Notebook reviews with NVIDIA GeForce RTX 2070 Super Mobile graphics card
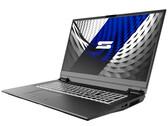
Schenker Compact 17 (Clevo PB71DF2-G) in review: A lot of performance with little heat development
The Schenker Compact 17 offers powerful hardware, 32 GB of RAM (dual-channel mode), a 4K display, and a 1 TB NVMe SSD. In addition, there's an extensive range of connections and the possibility to install up to three storage devices.
Intel Core i7-10875H, NVIDIA GeForce RTX 2070 Super Mobile, 17.3", 2.9 kgSchenker XMG Neo 15 laptop in review: Comet Lake upgrade
In addition to an Nvidia GeForce RTX 2070 Super, Schenker is also donating an Intel Core i7-10875H to the XMG Neo 15. In our test report, we clarify what improvements this brings with it compared to the Coffee Lake generation.
Intel Core i7-10875H, NVIDIA GeForce RTX 2070 Super Mobile, 15.6", 2.2 kgSchenker XMG Neo 17 (2020, Tongfang GM7MPHS) Review: Overboost unleashes the Core-i7 processor
The Neo 17 brings all the current computer games smoothly to the very responsive 17.3-inch screen (FHD, IPS, 240 Hz). The level of equipment is also right: a mechanical keyboard, 32 GB of working memory (dual-channel mode), an NVMe SSD (1 TB), and a Thunderbolt 3 connection are onboard. However, the battery life does not inspire enthusiasm.
Intel Core i7-10875H, NVIDIA GeForce RTX 2070 Super Mobile, 17.3", 2.6 kgAsus ROG Strix G17 G712LWS in review: Powerful gaming machine with integrated light show
The Strix G17 doesn't lower its guard and displays all modern games smoothly on the matte screen (IPS, Full HD, 144 Hz). The individually configurable LED bar on the bottom brings color into play. The laptop offers space for up to three M.2 SSDs.
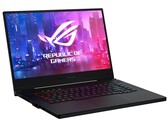
Intel Core i7-10750H, NVIDIA GeForce RTX 2070 Super Mobile, 17.3", 2.8 kgAsus ROG Zephyrus S15 GX502L laptop in review: Gaming laptop updated to Comet Lake
Not only does the slim Zephyrus S15 from Asus come with improved hardware in the new edition, but it now also features a 300 Hz panel. In our review, we'll clarify how well this works in combination with the built-in Nvidia GeForce RTX 2070 Super.
Intel Core i7-10875H, NVIDIA GeForce RTX 2070 Super Mobile, 15.6", 2.1 kgAsus ROG Strix Scar 15 G532LWS: Intel Core i9-10980HK, 15.60", 2.4 kg
Review » Asus ROG Strix Scar 15 G532LWS Laptop Review: GeForce Supercharged
MSI GE66 Raider 10SFS: Intel Core i9-10980HK, 15.60", 2.4 kg
Review » MSI GE66 Raider 10SFS Laptop Review: Premiere for the RTX 2070 Super
Acer Predator Triton 500 PT515-52-73L3: Intel Core i7-10750H, 15.60", 2.2 kg
External Review » Acer Predator Triton 500 PT515-52-73L3
HP Omen 17-cb1278ng: Intel Core i7-10750H, 17.30", 3.3 kg
External Review » HP Omen 17-cb1278ng
MSI GE66 Raider 10SFS: Intel Core i9-10980HK, 15.60", 2.4 kg
External Review » MSI GE66 Raider 10SFS
MSI GE66 Raider 10SFS-054ES: Intel Core i9-10980HK, 15.60", 2.4 kg
External Review » MSI GE66 Raider 10SFS-054ES
MSI GL65 Leopard 10SFSK-280XES: Intel Core i7-10750H, 15.60", 2.3 kg
External Review » MSI GL65 Leopard 10SFSK-280XES
Asus Strix Scar 15 G532LWS: Intel Core i9-10980HK, 15.60", 2.6 kg
External Review » Asus Strix Scar 15 G532LWS
Asus Strix Scar 17 G732LWS-HG029T: Intel Core i7-10875H, 17.30", 2.9 kg
External Review » Asus Strix Scar 17 G732LWS-HG029T
Alienware Area-51m R2, i7-10700K, RTX 2070 Super: unknown, 17.30", 4.1 kg
External Review » Alienware Area-51m R2, i7-10700K, RTX 2070 Super
Asus Strix G17 G712LWS-EV003T: Intel Core i7-10750H, 17.30", 2.9 kg
External Review » Asus Strix G17 G712LWS-EV003T
Asus Strix Scar 15 G532LWS-HF162T: Intel Core i7-10875H, 15.60", 2.6 kg
External Review » Asus Strix Scar 15 G532LWS-HF162T
HP Omen 17-cb1273ng: Intel Core i7-10750H, 17.30", 3.3 kg
External Review » HP Omen 17-cb1273ng
Asus ROG Strix Scar 15 G532LWS: Intel Core i9-10980HK, 15.60", 2.4 kg
External Review » Asus ROG Strix Scar 15 G532LWS
MSI GE75 Raider 10SFS-034CZ: Intel Core i7-10750H, 17.30", 2.7 kg
External Review » MSI GE75 Raider 10SFS-034CZ
MSI GE66 10SFS-072 Raider: Intel Core i9-10980HK, 15.60", 2.3 kg
External Review » MSI GE66 10SFS-072 Raider
Asus Strix G15 G512LWS-AZ029T: Intel Core i7-10875H, 15.00", 2.4 kg
External Review » Asus Strix G15 G512LWS-AZ029T
Asus ROG Zephyrus Duo 15 GX550LWS-HF055T: Intel Core i7-10875H, 15.60", 2.4 kg
External Review » Asus ROG Zephyrus Duo 15 GX550LWS-HF055T
MSI GE66 Raider 10SFS: Intel Core i9-10980HK, 15.60", 2.4 kg
Article » Staying secure in the new normal: How AMD Ryzen Pro processors ensure 24x7 protection for your critical data
Article » MSI laptops are the ideal Holiday season gifts for the avid gamer or content producer in your life
Schenker Compact 17: Intel Core i7-10875H, 17.30", 2.9 kg
» "Marvel's Avengers" or "Troy - A Total War Saga" - Buyers of the Schenker Compact 17 will get one of the two games for free
Schenker XMG Neo 17 Comet Lake: Intel Core i7-10875H, 17.30", 2.6 kg
» A real wolf in sheep's clothing: With the XMG Neo 17 (2020), Schenker delivers powerful hardware in a moderate exterior with a mechanical keyboard
Asus Strix G17 G712LWS: Intel Core i7-10750H, 17.30", 2.8 kg
» The Asus ROG Strix G17 G712LWS offers space for up to three M.2 2280 SSDs
Asus Zephyrus S15 GX502L: Intel Core i7-10875H, 15.60", 2.1 kg
» Asus Zephyrus S15: Advantage gained by RTX 2070 Super only marginal
Asus ROG Strix Scar 15 G532LWS: Intel Core i9-10980HK, 15.60", 2.4 kg
» MSI GE66 Raider vs. Asus ROG Strix Scar G532: Nothing but the facts
MSI GE66 Raider 10SFS: Intel Core i9-10980HK, 15.60", 2.4 kg
» MSI GE66 Raider: light show and monster battery