Notebook reviews with Intel Arc Graphics 130V graphics card
Lenovo ThinkPad E14 Gen 7 review - Lunar Lake delivers longer battery life but brings trade-offs
We tested the ThinkPad E14 Gen 7 equipped with Intel’s Lunar Lake chip, which improves battery life but lags behind in CPU performance and limits maintenance options. This raises the question: is the Arrow Lake variant the better overall choice?
Intel Core Ultra 5 228V, Arc 130V, 14", 1.4 kgSamsung Galaxy Book5 Pro 14 review - Finally a rival to Apple's MacBook Air thanks to Lunar Lake?
Samsung is now equipping its slim 14-inch laptop with Intel's efficient Lunar Lake processors, resulting in better runtimes. However, the price remains high, and Samsung is also slowly losing market share in the OLED panel segment.
Intel Core Ultra 5 226V, Arc 130V, 14", 1.2 kgA kilo of tech that inspires - Acer TravelMate P6 Business laptop in review
Acer's new TravelMate P6 is feather-light, mostly silent, and its battery life is outstanding. It's a notebook that gets through several workdays without a single thought spared for the charging cable, all while the compact business laptop delivers respectable performance.
Intel Core Ultra 5 226V, Arc 130V, 14", 1 kgIntel empire strikes back with 21 hrs of battery life: Lenovo ThinkPad T14s Gen 6 laptop review
Qualcomm, AMD and Intel - the Lenovo ThinkPad T14s Gen 6 is a laptop that can be configured with every available option. The Intel Lunar Lake model we test today may be the best yet, striking the ideal balance between great everyday performance and efficiency.
Intel Core Ultra 5 228V, Arc 130V, 14", 1.3 kgAcer Aspire 14 AI review: Basic home and office laptop done right
This inexpensive laptop can do it all for students or basic office needs with its efficient processor and long battery life. If you do even a bit of graphics editing, however, then the IPS display might disappoint.
Intel Core Ultra 5 226V, Arc 130V, 14", 1.4 kgAsus Vivobook S 14 OLED S5406SA: Intel Core Ultra 5 226V, 14.00", 1.3 kg
Review » Asus Vivobook S 14 OLED Review: Affordable, quieter, and long lasting thanks to Lunar Lake
Samsung Galaxy Book5 Pro 360: Intel Core Ultra 5 226V, 16.00", 1.7 kg
Review » Samsung Galaxy Book5 Pro 360 laptop review - The large OLED convertible benefits from Intel Lunar Lake
Acer Swift 14 AI SF14-51-58TU: Intel Core Ultra 5 226V, 14.00", 1.3 kg
Review » Acer Swift 14 AI review: The first laptop with the Arc Graphics 130V
Acer TravelMate X4 14 AI TMX414-51: Intel Core Ultra 5 226V, 14.00", 1.3 kg
External Review » Acer TravelMate X4 14 AI TMX414-51
Lenovo Yoga 7 2-in-1 14ILL10: Intel Core Ultra 5 226V, 14.00", 1.4 kg
External Review » Lenovo Yoga 7 2-in-1 14ILL10
Acer Swift Go 14 AI SFG14-75 : Intel Core Ultra 5 226V, 14.00", 1.2 kg
External Review » Acer Swift Go 14 AI SFG14-75
HP OmniBook X Flip NGAI 14-fm0000: Intel Core Ultra 5 226V, 14.00", 1.4 kg
External Review » HP OmniBook X Flip NGAI 14-fm0000
Acer Aspire 14 AI A14-53M: Intel Core Ultra 5 226V, 14.00", 1.2 kg
External Review » Acer Aspire 14 AI A14-53M
Microsoft Surface Laptop 7 13.8, Ultra 5 238V: Intel Core Ultra 5 238V, 13.80", 1.4 kg
External Review » Microsoft Surface Laptop 7 13.8, Ultra 5 238V
Asus VivoBook 14 Flip TP3407SA, Ultra 5 226V: Intel Core Ultra 5 226V, 14.00", 1.6 kg
External Review » Asus VivoBook 14 Flip TP3407SA, Ultra 5 226V
Microsoft Surface Pro 11: Intel Core Ultra 5 236V, 13.00", 0.9 kg
External Review » Microsoft Surface Pro 11
Acer Swift 16 AI SF16-51, Ultra 5 226V: Intel Core Ultra 5 226V, 16.00", 1.5 kg
External Review » Acer Swift 16 AI SF16-51, Ultra 5 226V
Acer Aspire 14 AI N24Q14: Intel Core Ultra 5 226V, 14.00", 1.4 kg
External Review » Acer Aspire 14 AI N24Q14
Asus Vivobook S 14 OLED S5406SA: Intel Core Ultra 5 226V, 14.00", 1.3 kg
External Review » Asus Vivobook S 14 OLED S5406SA
Asus Vivobook S14 Q423: Intel Core Ultra 5 226V, 14.00", 1.3 kg
External Review » Asus Vivobook S14 Q423
Acer Swift 14 AI SF14-51-58TU: Intel Core Ultra 5 226V, 14.00", 1.3 kg
External Review » Acer Swift 14 AI SF14-51-58TU
Asus ZenBook S14 OLED UX5406SA: Intel Core Ultra 5 226V, 14.00", 1.2 kg
External Review » Asus ZenBook S14 OLED UX5406SA
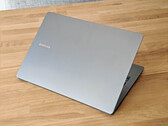
Lenovo ThinkPad E14 Gen 7 21U2002QGE: Intel Core Ultra 5 228V, 14.00", 1.4 kg
» Lenovo offers the ThinkPad E14 Gen 7 with modern Intel CPUs, but only old AMD CPUs
» Lenovo's ThinkPad E14 Gen 7 shows that Lunar Lake is not automatically the better choice for compact laptops
Samsung Galaxy Book5 Pro 14 940XHA: Intel Core Ultra 5 226V, 14.00", 1.2 kg
» Samsung charges premium prices for the Galaxy Book5 Pro, but €1699 for 16 GB RAM and a 512 GB SSD is excessive
» Samsung's OLED panel in the Galaxy Book5 Pro 14 falls behind the competition
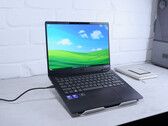
Acer TravelMate P6 TMP614-54-TCO-553Z: Intel Core Ultra 5 226V, 14.00", 1 kg
» Hidden talents: clever features of the Acer TravelMate P6 that shine in everyday use
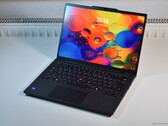
Lenovo ThinkPad T14s Gen 6 Intel: Intel Core Ultra 5 228V, 14.00", 1.3 kg
» Maximum efficiency: Lenovo ThinkPad T14s Gen 6 shows why Lunar Lake is the perfect choice for business laptops
Asus Vivobook S 14 OLED S5406SA: Intel Core Ultra 5 226V, 14.00", 1.3 kg
» Portable Asus Vivobook S 14 OLED laptop is phenomenal value as it is now 47% cheaper than list price
Acer Swift 14 AI SF14-51-58TU: Intel Core Ultra 5 226V, 14.00", 1.3 kg
» Acer Swift 14 AI Lunar Lake laptop with long battery life and 32 GB RAM is now $300 cheaper
Asus Vivobook S 14 OLED S5406SA: Intel Core Ultra 5 226V, 14.00", 1.3 kg
» Asus Vivobook S 14 (S5406) OLED laptop with 17-hour battery life drops back to record low price after 33% cut
» Asus Vivobook S 14 OLED becomes one of the best value laptops around as price drops 42% to new historic low
» Asus Vivobook S 14 OLED laptop with 32 GB of RAM and super long battery life enjoys 33.3% price cut
» Long-lasting Asus Vivobook S 14 OLED laptop with efficient Lunar Lake APU is back on sale
» Asus Vivobook S 16 (M506KA) and Vivobook S 14 (M5406WA) debut with new AMD Krackan Point APUs and OLED displays
» Asus Vivobook S 16 (S5606CA) launched with latest Intel Core Ultra 200H Arrow Lake mobile CPUs and Lumina OLED display