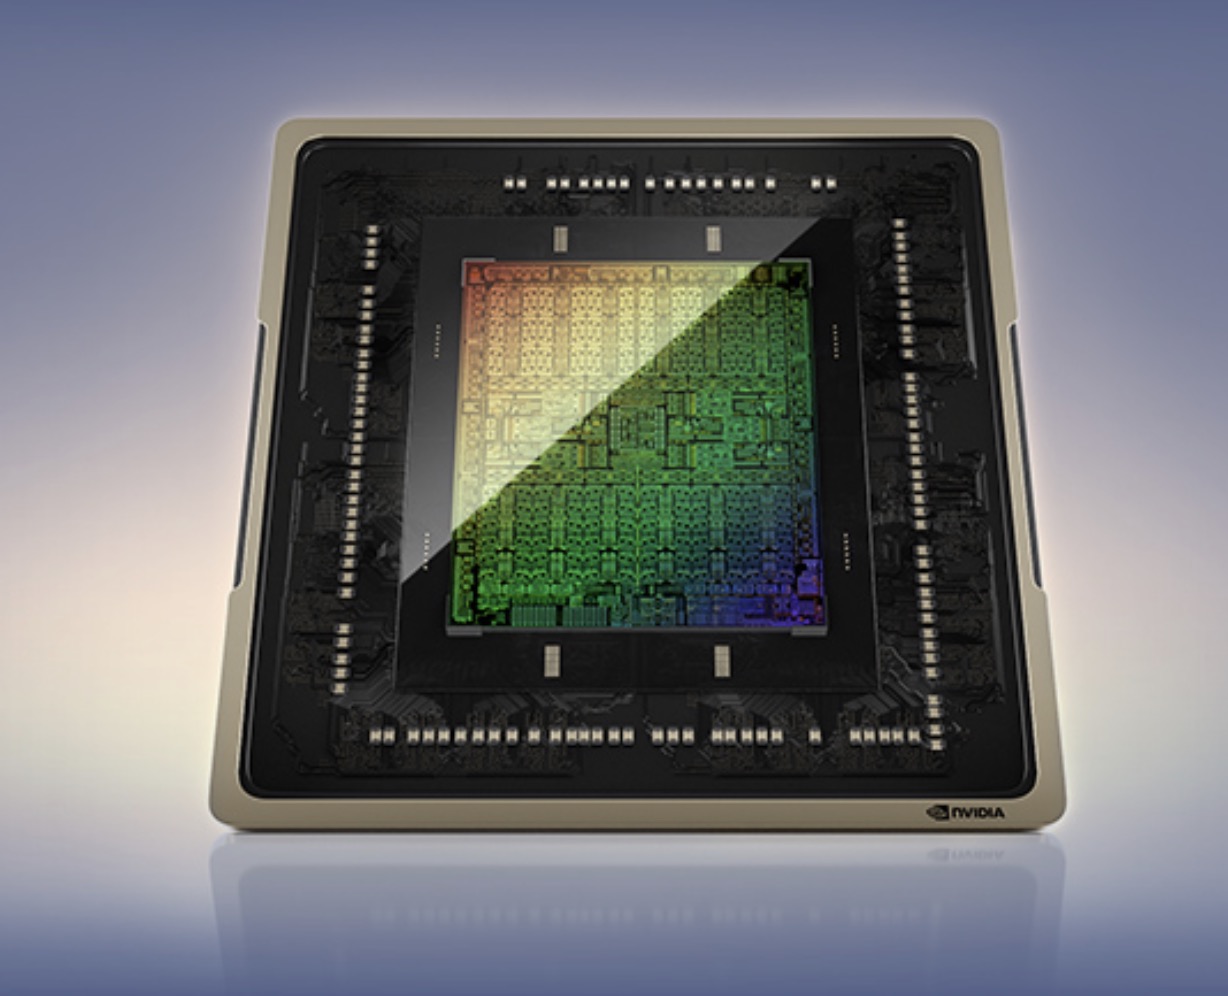
NVIDIA RTX 5000 Ada Generation Laptop The Nvidia RTX 5000 Ada Generation , not to be confused with the A5000 , P5000 and the RTX 5000 Turing Generation , is a super-powerful professional graphics card for use in laptops that sports 9,728 CUDA cores and 16 GB of ECC GDDR6 VRAM. Brought into existence in 2023, this graphics adapter leverages TSMC's 5 nm process and Nvidia's Ada Lovelace architecture to achieve great performance combined with reasonable power consumption. The Nvidia-recommended TGP range for the card is very wide at 80 W to 175 W leading to bizarre performance differences between different systems powered by what is supposed to be the same product.
Hardware-wise, the RTX 5000 is a GeForce RTX 4090 Laptop in disguise. Consequently, both make use of the AD103 chip and have little difficulty running triple-A games at UHD 2160p.
Quadro series graphics cards ship with much different BIOS and drivers than GeForce cards and are targeted at professional users rather than gamers. Commercial product design, large-scale calculations, simulation, data mining, 24 x 7 operation - if any of this sounds familiar, then a Quadro card will make you happy.
Architecture and Features
Ada Lovelace brings a range of improvements over older graphics cards utilizing the outgoing Ampere architecture. It's not just a better manufacturing process and a higher number of CUDA cores that we have here (up to 16,384 versus 10,752); under-the-hood refinements are plentiful, including an immensely larger L2 cache and an optimized ray tracing routine (a different way to determine what is transparent and what isn't is used) and other changes. Naturally, these graphics cards can both encode and decode some of the most widely used video codecs, AVC, HEVC and AV1 included; they also support a host of proprietary Nvidia technologies, including Optimus and DLSS 3, and they can certainly be used for various AI tasks.
The RTX 5000 features 76 RT cores of the 3rd generation, 304 Tensor cores of the 4th generation and 9,728 CUDA cores, making it a lot faster than the RTX 4000 Ada Generation . Elsewhere, the graphics card comes with 16 GB of 256-bit wide ECC GDDR6 memory for an impressive throughput of ~576 GB/s. Error correction can be turned off if desired. The fact that error correction is present here proves that the RTX 5000 is indeed targeted at professional users.
Just like Ampere-based cards, the RTX 5000 makes use of the PCI-Express 4 protocol. 8K SUHD monitors are supported, however DP 1.4a video outputs can potentially prove to be a bottleneck down the line.
Performance
The average RTX 5000 Ada Generation in our extensive database is noticeably inferior to the GeForce RTX 4080 in some tests but is totally comparable to the GeForce RTX 4090 in other ones, such as the Geekbench 6.2 GPU Vulkan test.
Nvidia's marketing materials mention "up to 42.6 TFLOPS" of performance which is very impressive. The RTX 4000 Ada Generation delivers up to 33.5 TFLOPS, for reference, while the RTX 500 Ada is only good for 9 TFLOPS.
Your mileage may vary depending on how competent the cooling solution of your laptop is and how high the TGP power target of the RTX 5000 is. One other thing worth mentioning is that enabling error correction appears to reduce the amount of video memory that is available to applications and games by up to a gigabyte.
Power consumption
Nvidia no longer divides its laptop graphics cards into Max-Q and non-max-Q models. Instead, laptop makers are free to set the TGP according to their needs, and the range can sometimes be shockingly wide. This is the case with the RTX 5000 Ada, as the lowest value recommended for it sits at just 80 W while the highest is more than two times higher at 175 W (this most likely includes Dynamic Boost). The slowest system built around an RTX 5000 Ada can easily be 60% slower than the fastest one. This is the kind of delta that we've already seen on consumer-grade laptops featuring the latest GeForce RTX cards.
Last but not the least, the improved 5 nm process (TSMC 4N) the RTX 5000 is built with makes for very decent energy efficiency, as of mid 2023.
RTX Ada Generation Laptop Series Architecture Ada Lovelace Pipelines 9728 - unified TMUs 304 ROPs 112 Raytracing Cores 76 Tensor / AI Cores 304 Core Speed 930 - 1680 (Boost) MHz AI GPU 682 TOPS INT8 Cache L2: 64 MB Memory Speed 20000 effective = 2250 MHz Memory Bus Width 256 Bit Memory Type GDDR6 Max. Amount of Memory 16 GB Shared Memory no Memory Bandwidth 576 GB/s API DirectX 12 Ultimate, Shader 6.7, OpenGL 4.6, OpenCL 3.0, Vulkan 1.3 Power Consumption 150 Watt (80 - 150 Watt TGP) Transistor Count 76.3 Billion Man. Technology 4 nm PCIe 4 x16/x8 Displays 4 Displays (max.), HDMI 2.1, DisplayPort 1.4a Notebook Size large Date of Announcement 21.03.2023 Link to Manufacturer Page images.nvidia.com Predecessor RTX A5500 Laptop GPU
Benchmarks 3DMark - 3DMark Speed Way Score
min: 3866 avg: 3978 median: 3872 (26%) max: 4196 Points
GPU TDP 95 W TDP 105 W 92% 100%
...
NVIDIA RTX 5000 Ada Generation Laptop
...
max:
3DMark - 3DMark Fire Strike Standard Score
min: 25968 avg: 27190 median: 26765 (40%) max: 28837 Points
GPU TDP 95 W TDP 105 W 91% 100%
...
NVIDIA RTX 5000 Ada Generation Laptop
...
max:
3DMark - 3DMark Fire Strike Standard Graphics
min: 29664 avg: 31985 median: 30422 (28%) max: 35868 Points
GPU TDP 95 W TDP 105 W 84% 100%
...
NVIDIA RTX 5000 Ada Generation Laptop
...
max:
3DMark - 3DMark Time Spy Score
min: 14048 avg: 14894 median: 14644 (38%) max: 15989 Points
GPU TDP 95 W TDP 105 W 90% 100%
...
NVIDIA RTX 5000 Ada Generation Laptop
...
max:
3DMark - 3DMark Time Spy Graphics
min: 14472 avg: 15184 median: 14861 (30%) max: 16218 Points
GPU TDP 95 W TDP 105 W 90% 100%
...
NVIDIA RTX 5000 Ada Generation Laptop
...
max:
3DMark 11 - 3DM11 Performance Score
min: 38230 avg: 39111 median: 39530 (48%) max: 39574 Points
GPU TDP 95 W TDP 105 W 98% 100%
...
NVIDIA RTX 5000 Ada Generation Laptop
max:
3DMark 11 - 3DM11 Performance GPU
min: 49833 avg: 51979 median: 51771 (40%) max: 54334 Points
GPU TDP 95 W TDP 105 W 93% 100%
...
NVIDIA RTX 5000 Ada Generation Laptop
max:
Blender - Blender 3.3 Classroom CUDA *
min: 21 avg: 22.3 median: 23 (3%) max: 23 Seconds
NVIDIA RTX 5000 Ada Generation Laptop
...
Blender - Blender 3.3 Classroom OPTIX *
min: 14 avg: 15 median: 15 (6%) max: 16 Seconds
NVIDIA RTX 5000 Ada Generation Laptop
...
SPECviewperf 12 + SPECviewperf 12 - specvp12 sw-03
min: 189.92 avg: 205.4 median: 201.1 (50%) max: 225.04 fps
GPU TDP 95 W TDP 105 W 87% 100%
...
NVIDIA RTX 5000 Ada Generation Laptop
max:
specvp12 snx-02 + SPECviewperf 12 - specvp12 snx-02
min: 291.54 avg: 297.4 median: 292 (43%) max: 308.58 fps
GPU TDP 95 W TDP 105 W 95% 100%
...
NVIDIA RTX 5000 Ada Generation Laptop
max:
specvp12 showcase-01 + SPECviewperf 12 - specvp12 showcase-01
min: 150.65 avg: 158.8 median: 153.1 (27%) max: 172.49 fps
GPU TDP 95 W TDP 105 W 88% 100%
...
NVIDIA RTX 5000 Ada Generation Laptop
max:
specvp12 mediacal-01 + SPECviewperf 12 - specvp12 mediacal-01
min: 132.41 avg: 134.5 median: 134.5 (34%) max: 136.68 fps
...
NVIDIA RTX 5000 Ada Generation Laptop
max:
specvp12 maya-04 + SPECviewperf 12 - specvp12 maya-04
min: 170.7 avg: 180.8 median: 181.6 (49%) max: 190.08 fps
GPU TDP 95 W TDP 105 W 93% 100%
...
NVIDIA RTX 5000 Ada Generation Laptop
max:
specvp12 energy-01 + SPECviewperf 12 - specvp12 energy-01
min: 29.61 avg: 30.6 median: 30.5 (27%) max: 31.48 fps
...
NVIDIA RTX 5000 Ada Generation Laptop
max:
specvp12 creo-01 + SPECviewperf 12 - specvp12 creo-01
min: 178.71 avg: 192.1 median: 193.9 (78%) max: 203.54 fps
GPU TDP 95 W TDP 105 W 92% 100%
...
NVIDIA RTX 5000 Ada Generation Laptop
max:
specvp12 catia-04 + SPECviewperf 12 - specvp12 catia-04
min: 221.81 avg: 242 median: 236.4 (37%) max: 267.81 fps
GPU TDP 95 W TDP 105 W 86% 100%
...
NVIDIA RTX 5000 Ada Generation Laptop
...
max:
SPECviewperf 13 specvp13 sw-04 + SPECviewperf 13 - specvp13 sw-04
min: 195.09 avg: 210.3 median: 209.3 (56%) max: 226.6 fps
GPU TDP 95 W TDP 105 W 89% 100%
...
NVIDIA RTX 5000 Ada Generation Laptop
max:
specvp13 snx-03 + SPECviewperf 13 - specvp13 snx-03
min: 524.73 avg: 535 median: 530.4 (59%) max: 550.94 fps
GPU TDP 95 W TDP 105 W 96% 100%
...
NVIDIA RTX 5000 Ada Generation Laptop
max:
specvp13 showcase-02 + SPECviewperf 13 - specvp13 showcase-02
min: 150.88 avg: 165.1 median: 154.1 (26%) max: 190.3 fps
GPU TDP 95 W TDP 105 W 80% 100%
...
NVIDIA RTX 5000 Ada Generation Laptop
max:
specvp13 medical-02 + SPECviewperf 13 - specvp13 medical-02
min: 169 avg: 198.4 median: 176.2 (30%) max: 249.87 fps
GPU TDP 95 W TDP 105 W 100% 79%
...
NVIDIA RTX 5000 Ada Generation Laptop
...
max:
specvp13 maya-05 + SPECviewperf 13 - specvp13 maya-05
min: 385.99 avg: 400.8 median: 391.6 (44%) max: 424.73 fps
GPU TDP 95 W TDP 105 W 92% 100%
...
NVIDIA RTX 5000 Ada Generation Laptop
max:
specvp13 energy-02 + SPECviewperf 13 - specvp13 energy-02
min: 105.16 avg: 107.7 median: 108.2 (35%) max: 109.73 fps
GPU TDP 95 W TDP 105 W 97% 100%
...
NVIDIA RTX 5000 Ada Generation Laptop
specvp13 creo-02 + SPECviewperf 13 - specvp13 creo-02
min: 354.77 avg: 375.9 median: 375.1 (54%) max: 397.76 fps
GPU TDP 95 W TDP 105 W 92% 100%
...
NVIDIA RTX 5000 Ada Generation Laptop
max:
specvp13 catia-05 + SPECviewperf 13 - specvp13 catia-05
min: 352.35 avg: 378.7 median: 374.4 (41%) max: 409.2 fps
GPU TDP 95 W TDP 105 W 89% 100%
...
NVIDIA RTX 5000 Ada Generation Laptop
max:
specvp13 3dsmax-06 + SPECviewperf 13 - specvp13 3dsmax-06
min: 258.63 avg: 269.7 median: 272.1 (43%) max: 278.36 fps
GPU TDP 95 W TDP 105 W 95% 100%
...
NVIDIA RTX 5000 Ada Generation Laptop
max:
SPECviewperf 2020 specvp2020 solidworks-07 4k + SPECviewperf 2020 - specvp2020 solidworks-07 4k
NVIDIA RTX 5000 Ada Generation Laptop
max:
specvp2020 solidworks-07 1080p + SPECviewperf 2020 - specvp2020 solidworks-07 1080p
NVIDIA RTX 5000 Ada Generation Laptop
...
specvp2020 solidworks-05 1080p + SPECviewperf 2020 - specvp2020 solidworks-05 1080p
min: 307.72 avg: 324 median: 324 (60%) max: 340.35 fps
...
NVIDIA RTX 5000 Ada Generation Laptop
specvp2020 snx-04 1080p + SPECviewperf 2020 - specvp2020 snx-04 1080p
min: 520.25 avg: 533 median: 525.6 (58%) max: 554.23 fps
GPU TDP 95 W TDP 105 W 94% 100%
...
NVIDIA RTX 5000 Ada Generation Laptop
max:
specvp2020 medical-03 1080p + SPECviewperf 2020 - specvp2020 medical-03 1080p
min: 85.08 avg: 104.1 median: 86.3 (24%) max: 140.89 fps
GPU TDP 95 W TDP 105 W 100% 75%
...
NVIDIA RTX 5000 Ada Generation Laptop
max:
specvp2020 maya-06 1080p + SPECviewperf 2020 - specvp2020 maya-06 1080p
min: 419.68 avg: 437.7 median: 433.6 (46%) max: 459.91 fps
GPU TDP 95 W TDP 105 W 93% 100%
...
NVIDIA RTX 5000 Ada Generation Laptop
max:
specvp2020 energy-03 1080p + SPECviewperf 2020 - specvp2020 energy-03 1080p
min: 104.5 avg: 107.4 median: 108.2 (18%) max: 109.65 fps
GPU TDP 95 W TDP 105 W 97% 100%
...
NVIDIA RTX 5000 Ada Generation Laptop
max:
specvp2020 creo-03 1080p + SPECviewperf 2020 - specvp2020 creo-03 1080p
min: 133.03 avg: 152.1 median: 153.8 (53%) max: 169.52 fps
GPU TDP 95 W TDP 105 W 85% 100%
...
NVIDIA RTX 5000 Ada Generation Laptop
max:
specvp2020 catia-06 1080p + SPECviewperf 2020 - specvp2020 catia-06 1080p
min: 121.41 avg: 124.7 median: 122.7 (60%) max: 130.04 fps
GPU TDP 95 W TDP 105 W 94% 100%
...
NVIDIA RTX 5000 Ada Generation Laptop
max:
specvp2020 3dsmax-07 1080p + SPECviewperf 2020 - specvp2020 3dsmax-07 1080p
min: 161.08 avg: 165.8 median: 161.5 (43%) max: 174.72 fps
GPU TDP 95 W TDP 105 W 92% 100%
...
NVIDIA RTX 5000 Ada Generation Laptop
max:
specvp2020 solidworks-05 4k + SPECviewperf 2020 - specvp2020 solidworks-05 4k
min: 129.32 avg: 135 median: 135 (32%) max: 140.59 fps
...
NVIDIA RTX 5000 Ada Generation Laptop
max:
specvp2020 snx-04 4k + SPECviewperf 2020 - specvp2020 snx-04 4k
min: 214.15 avg: 271.1 median: 237 (24%) max: 362.19 fps
GPU TDP 95 W TDP 105 W 62% 100%
...
NVIDIA RTX 5000 Ada Generation Laptop
max:
specvp2020 medical-03 4k + SPECviewperf 2020 - specvp2020 medical-03 4k
min: 36.13 avg: 43.8 median: 36.8 (24%) max: 58.46 fps
GPU TDP 95 W TDP 105 W 100% 76%
...
NVIDIA RTX 5000 Ada Generation Laptop
max:
specvp2020 maya-06 4k + SPECviewperf 2020 - specvp2020 maya-06 4k
min: 184.05 avg: 211 median: 207.2 (30%) max: 241.7 fps
GPU TDP 95 W TDP 105 W 81% 100%
...
NVIDIA RTX 5000 Ada Generation Laptop
...
max:
specvp2020 energy-03 4k + SPECviewperf 2020 - specvp2020 energy-03 4k
min: 38.09 avg: 42.3 median: 39.6 (9%) max: 49.16 fps
GPU TDP 95 W TDP 105 W 100% 91%
...
NVIDIA RTX 5000 Ada Generation Laptop
...
max:
specvp2020 creo-03 4k + SPECviewperf 2020 - specvp2020 creo-03 4k
min: 100.9 avg: 111.1 median: 115.9 (52%) max: 116.47 fps
GPU TDP 95 W TDP 105 W 94% 100%
...
NVIDIA RTX 5000 Ada Generation Laptop
max:
specvp2020 catia-06 4k + SPECviewperf 2020 - specvp2020 catia-06 4k
min: 67.17 avg: 70.4 median: 68.7 (45%) max: 75.33 fps
GPU TDP 95 W TDP 105 W 90% 100%
...
NVIDIA RTX 5000 Ada Generation Laptop
max:
specvp2020 3dsmax-07 4k + SPECviewperf 2020 - specvp2020 3dsmax-07 4k
min: 84.87 avg: 92.4 median: 94.6 (32%) max: 97.75 fps
GPU TDP 95 W TDP 105 W 100% 88%
...
NVIDIA RTX 5000 Ada Generation Laptop
max:
Cinebench R15 + Cinebench R15 - Cinebench R15 OpenGL 64 Bit
min: 267 avg: 334 median: 347 (20%) max: 388 fps
GPU TDP 95 W TDP 105 W 79% 100%
...
NVIDIA RTX 5000 Ada Generation Laptop
...
Cinebench R15 OpenGL Ref. Match 64 Bit + Cinebench R15 - Cinebench R15 OpenGL Ref. Match 64 Bit
GPU TDP 95 W TDP 105 W 100% 100%
...
NVIDIA RTX 5000 Ada Generation Laptop
...
Basemark GPU 1.2 - Basemark GPU 1.2 Vulkan Official Medium Offscreen 1080
min: 104.6 avg: 1019 median: 1380 (34%) max: 1572 fps
...
NVIDIA RTX 5000 Ada Generation Laptop
...
max:
Basemark GPU 1.2 - Basemark GPU 1.2 Vulkan Official High Offscreen 2160
NVIDIA RTX 5000 Ada Generation Laptop
...
max:
Geekbench 6.7 - Geekbench 6.7.1 GPU OpenCL
min: 152959 avg: 161815 median: 162695 (41%) max: 169792 points
...
NVIDIA RTX 5000 Ada Generation Laptop
max:
Geekbench 6.7 - Geekbench 6.7.1 GPU Vulkan
min: 124149 avg: 133082 median: 136348 (34%) max: 138748 points
...
NVIDIA RTX 5000 Ada Generation Laptop
...
max:
Power Consumption - Furmark Stress Test Power Consumption - external Monitor *
min: 121.1 avg: 143.4 median: 133 (18%) max: 176.1 Watt
GPU TDP 95 W TDP 105 W 109% 100%
...
NVIDIA RTX 5000 Ada Generation Laptop
...
max:
0 5 10 15 20 25 30 35 40 45 50 55 60 65 70 75 80 85 90 95 100 105 110 115 120 125 130 135 140 145 150 155 160 165 170 175 180 Tooltip Dell Precision 5690: Ø121.1 (104.2-140.1)
Dell Precision 5000 5680: Ø133 (123.5-152.9)
HP ZBook Fury 16 G10: Ø176.1 (167.5-184.7)
Power Consumption - The Witcher 3 Power Consumption - external Monitor *
min: 134.7 avg: 152.7 median: 140.9 (20%) max: 182.5 Watt
GPU TDP 95 W TDP 105 W 108% 100%
...
NVIDIA RTX 5000 Ada Generation Laptop
...
max:
0 5 10 15 20 25 30 35 40 45 50 55 60 65 70 75 80 85 90 95 100 105 110 115 120 125 130 135 140 145 150 155 160 165 170 175 180 185 190 195 Tooltip Dell Precision 5000 5680: Ø134.7 (129.4-145.7)
Dell Precision 5690: Ø140.9 (137.3-144.8)
HP ZBook Fury 16 G10: Ø182.5 (175.6-197.5)
Power Consumption - Witcher 3 Power Consumption *
min: 134 avg: 156 median: 144.5 (32%) max: 189.4 Watt
GPU TDP 95 W TDP 105 W 119% 100%
...
NVIDIA RTX 5000 Ada Generation Laptop
...
0 5 10 15 20 25 30 35 40 45 50 55 60 65 70 75 80 85 90 95 100 105 110 115 120 125 130 135 140 145 150 155 160 165 170 175 180 185 190 195 Tooltip Dell Precision 5000 5680: Ø134 (127-142.7)
Dell Precision 5690: Ø144.5 (137.5-156.5)
HP ZBook Fury 16 G10: Ø189.4 (177-200)
Power Consumption - Power Efficiency - Witcher 3 ultra
min: 0.826 avg: 0.9 median: 0.9 (80%) max: 0.952 fps per Watt
...
NVIDIA RTX 5000 Ada Generation Laptop
Power Consumption - Power Efficiency - Witcher 3 ultra external Monitor
min: 0.858 avg: 0.9 median: 0.9 (76%) max: 0.977 fps per Watt
...
NVIDIA RTX 5000 Ada Generation Laptop
Emissions Witcher 3 Fan Noise + Emissions - Witcher 3 Fan Noise
min: 44.1 avg: 47.8 median: 48.3 (69%) max: 51 dB(A)
GPU TDP 95 W TDP 105 W 100% 89%
...
NVIDIA RTX 5000 Ada Generation Laptop
...
- Range of benchmark values
- Average benchmark values
* Smaller numbers mean a higher performance
Game Benchmarks The following benchmarks stem from our benchmarks of review laptops. The performance depends on the used graphics memory, clock rate, processor, system settings, drivers, and operating systems. So the results don't have to be representative for all laptops with this GPU. For detailed information on the benchmark results, click on the fps number.
» With all tested laptops playable in detail settings ultra.
Additional Benchmarks
Low Preset (FSR off) 1280x720
Ray Tracing Ultra Preset (DLSS off) 1920x1080
Ray Tracing Ultra Preset (DLSS off, no Path Tracing) 3840x2160
» With all tested laptops playable in detail settings ultra.
» With all tested laptops playable in detail settings ultra.
» With all tested laptops playable in detail settings ultra.
» With all tested laptops playable in detail settings ultra.
Additional Benchmarks
Ultra Low Preset 16xAF TAA 1280x720
269 [X] Dell Precision 5690 2.02
Intel Core Ultra 9 185H 3.8GHz
RTX 5000 Ada Generation Laptop
min:
213 fps, P1:
179 fps, max:
294 fps
» With all tested laptops playable in detail settings ultra.
» With all tested laptops playable in detail settings ultra.
» With all tested laptops playable in detail settings ultra.
0 100 200 Tooltip Precision 5690: Ø144 (103-184)
Precision 5000 5680: Ø144.6 (116-183)
ZBook Fury 16 G10: Ø158.2 (117-202)
0 100 Tooltip Precision 5000 5680: Ø132.4 (106-175)
Precision 5690: Ø134.4 (107-180)
ZBook Fury 16 G10: Ø144.3 (107-183)
0 100 Tooltip Precision 5690: Ø127.3 (97-176)
Precision 5000 5680: Ø129 (102-174)
ZBook Fury 16 G10: Ø137.5 (102-178)
0 100 Tooltip Precision 5690: Ø119.4 (91-159)
ZBook Fury 16 G10: Ø131.4 (98-172)
Precision 5000 5680: Ø132.3 (101-186)
0 100 Tooltip Precision 5690: Ø113.3 (88-145)
Precision 5000 5680: Ø113.6 (65-145)
ZBook Fury 16 G10: Ø129.4 (94-166)
0 Tooltip Precision 5000 5680: Ø70.3 (62-84)
Precision 5690: Ø72.4 (64-85)
» With all tested laptops playable in detail settings ultra.
» With all tested laptops playable in detail settings high.
» With all tested laptops playable in detail settings high.
» With all tested laptops playable in detail settings ultra.
0 100 Tooltip Precision 5000 5680: Ø135.4 (123-143)
Precision 5690: Ø131 (122-140)
ZBook Fury 16 G10: Ø152.8 (134-163)
» With all tested laptops playable in detail settings ultra.
» With all tested laptops playable in detail settings ultra.
Additional Benchmarks
Highest 16xAF 4xMSAA + FXAA 3840x2160
Normal/Off 4xAF 1920x1080
Lowest Settings possible 1920x1080
low med. high ultra QHD 4K Cyberpunk 2077 125 116.6 94.6 108.5 63.7 28.8 Baldur's Gate 3 172.3 155.2 139.2 134.6 100.5 53.3 Ratchet & Clank Rift Apart 118 93.9 69.4 54.5 43.4 33.3 Returnal 98 94 90 81 60 34 F1 22 236 229 210 87 60 31 Tiny Tina's Wonderlands 228 203 157 129 92 51 Cyberpunk 2077 1.6 118 115 106 102 70 35 Strange Brigade 408 326 291 268 203 105 Far Cry 5 149 137 131 127 119 71 X-Plane 11.11 155 134 105 88 Final Fantasy XV Benchmark 197 170 136 108 64 Dota 2 Reborn 186 168 164 150 143 The Witcher 3 445 370 271 144 102 GTA V 185.4 179.7 175.3 117.1 106.6 108 low med. high ultra QHD 4K < 30 fps < 60 fps < 120 fps ≥ 120 fps 3 11 4 10 5 9 1 5 6 1 9 1 1 6 6 1
For more games that might be playable and a list of all games and graphics cards visit our Gaming List
v1.35
log 12. 00:23:59
#0 ran 0s before starting gpusingle class +0s ... 0s
#1 no ids found in url (should be separated by "_") +0s ... 0s
#2 not redirecting to Ajax server +0s ... 0s
#3 did not recreate cache, as it is less than 5 days old! Created at Fri, 10 Jul 2026 05:30:22 +0200 +0.005s ... 0.005s
#4 composed specs +0.045s ... 0.049s
#5 did output specs +0s ... 0.05s
#6 start showIntegratedCPUs +0s ... 0.05s
#7 getting avg benchmarks for device 11597 +0.016s ... 0.066s
#8 got single benchmarks 11597 +0.016s ... 0.082s
#9 got avg benchmarks for devices +0s ... 0.082s
#10 min, max, avg, median took s +2.126s ... 2.208s
#11 before gaming benchmark output +0s ... 2.208s
#12 Got 165 rows for game benchmarks. +0.064s ... 2.272s
#13 composed SQL query for gamebenchmarks +0s ... 2.272s
#14 got data and put it in $dataArray +0.01s ... 2.282s
#15 benchmarks composed for output. +0.225s ... 2.507s
#16 return log +0.548s ... 3.055s