Dell Precision 5690 workstation review: Ready for the AI revolution

The Precision 5690 succeeds last year's Precision 5680 by replacing the older Raptor Lake-H CPUs with newer Meteor Lake-H ones complete with integrated NPUs. The two models are otherwise identical with the same display and GPU options. We recommend checking out our review on the Precision 5680 to learn more about the XPS 16-inspired physical features of the series.
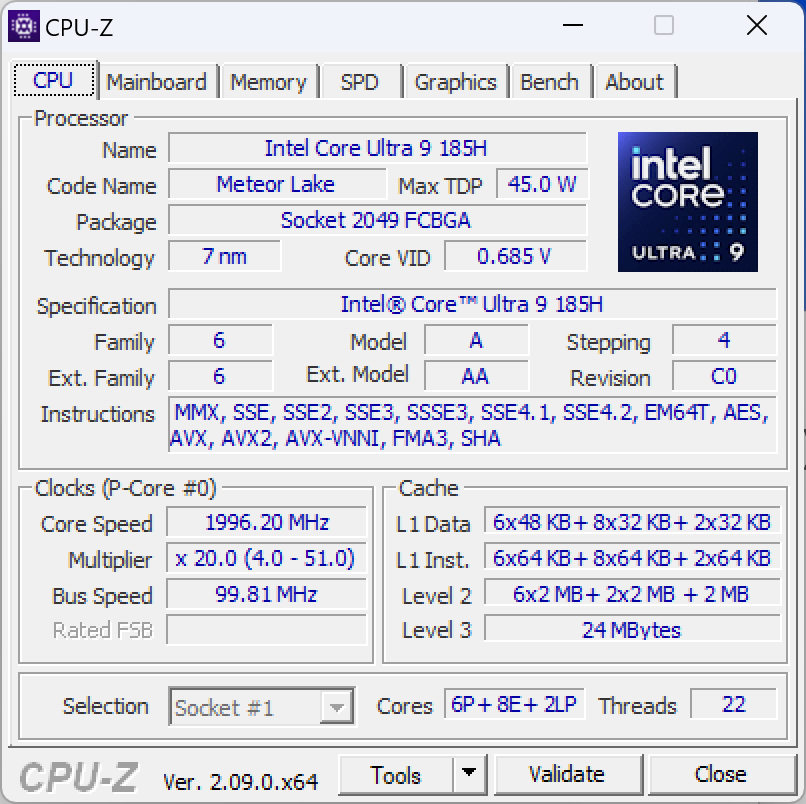
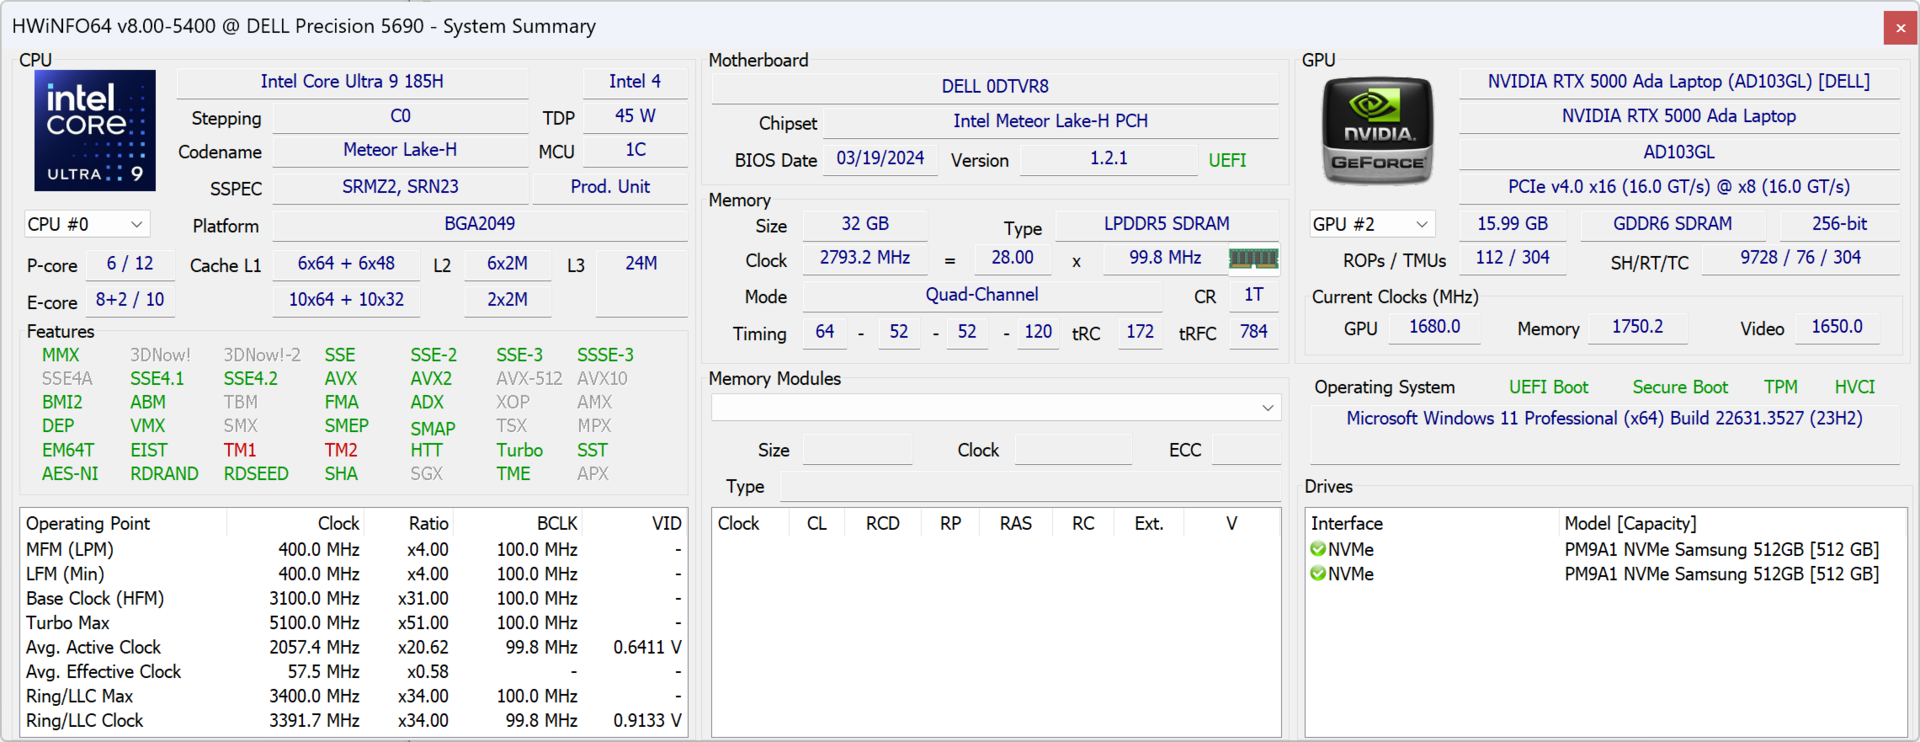
Our unit in review is the highest-end configuration with the Core Ultra 9 185H vPro CPU, Nvidia 5000 Ada GPU, and 16-inch 2400p OLED touchscreen for approximately $5900 USD. Lesser SKUs start with the Core Ultra 5 135H vPro, integrated Arc graphics only, and 1200p IPS display for only $2300.
Alternatives to the Precision 5690 include other 16-inch workstations like the Lenovo ThinkPad P16 G2, HP ZBook Fury 16 G10, or the MSI CreatorPro Z16P.
More Dell reviews:
Potential Competitors in Comparison
Rating | Date | Model | Weight | Height | Size | Resolution | Price |
|---|---|---|---|---|---|---|---|
| 88.3 % v7 (old) | 05 / 2024 | Dell Precision 5690 Ultra 9 185H, RTX 5000 Ada Generation Laptop | 2.3 kg | 22.17 mm | 16.00" | 3840x2400 | |
| 89 % v7 (old) | 08 / 2023 | Dell Precision 5000 5680 i9-13900H, RTX 5000 Ada Generation Laptop | 2.3 kg | 22.17 mm | 16.00" | 3840x2400 | |
| 90.2 % v7 (old) | 03 / 2024 | Lenovo ThinkPad P16 G2 21FA000FGE i7-13700HX, RTX 2000 Ada Generation Laptop | 3 kg | 30.23 mm | 16.00" | 2560x1600 | |
| 91.7 % v7 (old) | 10 / 2023 | Lenovo ThinkPad P1 G6-21FV000DGE i9-13900H, RTX 2000 Ada Generation Laptop | 1.9 kg | 17.5 mm | 16.00" | 2560x1600 | |
| 92.3 % v7 (old) | 09 / 2023 | HP ZBook Fury 16 G10 i9-13950HX, RTX 5000 Ada Generation Laptop | 2.6 kg | 28.5 mm | 16.00" | 3840x2400 | |
| 84.3 % v7 (old) | 11 / 2022 | MSI CreatorPro Z16P B12UKST i7-12700H, RTX A3000 Laptop GPU | 2.4 kg | 19 mm | 16.00" | 2560x1600 |
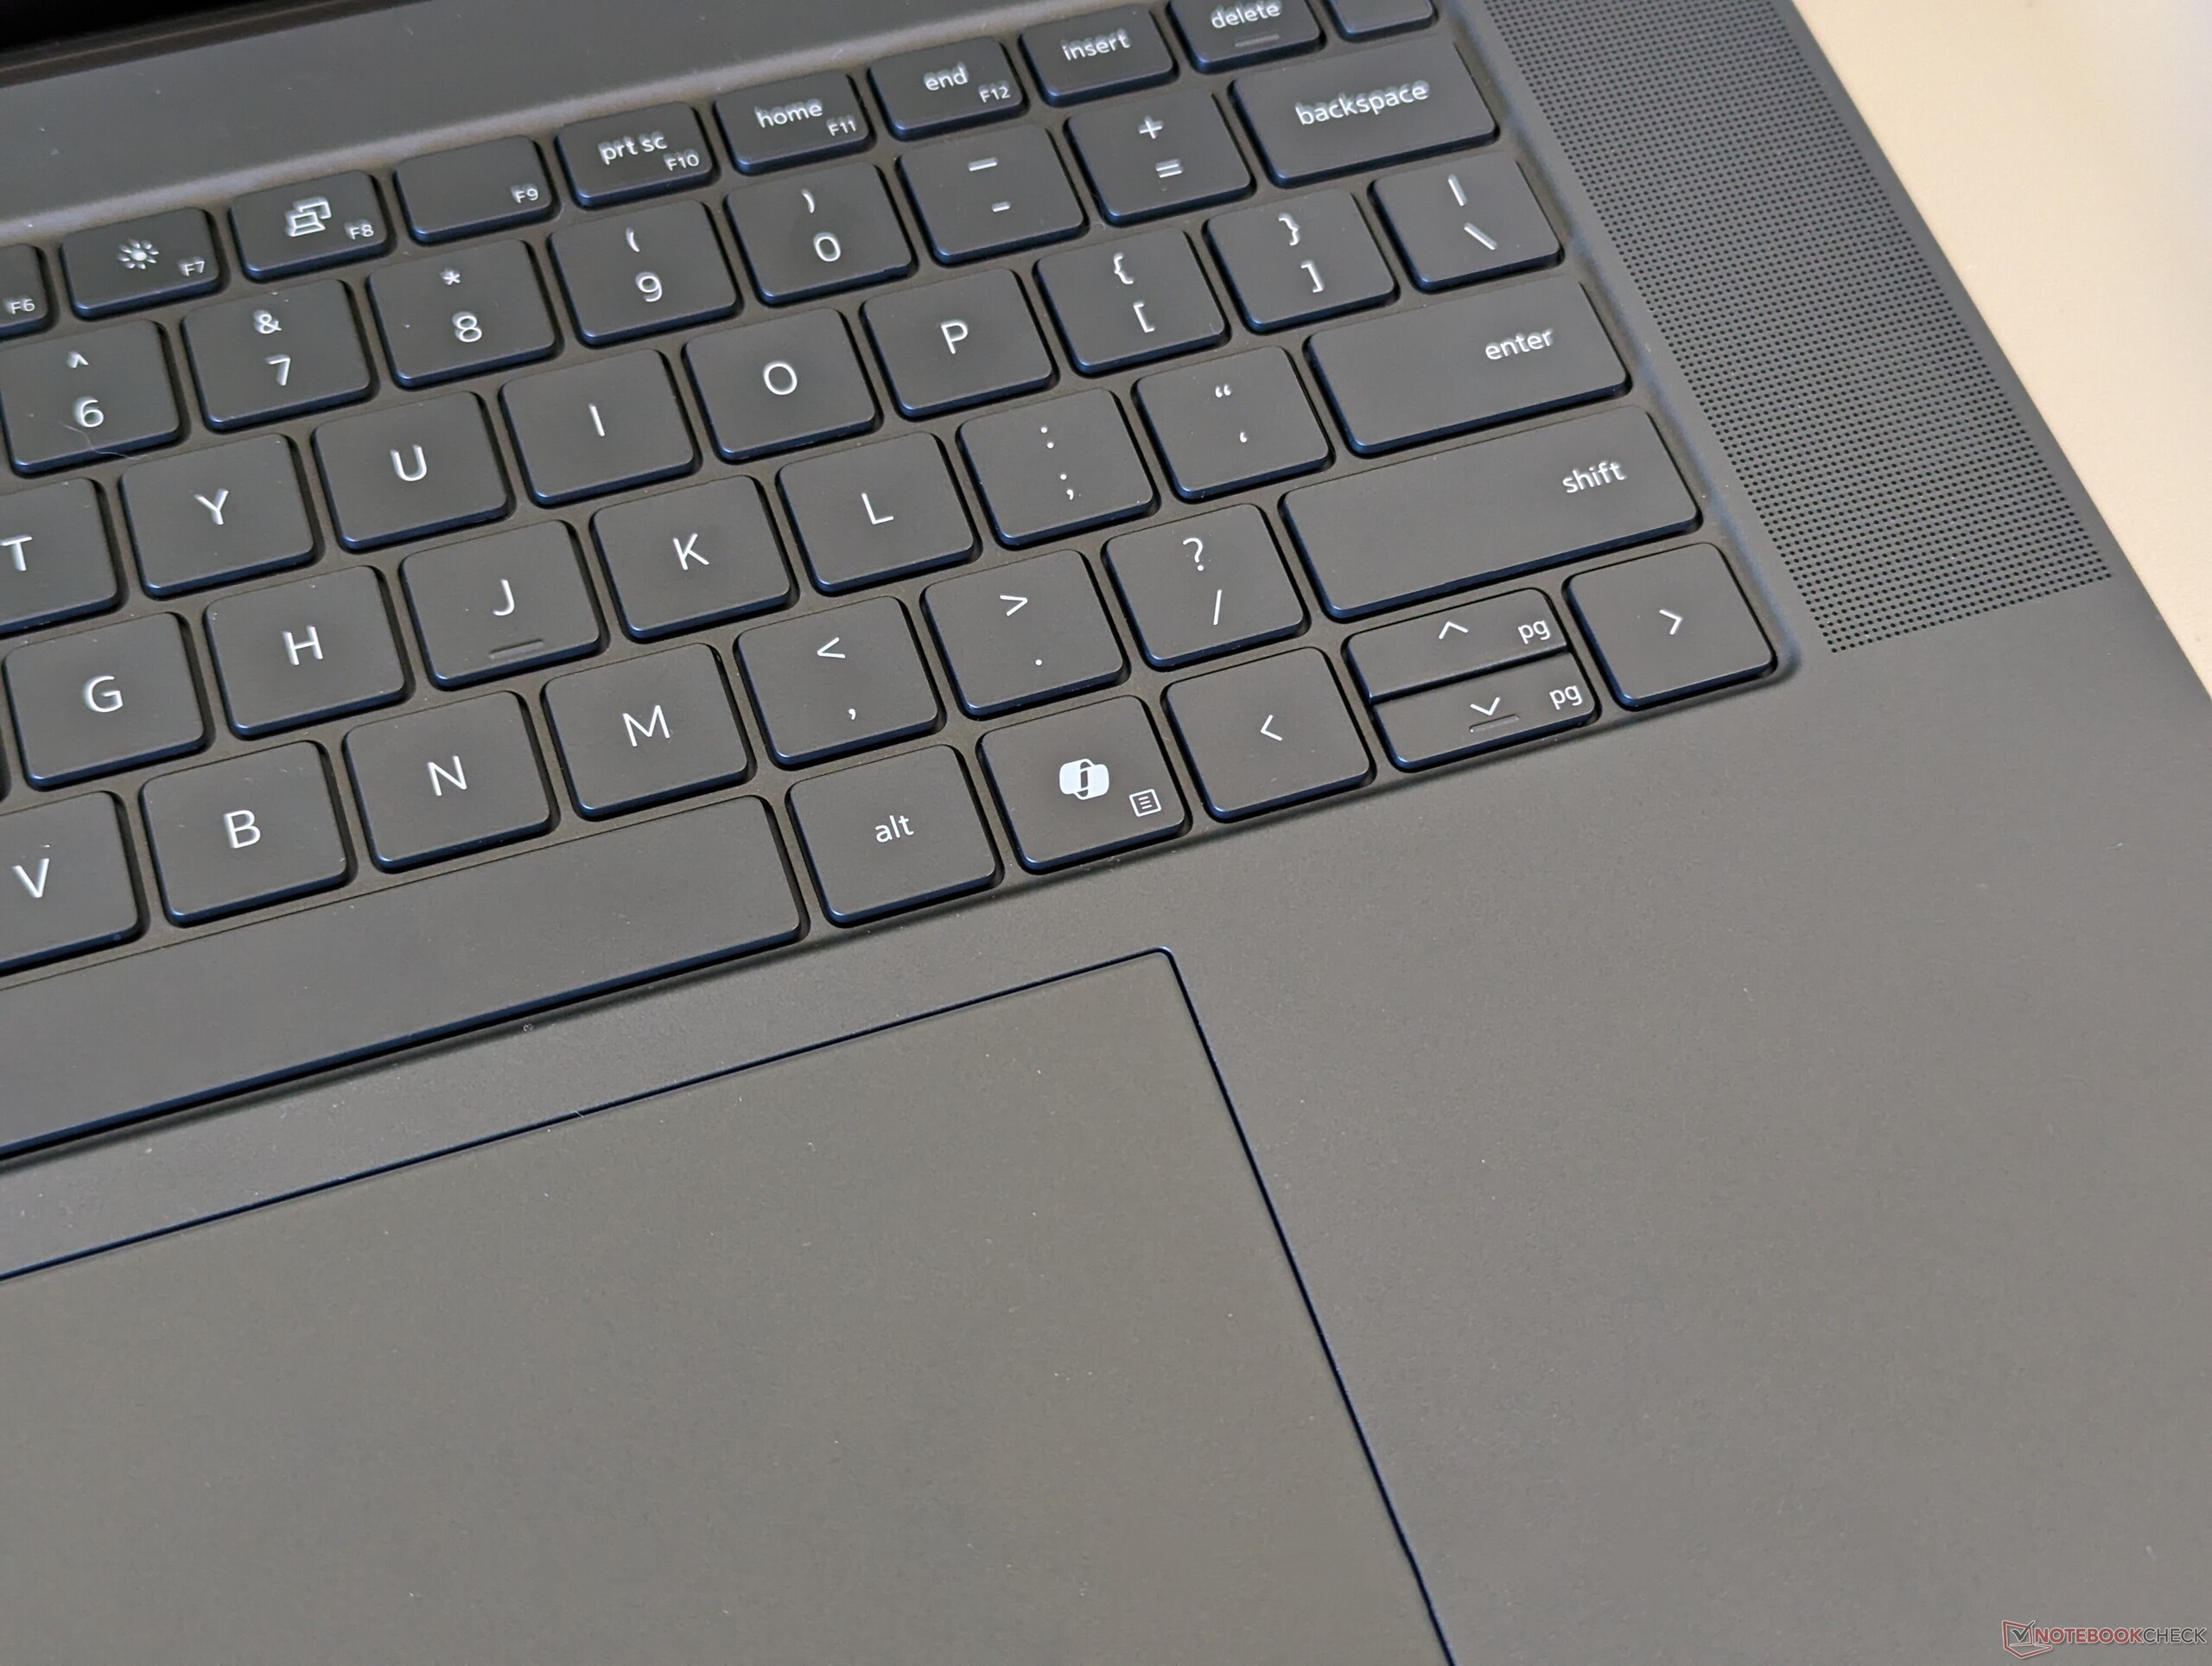
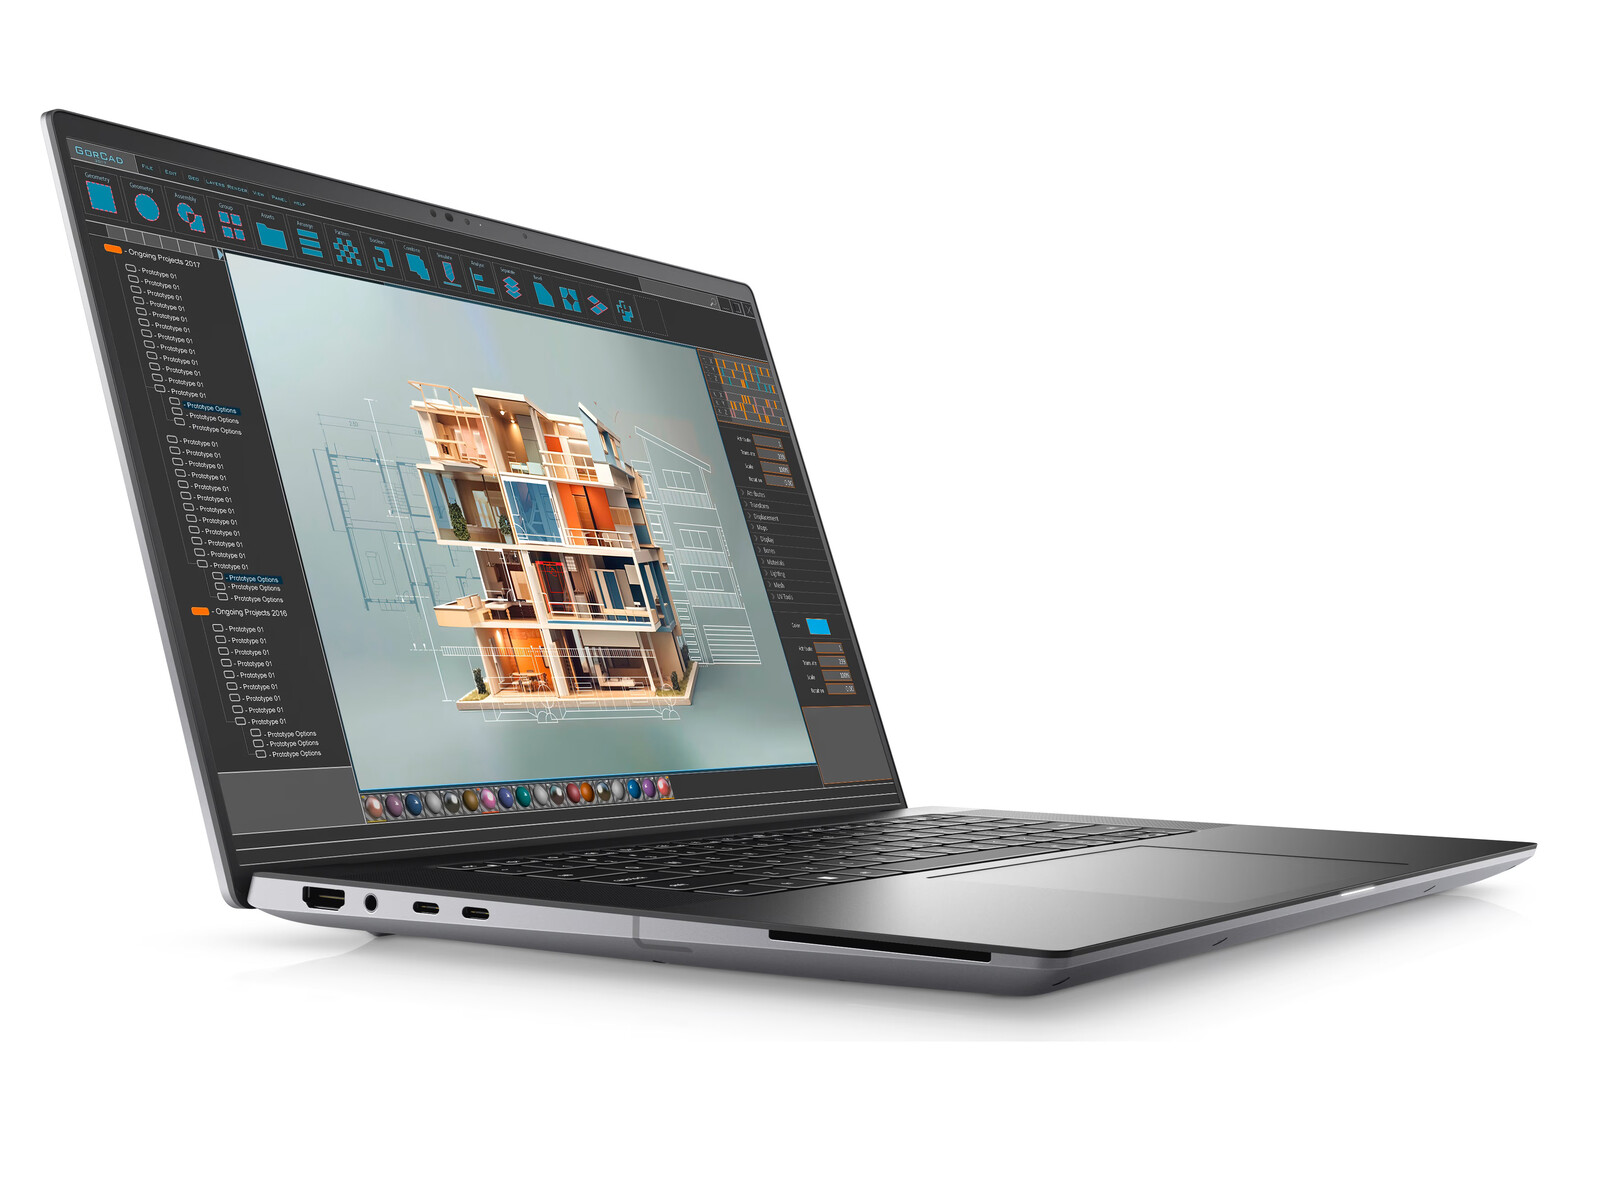
Case — Inspired By XPS 16
The keyboard now integrates a dedicated Microsoft Co-Pilot key in place of the right Ctrl key to visually separate the Precision 5690 from the 5680.
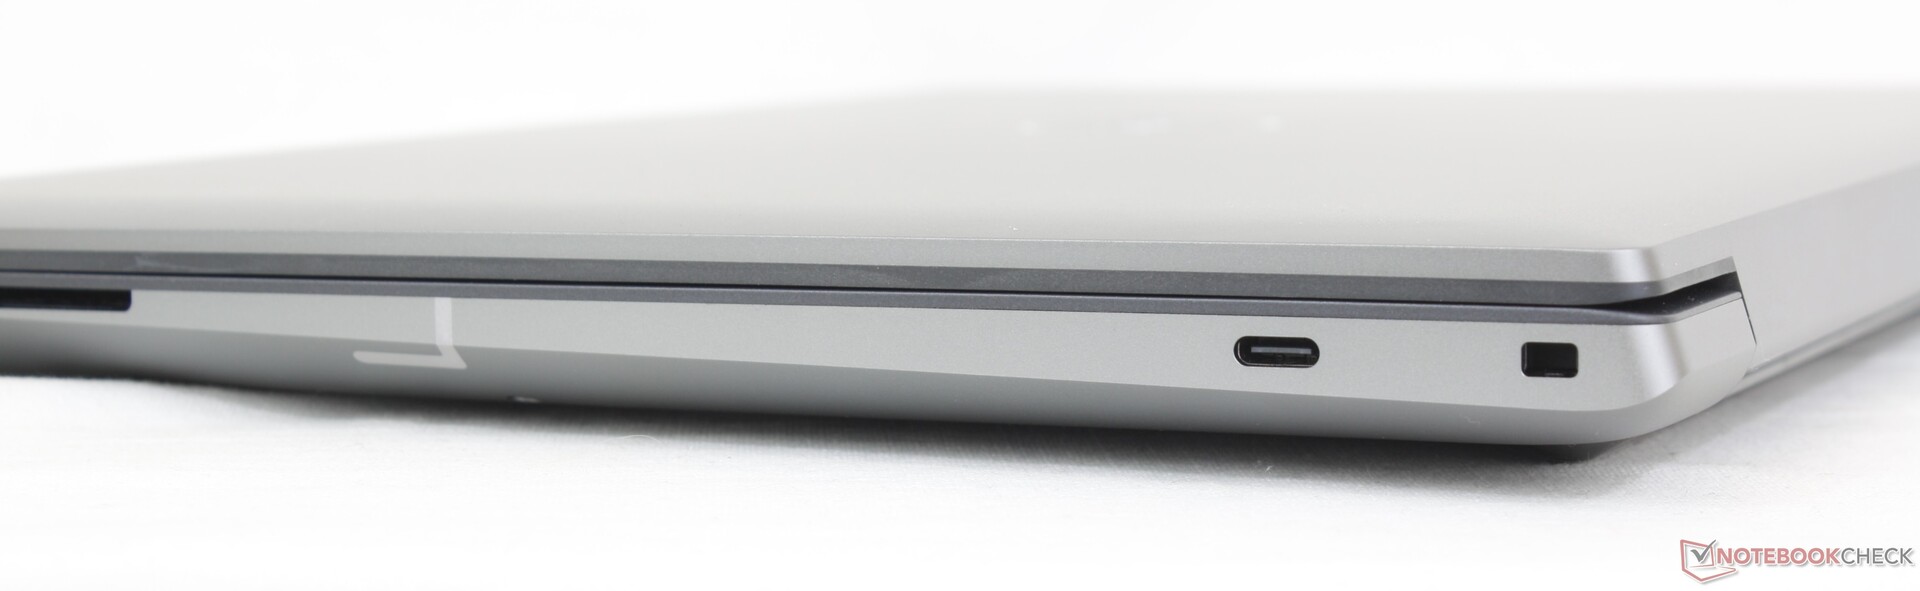
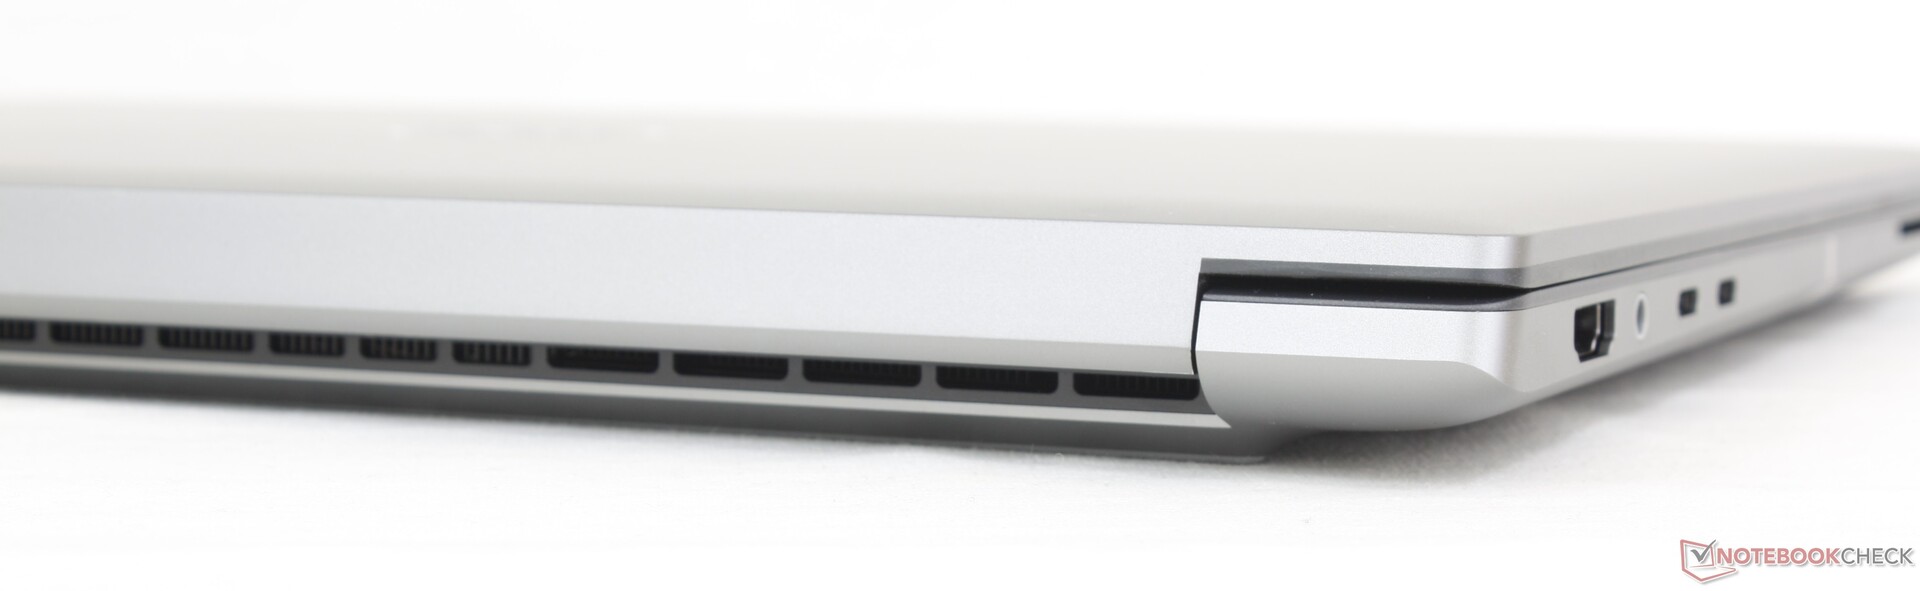
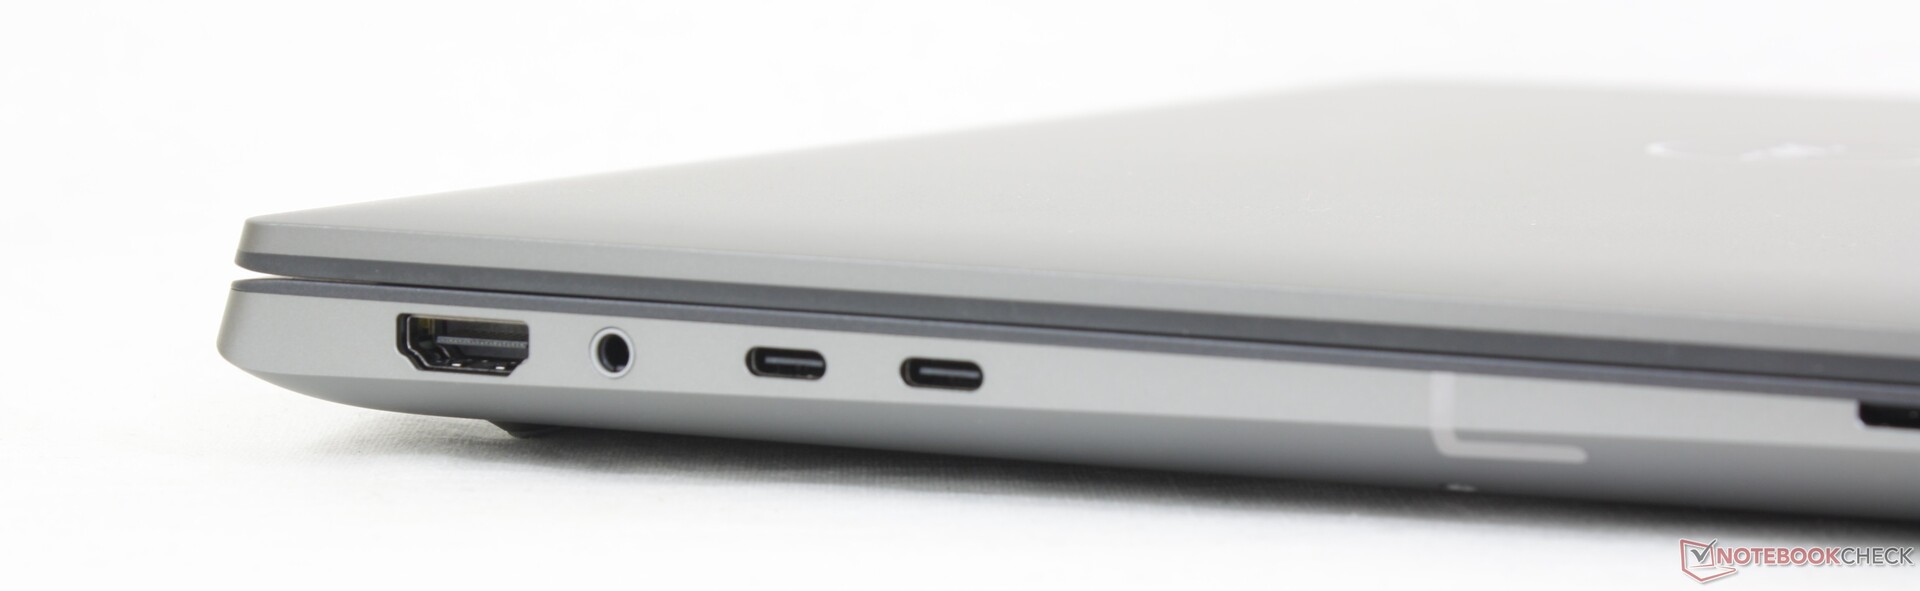
Connectivity

Communication
WLAN has been upgraded from the Intel AX211 to the Intel BE200 to support Wi-Fi 7 connectivity. However, the vast majority of users are still limited to Wi-Fi 6E or older networks and so most will not notice any performance benefits for the time being.
Webcam

")
")
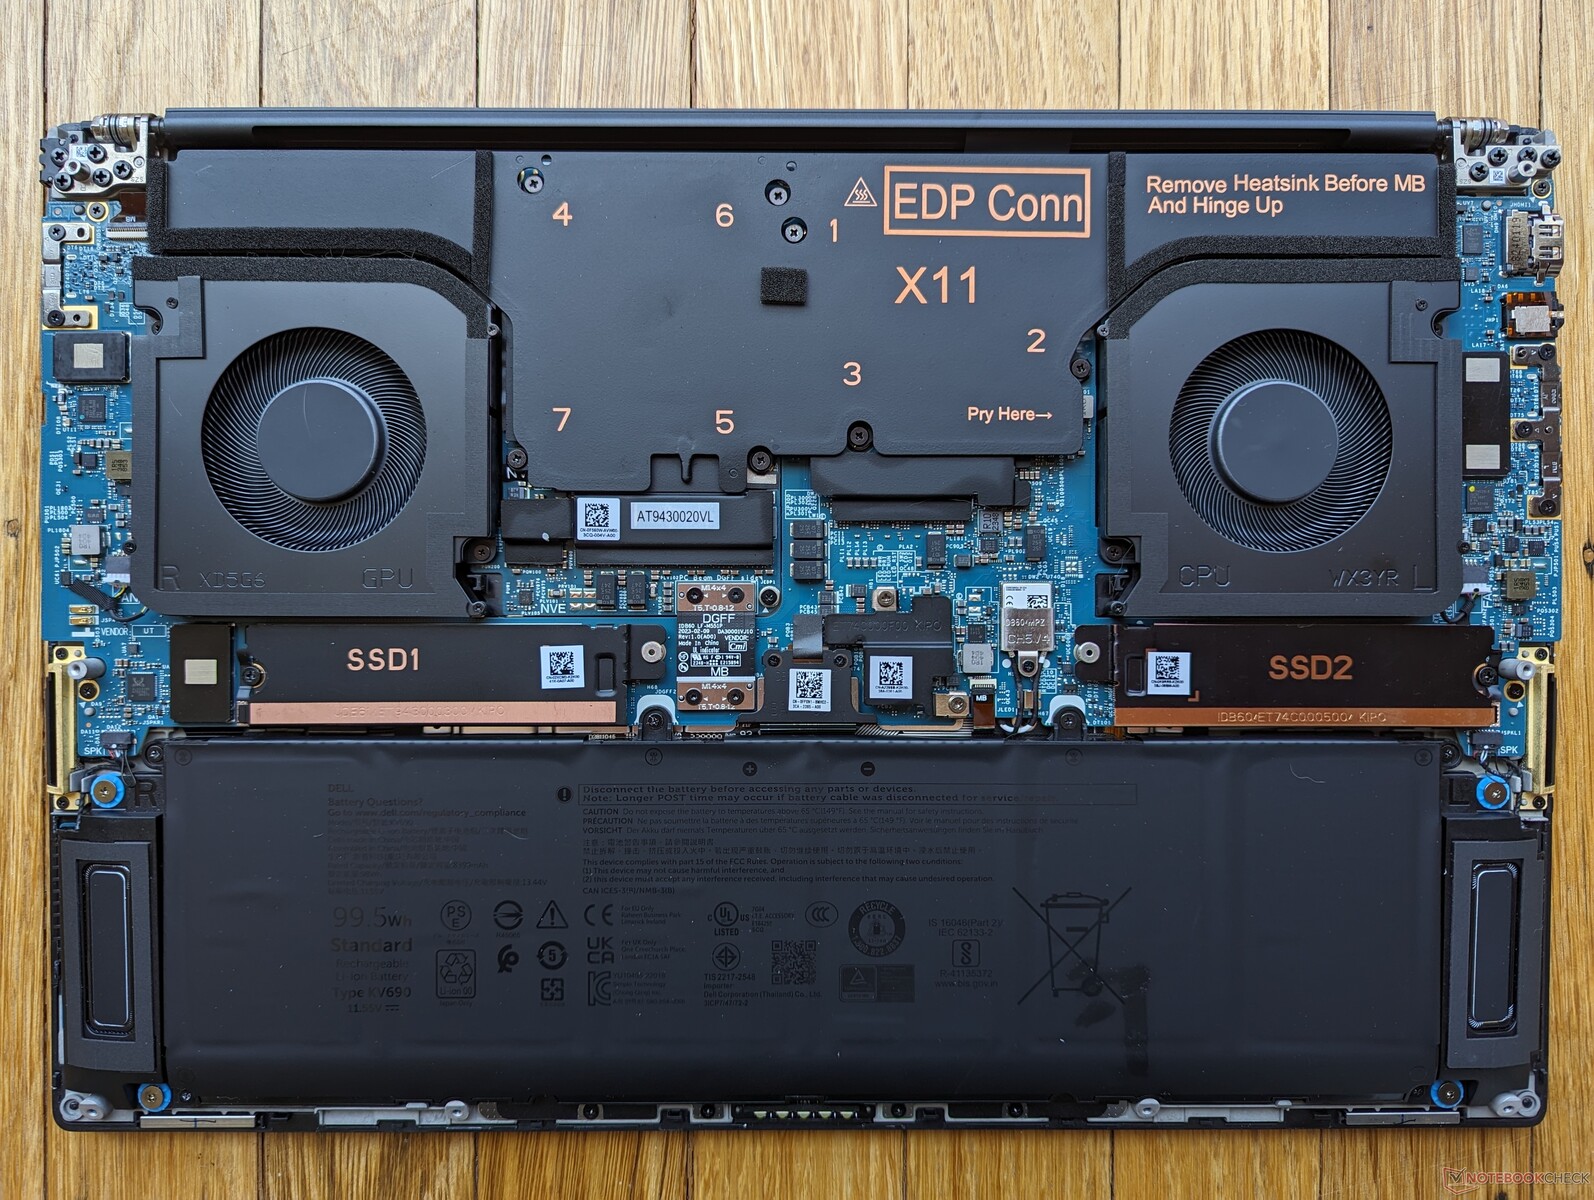
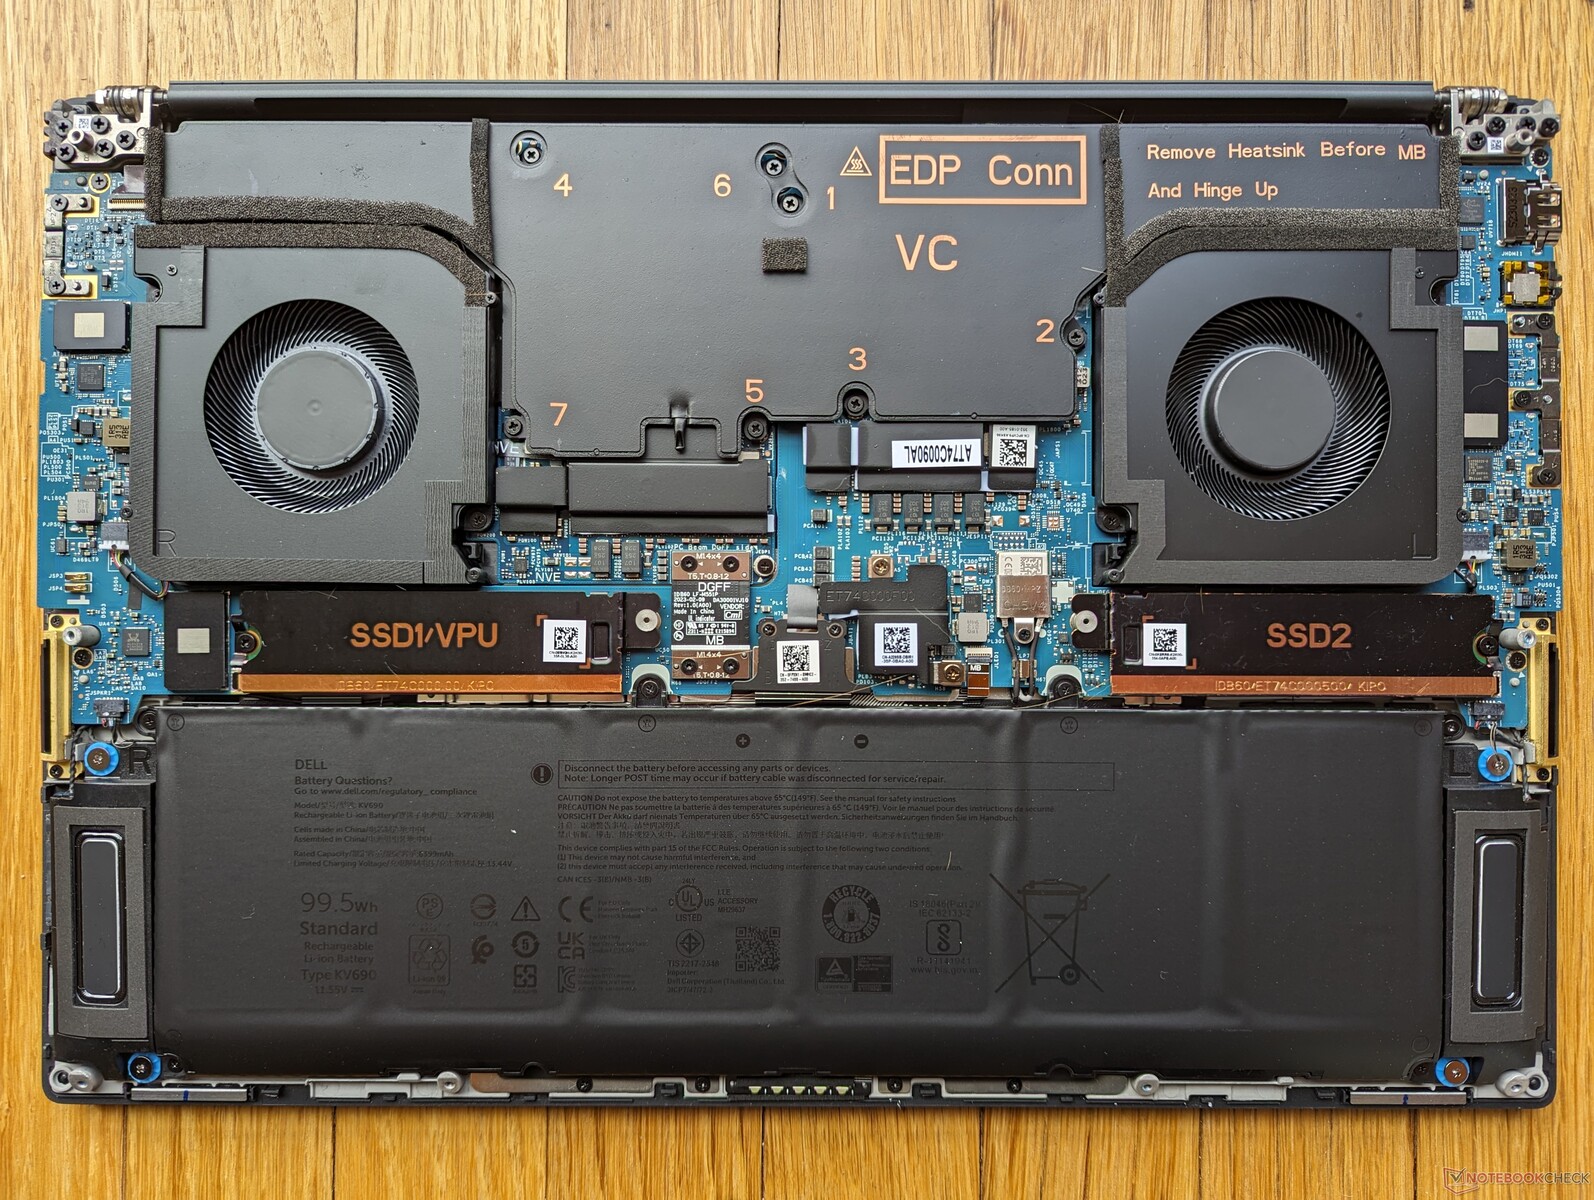
Maintenance
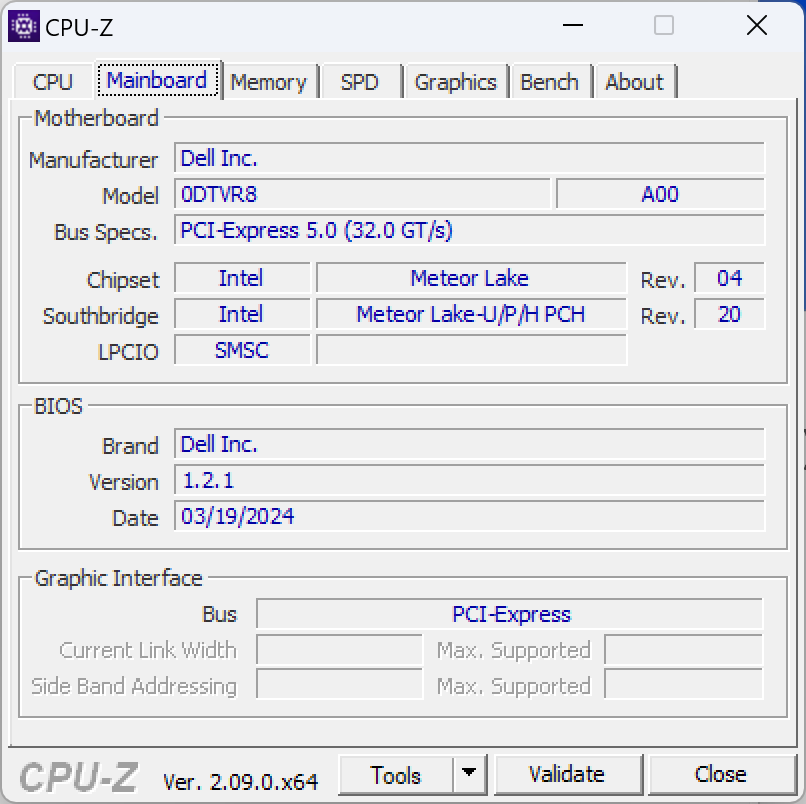
There are no notable internal differences between the Precision 5690 and older 5680.
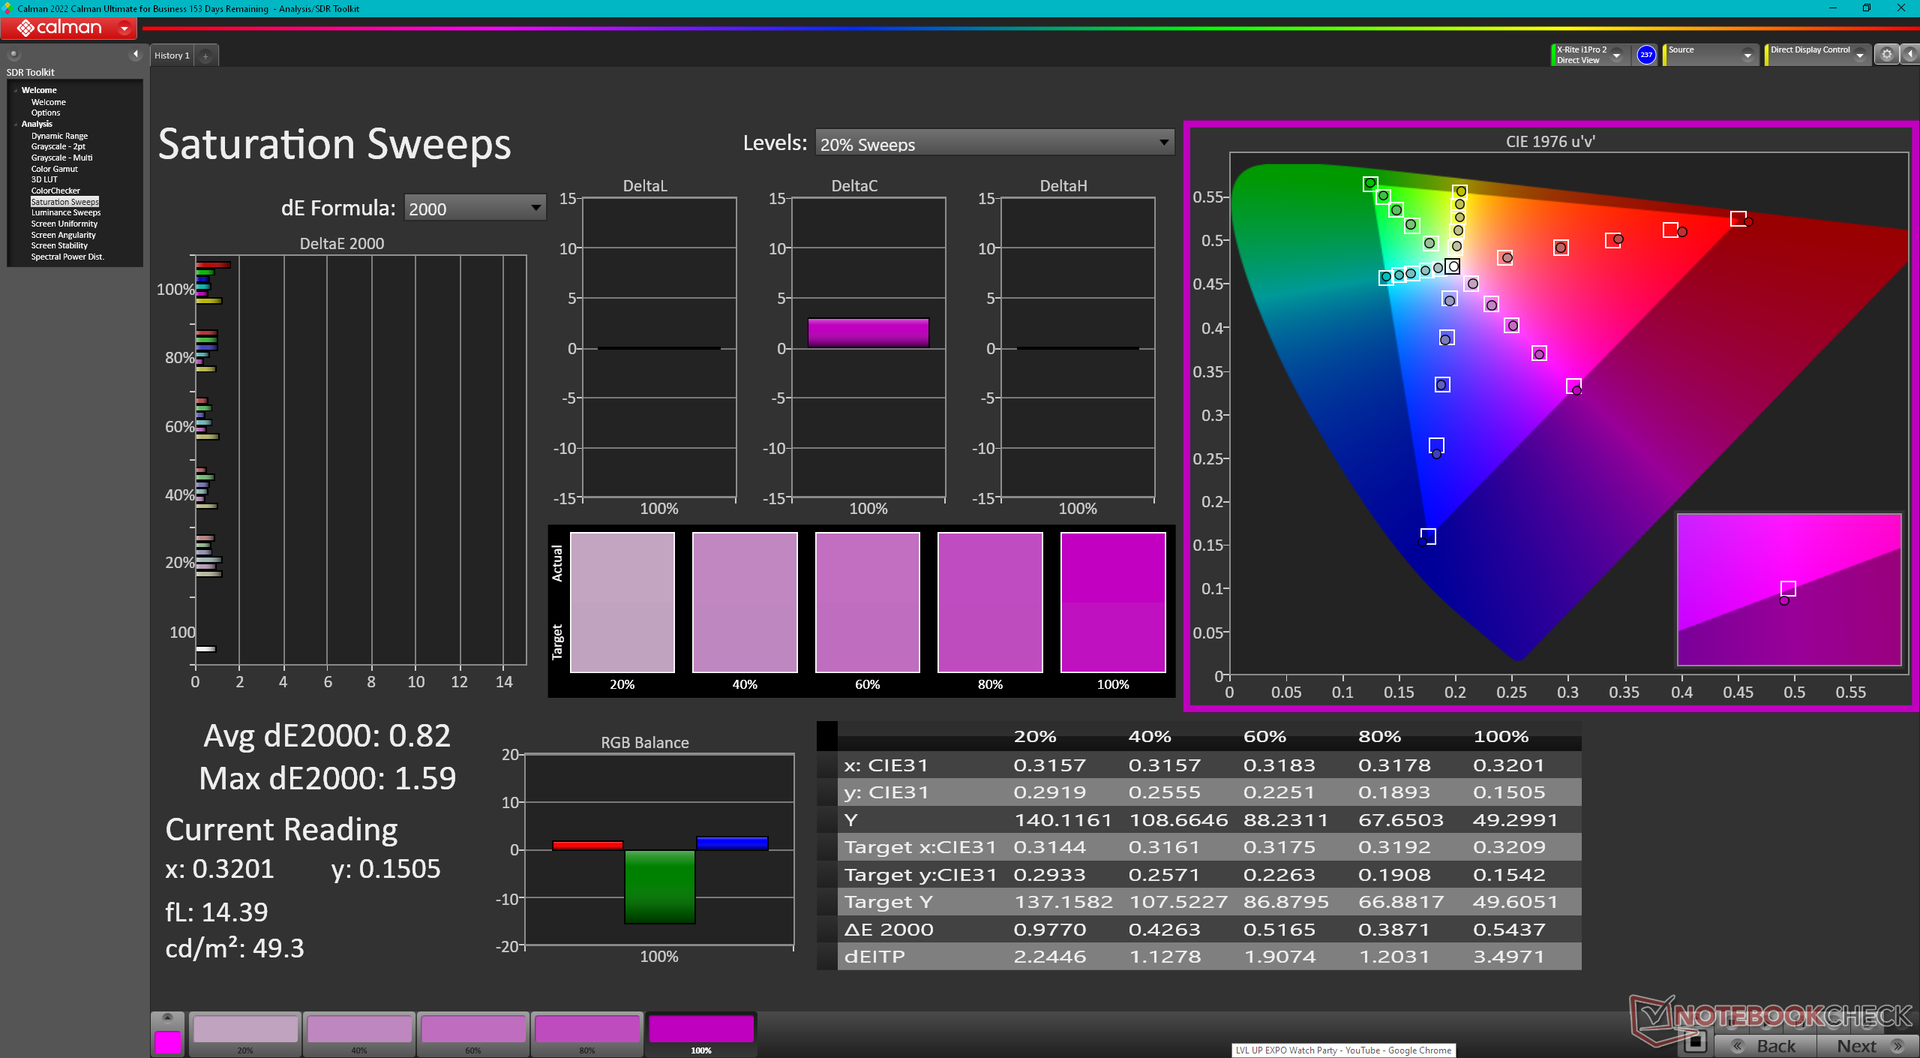
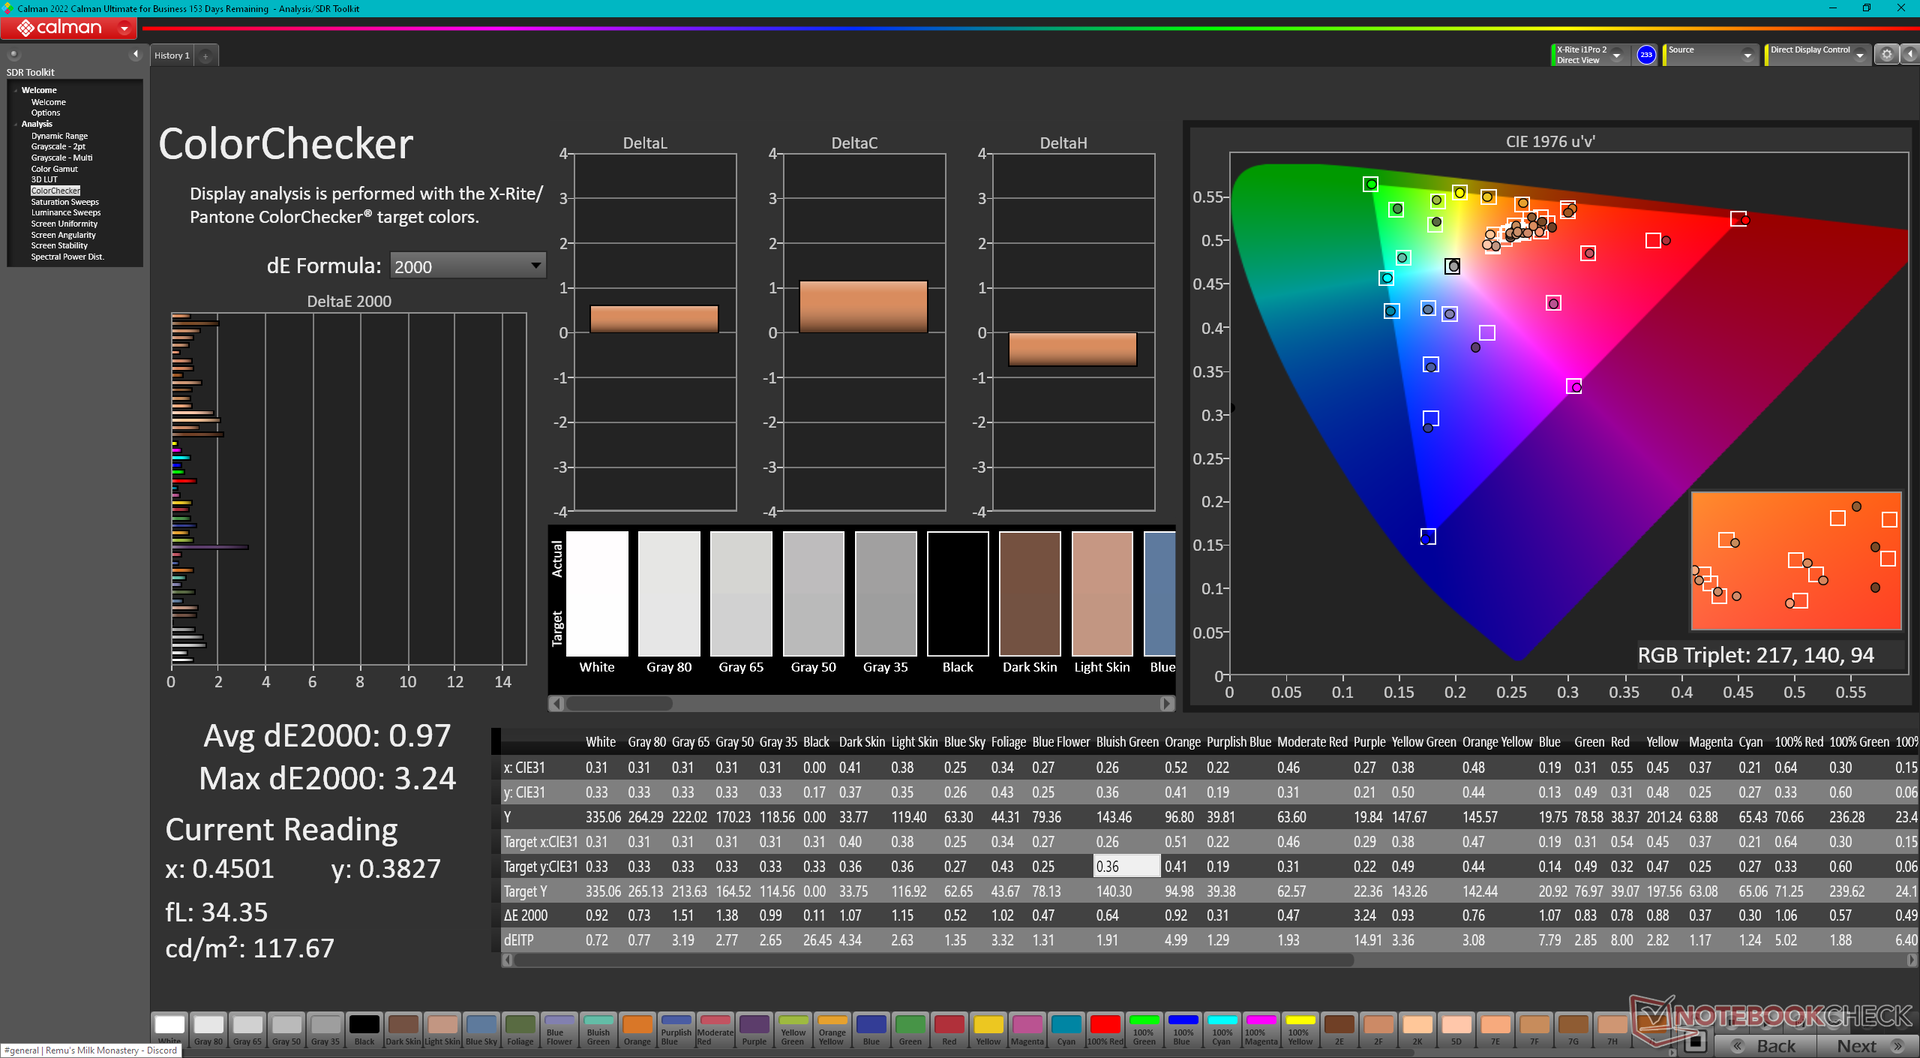
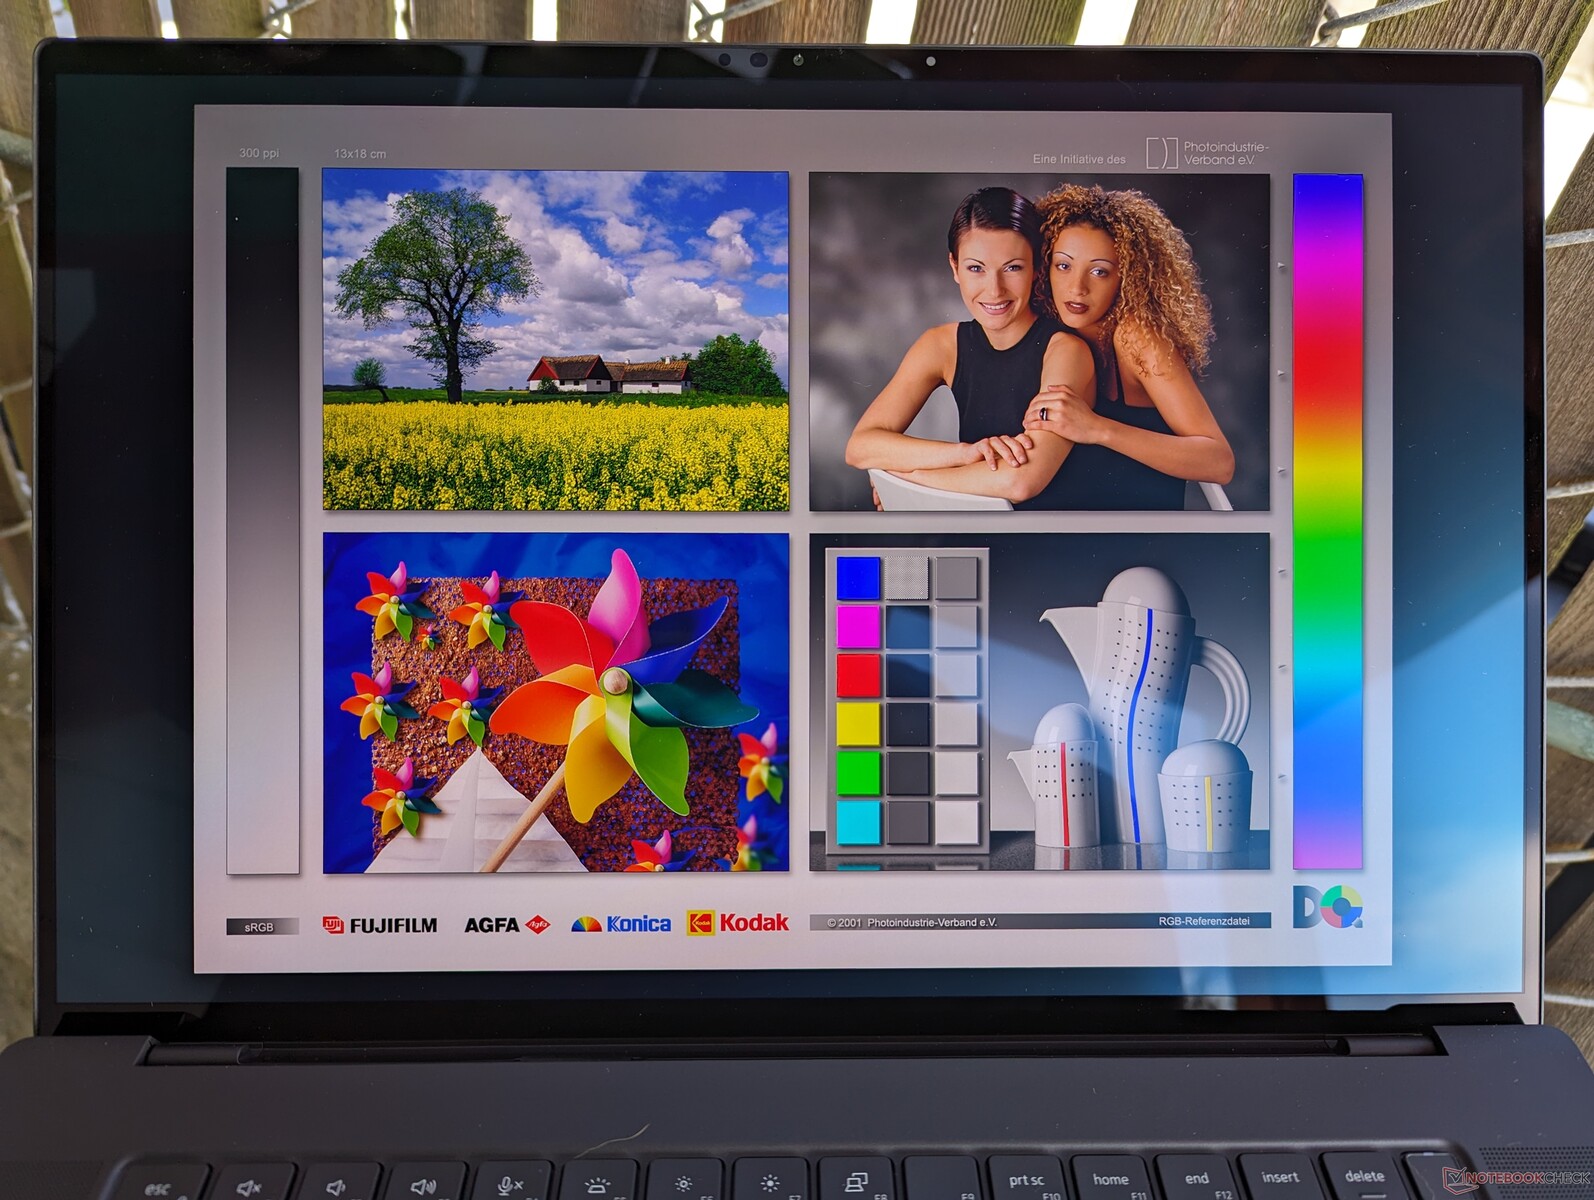
Display — HDR OLED At 60 Hz

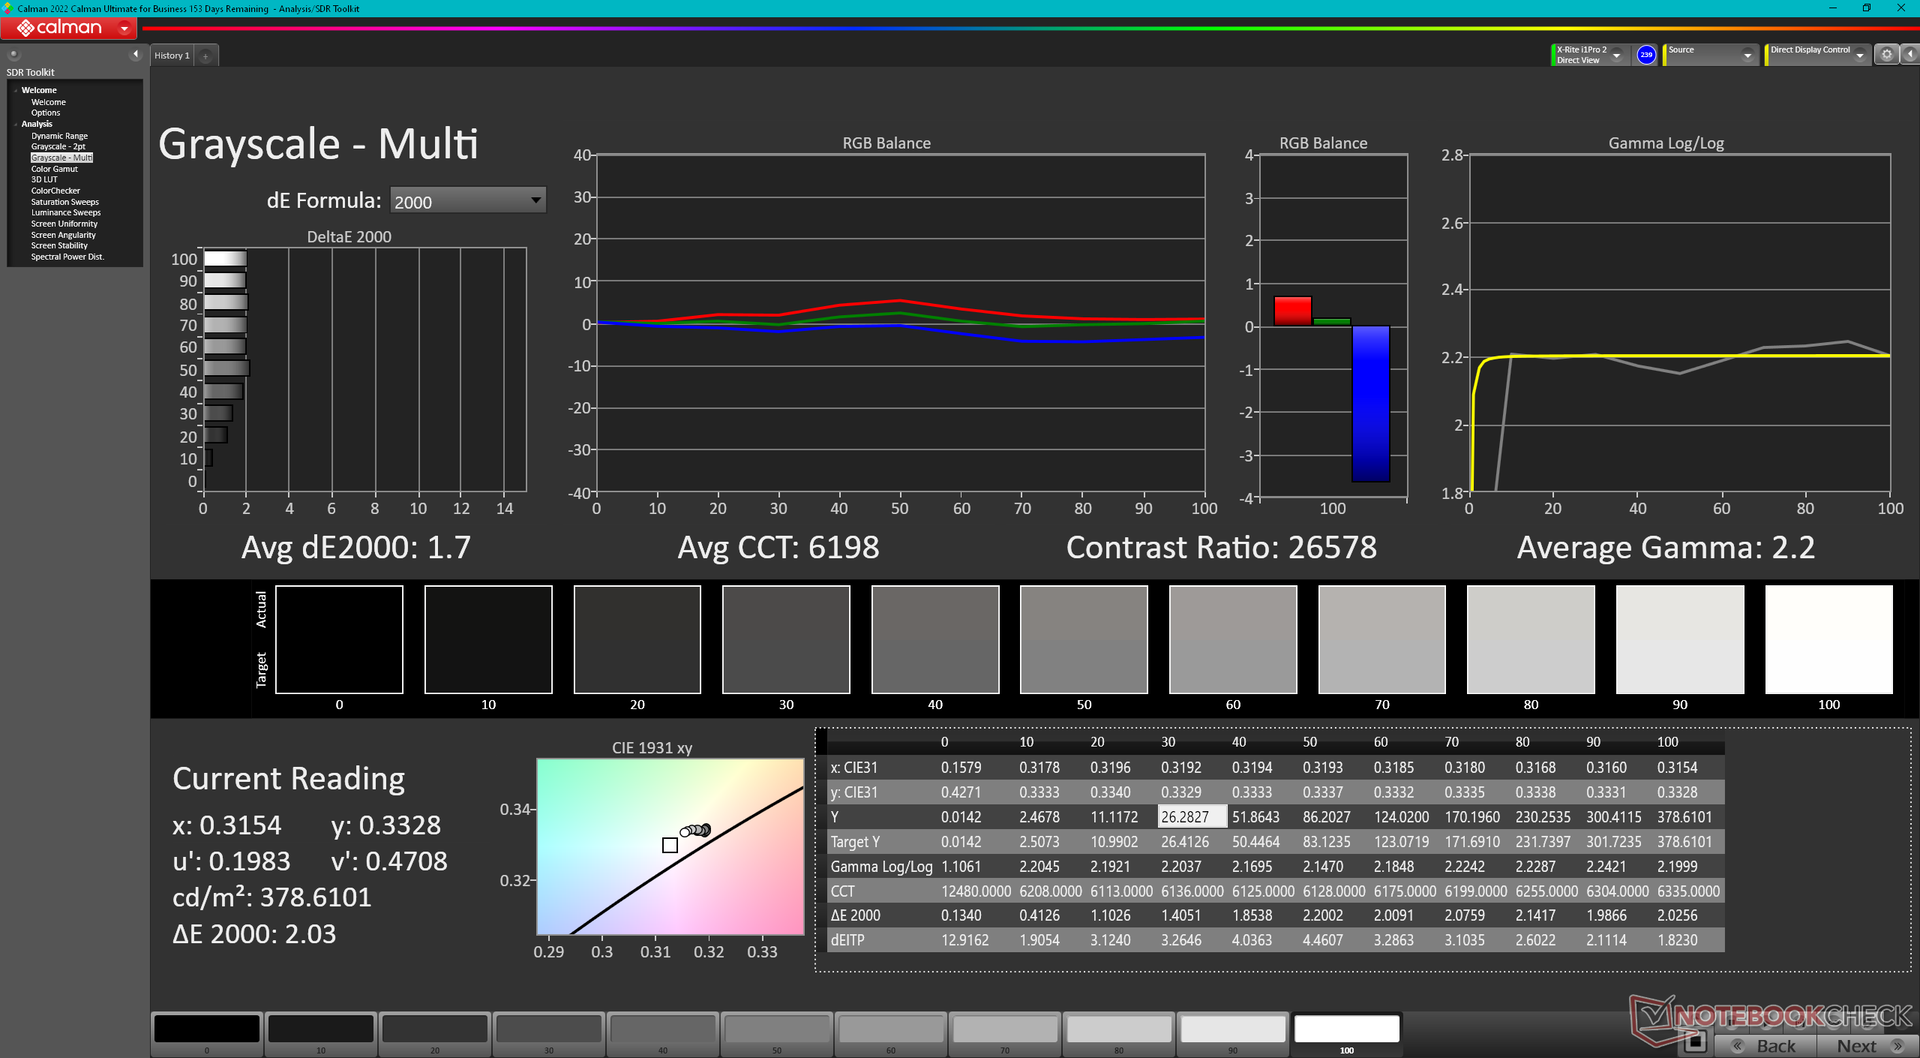
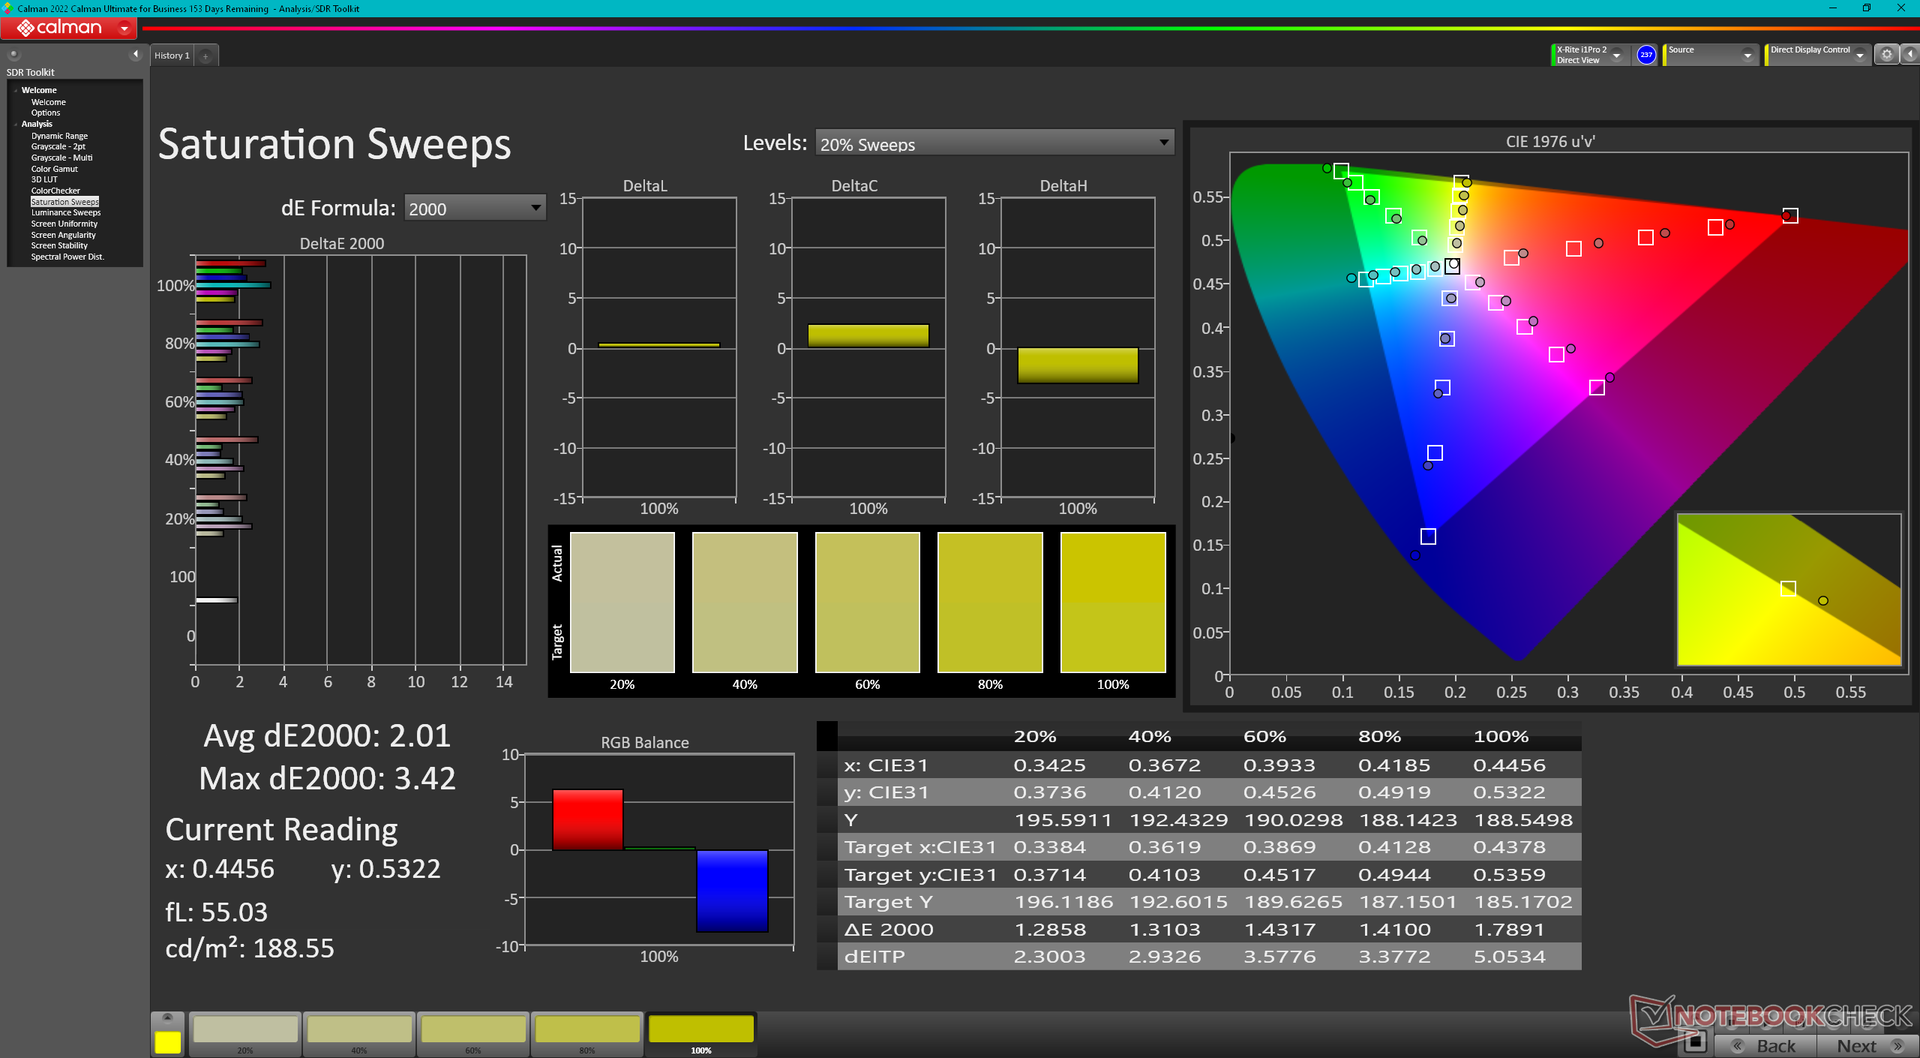
The 2024 model utilizes the same 4K Samsung 160YV03 OLED panel and D3KJF part number as the previous year for no changes to the visual experience. On one hand, this is excellent as the OLED panel comes pre-calibrated with full DCI-P3 colors and touch support. On the other hand, it would have been great to see higher refresh rates with adaptive options as the standard 60 Hz refresh rate is starting to age.
Maximum brightness on SDR and HDR modes can reach 350 nits and 600 nits, respectively.
| |||||||||||||||||||||||||
Brightness Distribution: 97 %
Center on Battery: 348.1 cd/m²
Contrast: ∞:1 (Black: 0 cd/m²)
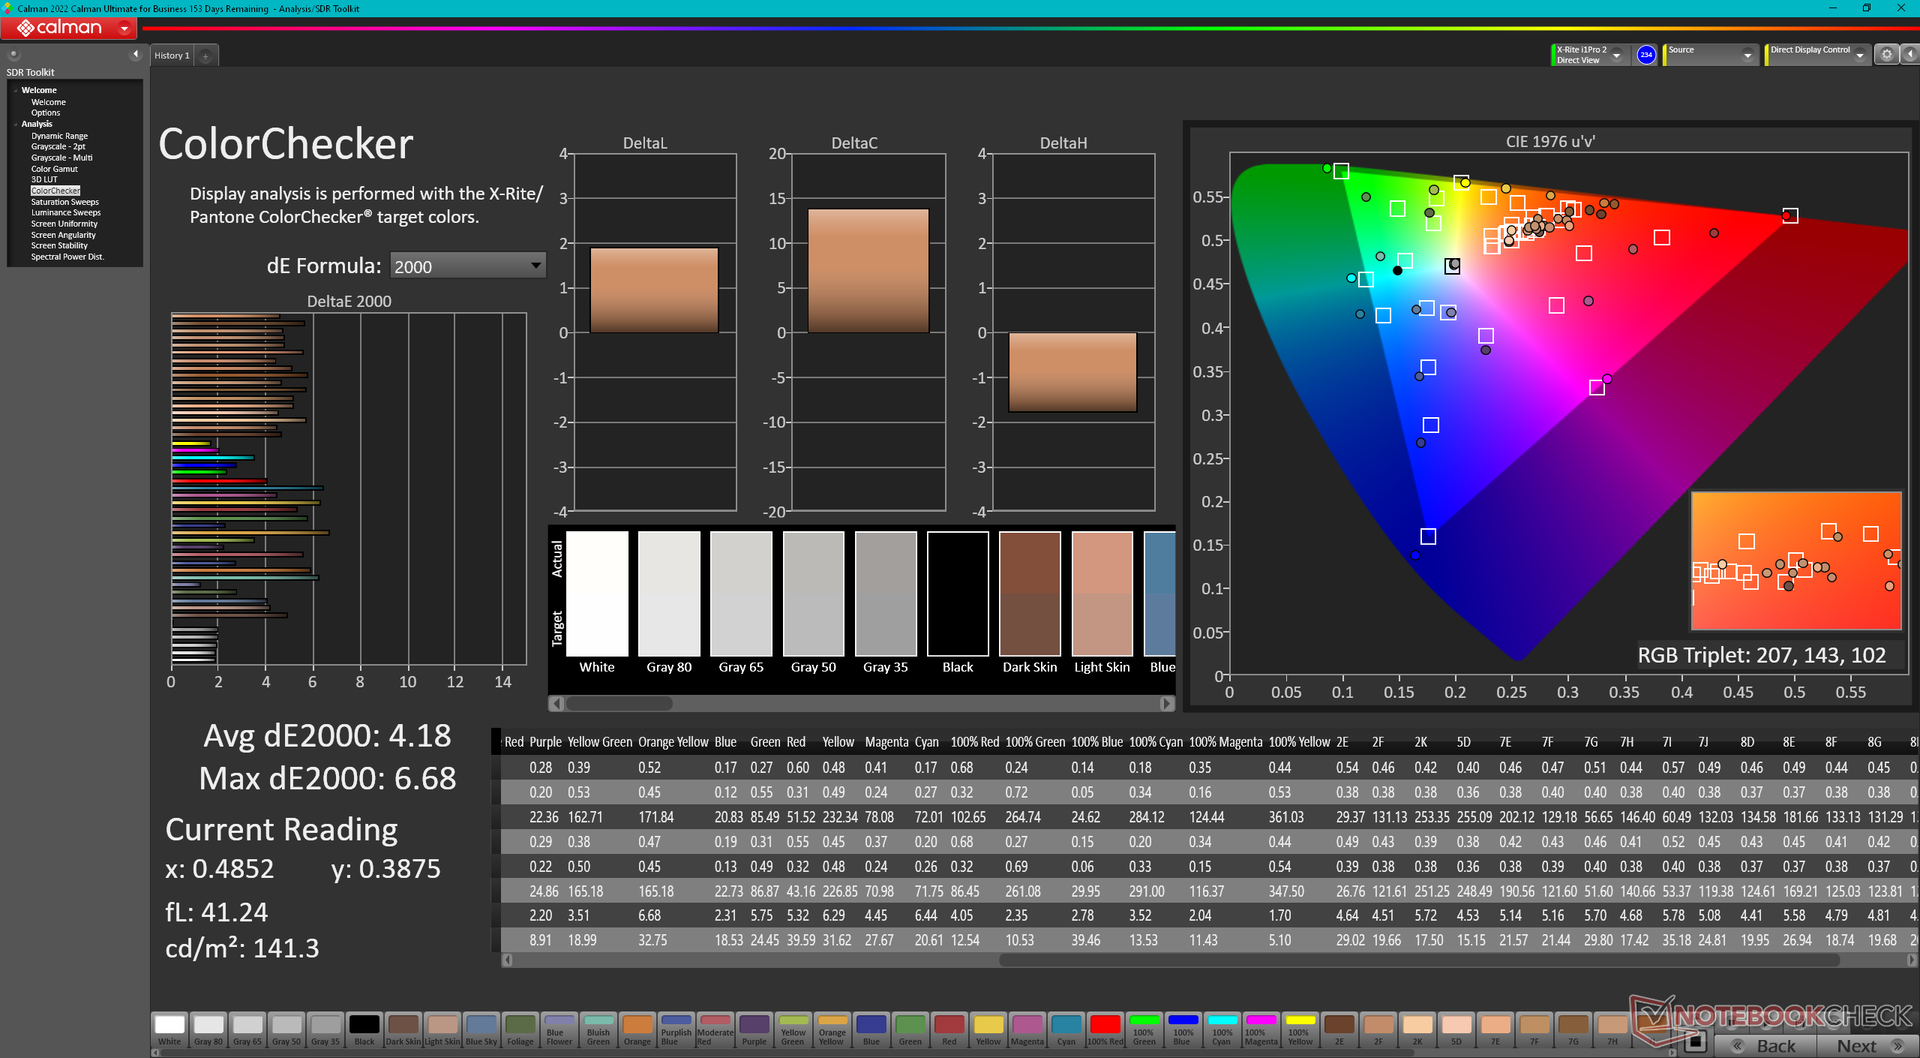
ΔE ColorChecker Calman: 4.18 | ∀{0.5-29.43 Ø4.73}
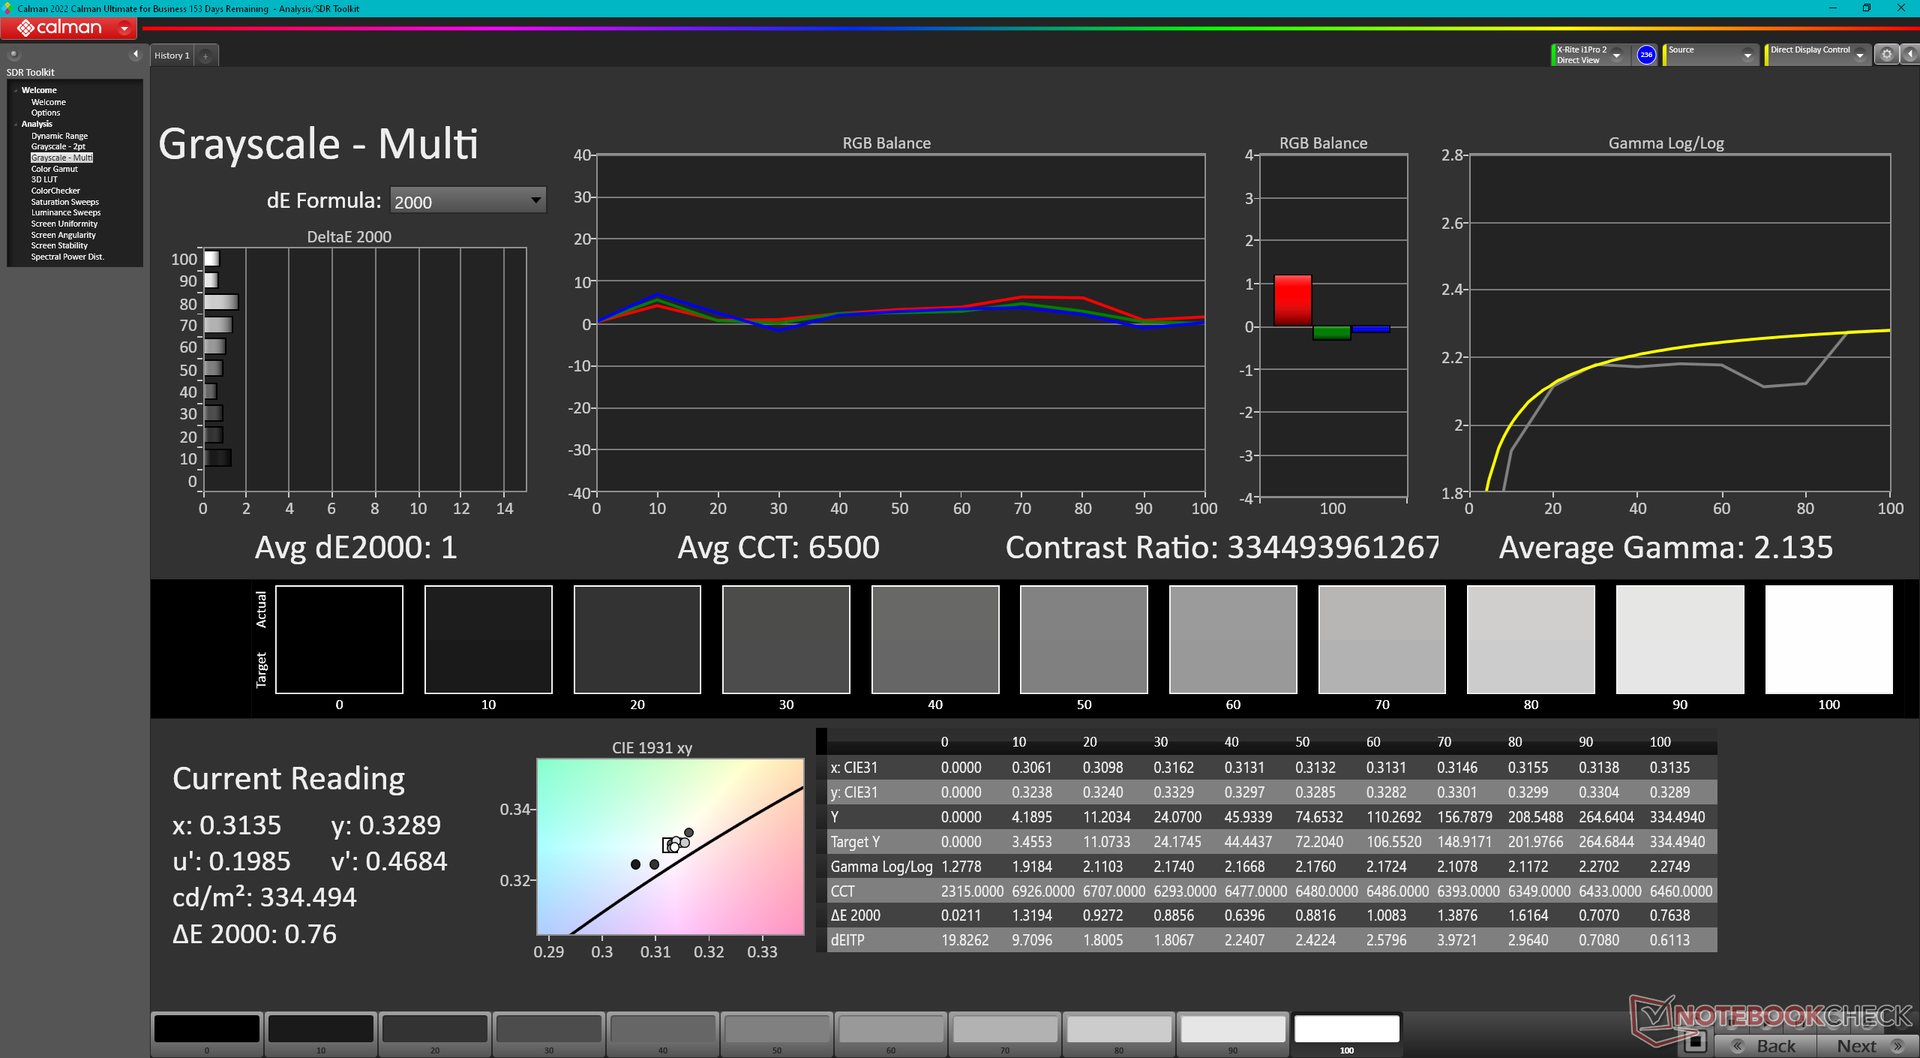
calibrated: 0.97
ΔE Greyscale Calman: 1.7 | ∀{0.09-98 Ø4.97}
96.6% AdobeRGB 1998 (Argyll 3D)
100% sRGB (Argyll 3D)
99.8% Display P3 (Argyll 3D)
Gamma: 2.2
CCT: 6198 K
| Dell Precision 5690 Samsung 160YV03, OLED, 3840x2400, 16" | Dell Precision 5000 5680 Samsung 160YV03, OLED, 3840x2400, 16" | Lenovo ThinkPad P16 G2 21FA000FGE MNG007DA1-9, IPS LED, 2560x1600, 16" | Lenovo ThinkPad P1 G6-21FV000DGE NE160QDM-NY1, IPS, 2560x1600, 16" | HP ZBook Fury 16 G10 AUO87A8, IPS, 3840x2400, 16" | MSI CreatorPro Z16P B12UKST B160QAN02.N, IPS, 2560x1600, 16" | |
|---|---|---|---|---|---|---|
| Display | 0% | -18% | -20% | -4% | -4% | |
| Display P3 Coverage (%) | 99.8 | 99.9 0% | 71 -29% | 68.1 -32% | 98 -2% | 97.6 -2% |
| sRGB Coverage (%) | 100 | 100 0% | 99.2 -1% | 97.5 -2% | 99.9 0% | 99.9 0% |
| AdobeRGB 1998 Coverage (%) | 96.6 | 97.5 1% | 73.2 -24% | 70.2 -27% | 86.2 -11% | 87.4 -10% |
| Response Times | -2% | -574% | -586% | -533% | -494% | |
| Response Time Grey 50% / Grey 80% * (ms) | 1.7 ? | 1.68 ? 1% | 12.8 ? -653% | 13.7 ? -706% | 11.9 ? -600% | 12.8 ? -653% |
| Response Time Black / White * (ms) | 1.7 ? | 1.77 ? -4% | 10.1 ? -494% | 9.6 ? -465% | 9.6 ? -465% | 7.4 ? -335% |
| PWM Frequency (Hz) | 60 ? | 60 ? | ||||
| Screen | -11% | -15% | 33% | 36% | 22% | |
| Brightness middle (cd/m²) | 348.1 | 345.7 -1% | 510 47% | 521 50% | 514.6 48% | 407 17% |
| Brightness (cd/m²) | 351 | 349 -1% | 517 47% | 484 38% | 495 41% | 388 11% |
| Brightness Distribution (%) | 97 | 98 1% | 89 -8% | 89 -8% | 90 -7% | 88 -9% |
| Black Level * (cd/m²) | 0.37 | 0.36 | 0.46 | 0.36 | ||
| Colorchecker dE 2000 * | 4.18 | 3.59 14% | 2.6 38% | 1.2 71% | 2.4 43% | 1.3 69% |
| Colorchecker dE 2000 max. * | 6.68 | 7.02 -5% | 5.2 22% | 2.5 63% | 4.86 27% | 2.5 63% |
| Colorchecker dE 2000 calibrated * | 0.97 | 0.99 -2% | 2.3 -137% | 1 -3% | 0.4 59% | 0.7 28% |
| Greyscale dE 2000 * | 1.7 | 3.1 -82% | 3.6 -112% | 1.4 18% | 1 41% | 2.1 -24% |
| Gamma | 2.2 100% | 2.13 103% | 2.26 97% | 2.25 98% | 2.3 96% | 2.26 97% |
| CCT | 6198 105% | 6448 101% | 5969 109% | 6682 97% | 6553 99% | 6437 101% |
| Contrast (:1) | 1378 | 1447 | 1119 | 1131 | ||
| Total Average (Program / Settings) | -4% /
-7% | -202% /
-109% | -191% /
-84% | -167% /
-69% | -159% /
-70% |
* ... smaller is better
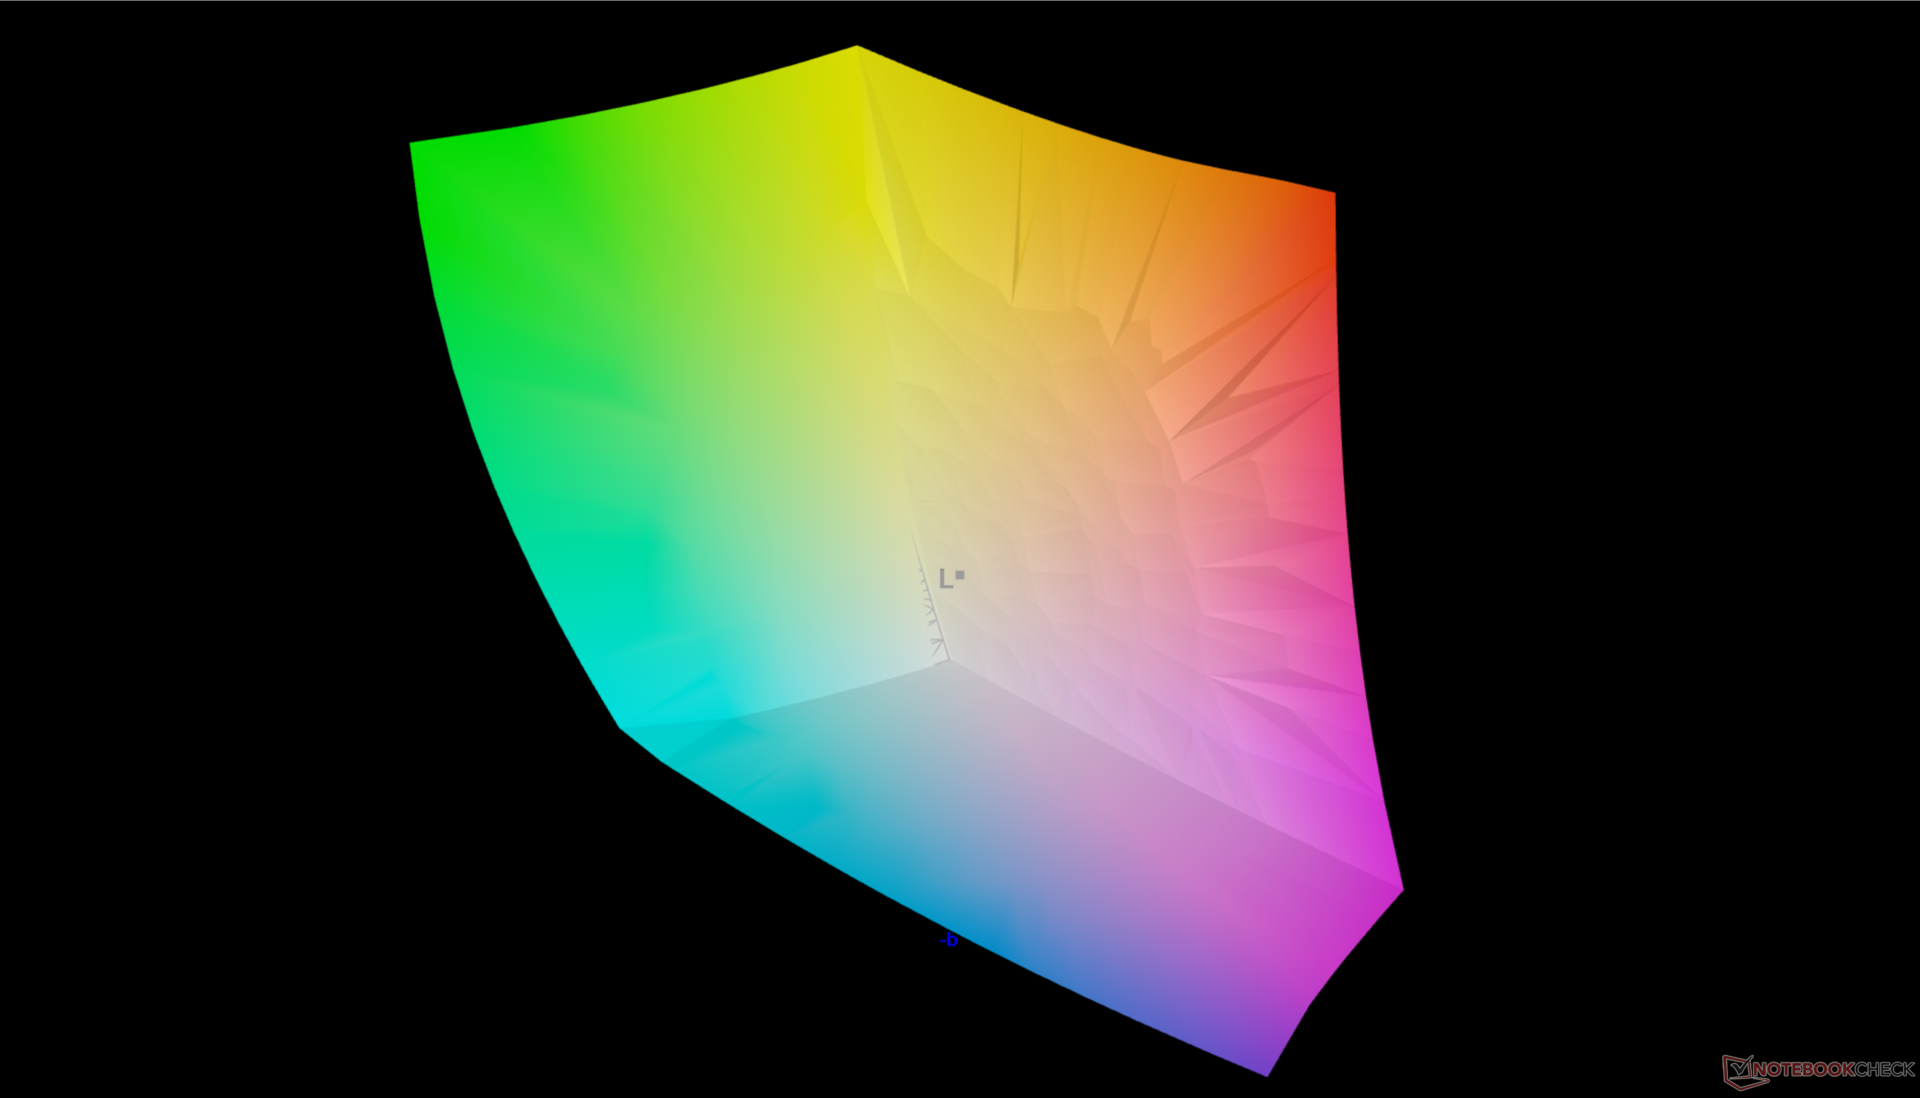
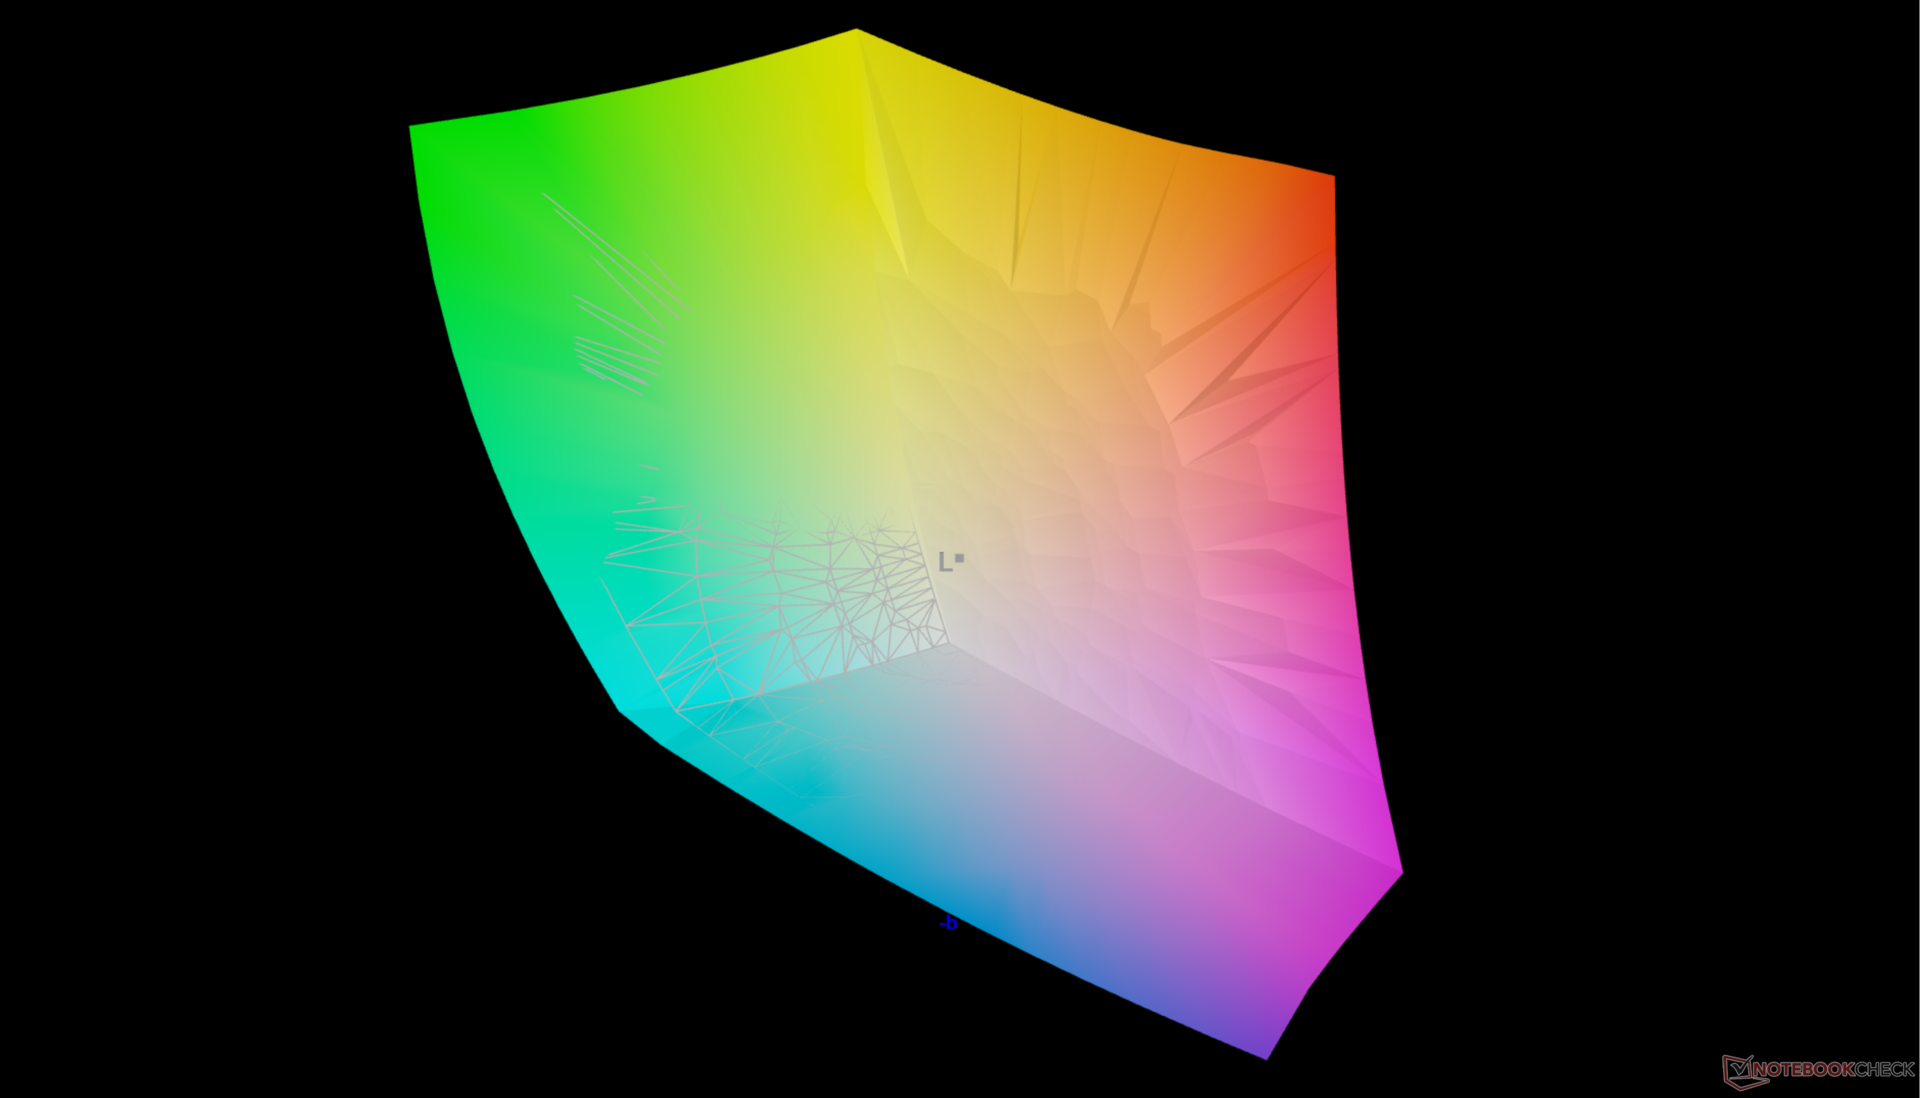
The display comes well-calibrated against the P3 standard with average grayscale and color DeltaE values of just 1.7 and 4.18, respectively.
Display Response Times
| ↔ Response Time Black to White | ||
|---|---|---|
| 1.7 ms ... rise ↗ and fall ↘ combined | ↗ 0.74 ms rise | 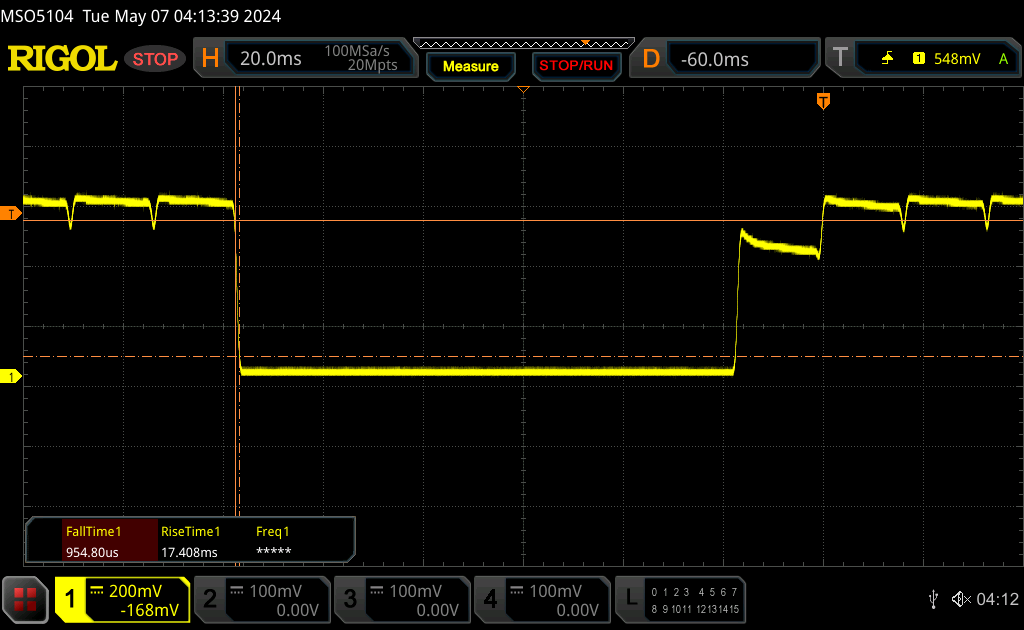 |
| ↘ 0.96 ms fall | ||
| The screen shows very fast response rates in our tests and should be very well suited for fast-paced gaming. In comparison, all tested devices range from 0.1 (minimum) to 240 (maximum) ms. » 10 % of all devices are better. This means that the measured response time is better than the average of all tested devices (19.9 ms). | ||
| ↔ Response Time 50% Grey to 80% Grey | ||
| 1.7 ms ... rise ↗ and fall ↘ combined | ↗ 0.88 ms rise | 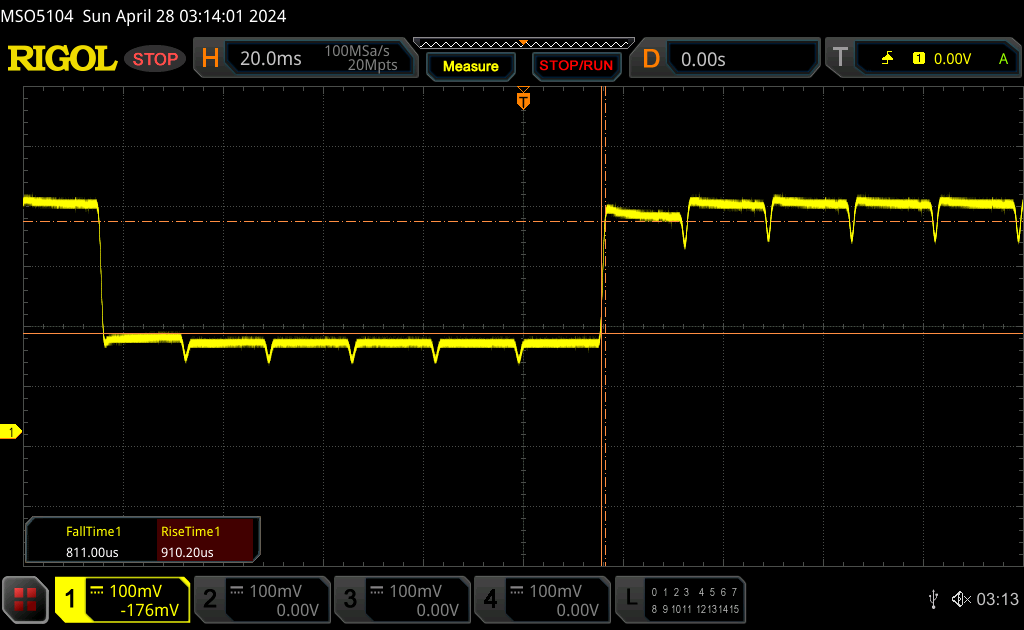 |
| ↘ 0.82 ms fall | ||
| The screen shows very fast response rates in our tests and should be very well suited for fast-paced gaming. In comparison, all tested devices range from 0.165 (minimum) to 636 (maximum) ms. » 8 % of all devices are better. This means that the measured response time is better than the average of all tested devices (31.1 ms). | ||
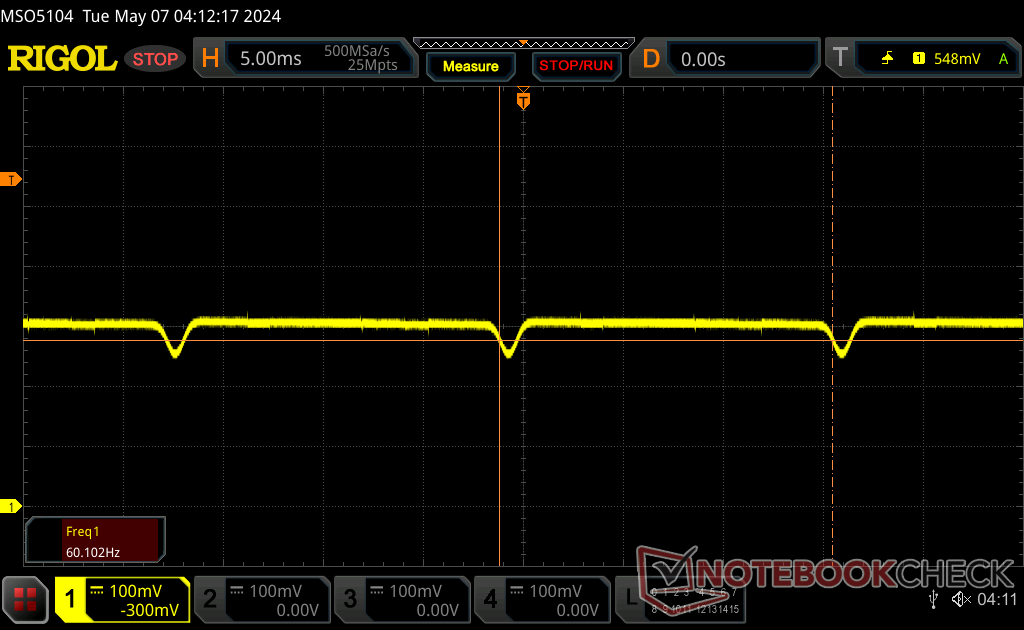
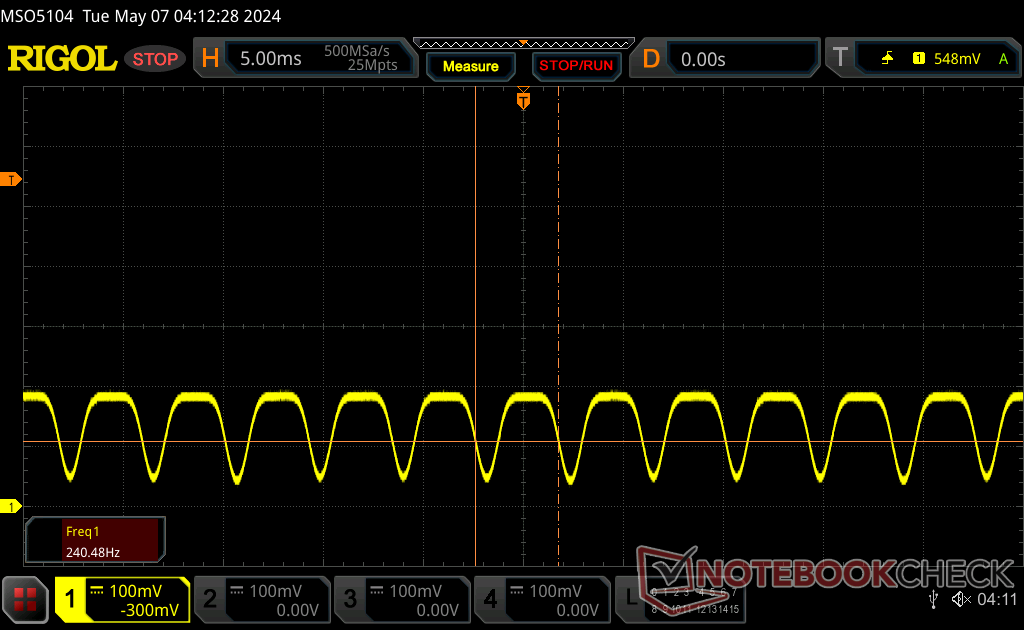
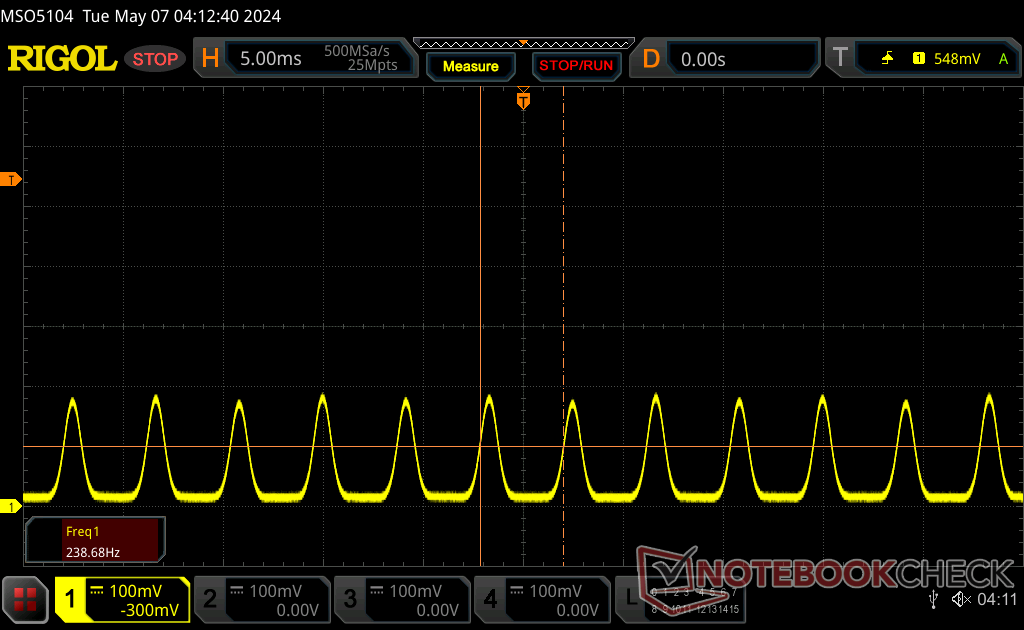
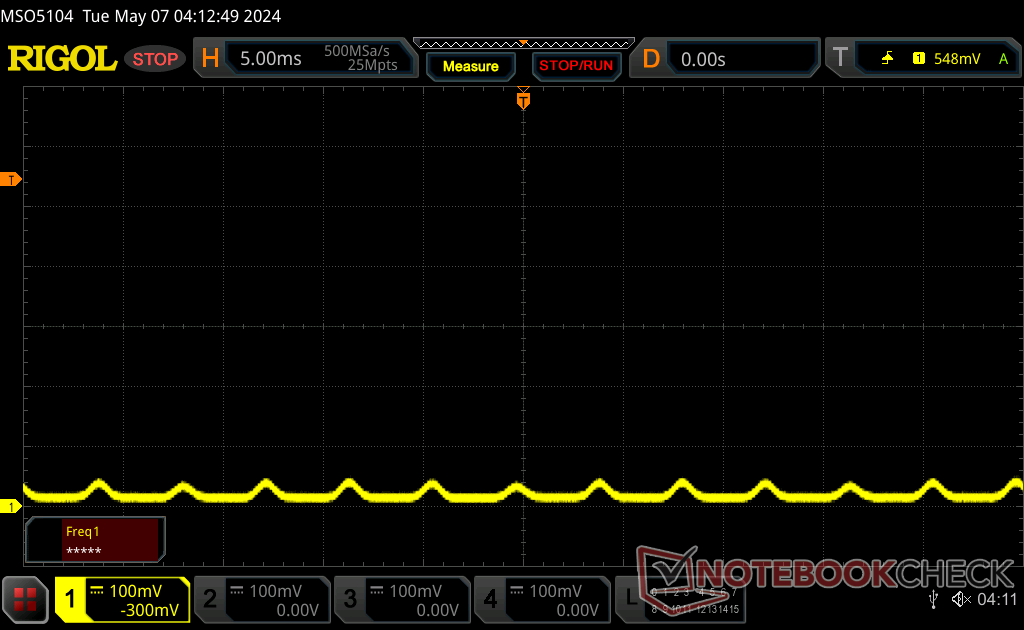
Screen Flickering / PWM (Pulse-Width Modulation)
| Screen flickering / PWM detected | 60 Hz | ≤ 100 % brightness setting | 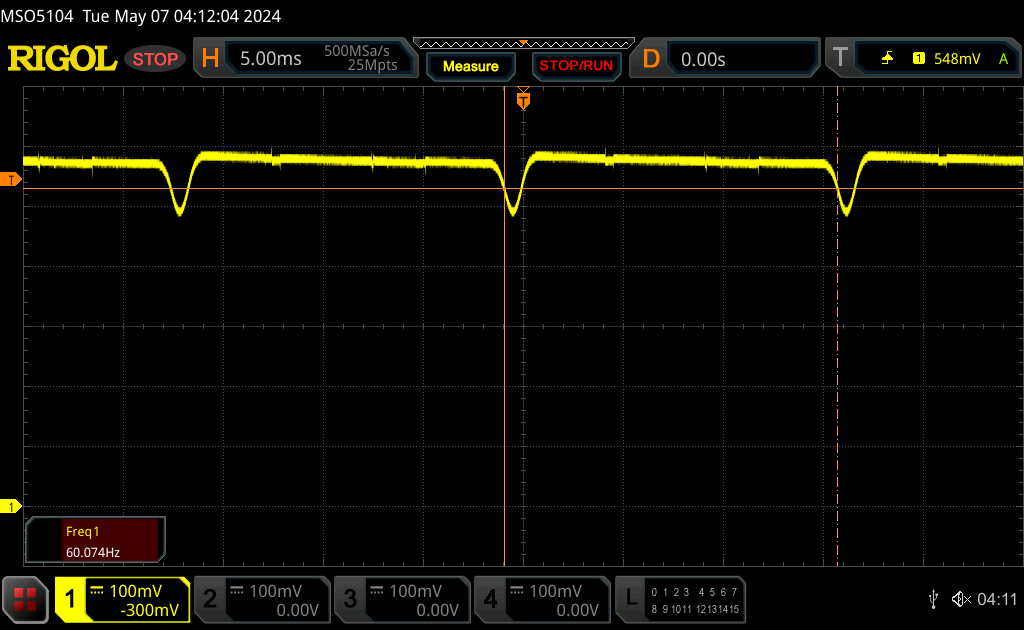 |
The display backlight flickers at 60 Hz (worst case, e.g., utilizing PWM) Flickering detected at a brightness setting of 100 % and below. There should be no flickering or PWM above this brightness setting. The frequency of 60 Hz is very low, so the flickering may cause eyestrain and headaches after extended use. In comparison: 52 % of all tested devices do not use PWM to dim the display. If PWM was detected, an average of 7784 (minimum: 5 - maximum: 343500) Hz was measured. | |||


Performance
Testing Conditions
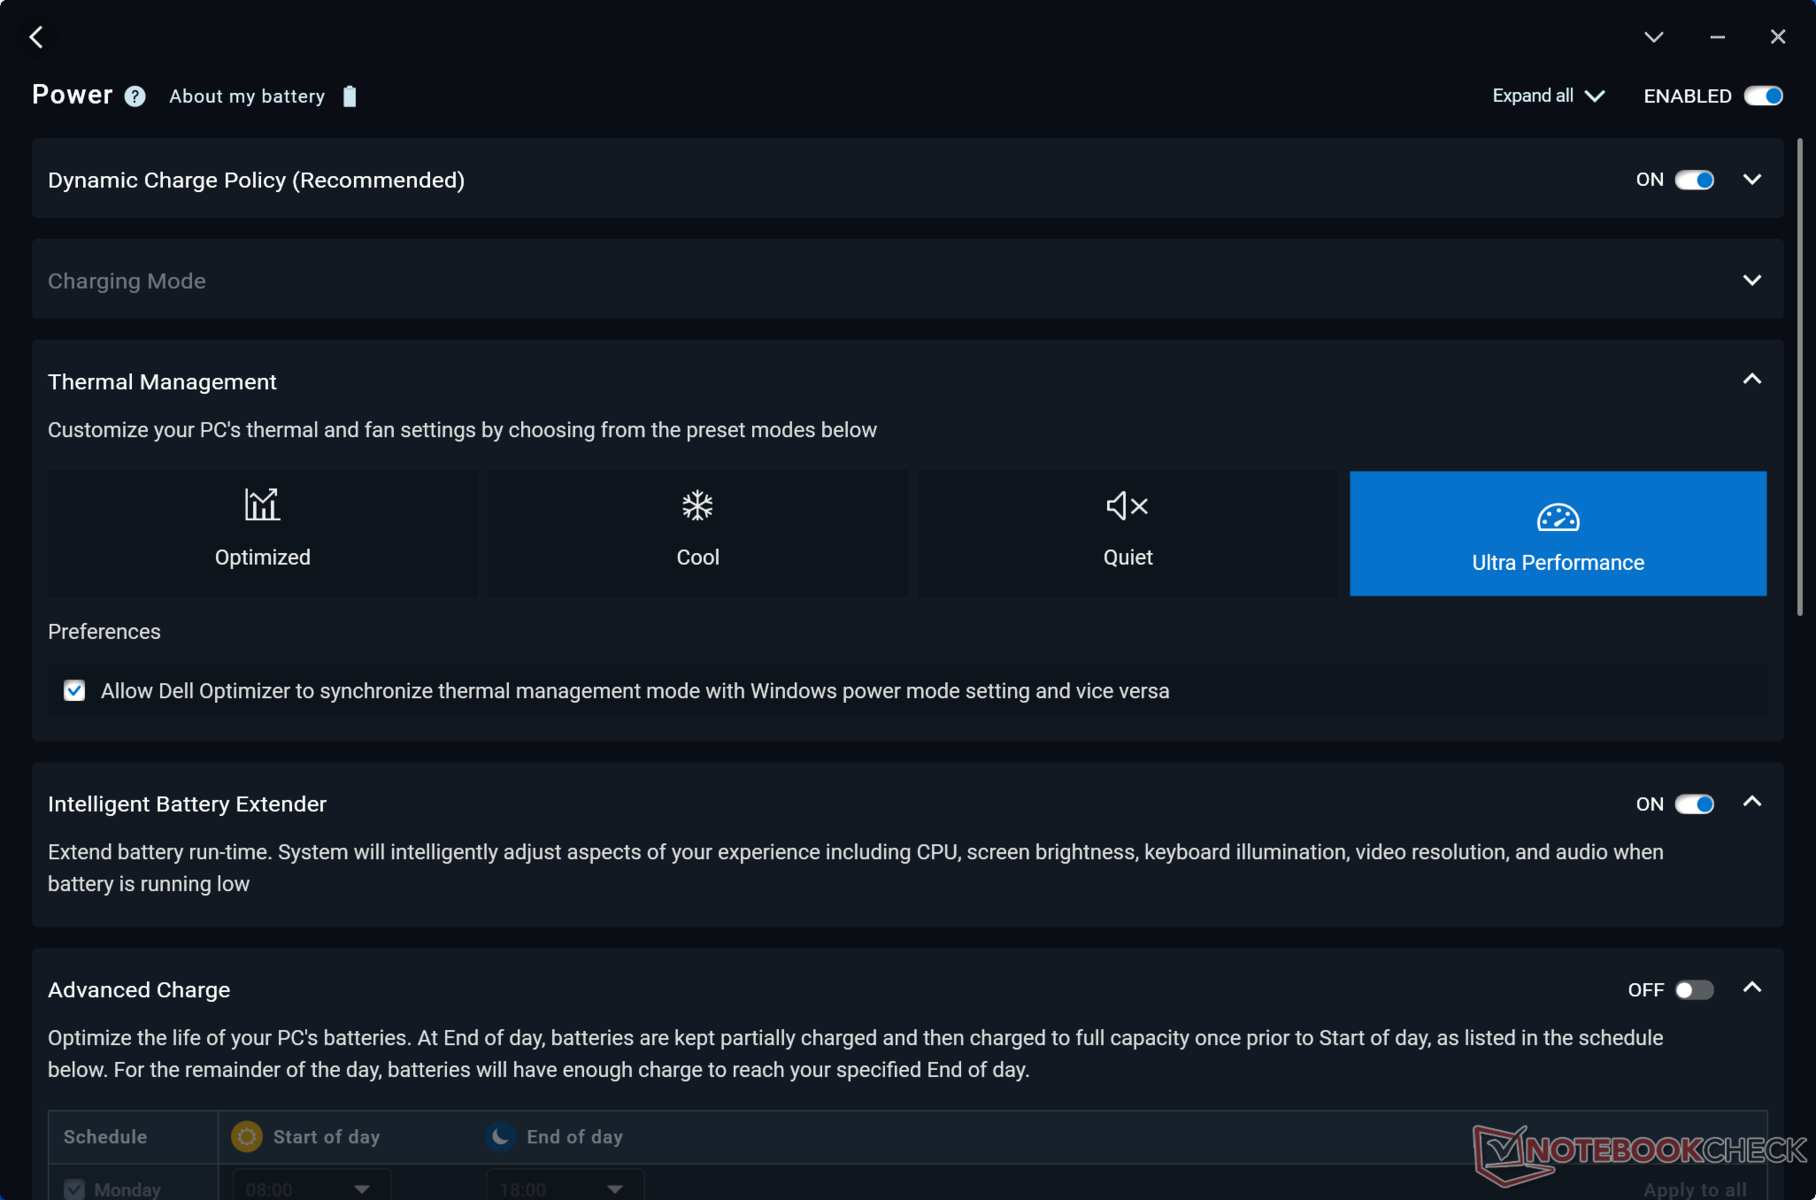
We set Dell Optimizer to Ultra Performance mode prior to running the benchmarks below. We also toggled ECC VRAM off via Nvidia Control Panel. Enabling ECC VRAM reduces accessible memory by about 1 GB.

Processor
The Core Ultra 9 185H performs almost identically to the Core i9-13900H in both single- and multi-threaded workloads. It does benefit more from Turbo Boost for that faster initial burst of speed, but this advantage is only temporary before settling at similar performance levels as the older Core i9 Precision 5680 as shown by the comparison graph below.
Downgrading to the Core Ultra 7 165H and Ultra 5 135H is expected to impact processor performance by 5 to 10 percent and 40 to 50 percent, respectively, meaning that the performance delta is significantly wider between the Core Ultra 5 and Ultra 7 than the Core Ultra 7 and Ultra 9. The Precision 5690 does not include any 14th gen Raptor Lake-HX CPUs which would have boosted performance even faster than the Core Ultra 9 185H. In return, however, the Core Ultra CPUs include integrated NPUs to accelerate local AI tasks when they become more readily available in the near future.
Cinebench R15 Multi Loop
Cinebench R23: Multi Core | Single Core
Cinebench R20: CPU (Multi Core) | CPU (Single Core)
Cinebench R15: CPU Multi 64Bit | CPU Single 64Bit
Blender: v2.79 BMW27 CPU
7-Zip 18.03: 7z b 4 | 7z b 4 -mmt1
Geekbench 6.7: Multi-Core | Single-Core
Geekbench 5.5: Multi-Core | Single-Core
HWBOT x265 Benchmark v2.2: 4k Preset
LibreOffice : 20 Documents To PDF
R Benchmark 2.5: Overall mean
| Geekbench 6.7 / Multi-Core | |
| HP ZBook Fury 16 G10 | |
| Dell Precision 5000 5680 | |
| Dell Precision 5690 | |
| Dell XPS 16 9640 | |
| Average Intel Core Ultra 9 185H (9140 - 14540, n=20) | |
| Lenovo ThinkPad P1 G6-21FV000DGE | |
| Lenovo ThinkPad P16s G2 21K9000CGE | |
| Samsung Galaxy Book4 Pro 360 | |
| Lenovo ThinkPad P16v G1 AMD | |
| Geekbench 6.7 / Single-Core | |
| HP ZBook Fury 16 G10 | |
| Lenovo ThinkPad P1 G6-21FV000DGE | |
| Dell Precision 5000 5680 | |
| Lenovo ThinkPad P16v G1 AMD | |
| Dell Precision 5690 | |
| Lenovo ThinkPad P16s G2 21K9000CGE | |
| Dell XPS 16 9640 | |
| Average Intel Core Ultra 9 185H (1490 - 2573, n=20) | |
| Samsung Galaxy Book4 Pro 360 | |
Cinebench R23: Multi Core | Single Core
Cinebench R20: CPU (Multi Core) | CPU (Single Core)
Cinebench R15: CPU Multi 64Bit | CPU Single 64Bit
Blender: v2.79 BMW27 CPU
7-Zip 18.03: 7z b 4 | 7z b 4 -mmt1
Geekbench 6.7: Multi-Core | Single-Core
Geekbench 5.5: Multi-Core | Single-Core
HWBOT x265 Benchmark v2.2: 4k Preset
LibreOffice : 20 Documents To PDF
R Benchmark 2.5: Overall mean
* ... smaller is better
AIDA64: FP32 Ray-Trace | FPU Julia | CPU SHA3 | CPU Queen | FPU SinJulia | FPU Mandel | CPU AES | CPU ZLib | FP64 Ray-Trace | CPU PhotoWorxx
| Performance rating | |
| HP ZBook Fury 16 G10 | |
| Dell Precision 5690 | |
| Lenovo ThinkPad P16 G2 21FA000FGE | |
| Average Intel Core Ultra 9 185H | |
| Dell Precision 5000 5680 | |
| MSI CreatorPro Z16P B12UKST | |
| Lenovo ThinkPad P1 G6-21FV000DGE | |
| AIDA64 / FP32 Ray-Trace | |
| HP ZBook Fury 16 G10 | |
| Dell Precision 5690 | |
| Lenovo ThinkPad P16 G2 21FA000FGE | |
| Lenovo ThinkPad P1 G6-21FV000DGE | |
| Average Intel Core Ultra 9 185H (9220 - 18676, n=20) | |
| Dell Precision 5000 5680 | |
| MSI CreatorPro Z16P B12UKST | |
| AIDA64 / FPU Julia | |
| HP ZBook Fury 16 G10 | |
| Dell Precision 5690 | |
| Lenovo ThinkPad P16 G2 21FA000FGE | |
| Lenovo ThinkPad P1 G6-21FV000DGE | |
| Average Intel Core Ultra 9 185H (48865 - 96463, n=20) | |
| Dell Precision 5000 5680 | |
| MSI CreatorPro Z16P B12UKST | |
| AIDA64 / CPU SHA3 | |
| HP ZBook Fury 16 G10 | |
| Dell Precision 5690 | |
| Lenovo ThinkPad P16 G2 21FA000FGE | |
| Average Intel Core Ultra 9 185H (2394 - 4534, n=20) | |
| Lenovo ThinkPad P1 G6-21FV000DGE | |
| MSI CreatorPro Z16P B12UKST | |
| Dell Precision 5000 5680 | |
| AIDA64 / CPU Queen | |
| HP ZBook Fury 16 G10 | |
| Dell Precision 5000 5680 | |
| Lenovo ThinkPad P1 G6-21FV000DGE | |
| Lenovo ThinkPad P16 G2 21FA000FGE | |
| MSI CreatorPro Z16P B12UKST | |
| Dell Precision 5690 | |
| Average Intel Core Ultra 9 185H (66785 - 95241, n=20) | |
| AIDA64 / FPU SinJulia | |
| HP ZBook Fury 16 G10 | |
| Lenovo ThinkPad P16 G2 21FA000FGE | |
| Dell Precision 5690 | |
| Average Intel Core Ultra 9 185H (7255 - 11392, n=20) | |
| Lenovo ThinkPad P1 G6-21FV000DGE | |
| Dell Precision 5000 5680 | |
| MSI CreatorPro Z16P B12UKST | |
| AIDA64 / FPU Mandel | |
| HP ZBook Fury 16 G10 | |
| Dell Precision 5690 | |
| Lenovo ThinkPad P16 G2 21FA000FGE | |
| Average Intel Core Ultra 9 185H (24004 - 48020, n=20) | |
| Lenovo ThinkPad P1 G6-21FV000DGE | |
| Dell Precision 5000 5680 | |
| MSI CreatorPro Z16P B12UKST | |
| AIDA64 / CPU AES | |
| MSI CreatorPro Z16P B12UKST | |
| HP ZBook Fury 16 G10 | |
| Average Intel Core Ultra 9 185H (53116 - 154066, n=20) | |
| Dell Precision 5690 | |
| Lenovo ThinkPad P16 G2 21FA000FGE | |
| Lenovo ThinkPad P1 G6-21FV000DGE | |
| Dell Precision 5000 5680 | |
| AIDA64 / CPU ZLib | |
| HP ZBook Fury 16 G10 | |
| Dell Precision 5690 | |
| Average Intel Core Ultra 9 185H (678 - 1341, n=20) | |
| Lenovo ThinkPad P16 G2 21FA000FGE | |
| Lenovo ThinkPad P1 G6-21FV000DGE | |
| MSI CreatorPro Z16P B12UKST | |
| Dell Precision 5000 5680 | |
| AIDA64 / FP64 Ray-Trace | |
| HP ZBook Fury 16 G10 | |
| Lenovo ThinkPad P16 G2 21FA000FGE | |
| Dell Precision 5690 | |
| Lenovo ThinkPad P1 G6-21FV000DGE | |
| Dell Precision 5000 5680 | |
| Average Intel Core Ultra 9 185H (4428 - 10078, n=20) | |
| MSI CreatorPro Z16P B12UKST | |
| AIDA64 / CPU PhotoWorxx | |
| Dell Precision 5690 | |
| Average Intel Core Ultra 9 185H (44547 - 53918, n=20) | |
| Dell Precision 5000 5680 | |
| MSI CreatorPro Z16P B12UKST | |
| HP ZBook Fury 16 G10 | |
| Lenovo ThinkPad P16 G2 21FA000FGE | |
| Lenovo ThinkPad P1 G6-21FV000DGE | |
Stress Test
When initiating Prime95 stress, the CPU would boost to 3.7 GHz and 120 W until reaching a core temperature of 100 C just a few seconds later. It would then drop to 3 GHz and 73 W and remain relatively steady throughout. Both core temperature and package power draw would be slightly higher than what we recorded on the Precision 5680.
GPU board power draw when running Witcher 3 would be stable at 72 W even though the GPU is listed as 90 W on Nvidia Control Center. Results are similar to what we recorded on last year's model.
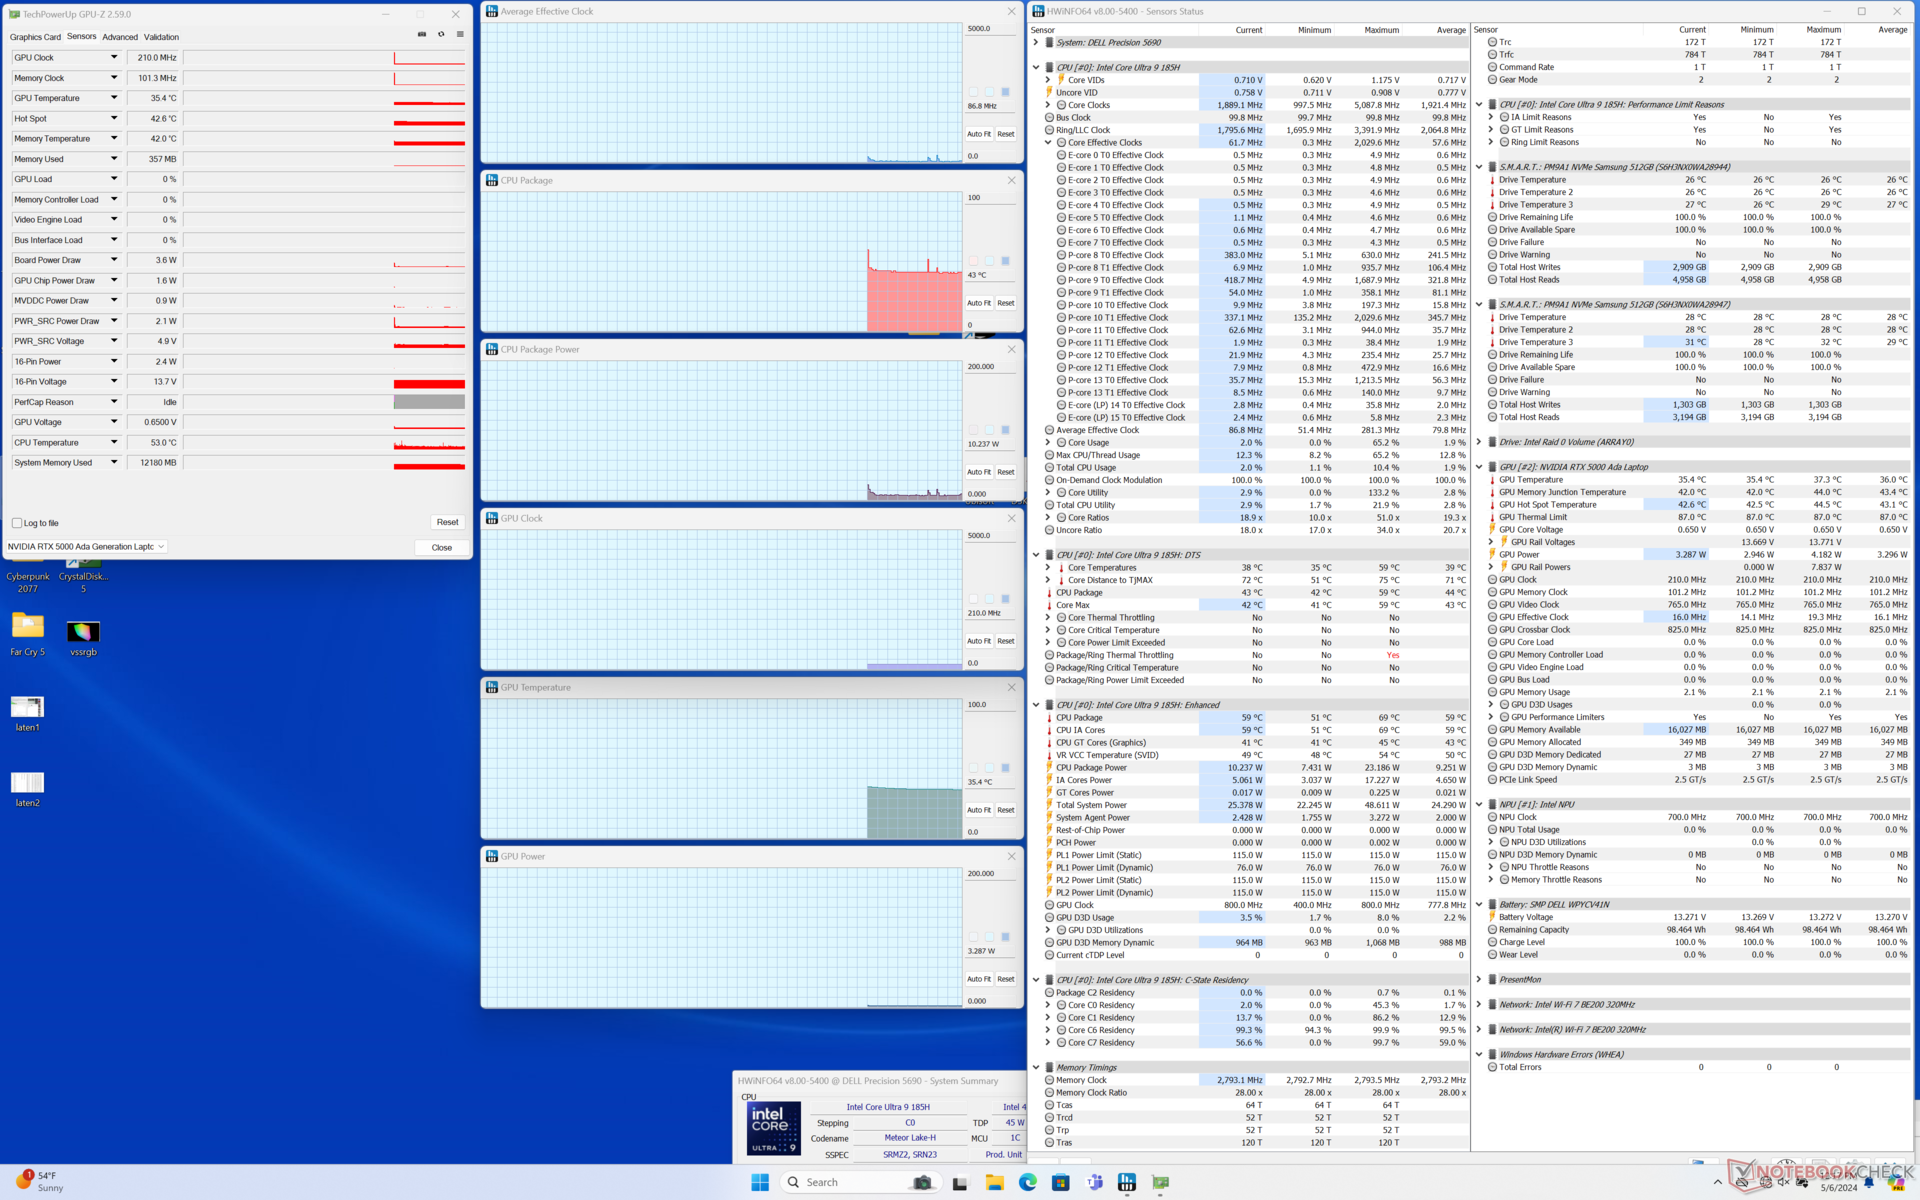
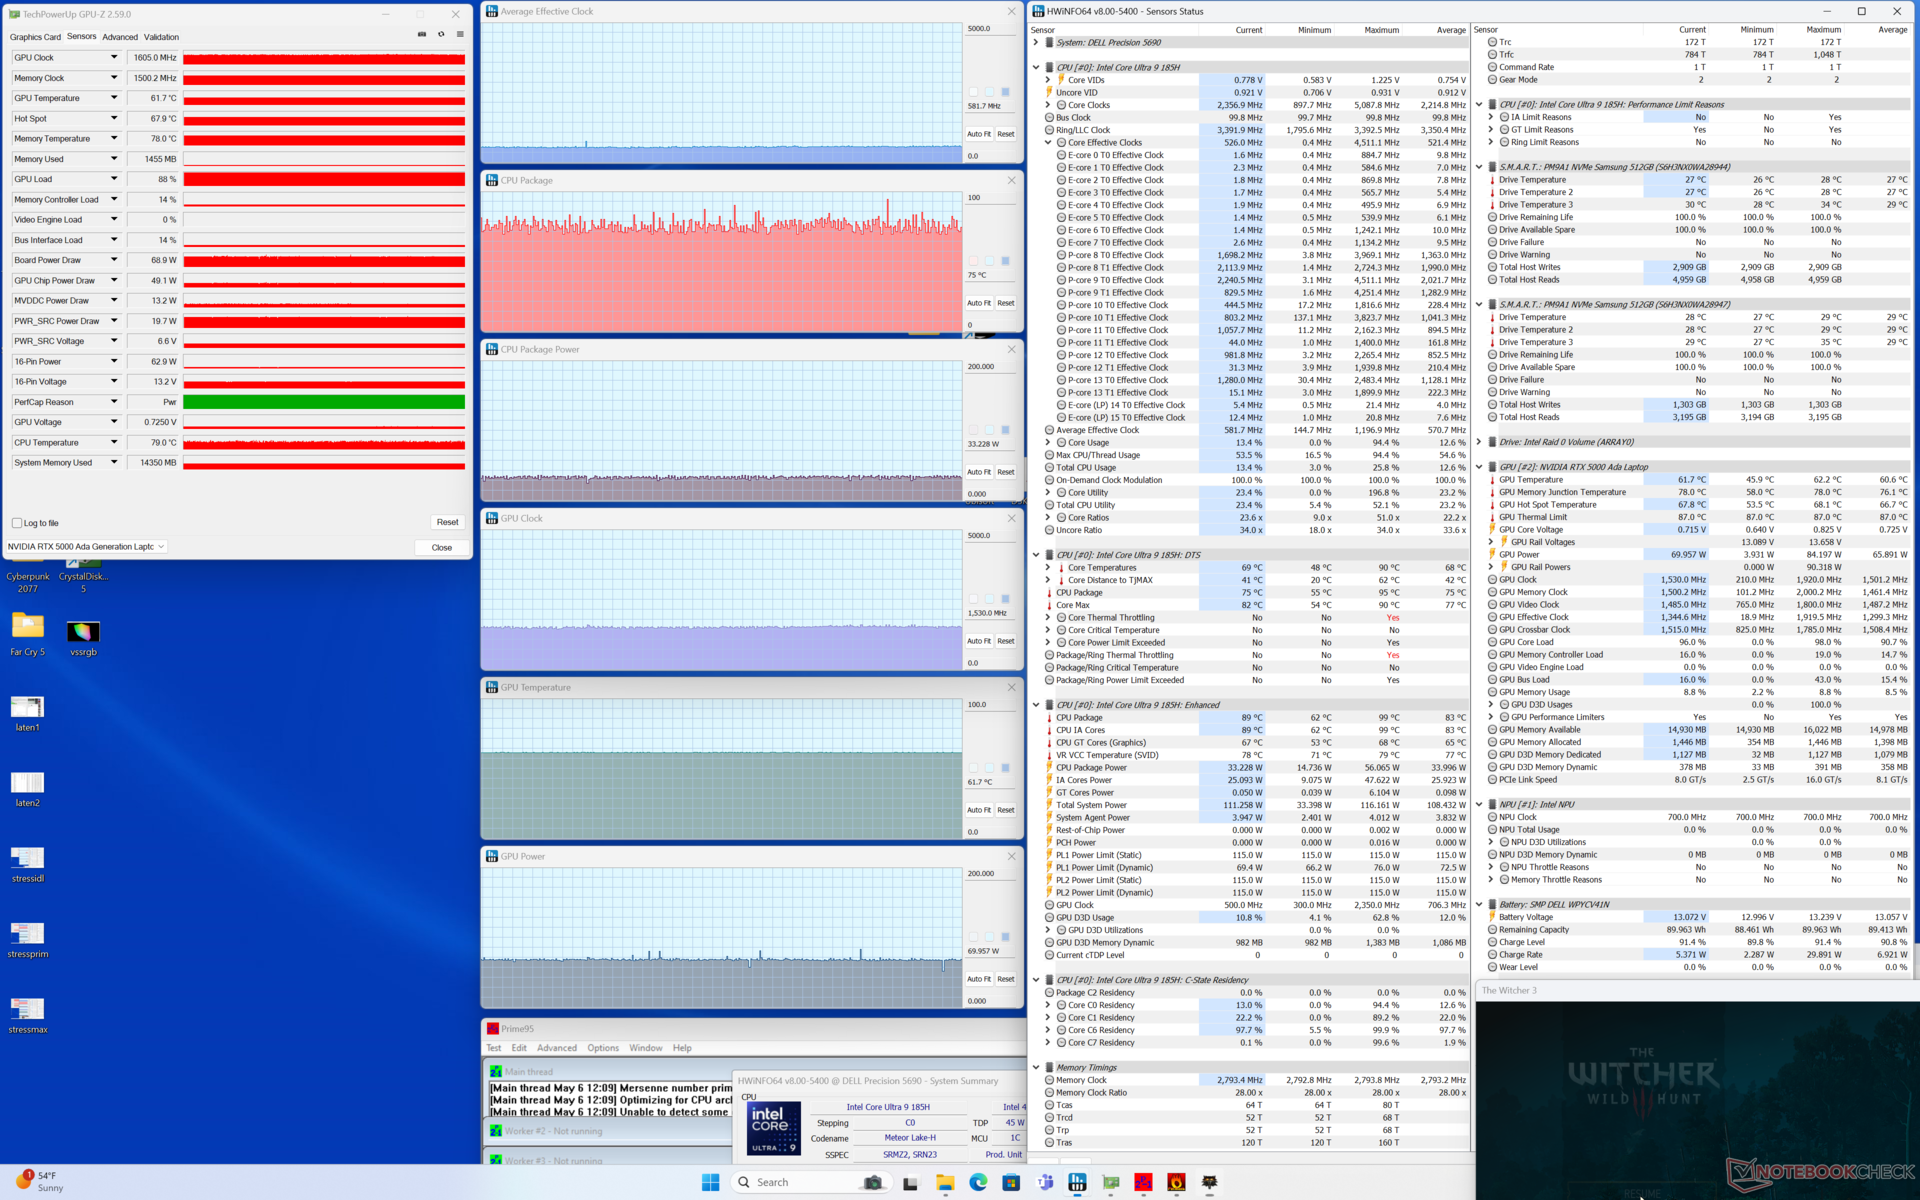
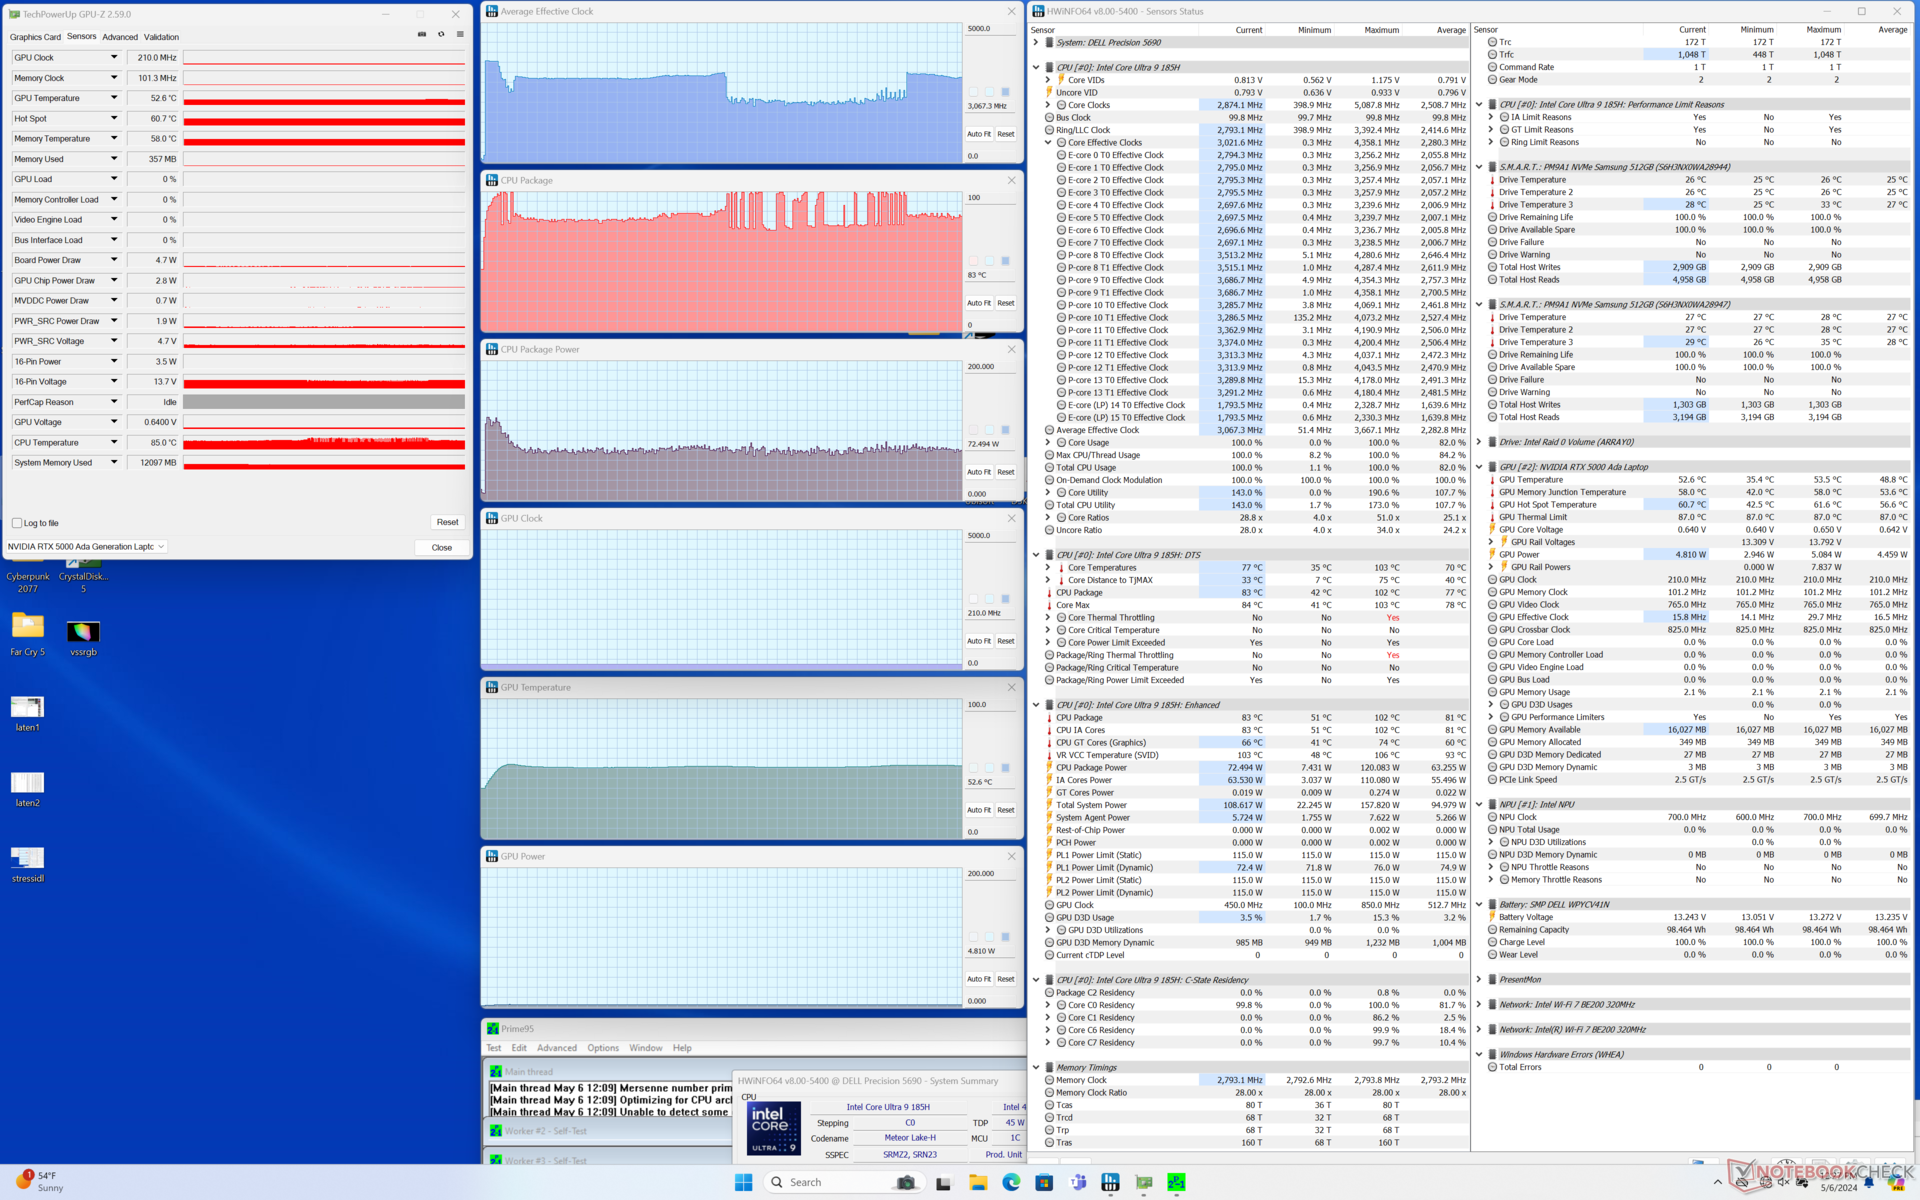
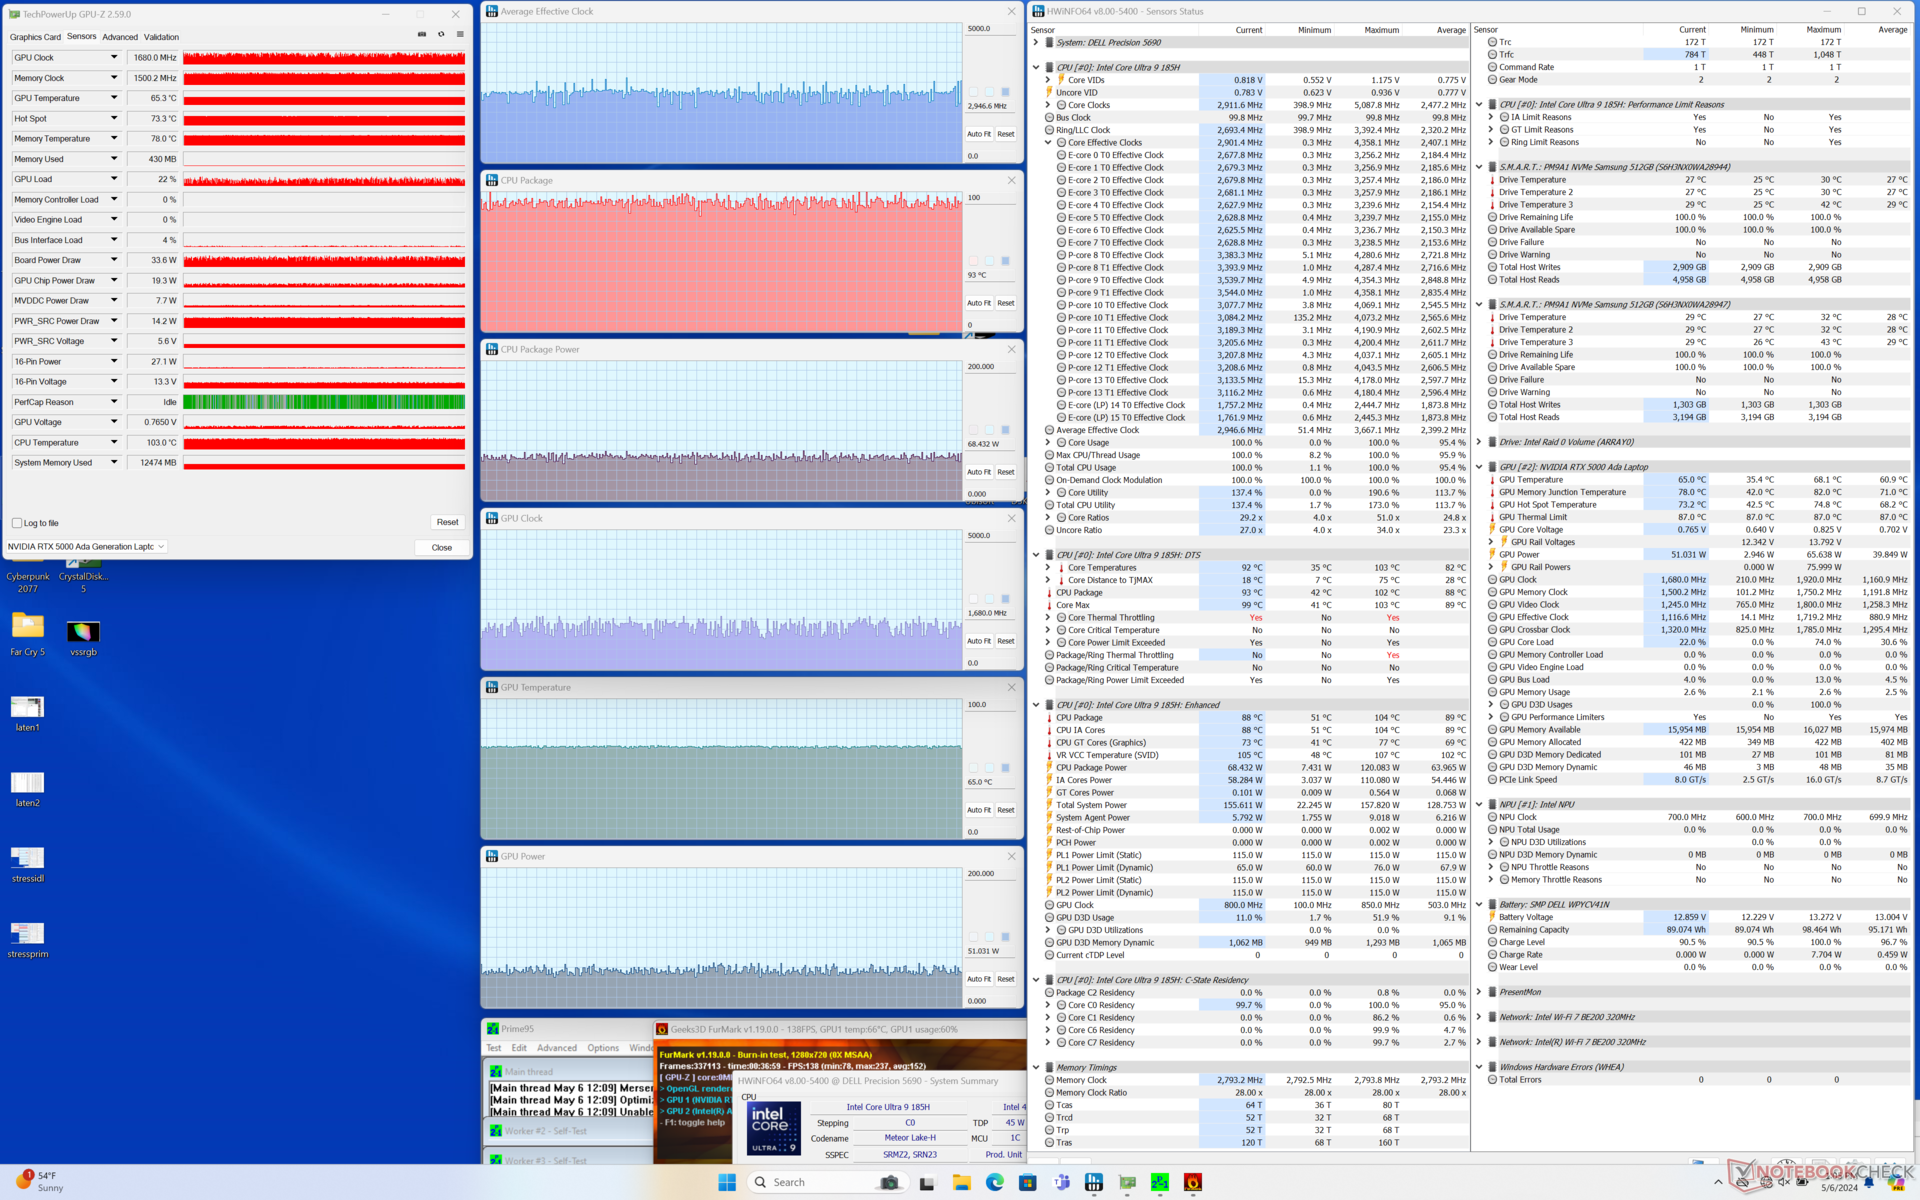
| CPU Clock (GHz) | GPU Clock (MHz) | Average CPU Temperature (°C) | Average GPU Temperature (°C) | |
| System Idle | -- | -- | 43 | 35 |
| Prime95 Stress | 3.0 | -- | 83 | 53 |
| Prime95 + FurMark Stress | ~3.0 | ~1680 | 93 | 65 |
| Witcher 3 Stress | ~0.6 | 1530 | 75 | 62 |
System Performance
PCMark 10 scores are essentially identical to what we recorded on the Precision 5680 to suggest no major performance differences between the two models when it comes to traditional tasks.
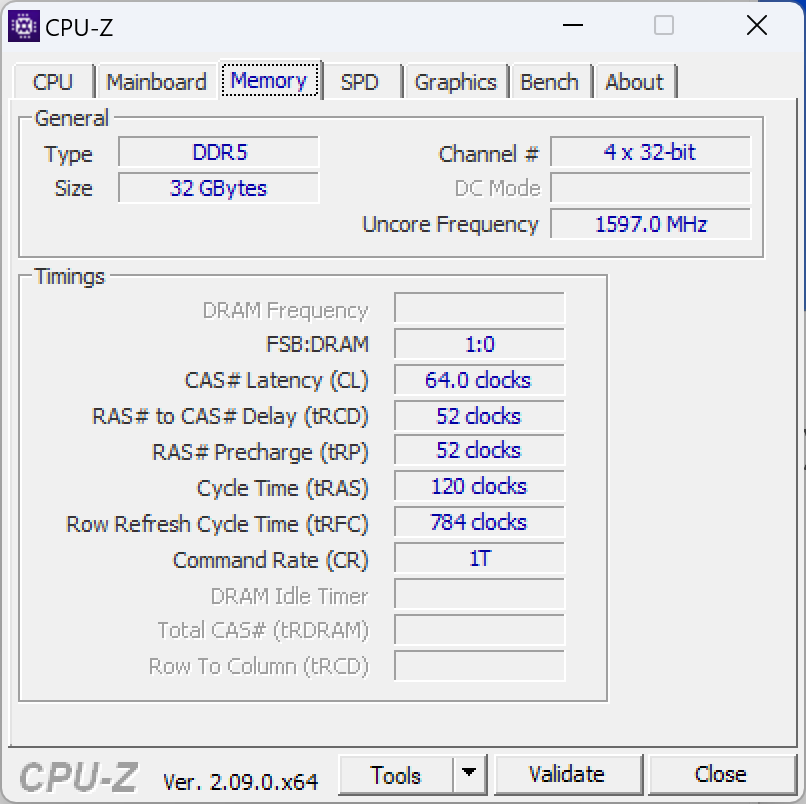
System RAM is slightly faster this year (7467 vs. 6000 MT/s) and this is reflected in the improved AIDA64 benchmark results.

CrossMark: Overall | Productivity | Creativity | Responsiveness
WebXPRT 3: Overall
WebXPRT 4: Overall
Mozilla Kraken 1.1: Total
| PCMark 10 / Score | |
| Dell Precision 5000 5680 | |
| HP ZBook Fury 16 G10 | |
| Dell Precision 5690 | |
| Average Intel Core Ultra 9 185H, NVIDIA RTX 5000 Ada Generation Laptop (n=1) | |
| Lenovo ThinkPad P1 G6-21FV000DGE | |
| Lenovo ThinkPad P16 G2 21FA000FGE | |
| MSI CreatorPro Z16P B12UKST | |
| PCMark 10 / Essentials | |
| Dell Precision 5000 5680 | |
| Lenovo ThinkPad P1 G6-21FV000DGE | |
| HP ZBook Fury 16 G10 | |
| Dell Precision 5690 | |
| Average Intel Core Ultra 9 185H, NVIDIA RTX 5000 Ada Generation Laptop (n=1) | |
| Lenovo ThinkPad P16 G2 21FA000FGE | |
| MSI CreatorPro Z16P B12UKST | |
| PCMark 10 / Productivity | |
| Dell Precision 5000 5680 | |
| Dell Precision 5690 | |
| Average Intel Core Ultra 9 185H, NVIDIA RTX 5000 Ada Generation Laptop (n=1) | |
| Lenovo ThinkPad P1 G6-21FV000DGE | |
| Lenovo ThinkPad P16 G2 21FA000FGE | |
| MSI CreatorPro Z16P B12UKST | |
| HP ZBook Fury 16 G10 | |
| PCMark 10 / Digital Content Creation | |
| HP ZBook Fury 16 G10 | |
| Dell Precision 5000 5680 | |
| Dell Precision 5690 | |
| Average Intel Core Ultra 9 185H, NVIDIA RTX 5000 Ada Generation Laptop (n=1) | |
| Lenovo ThinkPad P1 G6-21FV000DGE | |
| MSI CreatorPro Z16P B12UKST | |
| Lenovo ThinkPad P16 G2 21FA000FGE | |
| CrossMark / Overall | |
| MSI CreatorPro Z16P B12UKST | |
| Dell Precision 5000 5680 | |
| HP ZBook Fury 16 G10 | |
| Lenovo ThinkPad P1 G6-21FV000DGE | |
| Lenovo ThinkPad P16 G2 21FA000FGE | |
| Dell Precision 5690 | |
| Average Intel Core Ultra 9 185H, NVIDIA RTX 5000 Ada Generation Laptop (n=1) | |
| CrossMark / Productivity | |
| HP ZBook Fury 16 G10 | |
| MSI CreatorPro Z16P B12UKST | |
| Dell Precision 5000 5680 | |
| Lenovo ThinkPad P1 G6-21FV000DGE | |
| Dell Precision 5690 | |
| Average Intel Core Ultra 9 185H, NVIDIA RTX 5000 Ada Generation Laptop (n=1) | |
| Lenovo ThinkPad P16 G2 21FA000FGE | |
| CrossMark / Creativity | |
| Dell Precision 5000 5680 | |
| Lenovo ThinkPad P16 G2 21FA000FGE | |
| HP ZBook Fury 16 G10 | |
| MSI CreatorPro Z16P B12UKST | |
| Lenovo ThinkPad P1 G6-21FV000DGE | |
| Dell Precision 5690 | |
| Average Intel Core Ultra 9 185H, NVIDIA RTX 5000 Ada Generation Laptop (n=1) | |
| CrossMark / Responsiveness | |
| MSI CreatorPro Z16P B12UKST | |
| HP ZBook Fury 16 G10 | |
| Lenovo ThinkPad P1 G6-21FV000DGE | |
| Dell Precision 5000 5680 | |
| Dell Precision 5690 | |
| Average Intel Core Ultra 9 185H, NVIDIA RTX 5000 Ada Generation Laptop (n=1) | |
| Lenovo ThinkPad P16 G2 21FA000FGE | |
| WebXPRT 3 / Overall | |
| Dell Precision 5000 5680 | |
| HP ZBook Fury 16 G10 | |
| Lenovo ThinkPad P16 G2 21FA000FGE | |
| Lenovo ThinkPad P1 G6-21FV000DGE | |
| MSI CreatorPro Z16P B12UKST | |
| Dell Precision 5690 | |
| Average Intel Core Ultra 9 185H, NVIDIA RTX 5000 Ada Generation Laptop (n=1) | |
| WebXPRT 4 / Overall | |
| Lenovo ThinkPad P1 G6-21FV000DGE | |
| HP ZBook Fury 16 G10 | |
| Dell Precision 5000 5680 | |
| Dell Precision 5690 | |
| Average Intel Core Ultra 9 185H, NVIDIA RTX 5000 Ada Generation Laptop (n=1) | |
| MSI CreatorPro Z16P B12UKST | |
| Mozilla Kraken 1.1 / Total | |
| MSI CreatorPro Z16P B12UKST | |
| Dell Precision 5690 | |
| Average Intel Core Ultra 9 185H, NVIDIA RTX 5000 Ada Generation Laptop (n=1) | |
| Lenovo ThinkPad P16 G2 21FA000FGE | |
| Dell Precision 5000 5680 | |
| Lenovo ThinkPad P1 G6-21FV000DGE | |
| HP ZBook Fury 16 G10 | |
* ... smaller is better
| PCMark 10 Score | 8065 points | |
Help | ||
| AIDA64 / Memory Copy | |
| Dell Precision 5690 | |
| Average Intel Core Ultra 9 185H (69929 - 95718, n=20) | |
| Dell Precision 5000 5680 | |
| MSI CreatorPro Z16P B12UKST | |
| HP ZBook Fury 16 G10 | |
| Lenovo ThinkPad P16 G2 21FA000FGE | |
| Lenovo ThinkPad P1 G6-21FV000DGE | |
| AIDA64 / Memory Read | |
| Dell Precision 5690 | |
| Average Intel Core Ultra 9 185H (64619 - 87768, n=20) | |
| Dell Precision 5000 5680 | |
| MSI CreatorPro Z16P B12UKST | |
| HP ZBook Fury 16 G10 | |
| Lenovo ThinkPad P16 G2 21FA000FGE | |
| Lenovo ThinkPad P1 G6-21FV000DGE | |
| AIDA64 / Memory Write | |
| Dell Precision 5000 5680 | |
| Dell Precision 5690 | |
| Average Intel Core Ultra 9 185H (51114 - 93871, n=20) | |
| MSI CreatorPro Z16P B12UKST | |
| HP ZBook Fury 16 G10 | |
| Lenovo ThinkPad P16 G2 21FA000FGE | |
| Lenovo ThinkPad P1 G6-21FV000DGE | |
| AIDA64 / Memory Latency | |
| Average Intel Core Ultra 9 185H (121.4 - 259, n=20) | |
| Dell Precision 5690 | |
| HP ZBook Fury 16 G10 | |
| Lenovo ThinkPad P16 G2 21FA000FGE | |
| MSI CreatorPro Z16P B12UKST | |
| Dell Precision 5000 5680 | |
| Lenovo ThinkPad P1 G6-21FV000DGE | |
* ... smaller is better
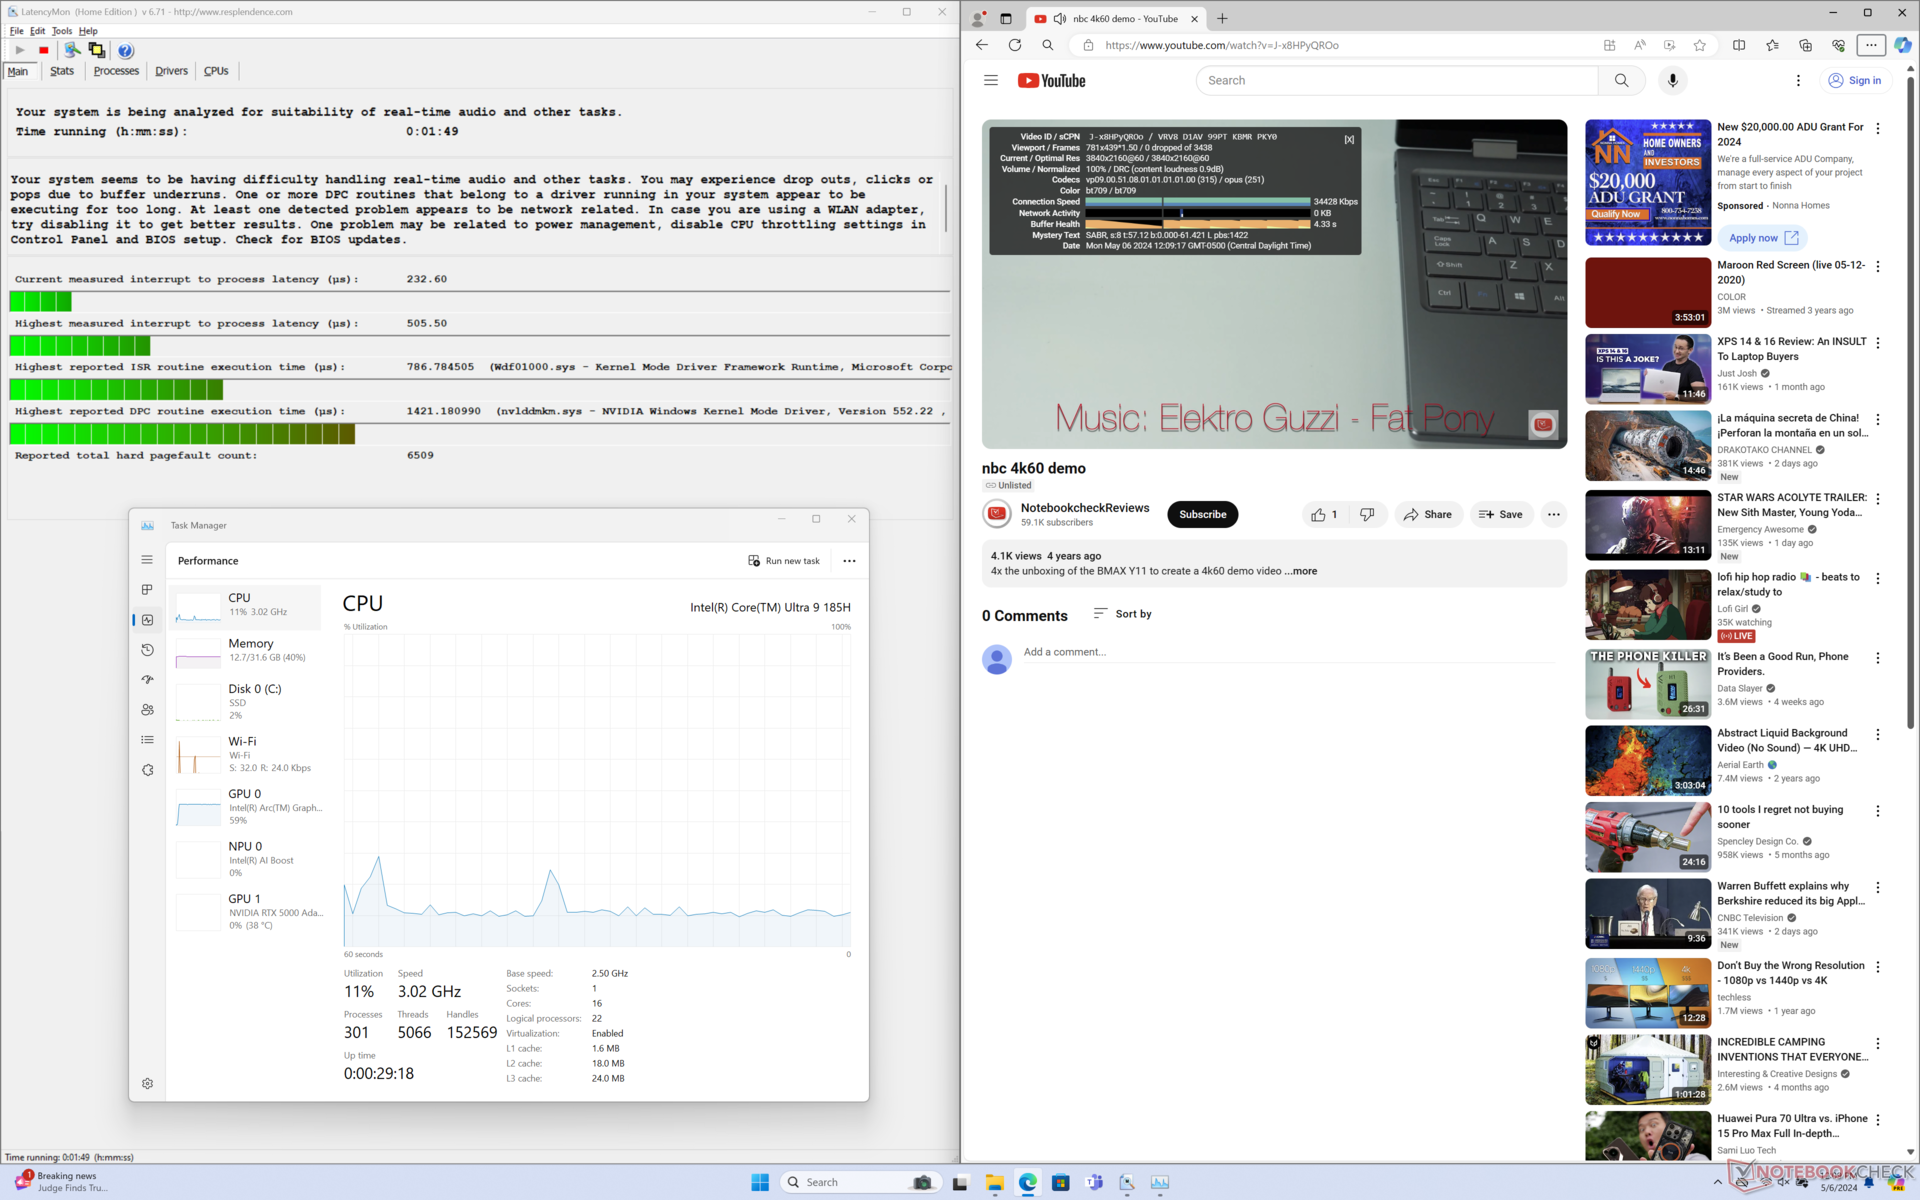
DPC Latency
LatencyMon reveals only minor DPC issues when opening multiple browser tabs of our homepage. 4K video playback at 60 FPS is otherwise perfect with no dropped frames recorded.

| DPC Latencies / LatencyMon - interrupt to process latency (max), Web, Youtube, Prime95 | |
| HP ZBook Fury 16 G10 | |
| Lenovo ThinkPad P1 G6-21FV000DGE | |
| Dell Precision 5000 5680 | |
| Lenovo ThinkPad P16 G2 21FA000FGE | |
| MSI CreatorPro Z16P B12UKST | |
| Dell Precision 5690 | |
* ... smaller is better
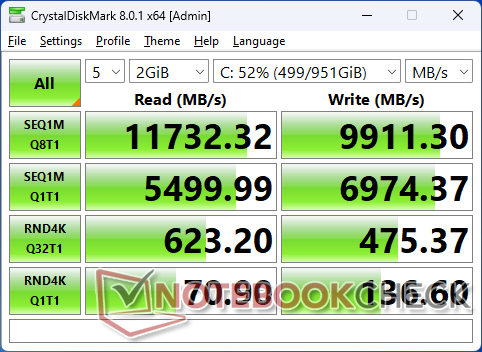
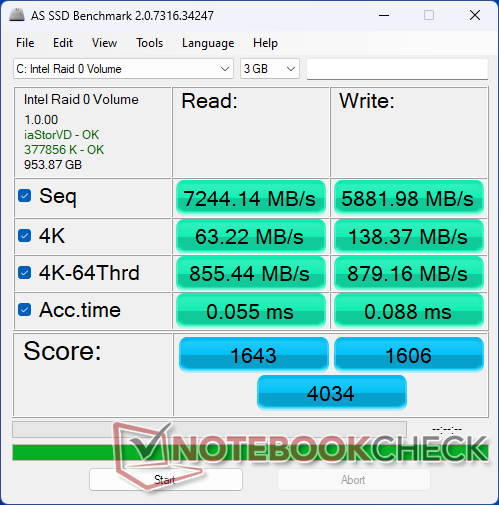
Storage Devices
Our test unit comes with two Samsung PM9A1 PCIe4 x4 NVMe SSDs in RAID 0 configuration for read and write rates exceeding 12000 MB/s and 9000 MB/s, respectively. Performance is steady with no throttled recorded when running DiskSpd in a loop.

| Drive Performance rating - Percent | |
| MSI CreatorPro Z16P B12UKST -8! | |
| Lenovo ThinkPad P1 G6-21FV000DGE | |
| Dell Precision 5690 | |
| HP ZBook Fury 16 G10 | |
| Dell Precision 5000 5680 | |
| Lenovo ThinkPad P16 G2 21FA000FGE | |
* ... smaller is better
Disk Throttling: DiskSpd Read Loop, Queue Depth 8
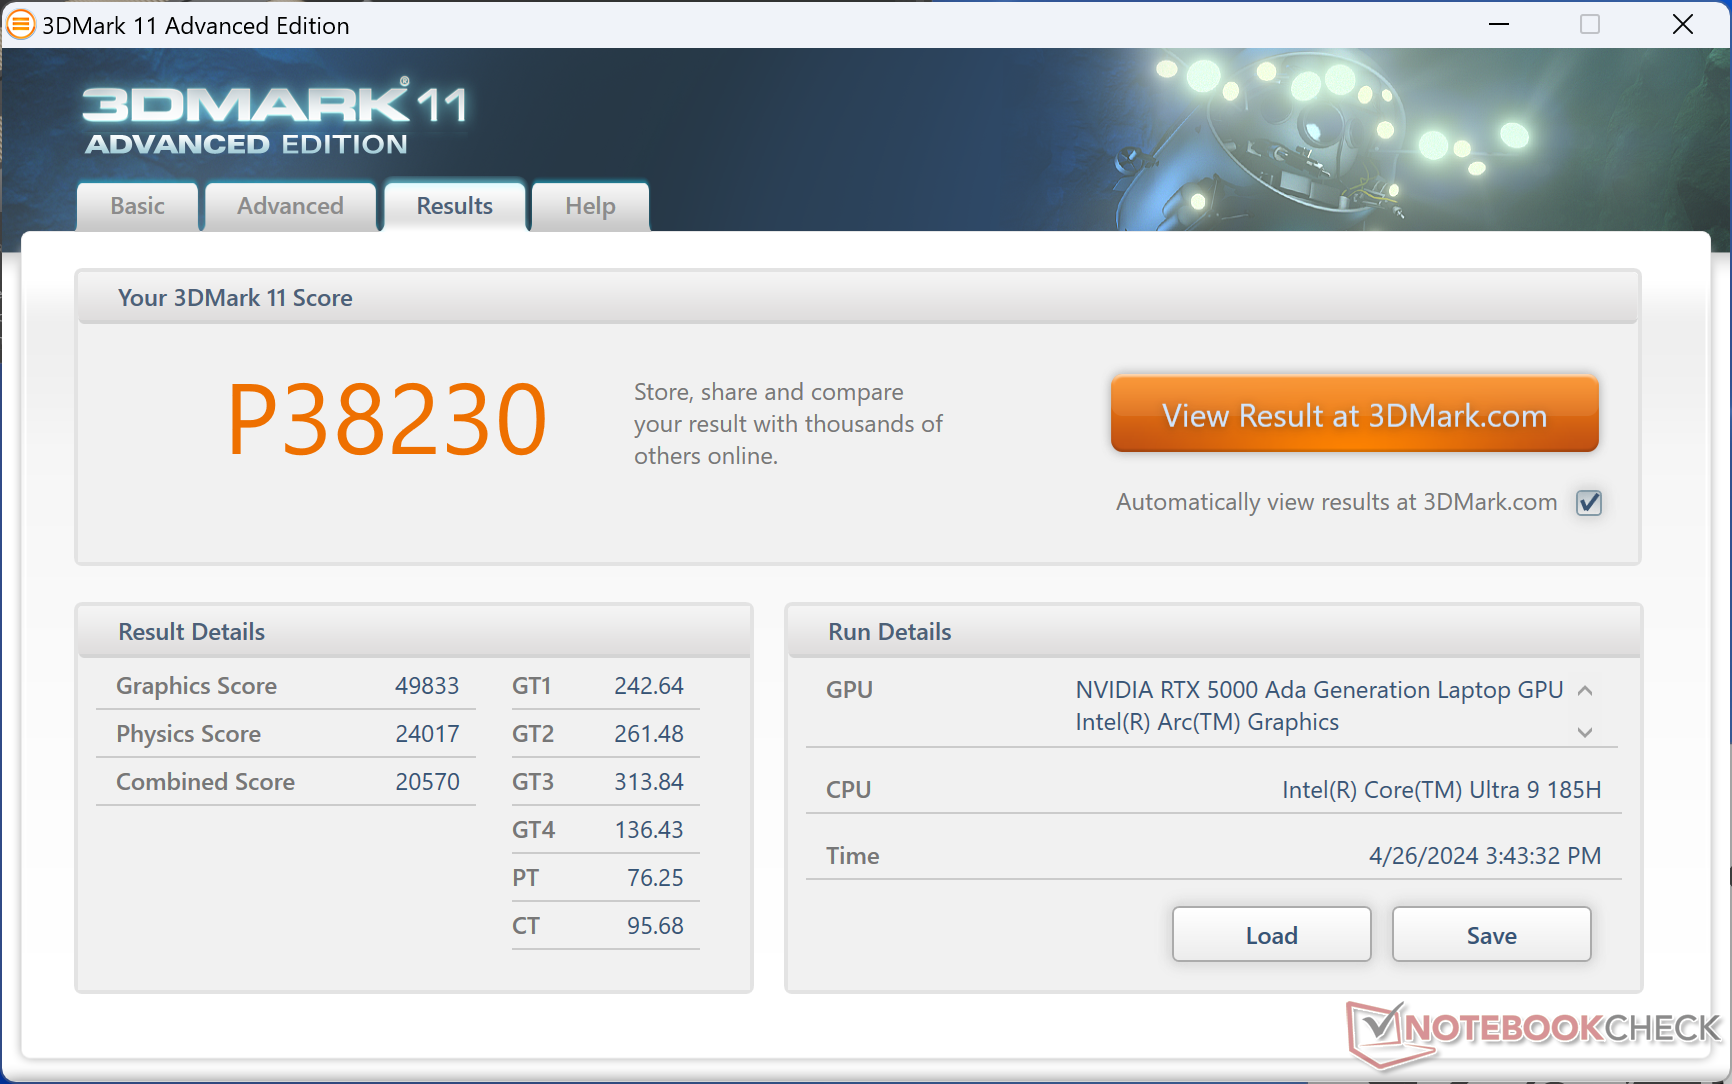
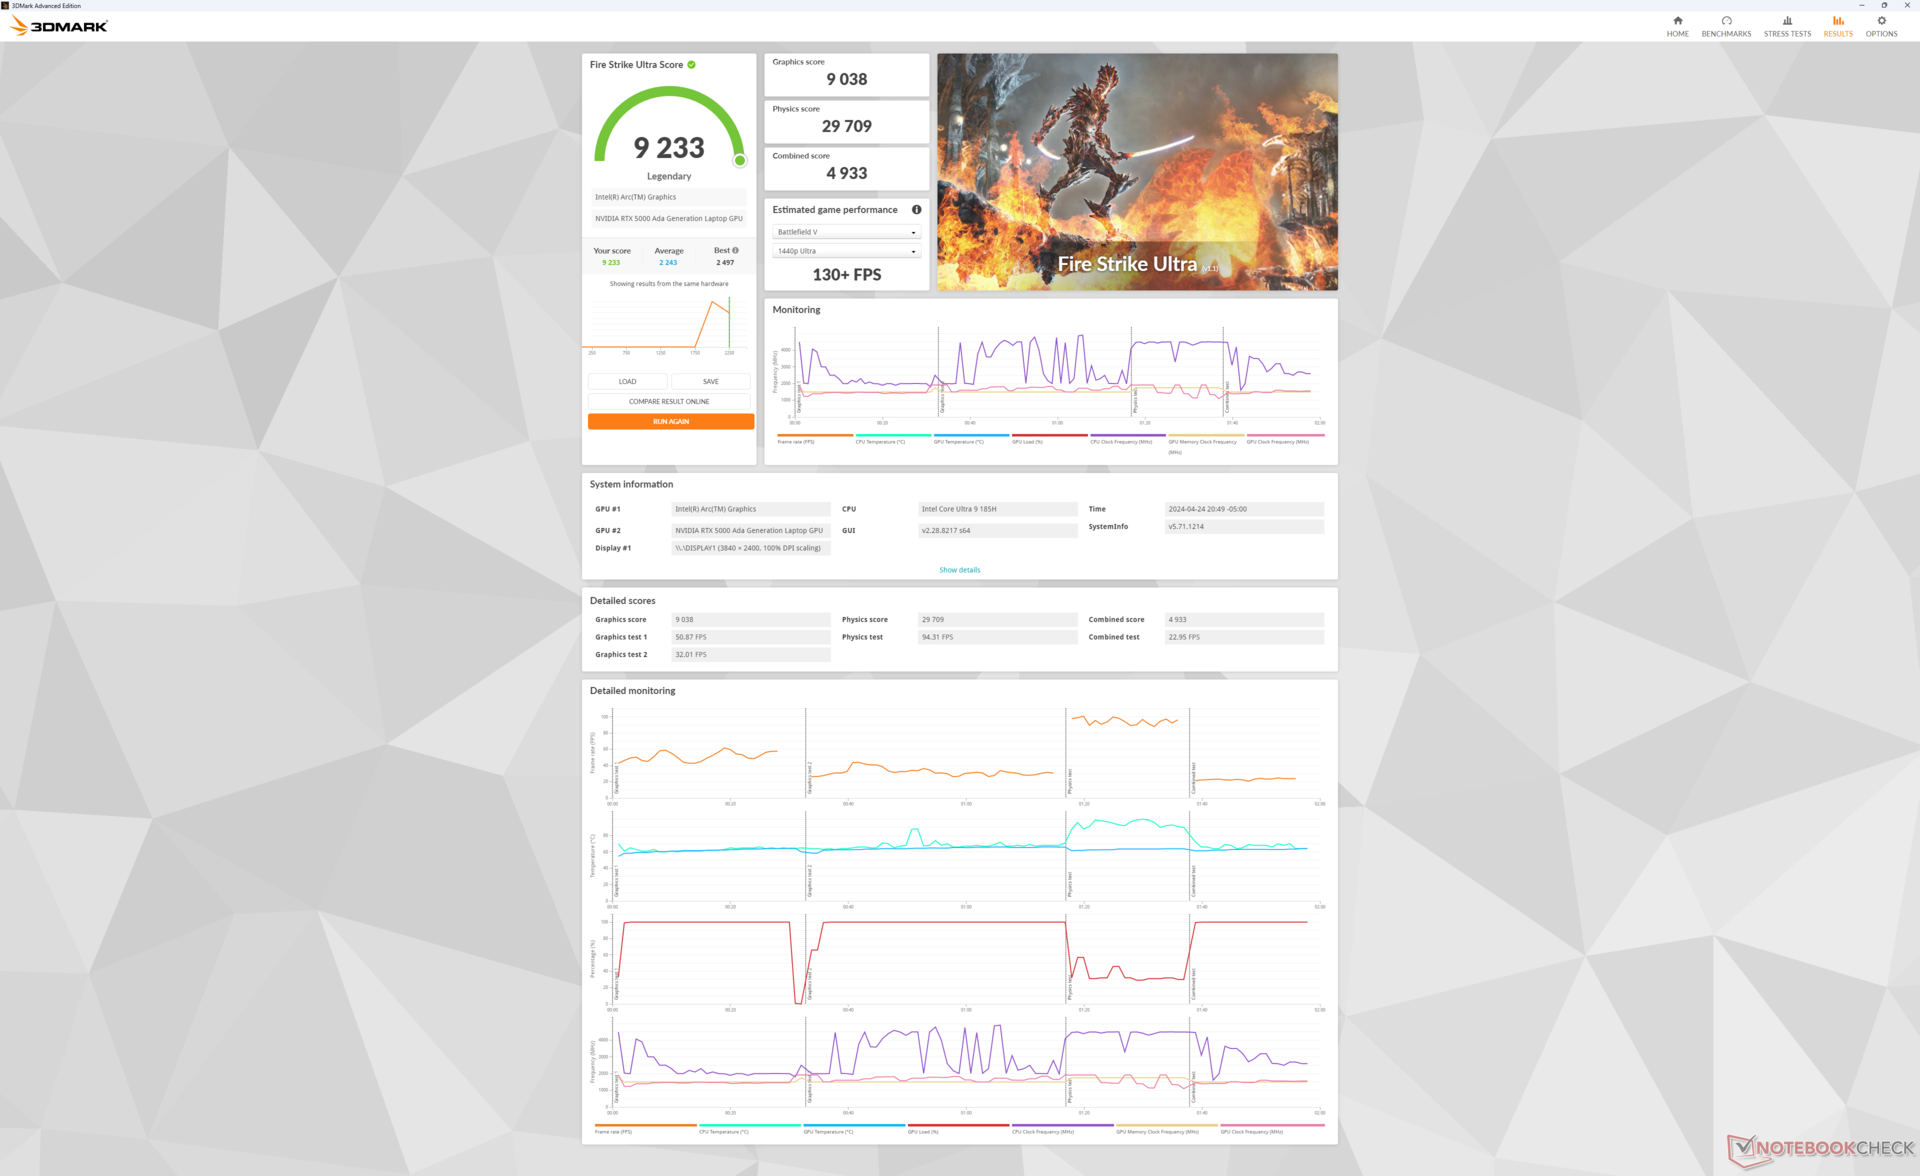
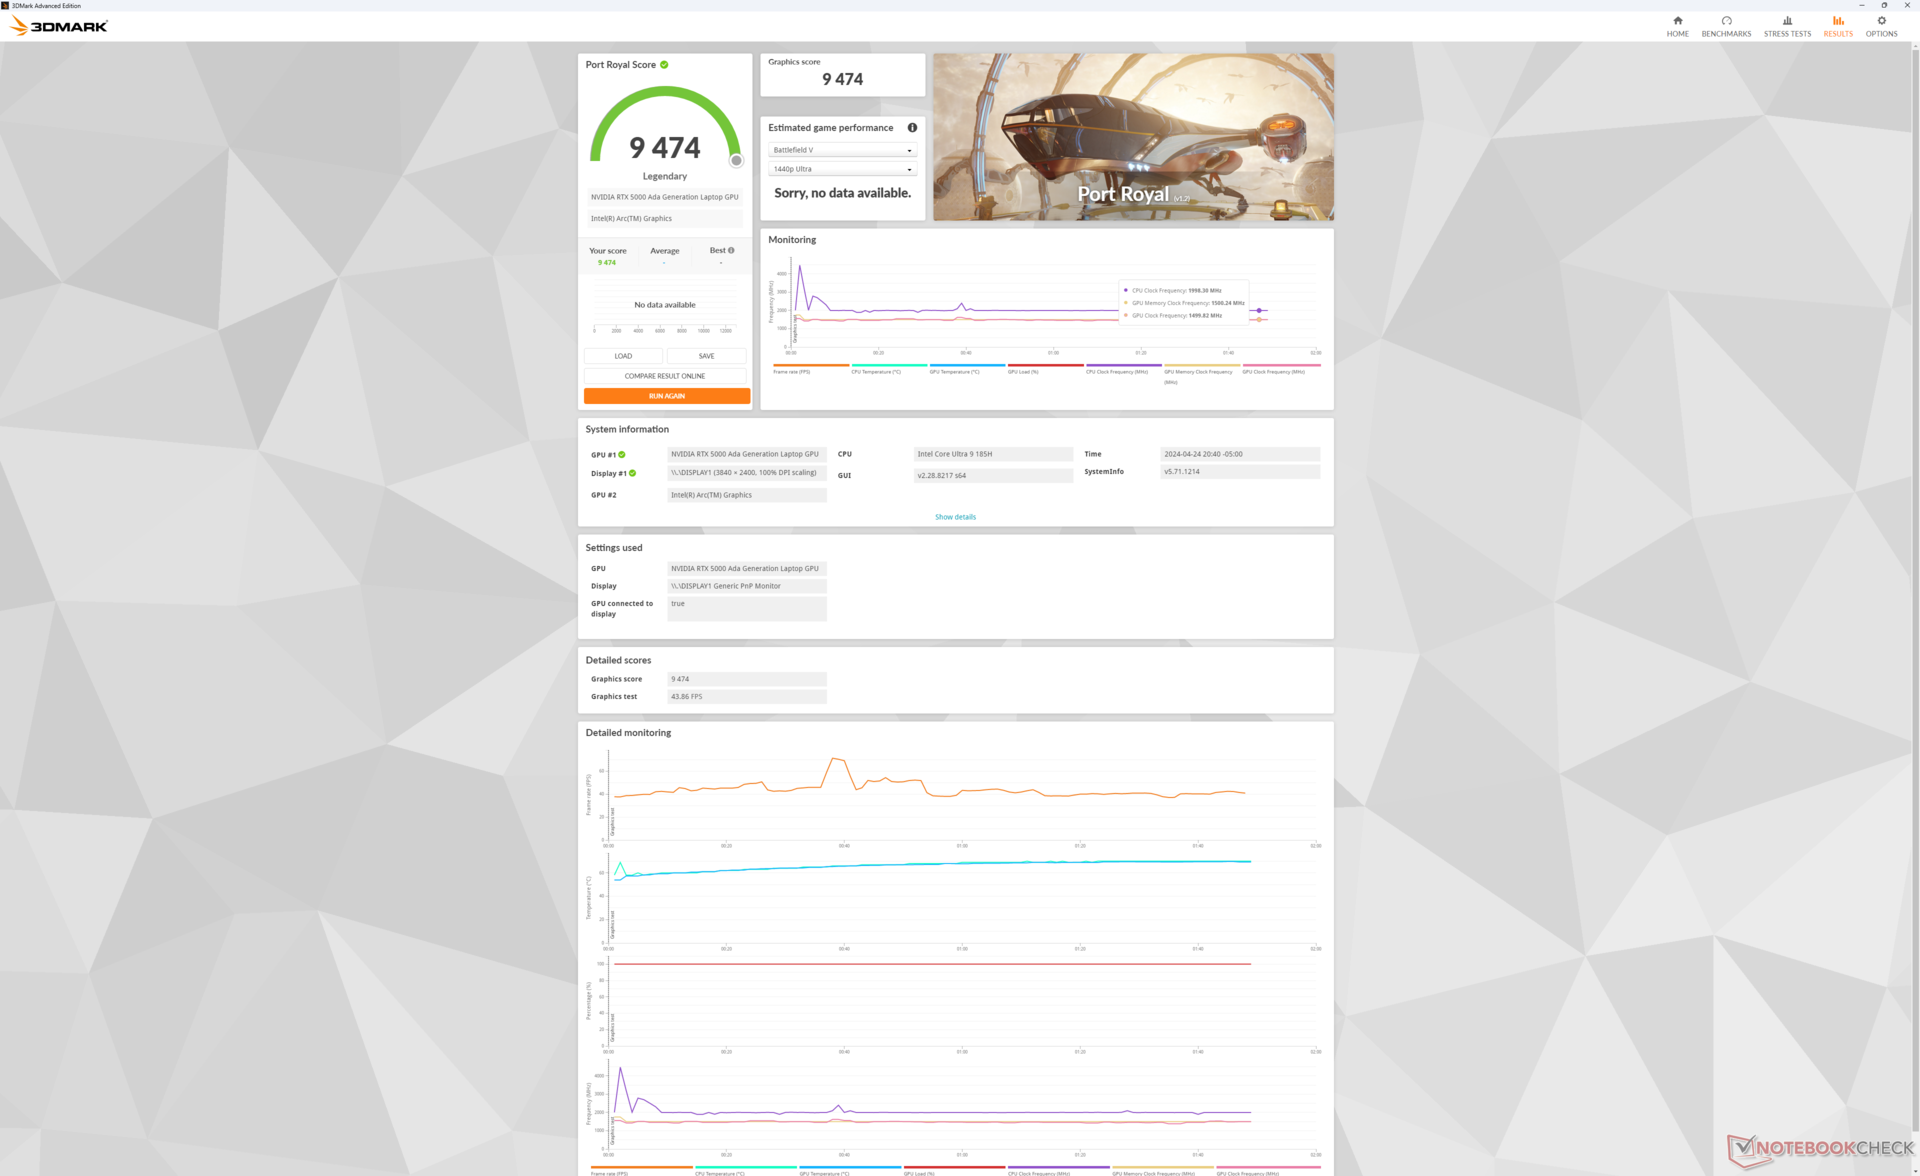
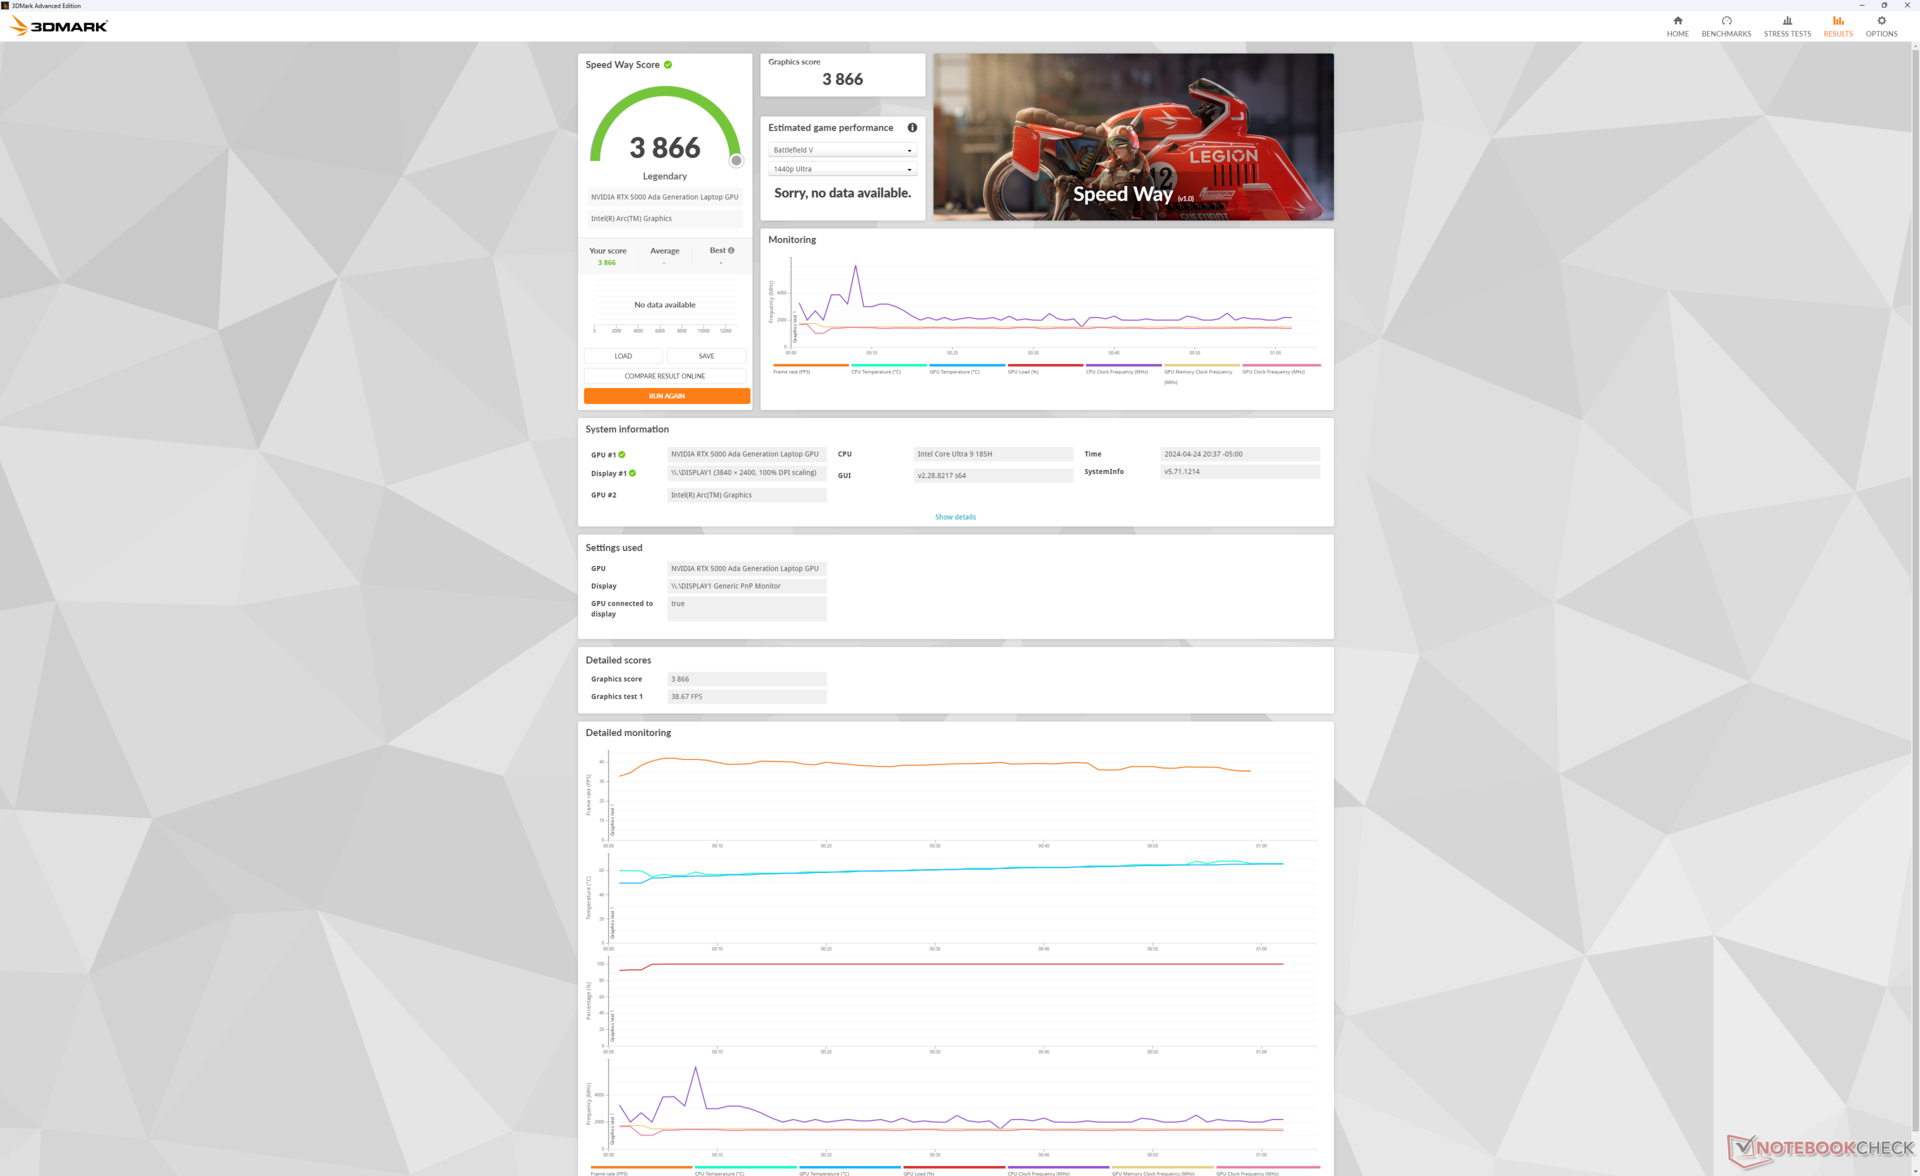
GPU Performance — Up To RTX 5000 Ada
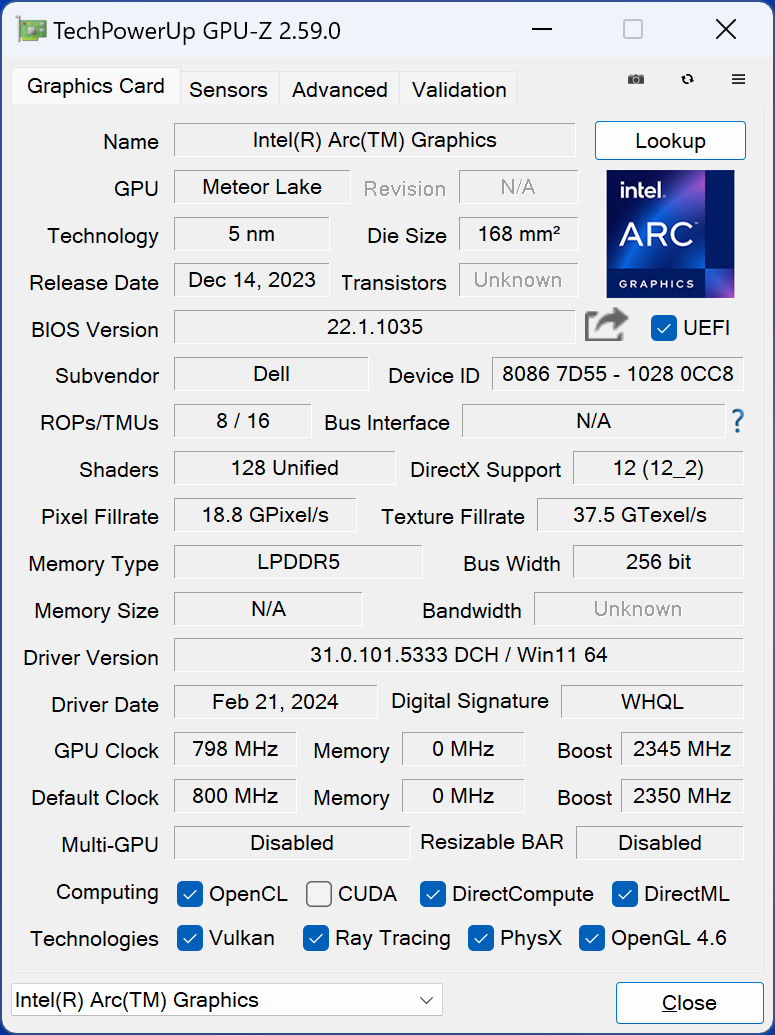
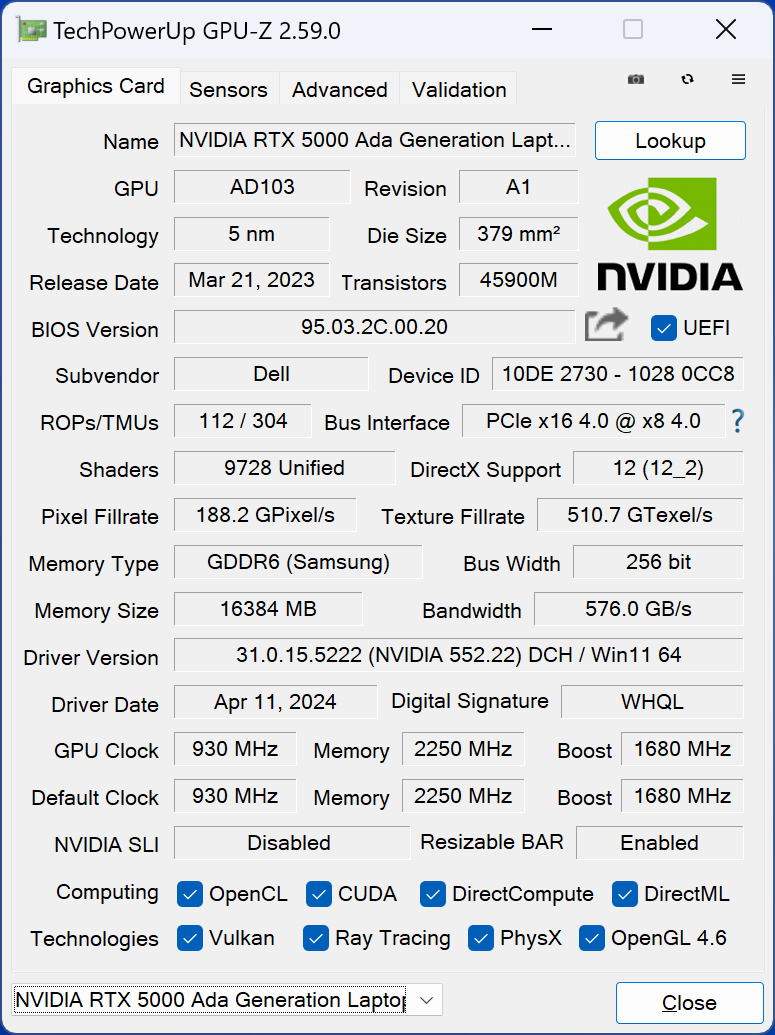
Nvidia GPU options have not changed from yesteryear and so the RTX 5000 Ada continues to be the top-of-the-line option. This GPU is derived from the GeForce RTX 4090 and so it notably includes 16 GB of VRAM instead of 12 GB if configured with the slower RTX 4000 Ada or 3500 Ada. Users have a wide range of RTX Ada GPUs to configure from including the RTX 1000 Ada up to our RTX 5000 Ada configuration.
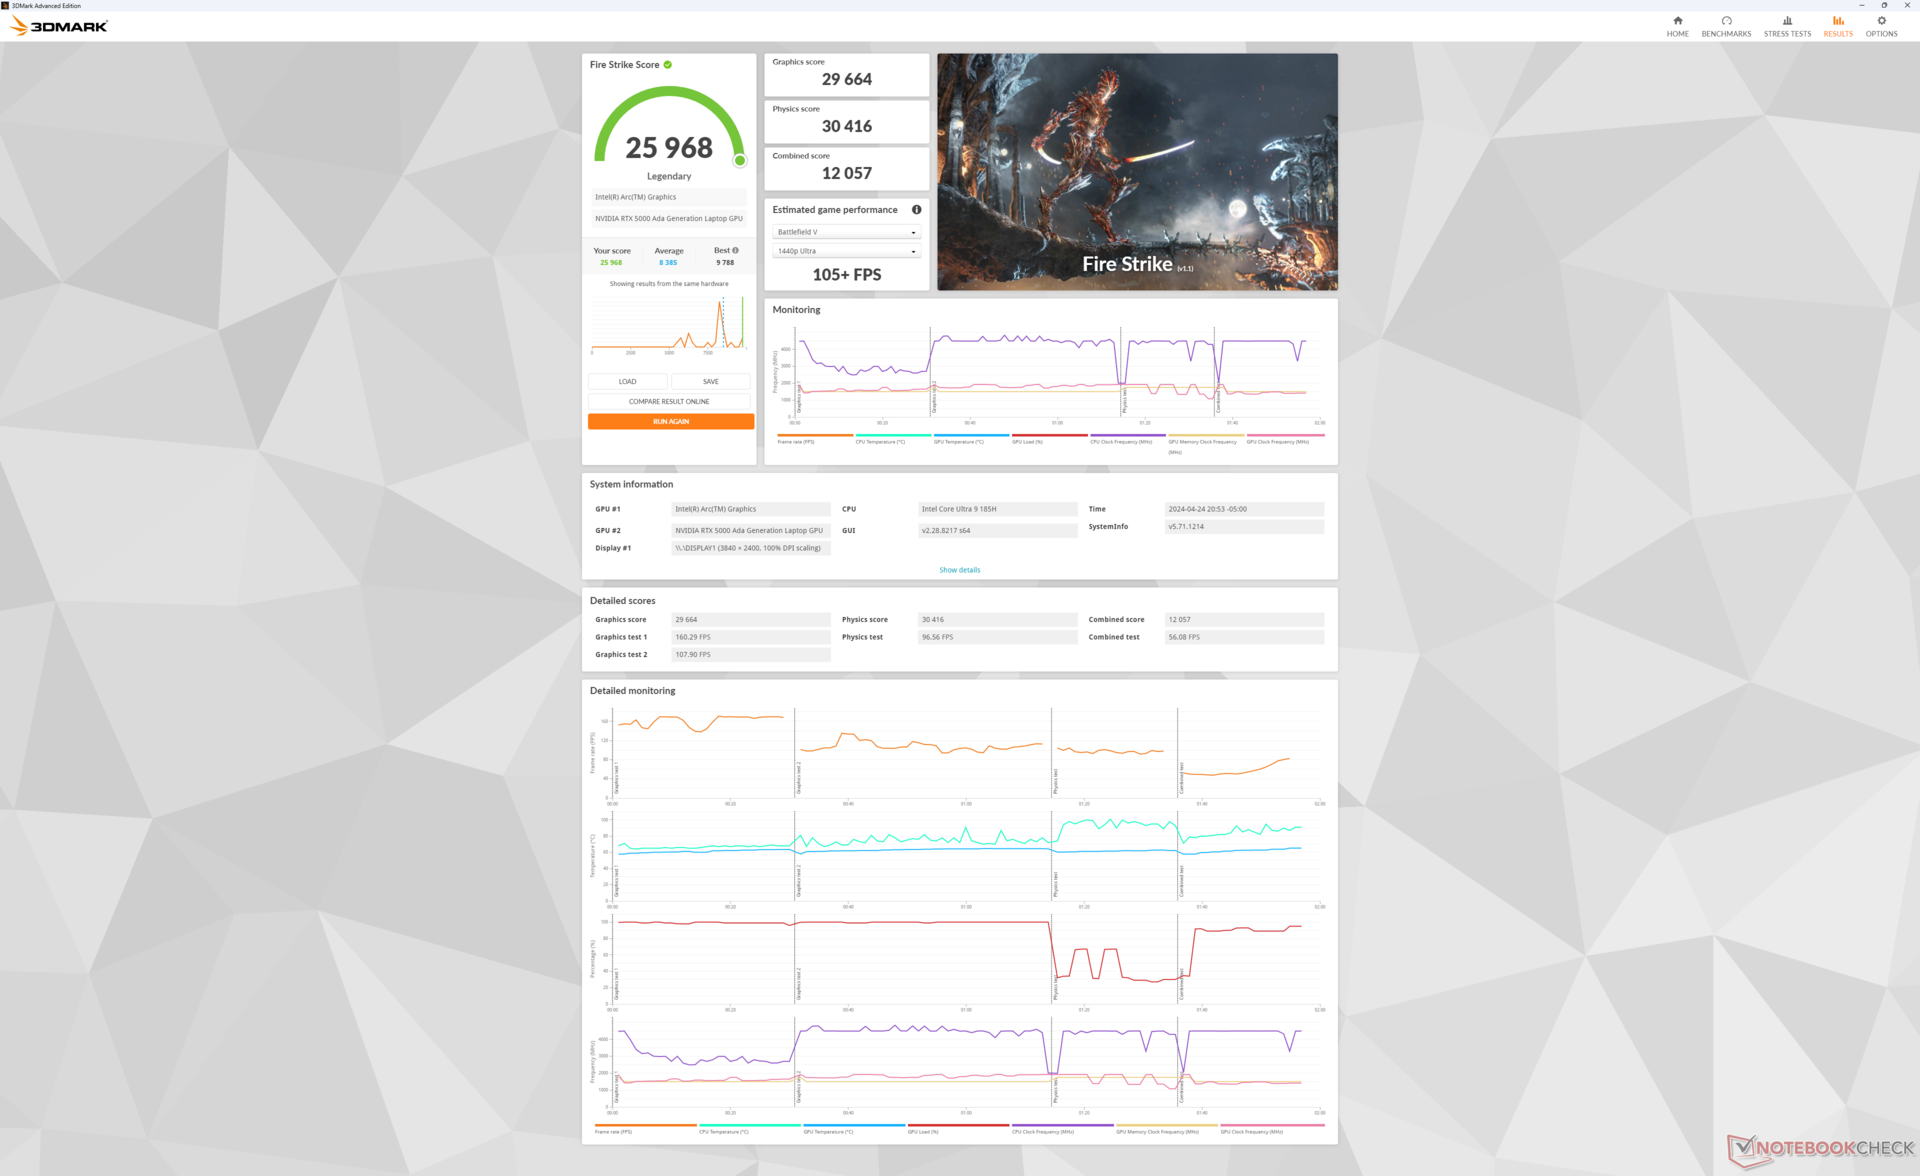
| Power Profile | Graphics Score | Physics Score | Combined Score |
| Performance Mode | 29664 | 30416 | 12057 |
| Balanced Mode | 29771 (-0%) | 27199 (-11%) | 11770 (-2%) |
| Battery Power | 26674 (-10%) | 20268 (-33%) | 9539 (-21%) |
Running on Balanced mode impacts processor performance while graphics performance would remain the same as shown by our Fire Strike results above.
| 3DMark Performance rating - Percent | |
| HP ZBook Fury 16 G10 -2! | |
| Average NVIDIA RTX 5000 Ada Generation Laptop | |
| Dell Precision 5690 -2! | |
| Dell Precision 5000 5680 -2! | |
| Asus ProArt StudioBook 16 W7600H5A-2BL2 -20! | |
| HP ZBook Fury 16 G9 -2! | |
| Dell XPS 16 9640 -35! | |
| Lenovo ThinkPad P1 G6-21FV000DGE -16! | |
| Lenovo ThinkPad P16 G2 21FA000FGE -18! | |
| MSI CreatorPro Z16P B12UKST -17! | |
| Lenovo ThinkPad P16v G1 AMD -16! | |
| Lenovo ThinkPad P16 G1 21D6001DMB -18! | |
| Lenovo ThinkPad P1 G4-20Y30017GE -18! | |
| Lenovo ThinkPad P16s G2 21K9000CGE -18! | |
| 3DMark 11 Performance | 38230 points | |
| 3DMark Fire Strike Score | 25968 points | |
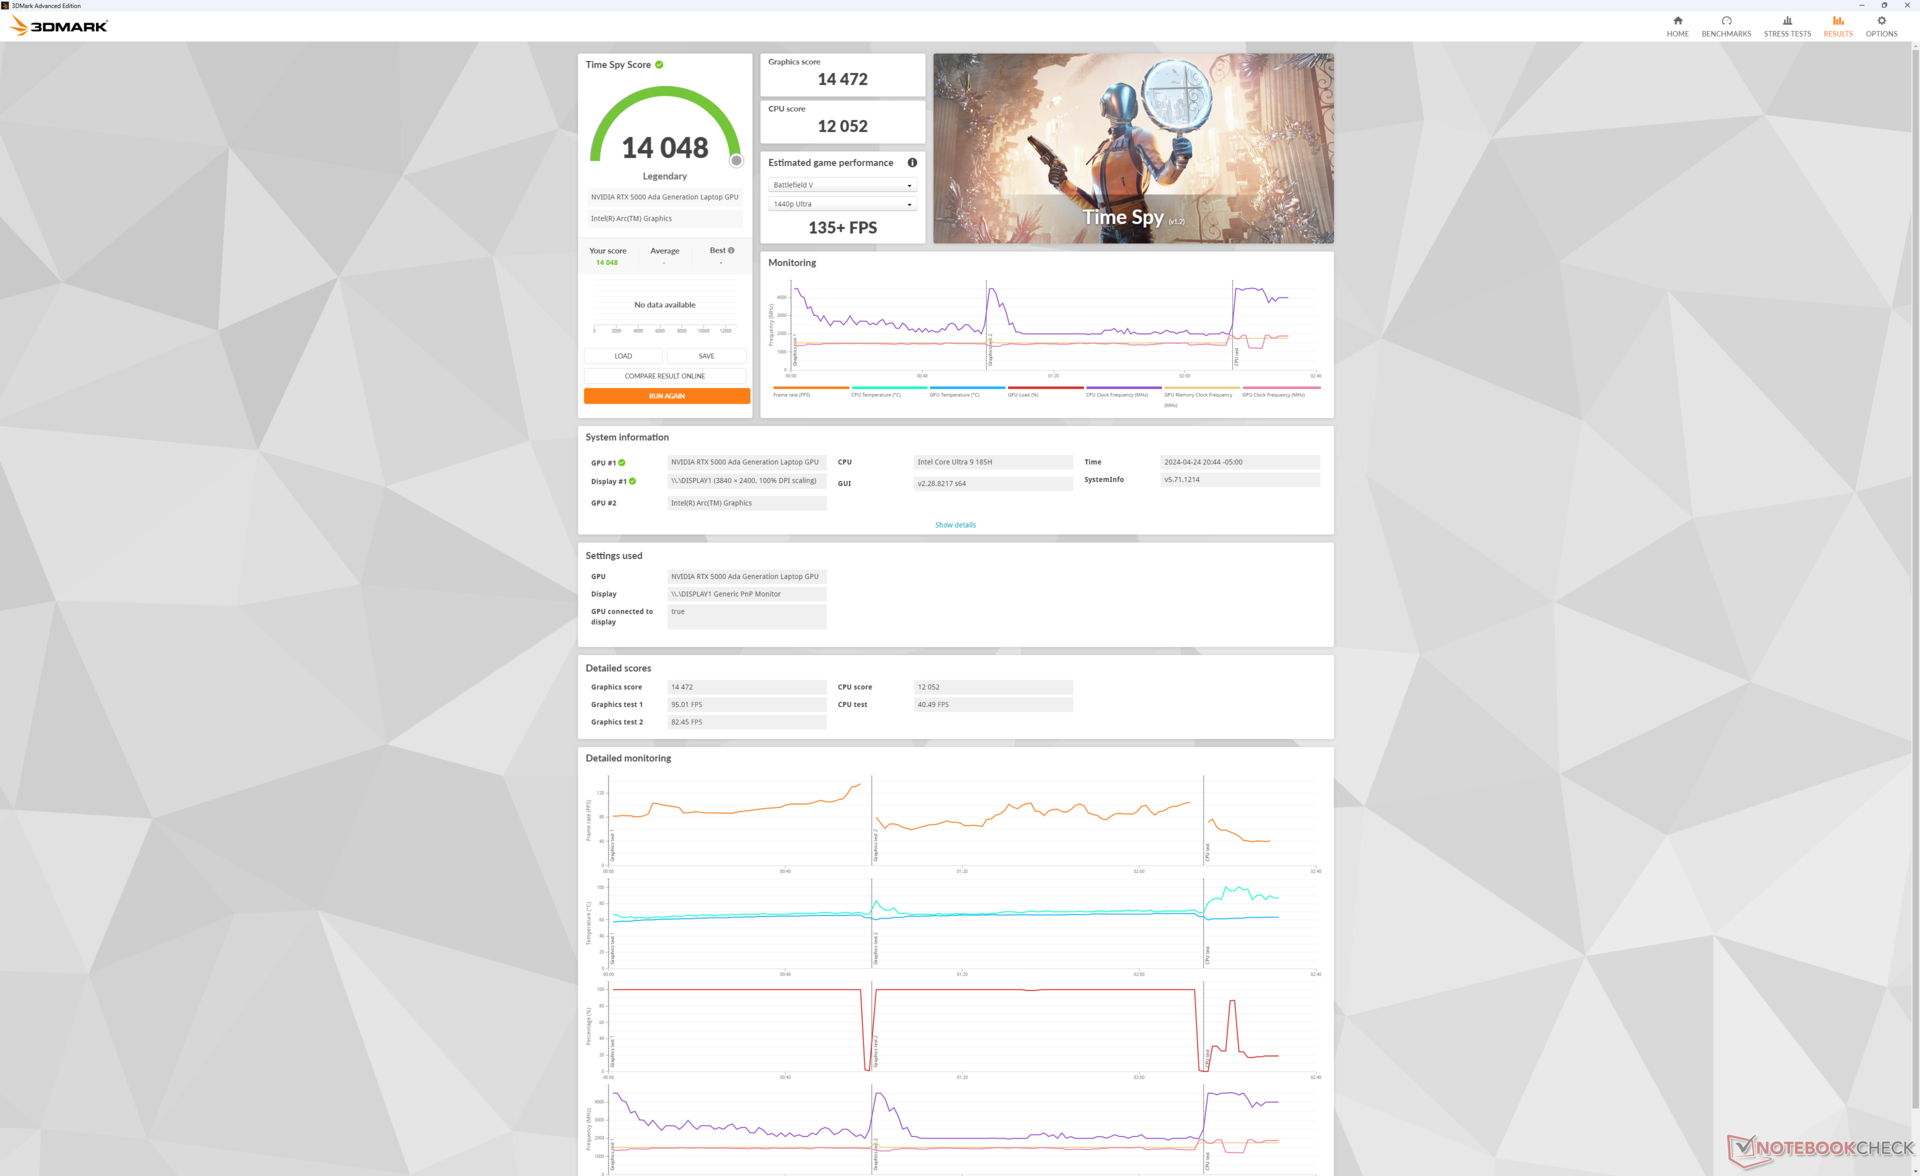
| 3DMark Time Spy Score | 14048 points | |
Help | ||
* ... smaller is better
| Performance rating - Percent | |
| HP ZBook Fury 16 G10 | |
| Dell Precision 5000 5680 -1! | |
| Dell Precision 5690 | |
| Lenovo ThinkPad P16 G2 21FA000FGE | |
| Lenovo ThinkPad P1 G6-21FV000DGE | |
| MSI CreatorPro Z16P B12UKST | |
| The Witcher 3 - 1920x1080 Ultra Graphics & Postprocessing (HBAO+) | |
| HP ZBook Fury 16 G10 | |
| Dell Precision 5690 | |
| Dell Precision 5000 5680 | |
| Lenovo ThinkPad P16 G2 21FA000FGE | |
| Lenovo ThinkPad P1 G6-21FV000DGE | |
| MSI CreatorPro Z16P B12UKST | |
| Final Fantasy XV Benchmark - 1920x1080 High Quality | |
| HP ZBook Fury 16 G10 | |
| Dell Precision 5690 | |
| Dell Precision 5000 5680 | |
| Lenovo ThinkPad P16 G2 21FA000FGE | |
| Lenovo ThinkPad P1 G6-21FV000DGE | |
| MSI CreatorPro Z16P B12UKST | |
| Strange Brigade - 1920x1080 ultra AA:ultra AF:16 | |
| HP ZBook Fury 16 G10 | |
| Dell Precision 5690 | |
| Lenovo ThinkPad P16 G2 21FA000FGE | |
| Lenovo ThinkPad P1 G6-21FV000DGE | |
| MSI CreatorPro Z16P B12UKST | |
| Dota 2 Reborn - 1920x1080 ultra (3/3) best looking | |
| HP ZBook Fury 16 G10 | |
| Lenovo ThinkPad P16 G2 21FA000FGE | |
| MSI CreatorPro Z16P B12UKST | |
| Dell Precision 5000 5680 | |
| Dell Precision 5690 | |
| Lenovo ThinkPad P1 G6-21FV000DGE | |
| X-Plane 11.11 - 1920x1080 high (fps_test=3) | |
| HP ZBook Fury 16 G10 | |
| Lenovo ThinkPad P1 G6-21FV000DGE | |
| Lenovo ThinkPad P16 G2 21FA000FGE | |
| Dell Precision 5000 5680 | |
| MSI CreatorPro Z16P B12UKST | |
| Dell Precision 5690 | |
| Baldur's Gate 3 | |
| 1920x1080 High Preset AA:T | |
| Dell Precision 5690 | |
| Average NVIDIA RTX 5000 Ada Generation Laptop (n=1) | |
| Dell XPS 16 9640 | |
| 1920x1080 Ultra Preset AA:T | |
| Dell Precision 5690 | |
| Average NVIDIA RTX 5000 Ada Generation Laptop (n=1) | |
| Dell XPS 16 9640 | |
| 2560x1440 Ultra Preset AA:T | |
| Dell Precision 5690 | |
| Average NVIDIA RTX 5000 Ada Generation Laptop (n=1) | |
| Dell XPS 16 9640 | |
| 3840x2160 Ultra Preset AA:T | |
| Dell Precision 5690 | |
| Average NVIDIA RTX 5000 Ada Generation Laptop (n=1) | |
| 3840x2160 Ultra Preset + Quality DLSS | |
| Dell Precision 5690 | |
| Average NVIDIA RTX 5000 Ada Generation Laptop (n=1) | |
| Cyberpunk 2077 | |
| 1920x1080 High Preset (FSR off) | |
| Dell Precision 5690 | |
| Average NVIDIA RTX 5000 Ada Generation Laptop (n=1) | |
| Dell XPS 16 9640 | |
| Lenovo ThinkPad P16v G1 AMD | |
| 1920x1080 Ultra Preset (FSR off) | |
| Dell Precision 5690 | |
| Average NVIDIA RTX 5000 Ada Generation Laptop (n=1) | |
| Dell XPS 16 9640 | |
| Lenovo ThinkPad P16v G1 AMD | |
| 2560x1440 Ultra Preset (FSR off) | |
| Dell Precision 5690 | |
| Average NVIDIA RTX 5000 Ada Generation Laptop (n=1) | |
| Dell XPS 16 9640 | |
| 3840x2160 Ultra Preset (FSR off) | |
| Dell Precision 5690 | |
| Average NVIDIA RTX 5000 Ada Generation Laptop (n=1) | |
| 1920x1080 Ray Tracing Ultra Preset (DLSS off) | |
| Dell Precision 5690 | |
| Average NVIDIA RTX 5000 Ada Generation Laptop (n=1) | |
| Tiny Tina's Wonderlands | |
| 1920x1080 High Preset (DX12) | |
| HP ZBook Fury 16 G10 | |
| Average NVIDIA RTX 5000 Ada Generation Laptop (145.5 - 171.7, n=3) | |
| Dell Precision 5000 5680 | |
| Dell Precision 5690 | |
| HP ZBook Fury 16 G9 | |
| 1920x1080 Badass Preset (DX12) | |
| HP ZBook Fury 16 G10 | |
| Average NVIDIA RTX 5000 Ada Generation Laptop (124 - 139.4, n=3) | |
| Dell Precision 5000 5680 | |
| Dell Precision 5690 | |
| HP ZBook Fury 16 G9 | |
| 2560x1440 Badass Preset (DX12) | |
| HP ZBook Fury 16 G10 | |
| Average NVIDIA RTX 5000 Ada Generation Laptop (87.1 - 99.4, n=3) | |
| Dell Precision 5000 5680 | |
| Dell Precision 5690 | |
| HP ZBook Fury 16 G9 | |
| 3840x2160 Badass Preset (DX12) | |
| HP ZBook Fury 16 G10 | |
| Average NVIDIA RTX 5000 Ada Generation Laptop (48.4 - 53.9, n=3) | |
| Dell Precision 5000 5680 | |
| Dell Precision 5690 | |
| HP ZBook Fury 16 G9 | |
Witcher 3 FPS Chart
| low | med. | high | ultra | QHD | 4K DLSS | 4K | |
|---|---|---|---|---|---|---|---|
| The Witcher 3 (2015) | 411.3 | 351.2 | 258.7 | 137.6 | 103.9 | ||
| Dota 2 Reborn (2015) | 169.4 | 149.2 | 150.1 | 139.9 | 130 | ||
| Final Fantasy XV Benchmark (2018) | 196.6 | 165.4 | 132.5 | 103.8 | 63.2 | ||
| X-Plane 11.11 (2018) | 132.8 | 113.9 | 88.7 | 74.8 | |||
| Far Cry 5 (2018) | 144 | 134 | 127 | 119 | 113 | 72 | |
| Strange Brigade (2018) | 405 | 314 | 276 | 252 | 190.6 | 105.3 | |
| Tiny Tina's Wonderlands (2022) | 196.5 | 179.4 | 145.5 | 124 | 87.1 | 48.4 | |
| F1 22 (2022) | 228 | 224 | 217 | 91.1 | 60.1 | 29.6 | |
| Baldur's Gate 3 (2023) | 172.3 | 155.2 | 139.2 | 134.6 | 100.5 | 87.8 | 53.3 |
| Cyberpunk 2077 (2023) | 125 | 116.6 | 94.6 | 108.5 | 63.7 | 28.8 |
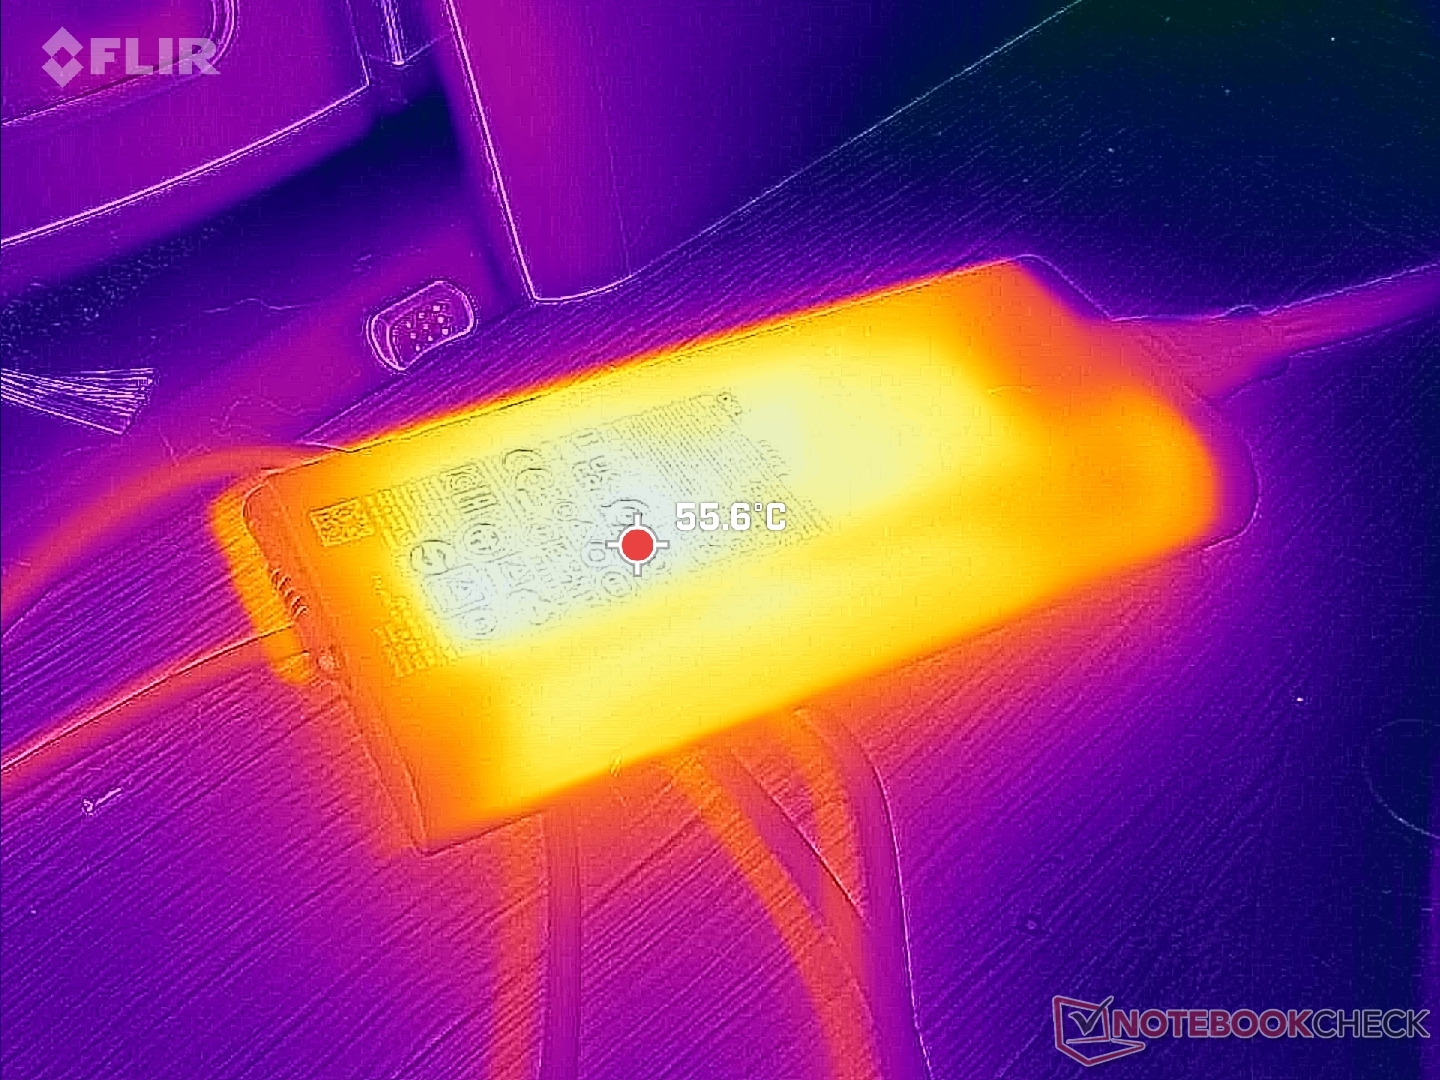
Emissions
System Noise — Loud And In Charge
Fan noise is sensitive to the selected power profile. If on Quiet mode, for example, fan noise tends to stay under 25 dB(A) against a silent background of 23.4 dB(A). Conversely, the fans tend to pulse more readily up to 30 dB(A) if set to Balanced or Performance modes even during mundane tasks like web browsing.
Fan noise ceiling is otherwise the same as what we recorded on the Precision 5680 at 51 dB(A) which is as loud as many gaming laptops. This maximum can be reached when running GPU demanding loads for more than several minutes.
Noise level
| Idle |
| 23.6 / 24.9 / 30.9 dB(A) |
| Load |
| 40.4 / 51.9 dB(A) |
 | ||
30 dB silent 40 dB(A) audible 50 dB(A) loud |
||
min: | ||
| Dell Precision 5690 RTX 5000 Ada Generation Laptop, Ultra 9 185H, 2x Samsung PM9A1 1TB (RAID 0) | Dell Precision 5000 5680 RTX 5000 Ada Generation Laptop, i9-13900H, 2x SK hynix PC801 HFS512GEJ9X101N RAID 0 | Lenovo ThinkPad P16 G2 21FA000FGE RTX 2000 Ada Generation Laptop, i7-13700HX, SK hynix PC801 HFS001TEJ9X162N | Lenovo ThinkPad P1 G6-21FV000DGE RTX 2000 Ada Generation Laptop, i9-13900H, SK Hynix PC711 1TB HFS001TDE9X084N | HP ZBook Fury 16 G10 RTX 5000 Ada Generation Laptop, i9-13950HX, SK hynix PC801 HFS001TEJ9X101N | MSI CreatorPro Z16P B12UKST RTX A3000 Laptop GPU, i7-12700H, Samsung PM9A1 MZVL21T0HCLR | |
|---|---|---|---|---|---|---|
| Noise | 6% | -1% | 3% | 6% | -0% | |
| off / environment * (dB) | 23.4 | 22.8 3% | 23.5 -0% | 24.5 -5% | 22.9 2% | 24.1 -3% |
| Idle Minimum * (dB) | 23.6 | 23 3% | 23.5 -0% | 24.5 -4% | 22.9 3% | 27.1 -15% |
| Idle Average * (dB) | 24.9 | 23 8% | 29.2 -17% | 24.5 2% | 22.9 8% | 27.1 -9% |
| Idle Maximum * (dB) | 30.9 | 23 26% | 29.5 5% | 24.5 21% | 28.5 8% | 27.1 12% |
| Load Average * (dB) | 40.4 | 37.2 8% | 32.7 19% | 48 -19% | 40.6 -0% | 42.9 -6% |
| Witcher 3 ultra * (dB) | 48.3 | 51 -6% | 50.6 -5% | 40.7 16% | 44.1 9% | 44 9% |
| Load Maximum * (dB) | 51.9 | 51 2% | 56.6 -9% | 48 8% | 45.8 12% | 47 9% |
* ... smaller is better
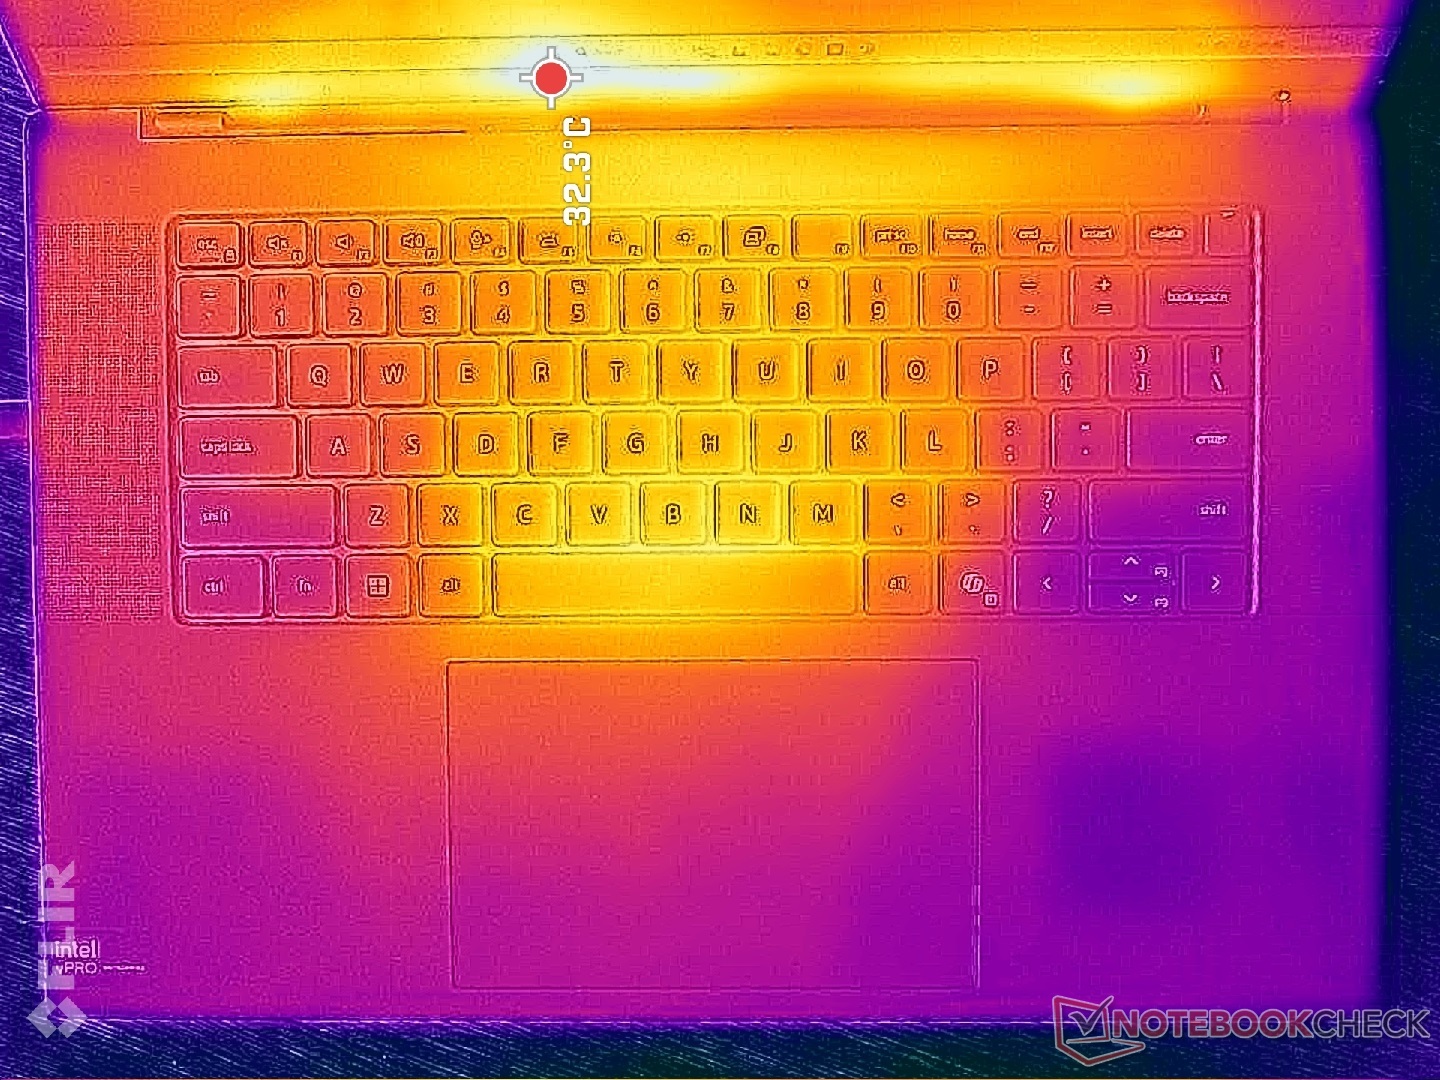
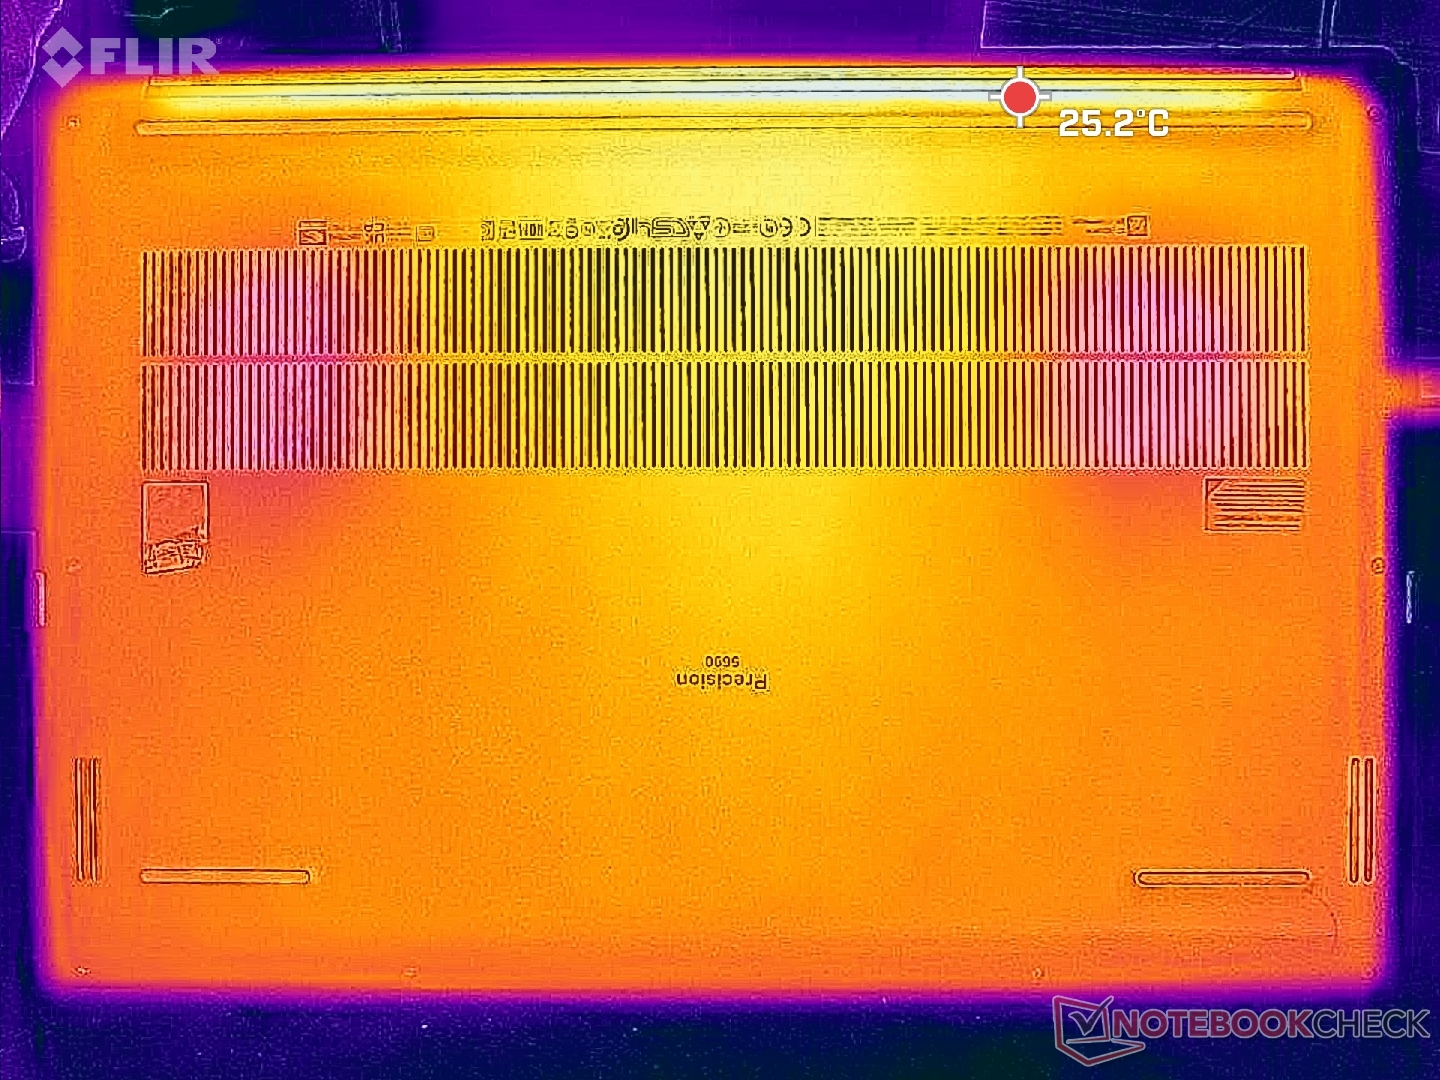
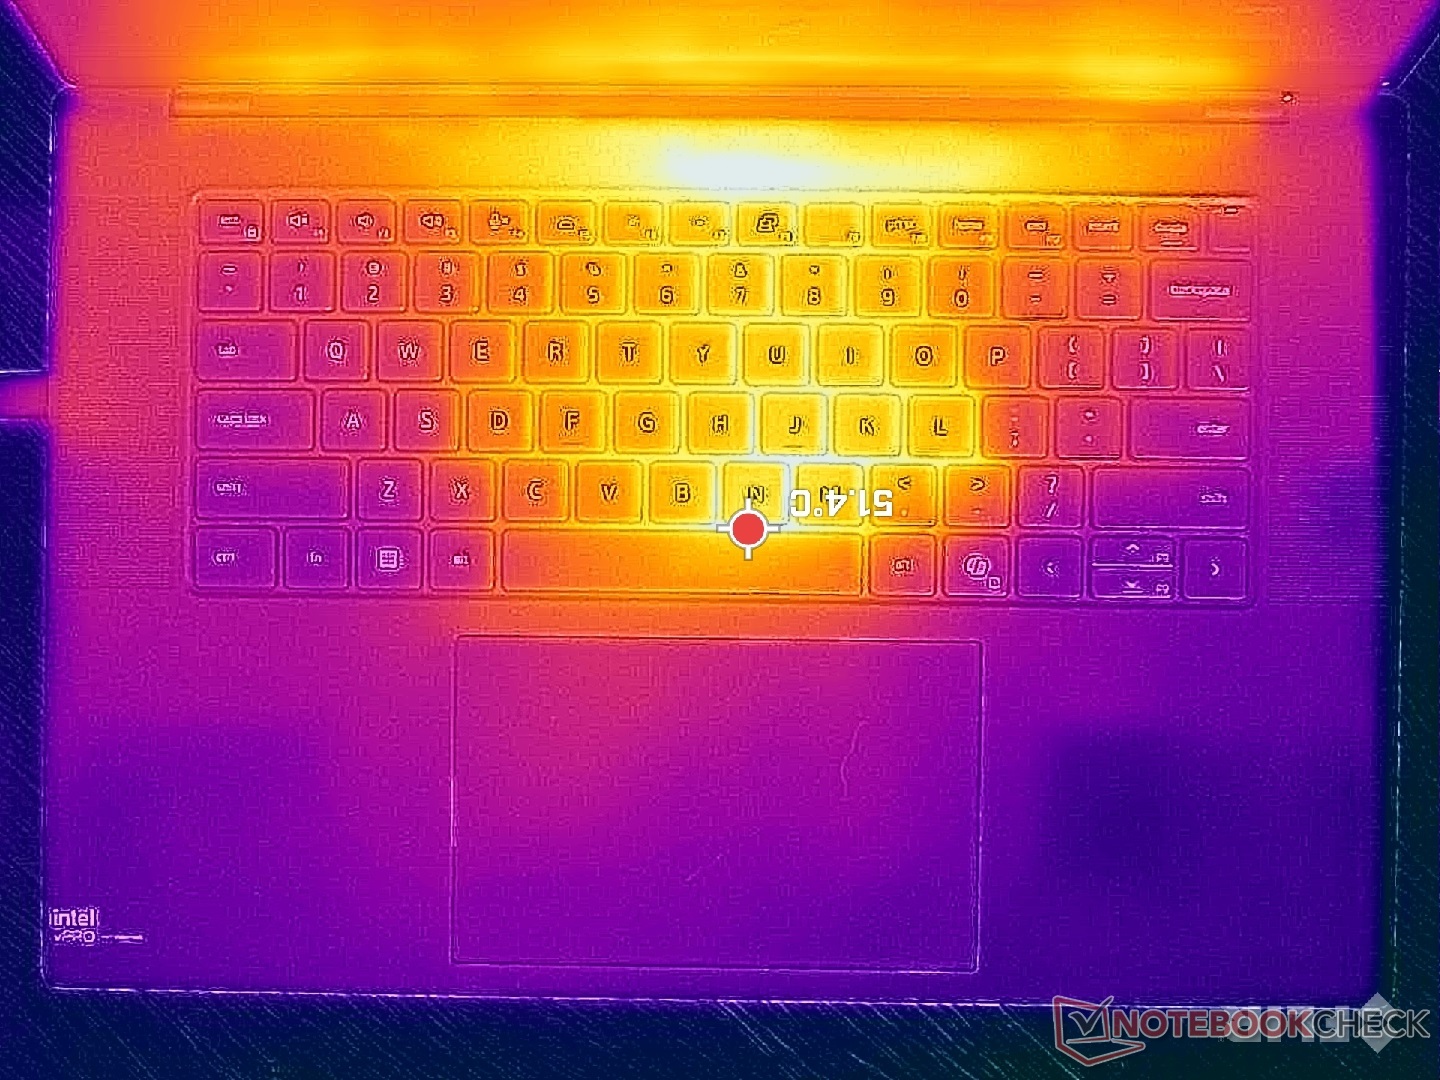
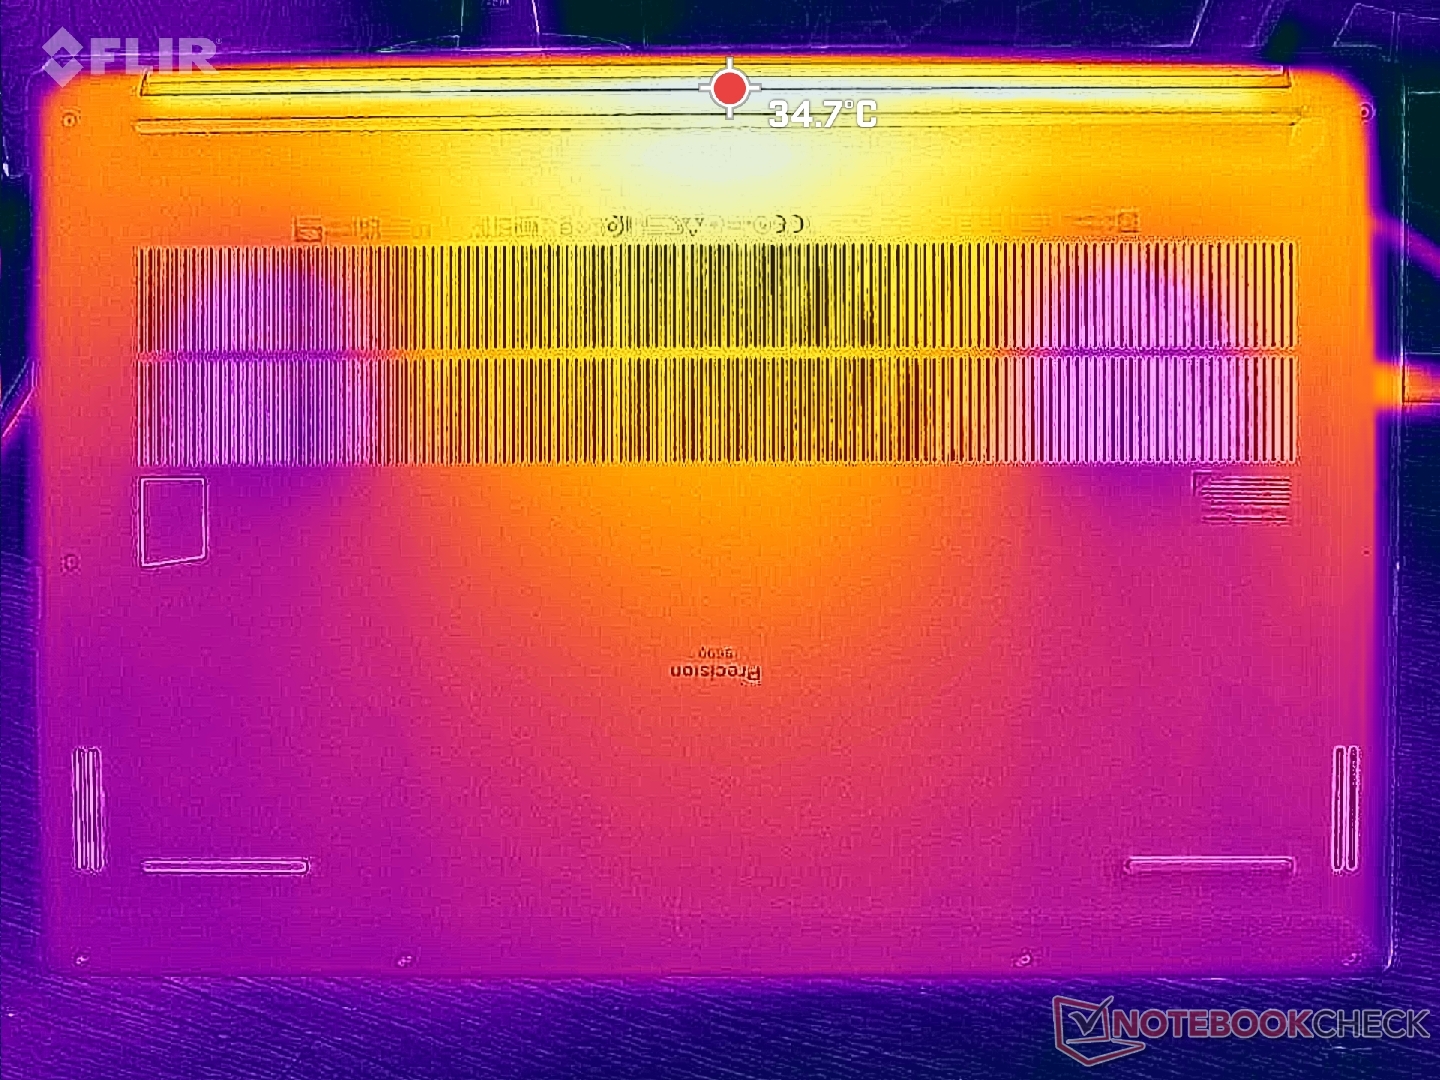
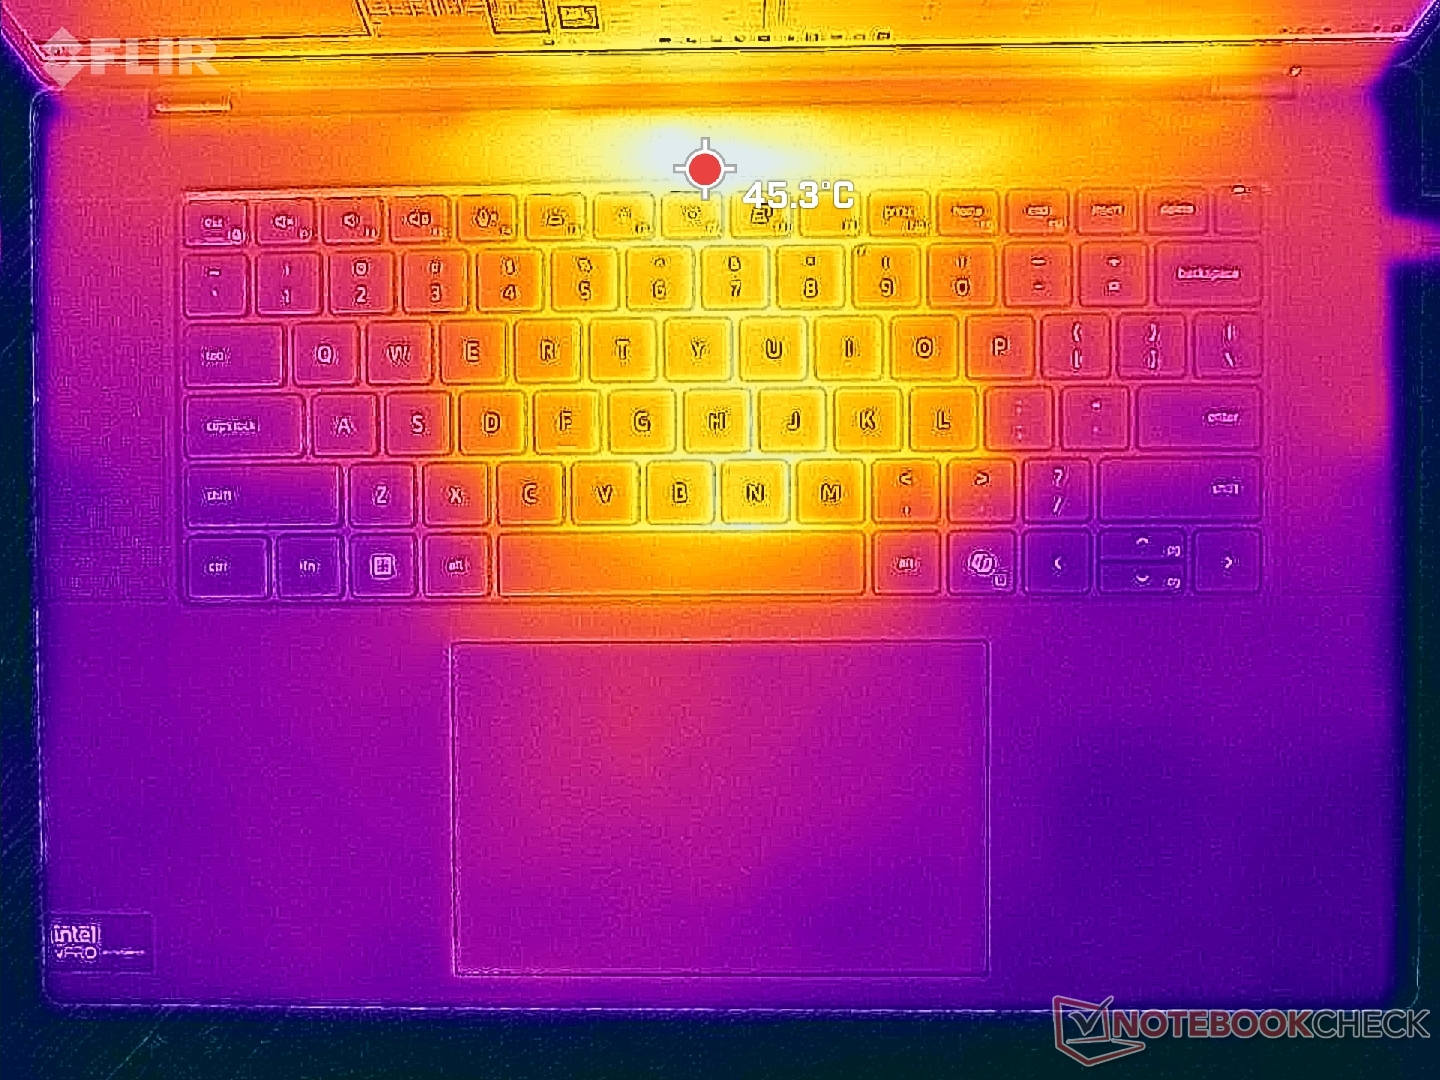
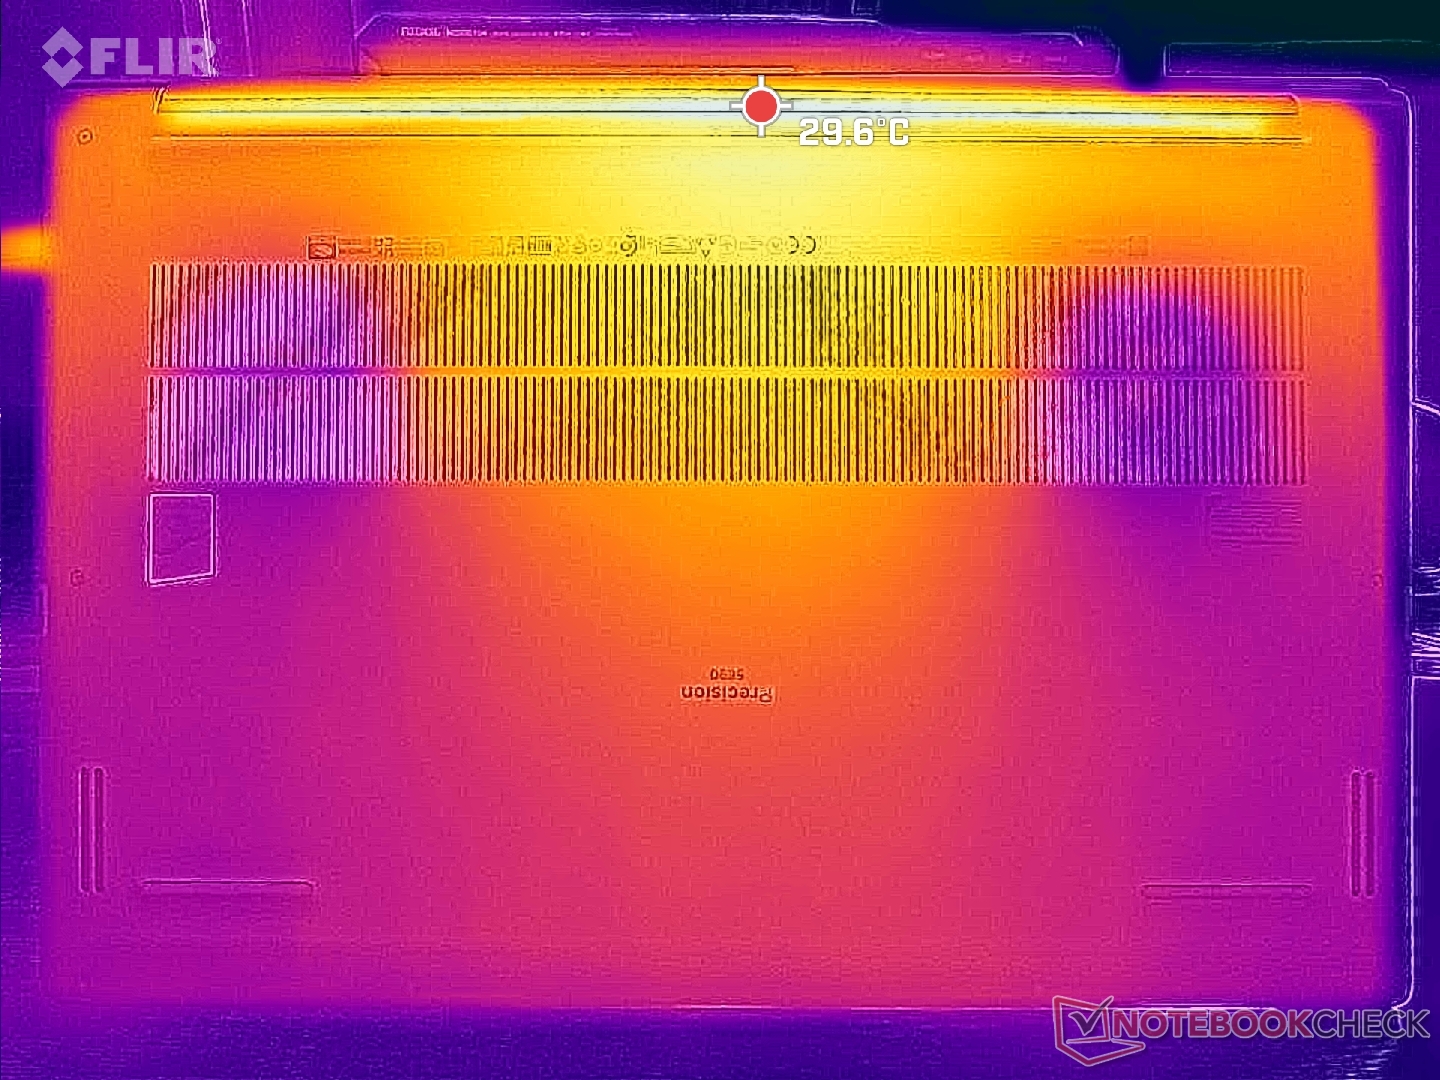
Temperature
Surface temperature development is symmetrical with hot spots as warm as 43 C to 47 C near the keyboard center. The bottom side of the chassis would remain noticeably cooler than the keyboard deck even when running demanding loads.
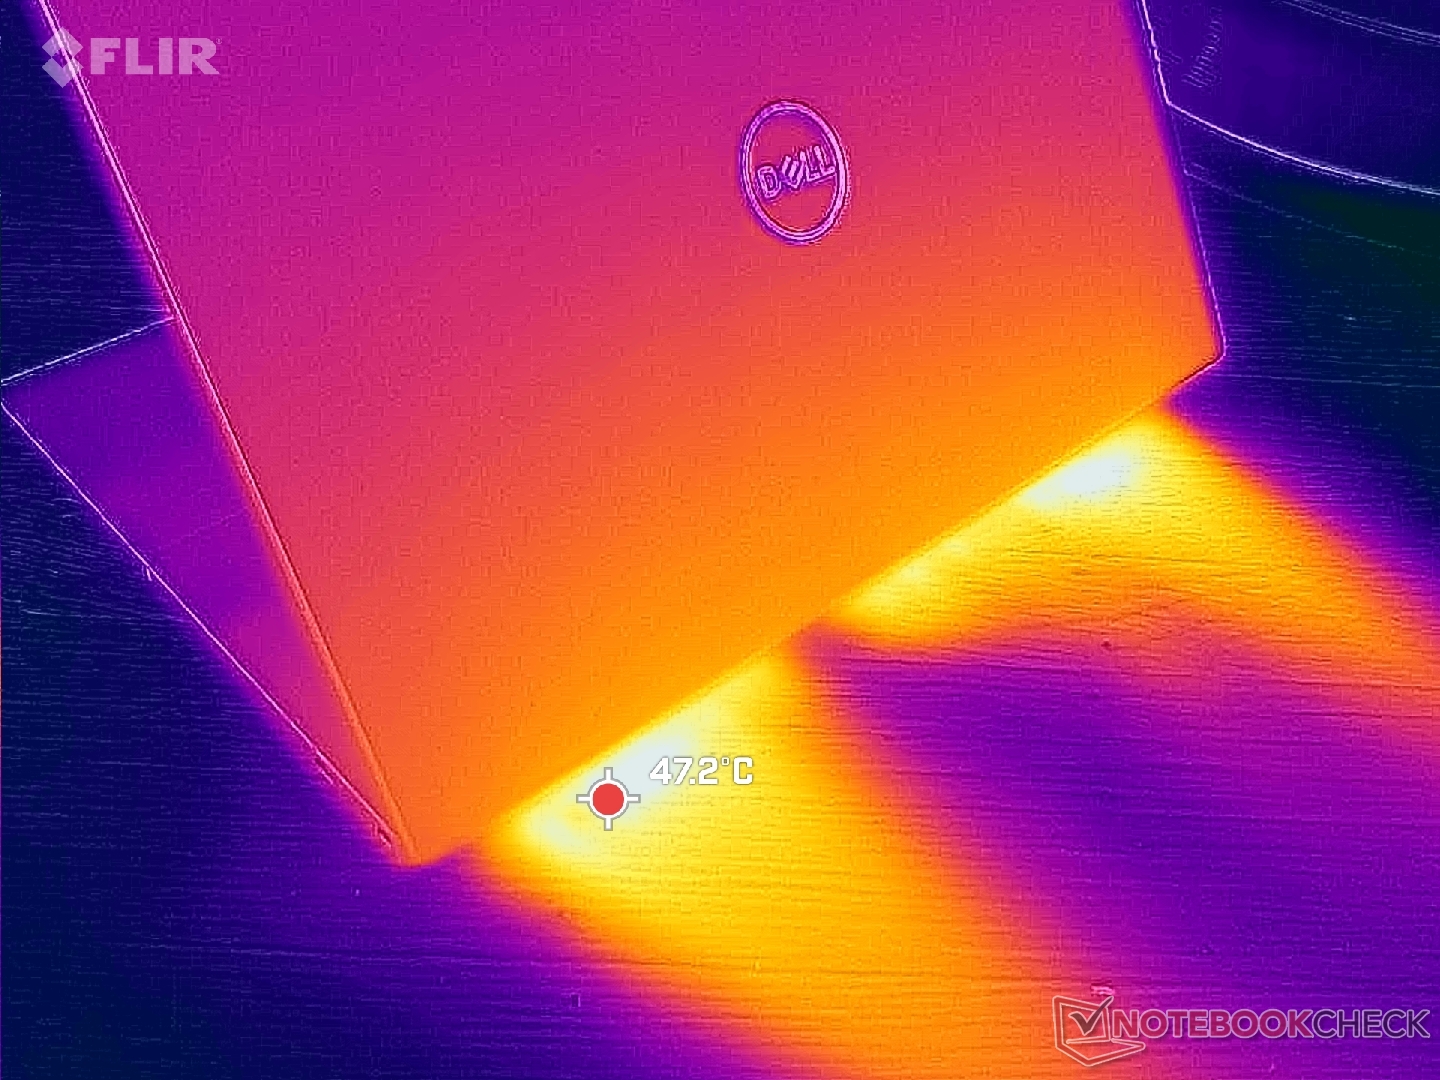
(-) The maximum temperature on the upper side is 46.6 °C / 116 F, compared to the average of 38.2 °C / 101 F, ranging from 22.2 to 69.8 °C for the class Workstation.
(+) The bottom heats up to a maximum of 33 °C / 91 F, compared to the average of 41.1 °C / 106 F
(+) In idle usage, the average temperature for the upper side is 29.2 °C / 85 F, compared to the device average of 32 °C / 90 F.
(±) Playing The Witcher 3, the average temperature for the upper side is 34 °C / 93 F, compared to the device average of 32 °C / 90 F.
(+) The palmrests and touchpad are cooler than skin temperature with a maximum of 27.6 °C / 81.7 F and are therefore cool to the touch.
(±) The average temperature of the palmrest area of similar devices was 27.8 °C / 82 F (+0.2 °C / 0.3 F).
| Dell Precision 5690 Intel Core Ultra 9 185H, NVIDIA RTX 5000 Ada Generation Laptop | Dell Precision 5000 5680 Intel Core i9-13900H, NVIDIA RTX 5000 Ada Generation Laptop | Lenovo ThinkPad P16 G2 21FA000FGE Intel Core i7-13700HX, NVIDIA RTX 2000 Ada Generation Laptop | Lenovo ThinkPad P1 G6-21FV000DGE Intel Core i9-13900H, NVIDIA RTX 2000 Ada Generation Laptop | HP ZBook Fury 16 G10 Intel Core i9-13950HX, NVIDIA RTX 5000 Ada Generation Laptop | MSI CreatorPro Z16P B12UKST Intel Core i7-12700H, NVIDIA RTX A3000 Laptop GPU | |
|---|---|---|---|---|---|---|
| Heat | -7% | 2% | -13% | -16% | -24% | |
| Maximum Upper Side * (°C) | 46.6 | 50.2 -8% | 47.2 -1% | 47.1 -1% | 44.8 4% | 56.3 -21% |
| Maximum Bottom * (°C) | 33 | 32 3% | 39.5 -20% | 56.5 -71% | 50 -52% | 68.3 -107% |
| Idle Upper Side * (°C) | 32.4 | 37.4 -15% | 28.1 13% | 28.1 13% | 34.4 -6% | 25.2 22% |
| Idle Bottom * (°C) | 29.4 | 31.2 -6% | 25.3 14% | 27.6 6% | 31.8 -8% | 25.9 12% |
* ... smaller is better
Speakers
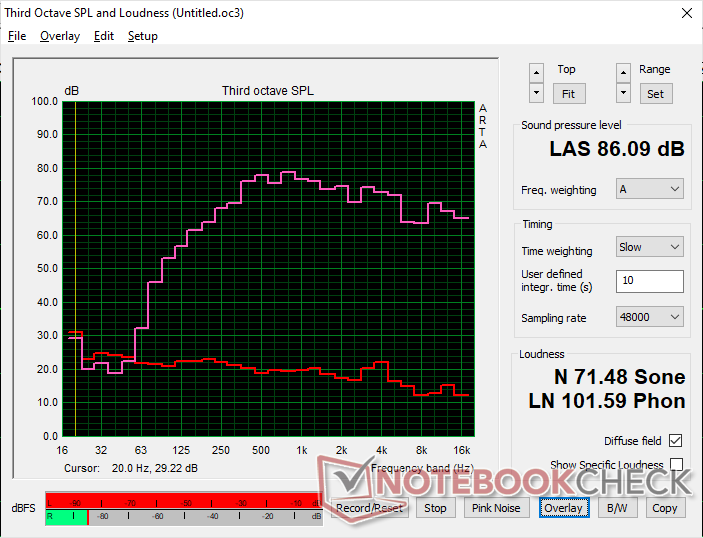
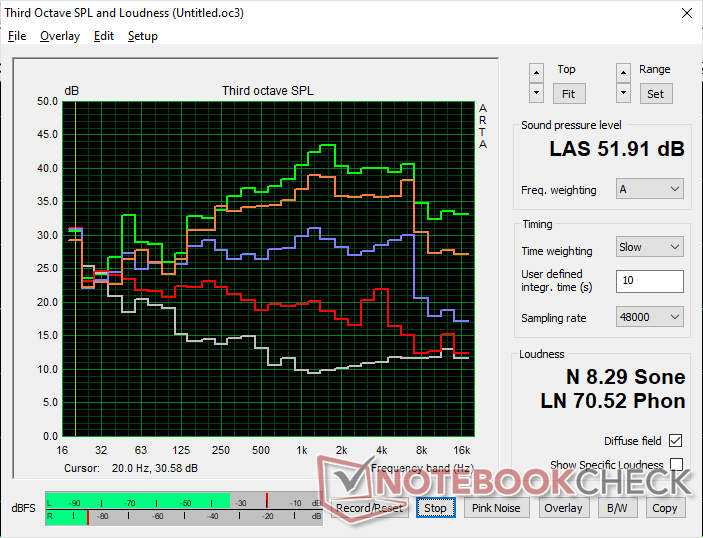
Dell Precision 5690 audio analysis
(+) | speakers can play relatively loud (86.1 dB)
Bass 100 - 315 Hz
(±) | reduced bass - on average 9.4% lower than median
(±) | linearity of bass is average (7.6% delta to prev. frequency)
Mids 400 - 2000 Hz
(+) | balanced mids - only 4.7% away from median
(+) | mids are linear (4.8% delta to prev. frequency)
Highs 2 - 16 kHz
(+) | balanced highs - only 3.4% away from median
(±) | linearity of highs is average (7.3% delta to prev. frequency)
Overall 100 - 16.000 Hz
(+) | overall sound is linear (11.1% difference to median)
Compared to same class
» 12% of all tested devices in this class were better, 4% similar, 84% worse
» The best had a delta of 7%, average was 17%, worst was 35%
Compared to all devices tested
» 7% of all tested devices were better, 2% similar, 92% worse
» The best had a delta of 4%, average was 24%, worst was 134%
Apple MacBook Pro 16 2021 M1 Pro audio analysis
(+) | speakers can play relatively loud (84.7 dB)
Bass 100 - 315 Hz
(+) | good bass - only 3.8% away from median
(+) | bass is linear (5.2% delta to prev. frequency)
Mids 400 - 2000 Hz
(+) | balanced mids - only 1.3% away from median
(+) | mids are linear (2.1% delta to prev. frequency)
Highs 2 - 16 kHz
(+) | balanced highs - only 1.9% away from median
(+) | highs are linear (2.7% delta to prev. frequency)
Overall 100 - 16.000 Hz
(+) | overall sound is linear (4.6% difference to median)
Compared to same class
» 0% of all tested devices in this class were better, 0% similar, 100% worse
» The best had a delta of 5%, average was 17%, worst was 45%
Compared to all devices tested
» 0% of all tested devices were better, 0% similar, 100% worse
» The best had a delta of 4%, average was 24%, worst was 134%
Energy Management
Power Consumption
Idling on desktop can demand as low as 8 W on the minimum brightness setting up to 29 W on the maximum brightness setting with an all-white background. This range is wider than on most IPS laptops due to how OLED works. Tasks like web browsing, word processing, or spreadsheet inputs can drain the battery faster than one might expect as these windows are mostly white in color. Lowering the brightness or selecting darker colors can help to extend battery life more than on an IPS alternative.
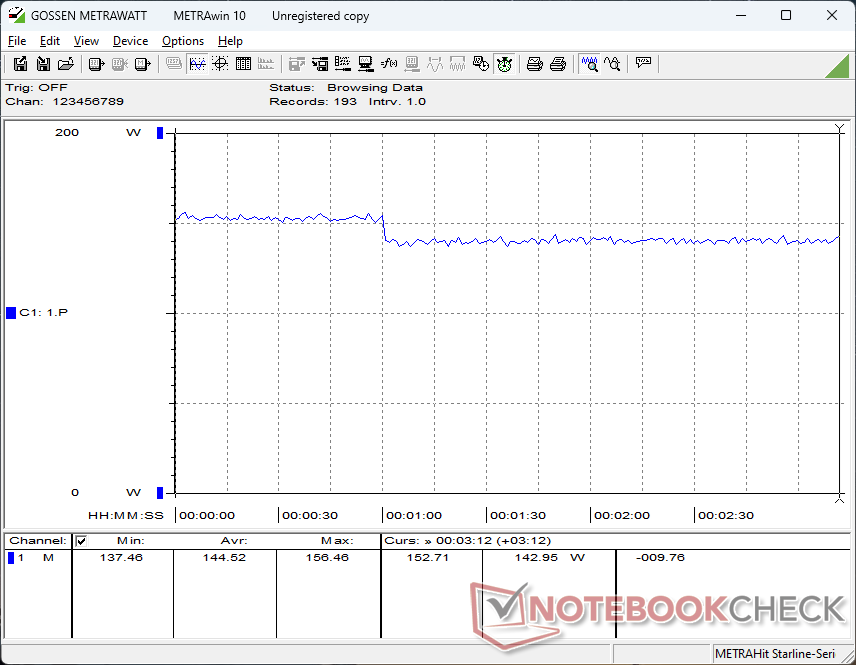
Power consumption when running higher loads like Witcher 3 would be nearly the same as what we recorded on the older Precision 5680. This corroborates our benchmark data above which also shows only marginal performance differences at best between the two models.
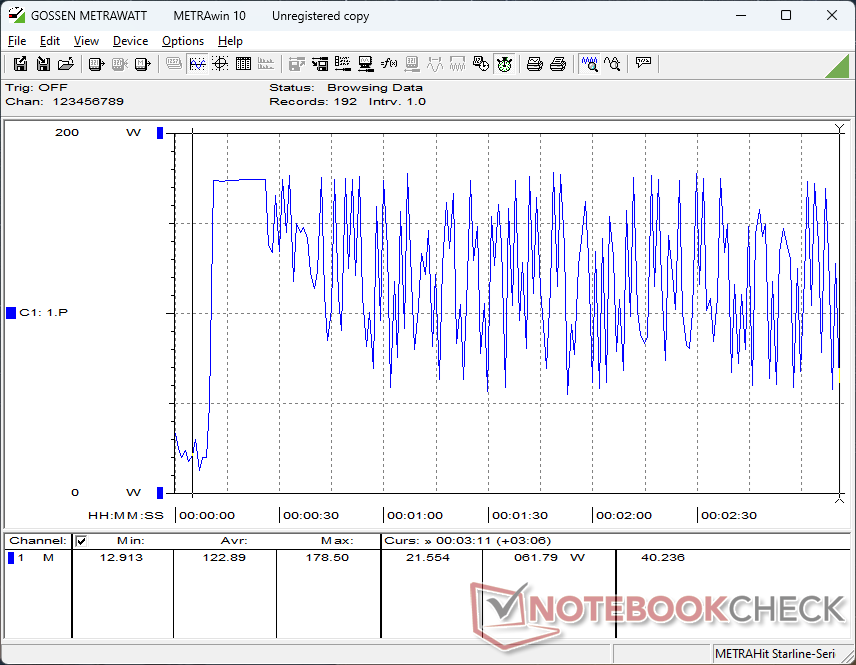
Strangely, consumption would fluctuate wildly when running Prime95 stress even after multiple retests. Performance appears to be steady otherwise.
| Off / Standby | |
| Idle | |
| Load |
|
Key:
min: | |
| Dell Precision 5690 Ultra 9 185H, RTX 5000 Ada Generation Laptop, 2x Samsung PM9A1 1TB (RAID 0), OLED, 3840x2400, 16" | Dell Precision 5000 5680 i9-13900H, RTX 5000 Ada Generation Laptop, 2x SK hynix PC801 HFS512GEJ9X101N RAID 0, OLED, 3840x2400, 16" | Lenovo ThinkPad P16 G2 21FA000FGE i7-13700HX, RTX 2000 Ada Generation Laptop, SK hynix PC801 HFS001TEJ9X162N, IPS LED, 2560x1600, 16" | Lenovo ThinkPad P1 G6-21FV000DGE i9-13900H, RTX 2000 Ada Generation Laptop, SK Hynix PC711 1TB HFS001TDE9X084N, IPS, 2560x1600, 16" | HP ZBook Fury 16 G10 i9-13950HX, RTX 5000 Ada Generation Laptop, SK hynix PC801 HFS001TEJ9X101N, IPS, 3840x2400, 16" | MSI CreatorPro Z16P B12UKST i7-12700H, RTX A3000 Laptop GPU, Samsung PM9A1 MZVL21T0HCLR, IPS, 2560x1600, 16" | |
|---|---|---|---|---|---|---|
| Power Consumption | 6% | -5% | 10% | -39% | -9% | |
| Idle Minimum * (Watt) | 7.9 | 8 -1% | 9.3 -18% | 8.3 -5% | 15.3 -94% | 10.8 -37% |
| Idle Average * (Watt) | 12 | 10.4 13% | 14.1 -18% | 14.5 -21% | 18.2 -52% | 16.3 -36% |
| Idle Maximum * (Watt) | 28.6 | 30.5 -7% | 15.5 46% | 15.3 47% | 28 2% | 16.9 41% |
| Load Average * (Watt) | 98.8 | 75.4 24% | 133.6 -35% | 91.8 7% | 137.9 -40% | 111.7 -13% |
| Witcher 3 ultra * (Watt) | 144.5 | 134 7% | 144.9 -0% | 104.7 28% | 189.4 -31% | 152.1 -5% |
| Load Maximum * (Watt) | 174.8 | 175 -0% | 179.6 -3% | 164.5 6% | 202 -16% | 177.4 -1% |
* ... smaller is better
Power Consumption Witcher 3 / Stresstest
Power Consumption external Monitor
Battery Life
Runtimes are about the same as before if not slightly shorter. Our WLAN test would last just over 9 hours whereas the Precision 5680 would be closer to 10 hours under similar conditions.
| Dell Precision 5690 Ultra 9 185H, RTX 5000 Ada Generation Laptop, 98 Wh | Dell Precision 5000 5680 i9-13900H, RTX 5000 Ada Generation Laptop, 98 Wh | Lenovo ThinkPad P16 G2 21FA000FGE i7-13700HX, RTX 2000 Ada Generation Laptop, 94 Wh | Lenovo ThinkPad P1 G6-21FV000DGE i9-13900H, RTX 2000 Ada Generation Laptop, 90 Wh | HP ZBook Fury 16 G10 i9-13950HX, RTX 5000 Ada Generation Laptop, 95 Wh | MSI CreatorPro Z16P B12UKST i7-12700H, RTX A3000 Laptop GPU, 90 Wh | |
|---|---|---|---|---|---|---|
| Battery runtime | 8% | -7% | 3% | -21% | -37% | |
| WiFi v1.3 (h) | 9.2 | 9.9 8% | 8.6 -7% | 9.5 3% | 7.3 -21% | 5.8 -37% |
| Reader / Idle (h) | 17.9 | |||||
| Load (h) | 1.7 | 1.1 | ||||
| H.264 (h) | 11.2 |
Pros
Cons
Verdict — Ready For The AI Revolution
The Precision 5680 came out running with a sleek new design derived from the XPS 16 complete with vPro CPUs and high-end Nvidia RTX Ada graphics. It would subsequently become one of the fastest 16-inch workstations available relative to its size and weight. The problem here is that the Precision 5680 is barely half a year old and still quite fresh. The newer Precision 5690 offers the same chassis, GPU, display, power consumption levels, battery life, and processor performance as the Precision 5680. If you're looking to save a bit of money, then last year's Precision 5680 can offer essentially the same user experience and performance for less.
The Precision 5690 introduced AI acceleration and faster RAM than its predecessor. Otherwise, the user experience has not changed year over year.
The major differentiating factor separating the 2024 Precision 5690 from the 2023 Precision 5680 comes down to the integrated NPU on the Meteor Lake-H series CPUs. The newer Dell model is therefore "AI ready" when Windows becomes optimized for local AI tasks. If you already utilize Co-Pilot or expect to run more AI-enhanced applications in the near future, for example, then the Precision 5690 should have a notable edge due to NPU acceleration. Otherwise, most "traditional" tasks will not run noticeably faster on the latest model.
Price and Availability
Dell is now shipping the Precision 5690 starting at $2290 for the Core Ultra 5 135H CPU, integrated graphics only, and 1200p IPS display up to well over $5000 if configured with the Core Ultra 9 185H, RTX 5000 Ada, and 2400p OLED touchscreen.
Dell Precision 5690
- 05/08/2024 v7 (old)
Allen Ngo
Transparency
The selection of devices to be reviewed is made by our editorial team. The test sample was provided to the author as a loan by the manufacturer or retailer for the purpose of this review. The lender had no influence on this review, nor did the manufacturer receive a copy of this review before publication. There was no obligation to publish this review. As an independent media company, Notebookcheck is not subjected to the authority of manufacturers, retailers or publishers.
This is how Notebookcheck is testing
Every year, Notebookcheck independently reviews hundreds of laptops and smartphones using standardized procedures to ensure that all results are comparable. We have continuously developed our test methods for around 20 years and set industry standards in the process. In our test labs, high-quality measuring equipment is utilized by experienced technicians and editors. These tests involve a multi-stage validation process. Our complex rating system is based on hundreds of well-founded measurements and benchmarks, which maintains objectivity. Further information on our test methods can be found here.
Price comparison
