Lenovo ThinkPad P16v G1 AMD review - Entry-level workstation with Zen4
Lenovo has added a new entry-level model to its mobile workstation lineup with the ThinkPad P16v G1. The laptop is available with either AMD or Intel processors, and you can choose between integrated graphics and the Nvidia professional GPUs RTX A500, RTX 1000 and RTX 2000 Ada.
The cheapest AMD model starts at around €1,400 (US$1,533) and features a Ryzen 5 PRO 7560HS with integrated Radeon 760M, 8 GB of RAM, a 256 GB SSD and a 1080p panel. The highest-spec AMD variant tops out at €3,200 (US$3,503) and comes with a Ryzen 9 PRO 7940HS, an RTX 2000 Ada, 64 GB of RAM, 4 TB of SSD storage and a 4K display.
Our review unit (model number 21FE0004GE) costs €2,099 (US$2,298) and is equipped with a Ryzen 7 PRO 7840HS, an Nvidia RTX A1000, 32 GB of RAM, a 1 TB SSD and a Full HD panel with complete sRGB coverage.
Comparison with possible competitors
Rating | Date | Model | Weight | Height | Size | Resolution | Price |
|---|---|---|---|---|---|---|---|
| 86.2 % v7 (old) | 01 / 2024 | Lenovo ThinkPad P16v G1 AMD R7 PRO 7840HS, RTX A1000 Laptop GPU | 2.3 kg | 24.7 mm | 16.00" | 1920x1200 | |
| 88.9 % v7 (old) | 12 / 2023 | HP ZBook Power 15 G10 R7 PRO 7840HS, RTX 2000 Ada Generation Laptop | 2 kg | 22.9 mm | 15.60" | 2560x1440 | |
| 87.8 % v7 (old) | 04 / 2023 | Lenovo ThinkPad P15v G3 21EM001AGE R7 PRO 6850H, RTX A2000 Laptop GPU | 2.2 kg | 22.7 mm | 15.60" | 3840x2160 | |
| 88.4 % v7 (old) | 10 / 2022 | Dell Precision 7670 i7-12850HX, RTX A2000 Laptop GPU | 2.7 kg | 24.7 mm | 16.00" | 3840x2400 | |
| 91.7 % v7 (old) | 10 / 2023 | Lenovo ThinkPad P1 G6-21FV000DGE i9-13900H, RTX 2000 Ada Generation Laptop | 1.9 kg | 17.5 mm | 16.00" | 2560x1600 | |
| 88.2 % v7 (old) | 02 / 2023 | Lenovo ThinkPad P16 G1 21D6001DMB i7-12850HX, RTX A2000 Laptop GPU | 3 kg | 30.23 mm | 16.00" | 2560x1600 |
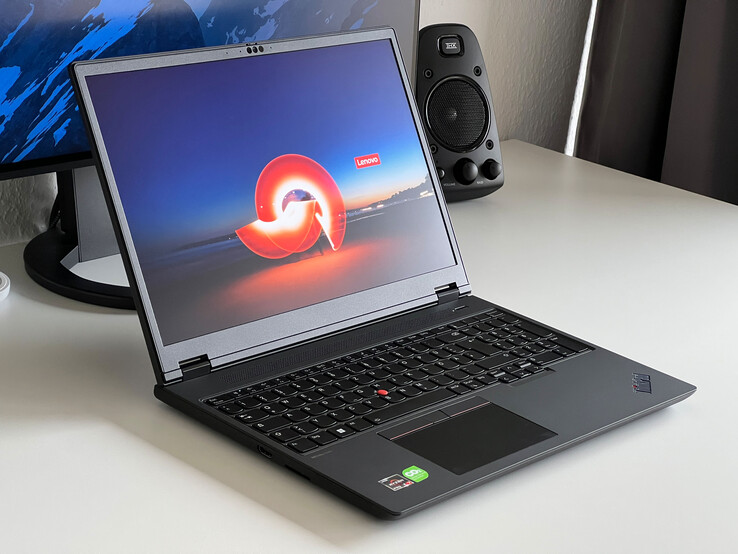
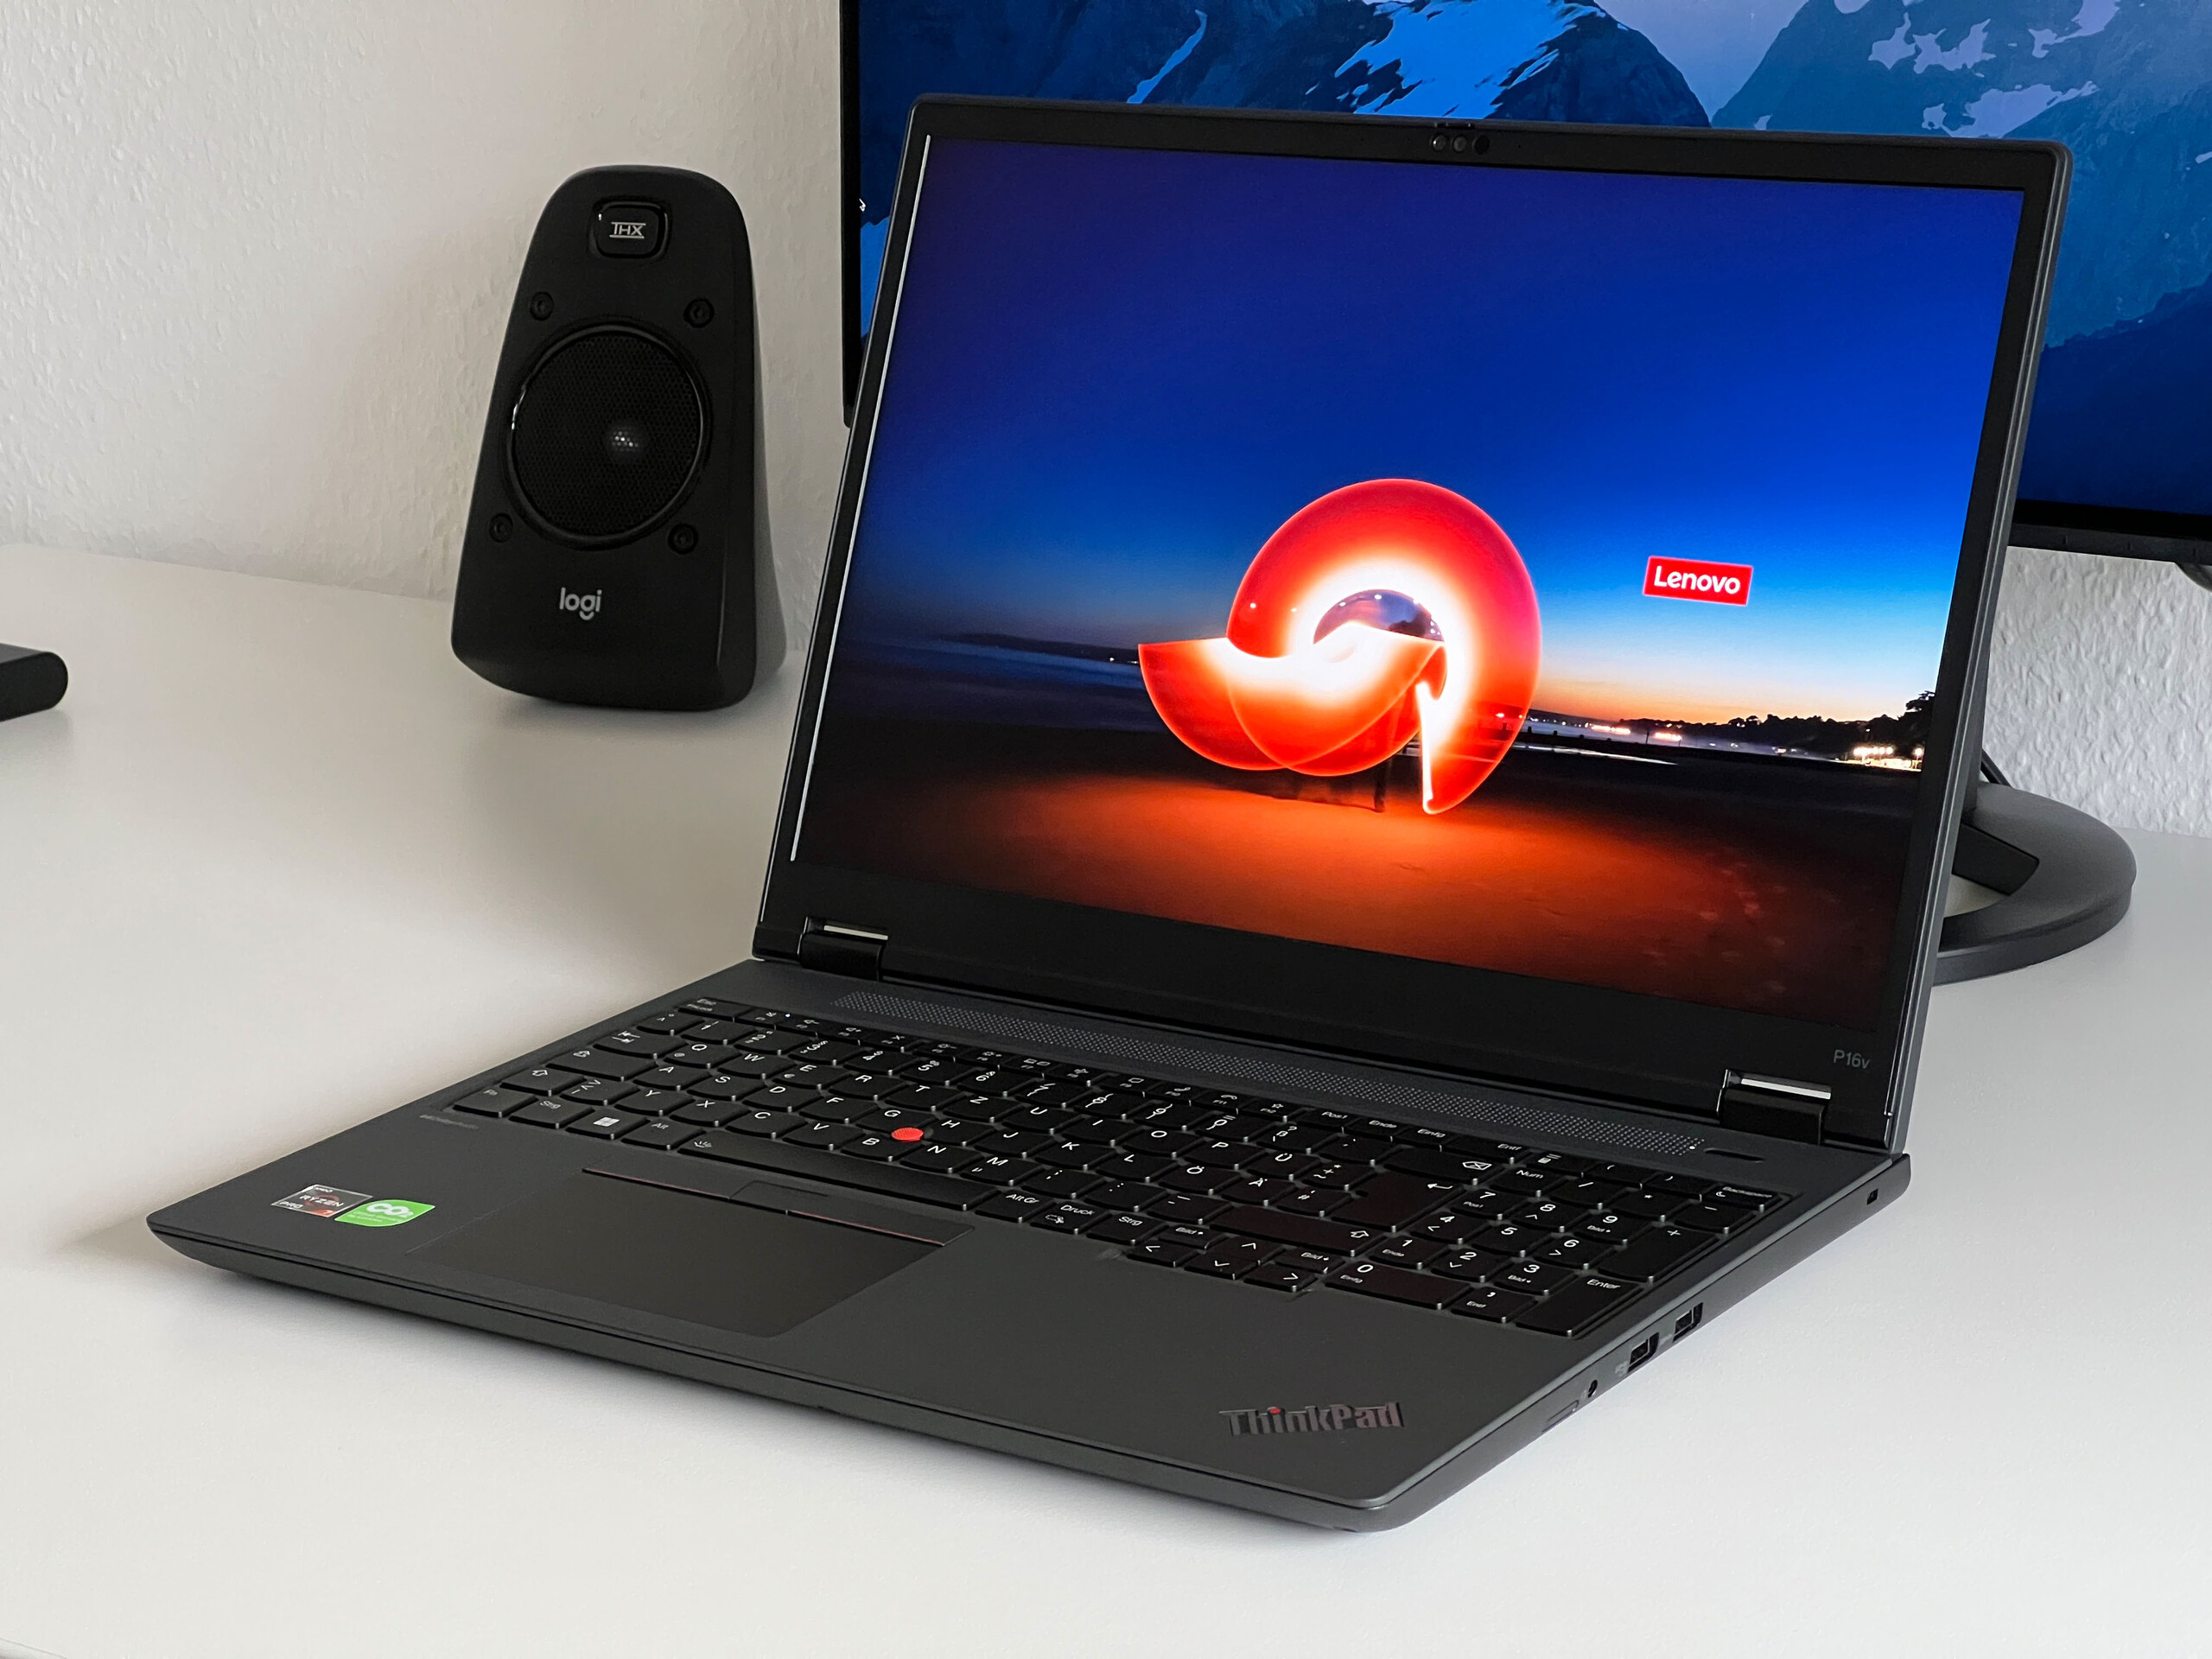
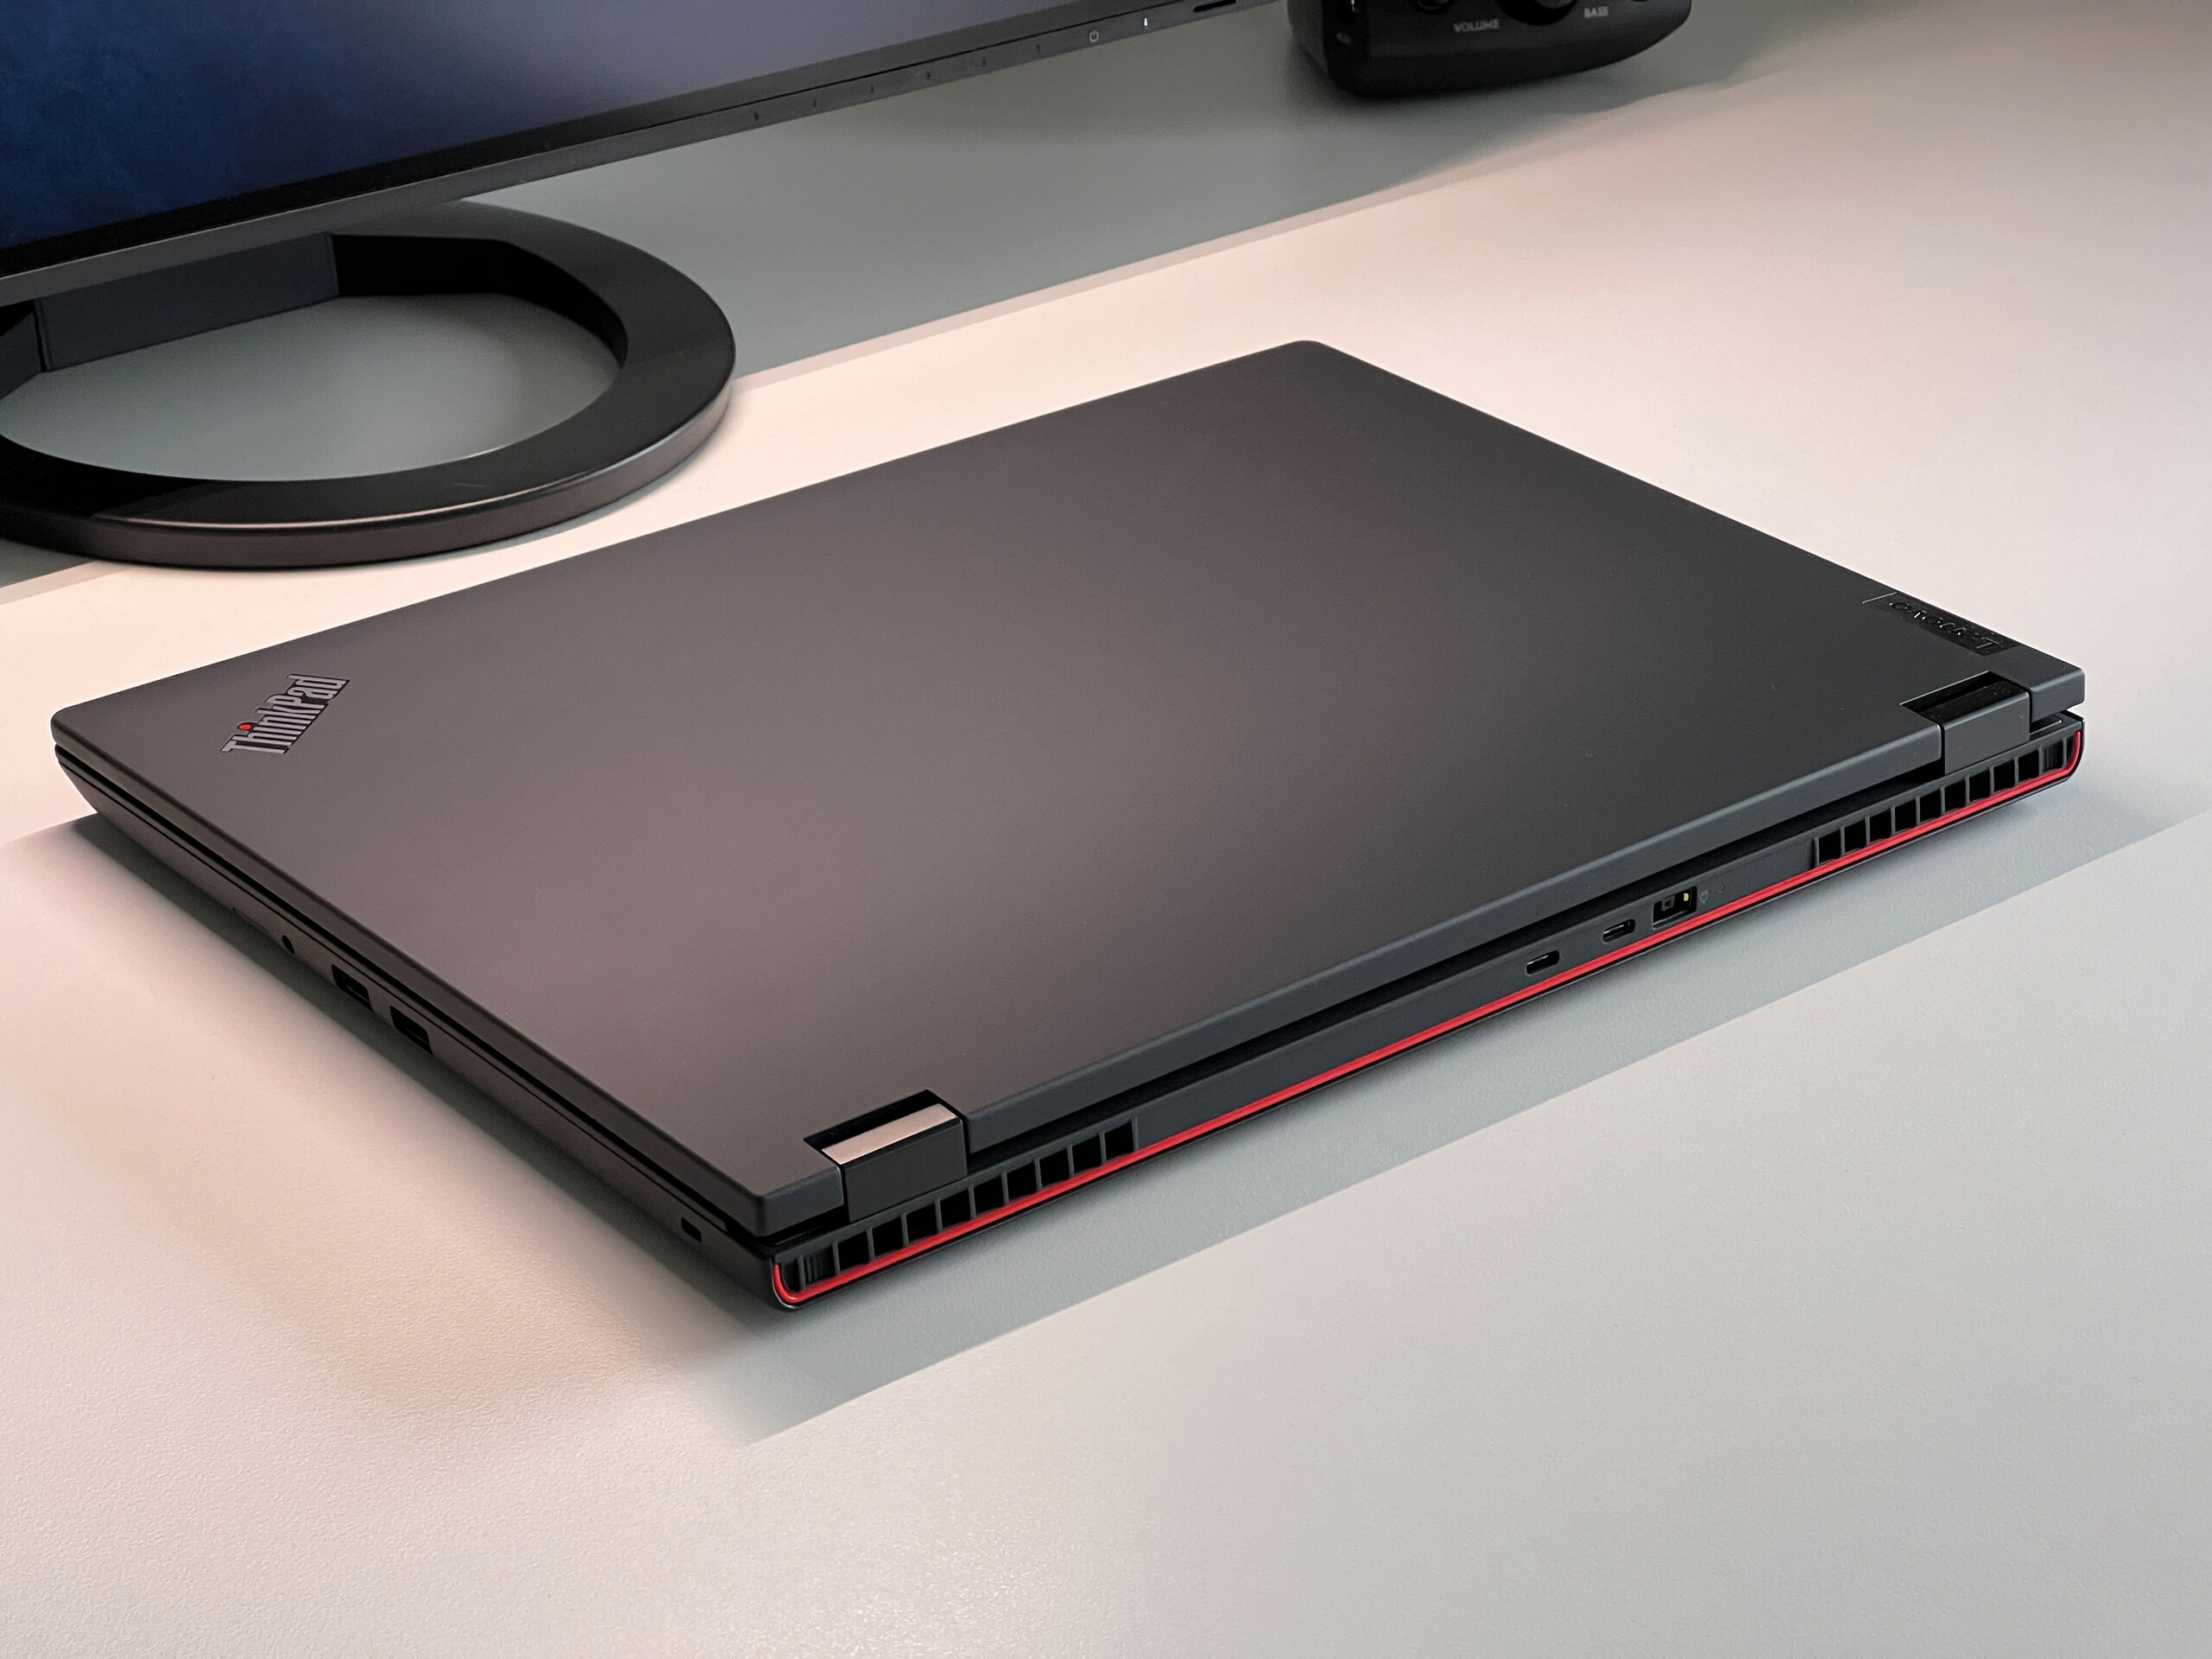
Case - Plastic ThinkPad with red accents
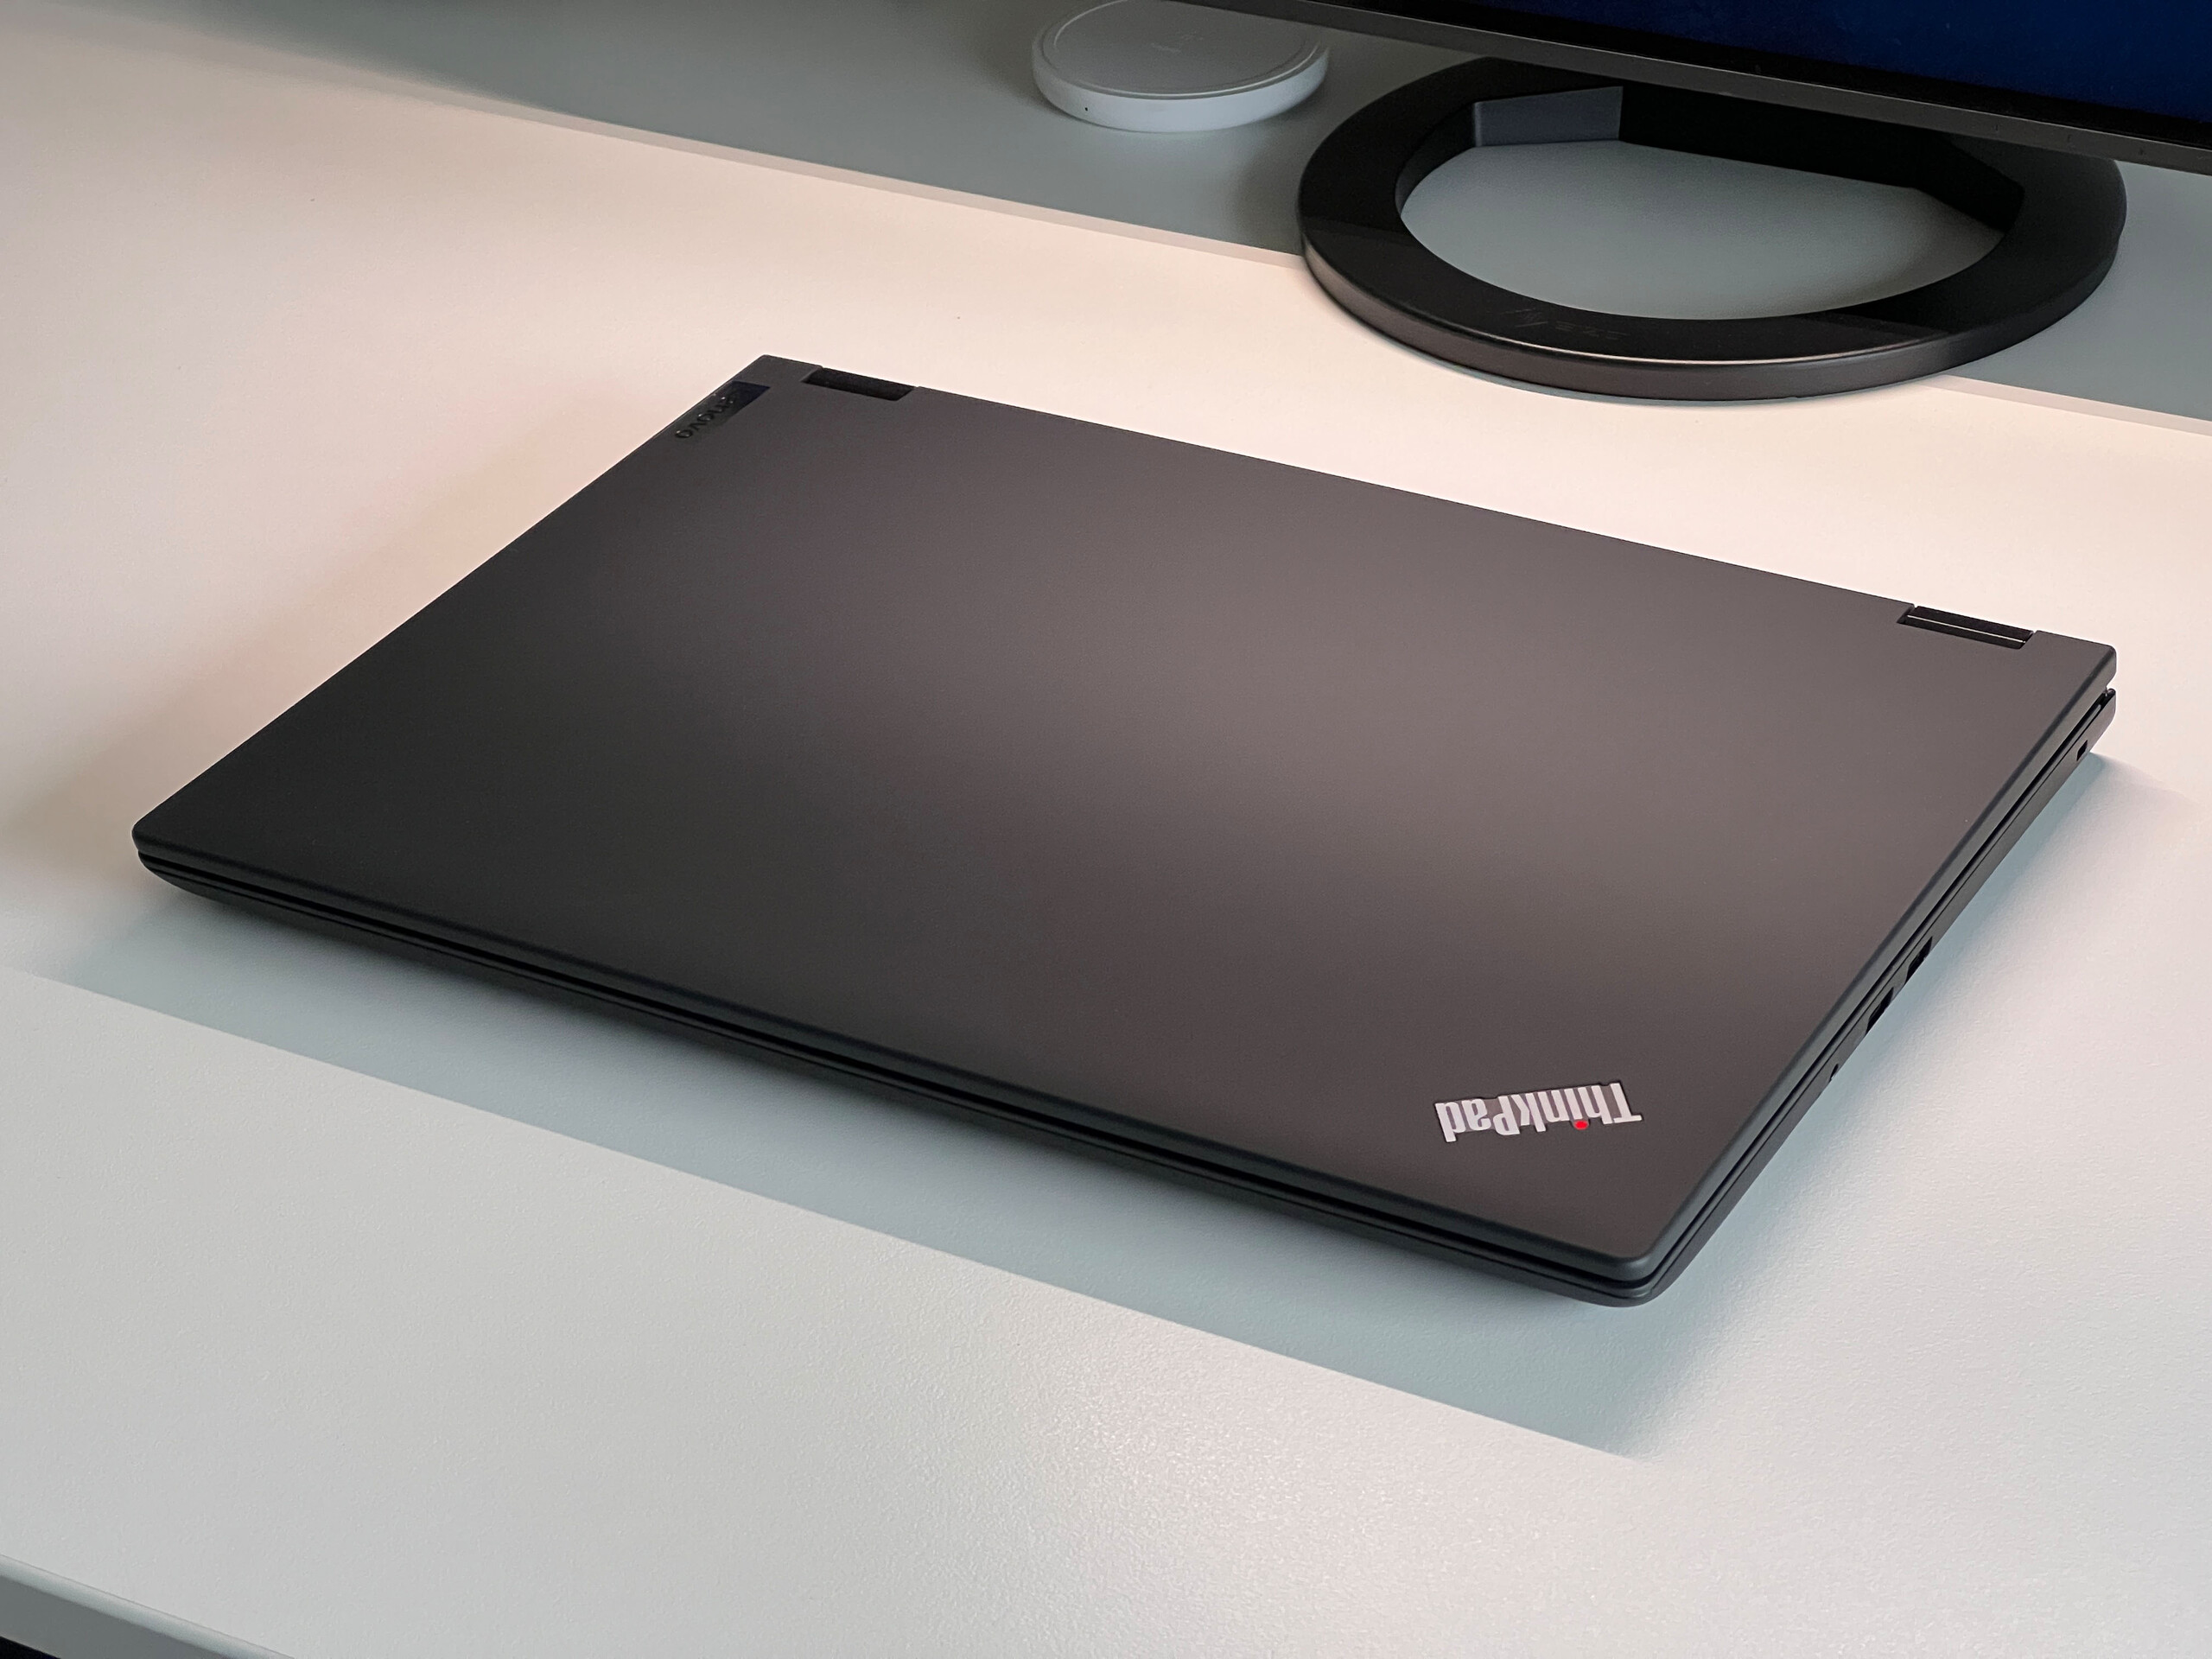
The laptop’s entry-level nature is clearly evident in the choice of material. Lenovo has given the ThinkPad P16v G1 a completely plastic chassis. Nevertheless, both the lid and the top of the base section feel nice and are not particularly susceptible to fingerprints. On the other hand, the bottom case and screen bezel are rougher and also feel cheaper. In terms of fit and finish, the competitor HP ZBook Power definitely has an edge with its metal chassis.
Besides the usual red elements, such as the TrackPoint and the red accent lines on the dedicated mouse buttons, Lenovo has gone one step further with the P16v G1 by adding another red accent line across the back of the device. Of course, personal taste is always subjective, but we aren’t quite sure whether this is appropriate for a mobile workstation.
The laptop is fundamentally sturdy, but drawbacks are inevitable against more expensive ThinkPad models. The middle of the base section can be pushed in slightly, and the lid also has quite a bit of flex. That said, this doesn’t result in any creaking noises or image distortion. The hinges are tuned pretty well, but there is noticeable wobble when you adjust the display’s angle. The screen also can’t be fully folded back 180 degrees.
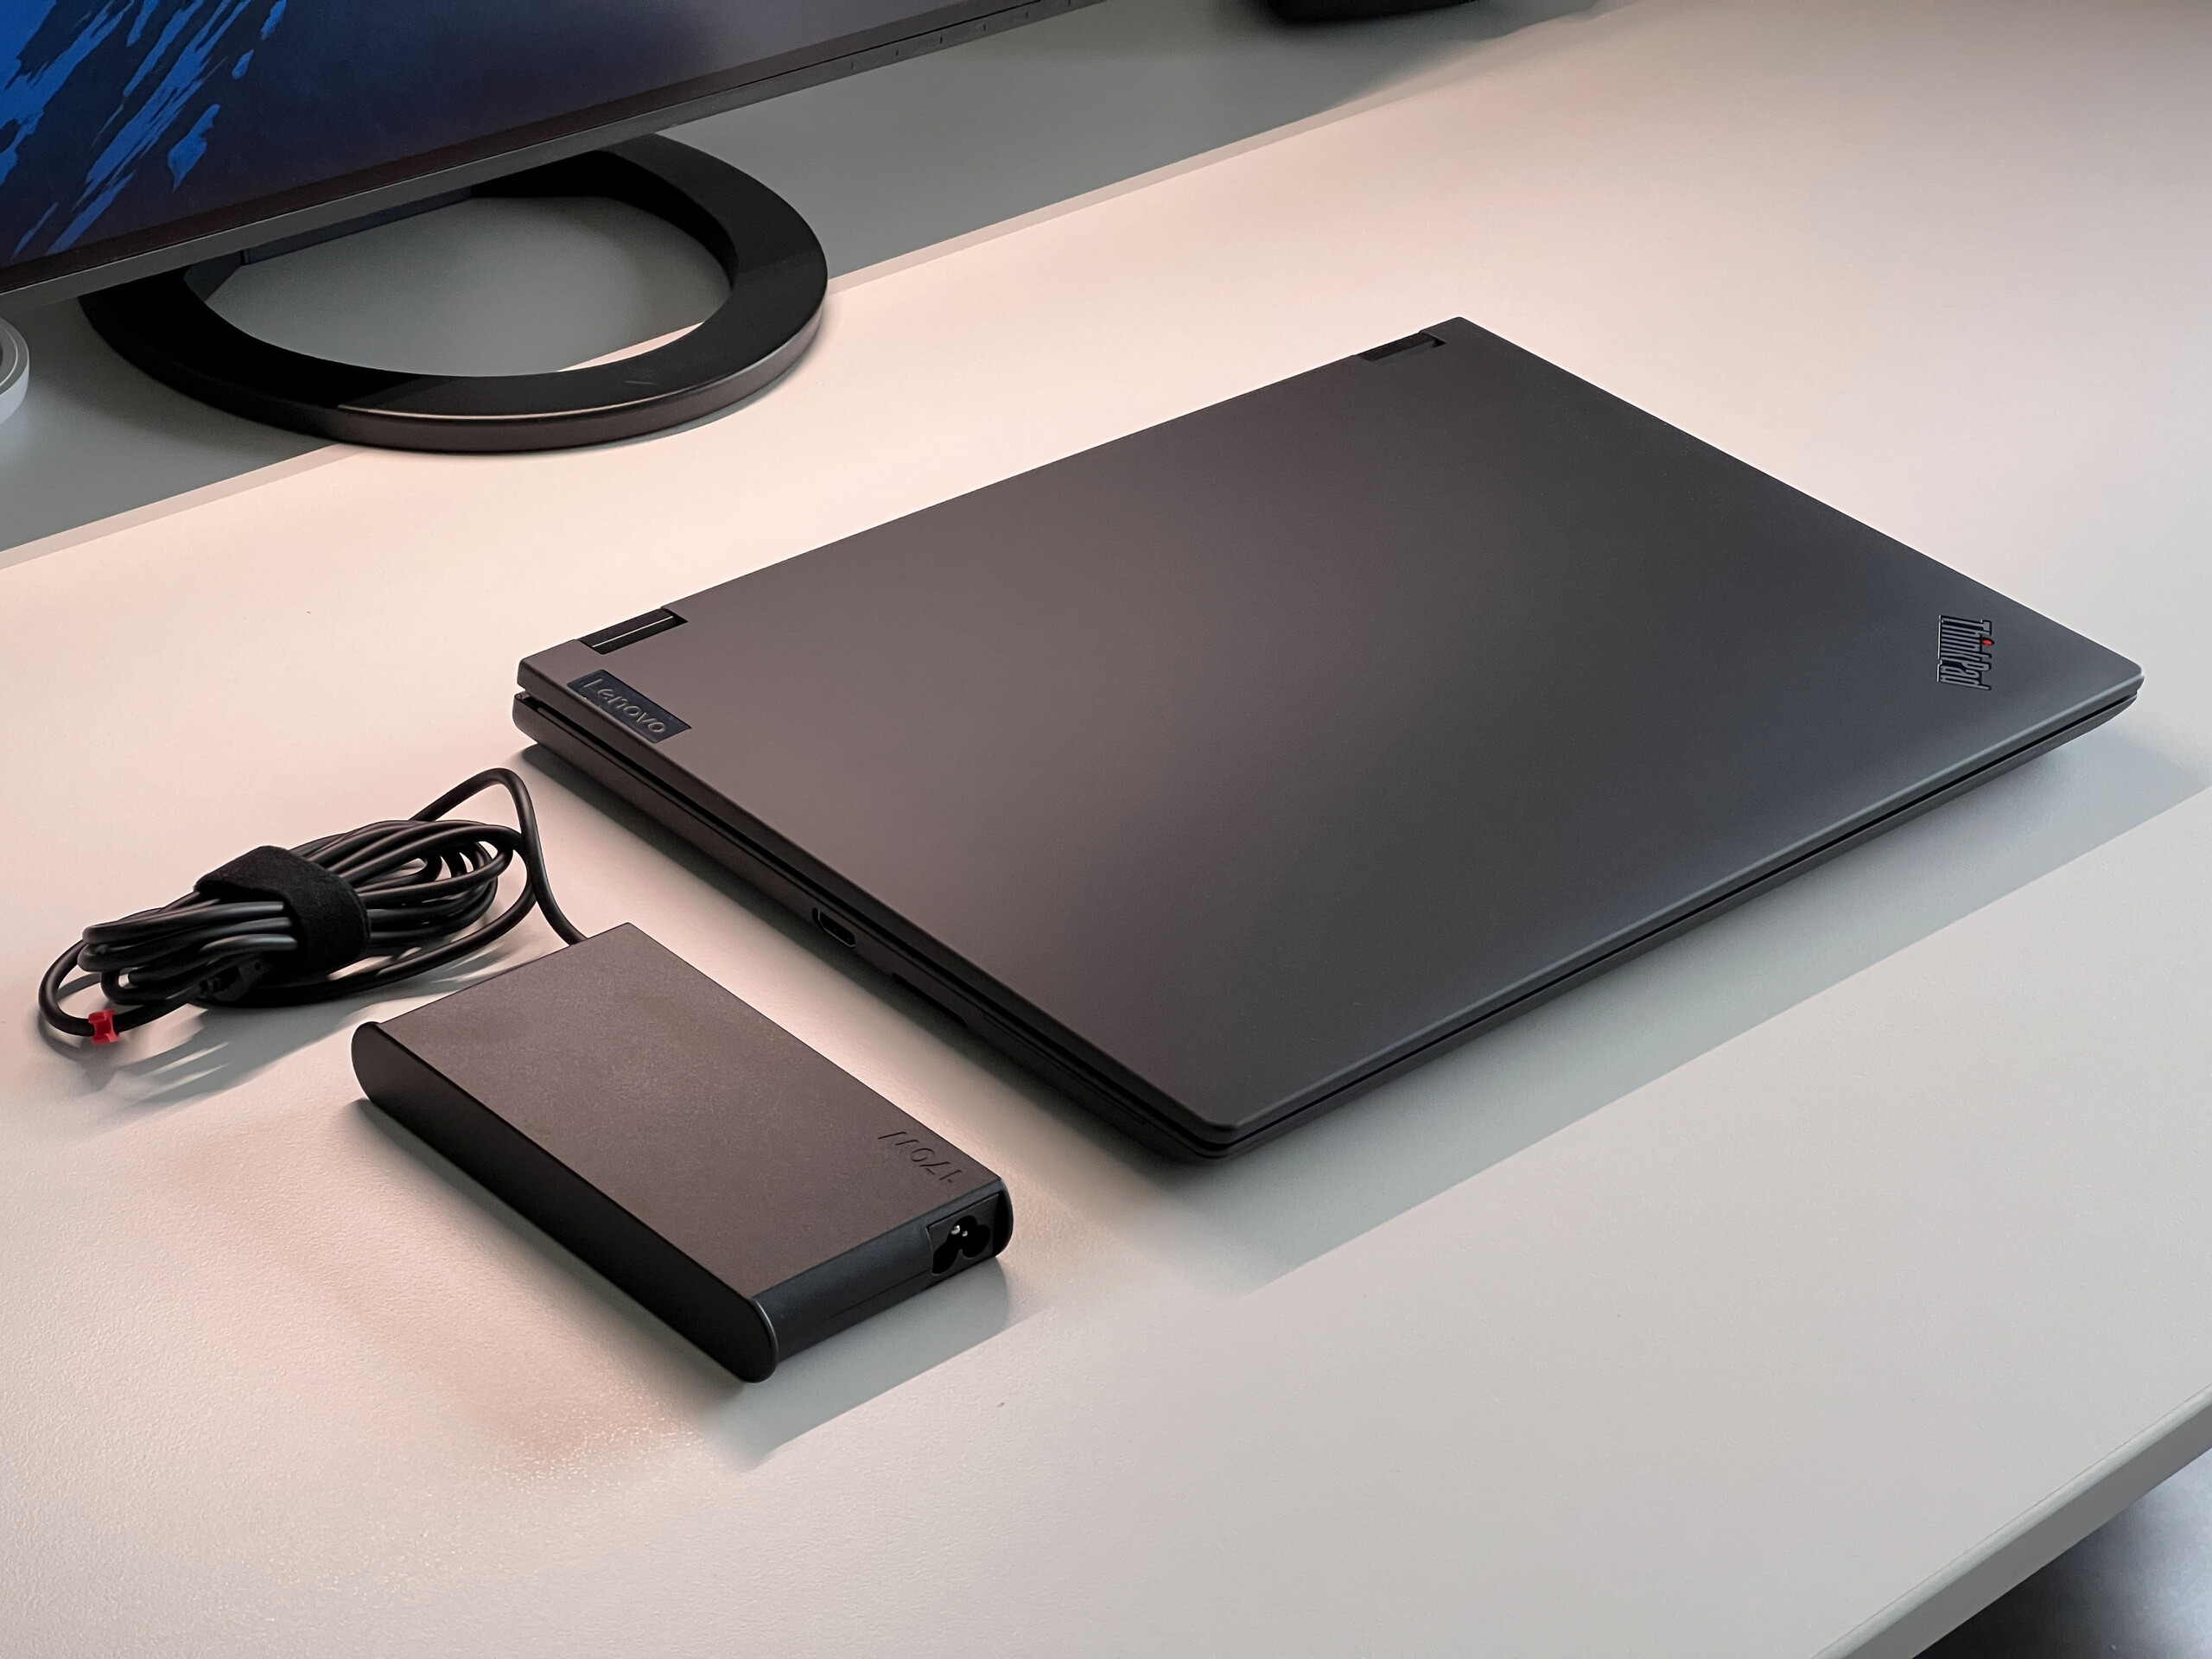
In terms of size and weight, the new P16v G1 falls almost exactly between the thin ThinkPad P1 G6 workstation and the beefy ThinkPad P16. The 170-watt charger weighs 554 g (1.22 lb) together with the power cable.
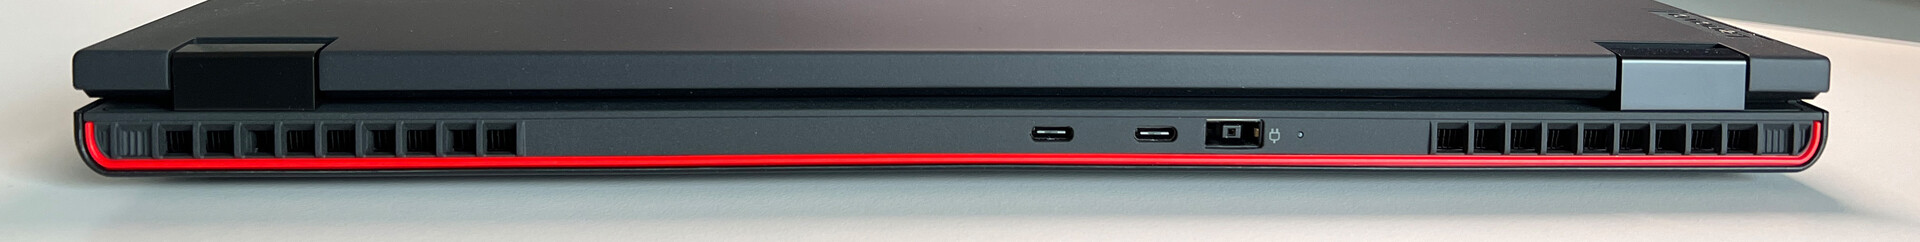
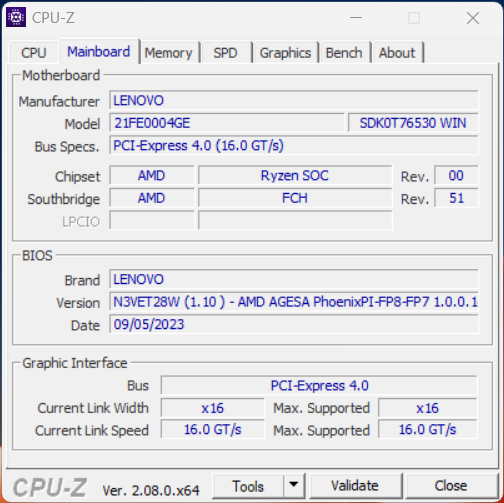
Specifications - AMD version with USB4
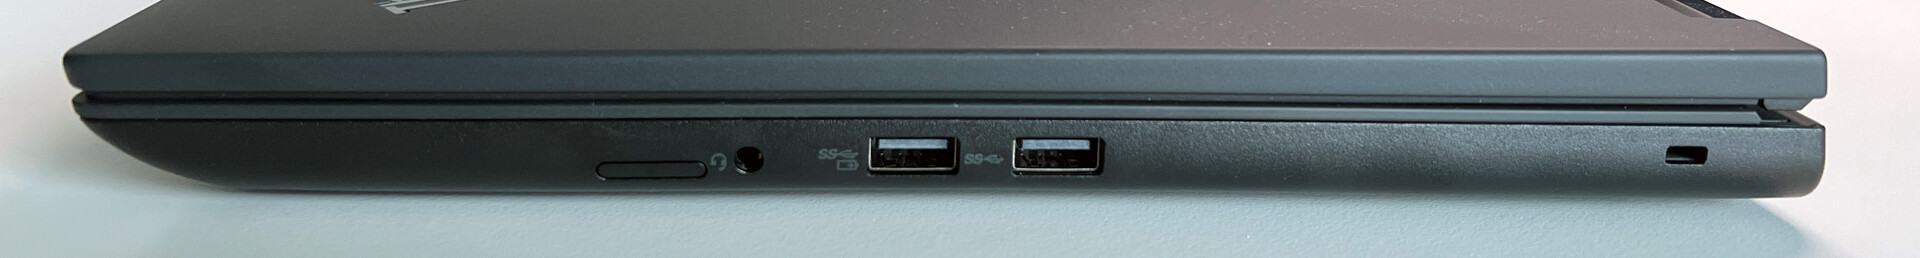
The AMD-based workstation features two modern USB-C ports with USB4 support, both of which are located on the back of the laptop. The interfaces are distributed across all three sides, though this arrangement isn’t ideal. We would rather have the HDMI output on the rear; it would've also been nice to have at least one USB port on the left. The ThinkPad P16v G1 can be equipped with an optional SmartCard reader. However, users will need to do without a dedicated Ethernet port, which can only be added using a USB-C adapter.
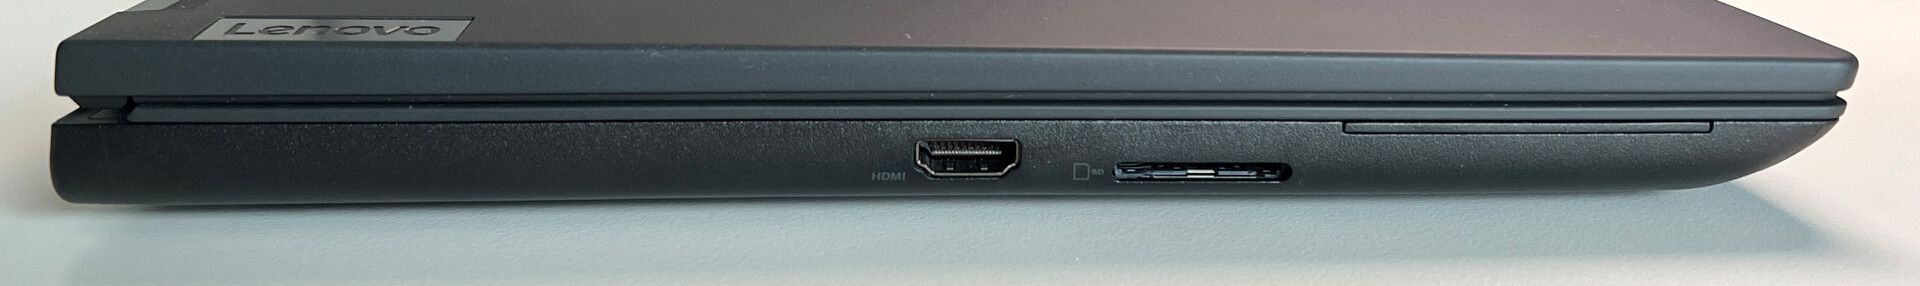
SD card reader
The SD card reader on the left has a spring-loaded mechanism. An SD card juts out very slightly when inserted. Using our reference card (Angelbird AV Pro V60), we managed to reach average transfer speeds in the region of 70-90 MB/s.
| SD Card Reader | |
| average JPG Copy Test (av. of 3 runs) | |
| Dell Precision 7670 (Toshiba Exceria Pro SDXC 64 GB UHS-II) | |
| Average of class Workstation (49.6 - 681, n=14, last 2 years) | |
| Lenovo ThinkPad P15v G3 21EM001AGE (AV Pro V60) | |
| Lenovo ThinkPad P1 G6-21FV000DGE (Angelbird AV Pro V60) | |
| Lenovo ThinkPad P16v G1 AMD (Angelbird AV Pro V60) | |
| Lenovo ThinkPad P16 G1 21D6001DMB (AV Pro V60) | |
| maximum AS SSD Seq Read Test (1GB) | |
| Average of class Workstation (87.6 - 1455, n=14, last 2 years) | |
| Lenovo ThinkPad P15v G3 21EM001AGE (AV Pro V60) | |
| Dell Precision 7670 (Toshiba Exceria Pro SDXC 64 GB UHS-II) | |
| Lenovo ThinkPad P16v G1 AMD (Angelbird AV Pro V60) | |
| Lenovo ThinkPad P1 G6-21FV000DGE (Angelbird AV Pro V60) | |
| Lenovo ThinkPad P16 G1 21D6001DMB (AV Pro V60) | |
Connectivity
The AMD ThinkPad is fitted with a Qualcomm Wi-Fi 6E module (WCN685x) that supports the current Wi-Fi 6 standard as well as Bluetooth 5.2. It delivered very high and stable transfer speeds when connected to our Asus reference router.
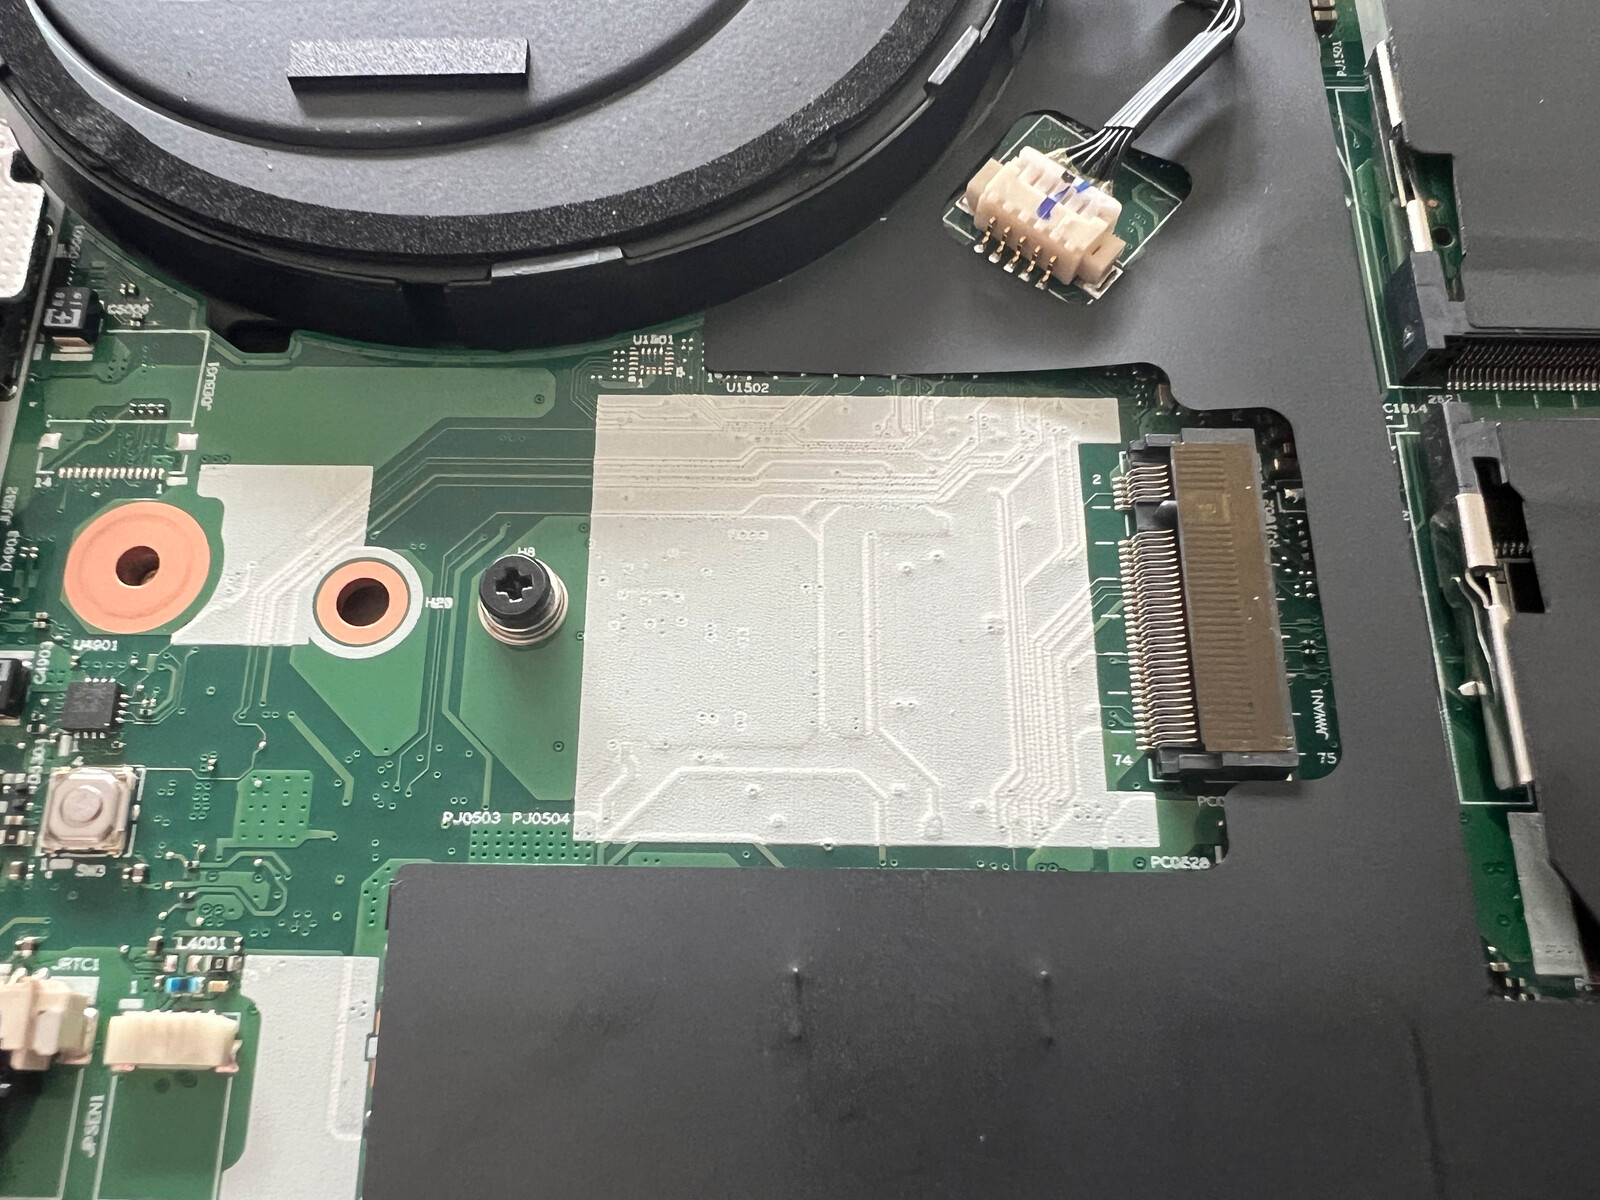
The ThinkPad P16v G1 can also be configured with a WWAN module (4G LTE) before ordering, but this can’t be added later on because neither the SIM card reader nor the required antennas are installed as standard.
| Networking | |
| Lenovo ThinkPad P16v G1 AMD | |
| iperf3 transmit AXE11000 | |
| iperf3 receive AXE11000 | |
| HP ZBook Power 15 G10 | |
| iperf3 transmit AXE11000 | |
| iperf3 receive AXE11000 | |
| iperf3 transmit AXE11000 6GHz | |
| iperf3 receive AXE11000 6GHz | |
| Lenovo ThinkPad P15v G3 21EM001AGE | |
| iperf3 transmit AXE11000 | |
| iperf3 receive AXE11000 | |
| iperf3 transmit AXE11000 6GHz | |
| iperf3 receive AXE11000 6GHz | |
| Dell Precision 7670 | |
| iperf3 transmit AXE11000 6GHz | |
| iperf3 receive AXE11000 6GHz | |
| Lenovo ThinkPad P1 G6-21FV000DGE | |
| iperf3 transmit AXE11000 | |
| iperf3 receive AXE11000 | |
| Lenovo ThinkPad P16 G1 21D6001DMB | |
| iperf3 transmit AXE11000 | |
| iperf3 receive AXE11000 | |
Webcam
Though Lenovo has installed a 5MP webcam, the image quality isn’t particularly great. Even under good lighting conditions, images look hardly any better than those taken by 1080p webcams. There is also an IR camera on board for Windows Hello facial recognition.


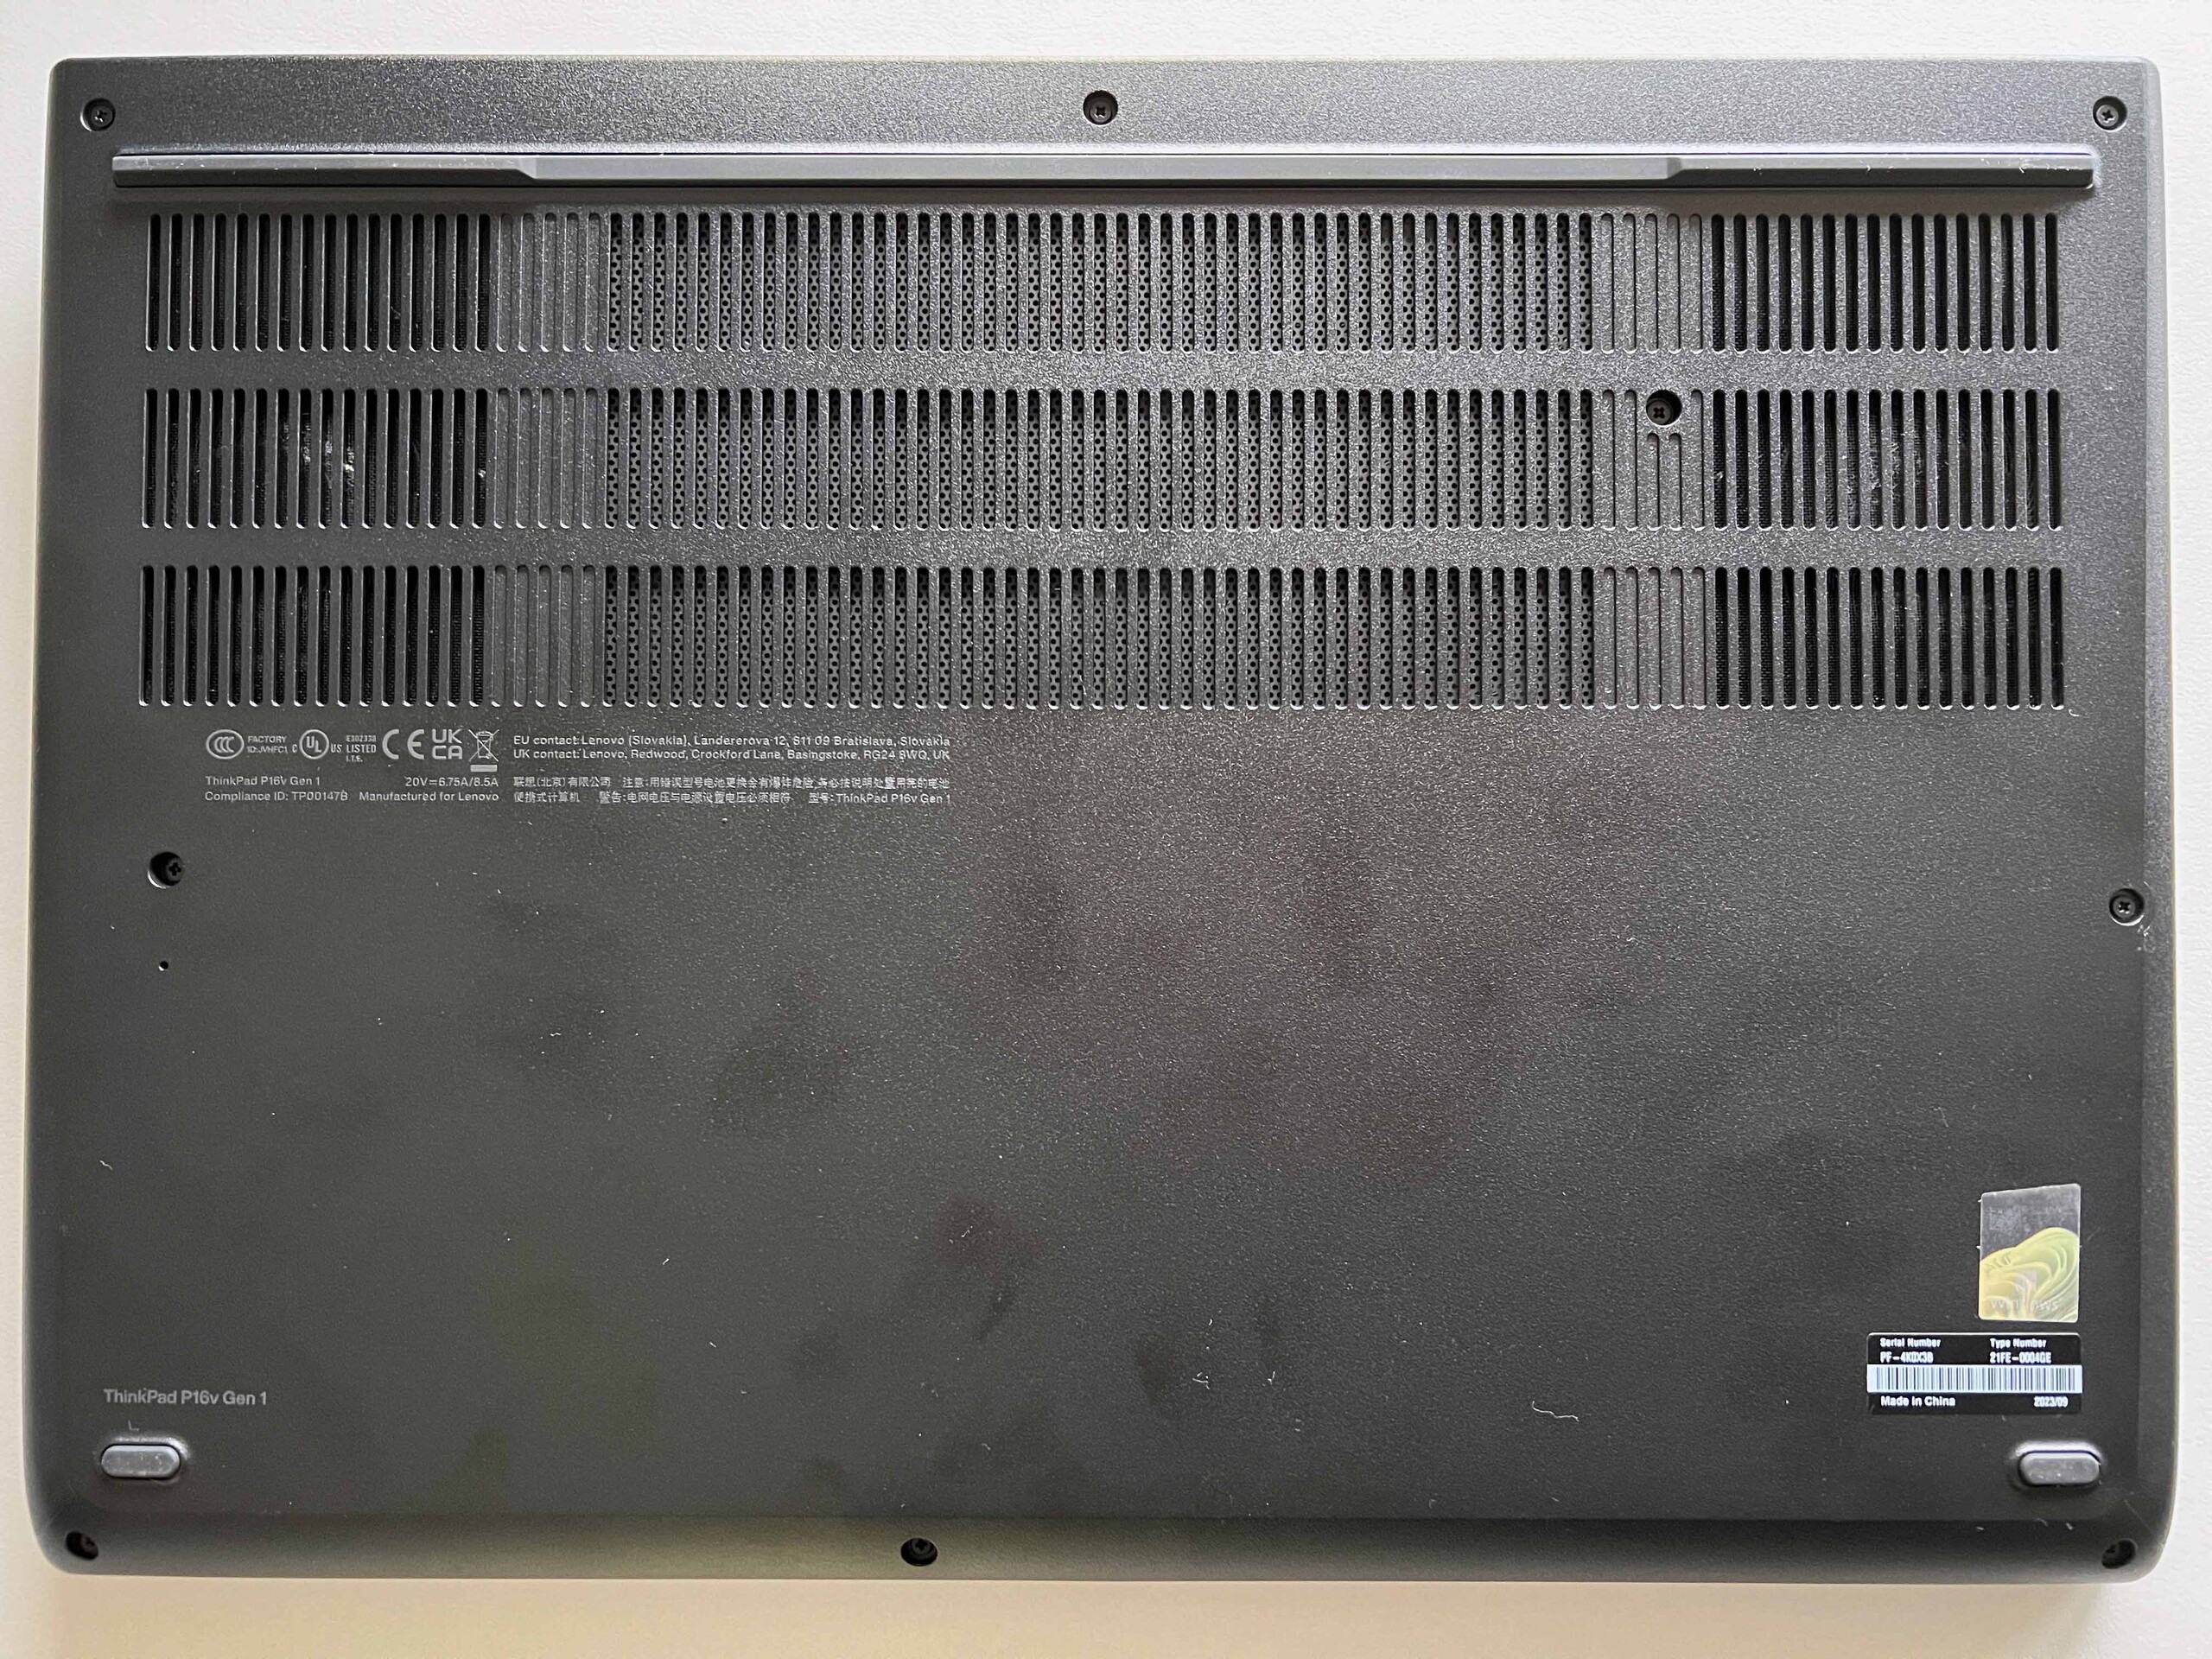
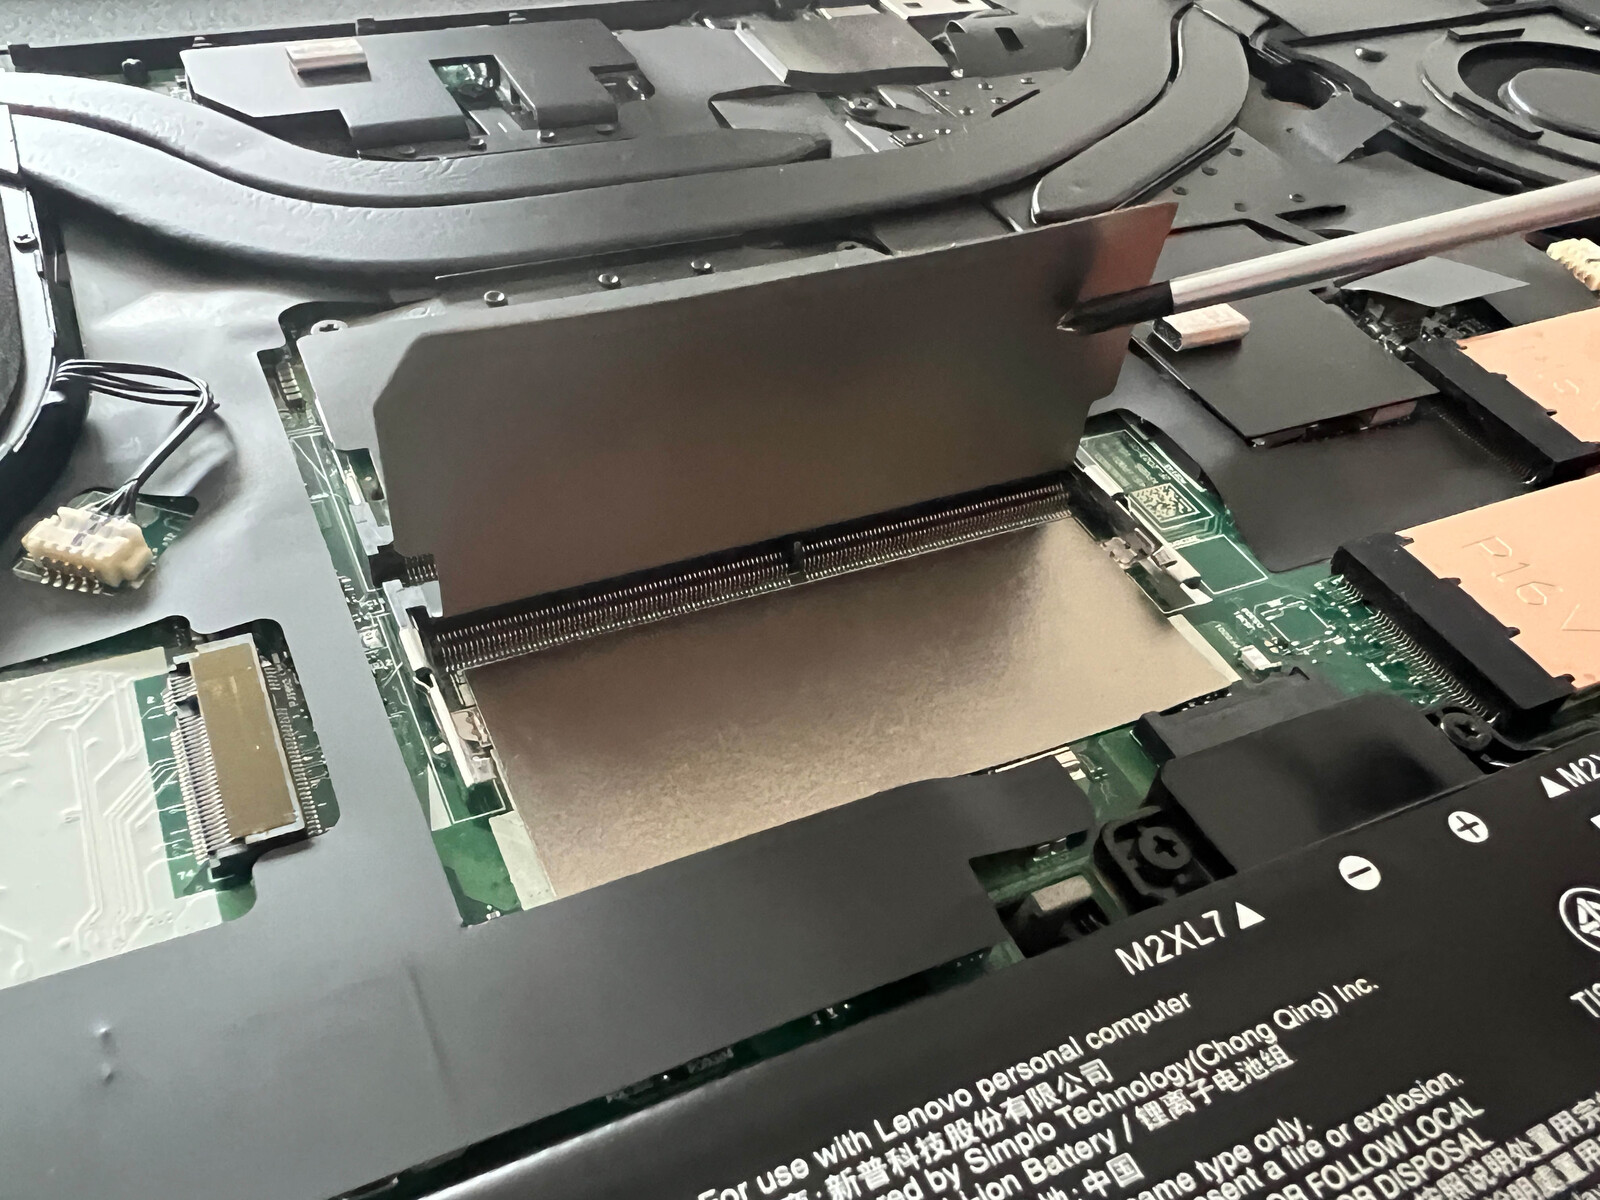
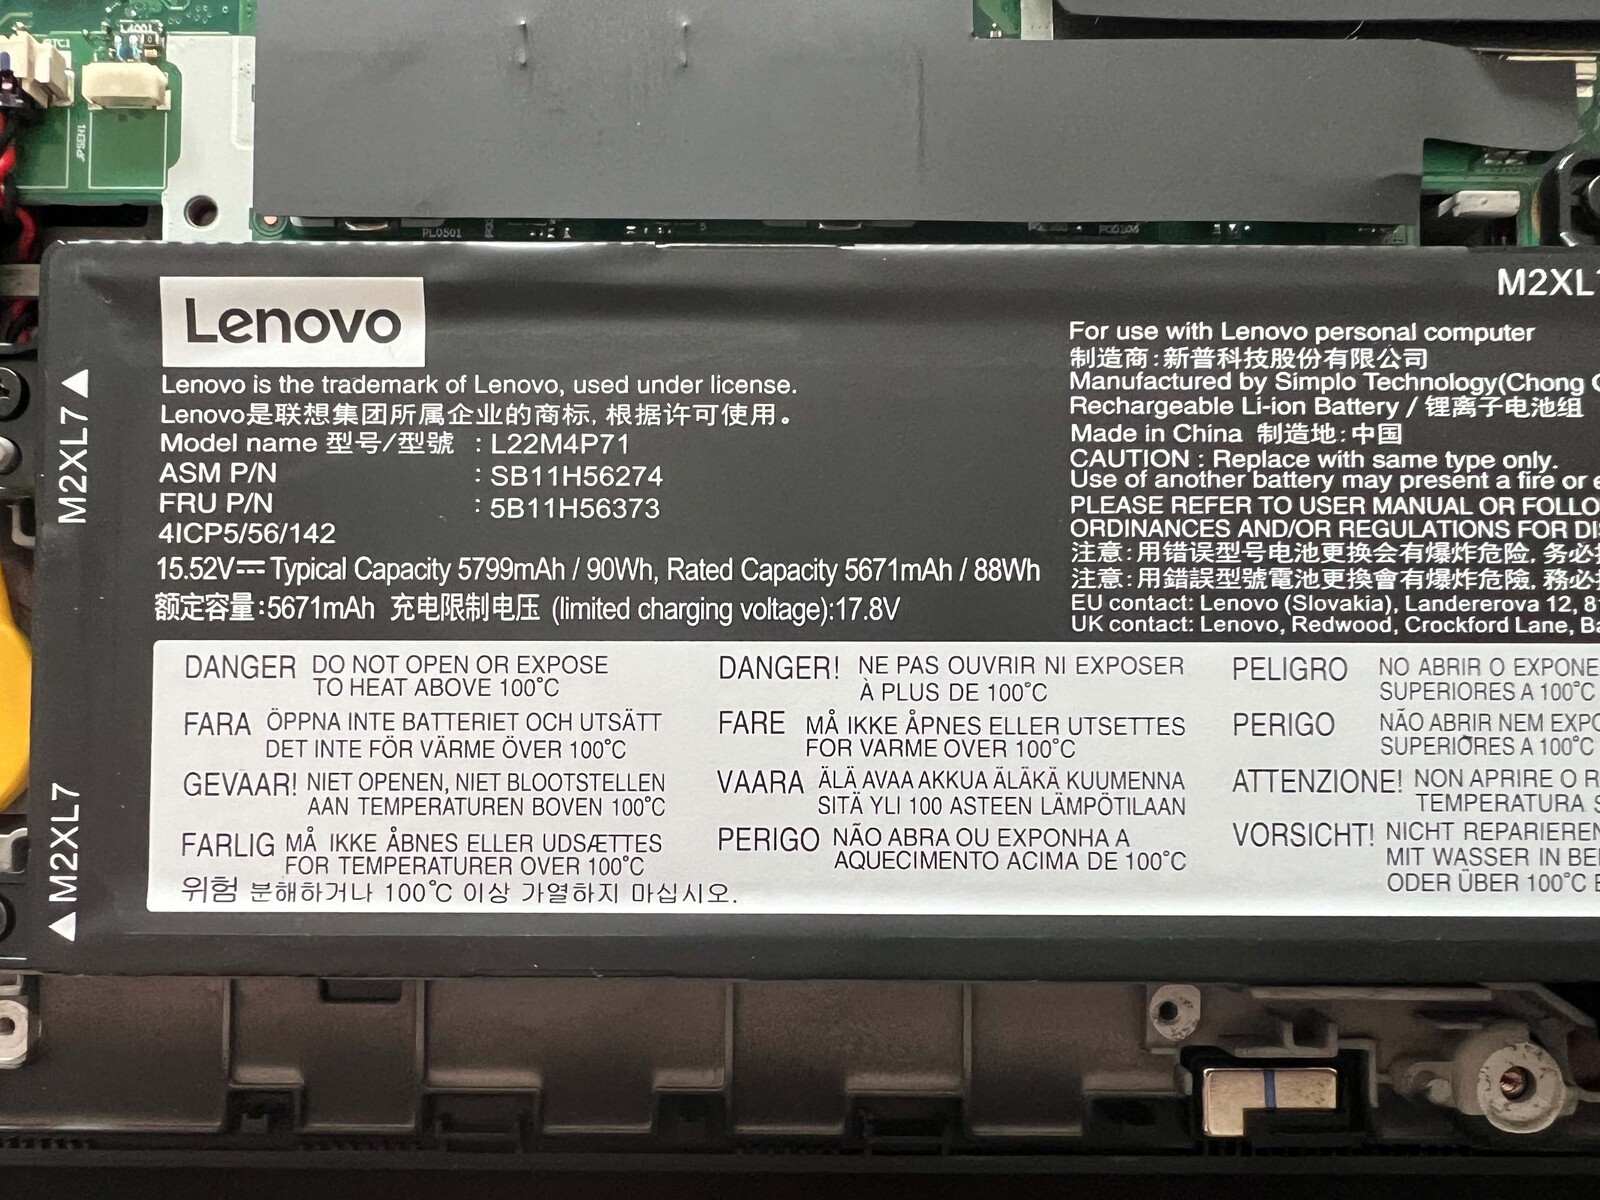
Maintenance
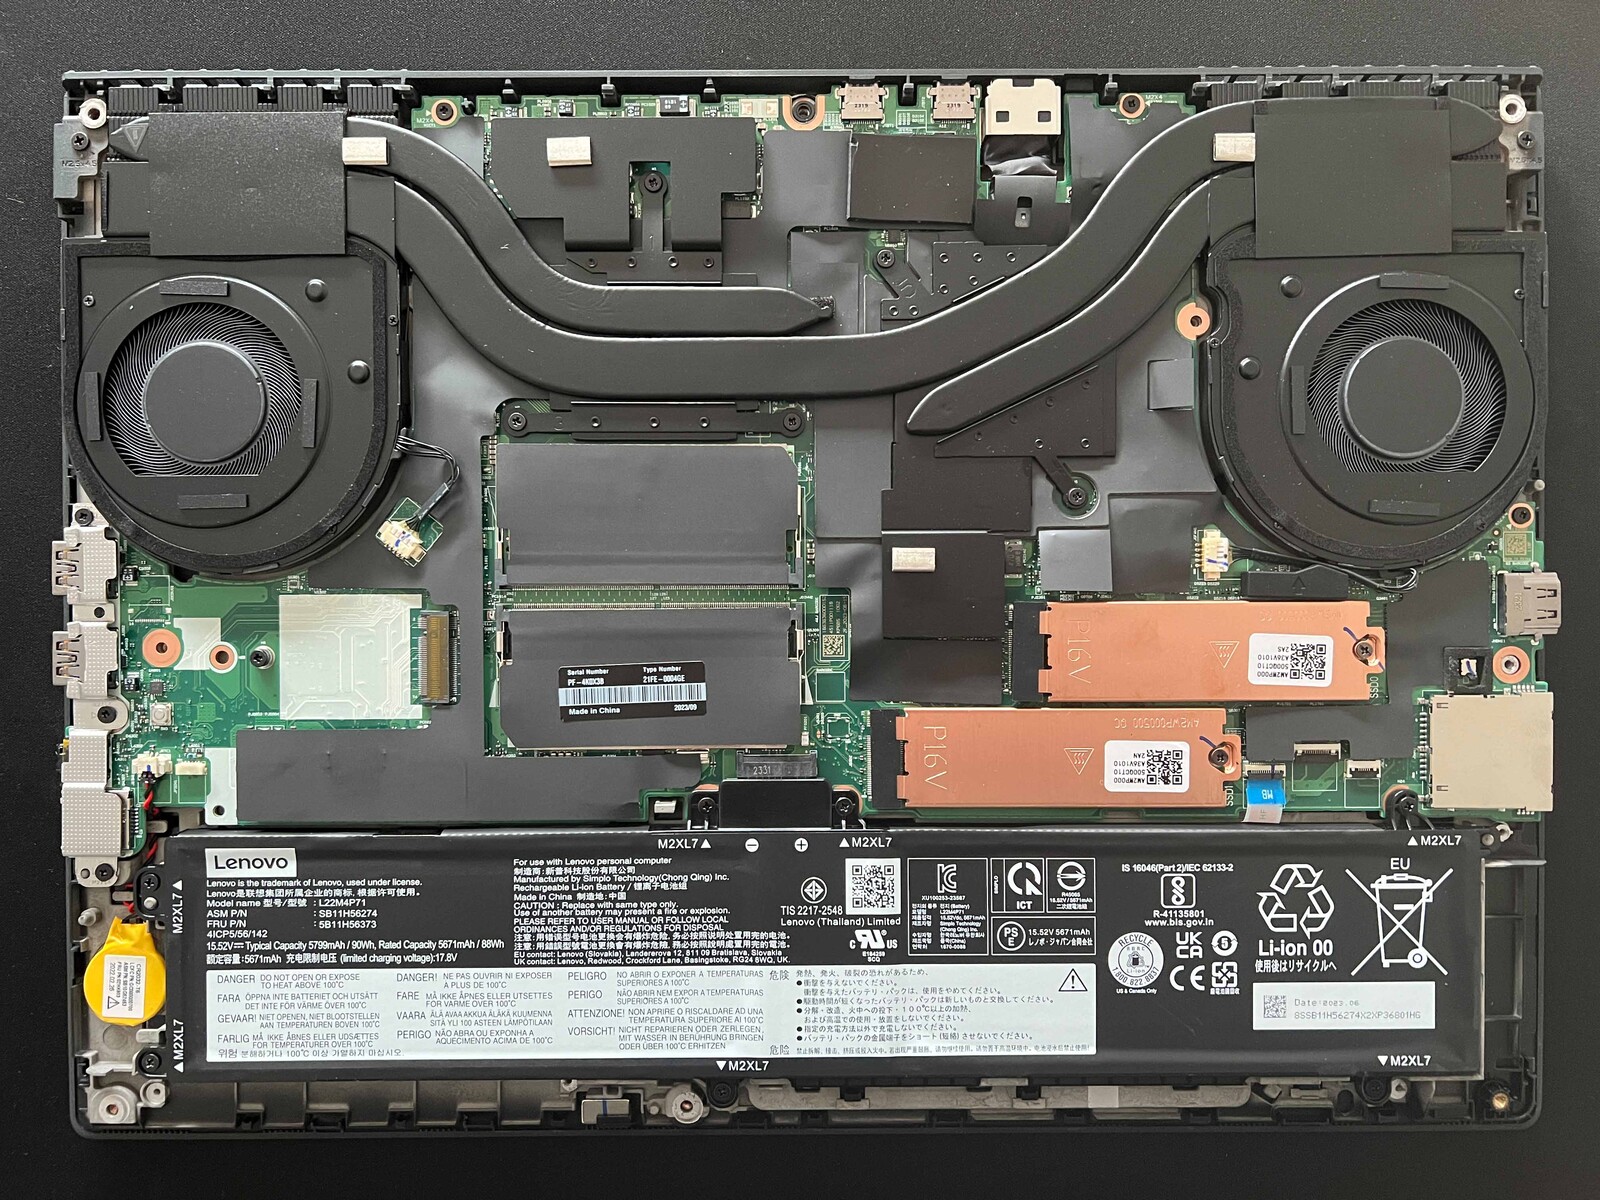
The bottom case is secured in place with a few Phillips screws and can be removed completely. Serviceability is good as a whole. Apart from the two SO-DIMM slots for RAM, there are two slots for M.2 2280 SSDs. The fans are easy enough to clean, and the battery is only screwed down. However, the wireless module is soldered on and can’t be replaced.
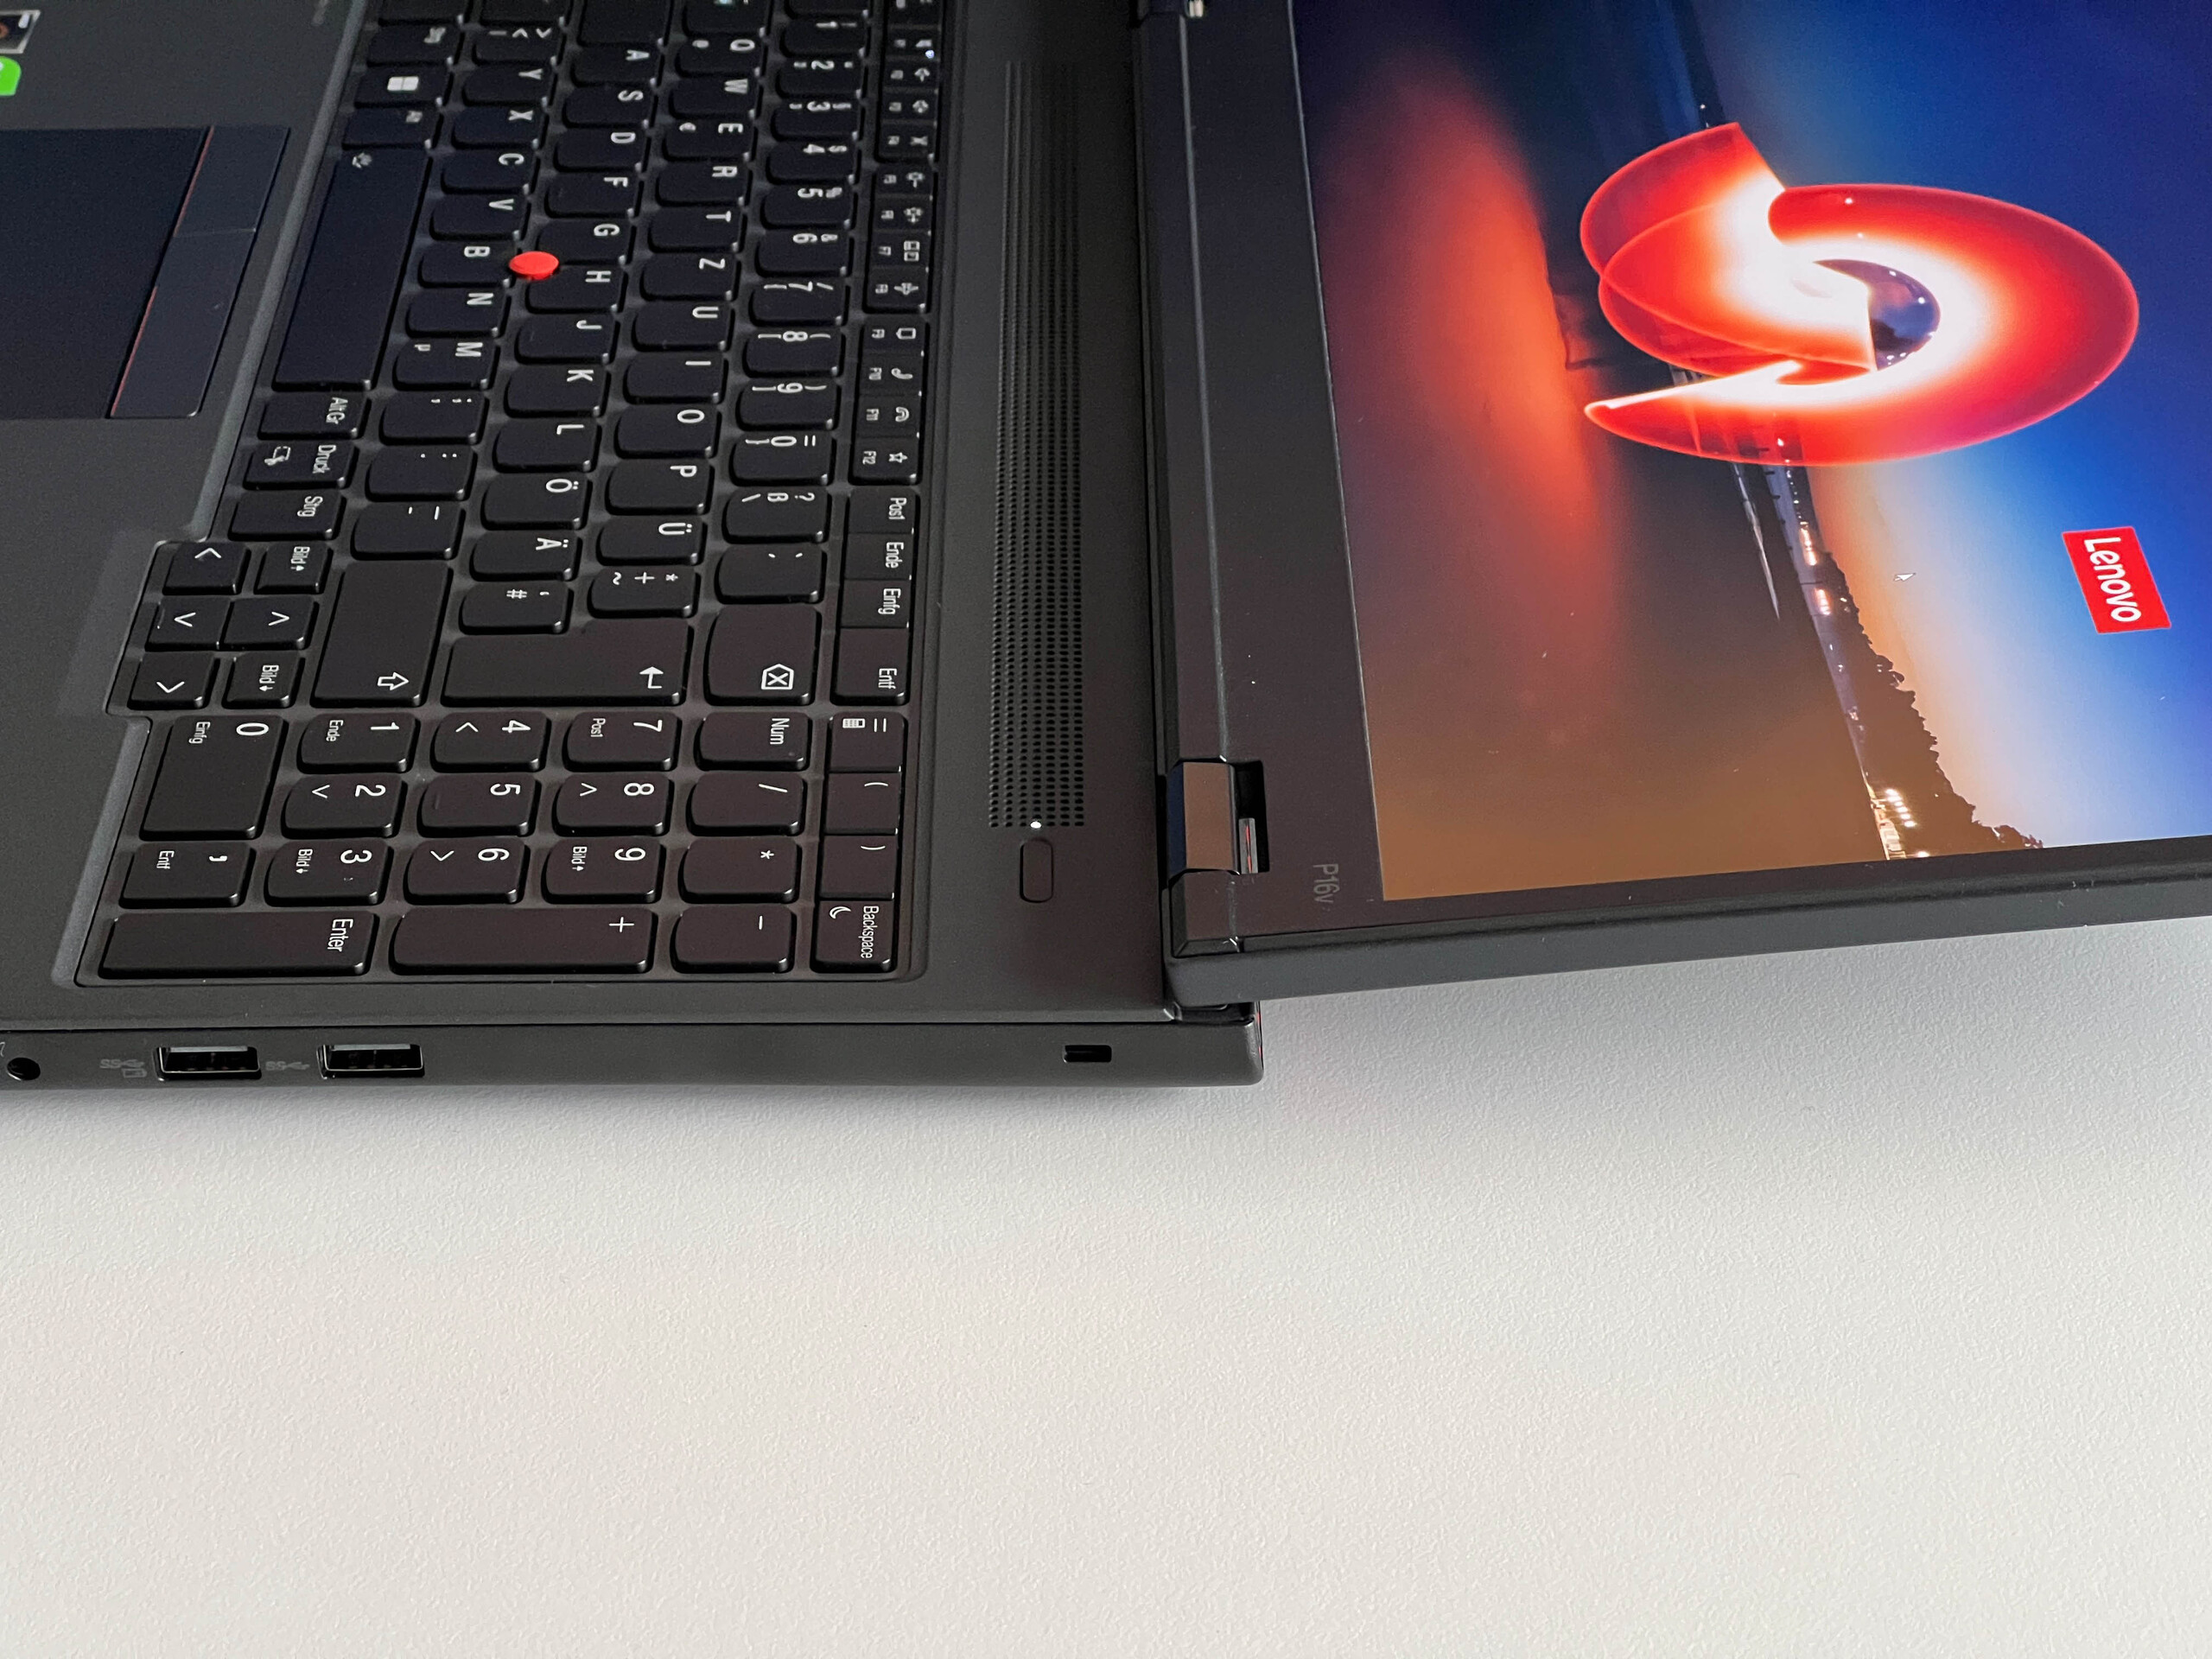
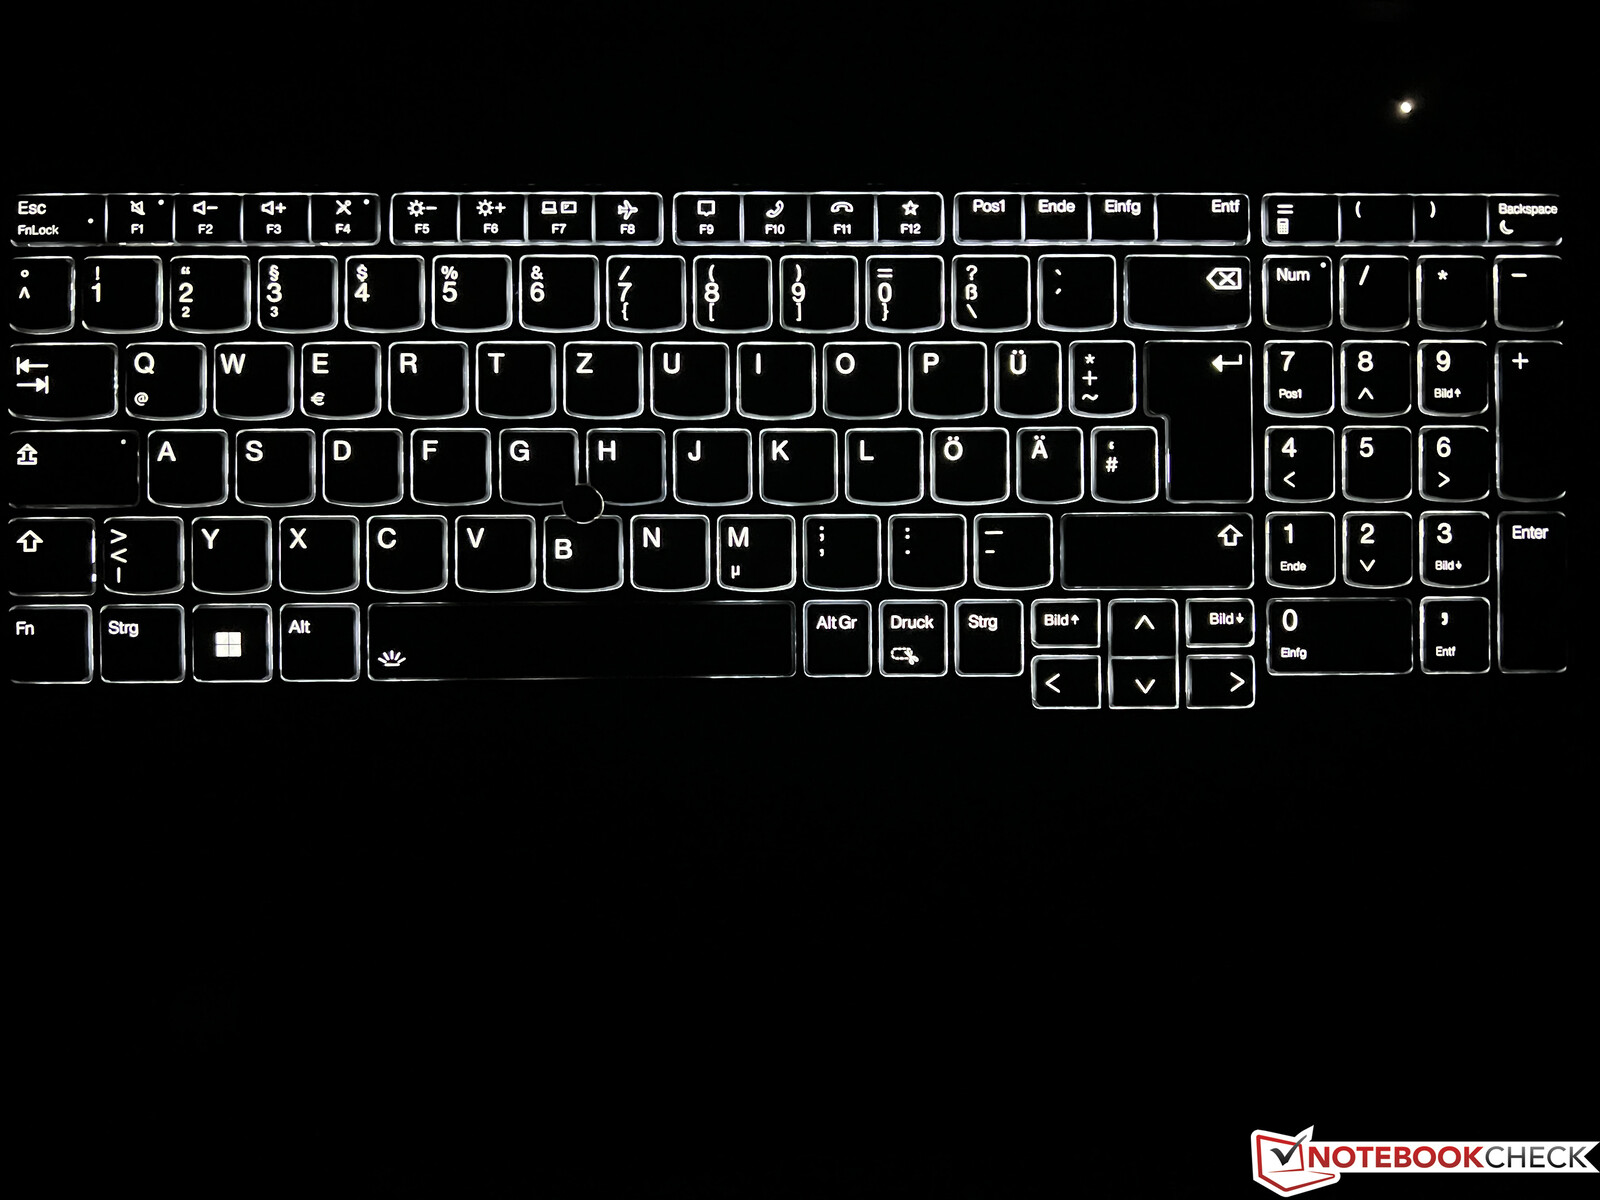
Input devices - 1.5 mm travel and number pad
The input devices on the P16v G1 are similar to those on the regular P16 when it comes to layout and mechanism, apart from the fact that the P16v’s keyboard is black rather than dark grey. The key travel measures roughly 1.5 mm and is thus in line with the current ThinkPad standard. That said, it is a shame that Lenovo has stopped using the much superior keyboards with 1.8 mm travel even on large workstations. Overall, the keyboard is by no means awful, but ultimately the P16v G1 no longer has any edge over competing devices like the HP ZBook Power G10 in this regard. The ThinkPad’s keyboard has a white backlight with two brightness levels; the power button (top right) also serves as a fingerprint scanner.
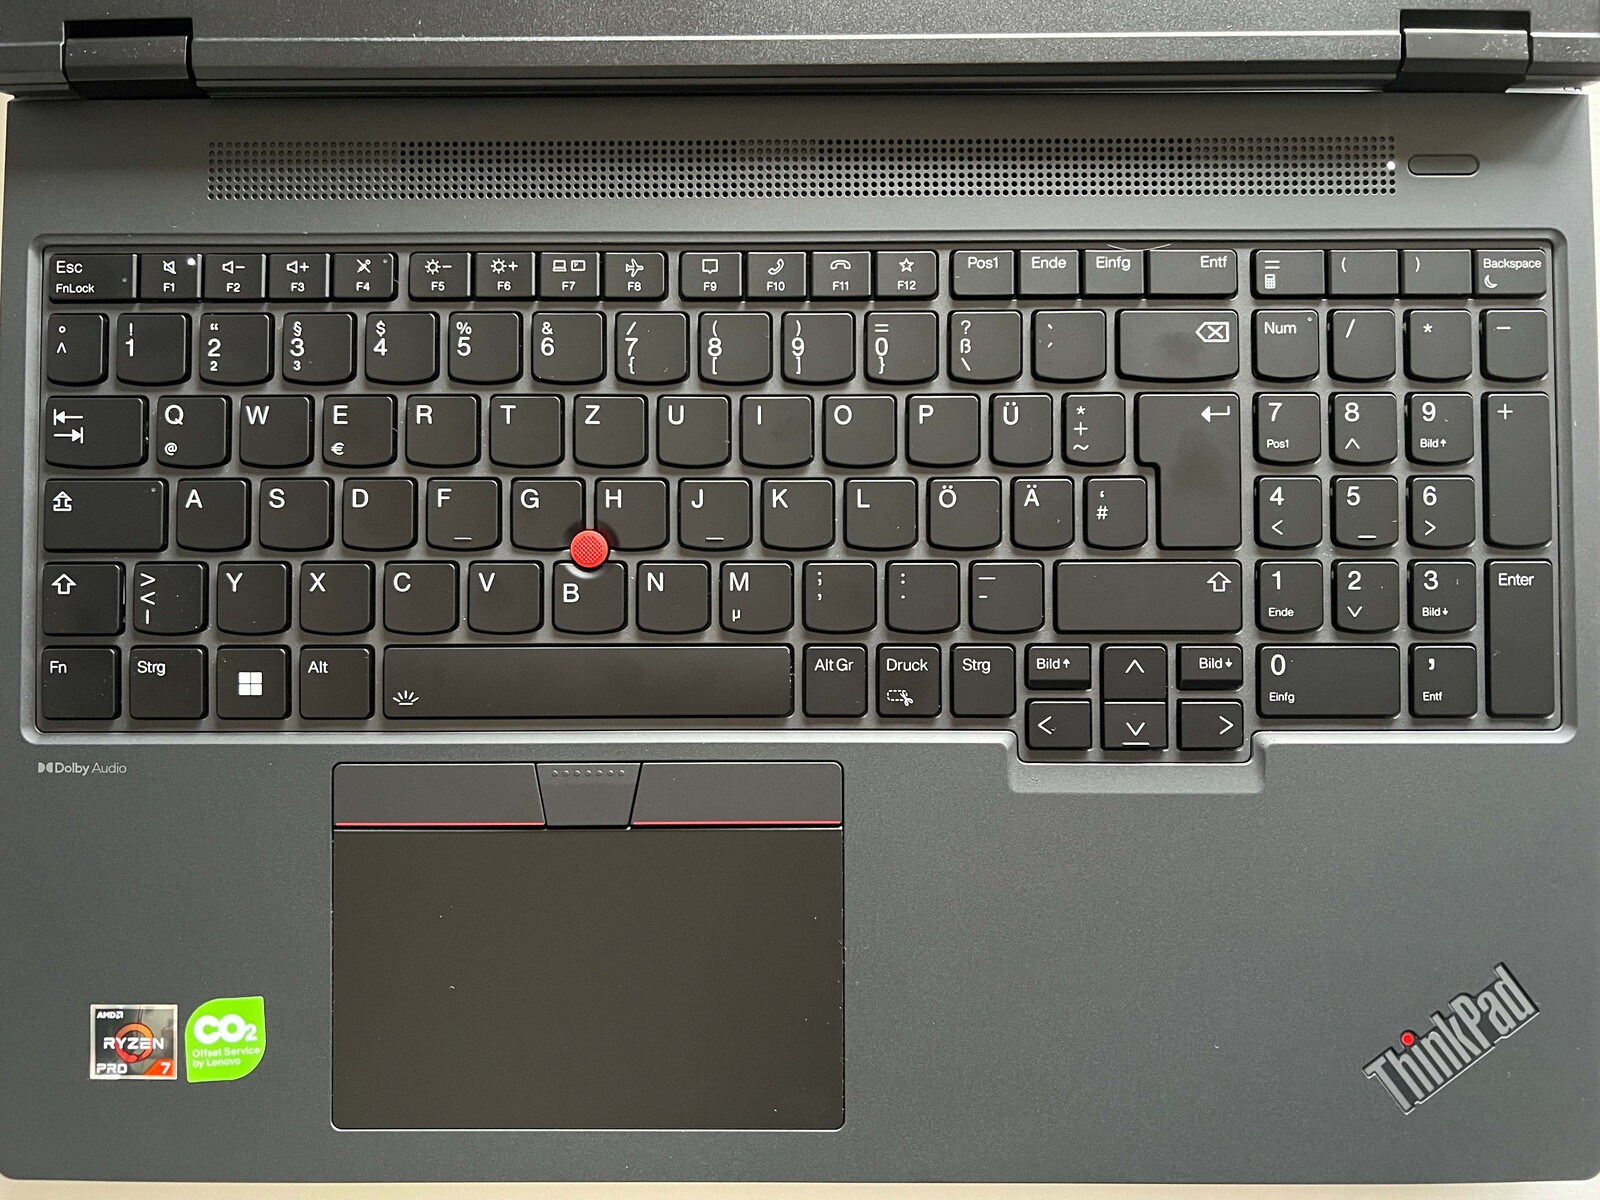
Users can move the mouse pointer around using either the ClickPad or TrackPoint. The ClickPad is offset slightly to the left and offers enough space for inputs (11.5 x 6.8 cm, or 4.5 x 2.7 in), but expectedly some space has been set aside for the dedicated TrackPoint buttons. The pad itself works fine and didn’t give us any problems, though the clicking sounds are kind of loud. This is also true of the previously mentioned TrackPoint buttons, which came across as very cheap. But the TrackPoint itself works perfectly well once you get used to it.
Display - Matt IPS panel

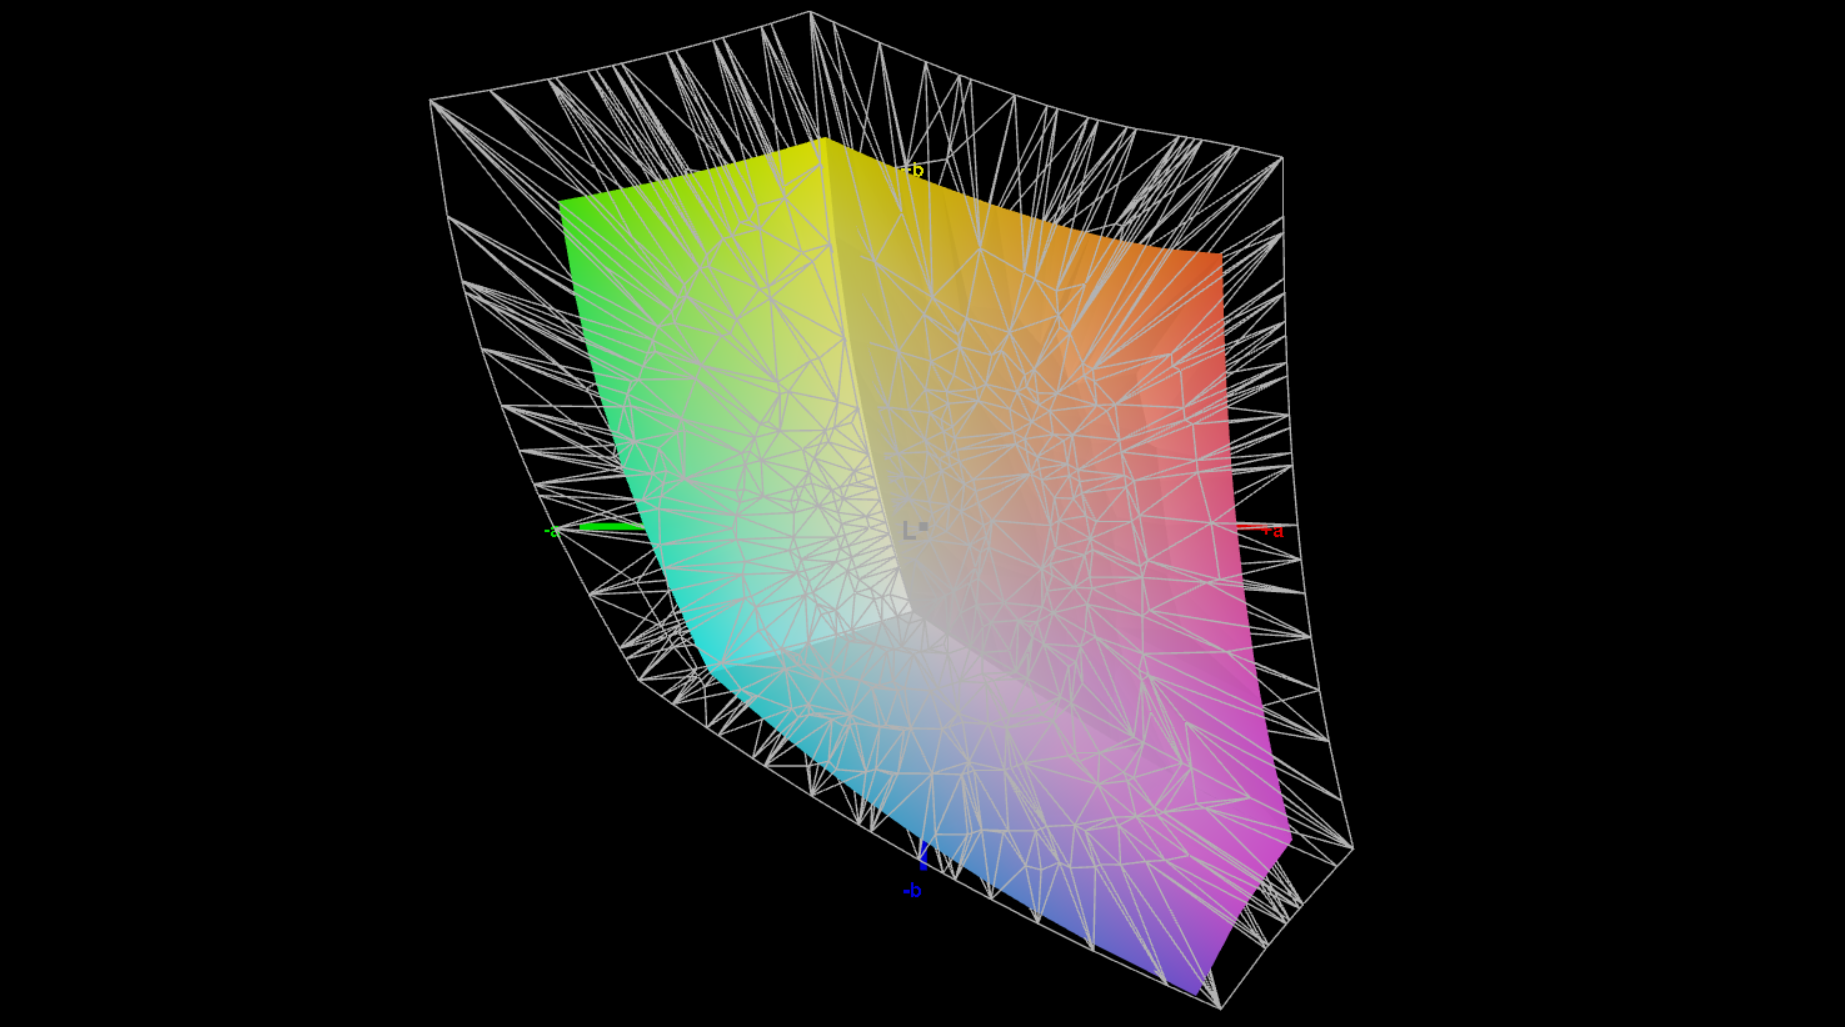
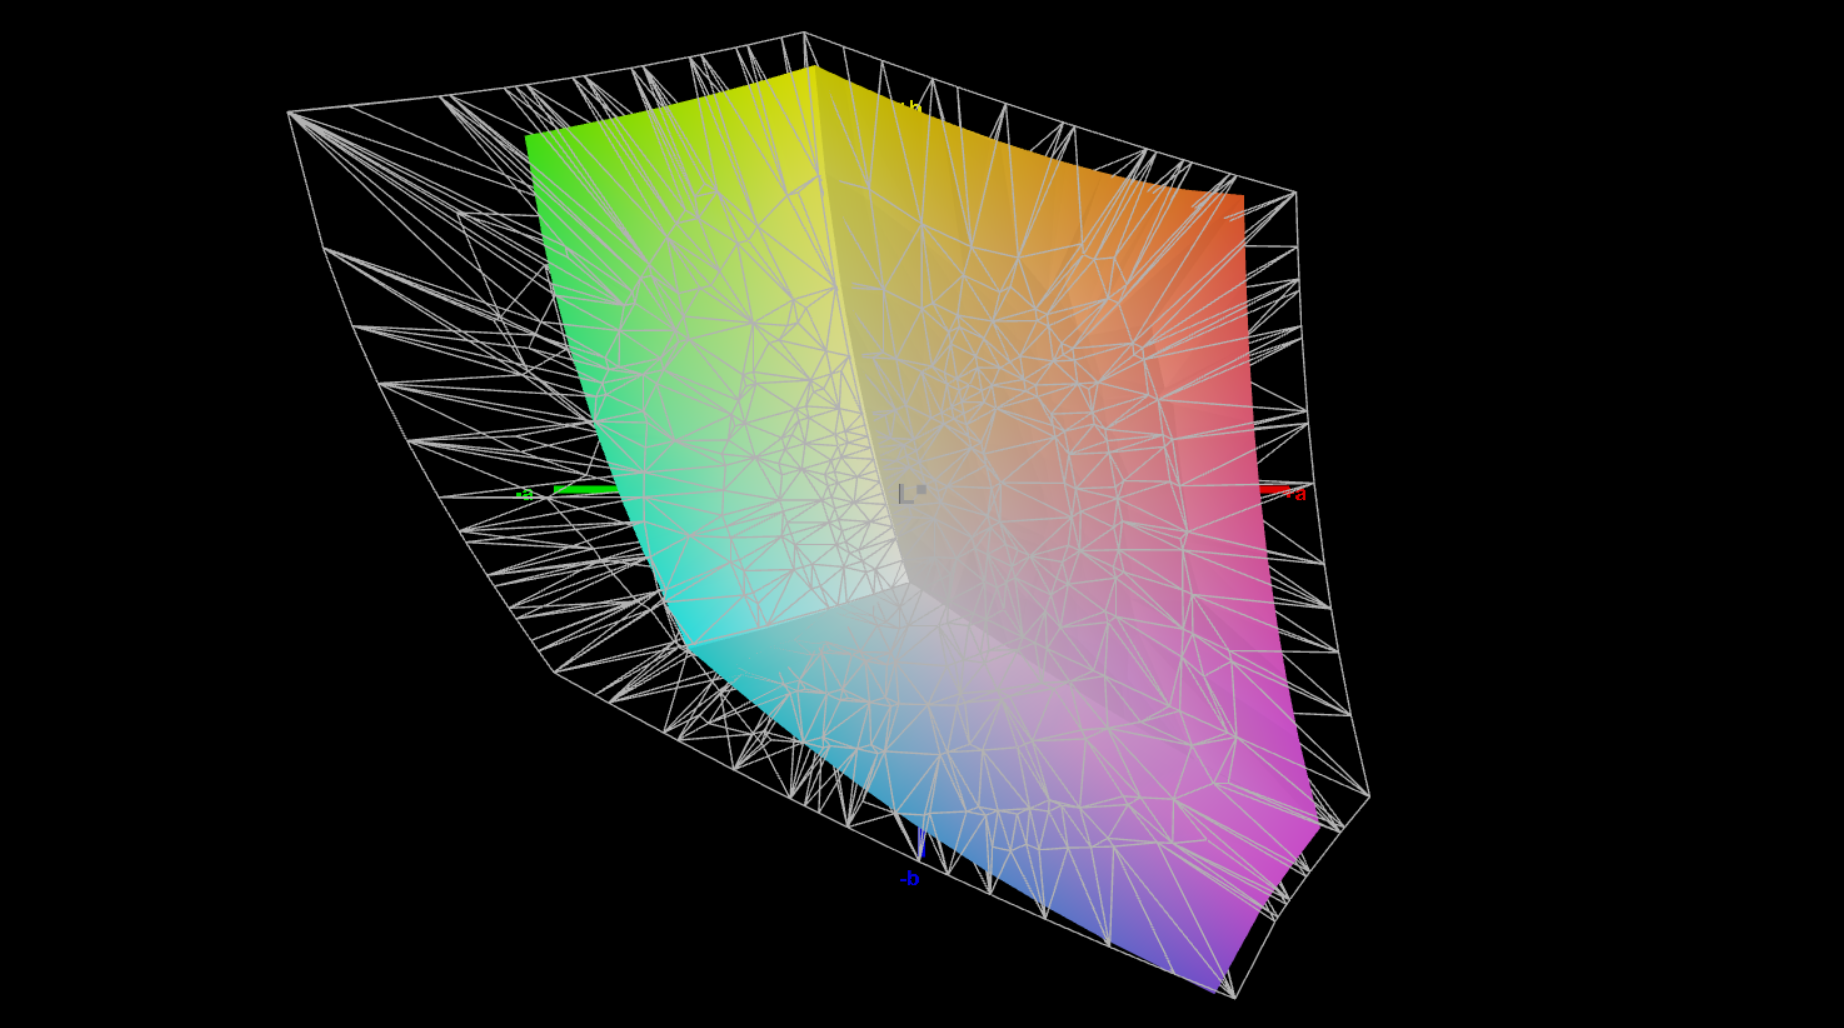
Lenovo offers a total of four display options for the ThinkPad P16v G1. By default, the laptop comes with a matt IPS panel with a resolution of 1,920 x 1,200, a peak brightness of 300 nits and 45% NTSC coverage. You also have the option to get this display with touchscreen capability. Our review unit is fitted with the optional Full HD model with 100% sRGB coverage. There is also a 4K panel option with 800 nits peak brightness, full DCI-P3 coverage, factory calibration and HDR support.
The 60Hz panel on our review unit is made by BOE and offers respectable image quality to our eyes. Colours are adequately vibrant and contents look sharp enough on the 16-inch screen. Bright areas also don’t appear grainy. However, response times are somewhat slow, and you’ll also notice minor monitor ghosting in everyday use, for example when moving the mouse cursor. The panel doesn’t use PWM and exhibits only minimal backlight bleed at full brightness and on a dark background.
Our review unit managed to hit an average peak brightness slightly above 340 cd/m², thus exceeding the advertised brightness of 300 cd/m². This, together with the low black level, results in a superb max contrast ratio upwards of 2,000:1.
| |||||||||||||||||||||||||
Brightness Distribution: 92 %
Center on Battery: 354 cd/m²
Contrast: 2088:1 (Black: 0.17 cd/m²)
ΔE ColorChecker Calman: 2.9 | ∀{0.5-29.43 Ø4.73}
calibrated: 1
ΔE Greyscale Calman: 4.7 | ∀{0.09-98 Ø4.97}
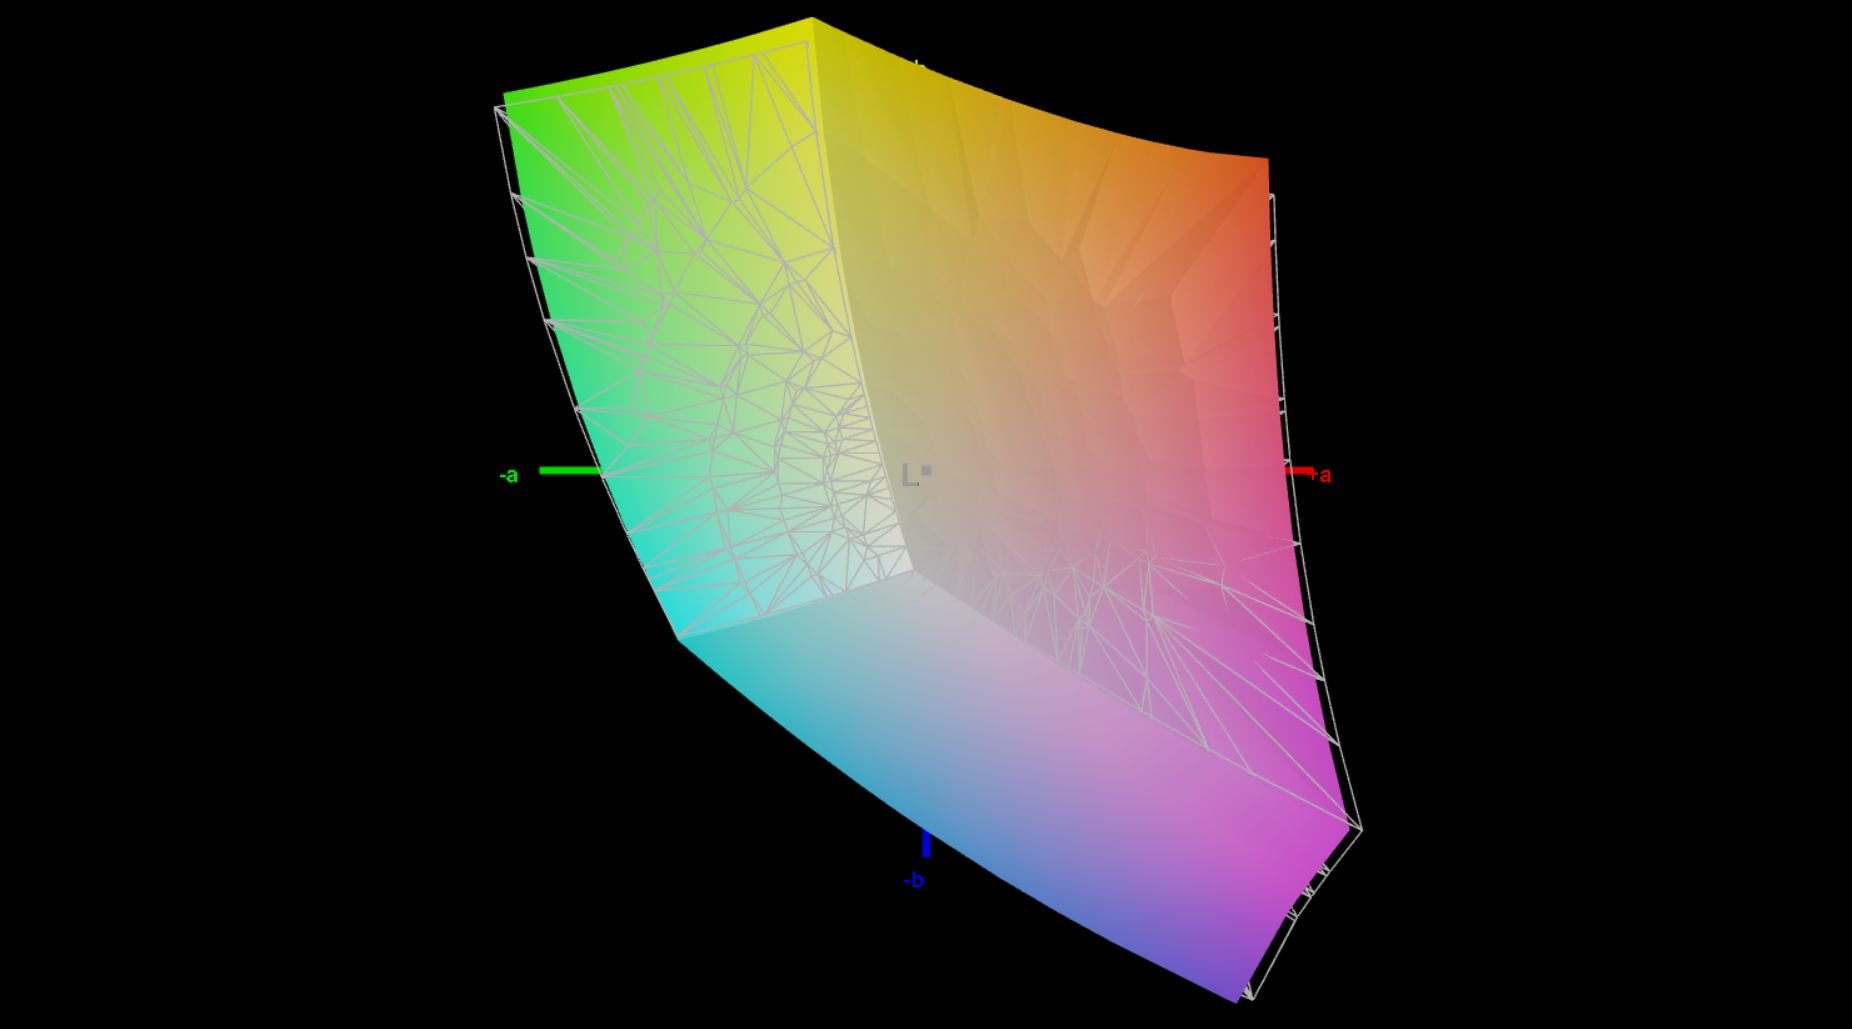
69.8% AdobeRGB 1998 (Argyll 3D)
97.7% sRGB (Argyll 3D)
67.8% Display P3 (Argyll 3D)
Gamma: 2.12
CCT: 6356 K
| Lenovo ThinkPad P16v G1 AMD NE160WUM-N64, IPS, 1920x1200, 16" | HP ZBook Power 15 G10 BOE0B6A, IPS, 2560x1440, 15.6" | Lenovo ThinkPad P15v G3 21EM001AGE NE156QUM-N6C, IPS LED, 3840x2160, 15.6" | Dell Precision 7670 Samsung 160YV03, OLED, 3840x2400, 16" | Lenovo ThinkPad P1 G6-21FV000DGE NE160QDM-NY1, IPS, 2560x1600, 16" | Lenovo ThinkPad P16 G1 21D6001DMB NE160QDM-N63 , IPS LED, 2560x1600, 16" | |
|---|---|---|---|---|---|---|
| Display | 0% | 26% | 30% | 0% | 4% | |
| Display P3 Coverage (%) | 67.8 | 68.2 1% | 89.9 33% | 99.9 47% | 68.1 0% | 71.5 5% |
| sRGB Coverage (%) | 97.7 | 95.6 -2% | 100 2% | 100 2% | 97.5 0% | 100 2% |
| AdobeRGB 1998 Coverage (%) | 69.8 | 70.5 1% | 99.9 43% | 97.5 40% | 70.2 1% | 73.3 5% |
| Response Times | 67% | 2% | 94% | 68% | 12% | |
| Response Time Grey 50% / Grey 80% * (ms) | 50.6 ? | 13 ? 74% | 46.7 ? 8% | 1.9 ? 96% | 13.7 ? 73% | 37.7 ? 25% |
| Response Time Black / White * (ms) | 26 ? | 10.4 ? 60% | 27.3 ? -5% | 2 ? 92% | 9.6 ? 63% | 26.3 ? -1% |
| PWM Frequency (Hz) | 59.5 ? | |||||
| Screen | -21% | -20% | -1% | 14% | 4% | |
| Brightness middle (cd/m²) | 355 | 313.8 -12% | 588 66% | 340.1 -4% | 521 47% | 424 19% |
| Brightness (cd/m²) | 344 | 302 -12% | 536 56% | 342 -1% | 484 41% | 398 16% |
| Brightness Distribution (%) | 92 | 83 -10% | 83 -10% | 98 7% | 89 -3% | 90 -2% |
| Black Level * (cd/m²) | 0.17 | 0.29 -71% | 0.38 -124% | 0.36 -112% | 0.24 -41% | |
| Contrast (:1) | 2088 | 1082 -48% | 1547 -26% | 1447 -31% | 1767 -15% | |
| Colorchecker dE 2000 * | 2.9 | 3.27 -13% | 3.9 -34% | 2.5 14% | 1.2 59% | 2.6 10% |
| Colorchecker dE 2000 max. * | 5.6 | 7.81 -39% | 8.8 -57% | 8.19 -46% | 2.5 55% | 4.9 12% |
| Colorchecker dE 2000 calibrated * | 1 | 0.56 44% | 1 -0% | 1 -0% | 0.8 20% | |
| Greyscale dE 2000 * | 4.7 | 5.9 -26% | 7.1 -51% | 3.5 26% | 1.4 70% | 4.1 13% |
| Gamma | 2.12 104% | 2.18 101% | 2.12 104% | 2.12 104% | 2.25 98% | 2.13 103% |
| CCT | 6356 102% | 6323 103% | 7268 89% | 6704 97% | 6682 97% | 7252 90% |
| Total Average (Program / Settings) | 15% /
-4% | 3% /
-7% | 41% /
25% | 27% /
19% | 7% /
5% |
* ... smaller is better
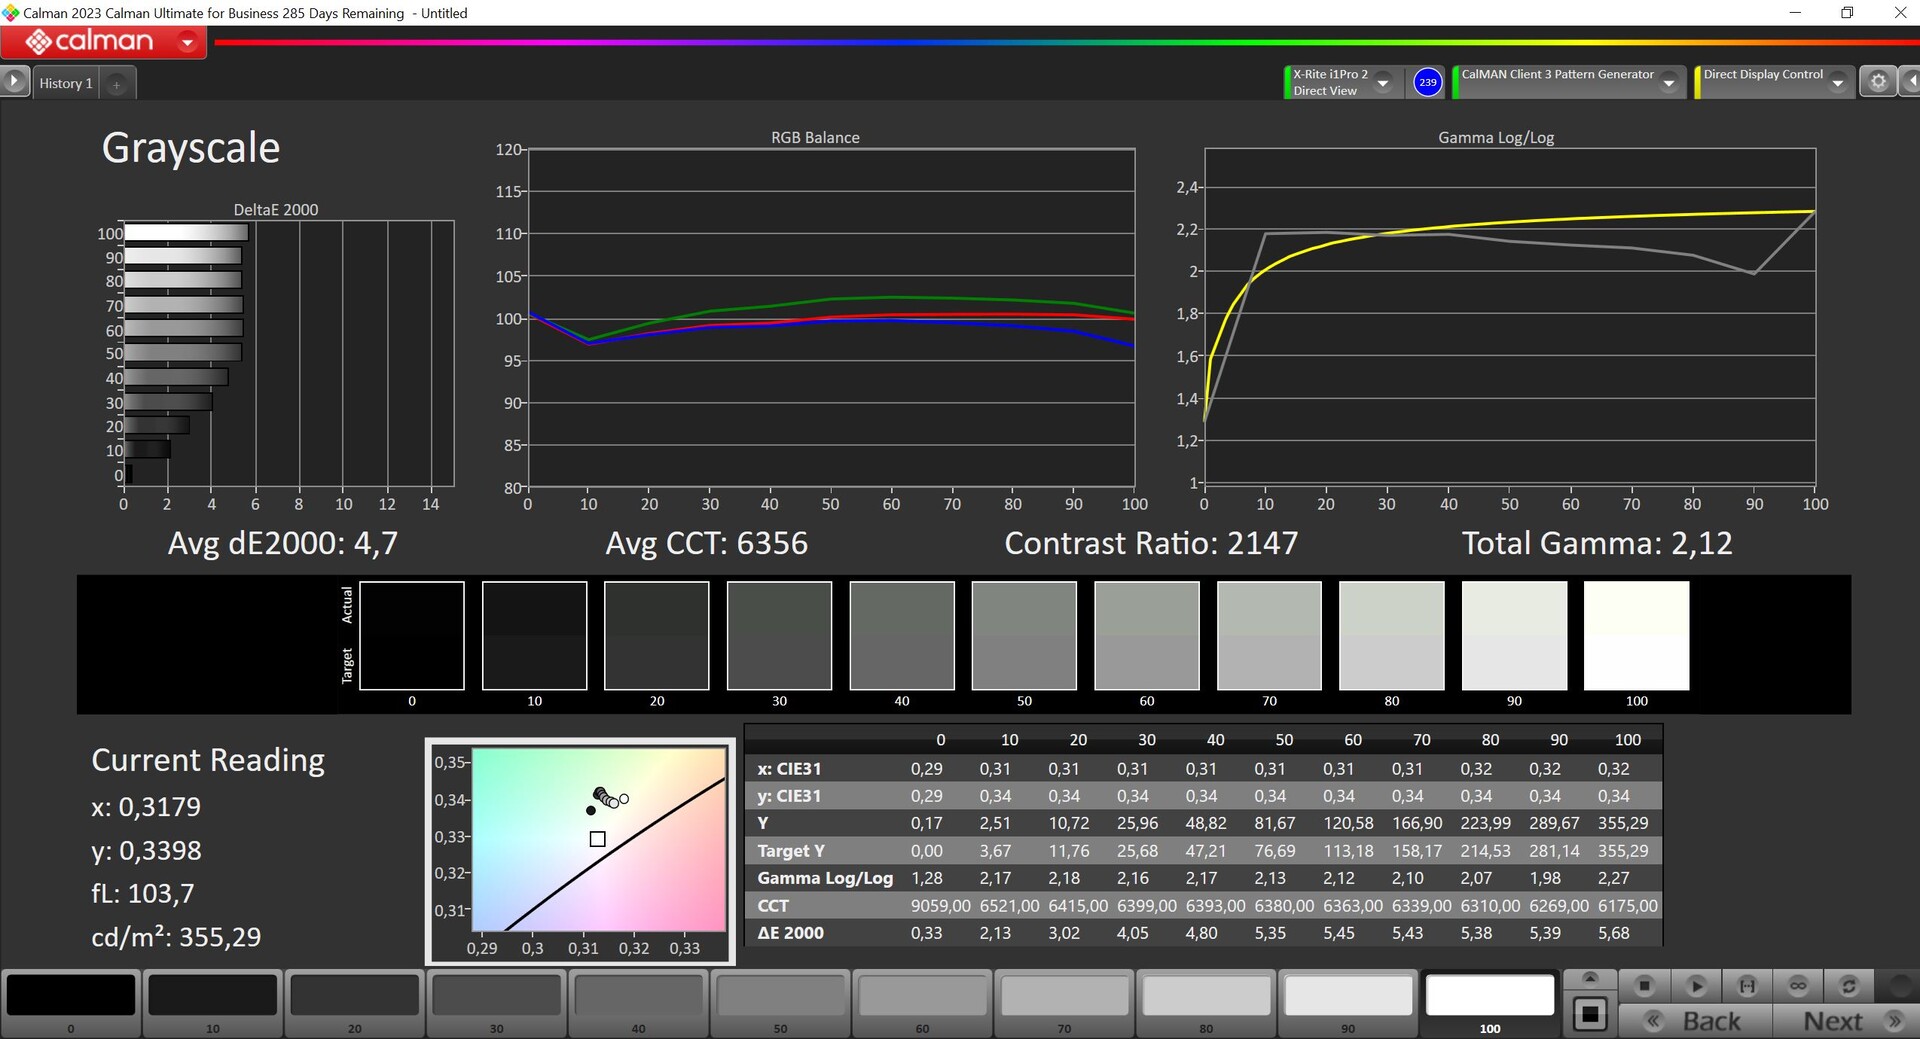
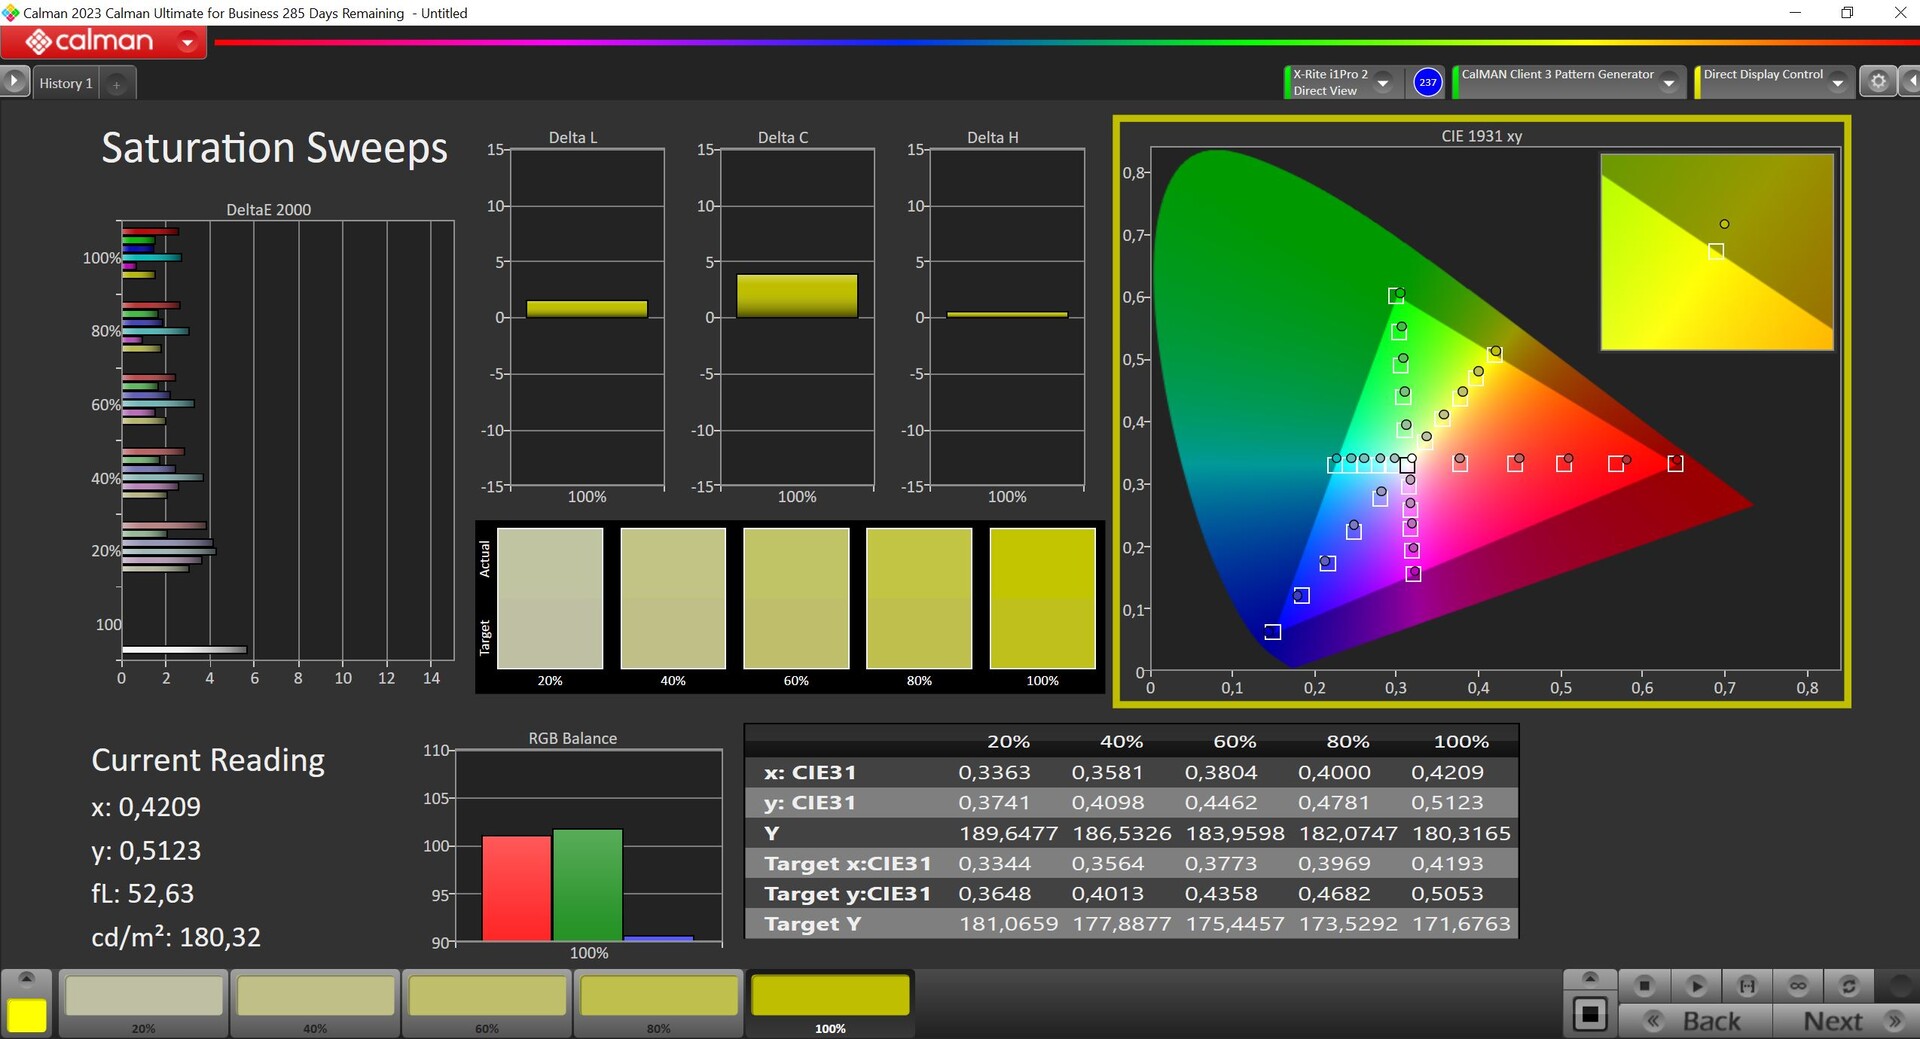
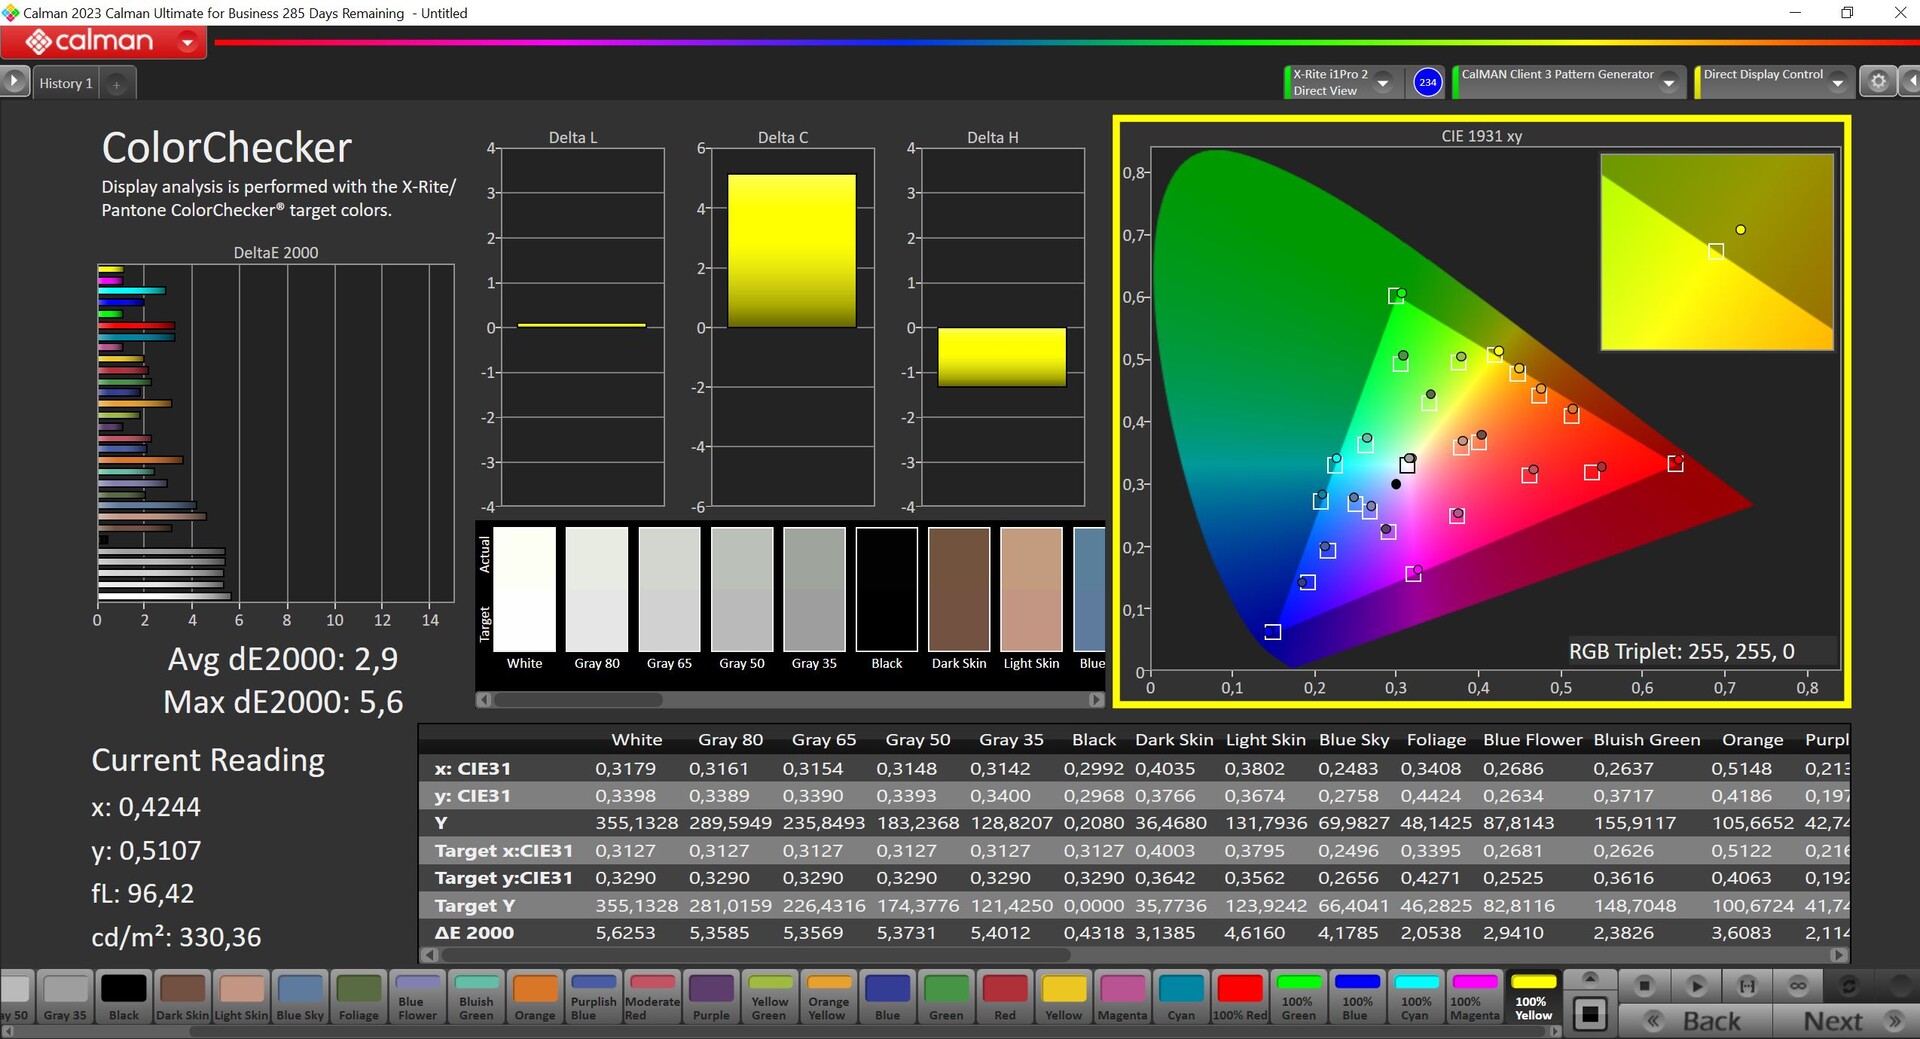
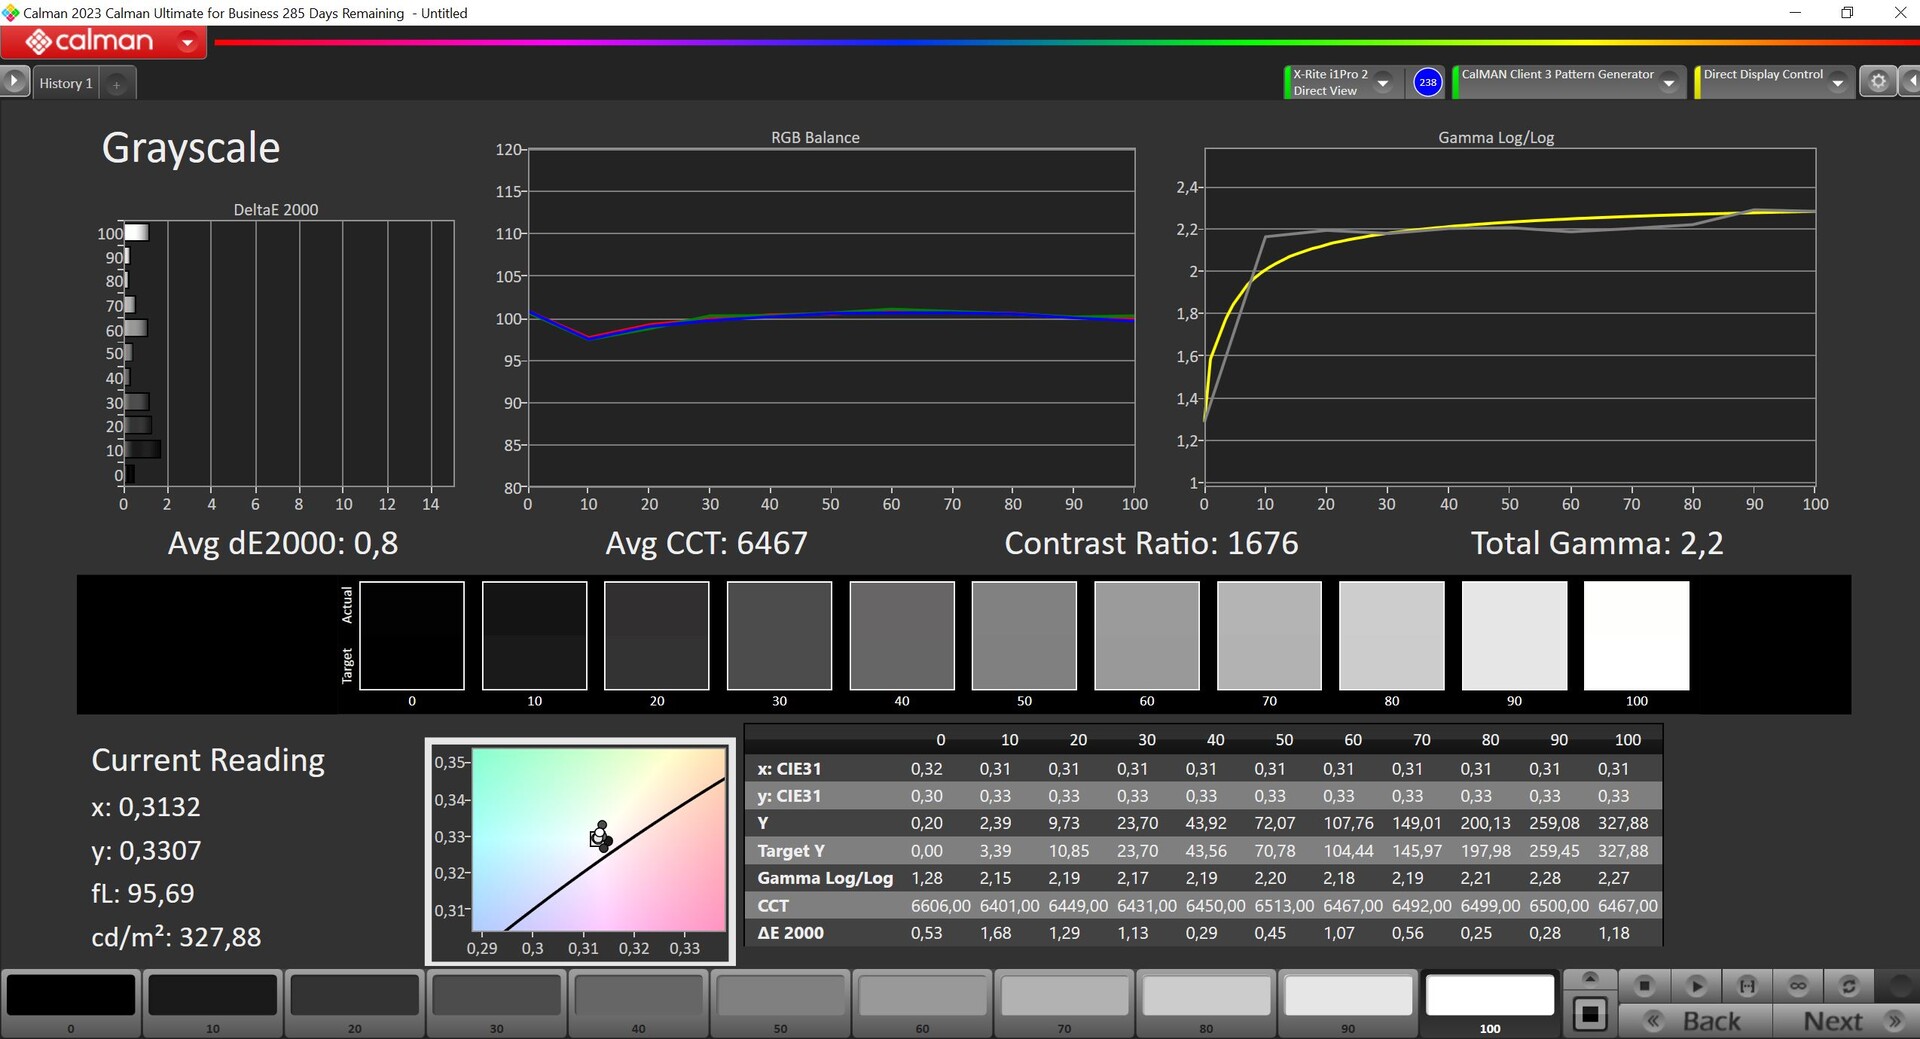
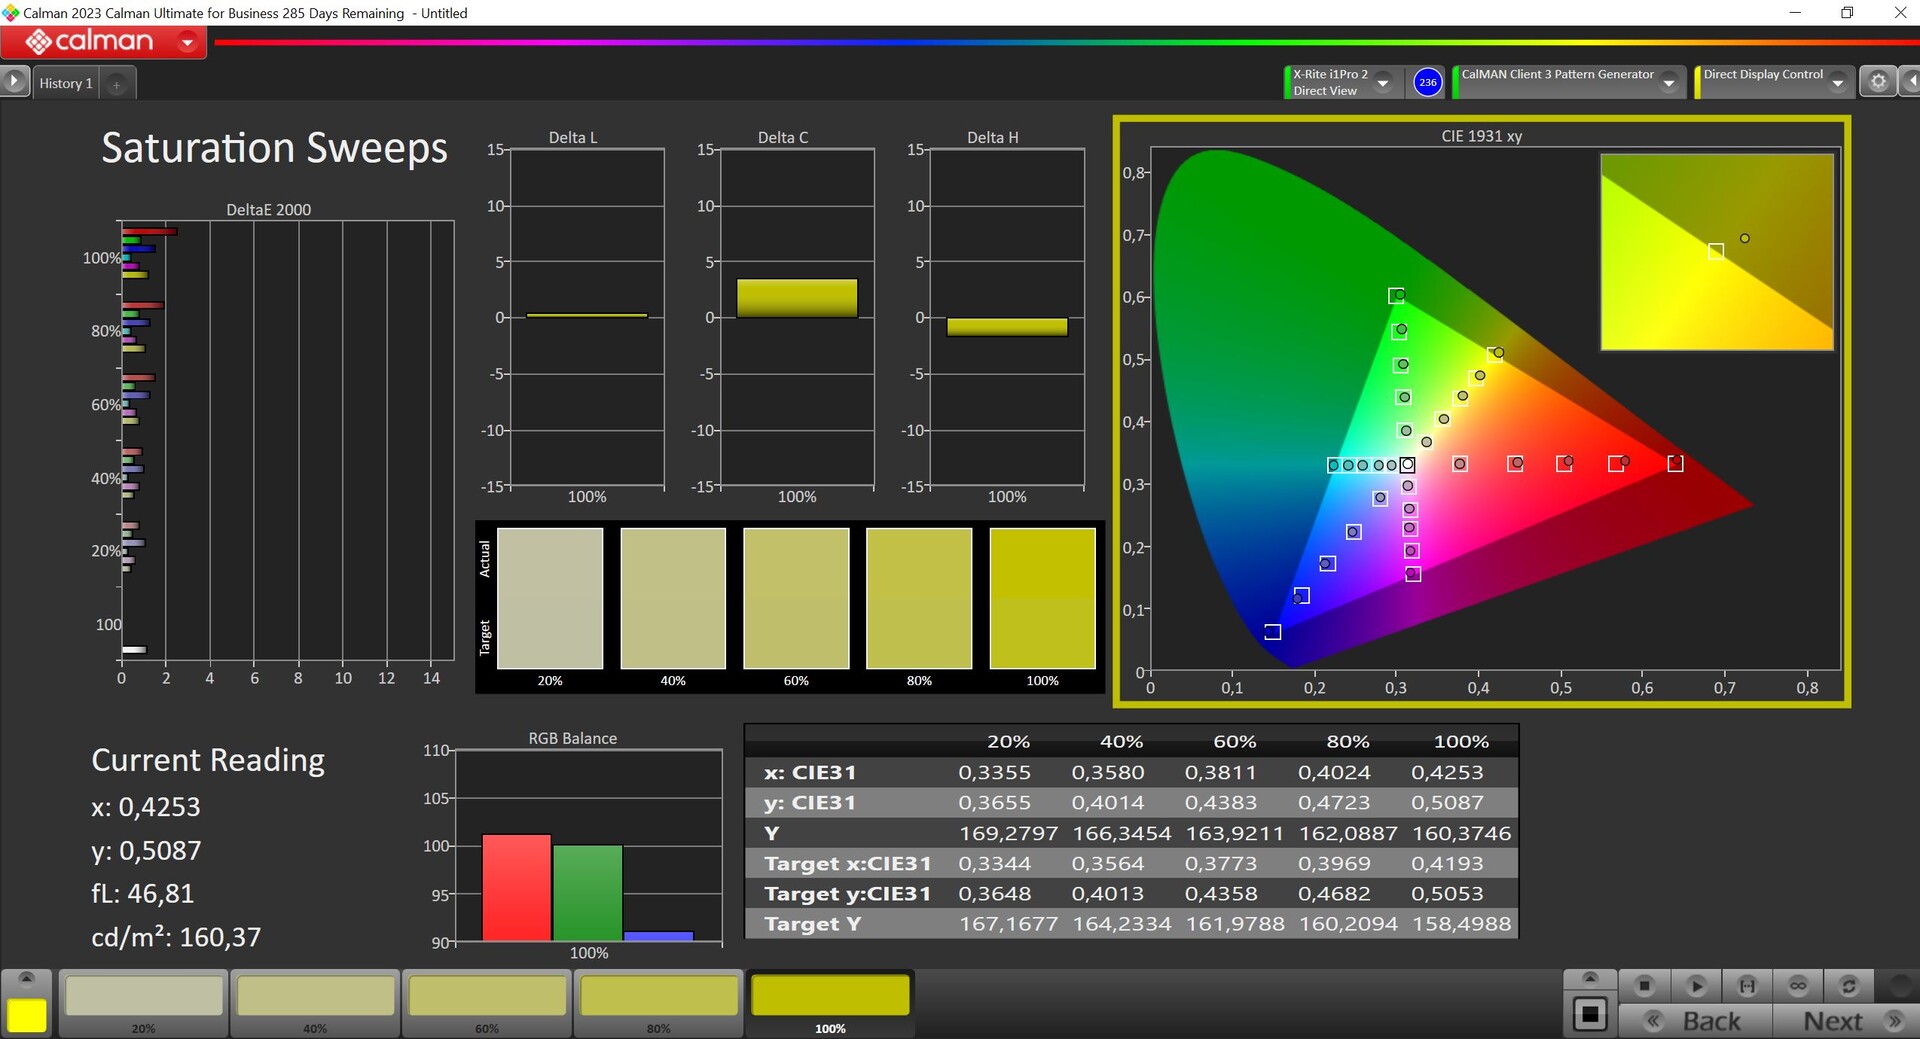
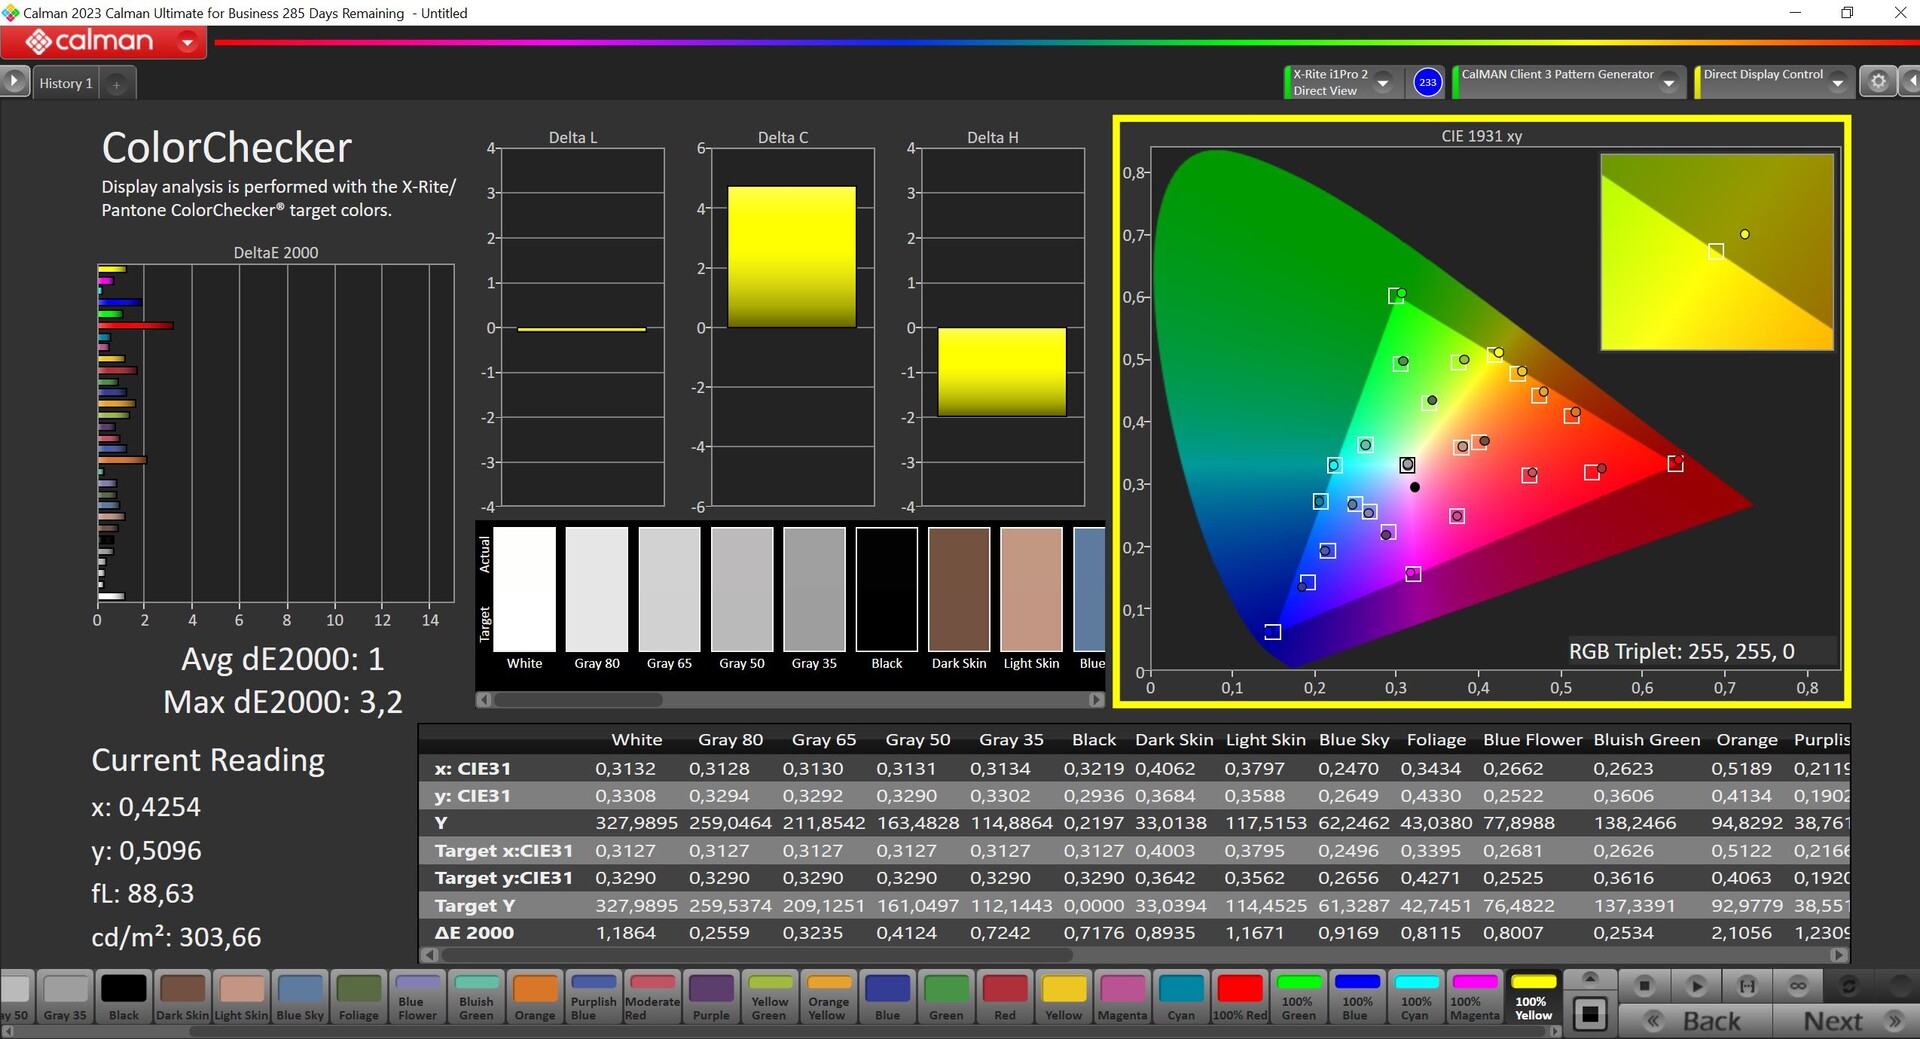
We measured the panel using the professional CalMAN software (X-Rite i1 Pro2) and found that there is still room for improvement right out of the box. We identified a slight green-leaning tint and greyscale deviations above our target value of 3. There were also a few outliers when it comes to colours. After performing our calibration (the corresponding profile is available as a free download above), we managed to improve the display’s colour reproduction considerably. Only 100% red was marginally above the target value with a DeltaE 2000 of 3.2. Nonetheless, in combination with the almost full sRGB coverage, it is still possible to edit photos and videos on the display.
Display Response Times
| ↔ Response Time Black to White | ||
|---|---|---|
| 26 ms ... rise ↗ and fall ↘ combined | ↗ 12.7 ms rise | 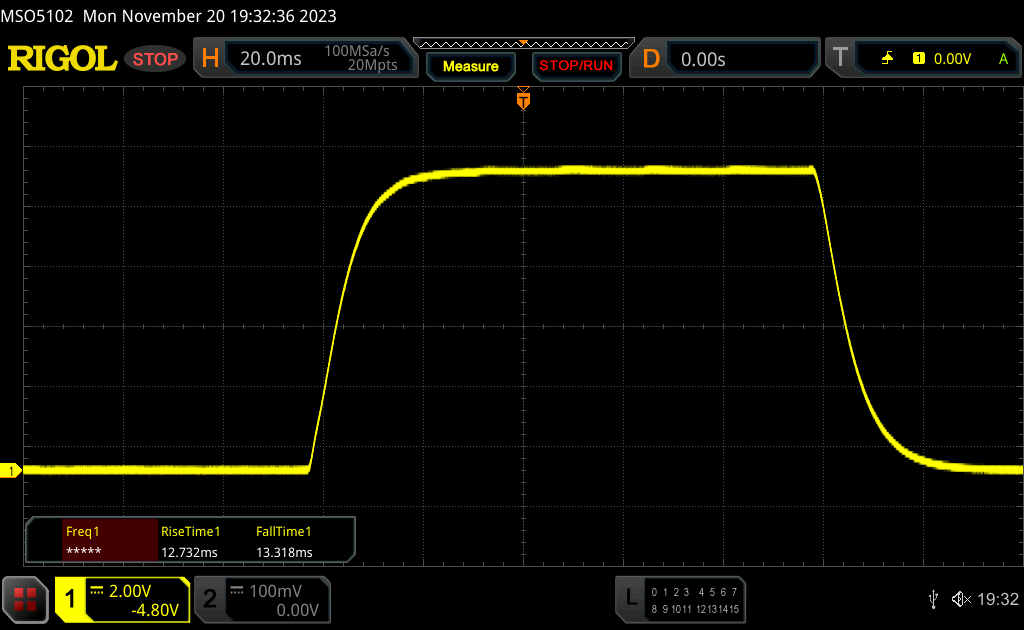 |
| ↘ 13.3 ms fall | ||
| The screen shows relatively slow response rates in our tests and may be too slow for gamers. In comparison, all tested devices range from 0.1 (minimum) to 240 (maximum) ms. » 62 % of all devices are better. This means that the measured response time is worse than the average of all tested devices (19.9 ms). | ||
| ↔ Response Time 50% Grey to 80% Grey | ||
| 50.6 ms ... rise ↗ and fall ↘ combined | ↗ 23 ms rise | 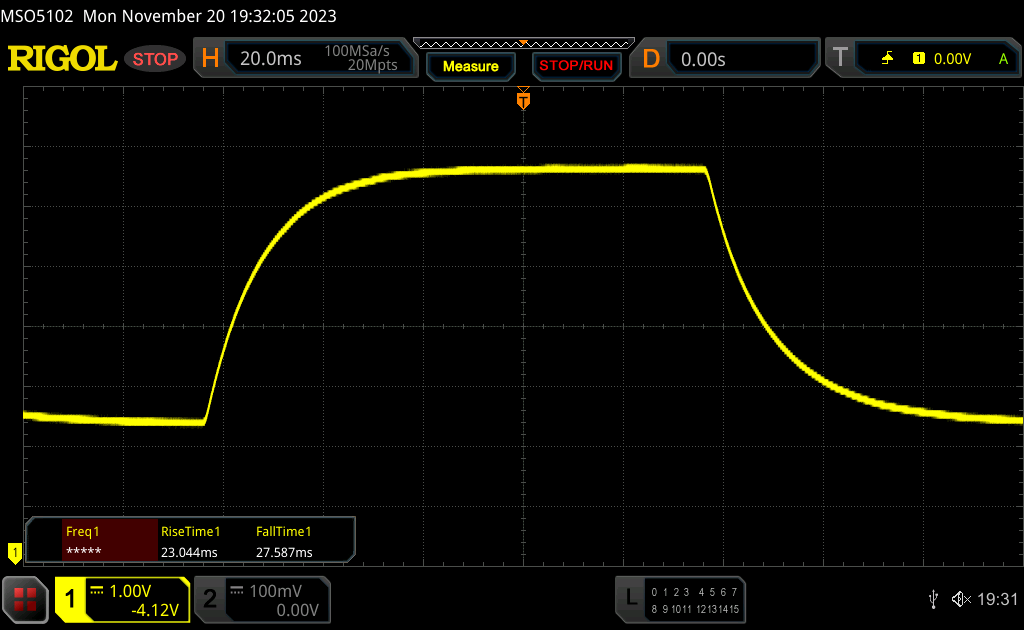 |
| ↘ 27.6 ms fall | ||
| The screen shows slow response rates in our tests and will be unsatisfactory for gamers. In comparison, all tested devices range from 0.165 (minimum) to 636 (maximum) ms. » 87 % of all devices are better. This means that the measured response time is worse than the average of all tested devices (31.1 ms). | ||
Screen Flickering / PWM (Pulse-Width Modulation)
| Screen flickering / PWM not detected |  | ||
In comparison: 52 % of all tested devices do not use PWM to dim the display. If PWM was detected, an average of 7798 (minimum: 5 - maximum: 343500) Hz was measured. | |||
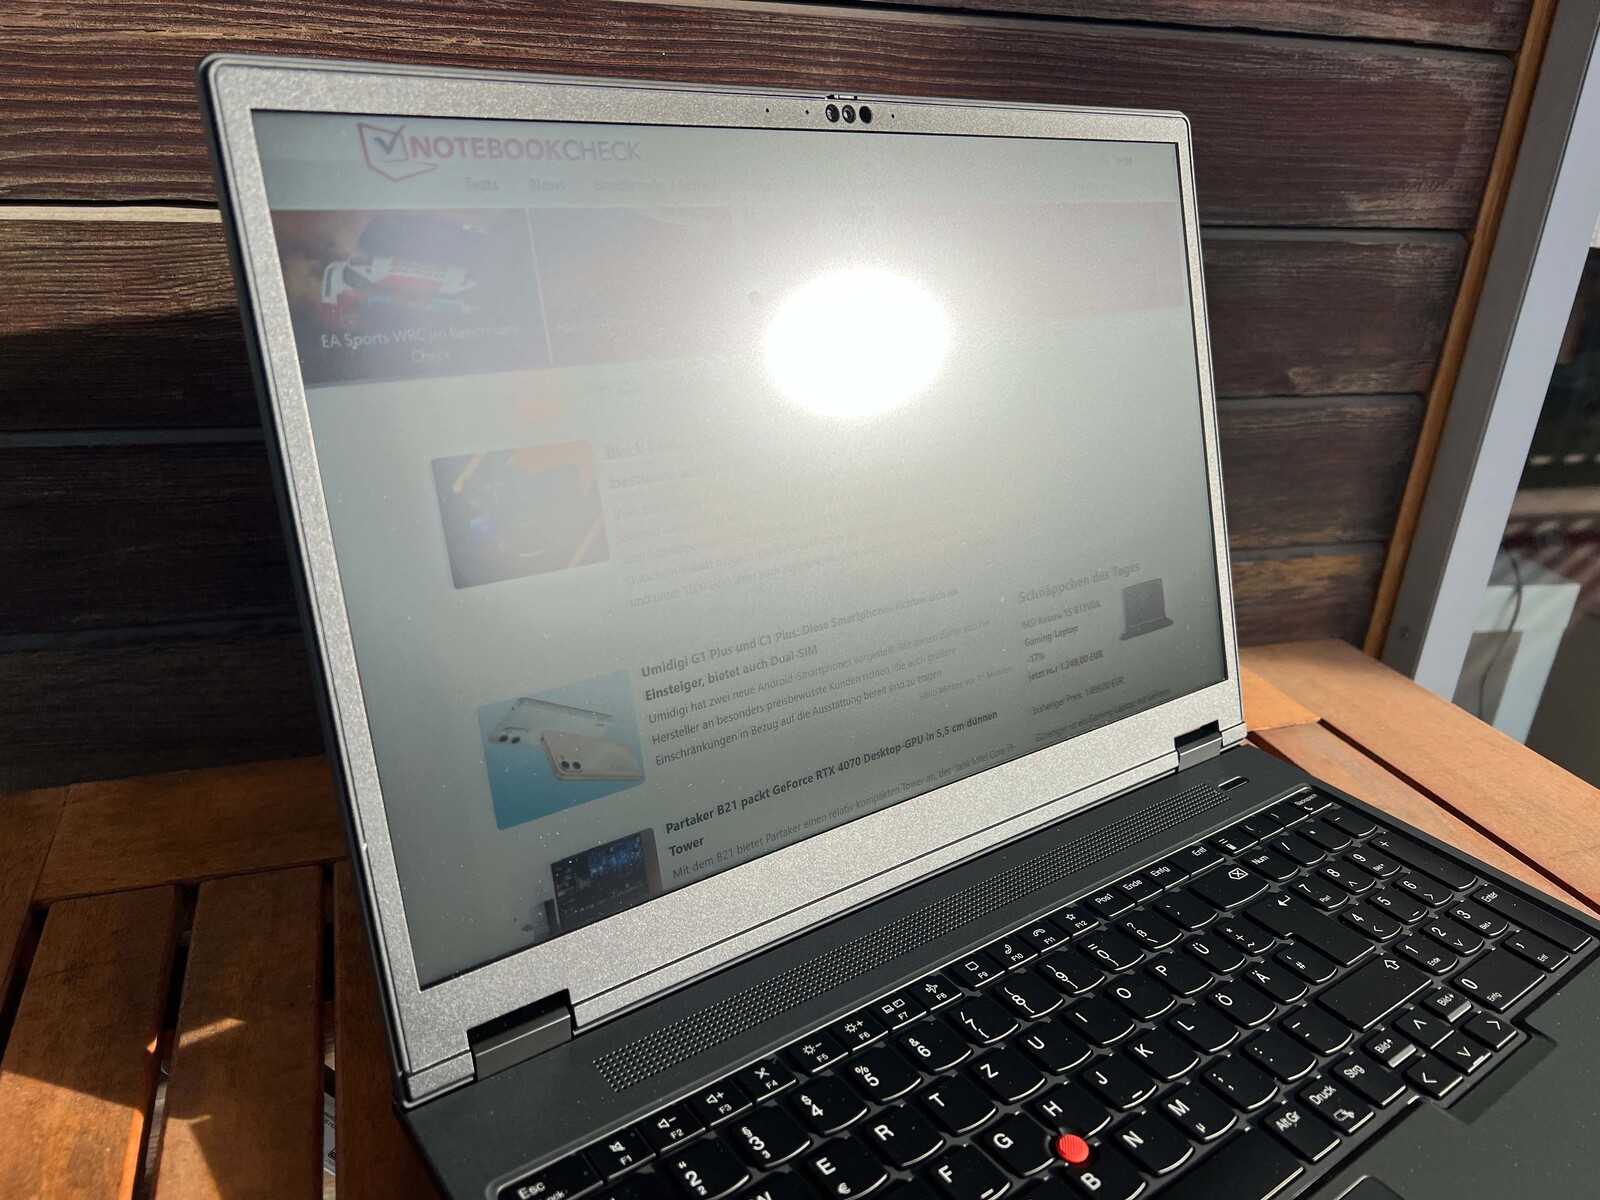
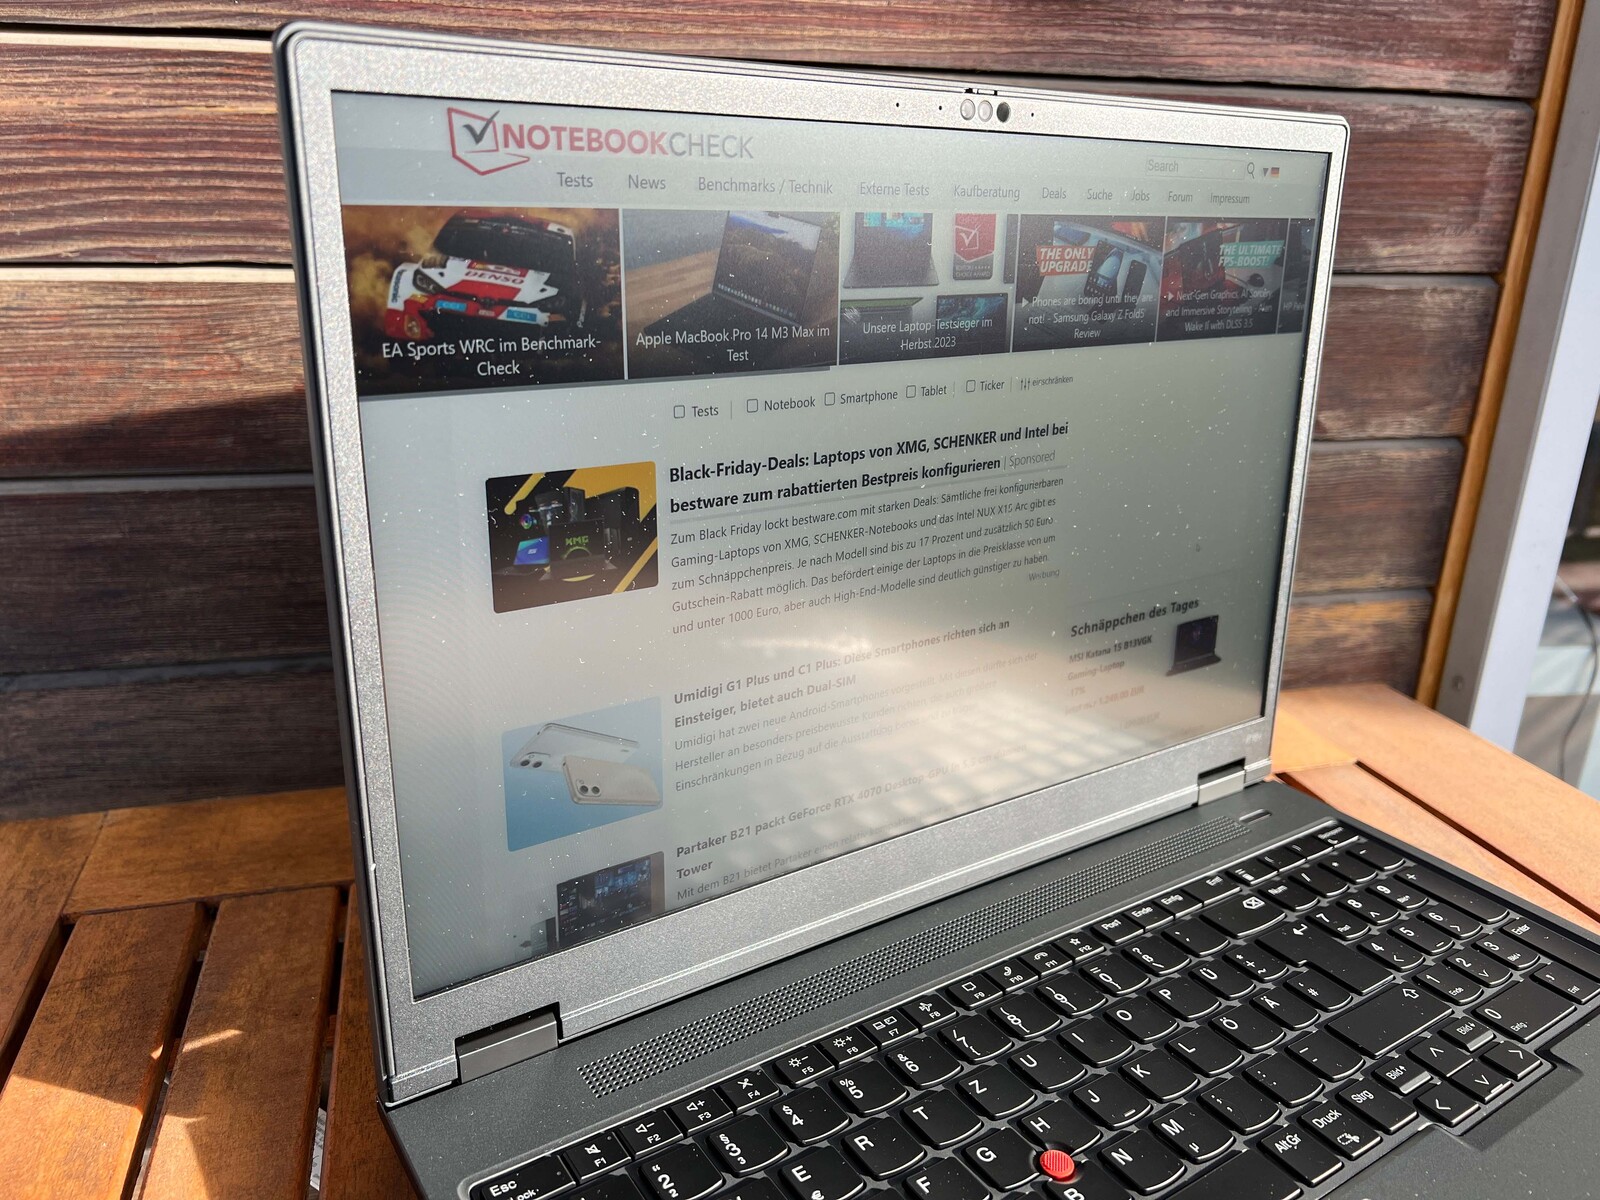

Using the matt display outdoors is generally not an issue. The screen’s brightness is only pushed to its limits in very bright environments or in direct sunlight. The IPS panel has a decent viewing angle.

Performance - Ryzen Pro & RTX A1000
Test conditions
Lenovo hasn't provided additional performance modes on their ThinkPads for ages, instead opting to integrate their own settings directly into Windows’ power modes – highly convenient for users. We performed the following measurements and benchmarks with the laptop in Best performance mode.
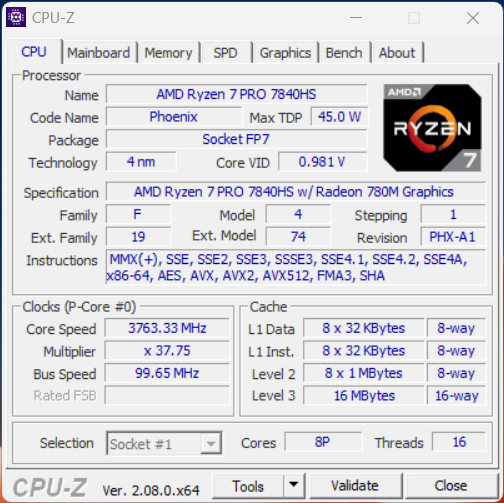
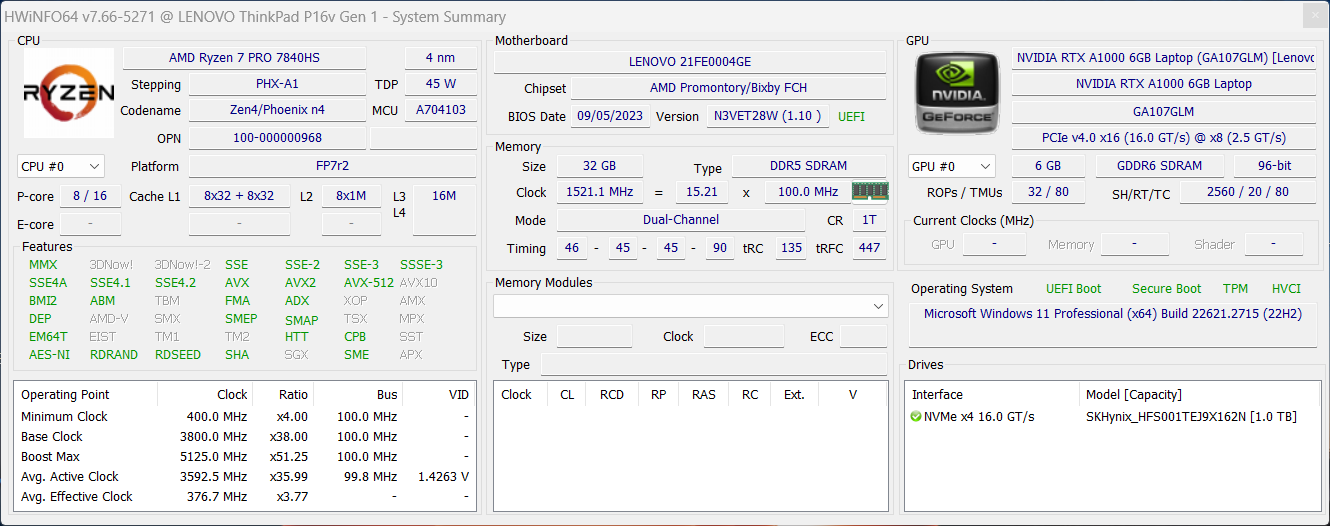
Processor - Ryzen 7 PRO 7840HS
The Ryzen 7 PRO 7840HS offers enhanced security features (comparable with Intel vPro) but is otherwise similar to the regular Ryzen 7 7840HS. This means the CPU features 8 Zen4 cores (max. 16 threads) with a max frequency of 5.1 GHz. Its power limits are set at 64/54 watts, much like the processor in the ZBook Power 15 G10 (likewise a Ryzen 7 PRO 7840HS). Competing Intel CPUs require substantially more power. Overall, the AMD processor delivers excellent performance and is even slightly ahead of the Core i7-12850HX in the Dell Precision 7670. The other devices in our comparison offer more CPU performance as a whole. That said, the P16v G1 saw a whopping 35% increase in performance over the ThinkPad P15v G3 with a Ryzen 7 PRO 6850H.
Performance remains stable under load, but the processor only has a meagre 18 watts at its disposal when running on battery power. Performance is thus significantly limited in the multi-core tests (40% drop in CB R23 Multi). More CPU benchmark results are available here.
Cinebench R15 Multi sustained load
Cinebench R23: Multi Core | Single Core
Cinebench R20: CPU (Multi Core) | CPU (Single Core)
Cinebench R15: CPU Multi 64Bit | CPU Single 64Bit
Blender: v2.79 BMW27 CPU
7-Zip 18.03: 7z b 4 | 7z b 4 -mmt1
Geekbench 5.5: Multi-Core | Single-Core
HWBOT x265 Benchmark v2.2: 4k Preset
LibreOffice : 20 Documents To PDF
R Benchmark 2.5: Overall mean
| CPU Performance rating | |
| Average of class Workstation | |
| Lenovo ThinkPad P1 G6-21FV000DGE | |
| Lenovo ThinkPad P16 G1 21D6001DMB | |
| HP ZBook Power 15 G10 | |
| Average AMD Ryzen 7 PRO 7840HS | |
| Lenovo ThinkPad P16v G1 AMD | |
| Dell Precision 7670 | |
| Lenovo ThinkPad P15v G3 21EM001AGE | |
| Cinebench R23 / Multi Core | |
| Average of class Workstation (14055 - 38520, n=25, last 2 years) | |
| Lenovo ThinkPad P1 G6-21FV000DGE | |
| Lenovo ThinkPad P16 G1 21D6001DMB | |
| HP ZBook Power 15 G10 | |
| Dell Precision 7670 | |
| Average AMD Ryzen 7 PRO 7840HS (14240 - 15863, n=2) | |
| Lenovo ThinkPad P16v G1 AMD | |
| Lenovo ThinkPad P15v G3 21EM001AGE | |
| Cinebench R23 / Single Core | |
| Lenovo ThinkPad P1 G6-21FV000DGE | |
| Average of class Workstation (1712 - 2228, n=25, last 2 years) | |
| Lenovo ThinkPad P16 G1 21D6001DMB | |
| HP ZBook Power 15 G10 | |
| Average AMD Ryzen 7 PRO 7840HS (1691 - 1774, n=2) | |
| Lenovo ThinkPad P16v G1 AMD | |
| Dell Precision 7670 | |
| Lenovo ThinkPad P15v G3 21EM001AGE | |
| Cinebench R20 / CPU (Multi Core) | |
| Average of class Workstation (5471 - 15043, n=25, last 2 years) | |
| Lenovo ThinkPad P1 G6-21FV000DGE | |
| Lenovo ThinkPad P16 G1 21D6001DMB | |
| HP ZBook Power 15 G10 | |
| Dell Precision 7670 | |
| Average AMD Ryzen 7 PRO 7840HS (5327 - 6235, n=2) | |
| Lenovo ThinkPad P16v G1 AMD | |
| Lenovo ThinkPad P15v G3 21EM001AGE | |
| Lenovo ThinkPad P15v G3 21EM001AGE | |
| Cinebench R20 / CPU (Single Core) | |
| Lenovo ThinkPad P1 G6-21FV000DGE | |
| Average of class Workstation (671 - 857, n=25, last 2 years) | |
| Lenovo ThinkPad P16 G1 21D6001DMB | |
| HP ZBook Power 15 G10 | |
| Dell Precision 7670 | |
| Average AMD Ryzen 7 PRO 7840HS (651 - 693, n=2) | |
| Lenovo ThinkPad P16v G1 AMD | |
| Lenovo ThinkPad P15v G3 21EM001AGE | |
| Lenovo ThinkPad P15v G3 21EM001AGE | |
| Cinebench R15 / CPU Multi 64Bit | |
| Average of class Workstation (2489 - 5810, n=25, last 2 years) | |
| Lenovo ThinkPad P16 G1 21D6001DMB | |
| Lenovo ThinkPad P1 G6-21FV000DGE | |
| HP ZBook Power 15 G10 | |
| Average AMD Ryzen 7 PRO 7840HS (2361 - 2519, n=2) | |
| Dell Precision 7670 | |
| Lenovo ThinkPad P16v G1 AMD | |
| Lenovo ThinkPad P15v G3 21EM001AGE | |
| Cinebench R15 / CPU Single 64Bit | |
| Average of class Workstation (191.4 - 328, n=25, last 2 years) | |
| Lenovo ThinkPad P1 G6-21FV000DGE | |
| HP ZBook Power 15 G10 | |
| Average AMD Ryzen 7 PRO 7840HS (262 - 276, n=2) | |
| Lenovo ThinkPad P16 G1 21D6001DMB | |
| Lenovo ThinkPad P16v G1 AMD | |
| Dell Precision 7670 | |
| Lenovo ThinkPad P15v G3 21EM001AGE | |
| Blender / v2.79 BMW27 CPU | |
| Lenovo ThinkPad P15v G3 21EM001AGE | |
| Dell Precision 7670 | |
| Lenovo ThinkPad P16v G1 AMD | |
| Average AMD Ryzen 7 PRO 7840HS (201 - 205, n=2) | |
| HP ZBook Power 15 G10 | |
| Lenovo ThinkPad P1 G6-21FV000DGE | |
| Lenovo ThinkPad P16 G1 21D6001DMB | |
| Average of class Workstation (91 - 261, n=25, last 2 years) | |
| 7-Zip 18.03 / 7z b 4 | |
| Average of class Workstation (54741 - 116969, n=25, last 2 years) | |
| Lenovo ThinkPad P1 G6-21FV000DGE | |
| HP ZBook Power 15 G10 | |
| Lenovo ThinkPad P16 G1 21D6001DMB | |
| Average AMD Ryzen 7 PRO 7840HS (62497 - 70387, n=2) | |
| Lenovo ThinkPad P16v G1 AMD | |
| Dell Precision 7670 | |
| Lenovo ThinkPad P15v G3 21EM001AGE | |
| 7-Zip 18.03 / 7z b 4 -mmt1 | |
| Lenovo ThinkPad P1 G6-21FV000DGE | |
| Lenovo ThinkPad P16v G1 AMD | |
| Average AMD Ryzen 7 PRO 7840HS (6493 - 6498, n=2) | |
| HP ZBook Power 15 G10 | |
| Average of class Workstation (5126 - 6960, n=25, last 2 years) | |
| Lenovo ThinkPad P16 G1 21D6001DMB | |
| Dell Precision 7670 | |
| Lenovo ThinkPad P15v G3 21EM001AGE | |
| Geekbench 5.5 / Multi-Core | |
| Average of class Workstation (11542 - 25554, n=25, last 2 years) | |
| Lenovo ThinkPad P16 G1 21D6001DMB | |
| HP ZBook Power 15 G10 | |
| Lenovo ThinkPad P1 G6-21FV000DGE | |
| Dell Precision 7670 | |
| Average AMD Ryzen 7 PRO 7840HS (10034 - 12039, n=2) | |
| Lenovo ThinkPad P16v G1 AMD | |
| Lenovo ThinkPad P15v G3 21EM001AGE | |
| Geekbench 5.5 / Single-Core | |
| Average of class Workstation (1781 - 2183, n=25, last 2 years) | |
| Lenovo ThinkPad P1 G6-21FV000DGE | |
| HP ZBook Power 15 G10 | |
| Average AMD Ryzen 7 PRO 7840HS (1822 - 1953, n=2) | |
| Lenovo ThinkPad P16v G1 AMD | |
| Lenovo ThinkPad P16 G1 21D6001DMB | |
| Dell Precision 7670 | |
| Lenovo ThinkPad P15v G3 21EM001AGE | |
| HWBOT x265 Benchmark v2.2 / 4k Preset | |
| Average of class Workstation (14.4 - 40.5, n=25, last 2 years) | |
| HP ZBook Power 15 G10 | |
| Lenovo ThinkPad P1 G6-21FV000DGE | |
| Average AMD Ryzen 7 PRO 7840HS (18.1 - 19.9, n=2) | |
| Lenovo ThinkPad P16v G1 AMD | |
| Dell Precision 7670 | |
| Lenovo ThinkPad P16 G1 21D6001DMB | |
| Lenovo ThinkPad P15v G3 21EM001AGE | |
| LibreOffice / 20 Documents To PDF | |
| Lenovo ThinkPad P15v G3 21EM001AGE | |
| HP ZBook Power 15 G10 | |
| Average AMD Ryzen 7 PRO 7840HS (45.9 - 54.7, n=2) | |
| Dell Precision 7670 | |
| Average of class Workstation (37.1 - 74.7, n=25, last 2 years) | |
| Lenovo ThinkPad P1 G6-21FV000DGE | |
| Lenovo ThinkPad P16 G1 21D6001DMB | |
| Lenovo ThinkPad P16v G1 AMD | |
| R Benchmark 2.5 / Overall mean | |
| Lenovo ThinkPad P15v G3 21EM001AGE | |
| Dell Precision 7670 | |
| Lenovo ThinkPad P16 G1 21D6001DMB | |
| HP ZBook Power 15 G10 | |
| Average AMD Ryzen 7 PRO 7840HS (0.44 - 0.4487, n=2) | |
| Lenovo ThinkPad P16v G1 AMD | |
| Average of class Workstation (0.3825 - 0.603, n=25, last 2 years) | |
| Lenovo ThinkPad P1 G6-21FV000DGE | |
* ... smaller is better
AIDA64: FP32 Ray-Trace | FPU Julia | CPU SHA3 | CPU Queen | FPU SinJulia | FPU Mandel | CPU AES | CPU ZLib | FP64 Ray-Trace | CPU PhotoWorxx
| Performance rating | |
| Average of class Workstation | |
| HP ZBook Power 15 G10 | |
| Average AMD Ryzen 7 PRO 7840HS | |
| Lenovo ThinkPad P16v G1 AMD | |
| Lenovo ThinkPad P16 G1 21D6001DMB | |
| Lenovo ThinkPad P15v G3 21EM001AGE | |
| Lenovo ThinkPad P1 G6-21FV000DGE | |
| Dell Precision 7670 | |
| AIDA64 / FP32 Ray-Trace | |
| Average of class Workstation (10658 - 61611, n=25, last 2 years) | |
| HP ZBook Power 15 G10 | |
| Average AMD Ryzen 7 PRO 7840HS (25606 - 25776, n=2) | |
| Lenovo ThinkPad P16v G1 AMD | |
| Lenovo ThinkPad P16 G1 21D6001DMB | |
| Lenovo ThinkPad P1 G6-21FV000DGE | |
| Lenovo ThinkPad P15v G3 21EM001AGE | |
| Dell Precision 7670 | |
| AIDA64 / FPU Julia | |
| Average of class Workstation (56664 - 186971, n=25, last 2 years) | |
| HP ZBook Power 15 G10 | |
| Average AMD Ryzen 7 PRO 7840HS (107907 - 109059, n=2) | |
| Lenovo ThinkPad P16v G1 AMD | |
| Lenovo ThinkPad P15v G3 21EM001AGE | |
| Lenovo ThinkPad P16 G1 21D6001DMB | |
| Lenovo ThinkPad P1 G6-21FV000DGE | |
| Dell Precision 7670 | |
| AIDA64 / CPU SHA3 | |
| Average of class Workstation (2608 - 8975, n=25, last 2 years) | |
| HP ZBook Power 15 G10 | |
| Average AMD Ryzen 7 PRO 7840HS (4631 - 4656, n=2) | |
| Lenovo ThinkPad P16v G1 AMD | |
| Lenovo ThinkPad P16 G1 21D6001DMB | |
| Lenovo ThinkPad P1 G6-21FV000DGE | |
| Lenovo ThinkPad P15v G3 21EM001AGE | |
| Dell Precision 7670 | |
| AIDA64 / CPU Queen | |
| Lenovo ThinkPad P1 G6-21FV000DGE | |
| HP ZBook Power 15 G10 | |
| Average of class Workstation (60778 - 144411, n=25, last 2 years) | |
| Average AMD Ryzen 7 PRO 7840HS (97729 - 115640, n=2) | |
| Lenovo ThinkPad P15v G3 21EM001AGE | |
| Lenovo ThinkPad P16v G1 AMD | |
| Lenovo ThinkPad P16 G1 21D6001DMB | |
| Dell Precision 7670 | |
| AIDA64 / FPU SinJulia | |
| HP ZBook Power 15 G10 | |
| Average AMD Ryzen 7 PRO 7840HS (14693 - 14742, n=2) | |
| Lenovo ThinkPad P16v G1 AMD | |
| Average of class Workstation (8165 - 29343, n=25, last 2 years) | |
| Lenovo ThinkPad P15v G3 21EM001AGE | |
| Lenovo ThinkPad P16 G1 21D6001DMB | |
| Lenovo ThinkPad P1 G6-21FV000DGE | |
| Dell Precision 7670 | |
| AIDA64 / FPU Mandel | |
| Average of class Workstation (27301 - 98153, n=25, last 2 years) | |
| HP ZBook Power 15 G10 | |
| Average AMD Ryzen 7 PRO 7840HS (57502 - 58181, n=2) | |
| Lenovo ThinkPad P16v G1 AMD | |
| Lenovo ThinkPad P15v G3 21EM001AGE | |
| Lenovo ThinkPad P16 G1 21D6001DMB | |
| Lenovo ThinkPad P1 G6-21FV000DGE | |
| Dell Precision 7670 | |
| AIDA64 / CPU AES | |
| Lenovo ThinkPad P15v G3 21EM001AGE | |
| Average of class Workstation (56077 - 187841, n=25, last 2 years) | |
| HP ZBook Power 15 G10 | |
| Average AMD Ryzen 7 PRO 7840HS (84454 - 85341, n=2) | |
| Lenovo ThinkPad P16v G1 AMD | |
| Lenovo ThinkPad P16 G1 21D6001DMB | |
| Lenovo ThinkPad P1 G6-21FV000DGE | |
| Dell Precision 7670 | |
| AIDA64 / CPU ZLib | |
| Average of class Workstation (742 - 2148, n=25, last 2 years) | |
| Lenovo ThinkPad P1 G6-21FV000DGE | |
| Lenovo ThinkPad P16 G1 21D6001DMB | |
| HP ZBook Power 15 G10 | |
| Average AMD Ryzen 7 PRO 7840HS (1032 - 1043, n=2) | |
| Lenovo ThinkPad P16v G1 AMD | |
| Dell Precision 7670 | |
| Lenovo ThinkPad P15v G3 21EM001AGE | |
| AIDA64 / FP64 Ray-Trace | |
| Average of class Workstation (5580 - 32891, n=25, last 2 years) | |
| HP ZBook Power 15 G10 | |
| Average AMD Ryzen 7 PRO 7840HS (13545 - 13800, n=2) | |
| Lenovo ThinkPad P16v G1 AMD | |
| Lenovo ThinkPad P16 G1 21D6001DMB | |
| Lenovo ThinkPad P1 G6-21FV000DGE | |
| Lenovo ThinkPad P15v G3 21EM001AGE | |
| Dell Precision 7670 | |
| AIDA64 / CPU PhotoWorxx | |
| Average of class Workstation (37151 - 93684, n=25, last 2 years) | |
| HP ZBook Power 15 G10 | |
| Dell Precision 7670 | |
| Average AMD Ryzen 7 PRO 7840HS (24325 - 42810, n=2) | |
| Lenovo ThinkPad P16 G1 21D6001DMB | |
| Lenovo ThinkPad P1 G6-21FV000DGE | |
| Lenovo ThinkPad P16v G1 AMD | |
| Lenovo ThinkPad P15v G3 21EM001AGE | |
System performance
Based on our impression, the ThinkPad P16v G1 has fantastic performance as expected and is very responsive to all kinds of inputs. The benchmark results are good as a whole, and we didn’t encounter any system stability issues during our testing.
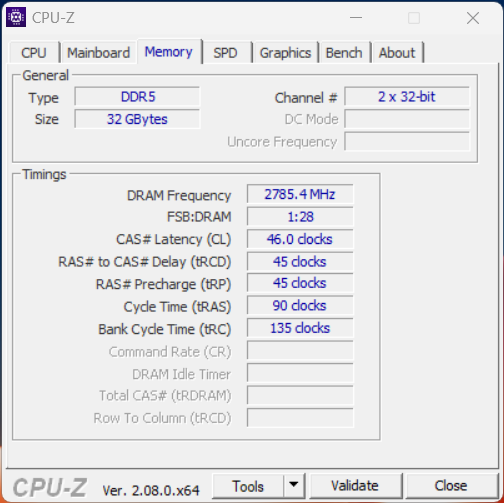
Because our review unit came with one RAM module, the system memory only runs in single-channel configuration. Accordingly, the laptop didn’t produce great results in our memory benchmarks.
CrossMark: Overall | Productivity | Creativity | Responsiveness
WebXPRT 3: Overall
WebXPRT 4: Overall
Mozilla Kraken 1.1: Total
| PCMark 10 / Score | |
| Average of class Workstation (6436 - 10409, n=21, last 2 years) | |
| HP ZBook Power 15 G10 | |
| Lenovo ThinkPad P1 G6-21FV000DGE | |
| Lenovo ThinkPad P16v G1 AMD | |
| Average AMD Ryzen 7 PRO 7840HS, NVIDIA RTX A1000 Laptop GPU (n=1) | |
| Dell Precision 7670 | |
| Lenovo ThinkPad P15v G3 21EM001AGE | |
| Lenovo ThinkPad P16 G1 21D6001DMB | |
| PCMark 10 / Essentials | |
| Lenovo ThinkPad P1 G6-21FV000DGE | |
| HP ZBook Power 15 G10 | |
| Dell Precision 7670 | |
| Average of class Workstation (9622 - 11157, n=21, last 2 years) | |
| Lenovo ThinkPad P16v G1 AMD | |
| Average AMD Ryzen 7 PRO 7840HS, NVIDIA RTX A1000 Laptop GPU (n=1) | |
| Lenovo ThinkPad P16 G1 21D6001DMB | |
| Lenovo ThinkPad P15v G3 21EM001AGE | |
| PCMark 10 / Productivity | |
| Average of class Workstation (8789 - 20616, n=21, last 2 years) | |
| Lenovo ThinkPad P1 G6-21FV000DGE | |
| Lenovo ThinkPad P16v G1 AMD | |
| Average AMD Ryzen 7 PRO 7840HS, NVIDIA RTX A1000 Laptop GPU (n=1) | |
| HP ZBook Power 15 G10 | |
| Lenovo ThinkPad P16 G1 21D6001DMB | |
| Dell Precision 7670 | |
| Lenovo ThinkPad P15v G3 21EM001AGE | |
| PCMark 10 / Digital Content Creation | |
| Average of class Workstation (7744 - 15631, n=21, last 2 years) | |
| HP ZBook Power 15 G10 | |
| Lenovo ThinkPad P1 G6-21FV000DGE | |
| Lenovo ThinkPad P16v G1 AMD | |
| Average AMD Ryzen 7 PRO 7840HS, NVIDIA RTX A1000 Laptop GPU (n=1) | |
| Lenovo ThinkPad P15v G3 21EM001AGE | |
| Dell Precision 7670 | |
| Lenovo ThinkPad P16 G1 21D6001DMB | |
| CrossMark / Overall | |
| Average of class Workstation (1307 - 2267, n=24, last 2 years) | |
| Lenovo ThinkPad P1 G6-21FV000DGE | |
| Lenovo ThinkPad P16 G1 21D6001DMB | |
| HP ZBook Power 15 G10 | |
| Lenovo ThinkPad P16v G1 AMD | |
| Average AMD Ryzen 7 PRO 7840HS, NVIDIA RTX A1000 Laptop GPU (n=1) | |
| Dell Precision 7670 | |
| Lenovo ThinkPad P15v G3 21EM001AGE | |
| CrossMark / Productivity | |
| Lenovo ThinkPad P1 G6-21FV000DGE | |
| Average of class Workstation (1130 - 2122, n=24, last 2 years) | |
| Lenovo ThinkPad P16 G1 21D6001DMB | |
| HP ZBook Power 15 G10 | |
| Lenovo ThinkPad P16v G1 AMD | |
| Average AMD Ryzen 7 PRO 7840HS, NVIDIA RTX A1000 Laptop GPU (n=1) | |
| Dell Precision 7670 | |
| Lenovo ThinkPad P15v G3 21EM001AGE | |
| CrossMark / Creativity | |
| Average of class Workstation (1657 - 2725, n=24, last 2 years) | |
| Lenovo ThinkPad P1 G6-21FV000DGE | |
| Lenovo ThinkPad P16 G1 21D6001DMB | |
| HP ZBook Power 15 G10 | |
| Dell Precision 7670 | |
| Lenovo ThinkPad P16v G1 AMD | |
| Average AMD Ryzen 7 PRO 7840HS, NVIDIA RTX A1000 Laptop GPU (n=1) | |
| Lenovo ThinkPad P15v G3 21EM001AGE | |
| CrossMark / Responsiveness | |
| Lenovo ThinkPad P1 G6-21FV000DGE | |
| Average of class Workstation (993 - 2096, n=24, last 2 years) | |
| Lenovo ThinkPad P16 G1 21D6001DMB | |
| Lenovo ThinkPad P16v G1 AMD | |
| Average AMD Ryzen 7 PRO 7840HS, NVIDIA RTX A1000 Laptop GPU (n=1) | |
| HP ZBook Power 15 G10 | |
| Lenovo ThinkPad P15v G3 21EM001AGE | |
| Dell Precision 7670 | |
| WebXPRT 3 / Overall | |
| Lenovo ThinkPad P16v G1 AMD | |
| Average AMD Ryzen 7 PRO 7840HS, NVIDIA RTX A1000 Laptop GPU (n=1) | |
| Lenovo ThinkPad P1 G6-21FV000DGE | |
| Average of class Workstation (260 - 360, n=25, last 2 years) | |
| HP ZBook Power 15 G10 | |
| Dell Precision 7670 | |
| Lenovo ThinkPad P16 G1 21D6001DMB | |
| Lenovo ThinkPad P15v G3 21EM001AGE | |
| WebXPRT 4 / Overall | |
| Lenovo ThinkPad P1 G6-21FV000DGE | |
| Average of class Workstation (189.2 - 326, n=25, last 2 years) | |
| Lenovo ThinkPad P16v G1 AMD | |
| Average AMD Ryzen 7 PRO 7840HS, NVIDIA RTX A1000 Laptop GPU (n=1) | |
| Dell Precision 7670 | |
| HP ZBook Power 15 G10 | |
| Lenovo ThinkPad P16 G1 21D6001DMB | |
| Lenovo ThinkPad P15v G3 21EM001AGE | |
| Mozilla Kraken 1.1 / Total | |
| Lenovo ThinkPad P15v G3 21EM001AGE | |
| HP ZBook Power 15 G10 | |
| Lenovo ThinkPad P16v G1 AMD | |
| Average AMD Ryzen 7 PRO 7840HS, NVIDIA RTX A1000 Laptop GPU (n=1) | |
| Dell Precision 7670 | |
| Lenovo ThinkPad P16 G1 21D6001DMB | |
| Lenovo ThinkPad P1 G6-21FV000DGE | |
| Average of class Workstation (411 - 538, n=25, last 2 years) | |
* ... smaller is better
| PCMark 10 Score | 6999 points | |
Help | ||
| AIDA64 / Memory Copy | |
| Average of class Workstation (56003 - 164795, n=25, last 2 years) | |
| HP ZBook Power 15 G10 | |
| Dell Precision 7670 | |
| Lenovo ThinkPad P16 G1 21D6001DMB | |
| Average AMD Ryzen 7 PRO 7840HS (34323 - 67943, n=2) | |
| Lenovo ThinkPad P1 G6-21FV000DGE | |
| Lenovo ThinkPad P16v G1 AMD | |
| Lenovo ThinkPad P15v G3 21EM001AGE | |
| AIDA64 / Memory Read | |
| Average of class Workstation (55795 - 121563, n=25, last 2 years) | |
| Dell Precision 7670 | |
| HP ZBook Power 15 G10 | |
| Lenovo ThinkPad P16 G1 21D6001DMB | |
| Average AMD Ryzen 7 PRO 7840HS (30787 - 61660, n=2) | |
| Lenovo ThinkPad P1 G6-21FV000DGE | |
| Lenovo ThinkPad P15v G3 21EM001AGE | |
| Lenovo ThinkPad P16v G1 AMD | |
| AIDA64 / Memory Write | |
| Average of class Workstation (55663 - 214520, n=25, last 2 years) | |
| HP ZBook Power 15 G10 | |
| Dell Precision 7670 | |
| Average AMD Ryzen 7 PRO 7840HS (39362 - 83167, n=2) | |
| Lenovo ThinkPad P16 G1 21D6001DMB | |
| Lenovo ThinkPad P16v G1 AMD | |
| Lenovo ThinkPad P1 G6-21FV000DGE | |
| Lenovo ThinkPad P15v G3 21EM001AGE | |
| AIDA64 / Memory Latency | |
| Average of class Workstation (84.5 - 165.2, n=25, last 2 years) | |
| Lenovo ThinkPad P16v G1 AMD | |
| Average AMD Ryzen 7 PRO 7840HS (99.6 - 101.2, n=2) | |
| HP ZBook Power 15 G10 | |
| Lenovo ThinkPad P16 G1 21D6001DMB | |
| Lenovo ThinkPad P15v G3 21EM001AGE | |
| Dell Precision 7670 | |
| Lenovo ThinkPad P1 G6-21FV000DGE | |
* ... smaller is better
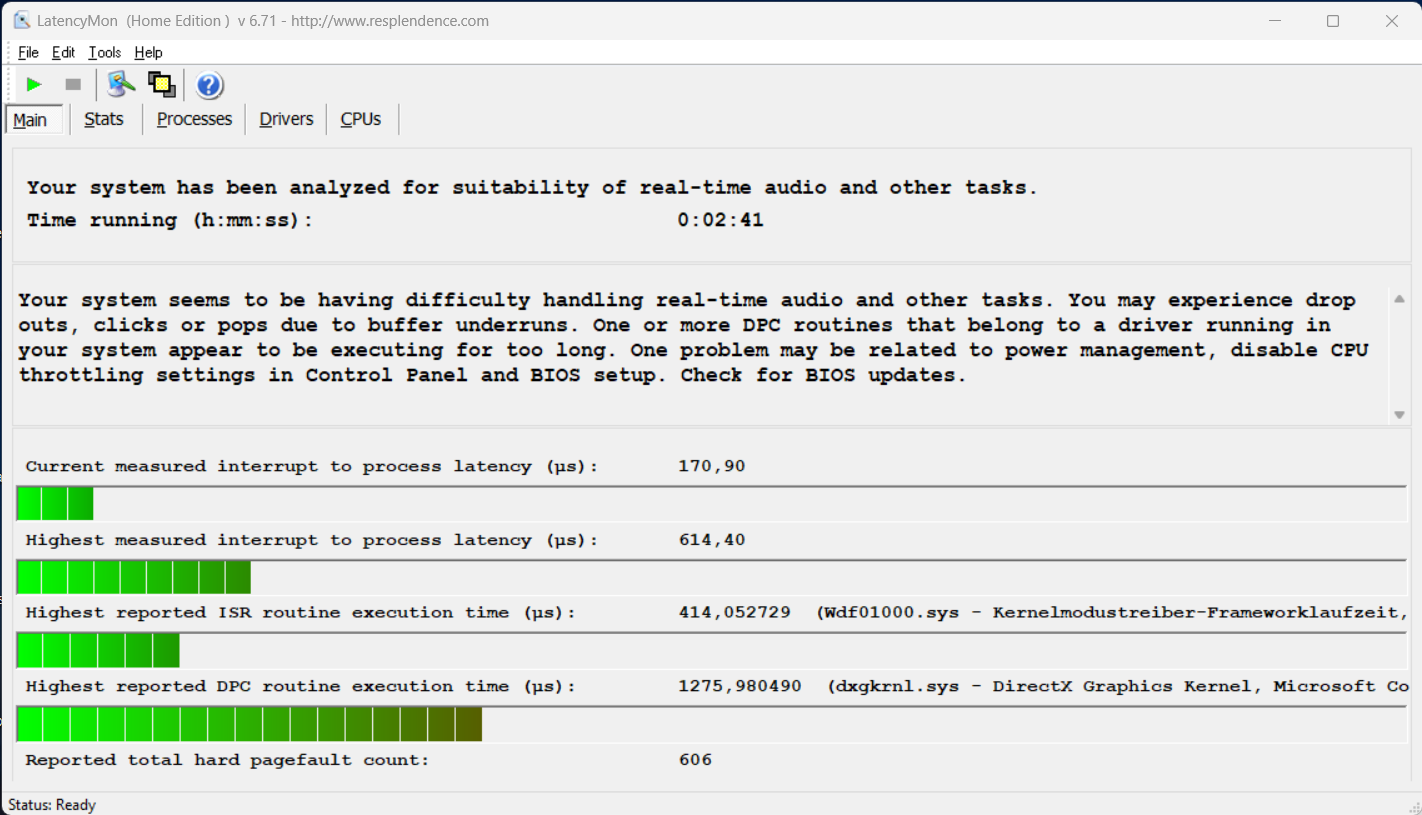
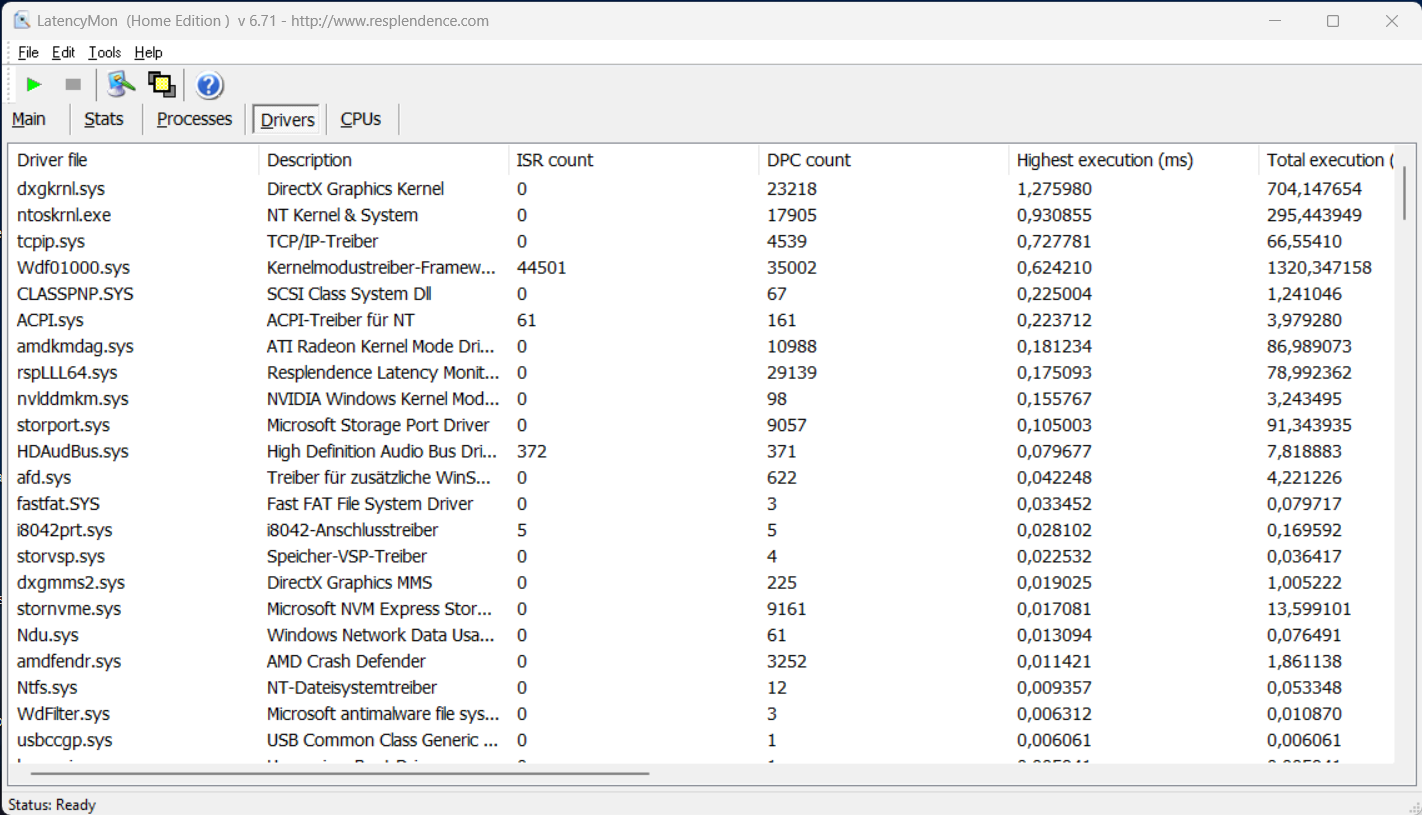
DPC latency
In our standardised latency test (web browsing, 4K YouTube playback, CPU load), the review unit didn’t exhibit any issues when running on the existing BIOS version. Only one driver showed a slight deviation, but this shouldn’t be a problem when you are using real-time audio applications.
| DPC Latencies / LatencyMon - interrupt to process latency (max), Web, Youtube, Prime95 | |
| Lenovo ThinkPad P1 G6-21FV000DGE | |
| HP ZBook Power 15 G10 | |
| Dell Precision 7670 | |
| Lenovo ThinkPad P16 G1 21D6001DMB | |
| Lenovo ThinkPad P16v G1 AMD | |
| Lenovo ThinkPad P15v G3 21EM001AGE | |
* ... smaller is better
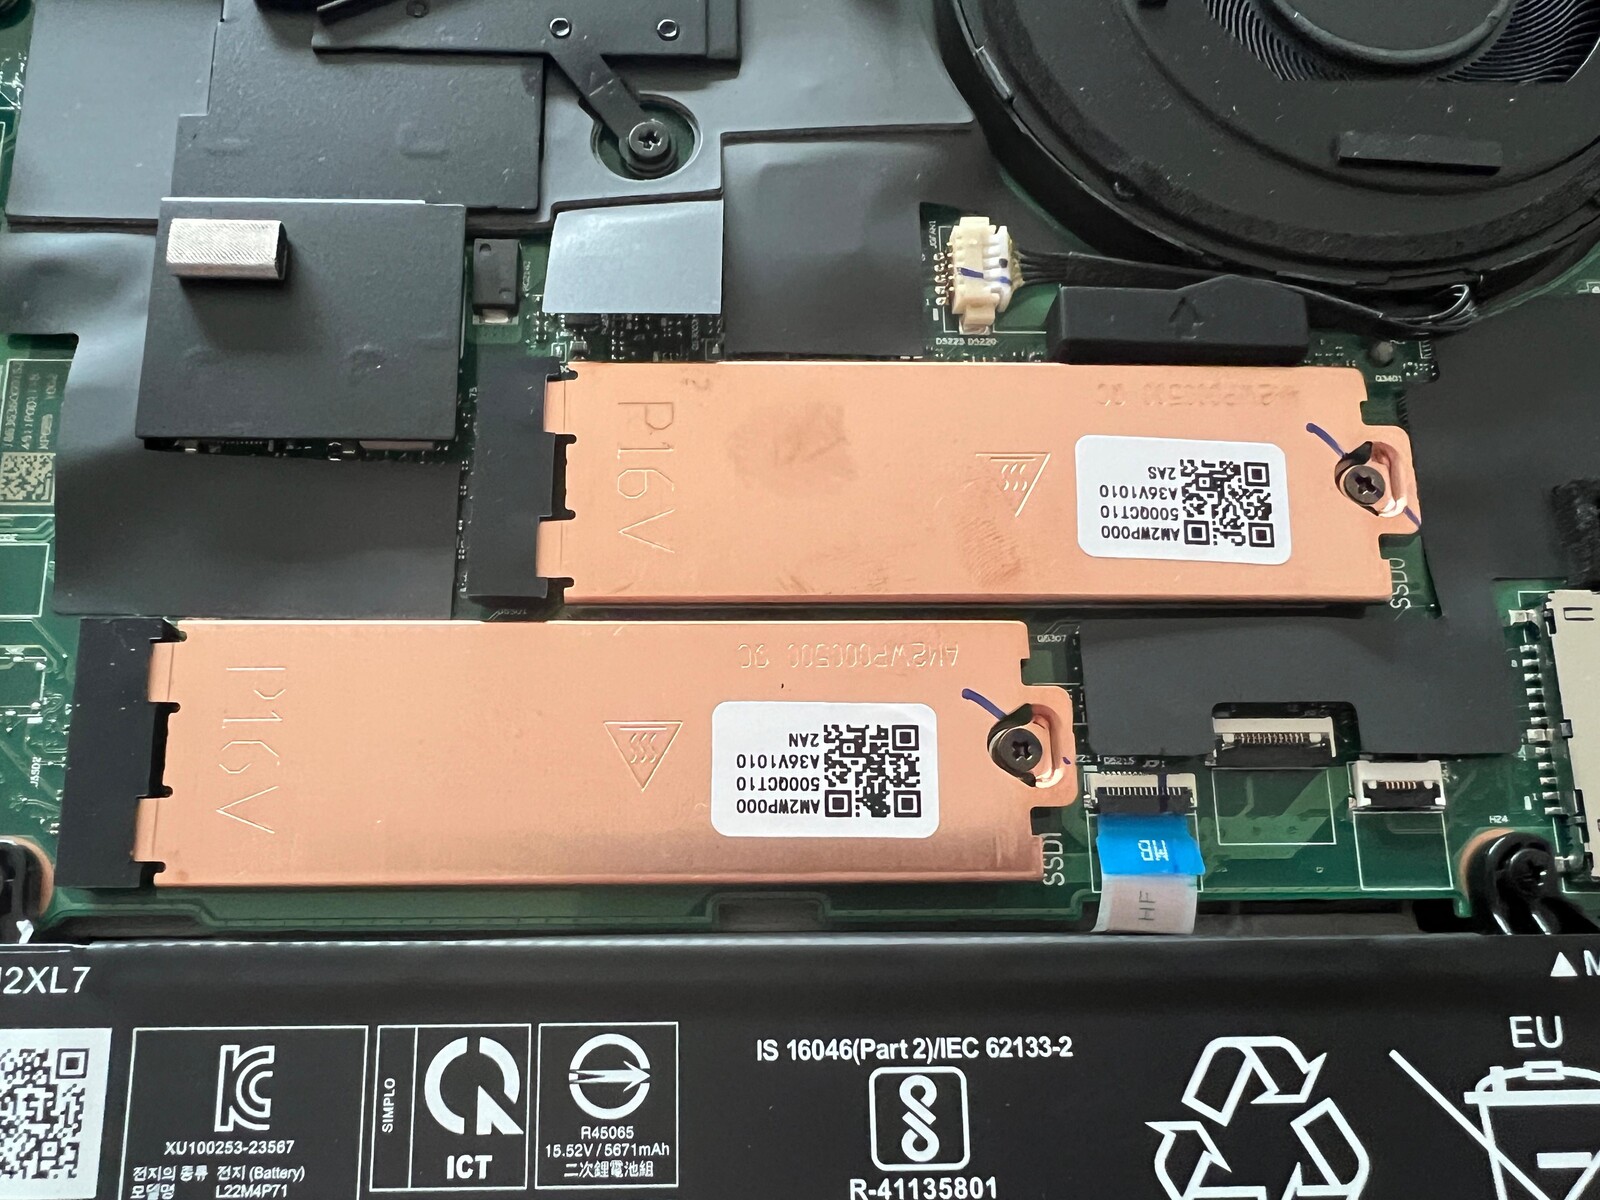
Mass storage
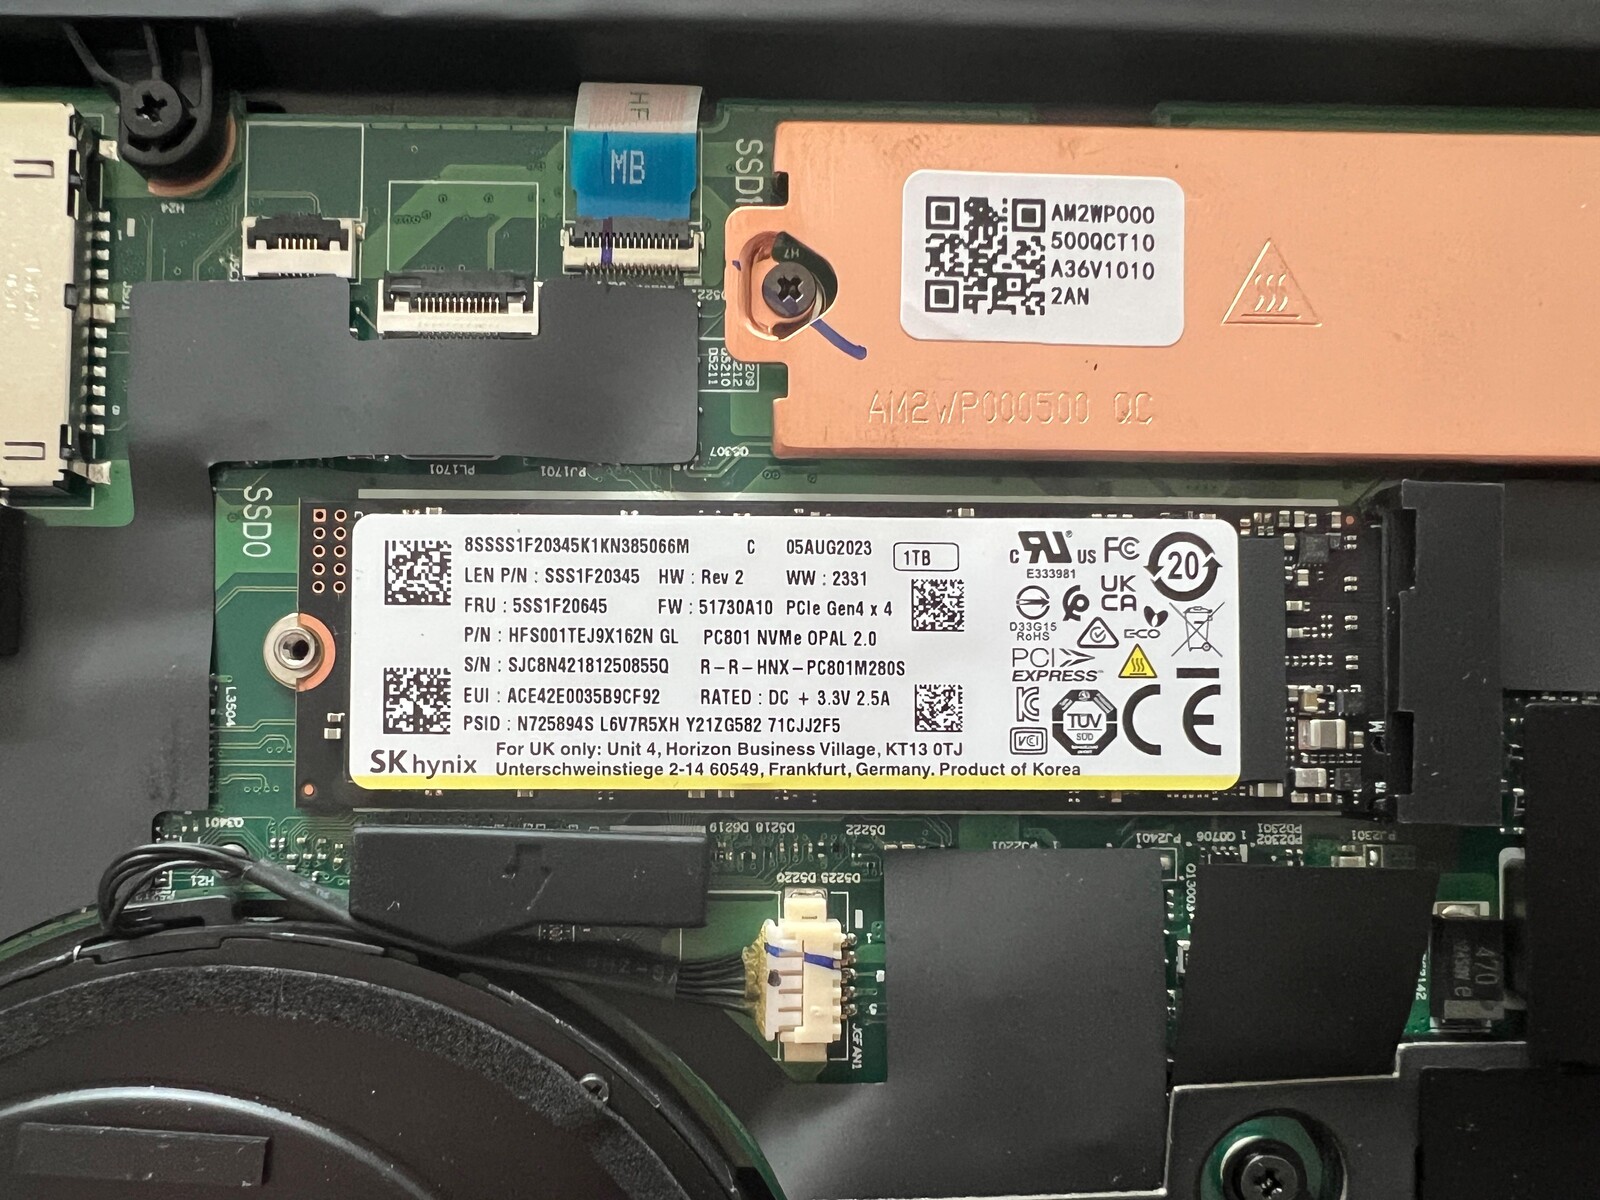
The ThinkPad P16v G1 provides two speedy PCIe 4.0 slots for M.2 2280 SSDs. Our review unit is shipped with the 1 TB version of the SK Hynix PC801. There is about 899 GB of usable space left after the initial setup. At over 7 GB/s, the max transfer speeds are superb. Thanks to the additional heatsink, the drive’s performance also remains perfectly stable even under prolonged load. You can find more SSD benchmark results listed here.

* ... smaller is better
Sustained load read: DiskSpd Read Loop, Queue Depth 8
Graphics card

The integrated Radeon 780M on the AMD chip handles graphics processing during simple tasks. For more-demanding work, the system will automatically switch to the dedicated RTX A1000 Laptop. This card is an Nvidia professional GPU that is unfortunately still not based on the current Ada Lovelace architecture. Instead, it uses the same GA107 chip also found on the consumer GPU GeForce RTX 3050.
The RTX A1000 in the laptop has 6 GB of VRAM and a TGP of 45 watts, meaning it’s a relatively slow variant (TGP can range from 35-95 watts for the A1000). It has around the same level of performance as the previous RTX A2000 with 4 GB of VRAM and similar TGP (see P15v G3 with 40 watts), but is far slower than the new RTX 2000 Ada (comparable with the GeForce RTX 4060 Laptop).
GPU performance stays absolutely stable under sustained load, though the graphics card has to make do with 40 watts of power when the laptop is running on battery. This causes graphics performance to drop by about 7%. More GPU benchmark results are available in our tech section.
| 3DMark 06 Standard Score | 48018 points | |
| 3DMark Vantage P Result | 58312 points | |
| 3DMark 11 Performance | 15795 points | |
| 3DMark Fire Strike Score | 10679 points | |
| 3DMark Time Spy Score | 4835 points | |
Help | ||
| Blender / v3.3 Classroom HIP/AMD | |
| Lenovo ThinkPad P15v G3 21EM001AGE | |
| Blender / v3.3 Classroom OPTIX/RTX | |
| Lenovo ThinkPad P16v G1 AMD | |
| Average NVIDIA RTX A1000 Laptop GPU (61 - 65, n=2) | |
| Lenovo ThinkPad P16 G1 21D6001DMB | |
| Lenovo ThinkPad P15v G3 21EM001AGE | |
| Lenovo ThinkPad P16 21D6001DMB A2000 Retest | |
| Dell Precision 7670 | |
| Lenovo ThinkPad P1 G6-21FV000DGE | |
| HP ZBook Power 15 G10 | |
| Average of class Workstation (10 - 95, n=19, last 2 years) | |
| Blender / v3.3 Classroom CUDA | |
| Average NVIDIA RTX A1000 Laptop GPU (108 - 112, n=2) | |
| Lenovo ThinkPad P16v G1 AMD | |
| Lenovo ThinkPad P15v G3 21EM001AGE | |
| Lenovo ThinkPad P16 G1 21D6001DMB | |
| Dell Precision 7670 | |
| Lenovo ThinkPad P16 21D6001DMB A2000 Retest | |
| Lenovo ThinkPad P1 G6-21FV000DGE | |
| HP ZBook Power 15 G10 | |
| Average of class Workstation (16 - 142, n=19, last 2 years) | |
| Blender / v3.3 Classroom CPU | |
| Lenovo ThinkPad P15v G3 21EM001AGE | |
| Average NVIDIA RTX A1000 Laptop GPU (329 - 448, n=2) | |
| Dell Precision 7670 | |
| Lenovo ThinkPad P1 G6-21FV000DGE | |
| Lenovo ThinkPad P16v G1 AMD | |
| HP ZBook Power 15 G10 | |
| Lenovo ThinkPad P16 21D6001DMB A2000 Retest | |
| Lenovo ThinkPad P16 G1 21D6001DMB | |
| Average of class Workstation (148 - 464, n=25, last 2 years) | |
* ... smaller is better
Gaming performance
You likewise won’t have any problems gaming on Nvidia’s professional drivers; we encountered zero issues during our testing. The gaming performance of the RTX A1000 is more or less on a par with an RTX 3050 with 6 GB of VRAM or an RTX 3050 Ti. Many older titles can thus run smoothly at 1080p and high to max settings. However, those who also want play more demanding games should go for the optional RTX 2000 Ada.
| The Witcher 3 - 1920x1080 Ultra Graphics & Postprocessing (HBAO+) | |
| Lenovo ThinkPad P1 G6-21FV000DGE | |
| HP ZBook Power 15 G10 | |
| Lenovo ThinkPad P16 21D6001DMB A2000 Retest | |
| Dell Precision 7670 | |
| Average of class Workstation (26.3 - 91.7, n=3, last 2 years) | |
| Lenovo ThinkPad P15v G3 21EM001AGE | |
| Lenovo ThinkPad P16 G1 21D6001DMB | |
| Lenovo ThinkPad P16v G1 AMD | |
| Far Cry 5 - 1920x1080 Ultra Preset AA:T | |
| Lenovo ThinkPad P1 G6-21FV000DGE | |
| HP ZBook Power 15 G10 | |
| Average of class Workstation (37 - 128, n=11, last 2 years) | |
| Lenovo ThinkPad P16v G1 AMD | |
| Average NVIDIA RTX A1000 Laptop GPU (n=1) | |
| F1 23 - 1920x1080 Ultra High Preset AA:T AF:16x | |
| Lenovo ThinkPad P1 G6-21FV000DGE | |
| Lenovo ThinkPad P16v G1 AMD | |
| Average NVIDIA RTX A1000 Laptop GPU (n=1) | |
| Average of class Workstation (n=1last 2 years) | |
Witcher 3 FPS chart
| low | med. | high | ultra | |
|---|---|---|---|---|
| GTA V (2015) | 168.2 | 129.4 | 62.7 | |
| The Witcher 3 (2015) | 257 | 165 | 87 | 43.2 |
| Dota 2 Reborn (2015) | 139.4 | 128.7 | 125 | 118.2 |
| Final Fantasy XV Benchmark (2018) | 129.2 | 67.9 | 48.3 | |
| X-Plane 11.11 (2018) | 99.8 | 88.6 | 71.9 | |
| Far Cry 5 (2018) | 132 | 85 | 79 | 73 |
| Strange Brigade (2018) | 261 | 111.4 | 90.2 | 78.4 |
| F1 2021 (2021) | 288 | 163.1 | 128.9 | 62.1 |
| F1 22 (2022) | 160.7 | 145.8 | 104.3 | 30.6 |
| F1 23 (2023) | 154.7 | 139.3 | 93.8 | 27 |
| Cyberpunk 2077 (2023) | 66.4 | 49.8 | 41.6 | 34.7 |
Emissions - Workstation with lousy speakers
Noise emissions
The two fans in the ThinkPad P16v G1 usually remain idle during basic tasks. Fan noise even stays pleasantly quiet (36 dB(A) based on our measurement) when you put only the processor or graphics card under load. We measured about 44 dB(A) of noise during gaming, but the fans tend to start rattling slightly at 40 dB(A) and above. The mobile workstation got very loud during the stress test, hitting around 50 dB(A). Our review unit didn’t produce any other electronic noises.
Noise level
| Idle |
| 24.3 / 24.3 / 24.3 dB(A) |
| Load |
| 35.7 / 50.2 dB(A) |
 | ||
30 dB silent 40 dB(A) audible 50 dB(A) loud |
||
min: | ||
| Lenovo ThinkPad P16v G1 AMD RTX A1000 Laptop GPU, R7 PRO 7840HS, SK hynix PC801 HFS001TEJ9X101N | HP ZBook Power 15 G10 RTX 2000 Ada Generation Laptop, R7 PRO 7840HS, WDC PC SN810 2TB | Lenovo ThinkPad P15v G3 21EM001AGE RTX A2000 Laptop GPU, R7 PRO 6850H, SK Hynix PC711 1TB HFS001TDE9X081N | Dell Precision 7670 RTX A2000 Laptop GPU, i7-12850HX, SK Hynix HFS001TEJ9X115N | Lenovo ThinkPad P1 G6-21FV000DGE RTX 2000 Ada Generation Laptop, i9-13900H, SK Hynix PC711 1TB HFS001TDE9X084N | Lenovo ThinkPad P16 21D6001DMB A2000 Retest RTX A2000 Laptop GPU, i7-12850HX, Micron 3400 1TB MTFDKBA1T0TFH | |
|---|---|---|---|---|---|---|
| Noise | 4% | 9% | -4% | -4% | -14% | |
| off / environment * (dB) | 24.3 | 24.2 -0% | 23.2 5% | 22.7 7% | 24.5 -1% | 24.7 -2% |
| Idle Minimum * (dB) | 24.3 | 24.4 -0% | 23.2 5% | 22.9 6% | 24.5 -1% | 24.7 -2% |
| Idle Average * (dB) | 24.3 | 24.4 -0% | 23.2 5% | 22.9 6% | 24.5 -1% | 26.2 -8% |
| Idle Maximum * (dB) | 24.3 | 24.4 -0% | 23.2 5% | 24.5 -1% | 24.5 -1% | 31.2 -28% |
| Load Average * (dB) | 35.7 | 27.4 23% | 35 2% | 48.7 -36% | 48 -34% | 48.3 -35% |
| Witcher 3 ultra * (dB) | 43.7 | 43.3 1% | 37.9 13% | 45.2 -3% | 40.7 7% | 52.7 -21% |
| Load Maximum * (dB) | 50.2 | 46.8 7% | 37.5 25% | 52.1 -4% | 48 4% | 52.7 -5% |
* ... smaller is better
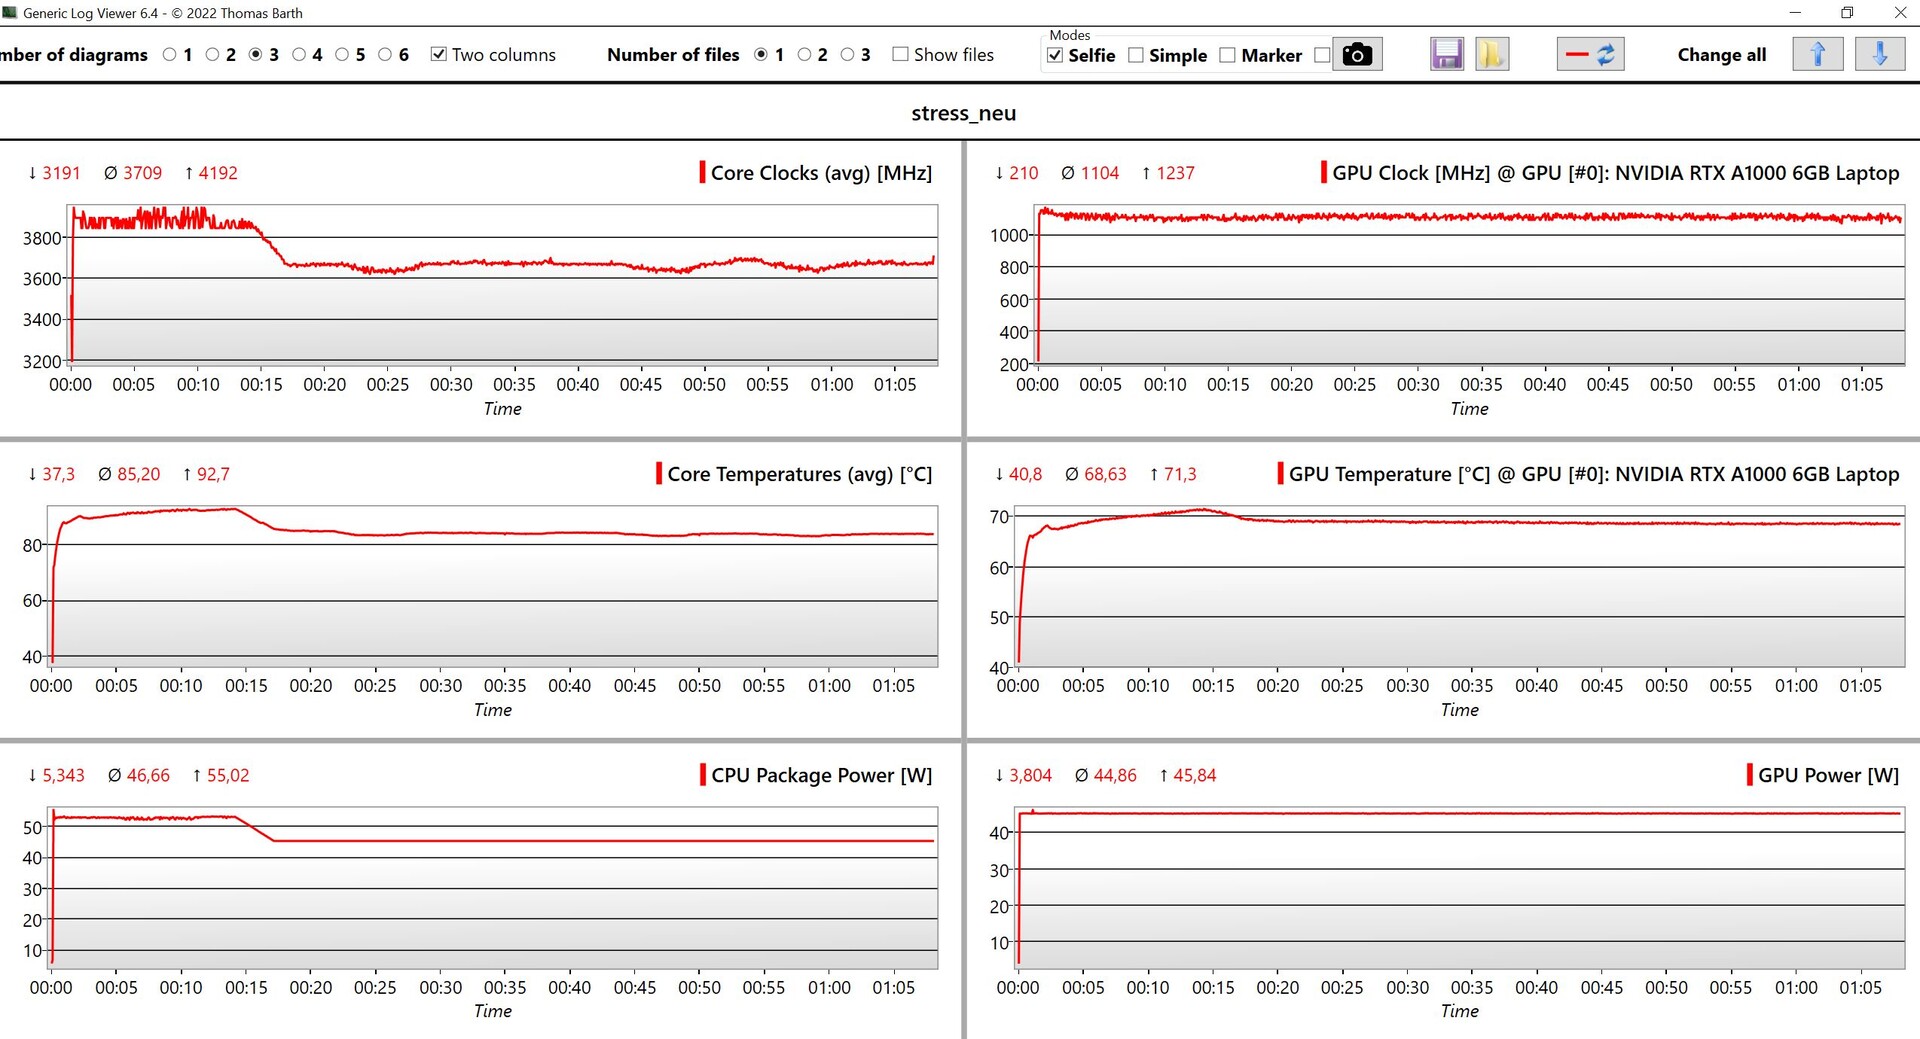
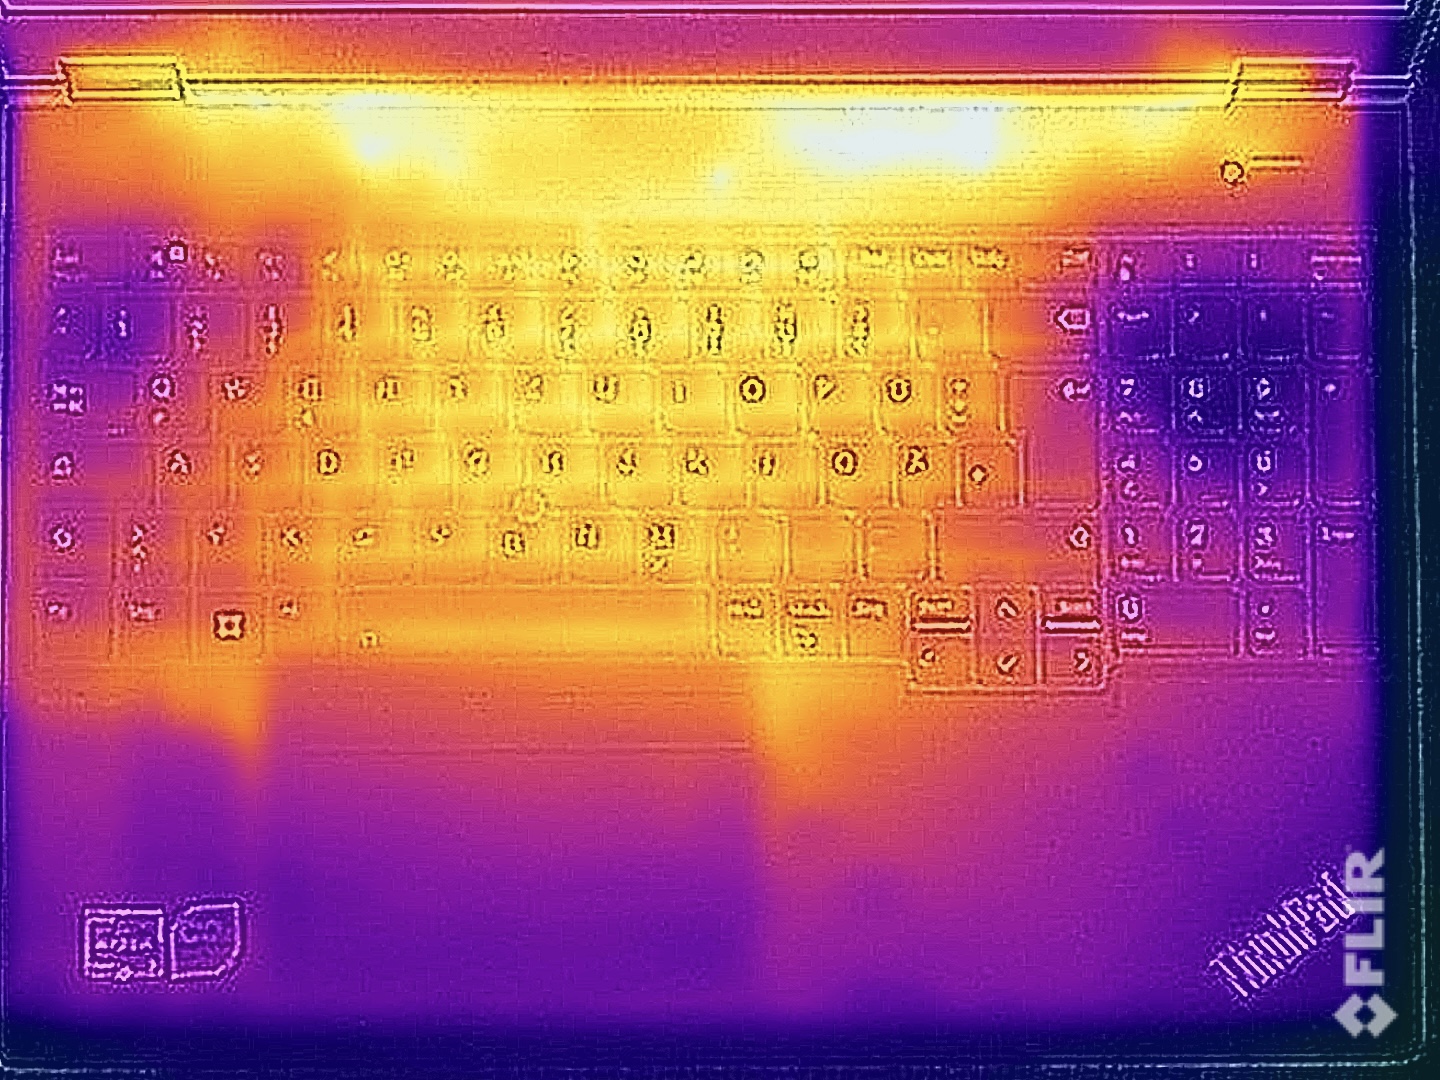
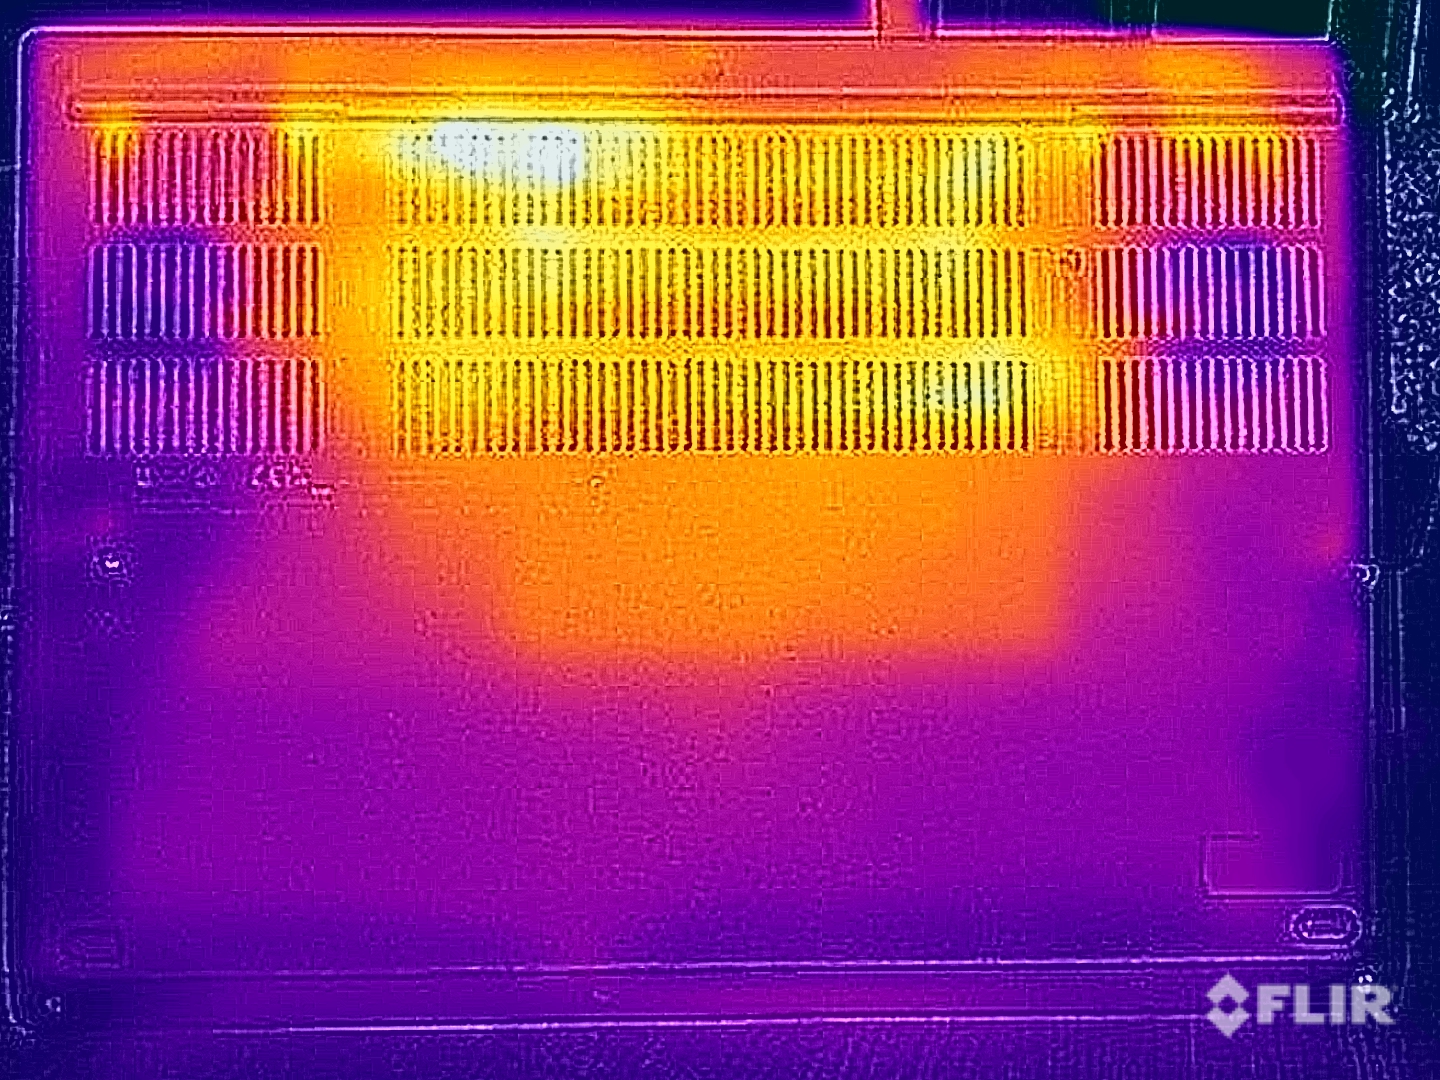
Temperature
There are no issues with surface temperatures at low load. However, this changes once you apply load to both the CPU and GPU. Especially on the bottom of the device, we measured temperatures above 55°C (131°F) at some spots, meaning you should definitely avoid direct skin contact with these areas. That said, the topside of the base section remained cooler, and temperatures were kept below the 40°C (104°F) mark almost everywhere on the keyboard. Therefore, it’s possible to type properly on the keyboard even under full load.
GPU power maintained at a stable 45 watts during the stress test, whilst the processor ran at 54 watts for roughly 12 minutes before settling down at 45 watts. On battery, the GPU still consumed 40 watts of power, but the processor dropped further to 18 watts.
(±) The maximum temperature on the upper side is 40.9 °C / 106 F, compared to the average of 38.2 °C / 101 F, ranging from 22.2 to 69.8 °C for the class Workstation.
(-) The bottom heats up to a maximum of 57.9 °C / 136 F, compared to the average of 41.1 °C / 106 F
(+) In idle usage, the average temperature for the upper side is 23.9 °C / 75 F, compared to the device average of 32 °C / 90 F.
(±) Playing The Witcher 3, the average temperature for the upper side is 32.7 °C / 91 F, compared to the device average of 32 °C / 90 F.
(+) The palmrests and touchpad are reaching skin temperature as a maximum (34.3 °C / 93.7 F) and are therefore not hot.
(-) The average temperature of the palmrest area of similar devices was 27.8 °C / 82 F (-6.5 °C / -11.7 F).
| Lenovo ThinkPad P16v G1 AMD AMD Ryzen 7 PRO 7840HS, NVIDIA RTX A1000 Laptop GPU | HP ZBook Power 15 G10 AMD Ryzen 7 PRO 7840HS, NVIDIA RTX 2000 Ada Generation Laptop | Lenovo ThinkPad P15v G3 21EM001AGE AMD Ryzen 7 PRO 6850H, NVIDIA RTX A2000 Laptop GPU | Dell Precision 7670 Intel Core i7-12850HX, NVIDIA RTX A2000 Laptop GPU | Lenovo ThinkPad P1 G6-21FV000DGE Intel Core i9-13900H, NVIDIA RTX 2000 Ada Generation Laptop | Lenovo ThinkPad P16 21D6001DMB A2000 Retest Intel Core i7-12850HX, NVIDIA RTX A2000 Laptop GPU | |
|---|---|---|---|---|---|---|
| Heat | -1% | -2% | -16% | -9% | -13% | |
| Maximum Upper Side * (°C) | 40.9 | 42.4 -4% | 48.7 -19% | 51 -25% | 47.1 -15% | 44 -8% |
| Maximum Bottom * (°C) | 57.9 | 47.8 17% | 50.5 13% | 45.8 21% | 56.5 2% | 46.8 19% |
| Idle Upper Side * (°C) | 24.5 | 26.8 -9% | 25 -2% | 31.8 -30% | 28.1 -15% | 31.8 -30% |
| Idle Bottom * (°C) | 25.5 | 27.2 -7% | 25.4 -0% | 32.6 -28% | 27.6 -8% | 33.5 -31% |
* ... smaller is better
Speakers
The two stereo speakers are pretty awful overall. Though mids and highs sound clean, which is useful for playing back voices, the speaker modules simply lack power and dynamics. Furthermore, bass is practically non-existent.
Lenovo ThinkPad P16v G1 AMD audio analysis
(±) | speaker loudness is average but good (74.9 dB)
Bass 100 - 315 Hz
(-) | nearly no bass - on average 19.8% lower than median
(±) | linearity of bass is average (8.8% delta to prev. frequency)
Mids 400 - 2000 Hz
(+) | balanced mids - only 3.8% away from median
(+) | mids are linear (5.4% delta to prev. frequency)
Highs 2 - 16 kHz
(+) | balanced highs - only 3.3% away from median
(+) | highs are linear (5% delta to prev. frequency)
Overall 100 - 16.000 Hz
(±) | linearity of overall sound is average (18.6% difference to median)
Compared to same class
» 63% of all tested devices in this class were better, 7% similar, 30% worse
» The best had a delta of 7%, average was 17%, worst was 35%
Compared to all devices tested
» 42% of all tested devices were better, 8% similar, 50% worse
» The best had a delta of 4%, average was 24%, worst was 134%
HP ZBook Power 15 G10 audio analysis
(±) | speaker loudness is average but good (74.4 dB)
Bass 100 - 315 Hz
(-) | nearly no bass - on average 24.9% lower than median
(±) | linearity of bass is average (11.1% delta to prev. frequency)
Mids 400 - 2000 Hz
(+) | balanced mids - only 1.8% away from median
(+) | mids are linear (4.6% delta to prev. frequency)
Highs 2 - 16 kHz
(+) | balanced highs - only 2.9% away from median
(+) | highs are linear (4.3% delta to prev. frequency)
Overall 100 - 16.000 Hz
(±) | linearity of overall sound is average (19.6% difference to median)
Compared to same class
» 70% of all tested devices in this class were better, 6% similar, 25% worse
» The best had a delta of 7%, average was 17%, worst was 35%
Compared to all devices tested
» 49% of all tested devices were better, 7% similar, 44% worse
» The best had a delta of 4%, average was 24%, worst was 134%
Power management - Long battery life
Power consumption
Power usage at idle didn't exceed 6.7 watts, which is extremely low for a 16-inch device. By contrast, it is no surprise that the ThinkPad required around 150 watts during the stress test, though this quickly dipped to about 135 watts. The included 170-watt adapter is therefore powerful enough for the laptop.
| Off / Standby | |
| Idle | |
| Load |
|
Key:
min: | |
| Lenovo ThinkPad P16v G1 AMD R7 PRO 7840HS, RTX A1000 Laptop GPU, SK hynix PC801 HFS001TEJ9X101N, IPS, 1920x1200, 16" | HP ZBook Power 15 G10 R7 PRO 7840HS, RTX 2000 Ada Generation Laptop, WDC PC SN810 2TB, IPS, 2560x1440, 15.6" | Lenovo ThinkPad P15v G3 21EM001AGE R7 PRO 6850H, RTX A2000 Laptop GPU, SK Hynix PC711 1TB HFS001TDE9X081N, IPS LED, 3840x2160, 15.6" | Dell Precision 7670 i7-12850HX, RTX A2000 Laptop GPU, SK Hynix HFS001TEJ9X115N, OLED, 3840x2400, 16" | Lenovo ThinkPad P1 G6-21FV000DGE i9-13900H, RTX 2000 Ada Generation Laptop, SK Hynix PC711 1TB HFS001TDE9X084N, IPS, 2560x1600, 16" | Lenovo ThinkPad P16 G1 21D6001DMB i7-12850HX, RTX A2000 Laptop GPU, Micron 3400 1TB MTFDKBA1T0TFH, IPS LED, 2560x1600, 16" | Average NVIDIA RTX A1000 Laptop GPU | Average of class Workstation | |
|---|---|---|---|---|---|---|---|---|
| Power Consumption | -40% | -52% | -115% | -74% | -39% | -26% | -91% | |
| Idle Minimum * (Watt) | 4.1 | 5.3 -29% | 6.3 -54% | 7.5 -83% | 8.3 -102% | 5.1 -24% | 4.2 ? -2% | 8.94 ? -118% |
| Idle Average * (Watt) | 6.5 | 9.9 -52% | 13.9 -114% | 9.5 -46% | 14.5 -123% | 9.2 -42% | 7.7 ? -18% | 13.8 ? -112% |
| Idle Maximum * (Watt) | 6.7 | 16.7 -149% | 14.5 -116% | 28.4 -324% | 15.3 -128% | 9.9 -48% | 12.8 ? -91% | 17.5 ? -161% |
| Load Average * (Watt) | 65.2 | 61.3 6% | 82.8 -27% | 139.1 -113% | 91.8 -41% | 124.1 -90% | 79.6 ? -22% | 95 ? -46% |
| Witcher 3 ultra * (Watt) | 77.2 | 87.9 -14% | 88.8 -15% | 134 -74% | 104.7 -36% | 87.7 -14% | ||
| Load Maximum * (Watt) | 147 | 145.3 1% | 124.8 15% | 220.8 -50% | 164.5 -12% | 168.9 -15% | 142.3 ? 3% | 175.2 ? -19% |
* ... smaller is better
Power consumption Witcher 3 / Stresstest
Power consumption with external monitor
Battery life
The combination of low power consumption and a 90 Wh battery allowed for very long battery life during our testing. The ThinkPad lasted nearly 18 hours in our video test at 150 cd/m² (equivalent to 71% of max brightness on our review unit) and almost 15 hours in our Wi-Fi test. Even with screen brightness turned all the way up, we still managed to get 12 hours out of the device. These are excellent results that competing devices can’t keep up with. Under max load, the battery became fully drained in a little more than an hour. It took around 2 hours to fully recharge the laptop when it was running, with the battery regaining 80% of its charge after 65 minutes.
| Lenovo ThinkPad P16v G1 AMD R7 PRO 7840HS, RTX A1000 Laptop GPU, 90 Wh | HP ZBook Power 15 G10 R7 PRO 7840HS, RTX 2000 Ada Generation Laptop, 83 Wh | Lenovo ThinkPad P15v G3 21EM001AGE R7 PRO 6850H, RTX A2000 Laptop GPU, 68 Wh | Dell Precision 7670 i7-12850HX, RTX A2000 Laptop GPU, 83 Wh | Lenovo ThinkPad P1 G6-21FV000DGE i9-13900H, RTX 2000 Ada Generation Laptop, 90 Wh | Lenovo ThinkPad P16 G1 21D6001DMB i7-12850HX, RTX A2000 Laptop GPU, 94 Wh | Average of class Workstation | |
|---|---|---|---|---|---|---|---|
| Battery runtime | -33% | -10% | -22% | -25% | 14% | -20% | |
| H.264 (h) | 17.8 | 10.7 -40% | 11.2 -37% | 9.51 ? -47% | |||
| WiFi v1.3 (h) | 15 | 10 -33% | 6.9 -54% | 5.9 -61% | 9.5 -37% | 9.4 -37% | 8.53 ? -43% |
| Load (h) | 1.1 | 1.8 64% | 1.3 18% | 1.1 0% | 1.8 64% | 1.429 ? 30% |
Pros
Cons
Verdict - ThinkPad P16v G1 is a great workstation


Lenovo launched the ThinkPad P16v G1 to replace the old ThinkPad P15v with a slightly larger 16-inch model. The basic idea behind the entry-level workstation remains the same: it is intended to be a relatively affordable gateway into the professional working world. The necessary CPU performance is provided by a current AMD Zen4 chip, which delivers great performance despite the somewhat low power limits of max 64 watts. But high-end workstations like the ThinkPad P16 with Intel’s HX CPUs offer even more processing power. Another point of criticism is that the CPU’s performance is massively reduced when the laptop is running on battery power.
Similarly, the only graphics card options available are low-end models from Nvidia (RTX A500, RTX A1000 or RTX 2000 Ada). But you can also completely forgo a dedicated GPU. The performance of the RTX A1000 with 6 GB of RAM is decent overall, though it is a relatively slow variant with a TGP of 45 watts. Given the laptop’s large 16-inch form factor, more could certainly have been got out of it.
The ThinkPad P16v G1 is Lenovo’s new entry-level model in the workstation segment. Its performance is adequate, though, needless to say, you have to put up with compromises in some areas (e.g. chassis quality, cooling performance) compared with the more expensive ThinkPad P16.
Being entirely made of plastic, the chassis quite clearly shows that the P16v G1 is an entry-level device. The device has good user-serviceability and features two SO-DIMM slots and space for two M.2 2280 SSDs. However, it is not possible to add a WWAN module because Lenovo hasn't preinstalled the necessary antennas or SIM card reader. The keyboard offers modern ThinkPad quality, and the Full HD display features full sRGB coverage and is a decent choice for normal tasks. There is also a 4K panel option (800 cd/m², P3 & HDR) if you want something better.
The biggest competitor to the ThinkPad P16v G1 is undoubtedly the HP ZBook Power G10, which feels more premium due to its metal chassis. Both laptops can be equipped with similar specs but otherwise don’t really differ much. Nevertheless, the HP still uses a 16:9 display and also can’t keep up with the ThinkPad in terms of battery life. Dell offers the Precision 3581 in this price range, but we still haven’t had the opportunity to give this device a go.
Price and availability
In Germany, the ThinkPad P16v G1 as spec'd is available from Campuspoint for €2,099 (US$2,298). You can also head on over the Lenovo Germany or Lenovo US to configure your own ThinkPad P16v G1. Student & teacher discount is also available for this laptop.
Lenovo ThinkPad P16v G1 AMD
- 01/03/2024 v7 (old)
Andreas Osthoff
Transparency
The selection of devices to be reviewed is made by our editorial team. The test sample was provided to the author as a loan by the manufacturer or retailer for the purpose of this review. The lender had no influence on this review, nor did the manufacturer receive a copy of this review before publication. There was no obligation to publish this review. As an independent media company, Notebookcheck is not subjected to the authority of manufacturers, retailers or publishers.
This is how Notebookcheck is testing
Every year, Notebookcheck independently reviews hundreds of laptops and smartphones using standardized procedures to ensure that all results are comparable. We have continuously developed our test methods for around 20 years and set industry standards in the process. In our test labs, high-quality measuring equipment is utilized by experienced technicians and editors. These tests involve a multi-stage validation process. Our complex rating system is based on hundreds of well-founded measurements and benchmarks, which maintains objectivity. Further information on our test methods can be found here.
Price comparison

