Notebook reviews with AMD Radeon 780M graphics card
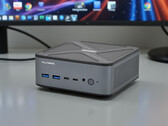
Alliwava GH8 review - Powerful and efficient mini PC with Ryzen 9 8945HS and USB4
The Alliwava GH8 aims to show just how much performance can be packed into a mini PC today. With the AMD Ryzen 9 8945HS, fast DDR5 RAM, and a PCIe SSD, the compact system comes with hardware that is usually found in much larger computers. But is the performance sufficient for everyday use, and how do the cooling, noise, and efficiency perform in practice? We get to the bottom of these questions in this review.
AMD Ryzen 9 8945HS, Radeon 780M, 516 gDynabook Tecra A65-M laptop review: Suitable ThinkPad E or EliteBook alternative
The Tecra A65-M doesn't do anything particularly special, but its core basics are solid to be a reliable and no-frills laptop for most office tasks that don't involve the most accurate colors.
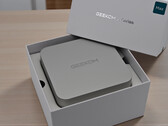
AMD Ryzen 7 250, Radeon 780M, 16", 1.7 kgGeekom A7 Max Mini-PC review: Elegant all-rounder with Ryzen 9 7940HS and wasted performance
With the Geekom A7 Max, the manufacturer is sending a powerful mini PC with AMD Ryzen 9 7940HS and Radeon 780M into the race. DDR5 RAM, a fast PCIe SSD, and numerous connections sound promising. But can the compact system deliver this performance over the long term - and how does it perform in terms of cooling, noise, and efficiency in everyday use?
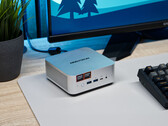
AMD Ryzen 9 7940HS, Radeon 780M, 681 gAffordable mini PC with sound onboard: Minisforum AI X1 for creatives, office users and gamers with AMD Ryzen power review
The Minisforum AI X1 is a compact mini PC with surprisingly high performance. Equipped with the AMD Ryzen 7 255, modern iGPU and efficient cooling, it is aimed at users who are looking for a versatile computer for work, multimedia, and light gaming. In our review, we check how well it performs in terms of performance, noise, and energy efficiency.
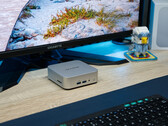
AMD Ryzen 7 255, Radeon 780M, 658 gGeekom A8 new 2025 edition with AMD Ryzen 7: Powerful and efficient mini PC for office, multimedia and home office in the review
The Geekom A8 brings together AMD’s Ryzen 7 8745HS, Radeon 780M graphics, DDR5 memory, and a PCIe SSD in a compact and modern chassis. It’s also more affordable than the top-tier variant, but can the slightly less powerful configuration keep up with the strong competition? And how efficient is the mini PC in everyday use? We put the Geekom A8 through extensive testing to evaluate its performance, efficiency, and overall capabilities.
AMD Ryzen 7 8745HS, Radeon 780M, 425 gAlliwava H90 Pro: AMD Ryzen 7 8745HS, 0.5 kg
Review » Performance meets efficiency: Alliwava H90 Pro Mini-PC review with AMD Ryzen 7 APU
HP EliteBook 8 G1a 14 AD3E9ET: AMD Ryzen 7 250, 14.00", 1.4 kg
Review » This more affordable AMD Ryzen 7 version is still a winner: HP EliteBook 8 G1a 14 laptop review
GMK NucBox K12: AMD Ryzen 7 H 255, 0.9 kg
Review » GMK NucBox K12 mini PC review: Bigger, but not necessarily faster
Lenovo ThinkPad E14 Gen 7 21T0003NGE: AMD Ryzen 7 250, 14.00", 1.5 kg
Review » AMD the worse choice than Intel for this business laptop: Lenovo ThinkPad E14 Gen 7 review
Peladn HA-4, R7 7840HS: AMD Ryzen 7 7840HS, 1 kg
Review » Powerful mini PC for the money? Peladn HA-4 challenges Geekom, Minisforum and co. - the efficiency miracle with Ryzen 7 7840HS review
Beelink SER9 Pro: AMD Ryzen 7 H 255, 0.8 kg
Review » Beelink SER9 Pro Ryzen 7 mini PC review: The regular non-Pro version is faster
Ninkear M8, 32+1TB: AMD Ryzen 7 8745HS, 0.5 kg
Review » Better than Geekom & Minisforum? How does the Ninkear M8 mini PC with AMD Ryzen 7 perform in the review
BOSGAME M4 Neo: AMD Ryzen 7 7840HS, 0.6 kg
Review » Bosgame M4 Neo test - the affordable alternative to expensive mini PCs
Chuwi Aubox, R7 8745HS: AMD Ryzen 7 8745HS, 0.7 kg
Review » Best Mini PC for under 450 dollars? Chuwi AuBox with AMD Ryzen 7 8745HS review
Geekom A8 Max, R7 8845HS: AMD Ryzen 7 8845HS, 0.7 kg
Review » Best value with AMD Ryzen 7 8845HS? – The Geekom A8 Max mini PC review
Asus VivoBook 18 M1807HA: AMD Ryzen 7 260, 18.40", 2.6 kg
Review » Asus VivoBook 18 laptop review: The display monster for just under $1,000
Minisforum EliteMini UM890 Pro: AMD Ryzen 9 8945HS, 0.7 kg
Review » Minisforum EliteMini UM890 Pro review: A powerful mini PC with AMD Ryzen 9 and whisper-quiet cooling
Lenovo IdeaPad Slim 3 14 AHP G10: AMD Ryzen 7 8840HS, 14.00", 1.5 kg
Review » Lenovo IdeaPad Slim 3 14 review - An affordable multimedia laptop with plenty of power thanks to Zen 4
GMK NucBox K11: AMD Ryzen 9 8945HS, 0.6 kg
Review » GMK NucBox K11 mini PC review: Strong performance-per-dollar with AMD Zen 4
Zotac ZGC-G1A1W-01: AMD Ryzen 7 8840U, 7.00", 0.7 kg
Review » ZOTAC Gaming Zone handheld review: Precision controller, brilliant OLED and compact
BOSGAME M2: AMD Ryzen 9 7940HS, 0.8 kg
Review » BOSGAME M2 mini PC review: Fixes a major complaint about the original M1
Lenovo ThinkPad P14s G5 21ME000TGE: AMD Ryzen 7 PRO 8840HS, 14.00", 1.4 kg
Review » OLED eats battery life: Lenovo ThinkPad P14s Gen 5 AMD laptop review
HP EliteBook 845 G11: AMD Ryzen 7 PRO 8840HS, 14.00", 1.5 kg
Review » HP EliteBook 845 G11 Laptop Review - No major changes, but still one of the best business notebooks
Lenovo ThinkPad T14 Gen 5 21MC003QGE: AMD Ryzen 7 8840U, 14.00", 1.5 kg
Review » AMD much faster than Intel: Lenovo ThinkPad T14 Gen 5 laptop review
Ayaneo Flip KB: AMD Ryzen 7 8840U, 7.00", 0.7 kg
Review » Ayaneo Flip KB review - handheld console with great functionality powered by the less efficient AMD Ryzen 7 8840U
Lenovo Yoga 7 2-in-1 14AHP9: AMD Ryzen 7 8840HS, 14.00", 1.6 kg
Review » Lenovo Yoga 7 2-in-1 14AHP9 review: Fast midrange convertible dragged down by a weak display
Lenovo IdeaPad 5 2-in-1 14AHP9: AMD Ryzen 7 8845HS, 14.00", 1.6 kg
Review » IdeaPad 5 2-in-1 14AHP9 convertible review: One of Lenovo's cheapest is also its fastest
Ninkear A16 Pro: AMD Ryzen 7 8845HS, 16.00", 1.8 kg
Review » Ninkear A16 Pro laptop review: Affordable, powerful and quiet during use
Zotac ZGC-G1A1W-01: AMD Ryzen 7 8840U, 7.00", 0.7 kg
Review » Zotac Zone review: Display galore with class-leading inputs
Minisforum MS-A1: AMD Ryzen 7 8700G, 1.7 kg
Review » Minisforum MS-A1 review: Workstation supports various AMD CPUs and offers space for four SSDs
Schenker XMG Evo 14 (M24): AMD Ryzen 7 8845HS, 14.00", 1.5 kg
Review » Schenker XMG Evo 14 (M24) laptop review - A good allrounder with a Ryzen 8000 and up to 96 GB RAM
Geekom AX8 Pro: AMD Ryzen 9 8945HS, 0.5 kg
Review » Geekom AX8 Pro AI NUC PC review: AMD Ryzen 9 8945HS with 32 GB DDR5 RAM and 2 TB SSD in a 0.47L chassis
Lenovo ThinkPad X13 Gen 4 21J3001VGE: AMD Ryzen 7 PRO 7840U, 13.30", 1.3 kg
Review » Lenovo ThinkPad X13 Gen 4 AMD laptop review: Compact Ryzen machine with mediocre performance
Asus ROG Ally X: AMD Ryzen Z1 Extreme, 7.00", 0.7 kg
Review » Asus ROG Ally X Review - The best gaming handheld thanks to faster RAM and a huge 80 Wh battery
Geekom AE7: AMD Ryzen 9 7940HS, 0.6 kg
Review » Geekom AE7 review: NUC mini-PC with AMD Ryzen 9 7940HS, DDR5 RAM, modern interfaces and one problem
Schenker VIA 14 Pro (M24): AMD Ryzen 7 8845HS, 14.00", 1.4 kg
Review » Schenker VIA 14 Pro (M24) review - Compact AMD subnotebook now with Ryzen 8000 and brighter display
Beelink SER8: AMD Ryzen 7 8845HS, 0.8 kg
Review » Beelink SER8 PC review: Mac Mini-inspired design with an AMD Ryzen 7 8845HS
Dell Inspiron 14 7445 2-in-1: AMD Ryzen 7 8840HS, 14.00", 1.7 kg
Review » Dell Inspiron 14 7445 2-in-1 convertible review: Transitioning from Ryzen-U to Ryzen-HS
Aoostar GEM12: AMD Ryzen 7 8845HS, 0.7 kg
Review » Aoostar GEM12 Mini-PC review: AMD Ryzen 7 8845HS with 32 GB RAM, 1 TB SSD and OCuLink interface
GPD Win Mini 2024 7": AMD Ryzen 7 8840U, 7.00", 0.5 kg
Review » GPD Win Mini Zen 4 handheld review: Solid alternative to the Asus ROG Ally
Geekom A8, R9 8945HS: AMD Ryzen 9 8945HS, 0.4 kg
Review » Geekom A8 review: Premium 0.5-liter mini-PC with AMD Ryzen 9 8945HS, 32 GB DDR5 RAM and 2 TB SSD
Lenovo ThinkPad T16 G2 21K70035GE: AMD Ryzen 7 7840U, 16.00", 1.8 kg
Review » Lenovo ThinkPad T16 G2 AMD Laptop Review: Big ThinkPad even better with Ryzen 7040
BOSGAME M1: AMD Ryzen 7 7840HS, 0.8 kg
Review » BOSGAME M1 mini PC review: Ryzen 7 7840HS is still a beast
HP Envy x360 2-in-1 16-ad0097nr: AMD Ryzen 7 8840HS, 16.00", 1.8 kg
Review » HP Envy x360 2-in-1 16 review: Ryzen 7 8840HS beats Core Ultra 7 155U
Asus Zenbook 14 OLED UM3406HA: AMD Ryzen 7 8840HS, 14.00", 1.2 kg
Review » Asus Zenbook 14 OLED review - The AMD variant of the Zenbook has received the weaker 1080p OLED screen
Minisforum V3: AMD Ryzen 7 8840U, 14.00", 0.9 kg
Review » Minisforum V3 3-in-1 review: the first ever Windows tablet with AMD's Hawk Point APU aka the AMD Ryzen 7 8840U
Acemagic AM18: AMD Ryzen 7 7840HS, 0.6 kg
Review » Acemagic AM18 review: Gaming mini-PC in eye-catching cyberpunk look with AMD Ryzen 7 7840HS and 32 GB RAM
GMK NucBox K6: AMD Ryzen 7 7840HS, 0.5 kg
Review » GMK NucBox K6 mini PC review: As powerful as the latest Intel Core Ultra laptops
Lenovo IdeaPad Pro 5 14AHP9: AMD Ryzen 7 8845HS, 14.00", 1.5 kg
Review » Lenovo IdeaPad Pro 5 14AHP9 laptop review - The powerful ultraportable with Ryzen 8000 and 120-Hz OLED
Minisforum Mercury Series EM780: AMD Ryzen 7 7840U, 0.2 kg
Review » Minisforum Mercury Series EM780 review: Extremely compact mini-PC with AMD Ryzen 7 7840U, 32 GB of RAM and 1 TB SSD
Geekom A7: AMD Ryzen 9 7940HS, 0.4 kg
Review » Geekom A7 with 0.5l case in review: Premium mini-PC with AMD Ryzen 9 7940HS, 32 GB DDR5 RAM and 2 TB SSD
HP EliteBook 865 G10: AMD Ryzen 9 PRO 7940HS, 16.00", 1.9 kg
Review » HP EliteBook 865 G10 laptop review - Capable business laptop ruined by Sure View
Asus ROG Zephyrus G14 2024 GA403U: AMD Ryzen 9 8945HS
Review » AMD Ryzen 8000 Hawk Point in testing - Zen4 refresh outperforms Meteor Lake in number crunching and GPU performance
ONEXPLAYER 2 Pro AR18: AMD Ryzen 7 7840U, 8.40", 0.9 kg
Review » OneXPlayer 2 Pro gaming handheld, tablet or detachable in review: multifaceted device with strong Ryzen 7
Ayaneo Kun: AMD Ryzen 7 7840U, 8.40", 0.9 kg
Review » Ayaneo Kun gaming handheld in review: Performance beast for individualists
Lenovo ThinkPad P16s G2 21K9000CGE: AMD Ryzen 7 PRO 7840U, 16.00", 1.8 kg
Review » Lenovo ThinkPad P16s G2 AMD review: Power plus OLED inside this workstation laptop
Tuxedo Pulse 14 Gen3: AMD Ryzen 7 7840HS, 14.00", 1.4 kg
Review » Tuxedo Pulse 14 Gen3 review - The Linux Ultrabook with AMD Zen4 and a 120-Hz display
Lenovo ThinkPad P14s G4 21K5000LGE: AMD Ryzen 7 PRO 7840U, 14.00", 1.3 kg
Review » Lenovo ThinkPad P14s G4 AMD review: fast, portable, straightforward
Lenovo ThinkPad Z13 Gen 2: AMD Ryzen 7 PRO 7840U, 13.30", 1.2 kg
Review » ThinkPad Z13 Gen 2 laptop review: Lenovo's answer to the Dell XPS 13
Lenovo Legion Go: AMD Ryzen Z1 Extreme, 8.80", 0.8 kg
Review » Lenovo Legion Go gaming handheld review: Good idea, not quite perfectly executed
Lenovo Yoga Pro 7 14APH G8: AMD Ryzen 7 7840HS, 14.50", 1.5 kg
Review » Lenovo Yoga Pro 7 14 G8 laptop review - AMD Zen4 isn’t automatically better
Lenovo ThinkPad T14 G4 21K4S02000: AMD Ryzen 7 PRO 7840U, 14.00", 1.5 kg
Review » Lenovo ThinkPad T14 G4 AMD Laptop Review: Ryzen power in the compact ThinkPad
Minisforum EliteMini UM780 XTX: AMD Ryzen 7 7840HS, 0.8 kg
Review » Minisforum EliteMini UM780 XTX review: The mini PC with an AMD Ryzen 7 7840HS and a Radeon 780M has been given OCuLink and USB-4 connections
HP Pavilion Plus 14-ey0095cl: AMD Ryzen 7 7840U, 14.00", 1.4 kg
Review » HP Pavilion Plus 14 Ryzen 7 laptop review: Changes in all the right places
Lenovo ThinkPad T14s G4-21F8002TGE: AMD Ryzen 7 7840U, 14.00", 1.4 kg
Review » Lenovo ThinkPad T14s G4 review: Business laptop is better with AMD Zen4
Lenovo Yoga Slim 7 14APU G8: AMD Ryzen 7 7840S, 14.50", 1.3 kg
Review » Lenovo Yoga Slim 7 14 G8 AMD Review - Custom Zen4 CPU meets great 2.9K OLED
Ayaneo Air 1S Retro Power : AMD Ryzen 7 7840U, 5.50", 0.4 kg
Review » Ayaneo Air 1S Retro Power gaming handheld in test - Zen4 Power for your pocket
Acer Swift Edge SFE16 Ryzen 7 7840U: AMD Ryzen 7 7840U, 16.00", 1.2 kg
Review » Acer Swift Edge 16 Ryzen 7 7840U laptop review: Zen 4 CPU and 3.2K 120 Hz OLED boost
Framework Laptop 13.5 Ryzen 7 7840U: AMD Ryzen 7 7840U, 13.50", 1.3 kg
Review » Framework Laptop 13.5 Ryzen 7 7840U review: So much better than the Intel version
HP EliteBook 845 G10 5Z4X0ES: AMD Ryzen 7 7840U, 14.00", 1.5 kg
Review » HP EliteBook 845 G10 review: Business laptop impresses with AMD Ryzen 7 7840U and unbeatable price
Beelink SER7: AMD Ryzen 7 7840HS, 0.6 kg
Review » Beelink SER7 mini PC review: Ryzen 7 7840HS with vapor chamber cooling
HP EliteBook 845 G10 818N0EA: AMD Ryzen 9 PRO 7940HS, 14.00", 1.5 kg
Review » HP EliteBook 845 G10 review: The almost perfect business laptop with AMD Zen4
Review » Testing the performance of AMD Radeon 780M & 760M iGPUs with new drivers
Minisforum Venus Series UM790 Pro: AMD Ryzen 9 7940HS, 0.7 kg
Review » Minisforum Venus Series UM790 Pro review: Better than its competitors thanks to an AMD Ryzen 9 7940HS and a Radeon 780M
Beelink GTR7 7840HS: AMD Ryzen 7 7840HS, 0.9 kg
Review » AMD Ryzen 7 7840HS performance debut: Beelink GTR7 mini PC review
Asus ROG Ally Z1 Extreme: AMD Ryzen Z1 Extreme, 7.00", 0.6 kg
Review » Asus ROG Ally Z1 Extreme Review - Gaming handheld with 120 Hz display and AMD Zen4
: , 0.00"
Review » AMD Radeon 780M iGPU analysis - AMD's new RDNA-3 GPU takes on its competitors
Asus ROG Zephyrus G14 GA402XY: AMD Ryzen 9 7940HS, 14.00"
Review » AMD Radeon 780M iGPU analysis - AMD's new RDNA-3 GPU takes on its competitors
Review » AMD Ryzen 9 7940HS analysis - Zen4 Phoenix is ideally as efficient as Apple
Asus ROG Ally X: AMD Ryzen Z1 Extreme
External Review » Asus ROG Ally X - Reviews and Specs
HP ProBook 4 G1a 14: AMD Ryzen 7 250, 14.00", 1.4 kg
External Review » HP ProBook 4 G1a 14
Lenovo IdeaPad Slim 3 15AHP10: AMD Ryzen 7 8840HS, 15.30", 1.6 kg
External Review » Lenovo IdeaPad Slim 3 15AHP10
Acer TravelMate P4 TMP414-42: AMD Ryzen 7 8840U, 14.00", 1.5 kg
External Review » Acer TravelMate P4 TMP414-42
HP EliteBook 8 G1a 14 AD3E9ET: AMD Ryzen 7 250, 14.00", 1.4 kg
External Review » HP EliteBook 8 G1a 14
HP Omnibook 5 16-bc1000: AMD Ryzen 7 8840U, 16.00", 1.8 kg
External Review » HP Omnibook 5 16-bc1000
HP EliteBook 865 G11: AMD Ryzen 7 8840U, 1.00", 1.9 kg
External Review » HP EliteBook 865 G11
Lenovo ThinkPad T14 G4 21K4S02000: AMD Ryzen 7 PRO 7840U, 14.00", 1.5 kg
External Review » Lenovo ThinkPad T14 G4 21K4S02000
Lenovo IdeaPad 5 16AHP9: AMD Ryzen 7 8845HS, 16.00", 1.9 kg
External Review » Lenovo IdeaPad 5 16AHP9
Asus Vivobook S 15 OLED M5506UA: AMD Ryzen 7 8845HS, 15.60", 1.5 kg
External Review » Asus Vivobook S 15 OLED M5506UA
Acer Nitro Blaze 11: AMD Ryzen 7 8840HS, 10.95", 1.1 kg
External Review » Acer Nitro Blaze 11
Lenovo IdeaPad 5 2-in-1 14AHP9, R7 8845HS: AMD Ryzen 7 8845HS, 14.00", 1.6 kg
External Review » Lenovo IdeaPad 5 2-in-1 14AHP9, R7 8845HS
Acer Nitro Blaze 7: AMD Ryzen 7 8840HS, 7.00", 0.7 kg
External Review » Acer Nitro Blaze 7
HP EliteBook 845 G11: AMD Ryzen 7 PRO 8840HS, 14.00", 1.5 kg
External Review » HP EliteBook 845 G11
Acer Swift Go 14 SFG14-63, R7 8845HS: AMD Ryzen 7 8845HS, 14.00", 1.3 kg
External Review » Acer Swift Go 14 SFG14-63, R7 8845HS
Lenovo ThinkPad T14 G5: AMD Ryzen 7 8840U, 14.00", 1.4 kg
External Review » Lenovo ThinkPad T14 G5
Acer Aspire 15 A15-41M: AMD Ryzen 7 8840HS, 15.60", 1.7 kg
External Review » Acer Aspire 15 A15-41M
Honor MagicBook X16 Plus 2024: AMD Ryzen 7 8845HS, 16.00", 1.8 kg
External Review » Honor MagicBook X16 Plus 2024
Acer Swift Edge SFE16-44: AMD Ryzen 7 8840U, 16.00", 1.2 kg
External Review » Acer Swift Edge SFE16-44
HP Envy x360 14-fa0000: AMD Ryzen 7 8840HS, 14.00", 1.4 kg
External Review » HP Envy x360 14-fa0000
HP Pavilion Aero 13-bg0000: AMD Ryzen 7 8840HS, 13.30", 1 kg
External Review » HP Pavilion Aero 13-bg0000
Lenovo Yoga 7 14AHP9: AMD Ryzen 7 8840HS, 14.00", 1.5 kg
External Review » Lenovo Yoga 7 14AHP9
Dell Inspiron 14 7445 2-in-1: AMD Ryzen 7 8840HS, 14.00", 1.7 kg
External Review » Dell Inspiron 14 7445 2-in-1
Asus Vivobook S 14 OLED M5406UA: AMD Ryzen 7 8845HS, 14.00", 1.3 kg
External Review » Asus Vivobook S 14 OLED M5406UA
Asus VivoBook S 14 OLED S5406UA: AMD Ryzen 9 8945HS, 14.00", 1.3 kg
External Review » Asus VivoBook S 14 OLED S5406UA
Asus ROG Ally X: AMD Ryzen Z1 Extreme, 7.00", 0.7 kg
External Review » Asus ROG Ally X
Lenovo ThinkPad T16 G2 21K70035GE: AMD Ryzen 7 7840U, 16.00", 1.8 kg
External Review » Lenovo ThinkPad T16 G2 21K70035GE
HP Envy x360 2-in-1 16-ad0097nr: AMD Ryzen 7 8840HS, 16.00", 1.8 kg
External Review » HP Envy x360 2-in-1 16-ad0097nr
HP ZBook Firefly 14 G10, R7 7840HS: AMD Ryzen 7 7840HS, 14.00", 1.5 kg
External Review » HP ZBook Firefly 14 G10, R7 7840HS
Asus Zenbook 14 OLED UM3406HA: AMD Ryzen 7 8840HS, 14.00", 1.2 kg
External Review » Asus Zenbook 14 OLED UM3406HA
HP EliteBook 865 G10, R7 PRO 7840U: AMD Ryzen 7 PRO 7840U, 16.00", 1.8 kg
External Review » HP EliteBook 865 G10, R7 PRO 7840U
Lenovo ThinkPad P14s G4 21K5000LGE: AMD Ryzen 7 PRO 7840U, 14.00", 1.3 kg
External Review » Lenovo ThinkPad P14s G4 21K5000LGE
HP EliteBook 865 G10: AMD Ryzen 9 PRO 7940HS, 16.00", 1.9 kg
External Review » HP EliteBook 865 G10
Lenovo IdeaPad Pro 5 16APH8: AMD Ryzen 7 7840HS, 16.00", 1.9 kg
External Review » Lenovo IdeaPad Pro 5 16APH8
Lenovo IdeaPad Pro 5 14AHP9: AMD Ryzen 7 8845HS, 14.00", 1.5 kg
External Review » Lenovo IdeaPad Pro 5 14AHP9
HP EliteBook 845 G10 5Z4X0ES: AMD Ryzen 7 7840U, 14.00", 1.5 kg
External Review » HP EliteBook 845 G10 5Z4X0ES
Lenovo ThinkPad Z13 Gen 2: AMD Ryzen 7 PRO 7840U, 13.30", 1.2 kg
External Review » Lenovo ThinkPad Z13 Gen 2
HP ZBook Firefly 14 G10: AMD Ryzen 9 PRO 7940HS, 14.00", 1.5 kg
External Review » HP ZBook Firefly 14 G10
Asus ROG Ally Z1 Extreme: AMD Ryzen Z1 Extreme, 7.00", 0.6 kg
External Review » Asus ROG Ally Z1 Extreme
Schenker VIA 14 Pro (L23): AMD Ryzen 7 PRO 7840HS, 14.00", 1.4 kg
External Review » SCHENKER VIA 14 Pro (L23)
Lenovo ThinkPad T14s G4-21F8002TGE: AMD Ryzen 7 7840U, 14.00", 1.4 kg
External Review » Lenovo ThinkPad T14s G4-21F8002TGE
HP Pavilion Plus 14-ey0095cl: AMD Ryzen 7 7840U, 14.00", 1.4 kg
External Review » HP Pavilion Plus 14-ey0095cl
Acer Swift Edge SFE16 Ryzen 7 7840U: AMD Ryzen 7 7840U, 16.00", 1.2 kg
External Review » Acer Swift Edge SFE16 Ryzen 7 7840U
Lenovo Yoga Pro 7 14APH G8: AMD Ryzen 7 7840HS, 14.50", 1.5 kg
External Review » Lenovo Yoga Pro 7 14APH8
Lenovo IdeaPad 5 Pro 16APH8: AMD Ryzen 7 7840HS, 16.00", 1.9 kg
External Review » Lenovo IdeaPad 5 Pro 16APH8
Lenovo Legion Go: AMD Ryzen Z1 Extreme, 8.80", 0.8 kg
External Review » Lenovo Legion Go
Xiaomi RedmiBook Pro 15 2023: AMD Ryzen 7 7840HS, 15.60", 1.8 kg
External Review » Xiaomi RedmiBook Pro 15 2023
Acer Swift Edge SFE16-43: AMD Ryzen 7 7840U, 16.00", 1.3 kg
External Review » Acer Swift Edge SFE16-43
Lenovo Yoga Slim 6 14APU8 7840U: AMD Ryzen 7 7840U, 14.00", 1.4 kg
External Review » Lenovo Yoga Slim 6
Acemagic AM18: AMD Ryzen 7 7840HS, 0.6 kg
» Acemagic anniversary 2026: Big discount campaign on mini PCs, laptops and NAS systems
Alliwava GH8, R9 8945HS: AMD Ryzen 9 8945HS, 0.5 kg
» Alliwava GH8 Mini-PC review: Top model with AMD Ryzen 9 power attacks Minisforum, Geekom & Co
Dynabook Tecra A60 A65-M: AMD Ryzen 7 250, 16.00", 1.7 kg
» Dynabook Tecra A65-M shows the importance of dual-channel RAM for integrated graphics performance
» This one disadvantage really brings down the new Dynabook Tecra A65-M
Geekom A7 Max, R9 7940HS: AMD Ryzen 9 7940HS, 0.7 kg
» Mini PC with AMD Ryzen 9: Is the Geekom A7 Max Edition 2026 worth it?
Minisforum AI X1, Ryzen 7 255: AMD Ryzen 7 255, 0.7 kg
» Minisforum AI X1 starts inexpensively: Mini PC with AMD Ryzen 7 255 and built-in speakers reviewed
Geekom A8, R7 8745HS: AMD Ryzen 7 8745HS, 0.4 kg
» Geekom A8 with Ryzen 7 8745HS: Is the mini-PC worth it?
HP EliteBook 8 G1a 14 AD3E9ET: AMD Ryzen 7 250, 14.00", 1.4 kg
» The return of an old standard: HP brings back the RJ45-Ethernet port to many business models
GMK NucBox K12: AMD Ryzen 7 H 255, 0.9 kg
» GMK NucBox K12 design has a small but annoying flaw
» New Ryzen 7 H 255 performs almost identically to the 3-year old Ryzen 7 7840HS
Lenovo ThinkPad E14 Gen 7 21T0003NGE: AMD Ryzen 7 250, 14.00", 1.5 kg
» Finally with AMD Zen 4 processors, but still one gen behind: Lenovo's ThinkPad E14 Gen 7 AMD better than ever
Peladn HA-4, R7 7840HS: AMD Ryzen 7 7840HS, 1 kg
» Stylish Ryzen 7 mini PC reviewed - Peladn HA-4 scores with top efficiency and RGB lighting
Beelink SER9 Pro: AMD Ryzen 7 H 255, 0.8 kg
» Ryzen 7 H 255 is a rebadged Ryzen 7 8845HS in first benchmarks
Lenovo ThinkPad P14s G5 21ME000TGE: AMD Ryzen 7 PRO 8840HS, 14.00", 1.4 kg
» 2.8K OLED, 64GB DDR5 and AMD Ryzen 7 Pro: Lenovo ThinkPad P14s gets huge discount
Lenovo ThinkPad Z13 Gen 2: AMD Ryzen 7 PRO 7840U, 13.30", 1.2 kg
» Lenovo ThinkPad Z13 Gen 2 OLED with metal chassis and AMD CPU drops to record-low price
Lenovo ThinkPad X13 Gen 4 21J3001VGE: AMD Ryzen 7 PRO 7840U, 13.30", 1.3 kg
» Lenovo ThinkPad X13 Gen 4 with AMD Ryzen 7 Pro 7840U discounted by 54%
Lenovo ThinkPad P14s G5 21ME000TGE: AMD Ryzen 7 PRO 8840HS, 14.00", 1.4 kg
» Lenovo ThinkPad P14s OLED with AMD Ryzen 7 Pro and 64GB RAM back on sale for 60% off
Geekom AE7: AMD Ryzen 9 7940HS, 0.6 kg
» Geekom AE7 mini PC with AMD Ryzen 9 and 32GB RAM gets massive 34% discount
Lenovo ThinkPad P14s G5 21ME000TGE: AMD Ryzen 7 PRO 8840HS, 14.00", 1.4 kg
» 64GB RAM and 2.8K 120Hz OLED: Lenovo ThinkPad P14s marked down by 60%
GMK NucBox K11: AMD Ryzen 9 8945HS, 0.6 kg
» Sleek GMKtec K11 mini PC with AMD Ryzen 9 8945HS and 32GB DDR5 gets big price cut
Minisforum EliteMini UM890 Pro: AMD Ryzen 9 8945HS, 0.7 kg
» Minisforum EliteMini UM890 Pro: The perfect mini PC with an AMD Ryzen 9 APU?
Lenovo IdeaPad Pro 5 14AHP9: AMD Ryzen 7 8845HS, 14.00", 1.5 kg
» Lenovo IdeaPad Pro 5 Gen 9 reaches record-low price bringing 120 Hz OLED panel and discrete GPU below $650
Acer Swift Edge SFE16 Ryzen 7 7840U: AMD Ryzen 7 7840U, 16.00", 1.2 kg
» Acer Swift Edge 16 OLED laptop records hefty 53% discount on list price for limited time
Framework Laptop 13.5 Ryzen 7 7840U: AMD Ryzen 7 7840U, 13.50", 1.3 kg
» Framework 12 announced as repairable 'entry-level' 2-in-1 laptop with rugged design
Lenovo ThinkPad P14s G5 21ME000TGE: AMD Ryzen 7 PRO 8840HS, 14.00", 1.4 kg
» Lenovo ThinkPad P14s Gen 5 with AMD Ryzen 5 Pro 8640HS gets 64% price cut
Lenovo IdeaPad Pro 5 14AHP9: AMD Ryzen 7 8845HS, 14.00", 1.5 kg
» Lenovo IdeaPad Pro 5 Gen 9 OLED laptop is now retailing for 47% less than list price with latest discount
Lenovo ThinkPad P14s G5 21ME000TGE: AMD Ryzen 7 PRO 8840HS, 14.00", 1.4 kg
» Ripe for Strix Halo: The next version of the ThinkPad P14s AMD needs Ryzen AI Max
» Unequal treatment: How Lenovo makes the AMD variant of the ThinkPad P14s Gen 5 worse
Dell Inspiron 14 7445 2-in-1: AMD Ryzen 7 8840HS, 14.00", 1.7 kg
» Dell Inspiron 14 7445 convertible with Ryzen 5 8640HS drops below $400 at Best Buy
Asus ROG Ally X: AMD Ryzen Z1 Extreme, 7.00", 0.7 kg
» Asus ROG Ally with Z1 Extreme SoC and free ROG Ally travel case is on sale at 31% discount
Asus ROG Ally Z1 Extreme: AMD Ryzen Z1 Extreme, 7.00", 0.6 kg
» Asus ROG Ally with Z1 Extreme SoC and free ROG Ally travel case is on sale at 31% discount
Beelink SER8: AMD Ryzen 7 8845HS, 0.8 kg
» Beelink Mini PC SER8 with AMD Ryzen 7 8745HS and Radeon 780M iGPU gets sizeable Amazon discount
Asus Zenbook 14 OLED UM3406HA: AMD Ryzen 7 8840HS, 14.00", 1.2 kg
» Asus Zenbook 14 OLED laptop with Core Ultra 7 155H CPU, 16 GB of RAM and long battery life scores massive discount
Lenovo Legion Go: AMD Ryzen Z1 Extreme, 8.80", 0.8 kg
» Lenovo confirms Legion Go 2 controllers to work with original Legion Go and be available for purchase "soon"
HP EliteBook 845 G11: AMD Ryzen 7 PRO 8840HS, 14.00", 1.5 kg
» HP's EliteBook 845 is one of the best business laptops, but the cooling performance is still a weak point
Asus Zenbook 14 OLED UM3406HA: AMD Ryzen 7 8840HS, 14.00", 1.2 kg
» 2025 Asus Zenbook 14 OLED notebooks now come with Intel Core Ultra 200H and Ryzen AI 300 APUs
Lenovo ThinkPad T14 Gen 5 21MC003QGE: AMD Ryzen 7 8840U, 14.00", 1.5 kg
» Hot laptop model runs too hot: ThinkPad T14 Gen 5 AMD too powerful for its own good
Lenovo Yoga 7 2-in-1 14AHP9: AMD Ryzen 7 8840HS, 14.00", 1.6 kg
» Lenovo Yoga 7 14 convertible with Ryzen 7 8840HS discounted to under $600
Asus ROG Ally X: AMD Ryzen Z1 Extreme, 7.00", 0.7 kg
» MSI Claw 8 AI+ vs ROG Ally X: Lunar Lake APU reportedly allows MSI to close gap in both performance and battery life
Asus ROG Ally Z1 Extreme: AMD Ryzen Z1 Extreme, 7.00", 0.6 kg
» MSI Claw 8 AI+ vs ROG Ally X: Lunar Lake APU reportedly allows MSI to close gap in both performance and battery life
Lenovo Legion Go: AMD Ryzen Z1 Extreme, 8.80", 0.8 kg
» MSI Claw 8 AI+ vs ROG Ally X: Lunar Lake APU reportedly allows MSI to close gap in both performance and battery life
Lenovo IdeaPad Pro 5 14AHP9: AMD Ryzen 7 8845HS, 14.00", 1.5 kg
» Lenovo IdeaPad Pro 5 Gen 9 laptop with 16-inch 120 Hz OLED panel and RTX 3050 records big 38% price drop
Lenovo Yoga Slim 7 14APU G8: AMD Ryzen 7 7840S, 14.50", 1.3 kg
» Lenovo Slim 7i Gen 9 laptop with 14-inch touch OLED display and good battery life tumbles to new historic-low price
Lenovo ThinkPad P16s G2 21K9000CGE: AMD Ryzen 7 PRO 7840U, 16.00", 1.8 kg
» Lenovo ThinkPad P16s with 64GB memory and 4K OLED discounted by massive 65%
Ayaneo Air 1S Retro Power : AMD Ryzen 7 7840U, 5.50", 0.4 kg
» Ayaneo Flip KB handheld console reviewed: Excellent functionality, midrange performance
Ayaneo Flip KB: AMD Ryzen 7 8840U, 7.00", 0.7 kg
» Ayaneo Flip KB handheld console reviewed: Excellent functionality, midrange performance
Ayaneo Kun: AMD Ryzen 7 7840U, 8.40", 0.9 kg
» Ayaneo Flip KB handheld console reviewed: Excellent functionality, midrange performance
Lenovo ThinkPad P14s G5 21ME000TGE: AMD Ryzen 7 PRO 8840HS, 14.00", 1.4 kg
» Lenovo ThinkPad P14s with 2.8K OLED, 64GB RAM and AMD Ryzen 7 Pro massively discounted in refurbished laptop sale
GPD Win Mini 2024 7": AMD Ryzen 7 8840U, 7.00", 0.5 kg
» GPD unveils Pocket 4 pricing: Ultraportable AMD-powered laptop coming soon
Lenovo IdeaPad Pro 5 14AHP9: AMD Ryzen 7 8845HS, 14.00", 1.5 kg
» Lenovo IdeaPad Pro 5 Gen 9 with 16-inch OLED display and excellent battery life is now 36% off list price
Lenovo ThinkPad P16s G2 21K9000CGE: AMD Ryzen 7 PRO 7840U, 16.00", 1.8 kg
» Lenovo ThinkPad P16s Gen 2 with 4K OLED, 64GB RAM and AMD Ryzen 7 Pro on sale for 63% off
Asus ROG Ally X: AMD Ryzen Z1 Extreme, 7.00", 0.7 kg
» SteamOS for Asus ROG Ally takes another step with display and VRR support in Gamescope
Framework Laptop 13.5 Ryzen 7 7840U: AMD Ryzen 7 7840U, 13.50", 1.3 kg
» Framework Laptop Brick System expands notebook with Lego feet, wheels, cable holders and more
Dell Inspiron 14 7445 2-in-1: AMD Ryzen 7 8840HS, 14.00", 1.7 kg
» Dell Inspiron 16 Plus 7630 multimedia laptop with RTX 4060 and 120 Hz screen is now down by massive 27% vs list price
Lenovo ThinkPad P16s G2 21K9000CGE: AMD Ryzen 7 PRO 7840U, 16.00", 1.8 kg
» Lenovo ThinkPad P16s Gen 2 with 64GB memory and 4K OLED sees 63% price drop
Lenovo ThinkPad X13 Gen 4 21J3001VGE: AMD Ryzen 7 PRO 7840U, 13.30", 1.3 kg
» Lenovo ThinkPad X13 Gen 4 without standout features: Are 13.3-inch laptops still needed?
Lenovo ThinkPad P16s G2 21K9000CGE: AMD Ryzen 7 PRO 7840U, 16.00", 1.8 kg
» Lenovo ThinkPad P16s with 4K OLED, 32GB RAM and AMD Ryzen 7 Pro discounted by 36% in refurbished laptop sale
» Refurbished Lenovo ThinkPad P16s with 64GB memory and 4K OLED now cheaper than ever
Lenovo ThinkPad T16 G2 21K70035GE: AMD Ryzen 7 7840U, 16.00", 1.8 kg
» Lenovo ThinkPad T16 G2 AMD: A great choice even in 2024
Lenovo ThinkPad P16s G2 21K9000CGE: AMD Ryzen 7 PRO 7840U, 16.00", 1.8 kg
» Maxed-out Lenovo ThinkPad P16s with 4K OLED and 64GB RAM gets substantial 59% price cut
Minisforum Mercury Series EM780: AMD Ryzen 7 7840U, 0.2 kg
» Minisforum Mercury Series EM780 packs an AMD Ryzen 7 7840U and 32 GB of DDR5 RAM in a 1/4 L chassis
HP EliteBook 865 G10: AMD Ryzen 9 PRO 7940HS, 16.00", 1.9 kg
» HP EliteBook 865 G10 review: Why isn't the series being refreshed like HP Spectre 16?
Lenovo ThinkPad P14s G4 21K5000LGE: AMD Ryzen 7 PRO 7840U, 14.00", 1.3 kg
» Lenovo ThinkPad P14s laptop with 64GB RAM and 2.8K OLED is 54% off right now
Asus ROG Ally Z1 Extreme: AMD Ryzen Z1 Extreme, 7.00", 0.6 kg
» ASUS ROG Ally gaming handheld models on sale up to $200 off MSRP at BestBuy US before Valentine's Day
Lenovo ThinkPad P16s G2 21K9000CGE: AMD Ryzen 7 PRO 7840U, 16.00", 1.8 kg
» Fast, bright, practical: The Lenovo ThinkPad P16s G2 AMD with Ryzen 7 and a Radeon 780M reviewed
Lenovo Legion Go: AMD Ryzen Z1 Extreme, 8.80", 0.8 kg
» Legion Go: Lenovo's Steam Deck competitor receives first-ever price cut
Lenovo ThinkPad T14 G4 21K4S02000: AMD Ryzen 7 PRO 7840U, 14.00", 1.5 kg
» Lenovo ThinkPad T14 G4 AMD needs upgradable RAM
Asus ROG Ally Z1 Extreme: AMD Ryzen Z1 Extreme, 7.00", 0.6 kg
» Asus ROG Ally with AMD Ryzen Z1 drops to US$399 on Best Buy thanks to US$200 discount
Lenovo Yoga Slim 7 14APU G8: AMD Ryzen 7 7840S, 14.50", 1.3 kg
» Yoga Slim 7 vs. Yoga Pro 7 - The fight for Lenovo's best 14-inch subnotebook
HP EliteBook 845 G10 5Z4X0ES: AMD Ryzen 7 7840U, 14.00", 1.5 kg
» HP's EliteBook 845 G10 is the better choice with the slower AMD Zen4 processor
HP EliteBook 845 G10 818N0EA: AMD Ryzen 9 PRO 7940HS, 14.00", 1.5 kg
» AMD Zen4 for the office: HP EliteBook 845 G10 convinces with bright display and great keyboard
Asus ROG Ally Z1 Extreme: AMD Ryzen Z1 Extreme, 7.00", 0.6 kg
» ASUS ROG Ally: Executive confirms gamers can hold off on troublesome recent BIOS update
» ASUS ROG Ally: Pre-orders open with cheaper AMD Ryzen Z1 model to follow
Lenovo Legion Go: AMD Ryzen Z1 Extreme, 8.80", 0.8 kg
» Lenovo's clarification about rumoured new gaming handheld releases still leaves room for Legion Go Lite