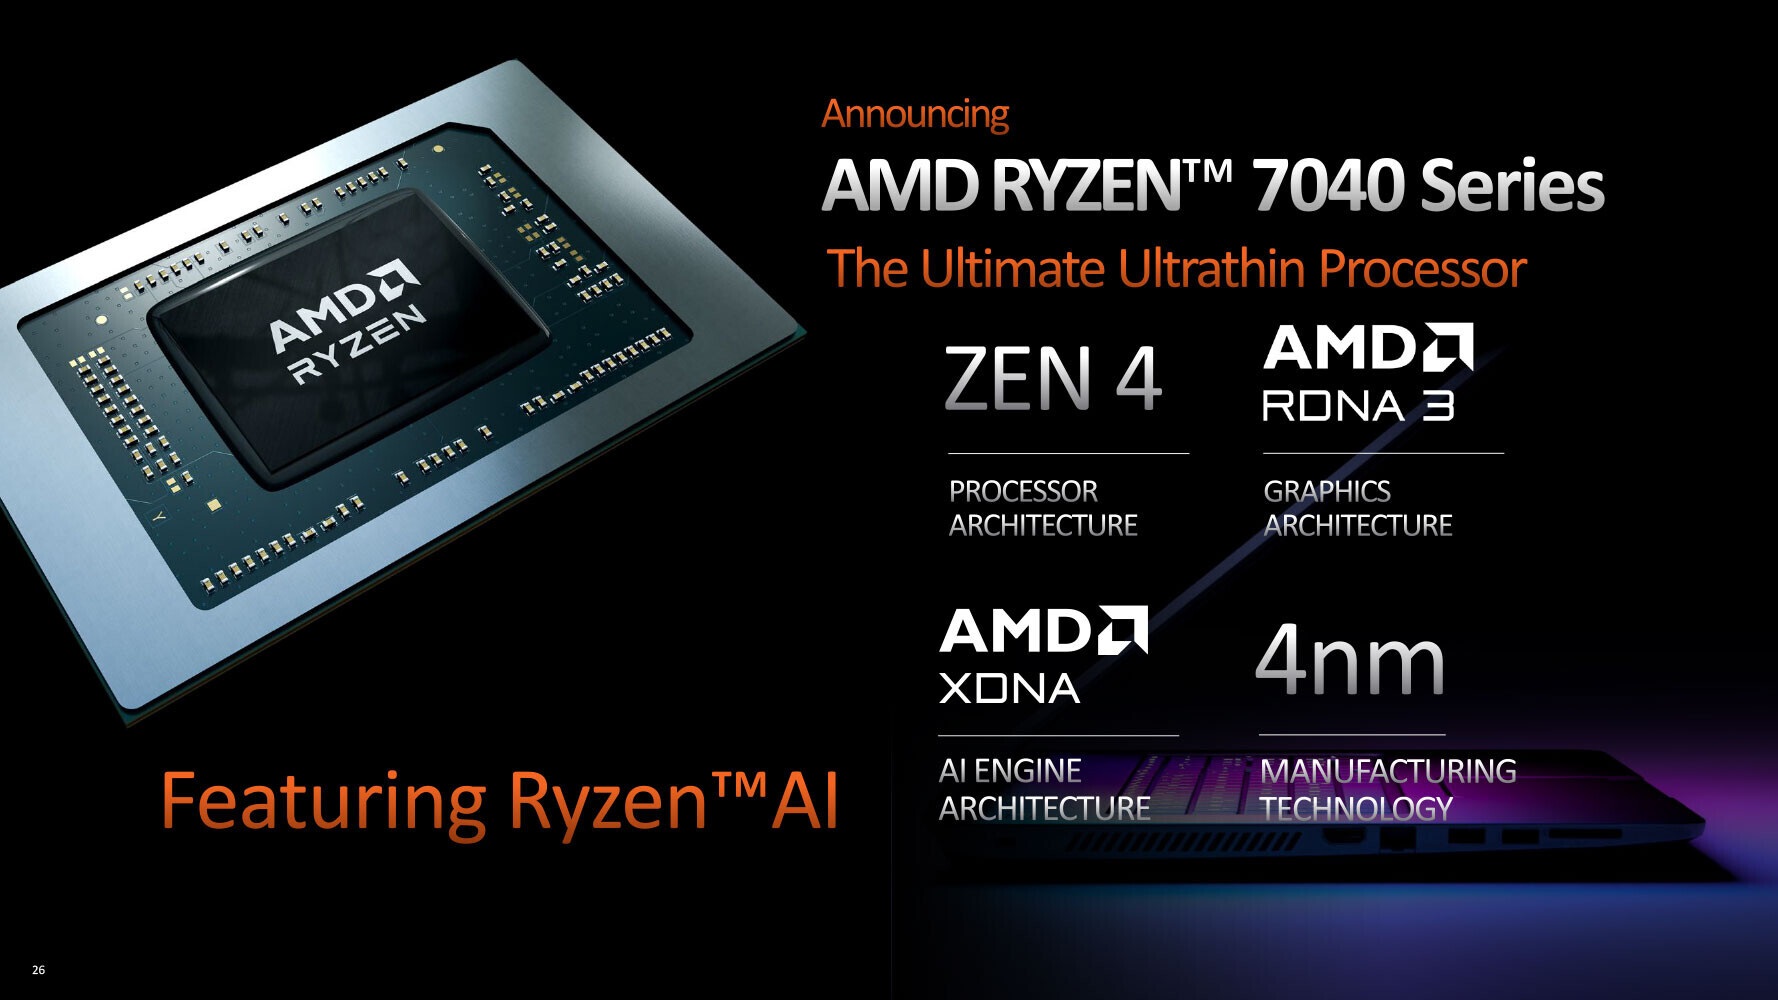
AMD Ryzen 9 7940HS analysis - Zen4 Phoenix is ideally as efficient as Apple
After thoroughly testing the AMD Ryzen 9 7945HX with the new Zen4 cores (Dragon Range, 5 nm) a few weeks ago, now we have received our first Phoenix Series Zen4 Chip. This chip has two unique features, namely it is the first AMD processor made using a 4 nm process, and it also has the new integrated graphics card Radeon 780M (RDNA3) installed - which promises a big jump in performance compared to last year's Radeon 680M. There will be a separate article published all about the new iGPU, as we still have some additional testing to do. In this article, we will be concentrating on the new processor. We will be testing its performance, its efficiency at different power consumption levels, as well as how this new processor compares to competitors from Intel, Apple, and of course last year's Zen3+. Was the long wait worth it?
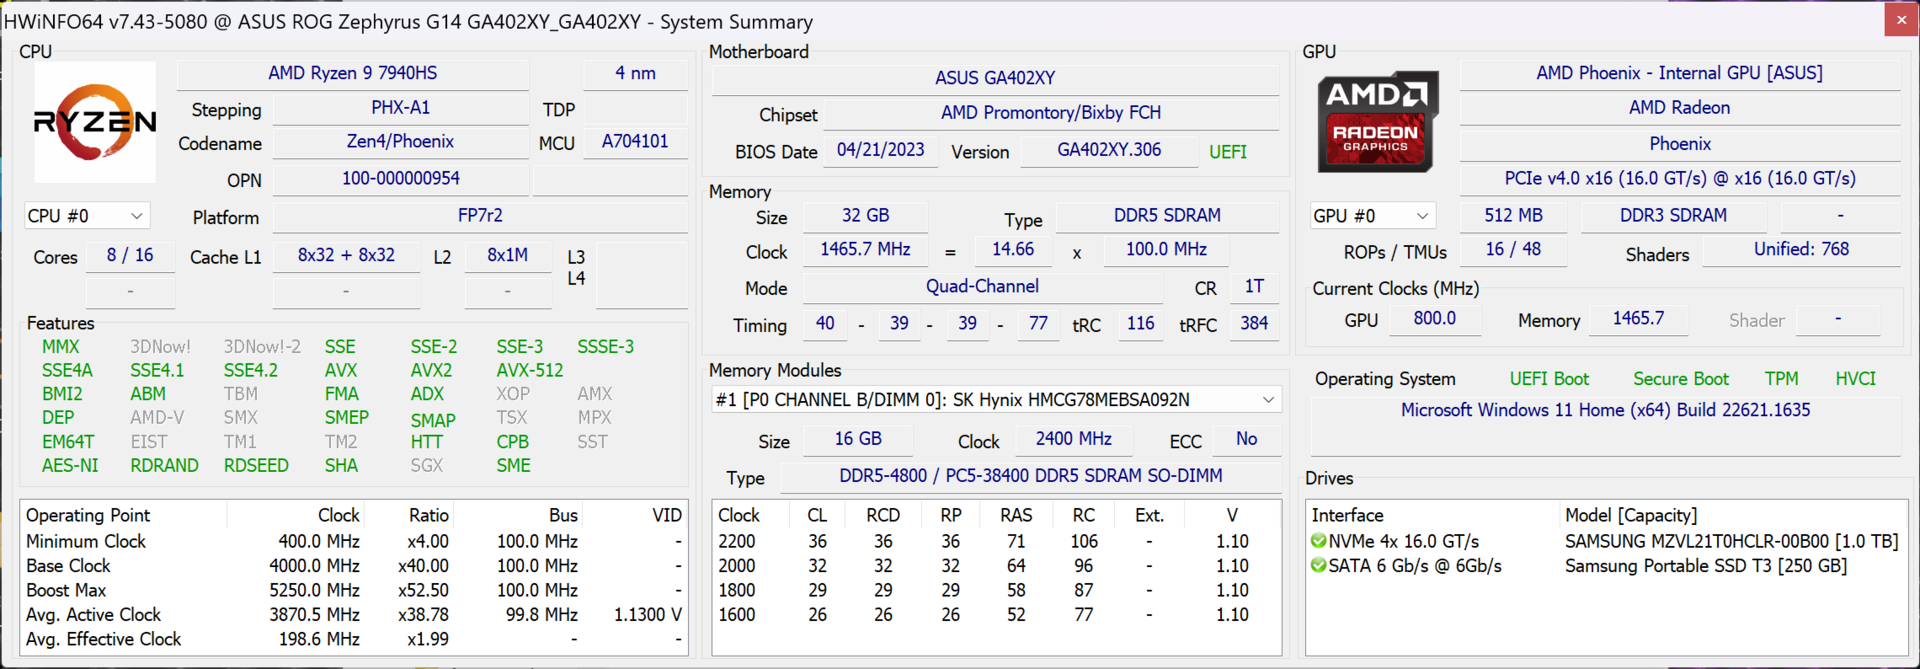
Test system - Asus ROG Zephyrus G14
We will be using the brand new Asus ROG Zephyrus G14 as our test system - the first laptop on the market featuring the new Ryzen 9 7940HS. We have already tested this laptop in great detail - today, we will be focusing on the new processor. Compared to our review, here we used the performance mode for the following tests, meaning the processor had access to 65 watts in the first 2 minutes (then 45 watts). We also completed further tests and measurements at 35, 45, 55 and 80 watts. We have utilized a 32 GB DDR5 4800 RAM in Dual-Channel configuration for these tests.
Direct competitors to this processor are the Intel Core i7-13700H processors, which can be found in the Lenovo Yoga Pro 7 14 G8 and the Asus TUF A15, as well as the AMD Ryzen 7 7735HS (Rembrandt-R, basically an old Ryzen 7 6800HS), which we have tested previously and can currently be found in many different laptops.
Specifications - 8 Zen4 cores with up to 5.2 GHz
The AMD Ryzen 9 7940HS nominally belongs to the 45-watt class and comes in clearly below HX CPUs like the Ryzen 9 7945HX, which we previously tested. Their technical specifications are also quite different: both models use Zen4 cores, but AMD's HX chip has a chiplet design (Dragon Range, 5 nm), where the components of the processor are manufactured individually and then assembled. However, AMD still rely on the well-known monolithic design for the HS series and also the U series, which means all components are manufactured on silicon at the same time. Furthermore, the HS chips are already manufactured using a 4 nm process and also benefit from the new iGPU Radeon 780M - which we will deal with in a separate article.
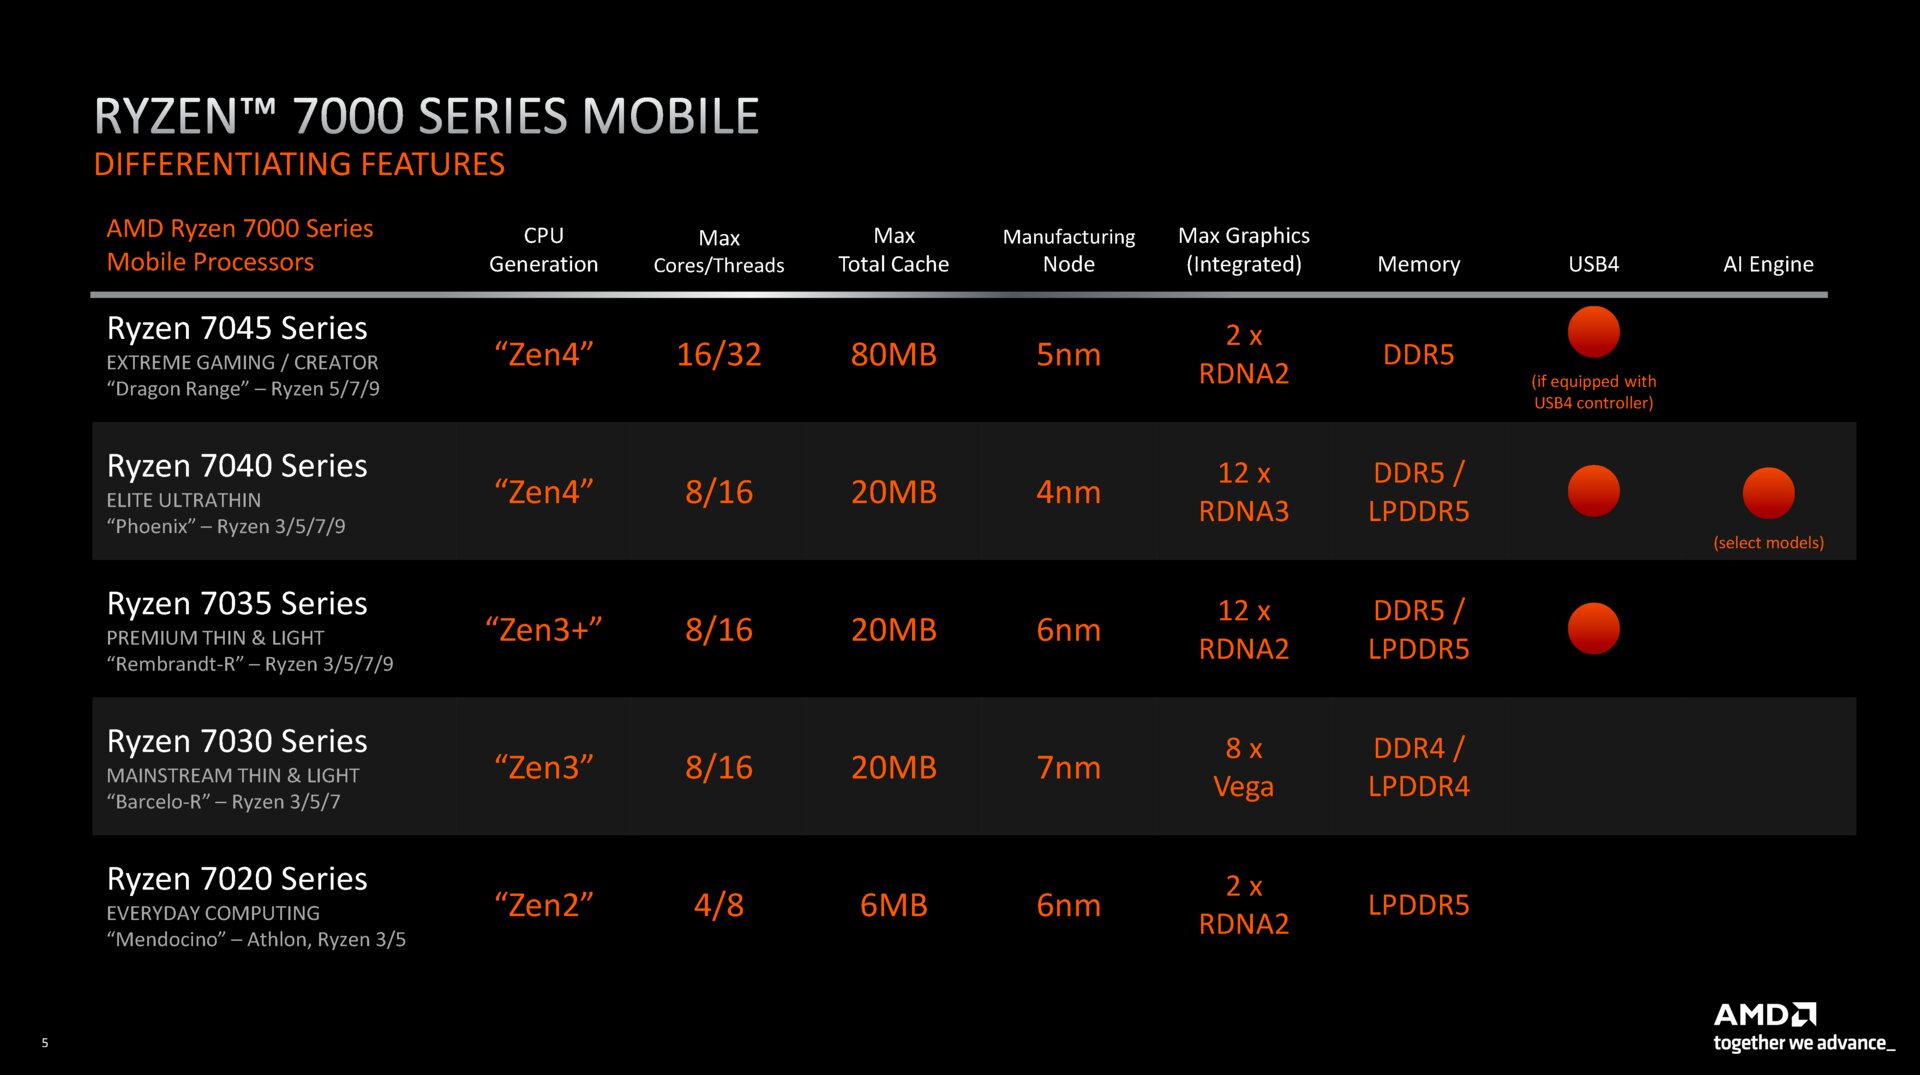
According to AMD, the HS processors operate in a TDP area of 35-54 watts - on the ROG Zephyrus G14, however, we observed up to 80 watts (whether this is a good thing will be discussed shortly). The Ryzen 9 7940HS has eight full Zen4 cores with a base clock rate of 4.0 GHz and a maximum Turbo clock rate of 5.2 GHz on one core, which we noted during our single-core benchmarks. In comparison, the current Raptor Lake generation Intel Core i7-13700H (which is practically a slightly faster Alder Lake Core i7-12700H) has 6 performance cores (incl. hyper-threading) and 8 efficiency cores - meaning it can process a total of 20 threads simultaneously. Although, the P-cores in particular require quite a lot of energy - power consumption rates of more than 100 watts are unfortunately not that uncommon in Intel's current H series CPUs.
Test procedure
In this article, we have analyzed the new AMD Ryzen 9 7940HS' performance using synthetic benchmarks, as we do for our regular laptop reviews. Additionally, we have taken a look at its efficiency by measuring its power consumption during multiple benchmarks. To rule out varying screen types (and sizes) as influencing factors, we have connected the laptops to external monitors and switched off their internal displays. We have also compared the CPUs' power consumption in idle mode. We haven't gone into gaming benchmarks at this stage, as the range of graphics cards and TDP/TGP configurations is simply too wide.
Singe-core performance and efficiency
First, let's take a look at single-core performance. For this, we have utilized different versions of Cinebench and Geekbench. In the comparison table, it has to be noted that Cinebench R15 and R20 had to be emulated on the Apple M2 chips and native benchmarks are not available for this processor. This had a slightly negative impact on its performance.
Single-core performance is typically a discipline in which AMD chips tend not to do too well - especially since Intel started using P-cores in last year's Alder Lake generation. The manufacturer was able to improve the performance with the introduction of their new Zen4 chips and on average we measured an improvement of 19 per cent compared to last year's Ryzen 9 6900HX and the Ryzen 7 7735HS (both chips are Zen3+, Rembrandt-R, 6 nm) - quite an impressive development. In the Cinebench tests, the new Ryzen 9 7940HS still had to admit defeat to the current Intel CPUs and was practically on the same level as last year's Core i7-12700H. In the Geekbench test, the AMD chip did considerably better - even beating the Lenovo Yoga Pro 7 14's Core i7-13700H and the ROG Zephyrus M16's Core i9-13900H. It came in only slightly behind both HX models.
Cinebench R23: Single Core
Cinebench R20: CPU (Single Core)
Cinebench R15: CPU Single 64Bit
Geekbench 5.5: Single-Core
| CPU Performance rating | |
| Intel Core i9-13900HX | |
| Average of class Gaming | |
| Intel Core i9-13900H | |
| AMD Ryzen 9 7945HX | |
| AMD Ryzen 9 7940HS | |
| Intel Core i7-13700H | |
| Average AMD Ryzen 9 7940HS | |
| Intel Core i7-12700H | |
| Intel Core i7-12700H | |
| Apple M2 Max | |
| AMD Ryzen 7 7735HS | |
| Apple M2 Pro | |
| AMD Ryzen 9 6900HX | |
| AMD Ryzen 7 6800U | |
| AMD Ryzen 7 6800U | |
| Cinebench R23 / Single Core | |
| Intel Core i9-13900HX | |
| Average of class Gaming (1166 - 2356, n=110, last 2 years) | |
| Intel Core i9-13900H | |
| Intel Core i7-13700H | |
| AMD Ryzen 9 7945HX | |
| Intel Core i7-12700H | |
| AMD Ryzen 9 7940HS | |
| Average AMD Ryzen 9 7940HS (1733 - 1832, n=12) | |
| Intel Core i7-12700H | |
| Apple M2 Pro | |
| Apple M2 Max | |
| AMD Ryzen 7 7735HS | |
| AMD Ryzen 9 6900HX | |
| AMD Ryzen 7 6800U | |
| AMD Ryzen 7 6800U | |
| Cinebench R20 / CPU (Single Core) | |
| Intel Core i9-13900HX | |
| Average of class Gaming (442 - 895, n=109, last 2 years) | |
| Intel Core i9-13900H | |
| Intel Core i7-13700H | |
| AMD Ryzen 9 7945HX | |
| Intel Core i7-12700H | |
| Average AMD Ryzen 9 7940HS (679 - 714, n=12) | |
| AMD Ryzen 9 7940HS | |
| Intel Core i7-12700H | |
| AMD Ryzen 7 7735HS | |
| AMD Ryzen 7 6800U | |
| AMD Ryzen 9 6900HX | |
| AMD Ryzen 7 6800U | |
| Apple M2 Max | |
| Apple M2 Pro | |
| Cinebench R15 / CPU Single 64Bit | |
| Intel Core i9-13900HX | |
| Average of class Gaming (188.8 - 343, n=109, last 2 years) | |
| AMD Ryzen 9 7945HX | |
| Intel Core i9-13900H | |
| AMD Ryzen 9 7940HS | |
| Average AMD Ryzen 9 7940HS (258 - 288, n=12) | |
| Intel Core i7-13700H | |
| Intel Core i7-12700H | |
| Intel Core i7-12700H | |
| AMD Ryzen 7 7735HS | |
| AMD Ryzen 9 6900HX | |
| AMD Ryzen 7 6800U | |
| Apple M2 Max | |
| AMD Ryzen 7 6800U | |
| Apple M2 Pro | |
| Geekbench 5.5 / Single-Core | |
| AMD Ryzen 9 7945HX | |
| Average of class Gaming (986 - 2474, n=108, last 2 years) | |
| Intel Core i9-13900HX | |
| AMD Ryzen 9 7940HS | |
| Average AMD Ryzen 9 7940HS (1823 - 2032, n=13) | |
| Apple M2 Max | |
| Intel Core i9-13900H | |
| Apple M2 Pro | |
| Intel Core i7-13700H | |
| Intel Core i7-12700H | |
| Intel Core i7-12700H | |
| AMD Ryzen 9 6900HX | |
| AMD Ryzen 7 6800U | |
| AMD Ryzen 7 7735HS | |
| AMD Ryzen 7 6800U | |
Cinebench R23: Single Core
Cinebench R20: CPU (Single Core)
Cinebench R15: CPU Single 64Bit
Geekbench 5.5: Single-Core
In turn, looking at power consumption makes it obvious that this higher performance (or higher clock rate) has led to higher power consumption - both the AMD Ryzen 9 7940HS and Intel Core i7-13700H processors have a CPU package power of 23-24 watts and a core power of 21-22 watts. The old Zen3+ models such as the Ryzen 7 7735HS have a core power of only 16-16 watts, which means their single-core performance has got worse (-19 per cent) despite their improved performance. Apple's current M2 Pro SoC is still on a completely different level.
| Power Consumption - Cinebench R23 Single Power Efficiency - external Monitor | |
| Apple M2 Pro | |
| Apple M2 Max | |
| AMD Ryzen 7 7735HS | |
| AMD Ryzen 7 6800U | |
| Intel Core i7-13700H | |
| AMD Ryzen 9 7940HS | |
| Intel Core i9-13900H | |
| AMD Ryzen 9 7945HX | |
| Intel Core i9-12900H | |
| Intel Core i9-13950HX | |
Multi-core performance and efficiency
In the multi-core benchmarks, the Ryzen 9 7940HS left a good impression despite its fewer threads - its maximum power consumption of 65 watts means the processor was able to keep up with Intel's Alder Lake chips as well as the new Core i7-13700H. Those chips, however, can use over 100 watts at times. Compared to its predecessor, the Ryzen 9 6900HS, the new Zen4 chip in our test was on average 30 per cent faster. Compared to the Asus TUF A15's Ryzen 7 7735HS (comparable power limits), it was 25 per cent ahead in total.
Cinebench R23: Multi Core
Cinebench R20: CPU (Multi Core)
Cinebench R15: CPU Multi 64Bit
Geekbench 5.5: Multi-Core
| CPU Performance rating | |
| Asus ROG Strix G17 G713PI | |
| Schenker XMG Neo 16 E23 | |
| Average of class Gaming | |
| Asus ROG Zephyrus M16 GU604VY-NM042X | |
| Lenovo Legion 5 15IAH7H 82RB | |
| Lenovo Yoga Pro 7 14IRH G8 | |
| Asus ROG Zephyrus G14 GA402XY | |
| Average AMD Ryzen 9 7940HS | |
| Alienware x14 i7 RTX 3060 | |
| Apple MacBook Pro 16 2023 M2 Max | |
| Apple MacBook Pro 14 2023 M2 Pro | |
| Asus TUF A15 FA507 | |
| Lenovo Yoga Pro 7 14ARP G8 | |
| Asus ROG Strix G15 G513RW | |
| Asus ROG Zephyrus G14 GA402RK | |
| Lenovo Yoga 7-14ARB G7 | |
| Asus Zenbook S 13 OLED | |
| Cinebench R23 / Multi Core | |
| Asus ROG Strix G17 G713PI | |
| Schenker XMG Neo 16 E23 | |
| Average of class Gaming (10488 - 40970, n=110, last 2 years) | |
| Asus ROG Zephyrus M16 GU604VY-NM042X | |
| Lenovo Legion 5 15IAH7H 82RB | |
| Lenovo Yoga Pro 7 14IRH G8 | |
| Asus ROG Zephyrus G14 GA402XY | |
| Average AMD Ryzen 9 7940HS (15556 - 18131, n=12) | |
| Alienware x14 i7 RTX 3060 | |
| Apple MacBook Pro 14 2023 M2 Pro | |
| Apple MacBook Pro 16 2023 M2 Max | |
| Asus TUF A15 FA507 | |
| Lenovo Yoga Pro 7 14ARP G8 | |
| Asus ROG Strix G15 G513RW | |
| Asus ROG Zephyrus G14 GA402RK | |
| Lenovo Yoga 7-14ARB G7 | |
| Asus Zenbook S 13 OLED | |
| Cinebench R20 / CPU (Multi Core) | |
| Schenker XMG Neo 16 E23 | |
| Asus ROG Strix G17 G713PI | |
| Average of class Gaming (4029 - 16108, n=109, last 2 years) | |
| Asus ROG Zephyrus M16 GU604VY-NM042X | |
| Lenovo Legion 5 15IAH7H 82RB | |
| Asus ROG Zephyrus G14 GA402XY | |
| Lenovo Yoga Pro 7 14IRH G8 | |
| Average AMD Ryzen 9 7940HS (6277 - 7111, n=12) | |
| Alienware x14 i7 RTX 3060 | |
| Asus TUF A15 FA507 | |
| Lenovo Yoga Pro 7 14ARP G8 | |
| Asus ROG Strix G15 G513RW | |
| Asus ROG Zephyrus G14 GA402RK | |
| Lenovo Yoga 7-14ARB G7 | |
| Asus Zenbook S 13 OLED | |
| Apple MacBook Pro 14 2023 M2 Pro | |
| Apple MacBook Pro 16 2023 M2 Max | |
| Cinebench R15 / CPU Multi 64Bit | |
| Asus ROG Strix G17 G713PI | |
| Schenker XMG Neo 16 E23 | |
| Average of class Gaming (1578 - 6271, n=109, last 2 years) | |
| Asus ROG Zephyrus M16 GU604VY-NM042X | |
| Lenovo Legion 5 15IAH7H 82RB | |
| Average AMD Ryzen 9 7940HS (2470 - 2848, n=12) | |
| Asus ROG Zephyrus G14 GA402XY | |
| Lenovo Yoga Pro 7 14IRH G8 | |
| Alienware x14 i7 RTX 3060 | |
| Asus TUF A15 FA507 | |
| Lenovo Yoga Pro 7 14ARP G8 | |
| Asus ROG Strix G15 G513RW | |
| Apple MacBook Pro 16 2023 M2 Max | |
| Apple MacBook Pro 14 2023 M2 Pro | |
| Asus ROG Zephyrus G14 GA402RK | |
| Lenovo Yoga 7-14ARB G7 | |
| Asus Zenbook S 13 OLED | |
| Geekbench 5.5 / Multi-Core | |
| Schenker XMG Neo 16 E23 | |
| Asus ROG Strix G17 G713PI | |
| Average of class Gaming (6460 - 27010, n=108, last 2 years) | |
| Asus ROG Zephyrus M16 GU604VY-NM042X | |
| Apple MacBook Pro 16 2023 M2 Max | |
| Apple MacBook Pro 14 2023 M2 Pro | |
| Alienware x14 i7 RTX 3060 | |
| Lenovo Yoga Pro 7 14IRH G8 | |
| Lenovo Legion 5 15IAH7H 82RB | |
| Asus ROG Zephyrus G14 GA402XY | |
| Average AMD Ryzen 9 7940HS (10089 - 12500, n=13) | |
| Asus ROG Zephyrus G14 GA402RK | |
| Asus ROG Strix G15 G513RW | |
| Asus TUF A15 FA507 | |
| Lenovo Yoga Pro 7 14ARP G8 | |
| Lenovo Yoga 7-14ARB G7 | |
| Asus Zenbook S 13 OLED | |
Cinebench R23: Multi Core
Cinebench R20: CPU (Multi Core)
Cinebench R15: CPU Multi 64Bit
Geekbench 5.5: Multi-Core
Compared to the single-core tests, our multi-core benchmarks showed improved efficiency compared to the old Zen3+ processors - however, only compared to the HS models such as the Ryzen 7 7735HS. In addition, this is also dependent on power limits - its lead over the Lenovo Yoga Pro 7's 7735HS is minimal, but its efficiency rose by 30 per cent compared to the Asus TUF A15 (with the same TDP as the 7940HS). The old U series chips, such as the Ryzen 7 6800U (15-28 watts) are surprisingly more efficient. The Intel processors (Alder Lake and Raptor Lake) clearly lost out, the Ryzen 9 7945HX is more efficient (even though it has a higher consumption). In comparison: At 80 watts, the Ryzen 9 7940HS scored 18,044 points in the Cinebench R23 Multi test and the Ryzen 9 7945HX scored 31,000 points.
| Power Consumption - Cinebench R23 Multi Power Efficiency - external Monitor | |
| Apple M2 Pro | |
| Apple M2 Max | |
| AMD Ryzen 7 6800U | |
| AMD Ryzen 9 7945HX | |
| AMD Ryzen 9 7940HS | |
| AMD Ryzen 7 7735HS | |
| Intel Core i7-13700H | |
| Intel Core i9-13900H | |
| AMD Ryzen 7 7735HS | |
| Intel Core i9-13950HX | |
| Intel Core i9-12900H | |
Performance and efficiency with low power limits
Of course, we were also interested in how the new Ryzen 9 7940HS performs with different power limits and have compared it to the Intel Core i7-13700H and the Asus TUF A15's AMD Ryzen 7 7735HS at 35, 45, 55, 65 and 80 watts. On both Asus systems, we were able to set power limits via the Armoury Crate software's manual mode - on the Intel system we used the Freeware tool ThrottleStop. We measured the following results:
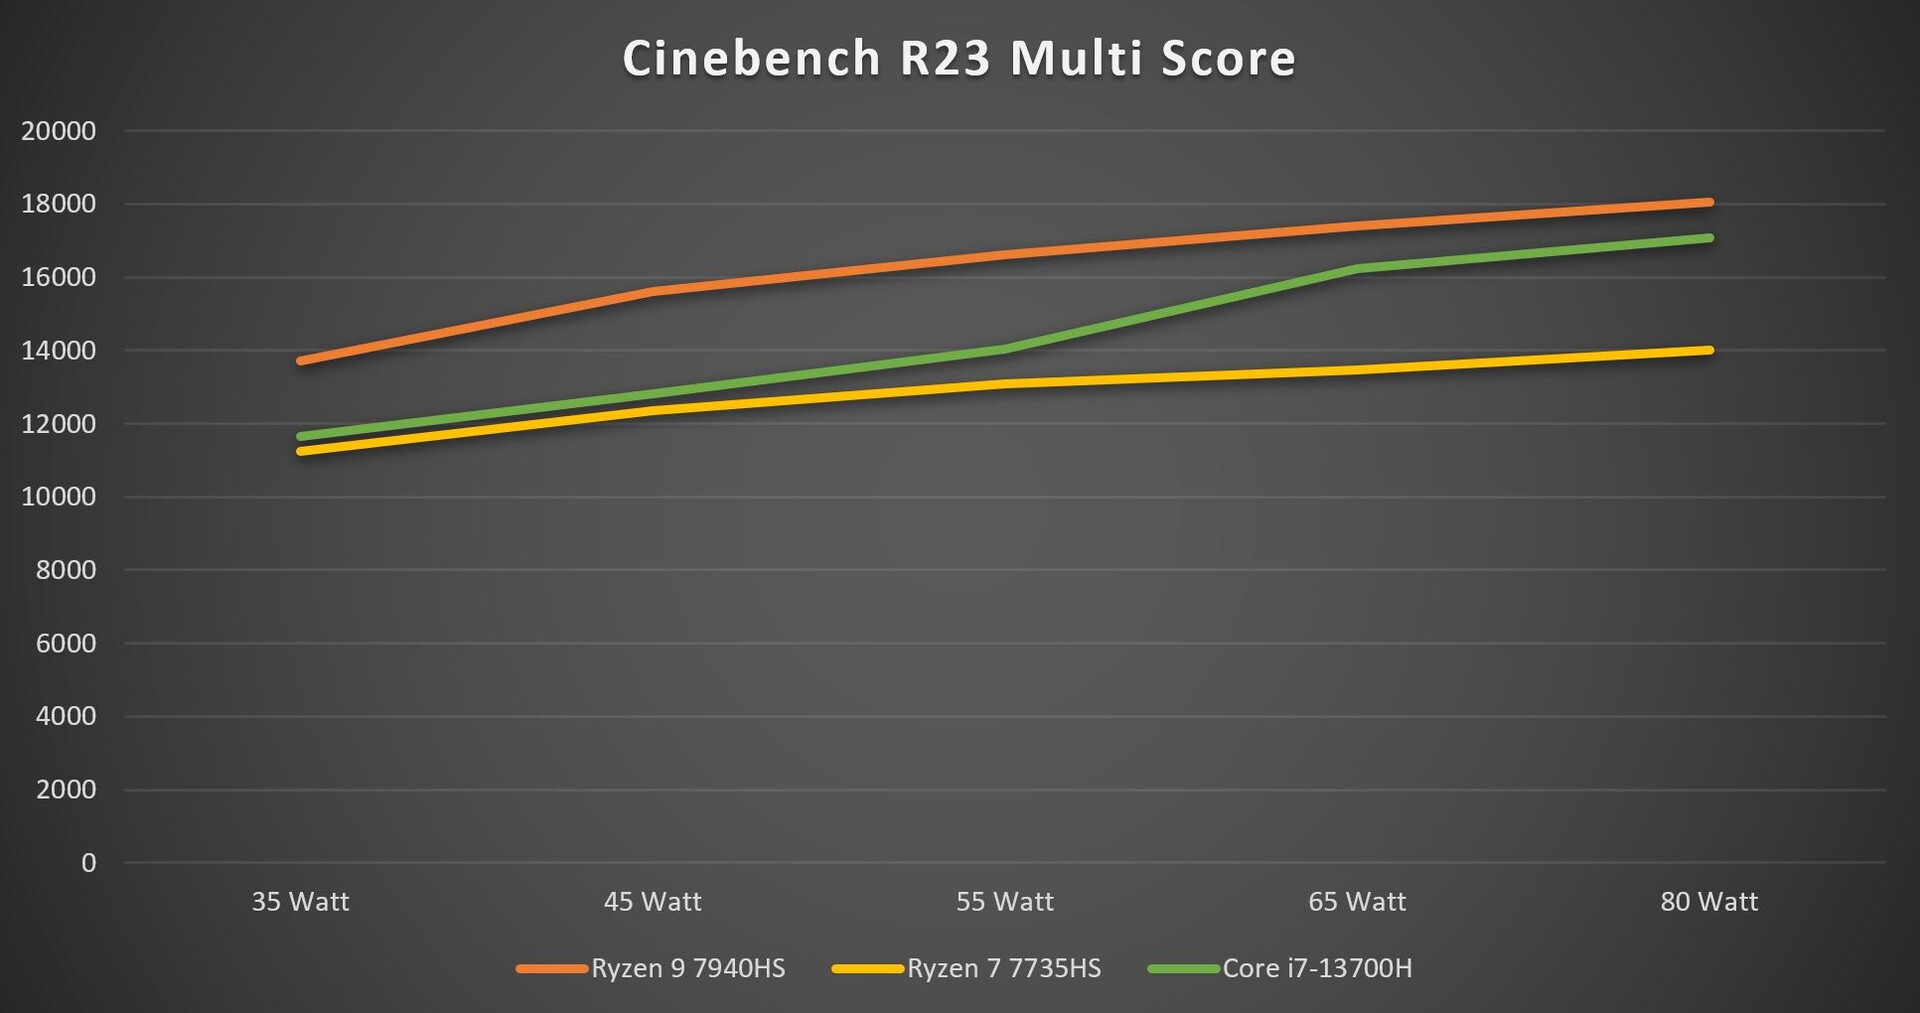
Here, you can clearly see that the Ryzen 9 7940HS delivered better performance at all power limits than its direct competitor, the Intel Core i7-13700H. From 55 to 65, the curve already becomes much flatter, meaning efficiency started to decline. The Core i7-13700H's P-cores simply use a lot of energy to deliver such good performance levels. From 65 watts, the Intel chip was able to close the gap between it and the AMD chip considerably.
It is interesting to take a look at how efficiencies fare with lower power limits. Our efficiency is calculated by dividing the achieved number of points by its consumption, namely the laptop's total consumption which we measured attached to an external monitor. This meant we got the following results for the Ryzen 9 7940HS:
| TDP | Cinebench R23 Multi | Consumption | Efficiency |
|---|---|---|---|
| 80 watts | 18,044 points | ~108 watts | 167 points/watt |
| 65 watts | 17,402 points | ~91 watts | 191.2 points/watt |
| 55 watts | 16,607 points | ~79 watts | 210.2 points/watt |
| 45 watts | 15,625 points | ~66 watts | 236.7 points/watt |
| 35 watts | 13,723 points | ~54 watts | 254.1 points/watt |
Using lower power limits, we observed higher efficiency and at 45 watts, the new Ryzen 9 7940HS did about as well as the old Ryzen 7 6800U and the Apple M2 Max. At 35 watts, the new Zen4 chip did even better - almost as good as the Apple M2 Pro even. This shows that the new HS CPUs are happiest at 35-55 watts and it gives us great hope for the coming U series processors.
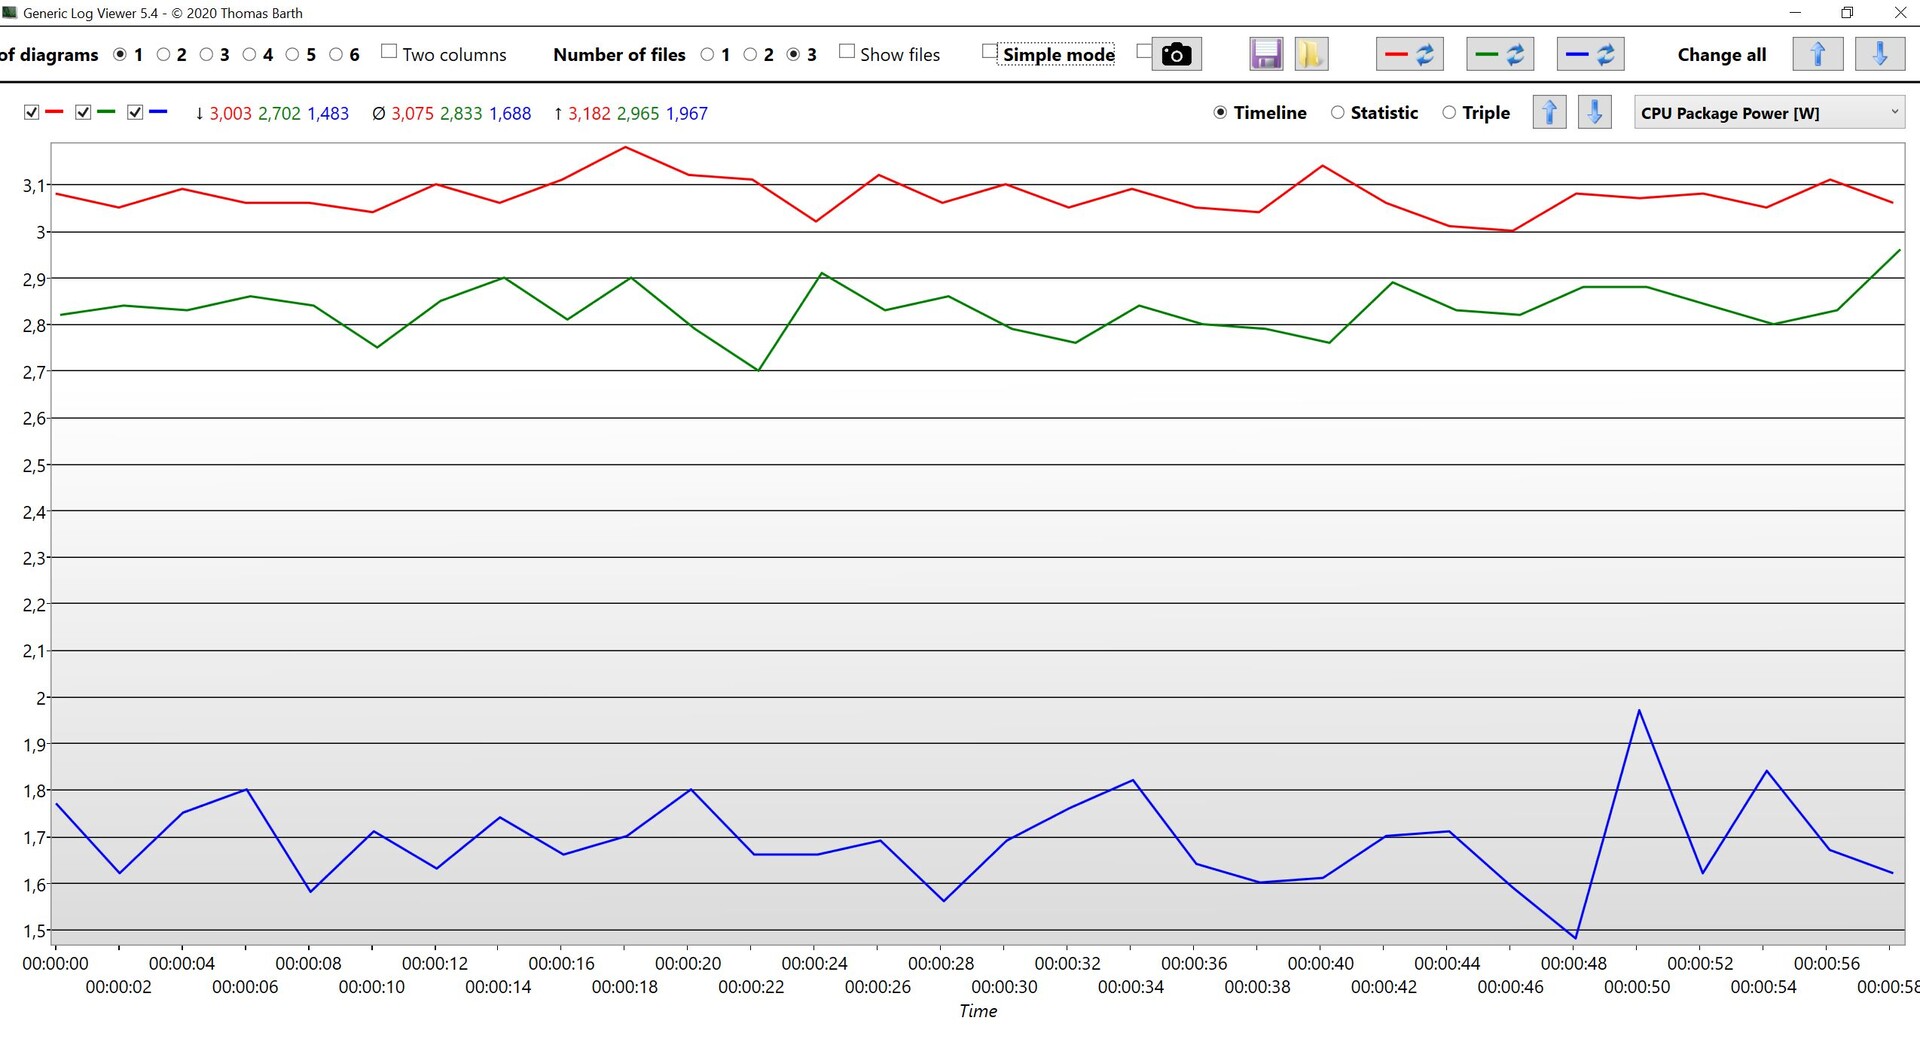
Power consumption in idle mode and when surfing the web
When testing the Ryzen 9 7945HX, we already noted a higher consumption compared to the Intel chips, which could be due to the chiplet design. We then documented and evaluated its CPU consumption in idle with the HWiNFO tool. However, the new Ryzen 9 7940HS didn't score particularly well here, because its consumption of around 3.1 watts is even slightly higher than the old Ryzen 7 7735HS with around 2.83 watts. Intel's Core i7-13700H on the other hand is much more efficient with an average of just under 1.7 watts.
Verdict - Zen4 Phoenix didn't quite live up to expectations at times
We had to wait quite a while for AMD's Phoenix CPUs and after the impressive introduction of the Ryzen 9 7945HX a few weeks ago, our expectations of the new 4 nm chips with the codename Phoenix were obviously extremely high. After thoroughly testing the new Ryzen 9 7940HS, the results are a little sobering in total.
Compared to Intel, who have relied on a hybrid architecture since last year, AMD continue to use 8 full Zen4 cores. Single-core performance could also be increased by the higher Turbo Boost of 5.2 GHz and is now on par with last year's H-series processors from Intel. However, AMD also has the problem that this performance increase comes with increased consumption, which is why its single-core efficiency is worse than last year's old Zen3+ chips despite its higher performance.
AMD's new Zen4 Phoenix processor features better performance and it can keep up with Intel in multi-core use - who use considerably more power. Its single-core performance is also better, but its single-core efficiency has sunk. It makes the most sense to run the new HS Zen4 chips at 35-55 watts, which gives laptop manufacturers more room to play with in terms of dedicated GPUs.
Its multi-core performance is about 30% more compared to last year's Ryzen 9 6900HS and its efficiency is also better, which is also the case in comparison to Intel processors. However, we can clearly see that its efficiency drops significantly at high power limits of more than 55 watts. The sweet spot for the new HS processors is 35-55 watts and at 35 and 45 watts, respectively, the new Zen4 chip comes within the range of Apple's M2 chips (M2 Pro & M2 Max). This is definitely good news for the upcoming Zen4 Phoenix U-series CPUs (15-28 watts). In addition, laptop manufacturers have much more leeway for the dedicated graphics card when using the HS CPUs in compact devices, whereas Intel chips require more power for comparable performance.
However, its idle power consumption has increased slightly and here, the Intel chips also end up being more efficient. Then there is of course the new iGPU Radeon 780M, which we will take a closer look at in a separate article. However, you should not have too high expectations here...

