The fastest Core i7-12700H laptop you can buy: Lenovo Legion 5 15IAH7H review
The 2022 Legion 5 15 is a major update over the 2021 Legion 5 15. It utilizes the same GPU albeit at a higher TGP target (140 W vs. 130 W) while upgrading the CPU to the latest 12th gen Alder Lake-H series. The external chassis has also been updated for a newer and sleeker look.
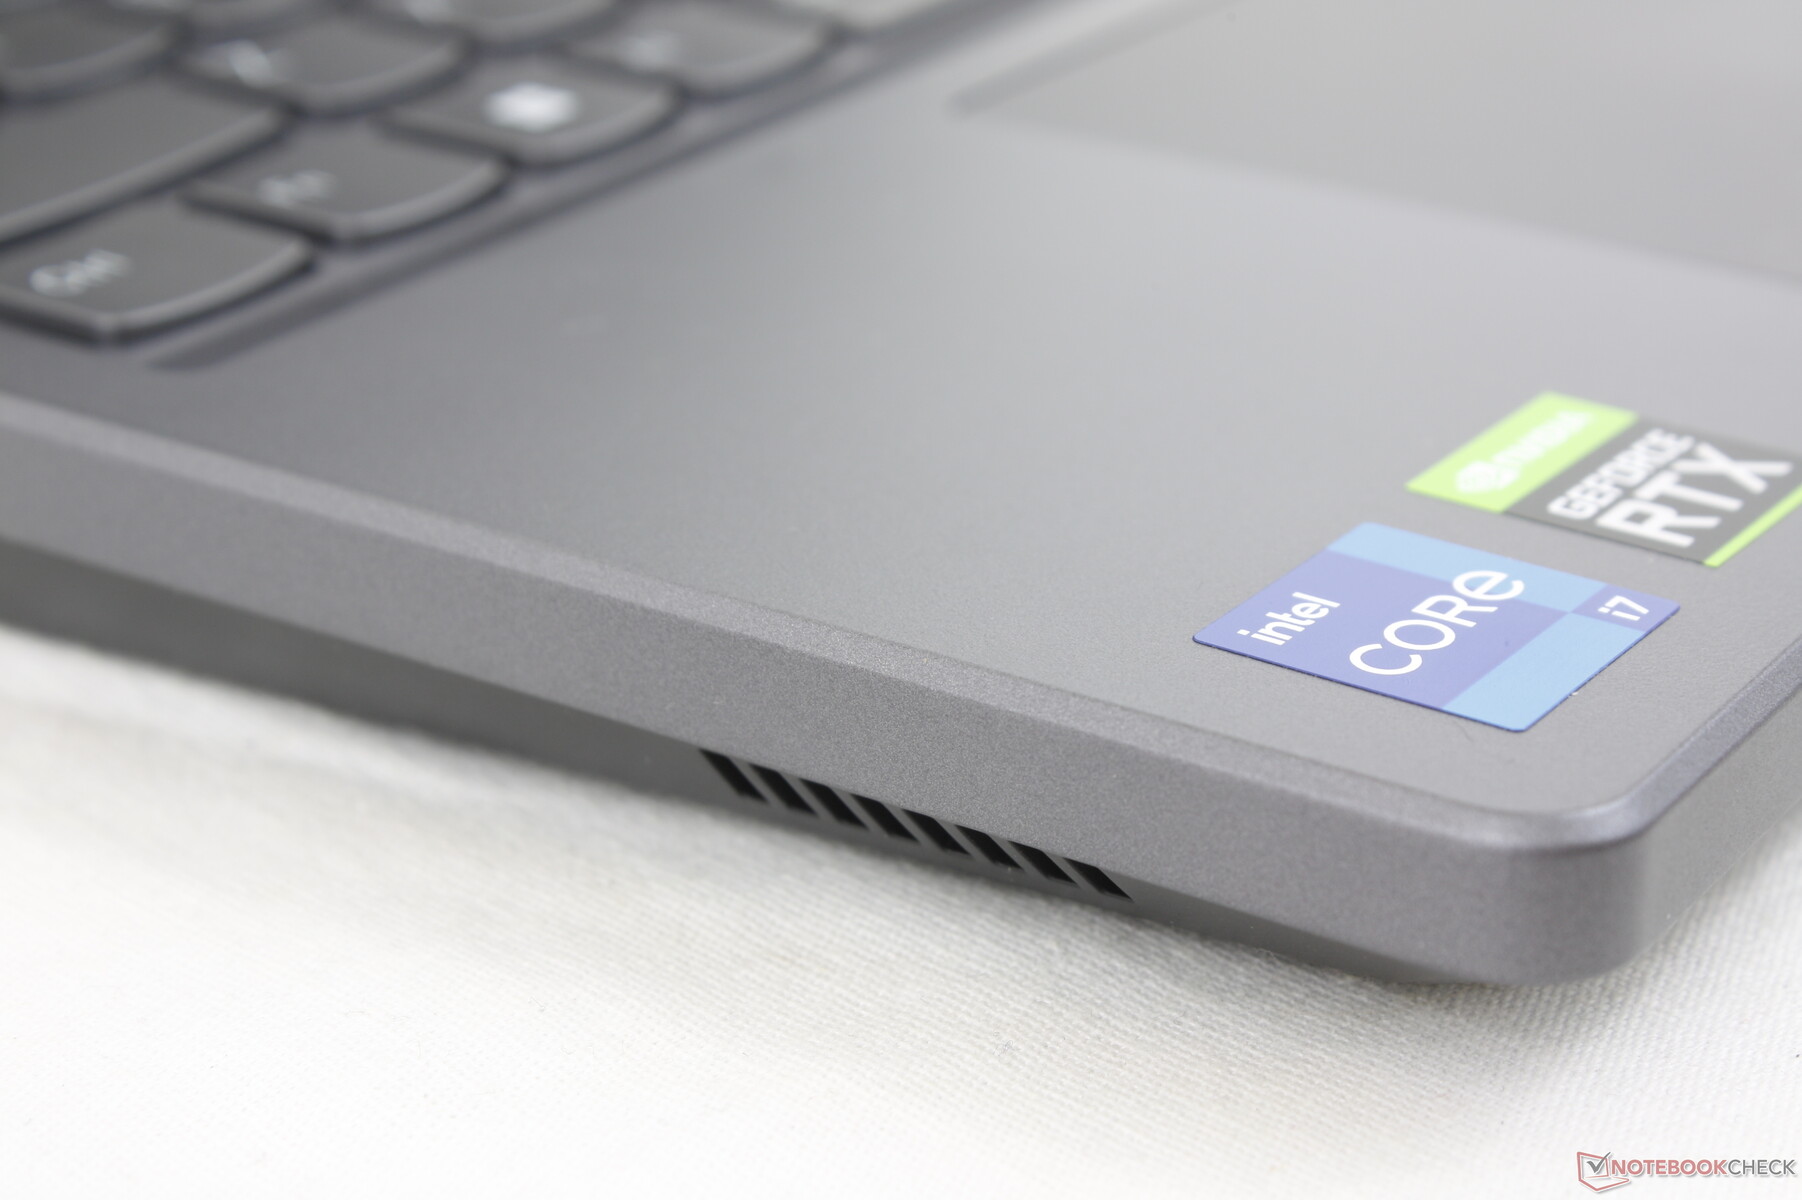
Our configuration in review is a midrange configuration with the Core i7-12700H, GeForce RTX 3060 GPU, and 1080p165 1080p IPS display for approximately $1600 USD retail. Other SKUs are available with the lesser Core i5-12500H CPU, 144 Hz display, or faster GeForce RTX 3070 Ti.
Competitors to the Legion 5 15 include other mid-range 15.6-inch gaming laptops like the Razer Blade 15 Base Edition, Asus TUF Gaming F15, MSI Bravo 15, or Acer Aspire Nitro 5. The Legion 5 15 should not be confused with the Legion 5 Pro which is a larger 16-inch design.
All specification options can be found on the official Lenovo PDF here.
More Lenovo reviews:
Potential Competitors in Comparison
Rating | Date | Model | Weight | Height | Size | Resolution | Price |
|---|---|---|---|---|---|---|---|
| 87.5 % v7 (old) | 11 / 2022 | Lenovo Legion 5 15IAH7H 82RB i7-12700H, GeForce RTX 3060 Laptop GPU | 2.4 kg | 19.99 mm | 15.60" | 1920x1080 | |
| 83.4 % v7 (old) | 09 / 2021 | Lenovo Legion 5 15ACH-82JU00C6GE-FL R7 5800H, GeForce RTX 3060 Laptop GPU | 2.5 kg | 26 mm | 15.60" | 1920x1080 | |
| 78.2 % v7 (old) | 04 / 2022 | MSI Bravo 15 B5DD-010US R5 5600H, Radeon RX 5500M | 2.3 kg | 24.95 mm | 15.60" | 1920x1080 | |
| 87.2 % v7 (old) | 03 / 2022 | Asus TUF Gaming F15 FX507ZM i7-12700H, GeForce RTX 3060 Laptop GPU | 2.1 kg | 24.95 mm | 15.60" | 1920x1080 | |
| 80.5 % v7 (old) | 05 / 2021 | Acer Aspire Nitro 5 AN515-55-57GF i5-10300H, GeForce RTX 3060 Laptop GPU | 2.3 kg | 23.9 mm | 15.60" | 1920x1080 | |
| 85.5 % v7 (old) | 03 / 2021 | Razer Blade 15 Base Edition 2021, i7-10750H RTX 3060 i7-10750H, GeForce RTX 3060 Laptop GPU | 2.1 kg | 19.9 mm | 15.60" | 1920x1080 |
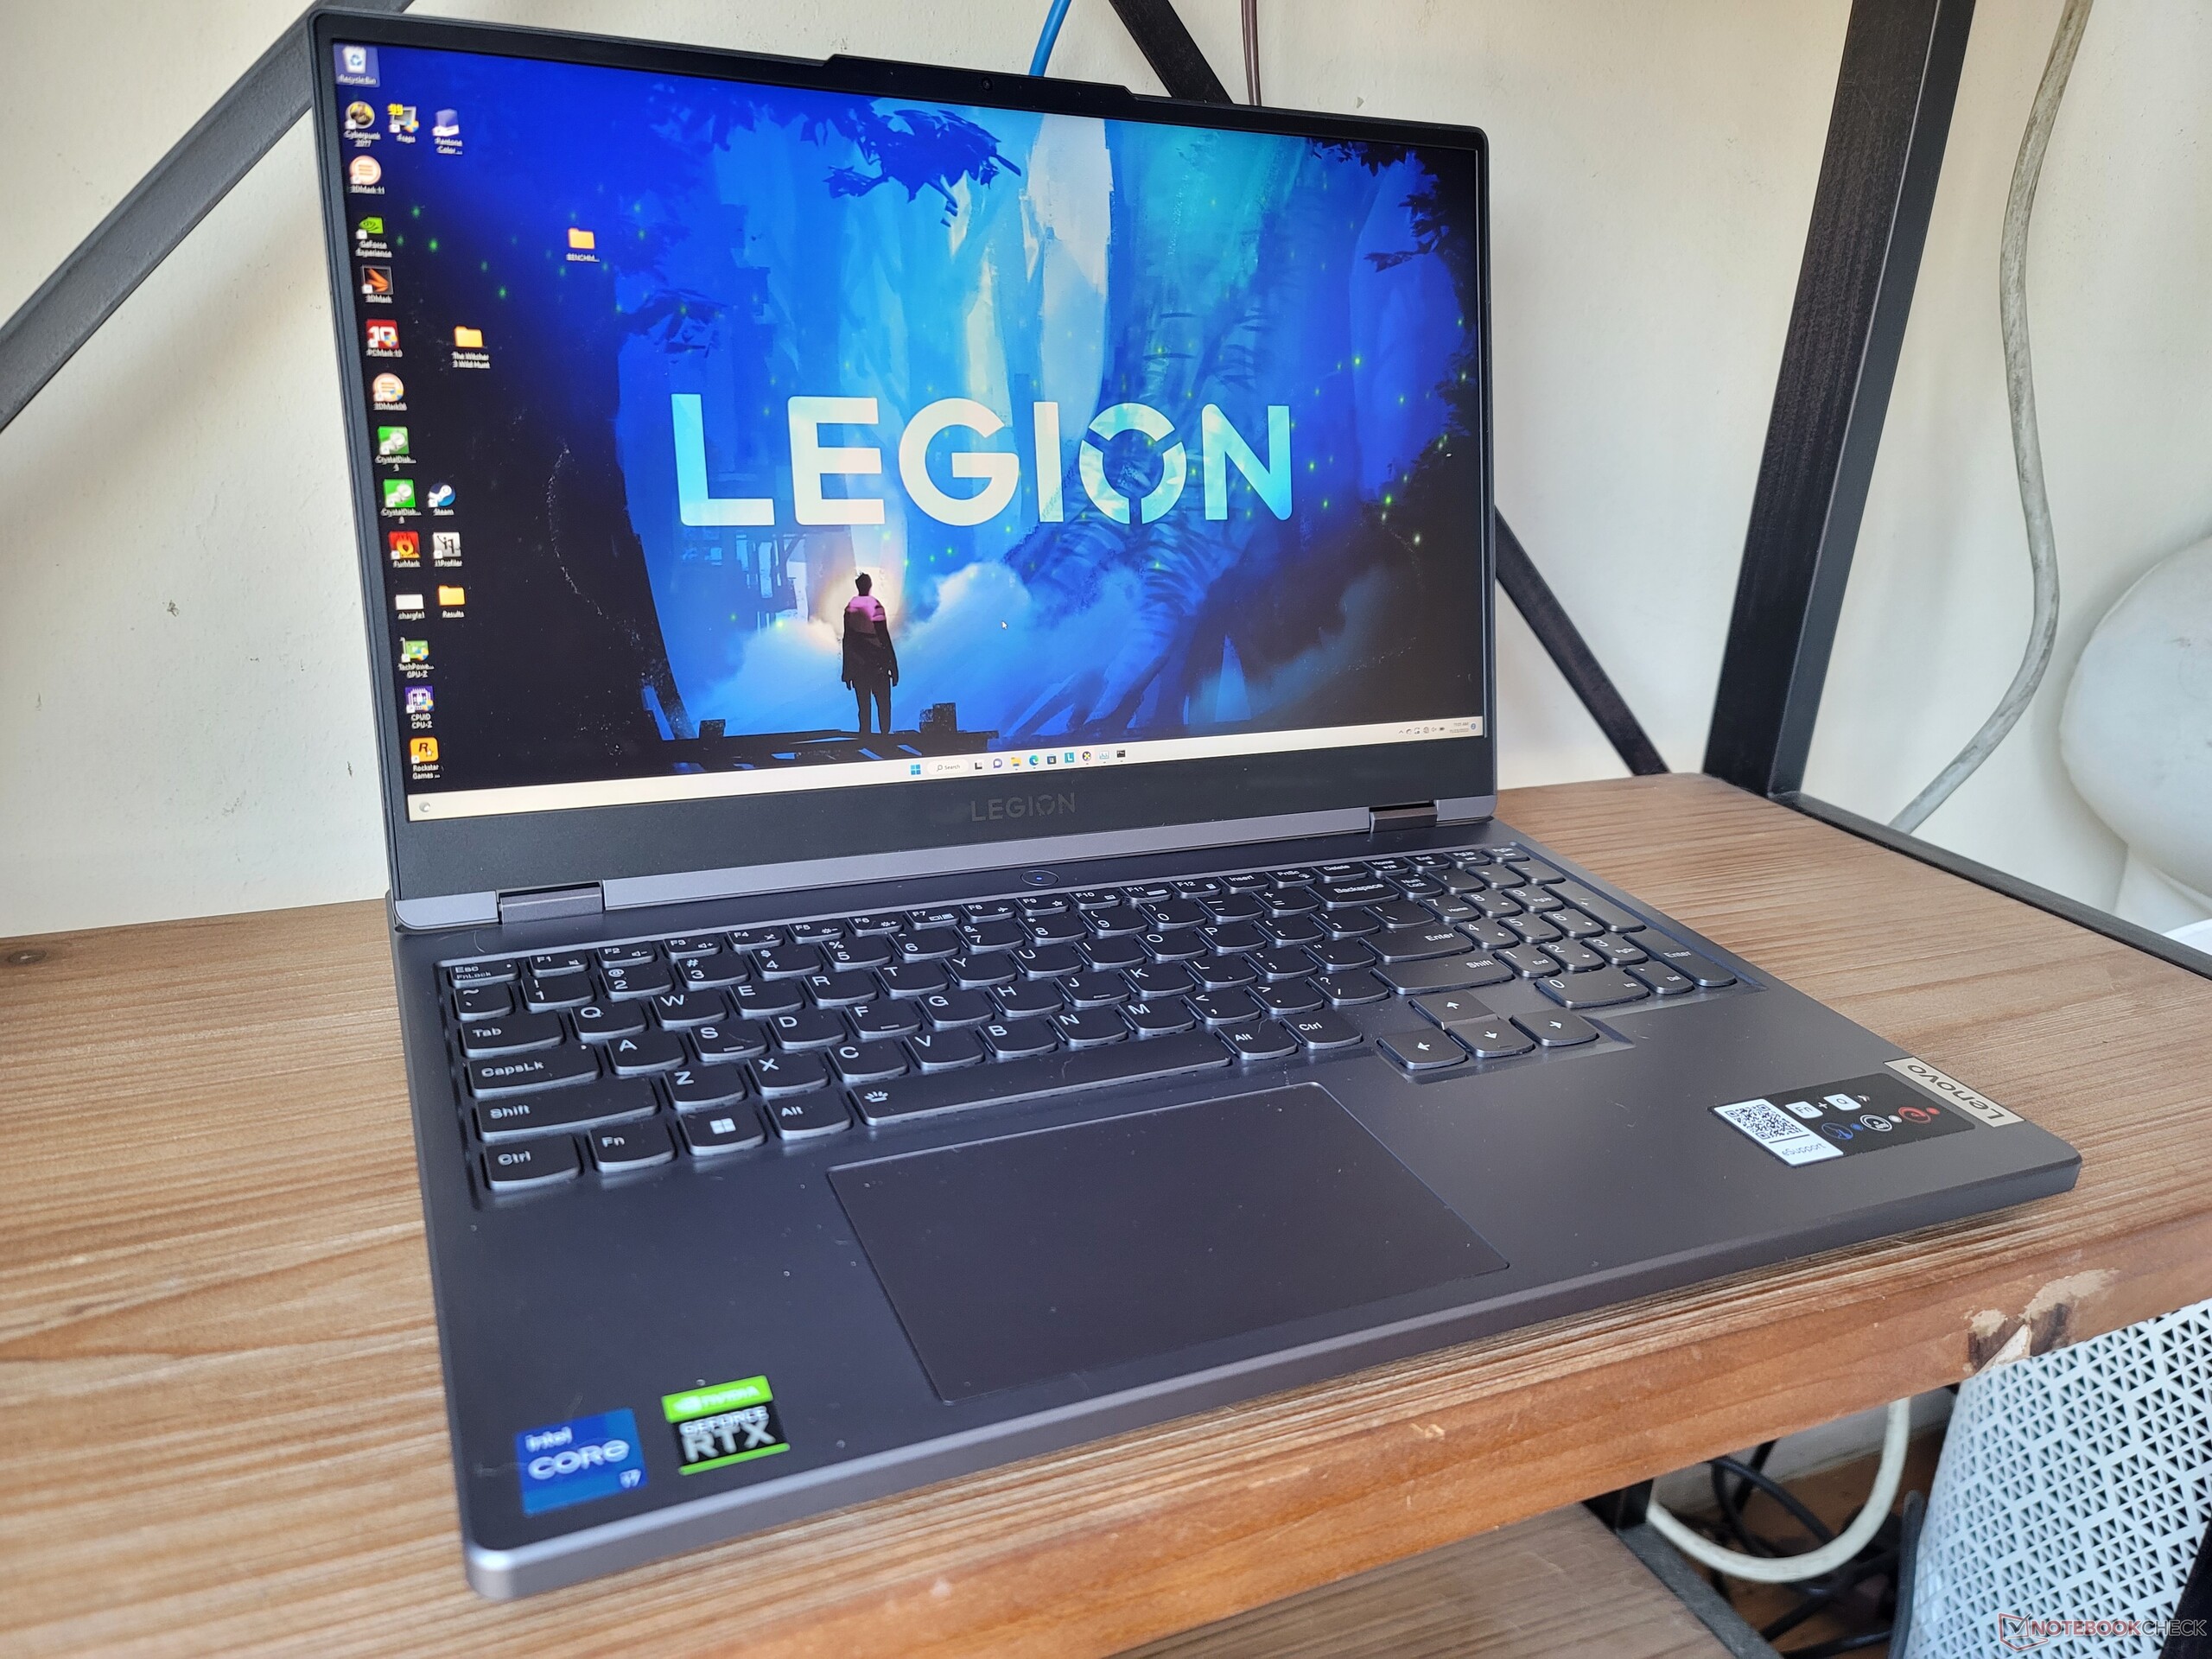
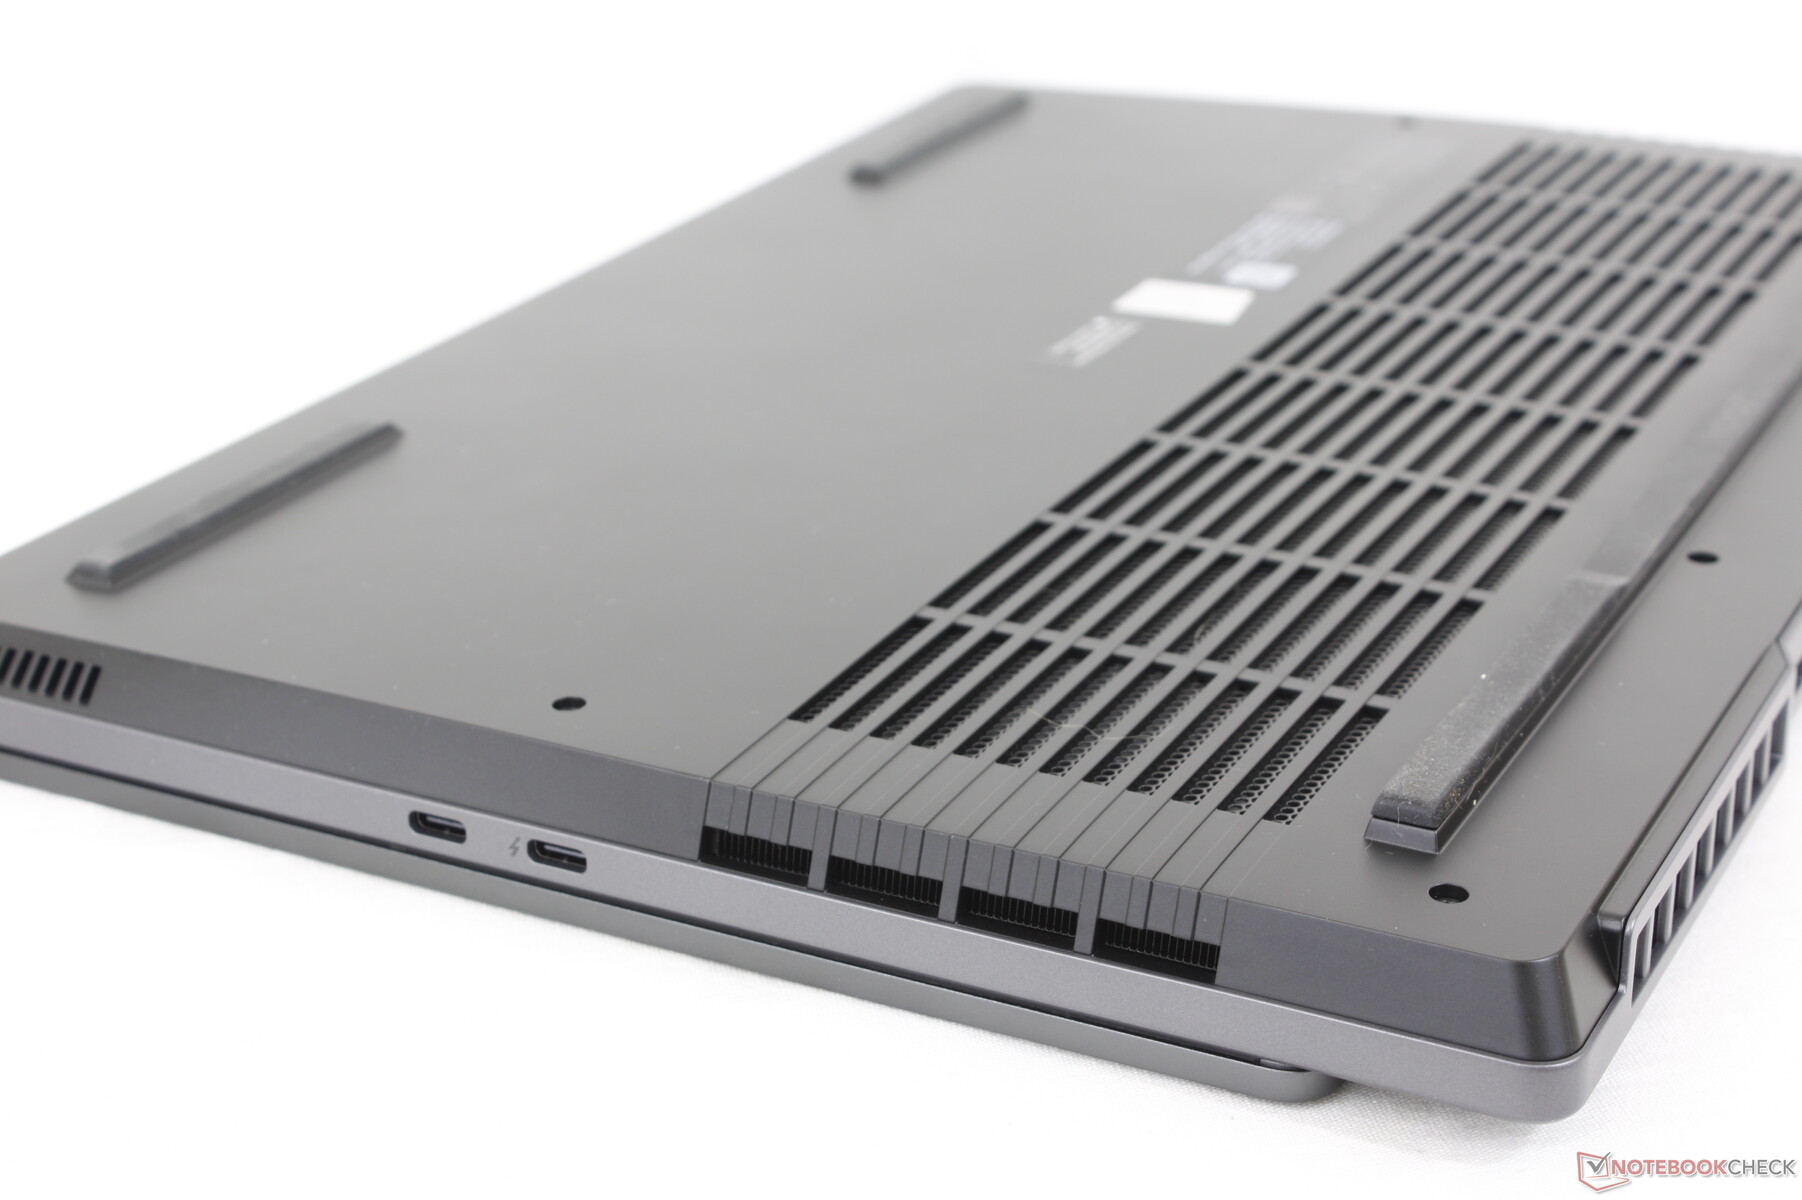
Case — Legion With A Dash Of ThinkBook
The chassis retains the general aesthetic of last year's model but with rounded off corners on all sides and redesigned ventilation grilles. The cleaner look more closely resembles the ThinkBook series which is likely not a coincidence. When compared to the competing Asus TUF/ROG series or the MSI series, the new Legion 5 15 looks much less gamer-y and more towards semi-professional.
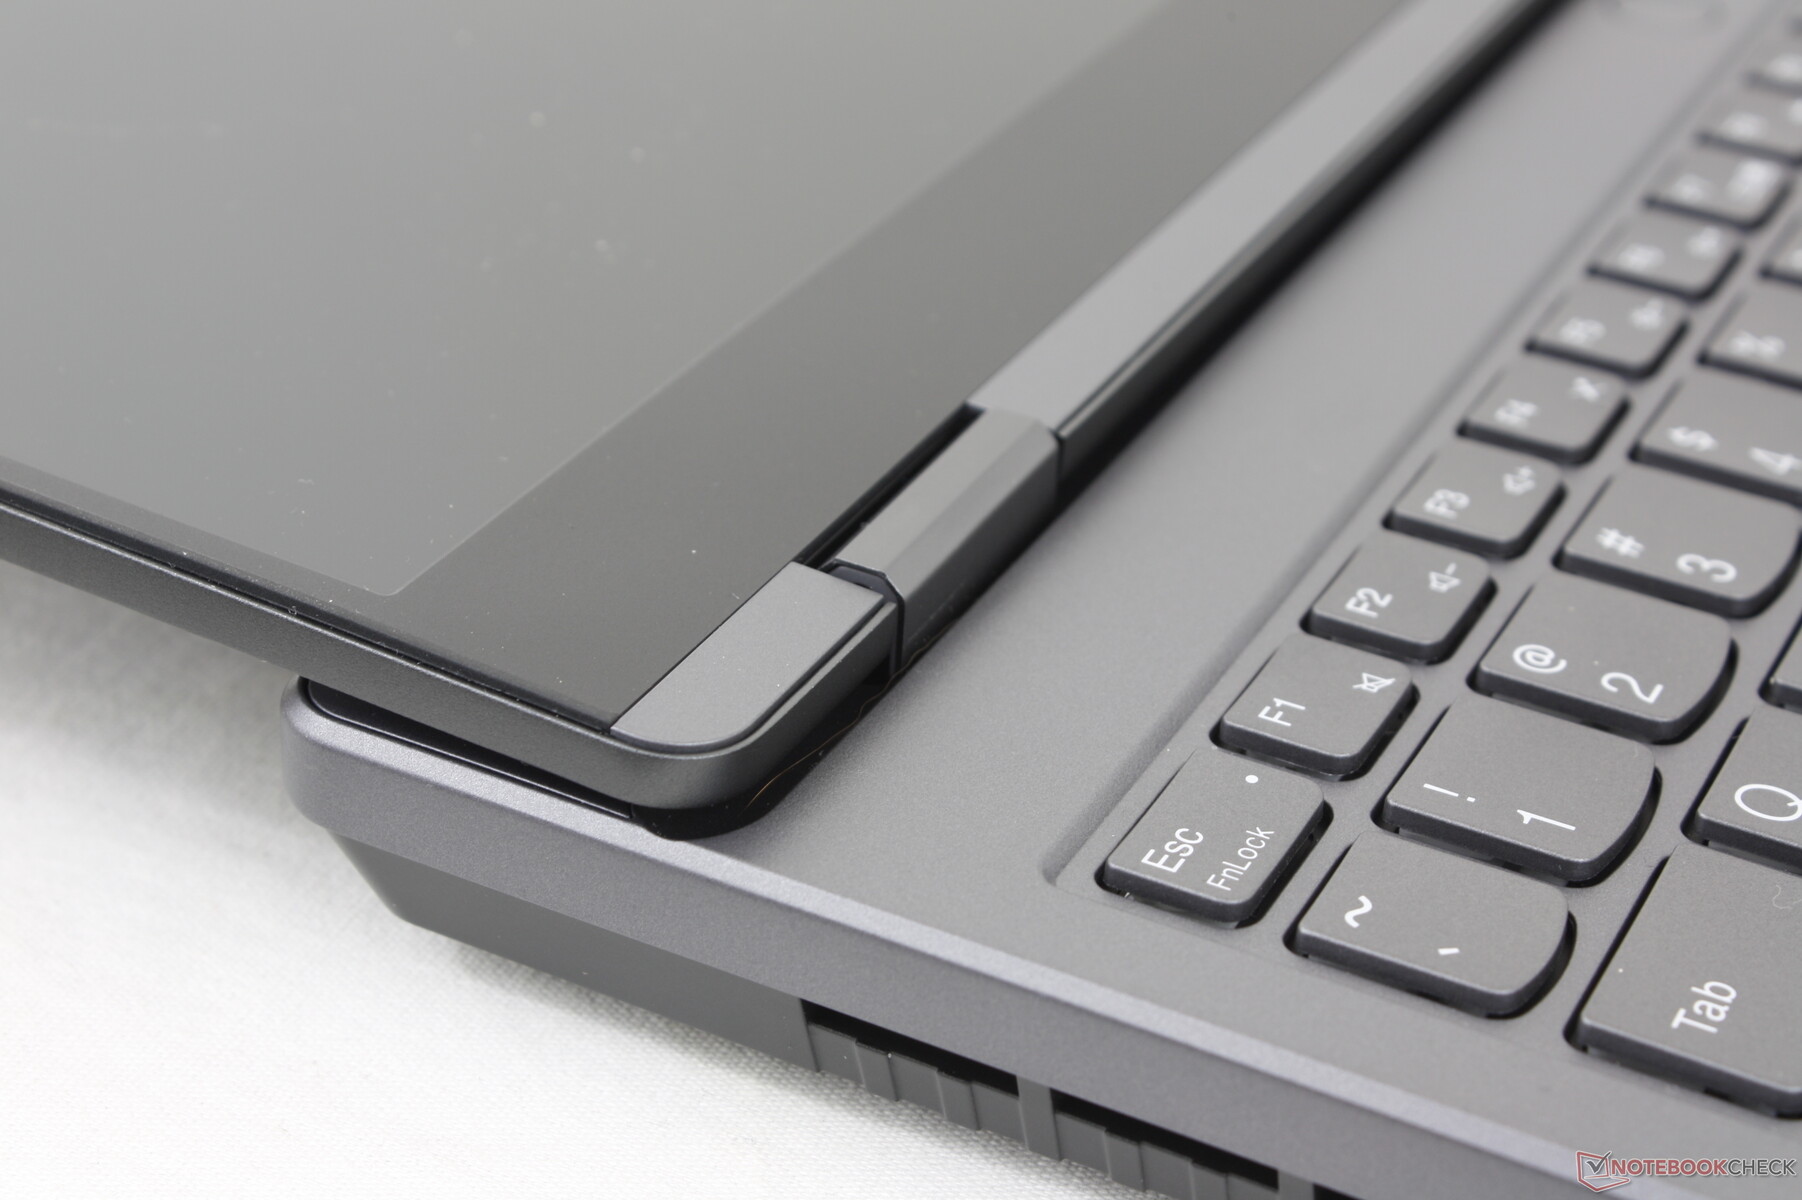
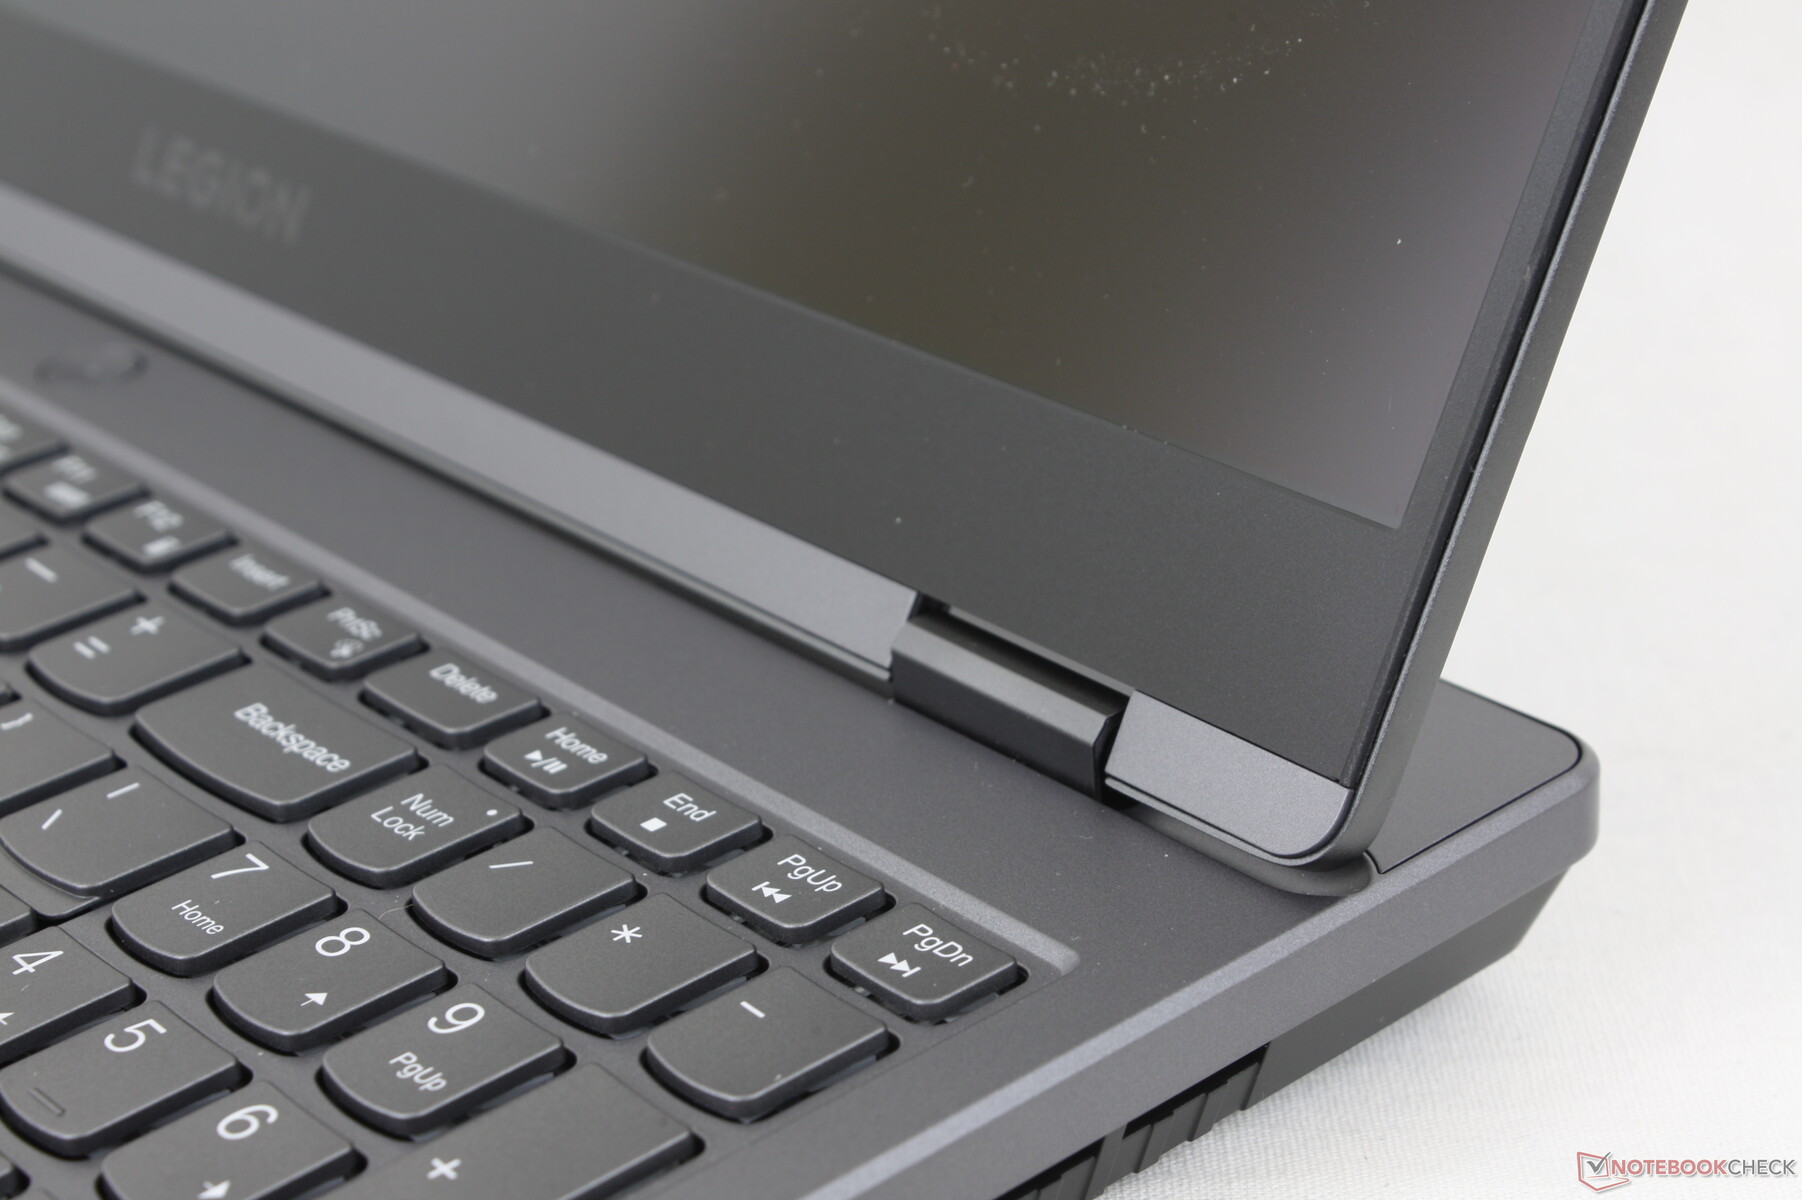
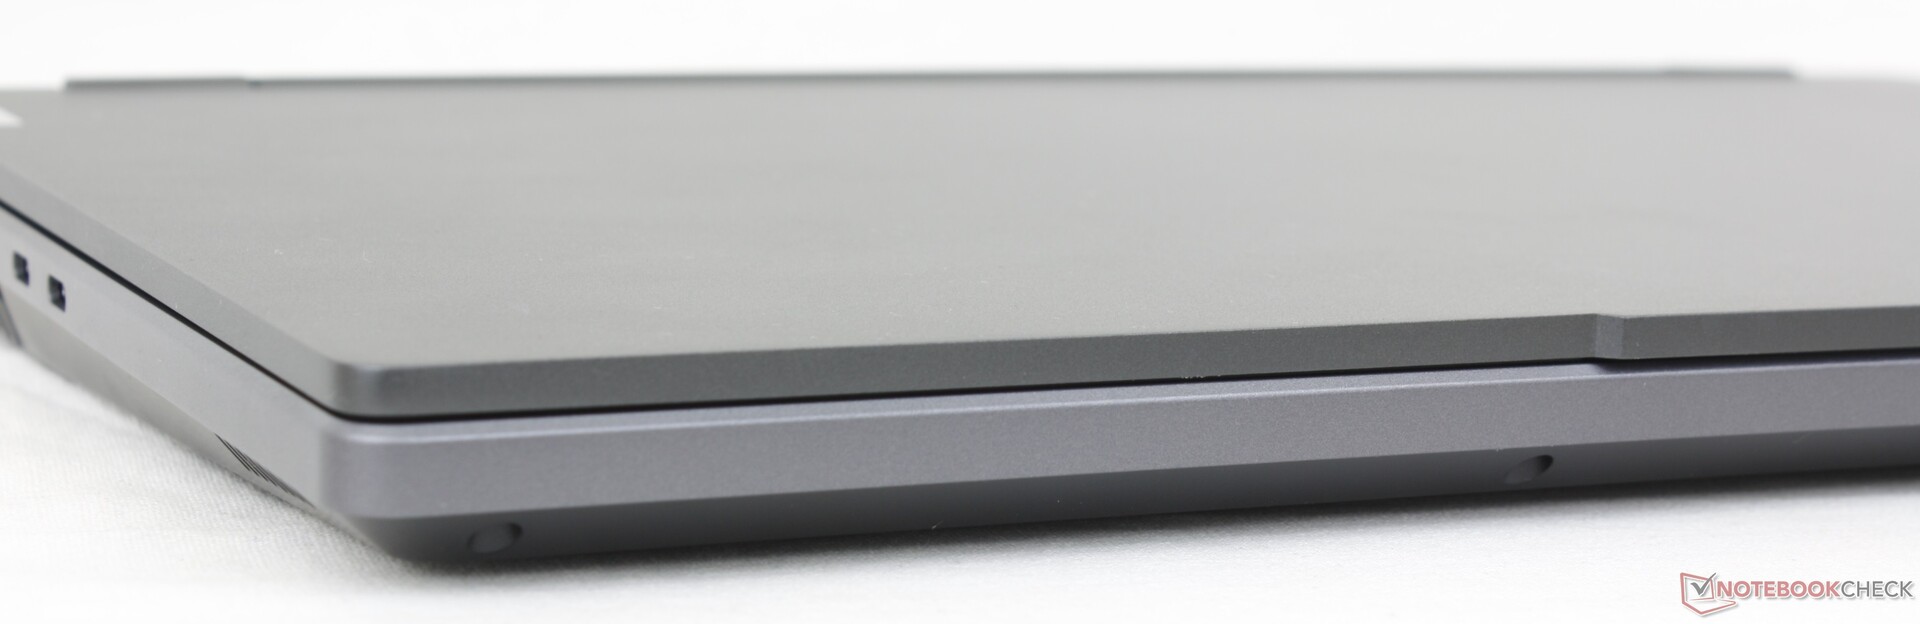
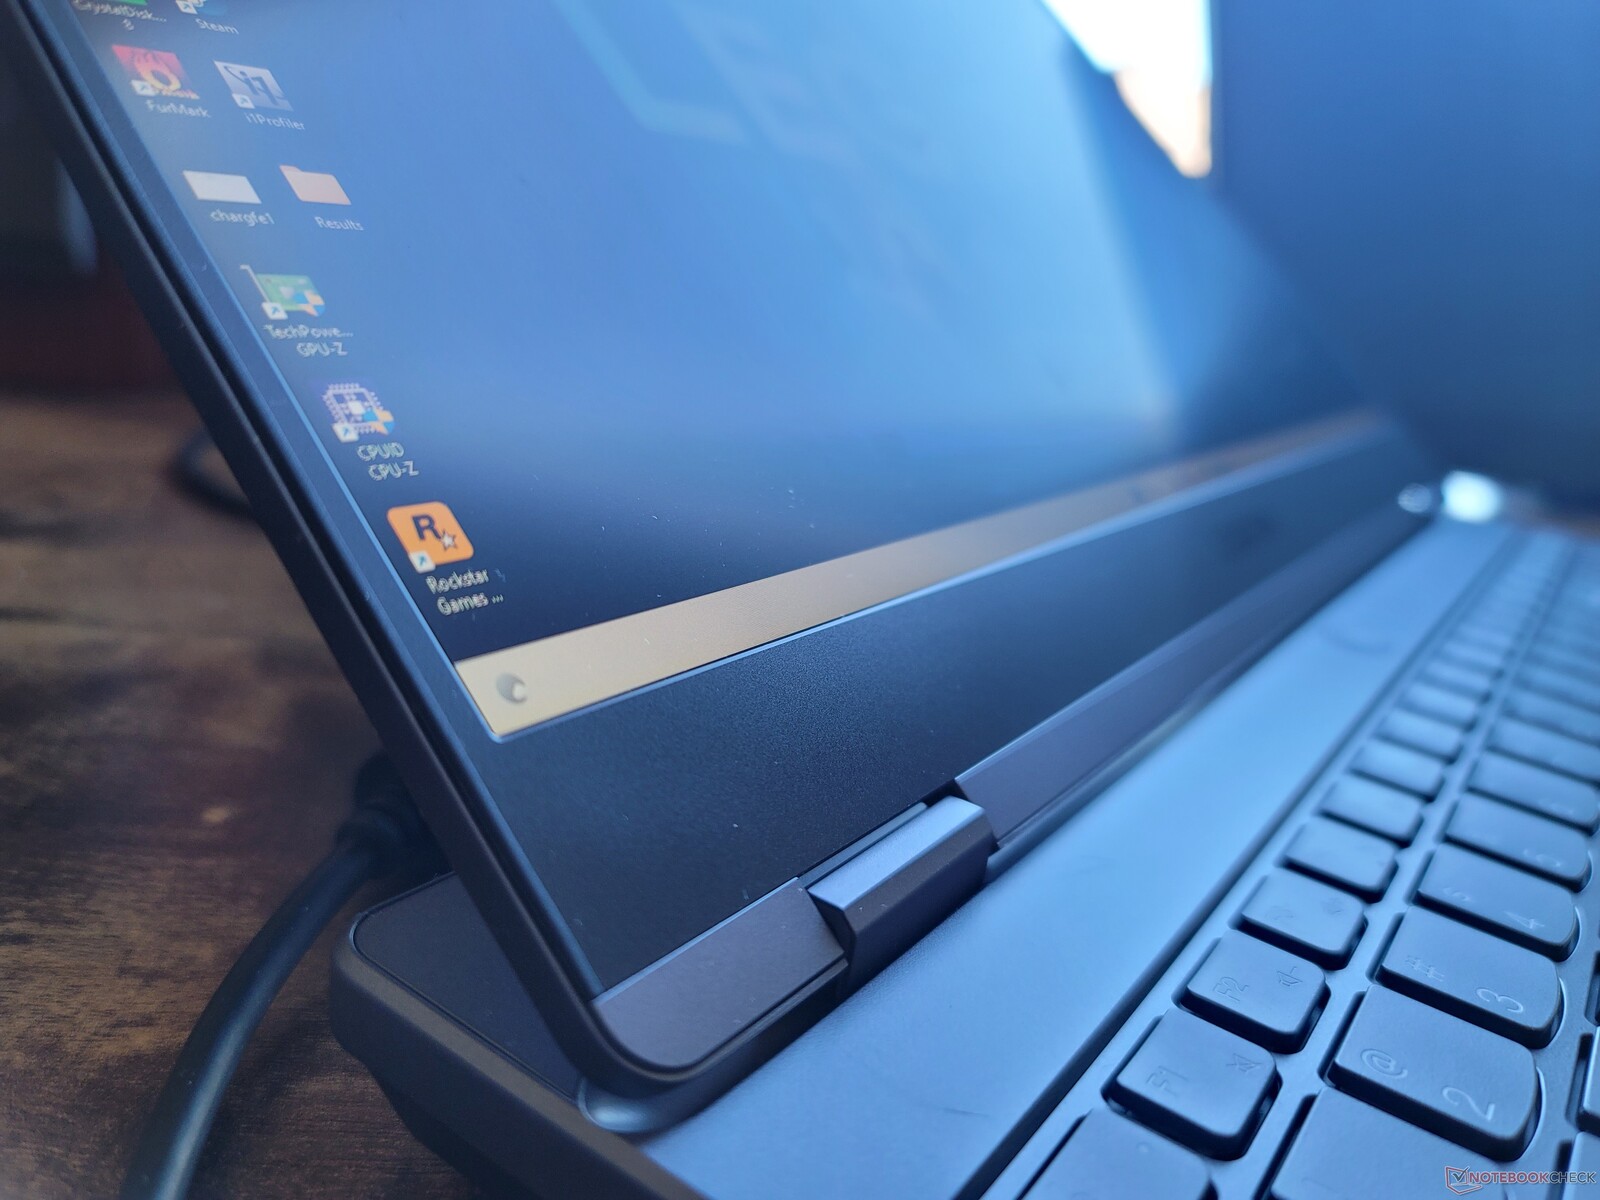
Chassis rigidity is strong but not quite up there with the Razer Blade series. When attempting to twist the base, for example, the Lenovo would exhibit slightly more warping and creaking and the same can be said for its display. The hinges are satisfactory but not as strong as the oversized hinges of the Asus TUF series.
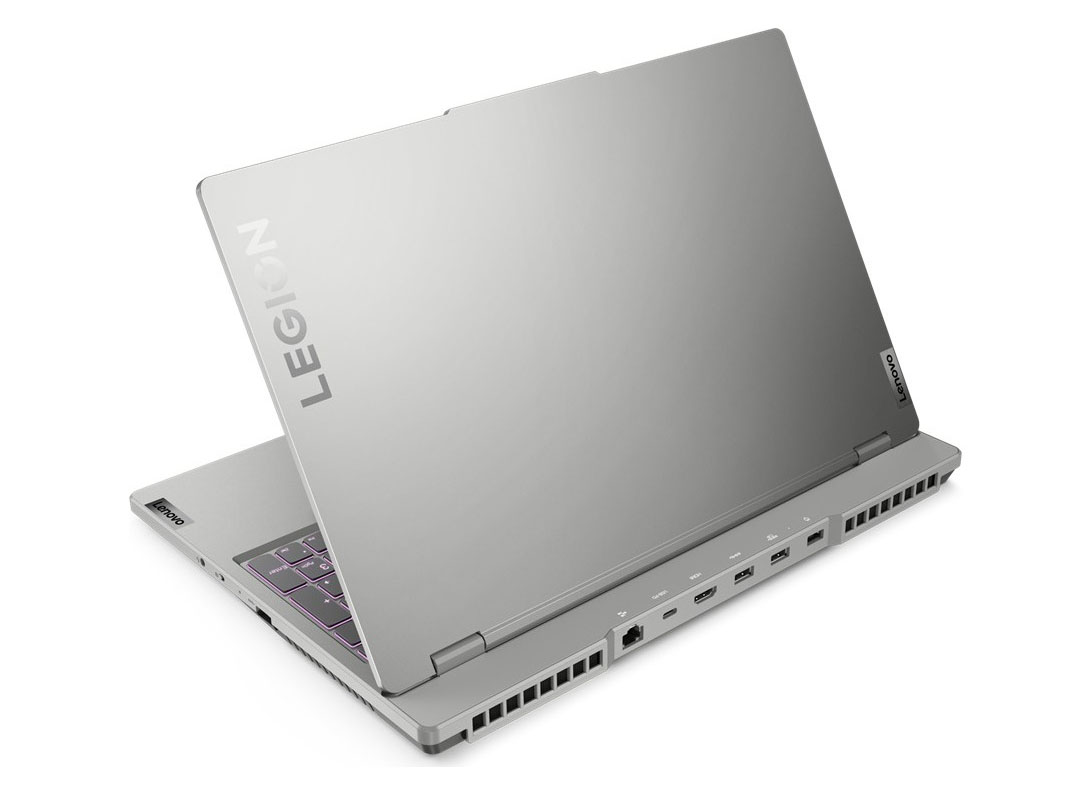
The model is wider and thus heavier than many other 15.6-inch gaming laptops due to the large protruding rear of the Legion design. Though this helps with cooling and performance, the drawback is a clunkier laptop that's not as well suited for traveling as many alternatives like the Razer Blade 15 Base Edition.
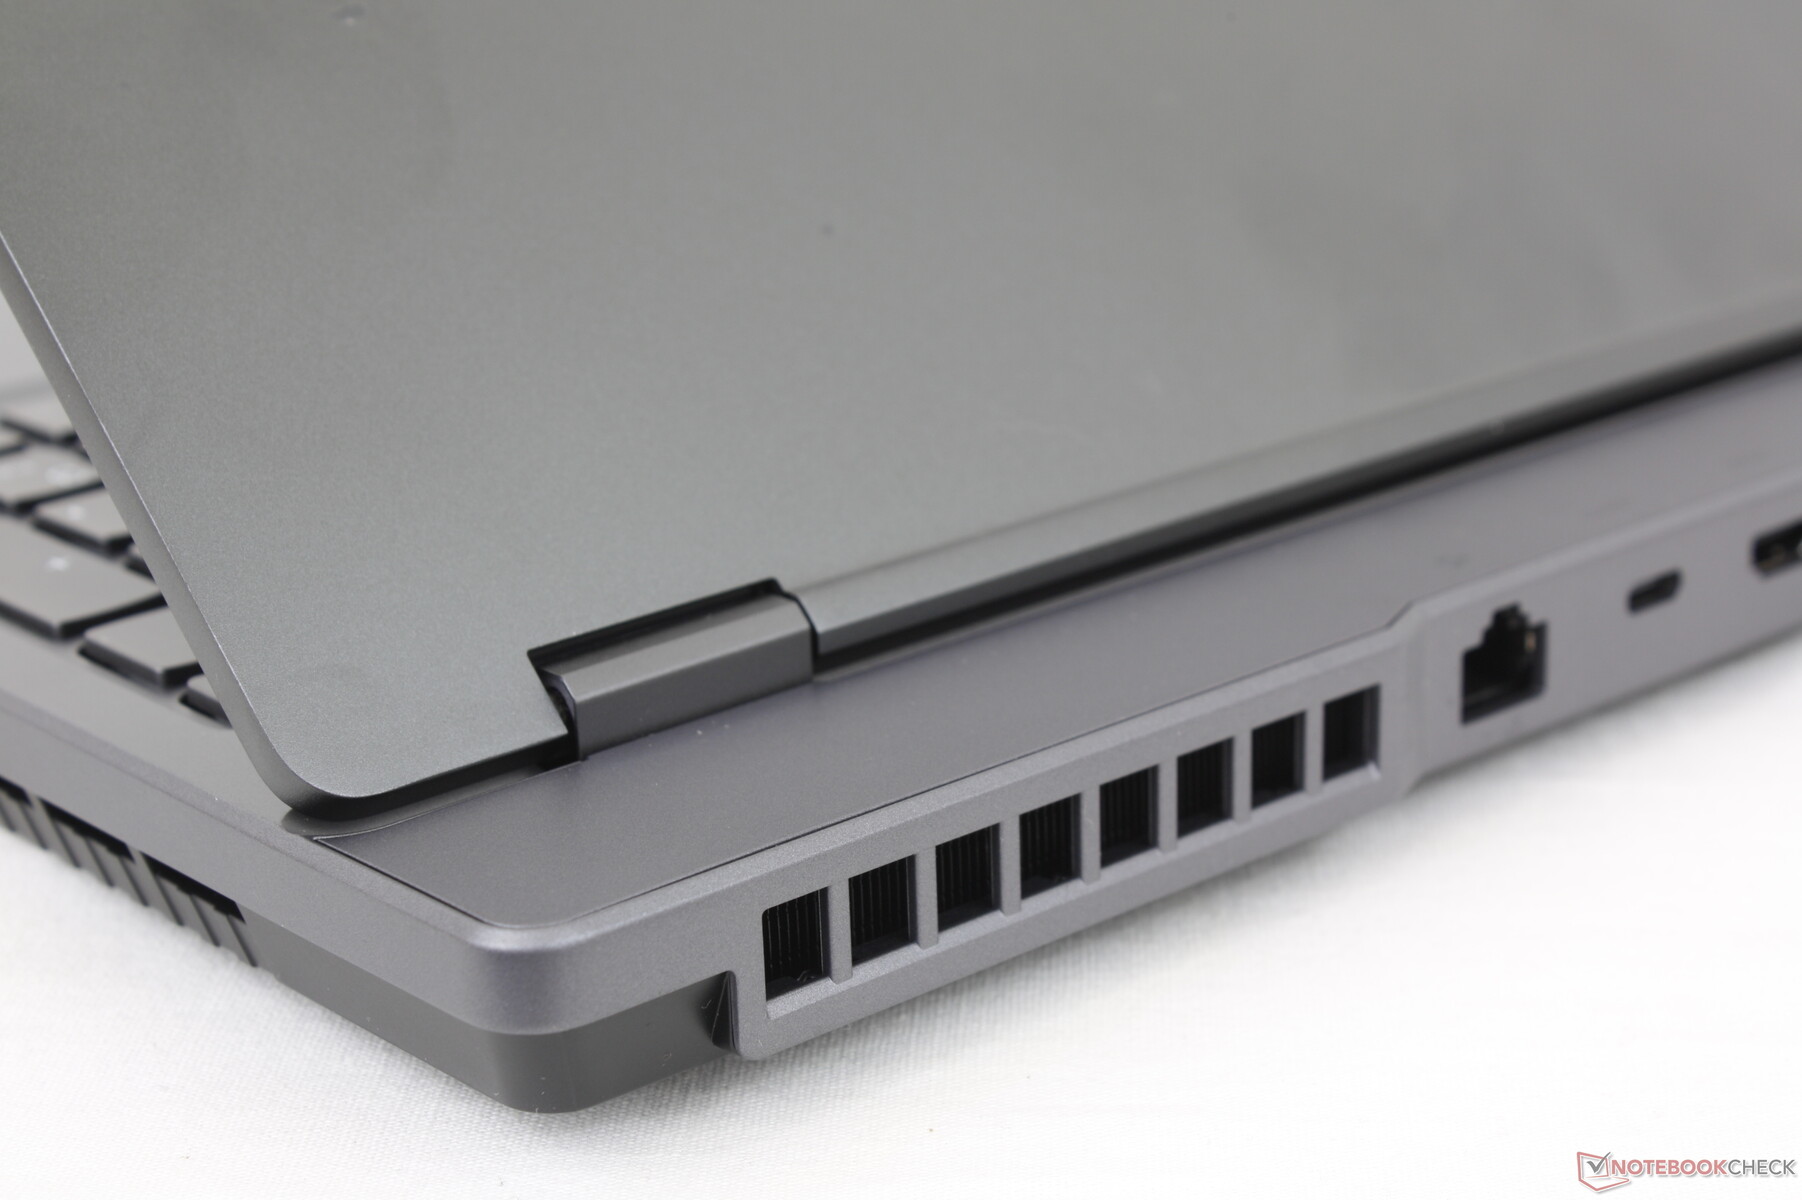
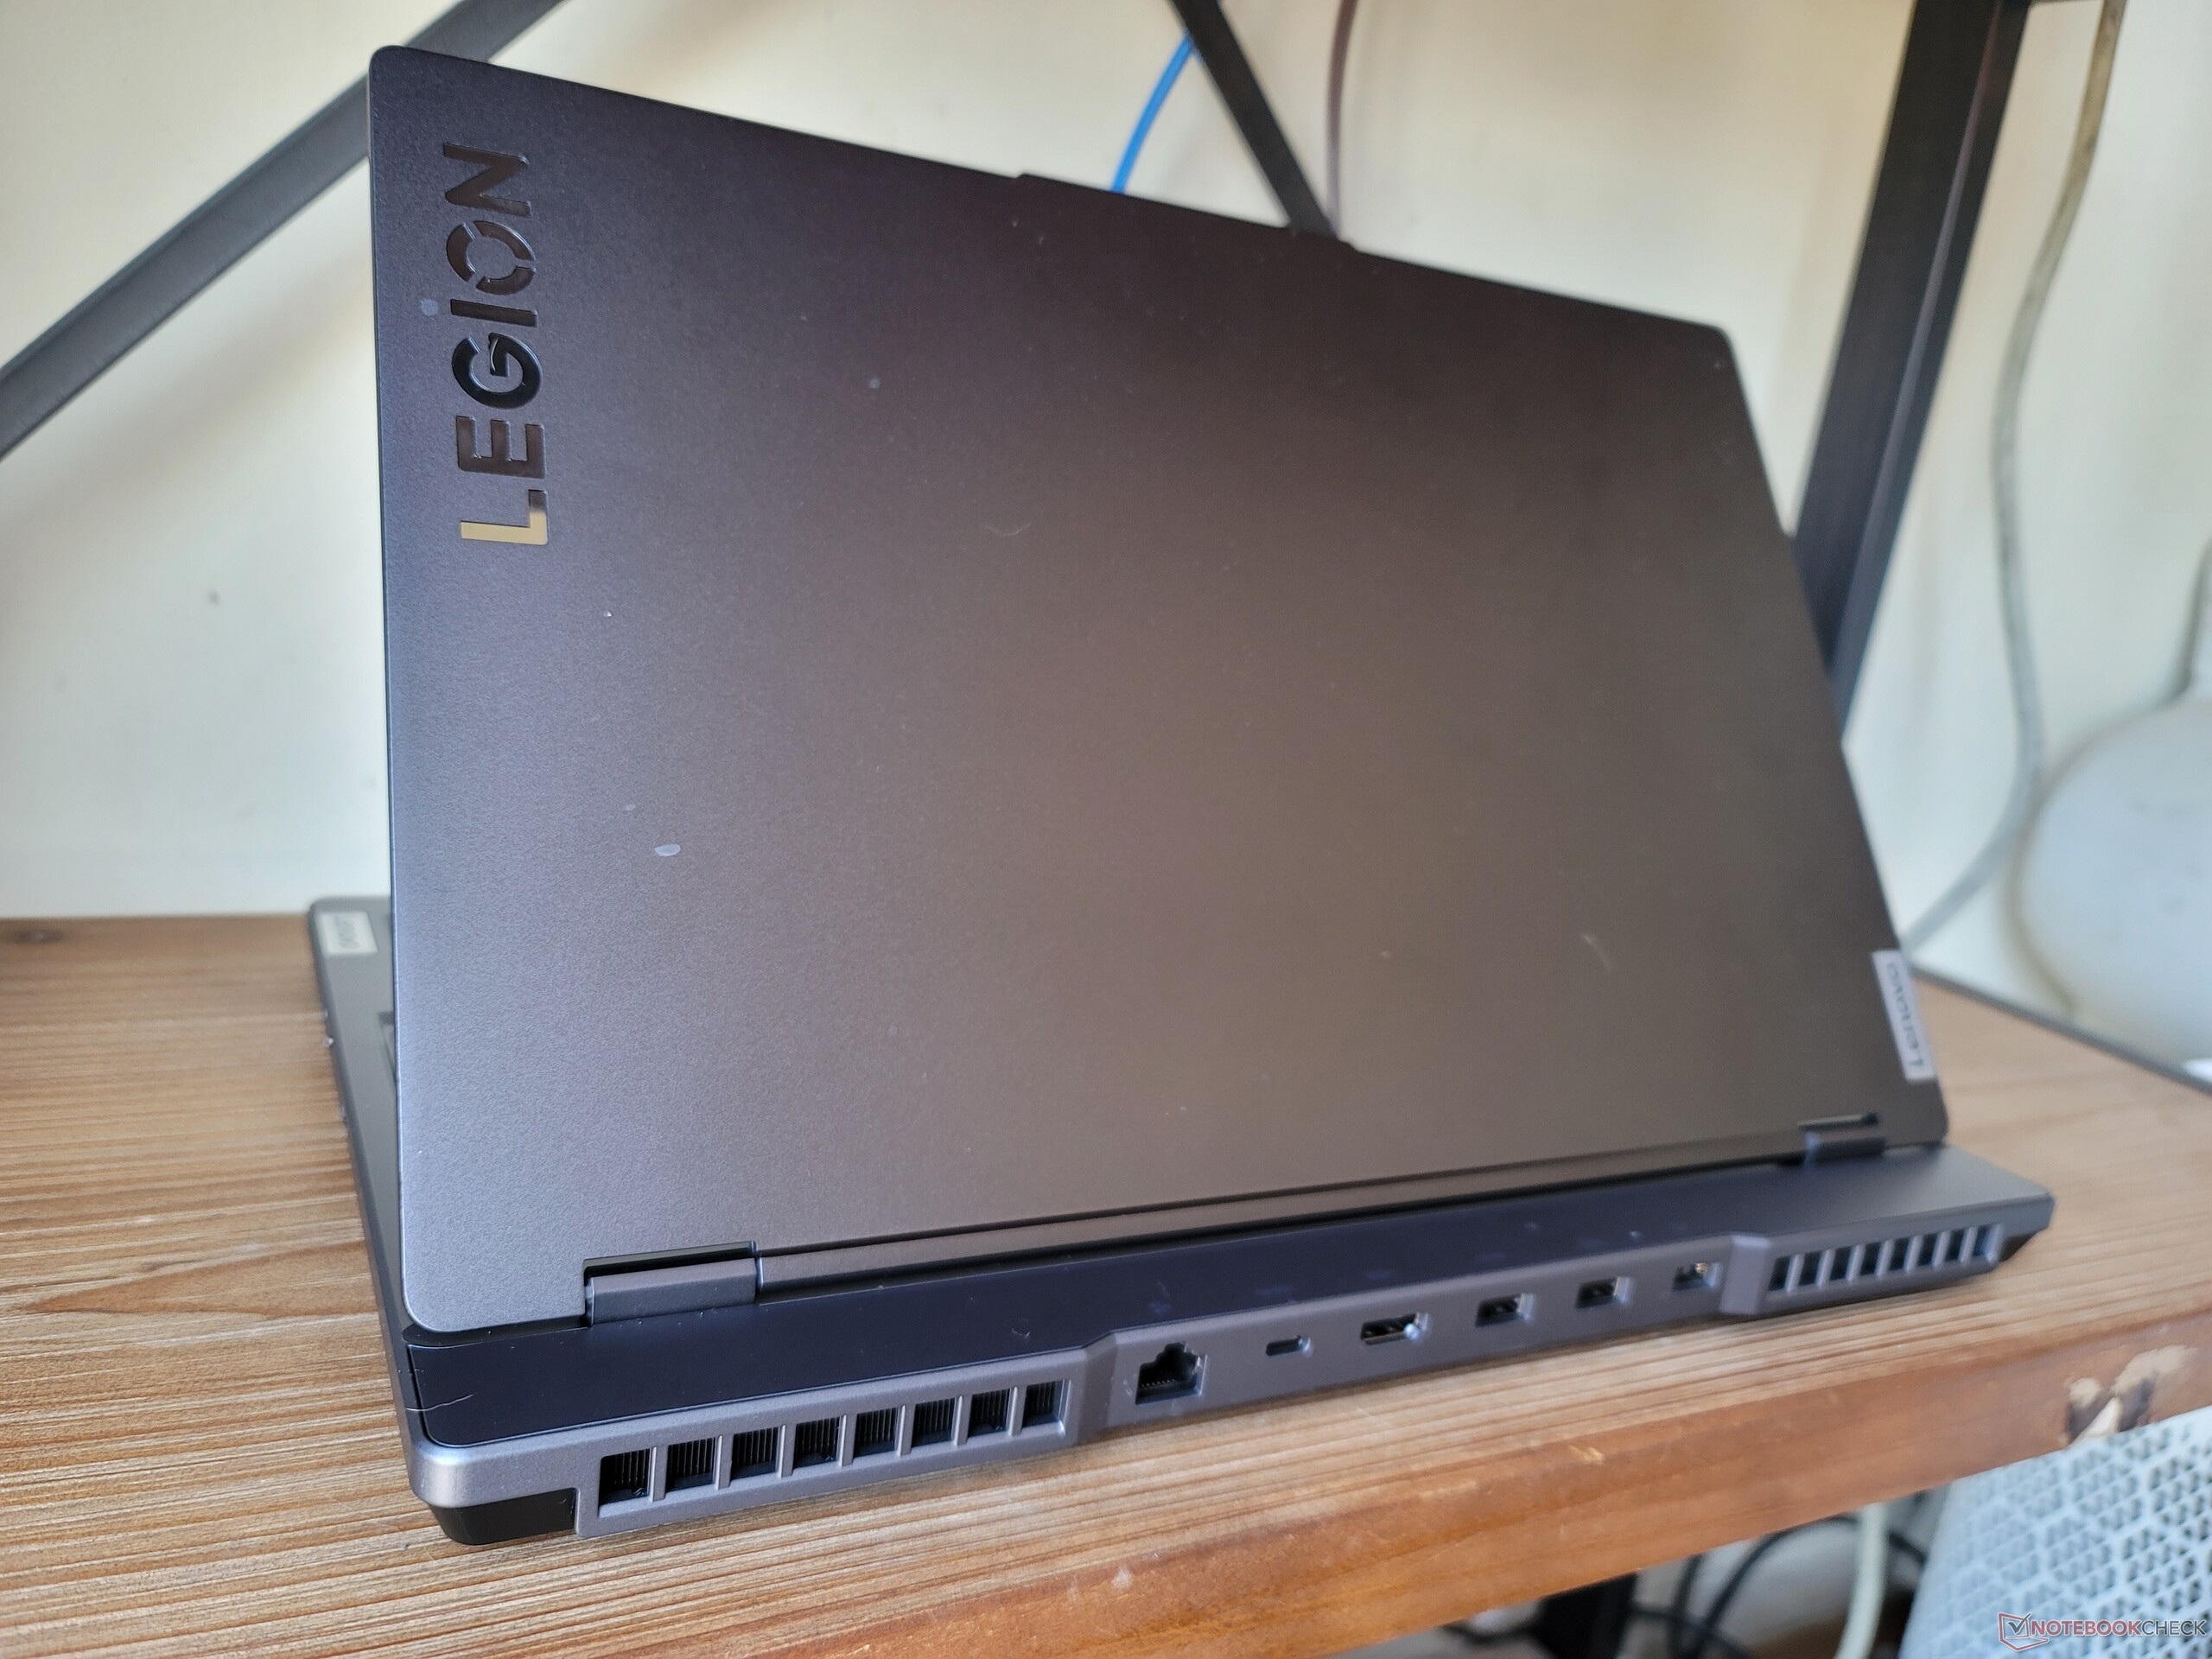
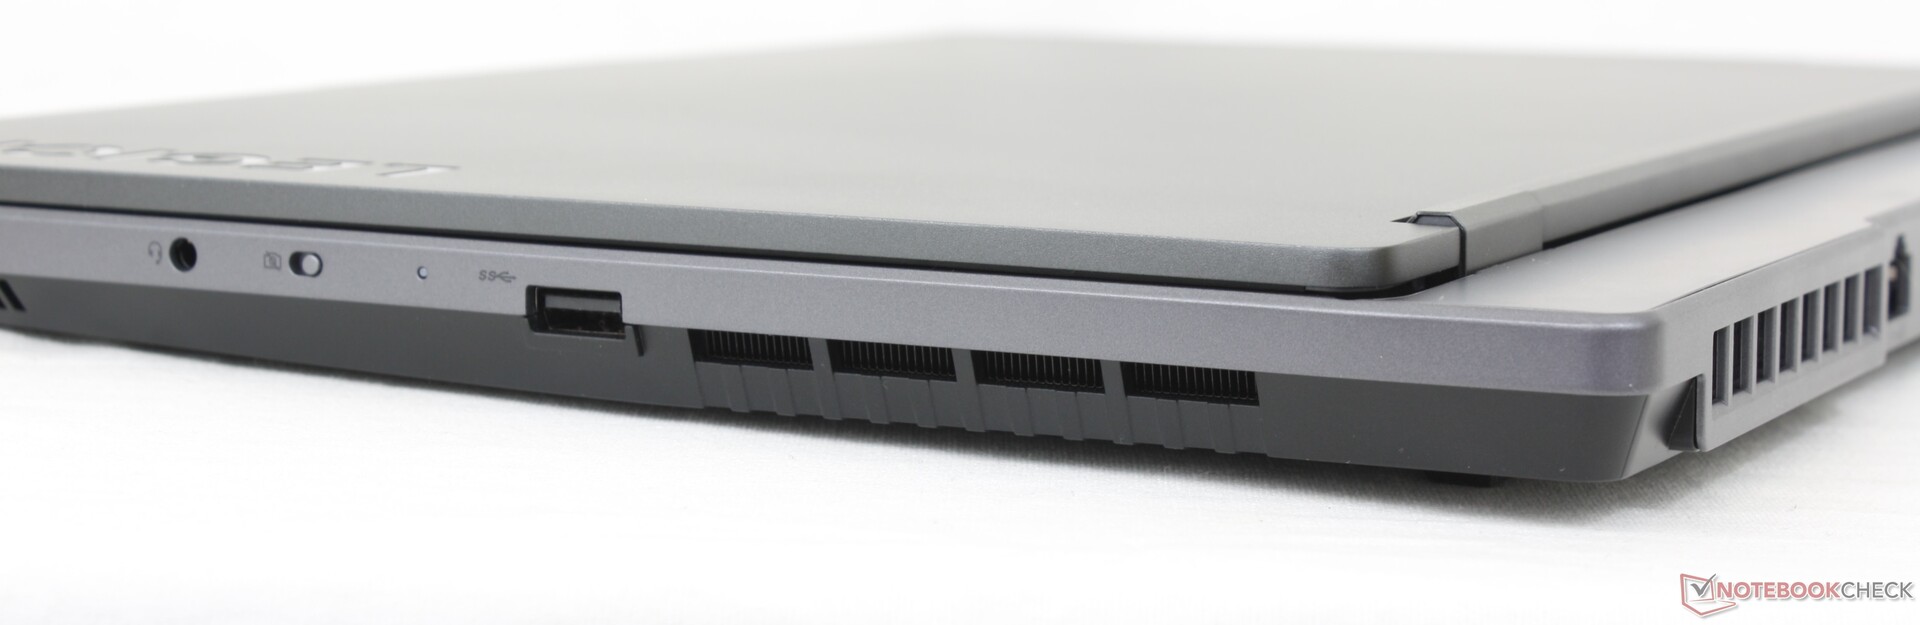
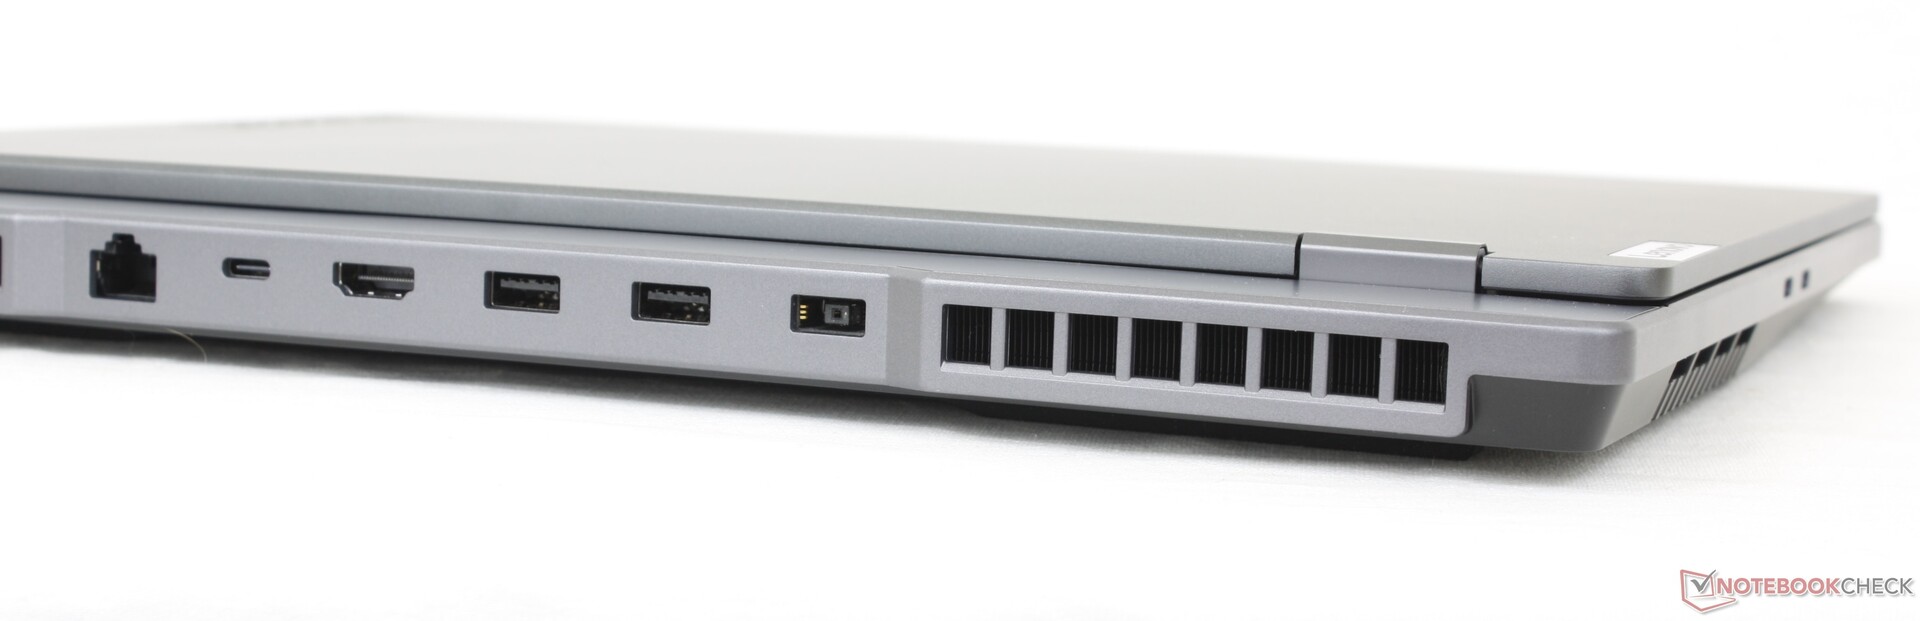
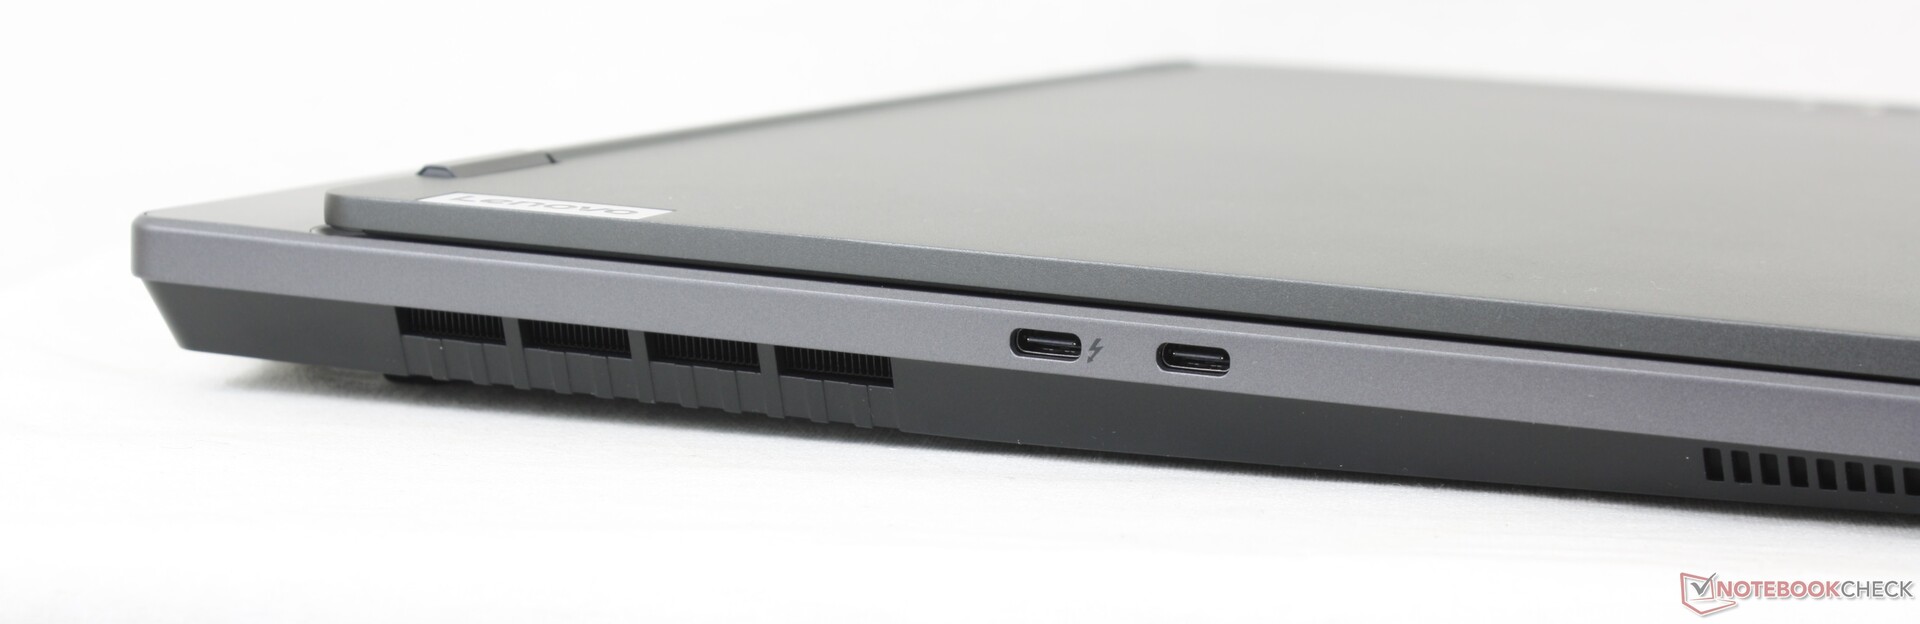
Connectivity — Thunderbolt 4 Support
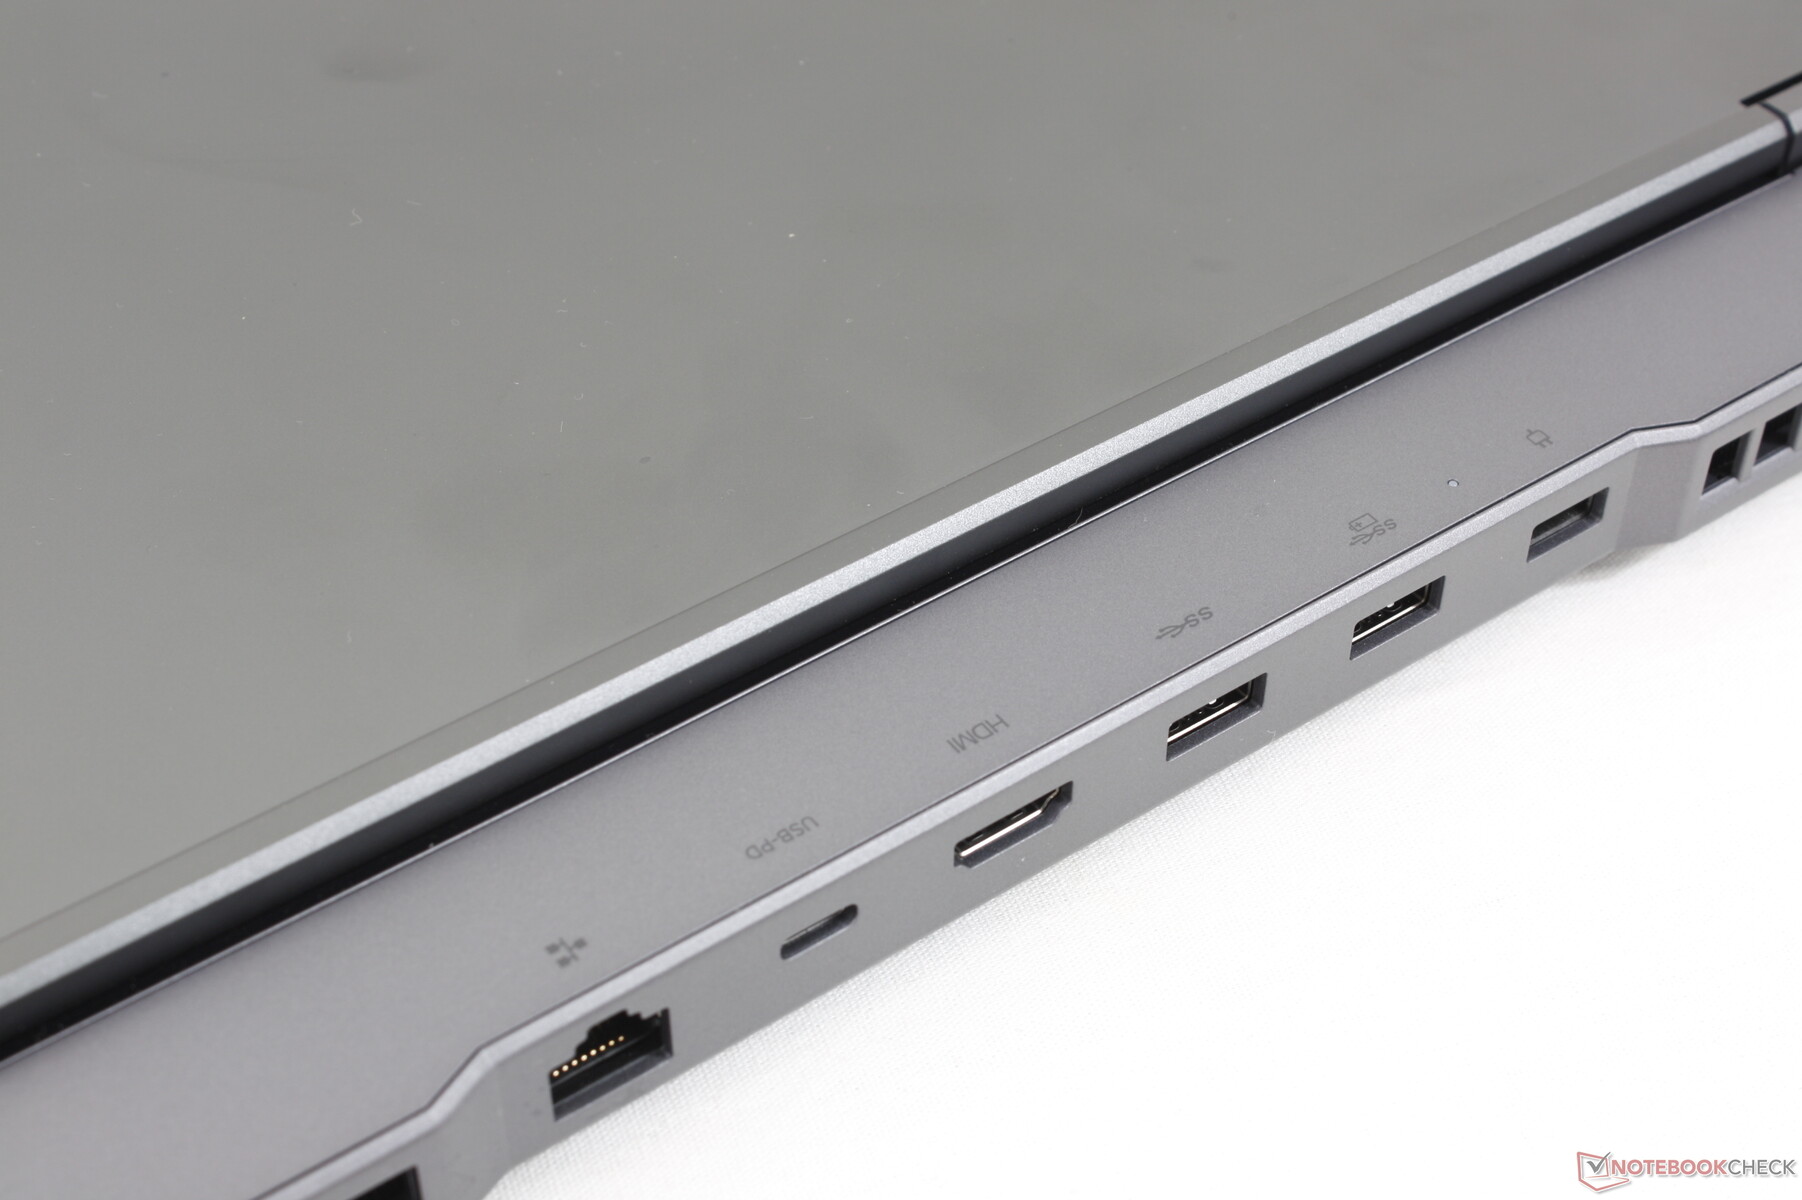
When compared to the AMD-based 2021 model, our Intel model swaps out one USB-A port for one USB-C port. Port options are otherwise identical between the two models albeit with rearranged positioning. The majority of the ports are along the rear unlike on most other gaming laptops for better or worse.
Thunderbolt 4 is supported only on the labeled USB-C port along the left edge.
Communication
The Intel AX211 comes standard on most SKUs for Wi-Fi 6E and Bluetooth 5.2 compatibility. We experienced no issues when paired to our 6 GHz network.
| Networking | |
| iperf3 transmit AX12 | |
| Razer Blade 15 Base Edition 2021, i7-10750H RTX 3060 | |
| Acer Aspire Nitro 5 AN515-55-57GF | |
| MSI Bravo 15 B5DD-010US | |
| Asus TUF Gaming F15 FX507ZM | |
| Lenovo Legion 5 15ACH-82JU00C6GE-FL | |
| iperf3 receive AX12 | |
| Razer Blade 15 Base Edition 2021, i7-10750H RTX 3060 | |
| Asus TUF Gaming F15 FX507ZM | |
| MSI Bravo 15 B5DD-010US | |
| Lenovo Legion 5 15ACH-82JU00C6GE-FL | |
| Acer Aspire Nitro 5 AN515-55-57GF | |
| iperf3 receive AXE11000 6GHz | |
| Lenovo Legion 5 15IAH7H 82RB | |
| iperf3 receive AXE11000 | |
| Lenovo Legion 5 15IAH7H 82RB | |
| iperf3 transmit AXE11000 | |
| Lenovo Legion 5 15IAH7H 82RB | |
| iperf3 transmit AXE11000 6GHz | |
| Lenovo Legion 5 15IAH7H 82RB | |
Webcam — Low 1 MP Quality
Camera quality is muddy from the 720p webcam. Windows Hello is not supported, either.


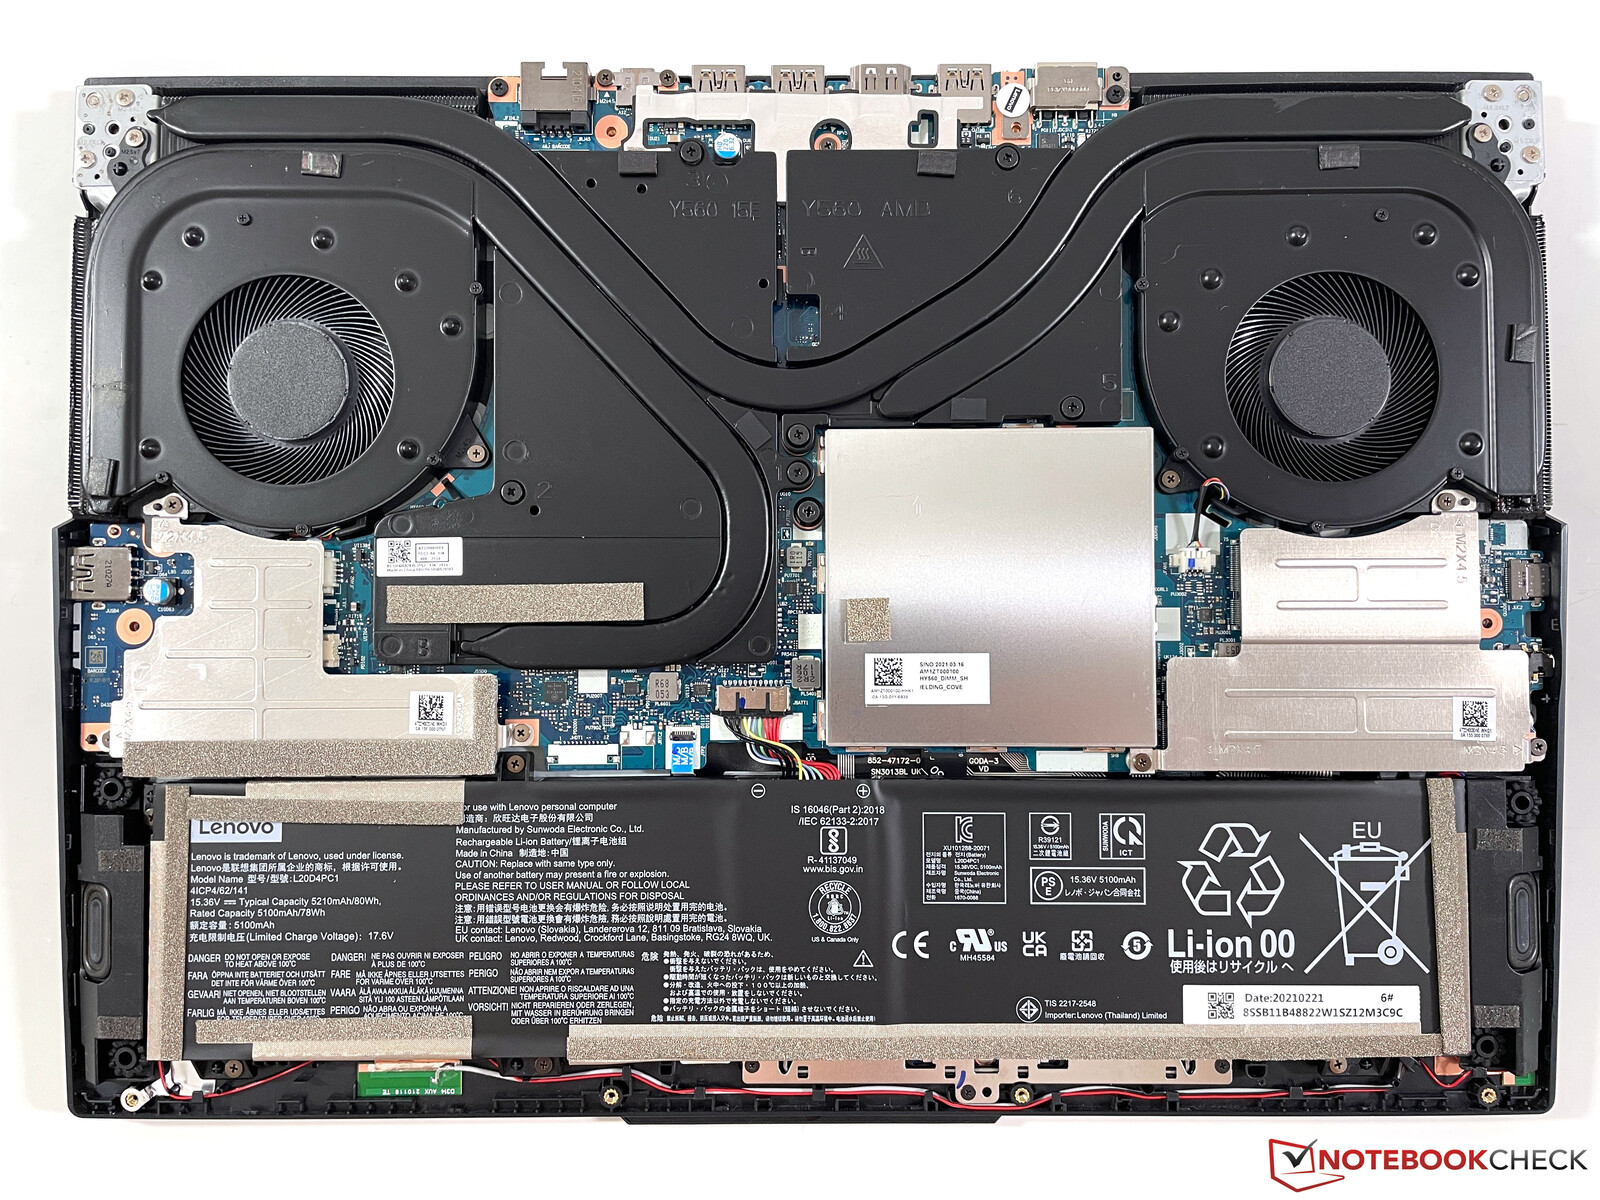
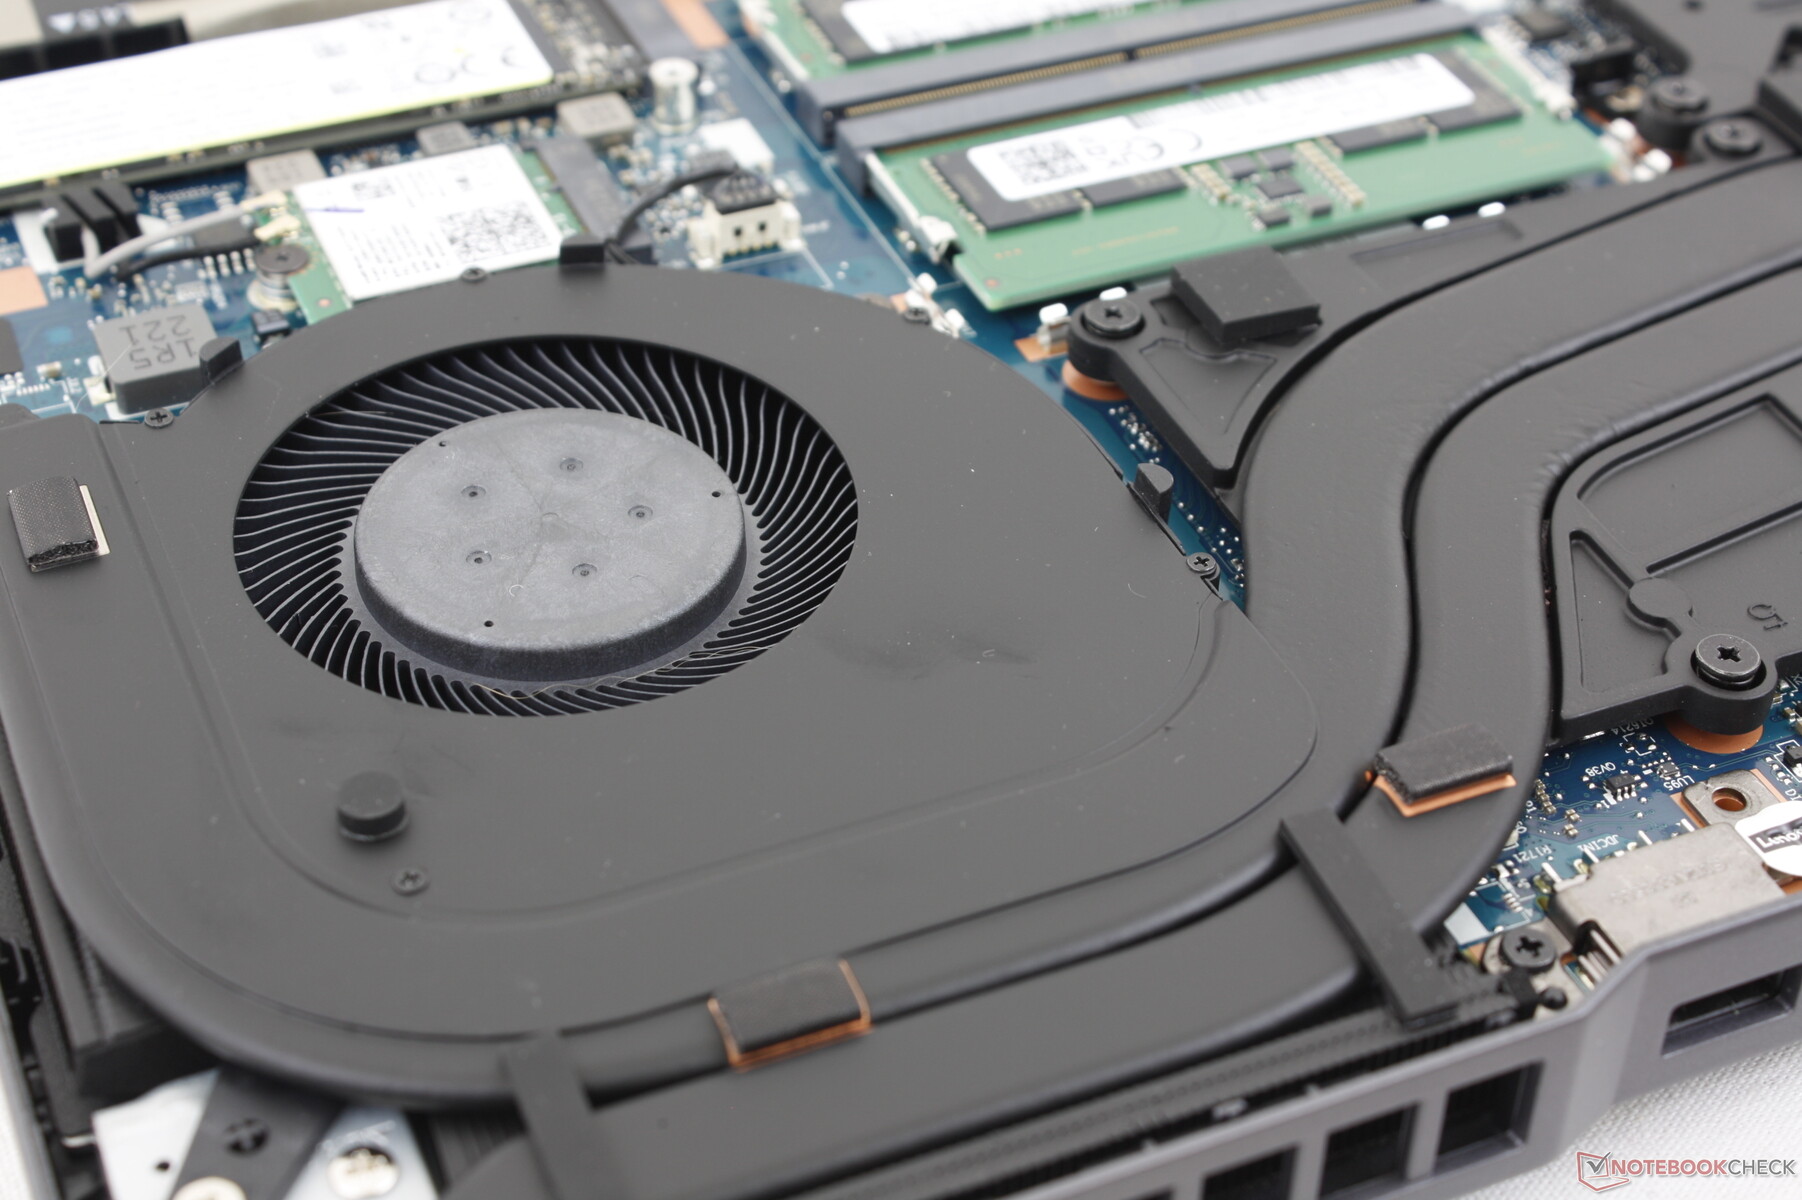
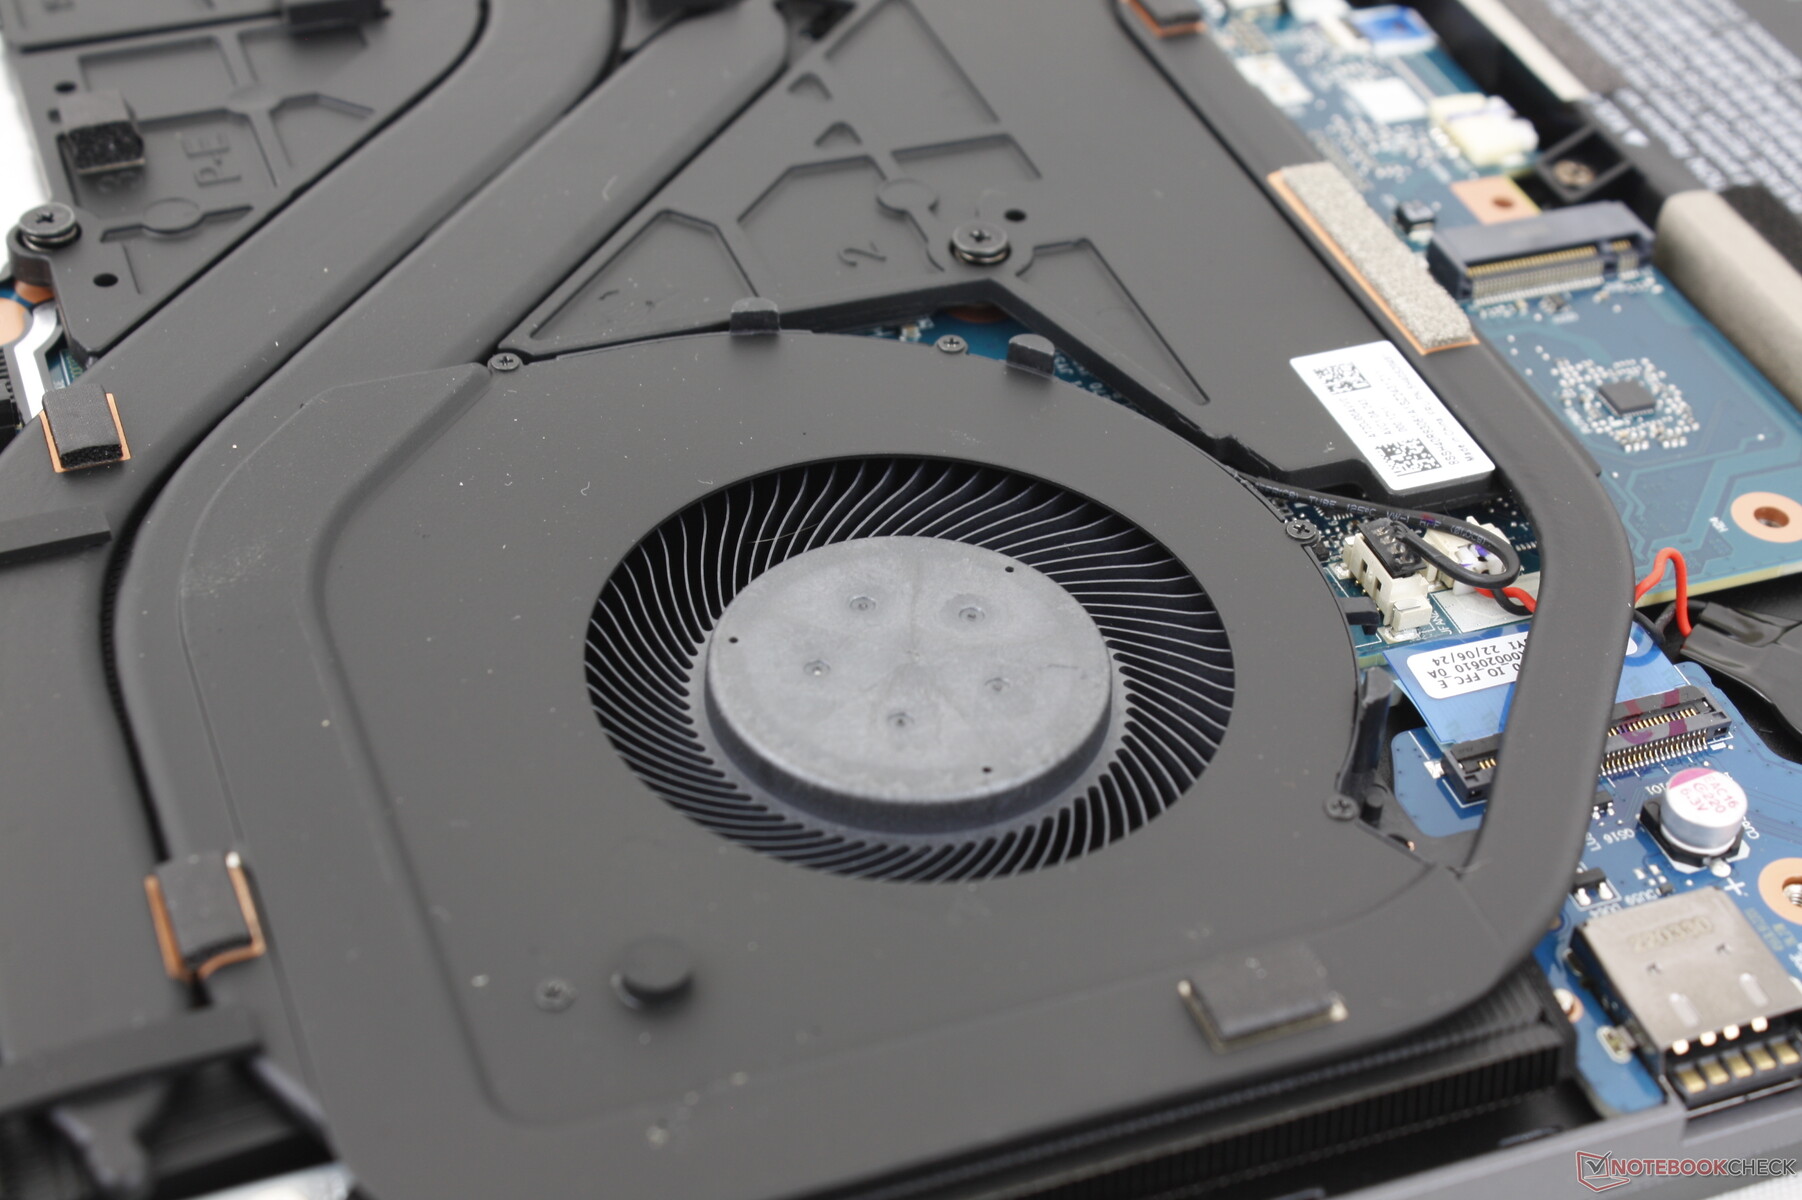
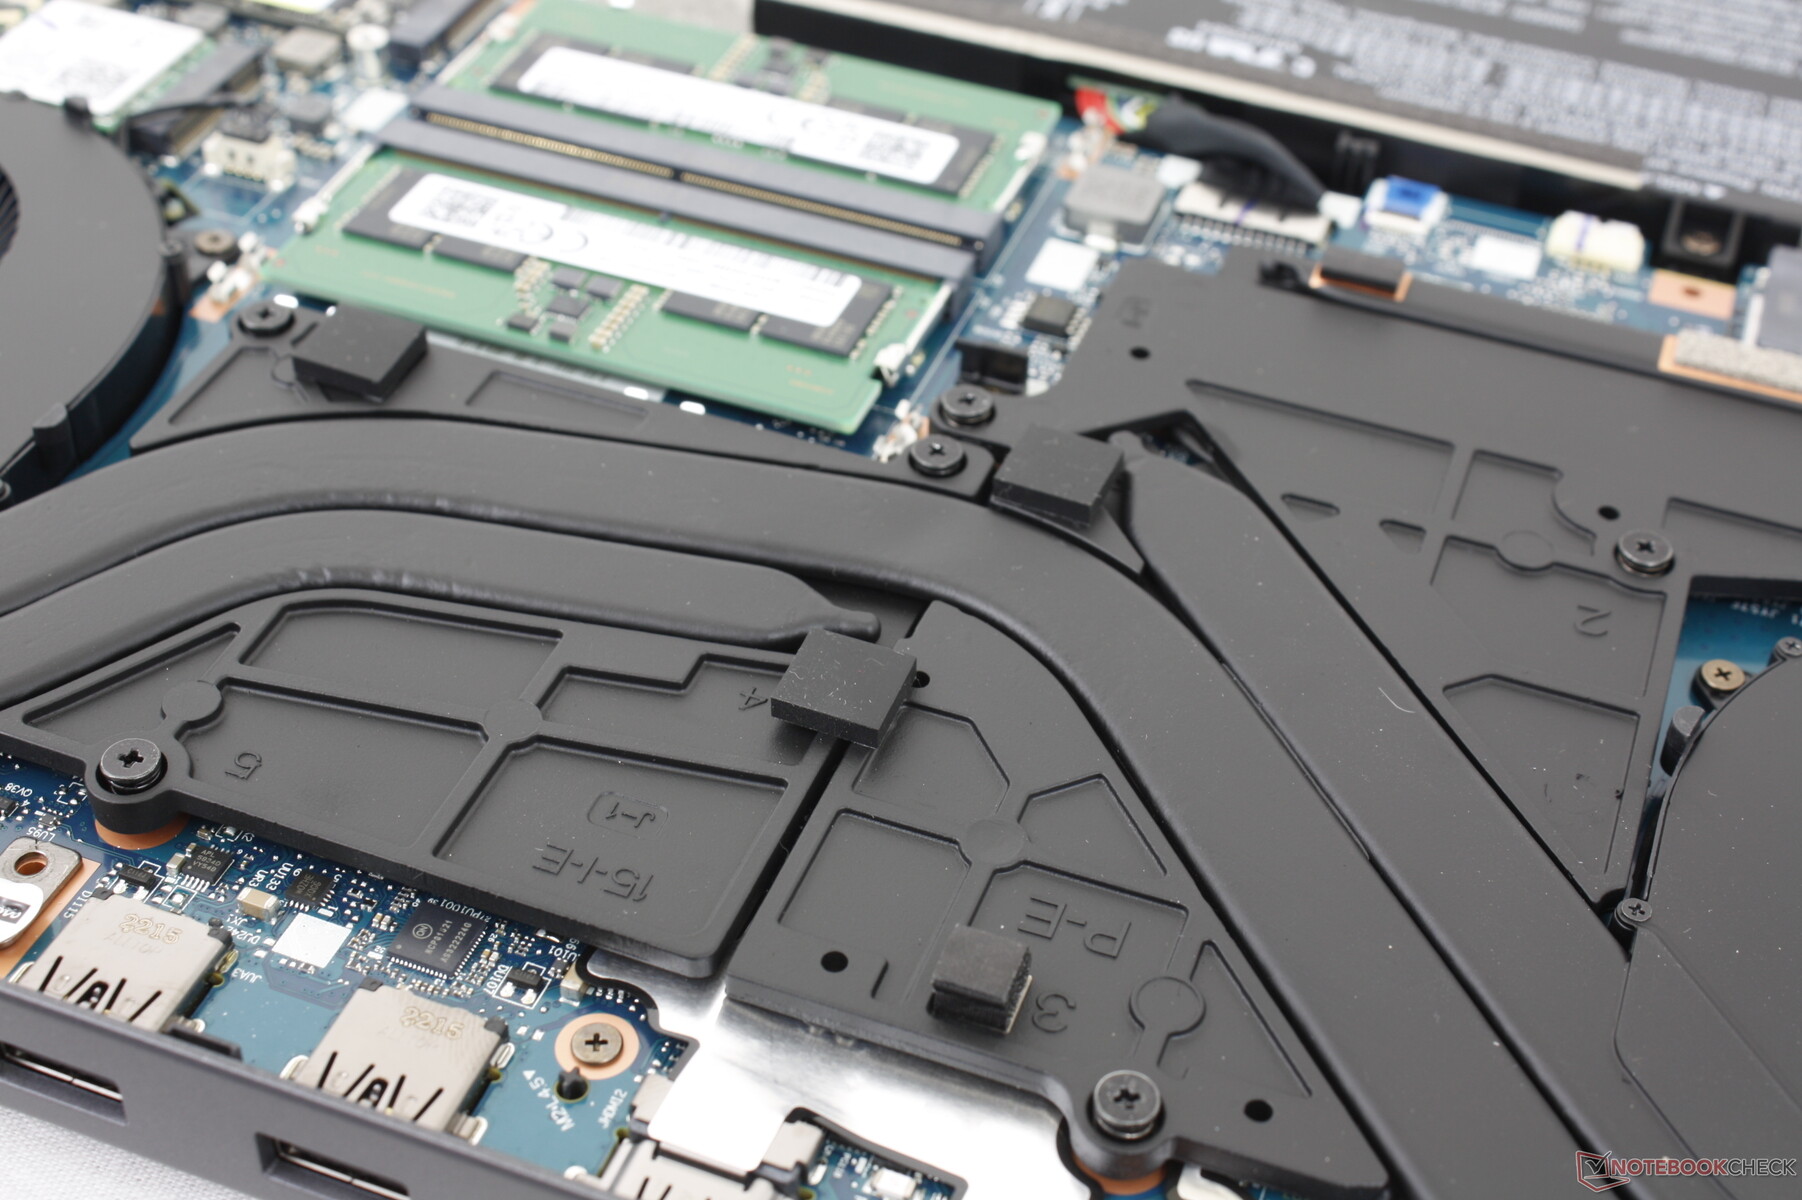
Maintenance
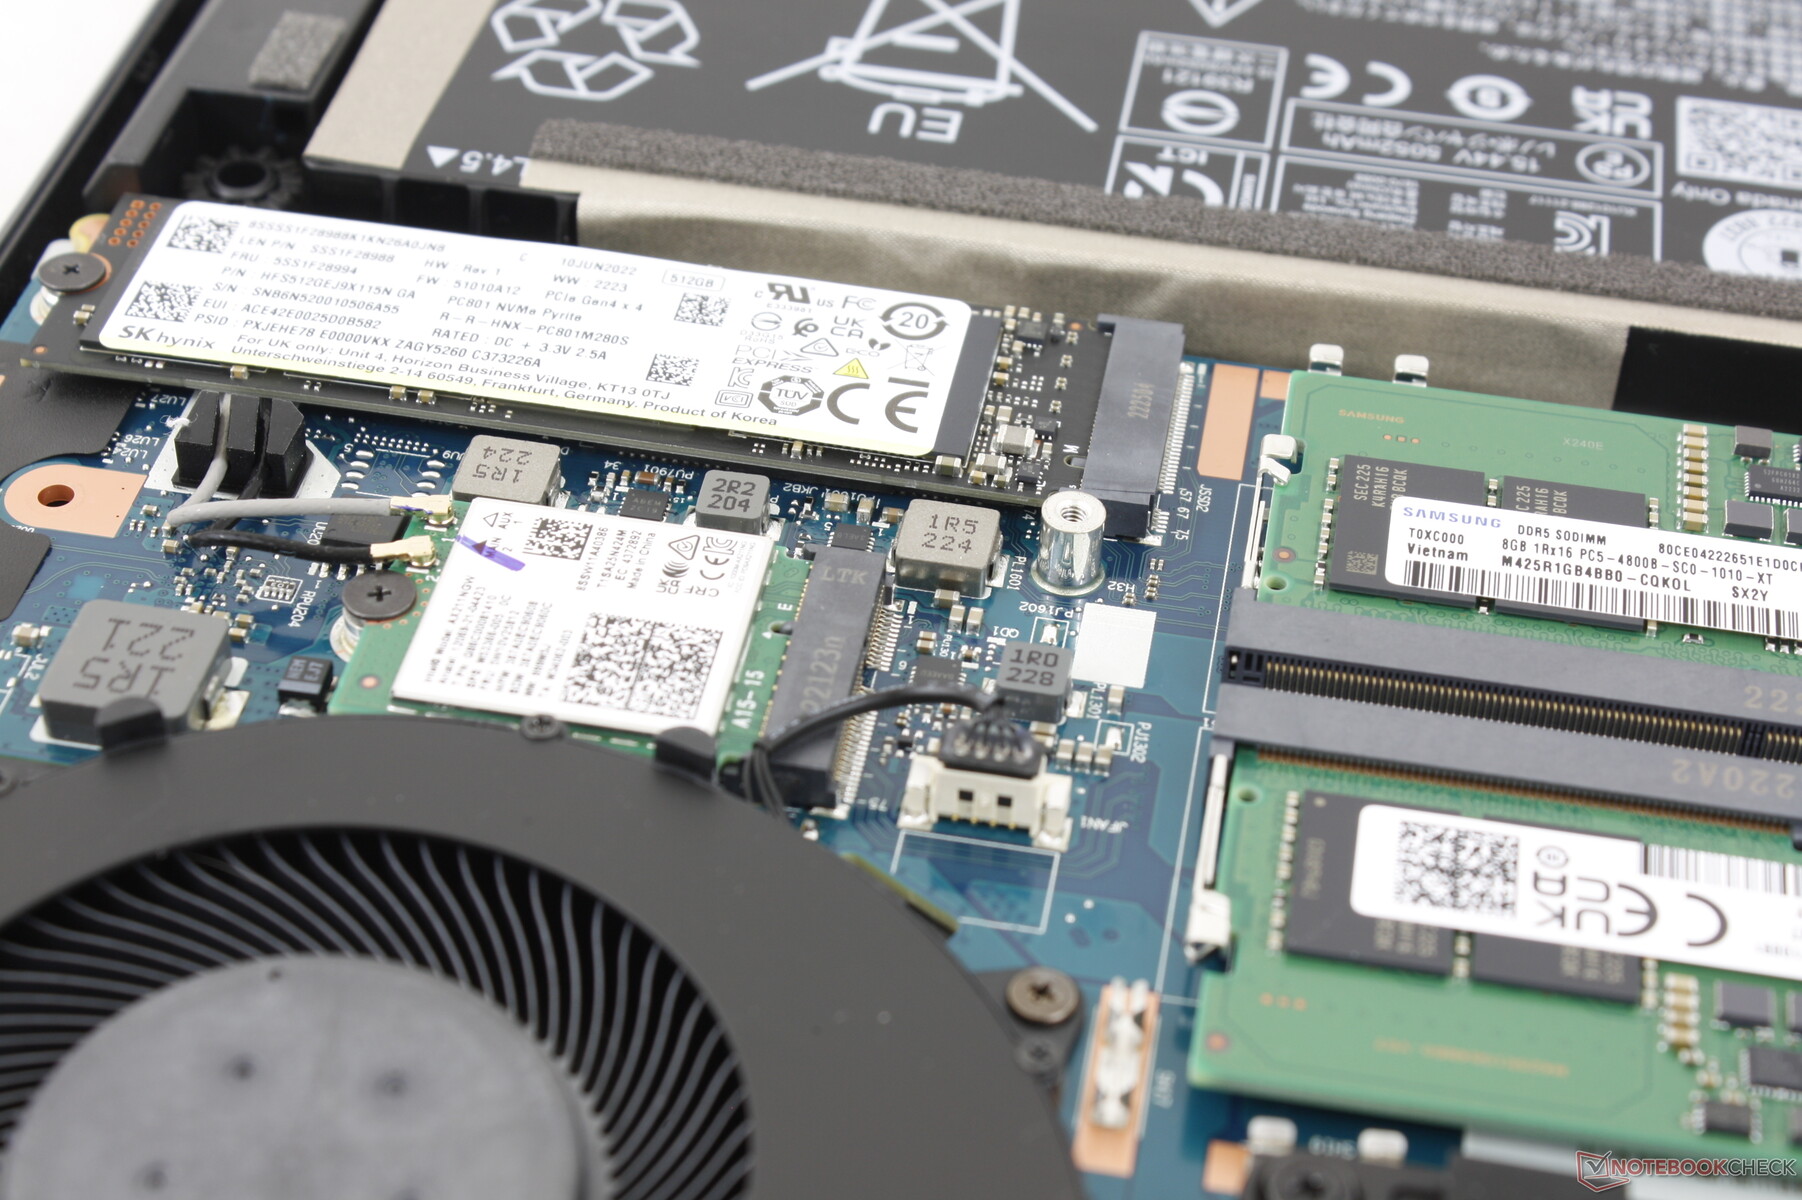
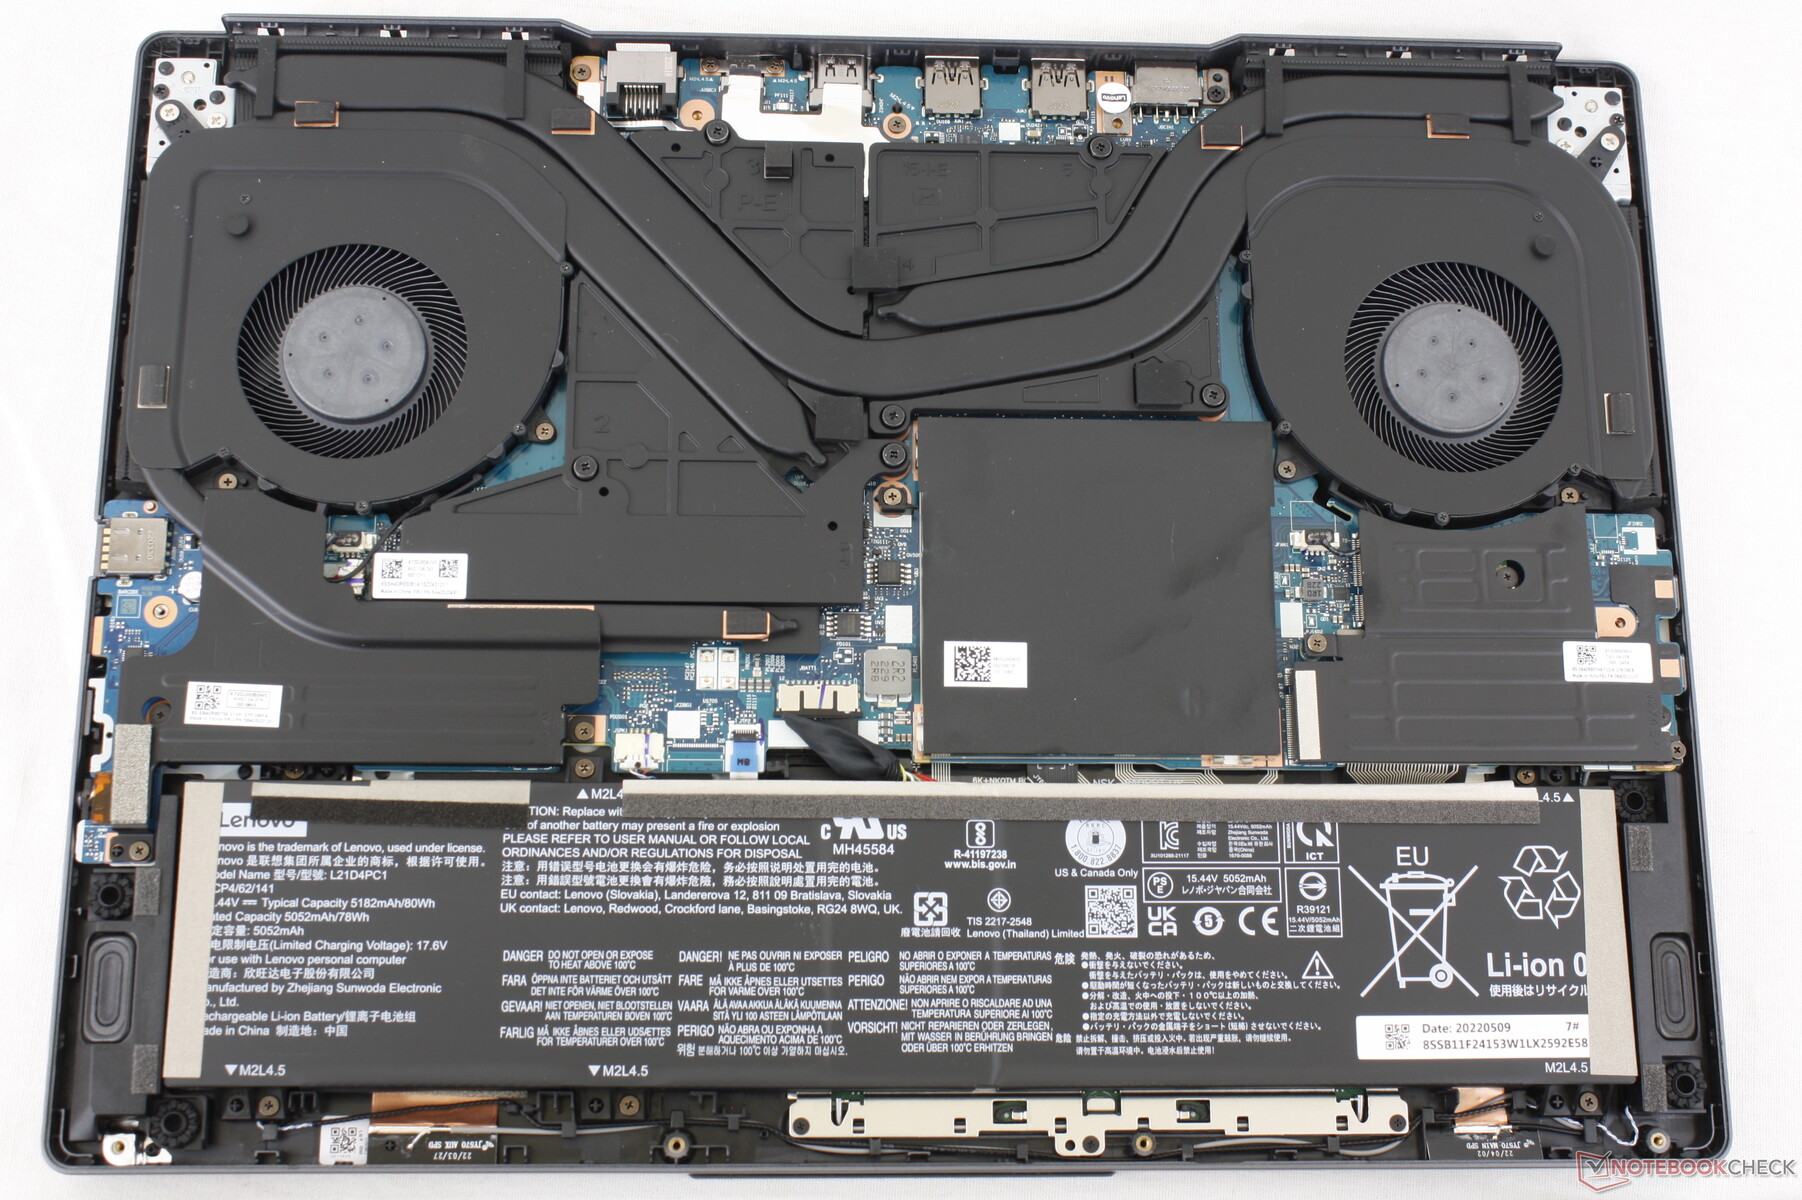
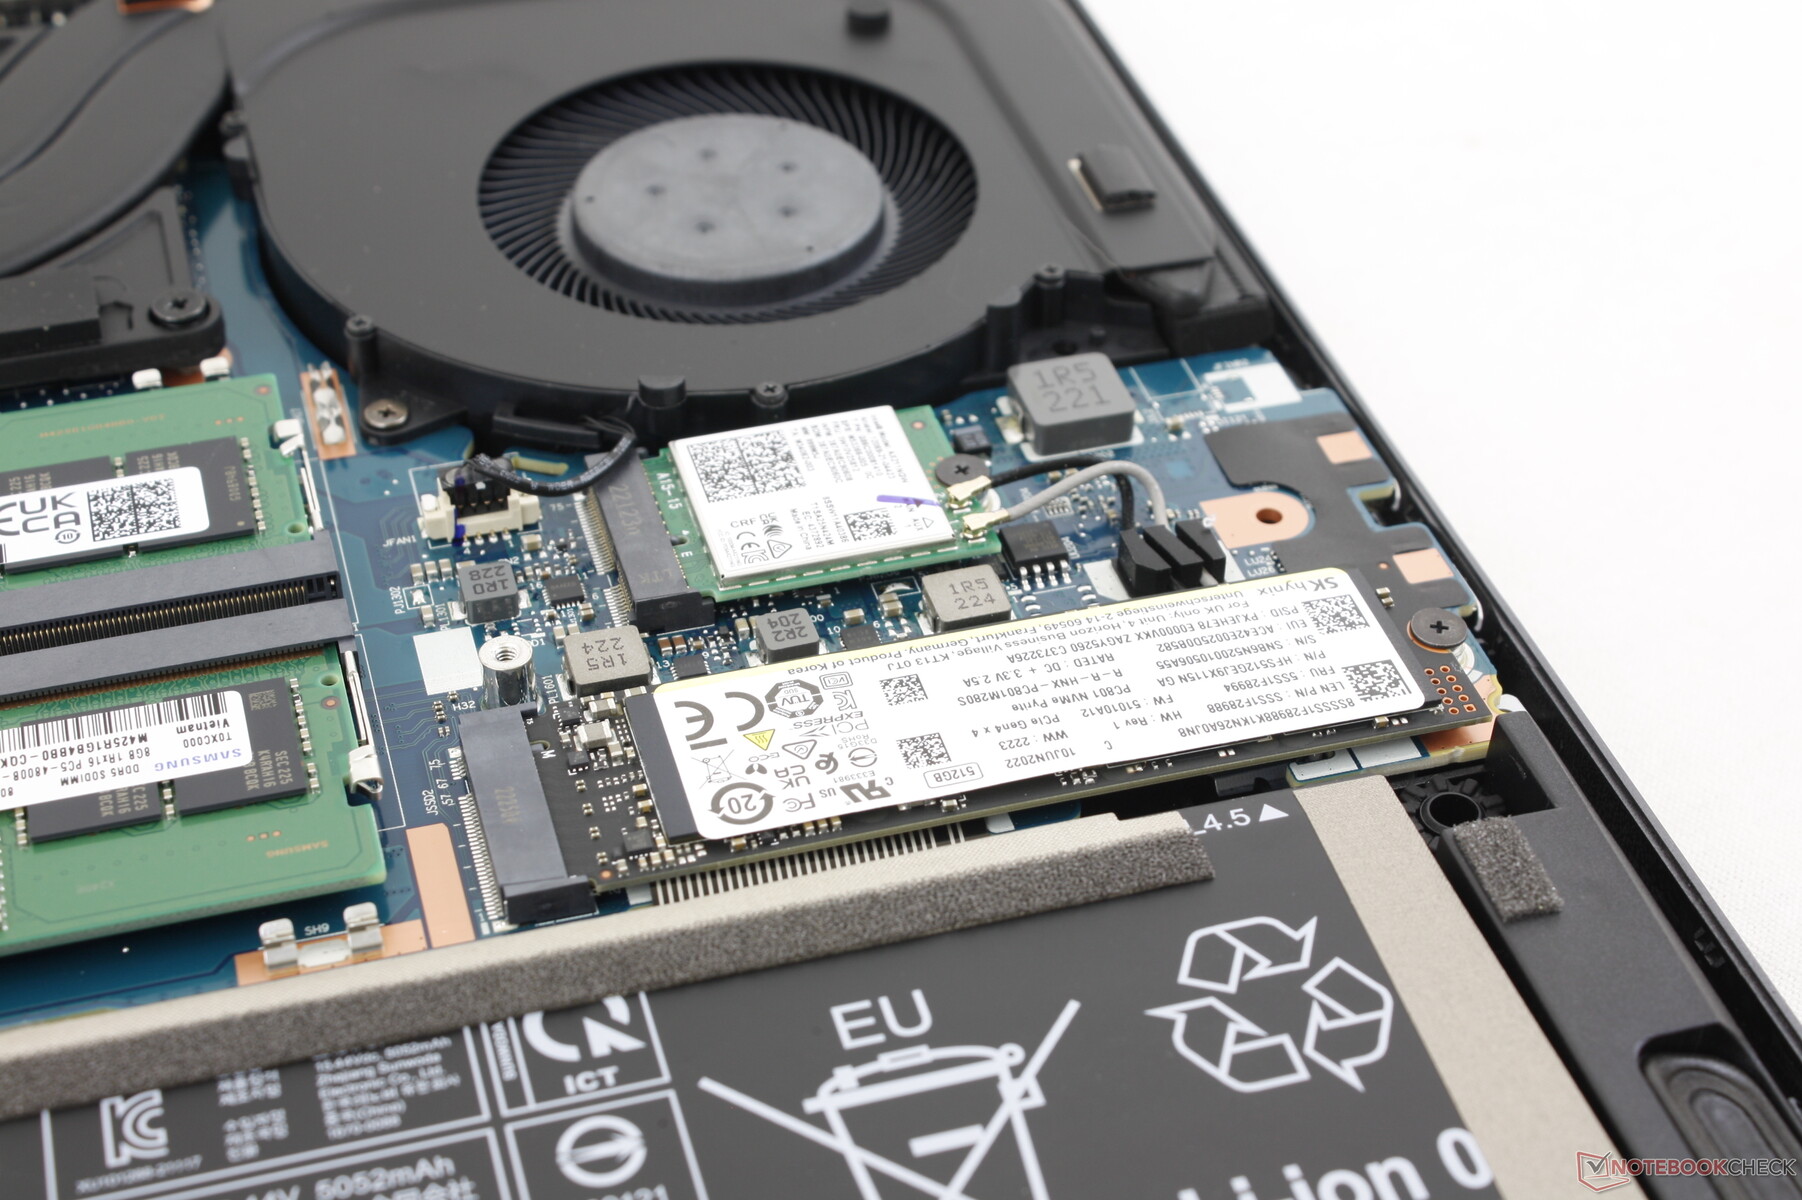
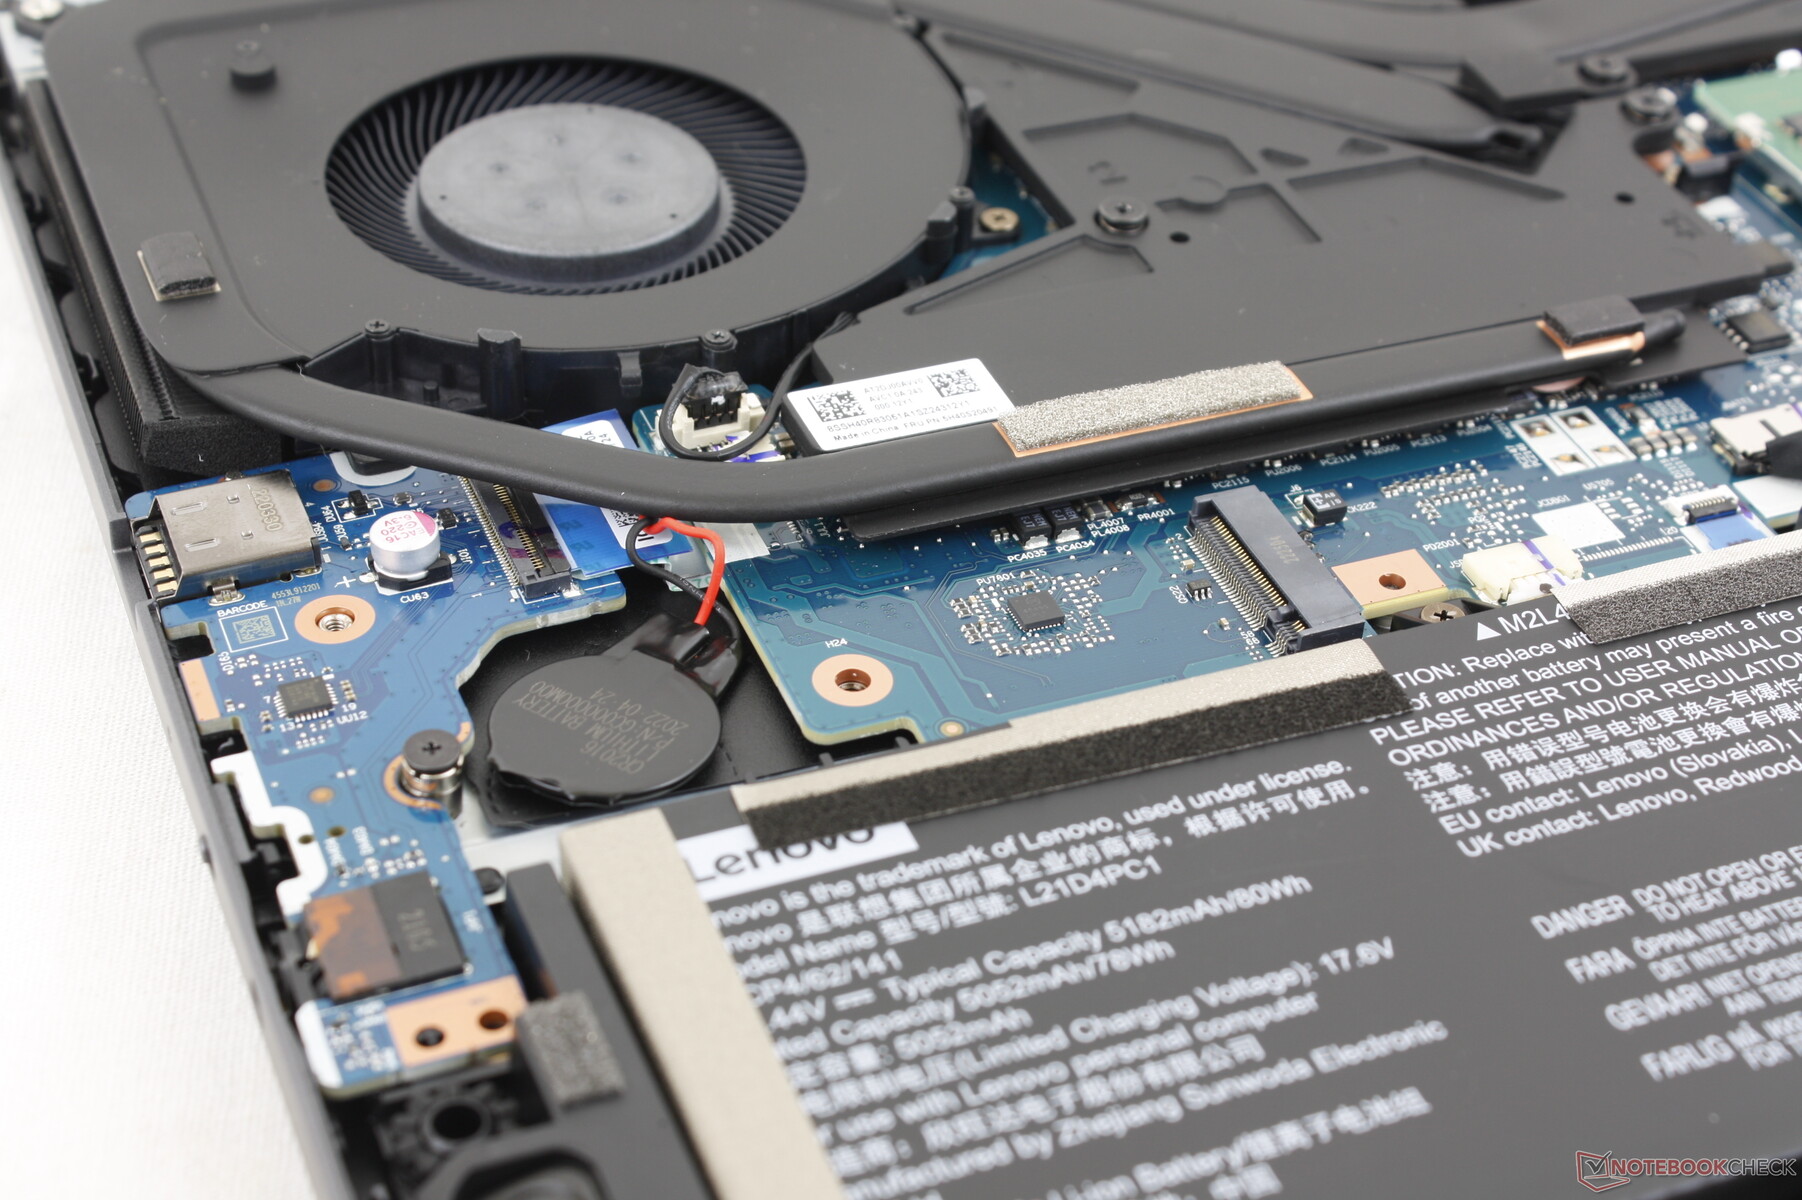
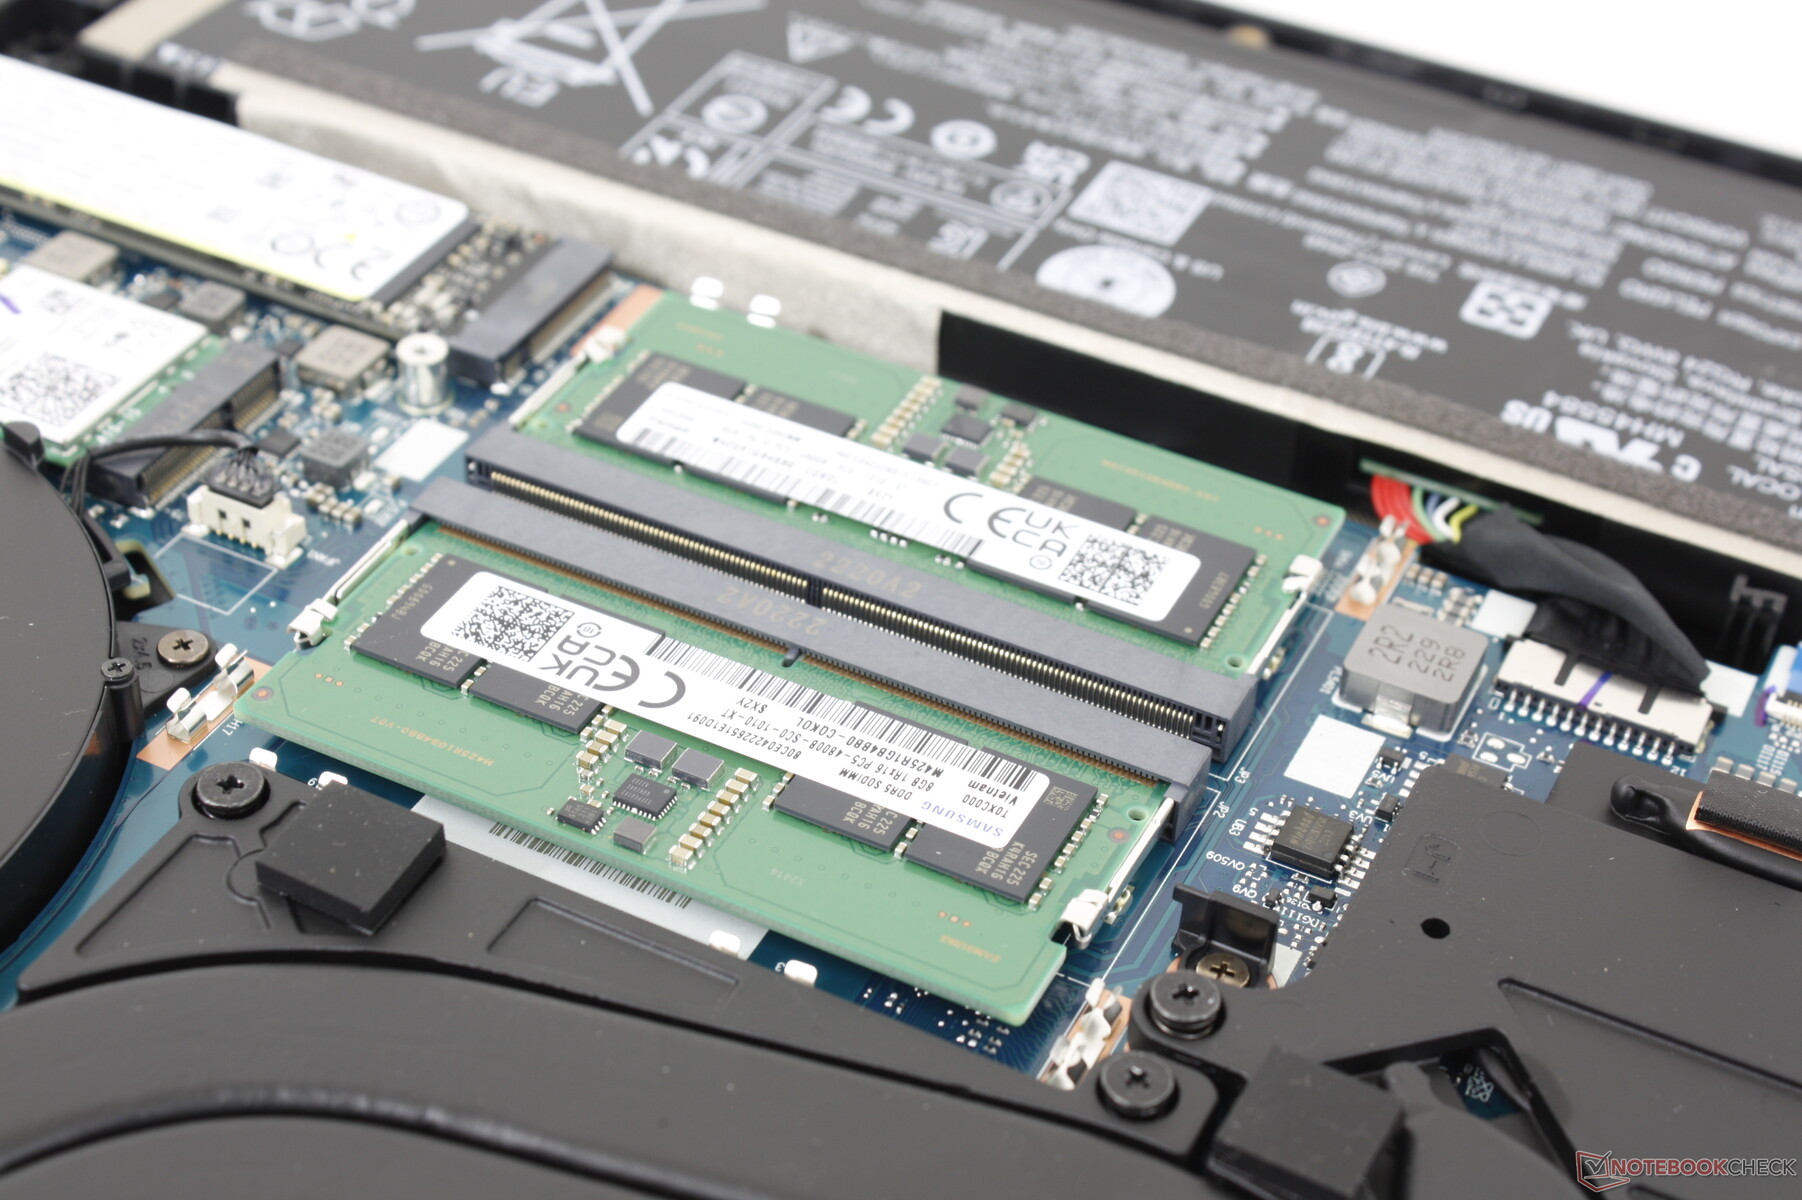
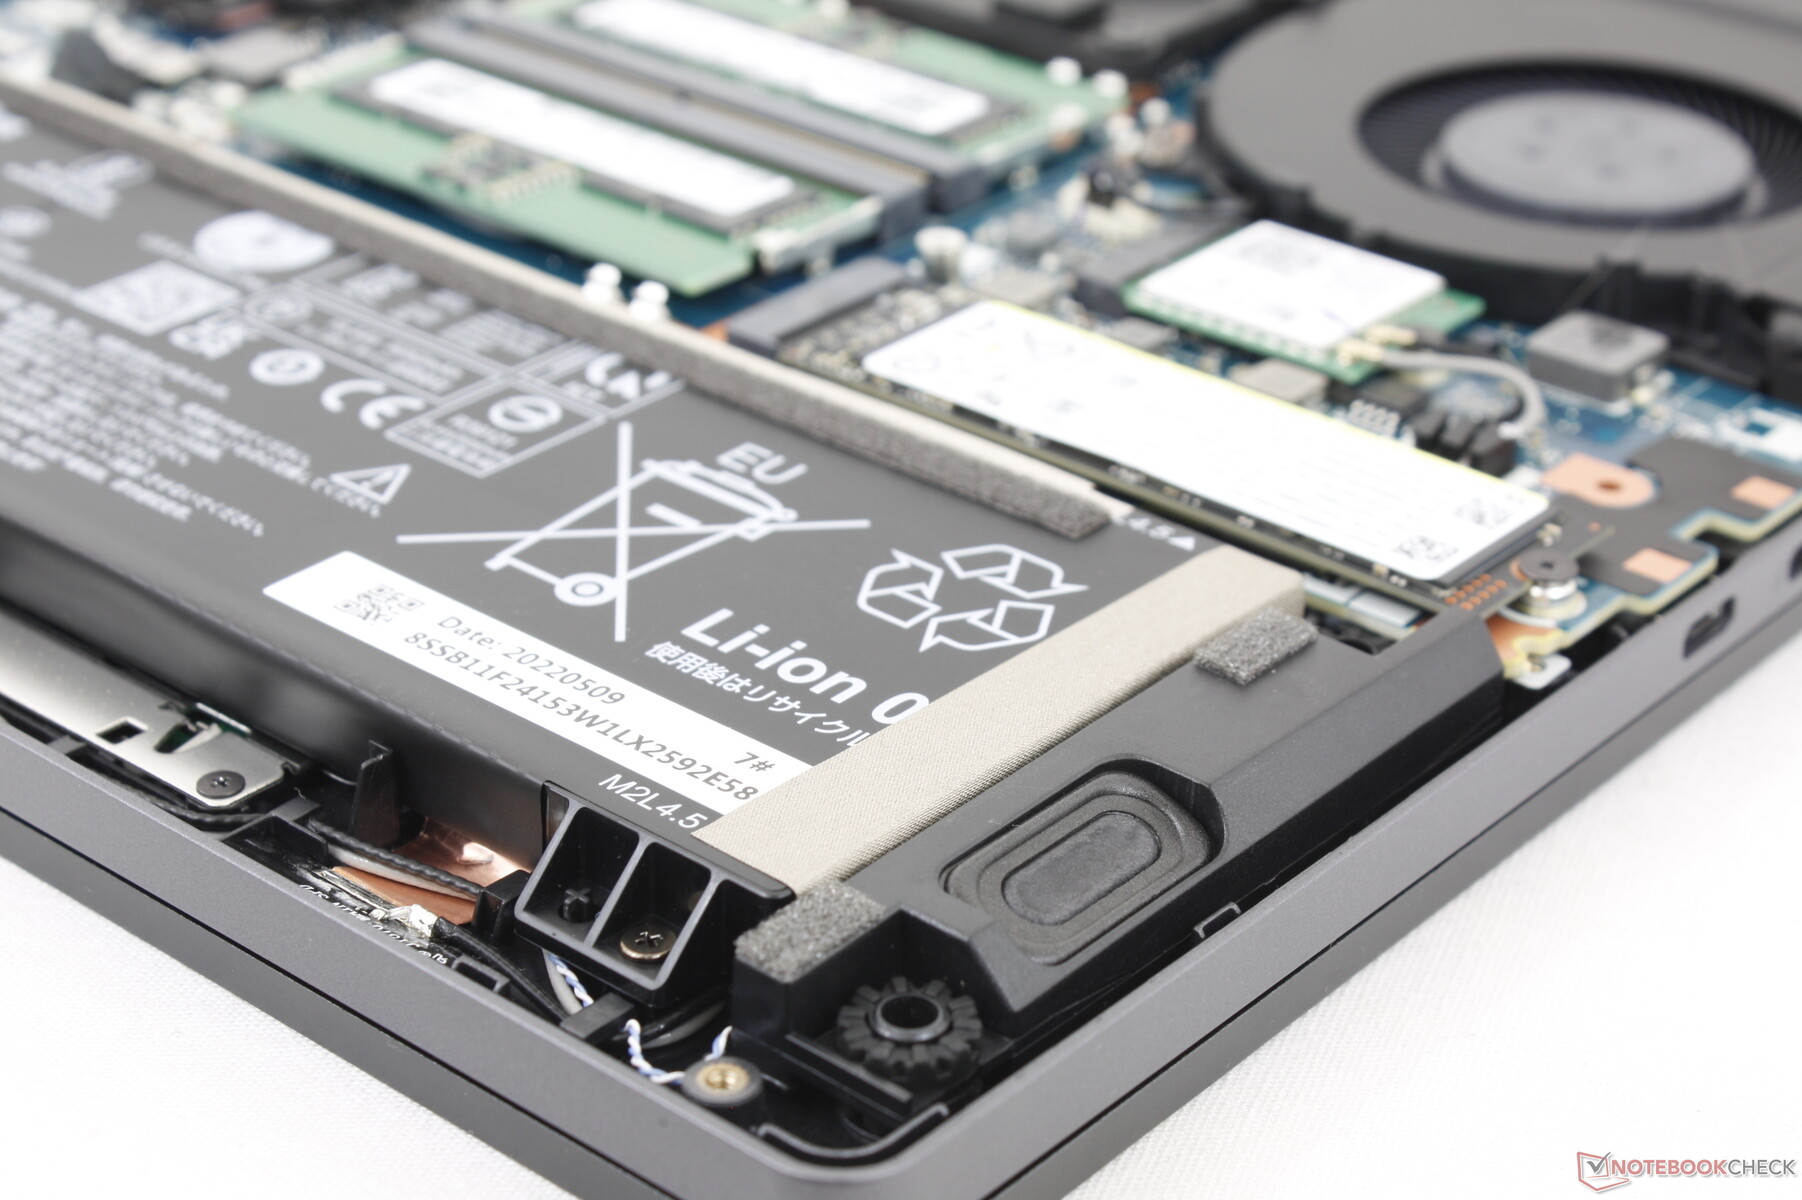
The bottom panel required only a Philips screwdriver to remove. Users can add/remove up to two DDR5 SODIMM modules, two M.2 PCIe4 x4 2280 SSDs, and one M.2 WLAN module.
Accessories and Warranty
There are no extras in the box beyond the AC adapter and paperwork. The standard one-year limited manufacturer warranty applies.
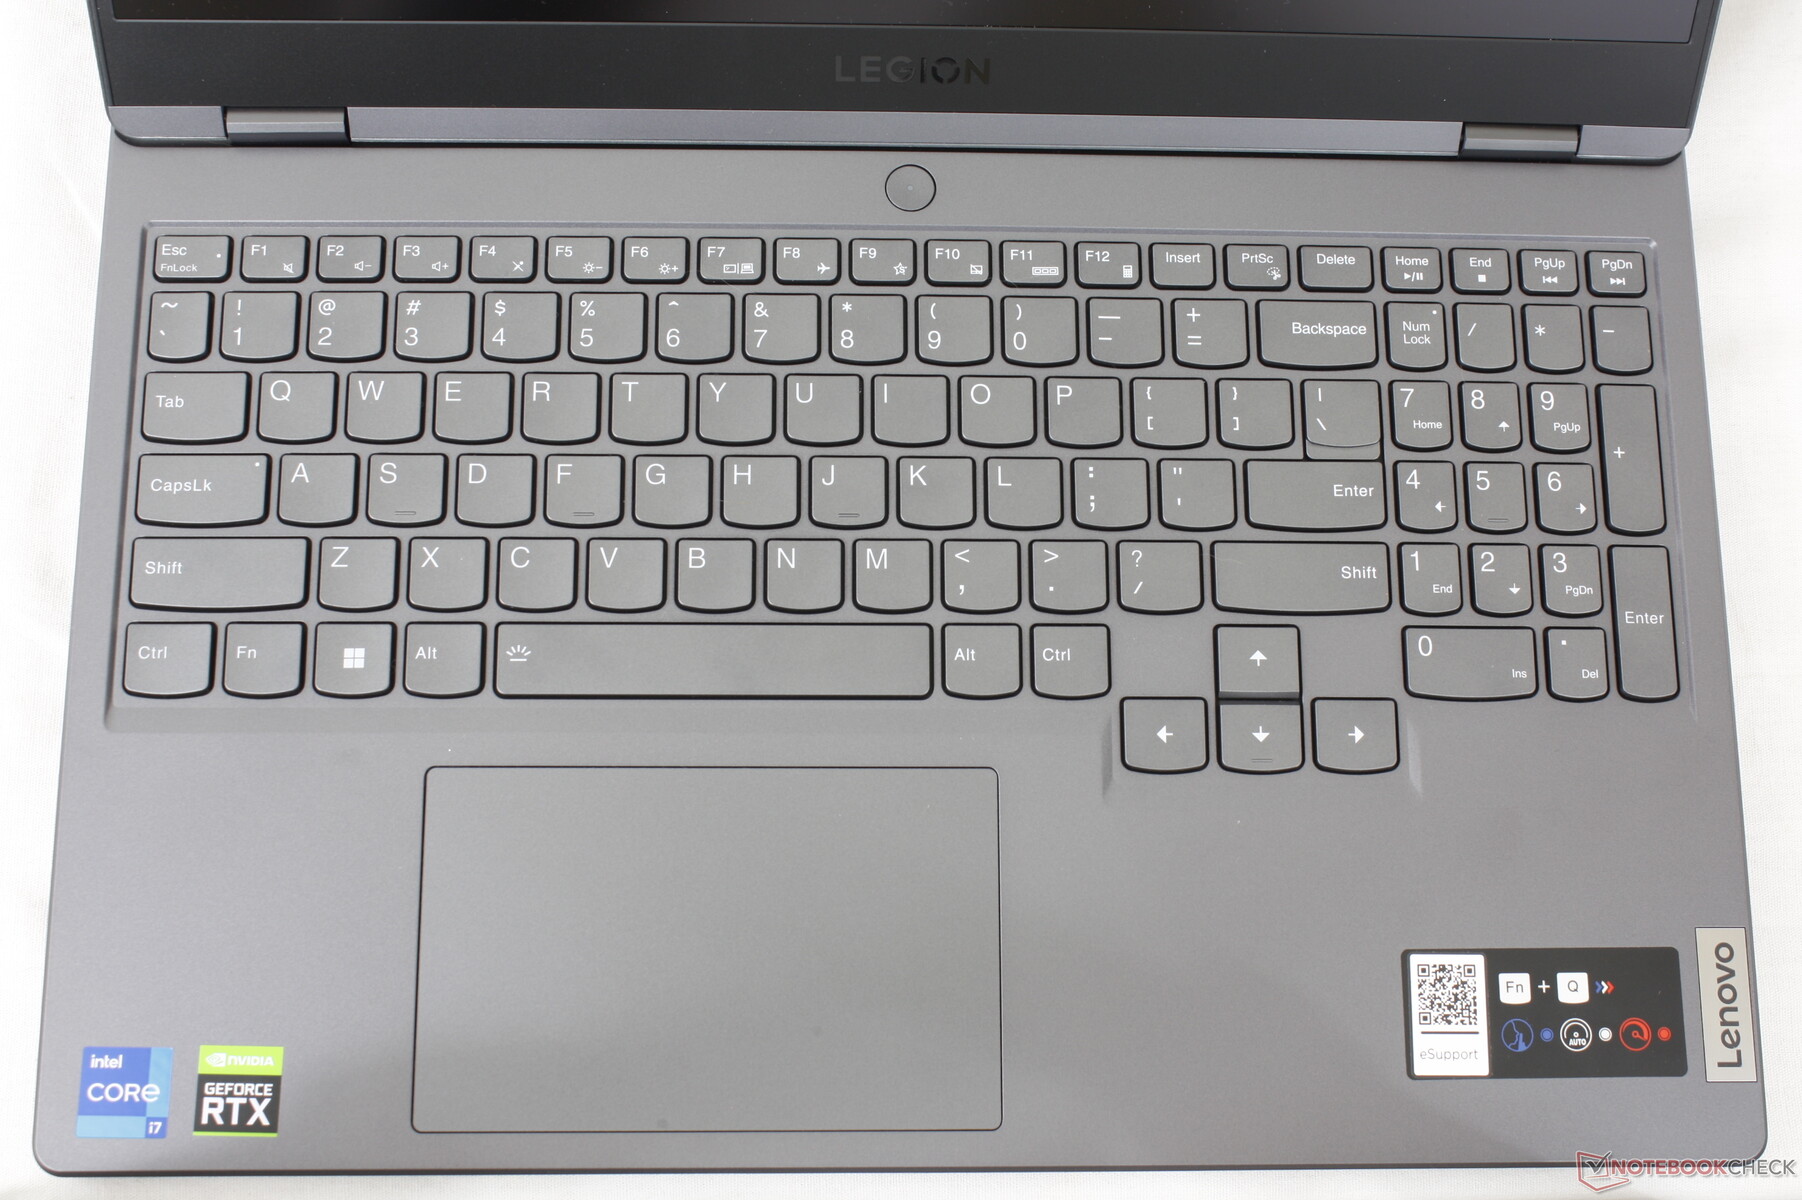
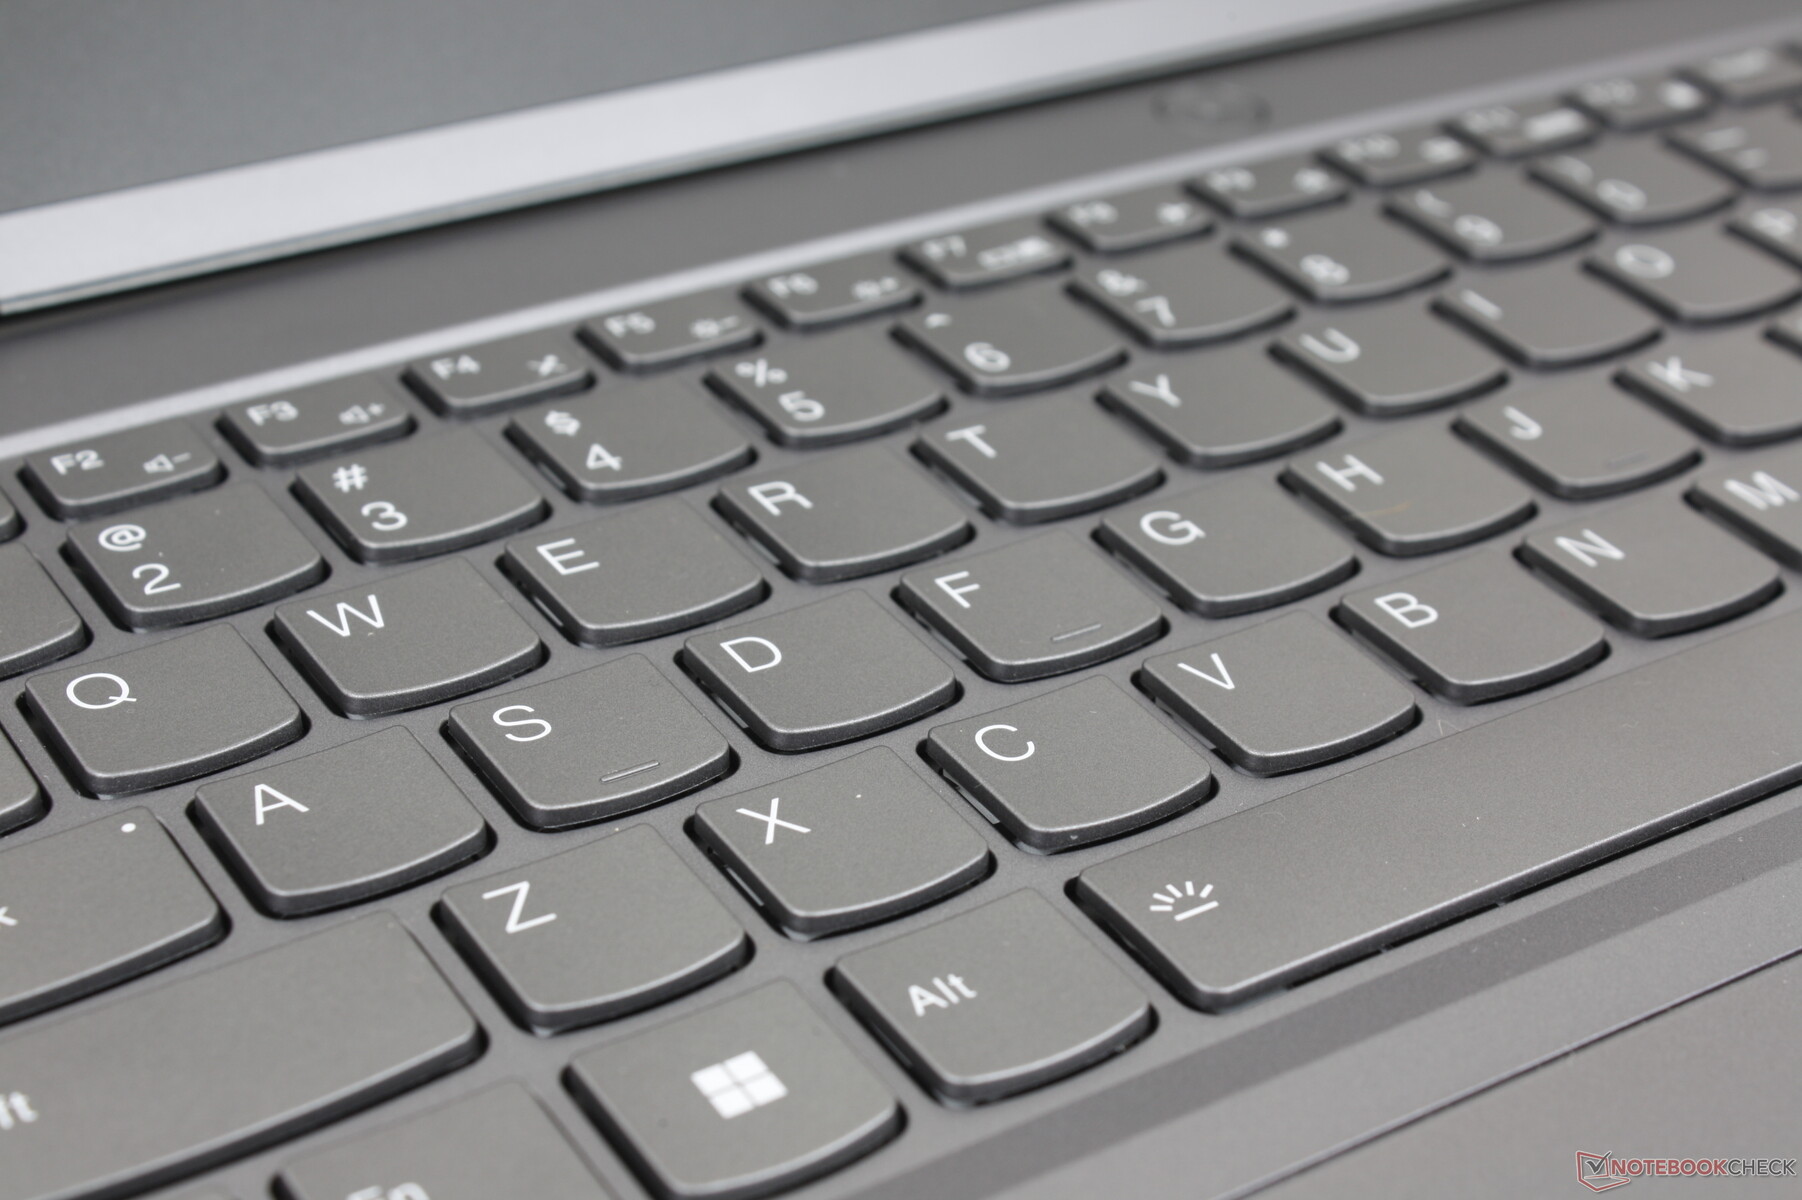
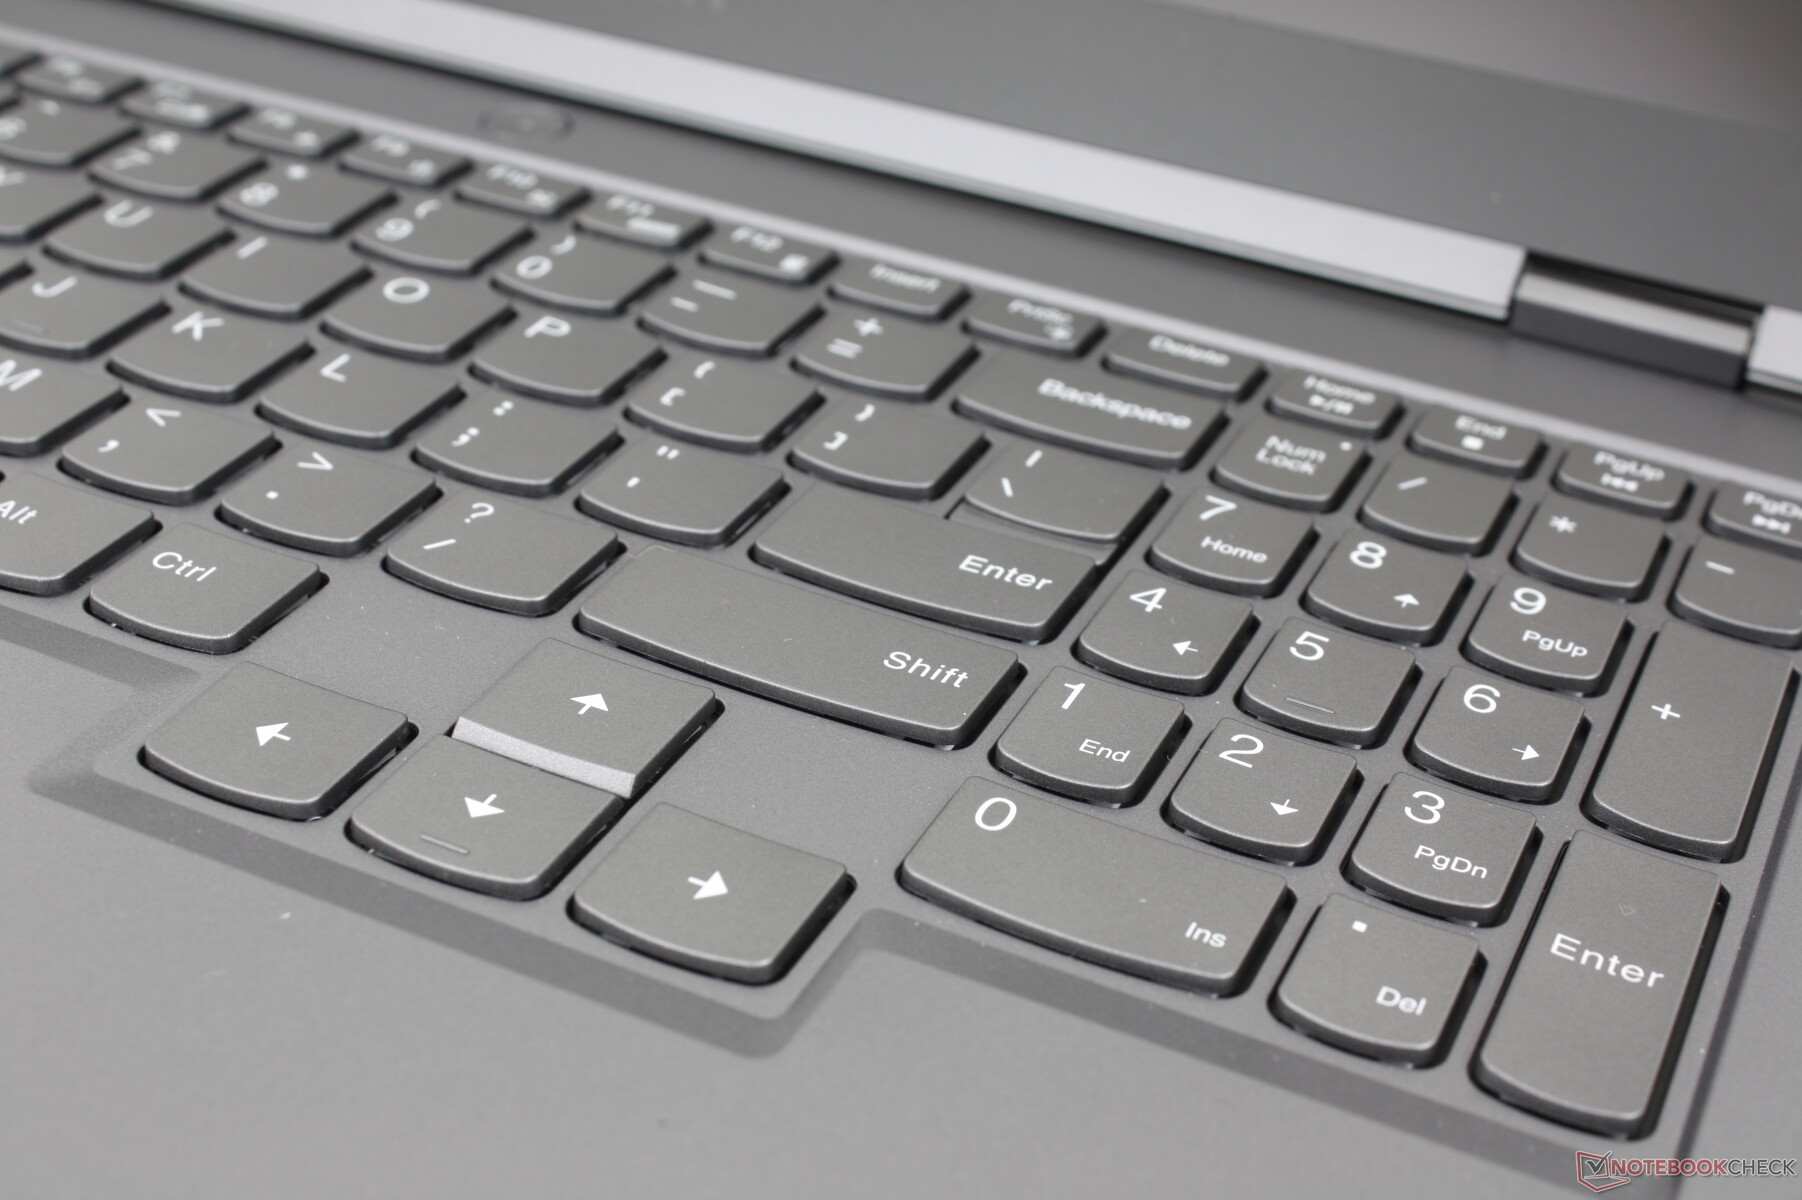
Input Devices — Great Keyboard, Spongy Clickpad
Keyboard
The Legion 5 15 utilizes traditional membrane-based keys instead of mechanical ones as found on some higher-end models like the Alienware m15 series. Nonetheless, key feedback and travel are crisper and deeper on the Legion when compared to the keys on regular Ultrabooks. If you do a lot of typing, then you might find the keyboard here to be more comfortable for office tasks than on a cheaper IdeaPad or Dell Inspiron.
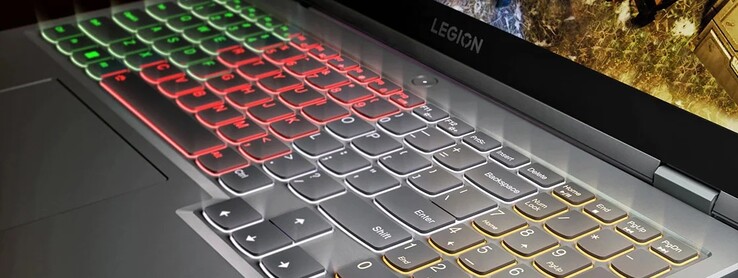
A keyboard backlight is included on all configurations, but some are only single-zone white while others are four-zone RGB. There is no per-key RGB option likely to save on costs. All keys and symbols become illuminated.
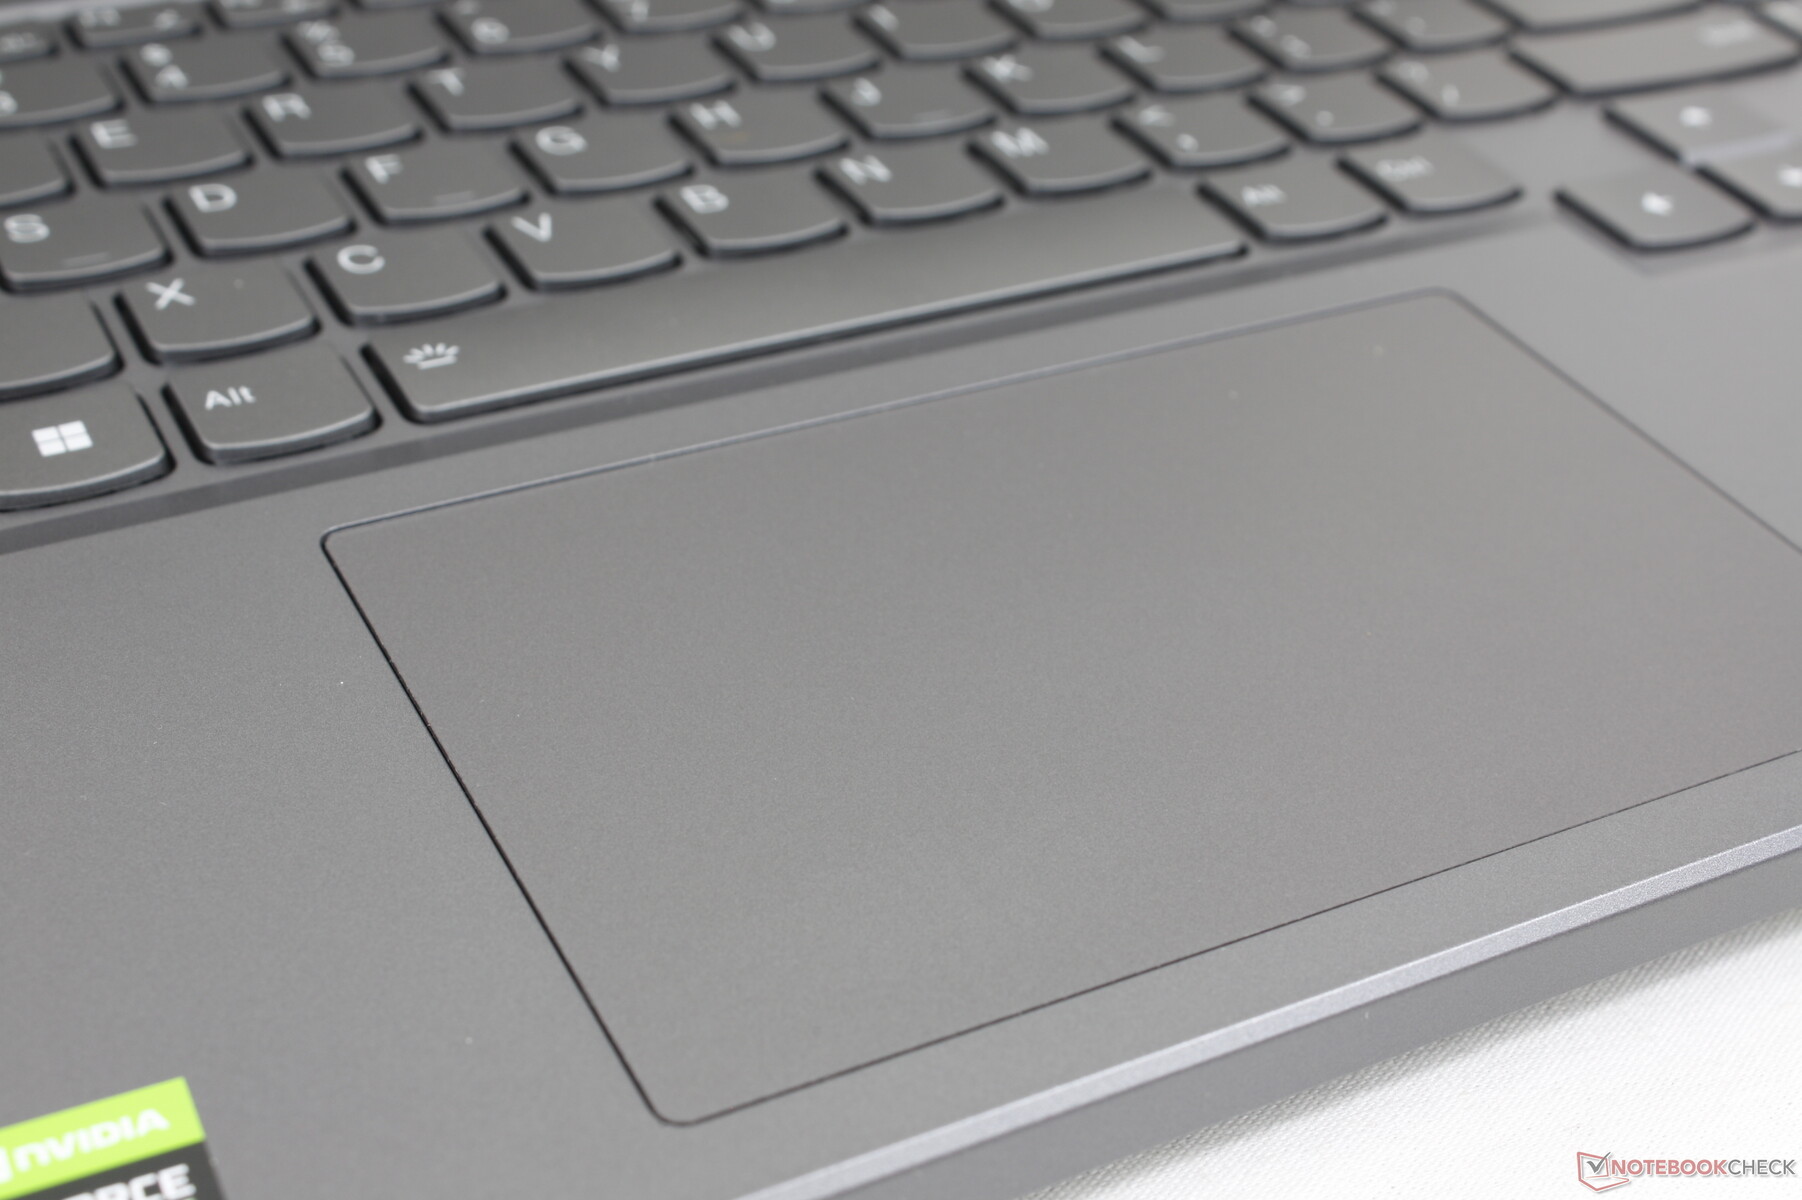
Touchpad
The clickpad is identical in size to the clickpad on the pricier Legion 7 16 at 12 x 7.5 cm. Feedback is also identical and so users can expect a somewhat spongy and unsatisfying click when pressed. The clickpad surface is smooth much like on the surrounding palm rests, but we recommend using an external mouse for an easier time clicking and dragging.
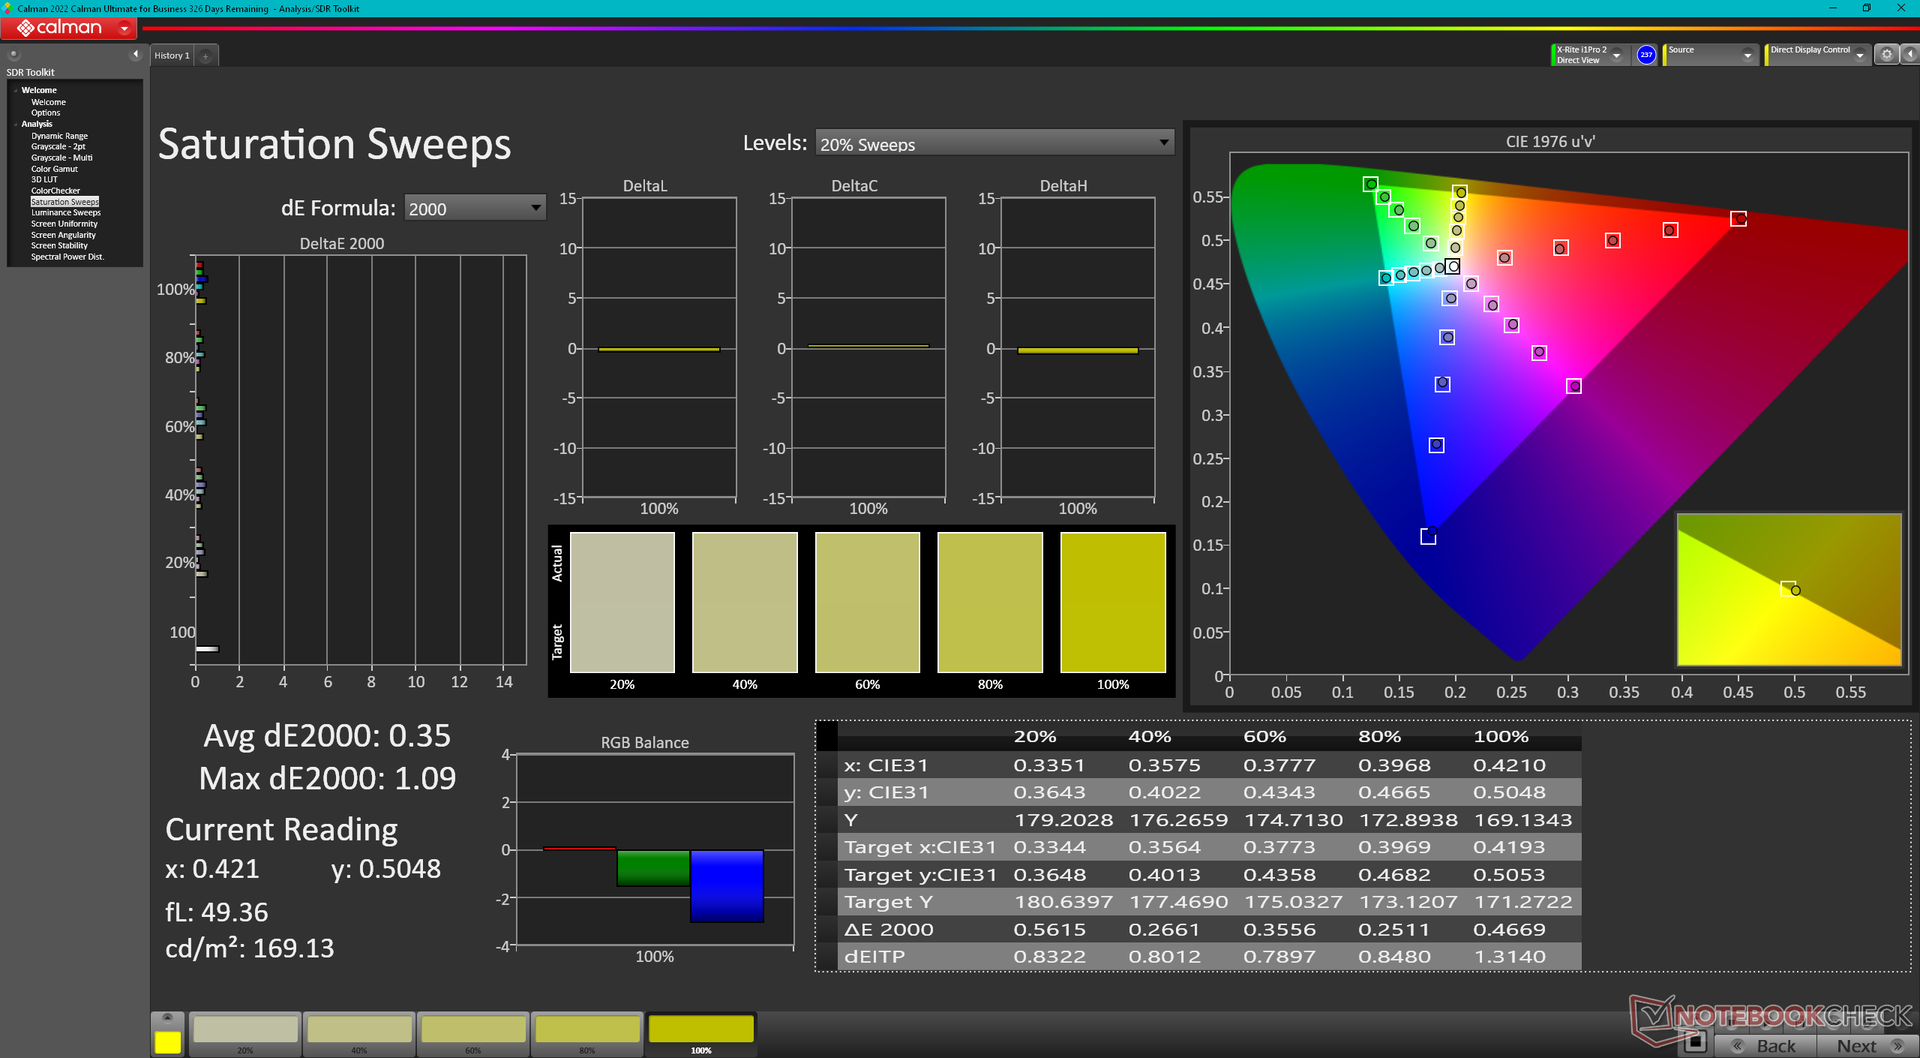
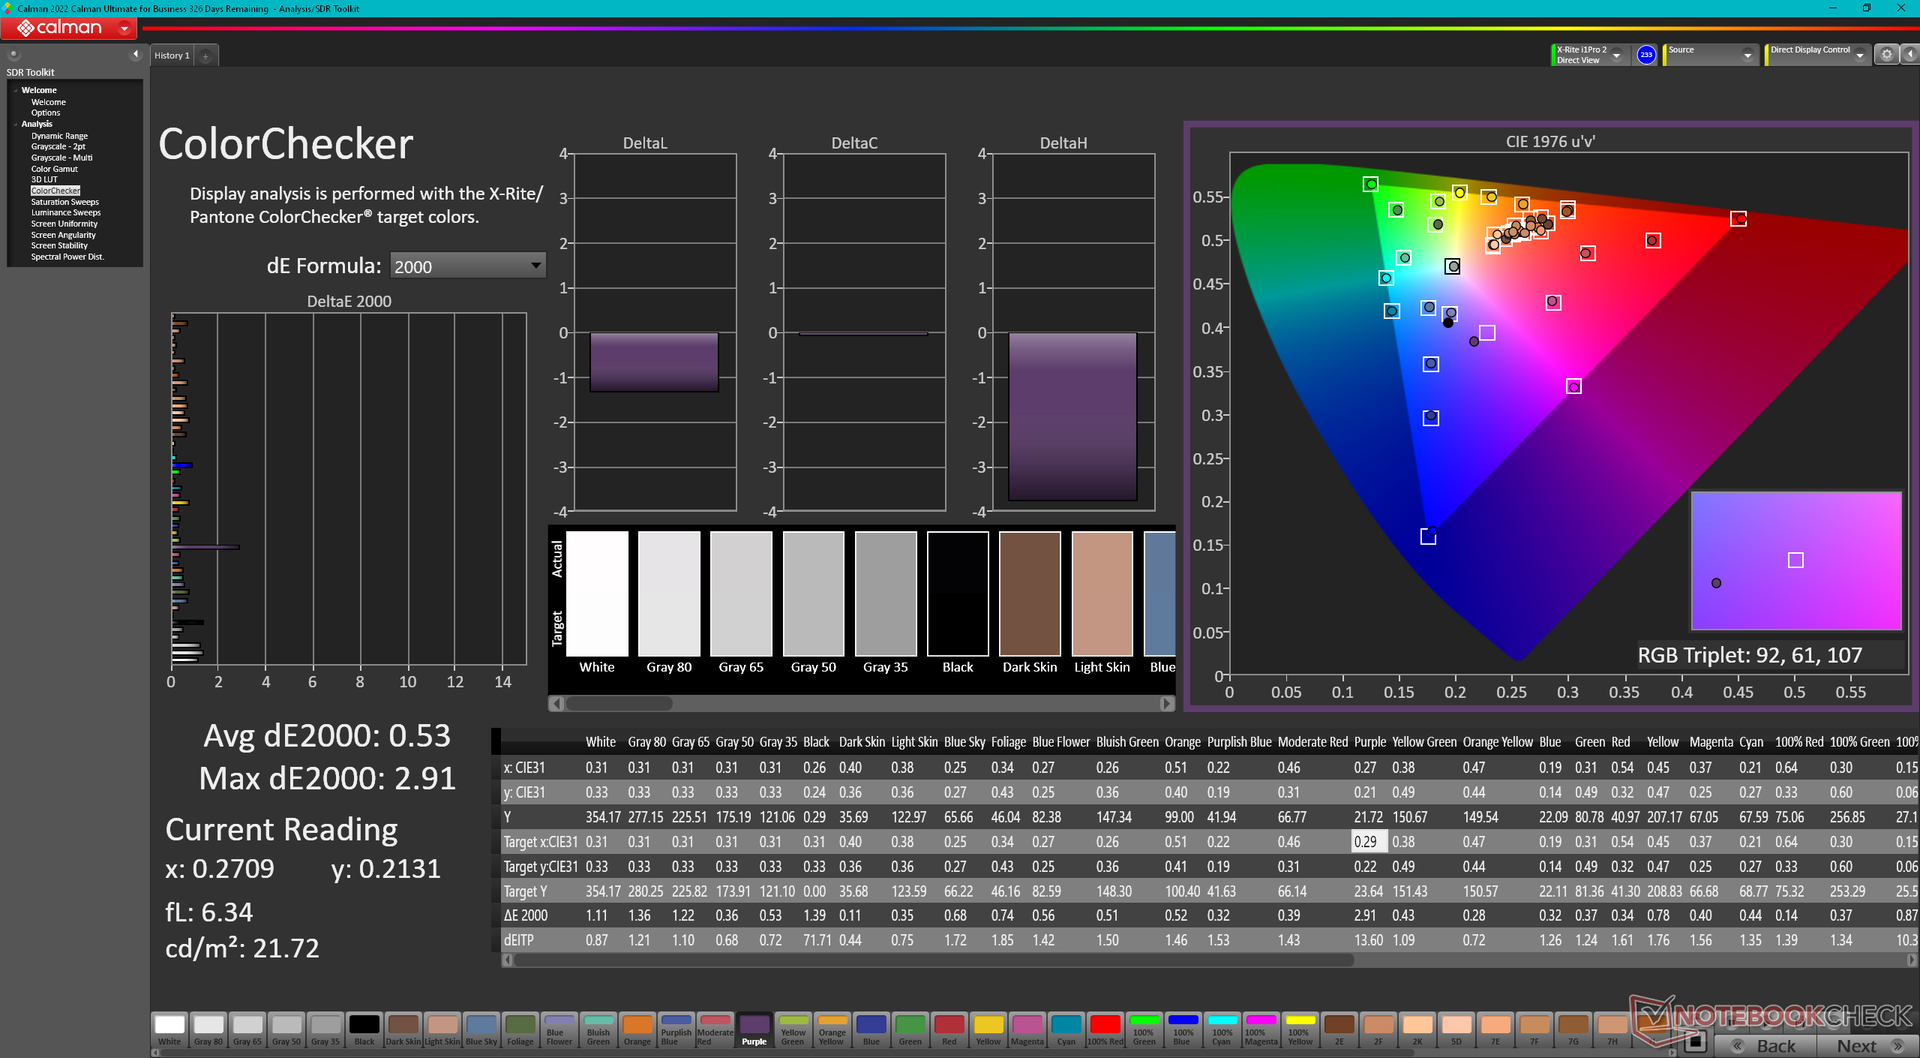
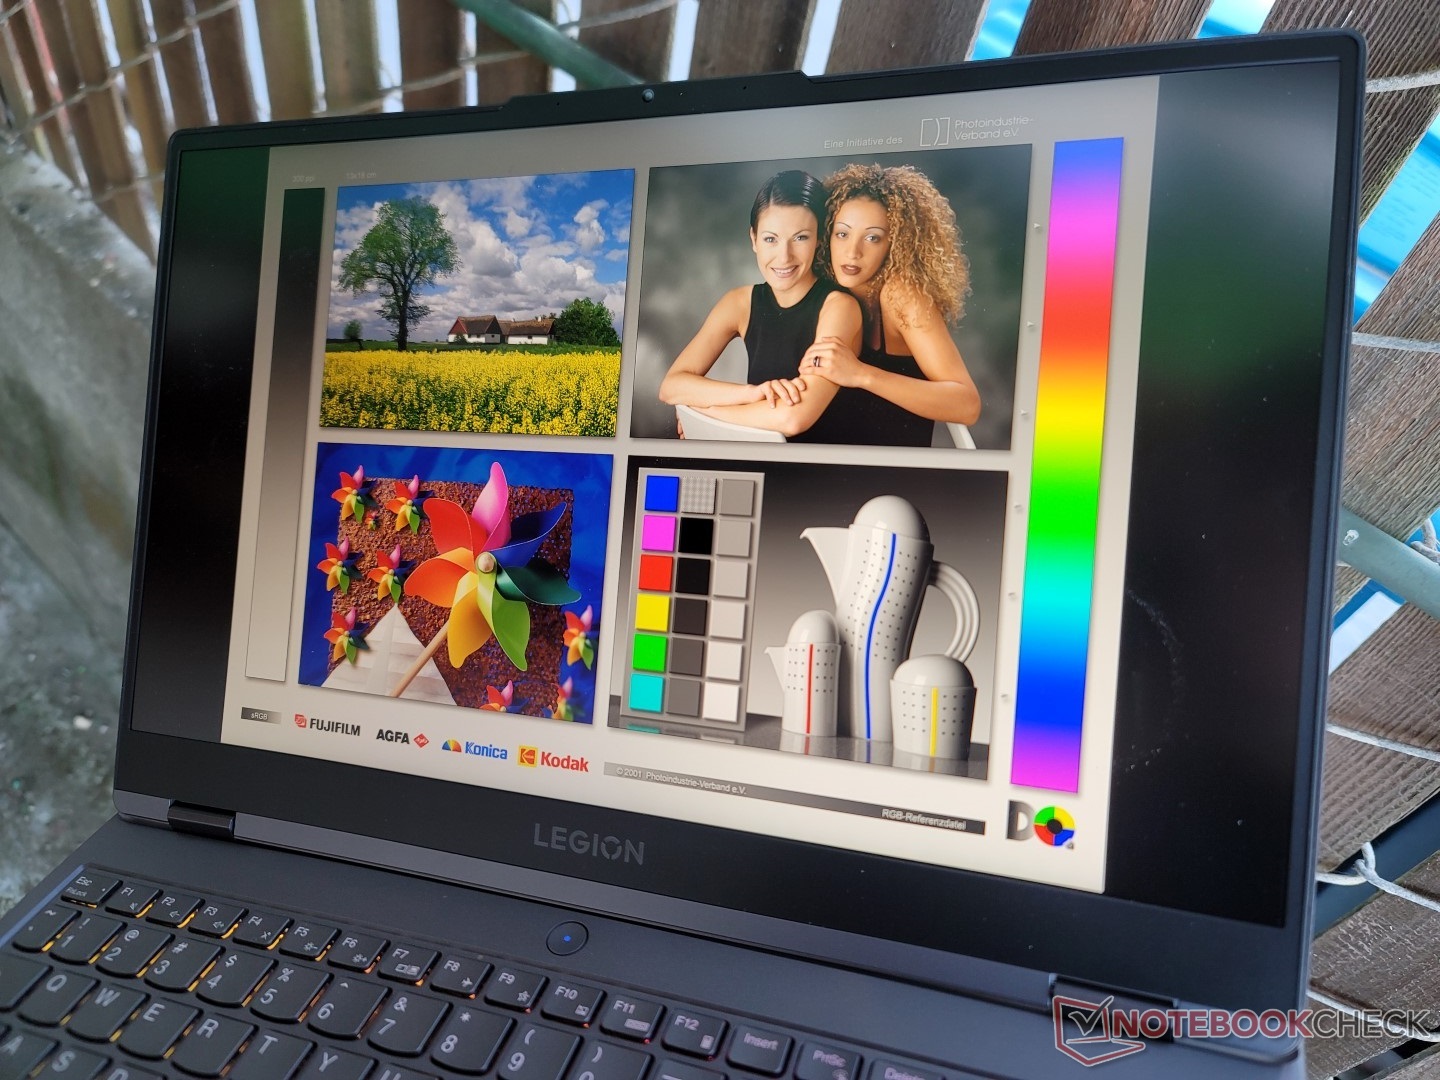
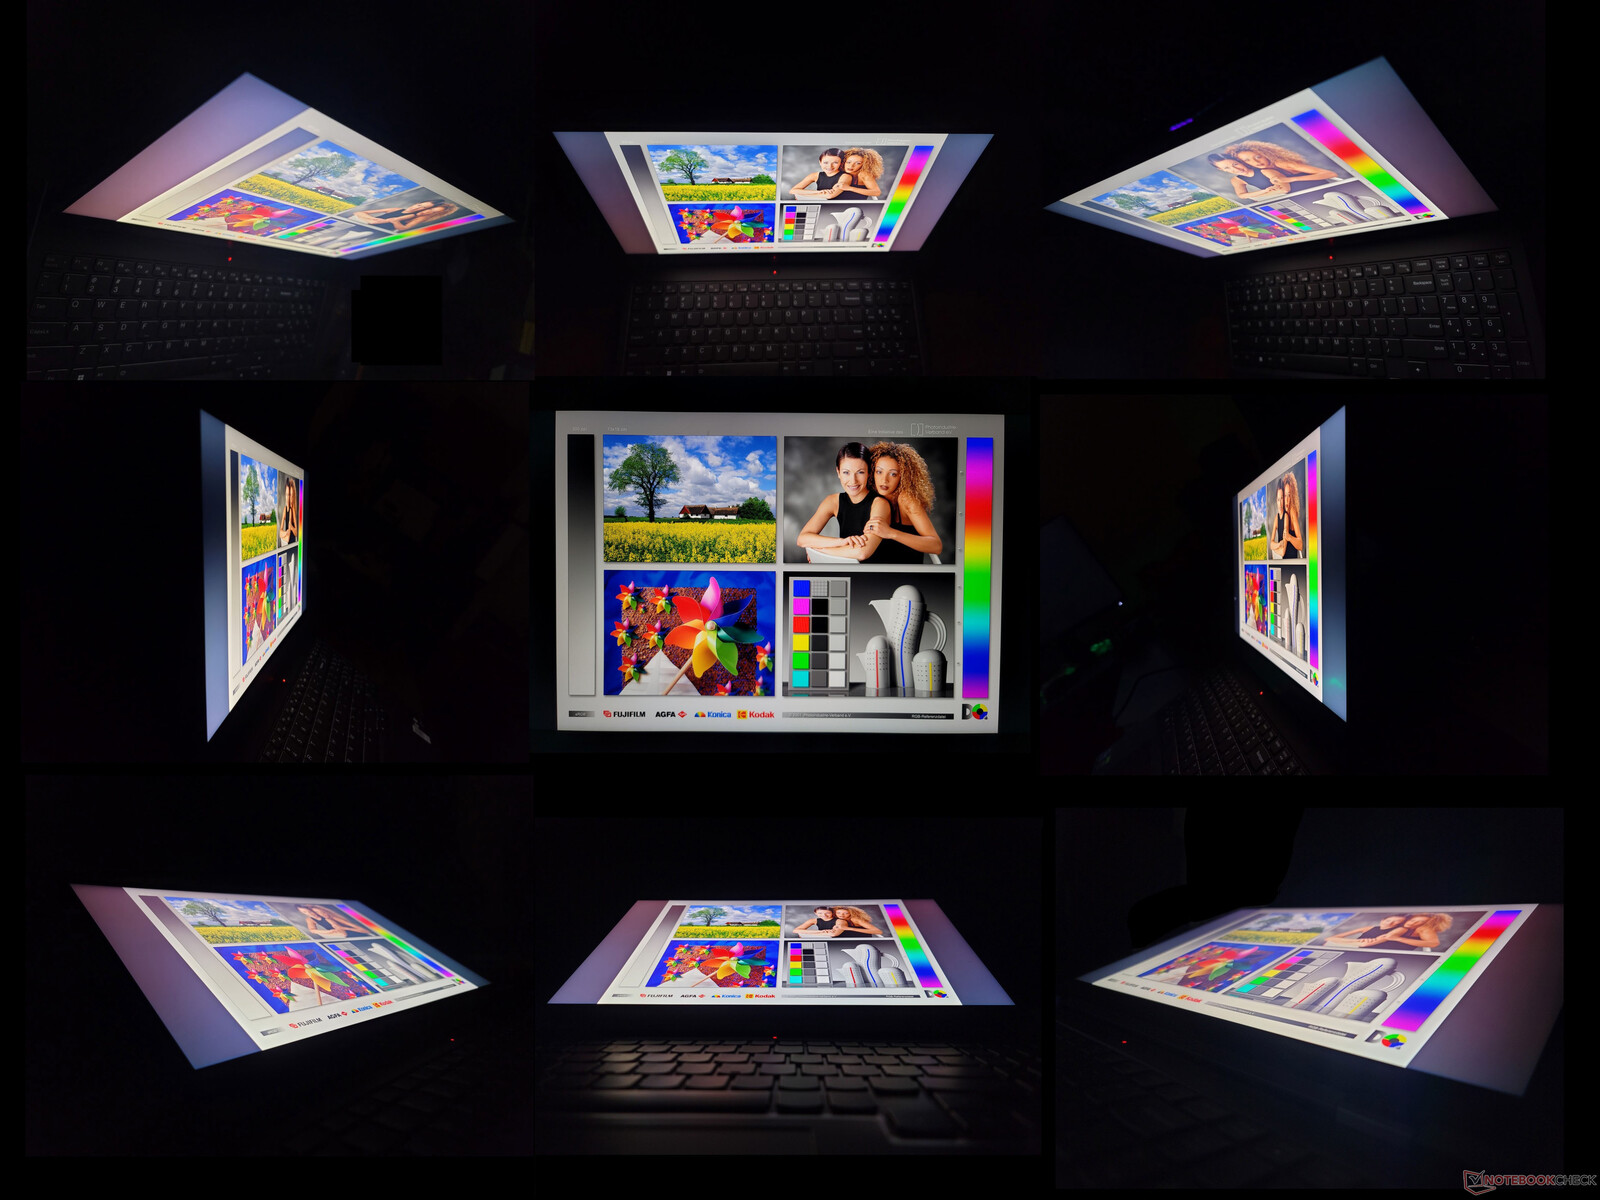
Display — 165 Hz, G-Sync, 100% sRGB, IPS
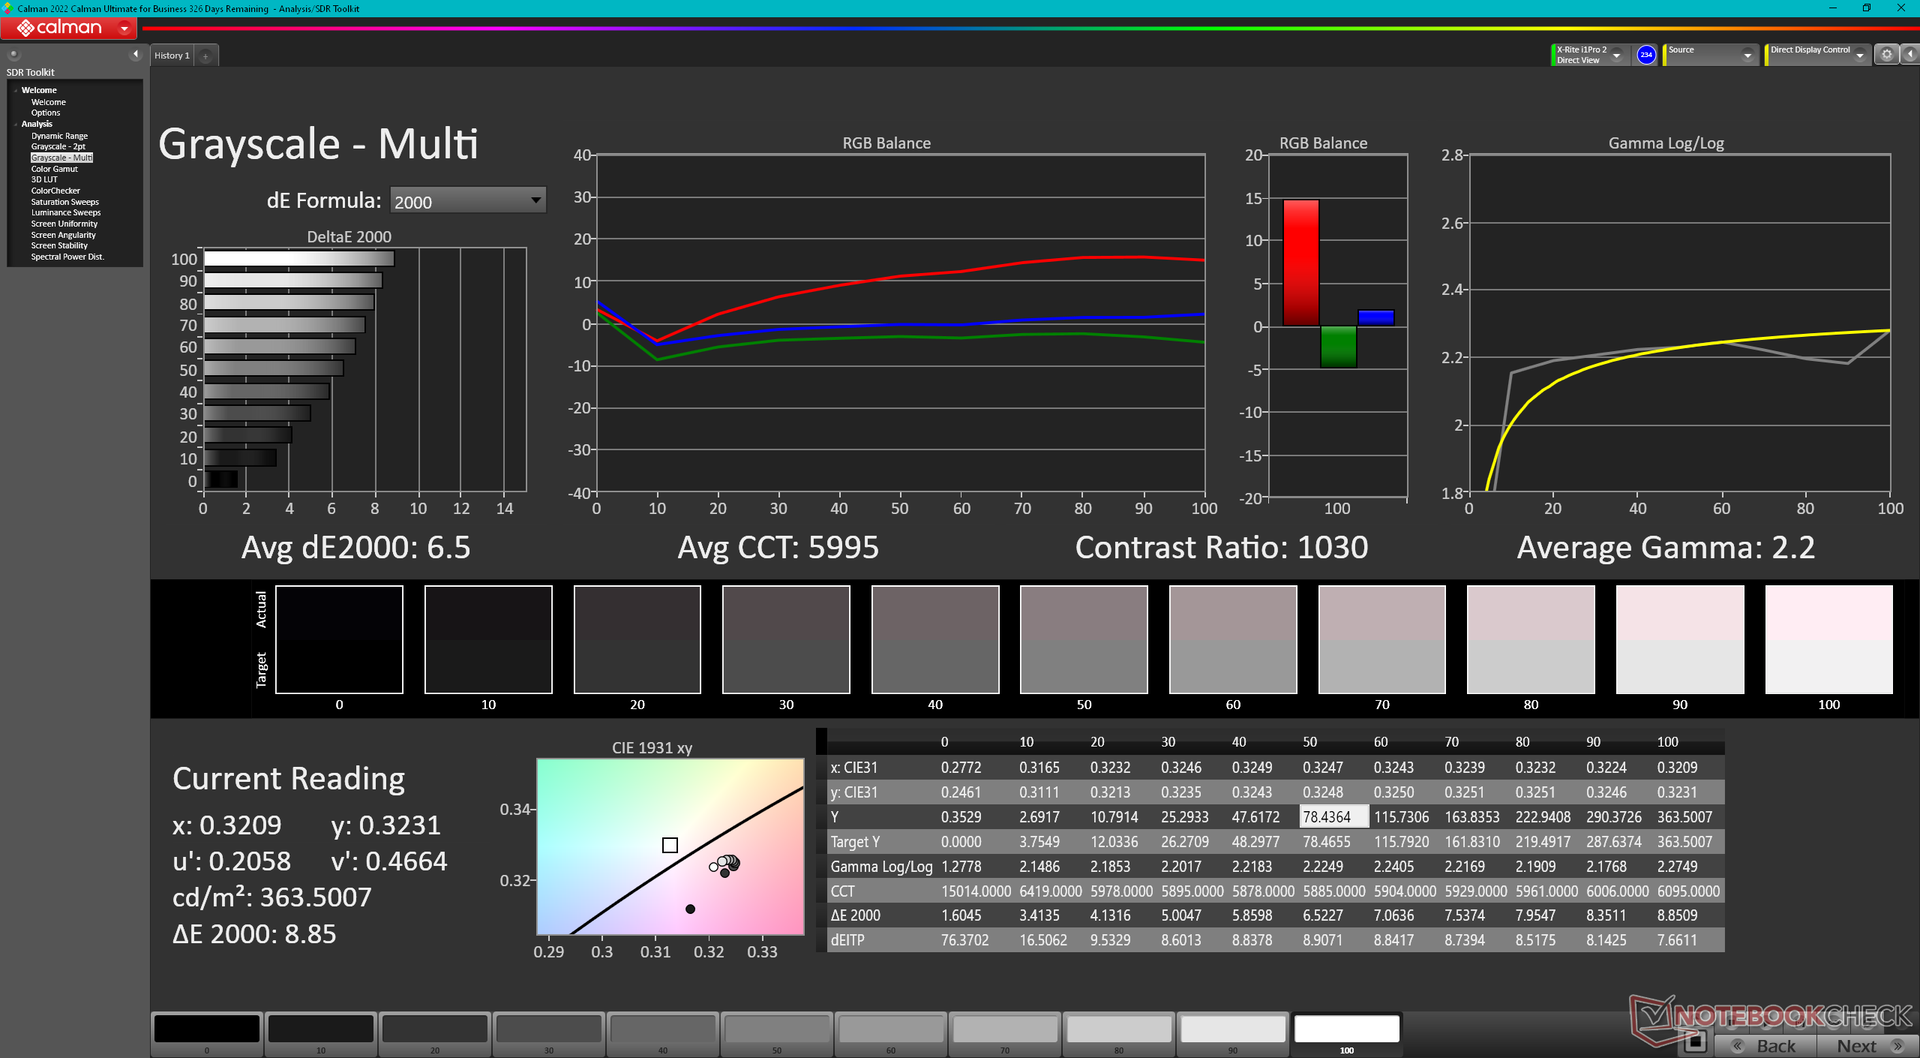
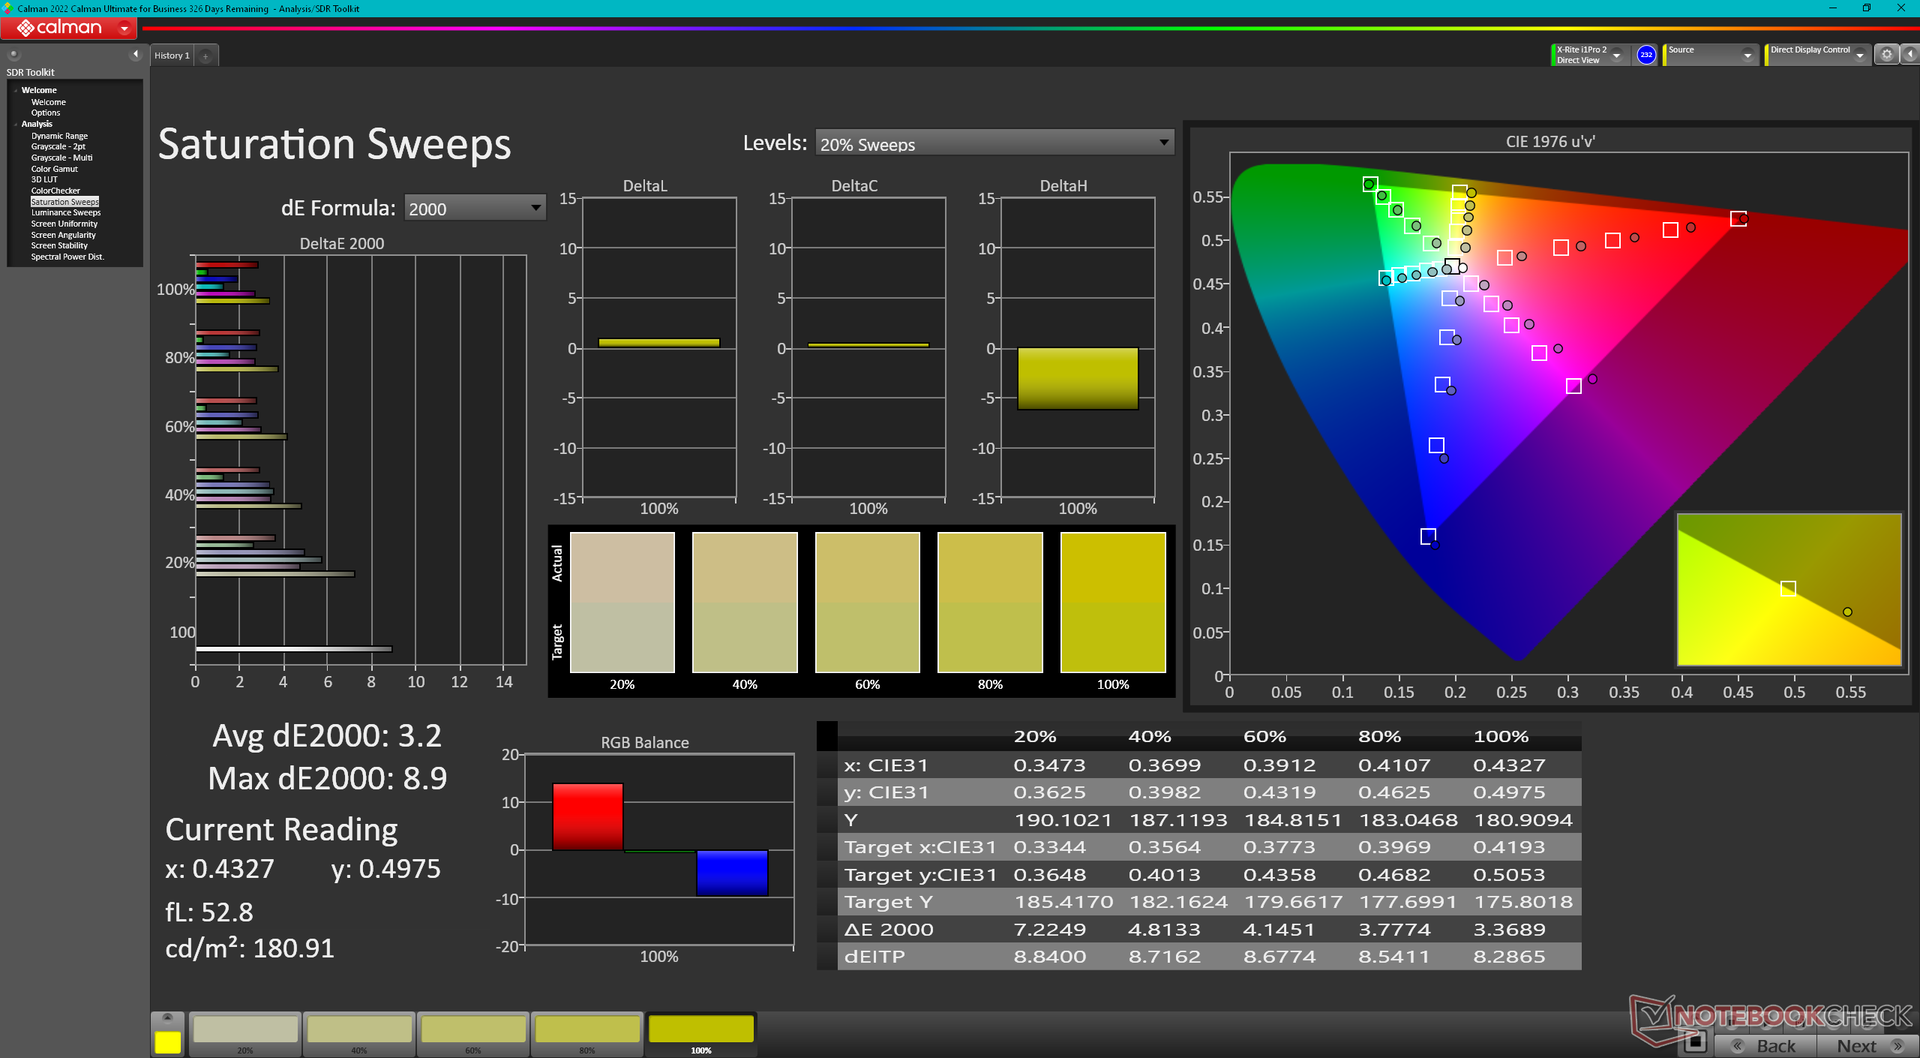
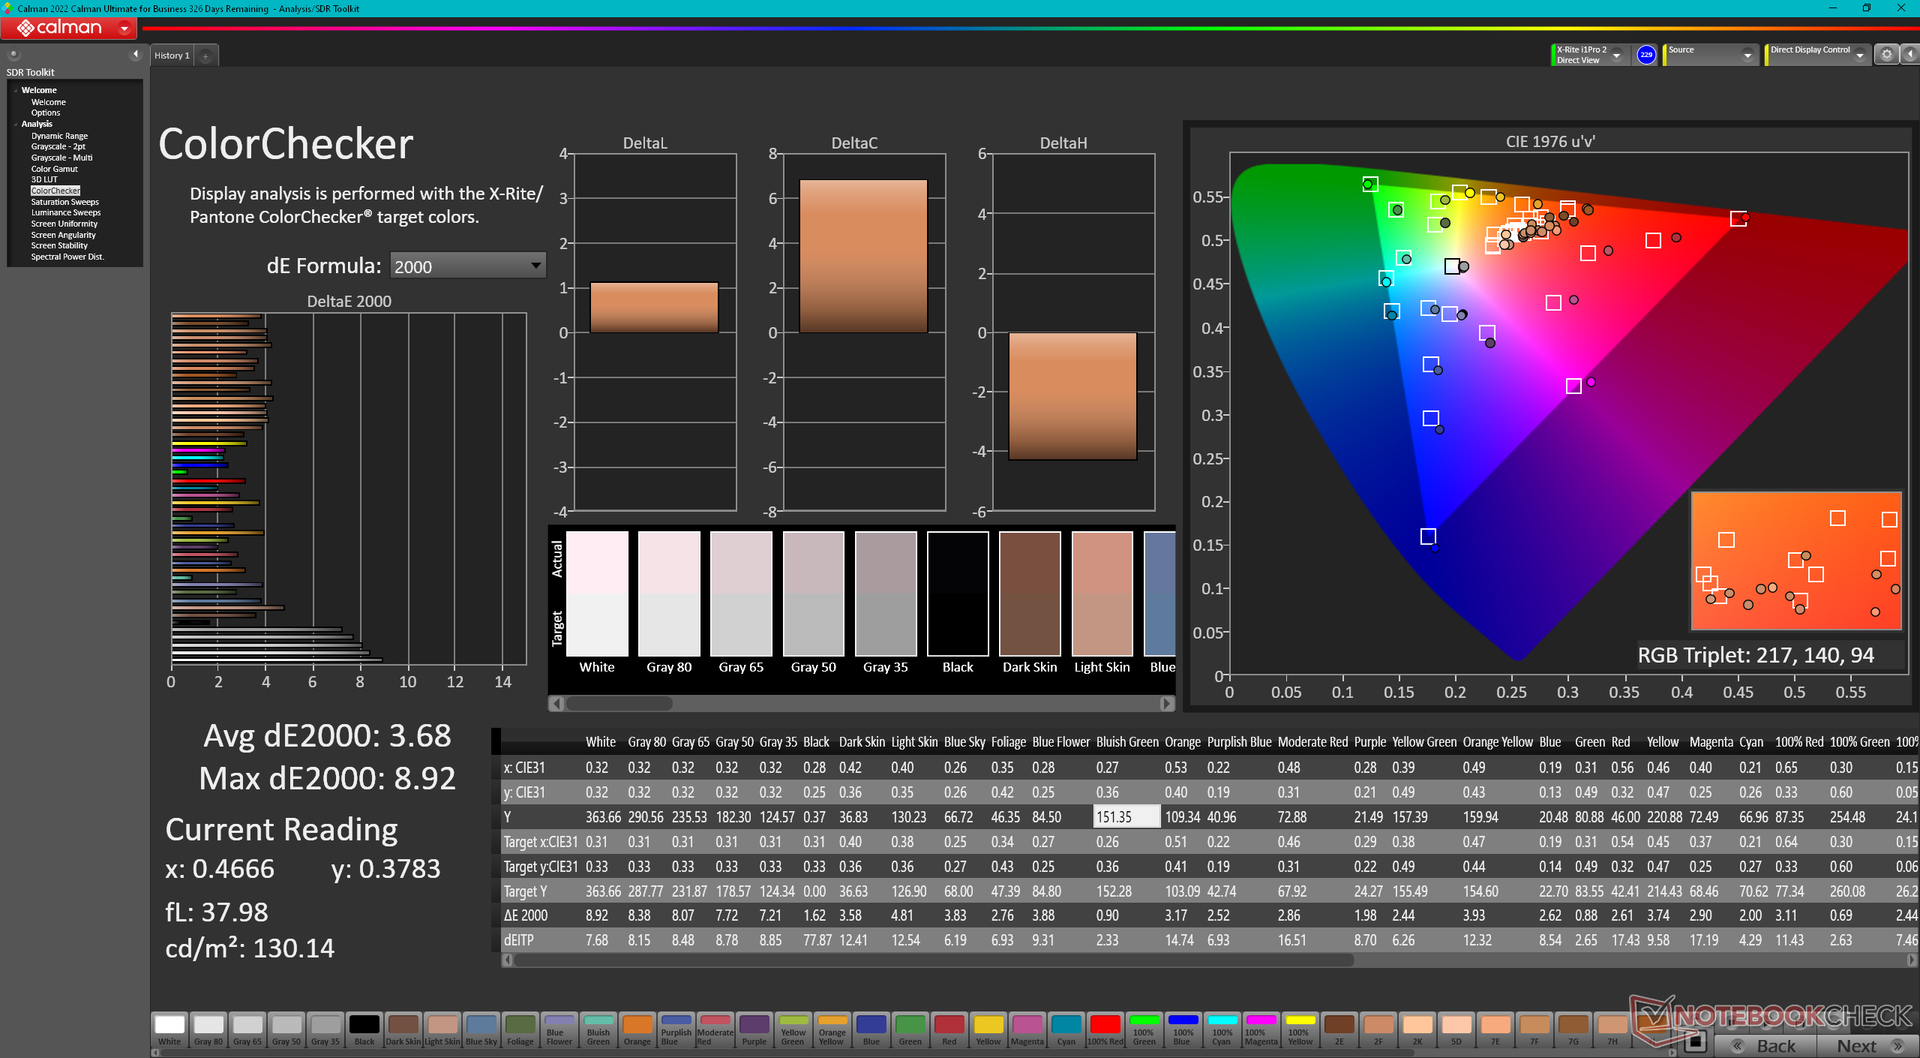
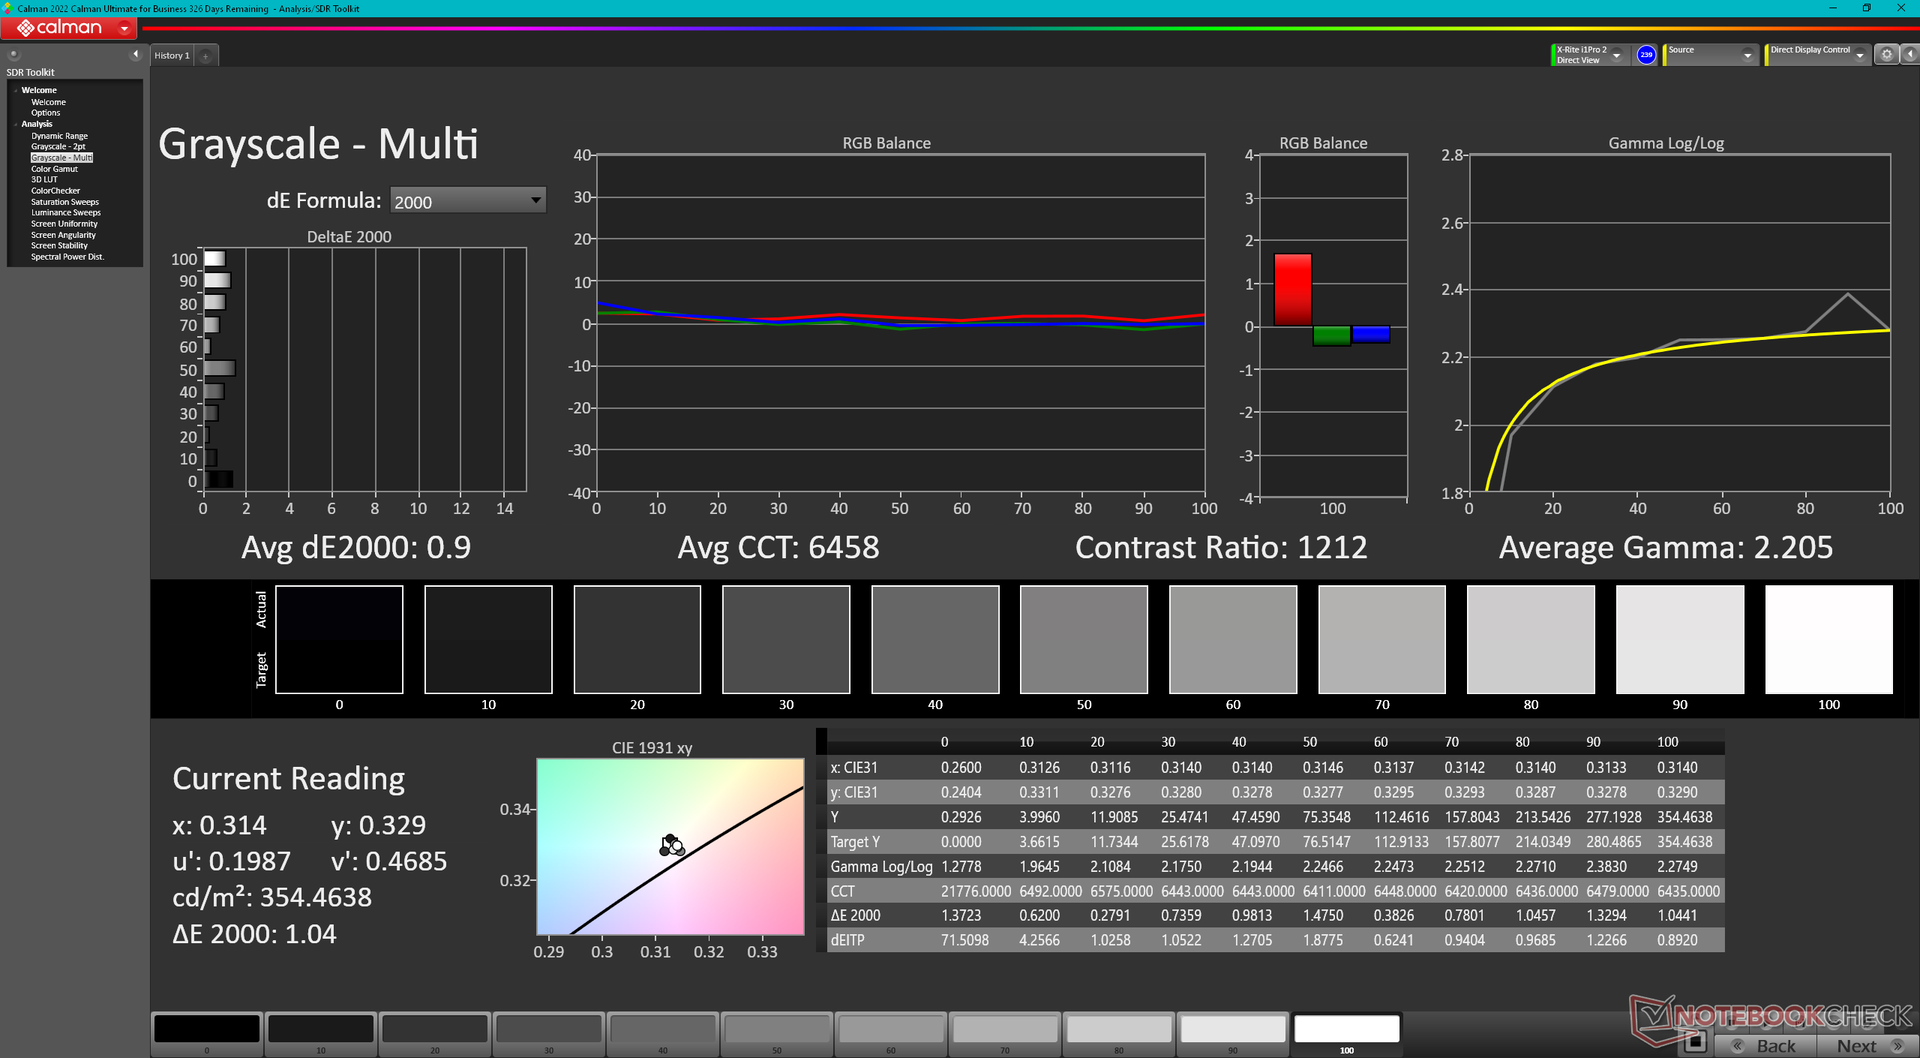
Lenovo has switched IPS panel providers from AUO to CSOT when compared to last year's model. Nonetheless, most attributes remain almost the same for a similar viewing experience. Users are still getting G-Sync, 100% sRGB coverage, 165 Hz native refresh rate, fast response times, bright 350-nit backlight, and a decent ~1000:1 contrast ratio. Some SKUs may include a cheaper 1080p 144 Hz panel which we recommend avoiding due to its narrower color space.


| |||||||||||||||||||||||||
Brightness Distribution: 89 %
Center on Battery: 363.5 cd/m²
Contrast: 932:1 (Black: 0.39 cd/m²)
ΔE ColorChecker Calman: 3.68 | ∀{0.5-29.43 Ø4.71}
calibrated: 0.53
ΔE Greyscale Calman: 6.5 | ∀{0.09-98 Ø4.96}
70% AdobeRGB 1998 (Argyll 3D)
99.5% sRGB (Argyll 3D)
69.1% Display P3 (Argyll 3D)
Gamma: 2.2
CCT: 5995 K
| Lenovo Legion 5 15IAH7H 82RB CSOT MNF601CA1-3, IPS, 1920x1080, 15.6" | Lenovo Legion 5 15ACH-82JU00C6GE-FL B156HAN12.H, , 1920x1080, 15.6" | MSI Bravo 15 B5DD-010US Chi Mei N156HRA-EA1, IPS, 1920x1080, 15.6" | Asus TUF Gaming F15 FX507ZM TL156VDXP0101, IPS, 1920x1080, 15.6" | Acer Aspire Nitro 5 AN515-55-57GF Chi Mei CMN N156HRA-EA1, IPS, 1920x1080, 15.6" | Razer Blade 15 Base Edition 2021, i7-10750H RTX 3060 BOE NV156FHM-N4K, IPS, 1920x1080, 15.6" | |
|---|---|---|---|---|---|---|
| Display | -4% | -38% | -3% | -37% | -7% | |
| Display P3 Coverage (%) | 69.1 | 65.4 -5% | 42.1 -39% | 66.4 -4% | 42.54 -38% | 64.3 -7% |
| sRGB Coverage (%) | 99.5 | 96.3 -3% | 62.8 -37% | 97 -3% | 63.5 -36% | 91.8 -8% |
| AdobeRGB 1998 Coverage (%) | 70 | 67.5 -4% | 43.6 -38% | 68.5 -2% | 44.02 -37% | 65.5 -6% |
| Response Times | 16% | -82% | 28% | -111% | 29% | |
| Response Time Grey 50% / Grey 80% * (ms) | 14.8 ? | 13.6 ? 8% | 25.6 ? -73% | 5.6 ? 62% | 33.8 ? -128% | 8.8 ? 41% |
| Response Time Black / White * (ms) | 12 ? | 9.2 ? 23% | 22.8 ? -90% | 12.8 ? -7% | 23.2 ? -93% | 10 ? 17% |
| PWM Frequency (Hz) | 1000 ? | |||||
| Screen | -15% | -87% | 23% | -53% | -40% | |
| Brightness middle (cd/m²) | 363.5 | 350 -4% | 265.1 -27% | 353.7 -3% | 288 -21% | 317.2 -13% |
| Brightness (cd/m²) | 350 | 350 0% | 245 -30% | 340 -3% | 262 -25% | 306 -13% |
| Brightness Distribution (%) | 89 | 96 8% | 87 -2% | 89 0% | 88 -1% | 89 0% |
| Black Level * (cd/m²) | 0.39 | 0.3 23% | 0.35 10% | 0.34 13% | 0.21 46% | 0.31 21% |
| Contrast (:1) | 932 | 1167 25% | 757 -19% | 1040 12% | 1371 47% | 1023 10% |
| Colorchecker dE 2000 * | 3.68 | 3.9 -6% | 4.68 -27% | 1.74 53% | 3.61 2% | 4.37 -19% |
| Colorchecker dE 2000 max. * | 8.92 | 8.2 8% | 19.96 -124% | 3.63 59% | 18.07 -103% | 6.62 26% |
| Colorchecker dE 2000 calibrated * | 0.53 | 1.6 -202% | 3.7 -598% | 0.5 6% | 3.12 -489% | 2.67 -404% |
| Greyscale dE 2000 * | 6.5 | 5.5 15% | 4.5 31% | 2.1 68% | 2.4 63% | 4.5 31% |
| Gamma | 2.2 100% | 2.15 102% | 2.22 99% | 2.3 96% | 2.216 99% | 2.4 92% |
| CCT | 5995 108% | 7414 88% | 6632 98% | 6257 104% | 6675 97% | 7418 88% |
| Color Space (Percent of AdobeRGB 1998) (%) | 44 | 59.2 | ||||
| Color Space (Percent of sRGB) (%) | 62 | 91.4 | ||||
| Total Average (Program / Settings) | -1% /
-8% | -69% /
-76% | 16% /
18% | -67% /
-58% | -6% /
-23% |
* ... smaller is better
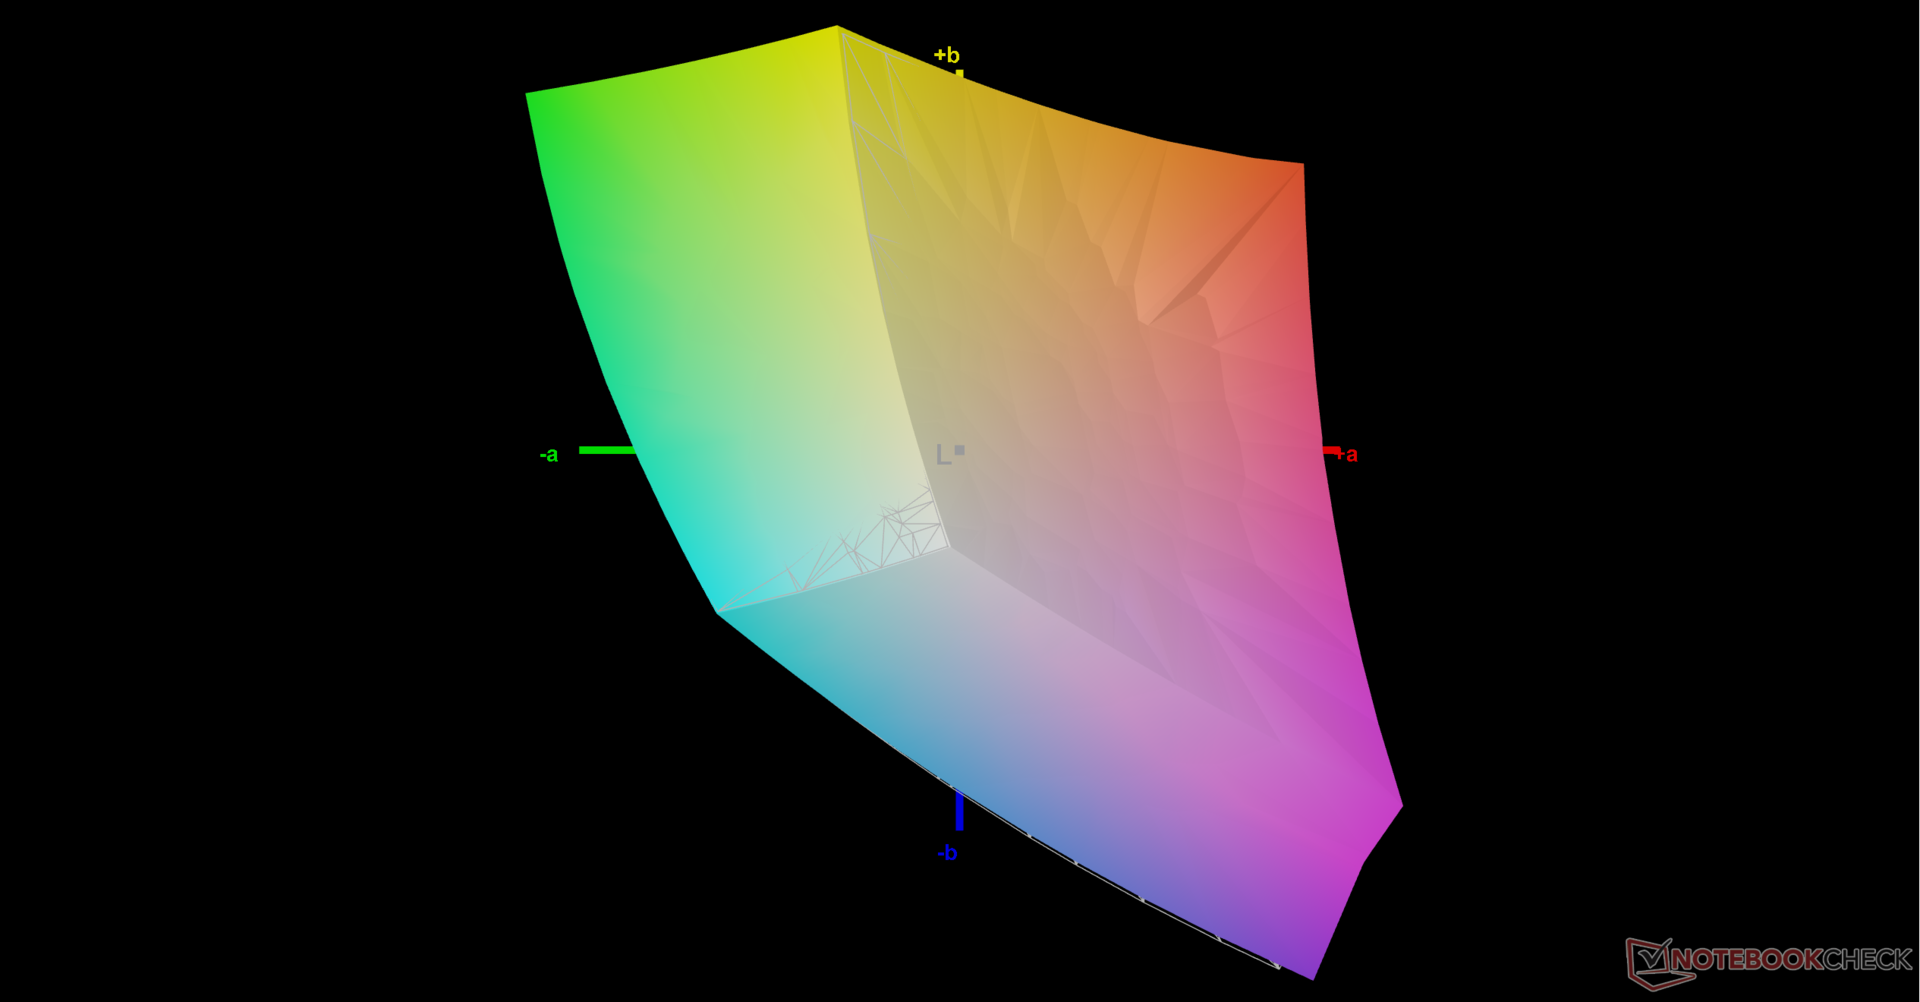
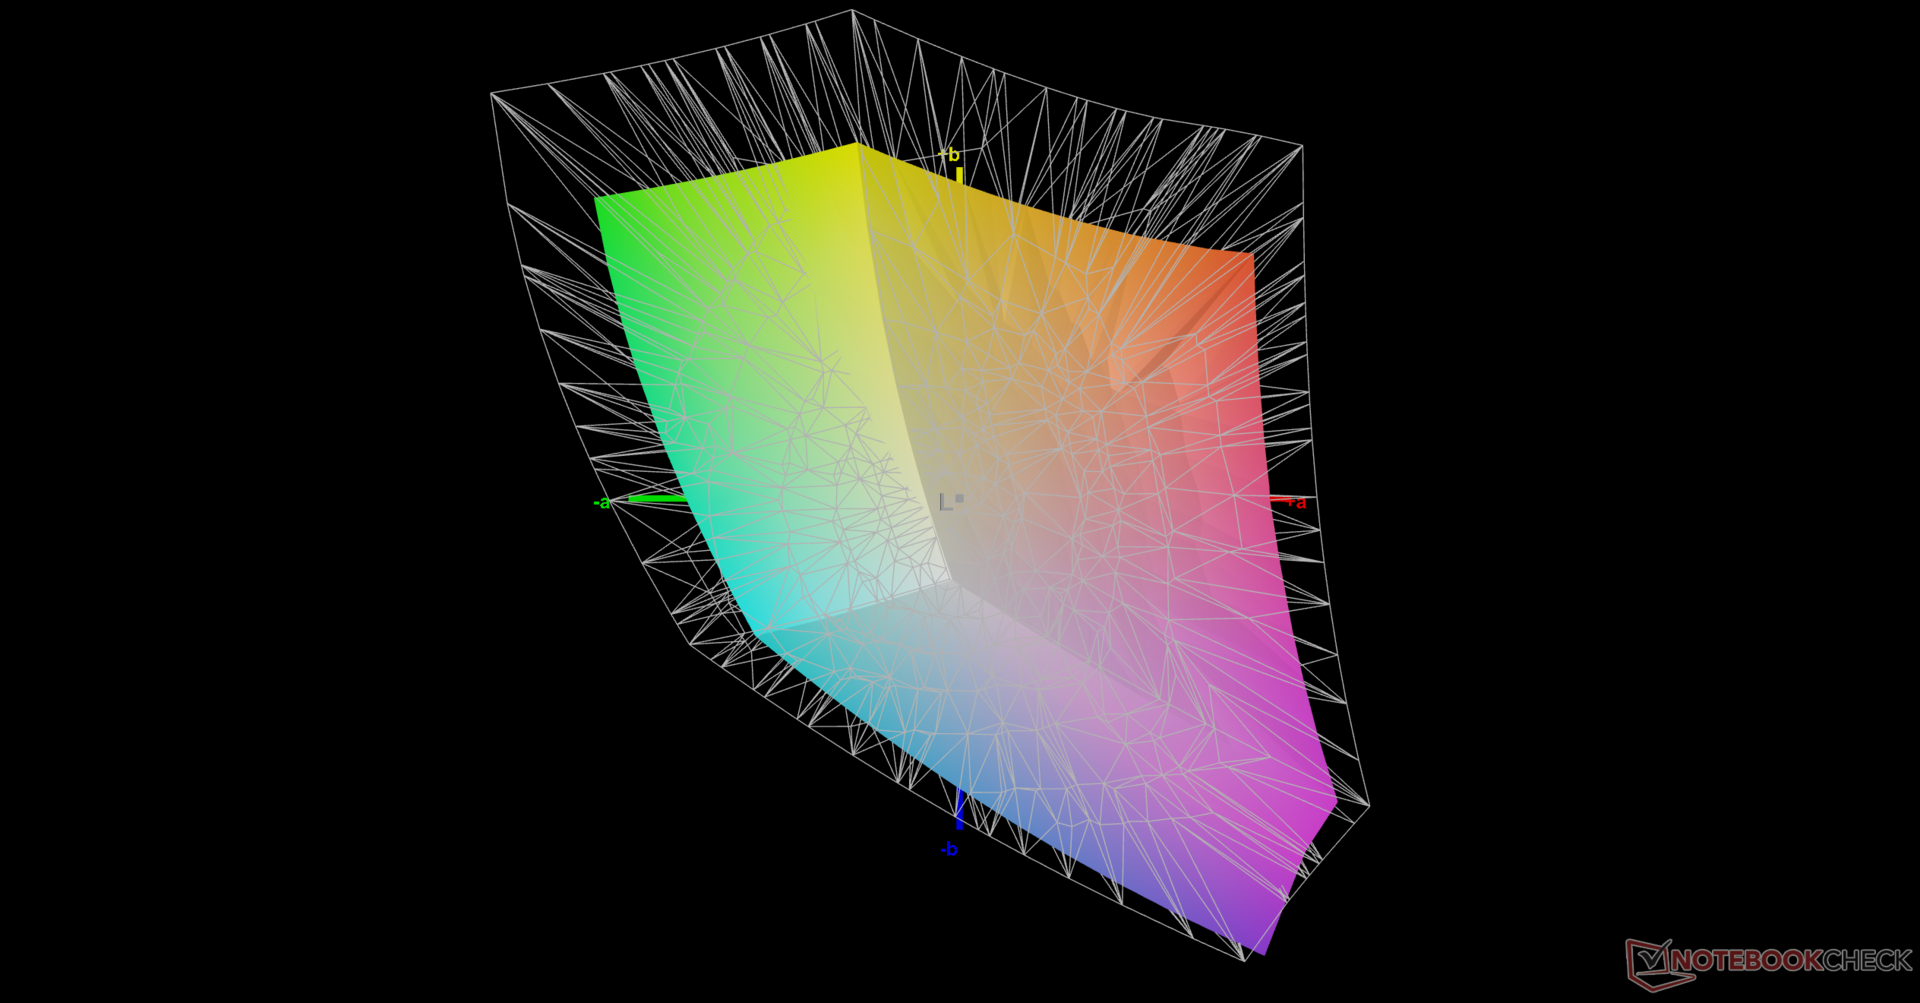
The display does not come pre-calibrated as demonstrated by our X-Rite colorimeter results below where average grayscale and color deltaE values are as high as 6.5 and 3.68, respectively. A proper calibration can bring said averages down to just 0.9 and 0.53, respectively, since the panel covers all of sRGB. We recommend applying our calibrated ICM profile above to better exploit the wide sRGB colors of the panel.
Display Response Times
| ↔ Response Time Black to White | ||
|---|---|---|
| 12 ms ... rise ↗ and fall ↘ combined | ↗ 6.8 ms rise | 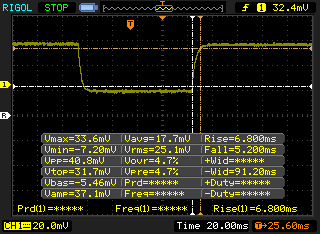 |
| ↘ 5.2 ms fall | ||
| The screen shows good response rates in our tests, but may be too slow for competitive gamers. In comparison, all tested devices range from 0.1 (minimum) to 240 (maximum) ms. » 32 % of all devices are better. This means that the measured response time is better than the average of all tested devices (19.8 ms). | ||
| ↔ Response Time 50% Grey to 80% Grey | ||
| 14.8 ms ... rise ↗ and fall ↘ combined | ↗ 8 ms rise | 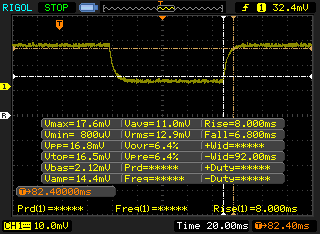 |
| ↘ 6.8 ms fall | ||
| The screen shows good response rates in our tests, but may be too slow for competitive gamers. In comparison, all tested devices range from 0.165 (minimum) to 636 (maximum) ms. » 29 % of all devices are better. This means that the measured response time is better than the average of all tested devices (30.9 ms). | ||
Screen Flickering / PWM (Pulse-Width Modulation)
| Screen flickering / PWM not detected | 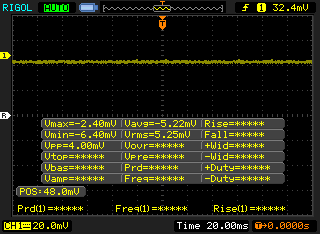 | ||
In comparison: 52 % of all tested devices do not use PWM to dim the display. If PWM was detected, an average of 7741 (minimum: 5 - maximum: 343500) Hz was measured. | |||
At 350 nits, the display is just slightly brighter than the average gaming laptop where 300 nits is commonplace. The screen is comfortable for viewing outdoors under shade and the matte overlay helps to reduce glare, but everything becomes washed out if under brighter conditions.


Performance — MUX Support
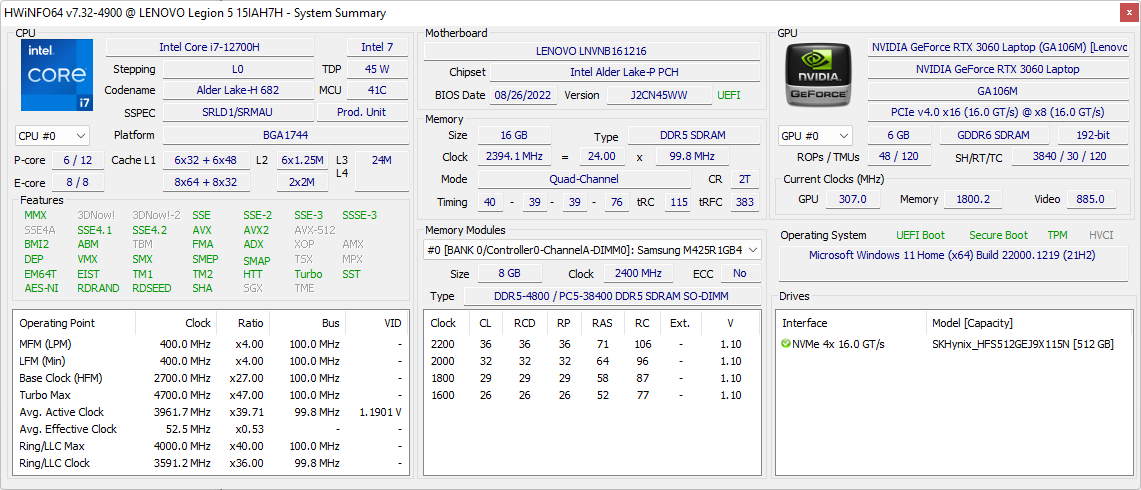
Testing Conditions
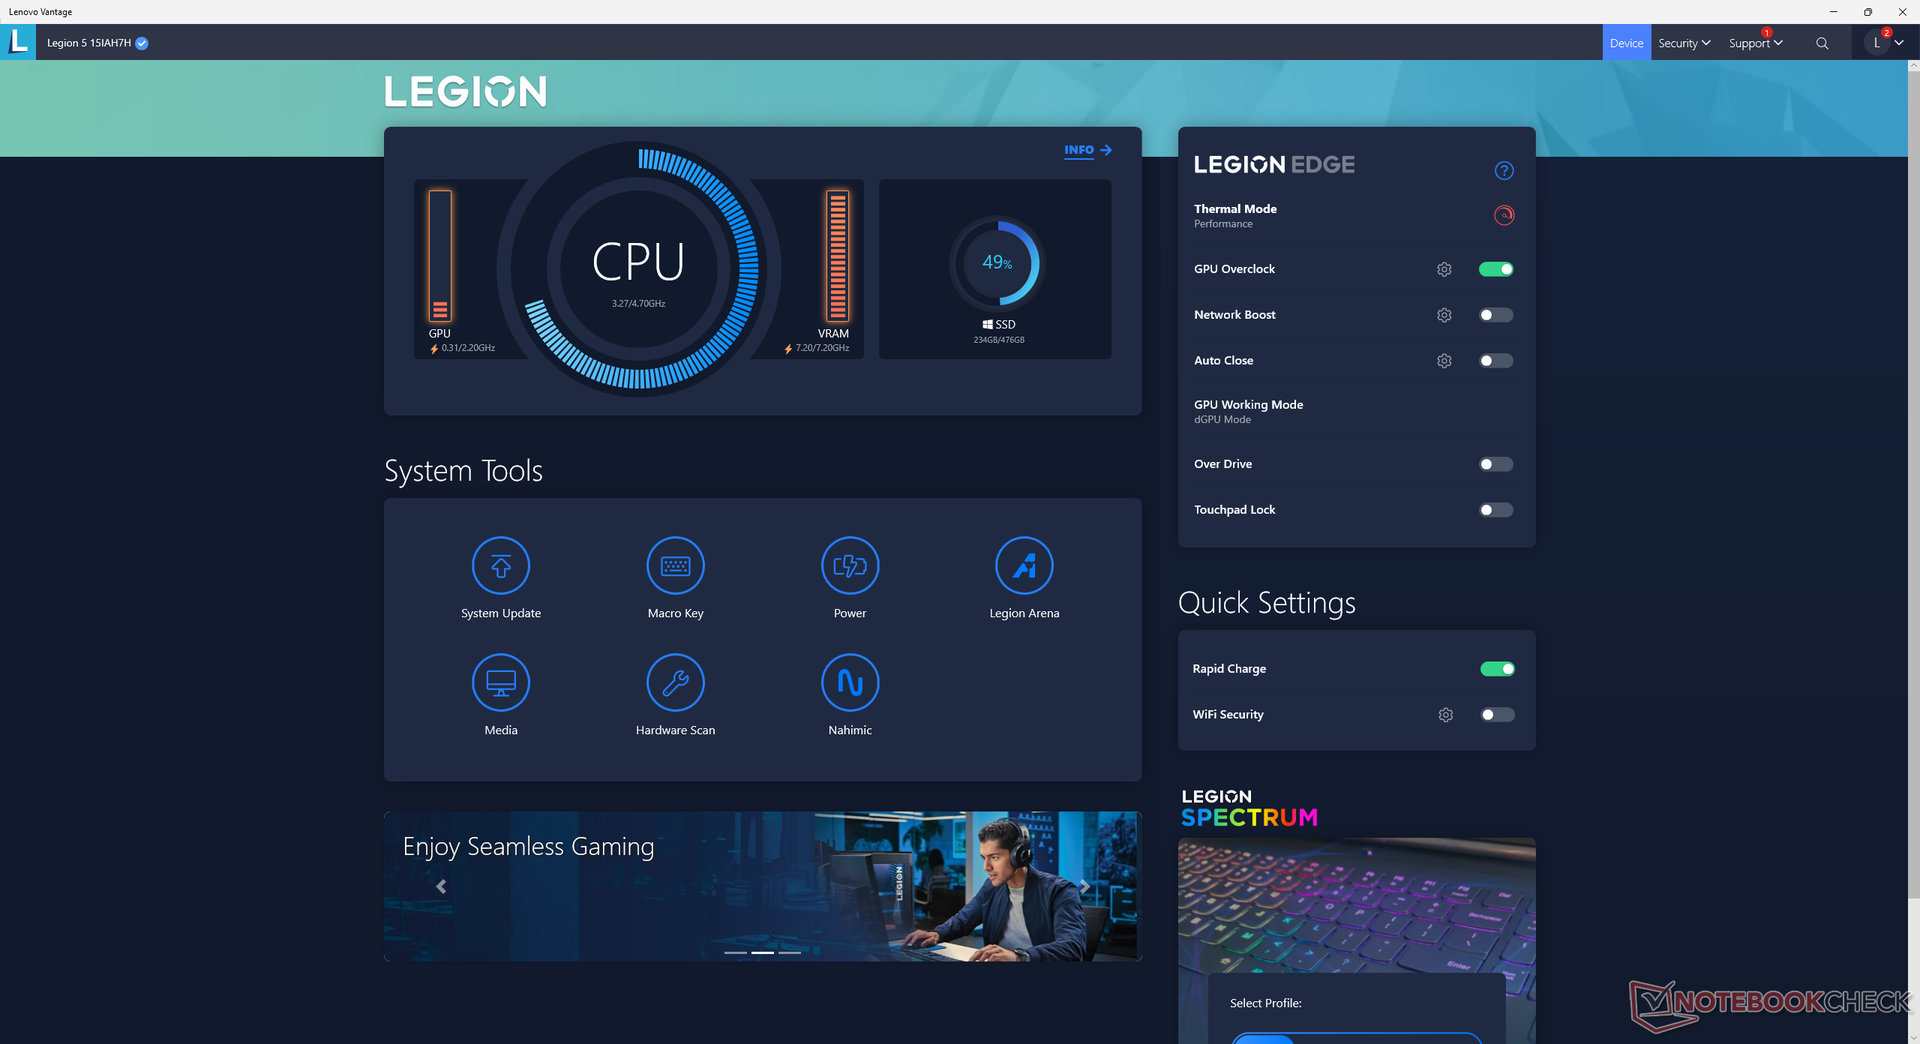
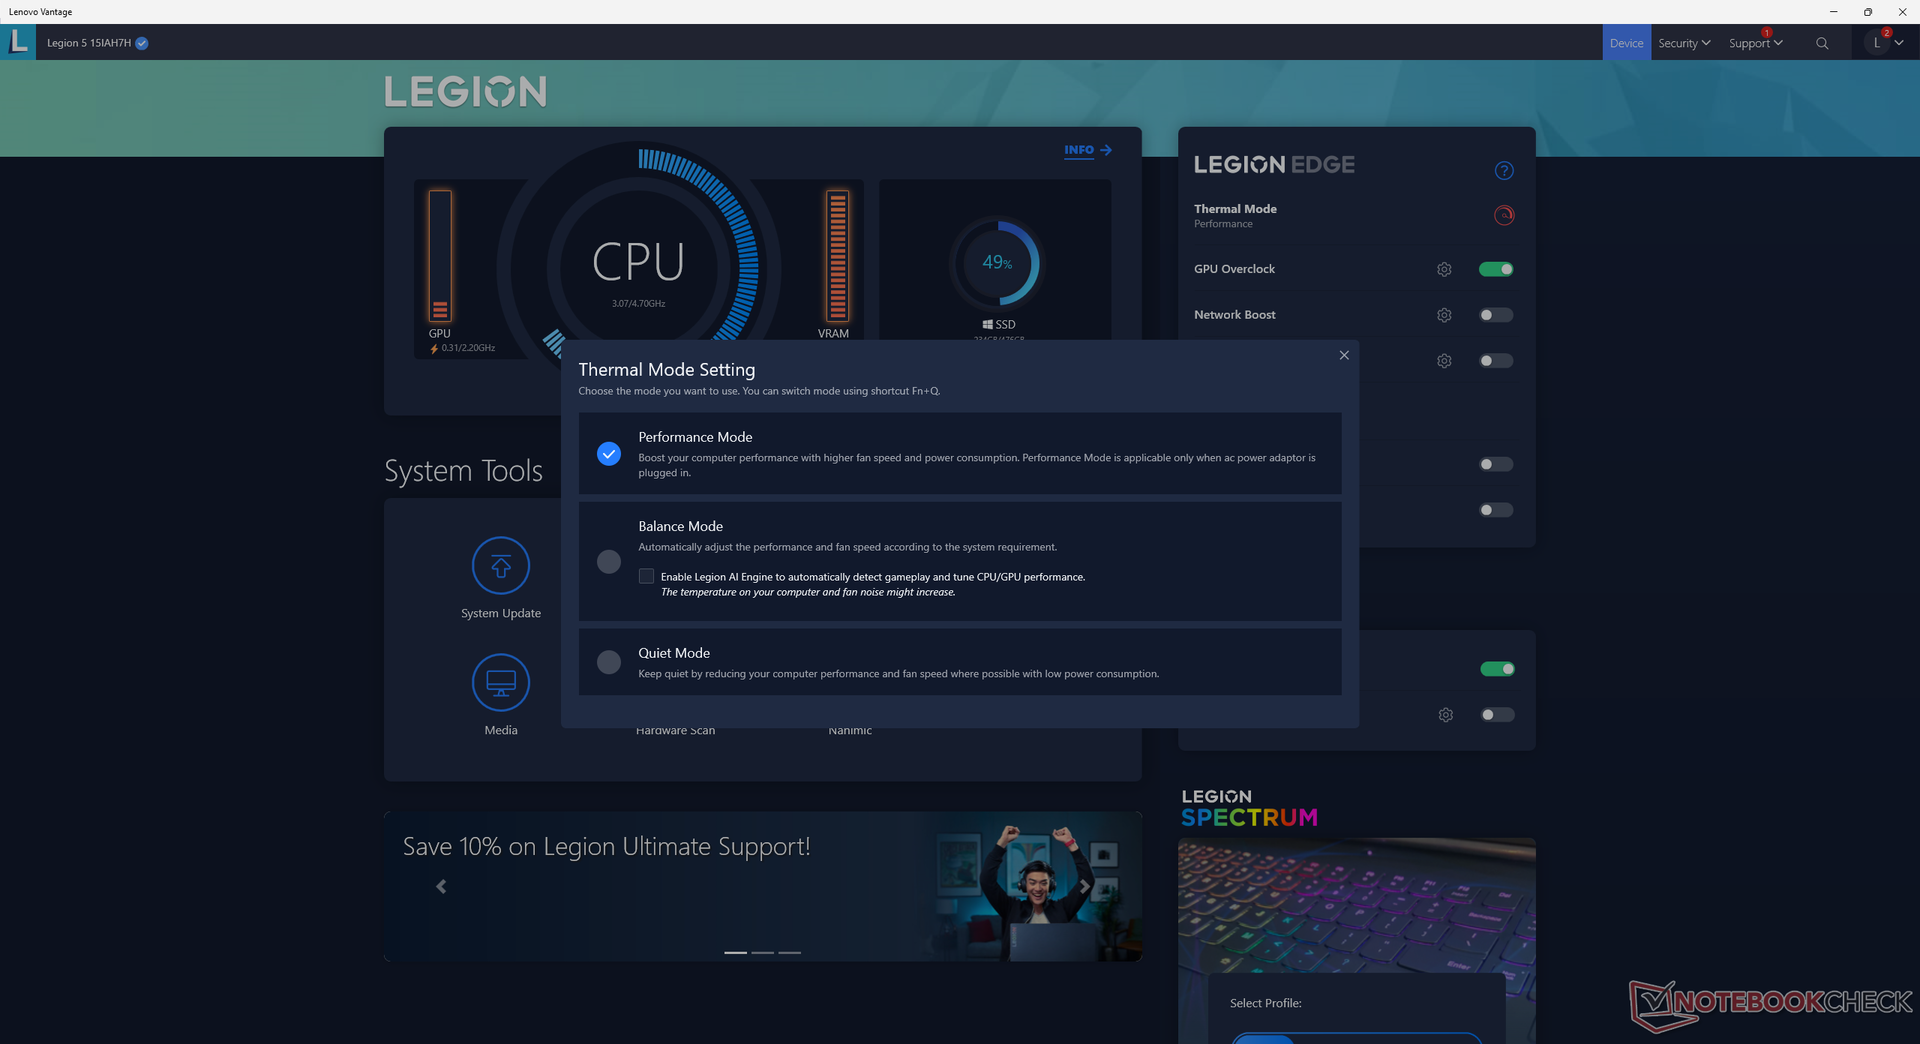
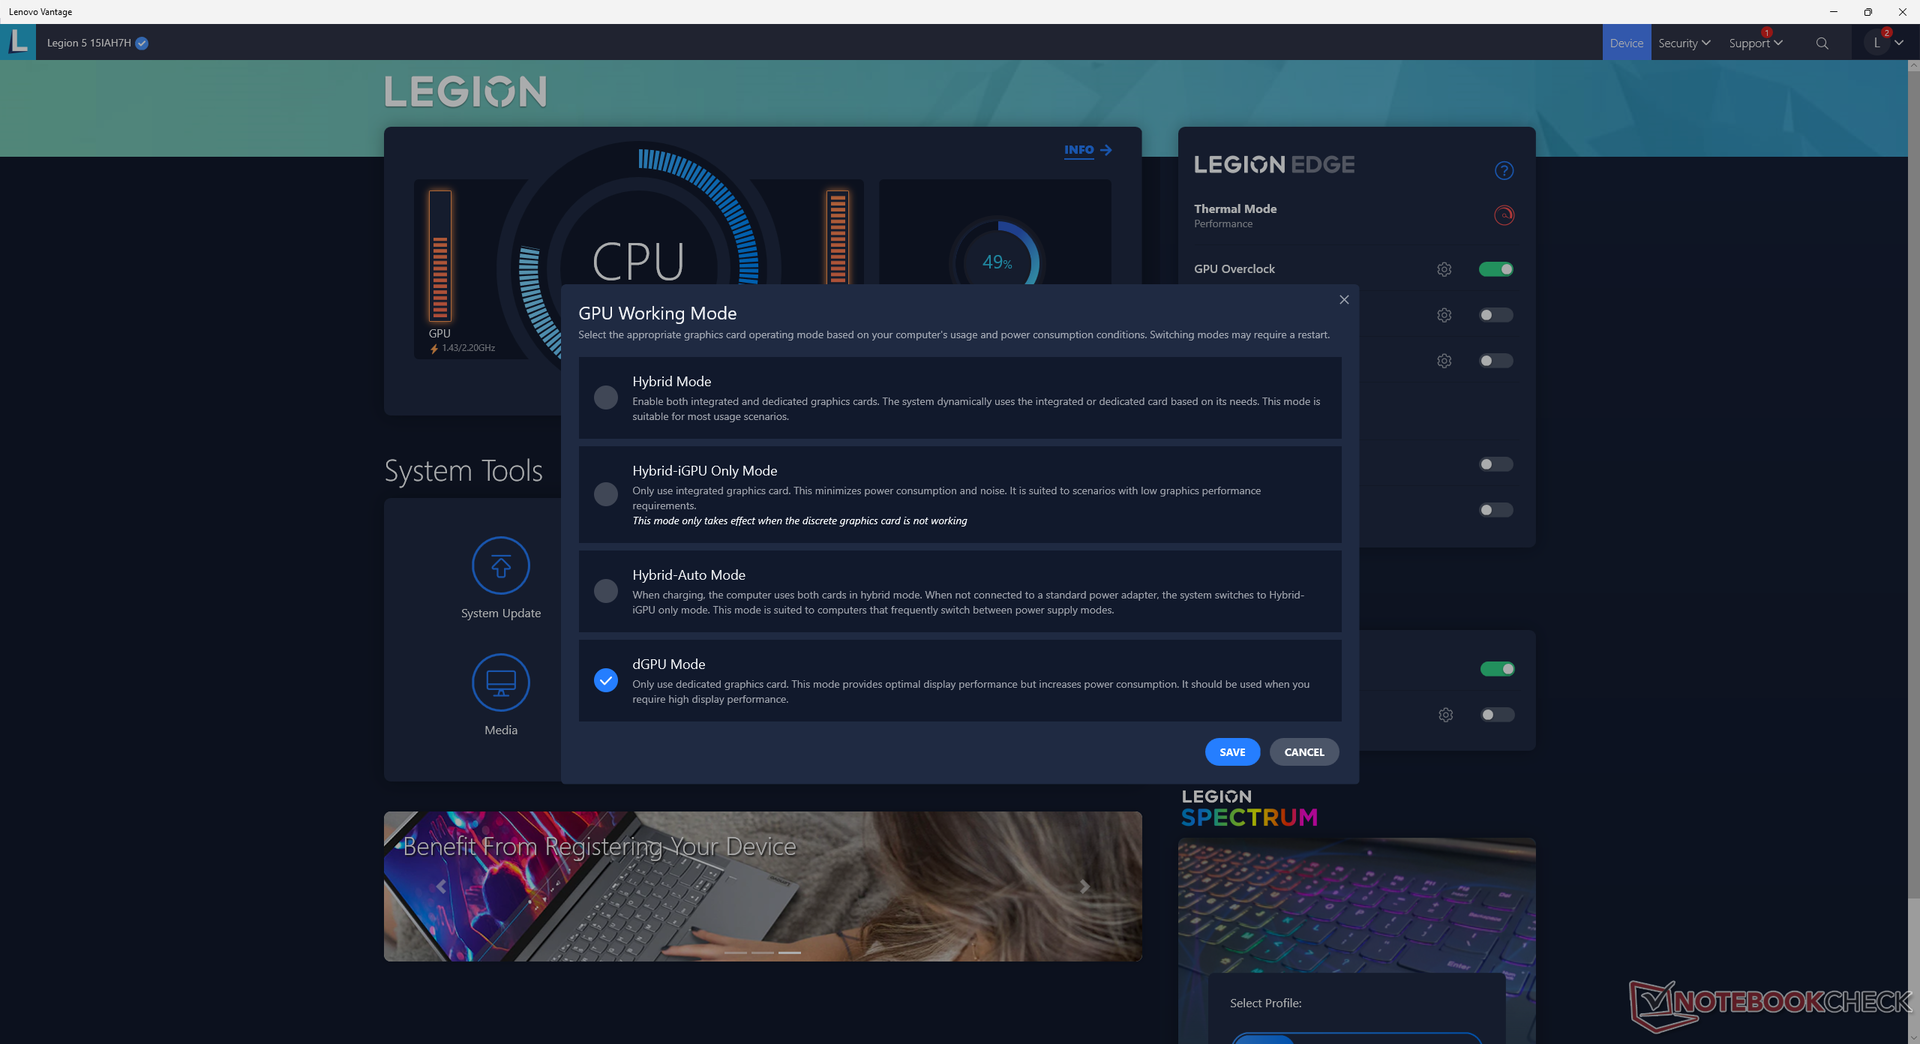
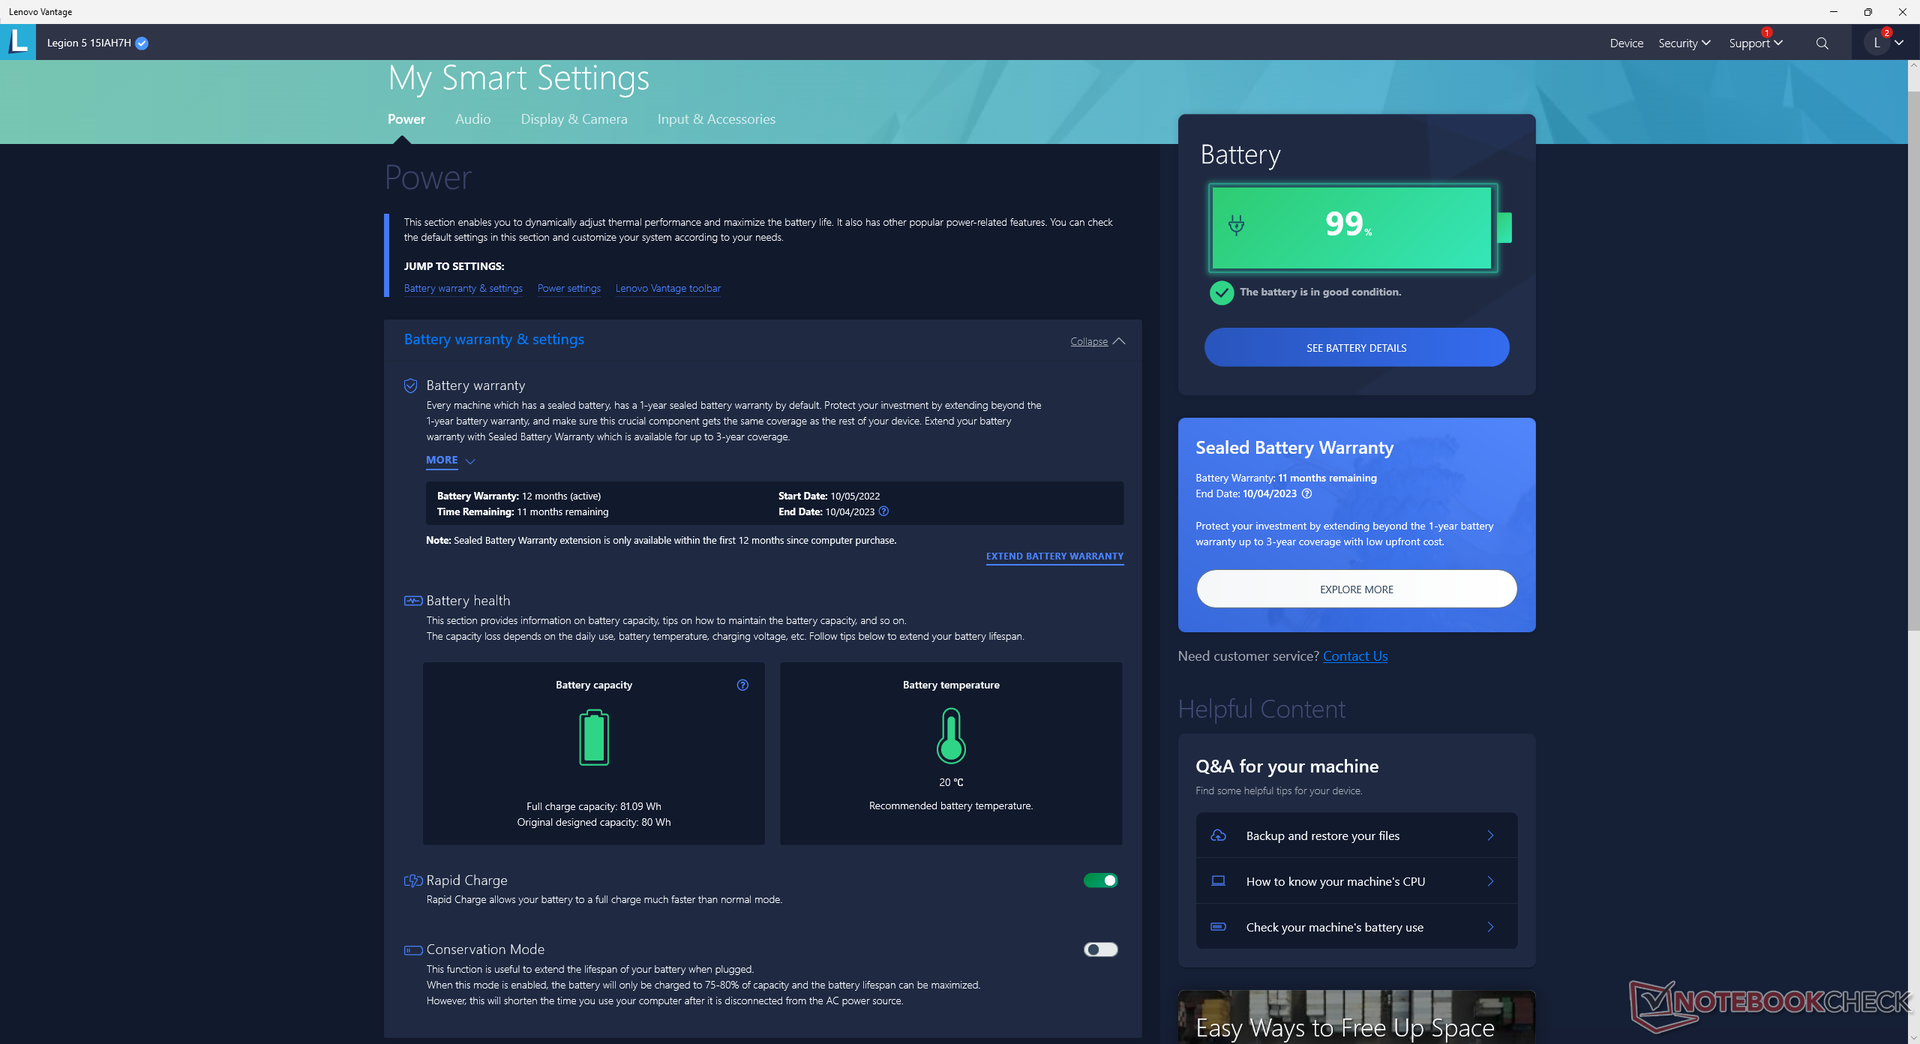
We set our system to Performance mode and the GPU to discrete mode via Lenovo Vantage prior to running any performance benchmarks below. It's highly recommended that users become familiar with the pre-installed Vantage software as it is the hub for system updates, MUX or hybrid graphics modes, charging behavior, and more as shown by the screenshots below.
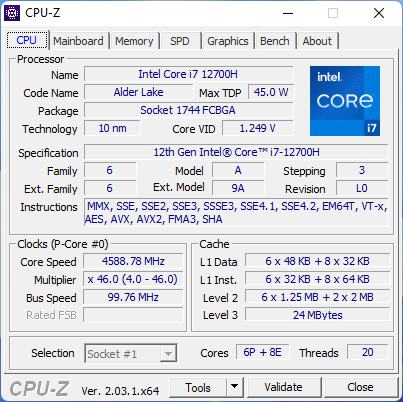
Processor
CPU performance is faster than expected with results that are 15 to 25 percent faster than the average laptop in our database equipped with the same Core i7-12700H processor. In fact, the Legion 5 15 is one of the fastest models you can get with the Core i7-12700H. Raw performance outpaces the Core i7-12800H in the more expensive 2022 Razer Blade 15 by noticeable margins.
Downgrading to a lesser Core i5-12500H configuration entails a 5 percent and 25 percent dip in single-thread and multi-thread performance, respectively.
Cinebench R15 Multi Loop
Cinebench R23: Multi Core | Single Core
Cinebench R15: CPU Multi 64Bit | CPU Single 64Bit
Blender: v2.79 BMW27 CPU
7-Zip 18.03: 7z b 4 | 7z b 4 -mmt1
Geekbench 5.5: Multi-Core | Single-Core
HWBOT x265 Benchmark v2.2: 4k Preset
LibreOffice : 20 Documents To PDF
R Benchmark 2.5: Overall mean
* ... smaller is better
AIDA64: FP32 Ray-Trace | FPU Julia | CPU SHA3 | CPU Queen | FPU SinJulia | FPU Mandel | CPU AES | CPU ZLib | FP64 Ray-Trace | CPU PhotoWorxx
| Performance rating | |
| Lenovo Legion 5 15IAH7H 82RB | |
| Lenovo Legion 5 15ACH-82JU00C6GE-FL | |
| Average Intel Core i7-12700H | |
| Asus TUF Gaming F15 FX507ZM | |
| MSI Bravo 15 B5DD-010US | |
| Acer Aspire Nitro 5 AN515-55-57GF | |
| AIDA64 / FP32 Ray-Trace | |
| Lenovo Legion 5 15IAH7H 82RB | |
| Lenovo Legion 5 15ACH-82JU00C6GE-FL | |
| Average Intel Core i7-12700H (2585 - 17957, n=64) | |
| MSI Bravo 15 B5DD-010US | |
| Asus TUF Gaming F15 FX507ZM | |
| Acer Aspire Nitro 5 AN515-55-57GF | |
| AIDA64 / FPU Julia | |
| Lenovo Legion 5 15ACH-82JU00C6GE-FL | |
| Lenovo Legion 5 15IAH7H 82RB | |
| MSI Bravo 15 B5DD-010US | |
| Average Intel Core i7-12700H (12439 - 90760, n=64) | |
| Asus TUF Gaming F15 FX507ZM | |
| Acer Aspire Nitro 5 AN515-55-57GF | |
| AIDA64 / CPU SHA3 | |
| Lenovo Legion 5 15IAH7H 82RB | |
| Asus TUF Gaming F15 FX507ZM | |
| Lenovo Legion 5 15ACH-82JU00C6GE-FL | |
| Average Intel Core i7-12700H (833 - 4242, n=64) | |
| MSI Bravo 15 B5DD-010US | |
| Acer Aspire Nitro 5 AN515-55-57GF | |
| AIDA64 / CPU Queen | |
| Lenovo Legion 5 15IAH7H 82RB | |
| Asus TUF Gaming F15 FX507ZM | |
| Average Intel Core i7-12700H (57923 - 103202, n=63) | |
| Lenovo Legion 5 15ACH-82JU00C6GE-FL | |
| MSI Bravo 15 B5DD-010US | |
| Acer Aspire Nitro 5 AN515-55-57GF | |
| AIDA64 / FPU SinJulia | |
| Lenovo Legion 5 15ACH-82JU00C6GE-FL | |
| Lenovo Legion 5 15IAH7H 82RB | |
| Asus TUF Gaming F15 FX507ZM | |
| MSI Bravo 15 B5DD-010US | |
| Average Intel Core i7-12700H (3249 - 9939, n=64) | |
| Acer Aspire Nitro 5 AN515-55-57GF | |
| AIDA64 / FPU Mandel | |
| Lenovo Legion 5 15ACH-82JU00C6GE-FL | |
| Lenovo Legion 5 15IAH7H 82RB | |
| MSI Bravo 15 B5DD-010US | |
| Average Intel Core i7-12700H (7135 - 44760, n=64) | |
| Asus TUF Gaming F15 FX507ZM | |
| Acer Aspire Nitro 5 AN515-55-57GF | |
| AIDA64 / CPU AES | |
| Lenovo Legion 5 15IAH7H 82RB | |
| Lenovo Legion 5 15ACH-82JU00C6GE-FL | |
| MSI Bravo 15 B5DD-010US | |
| Average Intel Core i7-12700H (31839 - 144360, n=64) | |
| Asus TUF Gaming F15 FX507ZM | |
| Acer Aspire Nitro 5 AN515-55-57GF | |
| AIDA64 / CPU ZLib | |
| Asus TUF Gaming F15 FX507ZM | |
| Lenovo Legion 5 15IAH7H 82RB | |
| Average Intel Core i7-12700H (305 - 1171, n=64) | |
| Lenovo Legion 5 15ACH-82JU00C6GE-FL | |
| MSI Bravo 15 B5DD-010US | |
| Acer Aspire Nitro 5 AN515-55-57GF | |
| AIDA64 / FP64 Ray-Trace | |
| Lenovo Legion 5 15IAH7H 82RB | |
| Lenovo Legion 5 15ACH-82JU00C6GE-FL | |
| Average Intel Core i7-12700H (1437 - 9692, n=64) | |
| MSI Bravo 15 B5DD-010US | |
| Asus TUF Gaming F15 FX507ZM | |
| Acer Aspire Nitro 5 AN515-55-57GF | |
| AIDA64 / CPU PhotoWorxx | |
| Lenovo Legion 5 15IAH7H 82RB | |
| Asus TUF Gaming F15 FX507ZM | |
| Average Intel Core i7-12700H (12863 - 52207, n=64) | |
| Acer Aspire Nitro 5 AN515-55-57GF | |
| MSI Bravo 15 B5DD-010US | |
| Lenovo Legion 5 15ACH-82JU00C6GE-FL | |
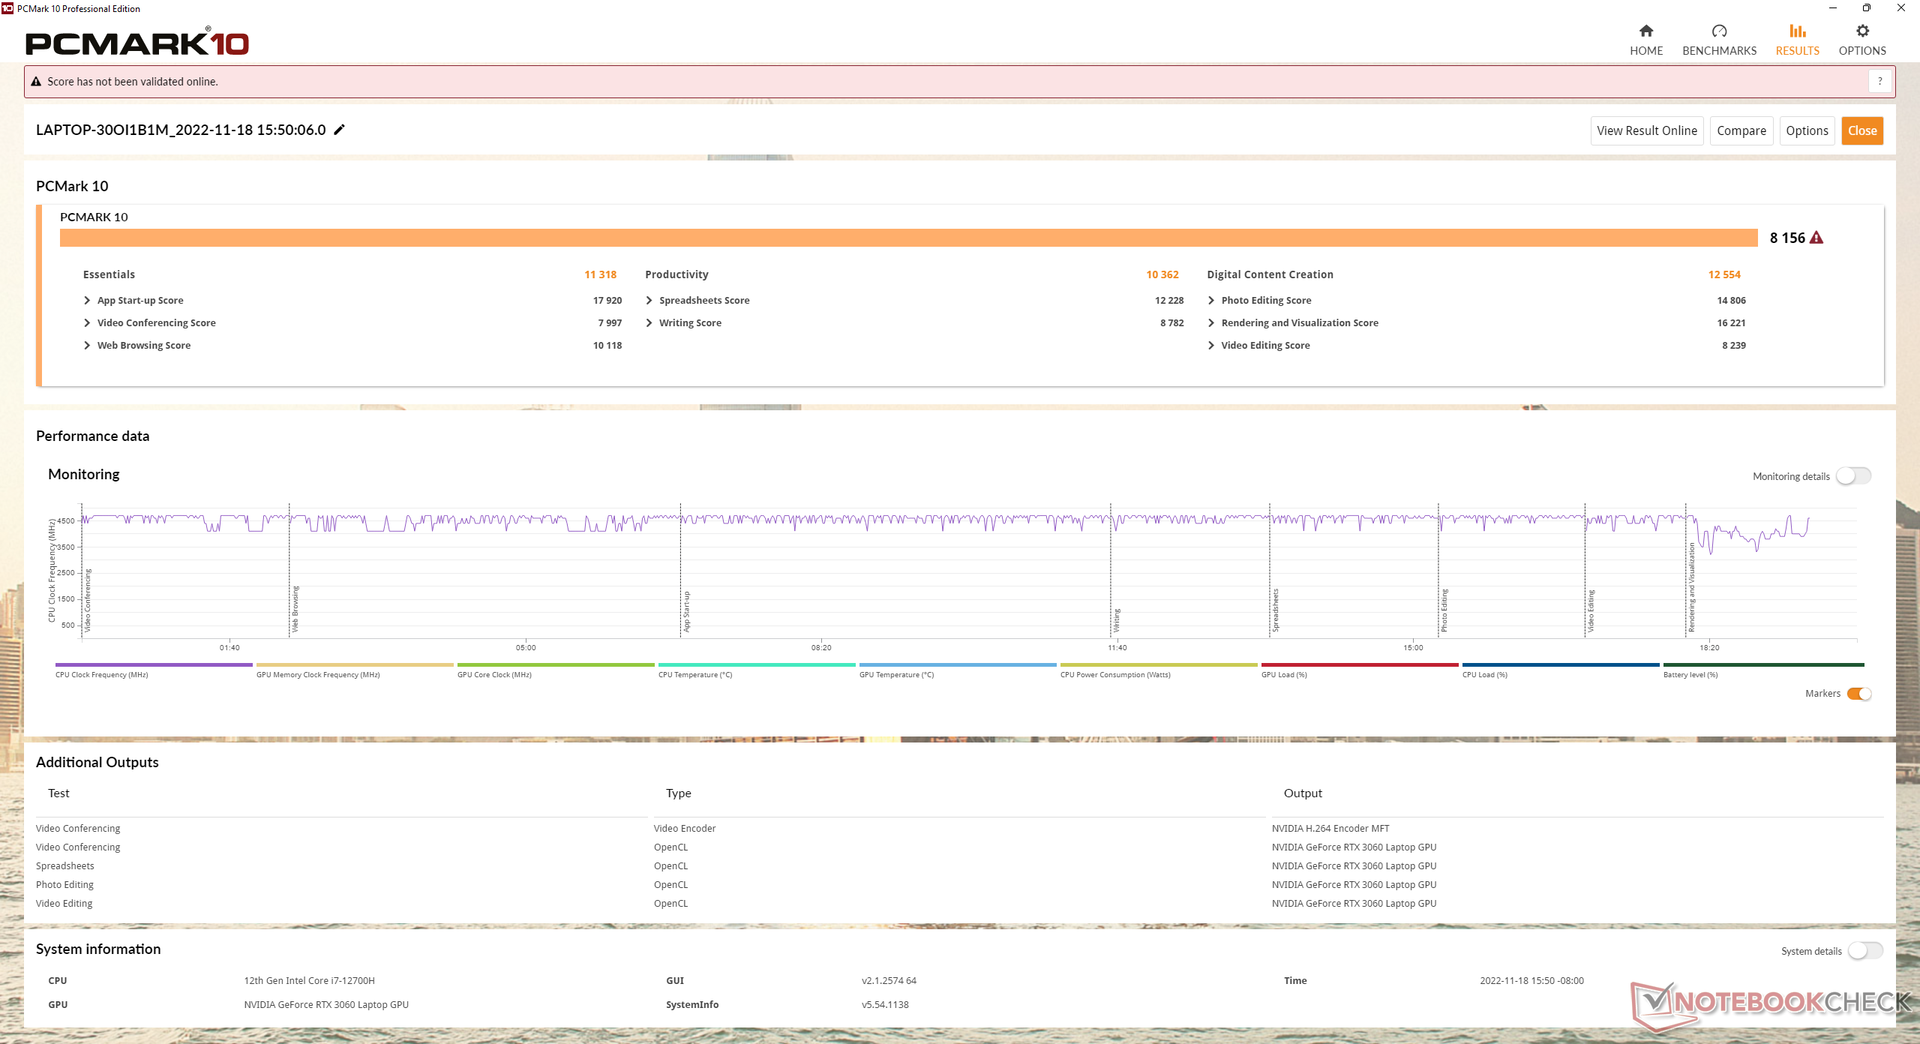
System Performance
PCMark results are consistently higher than on last year's model to be one of the highest of any laptop with the same Core i7-12700H CPU and RTX 3060 GPU. This aligns with the faster-than-average CPU and GPU performance results of our test unit.
CrossMark: Overall | Productivity | Creativity | Responsiveness
| PCMark 10 / Score | |
| Lenovo Legion 5 15IAH7H 82RB | |
| Asus TUF Gaming F15 FX507ZM | |
| Average Intel Core i7-12700H, NVIDIA GeForce RTX 3060 Laptop GPU (5986 - 8156, n=12) | |
| Lenovo Legion 5 15ACH-82JU00C6GE-FL | |
| Razer Blade 15 Base Edition 2021, i7-10750H RTX 3060 | |
| MSI Bravo 15 B5DD-010US | |
| Acer Aspire Nitro 5 AN515-55-57GF | |
| PCMark 10 / Essentials | |
| Lenovo Legion 5 15IAH7H 82RB | |
| Average Intel Core i7-12700H, NVIDIA GeForce RTX 3060 Laptop GPU (9289 - 12144, n=12) | |
| Asus TUF Gaming F15 FX507ZM | |
| Lenovo Legion 5 15ACH-82JU00C6GE-FL | |
| Razer Blade 15 Base Edition 2021, i7-10750H RTX 3060 | |
| MSI Bravo 15 B5DD-010US | |
| Acer Aspire Nitro 5 AN515-55-57GF | |
| PCMark 10 / Productivity | |
| Lenovo Legion 5 15IAH7H 82RB | |
| Lenovo Legion 5 15ACH-82JU00C6GE-FL | |
| Average Intel Core i7-12700H, NVIDIA GeForce RTX 3060 Laptop GPU (6161 - 10362, n=12) | |
| Asus TUF Gaming F15 FX507ZM | |
| MSI Bravo 15 B5DD-010US | |
| Razer Blade 15 Base Edition 2021, i7-10750H RTX 3060 | |
| Acer Aspire Nitro 5 AN515-55-57GF | |
| PCMark 10 / Digital Content Creation | |
| Lenovo Legion 5 15IAH7H 82RB | |
| Asus TUF Gaming F15 FX507ZM | |
| Average Intel Core i7-12700H, NVIDIA GeForce RTX 3060 Laptop GPU (8950 - 12554, n=12) | |
| Razer Blade 15 Base Edition 2021, i7-10750H RTX 3060 | |
| Lenovo Legion 5 15ACH-82JU00C6GE-FL | |
| MSI Bravo 15 B5DD-010US | |
| Acer Aspire Nitro 5 AN515-55-57GF | |
| CrossMark / Overall | |
| Lenovo Legion 5 15IAH7H 82RB | |
| Average Intel Core i7-12700H, NVIDIA GeForce RTX 3060 Laptop GPU (1649 - 2017, n=11) | |
| CrossMark / Productivity | |
| Lenovo Legion 5 15IAH7H 82RB | |
| Average Intel Core i7-12700H, NVIDIA GeForce RTX 3060 Laptop GPU (1536 - 1958, n=11) | |
| CrossMark / Creativity | |
| Lenovo Legion 5 15IAH7H 82RB | |
| Average Intel Core i7-12700H, NVIDIA GeForce RTX 3060 Laptop GPU (1816 - 2084, n=11) | |
| CrossMark / Responsiveness | |
| Lenovo Legion 5 15IAH7H 82RB | |
| Average Intel Core i7-12700H, NVIDIA GeForce RTX 3060 Laptop GPU (1210 - 2207, n=11) | |
| PCMark 10 Score | 8156 points | |
Help | ||
| AIDA64 / Memory Copy | |
| Average Intel Core i7-12700H (25615 - 80511, n=64) | |
| Asus TUF Gaming F15 FX507ZM | |
| Lenovo Legion 5 15IAH7H 82RB | |
| MSI Bravo 15 B5DD-010US | |
| Lenovo Legion 5 15ACH-82JU00C6GE-FL | |
| Acer Aspire Nitro 5 AN515-55-57GF | |
| AIDA64 / Memory Read | |
| Lenovo Legion 5 15IAH7H 82RB | |
| Asus TUF Gaming F15 FX507ZM | |
| Average Intel Core i7-12700H (25586 - 79442, n=64) | |
| MSI Bravo 15 B5DD-010US | |
| Lenovo Legion 5 15ACH-82JU00C6GE-FL | |
| Acer Aspire Nitro 5 AN515-55-57GF | |
| AIDA64 / Memory Write | |
| Lenovo Legion 5 15IAH7H 82RB | |
| Asus TUF Gaming F15 FX507ZM | |
| Average Intel Core i7-12700H (23679 - 88660, n=64) | |
| Acer Aspire Nitro 5 AN515-55-57GF | |
| MSI Bravo 15 B5DD-010US | |
| Lenovo Legion 5 15ACH-82JU00C6GE-FL | |
| AIDA64 / Memory Latency | |
| Lenovo Legion 5 15IAH7H 82RB | |
| Lenovo Legion 5 15ACH-82JU00C6GE-FL | |
| Average Intel Core i7-12700H (76.2 - 133.9, n=62) | |
| MSI Bravo 15 B5DD-010US | |
| Acer Aspire Nitro 5 AN515-55-57GF | |
| Asus TUF Gaming F15 FX507ZM | |
* ... smaller is better
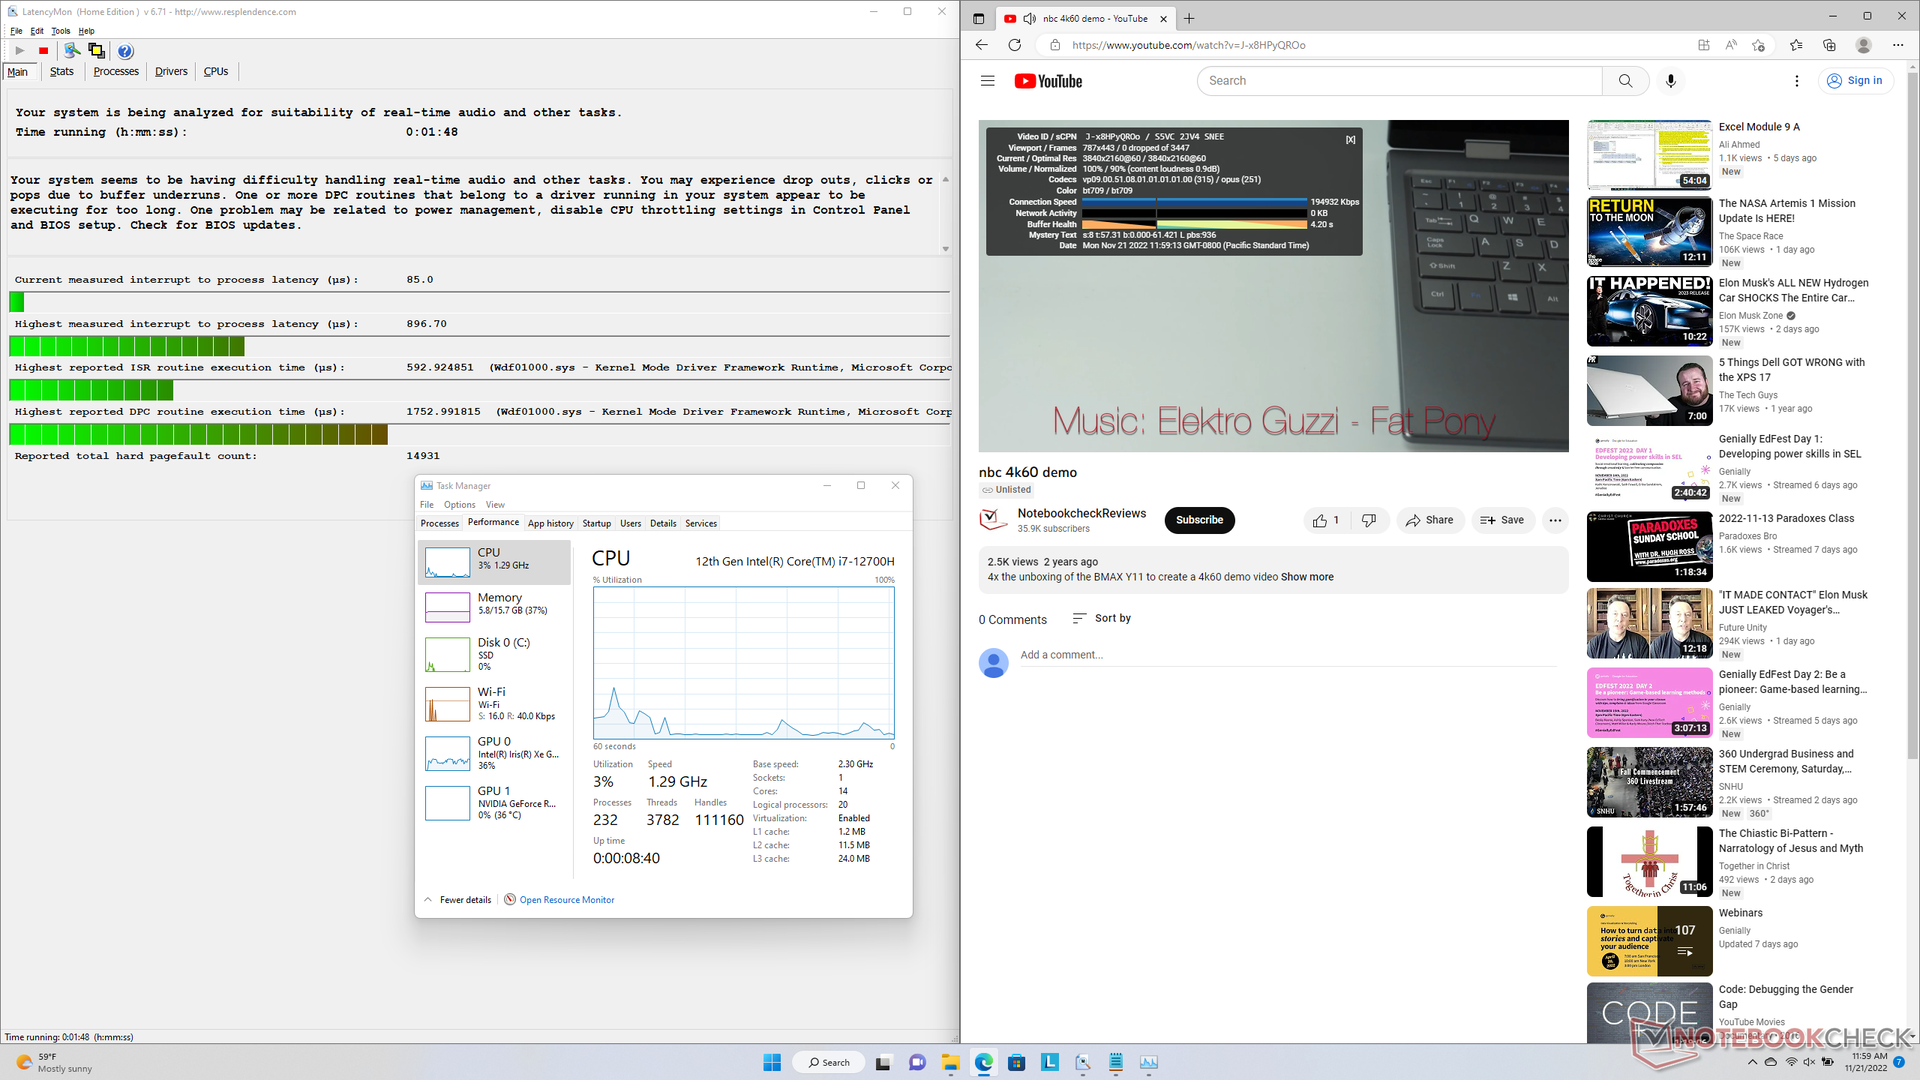
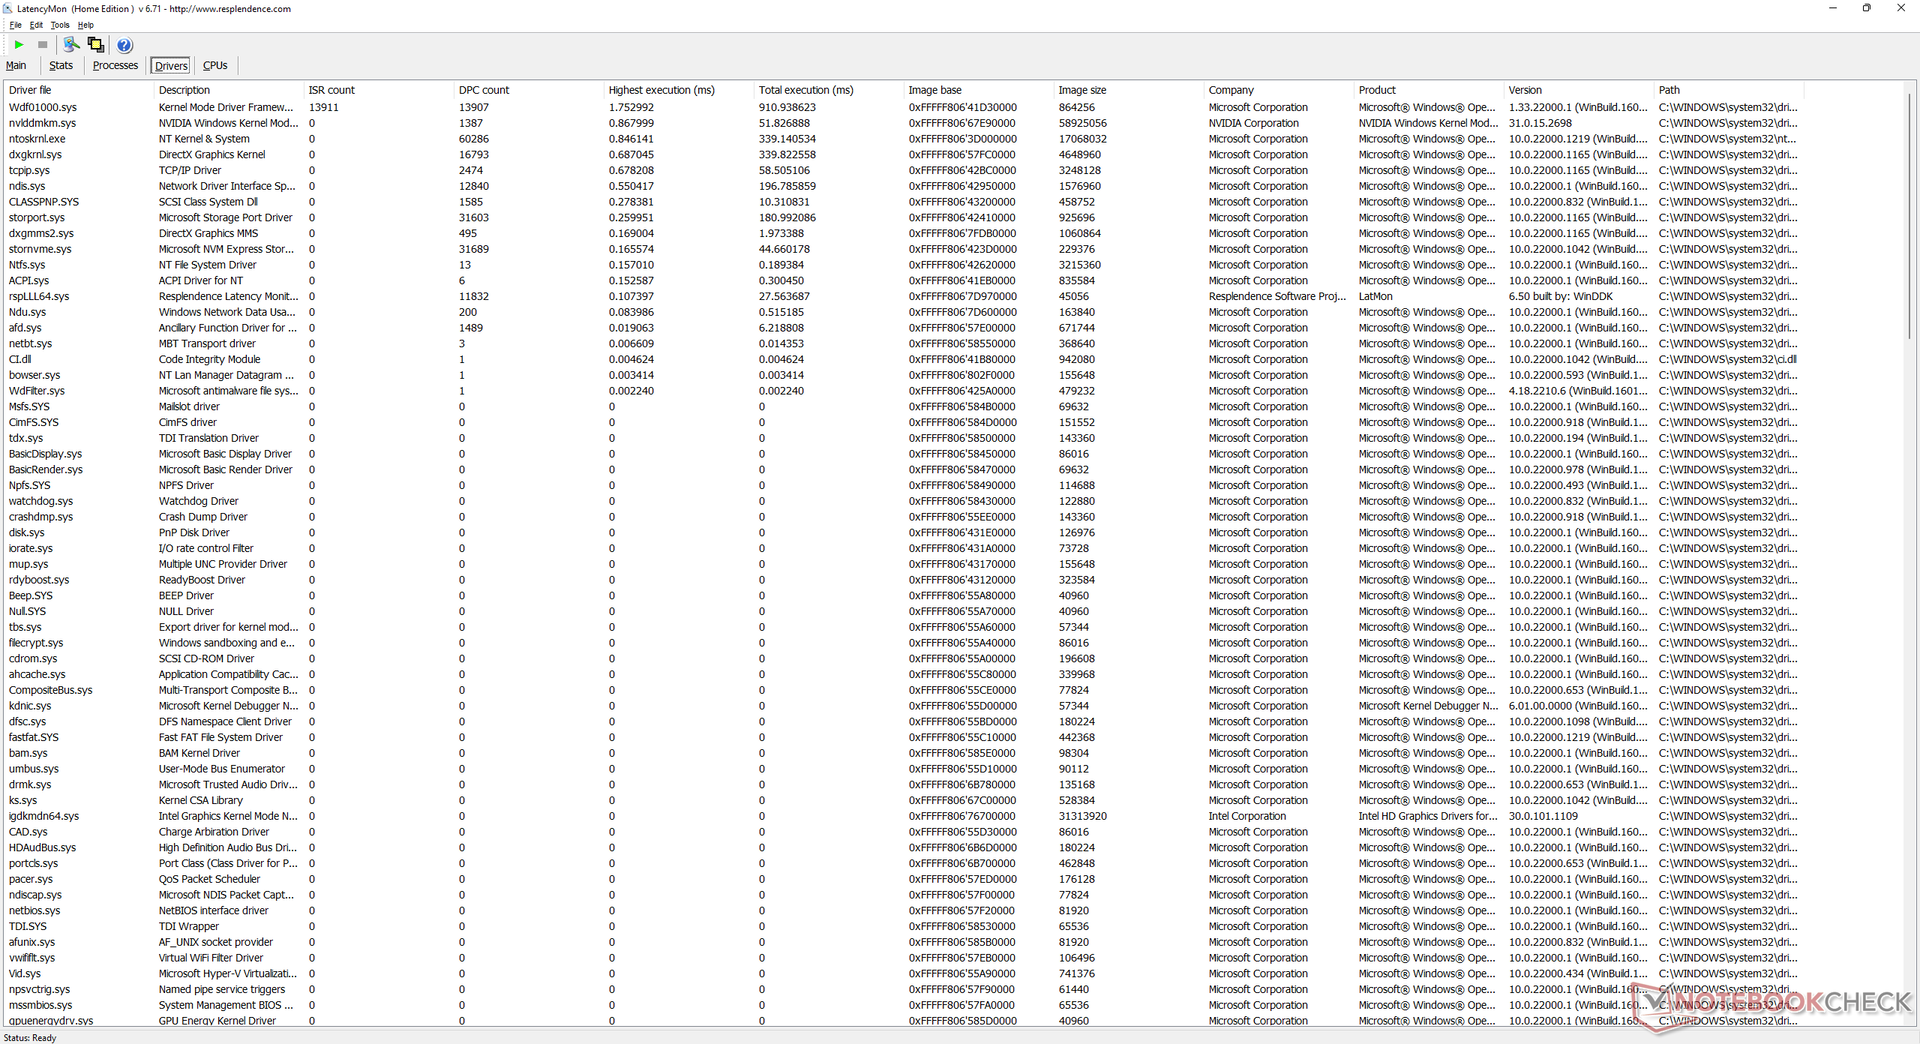
DPC Latency
LatencyMon reveals minor DPC issues when opening multiple browser tabs on our homepage. 4K video playback at 60 FPS is otherwise perfect with no dropped frames.
| DPC Latencies / LatencyMon - interrupt to process latency (max), Web, Youtube, Prime95 | |
| MSI Bravo 15 B5DD-010US | |
| Lenovo Legion 5 15IAH7H 82RB | |
| Asus TUF Gaming F15 FX507ZM | |
| Lenovo Legion 5 15ACH-82JU00C6GE-FL | |
| Razer Blade 15 Base Edition 2021, i7-10750H RTX 3060 | |
| Acer Aspire Nitro 5 AN515-55-57GF | |
* ... smaller is better
Storage Devices — 2x PCIe4 x4 Support
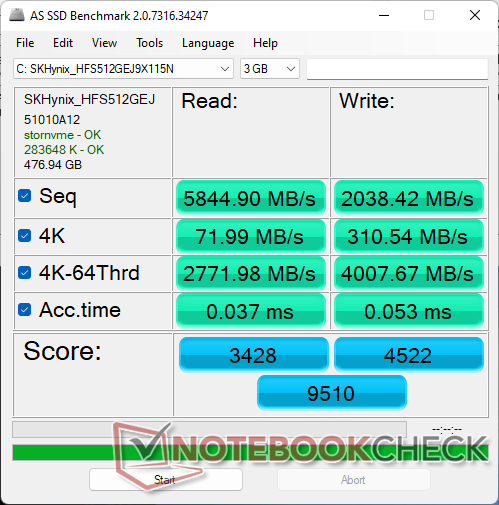
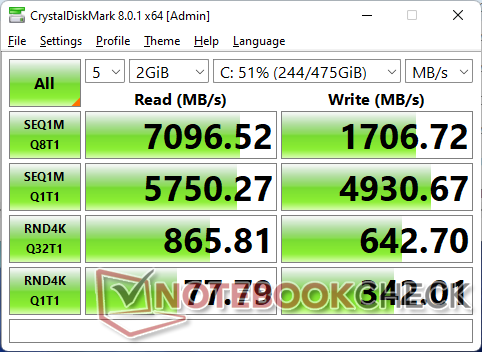
Users can install up to two M.2 2280 SSDs. Each slot includes their own thermal pad and heat spreader to aid in cooling. The 512 GB SK Hynix drive in our unit was able to maintain its maximum read rate of 7000 MB/s without any throttling issues.
If installing a second drive, be sure that it is not double-sided or else it may not fit in its slot. Our picture below shows that the BIOS battery is occupying space from a potential M.2 2280 SSD.

* ... smaller is better
Disk Throttling: DiskSpd Read Loop, Queue Depth 8
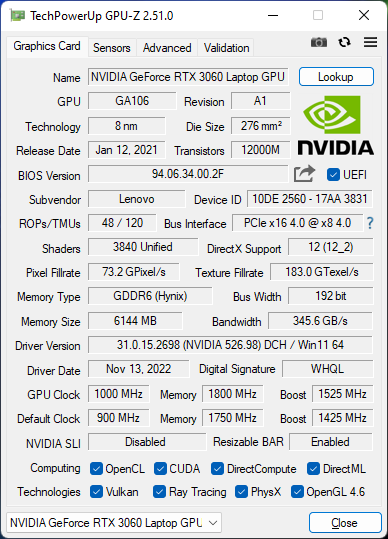
GPU Performance — High 140 W TGP
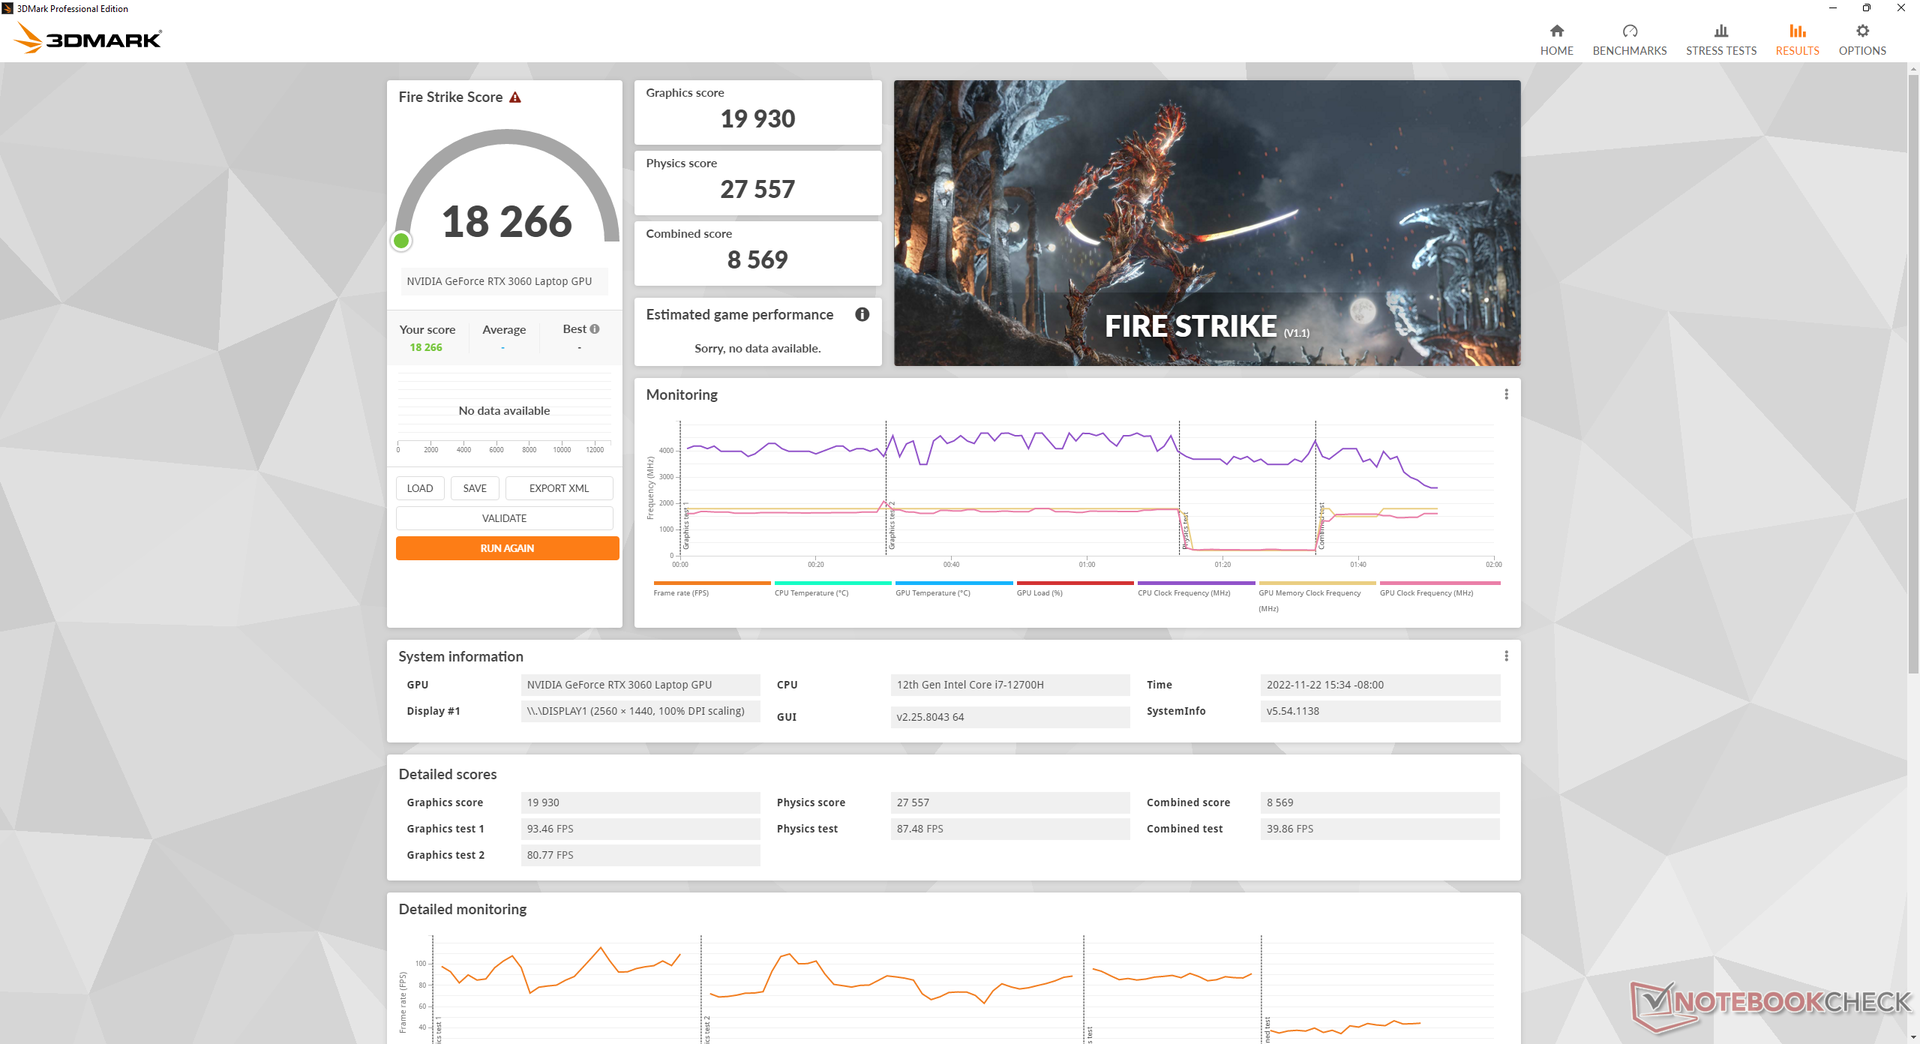
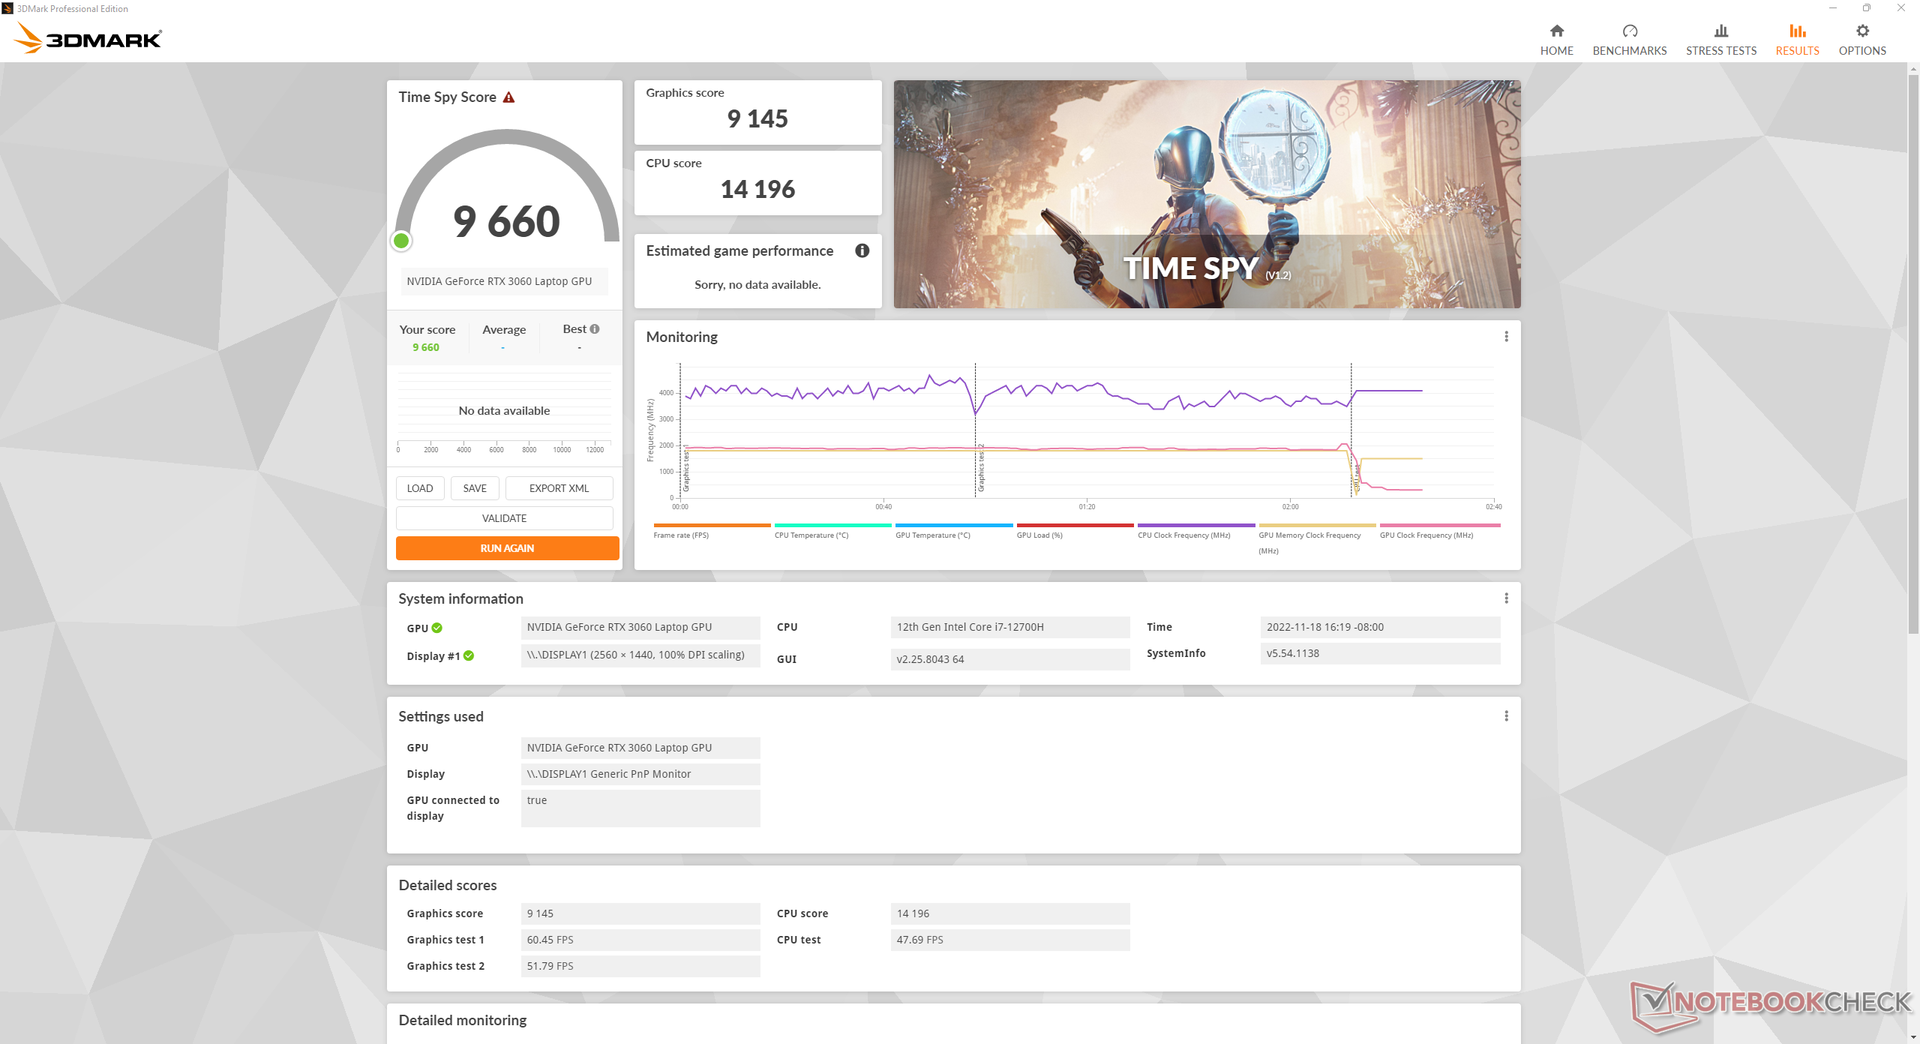
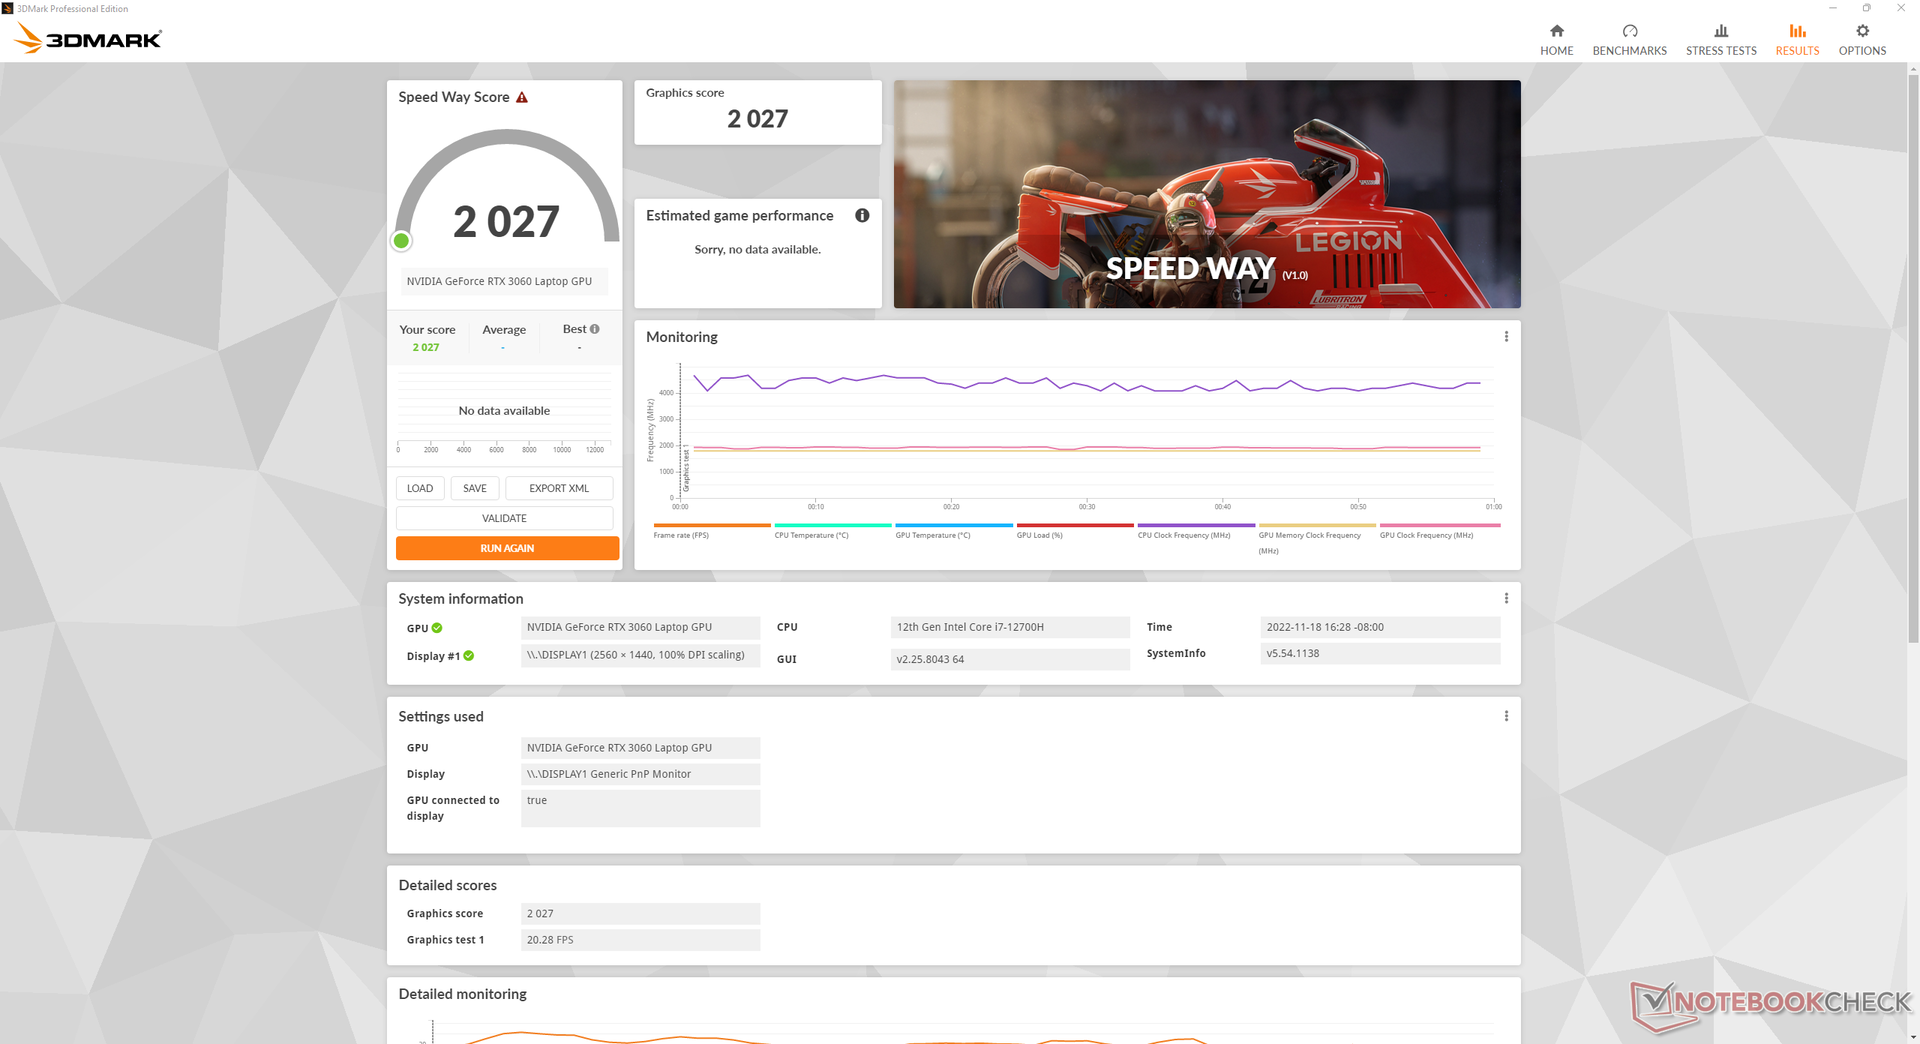
Graphics performance is excellent with 3DMark results that are 10 to 15 percent faster than the average laptop in our database equipped with the same GeForce RTX 3060 GPU. The higher-than-average performance can be partly attributed to the 140 W TGP target which is higher than on most other gaming laptops.
The system must be set to Performance mode in order to fully utilize the GPU. If running on Balanced mode, for example, graphics performance will drop by about 10 percent as shown by our Fire Strike results below.
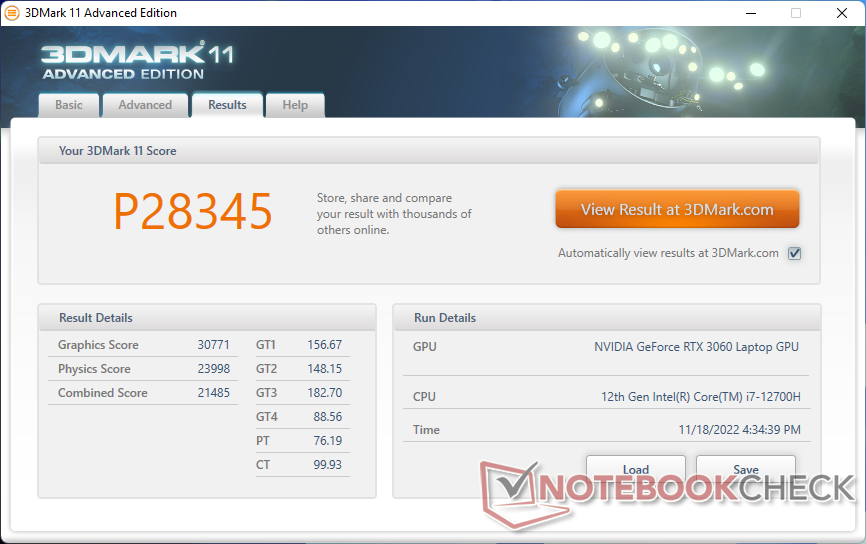

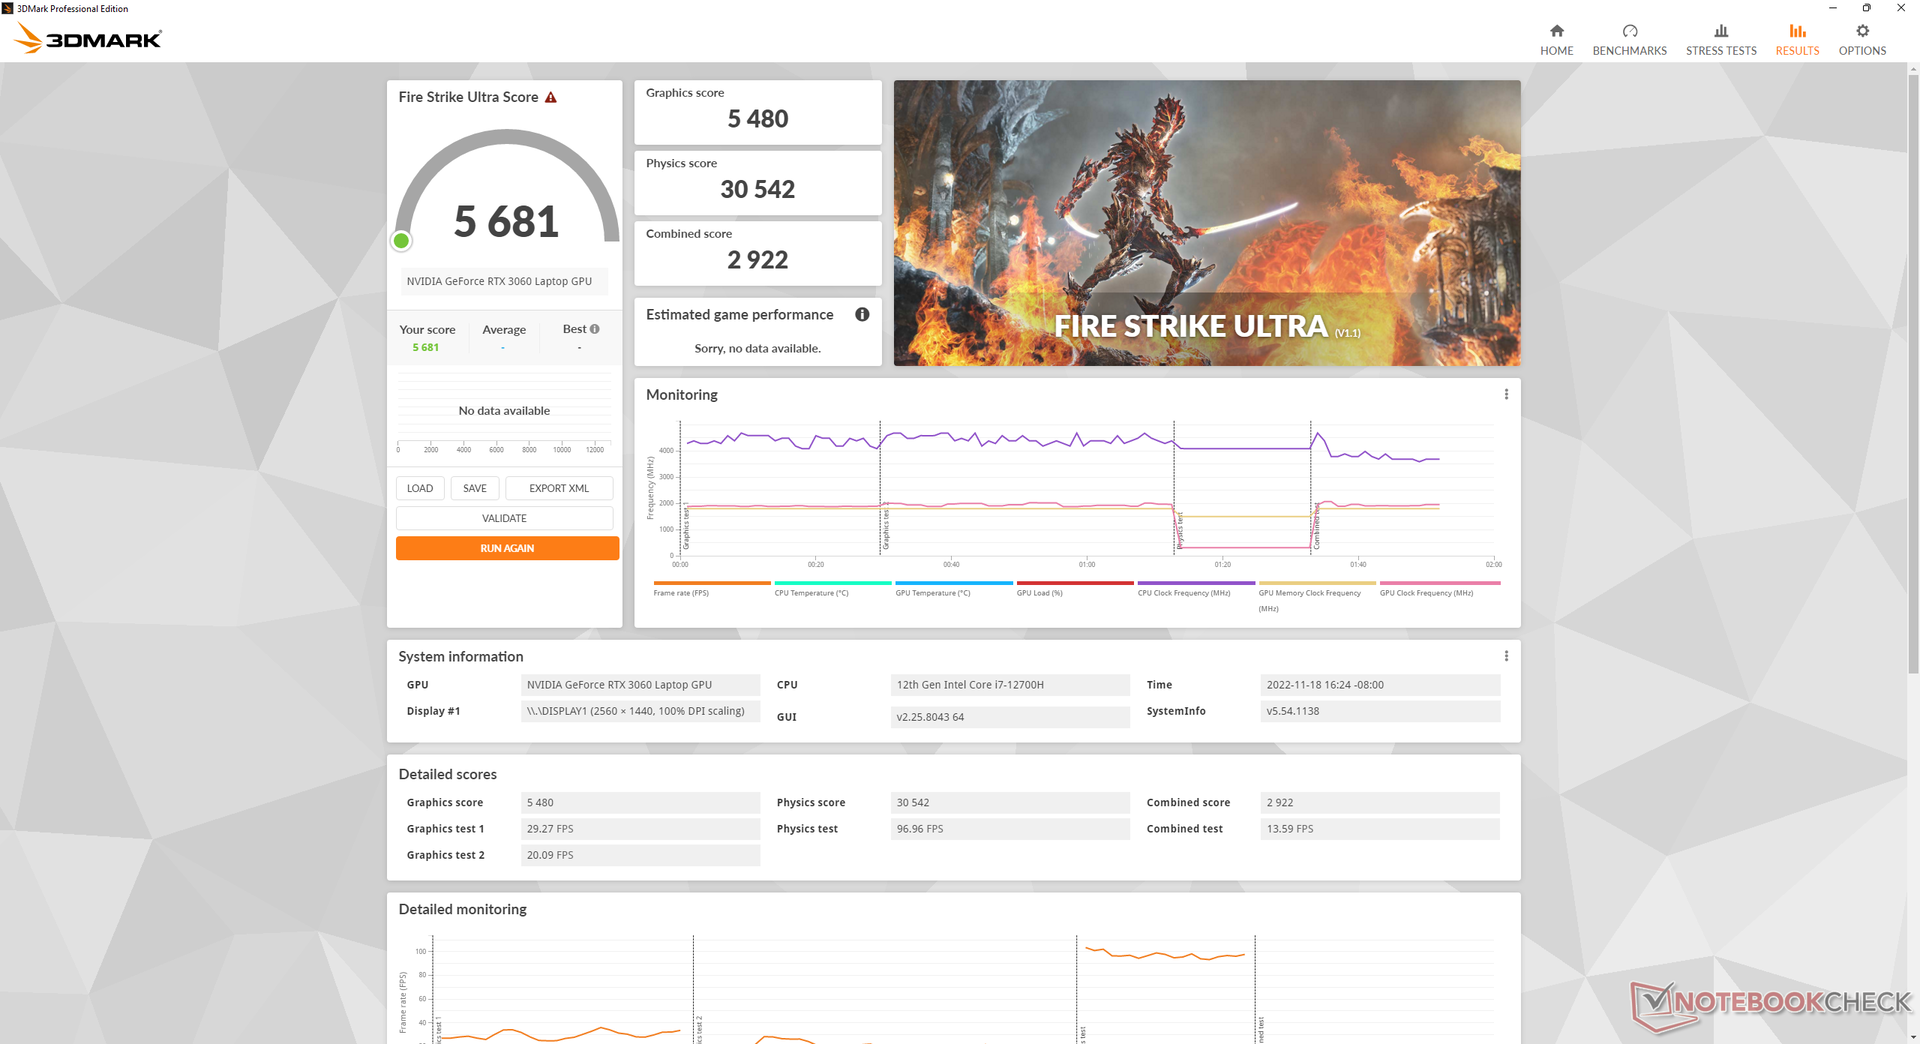
| 3DMark 11 Performance | 28345 points | |
| 3DMark Fire Strike Score | 20747 points | |
| 3DMark Time Spy Score | 9660 points | |
Help | ||
| Blender | |
| v3.3 Classroom OPTIX/RTX | |
| Average NVIDIA GeForce RTX 3060 Laptop GPU (30 - 56, n=15) | |
| Lenovo Legion 5 15IAH7H 82RB | |
| v3.3 Classroom CUDA | |
| Average NVIDIA GeForce RTX 3060 Laptop GPU (51 - 89, n=15) | |
| Lenovo Legion 5 15IAH7H 82RB | |
| v3.3 Classroom CPU | |
| Average NVIDIA GeForce RTX 3060 Laptop GPU (291 - 508, n=15) | |
| Lenovo Legion 5 15IAH7H 82RB | |
* ... smaller is better
| Performance rating - Percent | |
| Average of class Gaming | |
| Lenovo Legion 5 15IAH7H 82RB | |
| The Witcher 3 - 1920x1080 Ultra Graphics & Postprocessing (HBAO+) | |
| Average of class Gaming (104.7 - 240, n=7, last 2 years) | |
| Lenovo Legion 5 15IAH7H 82RB | |
| GTA V - 1920x1080 Highest AA:4xMSAA + FX AF:16x | |
| Average of class Gaming (67.1 - 186.9, n=90, last 2 years) | |
| Lenovo Legion 5 15IAH7H 82RB | |
| Final Fantasy XV Benchmark - 1920x1080 High Quality | |
| Average of class Gaming (64.2 - 215, n=91, last 2 years) | |
| Lenovo Legion 5 15IAH7H 82RB | |
| Strange Brigade - 1920x1080 ultra AA:ultra AF:16 | |
| Average of class Gaming (113.6 - 458, n=83, last 2 years) | |
| Lenovo Legion 5 15IAH7H 82RB | |
| Dota 2 Reborn - 1920x1080 ultra (3/3) best looking | |
| Average of class Gaming (84.8 - 252, n=104, last 2 years) | |
| Lenovo Legion 5 15IAH7H 82RB | |
| X-Plane 11.11 - 1920x1080 high (fps_test=3) | |
| Lenovo Legion 5 15IAH7H 82RB | |
| Average of class Gaming (55.5 - 148.5, n=106, last 2 years) | |
Witcher 3 FPS Chart
| low | med. | high | ultra | QHD | |
|---|---|---|---|---|---|
| GTA V (2015) | 186.8 | 183.4 | 179.4 | 109.8 | 83.6 |
| The Witcher 3 (2015) | 448.6 | 295.6 | 181.1 | 89.2 | |
| Dota 2 Reborn (2015) | 180.1 | 168.2 | 161.9 | 154.8 | |
| Final Fantasy XV Benchmark (2018) | 214 | 133.5 | 100.9 | 73.7 | |
| X-Plane 11.11 (2018) | 157.1 | 138.3 | 109.3 | ||
| Strange Brigade (2018) | 471 | 242 | 192.1 | 166.3 | 118.4 |
| Cyberpunk 2077 1.6 (2022) | 135.7 | 113.4 | 87.7 | 73.7 | 45.8 |
Emissions
System Noise
The internal fans remain quieter for longer before needing to ramp up when compared to the fans in the 2021 model. When running the first benchmark scene of 3DMark 06, for example, fan noise would top out at only 29.3 dB(A) compared to 54 dB(A) on the older model. This means that you can run low to low-medium loads like web browsing or video streaming for longer periods before the fans become audible.
Running Witcher 3 on Balanced mode would result in a fan noise level between 43 and 48 dB(A) compared to a flat 51.4 dB(A) when running on Performance mode. Thus, users must endure louder fans if they wish to fully exploit the GPU. Overall fan noise is louder than on the Razer Blade 15 Base Edition but quieter than on the Asus TUF Gaming F15 each with the same GeForce RTX 3060 GPU.
Noise level
| Idle |
| 23.5 / 23.5 / 26.8 dB(A) |
| Load |
| 29.3 / 53 dB(A) |
 | ||
30 dB silent 40 dB(A) audible 50 dB(A) loud |
||
min: | ||
| Lenovo Legion 5 15IAH7H 82RB GeForce RTX 3060 Laptop GPU, i7-12700H | Lenovo Legion 5 15ACH-82JU00C6GE-FL GeForce RTX 3060 Laptop GPU, R7 5800H, Micron 2300 512GB MTFDHBA512TDV | MSI Bravo 15 B5DD-010US Radeon RX 5500M, R5 5600H, Kingston OM8PCP3512F-AB | Asus TUF Gaming F15 FX507ZM GeForce RTX 3060 Laptop GPU, i7-12700H, SK Hynix HFM001TD3JX013N | Acer Aspire Nitro 5 AN515-55-57GF GeForce RTX 3060 Laptop GPU, i5-10300H, WDC PC SN530 SDBPNPZ-512G | Razer Blade 15 Base Edition 2021, i7-10750H RTX 3060 GeForce RTX 3060 Laptop GPU, i7-10750H, Samsung SSD PM981a MZVLB512HBJQ | |
|---|---|---|---|---|---|---|
| Noise | -21% | -12% | -5% | -15% | -6% | |
| off / environment * (dB) | 23.3 | 24.2 -4% | 24.5 -5% | 23.2 -0% | 25 -7% | 25.3 -9% |
| Idle Minimum * (dB) | 23.5 | 29 -23% | 24.5 -4% | 23.6 -0% | 25 -6% | 25.4 -8% |
| Idle Average * (dB) | 23.5 | 29 -23% | 32.8 -40% | 23.6 -0% | 30 -28% | 25.4 -8% |
| Idle Maximum * (dB) | 26.8 | 29 -8% | 32.8 -22% | 25.4 5% | 33 -23% | 25.4 5% |
| Load Average * (dB) | 29.3 | 53.5 -83% | 34.5 -18% | 38 -30% | 46 -57% | 42.5 -45% |
| Witcher 3 ultra * (dB) | 51.4 | 53.5 -4% | 42.5 17% | 54.1 -5% | 47 9% | 42 18% |
| Load Maximum * (dB) | 53 | 53.5 -1% | 58.5 -10% | 57.2 -8% | 50 6% | 52.2 2% |
* ... smaller is better
Temperature
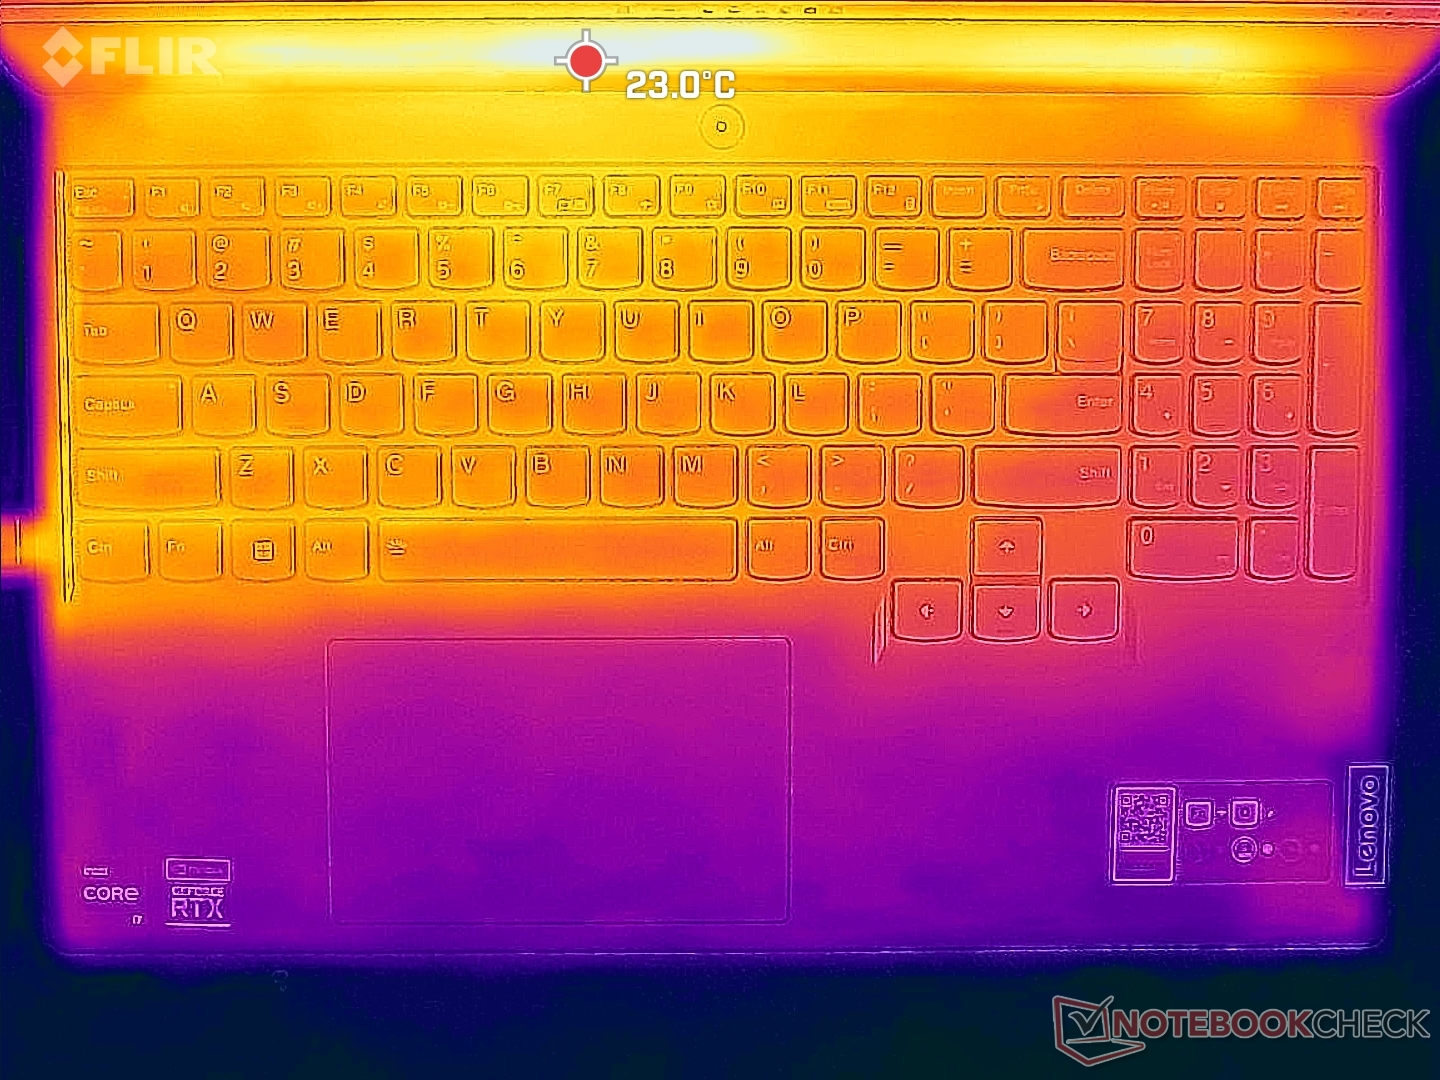
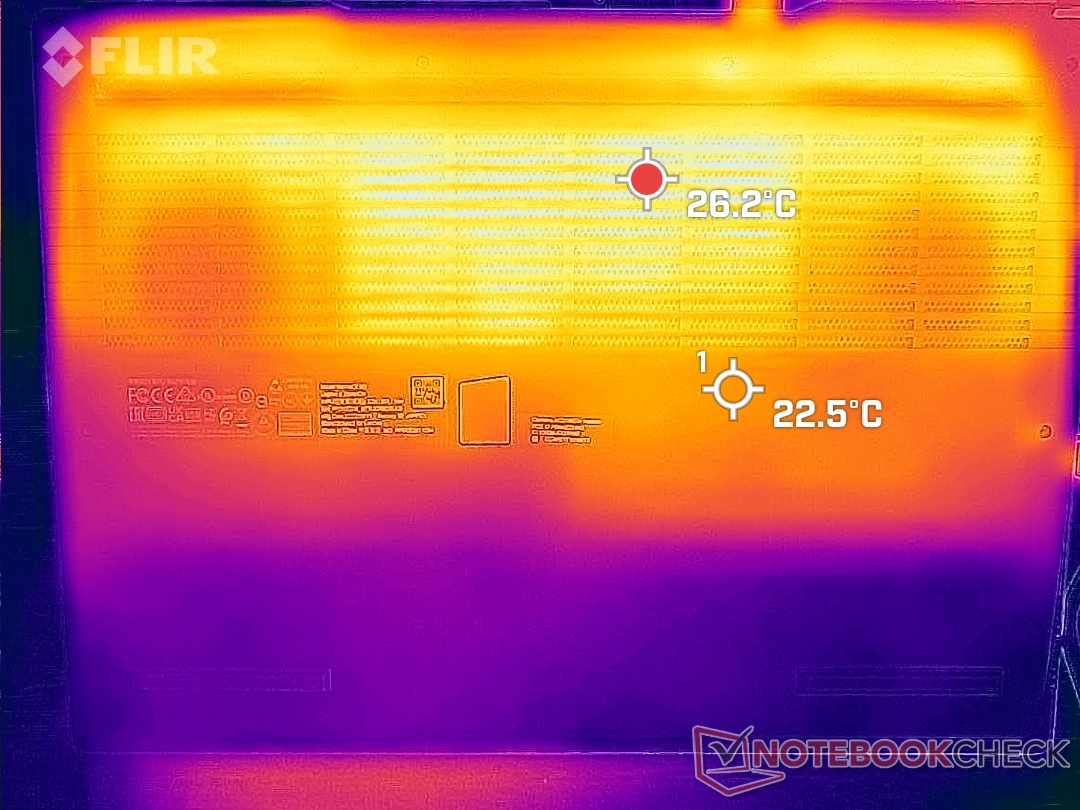
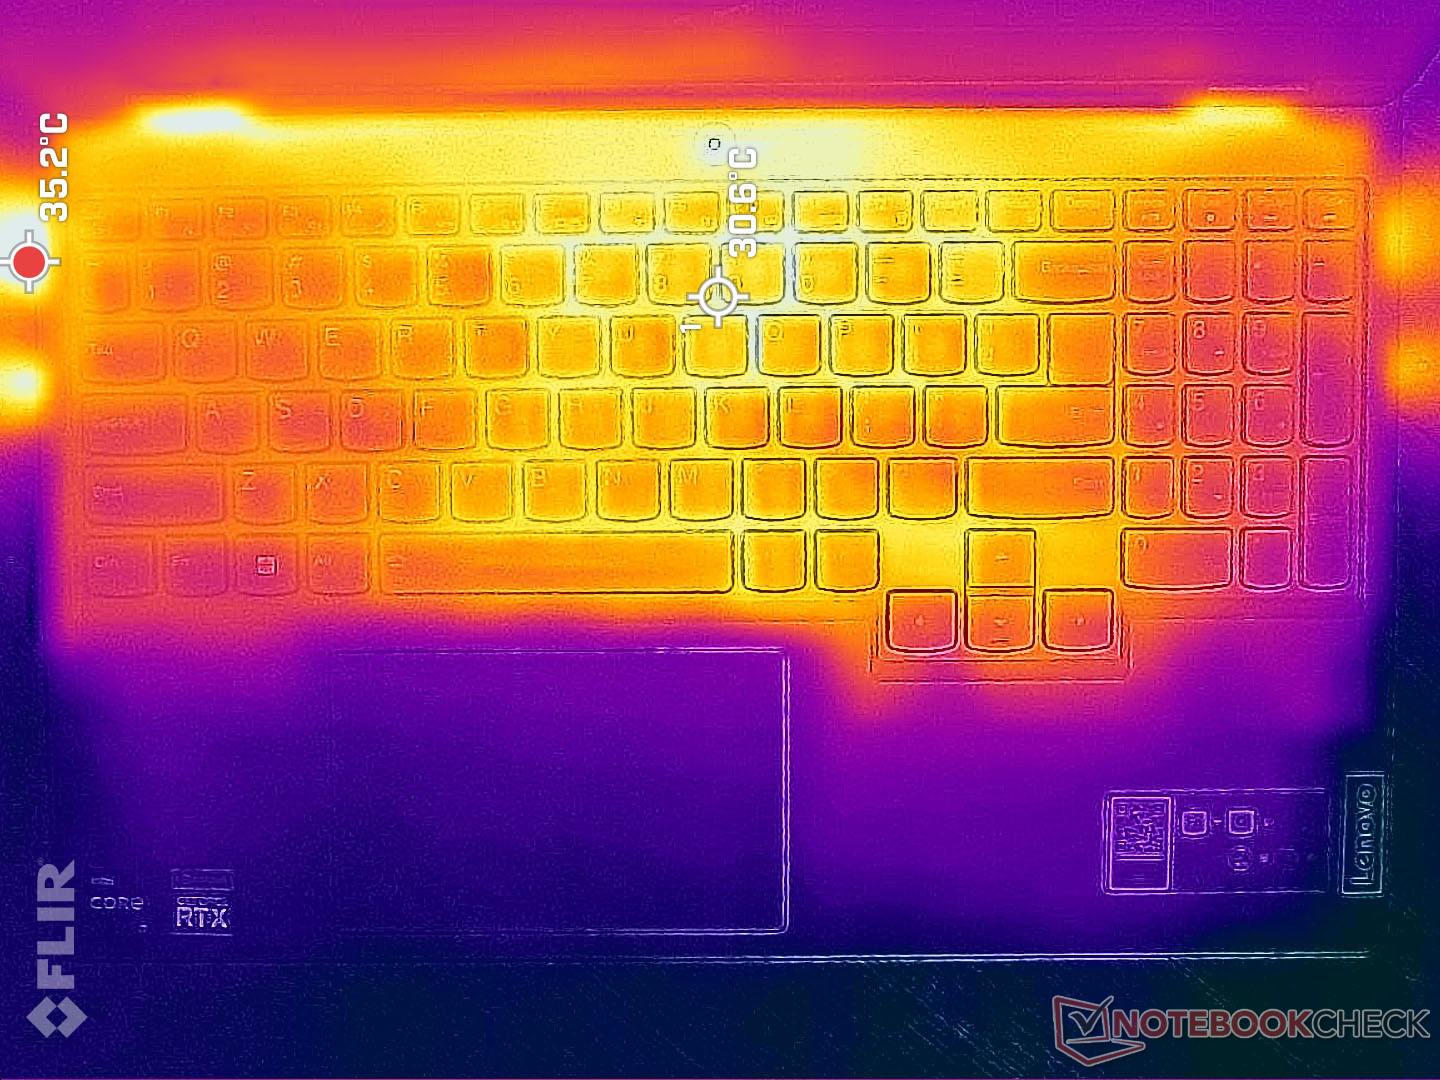
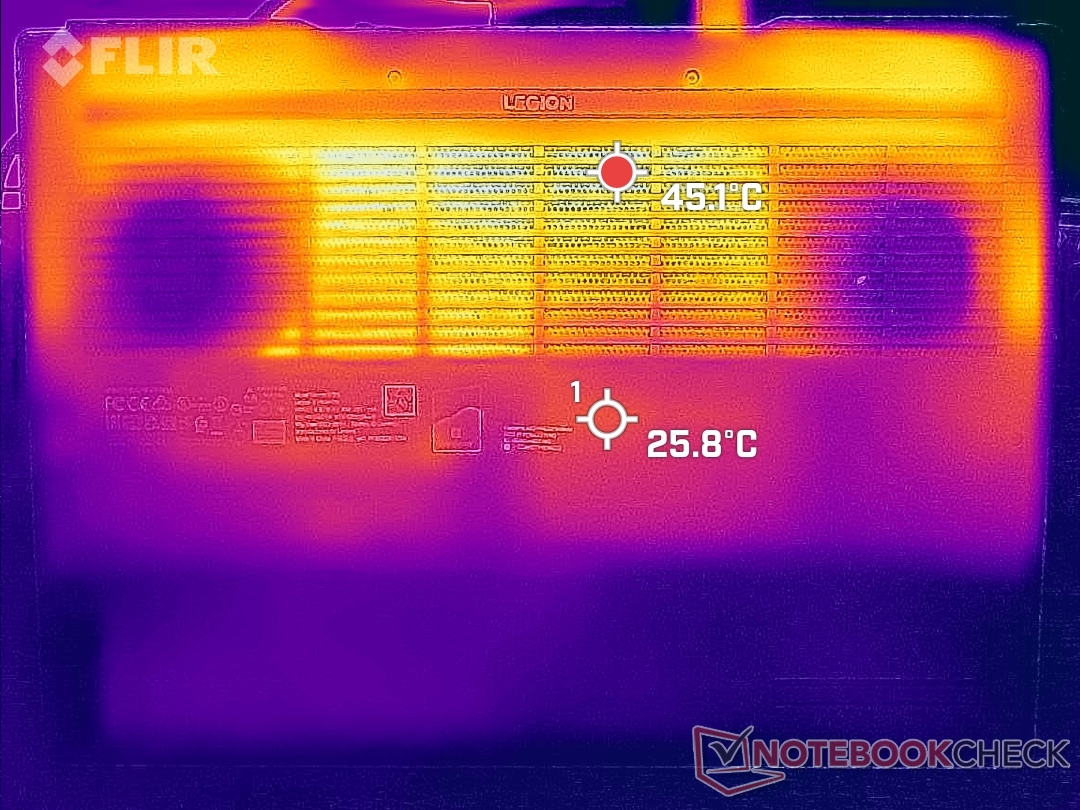
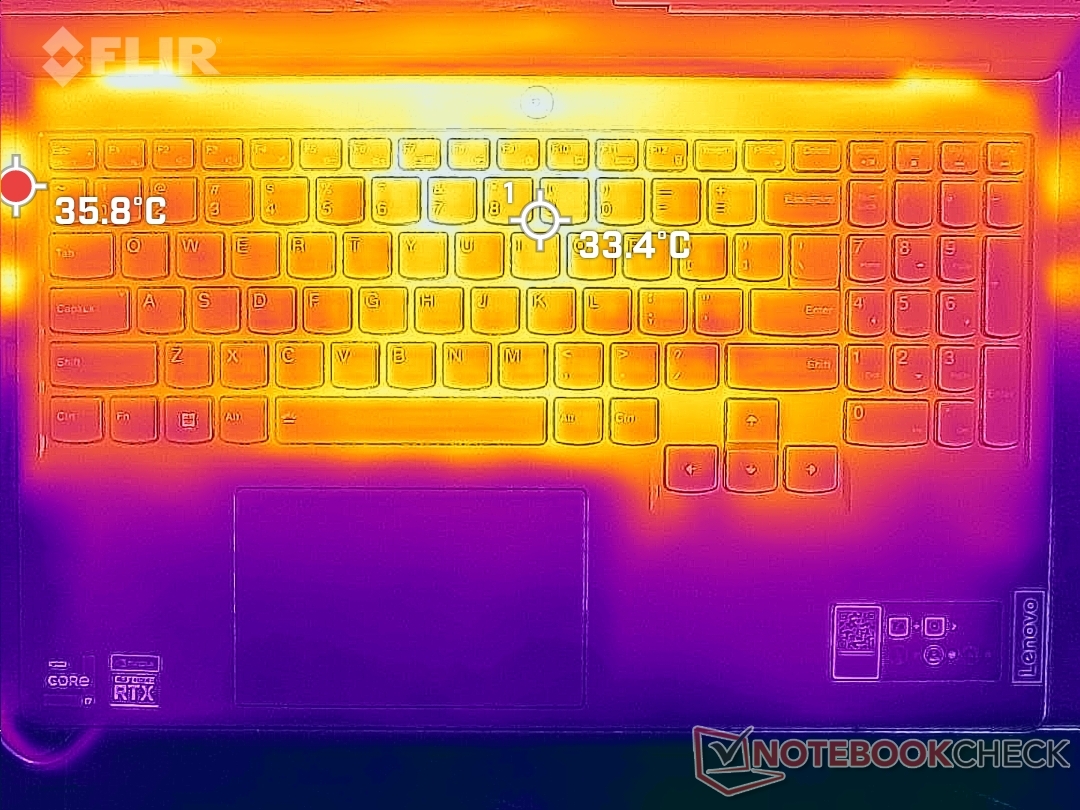
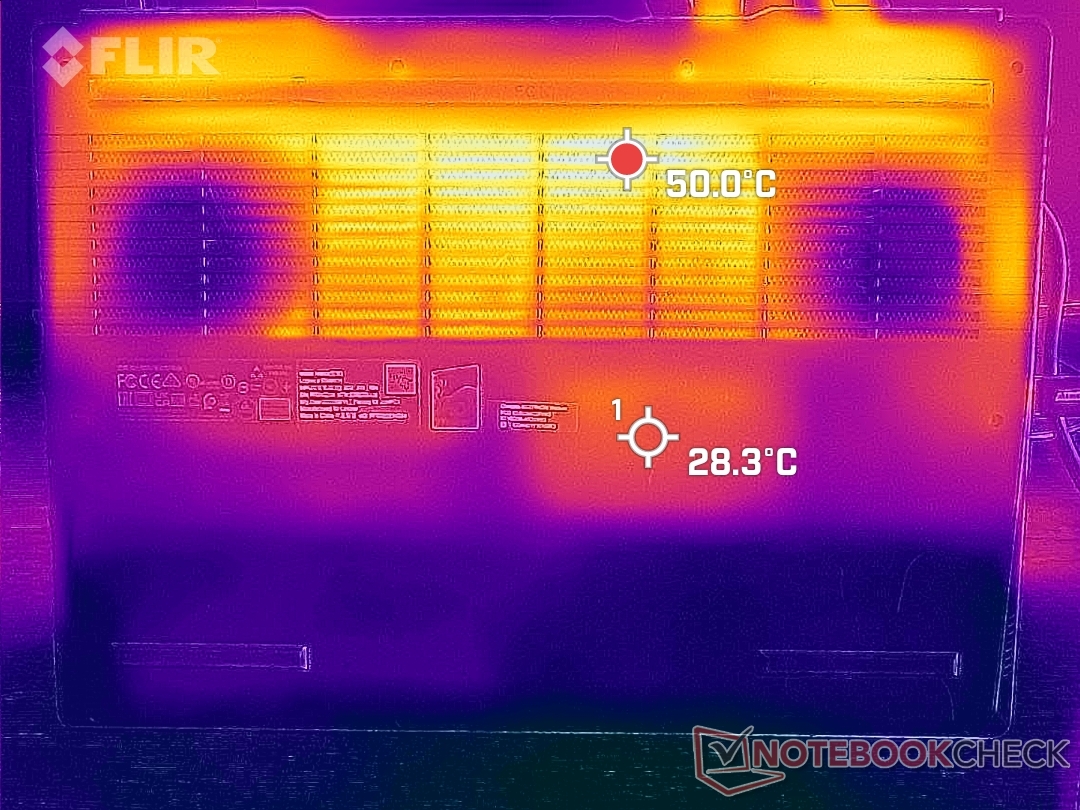
Surface temperatures are much warmer on the bottom where hot spots can reach over 50 C compared to only 36 C on the top when running demanding loads. This is nonetheless an improvement over last year's model where temperatures can reach over 40 C on most of the keyboard when gaming.
The hot spots are toward the rear edge of the chassis where skin contact is unlikely. There are ventilation grilles on nearly half of the chassis surface and so users should be careful to not block any airflow.
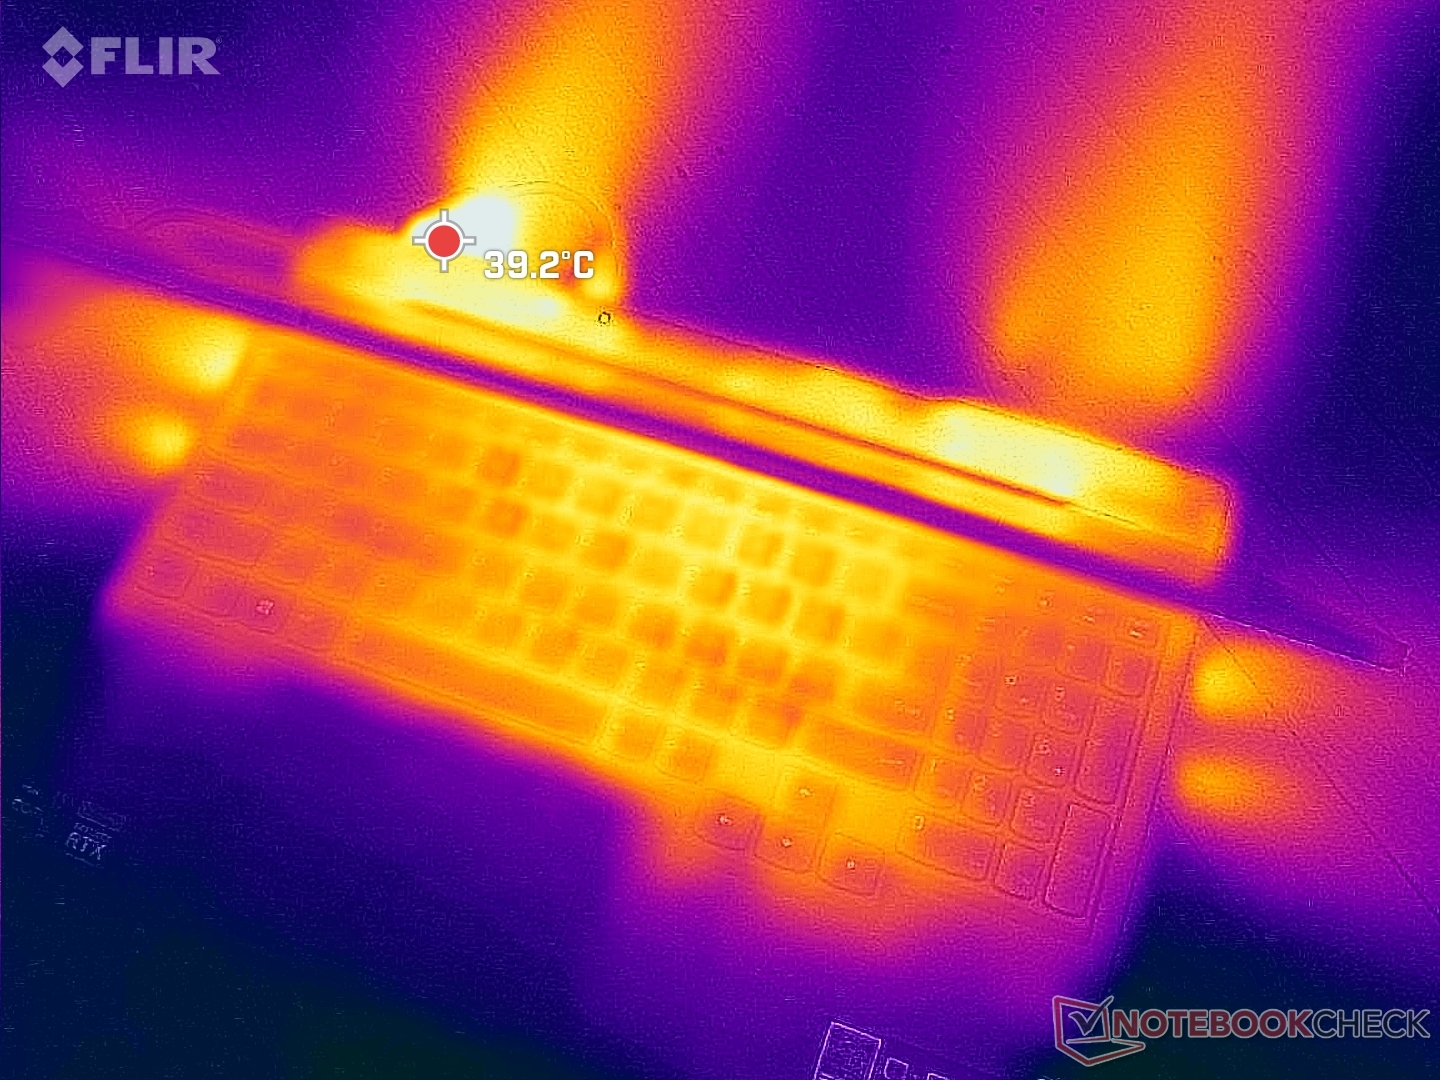
(+) The maximum temperature on the upper side is 37.8 °C / 100 F, compared to the average of 40.4 °C / 105 F, ranging from 21.2 to 68.8 °C for the class Gaming.
(-) The bottom heats up to a maximum of 51 °C / 124 F, compared to the average of 43.2 °C / 110 F
(+) In idle usage, the average temperature for the upper side is 23.8 °C / 75 F, compared to the device average of 33.9 °C / 93 F.
(+) Playing The Witcher 3, the average temperature for the upper side is 27.3 °C / 81 F, compared to the device average of 33.9 °C / 93 F.
(+) The palmrests and touchpad are cooler than skin temperature with a maximum of 23.8 °C / 74.8 F and are therefore cool to the touch.
(+) The average temperature of the palmrest area of similar devices was 28.8 °C / 83.8 F (+5 °C / 9 F).
| Lenovo Legion 5 15IAH7H 82RB Intel Core i7-12700H, NVIDIA GeForce RTX 3060 Laptop GPU | Lenovo Legion 5 15ACH-82JU00C6GE-FL AMD Ryzen 7 5800H, NVIDIA GeForce RTX 3060 Laptop GPU | MSI Bravo 15 B5DD-010US AMD Ryzen 5 5600H, AMD Radeon RX 5500M | Asus TUF Gaming F15 FX507ZM Intel Core i7-12700H, NVIDIA GeForce RTX 3060 Laptop GPU | Acer Aspire Nitro 5 AN515-55-57GF Intel Core i5-10300H, NVIDIA GeForce RTX 3060 Laptop GPU | Razer Blade 15 Base Edition 2021, i7-10750H RTX 3060 Intel Core i7-10750H, NVIDIA GeForce RTX 3060 Laptop GPU | |
|---|---|---|---|---|---|---|
| Heat | 0% | -20% | -25% | -6% | -19% | |
| Maximum Upper Side * (°C) | 37.8 | 42.6 -13% | 52.2 -38% | 44.4 -17% | 49 -30% | 45.2 -20% |
| Maximum Bottom * (°C) | 51 | 52.2 -2% | 48.6 5% | 48.8 4% | 51 -0% | 48 6% |
| Idle Upper Side * (°C) | 25.8 | 24.9 3% | 38 -47% | 37.8 -47% | 26 -1% | 34.4 -33% |
| Idle Bottom * (°C) | 28.8 | 25.3 12% | 28.4 1% | 39.6 -38% | 27 6% | 37.2 -29% |
* ... smaller is better
Stress Test
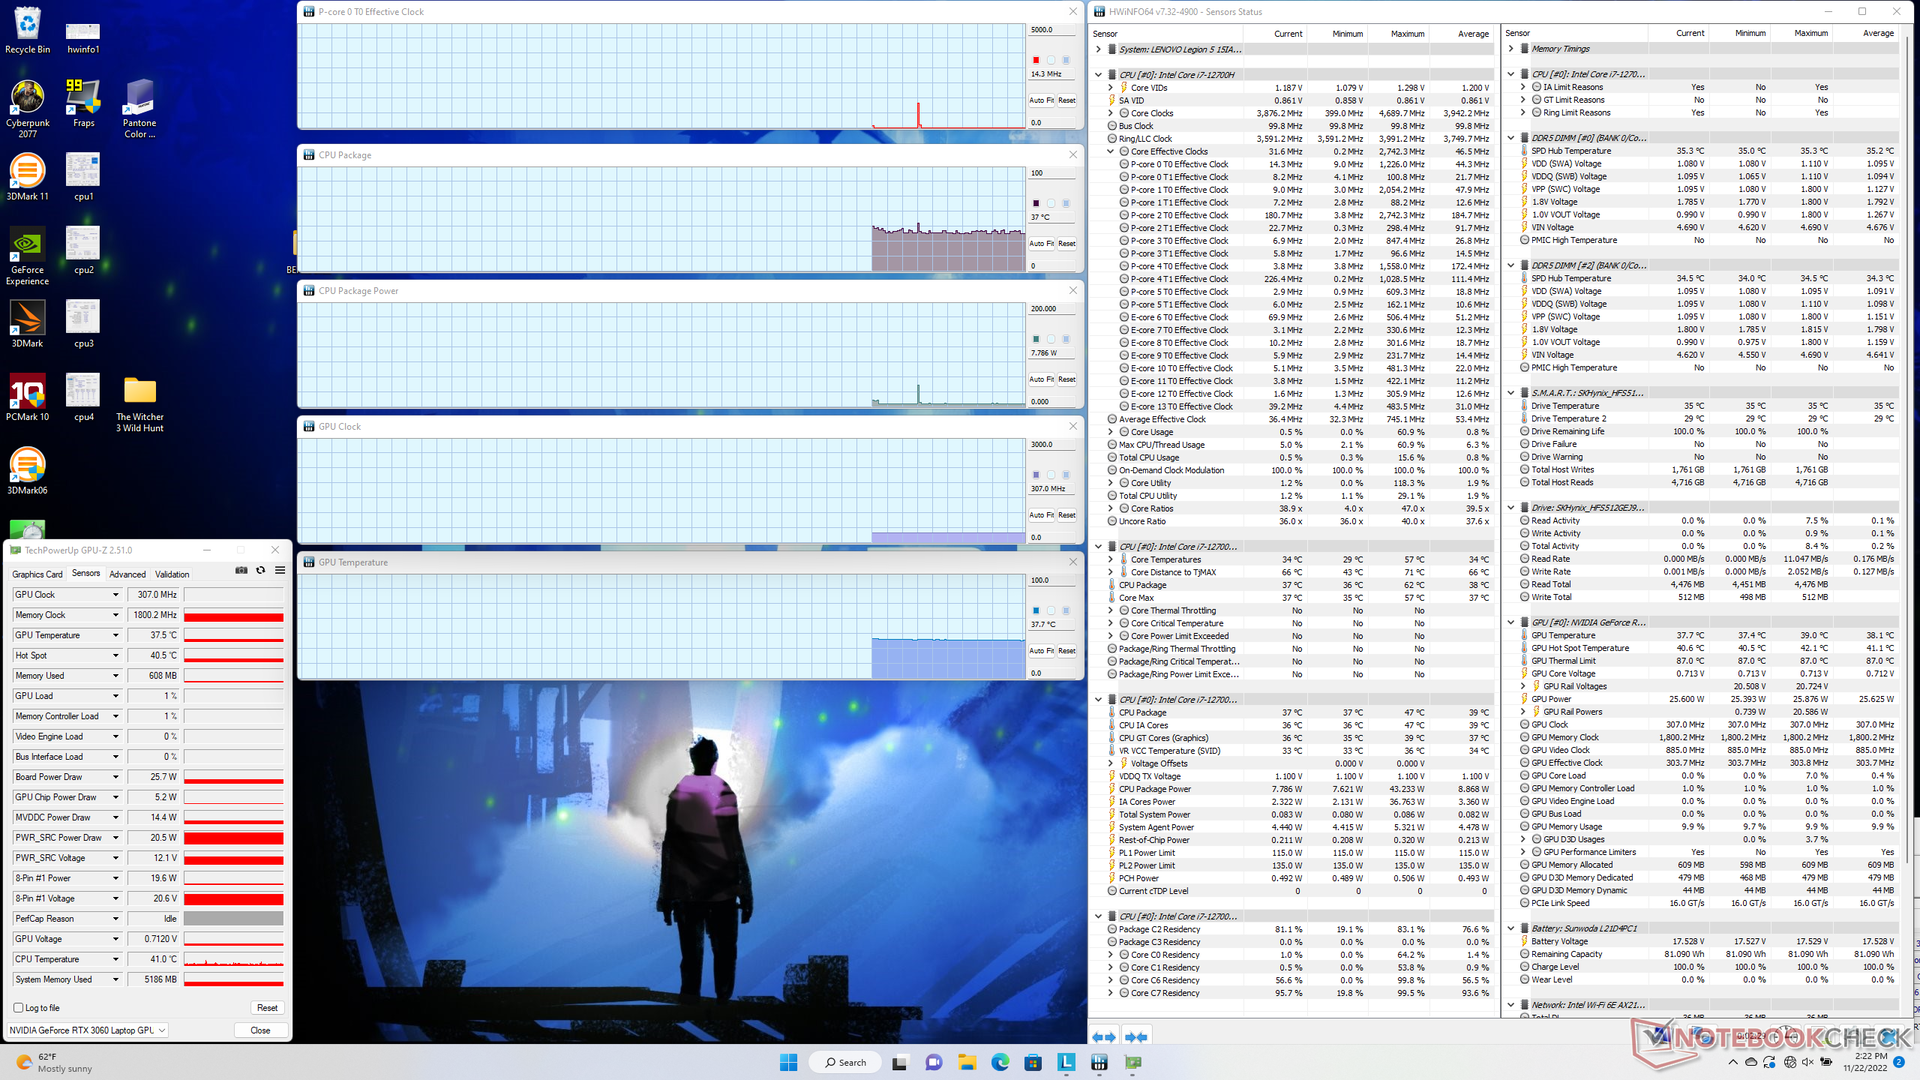
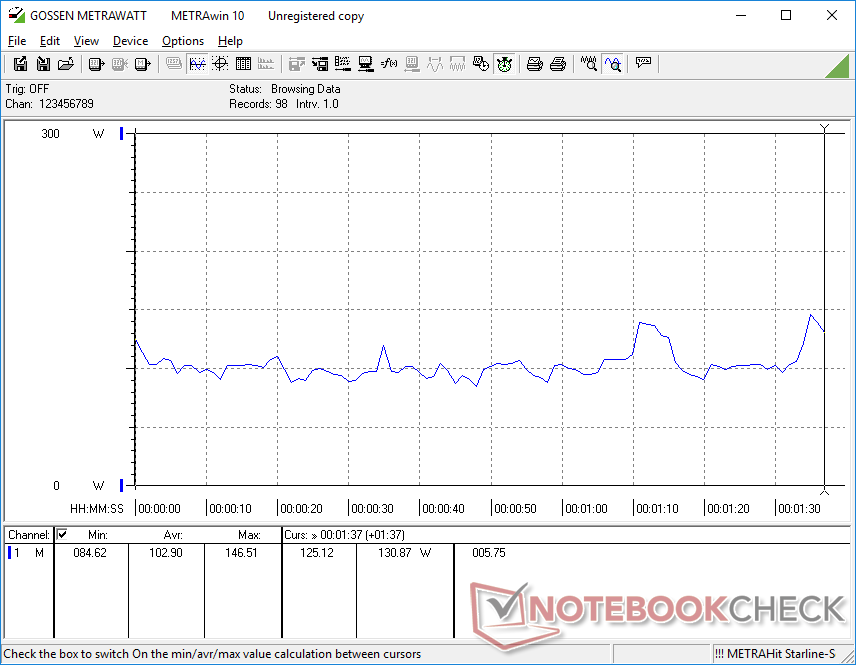
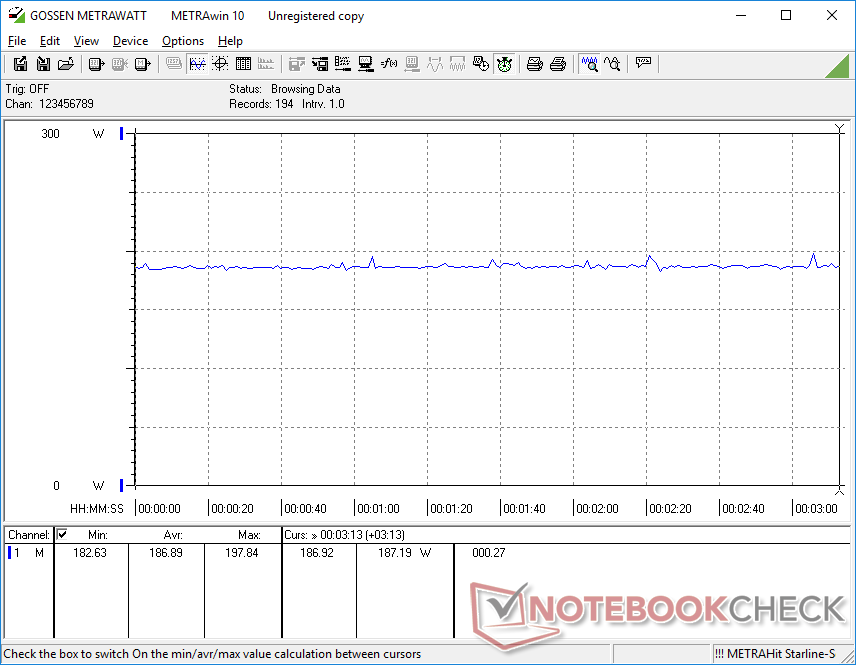
When running Prime95 to stress the CPU, clock rates and board power draw would spike to 4.1 GHz and 110 W, respectively, lasting for about a minute or so. The CPU would then stabilize at 3.6 GHz, 101 W, and 97 C thereafter. The very warm core temperature suggests that the processor is pushing the limits of the cooling solution more than on other gaming laptops to squeeze additional performance. The HP Envy 16 with the same Core i7-12700H CPU, for example, would stabilize at just 2.1 GHz and 66 C when under similar testing conditions in comparison.
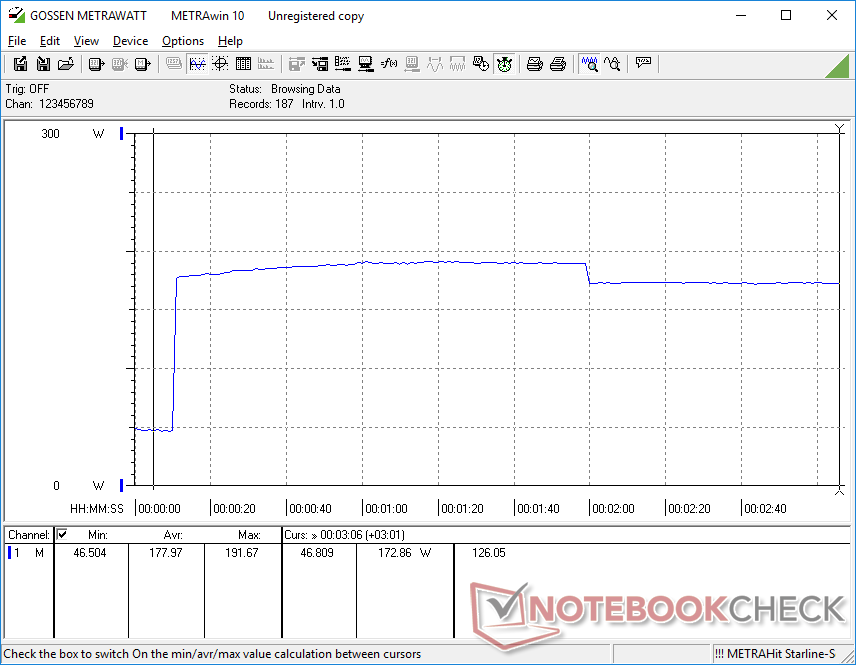
Running Witcher 3 on Performance mode to represent typical gaming loads would cause the Nvidia GPU to stabilize at 1972 MHz, 134 W board power draw, and 76 C. If on Balanced mode, the GPU would instead stabilize at 1665 MHz, 95 W, and 70 C for a 10 percent performance deficit as detailed in our GPU Performance section above. Users must therefore enable Performance mode through the Vantage software if they want to exploit the GPU to its fullest.
Running on battery power limits performance. A Fire Strike test on batteries would return Physics and Graphics scores of 23698 and 12906 points, respectively, compared to 30779 and 22257 points when on mains.
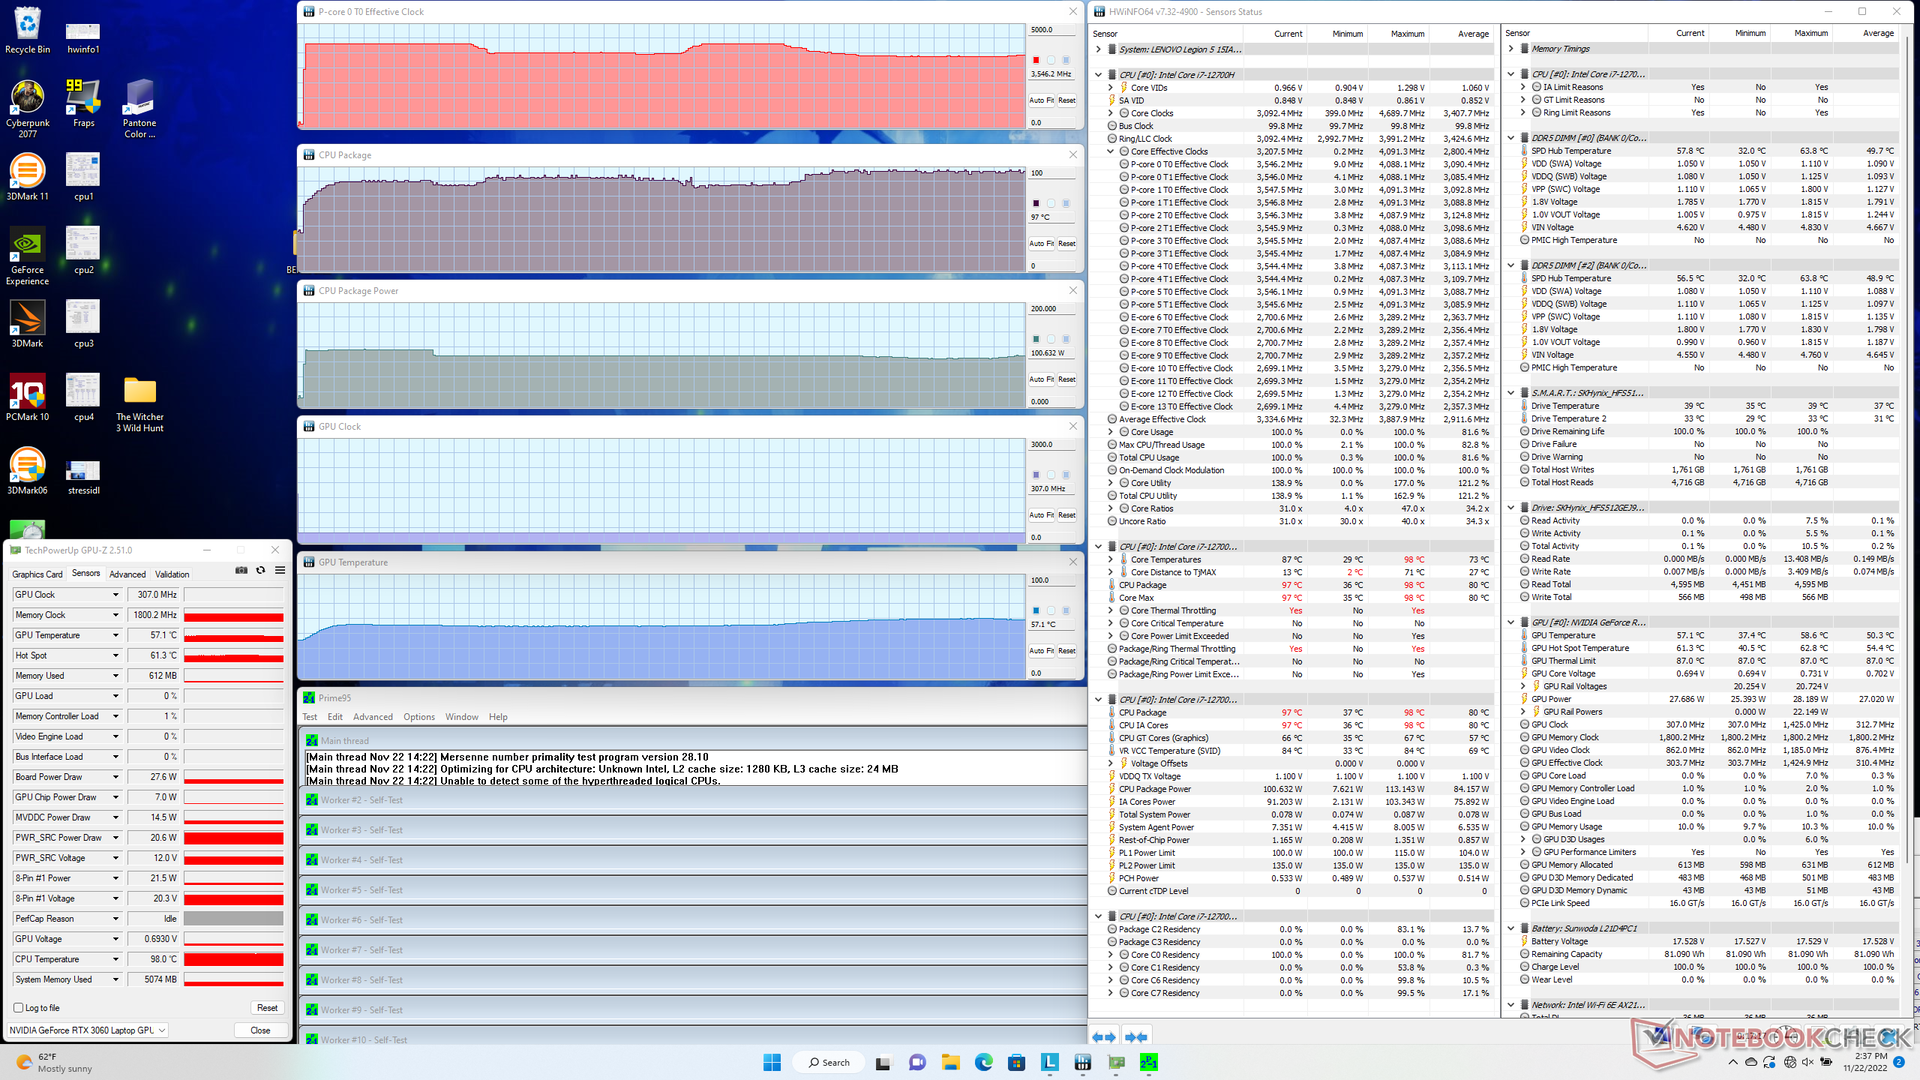
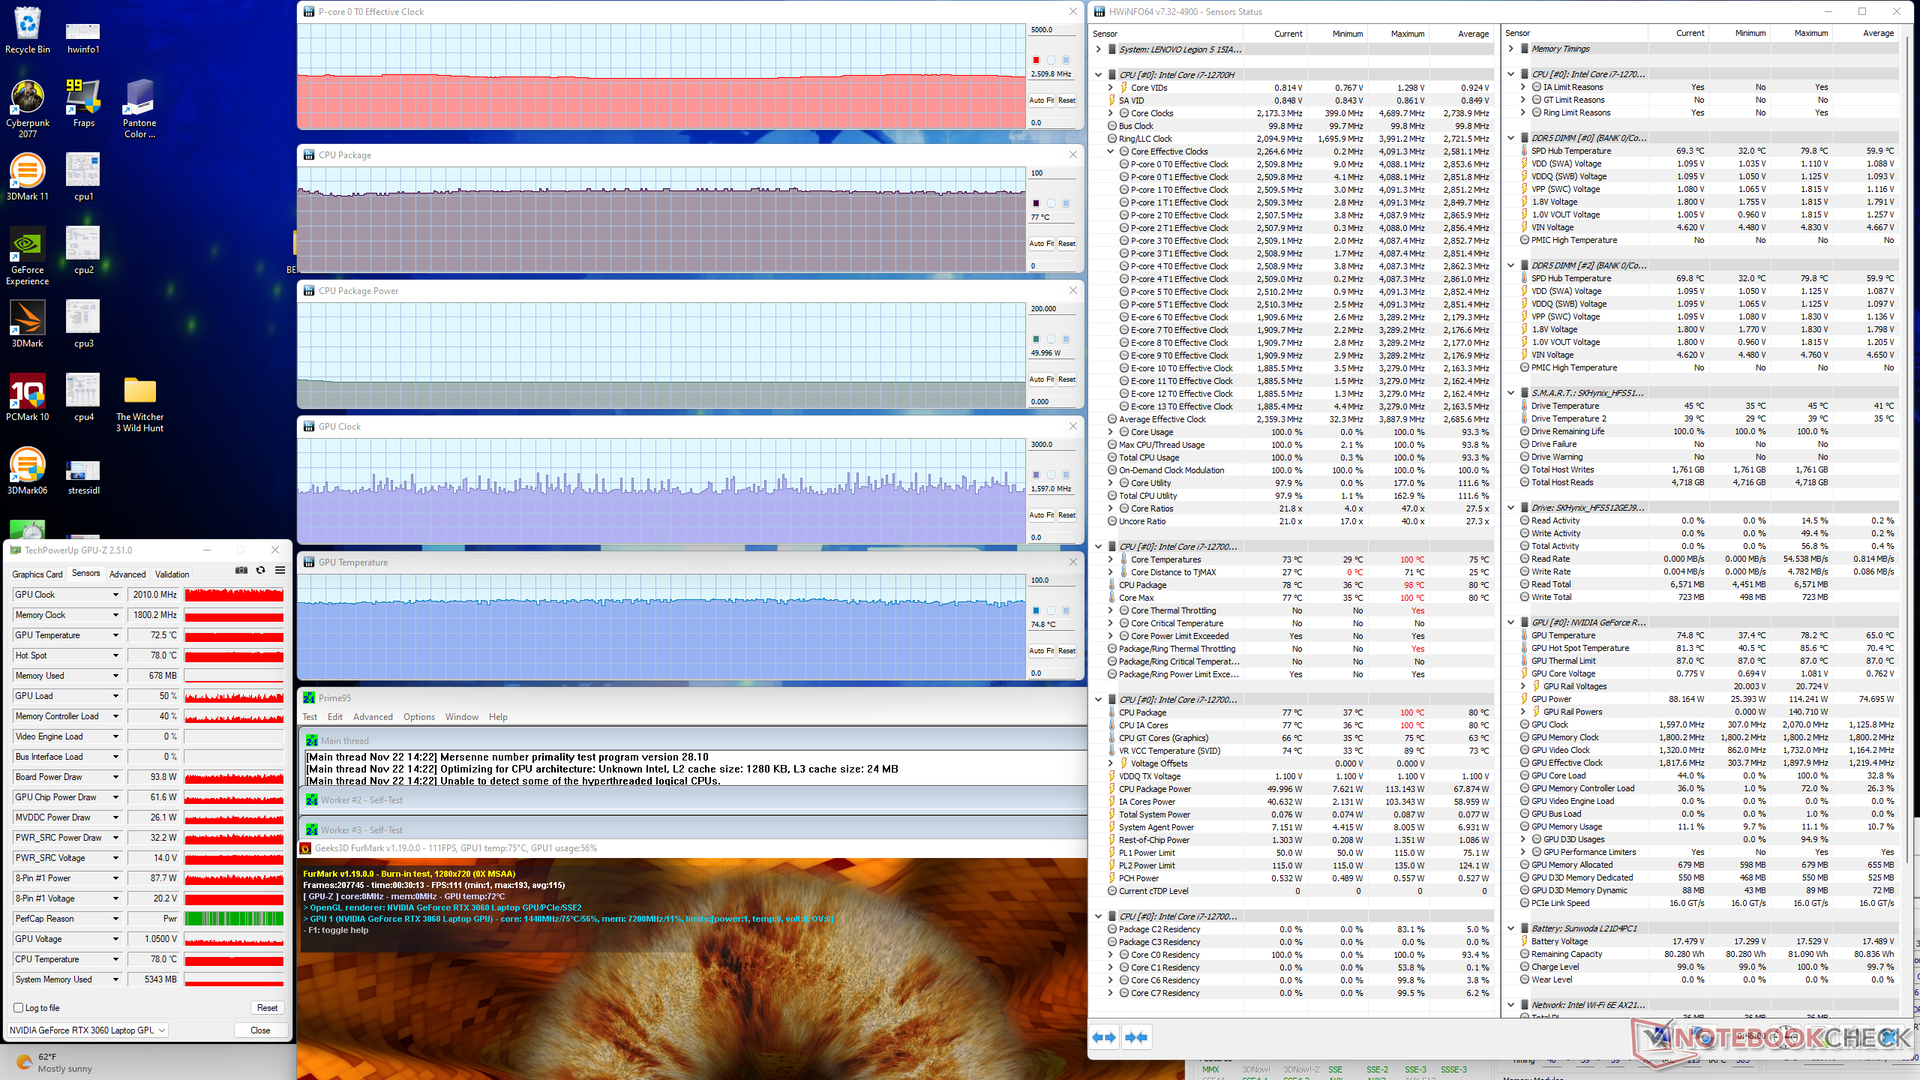
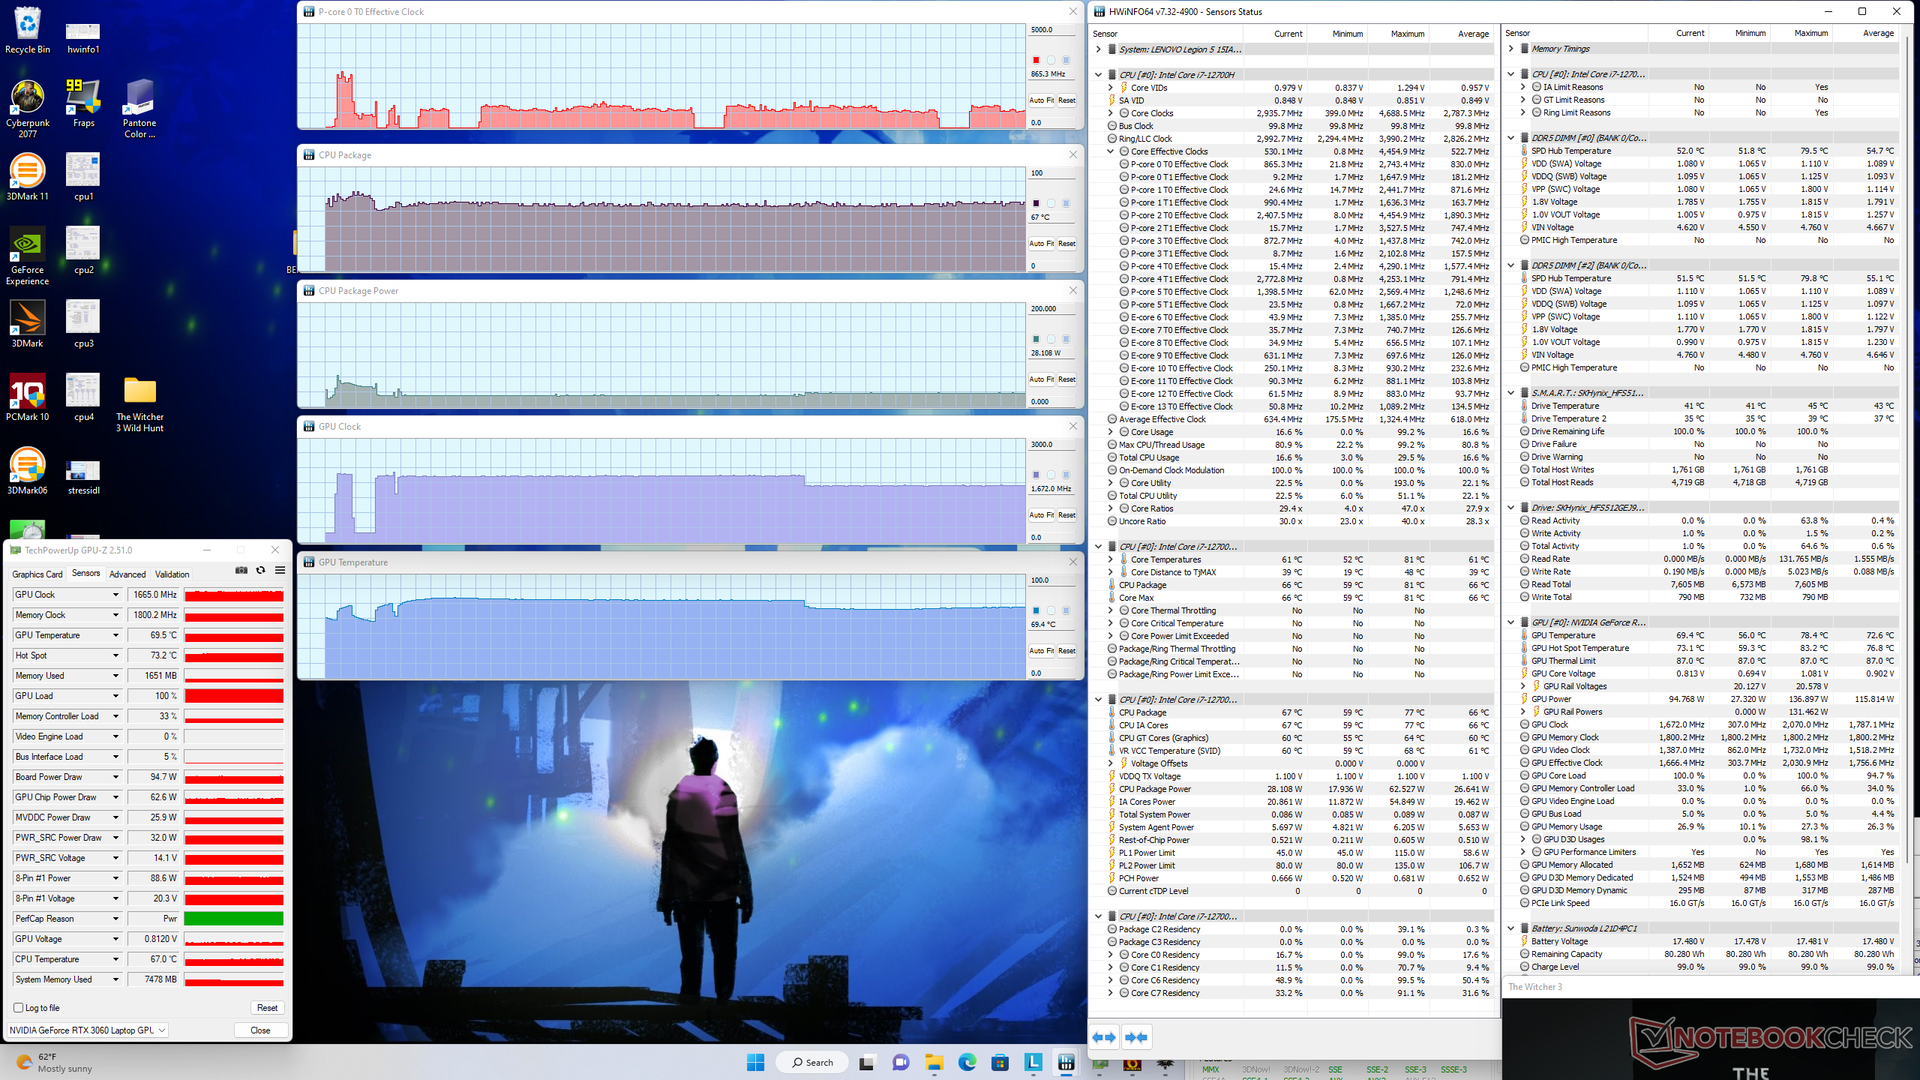
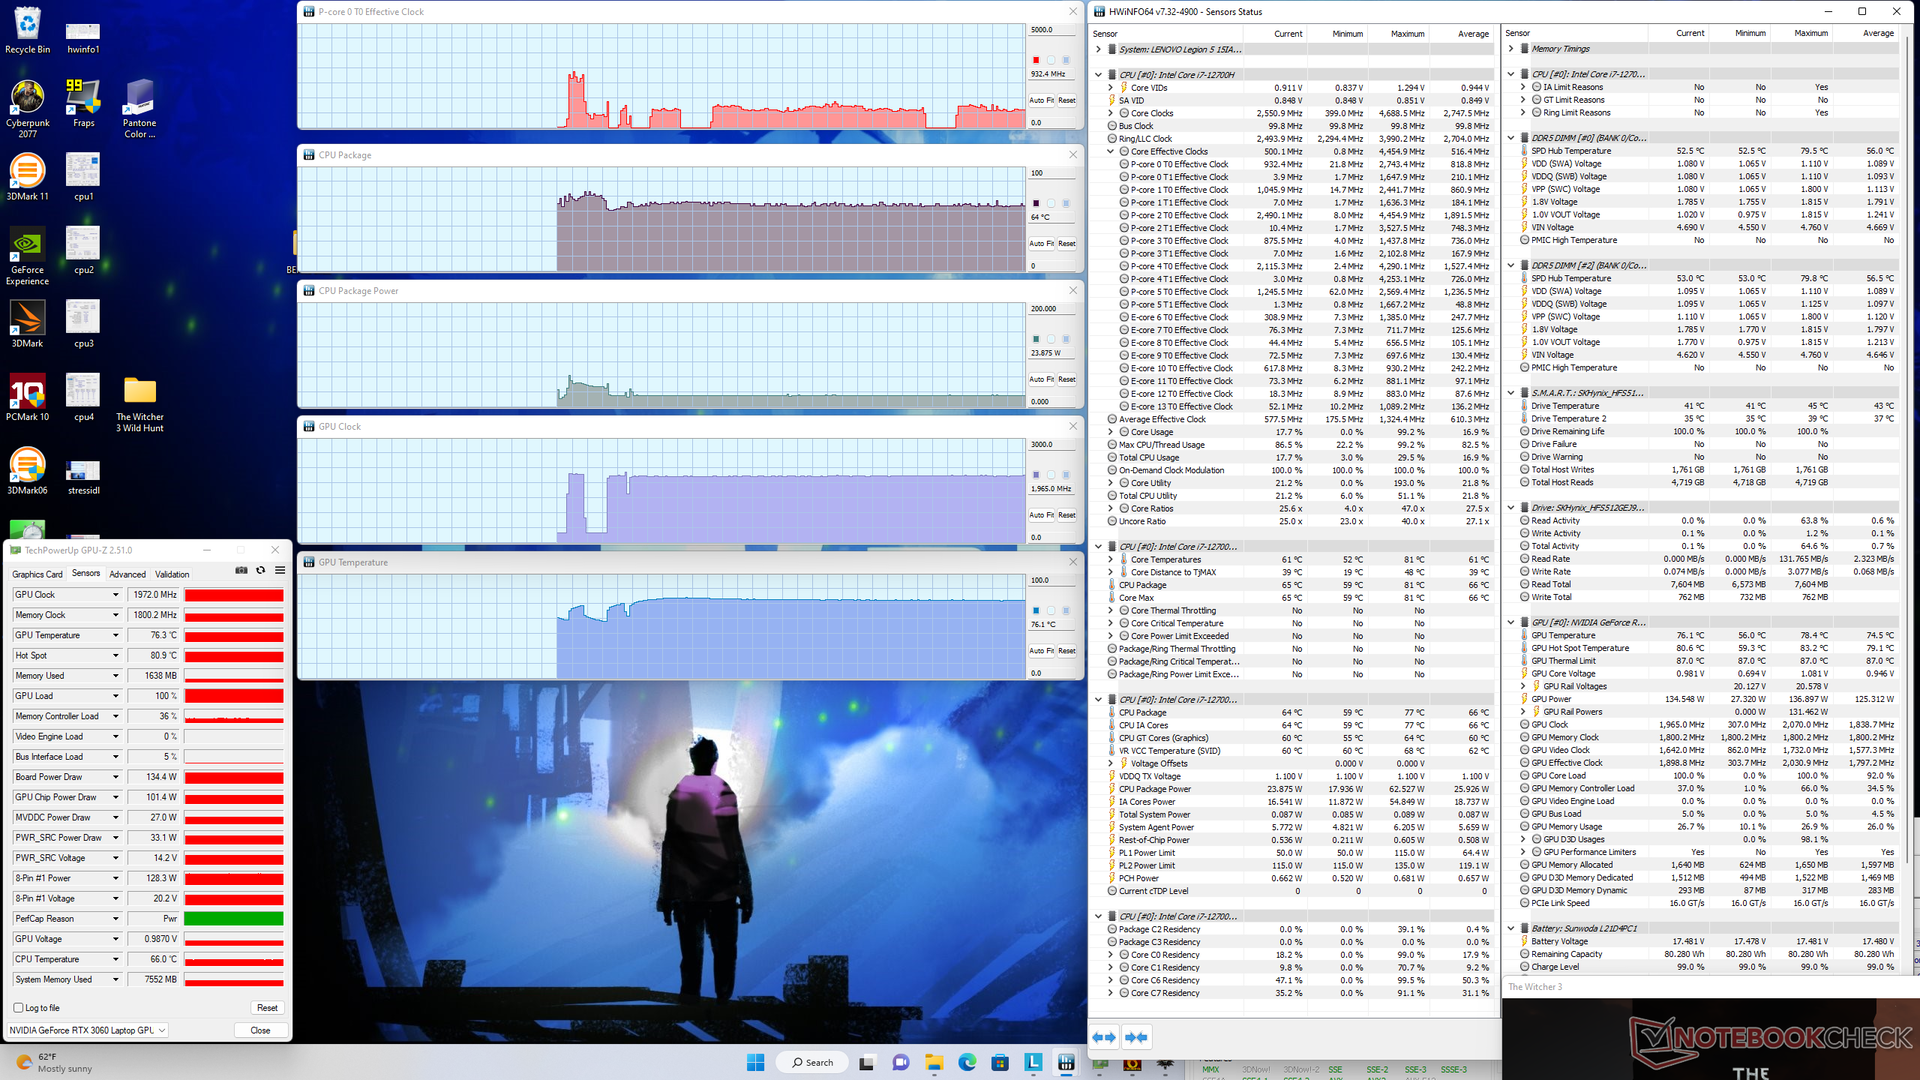
| CPU Clock (GHz) | GPU Clock (MHz) | Average CPU Temperature (°C) | Average GPU Temperature (°C) | |
| System Idle | -- | -- | 37 | 38 |
| Prime95 Stress | 3.6 - 3.8 | -- | 97 | 57 |
| Prime95 + FurMark Stress | 2.5 | 1597 - 2010 | 77 | 75 |
| Witcher 3 Stress (Balanced mode) | ~0.9 | 1665 | 67 | 70 |
| Witcher 3 Stress (Performance mode) | ~0.9 | 1972 | 64 | 76 |
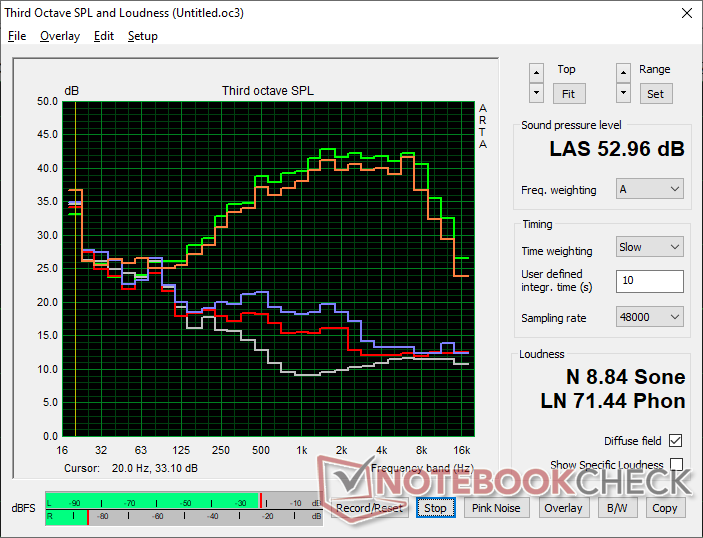
Speakers
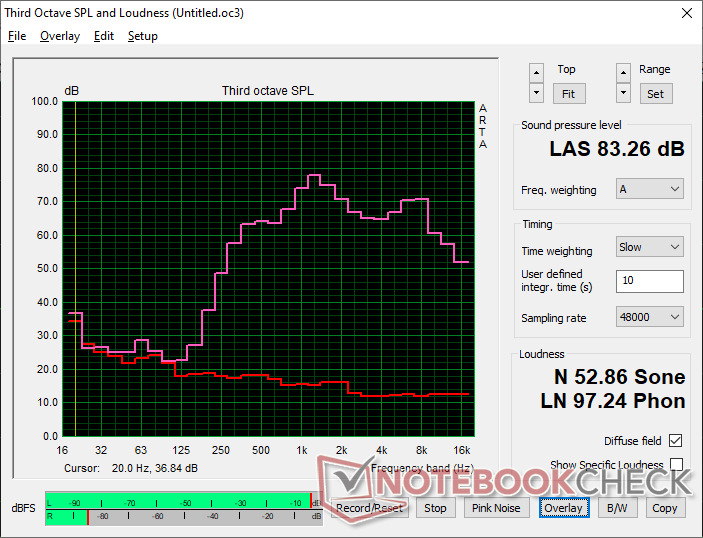
Lenovo Legion 5 15IAH7H 82RB audio analysis
(+) | speakers can play relatively loud (83.3 dB)
Bass 100 - 315 Hz
(-) | nearly no bass - on average 28.2% lower than median
(±) | linearity of bass is average (12.9% delta to prev. frequency)
Mids 400 - 2000 Hz
(±) | higher mids - on average 5.7% higher than median
(±) | linearity of mids is average (7.4% delta to prev. frequency)
Highs 2 - 16 kHz
(+) | balanced highs - only 3.3% away from median
(+) | highs are linear (6.4% delta to prev. frequency)
Overall 100 - 16.000 Hz
(±) | linearity of overall sound is average (23.6% difference to median)
Compared to same class
» 86% of all tested devices in this class were better, 4% similar, 10% worse
» The best had a delta of 6%, average was 18%, worst was 132%
Compared to all devices tested
» 71% of all tested devices were better, 6% similar, 23% worse
» The best had a delta of 4%, average was 23%, worst was 134%
Apple MacBook Pro 16 2021 M1 Pro audio analysis
(+) | speakers can play relatively loud (84.7 dB)
Bass 100 - 315 Hz
(+) | good bass - only 3.8% away from median
(+) | bass is linear (5.2% delta to prev. frequency)
Mids 400 - 2000 Hz
(+) | balanced mids - only 1.3% away from median
(+) | mids are linear (2.1% delta to prev. frequency)
Highs 2 - 16 kHz
(+) | balanced highs - only 1.9% away from median
(+) | highs are linear (2.7% delta to prev. frequency)
Overall 100 - 16.000 Hz
(+) | overall sound is linear (4.6% difference to median)
Compared to same class
» 0% of all tested devices in this class were better, 0% similar, 100% worse
» The best had a delta of 5%, average was 17%, worst was 45%
Compared to all devices tested
» 0% of all tested devices were better, 0% similar, 100% worse
» The best had a delta of 4%, average was 23%, worst was 134%
Energy Management — Demanding Under High CPU Loads
Power Consumption
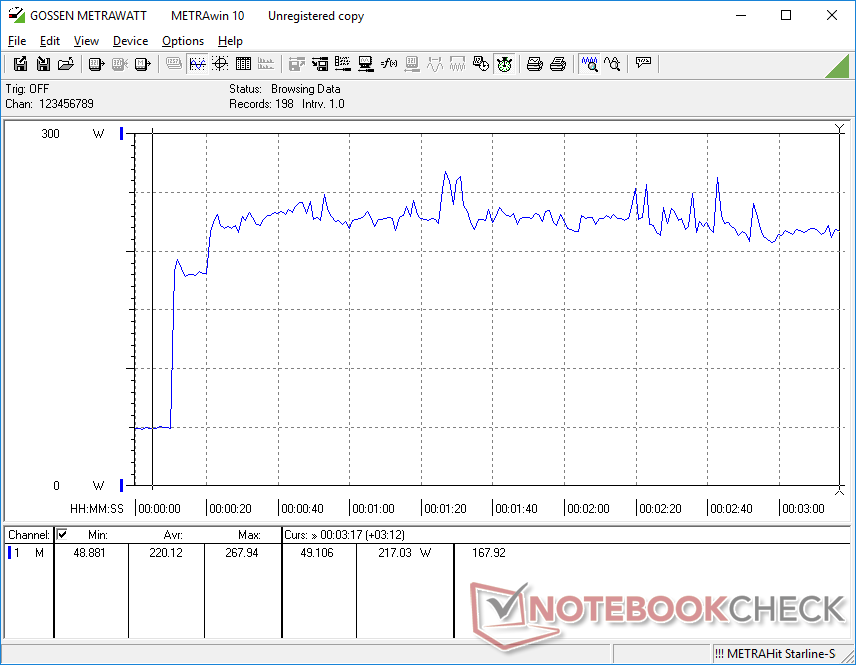
The system is unusually demanding when idling on desktop. Power consumption would range between 20 W when on the lowest brightness setting and power profile with hybrid graphics and 49 W when on the highest brightness setting and power profile with the dGPU active. In contrast, the 2021 model would range between 7 W and 16 W instead.
Running Witcher 3 demands about 187 W compared to 175 W on last year's model which closely correlates with the 10 W higher TGP target of our 2022 model.
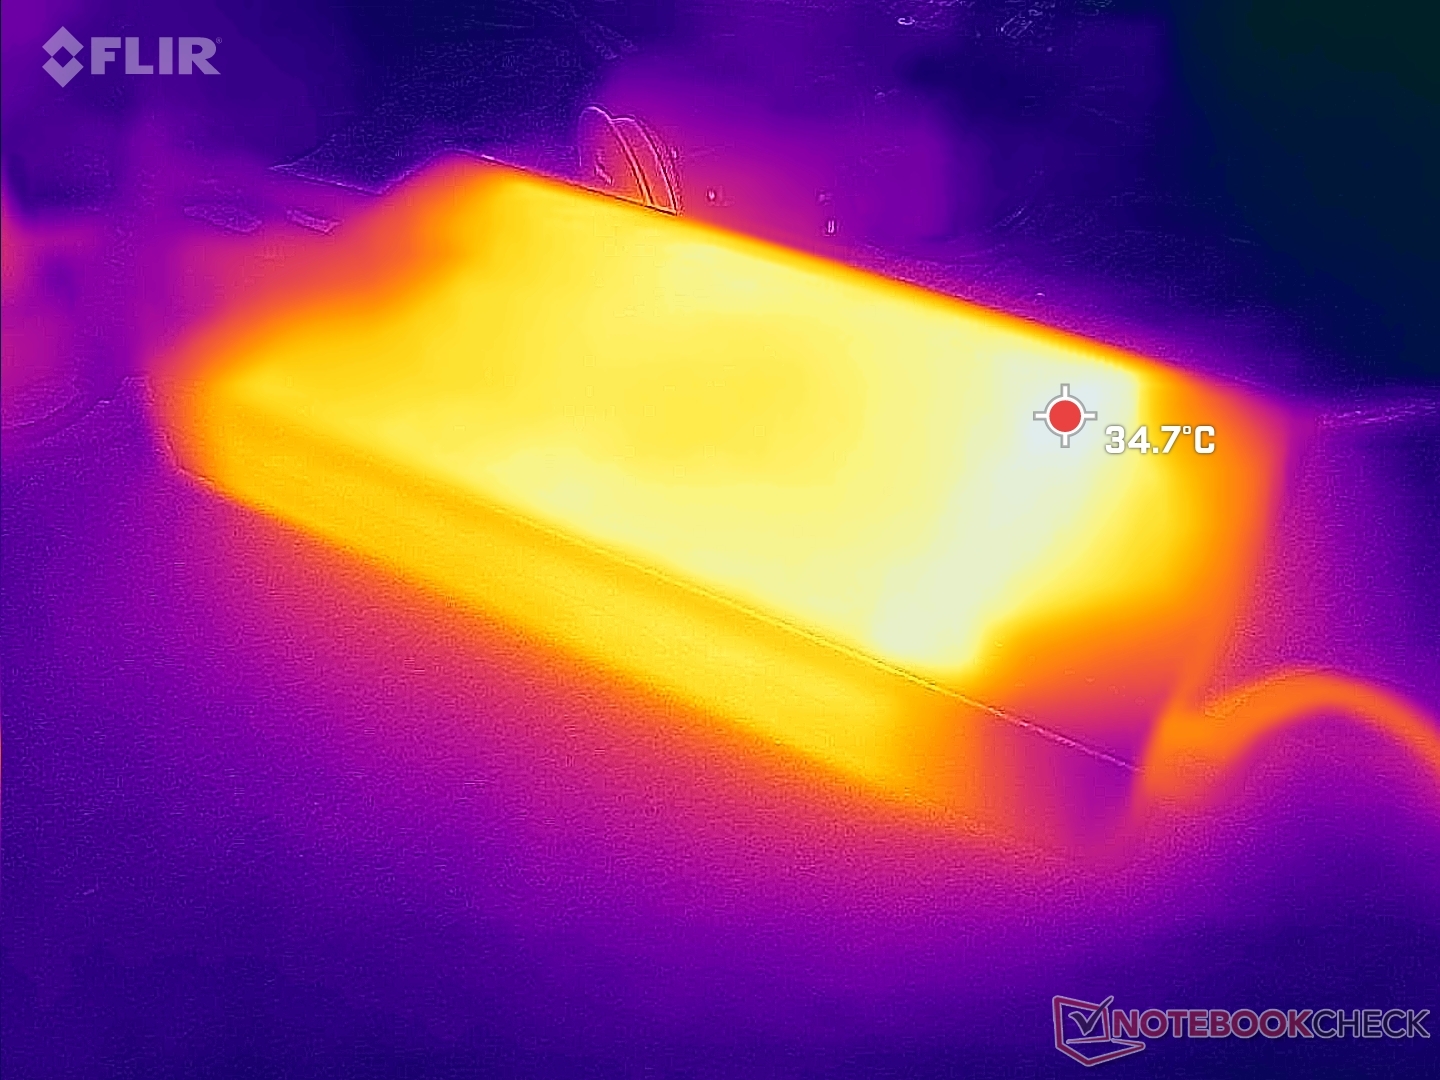
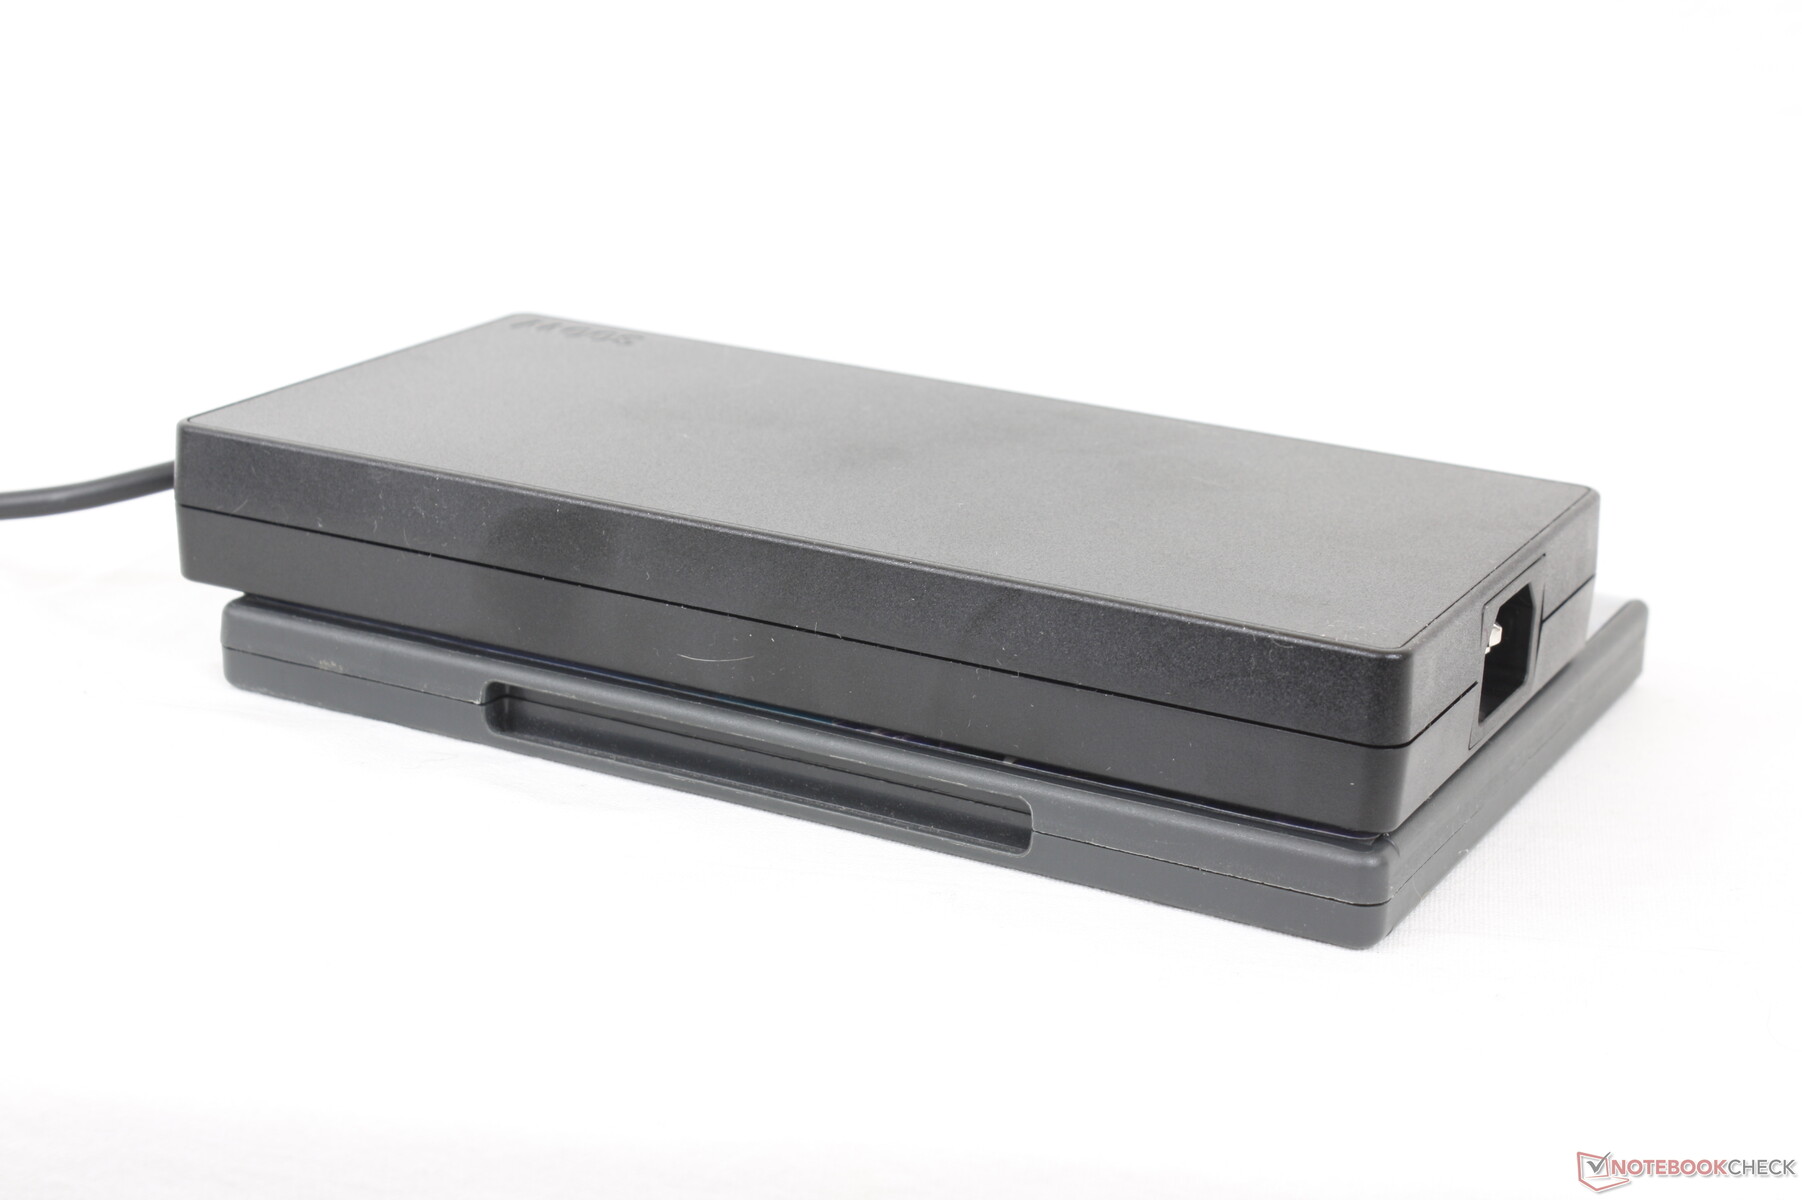
We're able to record a maximum draw of 268 W from the large (~19.8 x 9.8 x 2.5 cm) 300 W AC adapter when both the CPU and GPU are at 100 percent utilization. This maximum is higher than on most other gaming laptops running on AMD or 10th/11th gen Intel platforms as the 12th gen Core series is much more demanding.
| Off / Standby | |
| Idle | |
| Load |
|
Key:
min: | |
| Lenovo Legion 5 15IAH7H 82RB i7-12700H, GeForce RTX 3060 Laptop GPU, , IPS, 1920x1080, 15.6" | Lenovo Legion 5 15ACH-82JU00C6GE-FL R7 5800H, GeForce RTX 3060 Laptop GPU, Micron 2300 512GB MTFDHBA512TDV, , 1920x1080, 15.6" | MSI Bravo 15 B5DD-010US R5 5600H, Radeon RX 5500M, Kingston OM8PCP3512F-AB, IPS, 1920x1080, 15.6" | Asus TUF Gaming F15 FX507ZM i7-12700H, GeForce RTX 3060 Laptop GPU, SK Hynix HFM001TD3JX013N, IPS, 1920x1080, 15.6" | Acer Aspire Nitro 5 AN515-55-57GF i5-10300H, GeForce RTX 3060 Laptop GPU, WDC PC SN530 SDBPNPZ-512G, IPS, 1920x1080, 15.6" | Razer Blade 15 Base Edition 2021, i7-10750H RTX 3060 i7-10750H, GeForce RTX 3060 Laptop GPU, Samsung SSD PM981a MZVLB512HBJQ, IPS, 1920x1080, 15.6" | |
|---|---|---|---|---|---|---|
| Power Consumption | 34% | 53% | 31% | 49% | 29% | |
| Idle Minimum * (Watt) | 19.8 | 7.3 63% | 6.6 67% | 6.3 68% | 5 75% | 11.7 41% |
| Idle Average * (Watt) | 26.2 | 10.5 60% | 9.8 63% | 9.8 63% | 9 66% | 16 39% |
| Idle Maximum * (Watt) | 48.2 | 15.7 67% | 10.8 78% | 26.5 45% | 13 73% | 29.3 39% |
| Load Average * (Watt) | 102.9 | 108 -5% | 70.5 31% | 103.8 -1% | 84 18% | 95.6 7% |
| Witcher 3 ultra * (Watt) | 186.7 | 175 6% | 103.2 45% | 189 -1% | 125 33% | 141.3 24% |
| Load Maximum * (Watt) | 268 | 228 15% | 175 35% | 241.9 10% | 190 29% | 197 26% |
* ... smaller is better
Power Consumption Witcher 3 / Stresstest
Power Consumption external Monitor
Battery Life
WLAN runtime is about the same as on last year's model since battery capacity is still at 80 Wh. Charging from empty to full capacity takes only 35 minutes when Rapid Charge is toggled on compared to 1.5 to 2 hours on most other laptops.
USB-C charging is supported only through the rear USB-C port. However, charging may only be compatible with the optional Lenovo USB-C charger and not most third-party chargers. We tried three separate USB-C chargers (30 W, 100 W, and 130 W), but only the 130 W charger from Lenovo would work.
Certain SKUs come with a smaller 60 Wh battery instead of our 80 Wh one.
| Lenovo Legion 5 15IAH7H 82RB i7-12700H, GeForce RTX 3060 Laptop GPU, 80 Wh | Lenovo Legion 5 15ACH-82JU00C6GE-FL R7 5800H, GeForce RTX 3060 Laptop GPU, 80 Wh | MSI Bravo 15 B5DD-010US R5 5600H, Radeon RX 5500M, 53 Wh | Asus TUF Gaming F15 FX507ZM i7-12700H, GeForce RTX 3060 Laptop GPU, 90 Wh | Acer Aspire Nitro 5 AN515-55-57GF i5-10300H, GeForce RTX 3060 Laptop GPU, 57.5 Wh | Razer Blade 15 Base Edition 2021, i7-10750H RTX 3060 i7-10750H, GeForce RTX 3060 Laptop GPU, 65 Wh | |
|---|---|---|---|---|---|---|
| Battery runtime | 30% | 10% | 30% | 25% | 9% | |
| Reader / Idle (h) | 8.1 | 9.2 14% | 15.8 95% | 7.8 -4% | ||
| WiFi v1.3 (h) | 5 | 4.8 -4% | 6.3 26% | 4.8 -4% | 5.7 14% | 4.8 -4% |
| Load (h) | 1.1 | 1.8 64% | 1 -9% | 1.1 0% | 1.5 36% | 1.5 36% |
| H.264 (h) | 4.3 | 6.2 |
Pros
Cons
Verdict — Big Size, Big Performance
The most surprising aspect of the 2022 Legion 5 15 is its faster-than-average performance. Even though we've already tested plenty of gaming laptops with the Core i7-12700H CPU and GeForce RTX 3060 GPU, this Lenovo model runs at noticeably higher clock rates for higher performance than many competitors equipped with the same hardware. If you're concerned about accidentally purchasing a laptop with underclocked hardware, then the Legion 5 15 will squelch any such worries.
The 2022 Lenovo Legion 5 15 excels at maximizing performance in an almost semi-professional chassis with minimal RGB lights. It's quite big and heavy, however, and a few auxiliary aspects could use some improving.
The extra performance comes at the cost of a heavier and larger chassis. The large protruding rear is hard to ignore and competitors like the Asus TUF Gaming F15 FX507ZM or Razer Blade 15 Base Model are each noticeably lighter. If you travel a lot, then the higher performance may not be worth the heavier weight. The bulky 300 W AC adapter doesn't make the Lenovo very travel friendly, either.
For future models, we would like to see improvements to the spongy clickpad, pixelated webcam quality, poor third-party USB-C charging support, and small hinges. The latter in particular would help justify the heavier chassis when compared to the competition.
Price and Availability
Lenovo is now shipping its Legion 5 15 series starting for $1100 to $1900 USD depending on the configuration. Our specific review configuration is currently shipping for $1350.
Lenovo Legion 5 15IAH7H 82RB
- 11/25/2022 v7 (old)
Allen Ngo
Price comparison
