Verdict - Legion 5 15 is a very good mainstream gamer
Lenovo's Legion 5 15 is a very good mainstream gamer, which does not reveal any major issues in our review. The chassis is functional with sufficient ports, a very comfortable keyboard, as well as very good maintenance options. It is easy to upgrade the memory and there are two SSD slots. You do not get extensive chassis illumination, but this is not necessarily a disadvantage.
The Legion does not disappoint in terms of performance, either. The AMD processor is not the newest anymore, but the gaming performance in combination with the new GeForce RTX 5060 laptop GPU (115 Watts TGP) is still very good. If you primarily play in the 1080p resolution, the RTX 5060 Laptop is actually often not that much slower than the RTX 5070 laptop. The new OLED panel provides excellent image quality and is very bright in HDR mode. In combination with fast response time as well as the 165 Hz refresh rate, games simply look stunning. There are also accurate color profiles for P3 as well as sRGB, so it is suited for picture editing.
We did not find many issues with the new Legion 5 15. Sure, the Zen 4 processor in our review configuration is not the latest model, but the gaming performance is still good. And if you prefer a Zen 5 chip or an Intel CPU, you can pay extra to get those. The speakers could be better, and the fans get quite loud in Performance mode, even though the rivals are often even a bit louder. Lenovo also did not include Advanced Optimus GPU switching.
All in all, Lenovo offers a very convincing overall package with a stunning OLED panel and the fastest version of the new GeForce RTX 5060 Laptop. The optional RTX 5070 Laptop makes sense if you prefer to play in the native QHD resolution.
Pros
Cons
Price and Availability
Our review unit of the Legion 5 15 AMD is available from Lenovo for $1535 with Windows 11 Home. You can also buy the Intel powered Legion 5 15 with the RTX 5070 Laptop from Amazon for $1599.
Table of Contents
- Verdict - Legion 5 15 is a very good mainstream gamer
- Specifications
- Case - Functional gamer
- Connectivity - USB 4.0 and Wi-Fi 7
- Input Devices - 24-zone illumination
- Display - OLED with 165 Hz
- Performance - AMD Zen 4 meets Blackwell
- Emissions
- Energy Management - Good battery runtime
- Notebookcheck Rating
- Possible Alternatives in Comparison
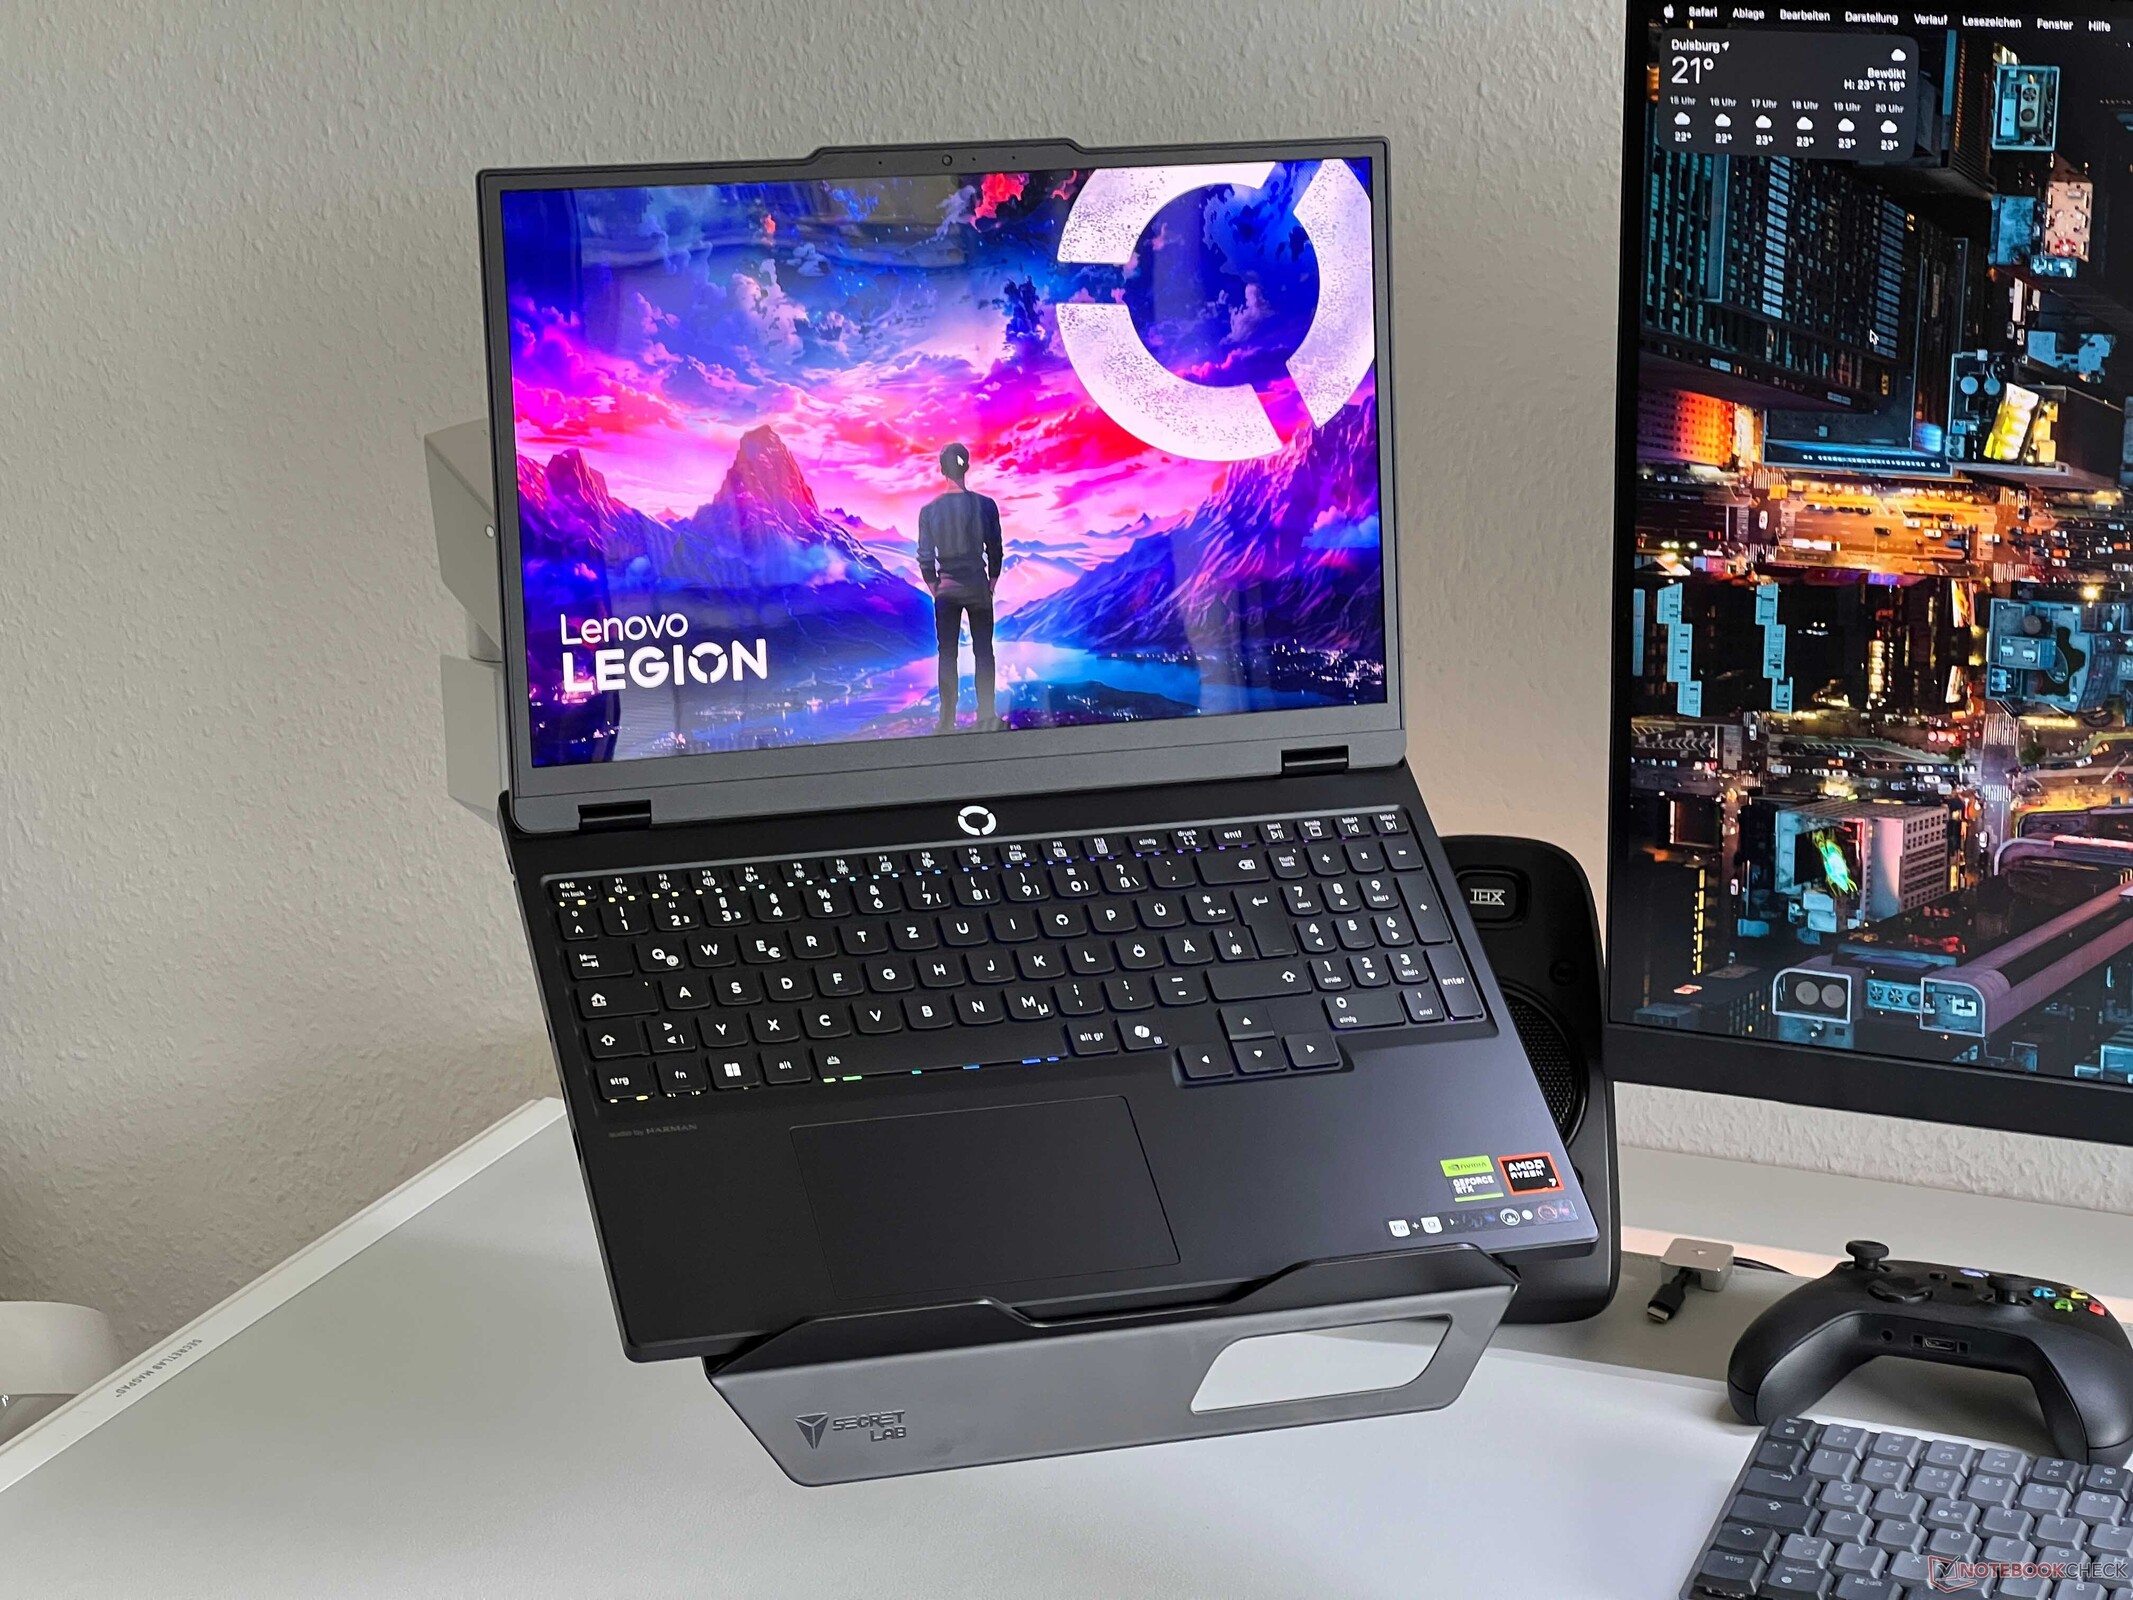
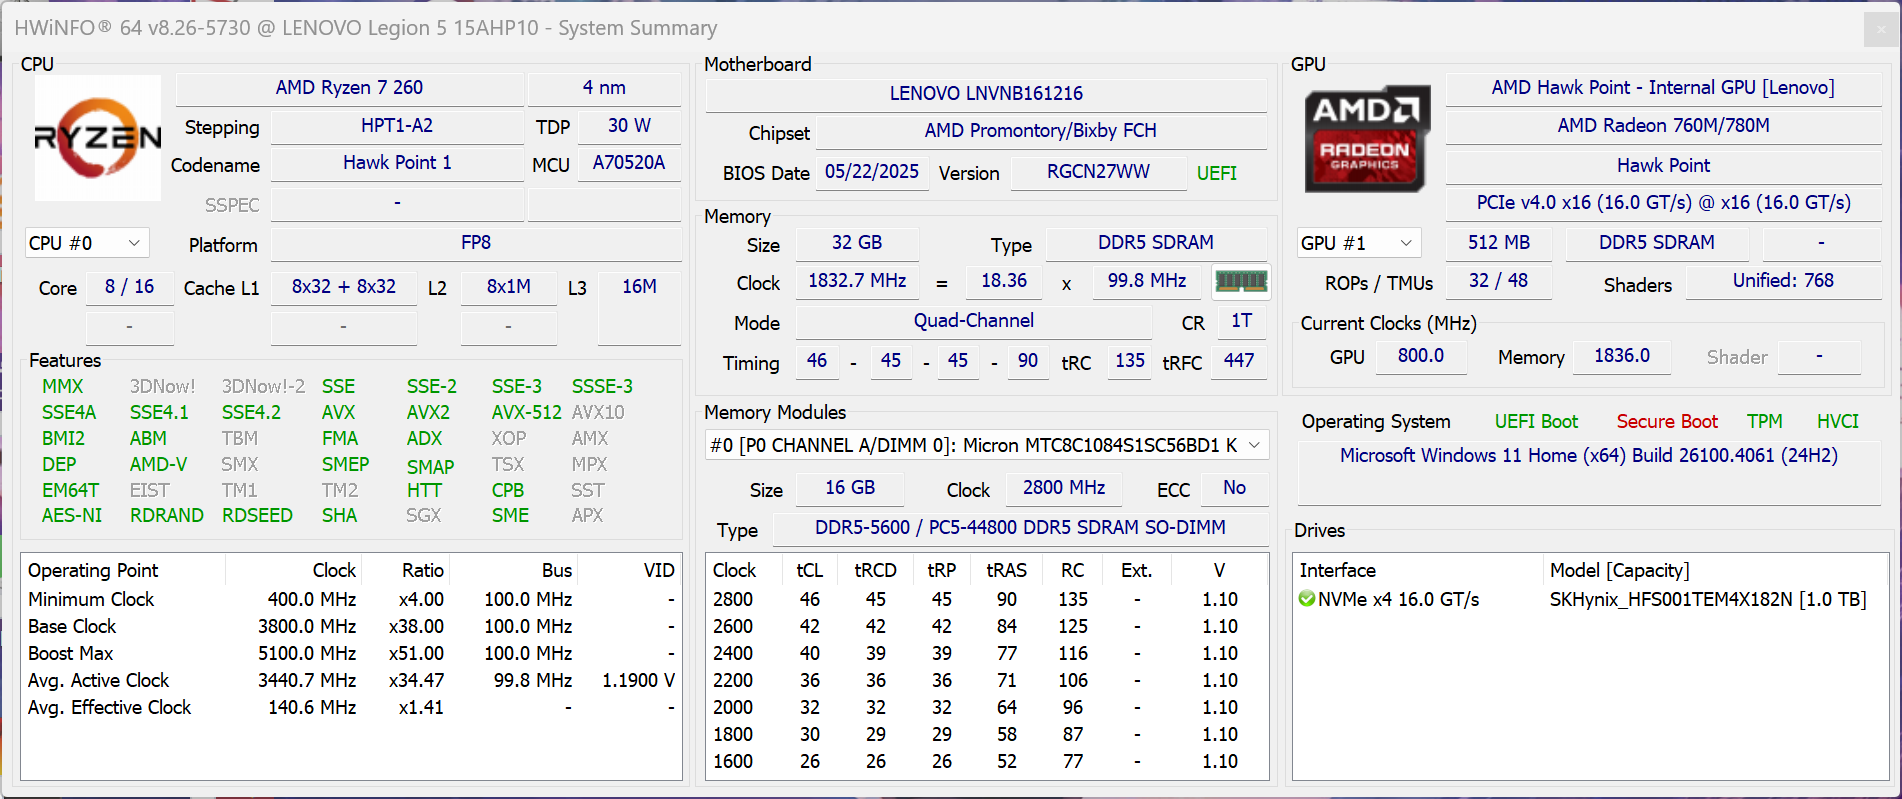
Lenovo's Legion 5 15 Gen 10 is a new mainstream gamer, which focuses on the performance. In addition to a got set of features, you also get an optional OLED screen with a brightness of 1000 nits. Our review unit is the special version for students for 1449 Euros with the AMD Ryzen 7 260 (Zen 4), 32 GB RAM, the high-resolution OLED as well as the new GeForce RTX 5060 Laptop.
Specifications
Case - Functional gamer
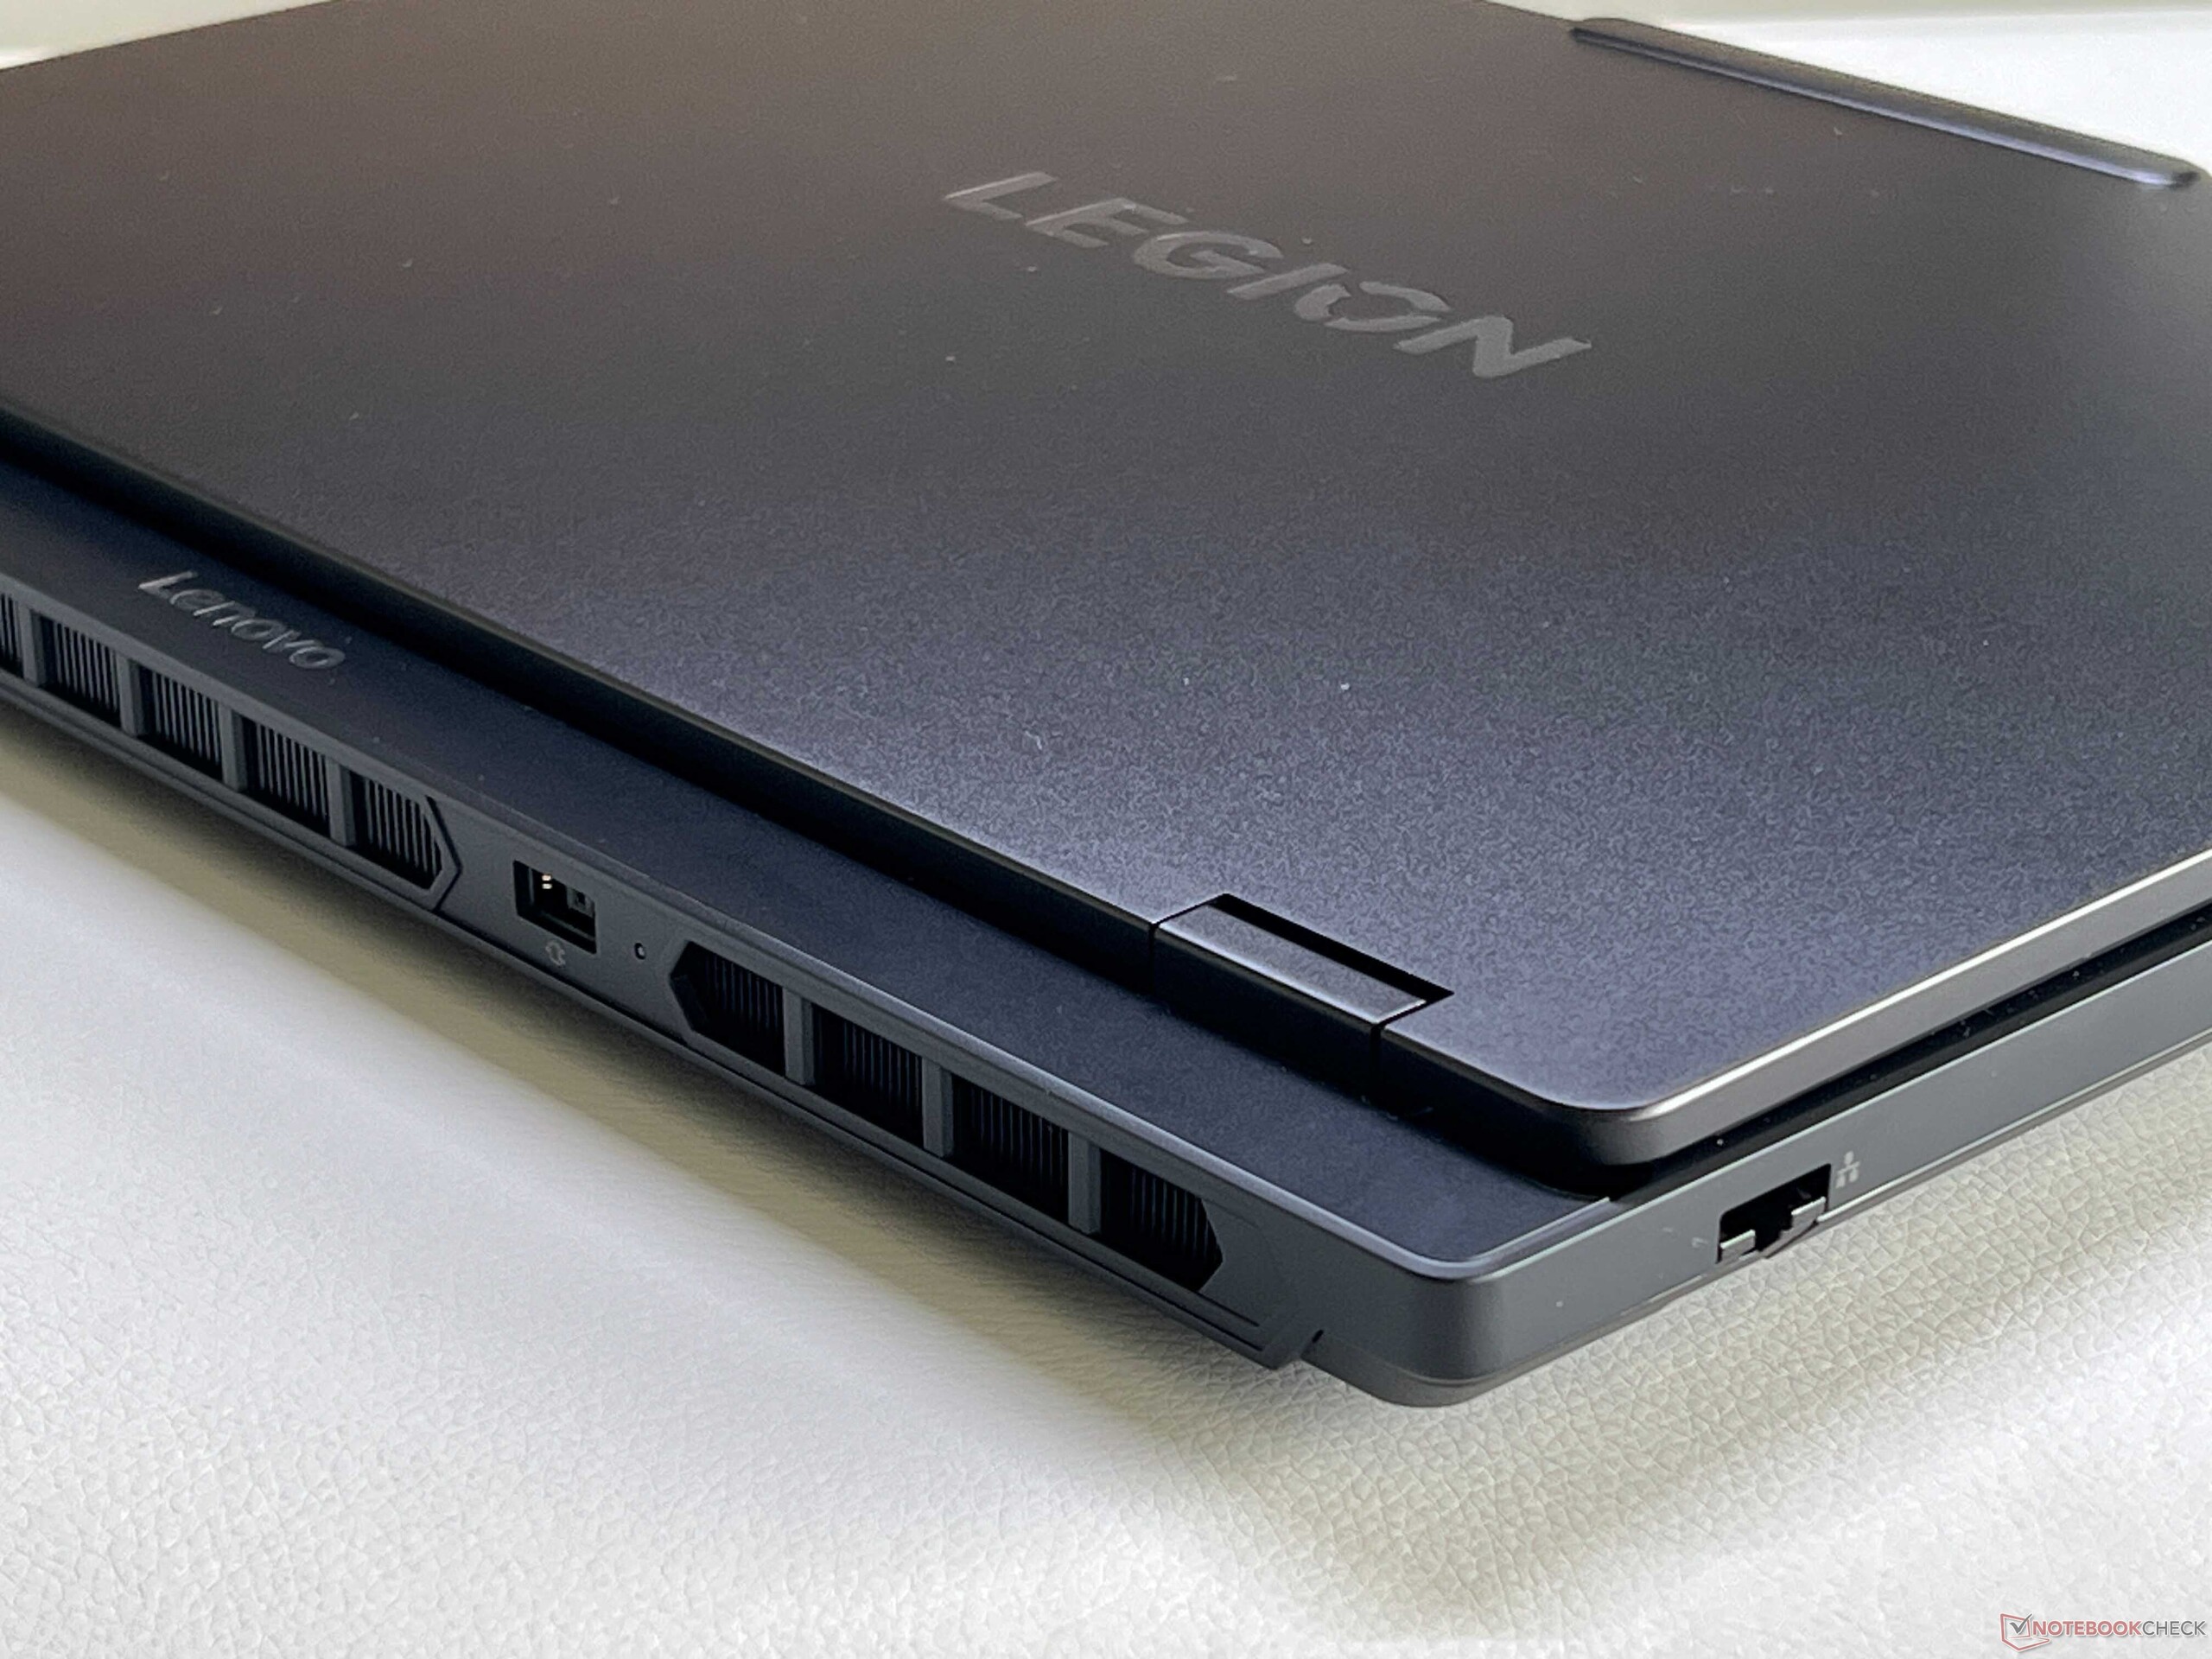
The black chassis of the new Legion 5 15 only uses black surfaces and does not offer lighting elements. Lenovo uses aluminum for the lid, while the base unit is made of plastic, which is also quite rough at the bottom panel. Visually, the Legion is therefore quite restrained, but the large camera bump does not look very good. The surfaces are also quite prone to fingerprints.
The stability of the base unit is very good in general, only the center of keyboard area can be pushed down quite easily. However, we were not able to twist it or provoke creaking sounds. The hinges are very well adjusted and hold the lid securely in position (maximum opening angle of 165 degrees). The camera bump is relatively thin, but still very stable.


The OLED version of the Legion 5 15 G10 is comparatively compact and it is also the lightest model within our comparison group at 1.94 kg. If you get an IPS model, the weight increases by almost 200 grams, and it is also 2.5 mm thicker. The included power adapter tips the scale at 734 grams.
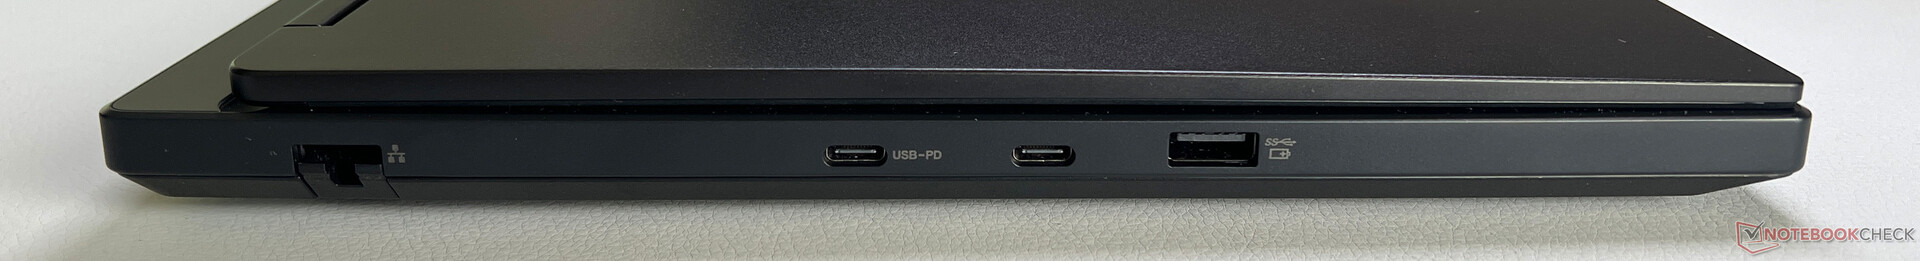
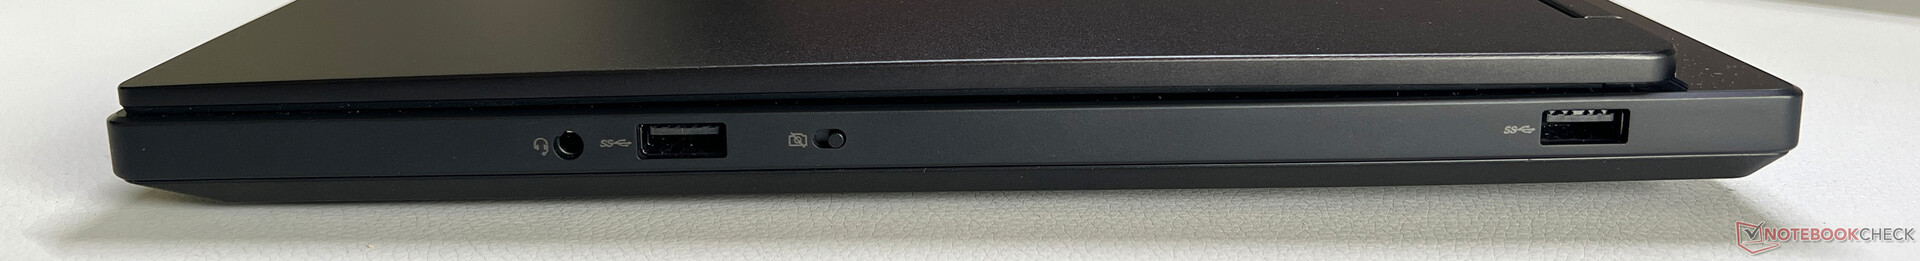
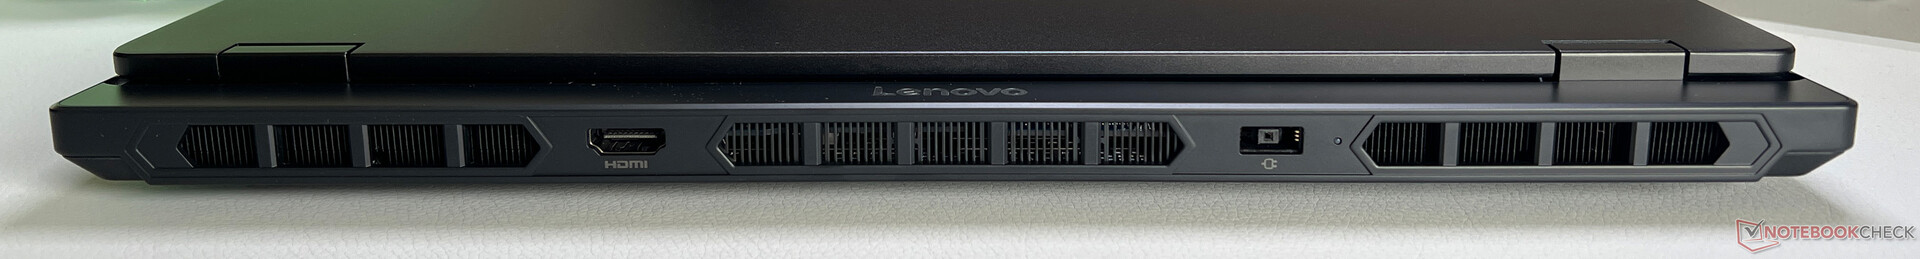
Connectivity - USB 4.0 and Wi-Fi 7
The ports of the Legion are distributed across the two sides as well as the rear and the layout is very convenient in practice. You get a modern USB-C 4.0 port and it is attached via iGPU, so the dGPU does not always have to be active when you use an external screen. Our review unit is not a Copilot+ laptop, but it still supports the studio effects for the webcam as well as live captions. The 5 MP webcam (including eShutter) takes quite sharp images, but the color accuracy is not that great.
In addition to the Gigabit-Ethernet port, you also get a modern Wi-Fi 7 module from MediaTek (including Bluetooth 5.4). The transfer rates in our standardized Wi-Fi test with the reference router from Asus are very good and stable. We did not experience any issues with the signal quality during our review period, either.
| Networking | |
| Lenovo Legion 5 15AHP G10 | |
| iperf3 transmit AXE11000 | |
| iperf3 receive AXE11000 | |
| Lenovo LOQ 15AHP10 | |
| iperf3 transmit AXE11000 | |
| iperf3 receive AXE11000 | |
| Gigabyte G5 KF5 2024 | |
| iperf3 transmit AXE11000 | |
| iperf3 receive AXE11000 | |
| iperf3 transmit AXE11000 6GHz | |
| iperf3 receive AXE11000 6GHz | |
| Asus TUF Gaming A15 FA507UV | |
| iperf3 transmit AXE11000 | |
| iperf3 receive AXE11000 | |
| Schenker XMG Core 15 (M24) | |
| iperf3 transmit AXE11000 | |
| iperf3 receive AXE11000 | |
| MSI Katana A15 AI B8VG | |
| iperf3 transmit AXE11000 | |
| iperf3 receive AXE11000 | |


Maintenance
The maintenance options are very good. You can install two SSDs (1x M.2-2242, 1x M.2-2280), the memory can be upgraded and both the Wi-Fi module as well as the battery (screwed) can easily be replaced if necessary. Lenovo provides a maintenance manual.


Sustainability
The Legion holds several environmental certificates (Energy Star 9.0, for example), but Lenovo does not provide any information about the CO2 footprint or the use of recycled materials. The packaging can be recycled completely.
Input Devices - 24-zone illumination
Lenovo uses a black keyboard with a numeric keypad as well as large arrow keys. The typing experience is very comfortable, because the key travel is sufficiently long at 1.6 mm and the feedback is precise. You get 24 illumination zones that can be adjusted individually. The clickpad is sufficiently sized at 12 x 7.8 cm and offers good gliding capabilities. It is shifted to the left though and the mechanical clicks are a bit loud.


Display - OLED with 165 Hz

Our review unit is equipped with the optional 15.1-inch OLED screen (2560 x 1600 pixels, 16:10), which offers great image quality and is perfect for gaming. All contents are razor-sharp, the colors are vivid, black is pure, you get fast response times and a refresh rate of 165 Hz. Neither the brightness, nor the color temperature, can be controlled via sensor, though.
The brightness of the screen is also very convincing, because we measure 495 nits in SDR mode and up to 1067 nits for small areas in HDR mode (925 nits for full-screen). HDR games in particular simply look amazing.
| |||||||||||||||||||||||||
Brightness Distribution: 92 %
Center on Battery: 492 cd/m²
Contrast: ∞:1 (Black: 0 cd/m²)
ΔE ColorChecker Calman: 0.9 | ∀{0.5-29.43 Ø4.72}
ΔE Greyscale Calman: 1.2 | ∀{0.09-98 Ø4.97}
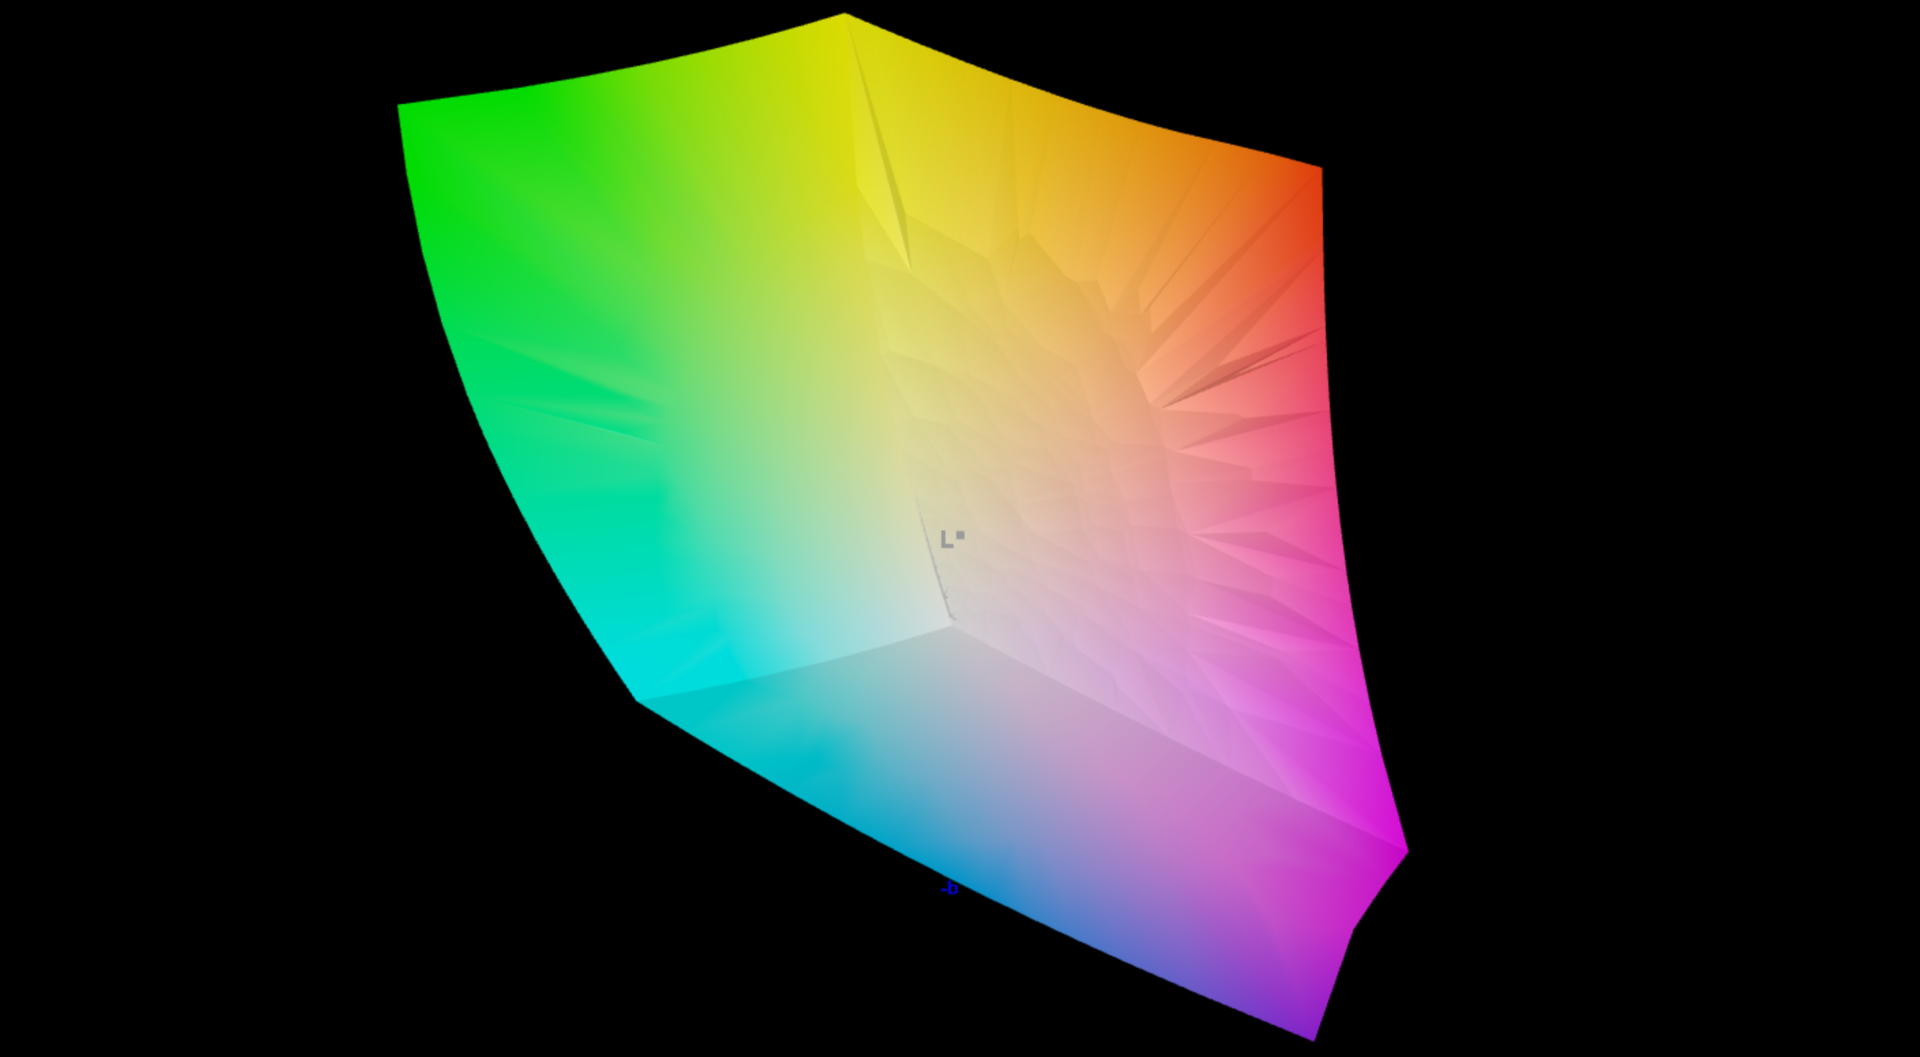
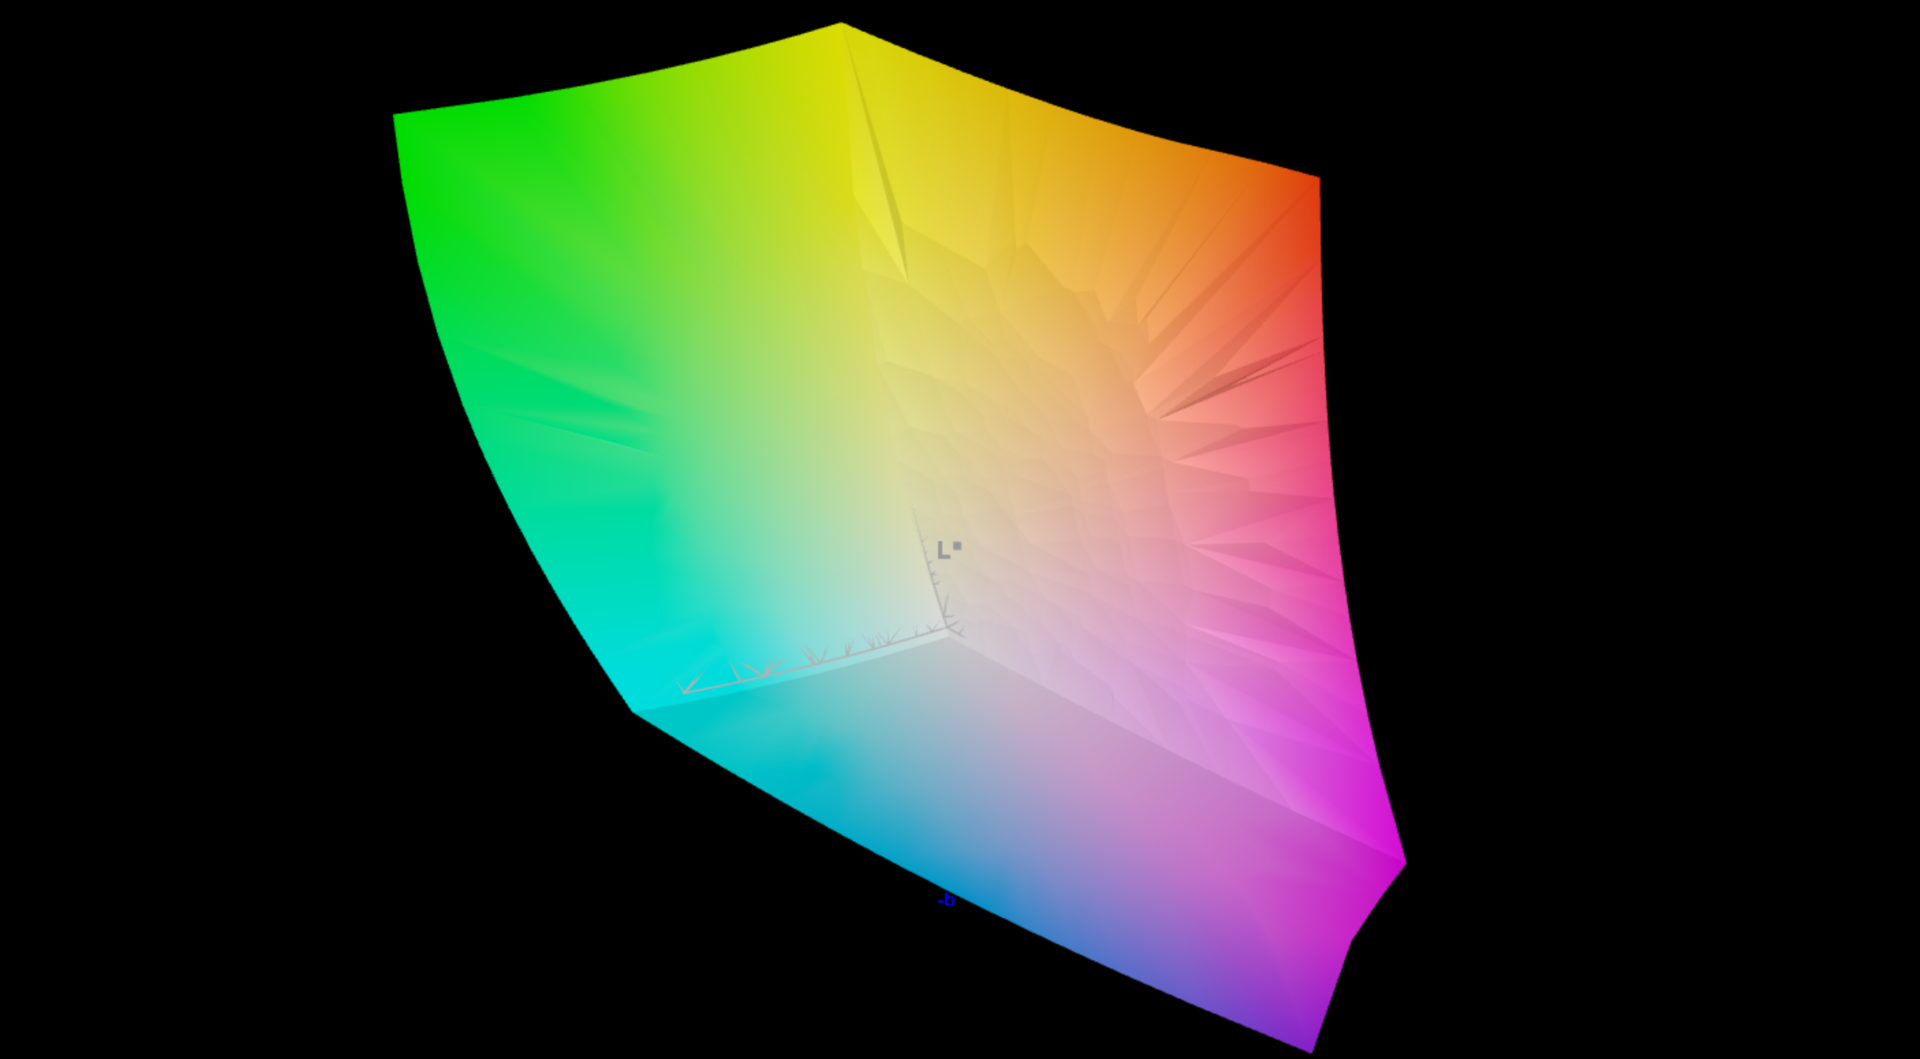
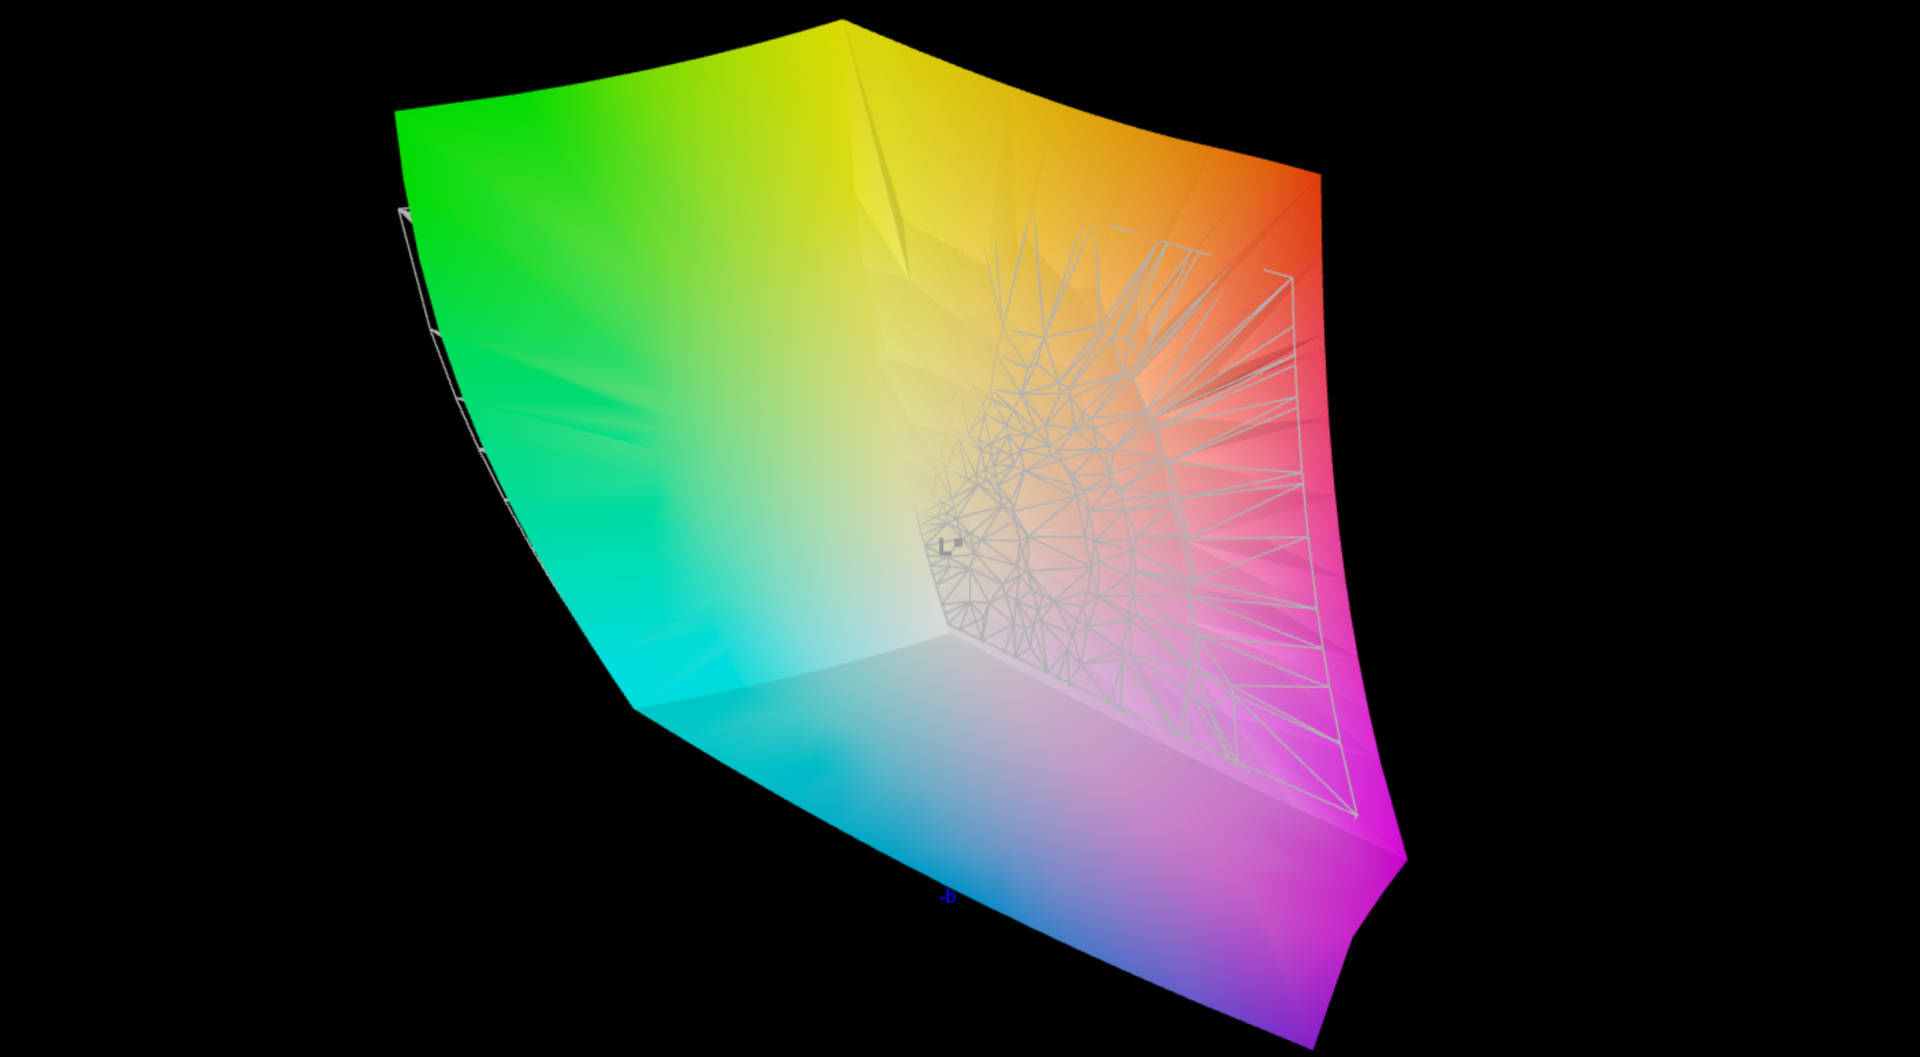
98.3% AdobeRGB 1998 (Argyll 3D)
100% sRGB (Argyll 3D)
99.9% Display P3 (Argyll 3D)
Gamma: 2.16
CCT: 6291 K
| Lenovo Legion 5 15AHP G10 LEN151WQXGA, OLED, 2560x1600, 15.1", 165 Hz | Lenovo LOQ 15AHP10 CSOT MNF601BA1-4, IPS, 1920x1080, 15.6", 144 Hz | Gigabyte G5 KF5 2024 Sharp SHP153F (LQ156M1JW30), IPS, 1920x1080, 15.6", 360 Hz | Asus TUF Gaming A15 FA507UV AU Optronics B156HAN15.H, IPS, 1920x1080, 15.6", 144 Hz | Schenker XMG Core 15 (M24) BOE NJ NE153QDM-NZ1 (BOE0C8E), IPS, 2560x1600, 15.3", 240 Hz | MSI Katana A15 AI B8VG CMN N156HRA-EA1, IPS, 1920x1080, 15.6", 144 Hz | |
|---|---|---|---|---|---|---|
| Display | -21% | -21% | -19% | -17% | -48% | |
| Display P3 Coverage (%) | 99.9 | 67.3 -33% | 67.9 -32% | 70.5 -29% | 73.2 -27% | 43.6 -56% |
| sRGB Coverage (%) | 100 | 99.2 -1% | 98.9 -1% | 98.5 -1% | 100 0% | 65.1 -35% |
| AdobeRGB 1998 Coverage (%) | 98.3 | 69.1 -30% | 68.8 -30% | 72.7 -26% | 74.6 -24% | 45.1 -54% |
| Response Times | -6586% | -2548% | -6537% | -2193% | -5581% | |
| Response Time Grey 50% / Grey 80% * (ms) | 0.42 ? | 33.9 ? -7971% | 13 ? -2995% | 31.7 ? -7448% | 9.6 ? -2186% | 28.5 ? -6686% |
| Response Time Black / White * (ms) | 0.4 ? | 21.2 ? -5200% | 8.8 ? -2100% | 22.9 ? -5625% | 9.2 ? -2200% | 18.3 ? -4475% |
| PWM Frequency (Hz) | 1152 ? | |||||
| PWM Amplitude * (%) | 11 | |||||
| Screen | -55% | -88% | -128% | -41% | -275% | |
| Brightness middle (cd/m²) | 492 | 318 -35% | 342 -30% | 315 -36% | 635 29% | 277 -44% |
| Brightness (cd/m²) | 495 | 300 -39% | 308 -38% | 303 -39% | 604 22% | 259 -48% |
| Brightness Distribution (%) | 92 | 89 -3% | 87 -5% | 90 -2% | 91 -1% | 77 -16% |
| Black Level * (cd/m²) | 0.2 | 0.29 | 0.25 | 0.64 | 0.19 | |
| Colorchecker dE 2000 * | 0.9 | 1.33 -48% | 2.46 -173% | 2.26 -151% | 1.89 -110% | 4.3 -378% |
| Colorchecker dE 2000 max. * | 1.8 | 4.42 -146% | 4.12 -129% | 7.37 -309% | 3.14 -74% | 19.14 -963% |
| Greyscale dE 2000 * | 1.2 | 1.9 -58% | 3.03 -153% | 4 -233% | 2.53 -111% | 3.6 -200% |
| Gamma | 2.16 102% | 2.187 101% | 2.51 88% | 2.116 104% | 2.36 93% | 2.322 95% |
| CCT | 6291 103% | 6678 97% | 7056 92% | 7570 86% | 6434 101% | 7182 91% |
| Contrast (:1) | 1590 | 1179 | 1260 | 992 | 1458 | |
| Colorchecker dE 2000 calibrated * | 0.94 | 0.82 | 1.03 | 1.14 | 3.01 | |
| Total Average (Program / Settings) | -2221% /
-1233% | -886% /
-517% | -2228% /
-1264% | -750% /
-426% | -1968% /
-1178% |
* ... smaller is better

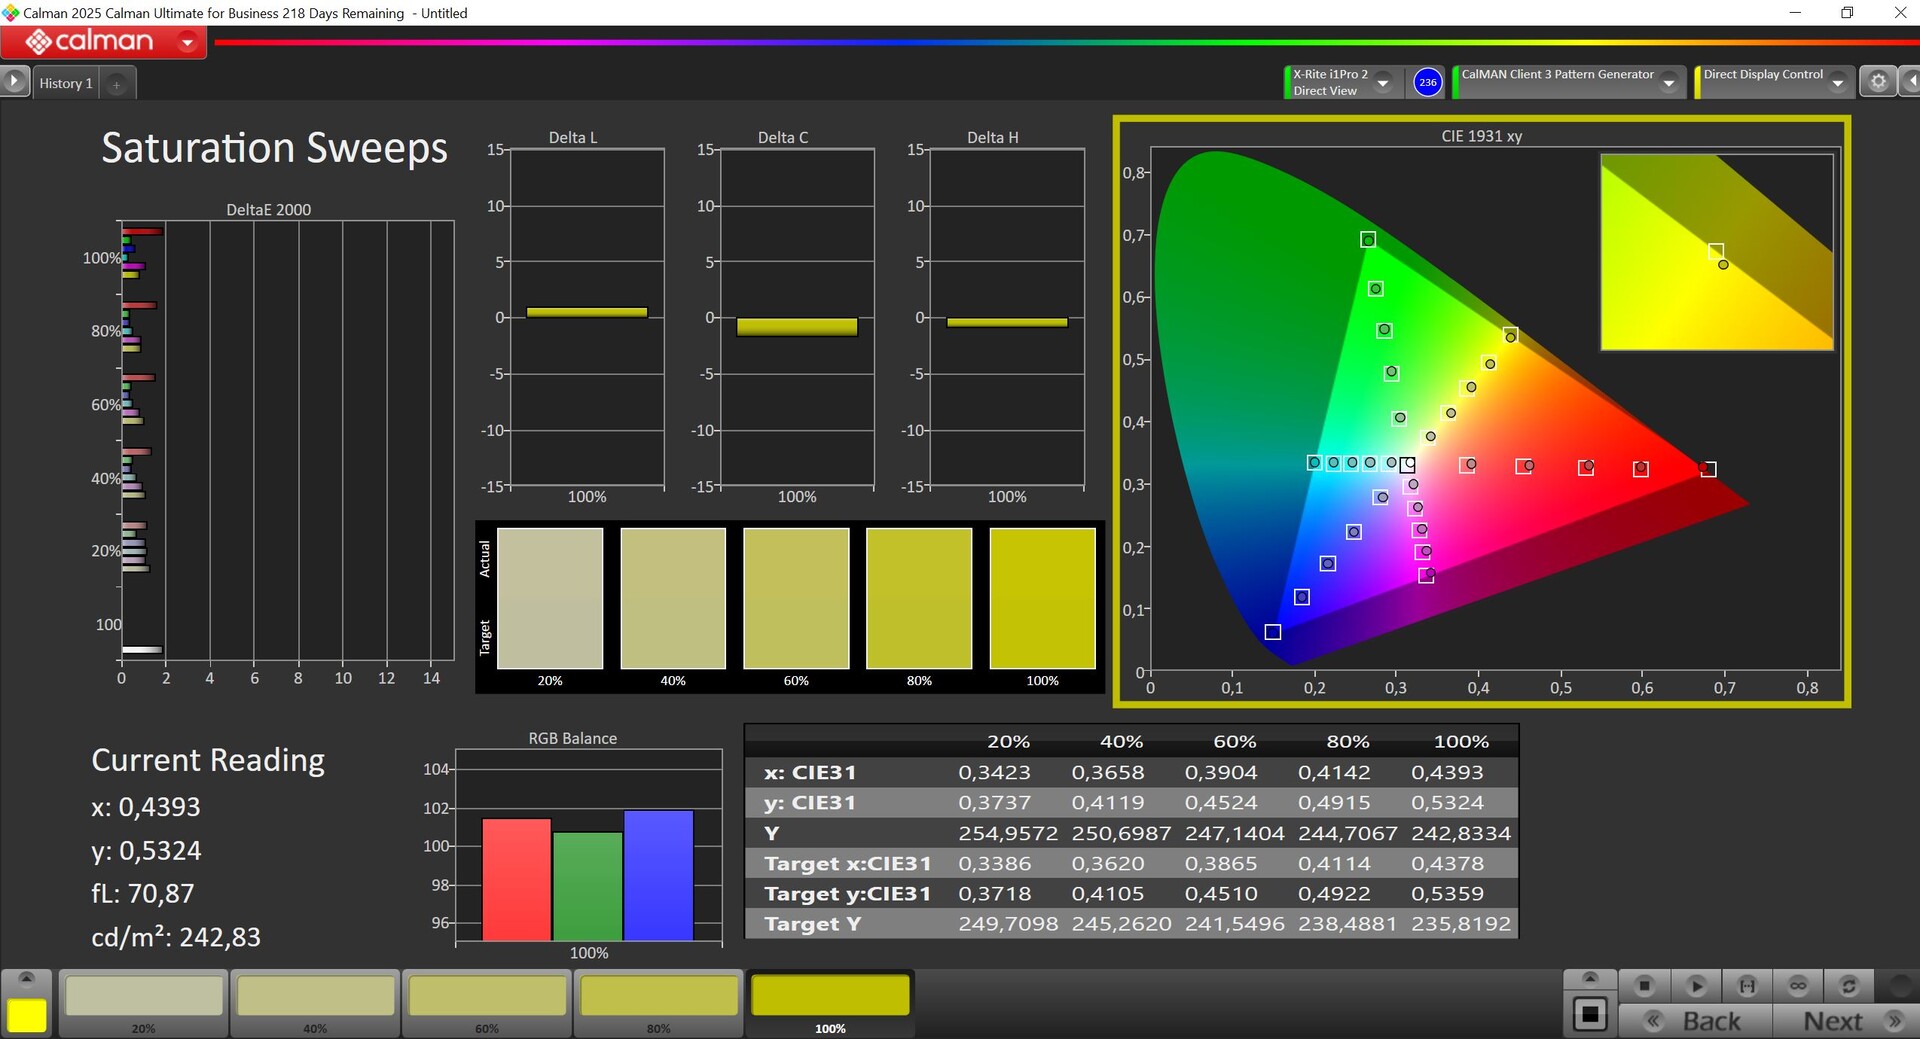

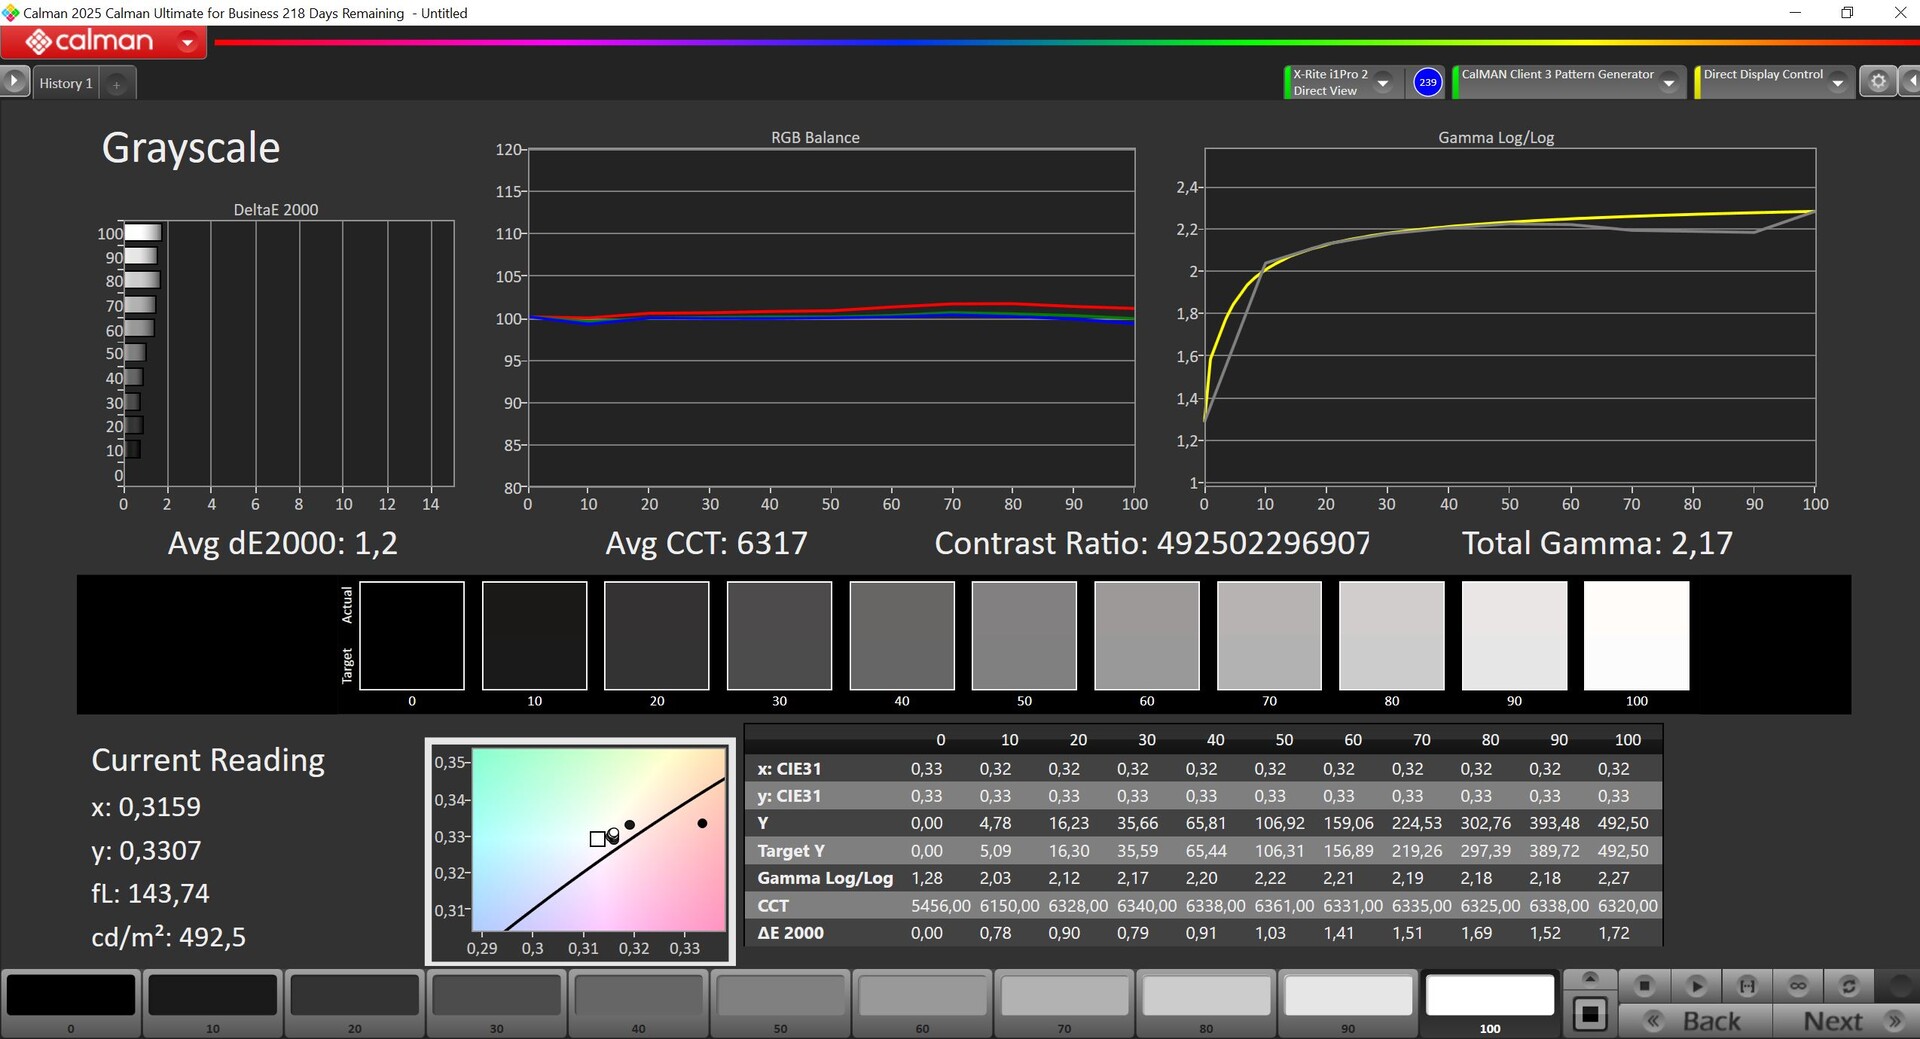
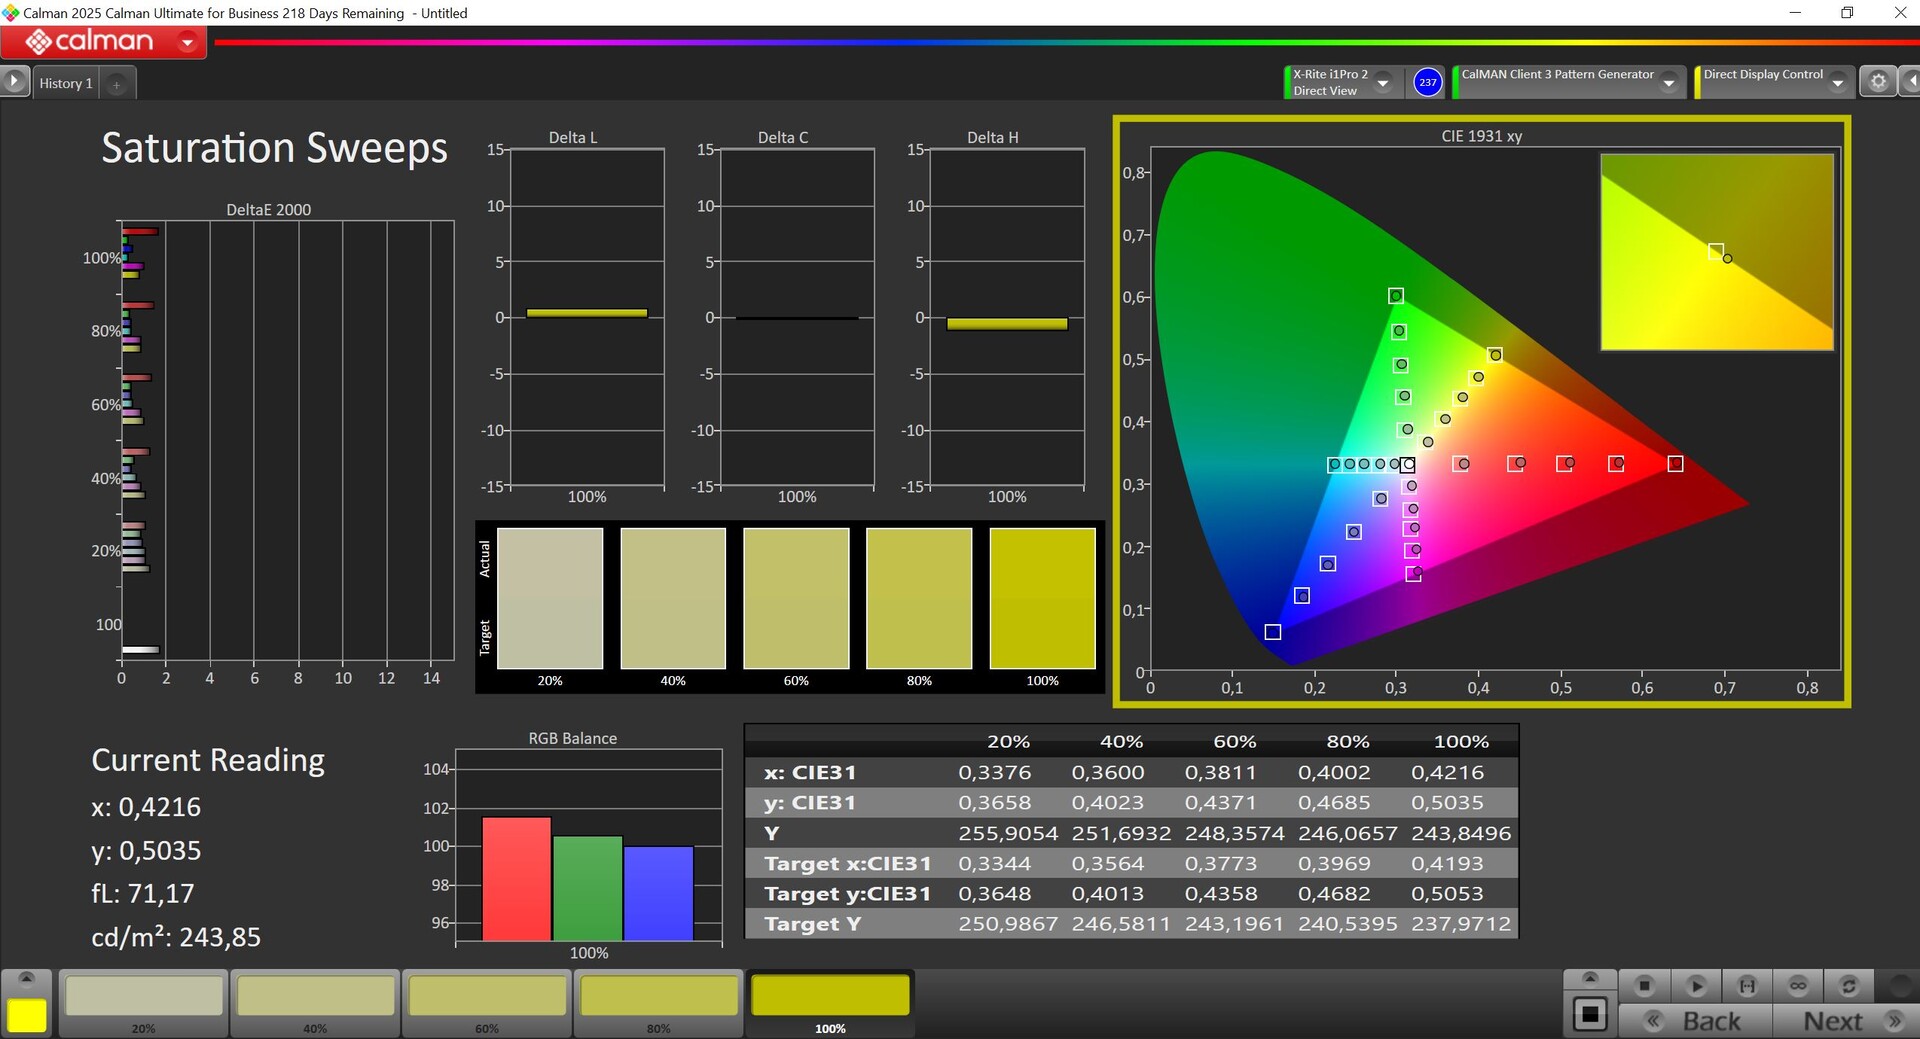


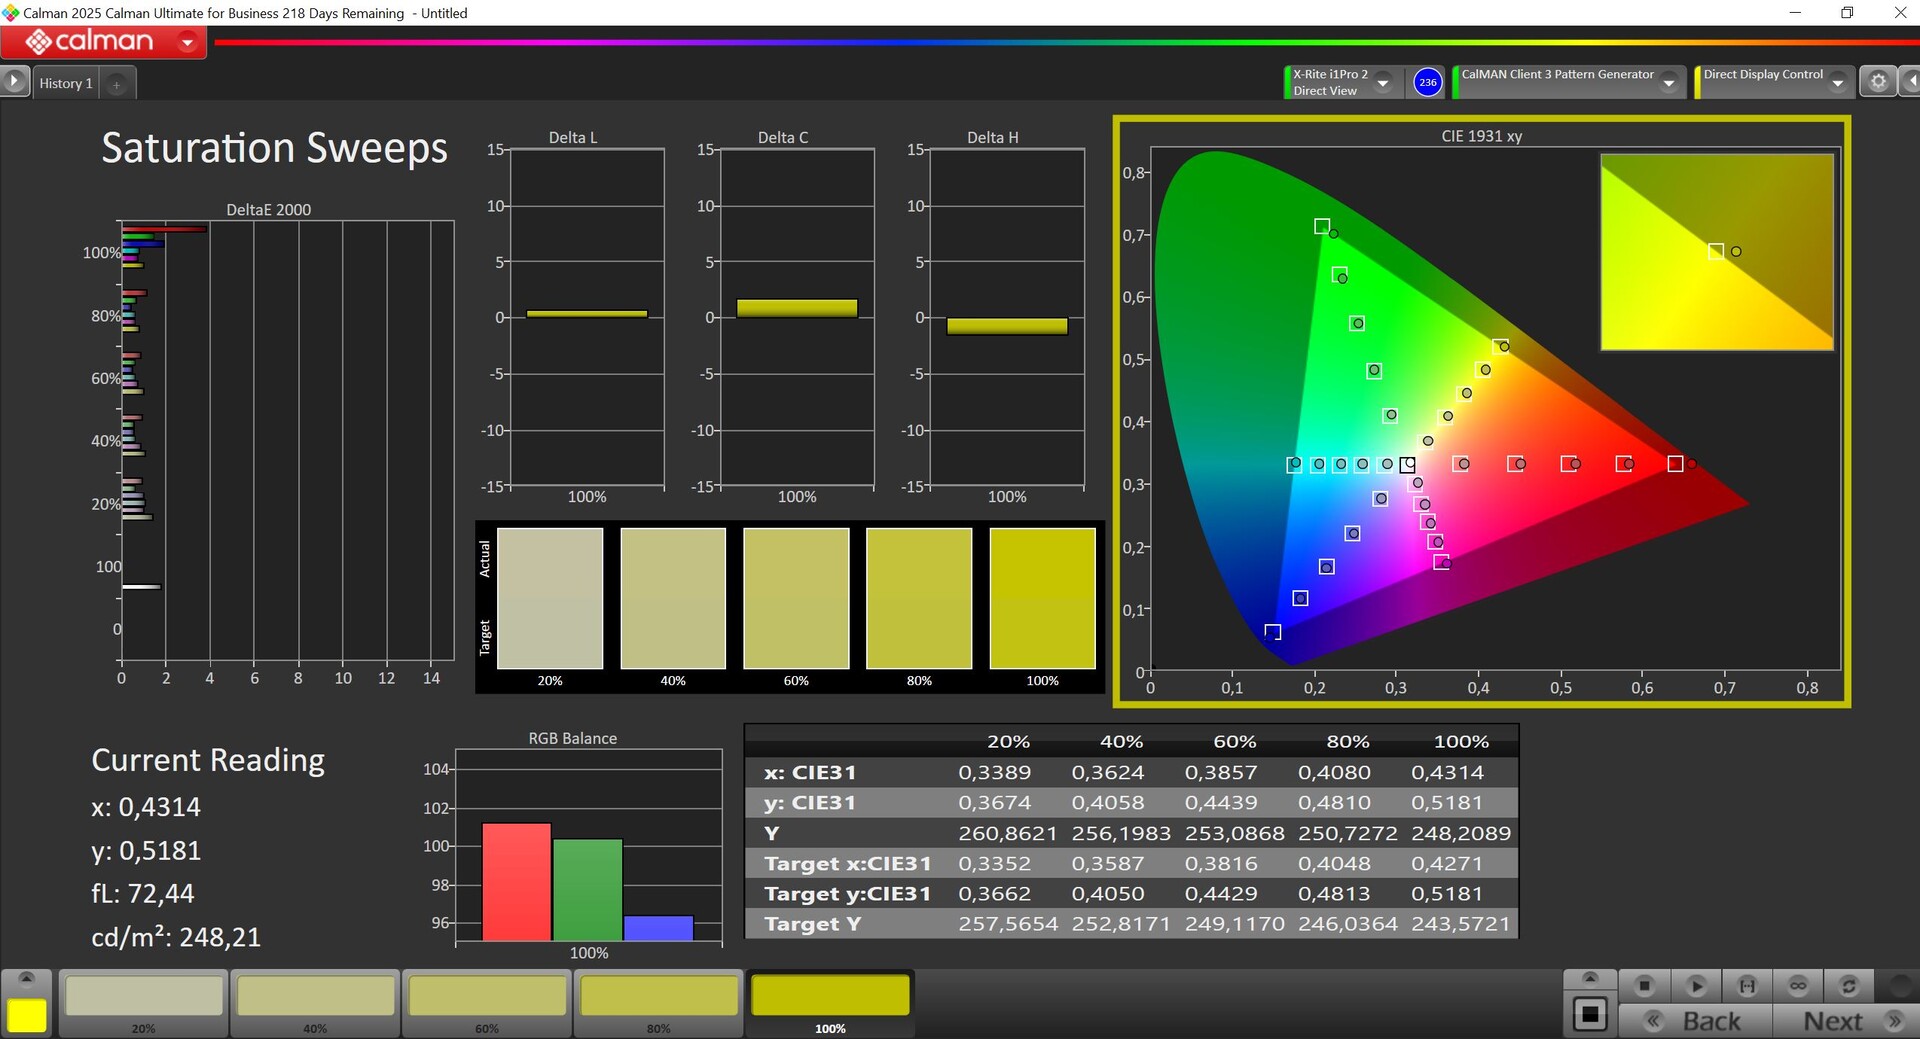

Lenovo offers the X-Rite Color Assistant for the Legion, which can also be downloaded from Lenovo's website. It will then automatically download the calibrated profile from the Lenovo server. We analyzed the panel with the professional CalMAN software and both the P3 as well as the sRGB profile are very accurate. In combination with the full color gamut, the OLED screen is also perfectly suited for picture editing. The panel even covers the AdobeRGB gamut quite comprehensively and the color accuracy is pretty good in general, only 100% red just misses the target value of 3. We were not able to improve the image quality with our own calibration.
Display Response Times
| ↔ Response Time Black to White | ||
|---|---|---|
| 0.4 ms ... rise ↗ and fall ↘ combined | ↗ 0.22 ms rise | 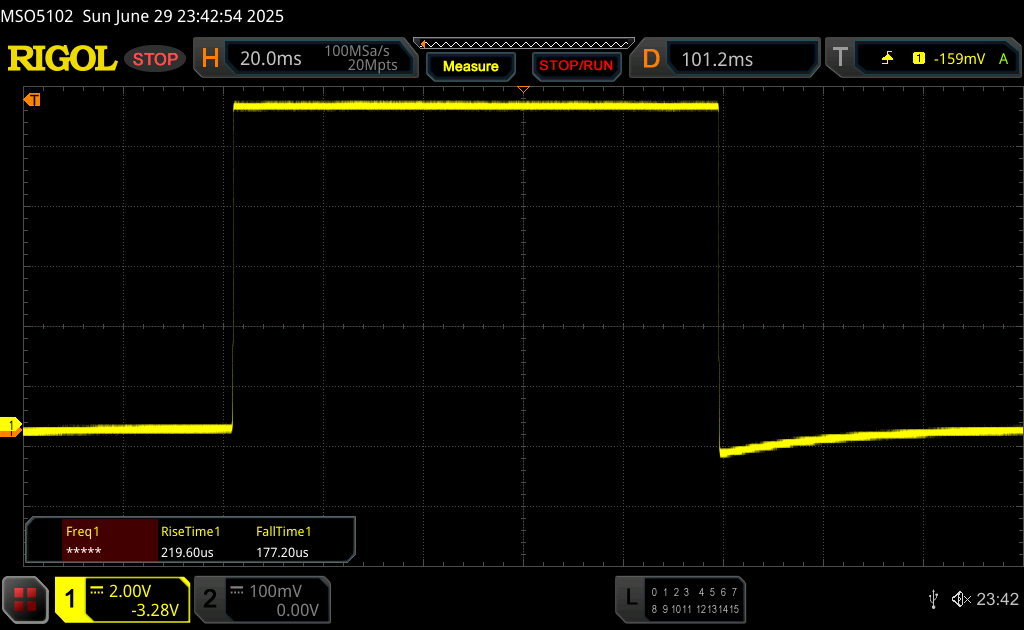 |
| ↘ 0.18 ms fall | ||
| The screen shows very fast response rates in our tests and should be very well suited for fast-paced gaming. In comparison, all tested devices range from 0.1 (minimum) to 240 (maximum) ms. » 0 % of all devices are better. This means that the measured response time is better than the average of all tested devices (19.8 ms). | ||
| ↔ Response Time 50% Grey to 80% Grey | ||
| 0.42 ms ... rise ↗ and fall ↘ combined | ↗ 0.21 ms rise | 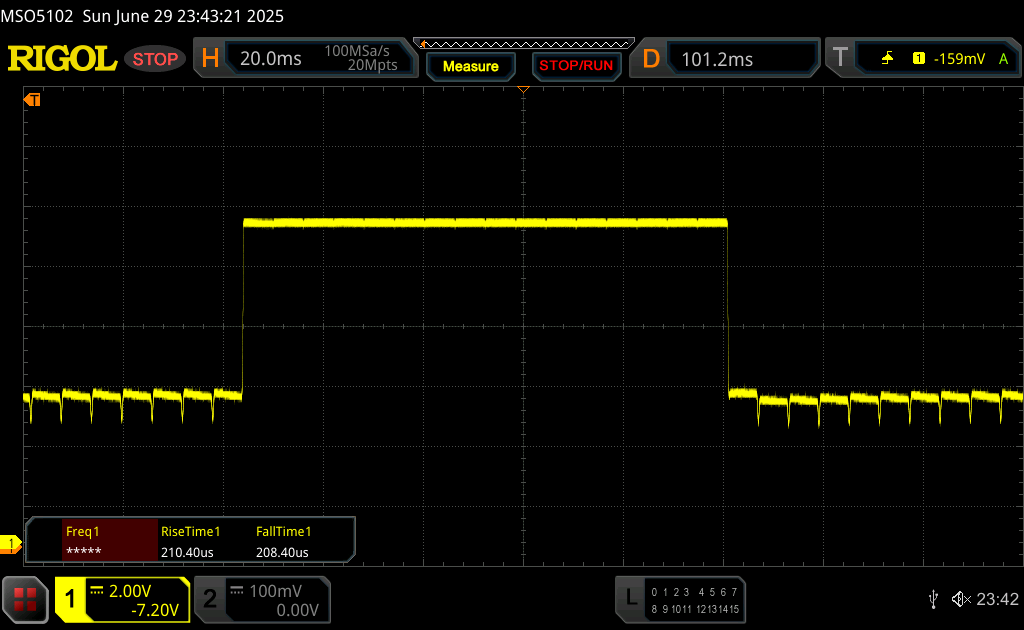 |
| ↘ 0.21 ms fall | ||
| The screen shows very fast response rates in our tests and should be very well suited for fast-paced gaming. In comparison, all tested devices range from 0.165 (minimum) to 636 (maximum) ms. » 1 % of all devices are better. This means that the measured response time is better than the average of all tested devices (31 ms). | ||
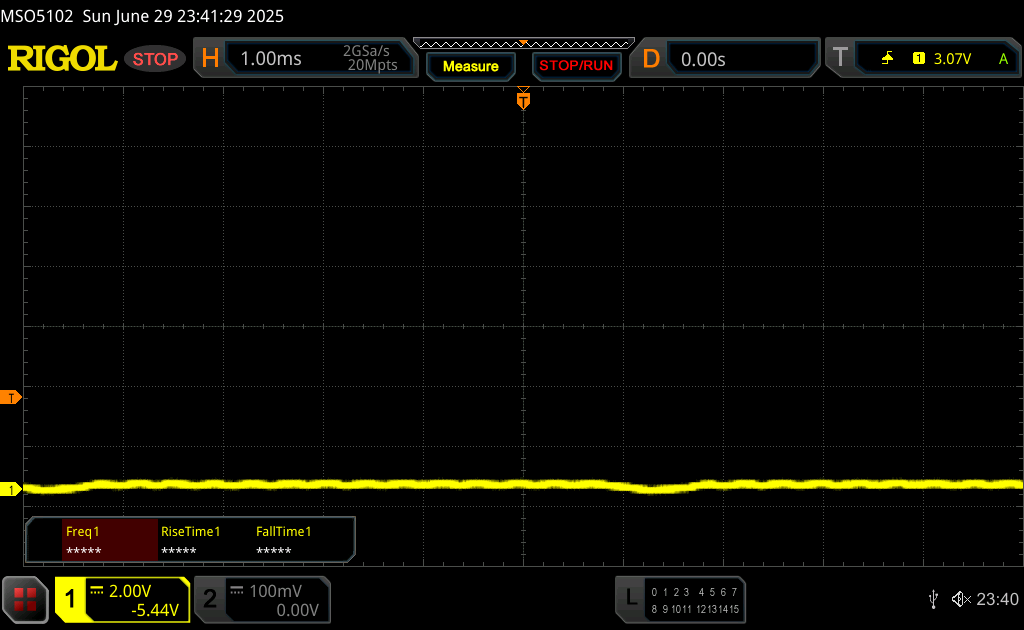
Screen Flickering / PWM (Pulse-Width Modulation)
| Screen flickering / PWM detected | 1152 Hz Amplitude: 11 % | ≤ 44 % brightness setting | 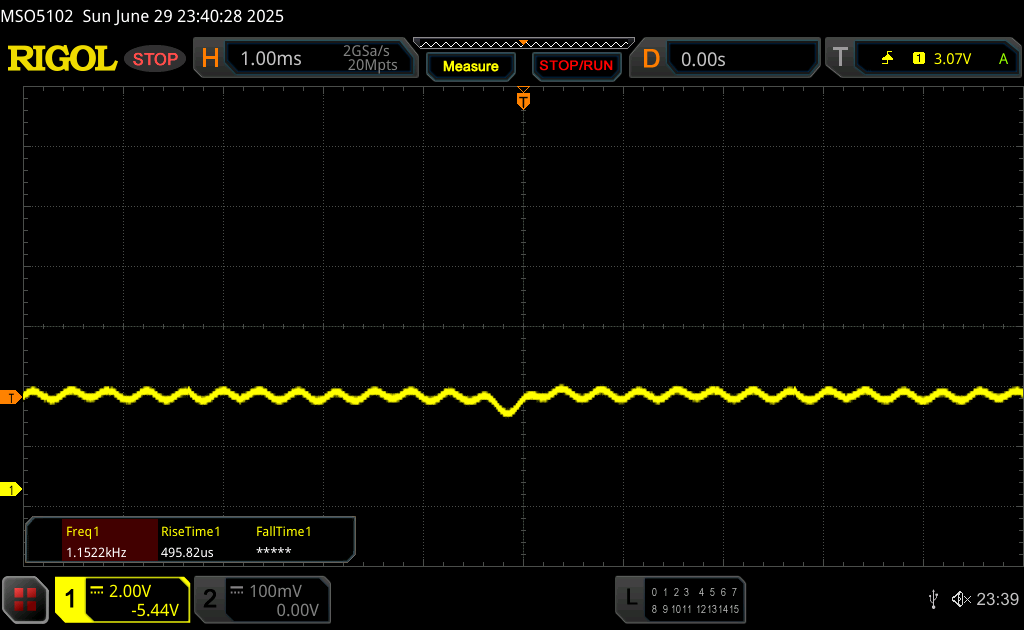 |
The display backlight flickers at 1152 Hz (worst case, e.g., utilizing PWM) Flickering detected at a brightness setting of 44 % and below. There should be no flickering or PWM above this brightness setting. The frequency of 1152 Hz is quite high, so most users sensitive to PWM should not notice any flickering. In comparison: 52 % of all tested devices do not use PWM to dim the display. If PWM was detected, an average of 7747 (minimum: 5 - maximum: 343500) Hz was measured. | |||
We can detect PWM flickering on the OLED panel. In the brightness range between 78-45 %, there is DC dimming at 165 Hz with a small amplitude. At brightness levels of 44 % and lower, we detect a flickering at 1.152 kHz, so there should not be any issues.


The outdoor usability is limited because there will be reflections on the glossy screen. This can also be an issue indoors when light sources or windows create reflections. The viewing angle stability is very good.

Performance - AMD Zen 4 meets Blackwell
Lenovo offers the Legion 5 15 with AMD as well as Intel processors. The two RAM slots can be equipped with up to 64 GB RAM and you can choose between the GeForce RTX 5060 Laptop or the RTX 5070 Laptop (both 115W TGP).
Review settings
Lenovo offers different power profiles, which can be quickly switched via key combination Fn+Q. The color of the status LED shows the active power profile (blue: Battery saver, white: Auto, red: Performance). The impact on the processor performance is small, but you only get the maximum GPU power in Performance mode, which we therefore used for our benchmarks and measurements. If you are running on battery power, you can only use the Auto mode.
| TDP | CB24 Multi | TGP | Time Spy Graphics | Cyberpunk 2077 QHD | max. fan noise | |
|---|---|---|---|---|---|---|
| Battery Saver | 60/50/45 Watts | 903 points | 60 Watts | 9,292 points | 43.4 FPS | 40.4 dB(A) |
| Auto | 85/78 Watts | 985 points | 75 Watts | 10,567 points | 49.1 FPS | 44.5 dB(A) |
| Performance | 85/80 Watts | 1,000 points | 115 Watts | 12,306 points | 57.9 FPS | 50.1 dB(A) |
| Battery (Auto) | 60/50/45 Watts | 903 points | 55 Watts | 8,833 points | 40.9 FPS | 44.5 dB(A) |
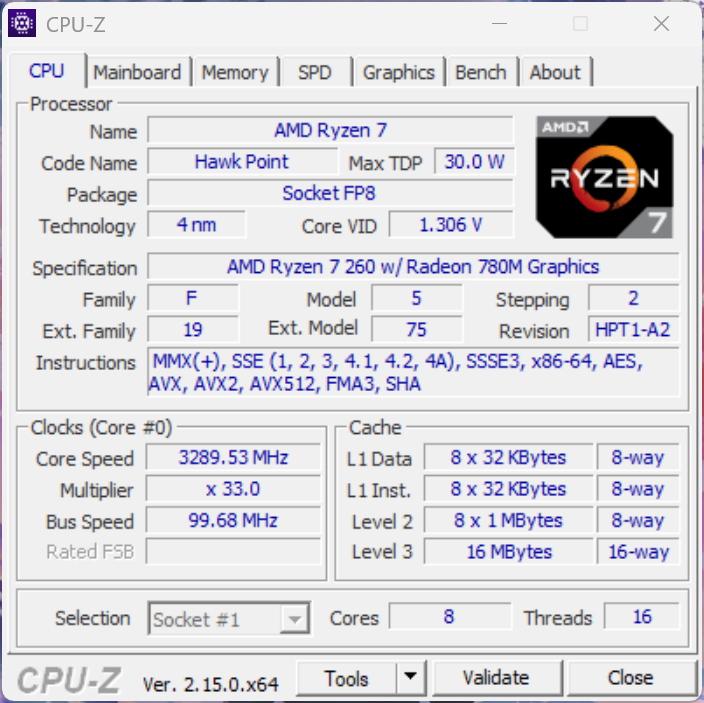
Processor - AMD Ryzen 7 260
The AMD Ryzen 7 260 (Hawk Pint) uses 8 Zen 4 cores with a maximum clock of 5.1 GHz and it is basically a rebranded Ryzen 7 8845HS. The multi-core performance is still good and also stays stable in the case of the Legion. Rather unsurprisingly, the performance is almost exactly on par with the Ryzen 7 8845HS in the XMG Core 15.
Cinebench R15 Multi Loop
Cinebench 2024: CPU Multi Core | CPU Single Core
Cinebench R23: Multi Core | Single Core
Cinebench R20: CPU (Multi Core) | CPU (Single Core)
Cinebench R15: CPU Multi 64Bit | CPU Single 64Bit
Blender: v2.79 BMW27 CPU
7-Zip 18.03: 7z b 4 | 7z b 4 -mmt1
Geekbench 6.7: Multi-Core | Single-Core
Geekbench 5.5: Multi-Core | Single-Core
HWBOT x265 Benchmark v2.2: 4k Preset
LibreOffice : 20 Documents To PDF
R Benchmark 2.5: Overall mean
| CPU Performance rating | |
| Average of class Gaming | |
| Lenovo Legion 5 15AHP G10 | |
| Schenker XMG Core 15 (M24) -2! | |
| Asus TUF Gaming A15 FA507UV | |
| Average AMD Ryzen 7 260 | |
| MSI Katana A15 AI B8VG -2! | |
| Lenovo LOQ 15AHP10 | |
| Gigabyte G5 KF5 2024 -2! | |
| Cinebench 2024 / CPU Multi Core | |
| Average of class Gaming (486 - 2298, n=88, last 2 years) | |
| Lenovo Legion 5 15AHP G10 | |
| Asus TUF Gaming A15 FA507UV | |
| Average AMD Ryzen 7 260 (786 - 1000, n=4) | |
| Lenovo LOQ 15AHP10 | |
| Cinebench 2024 / CPU Single Core | |
| Average of class Gaming (95 - 139.9, n=88, last 2 years) | |
| Lenovo Legion 5 15AHP G10 | |
| Average AMD Ryzen 7 260 (104 - 106.5, n=4) | |
| Lenovo LOQ 15AHP10 | |
| Asus TUF Gaming A15 FA507UV | |
| Cinebench R23 / Multi Core | |
| Average of class Gaming (10488 - 40970, n=106, last 2 years) | |
| Schenker XMG Core 15 (M24) | |
| Lenovo Legion 5 15AHP G10 | |
| Asus TUF Gaming A15 FA507UV | |
| Average AMD Ryzen 7 260 (15864 - 17712, n=6) | |
| MSI Katana A15 AI B8VG | |
| Lenovo LOQ 15AHP10 | |
| Gigabyte G5 KF5 2024 | |
| Cinebench R23 / Single Core | |
| Average of class Gaming (1166 - 2387, n=106, last 2 years) | |
| Gigabyte G5 KF5 2024 | |
| Asus TUF Gaming A15 FA507UV | |
| Lenovo Legion 5 15AHP G10 | |
| Schenker XMG Core 15 (M24) | |
| Average AMD Ryzen 7 260 (1760 - 1801, n=6) | |
| MSI Katana A15 AI B8VG | |
| Lenovo LOQ 15AHP10 | |
| Cinebench R20 / CPU (Multi Core) | |
| Average of class Gaming (4029 - 16108, n=105, last 2 years) | |
| Schenker XMG Core 15 (M24) | |
| Lenovo Legion 5 15AHP G10 | |
| Asus TUF Gaming A15 FA507UV | |
| Average AMD Ryzen 7 260 (6161 - 6969, n=6) | |
| MSI Katana A15 AI B8VG | |
| Lenovo LOQ 15AHP10 | |
| Gigabyte G5 KF5 2024 | |
| Cinebench R20 / CPU (Single Core) | |
| Average of class Gaming (442 - 904, n=105, last 2 years) | |
| Gigabyte G5 KF5 2024 | |
| Lenovo Legion 5 15AHP G10 | |
| Lenovo LOQ 15AHP10 | |
| Schenker XMG Core 15 (M24) | |
| Average AMD Ryzen 7 260 (679 - 697, n=6) | |
| MSI Katana A15 AI B8VG | |
| Asus TUF Gaming A15 FA507UV | |
| Cinebench R15 / CPU Multi 64Bit | |
| Average of class Gaming (1578 - 6271, n=104, last 2 years) | |
| Schenker XMG Core 15 (M24) | |
| Lenovo Legion 5 15AHP G10 | |
| Asus TUF Gaming A15 FA507UV | |
| Average AMD Ryzen 7 260 (2543 - 2831, n=6) | |
| MSI Katana A15 AI B8VG | |
| Lenovo LOQ 15AHP10 | |
| Gigabyte G5 KF5 2024 | |
| Cinebench R15 / CPU Single 64Bit | |
| Average of class Gaming (188.8 - 344, n=105, last 2 years) | |
| Asus TUF Gaming A15 FA507UV | |
| Lenovo Legion 5 15AHP G10 | |
| Schenker XMG Core 15 (M24) | |
| Lenovo LOQ 15AHP10 | |
| Average AMD Ryzen 7 260 (275 - 283, n=6) | |
| Gigabyte G5 KF5 2024 | |
| MSI Katana A15 AI B8VG | |
| Blender / v2.79 BMW27 CPU | |
| Gigabyte G5 KF5 2024 | |
| Lenovo LOQ 15AHP10 | |
| MSI Katana A15 AI B8VG | |
| Average AMD Ryzen 7 260 (182 - 204, n=6) | |
| Lenovo Legion 5 15AHP G10 | |
| Asus TUF Gaming A15 FA507UV | |
| Schenker XMG Core 15 (M24) | |
| Average of class Gaming (80 - 330, n=103, last 2 years) | |
| 7-Zip 18.03 / 7z b 4 | |
| Average of class Gaming (33491 - 148086, n=104, last 2 years) | |
| Schenker XMG Core 15 (M24) | |
| Asus TUF Gaming A15 FA507UV | |
| Lenovo Legion 5 15AHP G10 | |
| Average AMD Ryzen 7 260 (63076 - 73490, n=6) | |
| MSI Katana A15 AI B8VG | |
| Lenovo LOQ 15AHP10 | |
| Gigabyte G5 KF5 2024 | |
| 7-Zip 18.03 / 7z b 4 -mmt1 | |
| Asus TUF Gaming A15 FA507UV | |
| Schenker XMG Core 15 (M24) | |
| MSI Katana A15 AI B8VG | |
| Lenovo Legion 5 15AHP G10 | |
| Lenovo LOQ 15AHP10 | |
| Average AMD Ryzen 7 260 (6101 - 6575, n=6) | |
| Average of class Gaming (4199 - 7436, n=104, last 2 years) | |
| Gigabyte G5 KF5 2024 | |
| Geekbench 6.7 / Multi-Core | |
| Average of class Gaming (6625 - 22104, n=105, last 2 years) | |
| Schenker XMG Core 15 (M24) | |
| Lenovo Legion 5 15AHP G10 | |
| Gigabyte G5 KF5 2024 | |
| Asus TUF Gaming A15 FA507UV | |
| Average AMD Ryzen 7 260 (9977 - 13349, n=6) | |
| MSI Katana A15 AI B8VG | |
| Lenovo LOQ 15AHP10 | |
| Geekbench 6.7 / Single-Core | |
| Average of class Gaming (1490 - 3259, n=105, last 2 years) | |
| Asus TUF Gaming A15 FA507UV | |
| Schenker XMG Core 15 (M24) | |
| Lenovo Legion 5 15AHP G10 | |
| Average AMD Ryzen 7 260 (2622 - 2686, n=6) | |
| Lenovo LOQ 15AHP10 | |
| Gigabyte G5 KF5 2024 | |
| MSI Katana A15 AI B8VG | |
| Geekbench 5.5 / Multi-Core | |
| Average of class Gaming (6460 - 27010, n=104, last 2 years) | |
| Schenker XMG Core 15 (M24) | |
| Lenovo Legion 5 15AHP G10 | |
| Asus TUF Gaming A15 FA507UV | |
| Gigabyte G5 KF5 2024 | |
| Average AMD Ryzen 7 260 (9837 - 12597, n=6) | |
| MSI Katana A15 AI B8VG | |
| Lenovo LOQ 15AHP10 | |
| Geekbench 5.5 / Single-Core | |
| Average of class Gaming (986 - 2474, n=104, last 2 years) | |
| Asus TUF Gaming A15 FA507UV | |
| Lenovo Legion 5 15AHP G10 | |
| Schenker XMG Core 15 (M24) | |
| MSI Katana A15 AI B8VG | |
| Average AMD Ryzen 7 260 (1836 - 1986, n=6) | |
| Lenovo LOQ 15AHP10 | |
| Gigabyte G5 KF5 2024 | |
| HWBOT x265 Benchmark v2.2 / 4k Preset | |
| Average of class Gaming (11.5 - 44.3, n=104, last 2 years) | |
| Schenker XMG Core 15 (M24) | |
| Lenovo Legion 5 15AHP G10 | |
| Asus TUF Gaming A15 FA507UV | |
| Average AMD Ryzen 7 260 (17.6 - 22.4, n=6) | |
| MSI Katana A15 AI B8VG | |
| Lenovo LOQ 15AHP10 | |
| Gigabyte G5 KF5 2024 | |
| LibreOffice / 20 Documents To PDF | |
| Average AMD Ryzen 7 260 (49.6 - 66.3, n=6) | |
| MSI Katana A15 AI B8VG | |
| Lenovo LOQ 15AHP10 | |
| Gigabyte G5 KF5 2024 | |
| Lenovo Legion 5 15AHP G10 | |
| Average of class Gaming (33.2 - 88.8, n=104, last 2 years) | |
| Schenker XMG Core 15 (M24) | |
| Asus TUF Gaming A15 FA507UV | |
| R Benchmark 2.5 / Overall mean | |
| Lenovo LOQ 15AHP10 | |
| Gigabyte G5 KF5 2024 | |
| Lenovo Legion 5 15AHP G10 | |
| Average AMD Ryzen 7 260 (0.4416 - 0.4479, n=6) | |
| Schenker XMG Core 15 (M24) | |
| MSI Katana A15 AI B8VG | |
| Asus TUF Gaming A15 FA507UV | |
| Average of class Gaming (0.3439 - 0.759, n=105, last 2 years) | |
* ... smaller is better
AIDA64: FP32 Ray-Trace | FPU Julia | CPU SHA3 | CPU Queen | FPU SinJulia | FPU Mandel | CPU AES | CPU ZLib | FP64 Ray-Trace | CPU PhotoWorxx
| Performance rating | |
| Average of class Gaming | |
| Schenker XMG Core 15 (M24) | |
| Asus TUF Gaming A15 FA507UV | |
| Lenovo Legion 5 15AHP G10 | |
| Average AMD Ryzen 7 260 | |
| MSI Katana A15 AI B8VG | |
| Lenovo LOQ 15AHP10 | |
| Gigabyte G5 KF5 2024 | |
| AIDA64 / FP32 Ray-Trace | |
| Average of class Gaming (10227 - 85542, n=103, last 2 years) | |
| Schenker XMG Core 15 (M24) | |
| Lenovo Legion 5 15AHP G10 | |
| Asus TUF Gaming A15 FA507UV | |
| Average AMD Ryzen 7 260 (25995 - 29330, n=6) | |
| MSI Katana A15 AI B8VG | |
| Lenovo LOQ 15AHP10 | |
| Gigabyte G5 KF5 2024 | |
| AIDA64 / FPU Julia | |
| Average of class Gaming (51376 - 238426, n=103, last 2 years) | |
| Schenker XMG Core 15 (M24) | |
| Asus TUF Gaming A15 FA507UV | |
| Lenovo Legion 5 15AHP G10 | |
| Average AMD Ryzen 7 260 (106250 - 121427, n=6) | |
| MSI Katana A15 AI B8VG | |
| Lenovo LOQ 15AHP10 | |
| Gigabyte G5 KF5 2024 | |
| AIDA64 / CPU SHA3 | |
| Average of class Gaming (2180 - 9817, n=103, last 2 years) | |
| Schenker XMG Core 15 (M24) | |
| Asus TUF Gaming A15 FA507UV | |
| Lenovo Legion 5 15AHP G10 | |
| Average AMD Ryzen 7 260 (4636 - 5026, n=6) | |
| MSI Katana A15 AI B8VG | |
| Lenovo LOQ 15AHP10 | |
| Gigabyte G5 KF5 2024 | |
| AIDA64 / CPU Queen | |
| Asus TUF Gaming A15 FA507UV | |
| Schenker XMG Core 15 (M24) | |
| Lenovo Legion 5 15AHP G10 | |
| Average AMD Ryzen 7 260 (115108 - 123832, n=5) | |
| MSI Katana A15 AI B8VG | |
| Average of class Gaming (49785 - 173351, n=89, last 2 years) | |
| Lenovo LOQ 15AHP10 | |
| Gigabyte G5 KF5 2024 | |
| AIDA64 / FPU SinJulia | |
| Asus TUF Gaming A15 FA507UV | |
| Schenker XMG Core 15 (M24) | |
| Lenovo Legion 5 15AHP G10 | |
| MSI Katana A15 AI B8VG | |
| Average AMD Ryzen 7 260 (14810 - 15497, n=6) | |
| Lenovo LOQ 15AHP10 | |
| Average of class Gaming (4424 - 33636, n=103, last 2 years) | |
| Gigabyte G5 KF5 2024 | |
| AIDA64 / FPU Mandel | |
| Average of class Gaming (25115 - 128721, n=103, last 2 years) | |
| Schenker XMG Core 15 (M24) | |
| Asus TUF Gaming A15 FA507UV | |
| Lenovo Legion 5 15AHP G10 | |
| Average AMD Ryzen 7 260 (56974 - 65308, n=6) | |
| MSI Katana A15 AI B8VG | |
| Lenovo LOQ 15AHP10 | |
| Gigabyte G5 KF5 2024 | |
| AIDA64 / CPU AES | |
| Average of class Gaming (39258 - 247074, n=103, last 2 years) | |
| Schenker XMG Core 15 (M24) | |
| Asus TUF Gaming A15 FA507UV | |
| MSI Katana A15 AI B8VG | |
| Average AMD Ryzen 7 260 (66825 - 91381, n=6) | |
| Lenovo Legion 5 15AHP G10 | |
| Lenovo LOQ 15AHP10 | |
| Gigabyte G5 KF5 2024 | |
| AIDA64 / CPU ZLib | |
| Average of class Gaming (574 - 2531, n=103, last 2 years) | |
| Asus TUF Gaming A15 FA507UV | |
| Lenovo Legion 5 15AHP G10 | |
| Average AMD Ryzen 7 260 (1039 - 1133, n=6) | |
| MSI Katana A15 AI B8VG | |
| Lenovo LOQ 15AHP10 | |
| Schenker XMG Core 15 (M24) | |
| Gigabyte G5 KF5 2024 | |
| AIDA64 / FP64 Ray-Trace | |
| Average of class Gaming (5509 - 45446, n=103, last 2 years) | |
| Schenker XMG Core 15 (M24) | |
| Lenovo Legion 5 15AHP G10 | |
| Asus TUF Gaming A15 FA507UV | |
| Average AMD Ryzen 7 260 (13944 - 15751, n=6) | |
| MSI Katana A15 AI B8VG | |
| Lenovo LOQ 15AHP10 | |
| Gigabyte G5 KF5 2024 | |
| AIDA64 / CPU PhotoWorxx | |
| Average of class Gaming (12271 - 89891, n=103, last 2 years) | |
| Schenker XMG Core 15 (M24) | |
| Lenovo Legion 5 15AHP G10 | |
| Average AMD Ryzen 7 260 (23097 - 40796, n=6) | |
| Asus TUF Gaming A15 FA507UV | |
| MSI Katana A15 AI B8VG | |
| Gigabyte G5 KF5 2024 | |
| Lenovo LOQ 15AHP10 | |
System Performance
The Legion 5 15 is a fast companion and can also handle more complex tasks with ease. We did not experience any stability issues during our review period and the benchmark results do not suggest any performance bottlenecks, either.
PCMark 10: Score | Essentials | Productivity | Digital Content Creation
CrossMark: Overall | Productivity | Creativity | Responsiveness
WebXPRT 3: Overall
WebXPRT 4: Overall
Mozilla Kraken 1.1: Total
| Performance rating | |
| Average of class Gaming | |
| Schenker XMG Core 15 (M24) | |
| Lenovo Legion 5 15AHP G10 | |
| Asus TUF Gaming A15 FA507UV | |
| Average AMD Ryzen 7 260, NVIDIA GeForce RTX 5060 Laptop | |
| Gigabyte G5 KF5 2024 -2! | |
| Lenovo LOQ 15AHP10 -2! | |
| MSI Katana A15 AI B8VG -4! | |
| PCMark 10 / Score | |
| Schenker XMG Core 15 (M24) | |
| Average of class Gaming (5828 - 11730, n=92, last 2 years) | |
| Average AMD Ryzen 7 260, NVIDIA GeForce RTX 5060 Laptop (8241 - 8567, n=2) | |
| Lenovo Legion 5 15AHP G10 | |
| Asus TUF Gaming A15 FA507UV | |
| MSI Katana A15 AI B8VG | |
| Lenovo LOQ 15AHP10 | |
| Gigabyte G5 KF5 2024 | |
| PCMark 10 / Essentials | |
| Asus TUF Gaming A15 FA507UV | |
| Lenovo Legion 5 15AHP G10 | |
| Average of class Gaming (8810 - 11935, n=96, last 2 years) | |
| Gigabyte G5 KF5 2024 | |
| Average AMD Ryzen 7 260, NVIDIA GeForce RTX 5060 Laptop (9920 - 10806, n=2) | |
| Lenovo LOQ 15AHP10 | |
| Schenker XMG Core 15 (M24) | |
| MSI Katana A15 AI B8VG | |
| PCMark 10 / Productivity | |
| Schenker XMG Core 15 (M24) | |
| Average AMD Ryzen 7 260, NVIDIA GeForce RTX 5060 Laptop (10163 - 14632, n=2) | |
| Average of class Gaming (6845 - 21327, n=94, last 2 years) | |
| Asus TUF Gaming A15 FA507UV | |
| Lenovo Legion 5 15AHP G10 | |
| Gigabyte G5 KF5 2024 | |
| MSI Katana A15 AI B8VG | |
| Lenovo LOQ 15AHP10 | |
| PCMark 10 / Digital Content Creation | |
| Average of class Gaming (7602 - 19954, n=94, last 2 years) | |
| Lenovo Legion 5 15AHP G10 | |
| Average AMD Ryzen 7 260, NVIDIA GeForce RTX 5060 Laptop (11756 - 13832, n=2) | |
| Schenker XMG Core 15 (M24) | |
| MSI Katana A15 AI B8VG | |
| Asus TUF Gaming A15 FA507UV | |
| Lenovo LOQ 15AHP10 | |
| Gigabyte G5 KF5 2024 | |
| CrossMark / Overall | |
| Gigabyte G5 KF5 2024 | |
| Average of class Gaming (1366 - 2409, n=93, last 2 years) | |
| Schenker XMG Core 15 (M24) | |
| Asus TUF Gaming A15 FA507UV | |
| Lenovo Legion 5 15AHP G10 | |
| Lenovo LOQ 15AHP10 | |
| Average AMD Ryzen 7 260, NVIDIA GeForce RTX 5060 Laptop (1658 - 1792, n=2) | |
| CrossMark / Productivity | |
| Gigabyte G5 KF5 2024 | |
| Average of class Gaming (1386 - 2254, n=93, last 2 years) | |
| Schenker XMG Core 15 (M24) | |
| Lenovo LOQ 15AHP10 | |
| Asus TUF Gaming A15 FA507UV | |
| Lenovo Legion 5 15AHP G10 | |
| Average AMD Ryzen 7 260, NVIDIA GeForce RTX 5060 Laptop (1610 - 1712, n=2) | |
| CrossMark / Creativity | |
| Average of class Gaming (1343 - 2729, n=93, last 2 years) | |
| Schenker XMG Core 15 (M24) | |
| Gigabyte G5 KF5 2024 | |
| Lenovo Legion 5 15AHP G10 | |
| Asus TUF Gaming A15 FA507UV | |
| Average AMD Ryzen 7 260, NVIDIA GeForce RTX 5060 Laptop (1827 - 1957, n=2) | |
| Lenovo LOQ 15AHP10 | |
| CrossMark / Responsiveness | |
| Gigabyte G5 KF5 2024 | |
| Average of class Gaming (1226 - 2334, n=93, last 2 years) | |
| Lenovo LOQ 15AHP10 | |
| Schenker XMG Core 15 (M24) | |
| Asus TUF Gaming A15 FA507UV | |
| Lenovo Legion 5 15AHP G10 | |
| Average AMD Ryzen 7 260, NVIDIA GeForce RTX 5060 Laptop (1355 - 1580, n=2) | |
| WebXPRT 3 / Overall | |
| Average of class Gaming (220 - 532, n=97, last 2 years) | |
| Asus TUF Gaming A15 FA507UV | |
| Lenovo Legion 5 15AHP G10 | |
| Schenker XMG Core 15 (M24) | |
| Average AMD Ryzen 7 260, NVIDIA GeForce RTX 5060 Laptop (286 - 308, n=2) | |
| MSI Katana A15 AI B8VG | |
| WebXPRT 4 / Overall | |
| Average of class Gaming (165 - 354, n=97, last 2 years) | |
| Schenker XMG Core 15 (M24) | |
| Asus TUF Gaming A15 FA507UV | |
| Lenovo Legion 5 15AHP G10 | |
| Average AMD Ryzen 7 260, NVIDIA GeForce RTX 5060 Laptop (234 - 261, n=2) | |
| MSI Katana A15 AI B8VG | |
| Mozilla Kraken 1.1 / Total | |
| MSI Katana A15 AI B8VG | |
| MSI Katana A15 AI B8VG | |
| Lenovo LOQ 15AHP10 | |
| Average AMD Ryzen 7 260, NVIDIA GeForce RTX 5060 Laptop (494 - 533, n=2) | |
| Gigabyte G5 KF5 2024 | |
| Asus TUF Gaming A15 FA507UV | |
| Schenker XMG Core 15 (M24) | |
| Lenovo Legion 5 15AHP G10 | |
| Average of class Gaming (391 - 590, n=99, last 2 years) | |
* ... smaller is better
| PCMark 10 Score | 8241 points | |
Help | ||
| AIDA64 / Memory Copy | |
| Average of class Gaming (21750 - 129946, n=103, last 2 years) | |
| Schenker XMG Core 15 (M24) | |
| Lenovo Legion 5 15AHP G10 | |
| MSI Katana A15 AI B8VG | |
| Asus TUF Gaming A15 FA507UV | |
| Average AMD Ryzen 7 260 (35762 - 69413, n=6) | |
| Gigabyte G5 KF5 2024 | |
| Lenovo LOQ 15AHP10 | |
| AIDA64 / Memory Read | |
| Average of class Gaming (22956 - 118858, n=103, last 2 years) | |
| Asus TUF Gaming A15 FA507UV | |
| MSI Katana A15 AI B8VG | |
| Schenker XMG Core 15 (M24) | |
| Lenovo Legion 5 15AHP G10 | |
| Gigabyte G5 KF5 2024 | |
| Average AMD Ryzen 7 260 (30070 - 61363, n=6) | |
| Lenovo LOQ 15AHP10 | |
| AIDA64 / Memory Write | |
| Schenker XMG Core 15 (M24) | |
| Lenovo Legion 5 15AHP G10 | |
| Asus TUF Gaming A15 FA507UV | |
| MSI Katana A15 AI B8VG | |
| Average of class Gaming (22297 - 135096, n=103, last 2 years) | |
| Average AMD Ryzen 7 260 (42757 - 87114, n=6) | |
| Gigabyte G5 KF5 2024 | |
| Lenovo LOQ 15AHP10 | |
| AIDA64 / Memory Latency | |
| Average of class Gaming (75.3 - 259, n=103, last 2 years) | |
| Gigabyte G5 KF5 2024 | |
| Lenovo LOQ 15AHP10 | |
| Asus TUF Gaming A15 FA507UV | |
| Average AMD Ryzen 7 260 (90.8 - 94.1, n=6) | |
| Lenovo Legion 5 15AHP G10 | |
| MSI Katana A15 AI B8VG | |
| Schenker XMG Core 15 (M24) | |
* ... smaller is better
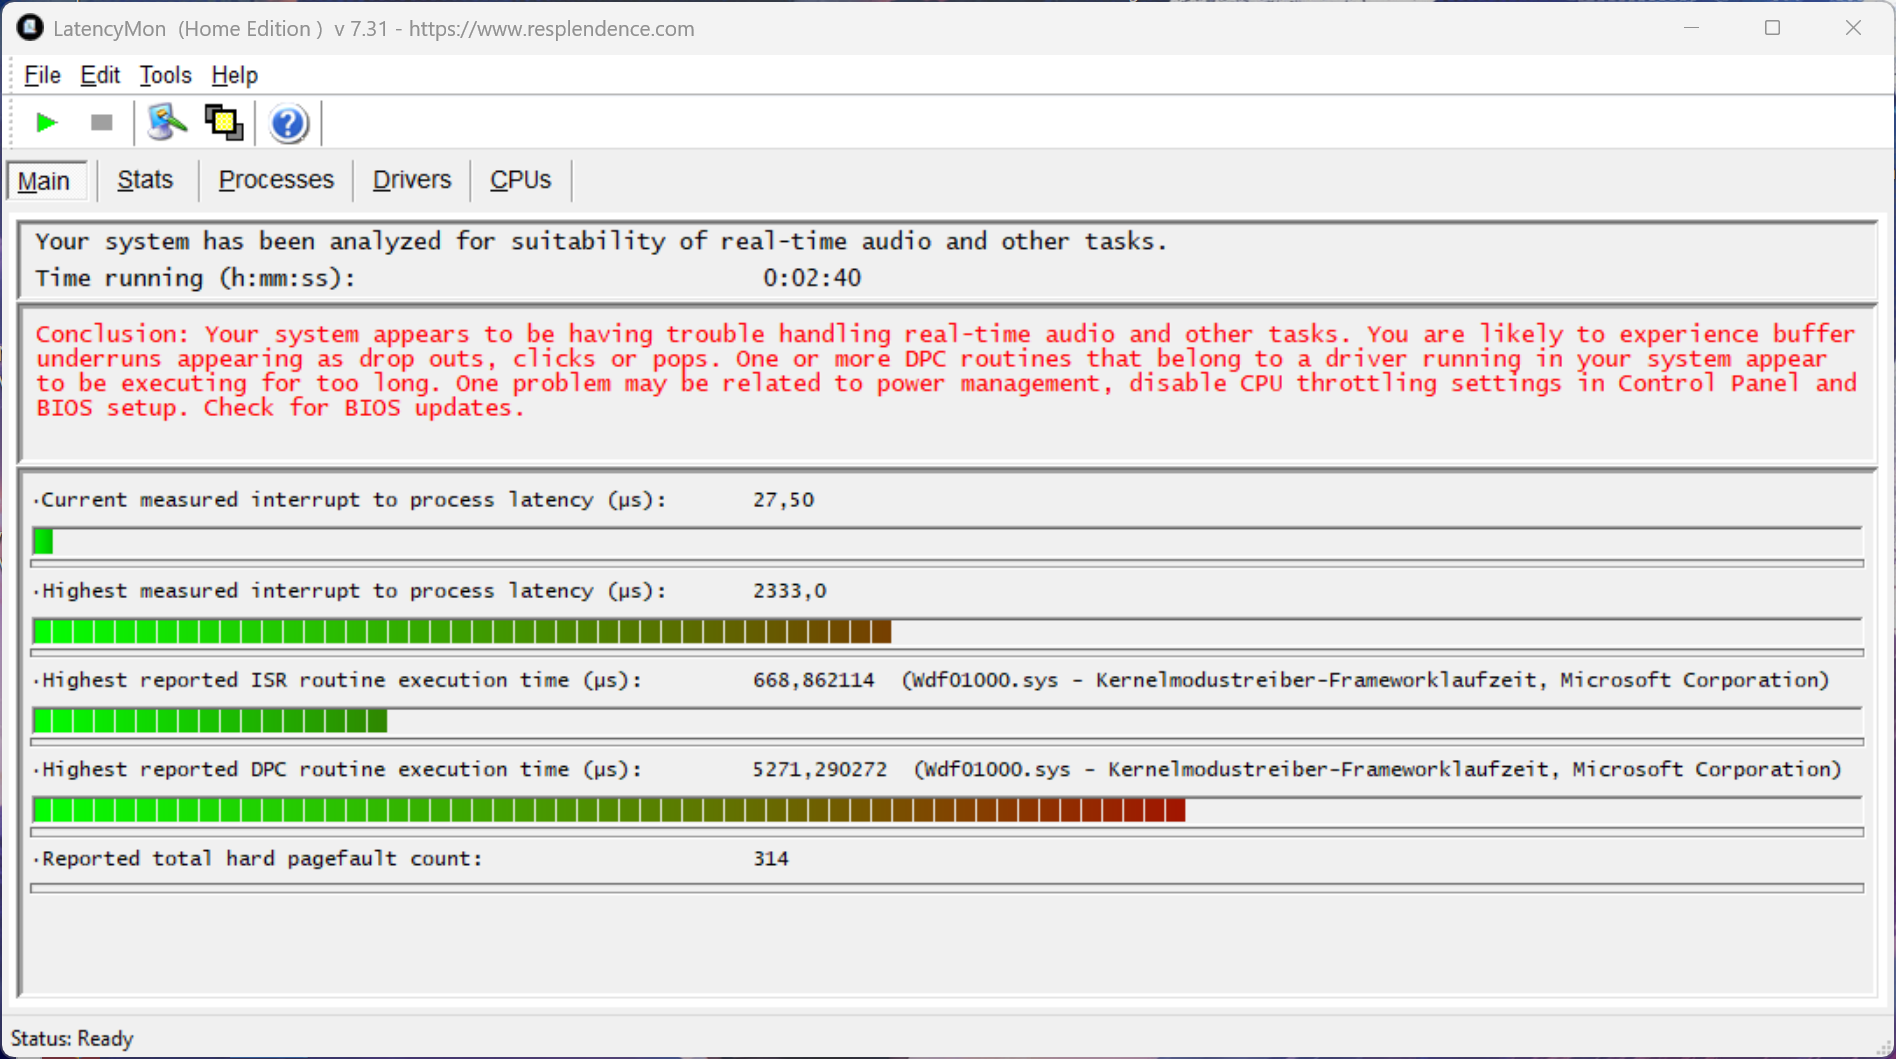
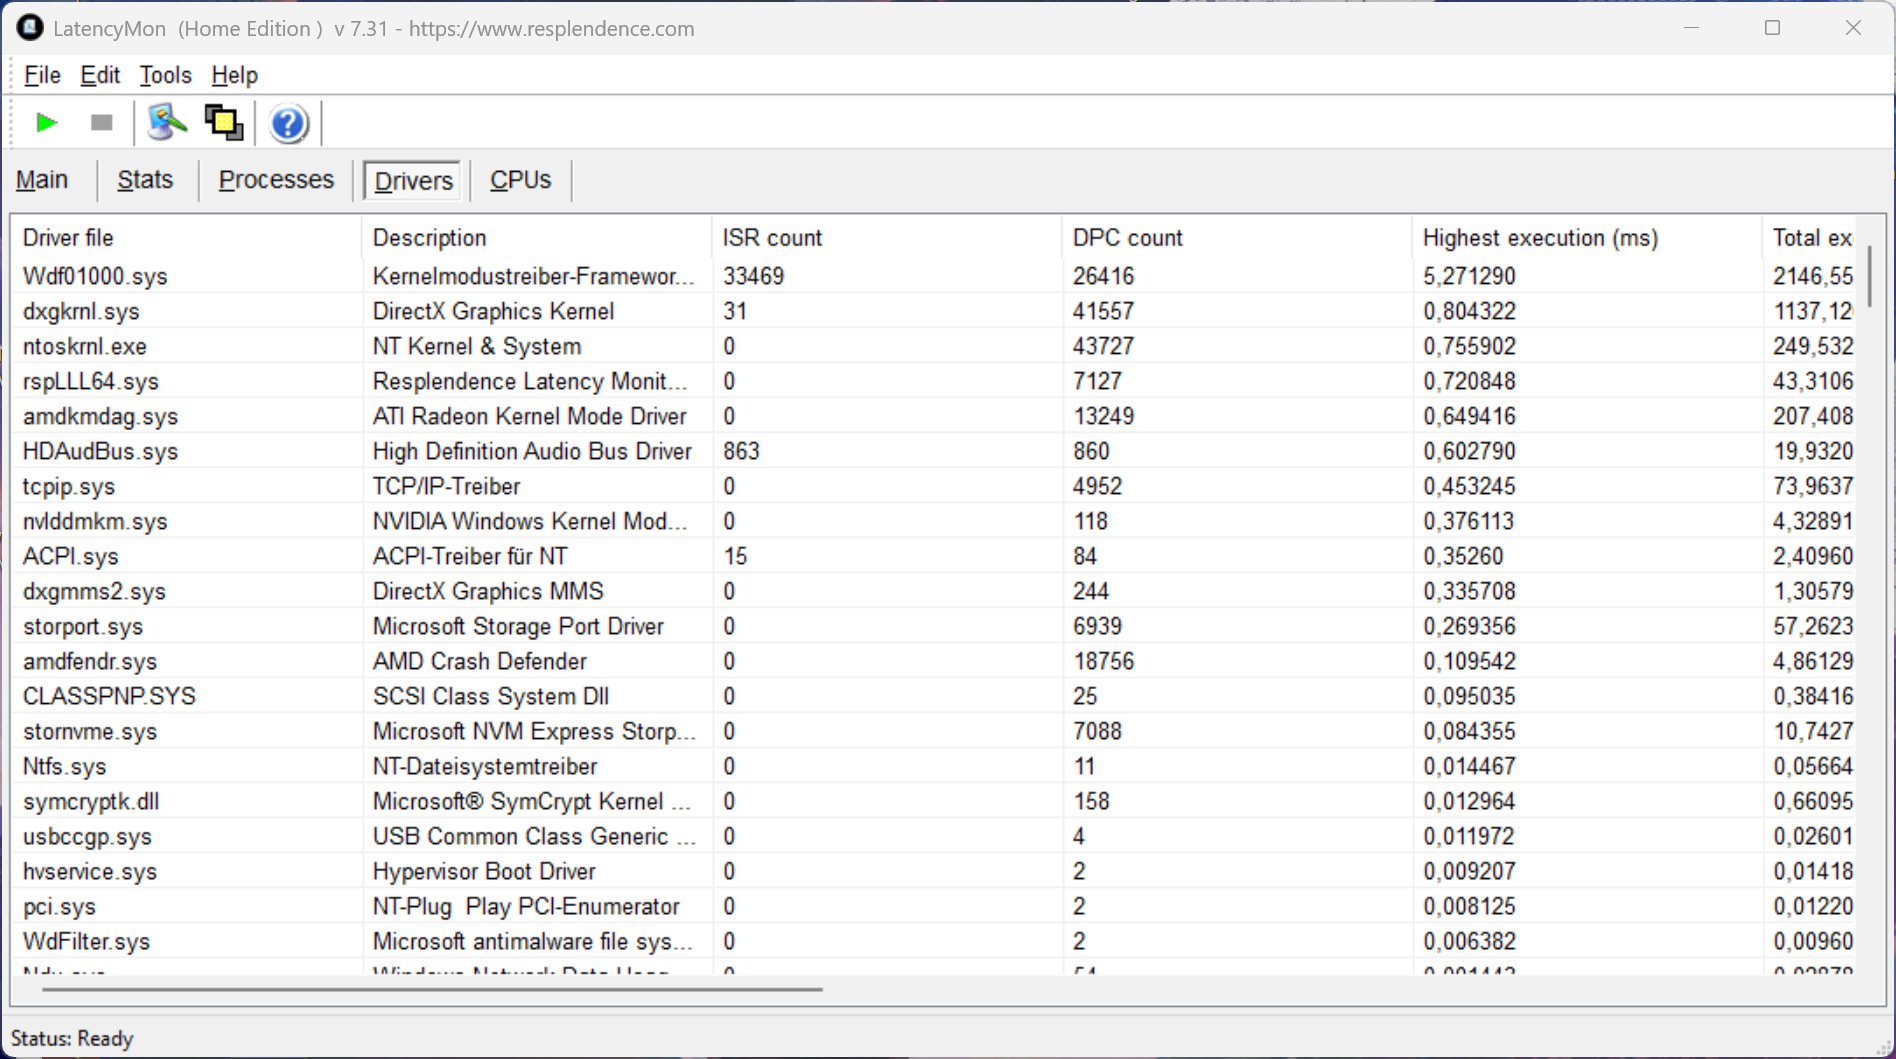
DPC Latency
Our review unit with the latest BIOS version shows limitations for real-time audio applications in our standardized latency test (web browsing, 4K YouTube playback, CPU load).
| DPC Latencies / LatencyMon - interrupt to process latency (max), Web, Youtube, Prime95 | |
| Gigabyte G5 KF5 2024 | |
| MSI Katana A15 AI B8VG | |
| Lenovo Legion 5 15AHP G10 | |
| Lenovo LOQ 15AHP10 | |
| Schenker XMG Core 15 (M24) | |
| Asus TUF Gaming A15 FA507UV | |
* ... smaller is better
Storage Devices
The Legion is shipped with a compact M.2-2242 SSD attached via PCIe 4.0 by default. Our review unit is equipped with the 1 TB version of the SK hynix PVC10. Transfer rates are excellent and the performance does not drop under sustained workloads, either. There is also an empty M.2-2280 slot (PCIe 4.0), so it is easy and cheap to expand the storage capacity.


* ... smaller is better
Disk throttling: DiskSpd Read Loop, Queue Depth 8
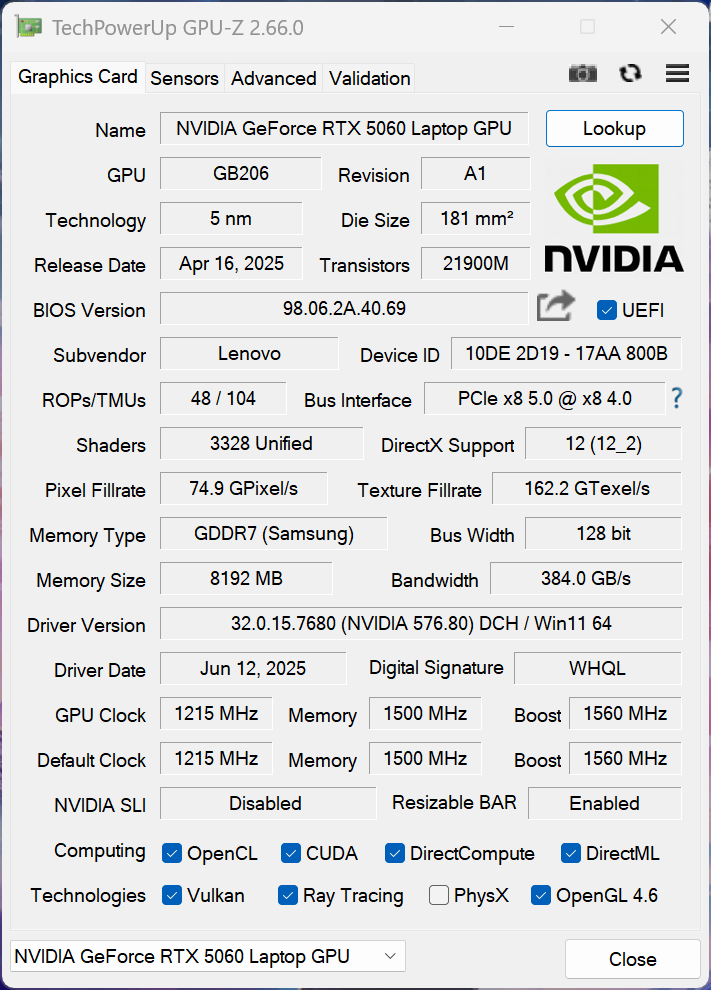
GPU Performance
The discrete graphics card in our review unit is the new Nvidia GeForce RTX 5060 Laptop with 8 GB VRAM. Lenovo uses the regular Optimus technology for GPU switching, but you can also deactivate the iGPU or dGPU completely in the BIOS if desired. It is the fastest version of the 5060 Laptop with a TGP of 115 Watts (90 Watts + 25 Watts Dynamic Boost). The new RTX 5060 laptop is just 7 % slower than the 115W version of the RTX 5070 Laptop in the Razer Blade 14 in our synthetic benchmarks, while the advantage over the fastest RTX 4060 Laptop is 9 %. However, the majority of devices with the RTX 4070 Laptop or the RTX 4060 Laptop are even slower. The GPU performance is completely stable under sustained load.
| 3DMark 11 Performance | 35012 points | |
| 3DMark Fire Strike Score | 29189 points | |
| 3DMark Time Spy Score | 12037 points | |
| 3DMark Steel Nomad Score | 2671 points | |
| 3DMark Steel Nomad Light Score | 12307 points | |
| 3DMark Steel Nomad Light Unlimited Score | 11971 points | |
Help | ||
| Blender / v3.3 Classroom OPTIX/RTX | |
| Gigabyte G5 KF5 2024 | |
| MSI Katana A15 AI B8VG | |
| Average NVIDIA GeForce RTX 5060 Laptop (20 - 28, n=18) | |
| Asus TUF Gaming A15 FA507UV | |
| Lenovo LOQ 15AHP10 | |
| Lenovo Legion 5 15AHP G10 | |
| Schenker XMG Core 15 (M24) | |
| Average of class Gaming (9 - 32, n=105, last 2 years) | |
| Blender / v3.3 Classroom CUDA | |
| Average NVIDIA GeForce RTX 5060 Laptop (38 - 186, n=19) | |
| Gigabyte G5 KF5 2024 | |
| Asus TUF Gaming A15 FA507UV | |
| Schenker XMG Core 15 (M24) | |
| Lenovo LOQ 15AHP10 | |
| Lenovo Legion 5 15AHP G10 | |
| MSI Katana A15 AI B8VG | |
| Average of class Gaming (15 - 228, n=105, last 2 years) | |
| Blender / v3.3 Classroom CPU | |
| Gigabyte G5 KF5 2024 | |
| Lenovo LOQ 15AHP10 | |
| MSI Katana A15 AI B8VG | |
| Asus TUF Gaming A15 FA507UV | |
| Lenovo Legion 5 15AHP G10 | |
| Schenker XMG Core 15 (M24) | |
| Average NVIDIA GeForce RTX 5060 Laptop (133 - 511, n=18) | |
| Average of class Gaming (122 - 565, n=101, last 2 years) | |
* ... smaller is better
Gaming Performance
Our default gaming tests in 1080p once again show that the Legion 5 15 is just slightly behind the RTX 5070 Laptop in the Blade 14, so the gaming performance is very good in the Full-HD resolution. The fast XMG Core 15 is once again close, but all the other comparison devices fall behind. The gap to the RTX 5070 Laptop increases in the QHD resolution, but many titles still run smoothly. Very demanding titles can suffer from VRAM warnings in combination with frame drops, though. The gaming performance is completely stable, so even long gaming sessions are not an issue.
| Final Fantasy XV Benchmark - 1920x1080 High Quality | |
| Average of class Gaming (41 - 215, n=94, last 2 years) | |
| Razer Blade 14 2025 | |
| Lenovo Legion 5 15AHP G10 | |
| Lenovo LOQ 15AHP10 | |
| Schenker XMG Core 15 (M24) | |
| MSI Katana A15 AI B8VG | |
| Asus TUF Gaming A15 FA507UV | |
| Gigabyte G5 KF5 2024 | |
| Strange Brigade - 1920x1080 ultra AA:ultra AF:16 | |
| Average of class Gaming (76.3 - 456, n=86, last 2 years) | |
| Razer Blade 14 2025 | |
| Lenovo Legion 5 15AHP G10 | |
| Lenovo LOQ 15AHP10 | |
| Schenker XMG Core 15 (M24) | |
| Asus TUF Gaming A15 FA507UV | |
| Gigabyte G5 KF5 2024 | |
| Dota 2 Reborn - 1920x1080 ultra (3/3) best looking | |
| Gigabyte G5 KF5 2024 | |
| Average of class Gaming (84.8 - 248, n=106, last 2 years) | |
| Asus TUF Gaming A15 FA507UV | |
| Razer Blade 14 2025 | |
| Schenker XMG Core 15 (M24) | |
| Lenovo Legion 5 15AHP G10 | |
| MSI Katana A15 AI B8VG | |
| Lenovo LOQ 15AHP10 | |
| F1 24 | |
| 1920x1080 Ultra High Preset AA:T AF:16x | |
| Average of class Gaming (58.8 - 157.8, n=57, last 2 years) | |
| Razer Blade 14 2025 | |
| Average NVIDIA GeForce RTX 5060 Laptop (68.2 - 77.5, n=8) | |
| Lenovo LOQ 15AHP10 | |
| Lenovo Legion 5 15AHP G10 | |
| Asus TUF Gaming A15 FA507UV | |
| 2560x1440 Ultra High Preset AA:T AF:16x | |
| Average of class Gaming (36.7 - 108.2, n=57, last 2 years) | |
| Razer Blade 14 2025 | |
| Lenovo Legion 5 15AHP G10 | |
| Average NVIDIA GeForce RTX 5060 Laptop (39 - 49.1, n=8) | |
| Lenovo LOQ 15AHP10 | |
| F1 25 | |
| 1920x1080 Ultra Max Preset AA:T AF:16x | |
| Average of class Gaming (12.5 - 62.3, n=33, last 2 years) | |
| Razer Blade 14 2025 | |
| Lenovo LOQ 15AHP10 | |
| Average NVIDIA GeForce RTX 5060 Laptop (18 - 26.6, n=7) | |
| Lenovo Legion 5 15AHP G10 | |
| 2560x1440 Ultra Max Preset AA:T AF:16x | |
| Average of class Gaming (5 - 37.7, n=25, last 2 years) | |
| Lenovo LOQ 15AHP10 | |
| Average NVIDIA GeForce RTX 5060 Laptop (9.33 - 13, n=5) | |
| Razer Blade 14 2025 | |
| Lenovo Legion 5 15AHP G10 | |
| Call of Duty Black Ops 6 | |
| 1920x1080 Extreme Preset | |
| Average of class Gaming (76 - 174, n=16, last 2 years) | |
| Razer Blade 14 2025 | |
| Lenovo Legion 5 15AHP G10 | |
| Average NVIDIA GeForce RTX 5060 Laptop (n=1) | |
| MSI Katana A15 AI B8VG | |
| 2560x1440 Extreme Preset | |
| Average of class Gaming (60 - 151, n=15, last 2 years) | |
| Razer Blade 14 2025 | |
| Lenovo Legion 5 15AHP G10 | |
| Average NVIDIA GeForce RTX 5060 Laptop (n=1) | |

Cyberpunk 2077 ultra FPS chart
| low | med. | high | ultra | QHD DLSS | QHD | |
|---|---|---|---|---|---|---|
| GTA V (2015) | 120.1 | 106.4 | ||||
| Dota 2 Reborn (2015) | 162 | 147.8 | 141.8 | 134.7 | ||
| Final Fantasy XV Benchmark (2018) | 215 | 167.6 | 126 | 92.2 | ||
| X-Plane 11.11 (2018) | 137.9 | 118.4 | 92.4 | |||
| Strange Brigade (2018) | 401 | 312 | 269 | 235 | 159.6 | |
| Baldur's Gate 3 (2023) | 158.5 | 128.5 | 113 | 110.7 | 76.7 | |
| Cyberpunk 2077 (2023) | 142.3 | 117.8 | 100.6 | 90.8 | 67.7 | 57.9 |
| Alan Wake 2 (2023) | 72.6 | 67.4 | 61.7 | 39.7 | ||
| F1 24 (2024) | 243 | 231 | 214 | 70.9 | 70.4 | 44.5 |
| Call of Duty Black Ops 6 (2024) | 144 | 131 | 93 | 84 | 64 | |
| Assassin's Creed Shadows (2025) | 61 | 58 | 49 | 36 | 28 | |
| F1 25 (2025) | 184.4 | 177.1 | 165.5 | 21.8 | 18.3 | 9.33 |
Emissions
System Noise

The Legion is generally a very quiet companion during everyday tasks, and you can usually only hear a quiet murmur even in Performance mode. When you stress the laptop, the maximum noise depends on the power profile. The fans are clearly audible in Performance mode with 50.1 dB(A) during gaming and our stress test, but the noise is not overly annoying. The other two modes are a bit quieter at 44.5 dB(A) in Auto mode and 40.4 dB(A) in Battery saver mode. We did not notice any other electronic noises on our review unit.
Noise level
| Idle |
| 25.5 / 25.5 / 26.9 dB(A) |
| Load |
| 34.6 / 50.1 dB(A) |
 | ||
30 dB silent 40 dB(A) audible 50 dB(A) loud |
||
min: | ||
| Lenovo Legion 5 15AHP G10 GeForce RTX 5060 Laptop, R7 260, SK hynix PVC10 HFS001TEM4X182N | Lenovo LOQ 15AHP10 GeForce RTX 5060 Laptop, R7 250, Micron 2500 1TB MTFDKBA1T0QGN | Gigabyte G5 KF5 2024 GeForce RTX 4060 Laptop GPU, i7-13620H, Gigabyte AG450E1024-SI | Asus TUF Gaming A15 FA507UV GeForce RTX 4060 Laptop GPU, R9 8945H, WD PC SN560 SDDPNQE-1T00 | Schenker XMG Core 15 (M24) GeForce RTX 4060 Laptop GPU, R7 8845HS, Samsung 990 Pro 1 TB | MSI Katana A15 AI B8VG GeForce RTX 4070 Laptop GPU, R9 8945HS, WD PC SN560 SDDPNQE-1T00 | |
|---|---|---|---|---|---|---|
| Noise | -40% | -7% | -3% | 3% | -3% | |
| off / environment * (dB) | 25.5 | 25 2% | 23 10% | 25 2% | 23 10% | 25 2% |
| Idle Minimum * (dB) | 25.5 | 43 -69% | 23 10% | 25 2% | 23 10% | 25 2% |
| Idle Average * (dB) | 25.5 | 45 -76% | 23 10% | 27 -6% | 23 10% | 26 -2% |
| Idle Maximum * (dB) | 26.9 | 48 -78% | 27.87 -4% | 33 -23% | 23 14% | 27 -0% |
| Load Average * (dB) | 34.6 | 53 -53% | 54.82 -58% | 40 -16% | 38.92 -12% | 40 -16% |
| Cyberpunk 2077 ultra * (dB) | 50.1 | 51 -2% | 54.82 -9% | 45 10% | 52.06 -4% | 52 -4% |
| Load Maximum * (dB) | 50.1 | 53 -6% | 54.82 -9% | 46 8% | 52.09 -4% | 50 -0% |
| Witcher 3 ultra * (dB) | 50.96 |
* ... smaller is better
Temperature
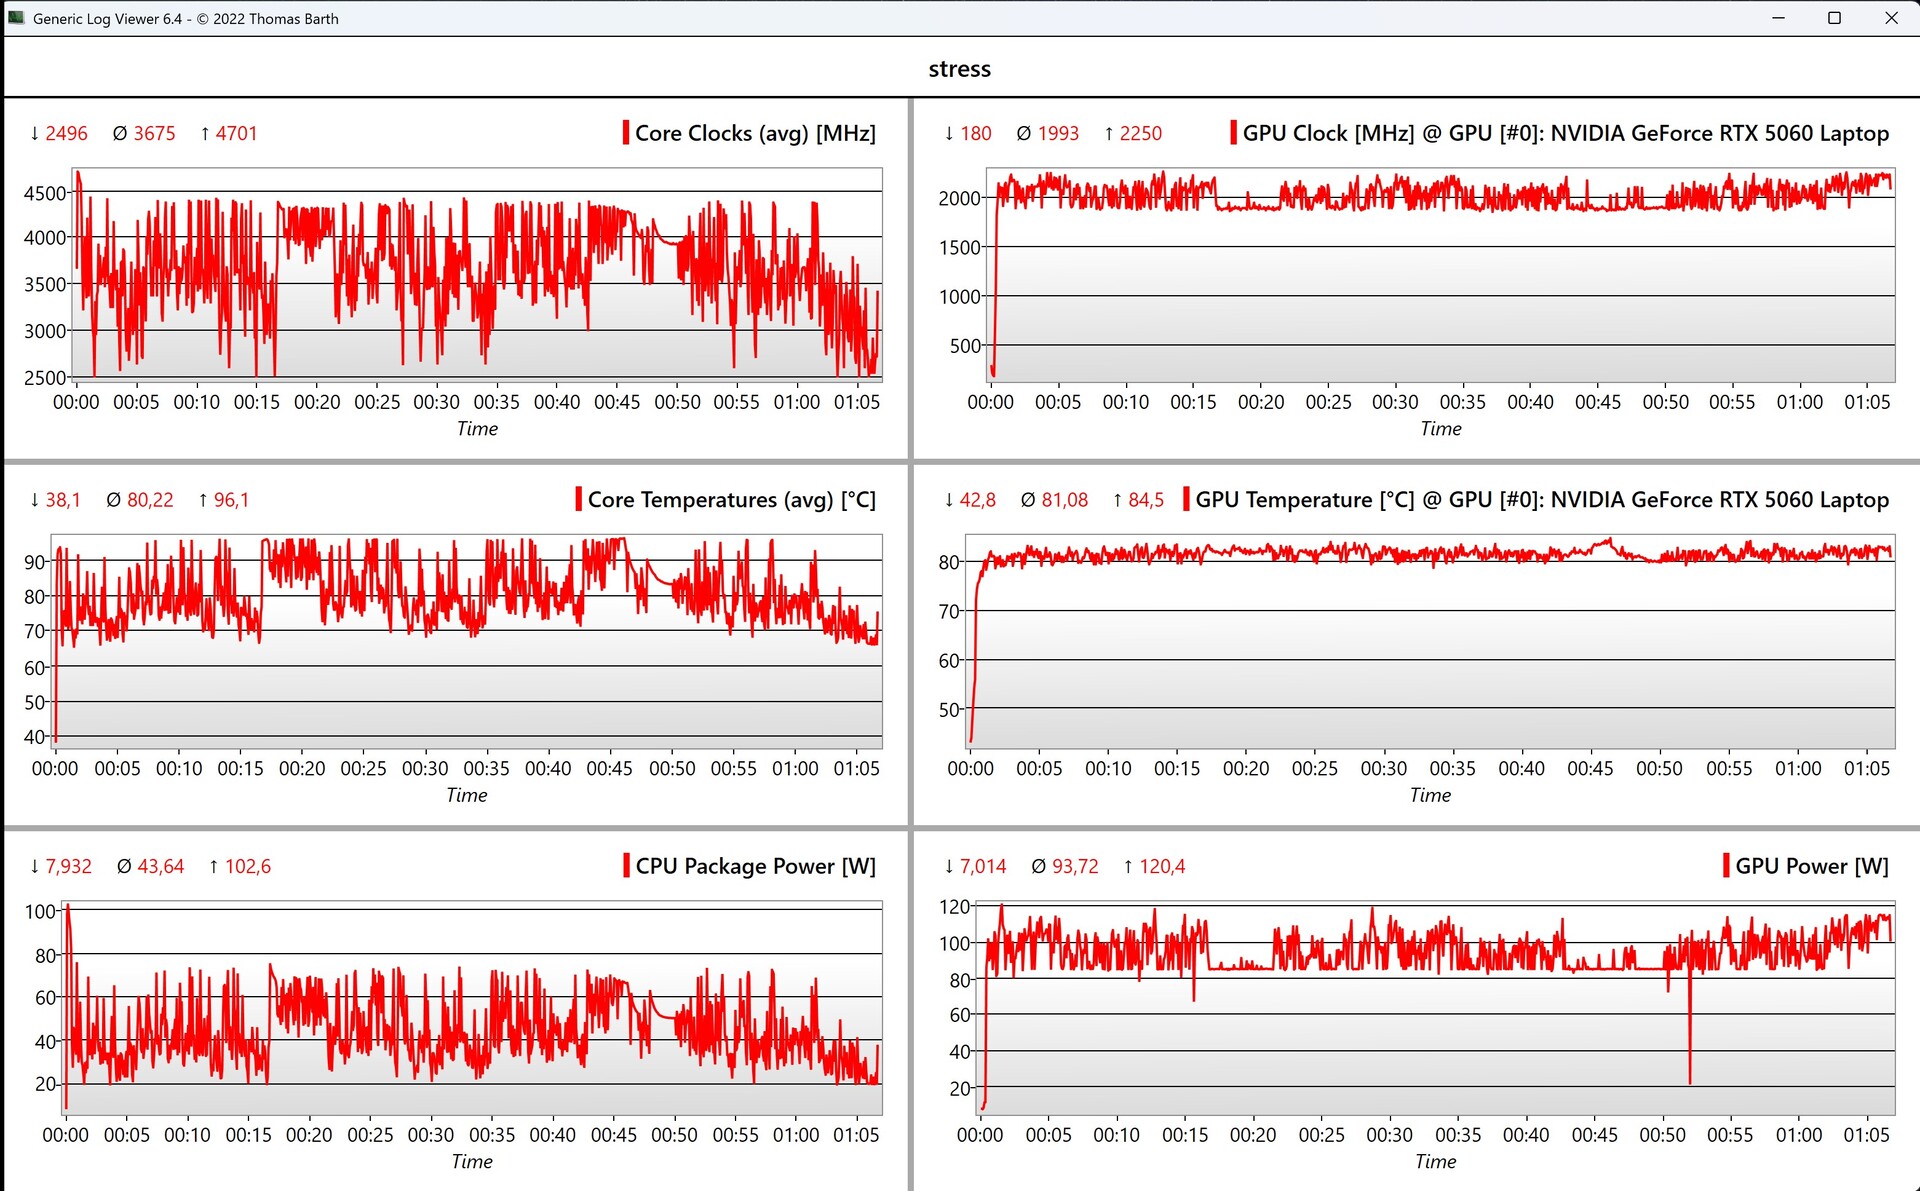
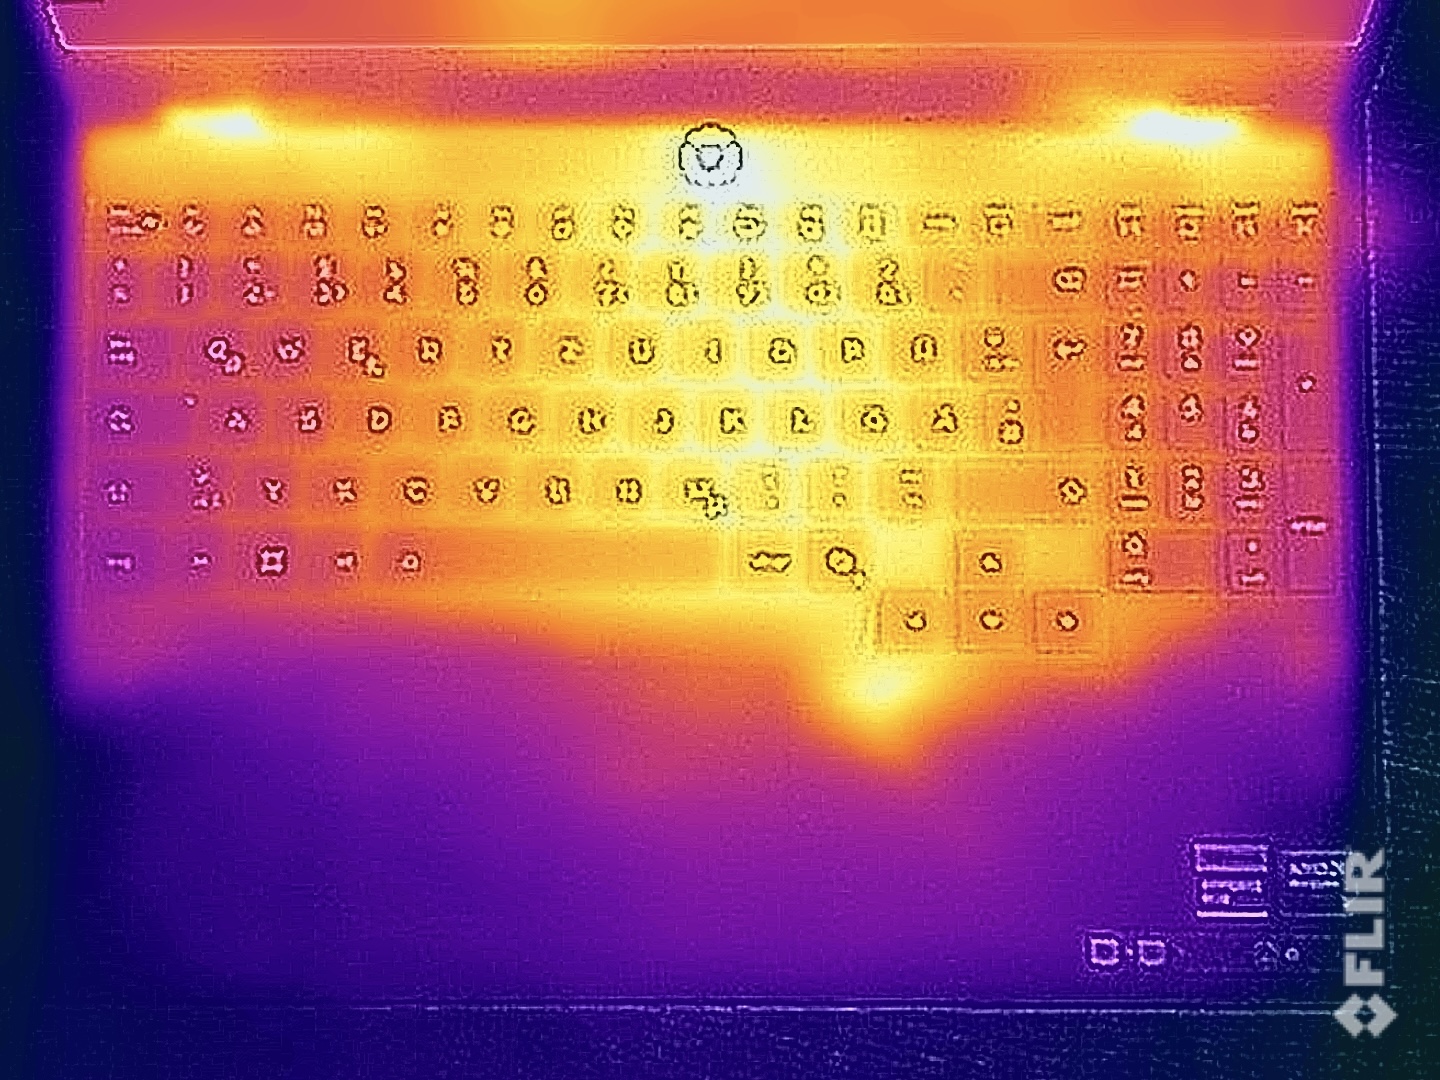
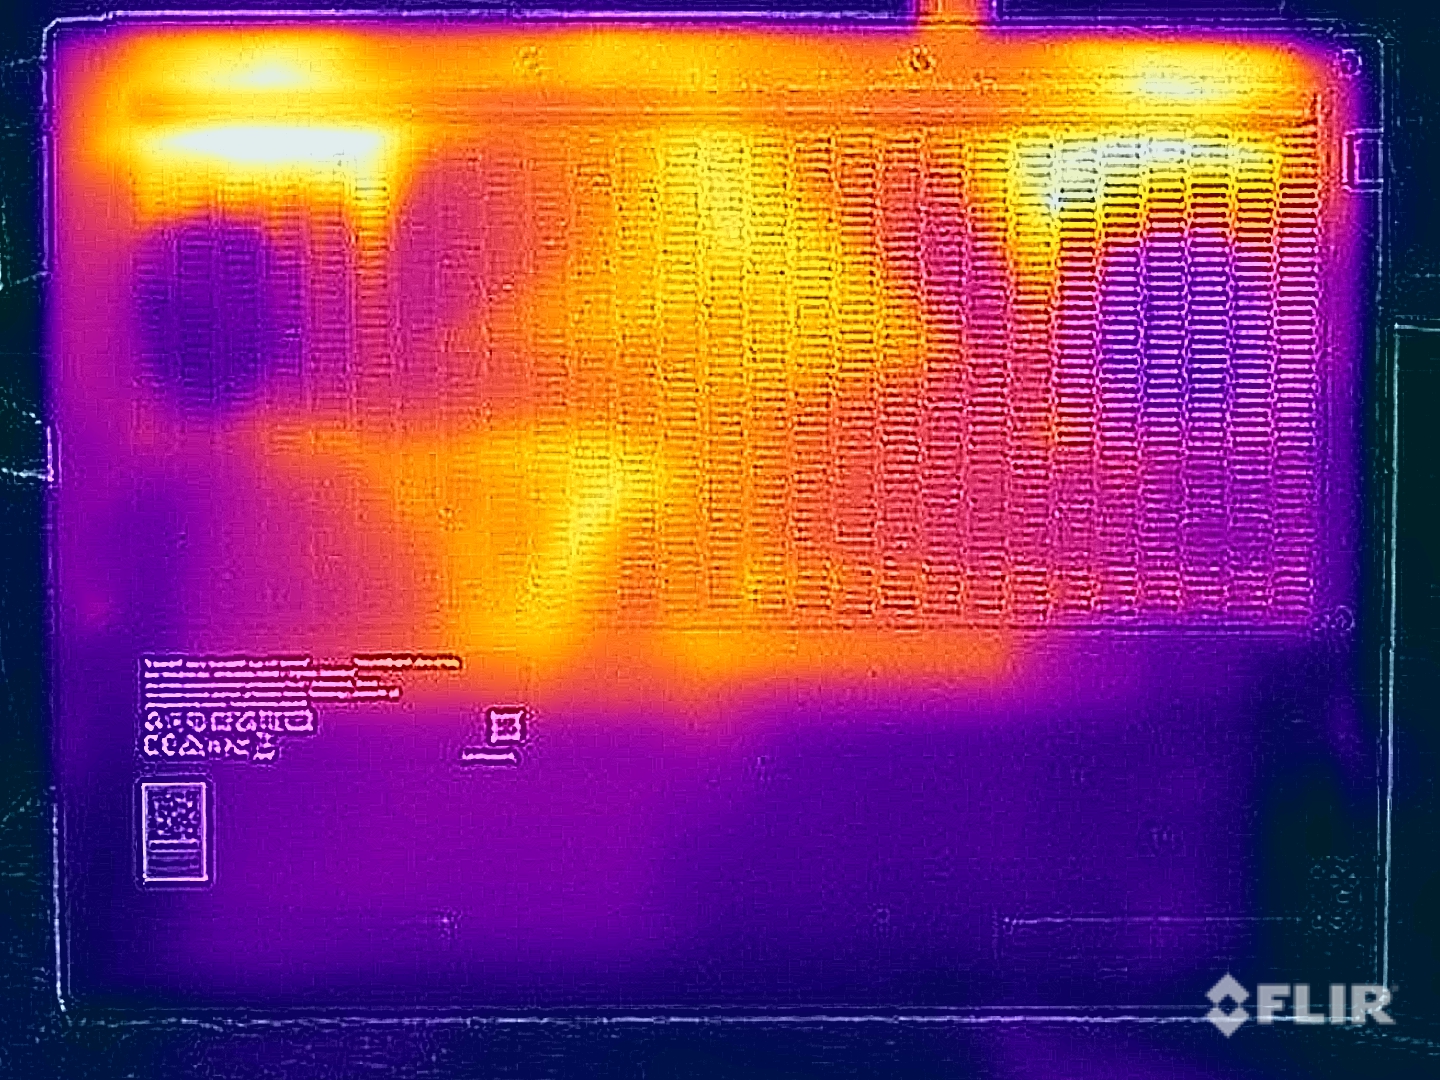
Lenovo's 15-inch gamer does not have any temperature issues. There are hot spots at the bottom rear where we can measure around 50 °C while gaming and you should not put the Legion on your lap, but both the keyboard and the palm rests stay much cooler in longer gaming sessions. During our stress test, the graphics card levels off at around 94 Watts (81 °C) and the processor at ~44 Watts (80 °C).
(±) The maximum temperature on the upper side is 42.2 °C / 108 F, compared to the average of 40.4 °C / 105 F, ranging from 21.2 to 68.8 °C for the class Gaming.
(-) The bottom heats up to a maximum of 51.7 °C / 125 F, compared to the average of 43.2 °C / 110 F
(+) In idle usage, the average temperature for the upper side is 27.5 °C / 82 F, compared to the device average of 33.9 °C / 93 F.
(±) 3: The average temperature for the upper side is 36.5 °C / 98 F, compared to the average of 33.9 °C / 93 F for the class Gaming.
(±) The palmrests and touchpad can get very hot to the touch with a maximum of 37.9 °C / 100.2 F.
(-) The average temperature of the palmrest area of similar devices was 28.8 °C / 83.8 F (-9.1 °C / -16.4 F).
| Lenovo Legion 5 15AHP G10 AMD Ryzen 7 260, NVIDIA GeForce RTX 5060 Laptop | Lenovo LOQ 15AHP10 AMD Ryzen 7 250, NVIDIA GeForce RTX 5060 Laptop | Gigabyte G5 KF5 2024 Intel Core i7-13620H, NVIDIA GeForce RTX 4060 Laptop GPU | Asus TUF Gaming A15 FA507UV AMD Ryzen 9 8945H, NVIDIA GeForce RTX 4060 Laptop GPU | Schenker XMG Core 15 (M24) AMD Ryzen 7 8845HS, NVIDIA GeForce RTX 4060 Laptop GPU | MSI Katana A15 AI B8VG AMD Ryzen 9 8945HS, NVIDIA GeForce RTX 4070 Laptop GPU | |
|---|---|---|---|---|---|---|
| Heat | -10% | -21% | -11% | -25% | -10% | |
| Maximum Upper Side * (°C) | 42.2 | 49 -16% | 50 -18% | 53 -26% | 52 -23% | 48 -14% |
| Maximum Bottom * (°C) | 51.7 | 58 -12% | 66 -28% | 46 11% | 61 -18% | 46 11% |
| Idle Upper Side * (°C) | 28.5 | 32 -12% | 32 -12% | 32 -12% | 35 -23% | 34 -19% |
| Idle Bottom * (°C) | 29.2 | 29 1% | 37 -27% | 34 -16% | 39 -34% | 34 -16% |
* ... smaller is better
Speakers
The two stereo speakers are quite loud, but the sound is not very powerful and therefore not very good. We recommend external speakers for music/movies and a headset for gaming (also considering the fan noise).
Lenovo Legion 5 15AHP G10 audio analysis
(±) | speaker loudness is average but good (81.5 dB)
Bass 100 - 315 Hz
(-) | nearly no bass - on average 21% lower than median
(±) | linearity of bass is average (8.2% delta to prev. frequency)
Mids 400 - 2000 Hz
(+) | balanced mids - only 4.7% away from median
(+) | mids are linear (5.4% delta to prev. frequency)
Highs 2 - 16 kHz
(+) | balanced highs - only 3.1% away from median
(+) | highs are linear (6.4% delta to prev. frequency)
Overall 100 - 16.000 Hz
(±) | linearity of overall sound is average (16.7% difference to median)
Compared to same class
» 43% of all tested devices in this class were better, 10% similar, 47% worse
» The best had a delta of 6%, average was 18%, worst was 132%
Compared to all devices tested
» 29% of all tested devices were better, 7% similar, 64% worse
» The best had a delta of 4%, average was 23%, worst was 134%
Lenovo LOQ 15AHP10 audio analysis
(±) | speaker loudness is average but good (81 dB)
Bass 100 - 315 Hz
(-) | nearly no bass - on average 17.7% lower than median
(±) | linearity of bass is average (9.4% delta to prev. frequency)
Mids 400 - 2000 Hz
(+) | balanced mids - only 2.6% away from median
(+) | mids are linear (4.2% delta to prev. frequency)
Highs 2 - 16 kHz
(±) | higher highs - on average 5.9% higher than median
(±) | linearity of highs is average (8.7% delta to prev. frequency)
Overall 100 - 16.000 Hz
(±) | linearity of overall sound is average (15.6% difference to median)
Compared to same class
» 36% of all tested devices in this class were better, 6% similar, 58% worse
» The best had a delta of 6%, average was 18%, worst was 132%
Compared to all devices tested
» 23% of all tested devices were better, 5% similar, 72% worse
» The best had a delta of 4%, average was 23%, worst was 134%
Gigabyte G5 KF5 2024 audio analysis
(±) | speaker loudness is average but good (79.8 dB)
Bass 100 - 315 Hz
(-) | nearly no bass - on average 29.6% lower than median
(±) | linearity of bass is average (12.3% delta to prev. frequency)
Mids 400 - 2000 Hz
(±) | higher mids - on average 7.2% higher than median
(±) | linearity of mids is average (13.3% delta to prev. frequency)
Highs 2 - 16 kHz
(±) | higher highs - on average 5.9% higher than median
(+) | highs are linear (6.1% delta to prev. frequency)
Overall 100 - 16.000 Hz
(±) | linearity of overall sound is average (29.1% difference to median)
Compared to same class
» 95% of all tested devices in this class were better, 2% similar, 4% worse
» The best had a delta of 6%, average was 18%, worst was 132%
Compared to all devices tested
» 87% of all tested devices were better, 2% similar, 11% worse
» The best had a delta of 4%, average was 23%, worst was 134%
Asus TUF Gaming A15 FA507UV audio analysis
(+) | speakers can play relatively loud (82 dB)
Bass 100 - 315 Hz
(±) | reduced bass - on average 6.8% lower than median
(±) | linearity of bass is average (7.1% delta to prev. frequency)
Mids 400 - 2000 Hz
(±) | higher mids - on average 7.8% higher than median
(±) | linearity of mids is average (7% delta to prev. frequency)
Highs 2 - 16 kHz
(+) | balanced highs - only 2.4% away from median
(±) | linearity of highs is average (7.6% delta to prev. frequency)
Overall 100 - 16.000 Hz
(+) | overall sound is linear (13.1% difference to median)
Compared to same class
» 18% of all tested devices in this class were better, 4% similar, 78% worse
» The best had a delta of 6%, average was 18%, worst was 132%
Compared to all devices tested
» 13% of all tested devices were better, 3% similar, 84% worse
» The best had a delta of 4%, average was 23%, worst was 134%
Schenker XMG Core 15 (M24) audio analysis
(±) | speaker loudness is average but good (79.12 dB)
Bass 100 - 315 Hz
(-) | nearly no bass - on average 16.7% lower than median
(-) | bass is not linear (15.7% delta to prev. frequency)
Mids 400 - 2000 Hz
(+) | balanced mids - only 4.5% away from median
(+) | mids are linear (4.4% delta to prev. frequency)
Highs 2 - 16 kHz
(+) | balanced highs - only 1% away from median
(+) | highs are linear (2.7% delta to prev. frequency)
Overall 100 - 16.000 Hz
(+) | overall sound is linear (13.7% difference to median)
Compared to same class
» 21% of all tested devices in this class were better, 7% similar, 72% worse
» The best had a delta of 6%, average was 18%, worst was 132%
Compared to all devices tested
» 15% of all tested devices were better, 4% similar, 81% worse
» The best had a delta of 4%, average was 23%, worst was 134%
MSI Katana A15 AI B8VG audio analysis
(±) | speaker loudness is average but good (81 dB)
Bass 100 - 315 Hz
(-) | nearly no bass - on average 21.6% lower than median
(±) | linearity of bass is average (10% delta to prev. frequency)
Mids 400 - 2000 Hz
(±) | higher mids - on average 6.2% higher than median
(±) | linearity of mids is average (8.6% delta to prev. frequency)
Highs 2 - 16 kHz
(+) | balanced highs - only 2.8% away from median
(+) | highs are linear (6% delta to prev. frequency)
Overall 100 - 16.000 Hz
(±) | linearity of overall sound is average (19.2% difference to median)
Compared to same class
» 65% of all tested devices in this class were better, 7% similar, 28% worse
» The best had a delta of 6%, average was 18%, worst was 132%
Compared to all devices tested
» 46% of all tested devices were better, 7% similar, 46% worse
» The best had a delta of 4%, average was 23%, worst was 134%
Energy Management - Good battery runtime
Power Consumption

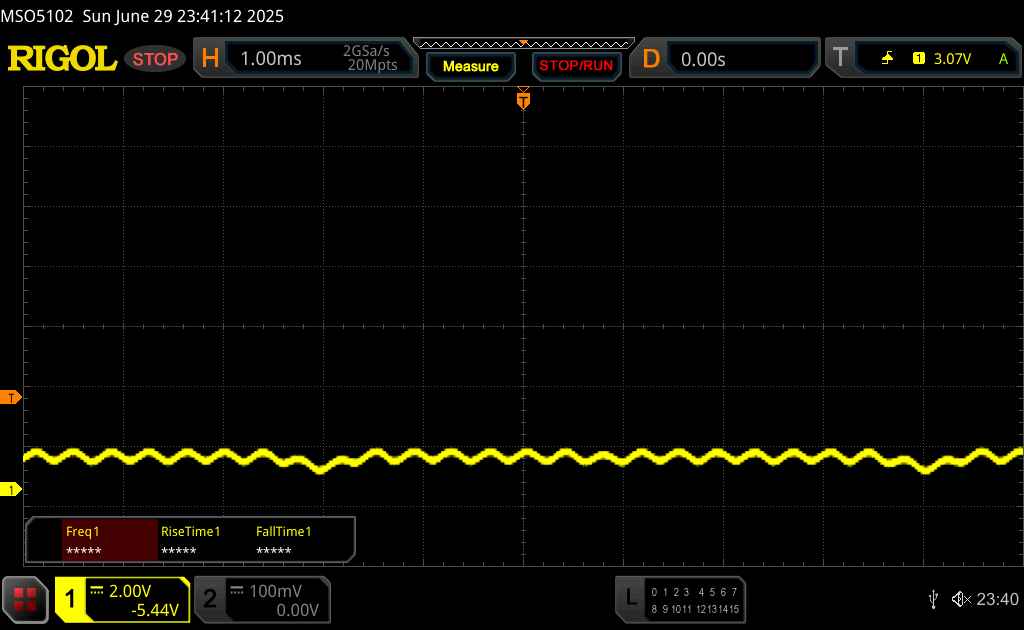
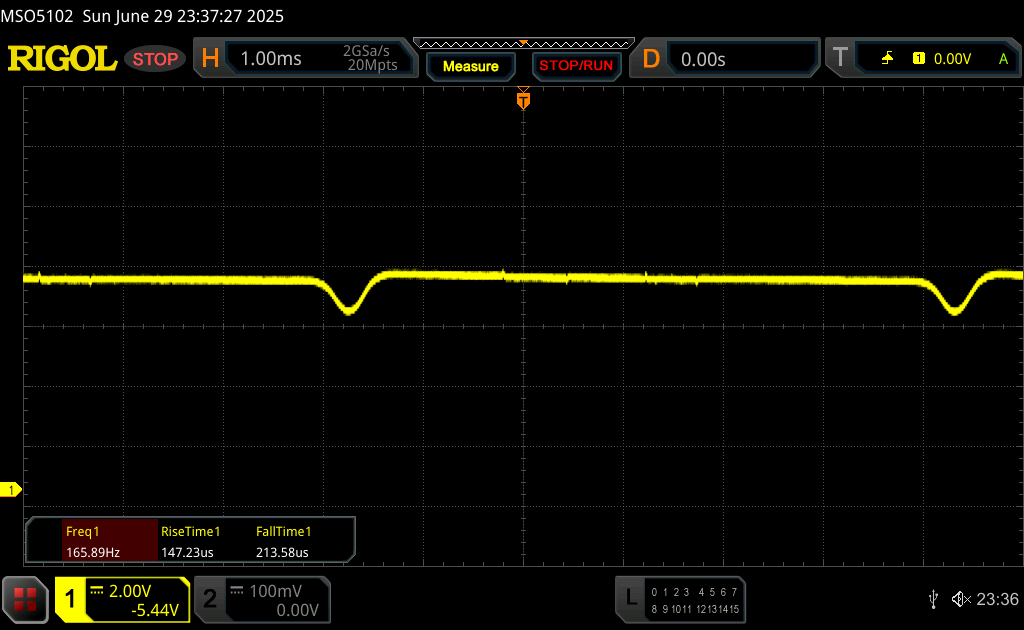
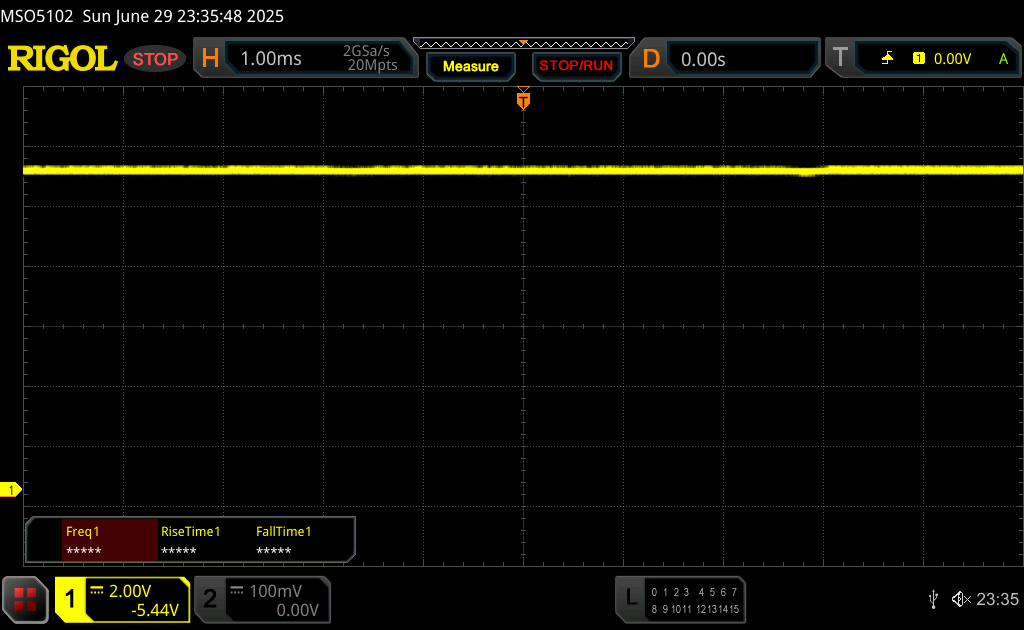
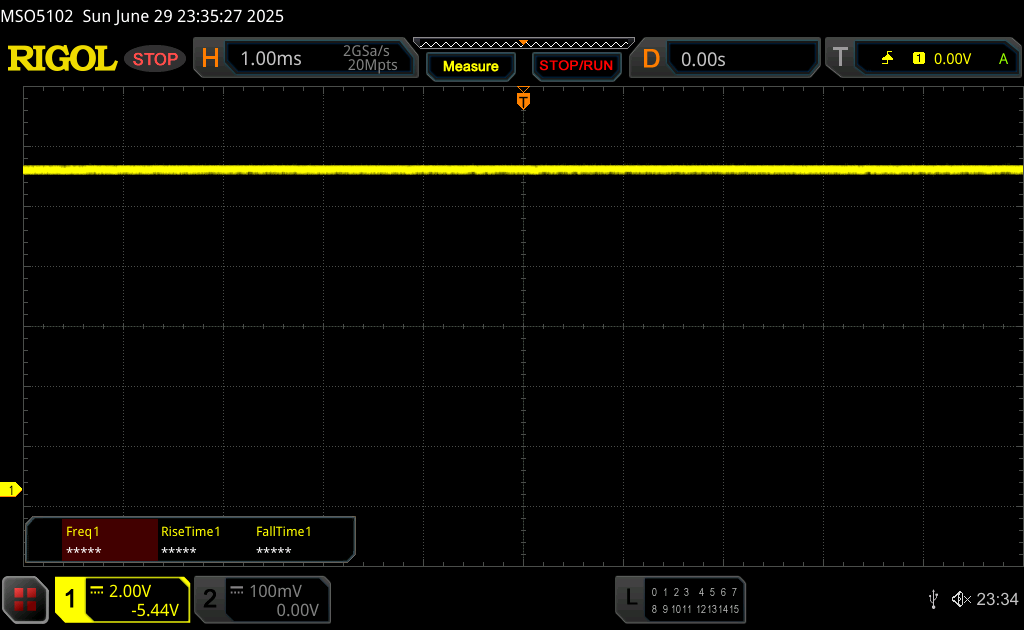
Despite the high brightness, the Legion is quite efficient while idling at up to 11.3 Watts. You can expect 160-170 Watts while gaming and we measure up to 233 Watts during our stress test, but this value quickly levels off at around 200 Watts. The 245W power adapter is therefore sufficient. The stand-by consumption of 0.87 Watts could be lower.
| Off / Standby | |
| Idle | |
| Load |
|
Key:
min: | |
| Lenovo Legion 5 15AHP G10 R7 260, GeForce RTX 5060 Laptop, SK hynix PVC10 HFS001TEM4X182N, OLED, 2560x1600, 15.1" | Lenovo LOQ 15AHP10 R7 250, GeForce RTX 5060 Laptop, Micron 2500 1TB MTFDKBA1T0QGN, IPS, 1920x1080, 15.6" | Gigabyte G5 KF5 2024 i7-13620H, GeForce RTX 4060 Laptop GPU, Gigabyte AG450E1024-SI, IPS, 1920x1080, 15.6" | Asus TUF Gaming A15 FA507UV R9 8945H, GeForce RTX 4060 Laptop GPU, WD PC SN560 SDDPNQE-1T00, IPS, 1920x1080, 15.6" | Schenker XMG Core 15 (M24) R7 8845HS, GeForce RTX 4060 Laptop GPU, Samsung 990 Pro 1 TB, IPS, 2560x1600, 15.3" | MSI Katana A15 AI B8VG R9 8945HS, GeForce RTX 4070 Laptop GPU, WD PC SN560 SDDPNQE-1T00, IPS, 1920x1080, 15.6" | Average NVIDIA GeForce RTX 5060 Laptop | Average of class Gaming | |
|---|---|---|---|---|---|---|---|---|
| Power Consumption | -49% | -19% | -6% | -23% | -30% | -27% | -69% | |
| Idle Minimum * (Watt) | 6.9 | 20 -190% | 5.2 25% | 7 -1% | 9.3 -35% | 13 -88% | 8.97 ? -30% | 13 ? -88% |
| Idle Average * (Watt) | 10.7 | 20.7 -93% | 19.6 -83% | 12 -12% | 12.9 -21% | 18 -68% | 12.9 ? -21% | 18.7 ? -75% |
| Idle Maximum * (Watt) | 11.3 | 22.7 -101% | 23 -104% | 18 -59% | 12.8 -13% | 23 -104% | 18.3 ? -62% | 24.3 ? -115% |
| Load Average * (Watt) | 69.7 | 71 -2% | 84 -21% | 70 -0% | 63 10% | 92 ? -32% | 110.2 ? -58% | |
| Cyberpunk 2077 ultra * (Watt) | 162.6 | 153.1 6% | 144 11% | 146.8 10% | 156.8 4% | |||
| Cyberpunk 2077 ultra external monitor * (Watt) | 165 | 151.1 8% | 144 13% | 146.2 11% | 156 5% | |||
| Load Maximum * (Watt) | 233.6 | 172 26% | 165 29% | 206 12% | 286 -22% | 159 32% | 213 ? 9% | 258 ? -10% |
| Witcher 3 ultra * (Watt) | 167 |
* ... smaller is better
Power consumption Cyberpunk / Stress test
Power consumption external screen
Battery Runtime
You can drain the 80-Wh battery in around one hour under load, but the runtimes are much better in the other scenarios. Our Wi-Fi test at 150 nits (60 % of the maximum SDR brightness) at 60 Hz runs for around 9.5 hours and still 6.5 hours at maximum brightness. Our video test even runs for 11.5 hours. A full recharge takes 95 minutes when the device is turned on (80 % after 52 minutes).

| Lenovo Legion 5 15AHP G10 R7 260, GeForce RTX 5060 Laptop, 80 Wh | Lenovo LOQ 15AHP10 R7 250, GeForce RTX 5060 Laptop, 60 Wh | Gigabyte G5 KF5 2024 i7-13620H, GeForce RTX 4060 Laptop GPU, 54 Wh | Asus TUF Gaming A15 FA507UV R9 8945H, GeForce RTX 4060 Laptop GPU, 90 Wh | Schenker XMG Core 15 (M24) R7 8845HS, GeForce RTX 4060 Laptop GPU, 99.8 Wh | MSI Katana A15 AI B8VG R9 8945HS, GeForce RTX 4070 Laptop GPU, 53.5 Wh | Average of class Gaming | |
|---|---|---|---|---|---|---|---|
| Battery runtime | -23% | -27% | 21% | 50% | -59% | -9% | |
| H.264 (h) | 11.5 | 6.1 -47% | 10.1 -12% | 8.64 ? -25% | |||
| WiFi v1.3 (h) | 9.7 | 4.5 -54% | 7.3 -25% | 11.7 21% | 14.8 53% | 4 -59% | 7.15 ? -26% |
| Cyberpunk 2077 ultra 150cd (h) | 0.9 | ||||||
| Load (h) | 1.2 | 1.3 8% | 1.1 -8% | 2.5 108% | 1.502 ? 25% |
Notebookcheck Rating
Lenovo Legion 5 15AHP G10
- 06/30/2025 v8
Andreas Osthoff
 Total Sustainability Score:
 Possible Alternatives in Comparison
Image | Model / Review | Price | Weight | Height | Display |
|---|---|---|---|---|---|
1. 87.2%  | Lenovo Legion 5 15AHP G10 AMD Ryzen 7 260 ⎘ NVIDIA GeForce RTX 5060 Laptop ⎘ 32 GB Memory, 1024 GB SSD | Amazon: List Price: 1449€ | 1.9 kg | 21.5 mm | 15.10" 2560x1600 200 PPI OLED |
2. 77.5%  | Lenovo LOQ 15AHP10 AMD Ryzen 7 250 ⎘ NVIDIA GeForce RTX 5060 Laptop ⎘ 16 GB Memory, 1024 GB SSD | Amazon: | 2.4 kg | 24 mm | 15.60" 1920x1080 141 PPI IPS |
3. 76.3%  | Gigabyte G5 KF5 2024 Intel Core i7-13620H ⎘ NVIDIA GeForce RTX 4060 Laptop GPU ⎘ 16 GB Memory, 1024 GB SSD | Amazon: List Price: 899 Euro | 2 kg | 22.7 mm | 15.60" 1920x1080 141 PPI IPS |
4. 80.3%  | Asus TUF Gaming A15 FA507UV AMD Ryzen 9 8945H ⎘ NVIDIA GeForce RTX 4060 Laptop GPU ⎘ 16 GB Memory, 1024 GB SSD | Amazon: 1. $74.25 Screen Replacement for ASUS ... 2. $109.00 Screen Replacement for ASUS ... 3. $879.00 ASUS TUF Gaming A15 Gaming L... List Price: 1199 Euro | 2.1 kg | 22.4 mm | 15.60" 1920x1080 141 PPI IPS |
5. 83.7%  | Schenker XMG Core 15 (M24) AMD Ryzen 7 8845HS ⎘ NVIDIA GeForce RTX 4060 Laptop GPU ⎘ 32 GB Memory, 1024 GB SSD | Amazon: List Price: 1650 Euro | 2.1 kg | 21.9 mm | 15.30" 2560x1600 197 PPI IPS |
6. 76.4%  | MSI Katana A15 AI B8VG AMD Ryzen 9 8945HS ⎘ NVIDIA GeForce RTX 4070 Laptop GPU ⎘ 16 GB Memory, 1024 GB SSD | Amazon: List Price: 1500 EUR | 2.3 kg | 24.9 mm | 15.60" 1920x1080 141 PPI IPS |
Transparency
The selection of devices to be reviewed is made by our editorial team. The test sample was provided to the author as a loan by the manufacturer or retailer for the purpose of this review. The lender had no influence on this review, nor did the manufacturer receive a copy of this review before publication. There was no obligation to publish this review. As an independent media company, Notebookcheck is not subjected to the authority of manufacturers, retailers or publishers.
This is how Notebookcheck is testing
Every year, Notebookcheck independently reviews hundreds of laptops and smartphones using standardized procedures to ensure that all results are comparable. We have continuously developed our test methods for around 20 years and set industry standards in the process. In our test labs, high-quality measuring equipment is utilized by experienced technicians and editors. These tests involve a multi-stage validation process. Our complex rating system is based on hundreds of well-founded measurements and benchmarks, which maintains objectivity. Further information on our test methods can be found here.
