Lenovo ThinkPad P1 Gen 7 review: Without TrackPoint buttons, with Nvidia GeForce RTX 4060
P1 with hint of ThinkPad Z.
For the new Lenovo ThinkPad P1 Gen 7, the new design is the main attraction. The high-end workstation is more premium, repairable and easier to use. At its core lies the new haptic Sensel touchpad, which successfully takes over the function of the formerly dedicated TrackPoint buttons.Benjamin Herzig 👁 (translated by Benjamin Herzig) Published 🇩🇪 🇫🇷 ...
Verdict: Modern design, but less GPU performance
Most times, new laptop models of a pre-existing line of PCs are mere updates of their predecessor, just with newer processors. This is not the case for the ThinkPad P1 Gen 7: Lenovo changes its premium workstation on a fundamental level, shifting the focus away from maximum performance - the high-end GPU options of the predecessor are no longer available. Instead, there are two M.2 2280 SSD slots in every model variant now, and the new P1 G7 also adopts the new innovative LPCAMM2 memory type.
On the outside, there are many design cues taken from the ThinkPad Z16, especially with the aluminum lid and the big haptic trackpad, which works great. Along with the thinner screen bezel, the design looks more fresh and modern, without losing the charm of the ThinkPad design completely. The new CPU platform Meteor Lake does not quite live up to Raptor Lake in terms of the single core performance, but the efficiency and battery life is improved. Overall, the Lenovo ThinkPad P1 Gen 7 is a well realized transformation to a more premium design with improved mobility compared with the predecessor. For the more rounded overall package, Lenovo sacrifices some GPU performance in the high end, but that is probably fine for most users.
Pros
Cons
Pricing and availability
From our loan-supplier Campuspoint, you can buy the Lenovo ThinkPad P1 Gen 7 as tested for €3,359 in Germany, with the student pricing sitting at €2,859. Amazon.com lists a version of the ThinkPad P1 Gen 7 for $2,548.
Price comparison
Possible competitors in comparison
Image | Model / Review | Price | Weight | Height | Display |
|---|---|---|---|---|---|
1. 83.5%  | Lenovo ThinkPad P1 Gen 7 21KV001SGE Intel Core Ultra 7 155H ⎘ NVIDIA GeForce RTX 4060 Laptop GPU ⎘ 32 GB Memory, 1024 GB SSD | 2 kg | 20.5 mm | 16.00" 2560x1600 189 PPI IPS LED | |
2. 90.1% v7 (old)  | Lenovo ThinkPad P1 G6 21FV001KUS Intel Core i7-13800H ⎘ NVIDIA GeForce RTX 4080 Laptop GPU ⎘ 32 GB Memory, 1024 GB SSD | 1.9 kg | 17.5 mm | 16.00" 3480x2400 264 PPI OLED | |
3. 93.7% v7 (old)  | Apple MacBook Pro 16 2023 M3 Pro Apple M3 Pro 12-Core ⎘ Apple M3 Pro 18-Core GPU ⎘ 18 GB Memory, 512 GB SSD | 2.1 kg | 16.9 mm | 16.20" 3456x2234 254 PPI Mini-LED | |
4. 88.6% v7 (old)  | Dell XPS 16 9640 Intel Core Ultra 7 155H ⎘ NVIDIA GeForce RTX 4070 Laptop GPU ⎘ 32 GB Memory, 1024 GB SSD | 2.3 kg | 18.7 mm | 16.30" 3840x2400 139 PPI OLED | |
5. 88.3% v7 (old)  | Dell Precision 5690 Intel Core Ultra 9 185H ⎘ NVIDIA RTX 5000 Ada Generation Laptop ⎘ 32 GB Memory, 2048 GB SSD | 2.3 kg | 22.17 mm | 16.00" 3840x2400 283 PPI OLED |
Table of Contents
- Verdict: Modern design, but less GPU performance
- Specifications: Core Ultra 7 155H meets GeForce RTX 4060
- Chassis: Aluminum instead of Carbon fiber for the ThinkPad P1
- Connectivity: Lenovo replaces SO-DIMM with LPCAMM2
- Input devices: Integrated TrackPoint buttons well realized for the first time
- Display: Fast 165 Hz screen
- Performance: Meteor Lake replaces Raptor Lake
- Emissions: Palmrest of the Lenovo laptop stays cool
- Energy management: Better battery life than ThinkPad P1 Gen 6
- Notebookcheck Overall Rating
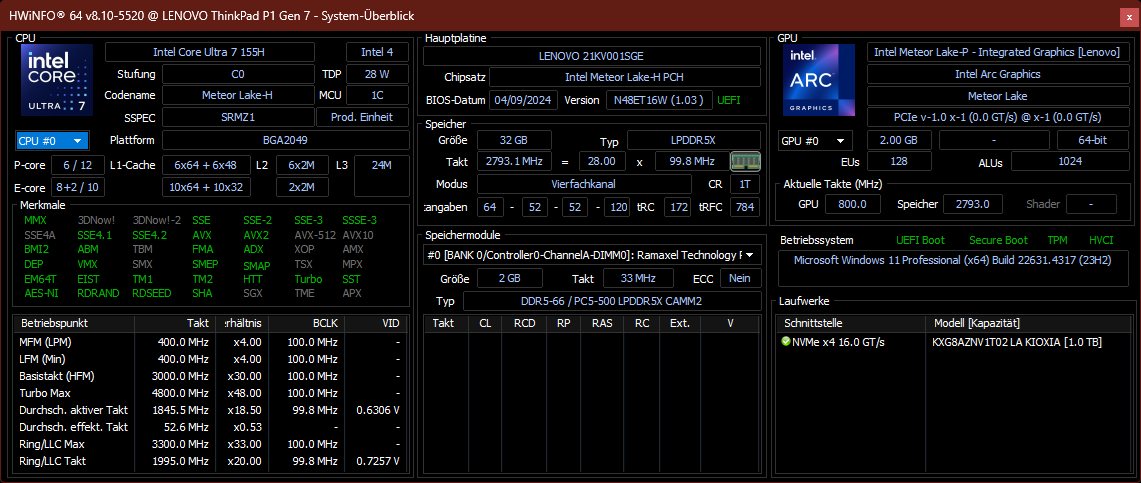
In the year 2018, Lenovo released a completely new ThinkPad series: The ThinkPad P1, a slim premium workstation, as well as the ThinkPad X1 Extreme, its multimedia counterpart. The X1 Extreme line has died in the meantime, but the ThinkPad P1 is still around. With the ThinkPad P1 Gen 7, we already have seven generations of this high-end device. This newest version has many new featured, as Lenovo has reworked the design almost completely - only for the second time in the history of the series. Together with the Intel Meteor Lake H CPUs, this is a very interesting mix, which Lenovo puts up against the Apple MacBook Pro 16, Dell XPS 16 or HP ZBook Studio.
Specifications: Core Ultra 7 155H meets GeForce RTX 4060
Chassis: Aluminum instead of Carbon fiber for the ThinkPad P1
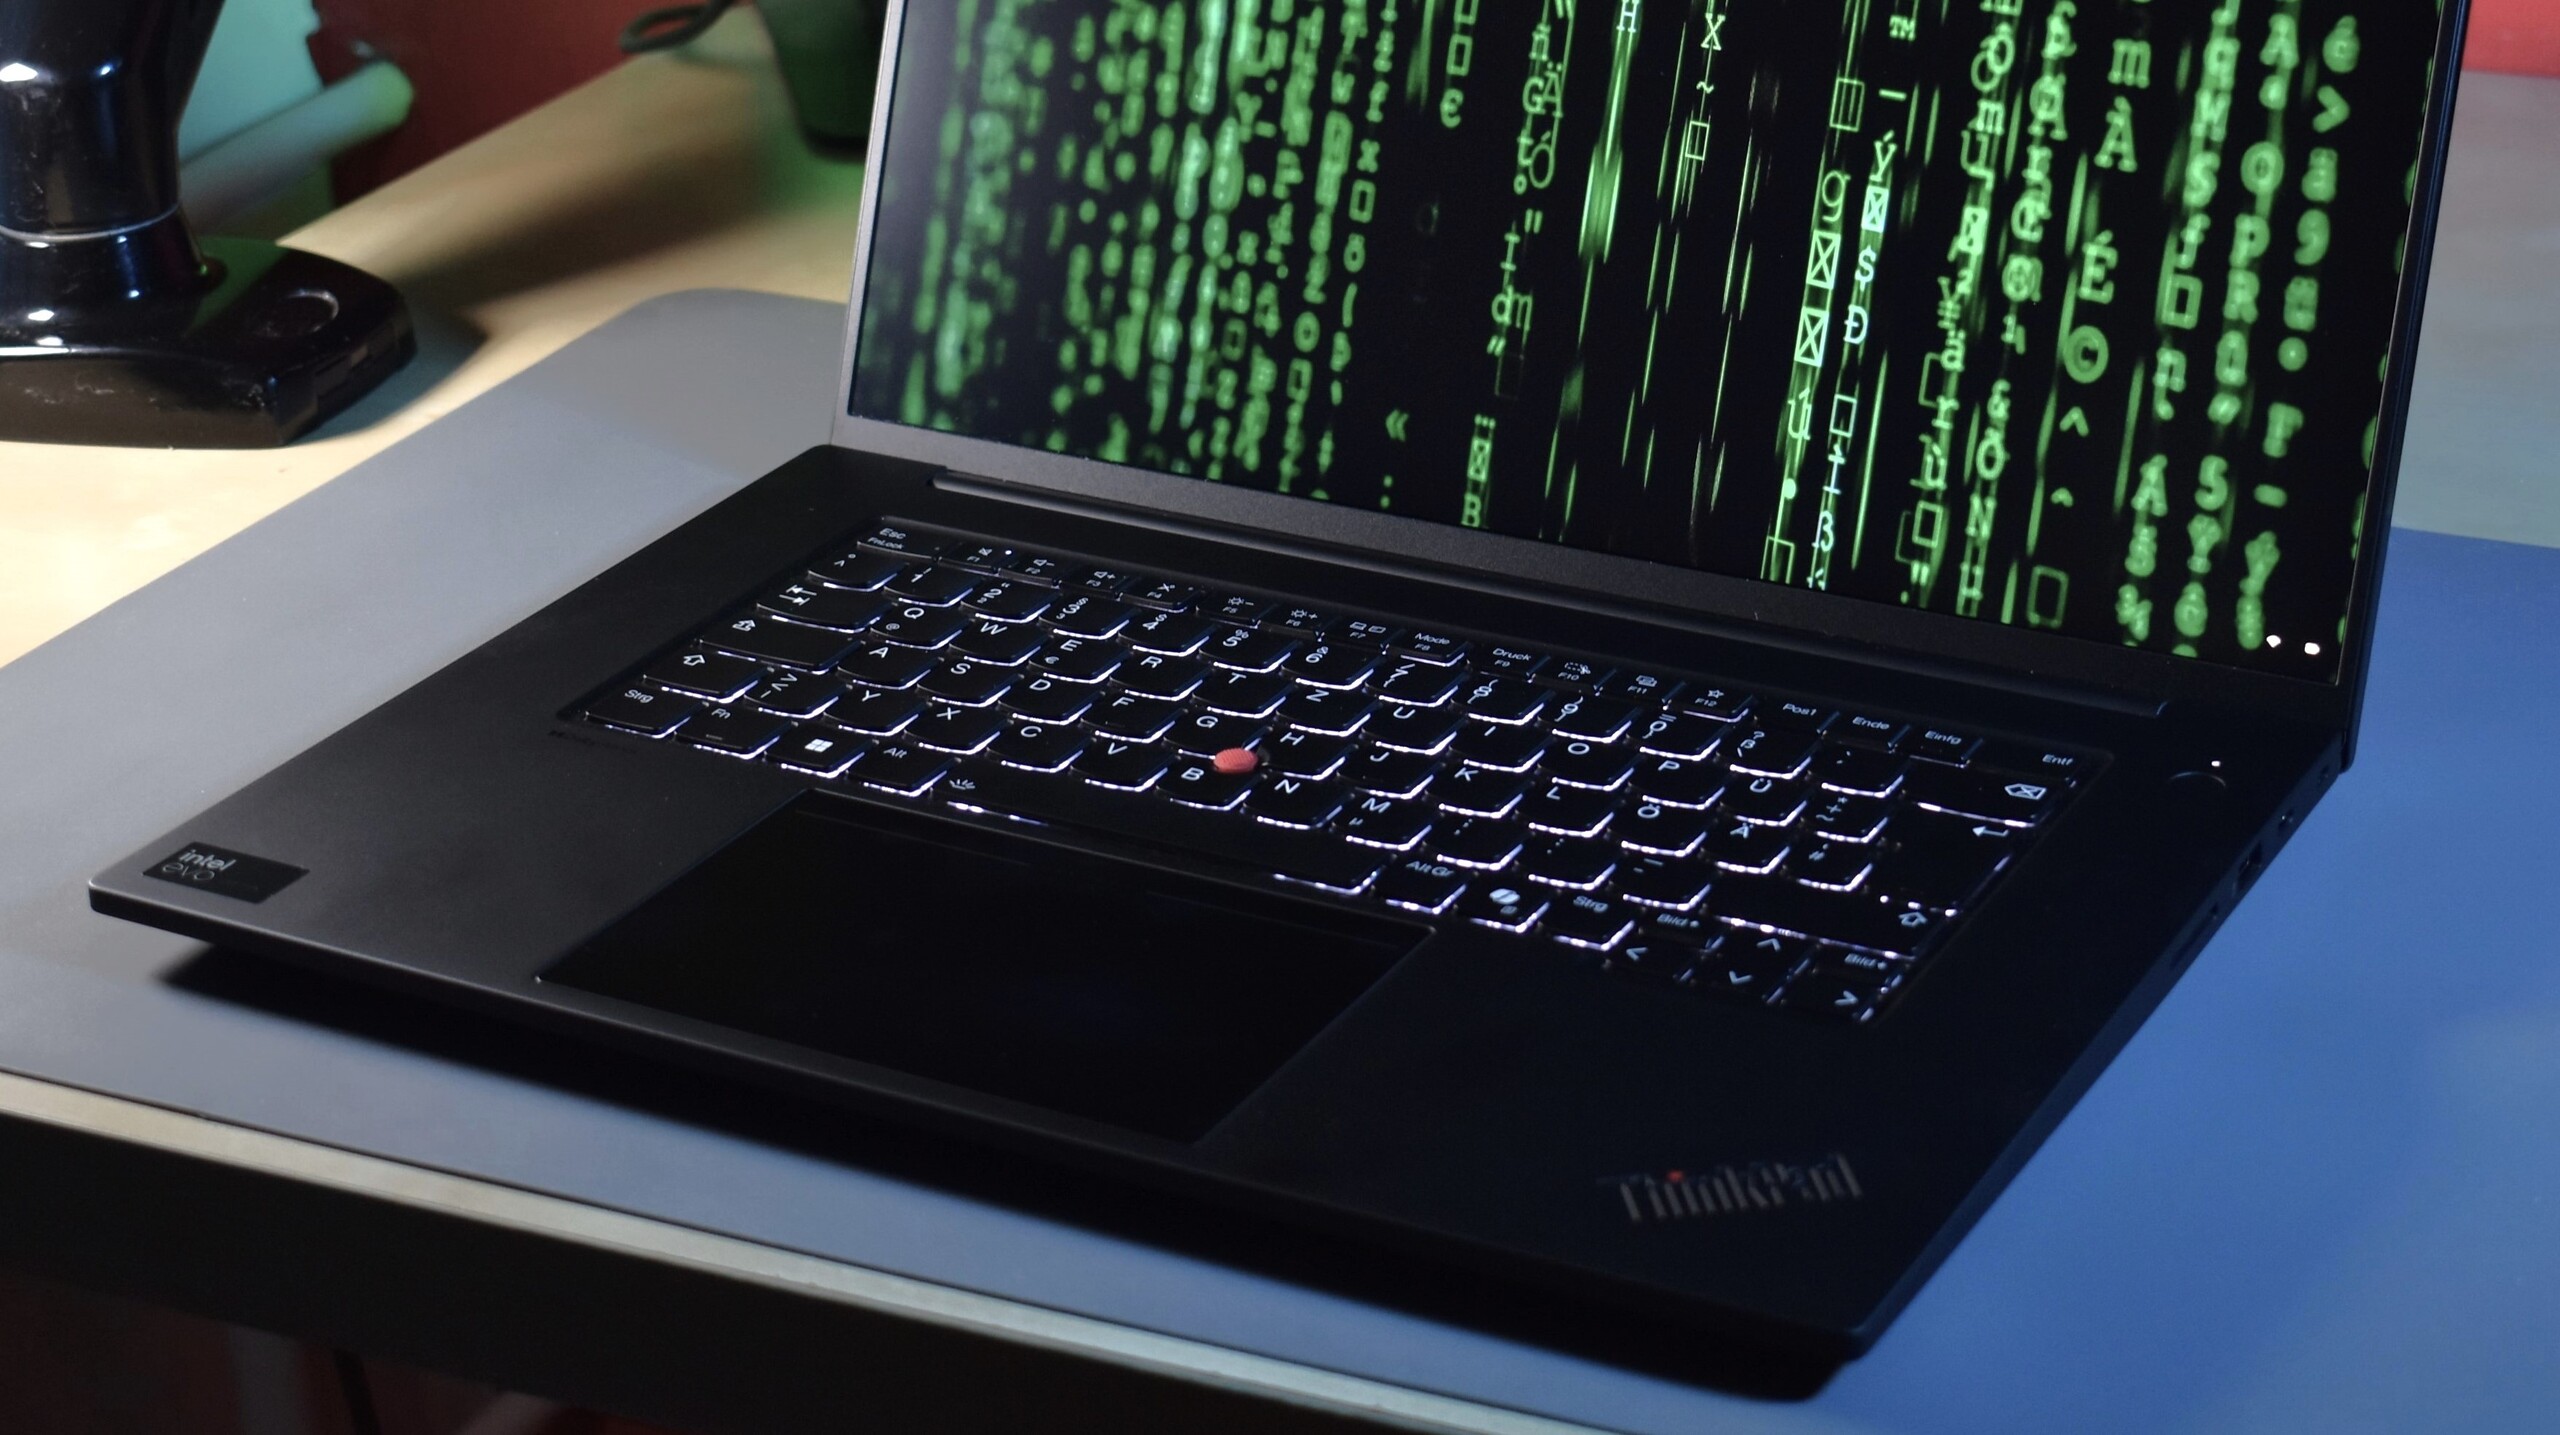
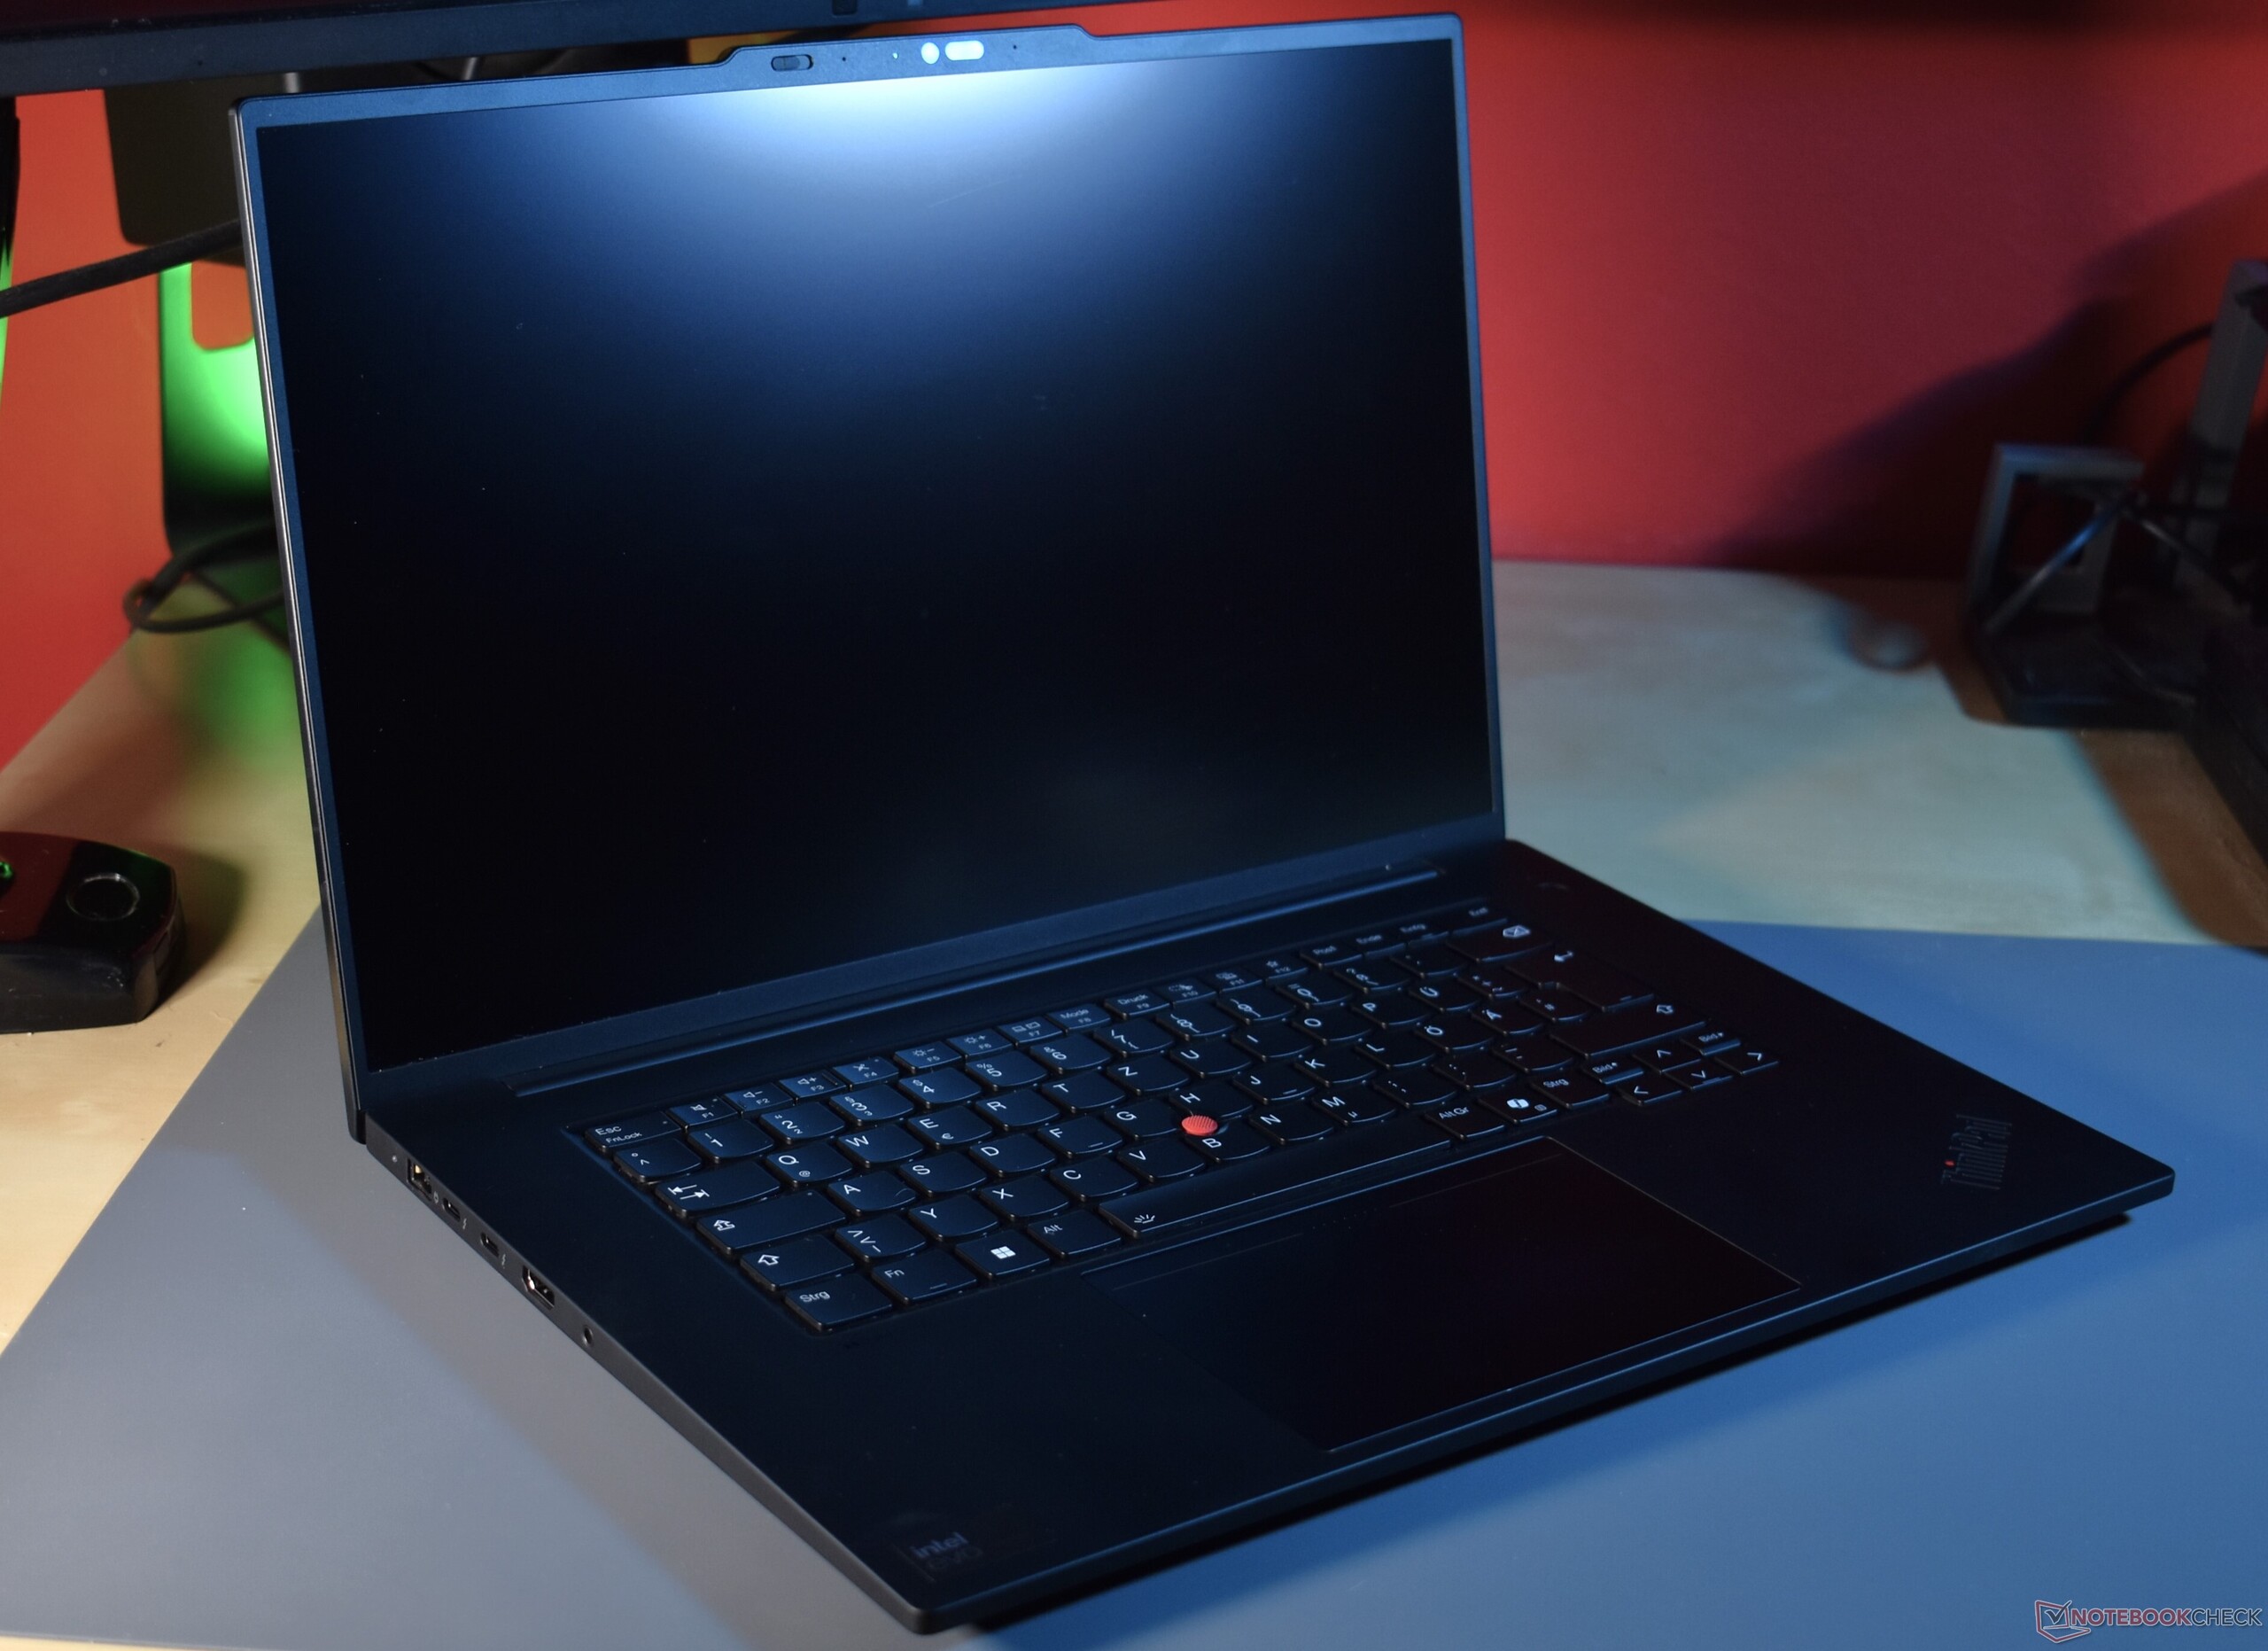
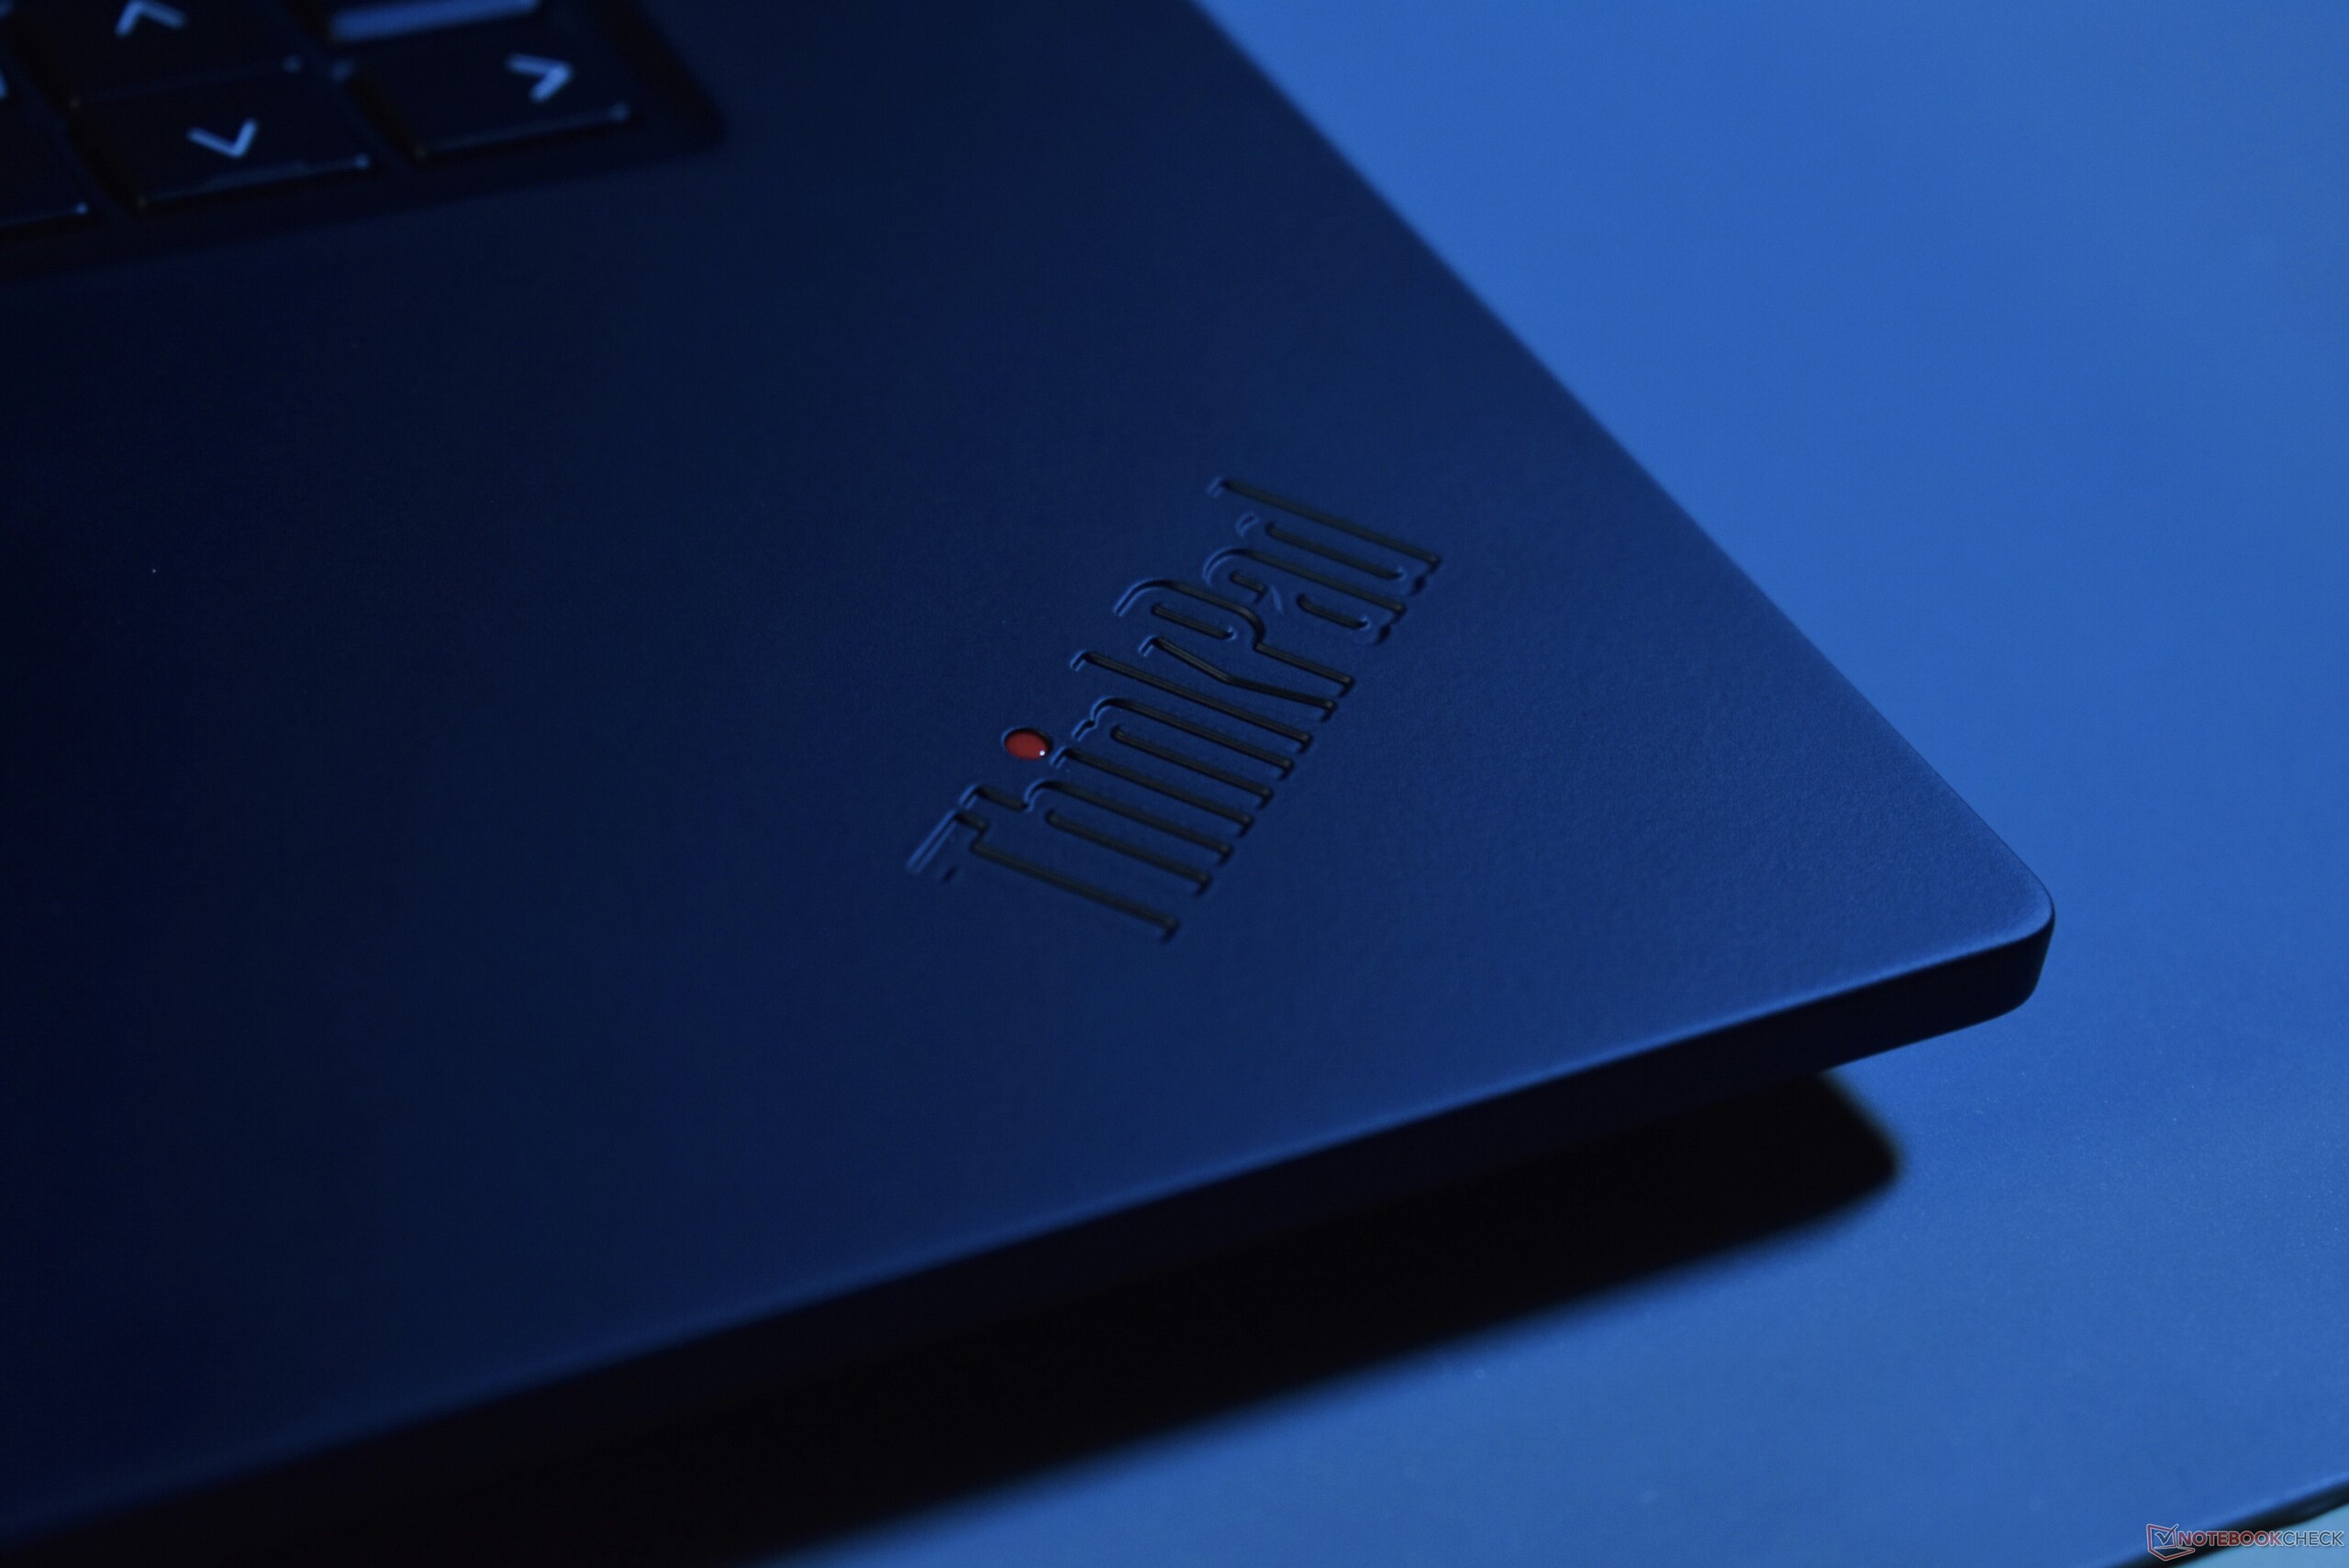
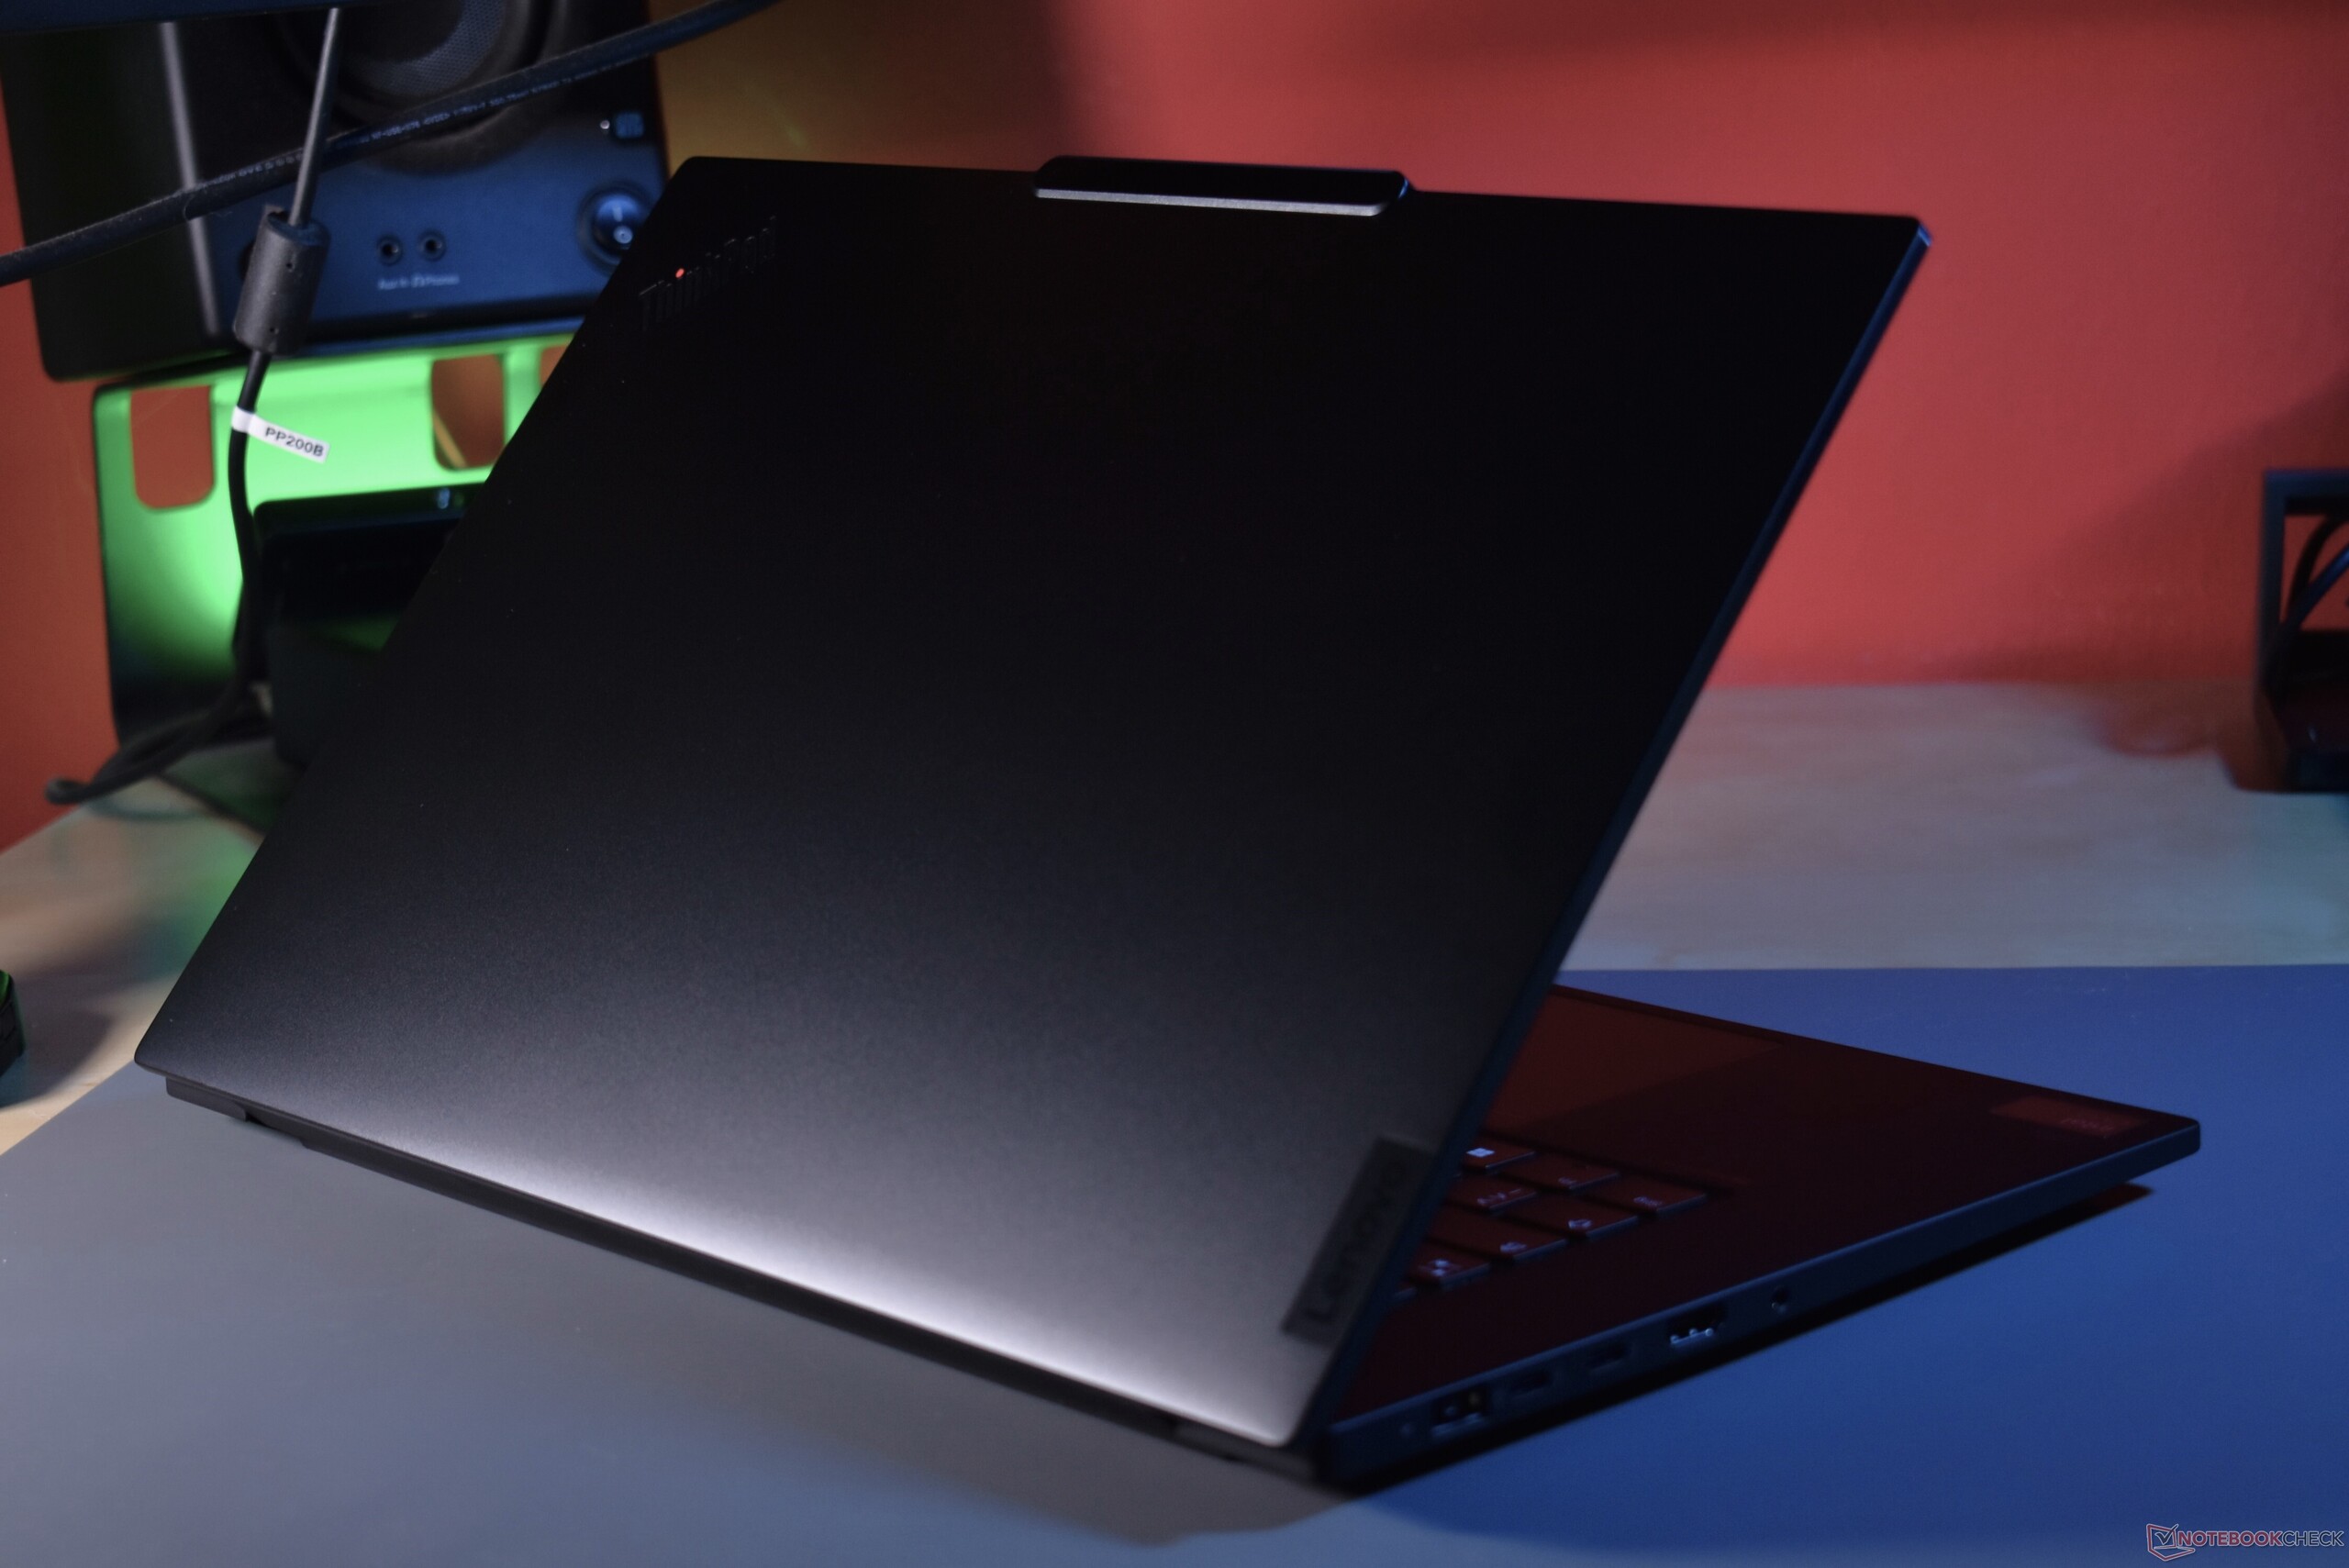
Right from the start, the Lenovo ThinkPad P1 was basically a bigger ThinkPad X1 Carbon. It used the same construction and the same materials as the smaller Ultrabook, just a bit thicker and in the bigger 15.6- or 16-inch format (since the Lenovo ThinkPad P1 Gen 4). With the ThinkPad P1 Gen 7, Lenovo breaks with this rule, at least a little bit. Instead of the classic, rubberized top cover made out of Carbon fiber, Lenovo now used black anodized aluminum with diamond-cut sides. Other design changes have been adapted from the ThinkPad X1 Carbon G12, like the camera bump. Very different from before is also the new haptic touchpad, which integrates the TrackPoint buttons - more on that in the section on input devices, but overall, we can say that the ThinkPad P1 now looks much more like the ThinkPad Z16 than before. One component of that is the much slimmer screen bezel. The screen to body ratio increases from 81 to 87 percent.

In terms of quality, the redesign is a level above the preceding model, which is due to the aluminum screen cover offering more stiffness. The ThinkPad laptop can not be dented anywhere and barely flexes. Workmanship is, as expected from such a premium model, flawless. Small drawback: The smudge-proneness of the black ThinkPad colorway still remains, both for the rubberized base unit and the metal screen cover.
The screen can be opened up to a full 180 degrees. Arranged as a wide single-piece bar, the two hinges are smooth enough to enable one-handed opening and stiff enough to stop the screen from wobbling. When opening the lid, the camera bump becomes a useful grip.

The weight goes slightly up, but the X/Y footprint gets smaller. The higher weight is due to the denser aluminum material for the lid. On the other hand, the P1 Gen 7 is notably more compact than the P1 Gen 6, thanks to the slimmer screen bezel. All competitors are heavier. In the case of the Dell XPS 16, the difference is substantial.
Connectivity: Lenovo replaces SO-DIMM with LPCAMM2
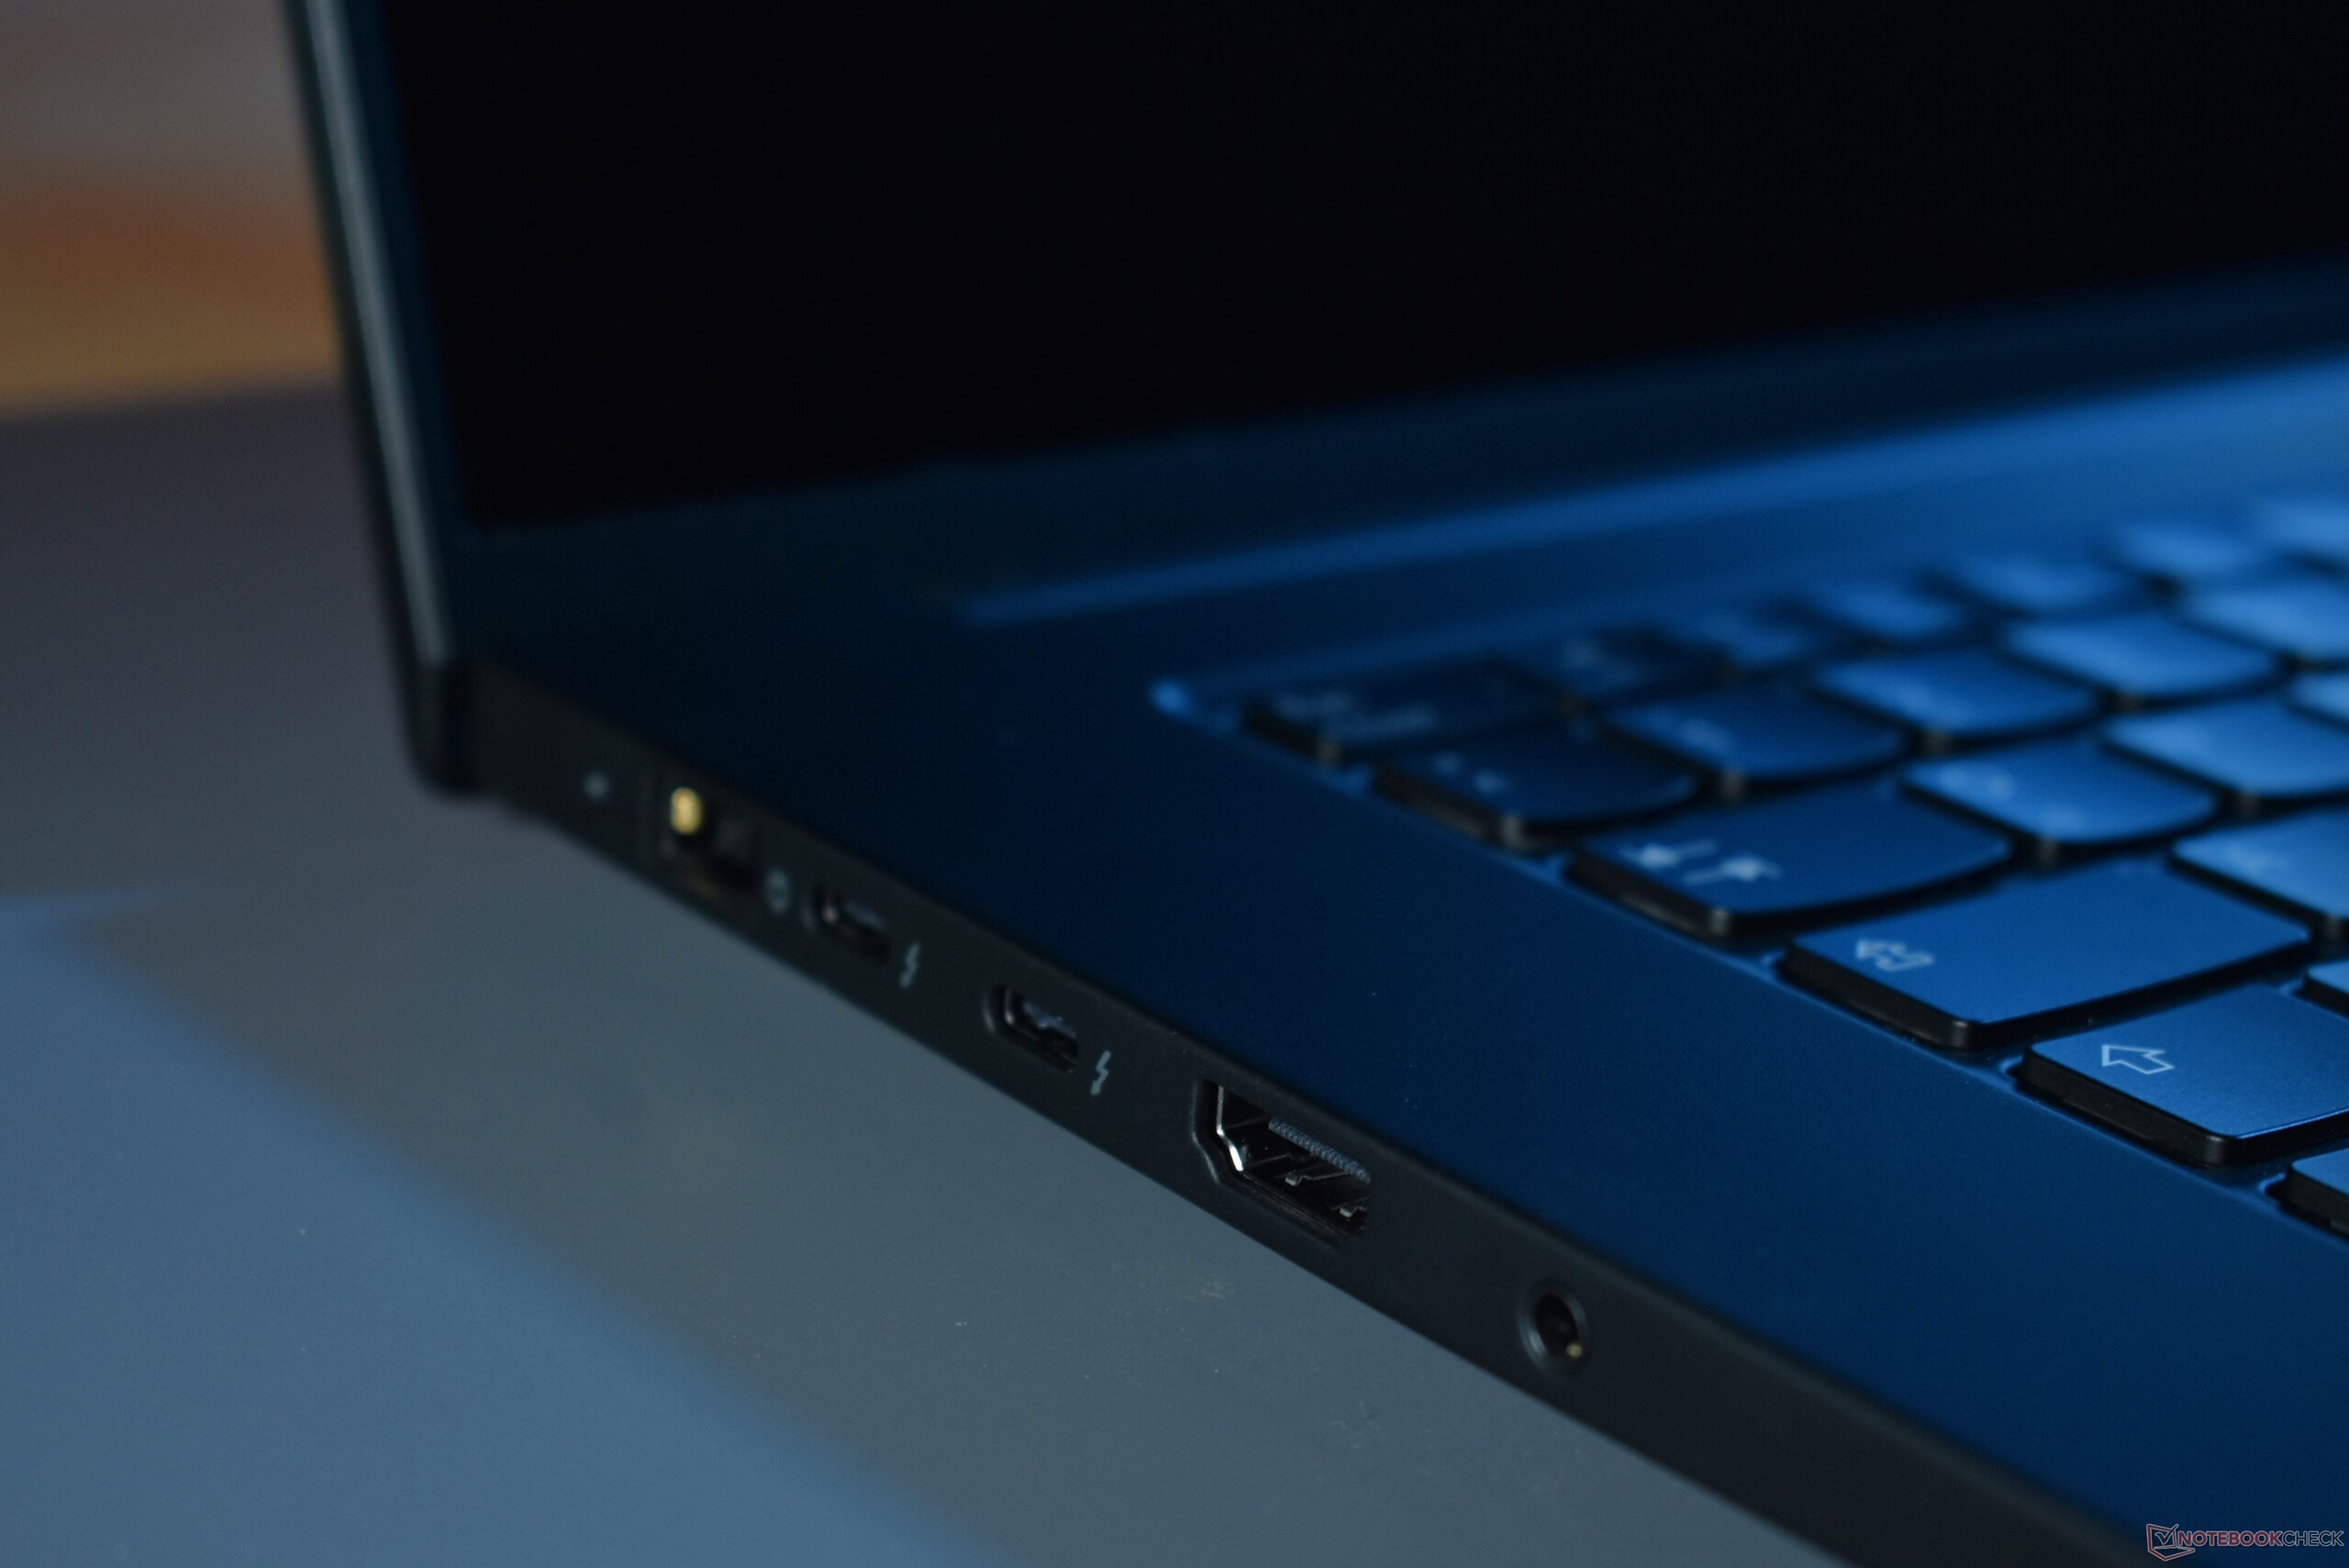
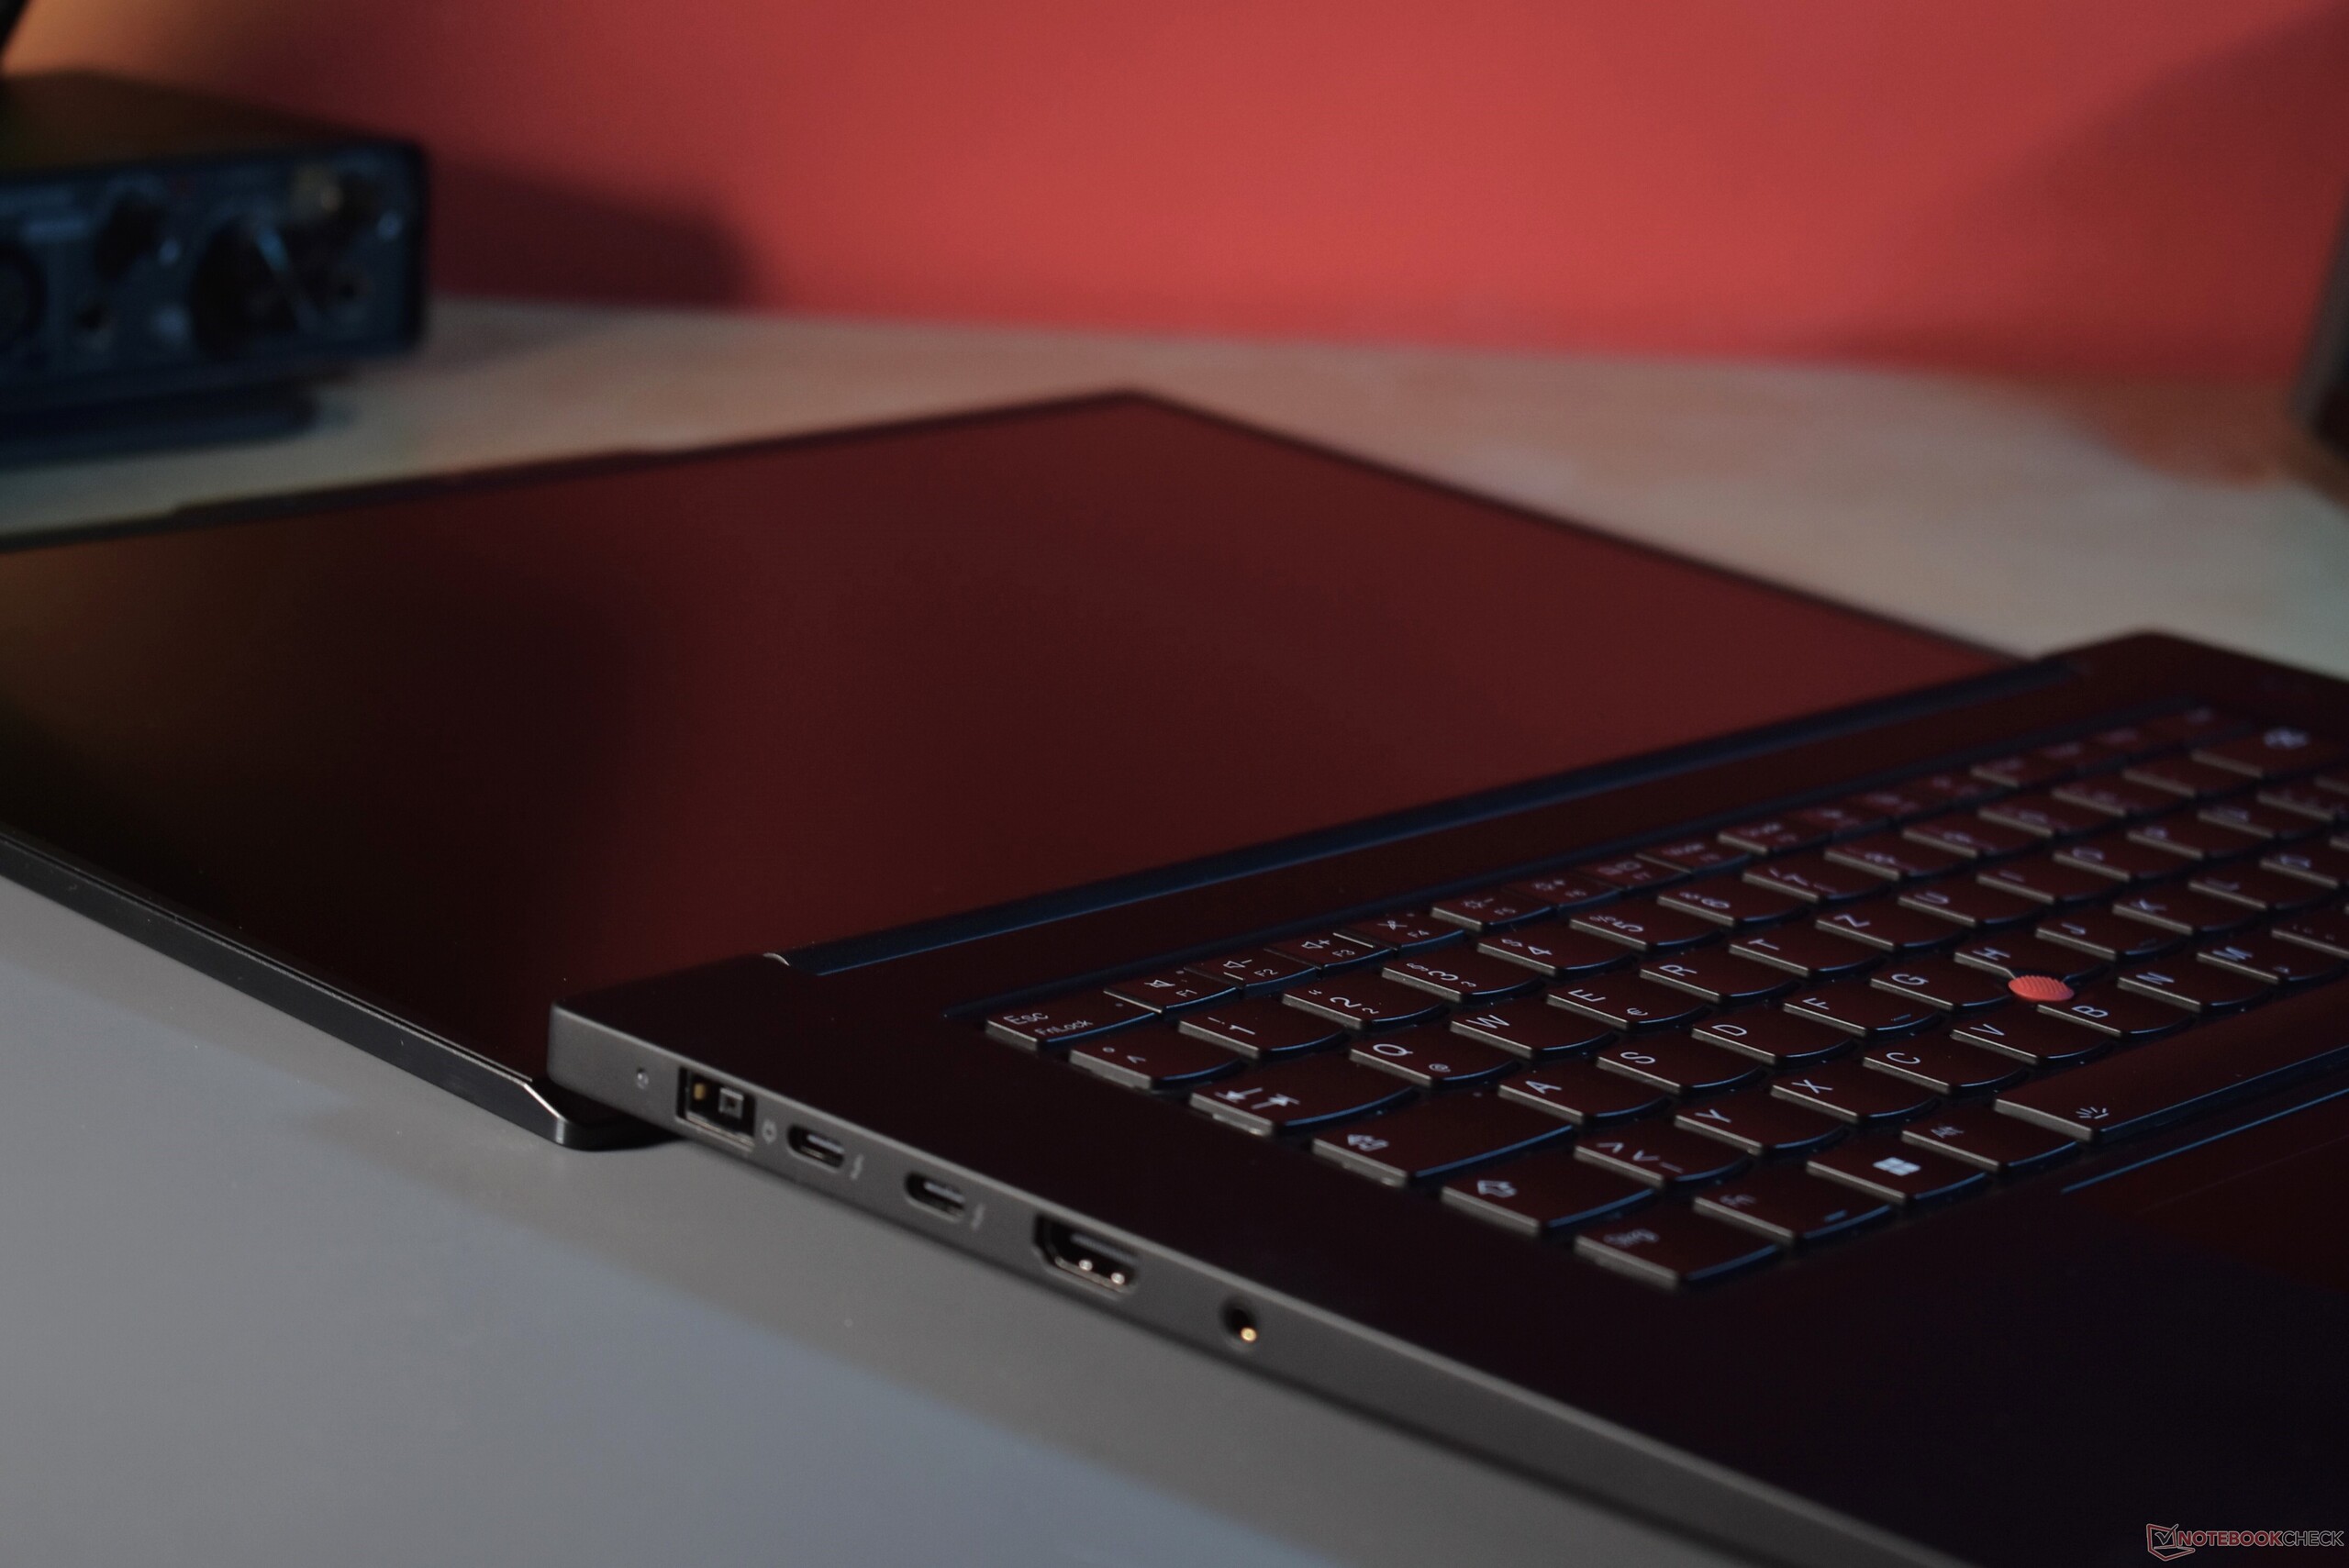
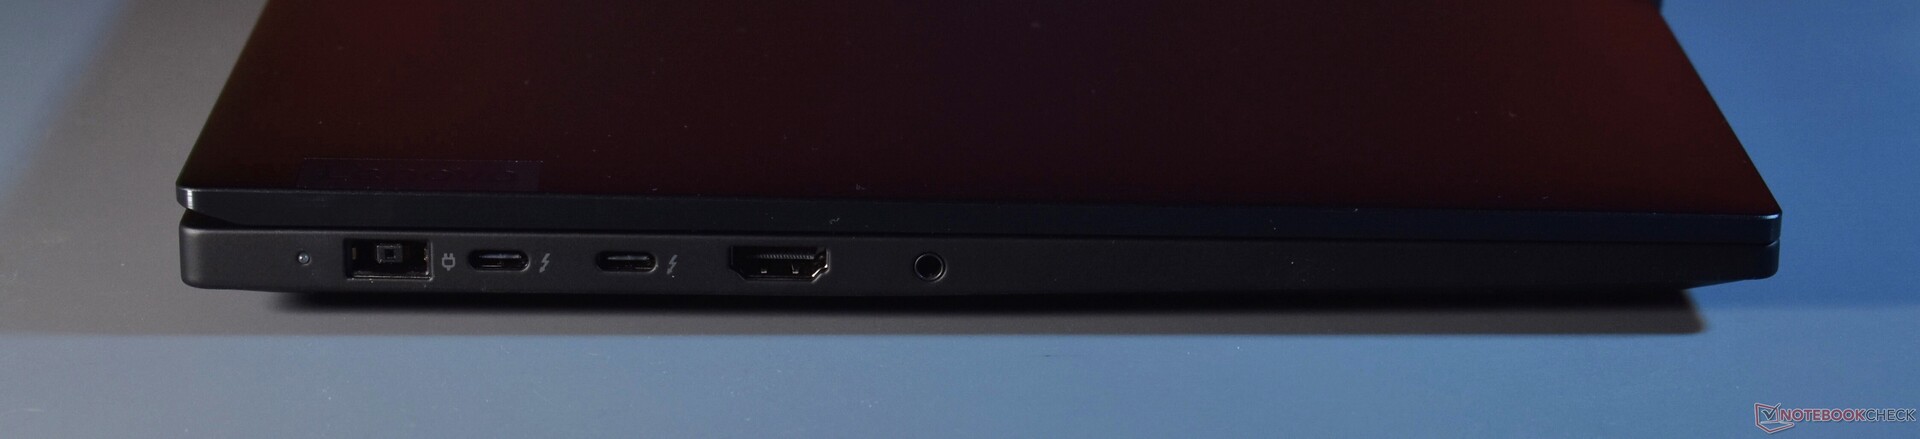
There is no big revolution for the ports, Lenovo keeps many legacy connectors around. The only substantial change: One of the two USB-A ports is replaced by a USB-C one. Of that flavor, there are no three ports, with the two on the left supporting Thunderbolt 4. The new port on the right side does support DisplayPort at least.
Charging is possible with each of the USB-C ports, though there also is a dedicated Slim tip charging connector. With a 100 W USB-C charger, the P1 G7 works without problems. Only under maximum load, performance will probably be reduced. A 65 W charger can charge the P1 as well - however, the ThinkPad laptop will complain about it, producing a notification that it is a "slow charger".
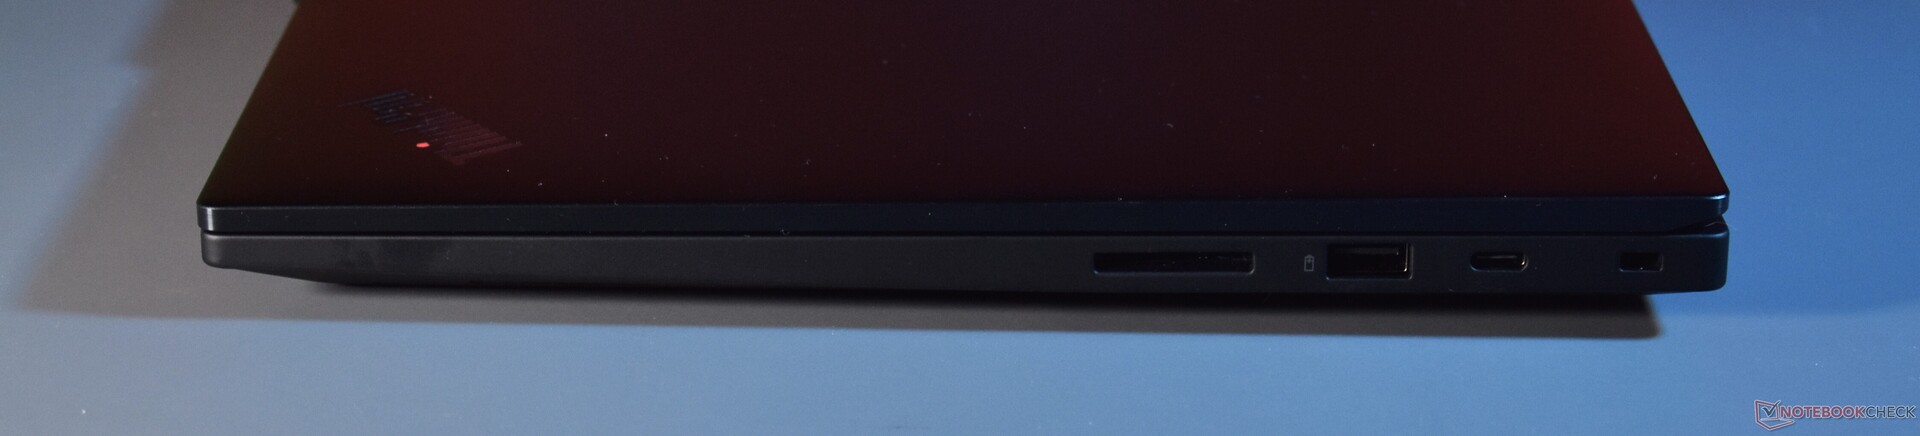
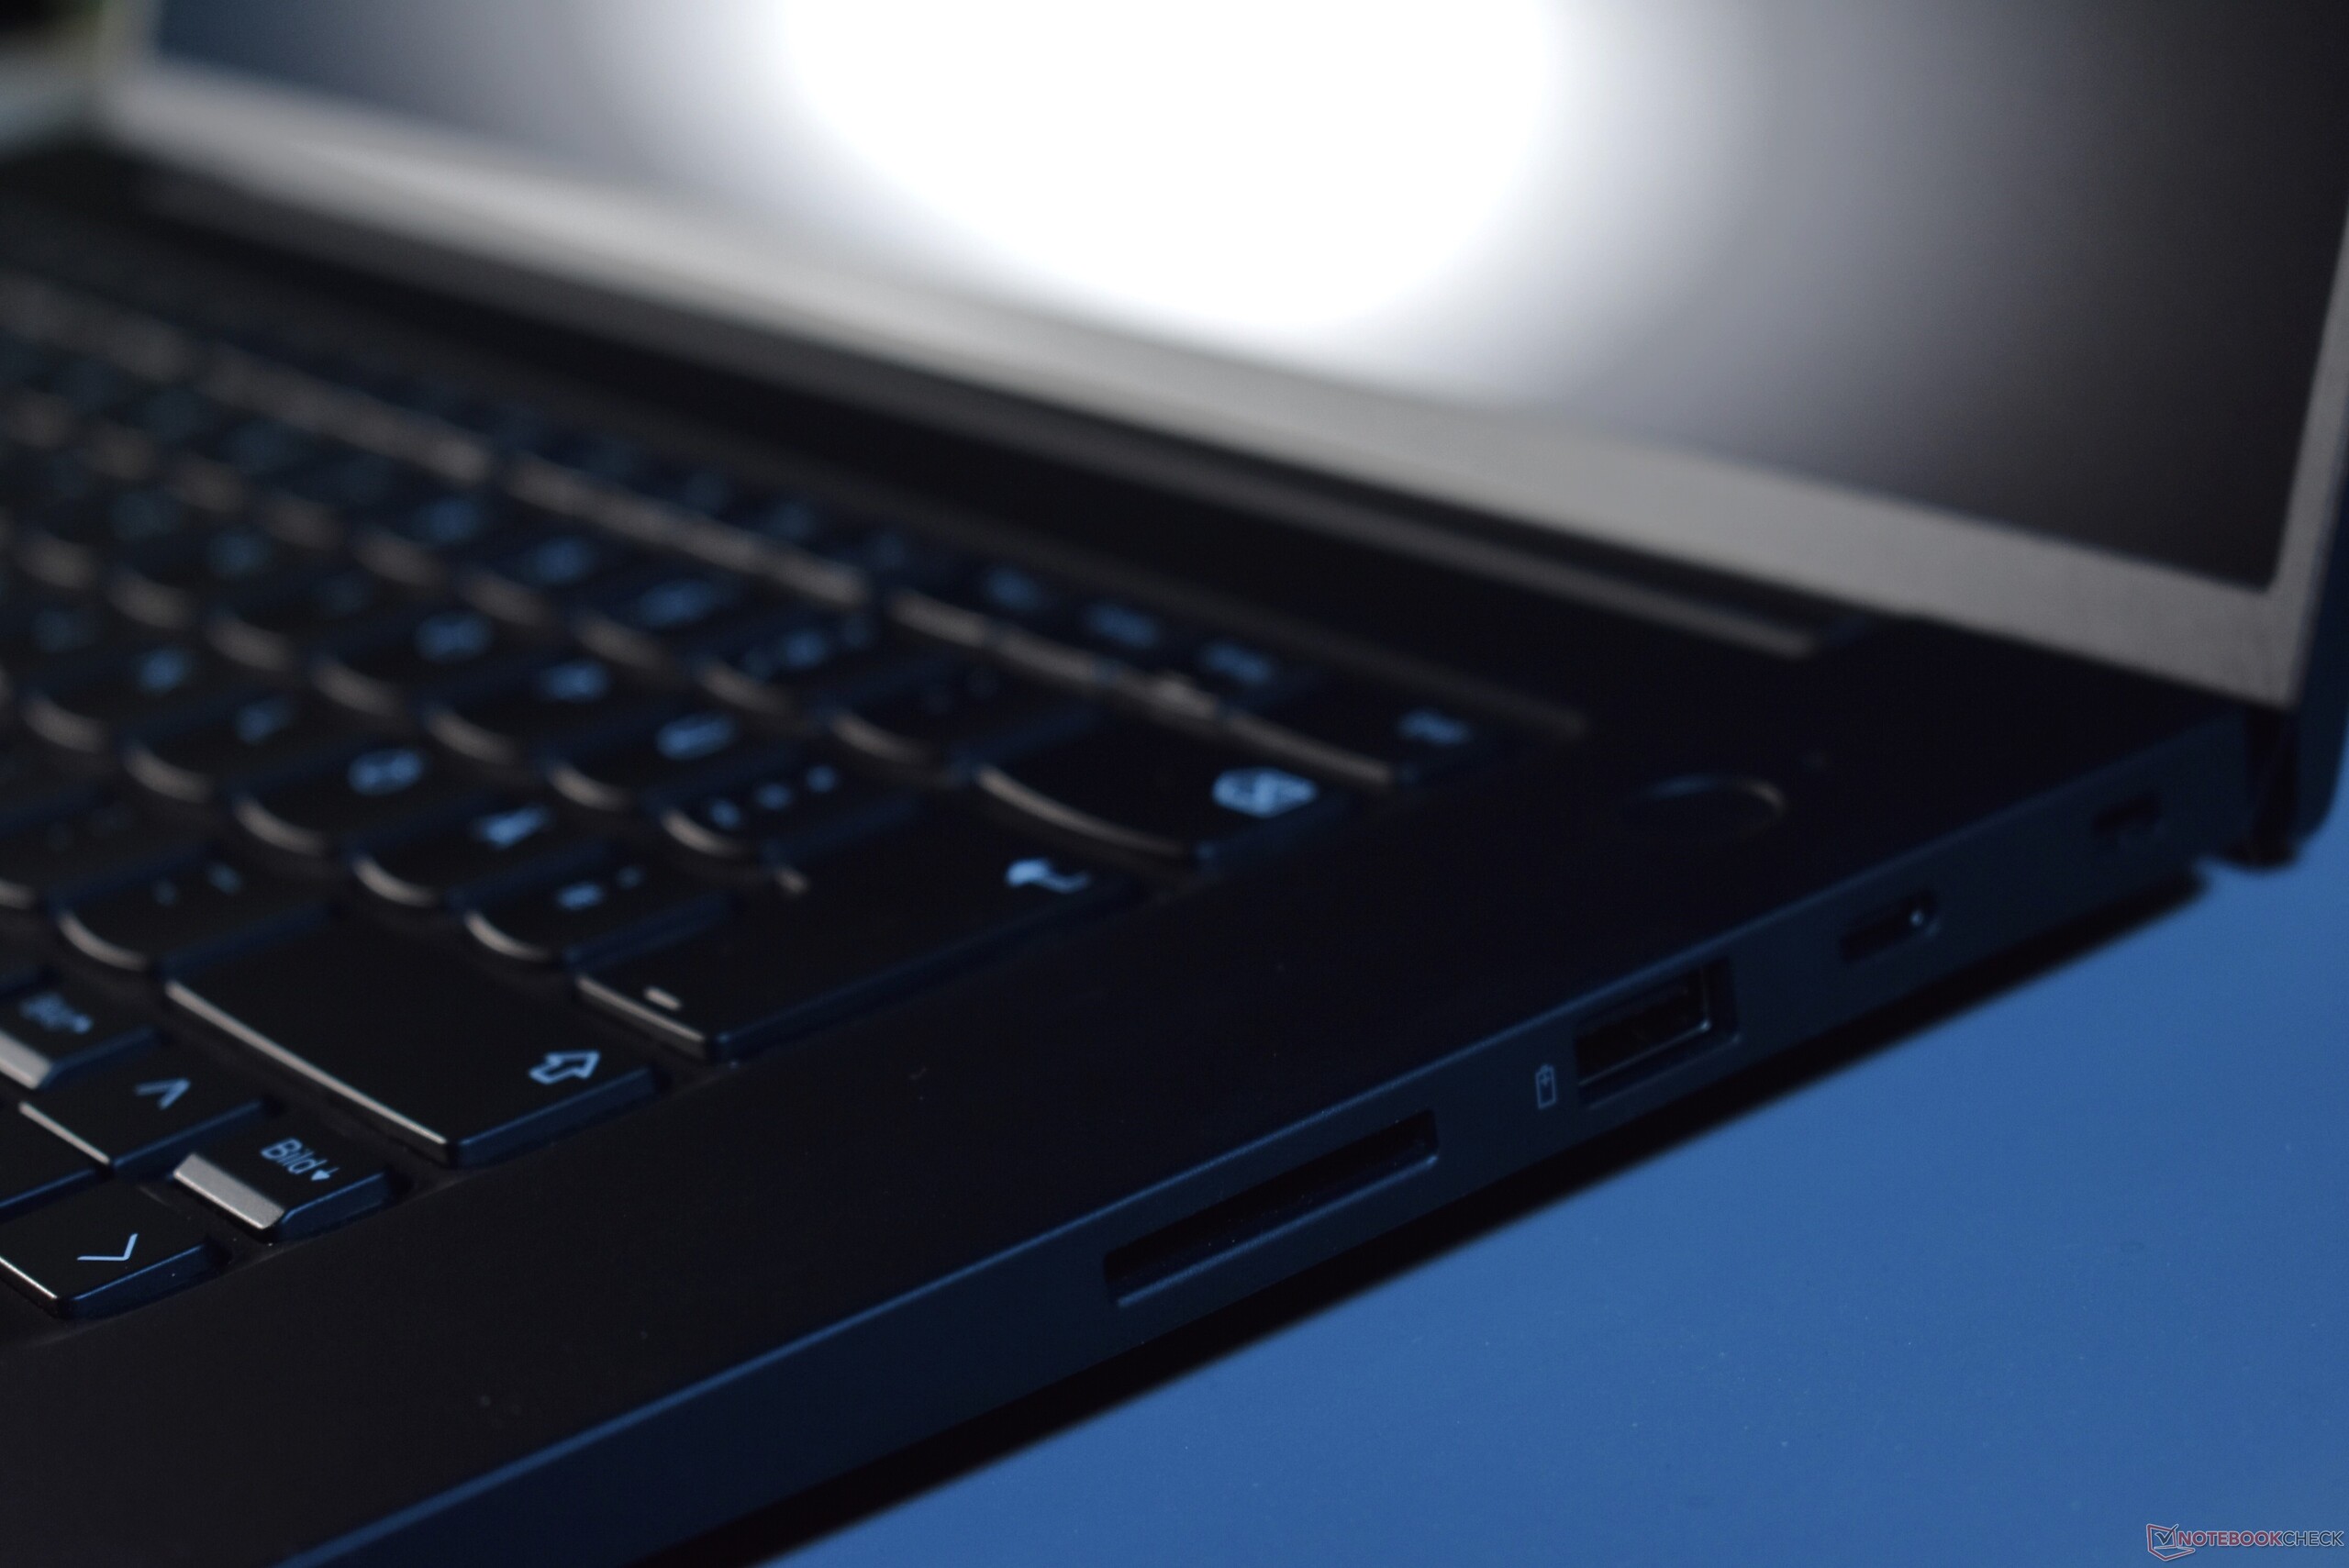
SD Card Reader
Surprising: The card reader of the Lenovo ThinkPad P1 Gen 7 can once again take in SD cards completely, making it useful for permanent storage expansion. Rather disappointing are the transfer rates, which me measured with the Angelbird AV Pro V60 reference card. The SD card reader is of average speed.
| SD Card Reader | |
| average JPG Copy Test (av. of 3 runs) | |
| Dell XPS 16 9640 (Angelbird AV Pro V60) | |
| Average of class Workstation (49.6 - 681, n=14, last 2 years) | |
| Lenovo ThinkPad P1 G6 21FV001KUS (Toshiba Exceria Pro SDXC 64 GB UHS-II) | |
| Lenovo ThinkPad P1 Gen 7 21KV001SGE (AV Pro V60) | |
| maximum AS SSD Seq Read Test (1GB) | |
| Average of class Workstation (87.6 - 1455, n=14, last 2 years) | |
| Dell XPS 16 9640 (Angelbird AV Pro V60) | |
| Lenovo ThinkPad P1 G6 21FV001KUS (Toshiba Exceria Pro SDXC 64 GB UHS-II) | |
| Lenovo ThinkPad P1 Gen 7 21KV001SGE (AV Pro V60) | |
Communication
The ThinkPad P1 Gen 7 is future-proof when it comes to the Wi-Fi solution. Lenovo puts in a Wi-Fi 7 solution from Intel, the BE200. It produces high transfer rates.
Besides Wi-Fi, this ThinkPad workstation only offers Bluetooth 5.4. RJ45 Ethernet is not present, neither is WWAN. 4G or 5G has been discontinued from the P1 series a few years ago, and it does not look like this feature will make a reappearance any time soon.
Webcam
The webcam of the Lenovo ThinkPad P1 Gen 7 offers a resolution of five megapixels. With the preceding model, this was still an optional upgrade. The quality of the webcam is comparatively good for a laptop, with the pictures being pretty sharp with good lighting.


Security
Since this is an enterprise model, the Lenovo ThinkPad P1 Gen 7 offers most security functions that the standard models for office tasks like the T series offer. Among these features, we find a Kensington lock slot, a fingerprint reader in the power button as well as a dTPM chip, a bottom tamper detection for the base cover and an infrared camera for Windows Hello. Different from the ThinkPad Z16, Lenovo affords the ThinkPad P1 G7 a physical camera shutter for enhanced privacy. Not part of the package is a Smart card reader.
Accessories
Lenovo takes it down a notch when it comes to the charger. Instead of a 230 W one, the P1 G7 just includes a 170 W charger, which is more lightweight and compact. It still is a proprietary charger with a Slim tip connector, but USB-C charging with up to 100 W is also possible here.
Maintenance
Lenovo makes it easy to reach the inside of the ThinkPad, as the six screws holding the bottom cover are captive, preventing them from getting lost. The screws use the Philips head standard - no special tools needed. Once the screws are loose, the base can be opened starting at the backside around the hinges. The clips practically open up by themselves here.

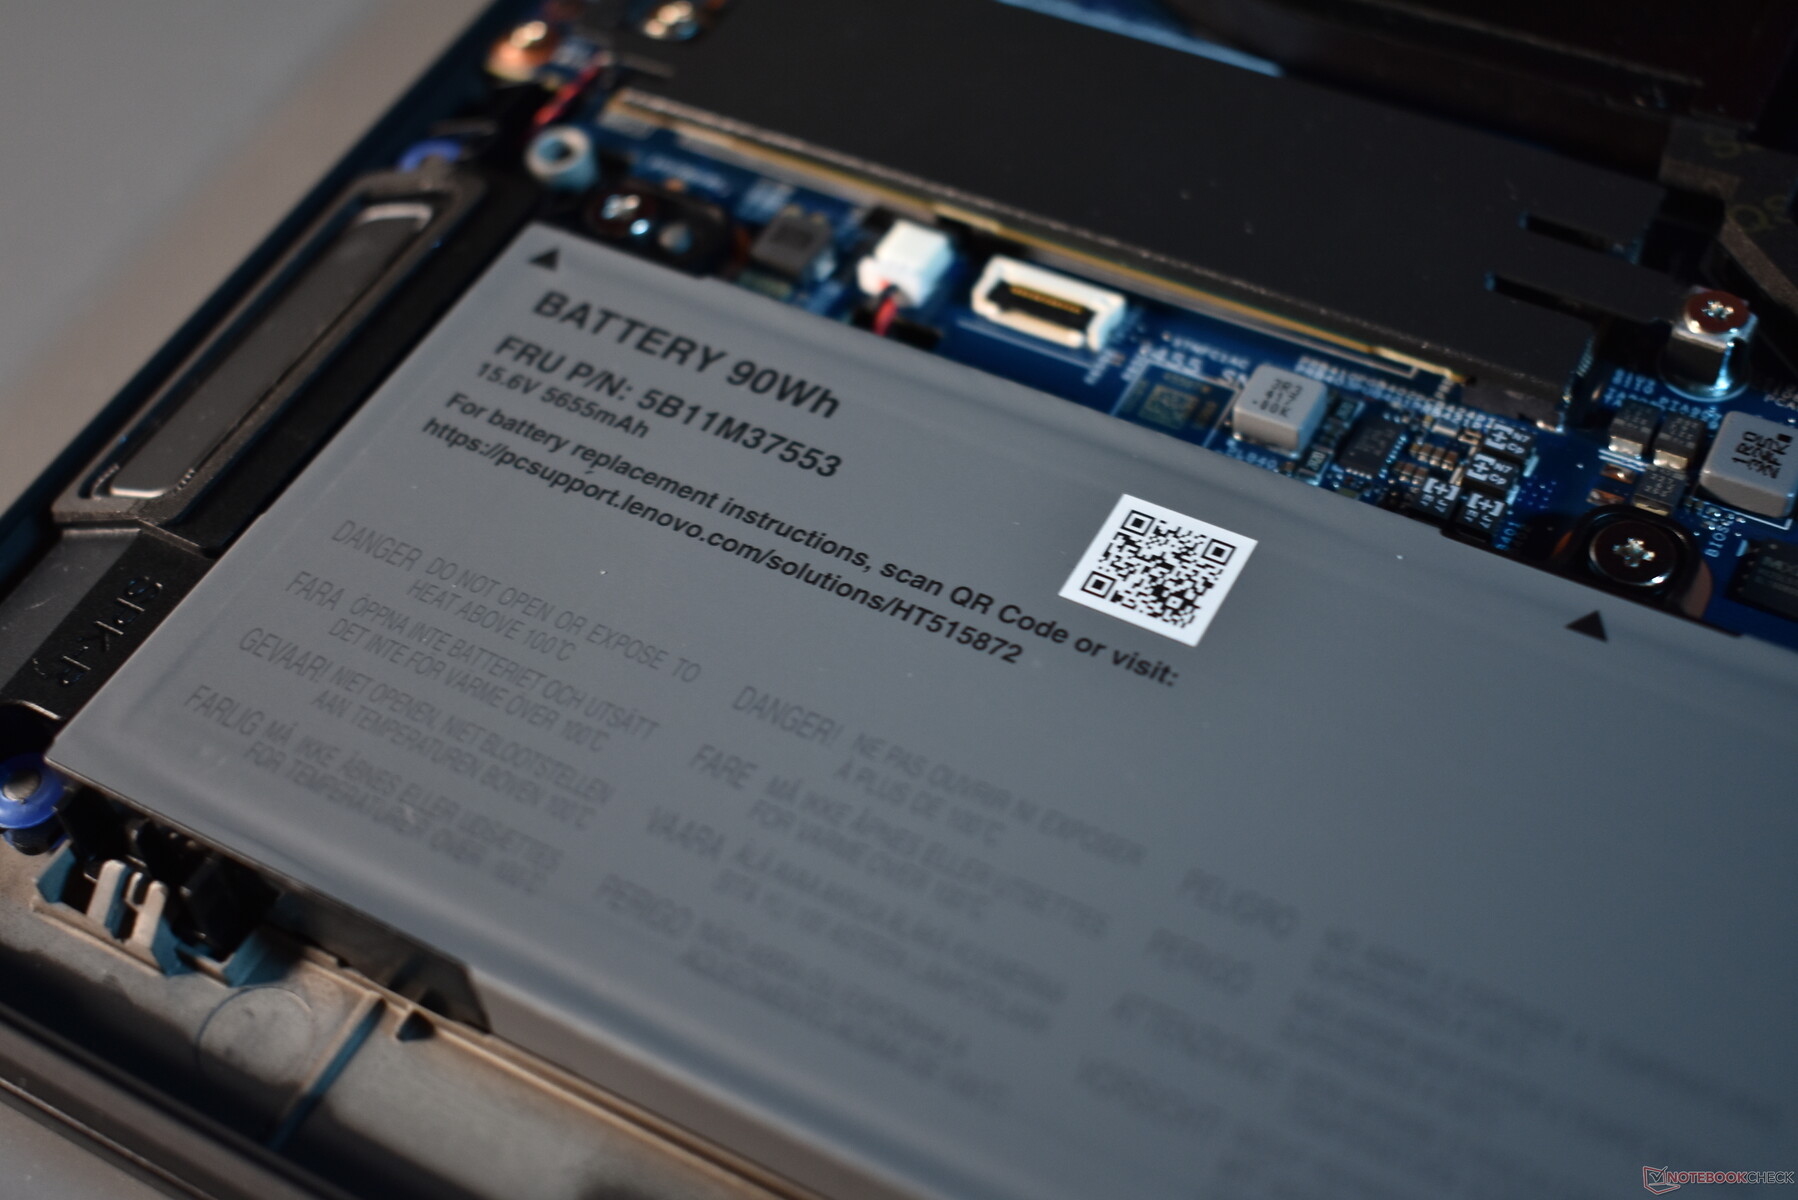
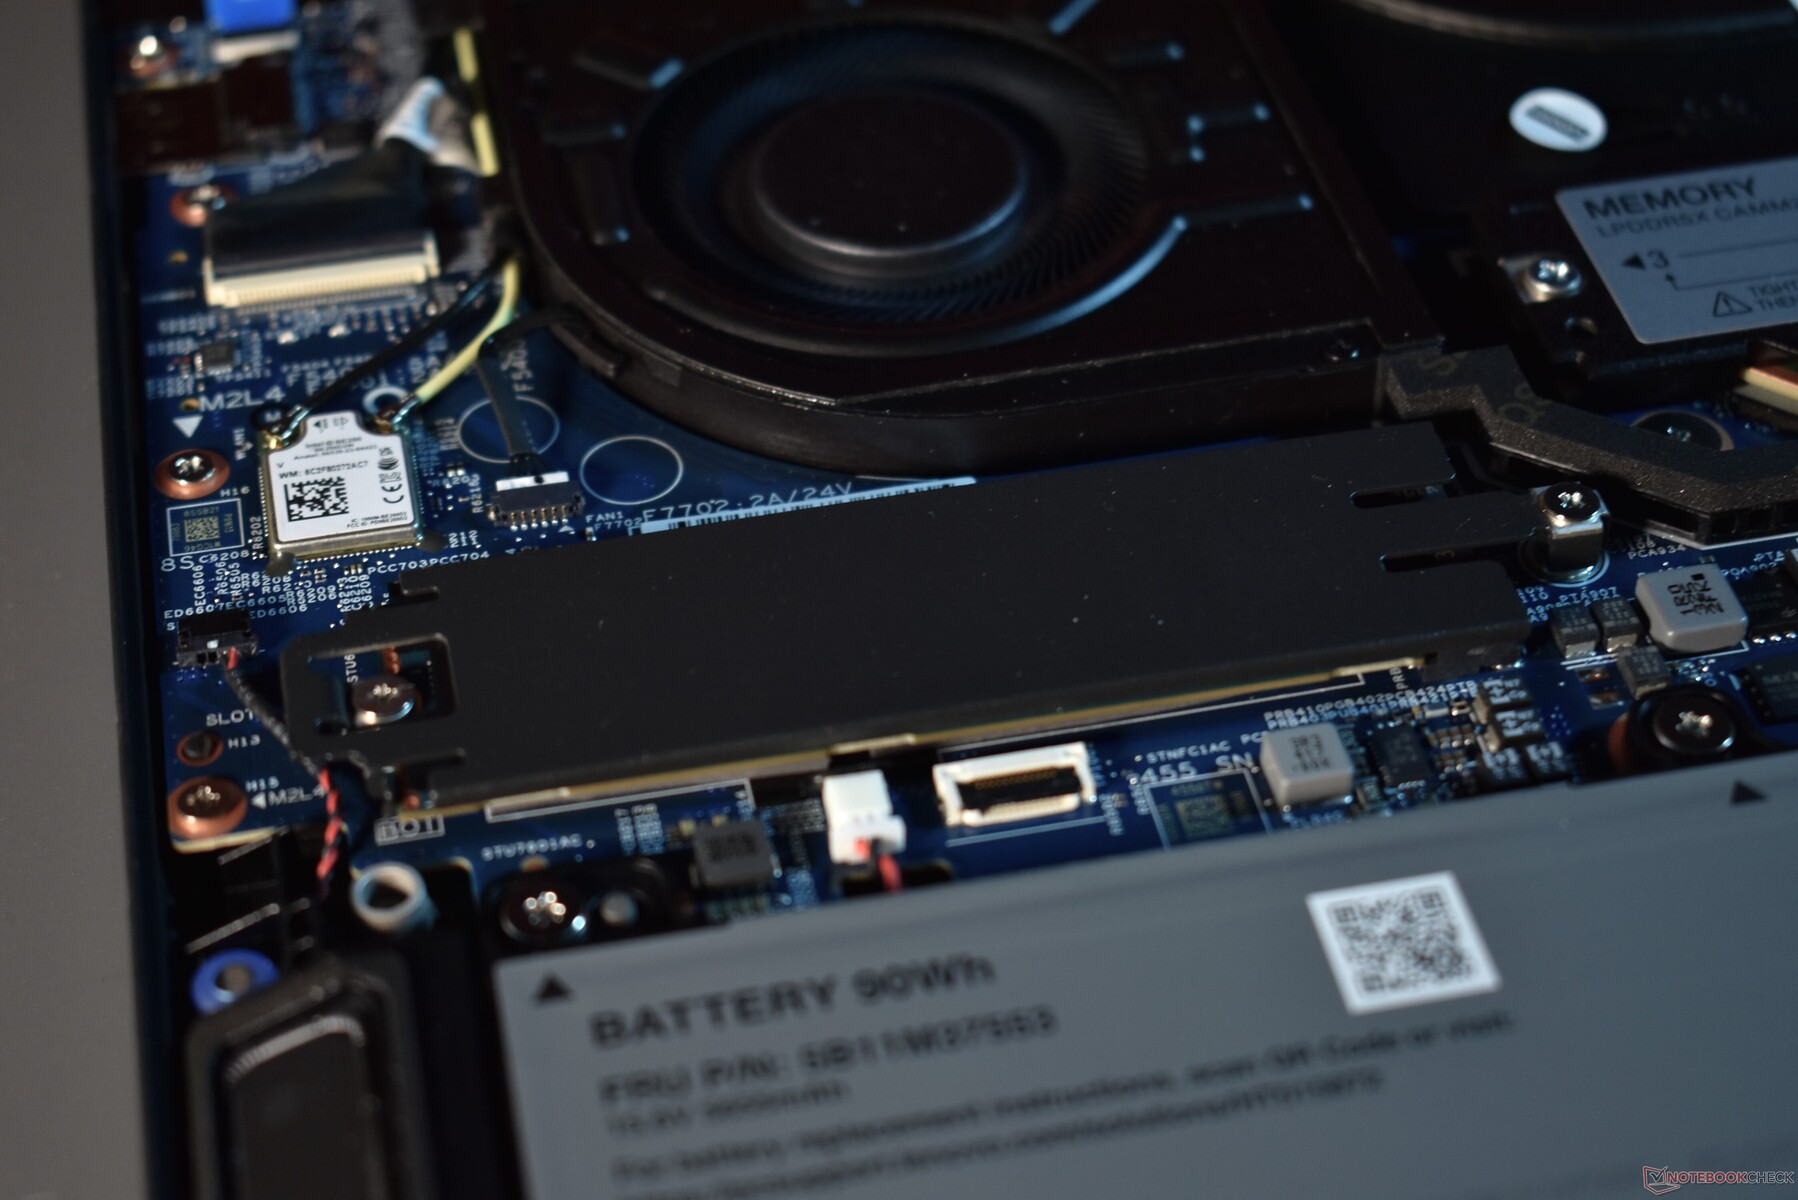
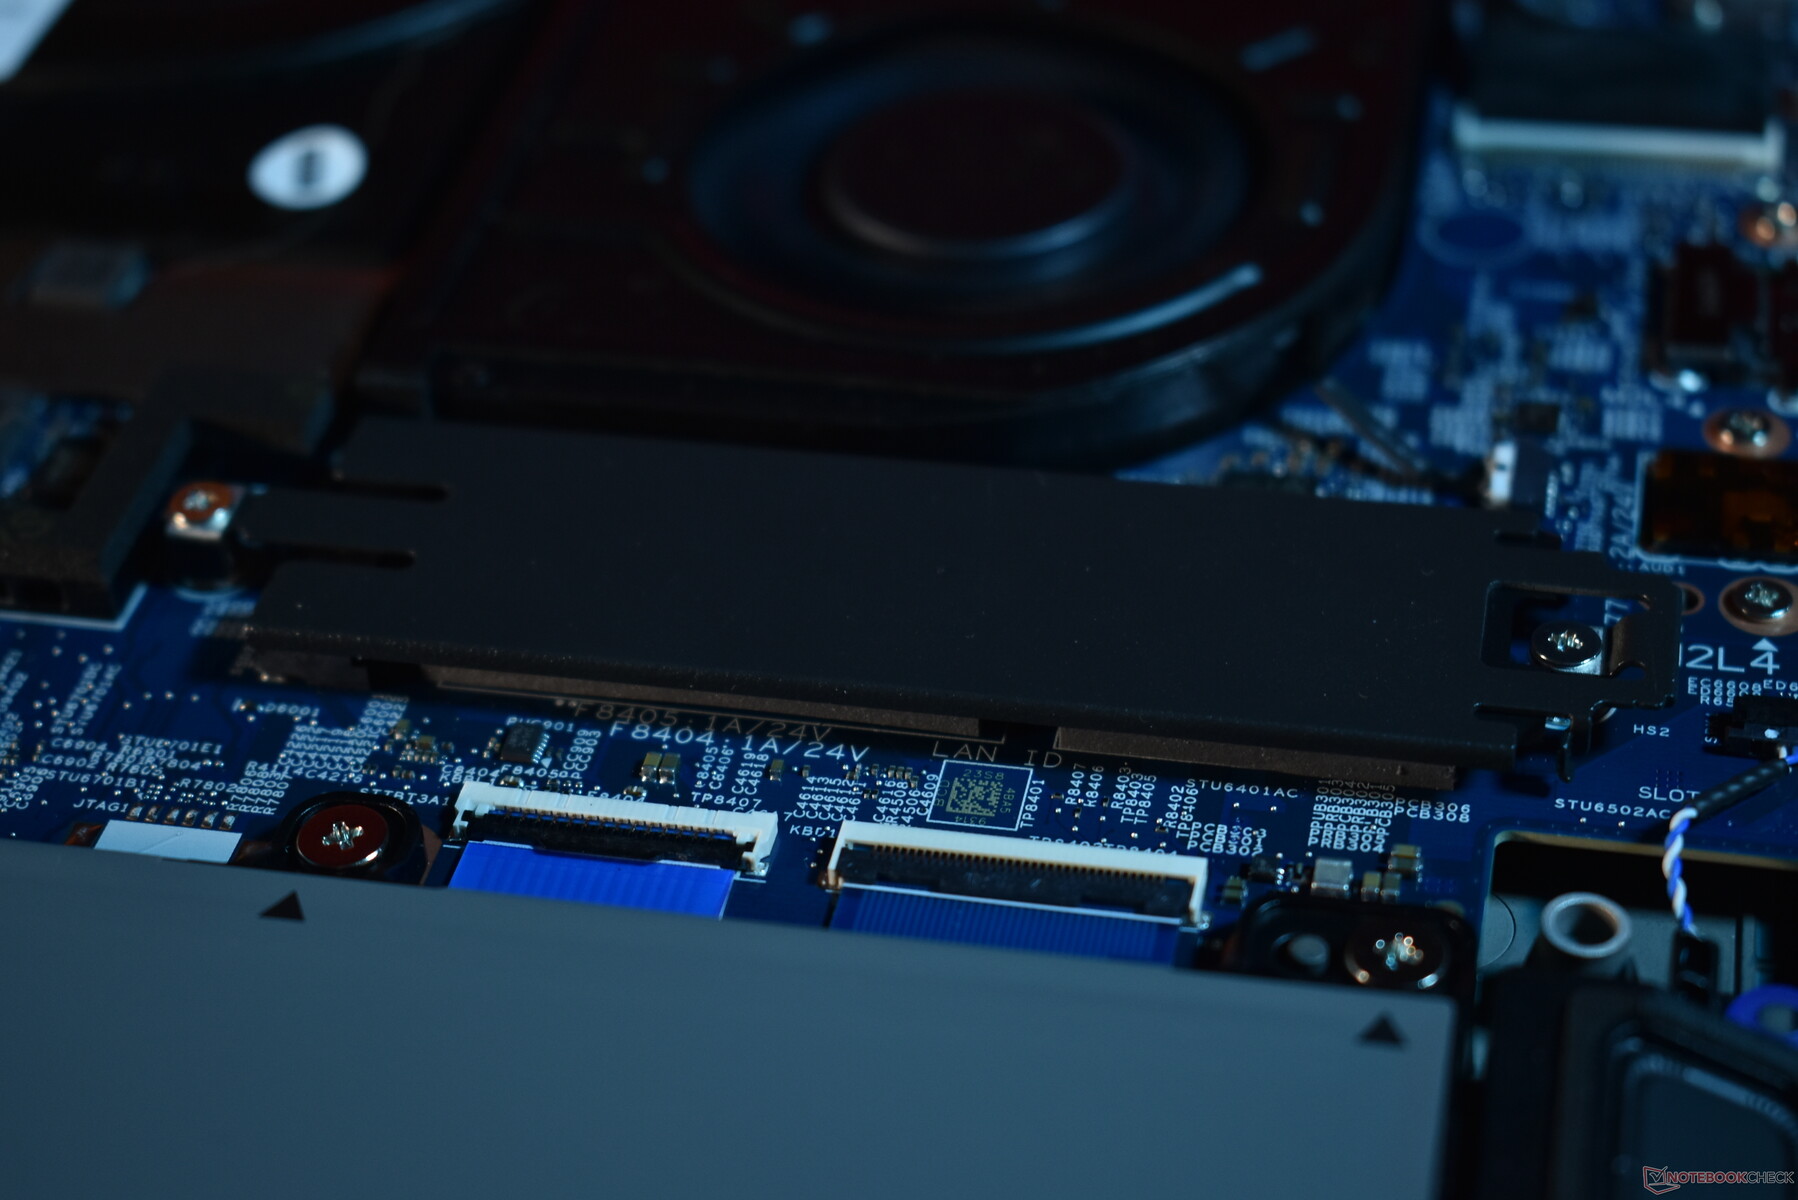
Lenovo has redesigned the internals completely. The cooling system is slightly smaller than the predecessor ThinkPad P1 Gen 6. As a gain, the ThinkPad P1 Gen 7 always has two M.2 2280 slots, which was only the case for the weakest variants of the P1 Gen 6. Also, the two SO-DIMM slots are nowhere to be found. Instead, Lenovo puts in a single LPCAMM2 module - the Lenovo ThinkPad P1 Gen 7 is the first laptop ever with this memory type. The single module carries low power memory, which comes in 16, 32 and 64 GB sizes. The predecessor with more inefficient DDR5 memory did offer up to 96 GB, though the SO-DIMM modules also took up a lot more space. To remove the LPCAMM2 memory, three screws have to be loosened. A guide how to do it is available through the QR code on the memory module.
The Wi-Fi module is soldered down. WWAN has not been present in the P1 line for a while, so there is no additional M.2 slot for that. It is pretty easy to change the battery, Lenovo did away with the cable-connector. Instead, the battery simply plugs in directly. Of course, it is still secured with screws. There is a QR code to a manual here too. For the first time with the P1 line, the battery can be changed by the user even in the warranty period, since it is a Customer Replaceable Unit (CRU) now.
Not easily replaceable is the keyboard, the whole base unit has to be replaced to change the keyboard. Also, the cooling system is no longer easily accessible - Lenovo warns customers not to take it apart, due to the usage of liquid metal cooling paste.

Sustainability
Most ThinkPad laptops of the 2024 generation use recycled materials for parts of their outer hull. This is not the case for the ThinkPad P1 Gen 7, only a few plastic parts like the keys are recycled. At least the packaging of the ThinkPad laptop is completely compostable. Lenovo offers a maximum of five years of warranty, so there also are five years of software updates and replacement part support. The CO₂ production value for the ThinkPad P1 G7 sits at 214 kg/CO₂ equivalent.
Warranty
As mentioned in the sustainability section, the maximum warranty reaches five years. Our unit already comes with three years of on-site service standard. Internationally, it is three years of bring in warranty.
Input devices: Integrated TrackPoint buttons well realized for the first time
Keyboard
Lenovo has reworked the two-level backlight keyboard of the ThinkPad P1 Gen 7 in many aspects.
The travel distance is still the same, 1.5 mm. The keycap design also remains, but Lenovo changes the outer keys from the smile-shaped design to a rectangular one - something they did on most ThinkPads a while ago. The same is true for the second change: Lenovo uses a slightly smaller keyboard for the first time in the ThinkPad P1. The new keyboard is roughly one centimeter less wide. This seems strange, as there is ample room with the ThinkPad P1. However, the ThinkPad P1 Gen 6 was the last ThinkPad laptop in the lineup with the old standard width. In the end, the cost argument was likely decisive, as making specialized hardware components tends to be costly. By using a smaller layout like for the 14-inch ThinkPad models, Lenovo can share parts between lines.
For European users with the ISO layout, the new keyboard is annoying as important keys like the German umlauts Ü and Ä are smaller - on the American ANSI type layout with the smaller enter key, it is less of a problem. Other new features affect all 2024 ThinkPads, like the swapped FN/Ctrl keys, the Copilot key instead of PrtScr and the haptic markers on important keys like Enter or the volume keys.
Overall, the keyboard is great. The actuation force is slightly higher than for other ThinkPad laptops, but we like it. Typing on this keyboard is almost as comfortable as on older ThinkPads, despite the lower travel distance. With this keyboard, typing for hours is effortless and easy.
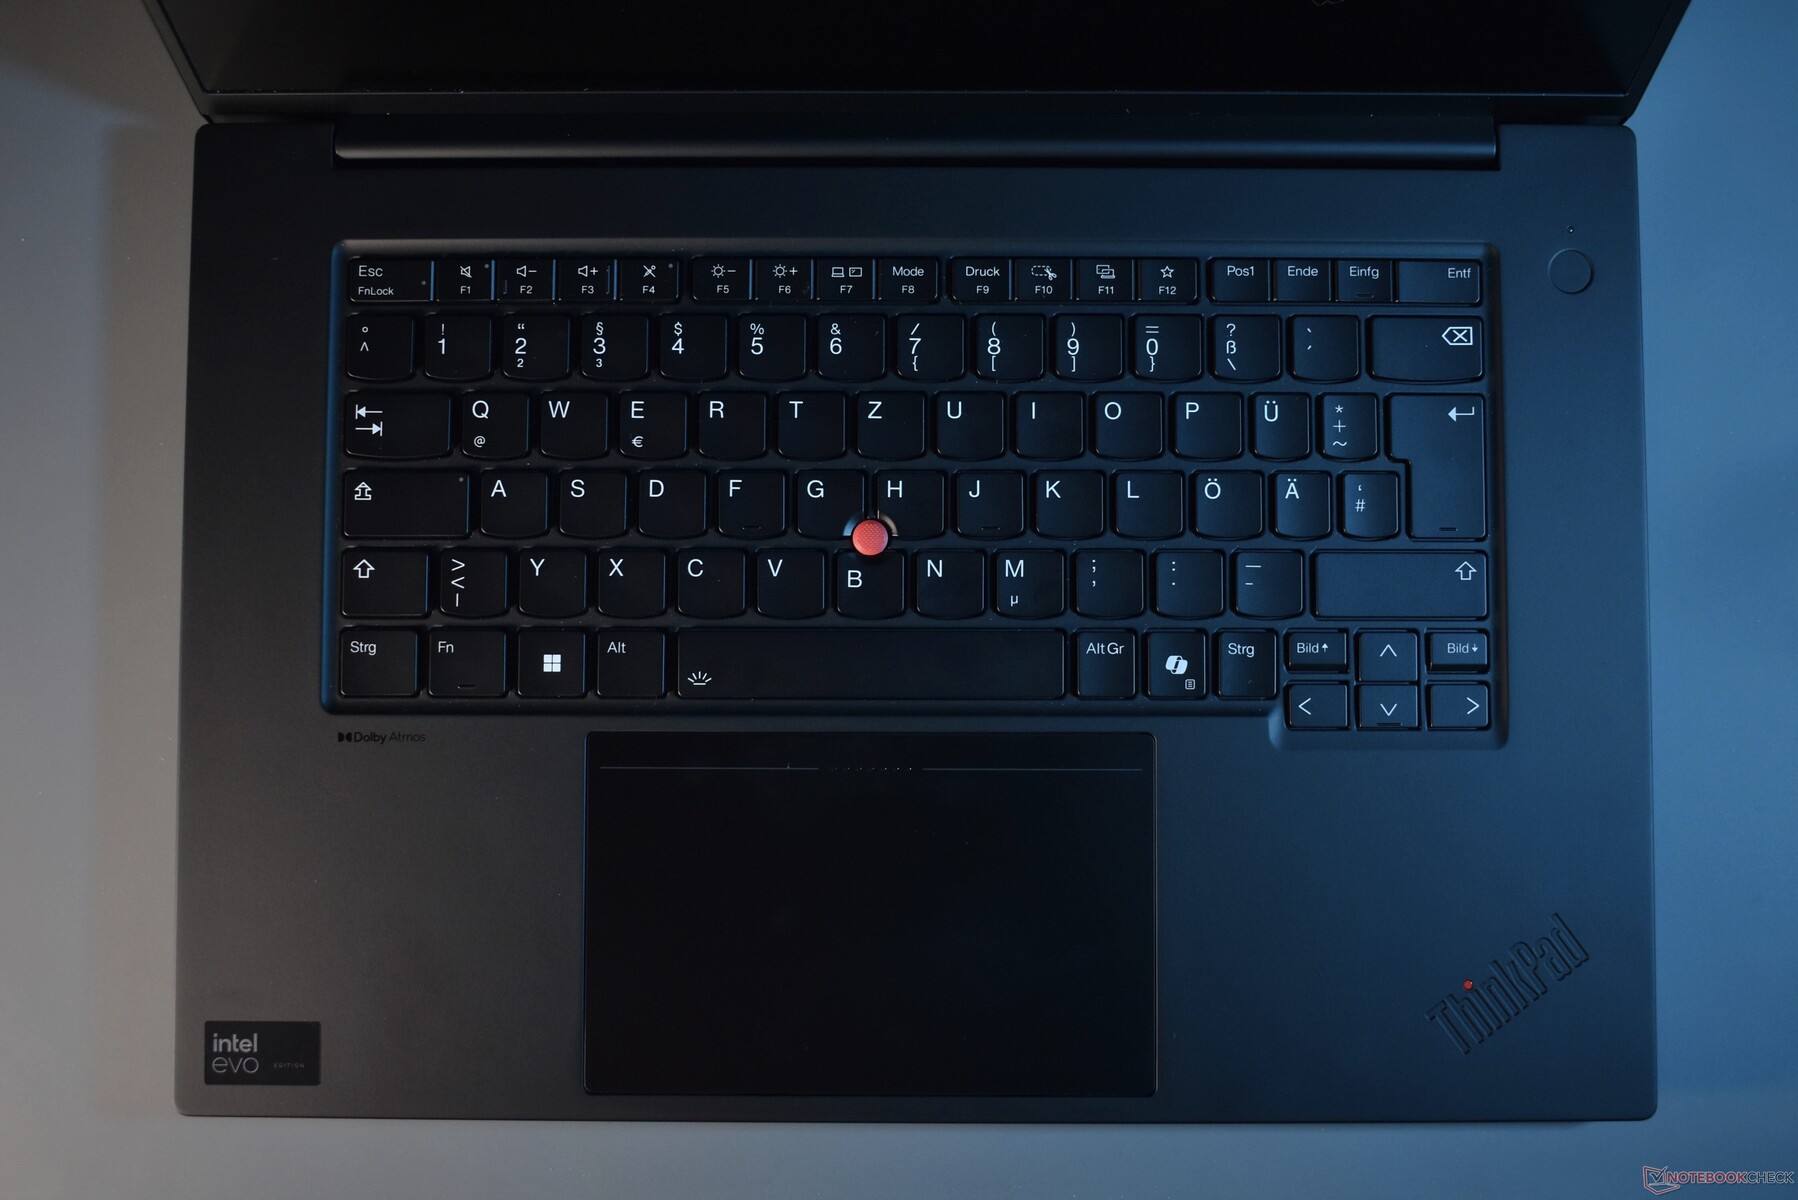
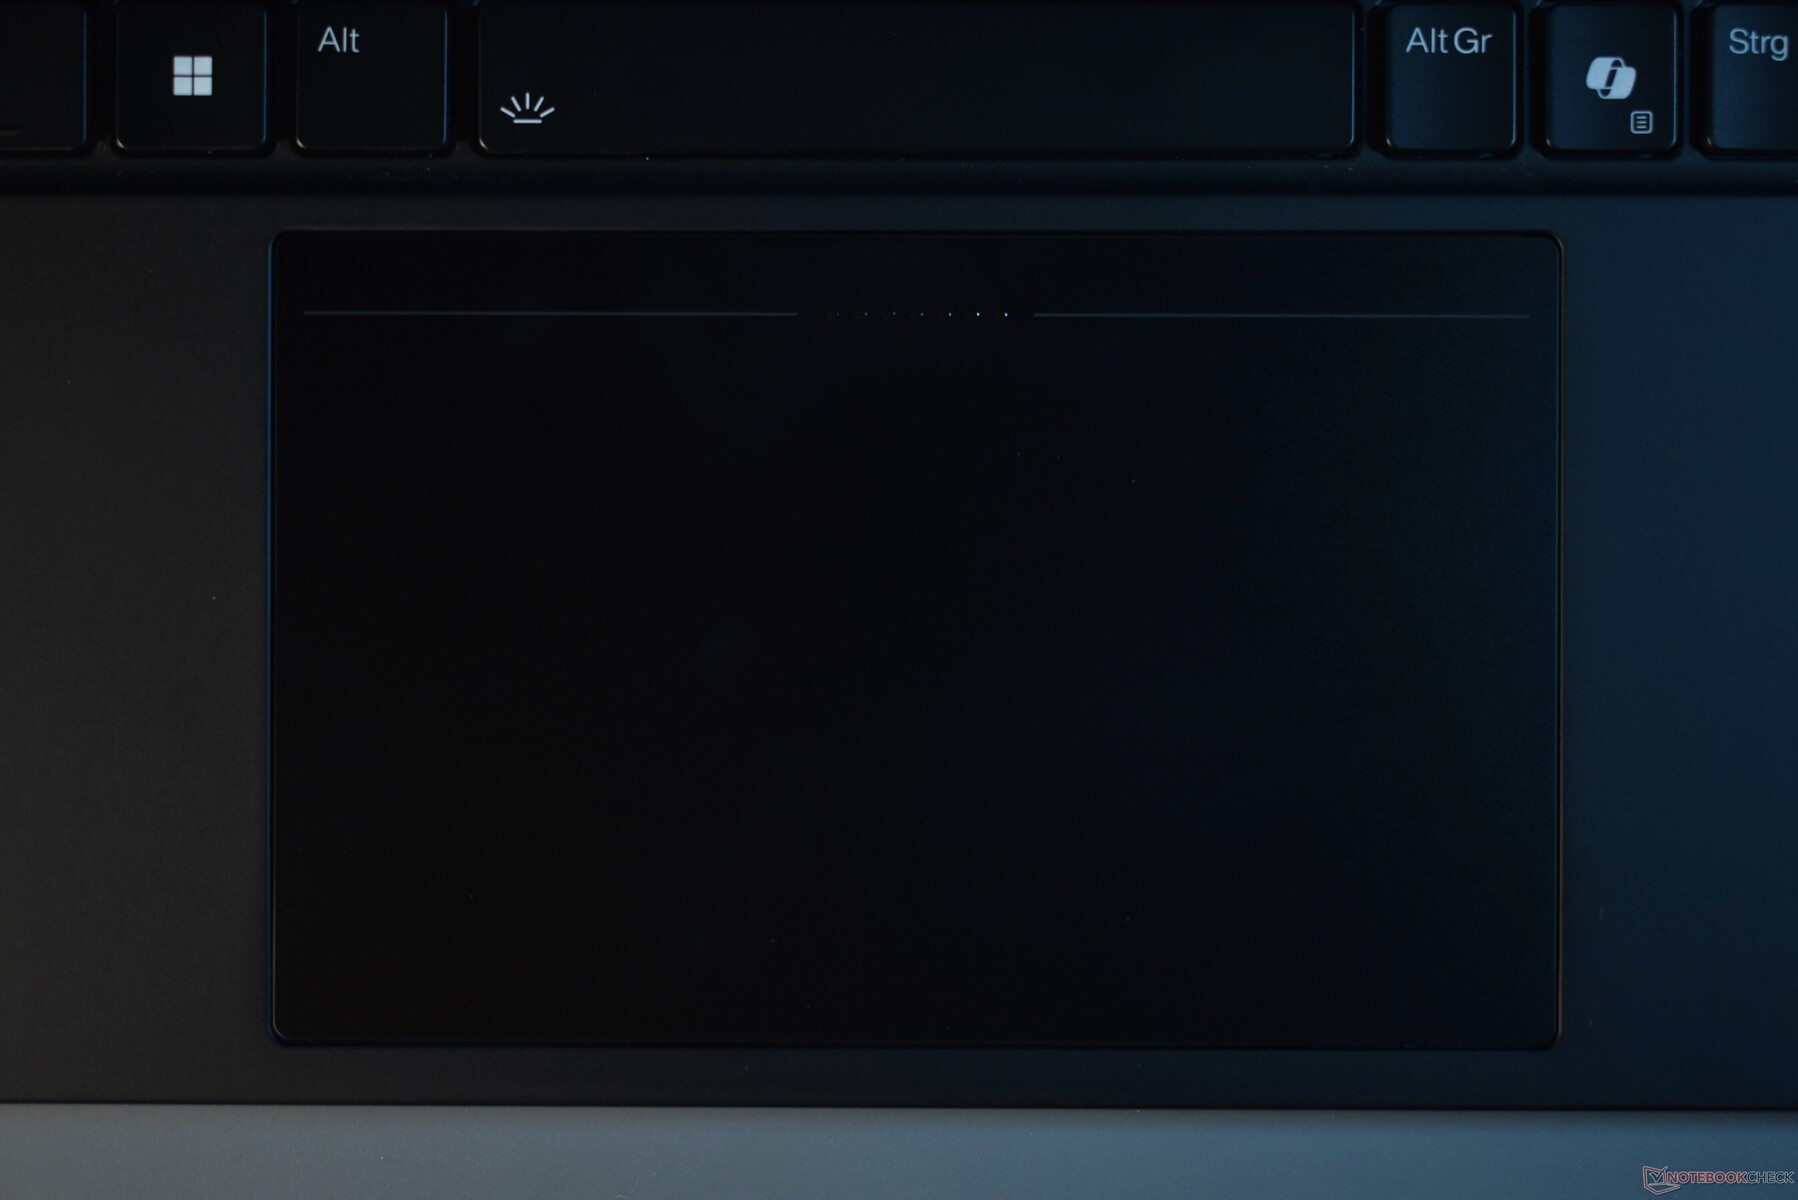
Touchpad & TrackPoint
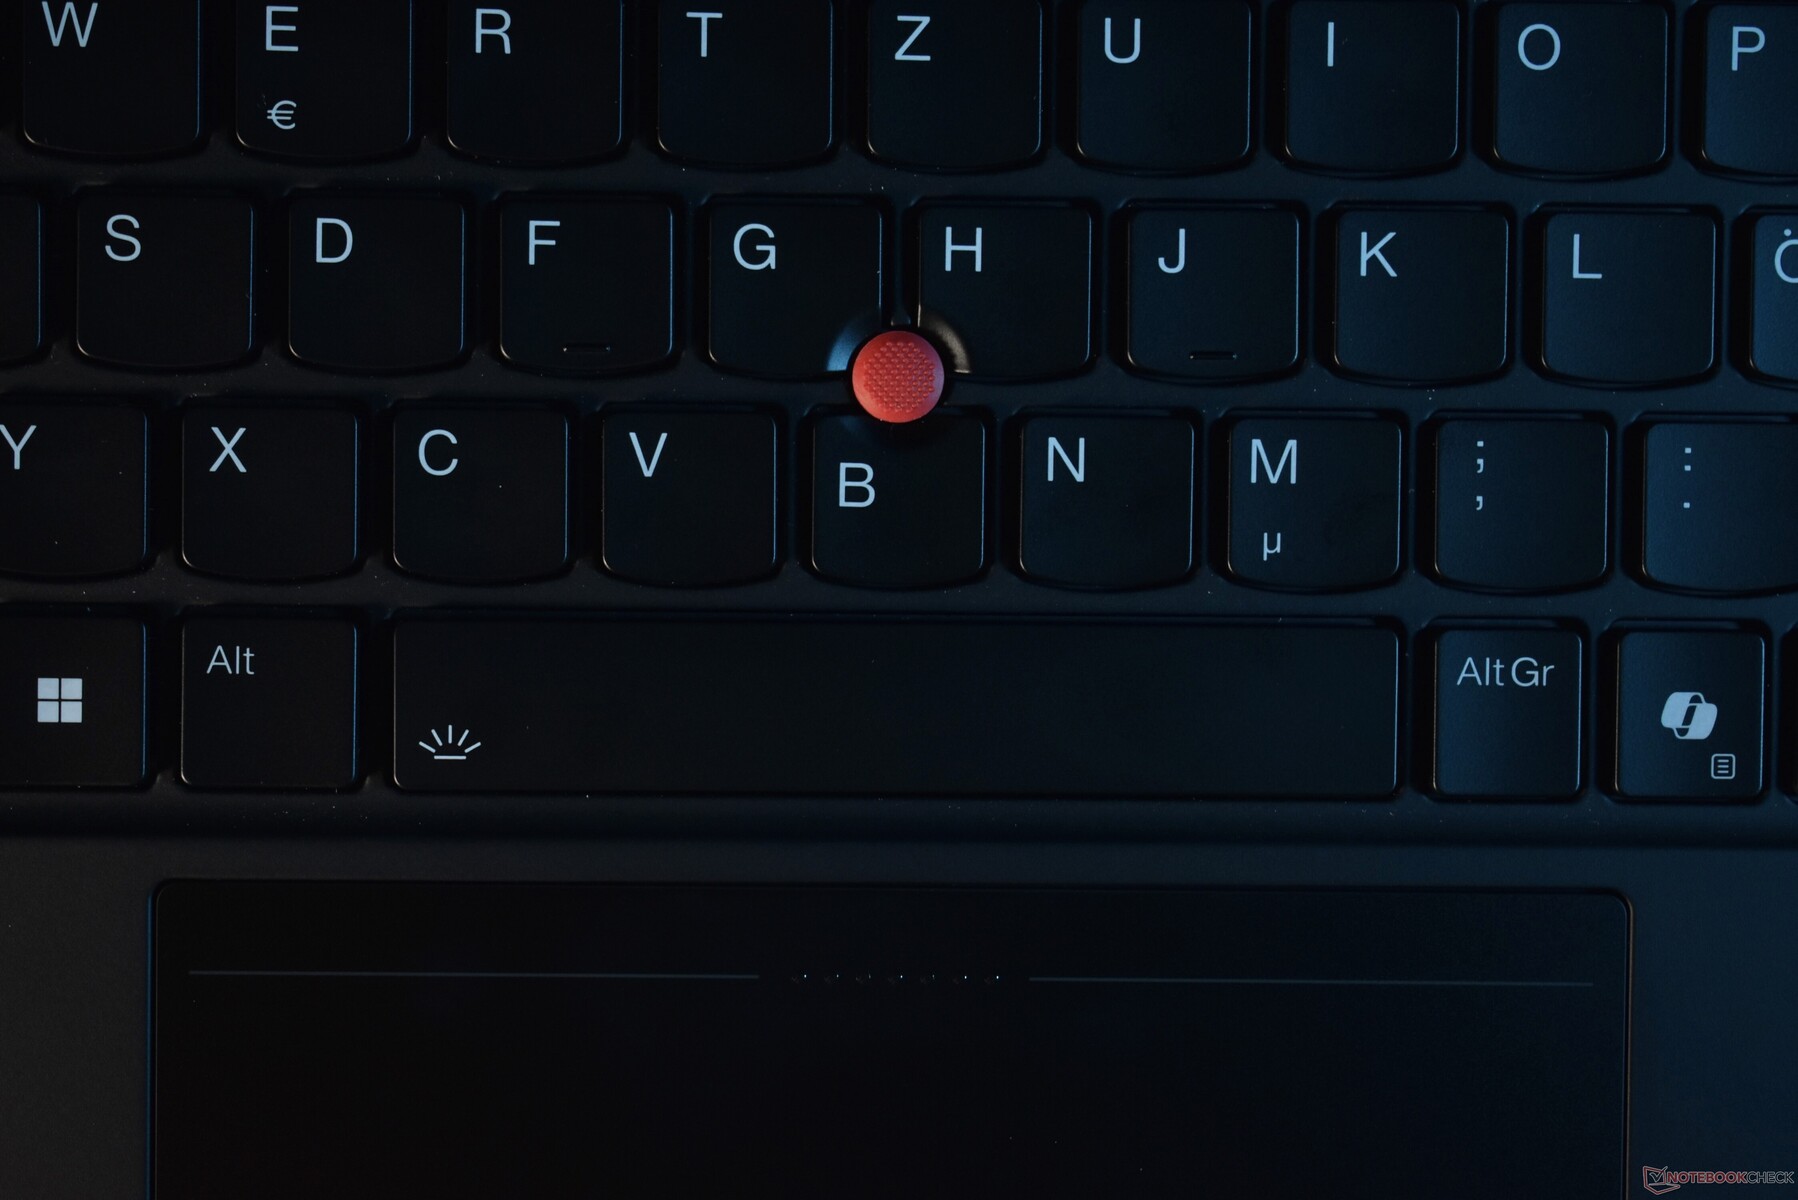
The touchpad is the area where Lenovo most clearly took cues from the ThinkPad Z16. Instead of the combination of physical TrackPoint buttons and a mechanical clickpad like usual for the ThinkPad P1, Lenovo puts a haptic trackpad into the ThinkPad P1 Gen 7, which was made by Sensel. Integrated into the surface are click zones for the ThinkPad TrackPoint - the P1 Gen 7 now has integrated TrackPoint buttons.
This new design allows Lenovo to increase the size of the touchpad without sacrificing the TrackPoint function completely. With a size of 13.5 x 8.5 cm, it is the largest trackpad of the recent ThinkPad generation. The surface consists of matte glass and since it is a haptic clickpad, it can be clicked anywhere. The click-strength can be decreased or increased in the Windows settings. The haptic effect can also be deactivated completely. The trackpad is outstanding in every way among ThinkPads, playing in the highest league in the laptop market overall.
If you use the red TrackPoint to steer the mouse pointer, the upper part of the touchpad replaced the dedicated mouse buttons. Since there are no separated buttons, the small dots of the middle button have to be used for orientation. This solution still is not 100 percent as good as dedicated buttons, but almost there. Compared with the previous version of the first Gen ThinkPad Z series, the haptic feedback is much softer, making it more pleasant to use. The force sensing also works great, with misclicks rarely happening, if ever. We only observed one problem: Sometimes, the touchpad tends to freeze when used with the TrackPoint and when a hand rests on the touchpad surface. Sensel promised us a firmware update is going to fix this in the future.
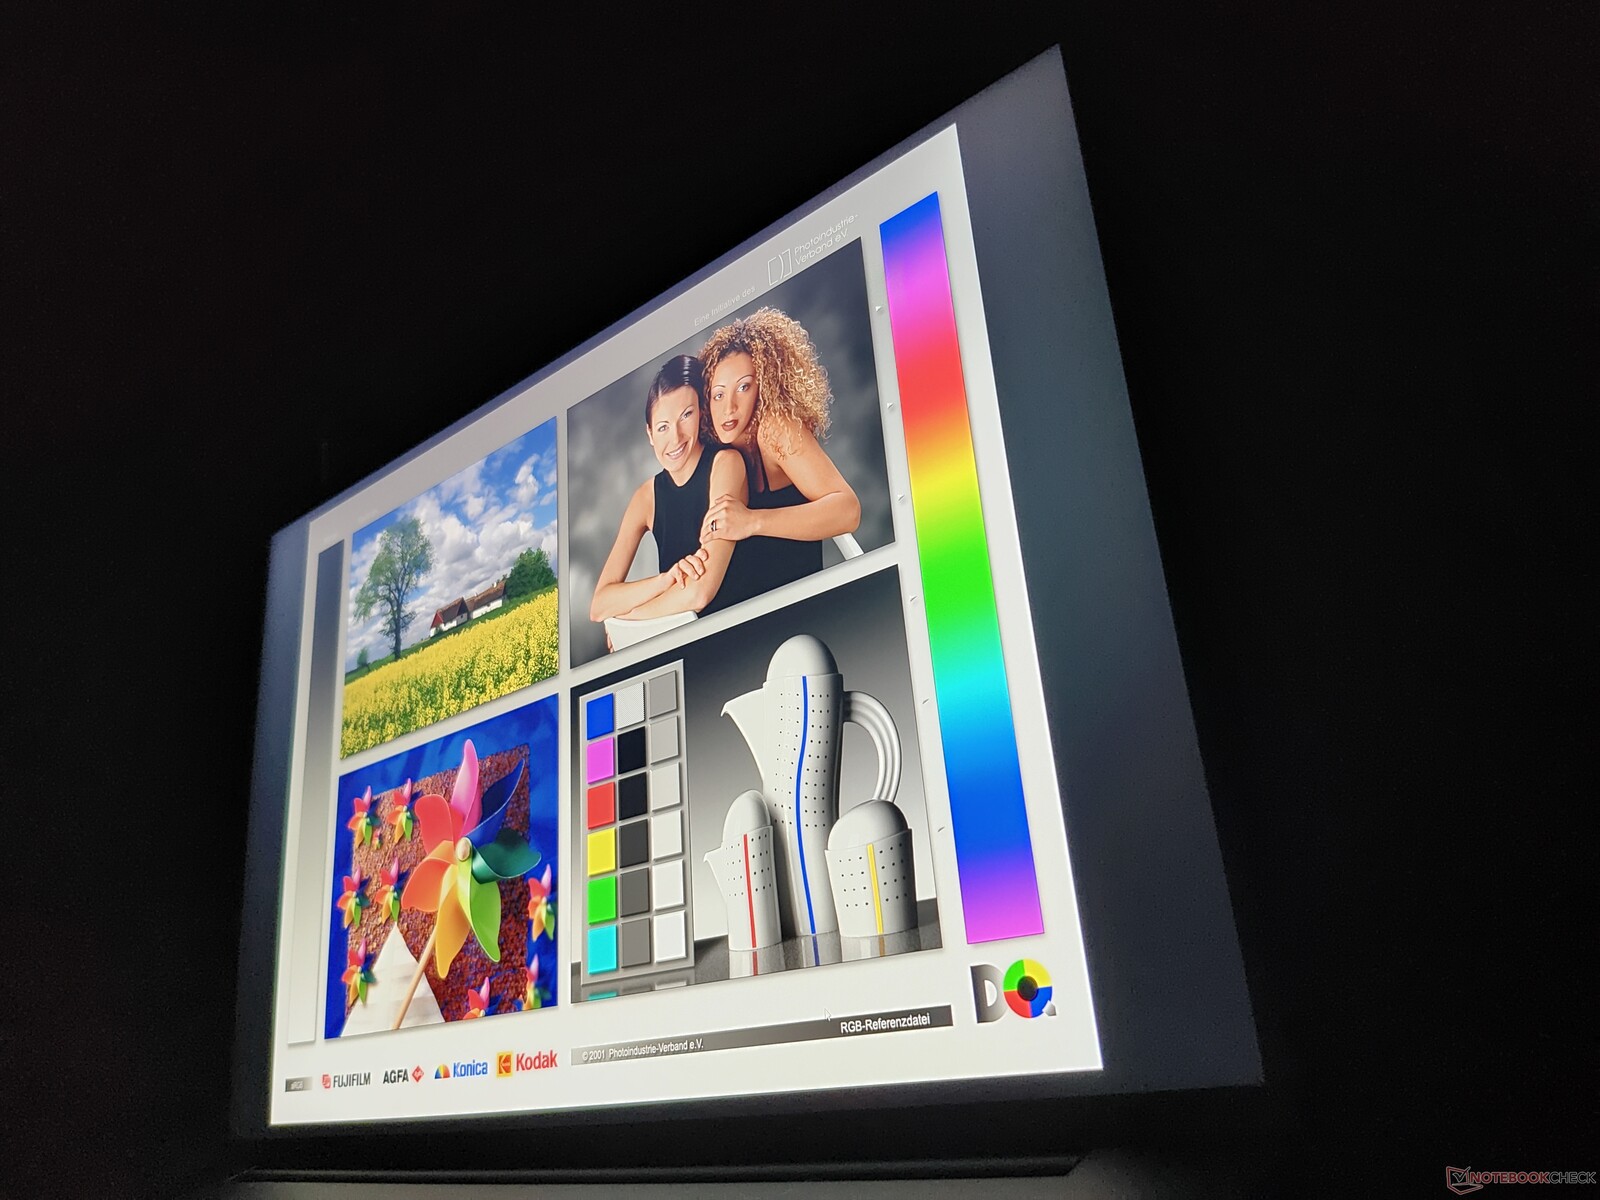
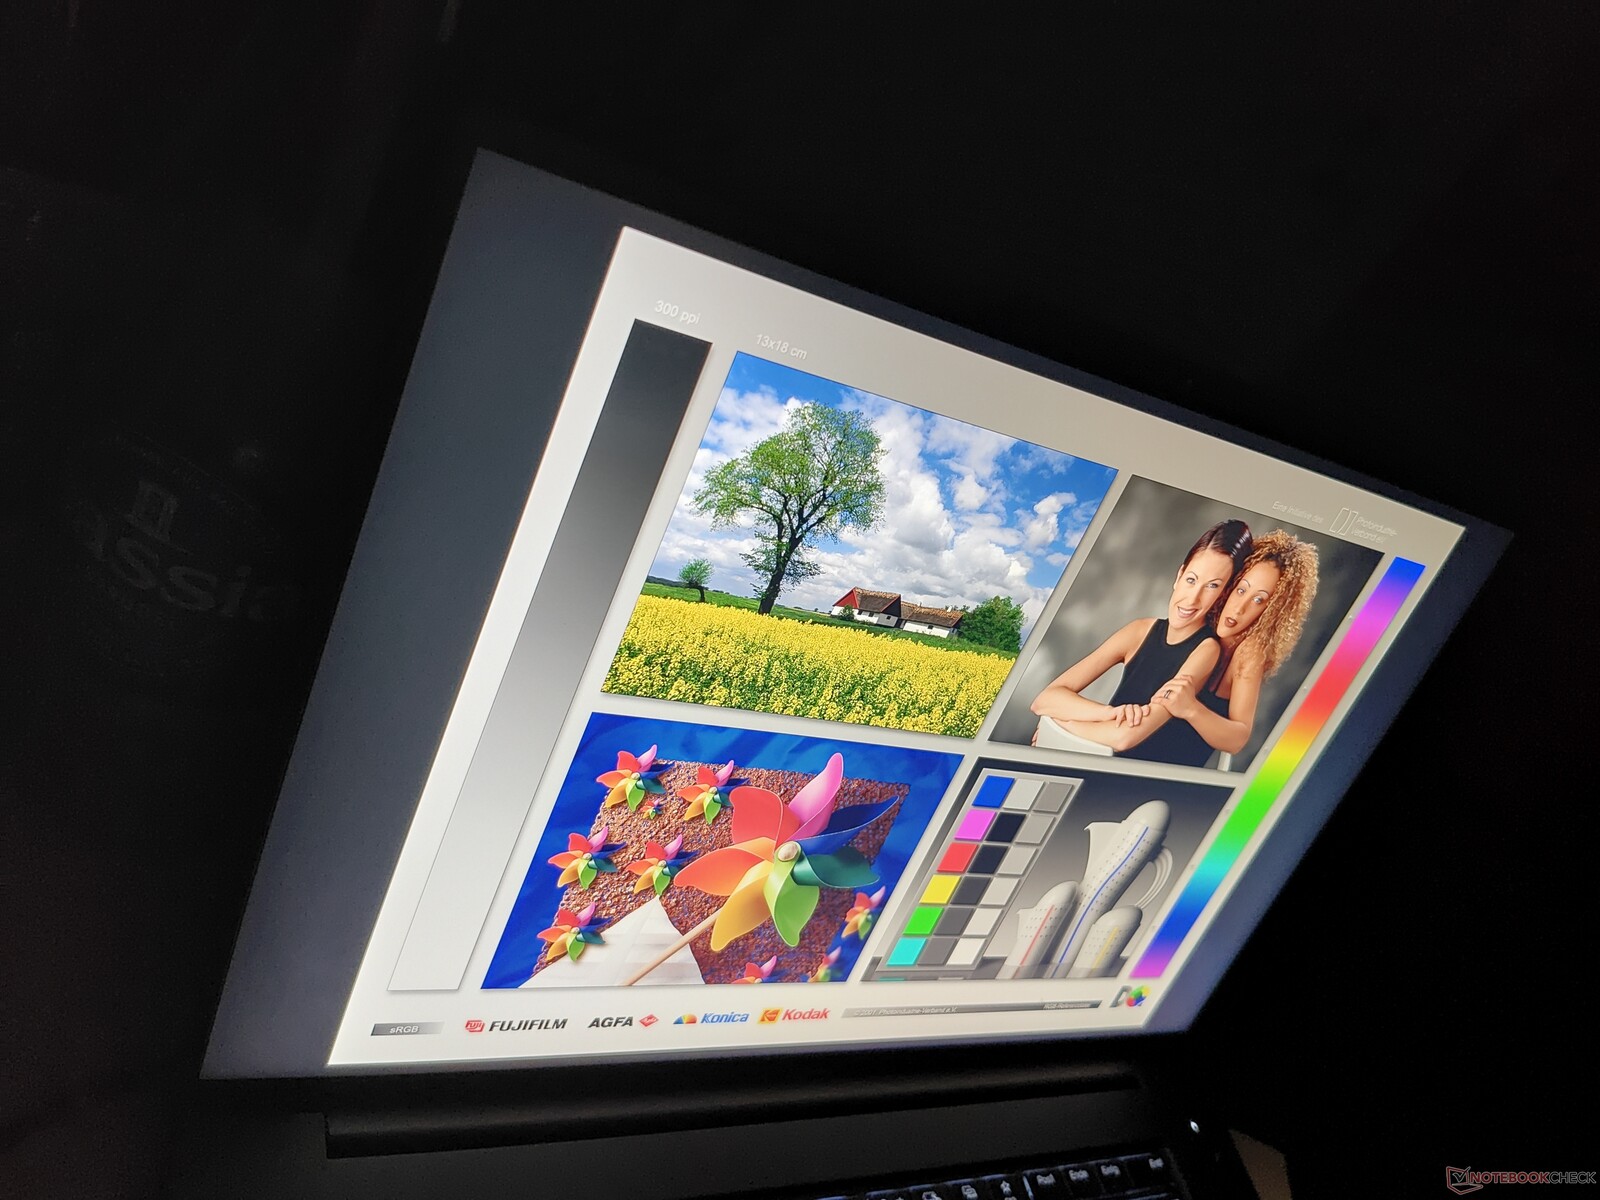
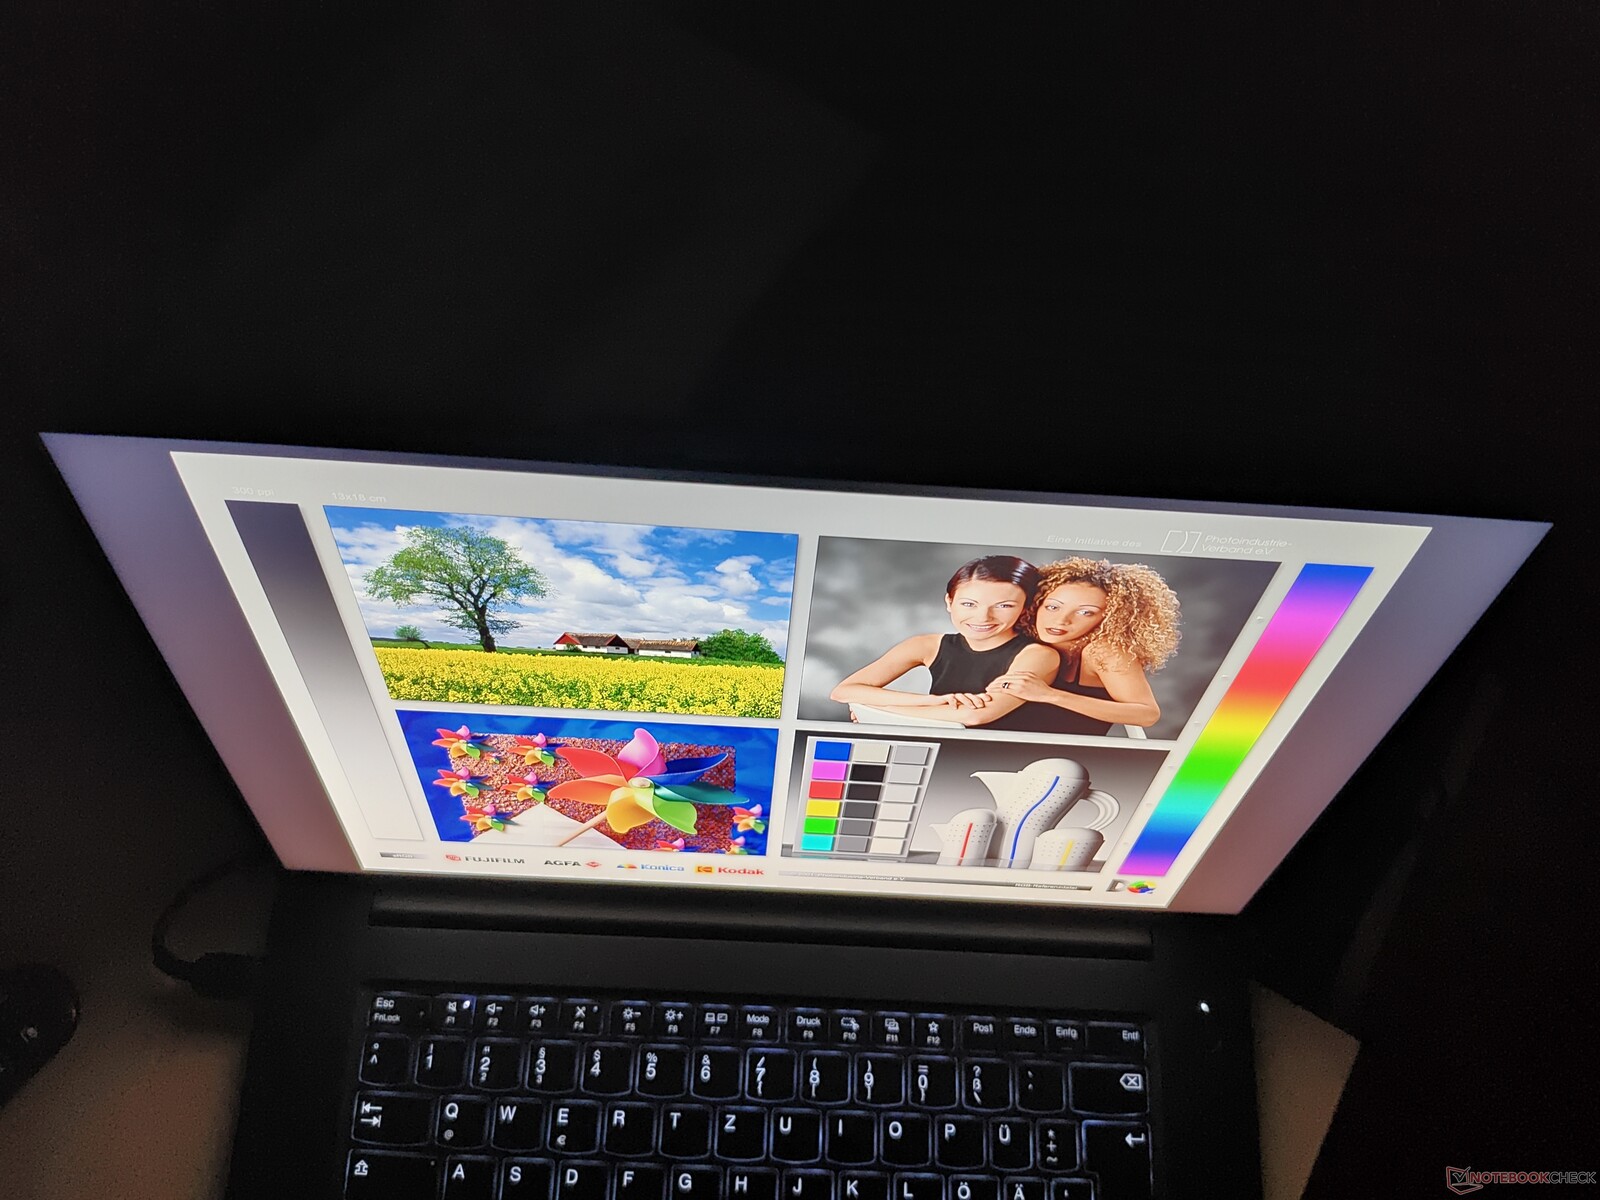
Display: Fast 165 Hz screen
Lenovo made adjustments in many areas, but not for the screens. The screen options barely changed, with the lone change compared with the ThinkPad P1 G6 being that the base screen option is now 100 cd/m² brighter. All screens on offer come in the 16:10 aspect ratio and 16-inch format.
- WUXGA (1,920 x 1,200), IPS, 400 cd/m², 100 % sRGB, matte
- WQXGA (2,560 x 1,600), IPS, 500 cd/m², 100 % sRGB, matte, 165 Hz
- WQUXGA (3,840 x 2,400), OLED, 400 cd/m², 100 % DCI-P3, semi-matte/semi-glossy, HDR
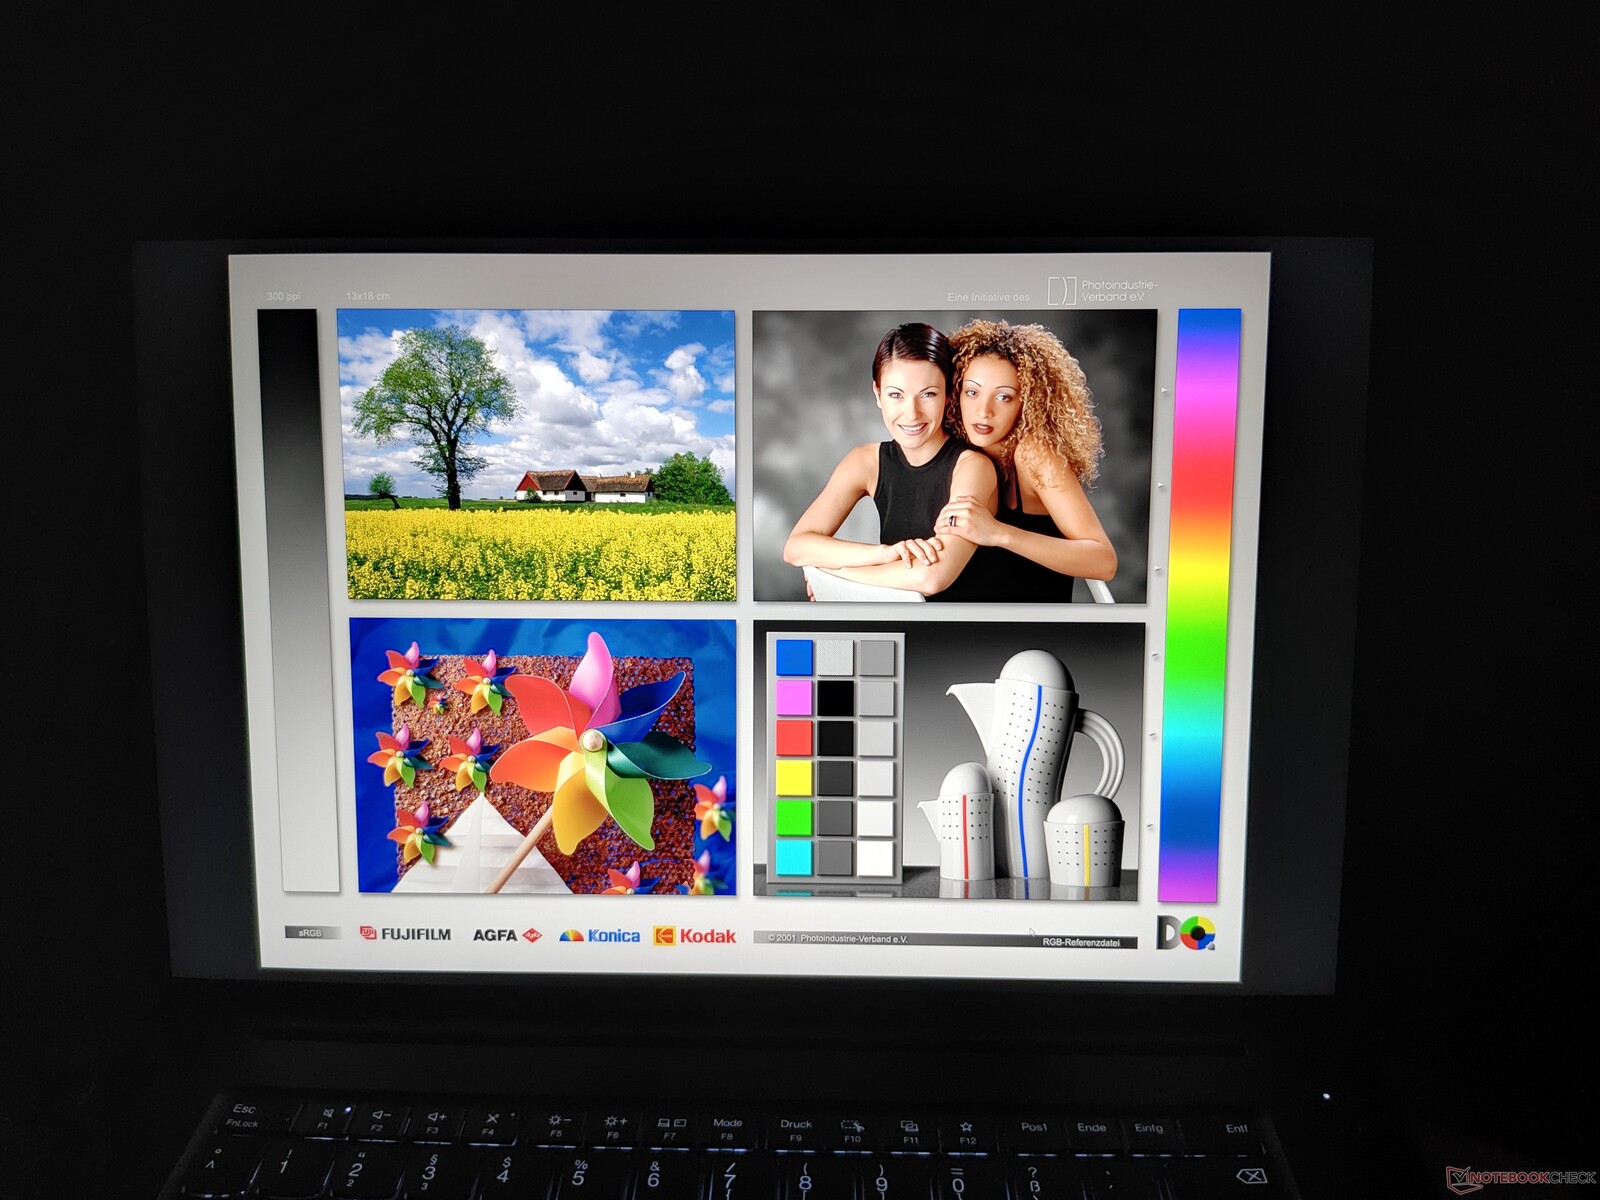
The LCD used here delivers the promised brightness of 500 cd/m², with a measured average brightness of 505 cd/m². The OLED displays of the assembled Windows competition are beaten handily, but not the miniLED screen of the Apple MacBook Pro 16. Overall, this panel is not really comparable with the competing laptops we tested, due to the different technologies and resolutions. The OLED variant of the ThinkPad P1 Gen 7 would be a more fitting comparison. At least, the refresh rate of 165 Hz is a level above the rest, though the OLED displays have better response times. In this regard, the MacBook can not keep up. A positive: The LCD does not have PWM, different from the OLED and miniLED competition.
| |||||||||||||||||||||||||
Brightness Distribution: 89 %
Center on Battery: 516 cd/m²
Contrast: 1259:1 (Black: 0.41 cd/m²)
ΔE ColorChecker Calman: 3.5 | ∀{0.5-29.43 Ø4.71}
calibrated: 1.2
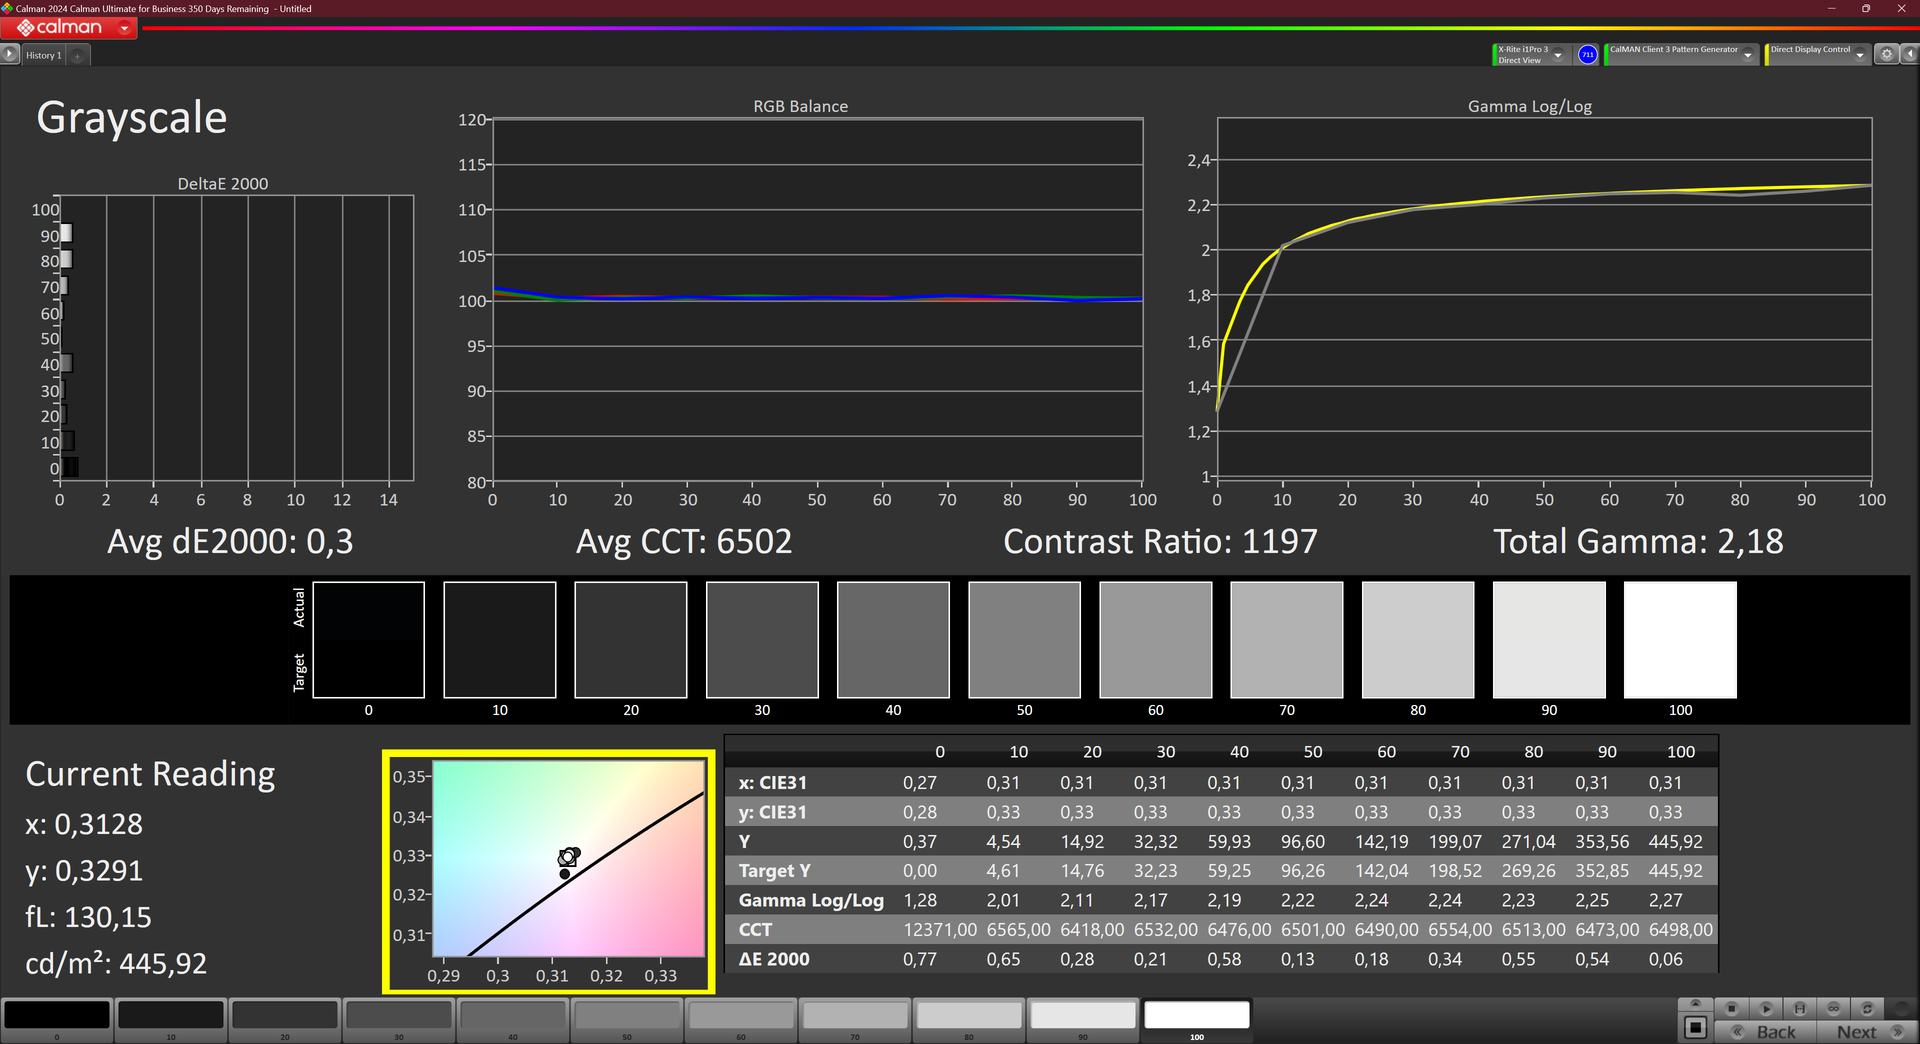
ΔE Greyscale Calman: 5.6 | ∀{0.09-98 Ø4.96}
71.8% AdobeRGB 1998 (Argyll 3D)
97.6% sRGB (Argyll 3D)
69.4% Display P3 (Argyll 3D)
Gamma: 2.27
CCT: 6071 K
| Lenovo ThinkPad P1 Gen 7 21KV001SGE MNG007DA1-9 , IPS LED, 2560x1600, 16", 165 Hz | Lenovo ThinkPad P1 G6 21FV001KUS Samsung ATNA60YV04-0, OLED, 3480x2400, 16", 60 Hz | Dell XPS 16 9640 SDC4196, OLED, 3840x2400, 16.3", 90 Hz | Dell Precision 5690 Samsung 160YV03, OLED, 3840x2400, 16", 60 Hz | Apple MacBook Pro 16 2023 M3 Max Mini-LED, 3456x2234, 16", 120 Hz | |
|---|---|---|---|---|---|
| Display | 27% | 22% | 27% | 43% | |
| Display P3 Coverage (%) | 69.4 | 99.8 44% | 98.3 42% | 99.8 44% | 99.2 43% |
| sRGB Coverage (%) | 97.6 | 100 2% | 100 2% | 100 2% | |
| AdobeRGB 1998 Coverage (%) | 71.8 | 97.9 36% | 87.8 22% | 96.6 35% | |
| Response Times | 85% | 93% | 85% | -404% | |
| Response Time Grey 50% / Grey 80% * (ms) | 11.2 ? | 1.69 ? 85% | 0.82 ? 93% | 1.7 ? 85% | 66.9 ? -497% |
| Response Time Black / White * (ms) | 10.6 ? | 1.73 ? 84% | 0.85 ? 92% | 1.7 ? 84% | 43.6 ? -311% |
| PWM Frequency (Hz) | 60 ? | 360 ? | 60 ? | 14877 | |
| Screen | 28% | 22% | 6% | 41% | |
| Brightness middle (cd/m²) | 516 | 375.1 -27% | 366 -29% | 348.1 -33% | 630 22% |
| Brightness (cd/m²) | 505 | 379 -25% | 367 -27% | 351 -30% | 604 20% |
| Brightness Distribution (%) | 89 | 98 10% | 96 8% | 97 9% | 94 6% |
| Black Level * (cd/m²) | 0.41 | ||||
| Contrast (:1) | 1259 | ||||
| Colorchecker dE 2000 * | 3.5 | 1.16 67% | 1.3 63% | 4.18 -19% | 1.2 66% |
| Colorchecker dE 2000 max. * | 8.8 | 2.94 67% | 3.6 59% | 6.68 24% | 2.8 68% |
| Colorchecker dE 2000 calibrated * | 1.2 | 1 17% | 0.97 19% | ||
| Greyscale dE 2000 * | 5.6 | 1.4 75% | 2.2 61% | 1.7 70% | 1.9 66% |
| Gamma | 2.27 97% | 2.2 100% | 2.14 103% | 2.2 100% | 2.29 96% |
| CCT | 6071 107% | 6325 103% | 6680 97% | 6198 105% | 6812 95% |
| Total Average (Program / Settings) | 47% /
38% | 46% /
34% | 39% /
24% | -107% /
-57% |
* ... smaller is better
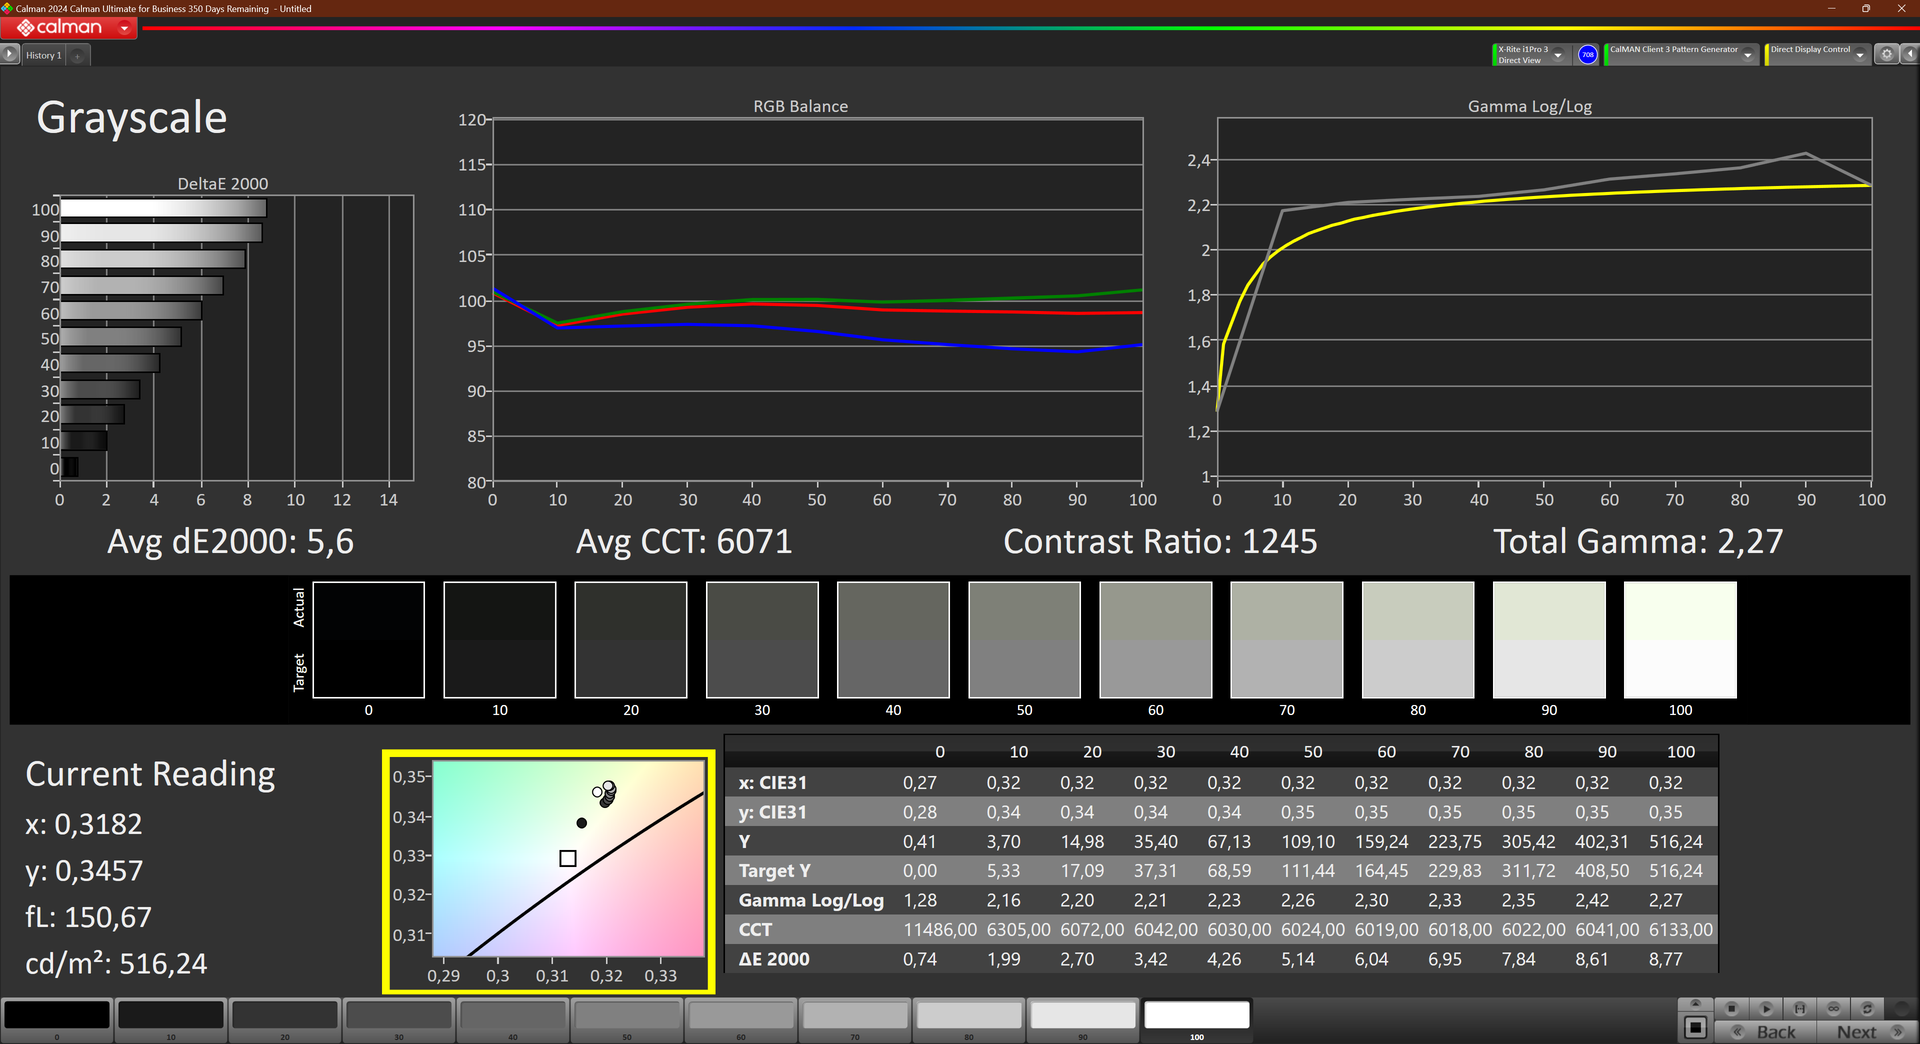
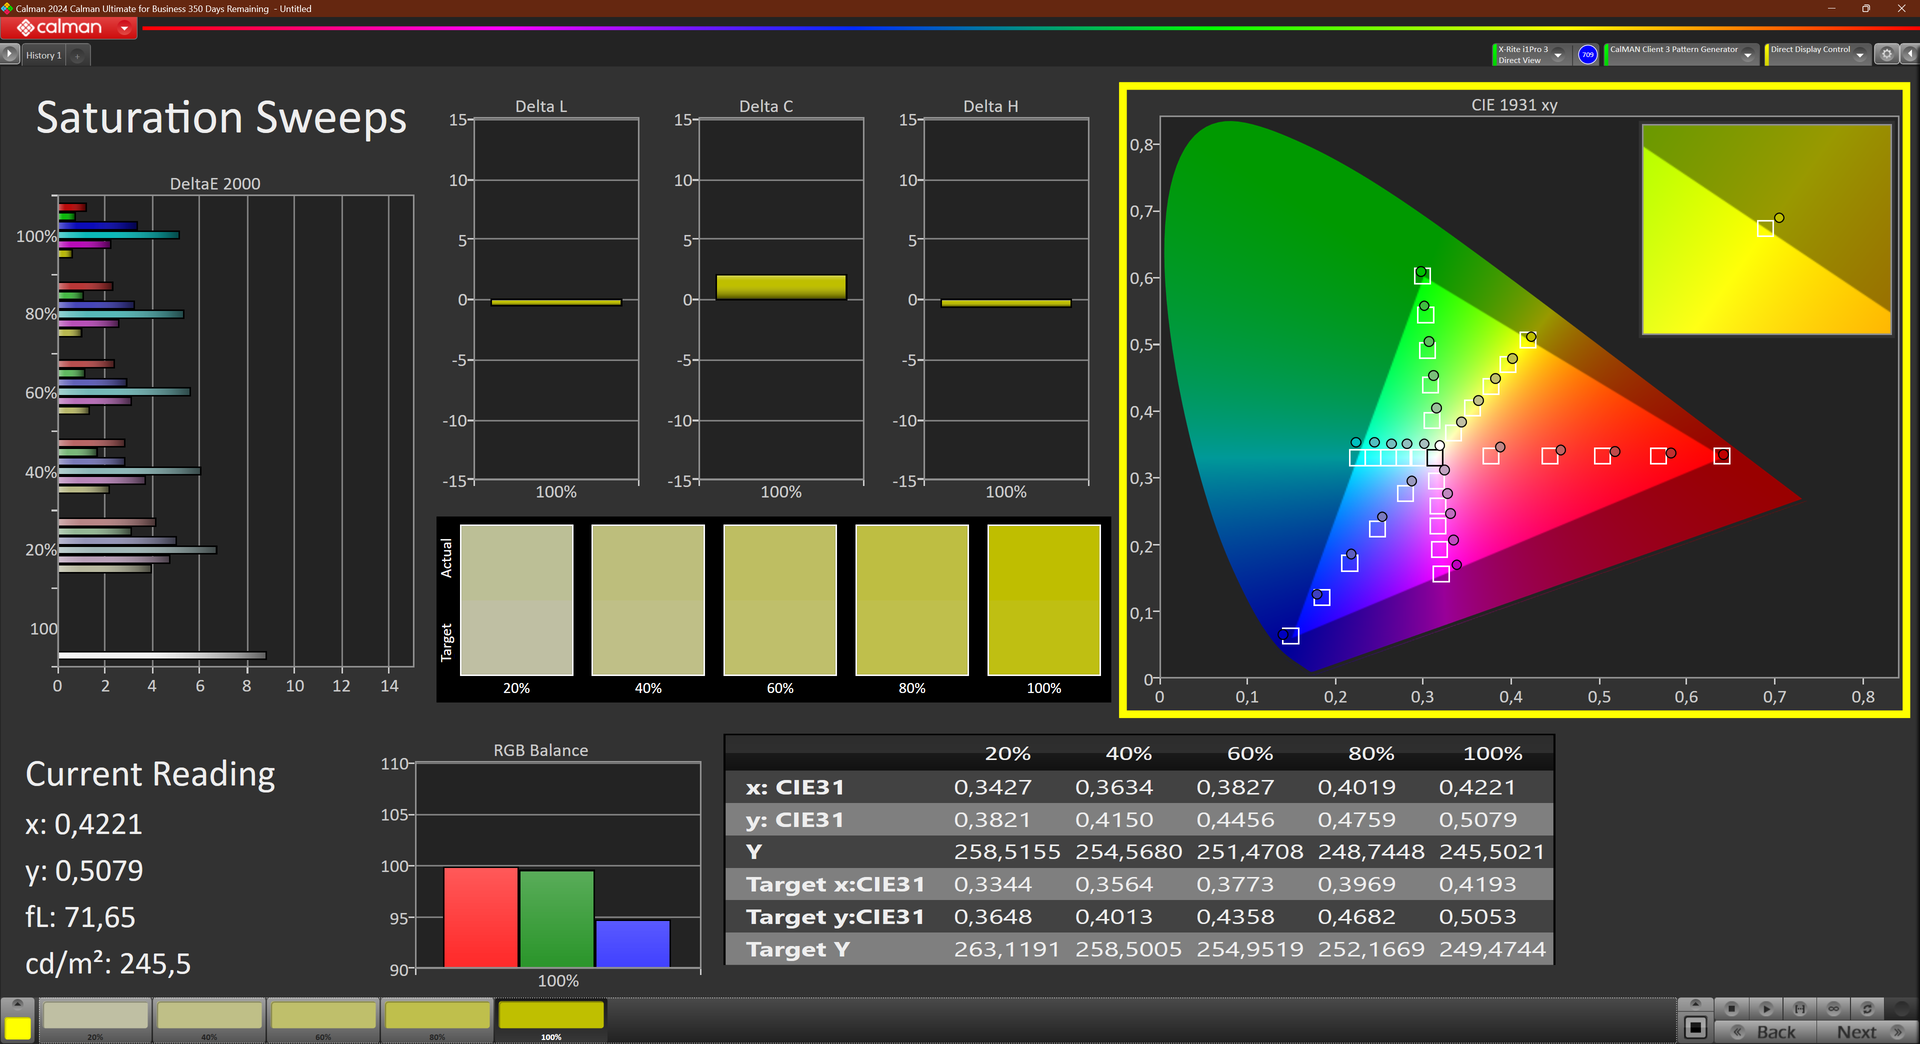
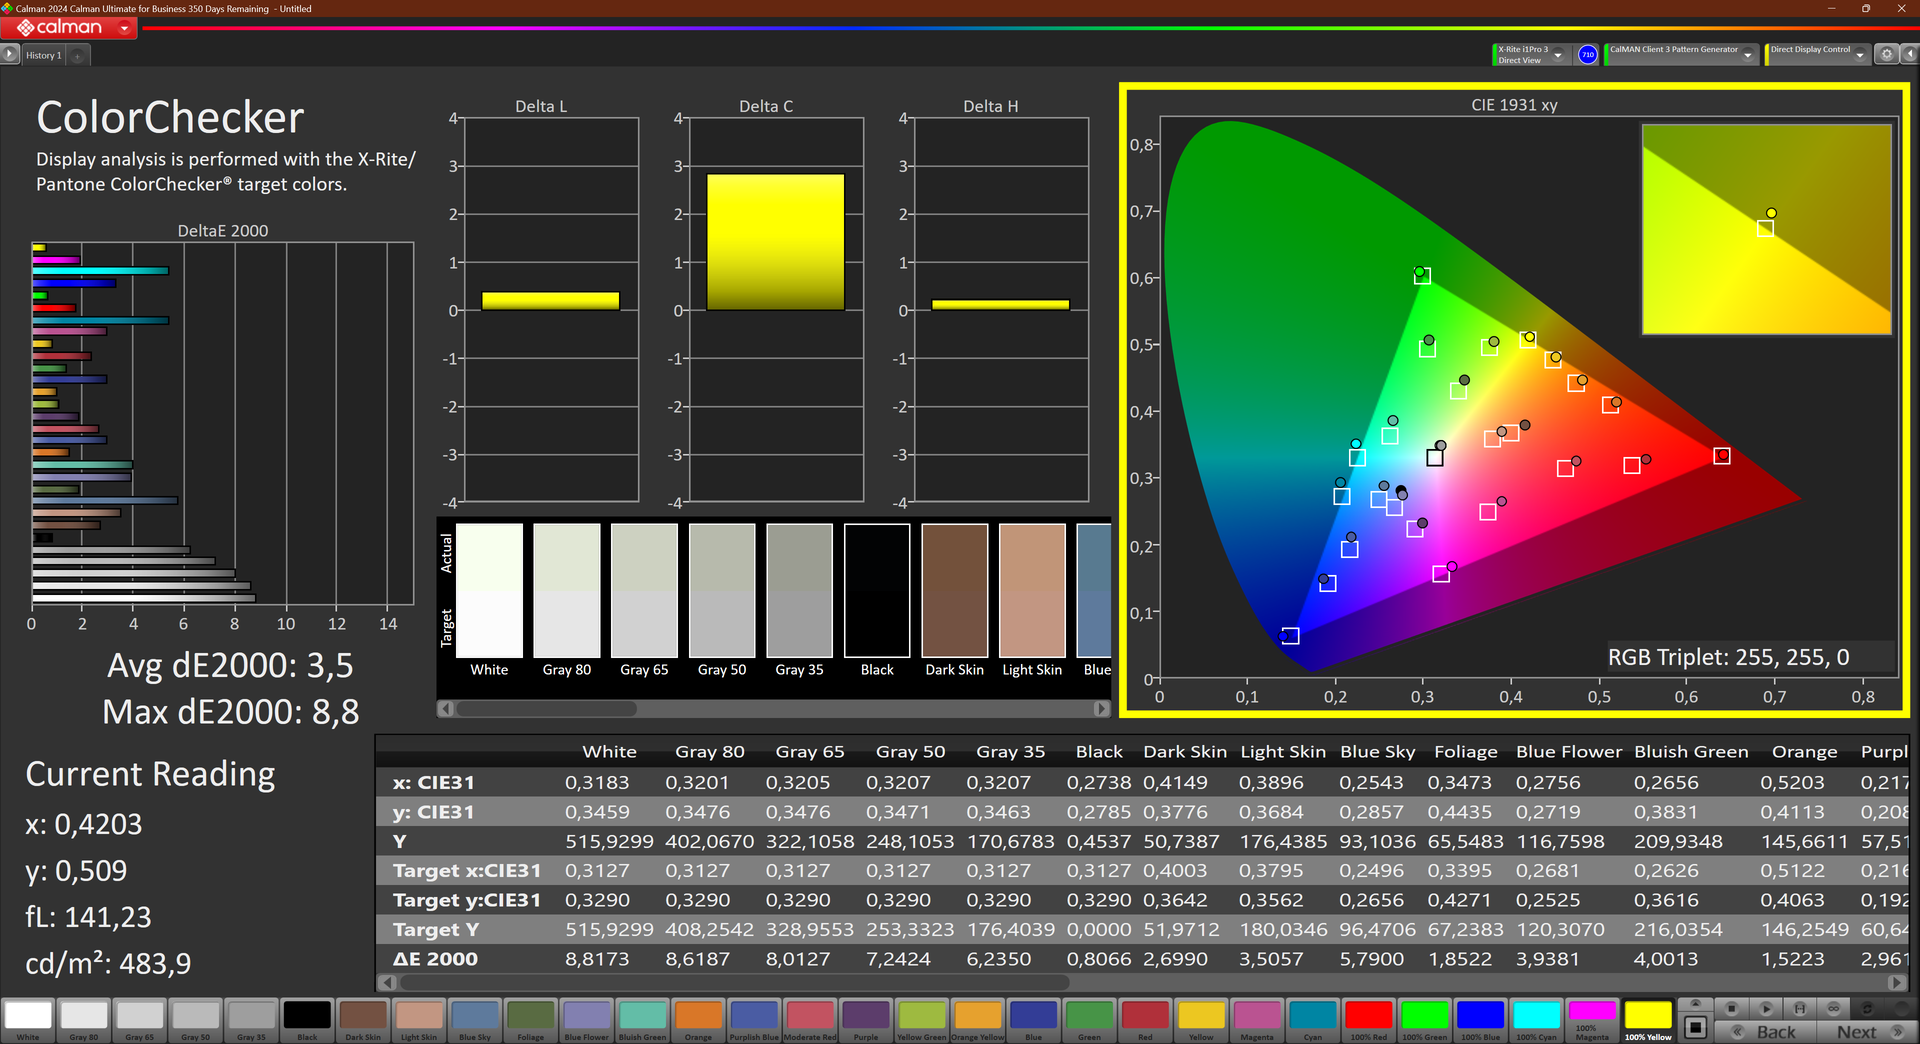
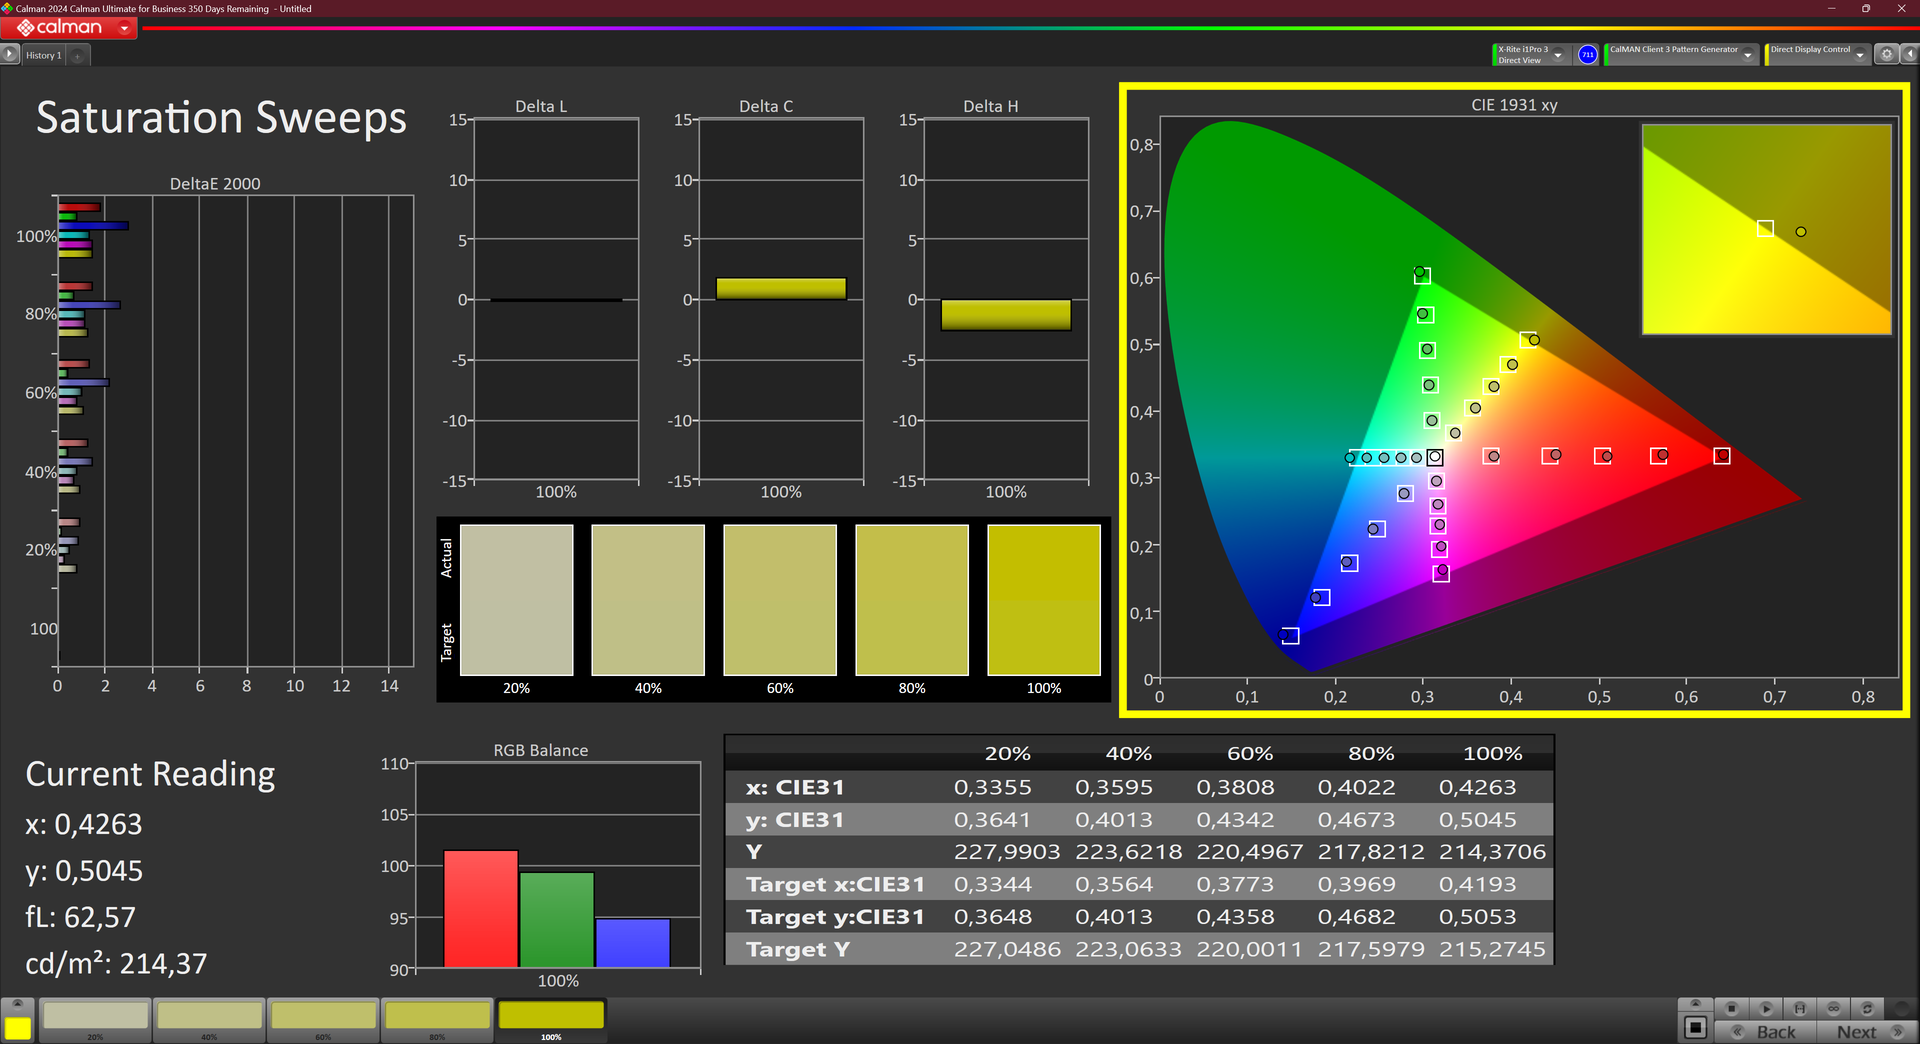

The color profile enabled ex factory shows false colors, with the grays being too warm as well. With a calibration with the X-Rite i1Pro 3, we were able to correct it. The Colorchecker deltaE, which gives us the average deviation from neutral colors, decreased after the calibration from 3.5 to 1.2.
The WQXGA screen of the Lenovo ThinkPad P1 Gen 7 covers 97 percent of the sRGB color gamut. This makes the panel suitable for simple color work. For anything advanced, the OLED panel should be the choice.

When using the Lenovo ThinkPad P1 Gen 7 outdoors, the high screen brightness keeps the screen content visible. The matte display surface supports the outdoor-capabilities as well.
Display Response Times
| ↔ Response Time Black to White | ||
|---|---|---|
| 10.6 ms ... rise ↗ and fall ↘ combined | ↗ 6.1 ms rise |  |
| ↘ 4.5 ms fall | ||
| The screen shows good response rates in our tests, but may be too slow for competitive gamers. In comparison, all tested devices range from 0.1 (minimum) to 240 (maximum) ms. » 29 % of all devices are better. This means that the measured response time is better than the average of all tested devices (19.8 ms). | ||
| ↔ Response Time 50% Grey to 80% Grey | ||
| 11.2 ms ... rise ↗ and fall ↘ combined | ↗ 5.6 ms rise | 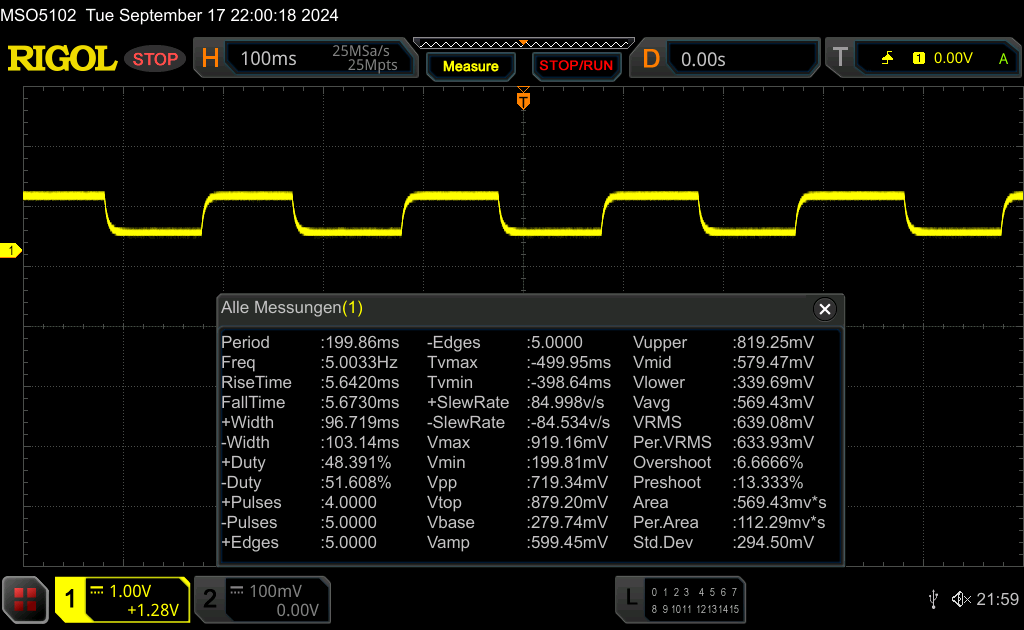 |
| ↘ 5.6 ms fall | ||
| The screen shows good response rates in our tests, but may be too slow for competitive gamers. In comparison, all tested devices range from 0.165 (minimum) to 636 (maximum) ms. » 25 % of all devices are better. This means that the measured response time is better than the average of all tested devices (31 ms). | ||
Screen Flickering / PWM (Pulse-Width Modulation)
| Screen flickering / PWM not detected |  | ||
In comparison: 52 % of all tested devices do not use PWM to dim the display. If PWM was detected, an average of 7754 (minimum: 5 - maximum: 343500) Hz was measured. | |||
Performance: Meteor Lake replaces Raptor Lake
The Lenovo ThinkPad P1 Gen 7 is only offered with Intel CPUs - as opposed to the AMD based ThinkPad Z16. Four Meteor Lake H chips are listed in the spec sheet (Intel Core Ultra 5 135H, Core Ultra 7 155H, Core Ultra 7 165H, Core Ultra 9 185H), all of which support vPro Enterprise except for the 155H. Even more comprehensive is the choice of GPUs, with three professional Nvidia RTX chips (RTX 1000 Ada, RTX 2000 Ada, RTX 3000 Ada) and two Nvidia GeForce chips (GeForce RTX 4060, GeForce RTX 4070). Alternatively, the P1 G7 can also be configured without any dGPU, in which case the Intel ARC takes over.
The capacity of the RAM sits at 16, 32 or 64 GB. The single LPCAMM2 module brings fast LPDDR5X-7500 memory into the ThinkPad P1 G7, replacing the DDR5-5600 of the predecessor - but without ECC support, this feature goes away. The two M.2 2280 SSDs are connected via NVMe PCIe 4.0, with the maximum limit of 8 TB (2x 4 TB). RAID 0/1 are supported.
Testing conditions
The three available energy profiles are selectable through the Windows settings. They influence the TDP settings via the power limits - with the Power Limit 1 (PL1) setting the power consumption under sustained load and the PL2 being the maximum power consumption under short term load.
- Best battery life: PL1 25 W / PL2 115 W
- Balanced: PL1 50 W / PL2 115 W
- Best Performance: PL1 70 W / PL2 115 W
The following table lists the performance difference between the different energy profiles of the ThinkPad P1 Gen 7.
| Energy profile | PL1 | PL2 | CB R23 Multi | TGP | Time Spy Graphics | CP 2077 QHD/Ultra | Stress test | max. fan noise |
|---|---|---|---|---|---|---|---|---|
| Best battery life | 25 W | 115 W | 16388 | 45 W | 7150 | 30.3 FPS | CPU: 75° GPU: 65° |
43.18 dB(A) |
| Balanced | 50 W | 115 W | 17111 | 60 W | 8166 | 33.6 FPS | CPU: 100° GPU: 80° |
46.17 dB(A) |
| Best performance | 70 W | 115 W | 18762 | 80 W | 9386 | 39.9 FPS | CPU: 103° GPU: 88° |
53.27 dB(a) |
Processor
Intel's Core Ultra 7 155H is part of the performance focused Meteor Lake H series. The typical power consumption sits between 28 and 45 W, but as we see with the Lenovo ThinkPad P1 Gen 7, it is possible for the OEMs to set a much higher limit. The CPU has 16 cores and 22 threads with hyperthreading, being a 6+8+2 design with six big P cores, eight E cores and two Low Power E cores. The cores have varying clock rates (P cores: 1.4 to 4.8 GHz, E Cores: 0.9 to 3.9 GHz, LP E cores: 0.7 to 2.5 GHz). Comparisons with other CPUs are possible with our CPU list.
The high power limits enable the Lenovo ThinkPad P1 Gen 7 to eclipse its predecessor P1 Gen 6 in the multicore test. The newer ThinkPad workstation also delivers this performance under sustained load without any throttling. When running single core tasks, the P1 Gen 7 loses to its predecessor, as Raptor Lake in general beats out Meteor Lake in this discipline - with a higher power consumption. Overall, the CPU performance of the P1 Gen 7 is more than serviceable for a modern workstation and roughly on par with the competition from Dell.
In the battery mode, the CPU performance is throttled slightly. We measured a performance loss of 13 percent.
Cinebench R15 Multi Dauertest
Cinebench R23: Multi Core | Single Core
Cinebench R20: CPU (Multi Core) | CPU (Single Core)
Cinebench R15: CPU Multi 64Bit | CPU Single 64Bit
Blender: v2.79 BMW27 CPU
7-Zip 18.03: 7z b 4 | 7z b 4 -mmt1
Geekbench 6.7: Multi-Core | Single-Core
Geekbench 5.5: Multi-Core | Single-Core
HWBOT x265 Benchmark v2.2: 4k Preset
LibreOffice : 20 Documents To PDF
R Benchmark 2.5: Overall mean
| CPU Performance rating | |
| Average of class Workstation | |
| Apple MacBook Pro 16 2023 M3 Pro -8! | |
| Lenovo ThinkPad P1 G6 21FV001KUS | |
| Dell Precision 5690 | |
| Lenovo ThinkPad P1 Gen 7 21KV001SGE | |
| Dell XPS 16 9640 | |
| HP ZBook Power 16 G11 A | |
| Average Intel Core Ultra 7 155H | |
| Cinebench R23 / Multi Core | |
| Average of class Workstation (14621 - 38520, n=23, last 2 years) | |
| Dell Precision 5690 | |
| Lenovo ThinkPad P1 Gen 7 21KV001SGE | |
| Dell XPS 16 9640 | |
| Lenovo ThinkPad P1 G6 21FV001KUS | |
| HP ZBook Power 16 G11 A | |
| Apple MacBook Pro 16 2023 M3 Pro | |
| Average Intel Core Ultra 7 155H (9769 - 19007, n=52) | |
| Cinebench R23 / Single Core | |
| Average of class Workstation (1712 - 2228, n=23, last 2 years) | |
| Lenovo ThinkPad P1 G6 21FV001KUS | |
| Apple MacBook Pro 16 2023 M3 Pro | |
| Dell Precision 5690 | |
| Lenovo ThinkPad P1 Gen 7 21KV001SGE | |
| Dell XPS 16 9640 | |
| HP ZBook Power 16 G11 A | |
| Average Intel Core Ultra 7 155H (1496 - 1815, n=52) | |
| Cinebench R20 / CPU (Multi Core) | |
| Average of class Workstation (5760 - 15043, n=23, last 2 years) | |
| Dell Precision 5690 | |
| Lenovo ThinkPad P1 Gen 7 21KV001SGE | |
| Dell XPS 16 9640 | |
| Lenovo ThinkPad P1 G6 21FV001KUS | |
| HP ZBook Power 16 G11 A | |
| Average Intel Core Ultra 7 155H (3798 - 7409, n=50) | |
| Cinebench R20 / CPU (Single Core) | |
| Average of class Workstation (671 - 857, n=23, last 2 years) | |
| Lenovo ThinkPad P1 G6 21FV001KUS | |
| Dell Precision 5690 | |
| Lenovo ThinkPad P1 Gen 7 21KV001SGE | |
| HP ZBook Power 16 G11 A | |
| Dell XPS 16 9640 | |
| Average Intel Core Ultra 7 155H (601 - 696, n=50) | |
| Cinebench R15 / CPU Multi 64Bit | |
| Average of class Workstation (2489 - 5810, n=23, last 2 years) | |
| Dell Precision 5690 | |
| Lenovo ThinkPad P1 Gen 7 21KV001SGE | |
| Dell XPS 16 9640 | |
| Lenovo ThinkPad P1 G6 21FV001KUS | |
| HP ZBook Power 16 G11 A | |
| Average Intel Core Ultra 7 155H (1932 - 2880, n=56) | |
| Apple MacBook Pro 16 2023 M3 Pro | |
| Cinebench R15 / CPU Single 64Bit | |
| Average of class Workstation (191.4 - 328, n=23, last 2 years) | |
| Lenovo ThinkPad P1 G6 21FV001KUS | |
| HP ZBook Power 16 G11 A | |
| Dell Precision 5690 | |
| Lenovo ThinkPad P1 Gen 7 21KV001SGE | |
| Dell XPS 16 9640 | |
| Average Intel Core Ultra 7 155H (99.6 - 268, n=52) | |
| Blender / v2.79 BMW27 CPU | |
| Apple MacBook Pro 16 2023 M3 Pro | |
| Average Intel Core Ultra 7 155H (175 - 381, n=47) | |
| Dell Precision 5690 | |
| HP ZBook Power 16 G11 A | |
| Lenovo ThinkPad P1 G6 21FV001KUS | |
| Dell XPS 16 9640 | |
| Lenovo ThinkPad P1 Gen 7 21KV001SGE | |
| Average of class Workstation (91 - 222, n=23, last 2 years) | |
| 7-Zip 18.03 / 7z b 4 | |
| Average of class Workstation (60489 - 116969, n=23, last 2 years) | |
| Dell Precision 5690 | |
| Lenovo ThinkPad P1 G6 21FV001KUS | |
| Lenovo ThinkPad P1 Gen 7 21KV001SGE | |
| Dell XPS 16 9640 | |
| HP ZBook Power 16 G11 A | |
| Average Intel Core Ultra 7 155H (41739 - 70254, n=50) | |
| 7-Zip 18.03 / 7z b 4 -mmt1 | |
| Lenovo ThinkPad P1 G6 21FV001KUS | |
| HP ZBook Power 16 G11 A | |
| Average of class Workstation (5126 - 6960, n=23, last 2 years) | |
| Lenovo ThinkPad P1 Gen 7 21KV001SGE | |
| Dell XPS 16 9640 | |
| Average Intel Core Ultra 7 155H (4594 - 5621, n=50) | |
| Dell Precision 5690 | |
| Geekbench 6.7 / Multi-Core | |
| Average of class Workstation (12721 - 20887, n=23, last 2 years) | |
| Apple MacBook Pro 16 2023 M3 Pro | |
| Dell Precision 5690 | |
| Dell XPS 16 9640 | |
| Lenovo ThinkPad P1 Gen 7 21KV001SGE | |
| Lenovo ThinkPad P1 G6 21FV001KUS | |
| HP ZBook Power 16 G11 A | |
| Average Intel Core Ultra 7 155H (7732 - 13656, n=55) | |
| Geekbench 6.7 / Single-Core | |
| Apple MacBook Pro 16 2023 M3 Pro | |
| Average of class Workstation (2389 - 3065, n=23, last 2 years) | |
| Lenovo ThinkPad P1 G6 21FV001KUS | |
| HP ZBook Power 16 G11 A | |
| Dell Precision 5690 | |
| Dell XPS 16 9640 | |
| Lenovo ThinkPad P1 Gen 7 21KV001SGE | |
| Average Intel Core Ultra 7 155H (1901 - 2473, n=52) | |
| Geekbench 5.5 / Multi-Core | |
| Average of class Workstation (11542 - 25554, n=23, last 2 years) | |
| Apple MacBook Pro 16 2023 M3 Pro | |
| Dell Precision 5690 | |
| Dell XPS 16 9640 | |
| Lenovo ThinkPad P1 Gen 7 21KV001SGE | |
| Lenovo ThinkPad P1 G6 21FV001KUS | |
| Average Intel Core Ultra 7 155H (10017 - 13556, n=52) | |
| HP ZBook Power 16 G11 A | |
| Geekbench 5.5 / Single-Core | |
| Apple MacBook Pro 16 2023 M3 Pro | |
| Average of class Workstation (1783 - 2183, n=23, last 2 years) | |
| Lenovo ThinkPad P1 G6 21FV001KUS | |
| HP ZBook Power 16 G11 A | |
| Dell Precision 5690 | |
| Lenovo ThinkPad P1 Gen 7 21KV001SGE | |
| Dell XPS 16 9640 | |
| Average Intel Core Ultra 7 155H (1462 - 1824, n=52) | |
| HWBOT x265 Benchmark v2.2 / 4k Preset | |
| Average of class Workstation (17.8 - 40.5, n=23, last 2 years) | |
| Dell Precision 5690 | |
| Lenovo ThinkPad P1 Gen 7 21KV001SGE | |
| Dell XPS 16 9640 | |
| Lenovo ThinkPad P1 G6 21FV001KUS | |
| HP ZBook Power 16 G11 A | |
| Average Intel Core Ultra 7 155H (9.93 - 21.2, n=50) | |
| LibreOffice / 20 Documents To PDF | |
| HP ZBook Power 16 G11 A | |
| Average Intel Core Ultra 7 155H (37.5 - 79.2, n=49) | |
| Average of class Workstation (37.1 - 74.7, n=23, last 2 years) | |
| Dell XPS 16 9640 | |
| Lenovo ThinkPad P1 G6 21FV001KUS | |
| Lenovo ThinkPad P1 Gen 7 21KV001SGE | |
| Dell Precision 5690 | |
| R Benchmark 2.5 / Overall mean | |
| Dell XPS 16 9640 | |
| Average Intel Core Ultra 7 155H (0.4457 - 0.53, n=49) | |
| Lenovo ThinkPad P1 Gen 7 21KV001SGE | |
| Dell Precision 5690 | |
| HP ZBook Power 16 G11 A | |
| Average of class Workstation (0.3825 - 0.603, n=23, last 2 years) | |
| Lenovo ThinkPad P1 G6 21FV001KUS | |
* ... smaller is better
AIDA64: FP32 Ray-Trace | FPU Julia | CPU SHA3 | CPU Queen | FPU SinJulia | FPU Mandel | CPU AES | CPU ZLib | FP64 Ray-Trace | CPU PhotoWorxx
| Performance rating | |
| Average of class Workstation | |
| Dell Precision 5690 | |
| Dell XPS 16 9640 | |
| Lenovo ThinkPad P1 Gen 7 21KV001SGE | |
| Lenovo ThinkPad P1 G6 21FV001KUS | |
| Average Intel Core Ultra 7 155H | |
| AIDA64 / FP32 Ray-Trace | |
| Average of class Workstation (16730 - 61611, n=23, last 2 years) | |
| Dell Precision 5690 | |
| Lenovo ThinkPad P1 Gen 7 21KV001SGE | |
| Dell XPS 16 9640 | |
| Lenovo ThinkPad P1 G6 21FV001KUS | |
| Average Intel Core Ultra 7 155H (6670 - 18470, n=50) | |
| AIDA64 / FPU Julia | |
| Average of class Workstation (89597 - 186971, n=23, last 2 years) | |
| Dell Precision 5690 | |
| Lenovo ThinkPad P1 Gen 7 21KV001SGE | |
| Dell XPS 16 9640 | |
| Lenovo ThinkPad P1 G6 21FV001KUS | |
| Average Intel Core Ultra 7 155H (40905 - 93181, n=50) | |
| AIDA64 / CPU SHA3 | |
| Average of class Workstation (4178 - 8975, n=23, last 2 years) | |
| Dell Precision 5690 | |
| Lenovo ThinkPad P1 Gen 7 21KV001SGE | |
| Dell XPS 16 9640 | |
| Lenovo ThinkPad P1 G6 21FV001KUS | |
| Average Intel Core Ultra 7 155H (1940 - 4436, n=50) | |
| AIDA64 / CPU Queen | |
| Lenovo ThinkPad P1 G6 21FV001KUS | |
| Average of class Workstation (60778 - 144411, n=23, last 2 years) | |
| Dell Precision 5690 | |
| Lenovo ThinkPad P1 Gen 7 21KV001SGE | |
| Dell XPS 16 9640 | |
| Average Intel Core Ultra 7 155H (64698 - 94181, n=50) | |
| AIDA64 / FPU SinJulia | |
| Average of class Workstation (8165 - 29343, n=23, last 2 years) | |
| Dell Precision 5690 | |
| Lenovo ThinkPad P1 G6 21FV001KUS | |
| Dell XPS 16 9640 | |
| Lenovo ThinkPad P1 Gen 7 21KV001SGE | |
| Average Intel Core Ultra 7 155H (5639 - 10647, n=50) | |
| AIDA64 / FPU Mandel | |
| Average of class Workstation (44497 - 98153, n=23, last 2 years) | |
| Dell Precision 5690 | |
| Lenovo ThinkPad P1 Gen 7 21KV001SGE | |
| Dell XPS 16 9640 | |
| Lenovo ThinkPad P1 G6 21FV001KUS | |
| Average Intel Core Ultra 7 155H (18236 - 47685, n=50) | |
| AIDA64 / CPU AES | |
| Average of class Workstation (73133 - 187841, n=23, last 2 years) | |
| Dell Precision 5690 | |
| Lenovo ThinkPad P1 Gen 7 21KV001SGE | |
| Dell XPS 16 9640 | |
| Lenovo ThinkPad P1 G6 21FV001KUS | |
| Average Intel Core Ultra 7 155H (45713 - 152179, n=50) | |
| AIDA64 / CPU ZLib | |
| Average of class Workstation (929 - 2148, n=23, last 2 years) | |
| Dell Precision 5690 | |
| Lenovo ThinkPad P1 Gen 7 21KV001SGE | |
| Dell XPS 16 9640 | |
| Lenovo ThinkPad P1 G6 21FV001KUS | |
| Average Intel Core Ultra 7 155H (557 - 1250, n=50) | |
| AIDA64 / FP64 Ray-Trace | |
| Average of class Workstation (8545 - 32891, n=23, last 2 years) | |
| Dell Precision 5690 | |
| Lenovo ThinkPad P1 Gen 7 21KV001SGE | |
| Lenovo ThinkPad P1 G6 21FV001KUS | |
| Dell XPS 16 9640 | |
| Average Intel Core Ultra 7 155H (3569 - 9802, n=50) | |
| AIDA64 / CPU PhotoWorxx | |
| Dell XPS 16 9640 | |
| Dell Precision 5690 | |
| Average of class Workstation (37151 - 93684, n=23, last 2 years) | |
| Average Intel Core Ultra 7 155H (32719 - 54223, n=50) | |
| Lenovo ThinkPad P1 Gen 7 21KV001SGE | |
| Lenovo ThinkPad P1 G6 21FV001KUS | |
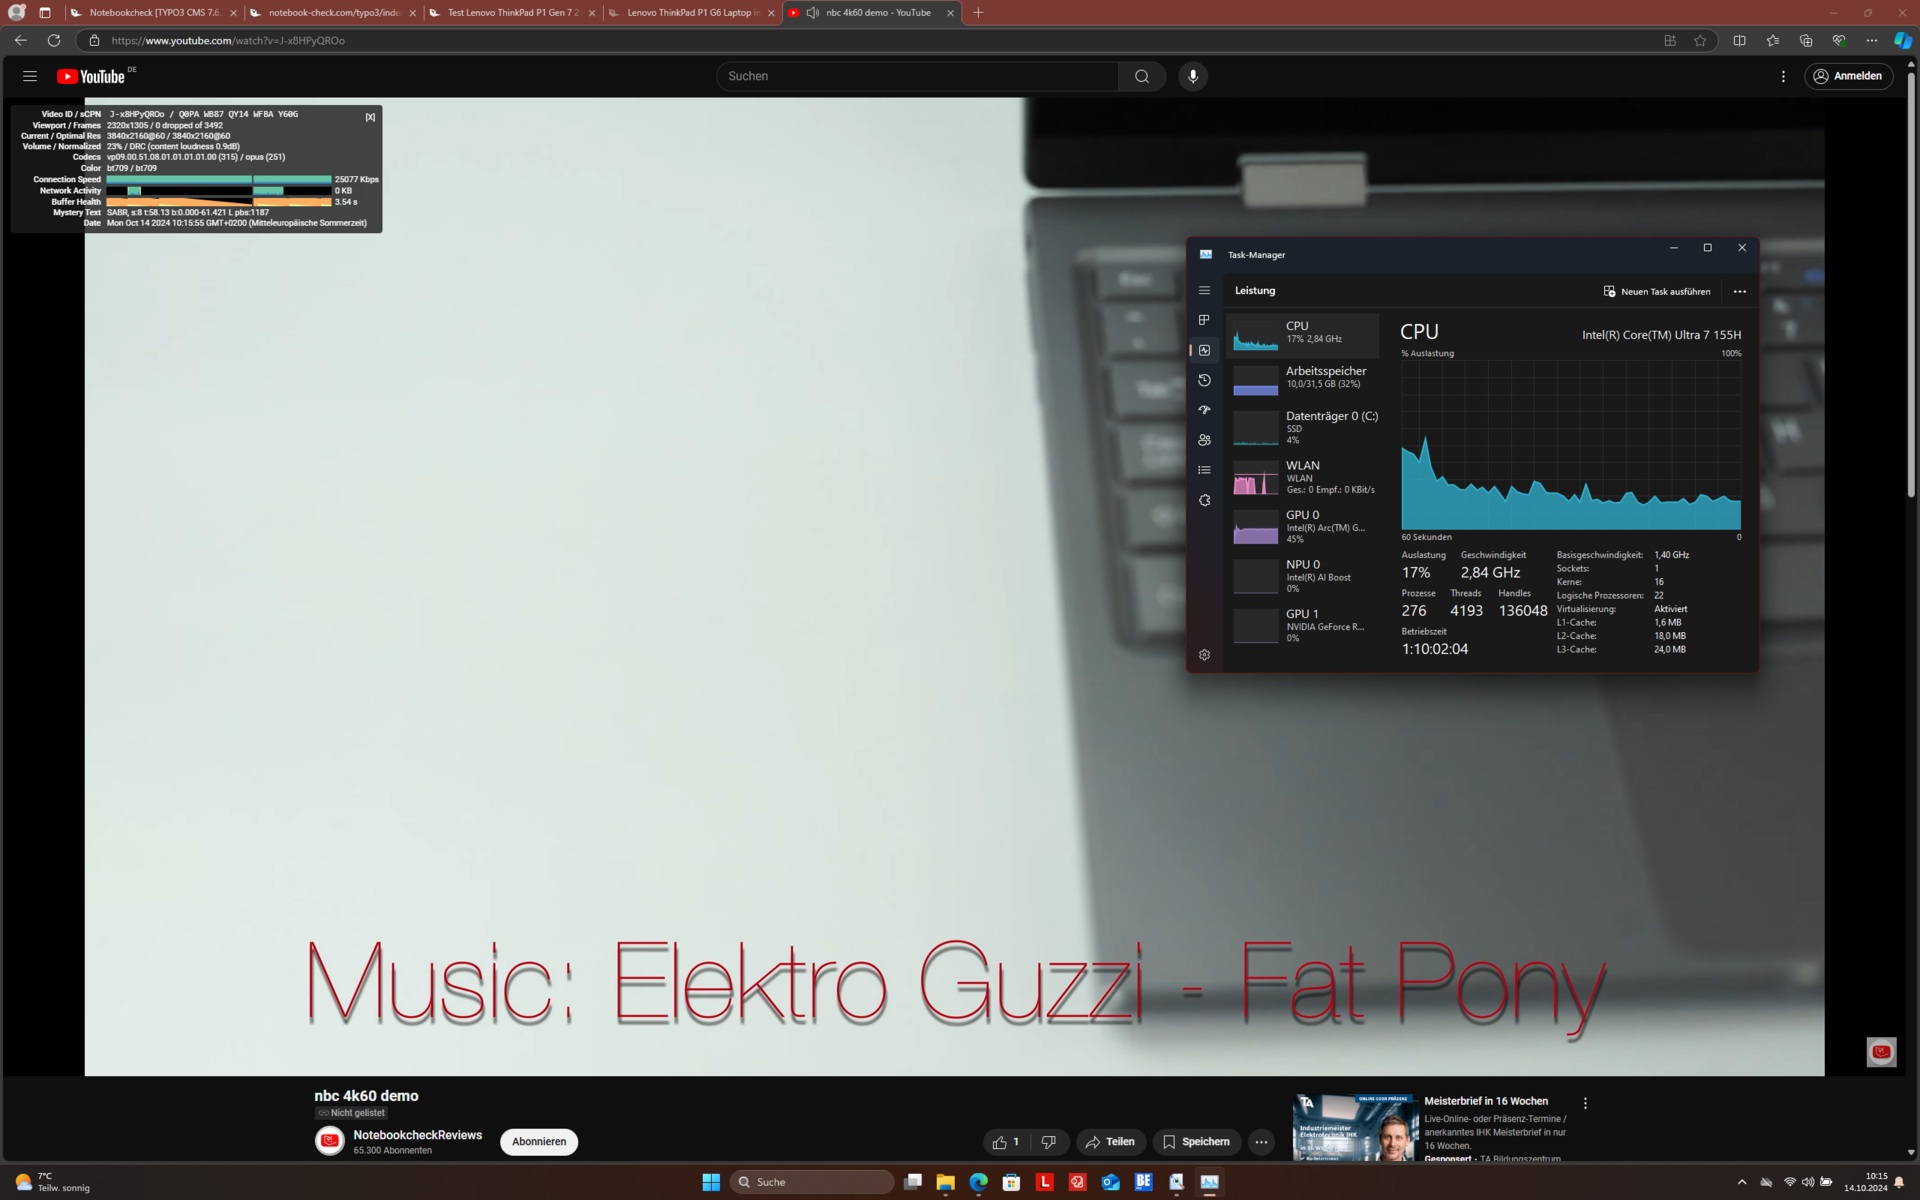
System performance
There is nothing to complain about when it comes to the system performance. As is to be expected from such an expensive unit, the Lenovo ThinkPad P1 Gen 7 runs very fast.
The memory benchmarks are interesting: The LPCAMM2 memory is much faster than the DDR5 RAM of the predecessor, but still lags behind the soldered Dell competition.
CrossMark: Overall | Productivity | Creativity | Responsiveness
WebXPRT 3: Overall
WebXPRT 4: Overall
Mozilla Kraken 1.1: Total
| PCMark 10 / Score | |
| Average of class Workstation (6563 - 10409, n=19, last 2 years) | |
| Dell Precision 5690 | |
| Lenovo ThinkPad P1 G6 21FV001KUS | |
| Lenovo ThinkPad P1 Gen 7 21KV001SGE | |
| Dell XPS 16 9640 | |
| Average Intel Core Ultra 7 155H, NVIDIA GeForce RTX 4060 Laptop GPU (6751 - 7370, n=5) | |
| PCMark 10 / Essentials | |
| Lenovo ThinkPad P1 G6 21FV001KUS | |
| Dell Precision 5690 | |
| Average of class Workstation (9622 - 11157, n=19, last 2 years) | |
| Lenovo ThinkPad P1 Gen 7 21KV001SGE | |
| Dell XPS 16 9640 | |
| Average Intel Core Ultra 7 155H, NVIDIA GeForce RTX 4060 Laptop GPU (9476 - 10446, n=5) | |
| PCMark 10 / Productivity | |
| Average of class Workstation (8789 - 20616, n=19, last 2 years) | |
| Dell Precision 5690 | |
| Lenovo ThinkPad P1 G6 21FV001KUS | |
| Dell XPS 16 9640 | |
| Lenovo ThinkPad P1 Gen 7 21KV001SGE | |
| Average Intel Core Ultra 7 155H, NVIDIA GeForce RTX 4060 Laptop GPU (8079 - 9477, n=5) | |
| PCMark 10 / Digital Content Creation | |
| Average of class Workstation (8108 - 15631, n=19, last 2 years) | |
| Lenovo ThinkPad P1 G6 21FV001KUS | |
| Dell Precision 5690 | |
| Lenovo ThinkPad P1 Gen 7 21KV001SGE | |
| Average Intel Core Ultra 7 155H, NVIDIA GeForce RTX 4060 Laptop GPU (9811 - 11620, n=5) | |
| Dell XPS 16 9640 | |
| CrossMark / Overall | |
| Apple MacBook Pro 16 2023 M3 Pro | |
| Average of class Workstation (1307 - 2267, n=22, last 2 years) | |
| Dell XPS 16 9640 | |
| Lenovo ThinkPad P1 G6 21FV001KUS | |
| Dell Precision 5690 | |
| Lenovo ThinkPad P1 Gen 7 21KV001SGE | |
| Average Intel Core Ultra 7 155H, NVIDIA GeForce RTX 4060 Laptop GPU (1540 - 1746, n=5) | |
| CrossMark / Productivity | |
| Average of class Workstation (1130 - 2122, n=22, last 2 years) | |
| Apple MacBook Pro 16 2023 M3 Pro | |
| Dell XPS 16 9640 | |
| Dell Precision 5690 | |
| Lenovo ThinkPad P1 G6 21FV001KUS | |
| Lenovo ThinkPad P1 Gen 7 21KV001SGE | |
| Average Intel Core Ultra 7 155H, NVIDIA GeForce RTX 4060 Laptop GPU (1436 - 1684, n=5) | |
| CrossMark / Creativity | |
| Apple MacBook Pro 16 2023 M3 Pro | |
| Average of class Workstation (1657 - 2725, n=22, last 2 years) | |
| Lenovo ThinkPad P1 G6 21FV001KUS | |
| Dell Precision 5690 | |
| Dell XPS 16 9640 | |
| Lenovo ThinkPad P1 Gen 7 21KV001SGE | |
| Average Intel Core Ultra 7 155H, NVIDIA GeForce RTX 4060 Laptop GPU (1811 - 1929, n=5) | |
| CrossMark / Responsiveness | |
| Dell XPS 16 9640 | |
| Average of class Workstation (993 - 2096, n=22, last 2 years) | |
| Dell Precision 5690 | |
| Lenovo ThinkPad P1 G6 21FV001KUS | |
| Apple MacBook Pro 16 2023 M3 Pro | |
| Average Intel Core Ultra 7 155H, NVIDIA GeForce RTX 4060 Laptop GPU (1165 - 1631, n=5) | |
| Lenovo ThinkPad P1 Gen 7 21KV001SGE | |
| WebXPRT 3 / Overall | |
| Apple MacBook Pro 16 2023 M3 Pro | |
| Average of class Workstation (260 - 360, n=23, last 2 years) | |
| Lenovo ThinkPad P1 G6 21FV001KUS | |
| Dell Precision 5690 | |
| Lenovo ThinkPad P1 Gen 7 21KV001SGE | |
| Dell XPS 16 9640 | |
| Average Intel Core Ultra 7 155H, NVIDIA GeForce RTX 4060 Laptop GPU (274 - 290, n=5) | |
| WebXPRT 4 / Overall | |
| Average of class Workstation (189.2 - 326, n=23, last 2 years) | |
| Lenovo ThinkPad P1 G6 21FV001KUS | |
| Dell Precision 5690 | |
| Lenovo ThinkPad P1 Gen 7 21KV001SGE | |
| Dell XPS 16 9640 | |
| Average Intel Core Ultra 7 155H, NVIDIA GeForce RTX 4060 Laptop GPU (236 - 262, n=5) | |
| Mozilla Kraken 1.1 / Total | |
| Average Intel Core Ultra 7 155H, NVIDIA GeForce RTX 4060 Laptop GPU (519 - 585, n=5) | |
| Lenovo ThinkPad P1 Gen 7 21KV001SGE | |
| Dell Precision 5690 | |
| Lenovo ThinkPad P1 G6 21FV001KUS | |
| Average of class Workstation (411 - 538, n=23, last 2 years) | |
| Apple MacBook Pro 16 2023 M3 Pro | |
* ... smaller is better
| PCMark 10 Score | 7370 points | |
Help | ||
| AIDA64 / Memory Copy | |
| Dell XPS 16 9640 | |
| Dell Precision 5690 | |
| Average Intel Core Ultra 7 155H (62397 - 96791, n=50) | |
| Average of class Workstation (56003 - 164795, n=23, last 2 years) | |
| Lenovo ThinkPad P1 Gen 7 21KV001SGE | |
| Lenovo ThinkPad P1 G6 21FV001KUS | |
| AIDA64 / Memory Read | |
| Dell Precision 5690 | |
| Dell XPS 16 9640 | |
| Average Intel Core Ultra 7 155H (60544 - 90647, n=50) | |
| Average of class Workstation (55795 - 121563, n=23, last 2 years) | |
| Lenovo ThinkPad P1 Gen 7 21KV001SGE | |
| Lenovo ThinkPad P1 G6 21FV001KUS | |
| AIDA64 / Memory Write | |
| Average of class Workstation (55663 - 214520, n=23, last 2 years) | |
| Dell Precision 5690 | |
| Dell XPS 16 9640 | |
| Average Intel Core Ultra 7 155H (58692 - 93451, n=50) | |
| Lenovo ThinkPad P1 Gen 7 21KV001SGE | |
| Lenovo ThinkPad P1 G6 21FV001KUS | |
| AIDA64 / Memory Latency | |
| Average Intel Core Ultra 7 155H (116.2 - 233, n=50) | |
| Dell Precision 5690 | |
| Dell XPS 16 9640 | |
| Lenovo ThinkPad P1 Gen 7 21KV001SGE | |
| Average of class Workstation (84.5 - 165.2, n=23, last 2 years) | |
| Lenovo ThinkPad P1 G6 21FV001KUS | |
* ... smaller is better
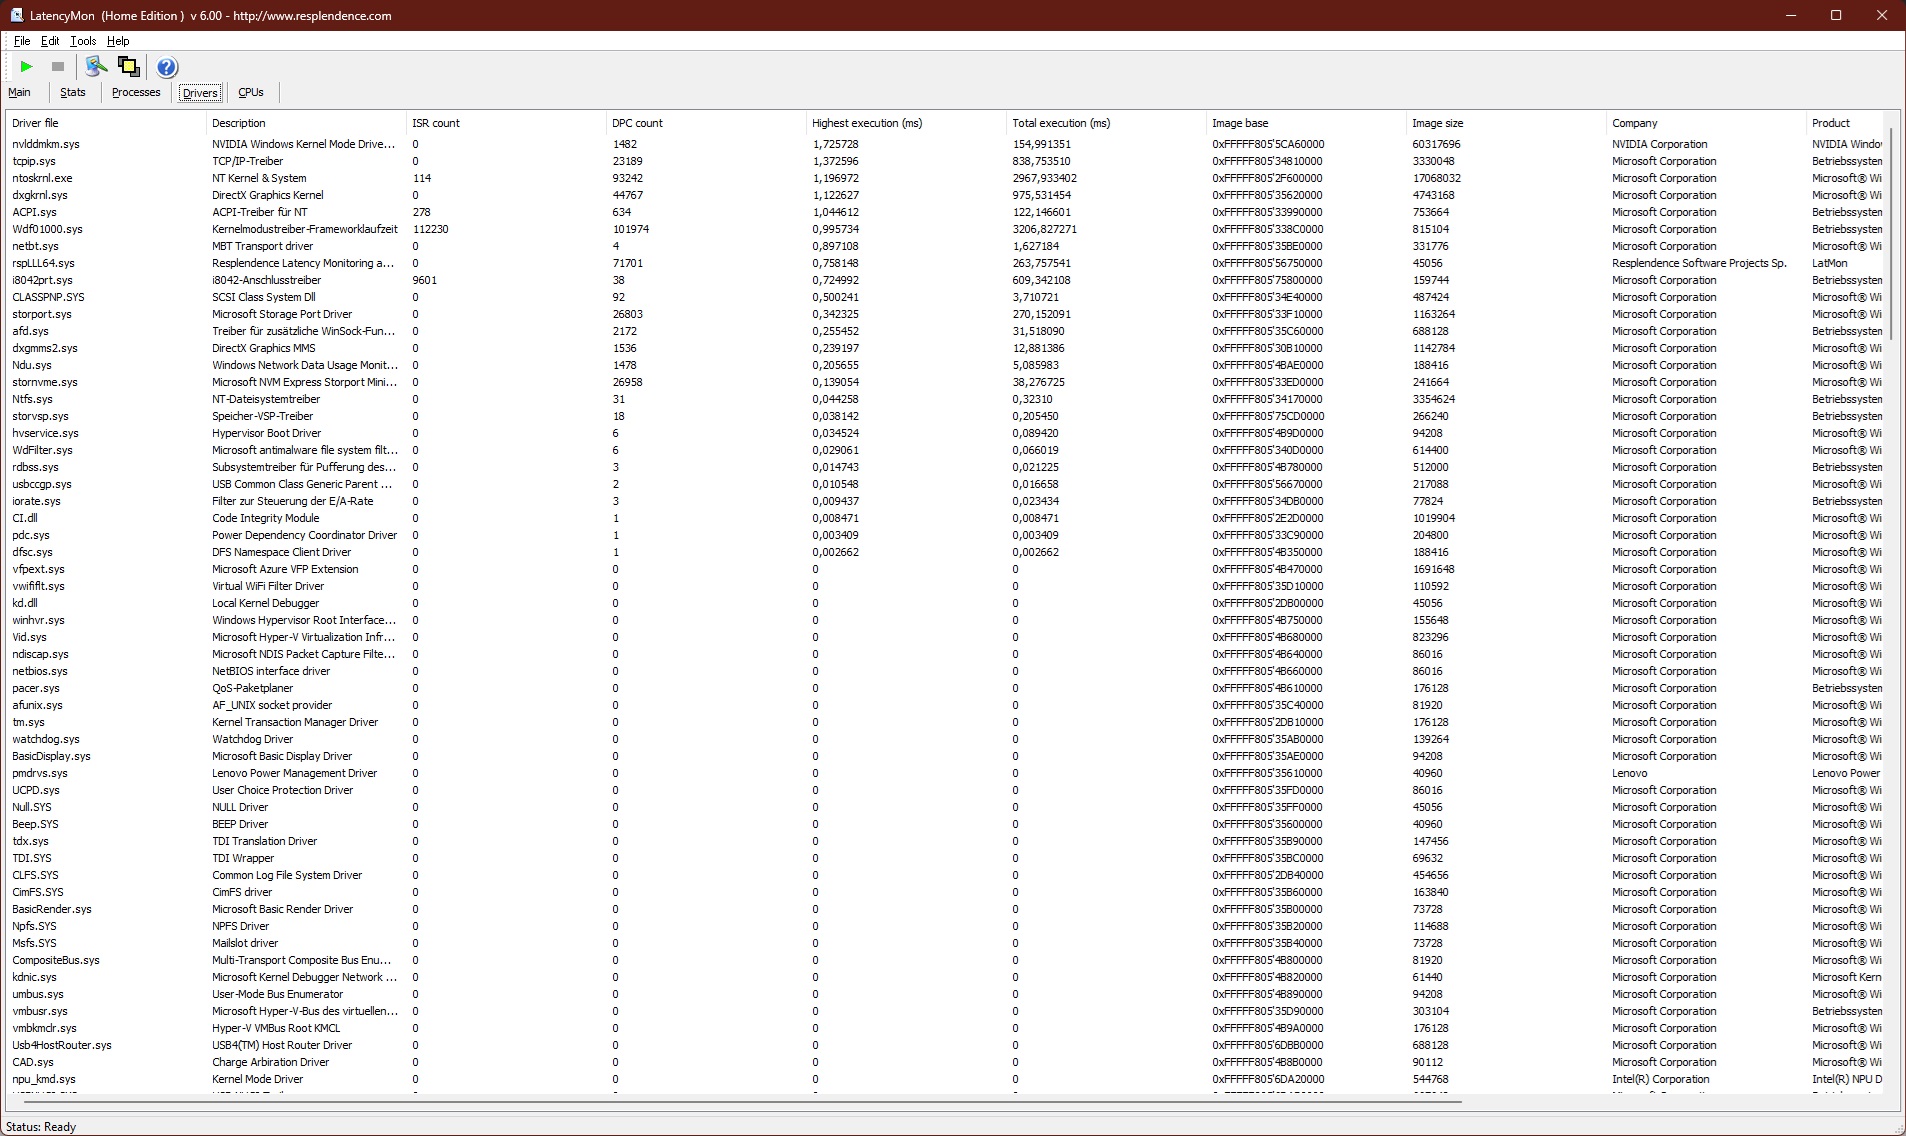
DPC latency
Lenovo's ThinkPad P1 G7 seems to have some problems with DPC latency induced dropouts. The root cause seems to be the Nvidia driver. When the ThinkPad is used with the Nvidia GPU disabled, the problem might disappear.
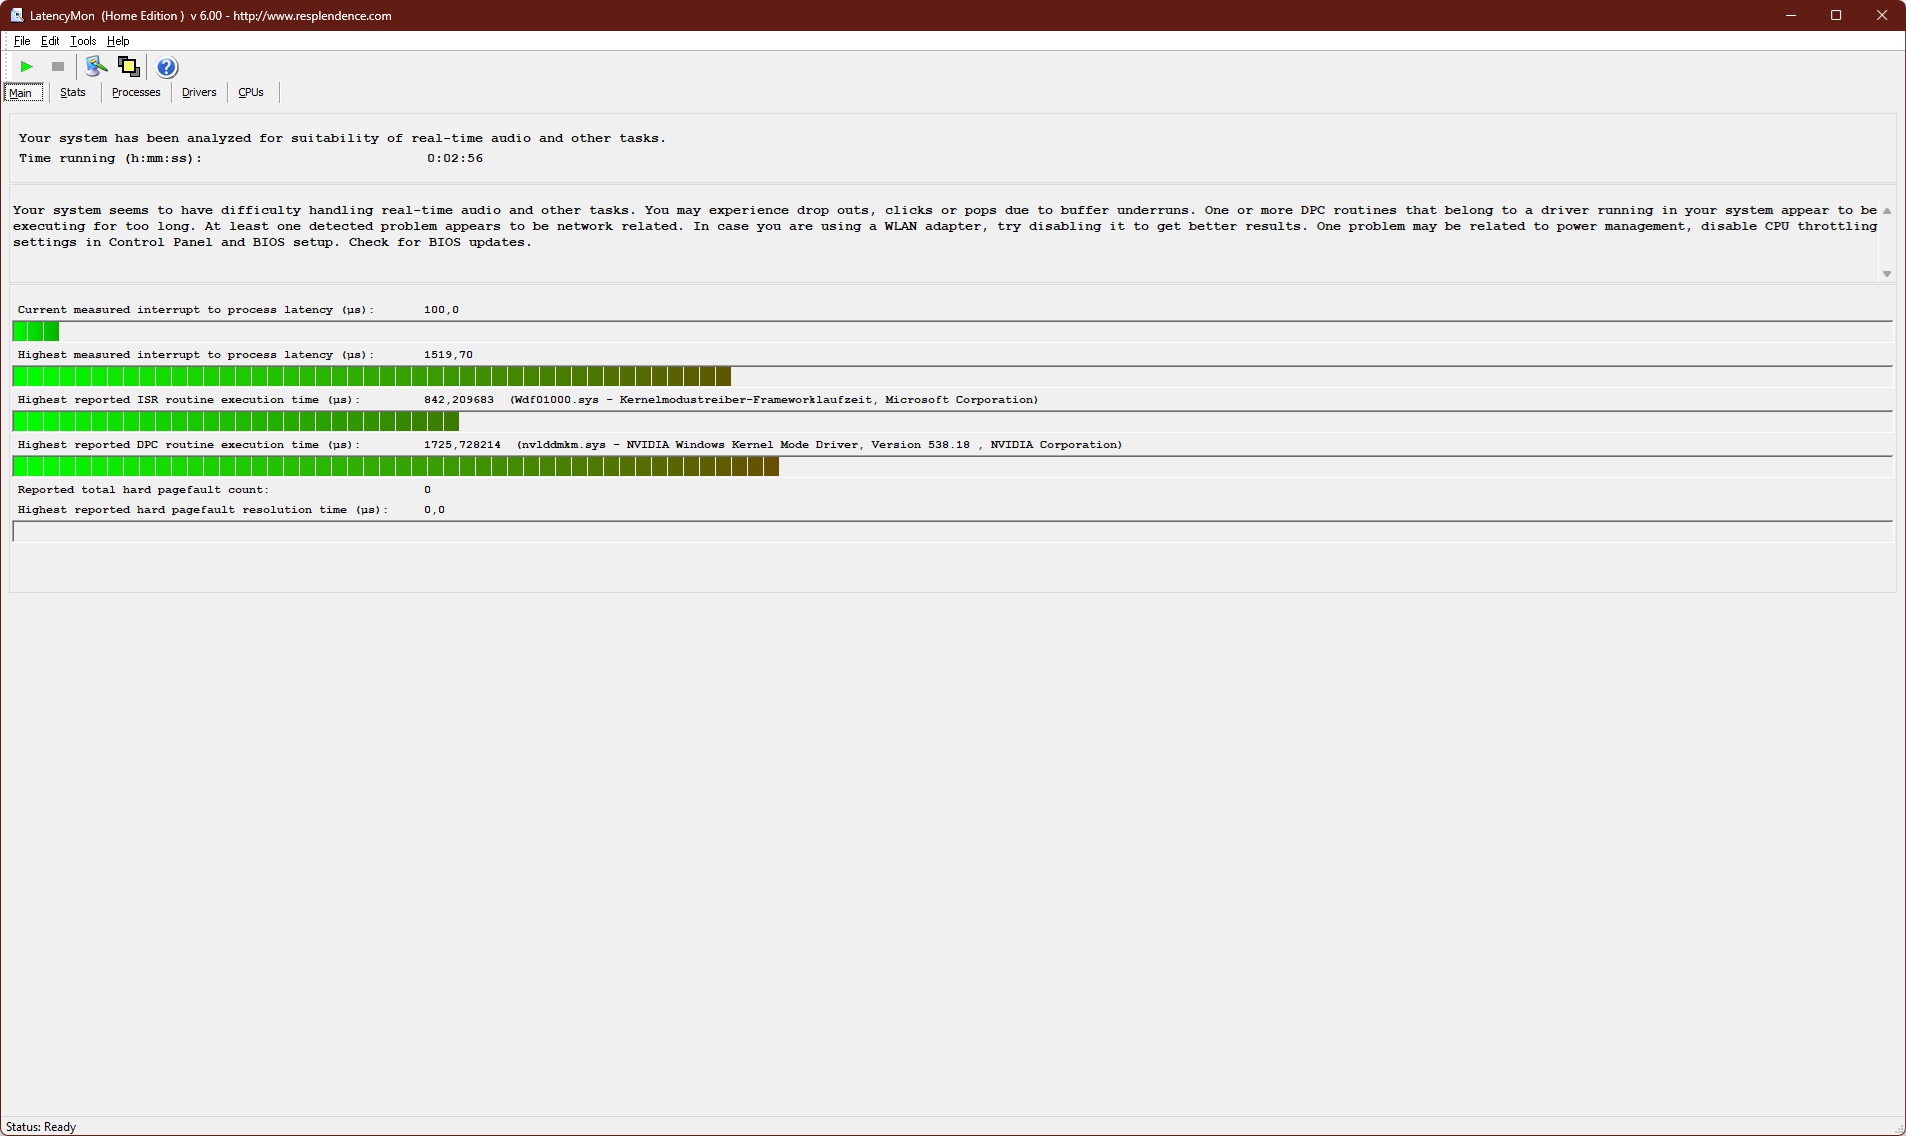
| DPC Latencies / LatencyMon - interrupt to process latency (max), Web, Youtube, Prime95 | |
| Lenovo ThinkPad P1 Gen 7 21KV001SGE | |
| Lenovo ThinkPad P1 G6 21FV001KUS | |
| Dell XPS 16 9640 | |
| Dell Precision 5690 | |
* ... smaller is better
Storage
Lenovo uses a Kioxia SSD with a capacity of one terabyte. The NVMe PCIe 4.0 SSD shows no performance degradation under sustained load, but it is not extremely fast. In everyday use, however, the differences to the SSDs of the competition will not be apparent.
As mentioned in the maintenance section: The Lenovo ThinkPad P1 Gen 7 has two M.2 2280 slots, one of which stays open on our unit. Another SSD can be added. The ThinkPad P1 Gen 7 also supports RAID 0/1.

| Drive Performance rating - Percent | |
| Dell XPS 16 9640 | |
| Average of class Workstation | |
| Dell Precision 5690 | |
| Average Kioxia XG8 KXG8AZNV1T02 | |
| Lenovo ThinkPad P1 G6 21FV001KUS | |
| Lenovo ThinkPad P1 Gen 7 21KV001SGE | |
* ... smaller is better
Sustained performance read: DiskSpd Read Loop, Queue Depth 8
GPU
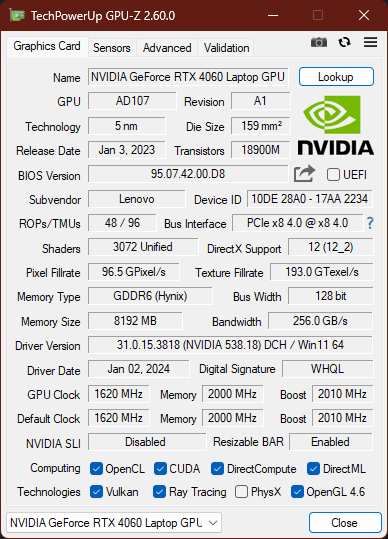
With the Nvidia GeForce RTX 4060 Laptop, the Lenovo ThinkPad P1 Gen 7 offers a mid-range solution of the Ada Lovelace series. Alternatively, the GeForce RTX 4070 or RTX 3000 Ada can offer even more performance. The real high end GPUs, which were available in the ThinkPad P1 Gen 6 (RTX 4000 Ada, RTX 5000 Ada, GeForce RTX 4080, GeForce RTX 4090) are nowhere to be found here.
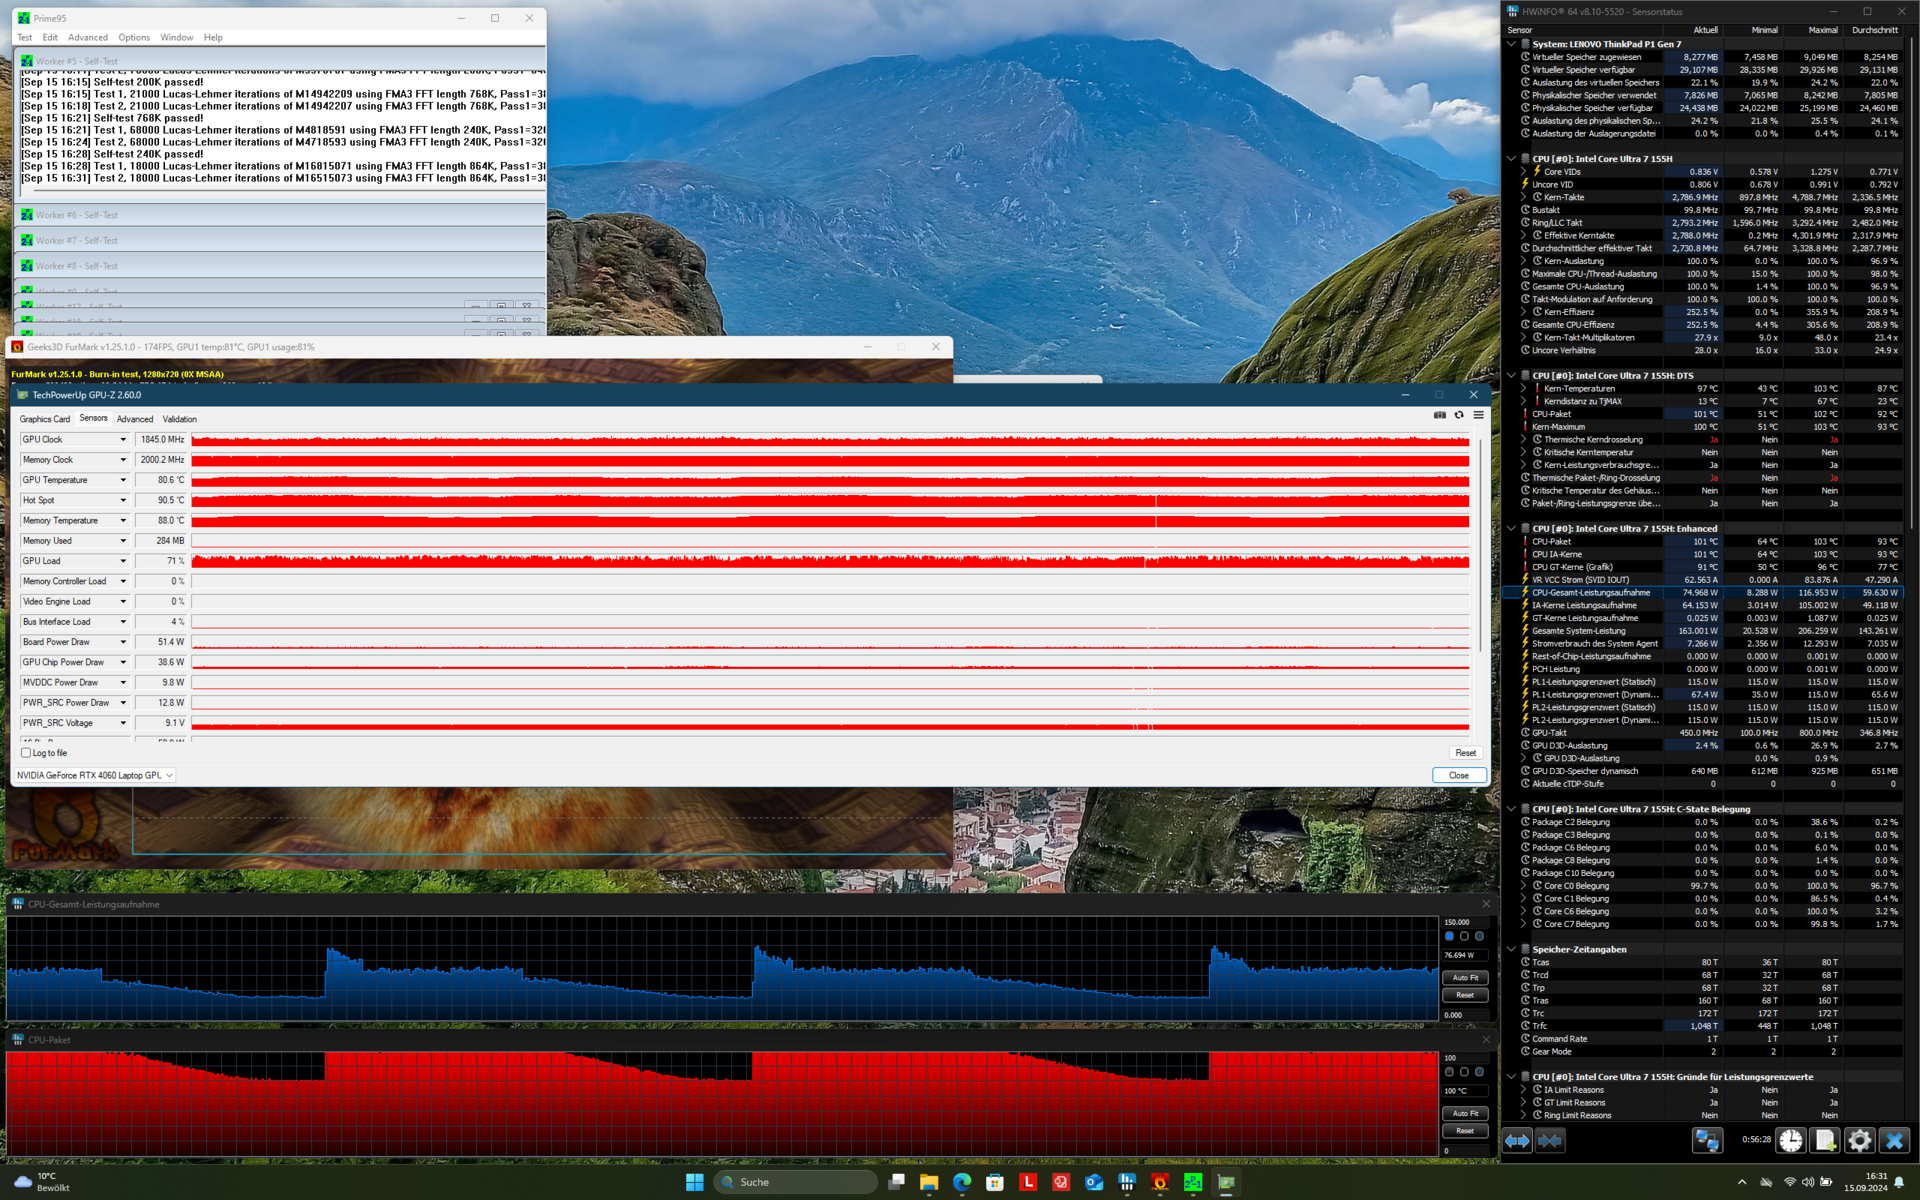
This means that the Lenovo ThinkPad P1 Gen 7 is a GPU downgrade compared with the older ThinkPad workstation. This downgrade is especially apparent when it comes to VRAM: The P1 G6 offered up to 16 GB VRAM, this gets halved to 8 GB for the P1 Gen 7. At least, the GeForce RTX 4060 here is not slow. In the 3DMark benchmarks, it is roughly as fast as the RTX 4070 in the Dell XPS 16. The TGP of the GPU sits at 80 W.
It is somewhat sad that the ThinkPad P1 Gen 7 does not offer Advanced Optimus anymore. With the predecessor, the MUX switch in the BIOS enabled a pure dGPU operation - not possible here anymore.
In battery mode, the GPU performance is slightly limited. In the 3DMark 11, the Lenovo ThinkPad P1 Gen 7 scored 25,134 points instead of 32,372, a reduction of 22 percent.
| 3DMark 11 Performance | 28509 points | |
| 3DMark Fire Strike Score | 21488 points | |
| 3DMark Time Spy Score | 9572 points | |
Help | ||
| SPECviewperf Performance rating - Percent | |
| Dell Precision 5690 -1! | |
| Average of class Workstation | |
| Lenovo ThinkPad P1 G6 21FV001KUS -1! | |
| Average NVIDIA GeForce RTX 4060 Laptop GPU -1! | |
| Lenovo ThinkPad P1 Gen 7 21KV001SGE -1! | |
* ... smaller is better
Gaming performance
Gaming is certainly possible with the P1 Gen 7, but it scores below the ThinkPad P1 Gen 8 with its Nvidia GeForce RTX 4080. At least in this regard, the ThinkPad P1 Gen 7 can beat the Dell XPS 16, despite that one having a RTX 4070. Of course, playing games with the Lenovo ThinkPad P1 Gen 7 is a little like driving a Ferrari on a public street - it is made for different applications.
| GTA V - 1920x1080 Highest AA:4xMSAA + FX AF:16x | |
| Lenovo ThinkPad P1 G6 21FV001KUS | |
| Dell XPS 16 9640 | |
| Average of class Workstation (18.1 - 156.1, n=23, last 2 years) | |
| Lenovo ThinkPad P1 Gen 7 21KV001SGE | |
| Apple MacBook Pro 16 2023 M3 Pro | |
| Final Fantasy XV Benchmark - 1920x1080 High Quality | |
| Lenovo ThinkPad P1 G6 21FV001KUS | |
| Dell Precision 5690 | |
| Average of class Workstation (26.4 - 197.6, n=23, last 2 years) | |
| Dell XPS 16 9640 | |
| Lenovo ThinkPad P1 Gen 7 21KV001SGE | |
| Dota 2 Reborn - 1920x1080 ultra (3/3) best looking | |
| Lenovo ThinkPad P1 G6 21FV001KUS | |
| Dell Precision 5690 | |
| Average of class Workstation (50.7 - 178.4, n=23, last 2 years) | |
| Lenovo ThinkPad P1 Gen 7 21KV001SGE | |
| Dell XPS 16 9640 | |
| X-Plane 11.11 - 1920x1080 high (fps_test=3) | |
| Lenovo ThinkPad P1 G6 21FV001KUS | |
| Dell Precision 5690 | |
| Dell XPS 16 9640 | |
| Dell XPS 16 9640 | |
| Lenovo ThinkPad P1 Gen 7 21KV001SGE | |
| Average of class Workstation (30.5 - 139.7, n=23, last 2 years) | |
In the Cyberpunk load test, there were no big frame rate drops.
Cyberpunk 2077 ultra FPS diagram
| low | med. | high | ultra | QHD DLSS | QHD | 4K | |
|---|---|---|---|---|---|---|---|
| GTA V (2015) | 176.4 | 168 | 162.9 | 97.9 | 77.6 | 73.1 | |
| Dota 2 Reborn (2015) | 161.5 | 146.7 | 138.2 | 131.2 | |||
| Final Fantasy XV Benchmark (2018) | 174.2 | 122.7 | 90.3 | 68.1 | |||
| X-Plane 11.11 (2018) | 124.4 | 105.9 | 83.3 | ||||
| Far Cry 5 (2018) | 148 | 125 | 118 | 110 | 88 | ||
| Baldur's Gate 3 (2023) | 102.8 | 77.5 | 68.7 | 67.4 | 45.2 | ||
| Cyberpunk 2077 (2023) | 106.9 | 85.7 | 74.4 | 65.1 | 41 | 16.9 | |
| F1 24 (2024) | 190.1 | 175.5 | 142.5 | 47.5 | 48.6 | 31.8 |
Emissions: Palmrest of the Lenovo laptop stays cool
Noise
One can not expect a performance optimized unit like the Lenovo ThinkPad P1 Gen 7 to always be quiet. When idling, the two fans are not running, but they get pretty loud already under medium load (energy profile: Balanced). Under maximum load in the stress test (energy profile: Best performance), we measure 53 dB(a) - very loud, but normal for a workstation laptop. Overall, we would not call the ThinkPad P1 Gen 7 a very loud laptop. The fans do get loud, but they do stop running as soon as the system goes back to idling.
The Lenovo ThinkPad P1 Gen 7 produces no coil whine.
Noise level
| Idle |
| 24.7 / 24.7 / 24.7 dB(A) |
| Load |
| 43.7 / 53.3 dB(A) |
 | ||
30 dB silent 40 dB(A) audible 50 dB(A) loud |
||
min: | ||
| Lenovo ThinkPad P1 Gen 7 21KV001SGE GeForce RTX 4060 Laptop GPU, Ultra 7 155H, Kioxia XG8 KXG8AZNV1T02 | Lenovo ThinkPad P1 G6 21FV001KUS GeForce RTX 4080 Laptop GPU, i7-13800H, Kioxia XG8 KXG8AZNV1T02 | Apple MacBook Pro 16 2023 M3 Pro M3 Pro 18-Core GPU, Apple M3 Pro 12-Core, Apple SSD AP0512Z | Dell XPS 16 9640 GeForce RTX 4070 Laptop GPU, Ultra 7 155H, Kioxia XG8 KXG80ZNV1T02 | Dell Precision 5690 RTX 5000 Ada Generation Laptop, Ultra 9 185H, 2x Samsung PM9A1 1TB (RAID 0) | |
|---|---|---|---|---|---|
| Noise | 11% | 8% | 1% | -1% | |
| off / environment * (dB) | 24.7 | 22.5 9% | 24.4 1% | 24.5 1% | 23.4 5% |
| Idle Minimum * (dB) | 24.7 | 22.5 9% | 24.4 1% | 24.5 1% | 23.6 4% |
| Idle Average * (dB) | 24.7 | 22.5 9% | 24.4 1% | 24.5 1% | 24.9 -1% |
| Idle Maximum * (dB) | 24.7 | 22.5 9% | 24.4 1% | 27.5 -11% | 30.9 -25% |
| Load Average * (dB) | 43.7 | 28.7 34% | 26.9 38% | 39.6 9% | 40.4 8% |
| Cyberpunk 2077 ultra * (dB) | 53.2 | ||||
| Load Maximum * (dB) | 53.3 | 54.4 -2% | 50.4 5% | 49.7 7% | 51.9 3% |
| Witcher 3 ultra * (dB) | 47.5 | 25.1 | 49.7 | 48.3 |
* ... smaller is better
Heat
The max temperature of the chassis goes up to 50 degrees Celsius / 123 F. That hot spot is above the keyboard, an area the user usually will not touch. The lower part of the device mostly stays cool, no matter if in the stress test or the Cyberpunk gaming test.
Despite having two fans, liquid metal and a vapor chamber, the Lenovo ThinkPad P1 Gen 7 can not cool both the CPU and GPU without throttling under sustained load. Both components have to be limited in the stress test, with the GPU running at 50 W and the CPU at 70 W. CPU performance goes up and down in a sort of "wave" pattern.
(-) The maximum temperature on the upper side is 50.3 °C / 123 F, compared to the average of 38.2 °C / 101 F, ranging from 22.2 to 69.8 °C for the class Workstation.
(+) The bottom heats up to a maximum of 38 °C / 100 F, compared to the average of 41.1 °C / 106 F
(+) In idle usage, the average temperature for the upper side is 24.9 °C / 77 F, compared to the device average of 32 °C / 90 F.
(±) 3: The average temperature for the upper side is 32.2 °C / 90 F, compared to the average of 32 °C / 90 F for the class Workstation.
(+) The palmrests and touchpad are cooler than skin temperature with a maximum of 30.2 °C / 86.4 F and are therefore cool to the touch.
(-) The average temperature of the palmrest area of similar devices was 27.8 °C / 82 F (-2.4 °C / -4.4 F).
| Lenovo ThinkPad P1 Gen 7 21KV001SGE Intel Core Ultra 7 155H, NVIDIA GeForce RTX 4060 Laptop GPU | Lenovo ThinkPad P1 G6 21FV001KUS Intel Core i7-13800H, NVIDIA GeForce RTX 4080 Laptop GPU | Apple MacBook Pro 16 2023 M3 Pro Apple M3 Pro 12-Core, Apple M3 Pro 18-Core GPU | Dell XPS 16 9640 Intel Core Ultra 7 155H, NVIDIA GeForce RTX 4070 Laptop GPU | Dell Precision 5690 Intel Core Ultra 9 185H, NVIDIA RTX 5000 Ada Generation Laptop | |
|---|---|---|---|---|---|
| Heat | -14% | 13% | 6% | -1% | |
| Maximum Upper Side * (°C) | 50.3 | 42 17% | 38.1 24% | 39.4 22% | 46.6 7% |
| Maximum Bottom * (°C) | 38 | 45.2 -19% | 37 3% | 36.9 3% | 33 13% |
| Idle Upper Side * (°C) | 28.3 | 33 -17% | 24.2 14% | 28.2 -0% | 32.4 -14% |
| Idle Bottom * (°C) | 27.3 | 37 -36% | 24.6 10% | 27.4 -0% | 29.4 -8% |
* ... smaller is better
Speakers
Instead of upward firing speakers like the predecessor ThinkPad P1 Gen 6, the ThinkPad P1 Gen 7 has downward firing ones. The quality of the Stereo speakers is still great, even if the maximum volume is a little reduced compared with last years model.
Lenovo ThinkPad P1 Gen 7 21KV001SGE audio analysis
(±) | speaker loudness is average but good (81.4 dB)
Bass 100 - 315 Hz
(±) | reduced bass - on average 6.8% lower than median
(±) | linearity of bass is average (10.3% delta to prev. frequency)
Mids 400 - 2000 Hz
(+) | balanced mids - only 3.4% away from median
(+) | mids are linear (4.7% delta to prev. frequency)
Highs 2 - 16 kHz
(+) | balanced highs - only 3.1% away from median
(+) | highs are linear (6% delta to prev. frequency)
Overall 100 - 16.000 Hz
(+) | overall sound is linear (9.2% difference to median)
Compared to same class
» 4% of all tested devices in this class were better, 2% similar, 94% worse
» The best had a delta of 7%, average was 17%, worst was 35%
Compared to all devices tested
» 3% of all tested devices were better, 1% similar, 96% worse
» The best had a delta of 4%, average was 23%, worst was 134%
Lenovo ThinkPad P1 G6 21FV001KUS audio analysis
(+) | speakers can play relatively loud (85.2 dB)
Bass 100 - 315 Hz
(±) | reduced bass - on average 8% lower than median
(±) | linearity of bass is average (10.2% delta to prev. frequency)
Mids 400 - 2000 Hz
(±) | higher mids - on average 7.7% higher than median
(+) | mids are linear (4.7% delta to prev. frequency)
Highs 2 - 16 kHz
(+) | balanced highs - only 4.2% away from median
(+) | highs are linear (6.2% delta to prev. frequency)
Overall 100 - 16.000 Hz
(+) | overall sound is linear (13.2% difference to median)
Compared to same class
» 23% of all tested devices in this class were better, 6% similar, 71% worse
» The best had a delta of 7%, average was 17%, worst was 35%
Compared to all devices tested
» 14% of all tested devices were better, 3% similar, 84% worse
» The best had a delta of 4%, average was 23%, worst was 134%
Dell XPS 16 9640 audio analysis
(+) | speakers can play relatively loud (83.4 dB)
Bass 100 - 315 Hz
(±) | reduced bass - on average 11.2% lower than median
(±) | linearity of bass is average (8.9% delta to prev. frequency)
Mids 400 - 2000 Hz
(+) | balanced mids - only 4.5% away from median
(+) | mids are linear (3% delta to prev. frequency)
Highs 2 - 16 kHz
(+) | balanced highs - only 1.4% away from median
(+) | highs are linear (2% delta to prev. frequency)
Overall 100 - 16.000 Hz
(+) | overall sound is linear (10% difference to median)
Compared to same class
» 13% of all tested devices in this class were better, 2% similar, 84% worse
» The best had a delta of 5%, average was 17%, worst was 45%
Compared to all devices tested
» 4% of all tested devices were better, 1% similar, 94% worse
» The best had a delta of 4%, average was 23%, worst was 134%
Energy management: Better battery life than ThinkPad P1 Gen 6
Power consumption
The Lenovo ThinkPad P1 Gen 7 has a lower idle power consumption than the competition, except for the Apple MacBook Pro 16. In this regard, the lower screen resolution probably pays off, though the higher refresh rate of 165 Hz counteracts this advantage. Ex factory, the screen is set to 165 Hz, Dynamic Refresh Rate is not supported.
Under maximum load, the ThinkPad laptop consumes up to 167.5 W, which is within the bounds of the 170 W charger.
| Off / Standby | |
| Idle | |
| Load |
|
Key:
min: | |
| Lenovo ThinkPad P1 Gen 7 21KV001SGE Ultra 7 155H, GeForce RTX 4060 Laptop GPU, Kioxia XG8 KXG8AZNV1T02, IPS LED, 2560x1600, 16" | Lenovo ThinkPad P1 G6 21FV001KUS i7-13800H, GeForce RTX 4080 Laptop GPU, Kioxia XG8 KXG8AZNV1T02, OLED, 3480x2400, 16" | Apple MacBook Pro 16 2023 M3 Pro Apple M3 Pro 12-Core, M3 Pro 18-Core GPU, Apple SSD AP0512Z, Mini-LED, 3456x2234, 16.2" | Dell XPS 16 9640 Ultra 7 155H, GeForce RTX 4070 Laptop GPU, Kioxia XG8 KXG80ZNV1T02, OLED, 3840x2400, 16.3" | Dell Precision 5690 Ultra 9 185H, RTX 5000 Ada Generation Laptop, 2x Samsung PM9A1 1TB (RAID 0), OLED, 3840x2400, 16" | Average NVIDIA GeForce RTX 4060 Laptop GPU | Average of class Workstation | |
|---|---|---|---|---|---|---|---|
| Power Consumption | -12% | 15% | 14% | -19% | -29% | -14% | |
| Idle Minimum * (Watt) | 7.3 | 8 -10% | 4.5 38% | 7.7 -5% | 7.9 -8% | 11.5 ? -58% | 9.11 ? -25% |
| Idle Average * (Watt) | 12.3 | 9.5 23% | 16.5 -34% | 10.3 16% | 12 2% | 16 ? -30% | 13.8 ? -12% |
| Idle Maximum * (Watt) | 17.9 | 23.7 -32% | 16.7 7% | 10.6 41% | 28.6 -60% | 20.3 ? -13% | 17.9 ? -0% |
| Load Average * (Watt) | 78.2 | 97.2 -24% | 60.4 23% | 76.5 2% | 98.8 -26% | 92.9 ? -19% | 96 ? -23% |
| Cyberpunk 2077 ultra external monitor * (Watt) | 117.7 | ||||||
| Cyberpunk 2077 ultra * (Watt) | 123.5 | ||||||
| Load Maximum * (Watt) | 167.5 | 197.2 -18% | 102.9 39% | 138.5 17% | 174.8 -4% | 210 ? -25% | 180.3 ? -8% |
| Witcher 3 ultra * (Watt) | 144 | 52.1 | 126.4 | 144.5 |
* ... smaller is better
Power consumption Cyberpunk / stress test
Power consumption w/external monitor
Battery life
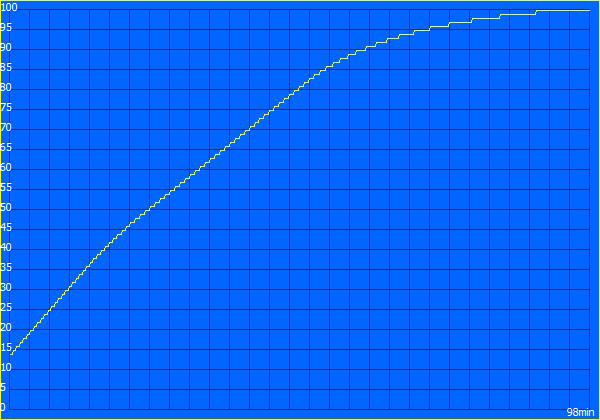
The battery capacity of the 90 Wh battery remains unchanged. Still, battery life is improved in the Wi-Fi test (150 cd/m² screen brightness) compared with the preceding Lenovo ThinkPad P1 Gen 6. The 2024 model achieves roughly ten hours instead of four like the old model. Using this device on the go seems much more feasible than with the P1 Gen 6.
| Lenovo ThinkPad P1 Gen 7 21KV001SGE Ultra 7 155H, GeForce RTX 4060 Laptop GPU, 90 Wh | Lenovo ThinkPad P1 G6 21FV001KUS i7-13800H, GeForce RTX 4080 Laptop GPU, 90 Wh | Apple MacBook Pro 16 2023 M3 Pro Apple M3 Pro 12-Core, M3 Pro 18-Core GPU, 99.6 Wh | Dell XPS 16 9640 Ultra 7 155H, GeForce RTX 4070 Laptop GPU, 99.5 Wh | Dell Precision 5690 Ultra 9 185H, RTX 5000 Ada Generation Laptop, 98 Wh | Average of class Workstation | |
|---|---|---|---|---|---|---|
| Battery runtime | -58% | 39% | -8% | -7% | -19% | |
| WiFi v1.3 (h) | 9.9 | 4.2 -58% | 20.1 103% | 10.5 6% | 9.2 -7% | 8.55 ? -14% |
| Load (h) | 1.9 | 1.4 -26% | 1.5 -21% | 1.441 ? -24% |
Notebookcheck Overall Rating
The Lenovo ThinkPad P1 Gen 7 skips high-end GPUs and uses two M.2 2280 slots as well as the new LPCAMM2 memory. The design is close to the ThinkPad Z16 with an aluminum lid and a big trackpad. On the inside, the Meteor Lake CPU improves the efficiency and battery life. Overall, this model offers a more premium design and improved mobility with a slightly reduced GPU performance.
Transparency
The selection of devices to be reviewed is made by our editorial team. The test sample was provided to the author as a loan by the manufacturer or retailer for the purpose of this review. The lender had no influence on this review, nor did the manufacturer receive a copy of this review before publication. There was no obligation to publish this review. As an independent media company, Notebookcheck is not subjected to the authority of manufacturers, retailers or publishers.
This is how Notebookcheck is testing
Every year, Notebookcheck independently reviews hundreds of laptops and smartphones using standardized procedures to ensure that all results are comparable. We have continuously developed our test methods for around 20 years and set industry standards in the process. In our test labs, high-quality measuring equipment is utilized by experienced technicians and editors. These tests involve a multi-stage validation process. Our complex rating system is based on hundreds of well-founded measurements and benchmarks, which maintains objectivity. Further information on our test methods can be found here.
