Lenovo ThinkPad P1 (Xeon E-2176M, Quadro P2000 Max-Q) Workstation Review
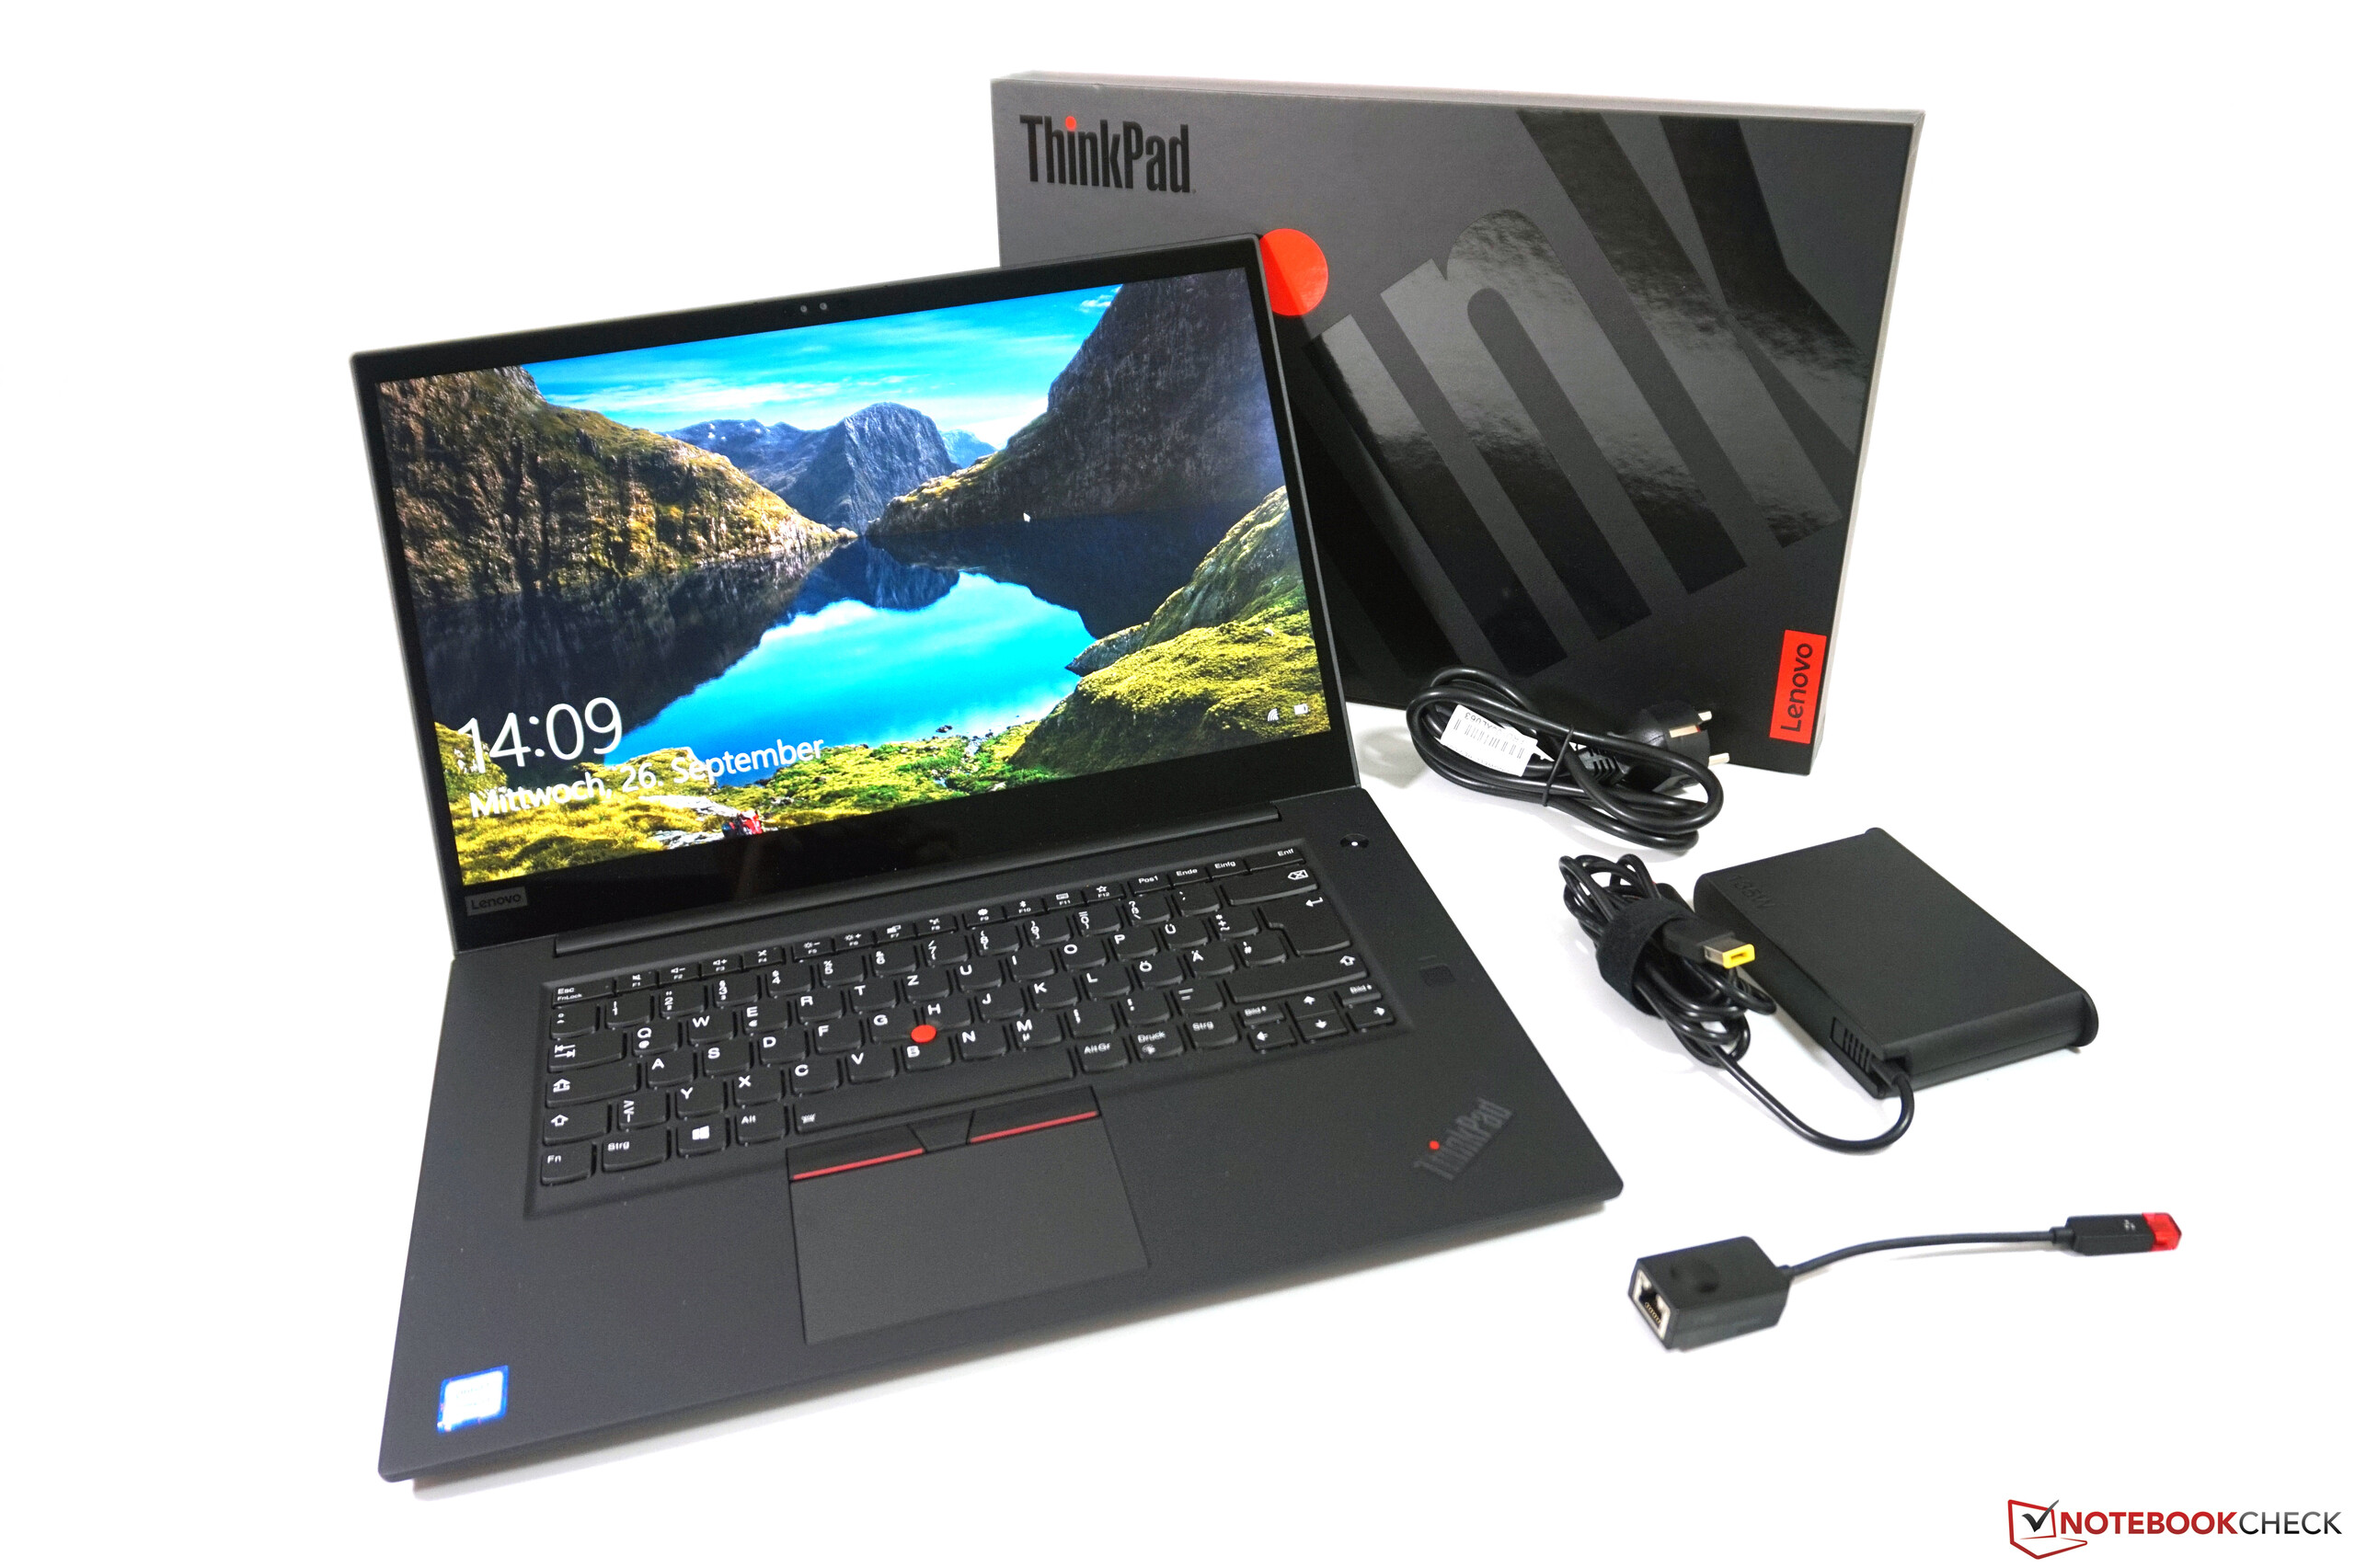
Not to be outdone by the impressive ThinkPad X1 Extreme we reviewed last month is the state-of-the-art laptop’s business workstation counterpart, the ThinkPad P1. In terms of design and appearance, the machines are identical, but several critical parts have been swapped out for workstation-grade components in the P1. Namely, in place of the Core i7 CPU and NVIDIA GeForce GTX 1050 Ti Max-Q GPU, today’s P1 review unit features a Xeon E-2176M and Quadro P2000 Max-Q respectively. We were also pleased to find an absolutely massive 2 TB Samsung NVMe SSD in today’s machine—double the previous storage—and the same 32 GB of RAM and 4K HDR touch display. The towering price consequently dwarfs even that of the X1 Extreme: a mind-boggling $4220 as of this writing.
Our criticisms of the X1 Extreme were relatively minor indeed. Mostly, we regretted the glossy screen finish, overactive fans, high power consumption, and CPU performance on battery. By and large, the rest of our findings were overwhelmingly positive: terrific build quality and input devices, strong performance, a high-quality display, and good port selection and maintainability/upgradeability. How will today’s workstation counterpart measure up to the lofty standards set by its mass-market sibling?
Case
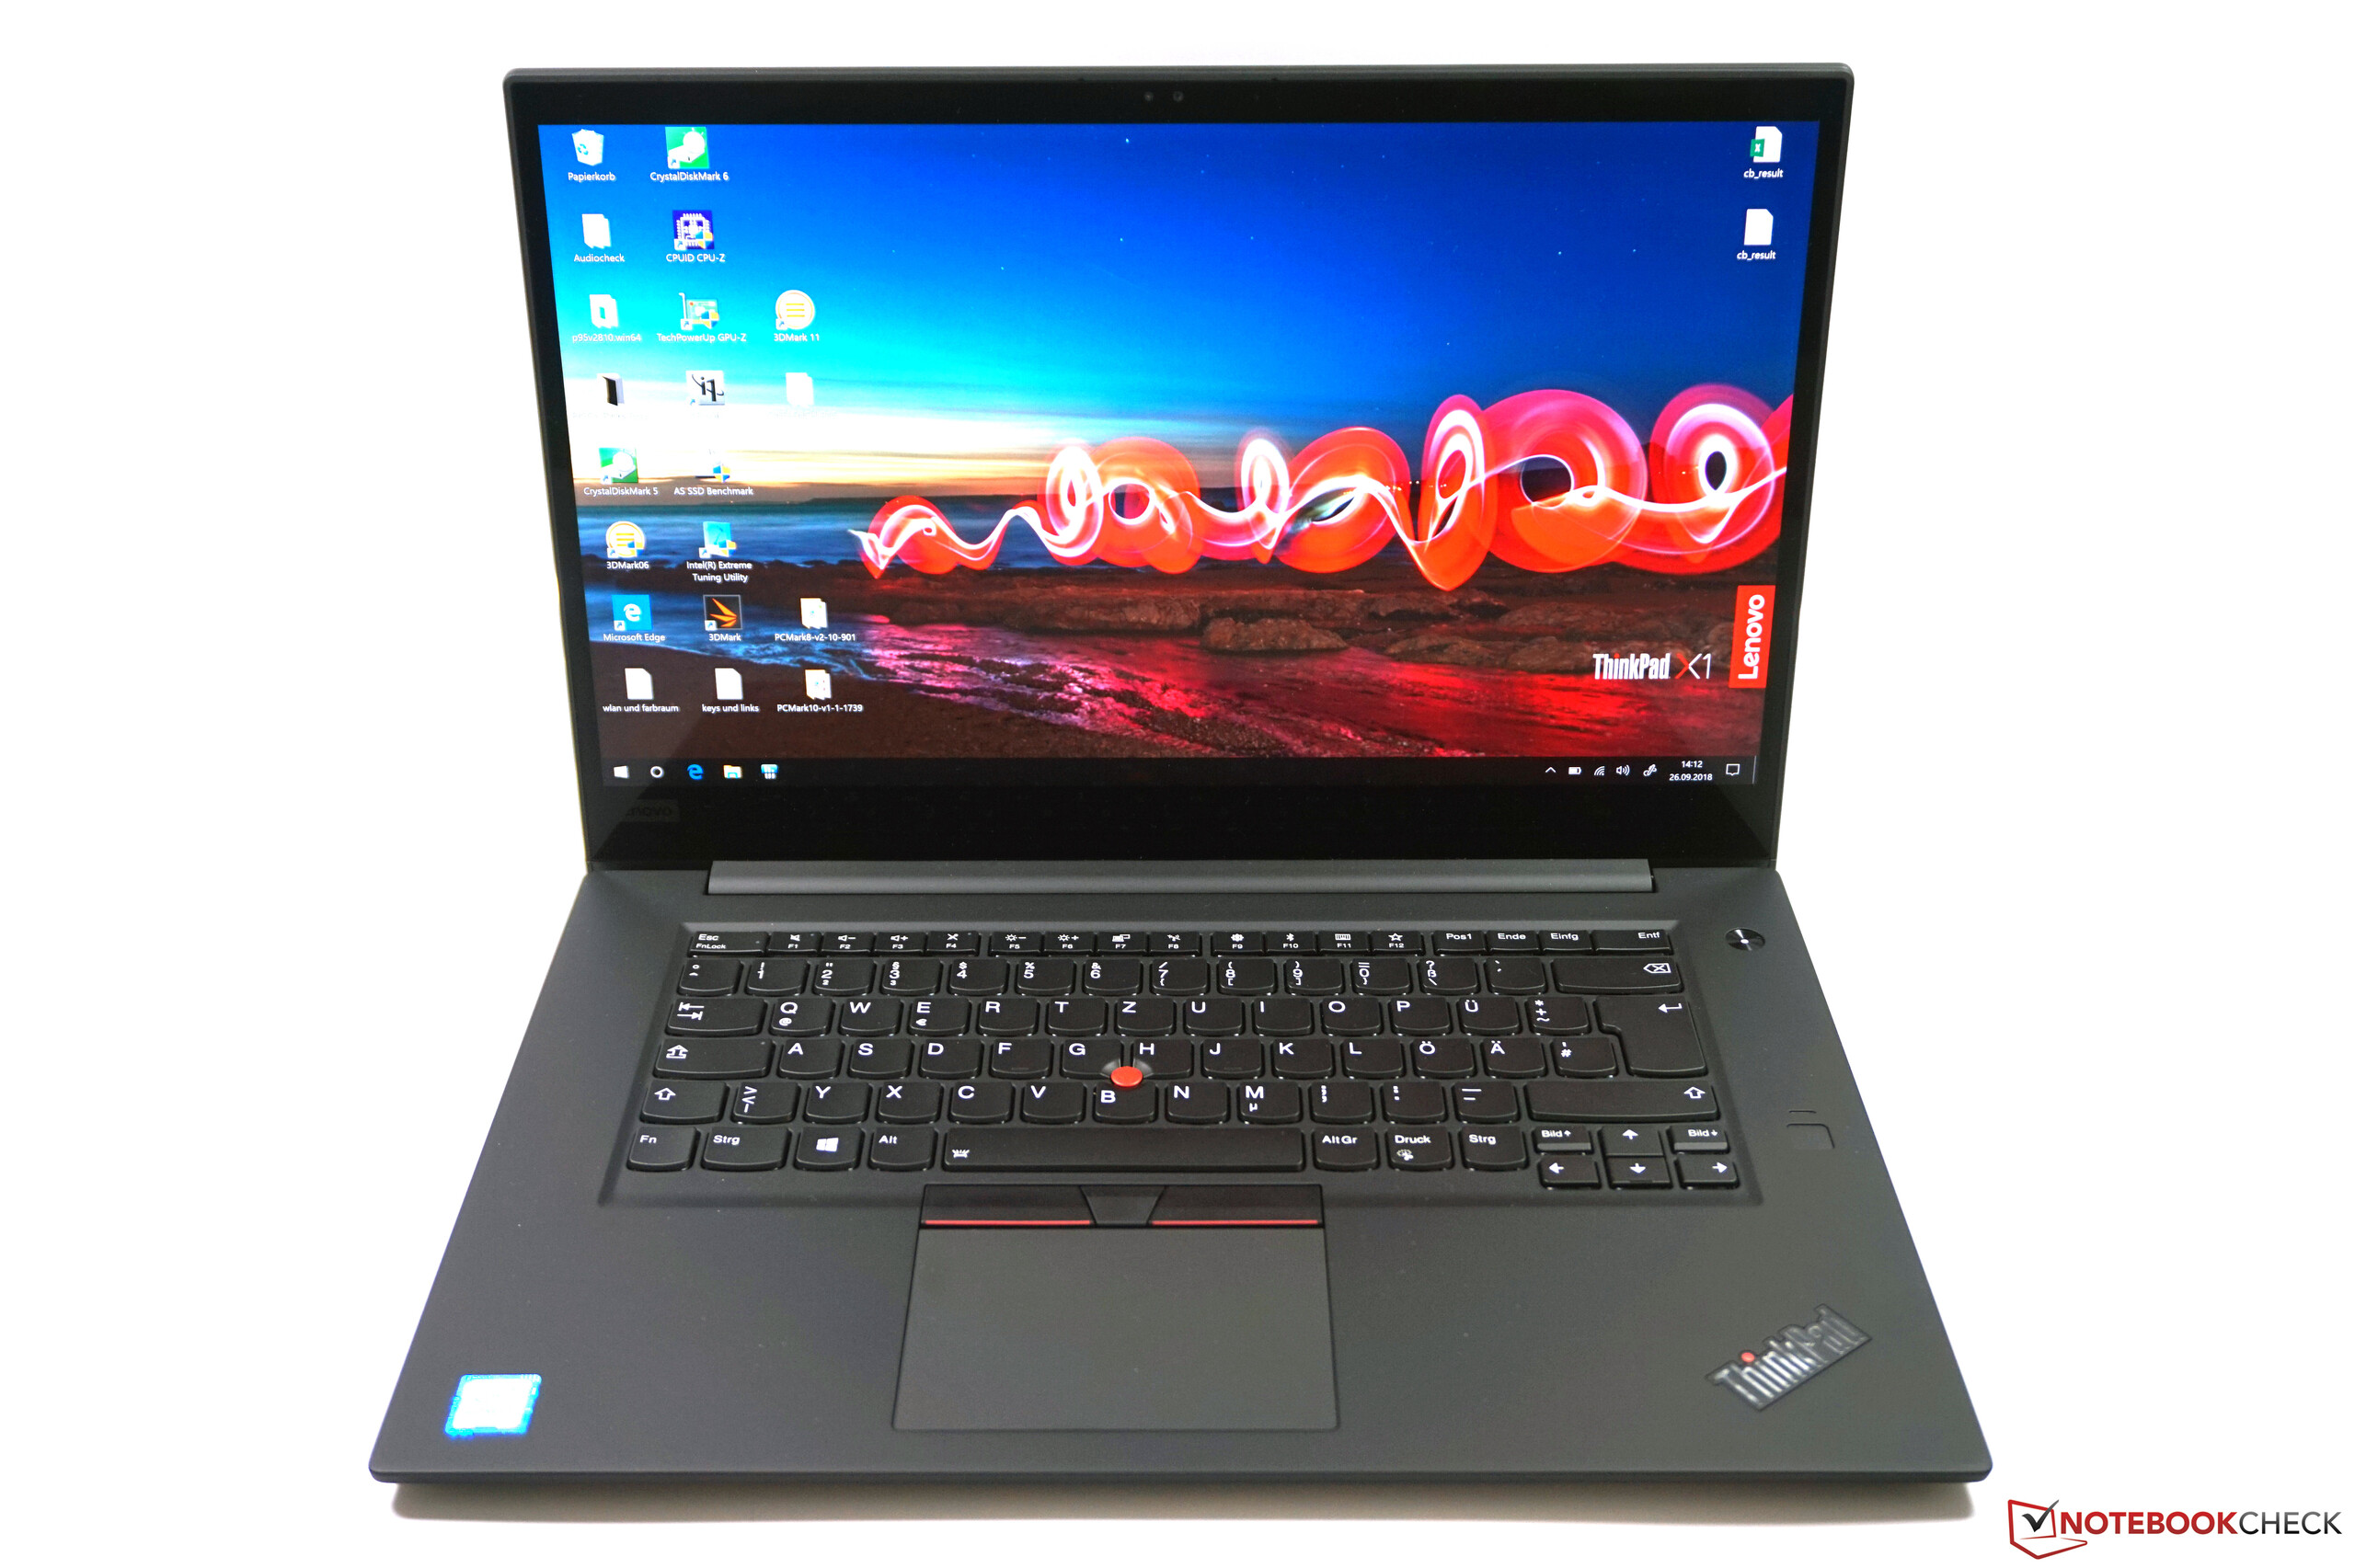
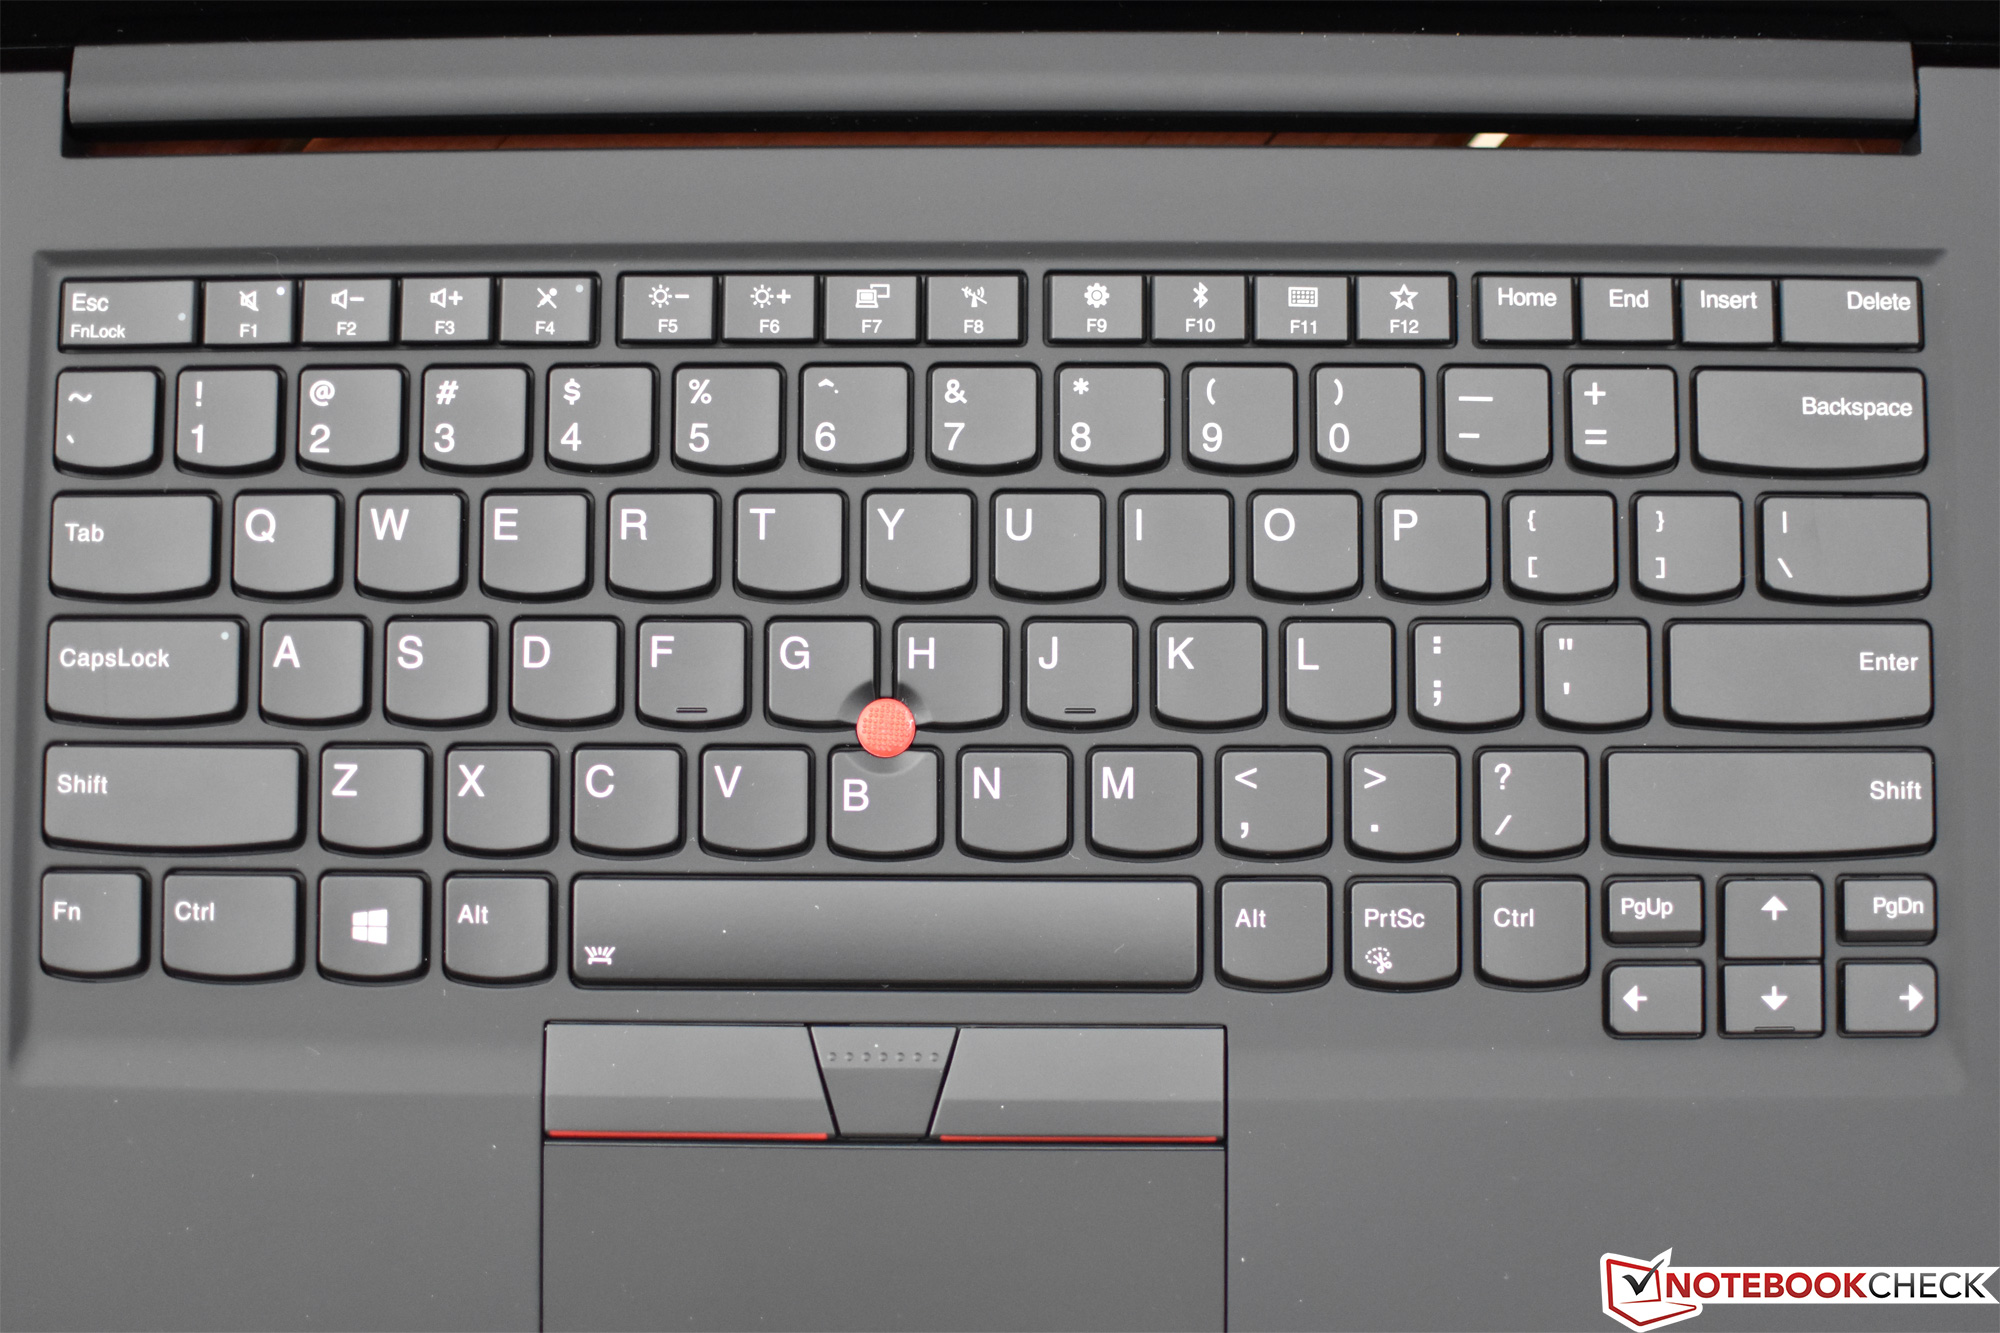
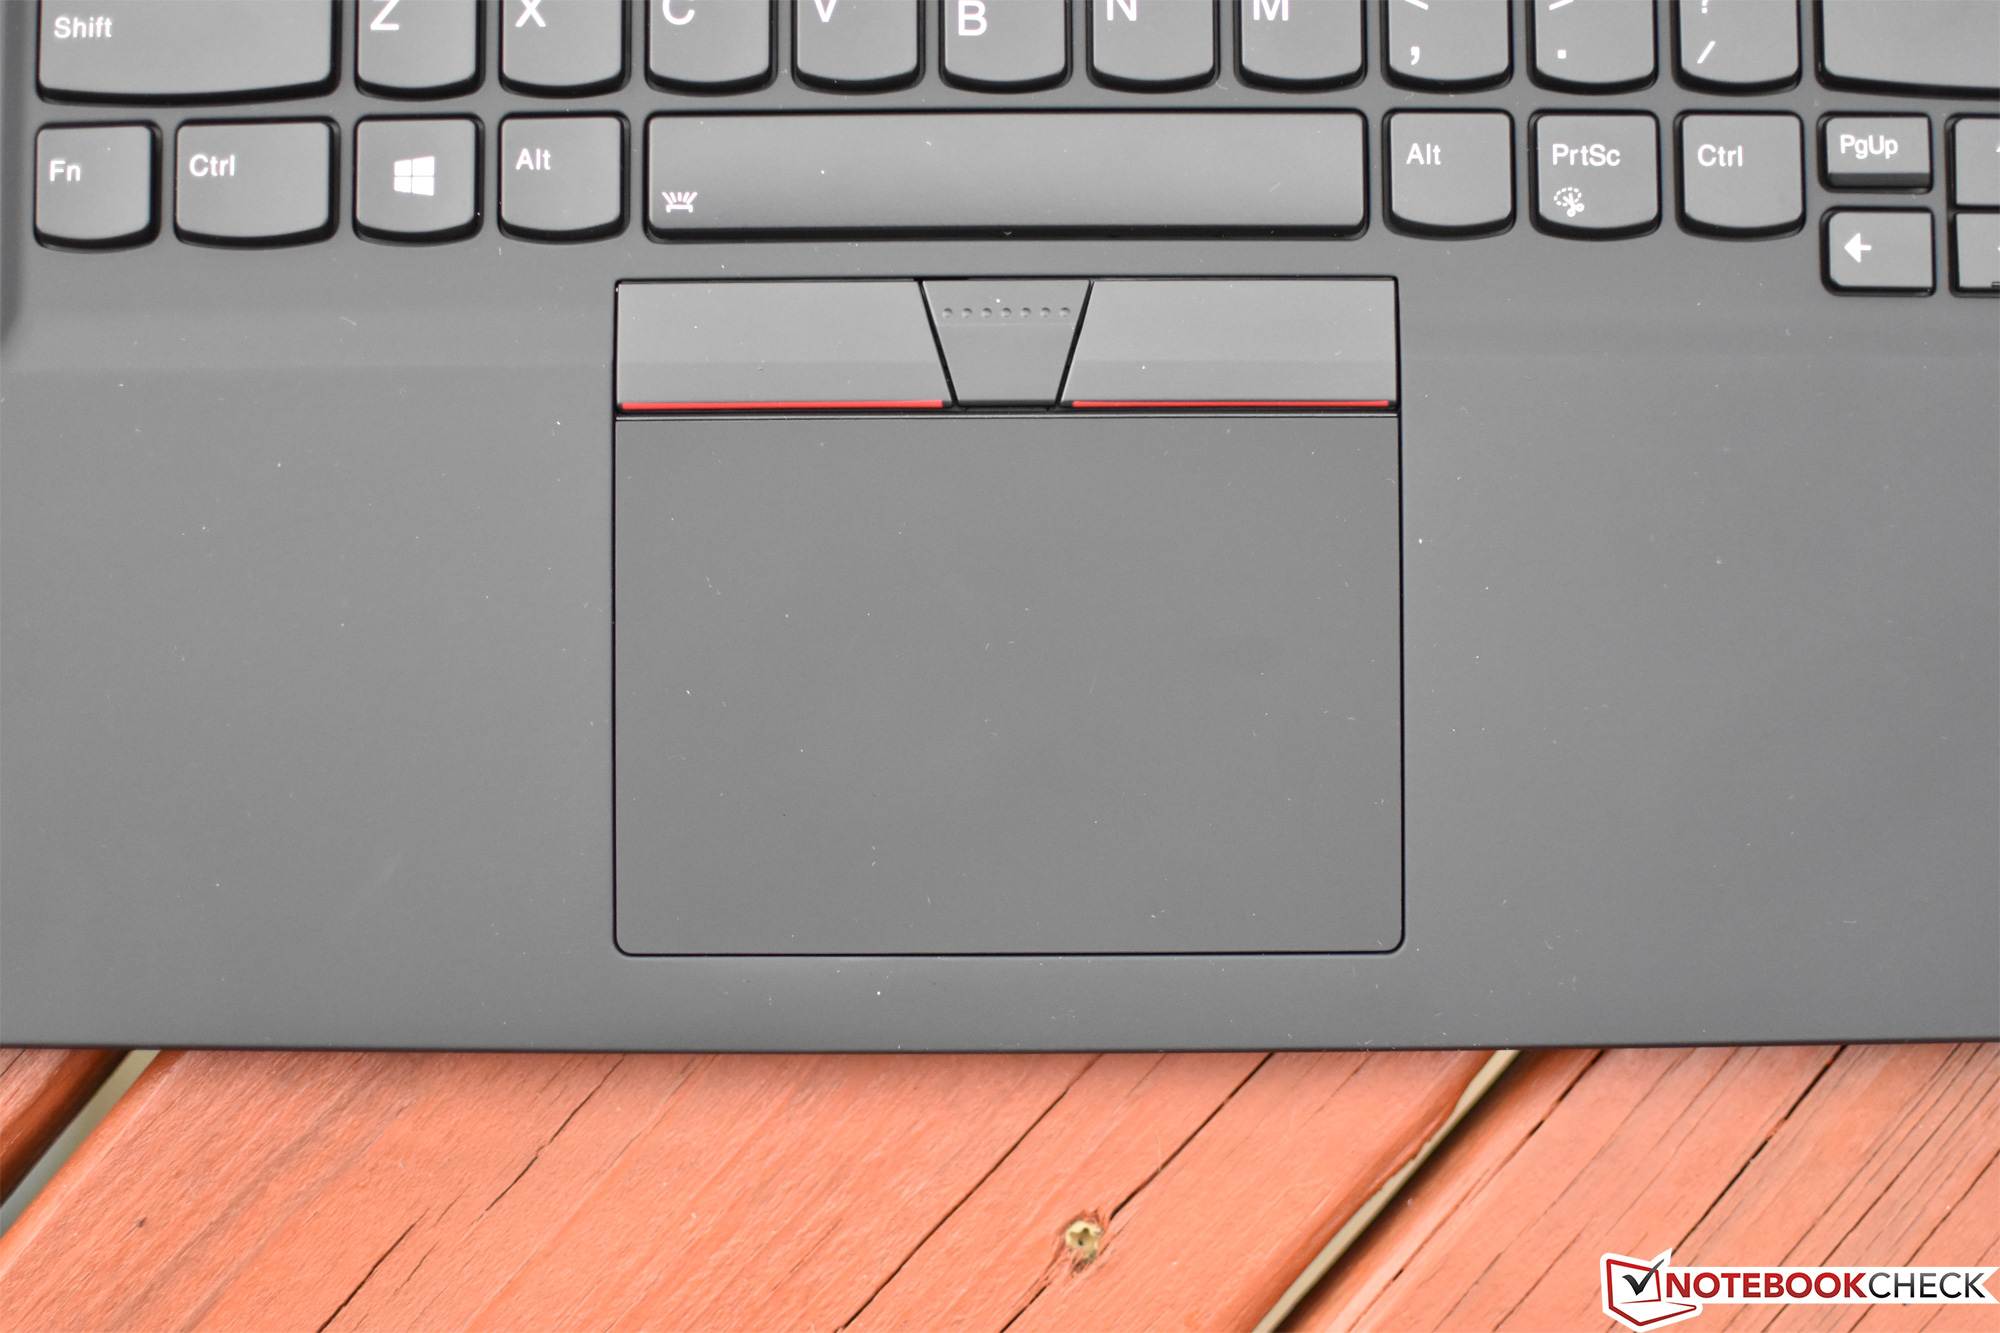
As previously mentioned, the ThinkPad P1 is identical in terms of case design and aesthetics, and the similarities also extend to the input devices and port selection. The only major differences in today’s review unit are the discrepancies in internal components we mentioned previously. As such, our evaluation of the physical aspects of the machine have not changed much since our X1 Extreme review.
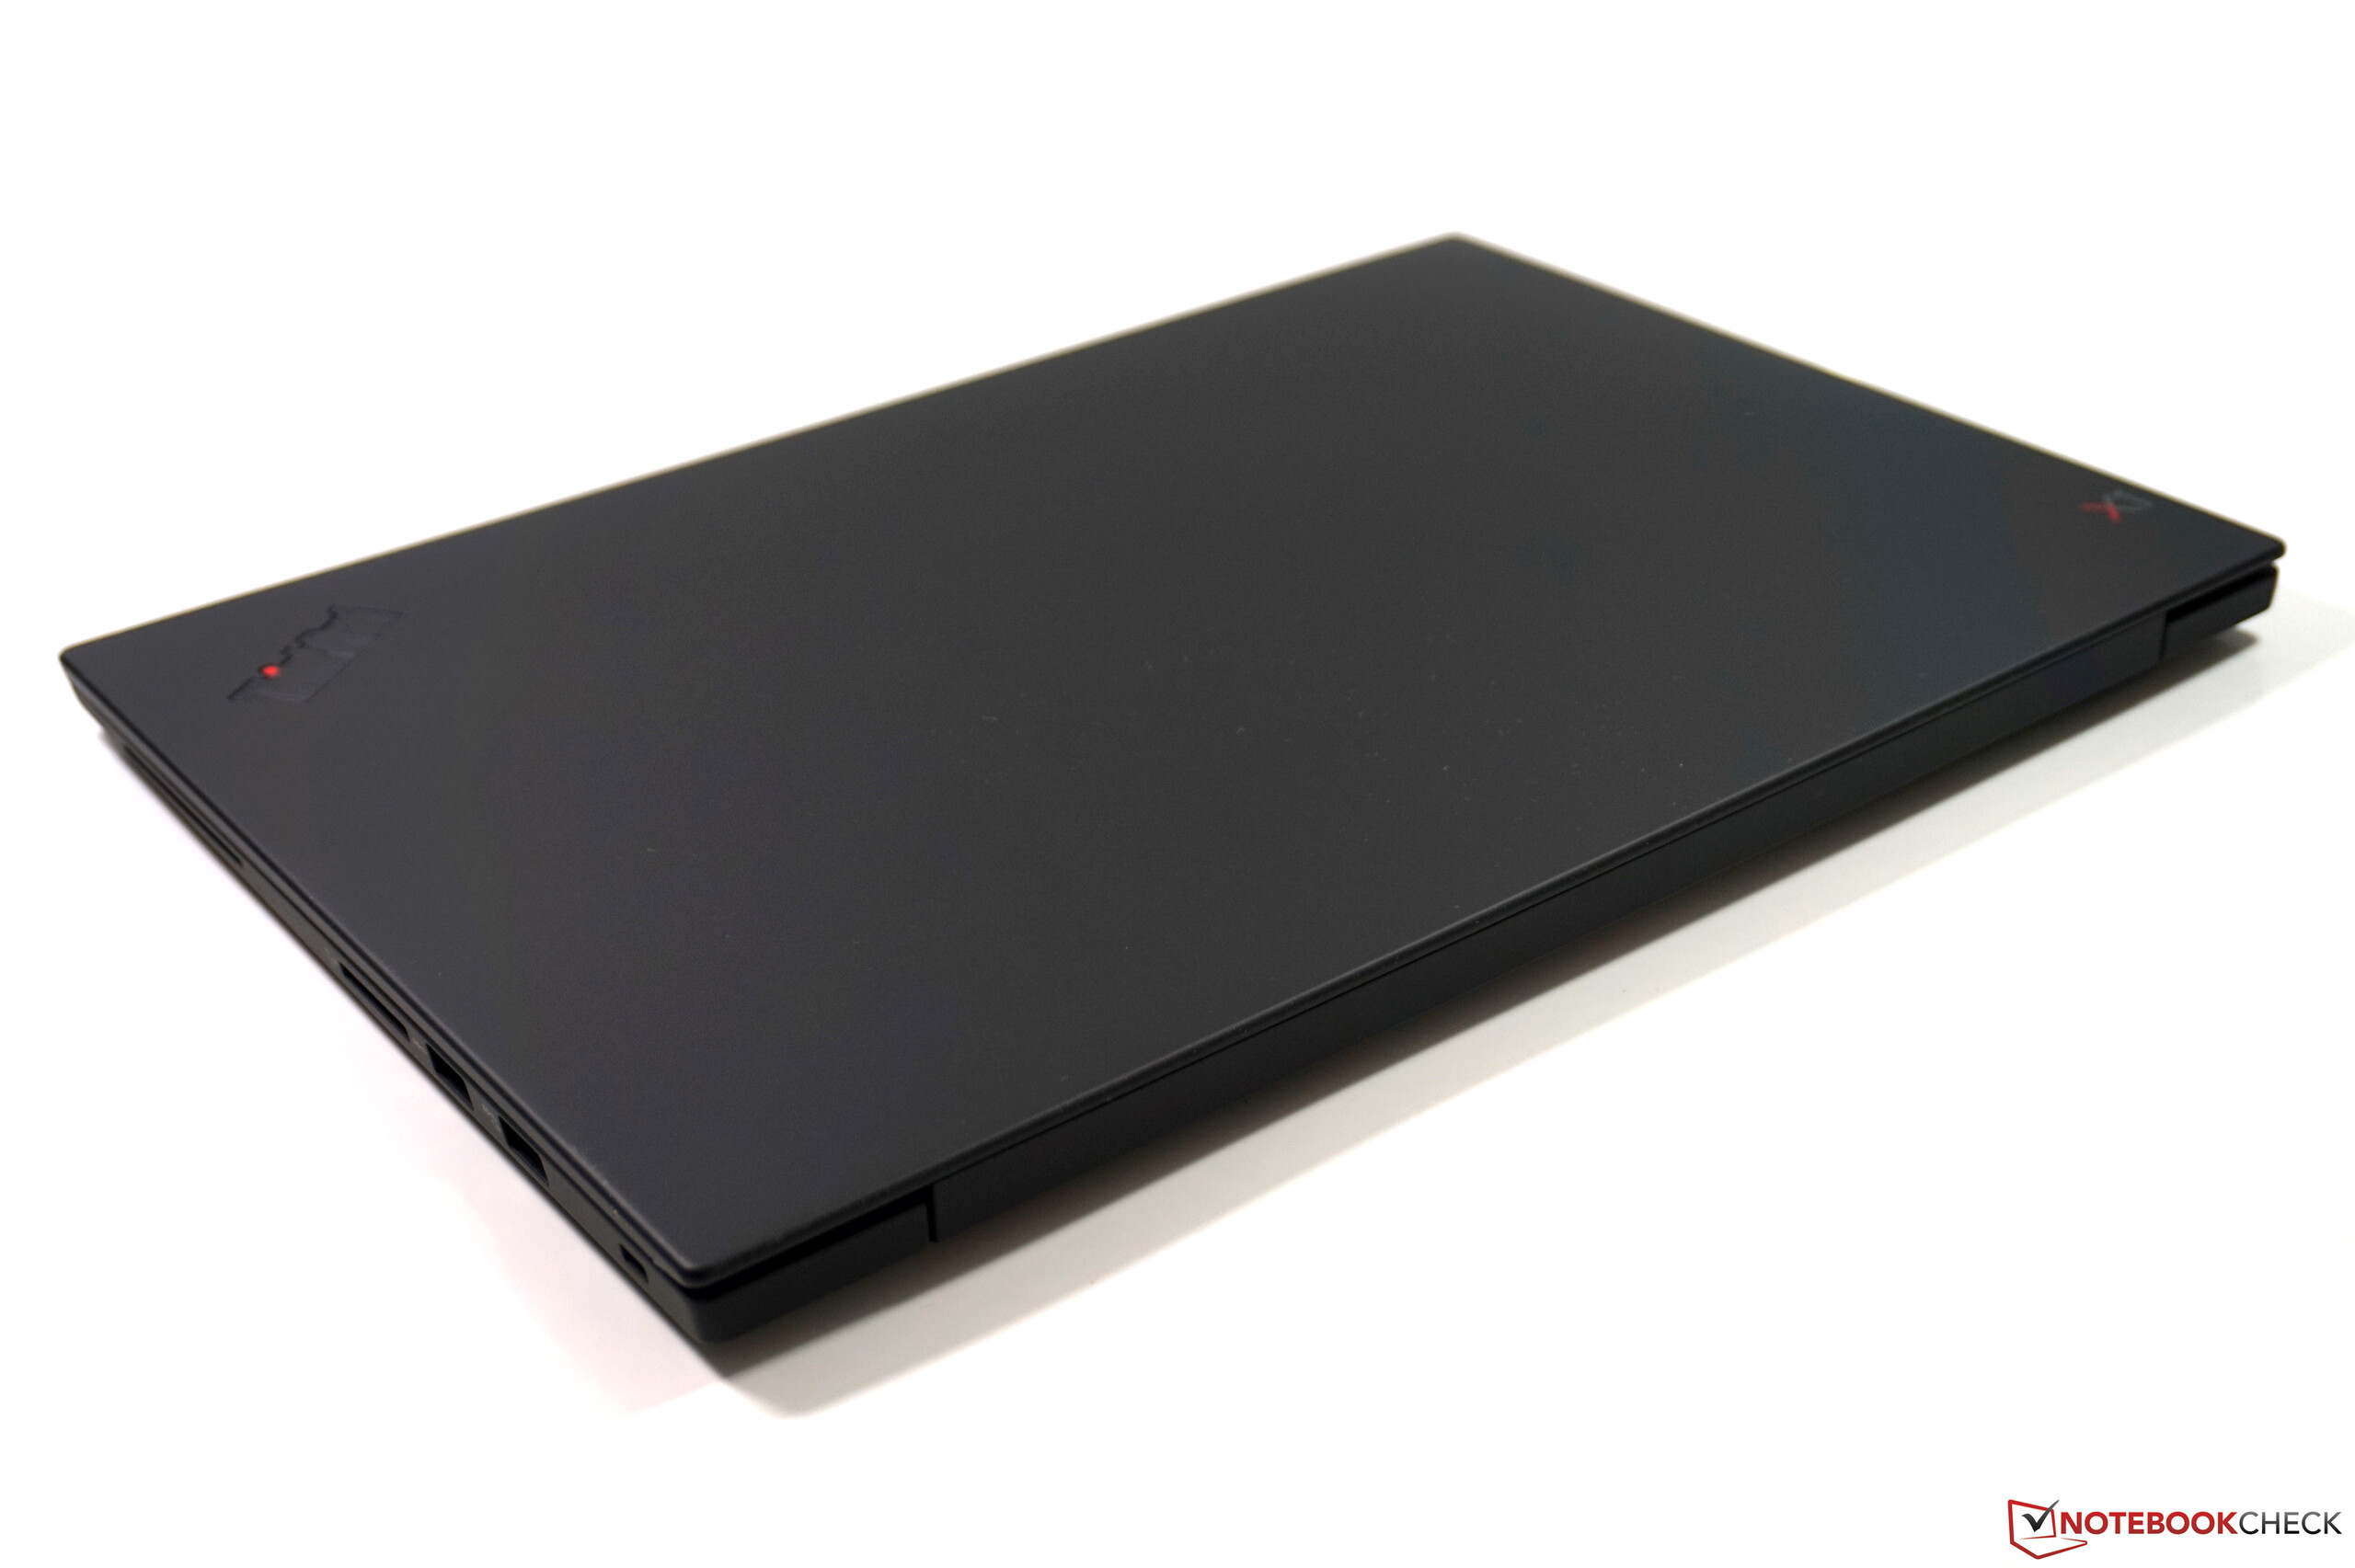
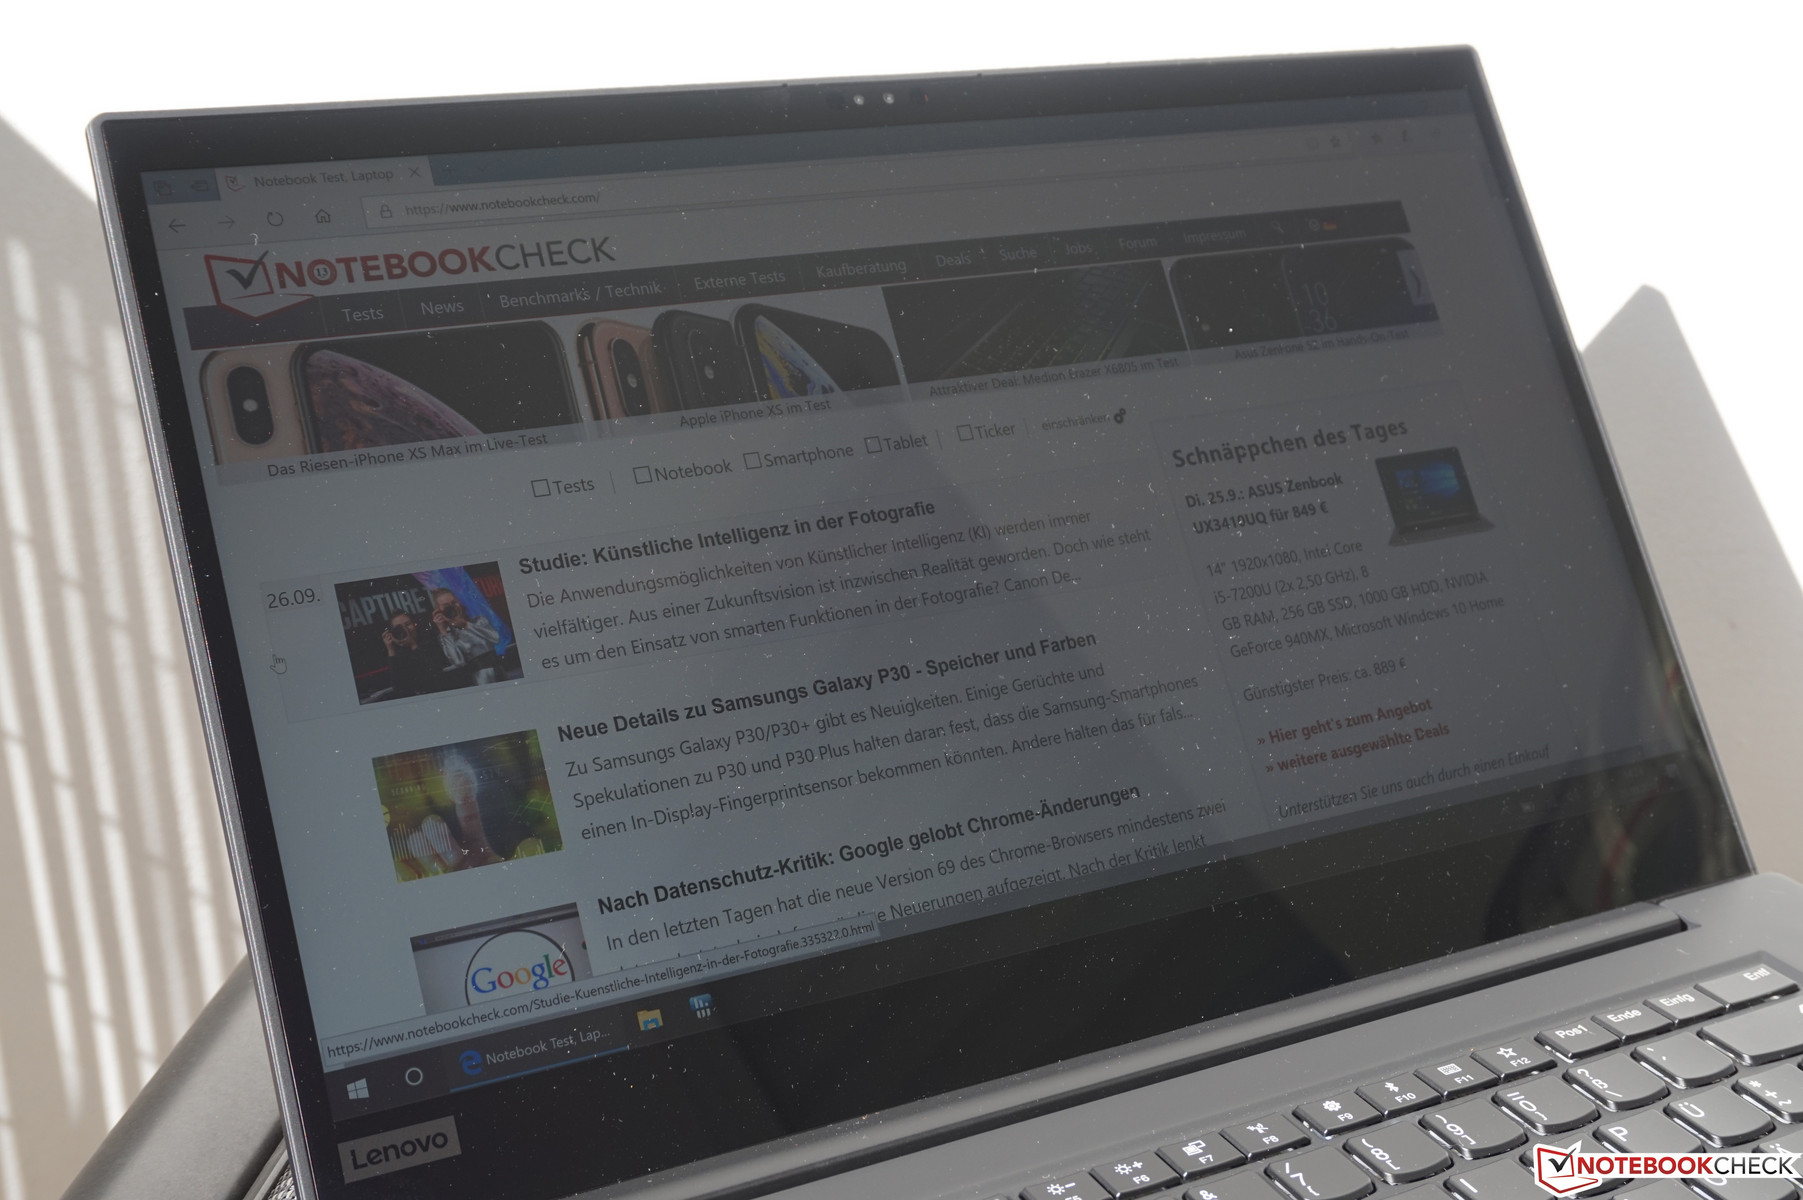
To briefly summarize, the case is constructed purely from aluminum alloy, apart from the CFRP/GFRP hybrid display lid, which in our previous unit exhibited some creaking when pressure was applied from the rear. Today’s review unit seems better in this regard, though pressure in the upper-left corner did elicit a single “pop” when we first attempted it. Overall, the case quality is very good, up to the standards of recent ThinkPad machines.
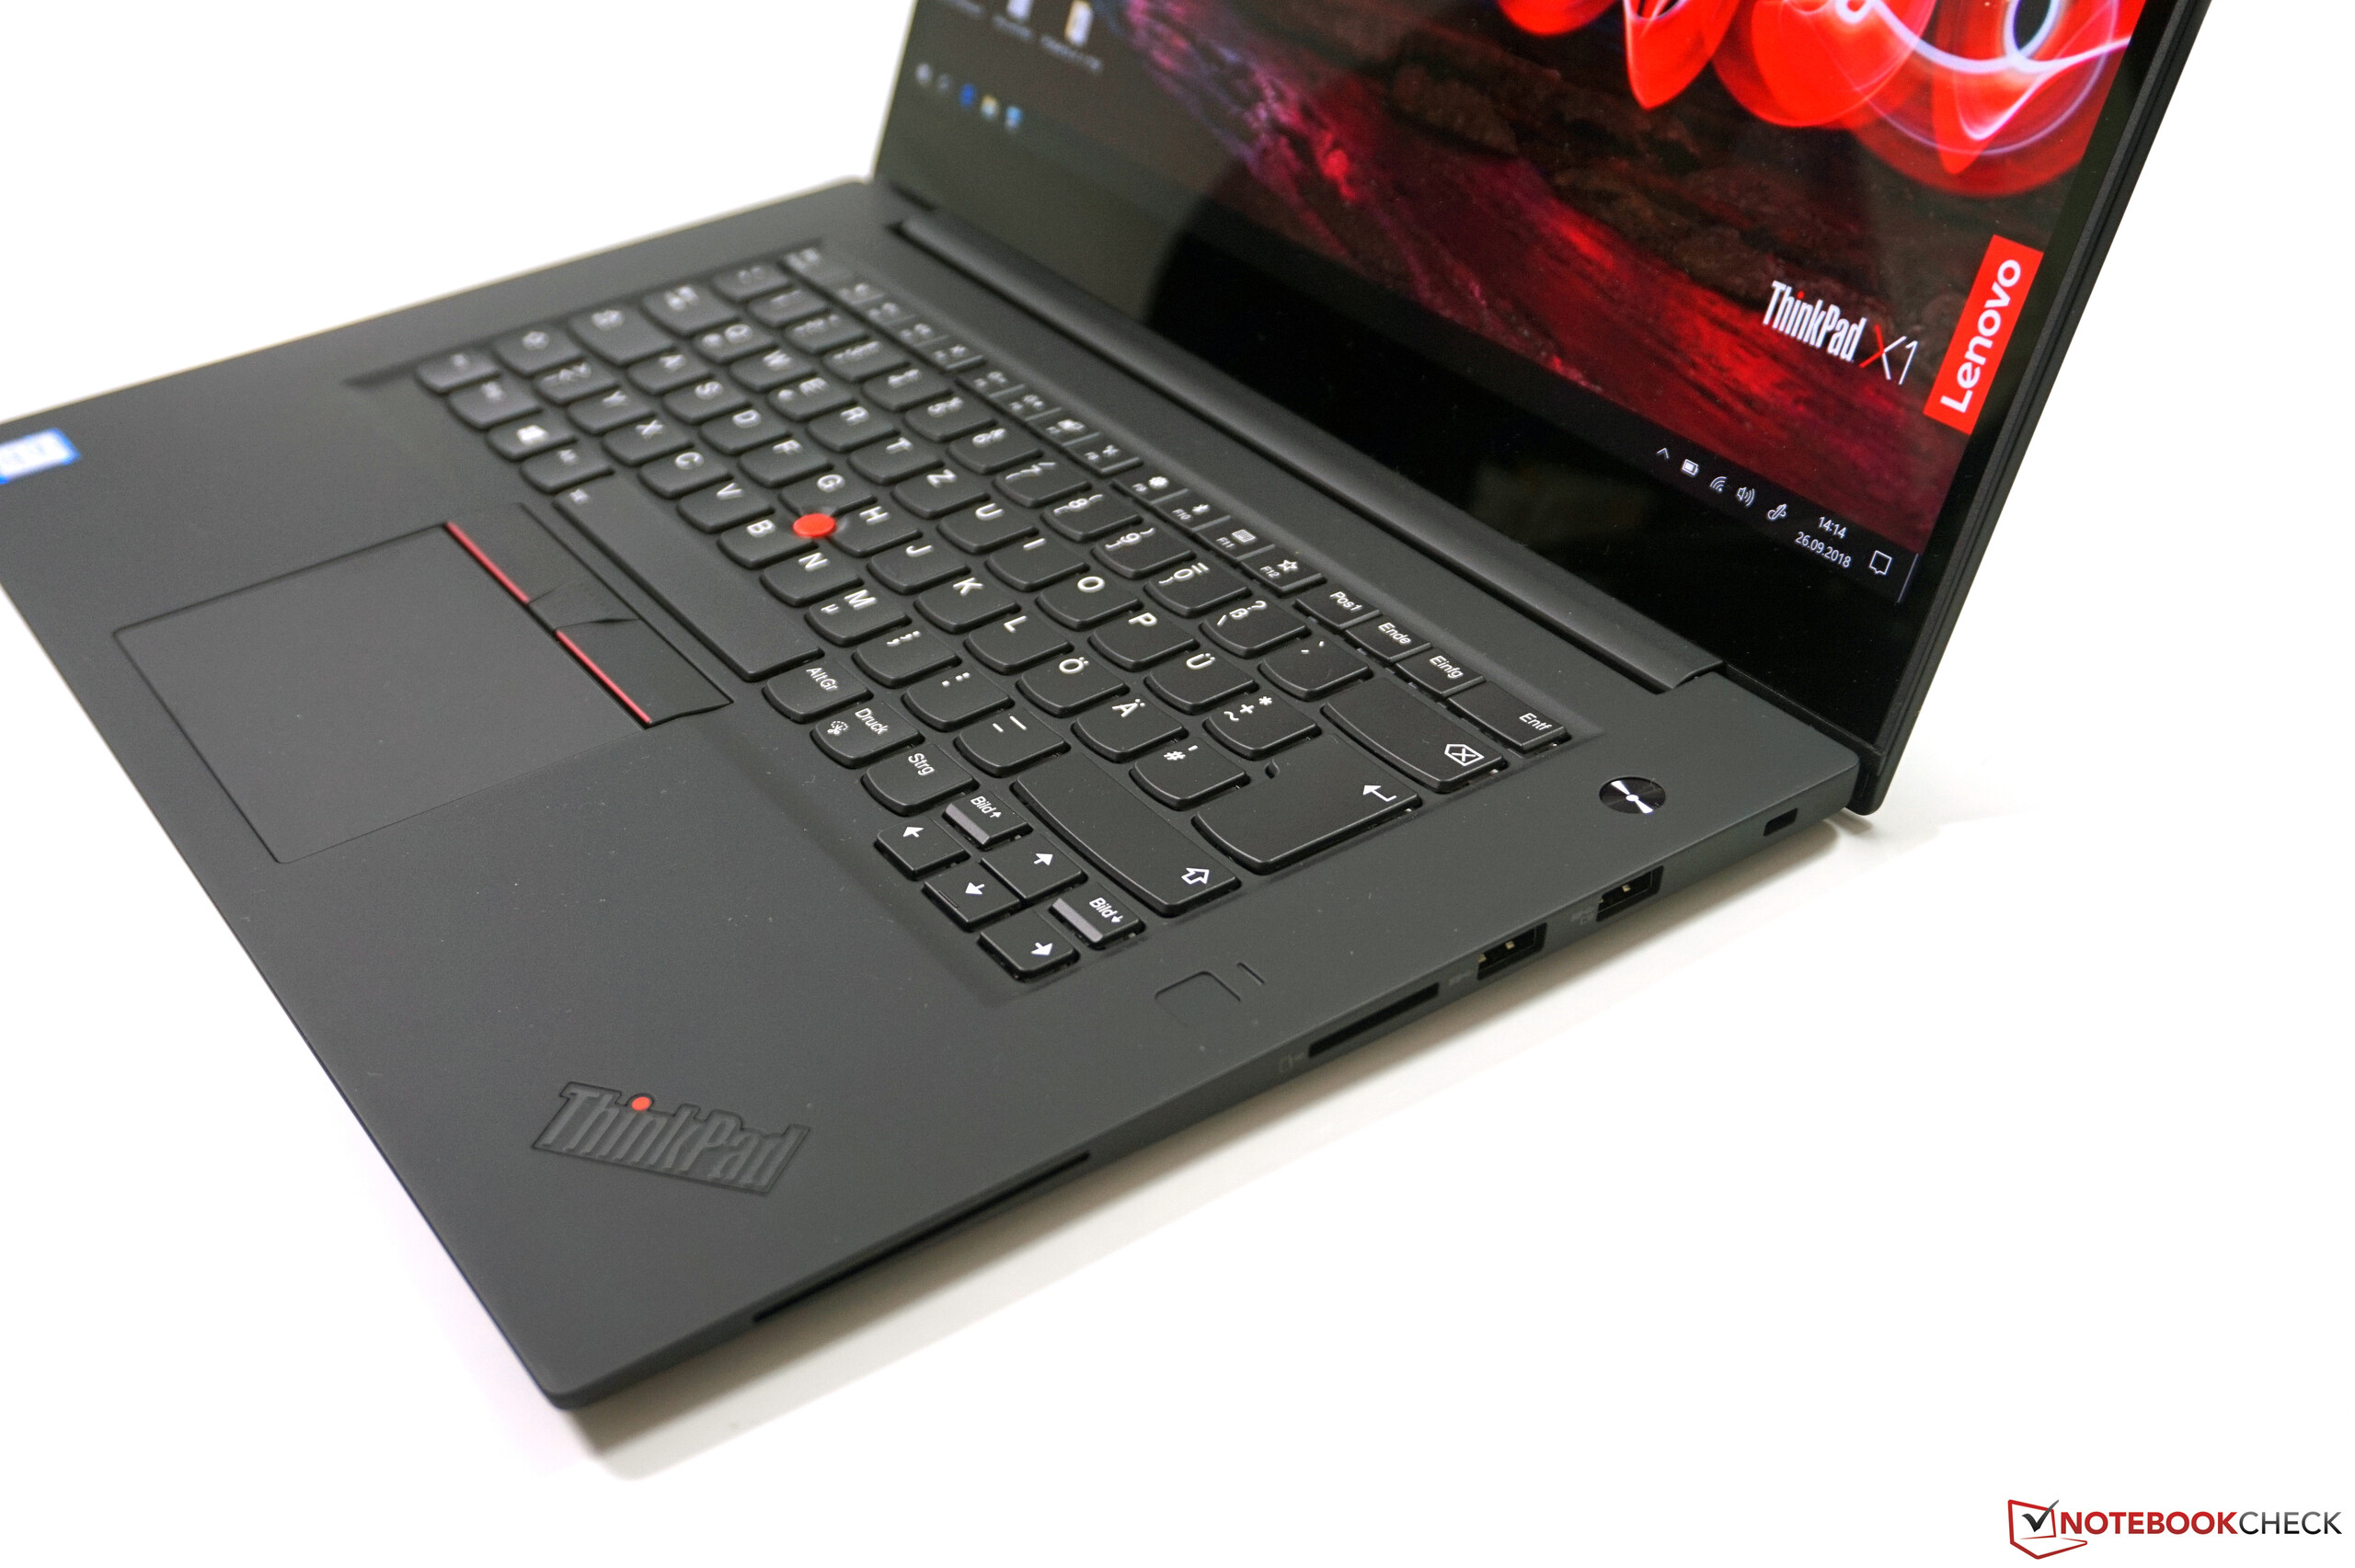
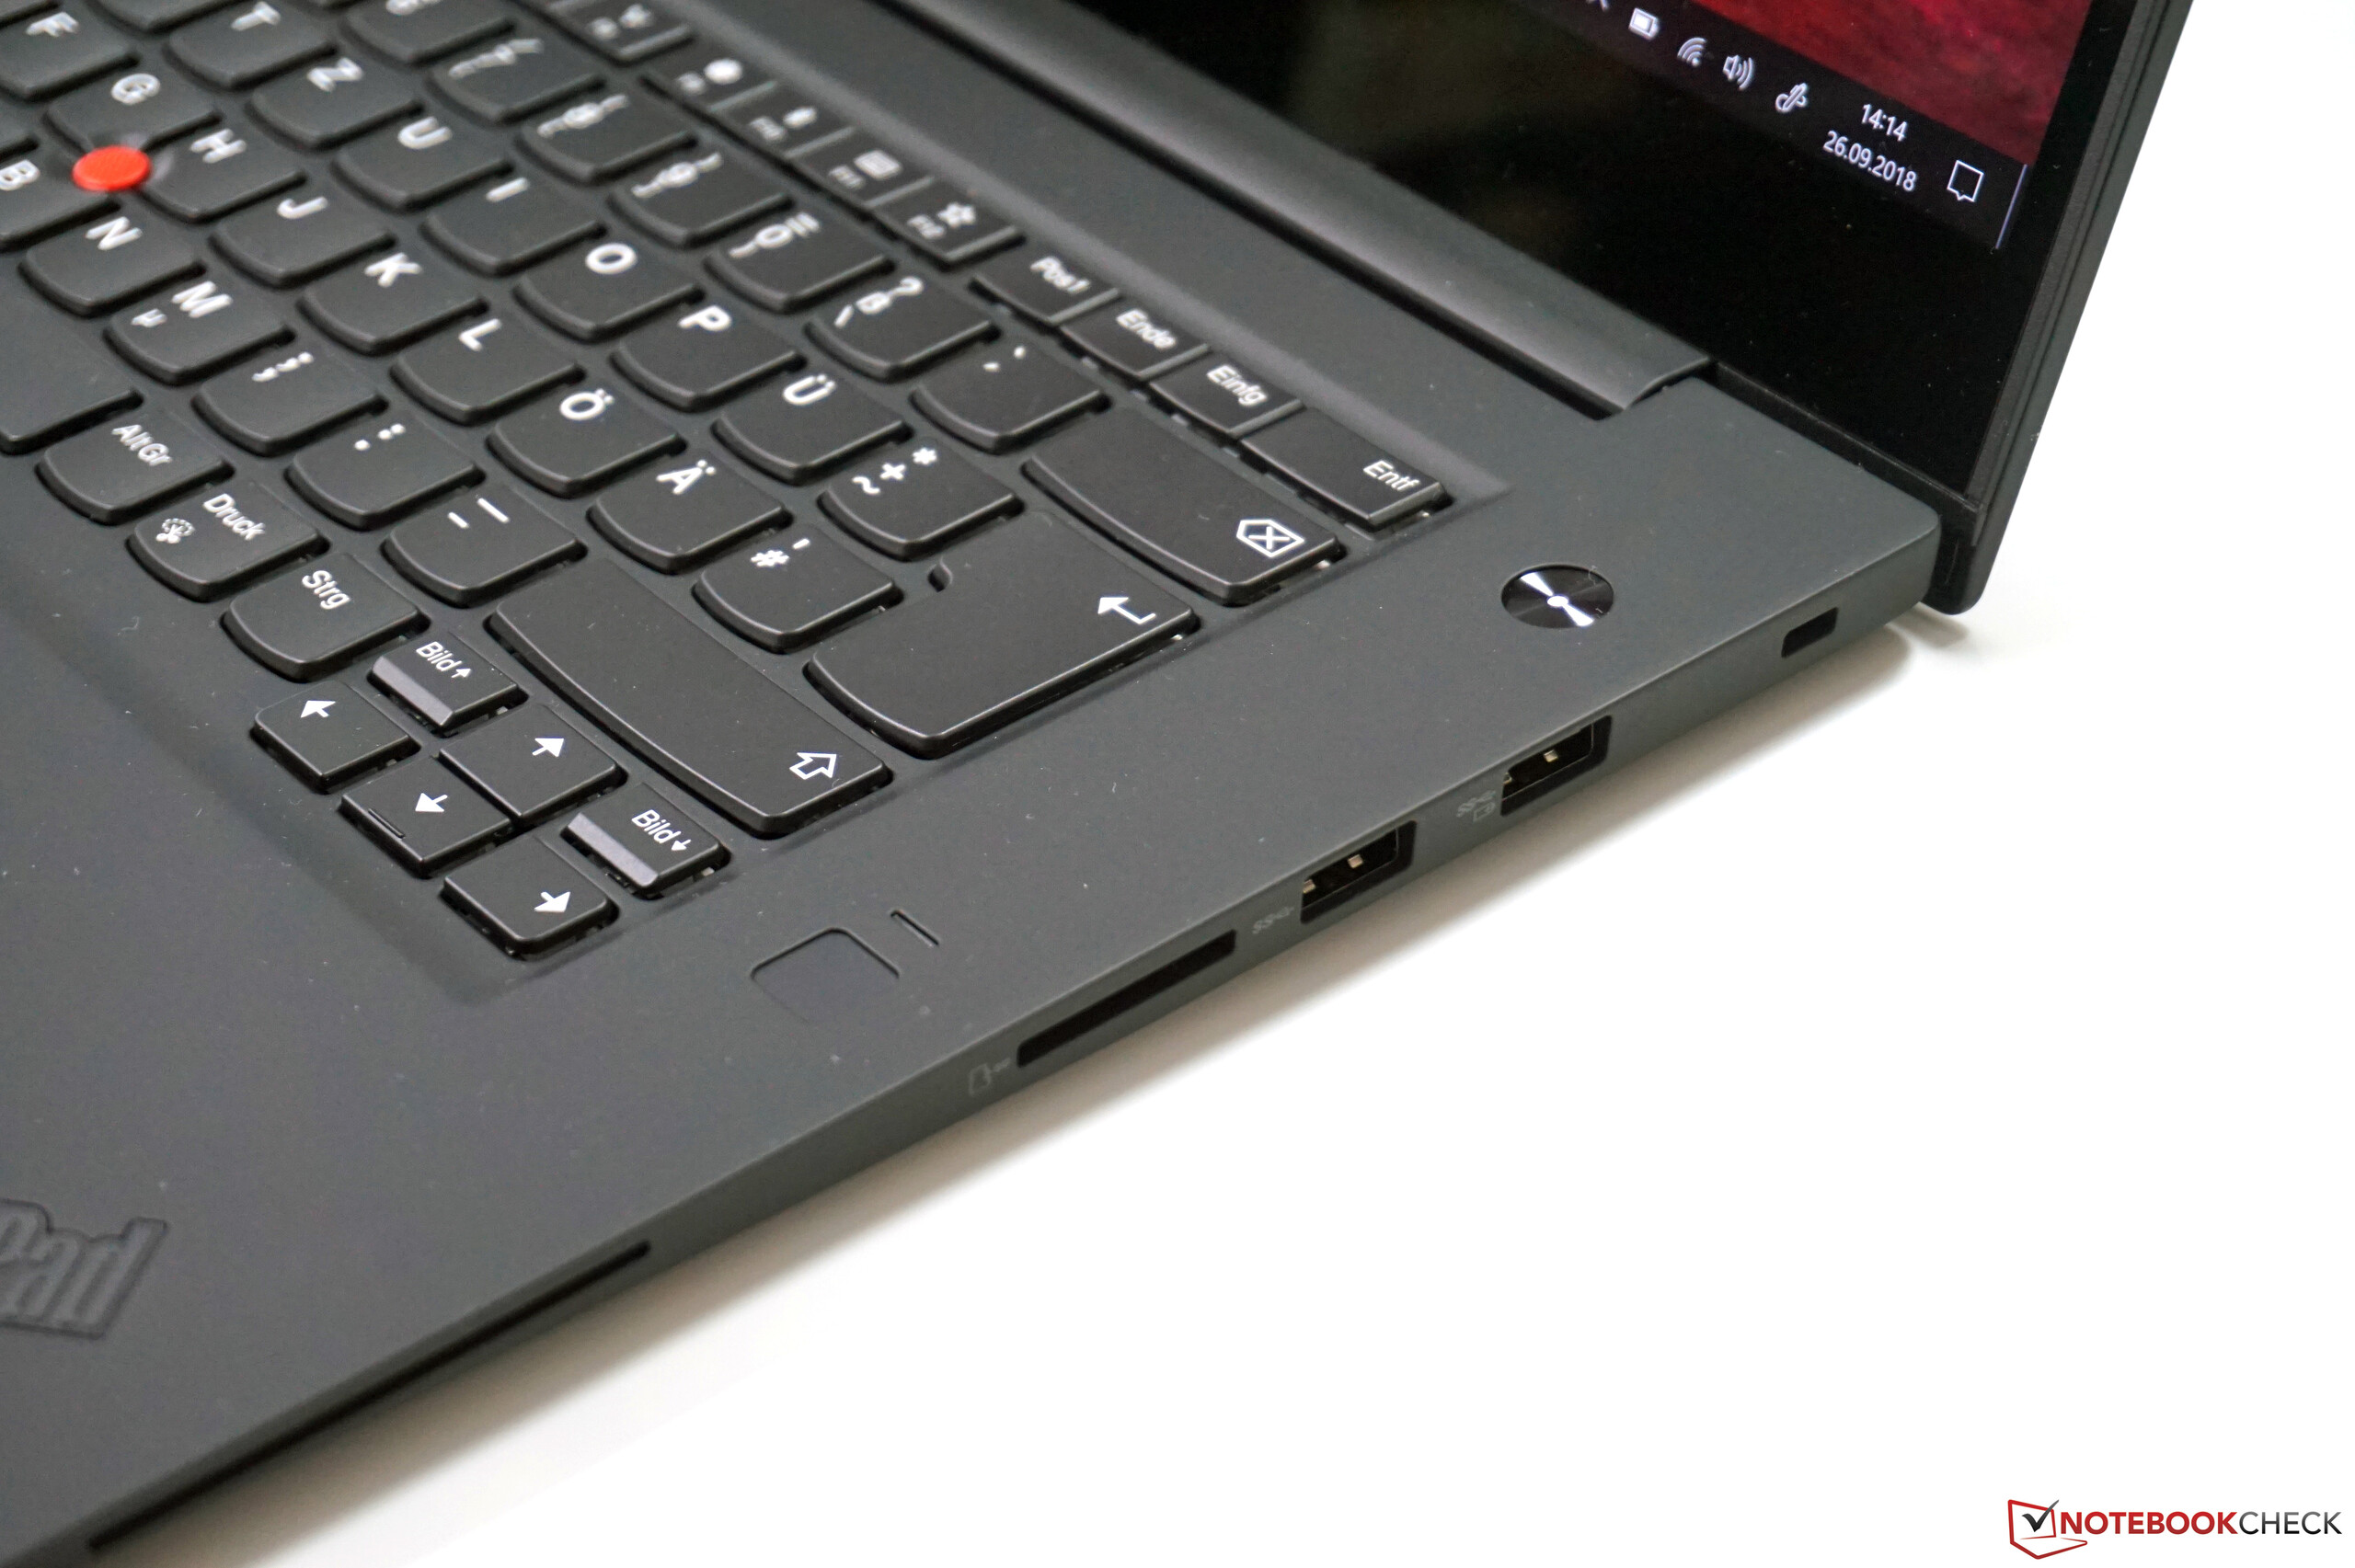
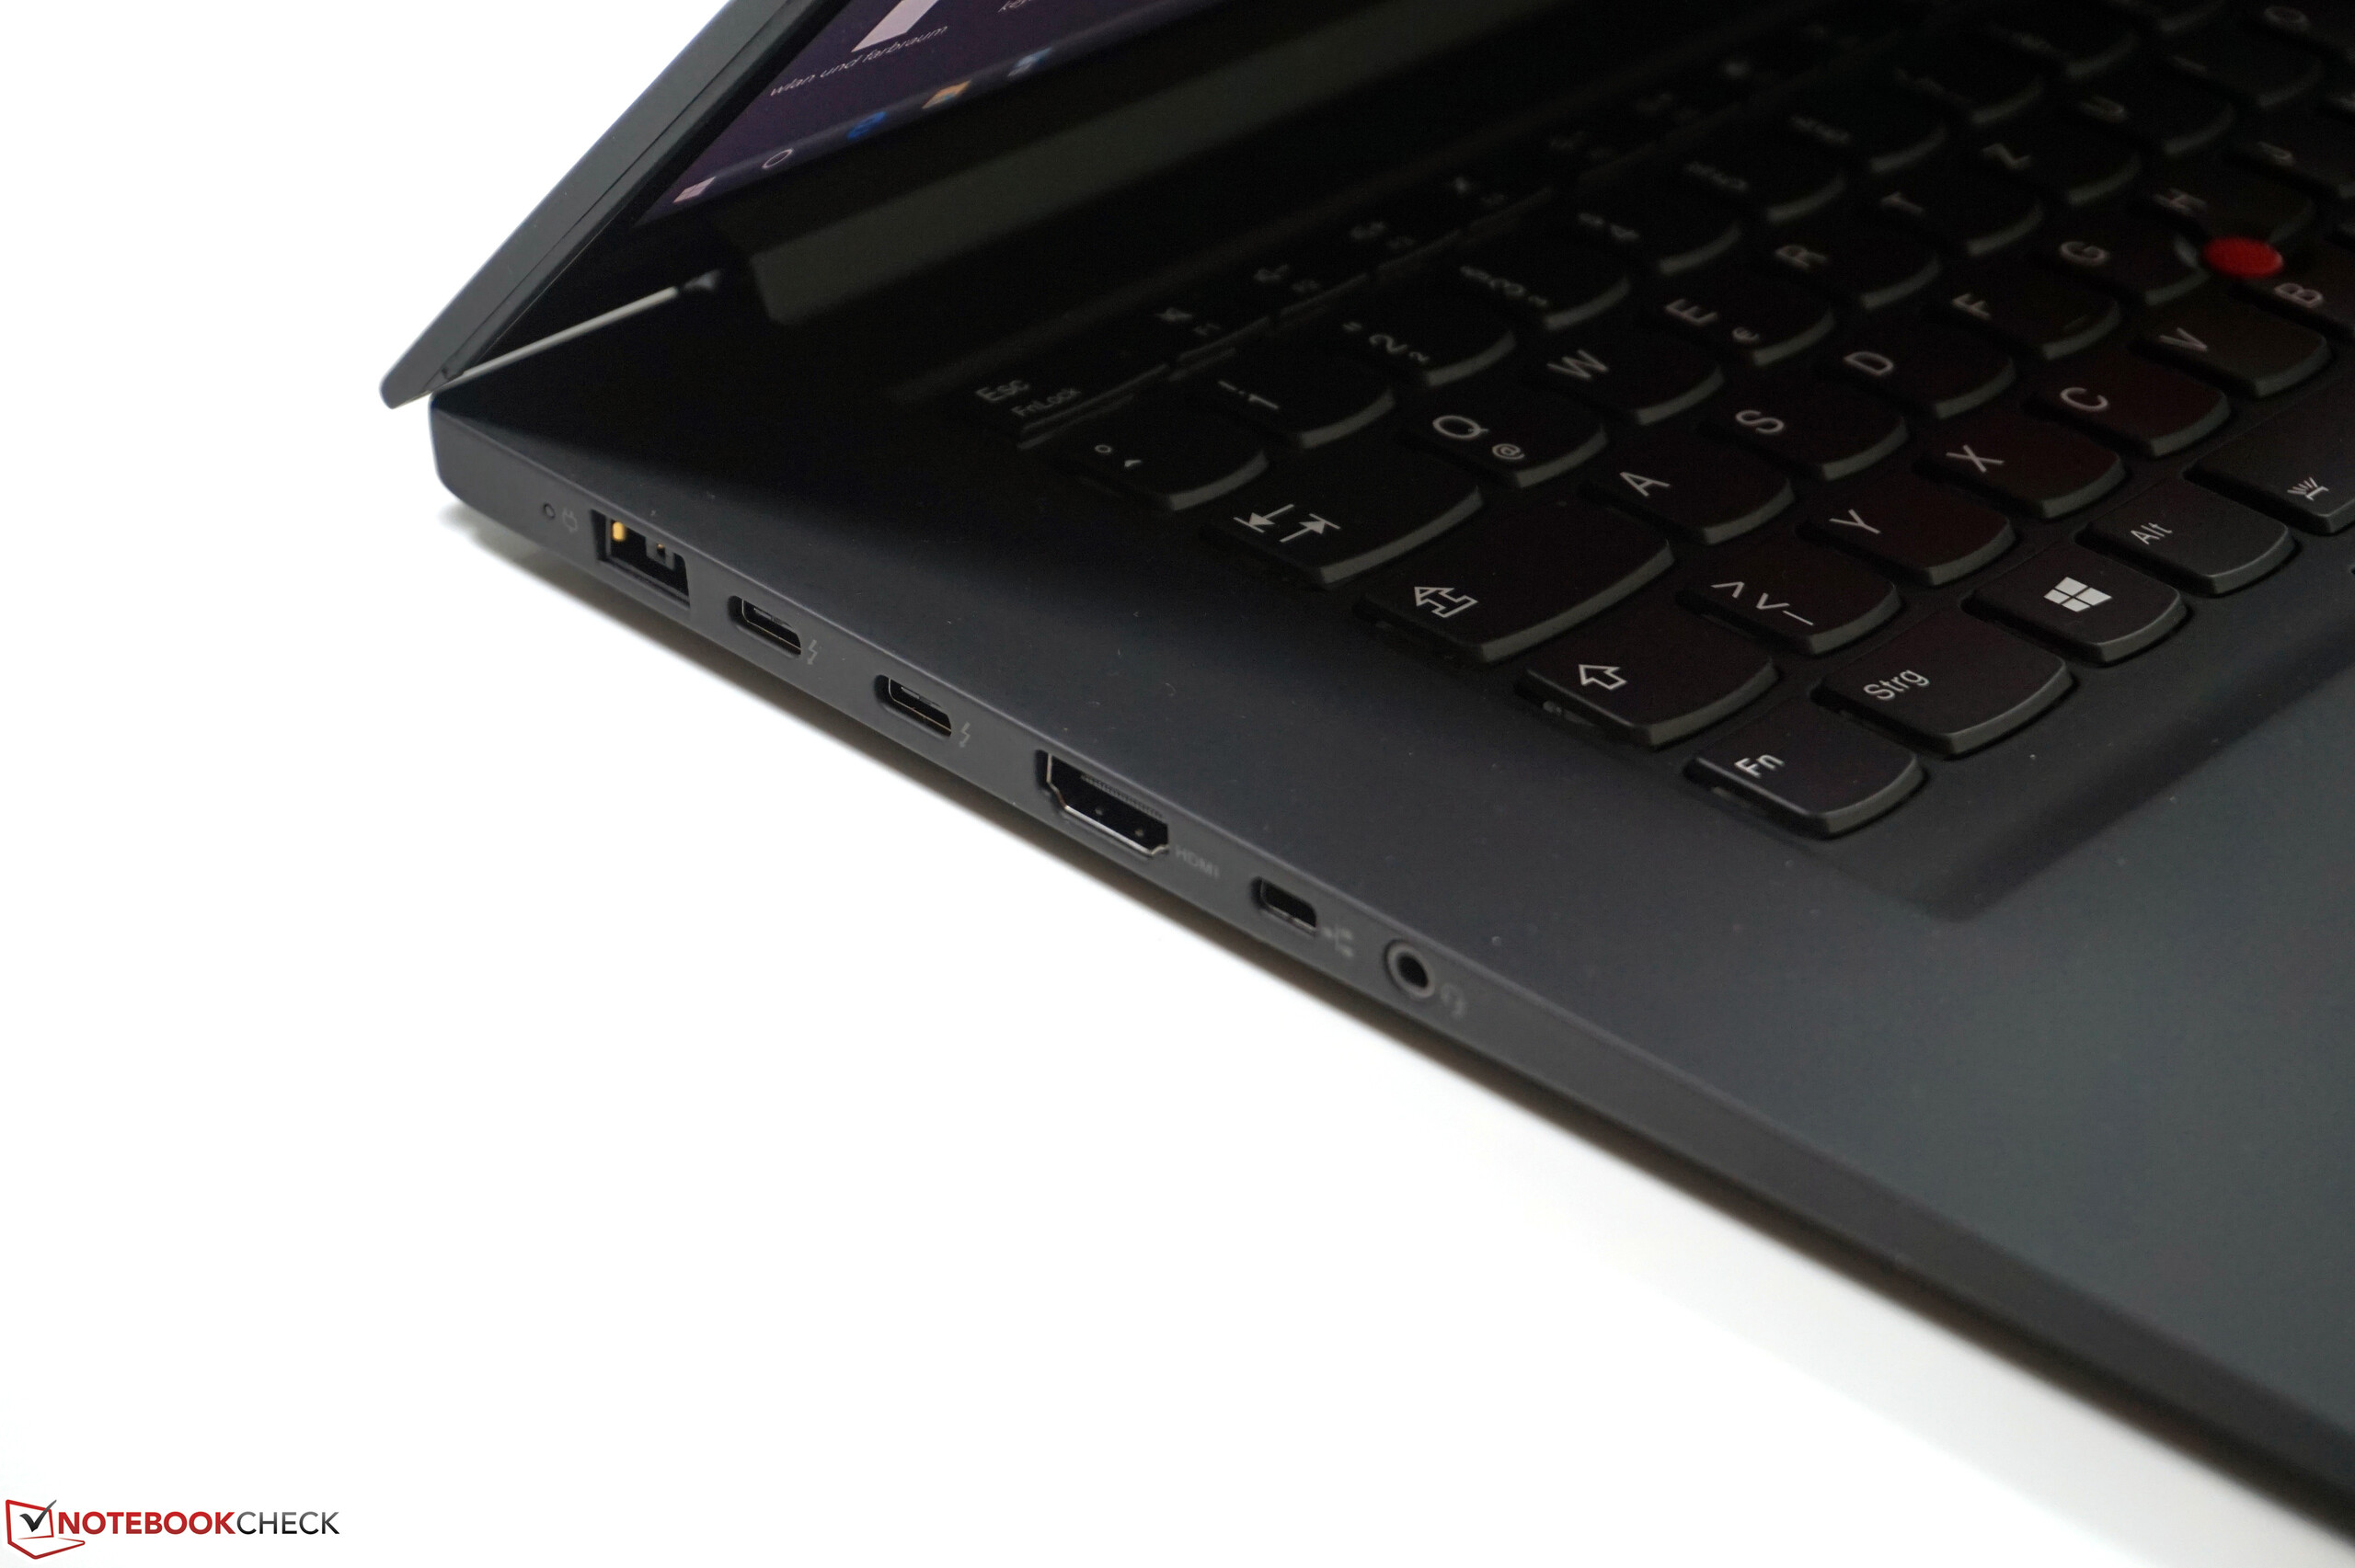
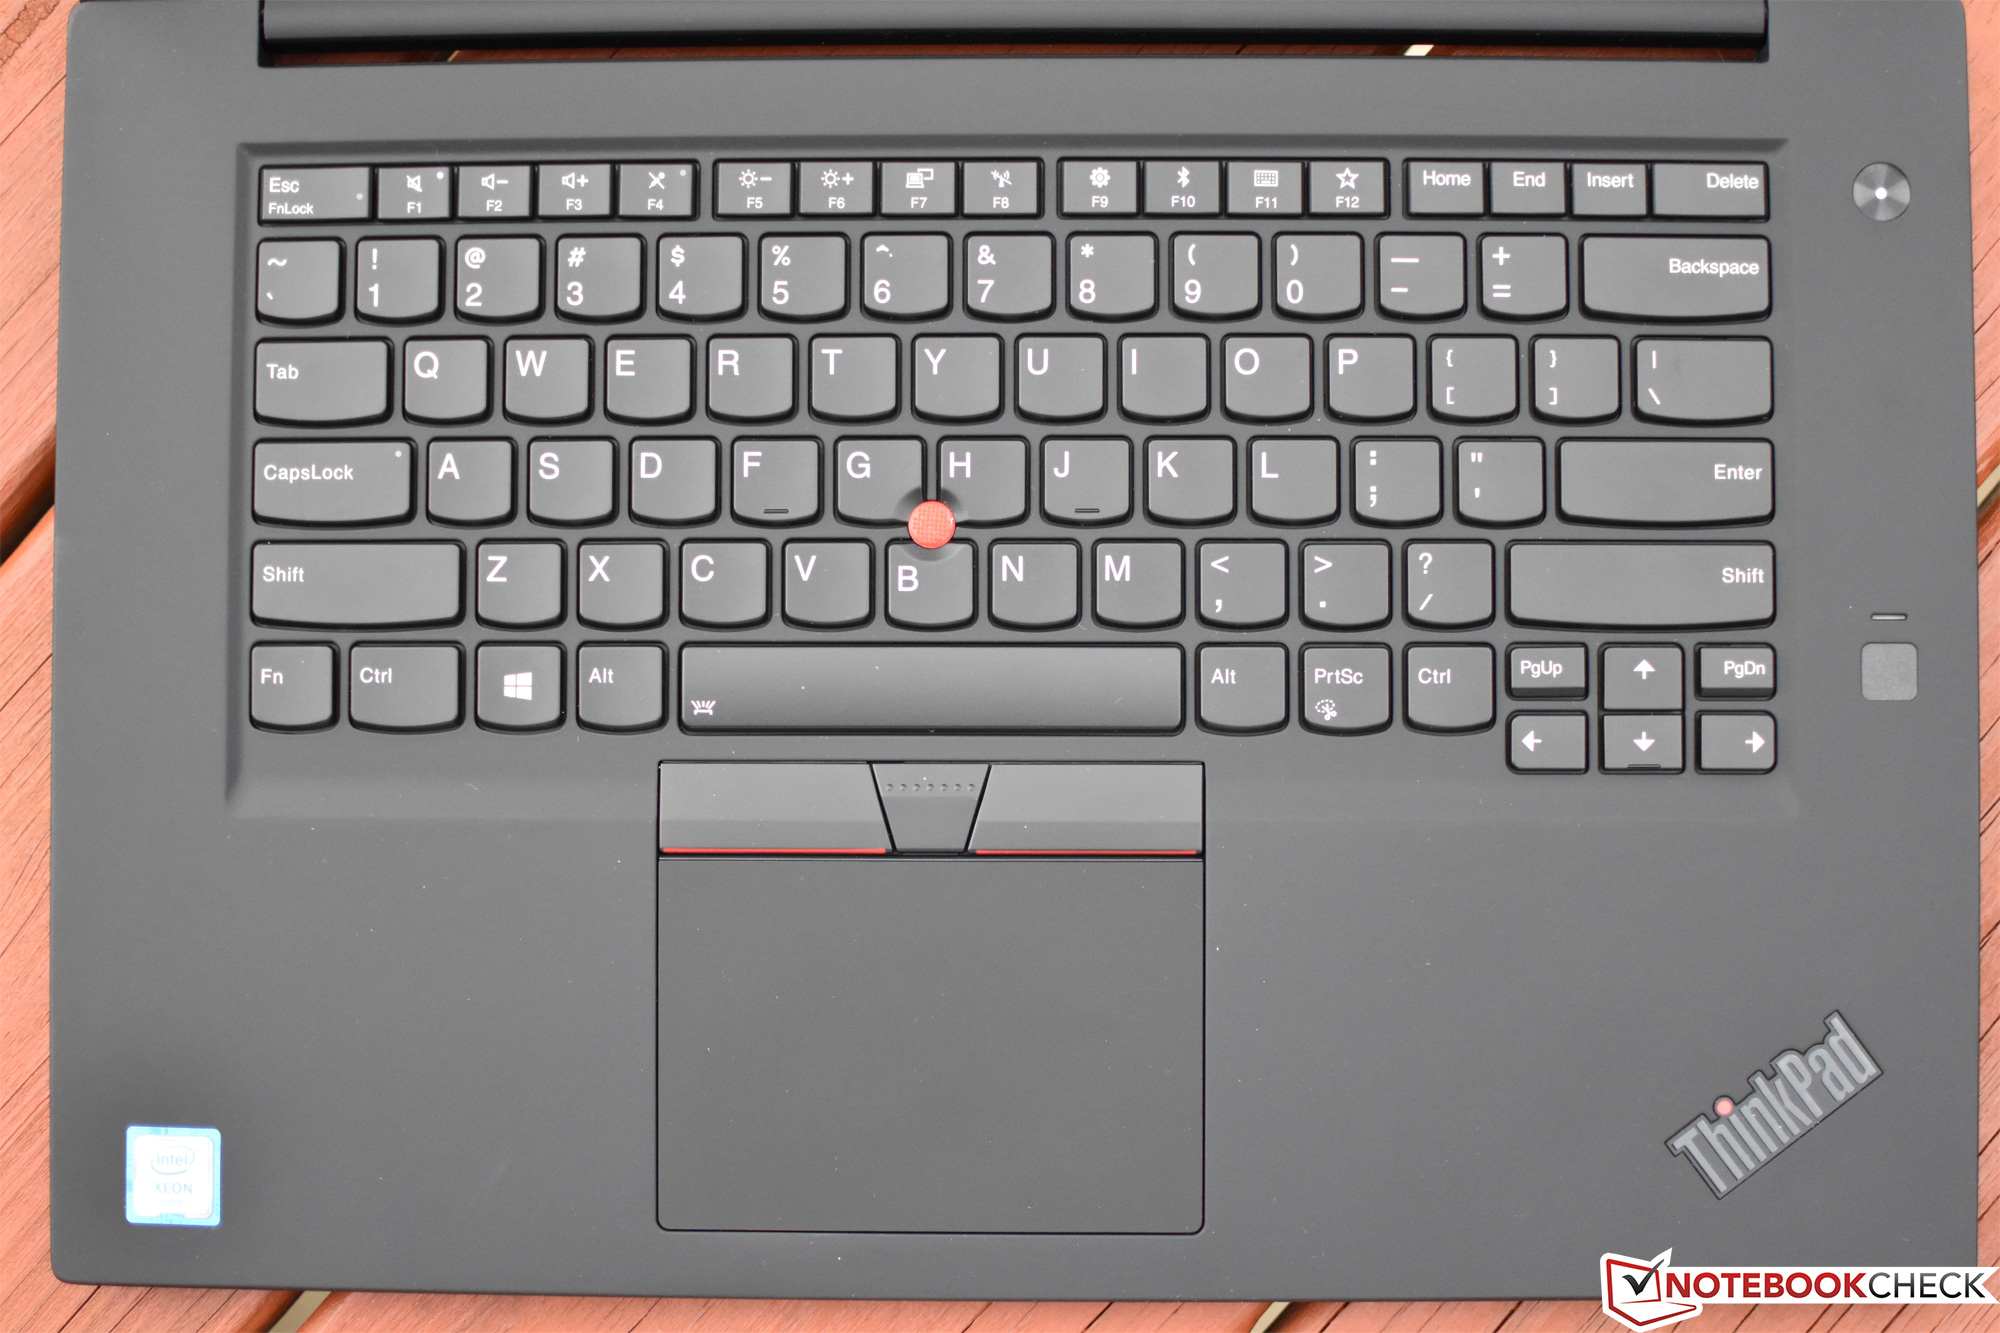
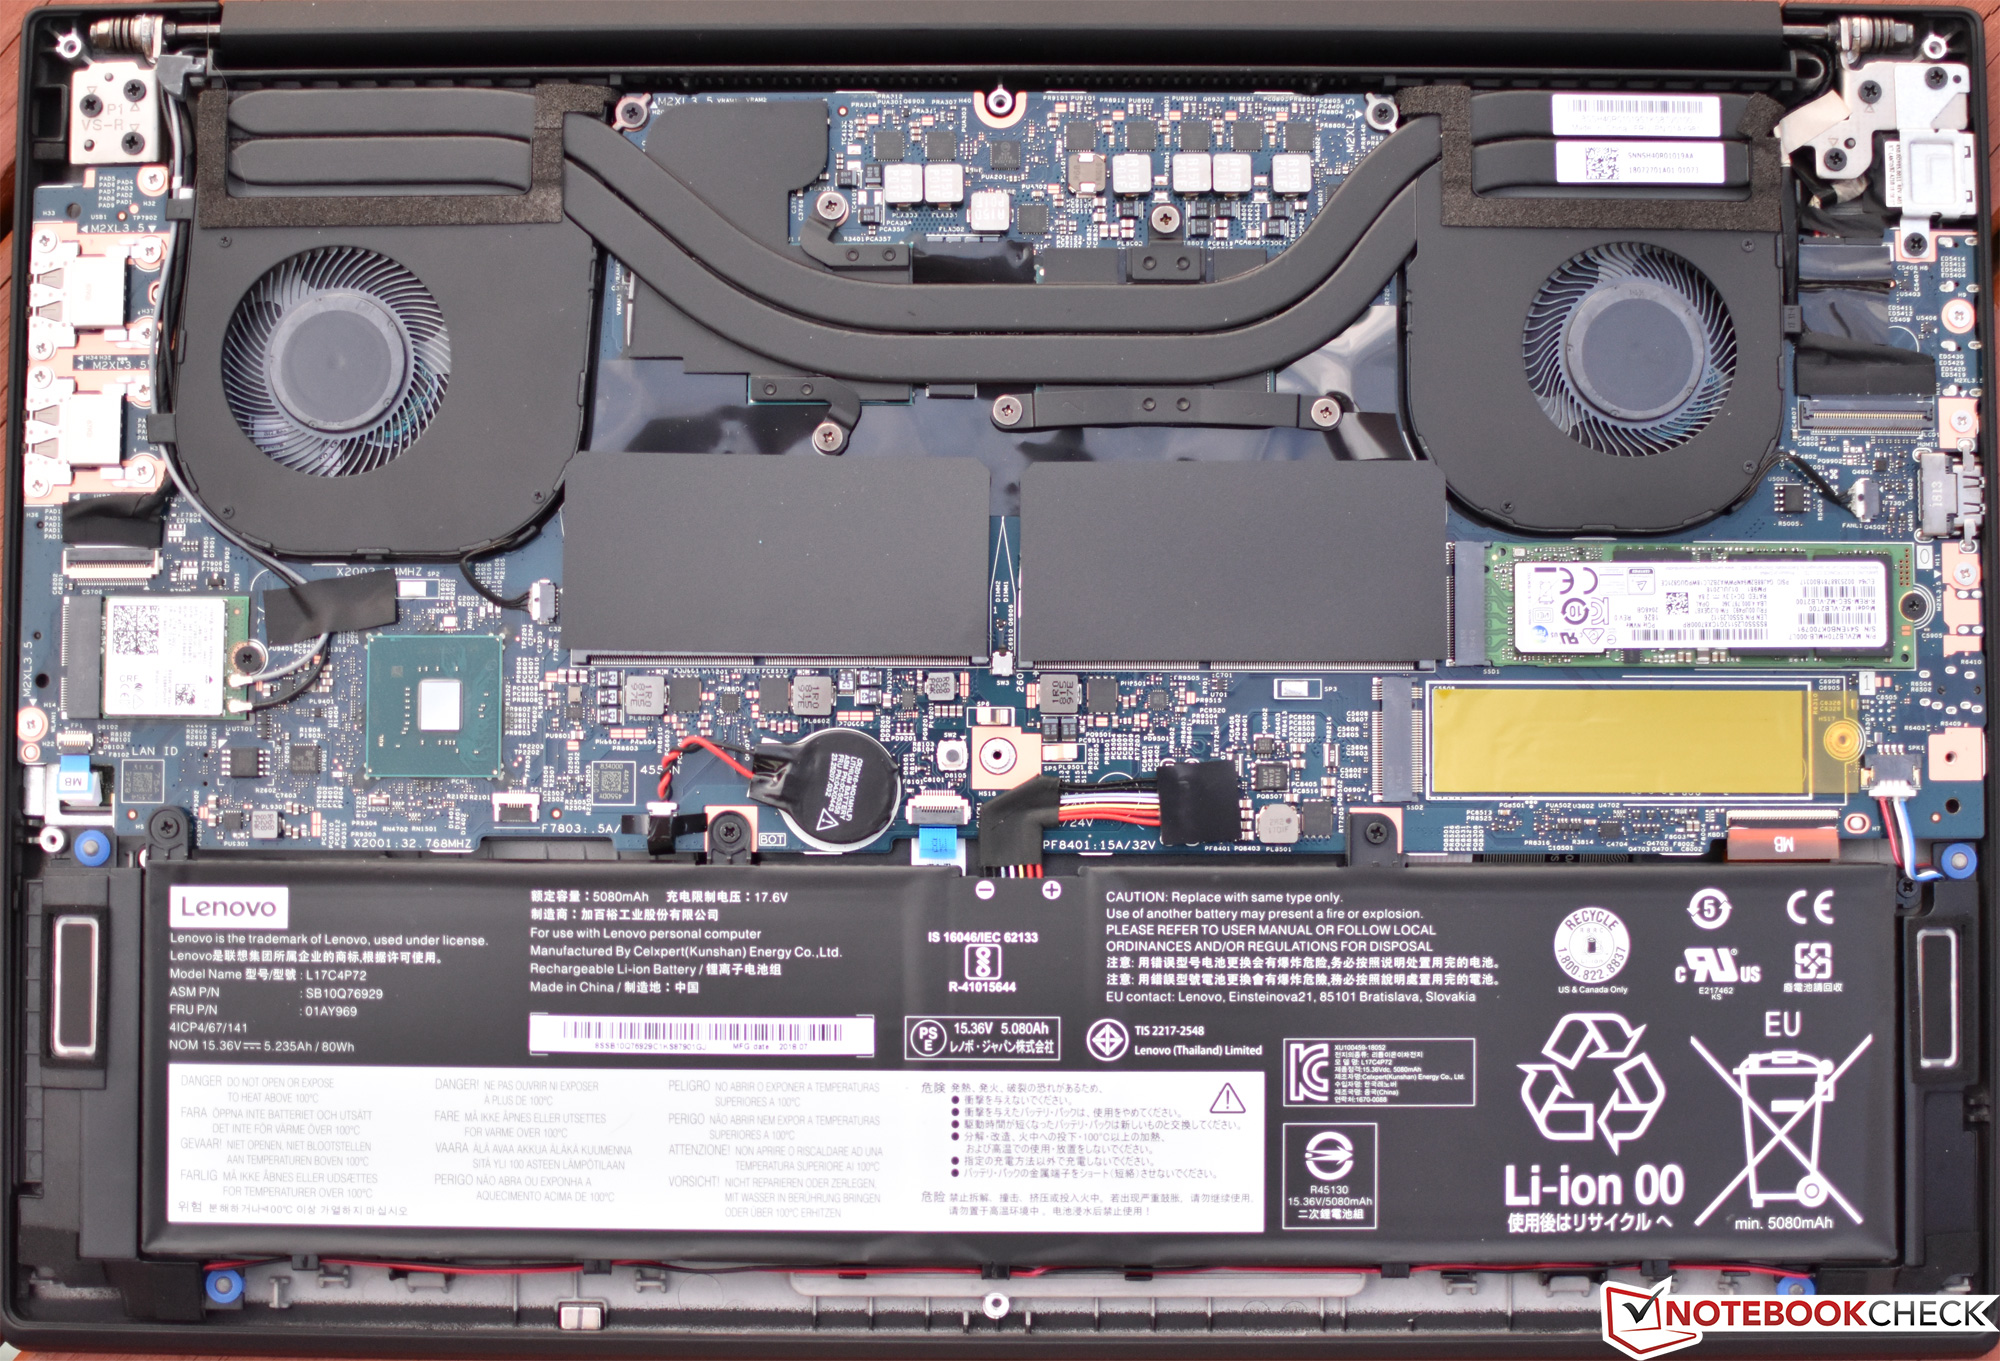
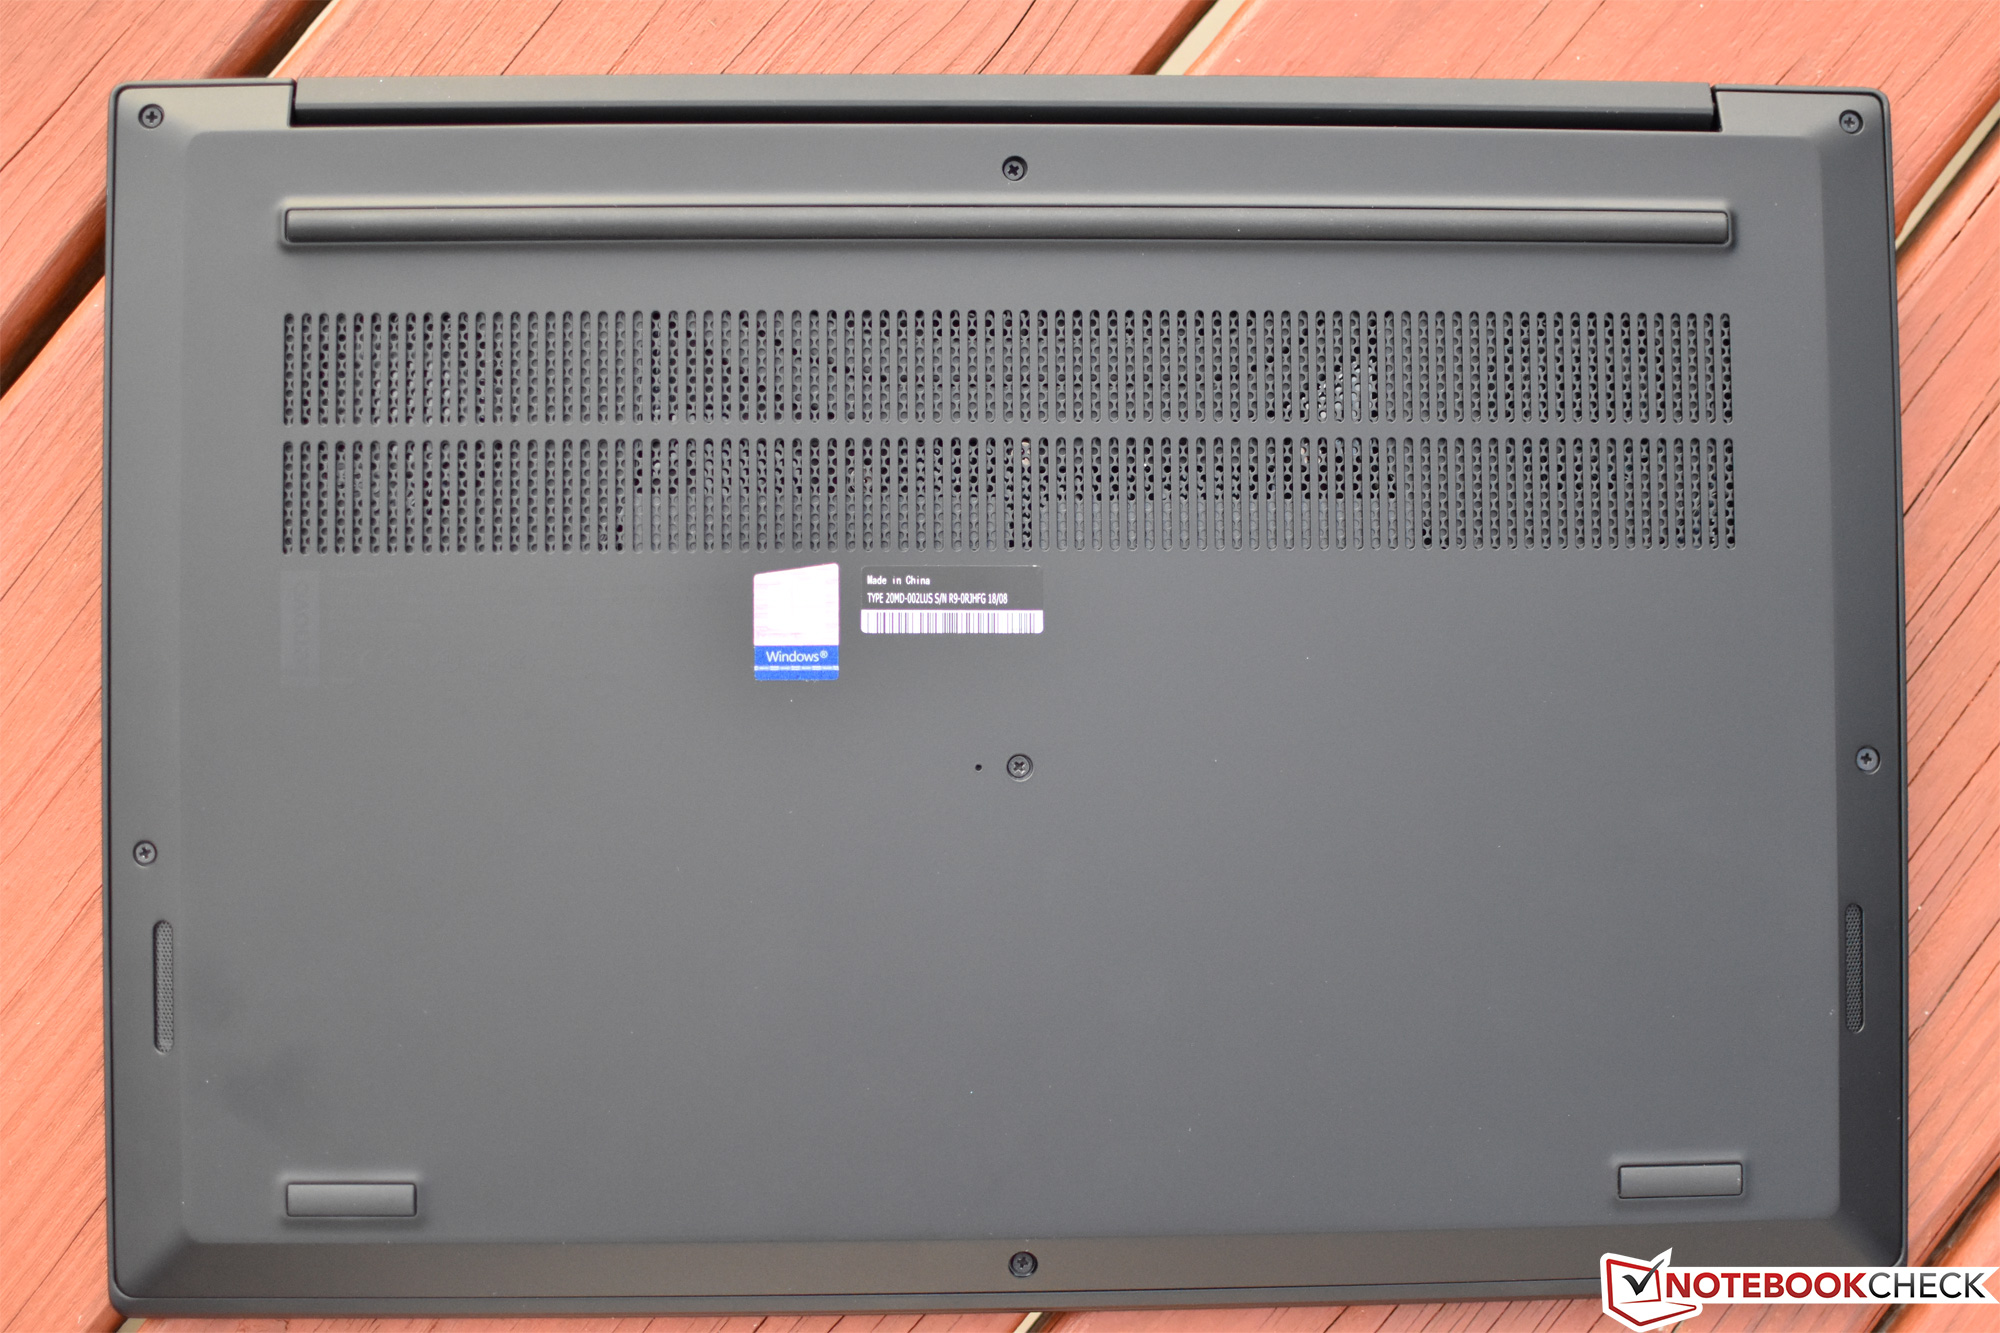
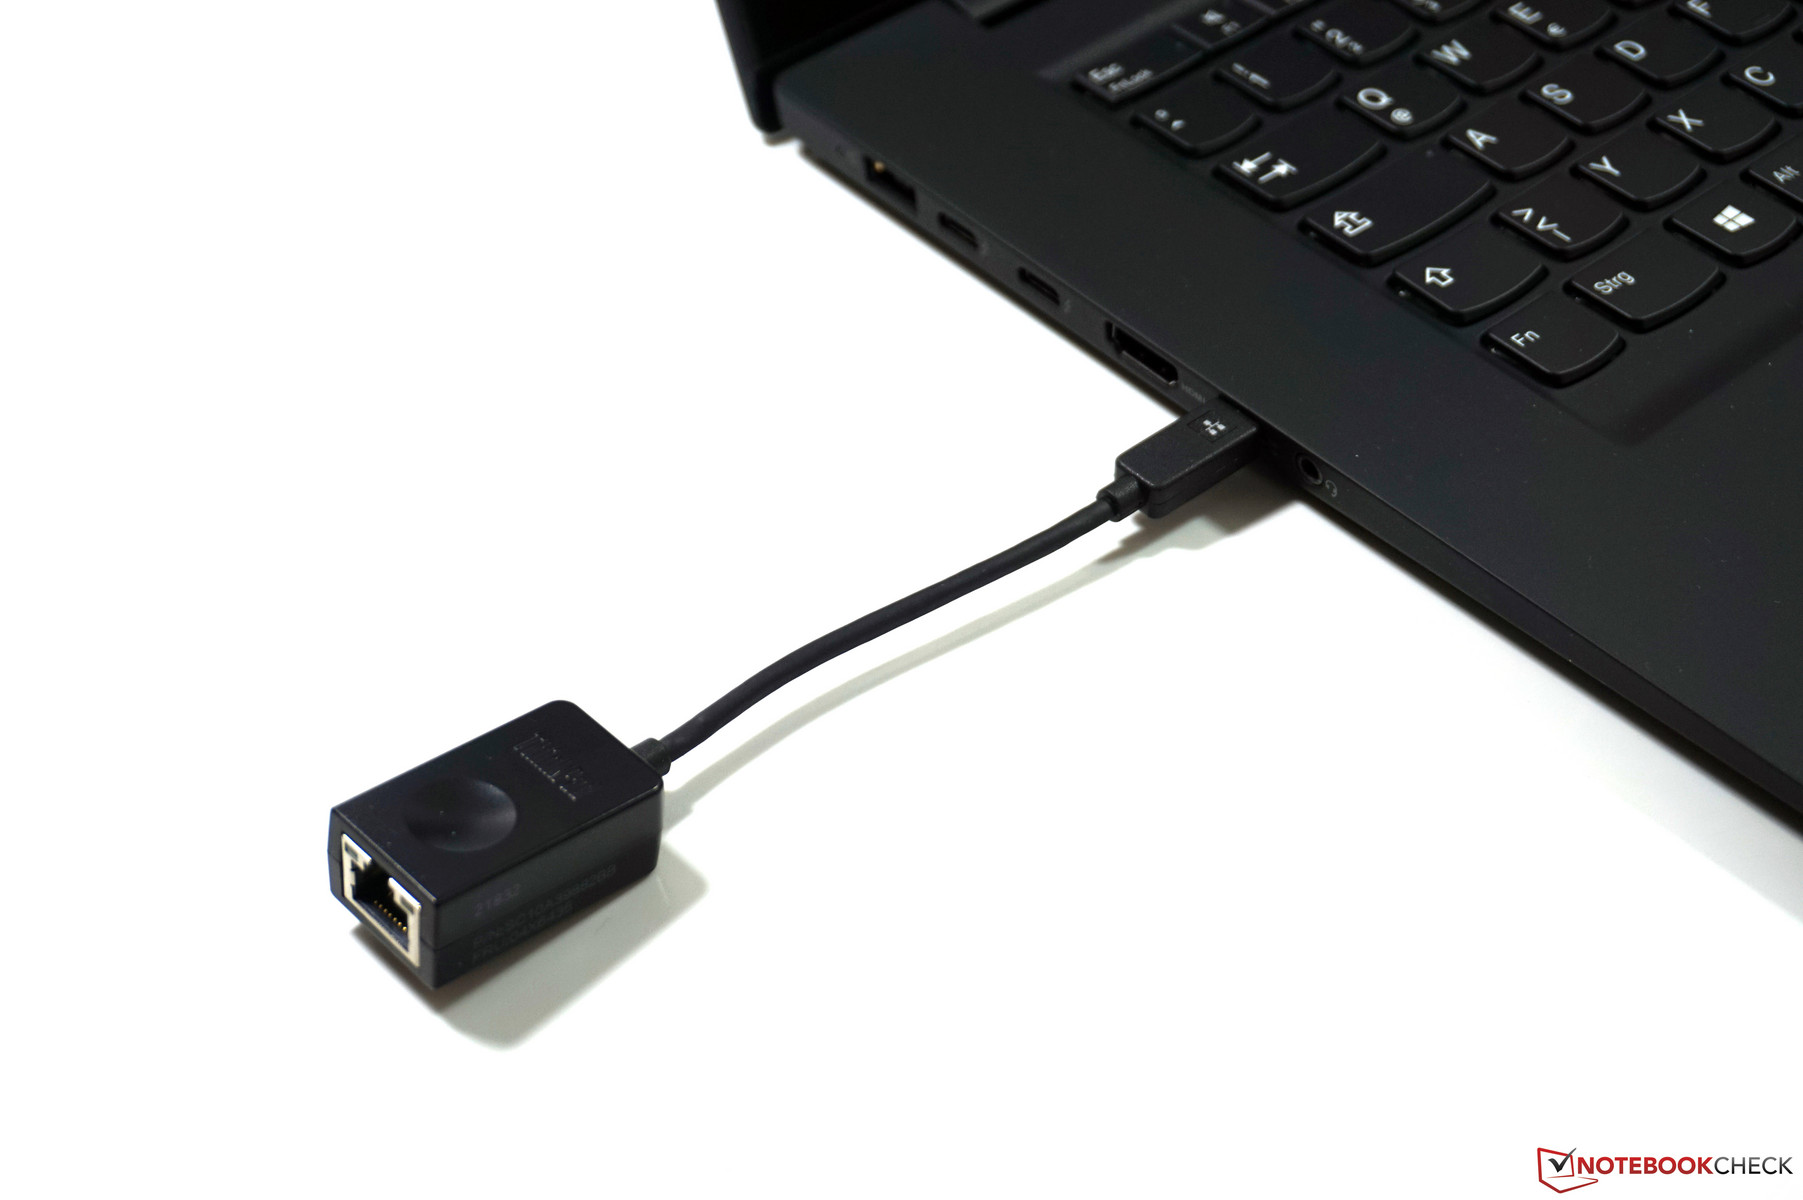
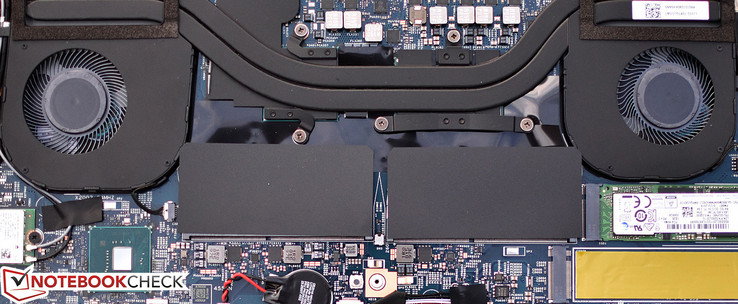
Port selection is quite good, with a comfortable mixture of old and modern ports and good organization. Card reader and networking test results are strong, though the WWAN slot is conspicuously absent. Security options such as TPM 2.0, a touch fingerprint scanner, and Kensington Lock port are all present (though our display SKU lacks the ThinkShutter webcam cover). Finally, maintenance is a cinch, with all FRUs accessible beneath the bottom cover, which is easily removed with a Phillips-head screwdriver.
| SD Card Reader | |
| average JPG Copy Test (av. of 3 runs) | |
| Lenovo ThinkPad X1 Carbon 2018-20KGS03900 (Toshiba Exceria Pro M501) | |
| Lenovo ThinkPad X1 Extreme-20MF000XGE (Toshiba Exceria Pro SDXC 64 GB UHS-II) | |
| Lenovo ThinkPad P1-20MD002LUS (Toshiba Exceria Pro SDXC 64 GB UHS-II) | |
| Dell Precision 5530 Xeon E-2176M (Toshiba Exceria Pro SDXC 64 GB UHS-II) | |
| HP EliteBook 1050 G1-4QY20EA (Toshiba Exceria Pro SDXC 64 GB UHS-II) | |
| Average of class Workstation (49.6 - 681, n=14, last 2 years) | |
| maximum AS SSD Seq Read Test (1GB) | |
| Lenovo ThinkPad X1 Extreme-20MF000XGE (Toshiba Exceria Pro SDXC 64 GB UHS-II) | |
| Lenovo ThinkPad P1-20MD002LUS (Toshiba Exceria Pro SDXC 64 GB UHS-II) | |
| Lenovo ThinkPad X1 Carbon 2018-20KGS03900 (Toshiba Exceria Pro M501) | |
| Average of class Workstation (87.6 - 1455, n=14, last 2 years) | |
| HP EliteBook 1050 G1-4QY20EA (Toshiba Exceria Pro SDXC 64 GB UHS-II) | |
| Dell Precision 5530 Xeon E-2176M (Toshiba Exceria Pro SDXC 64 GB UHS-II) | |
Display
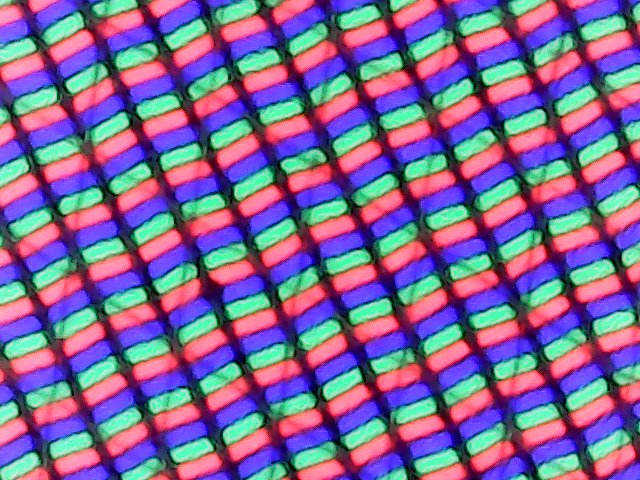
The display panel in our ThinkPad P1 is also identical to that of our X1 Extreme review unit, so not much should have changed in this section either. Nevertheless, we’ll briefly cover our measurements of the P1’s screen, which (at least subjectively) does immediately make a good impression, with deep color saturation and what appears to be a good brightness and contrast. We note conspicuous backlight bleed in the upper corners and lower right of our review unit display.

| |||||||||||||||||||||||||
Brightness Distribution: 85 %
Center on Battery: 397.6 cd/m²
Contrast: 1590:1 (Black: 0.25 cd/m²)
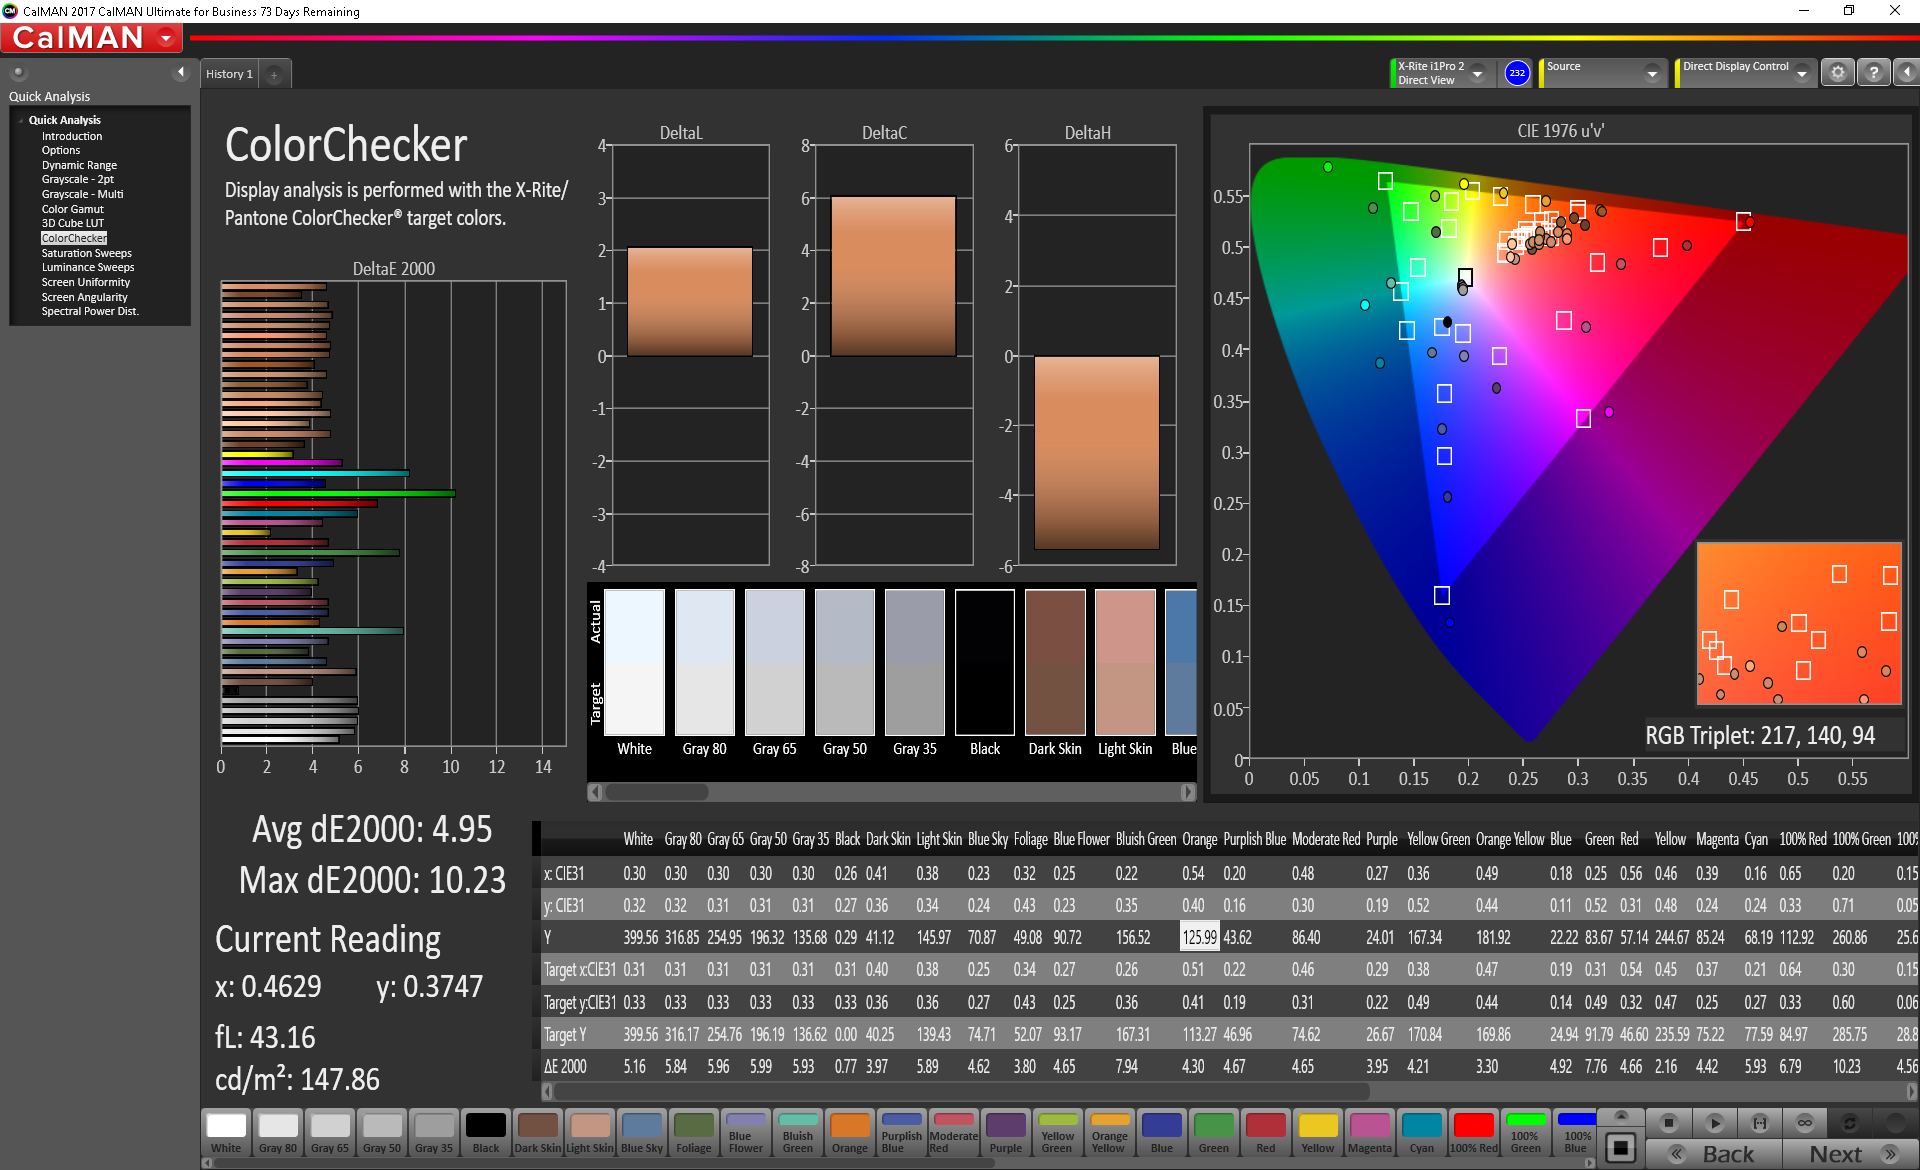
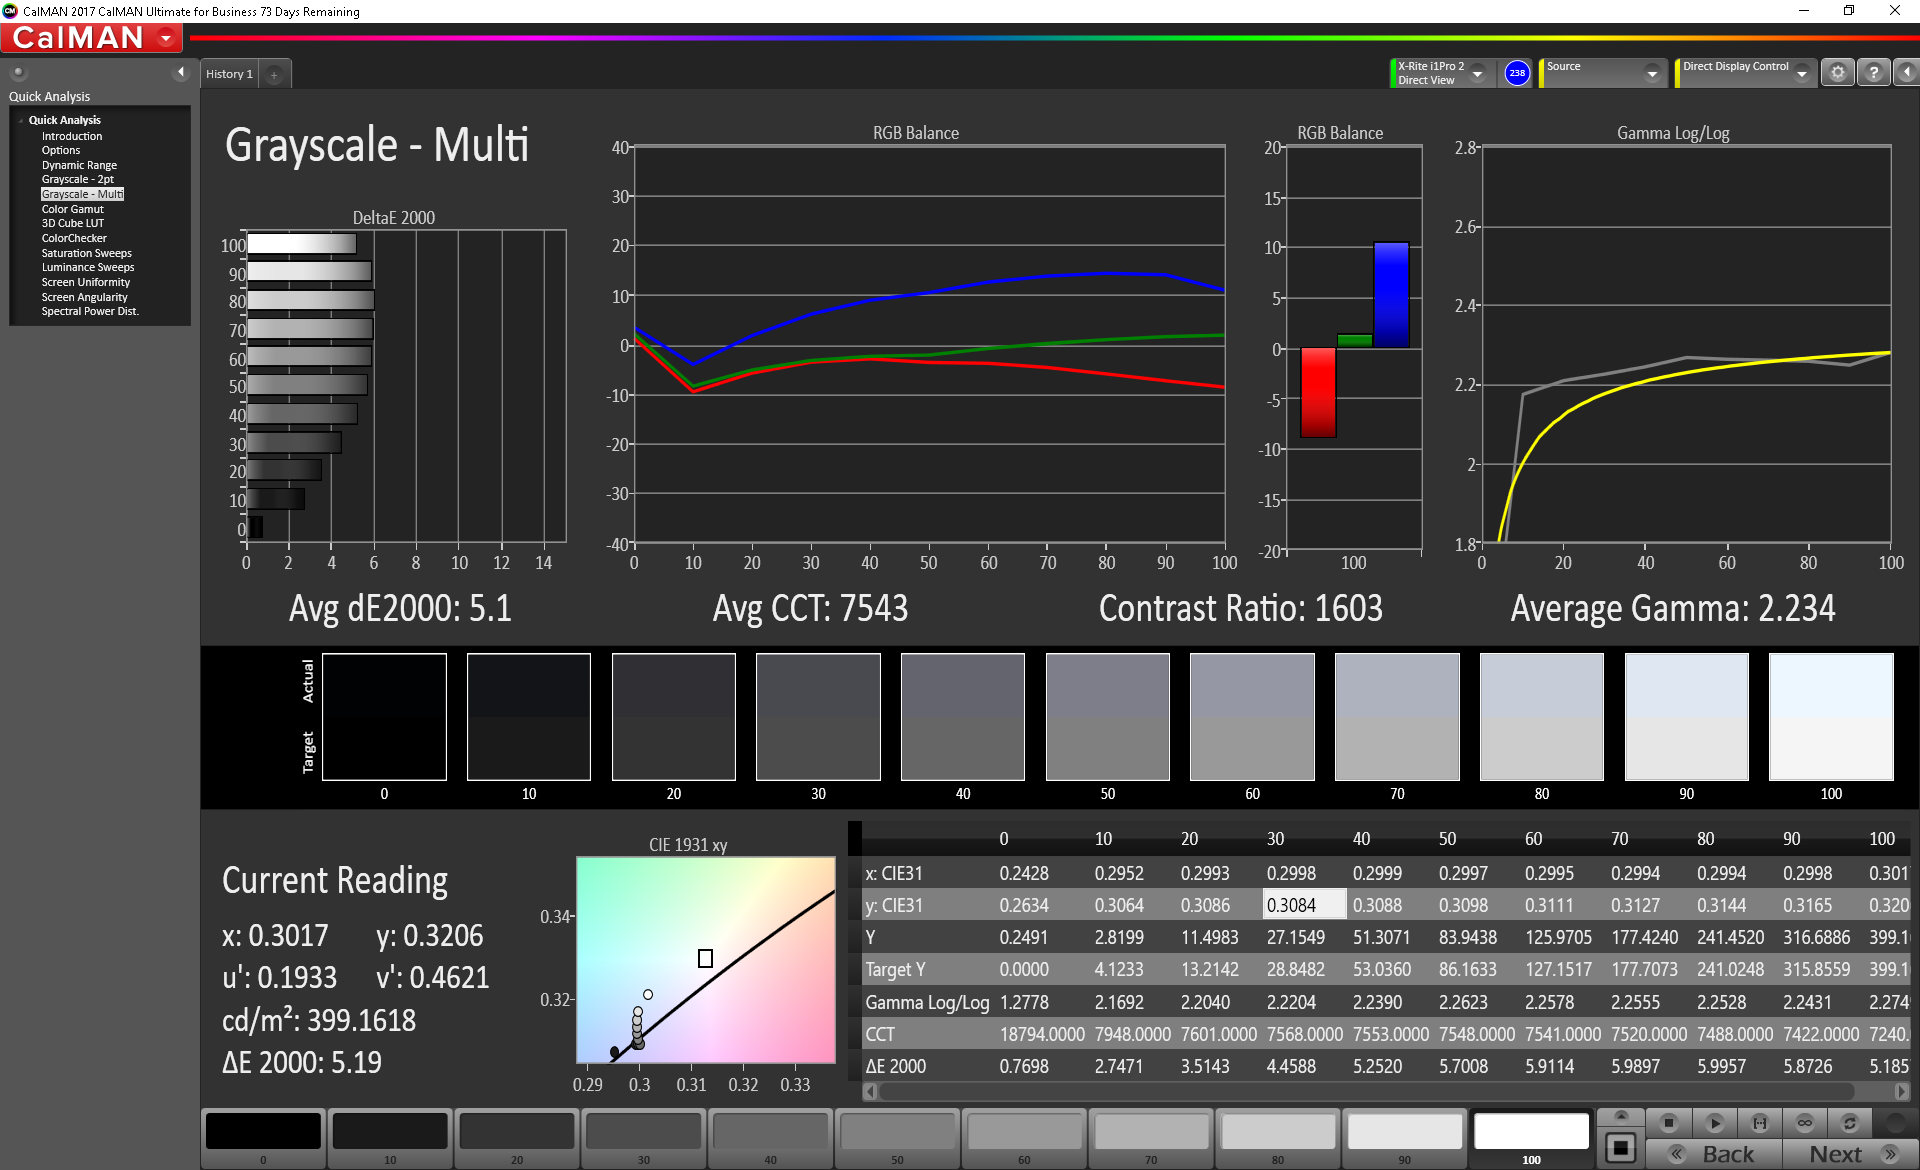
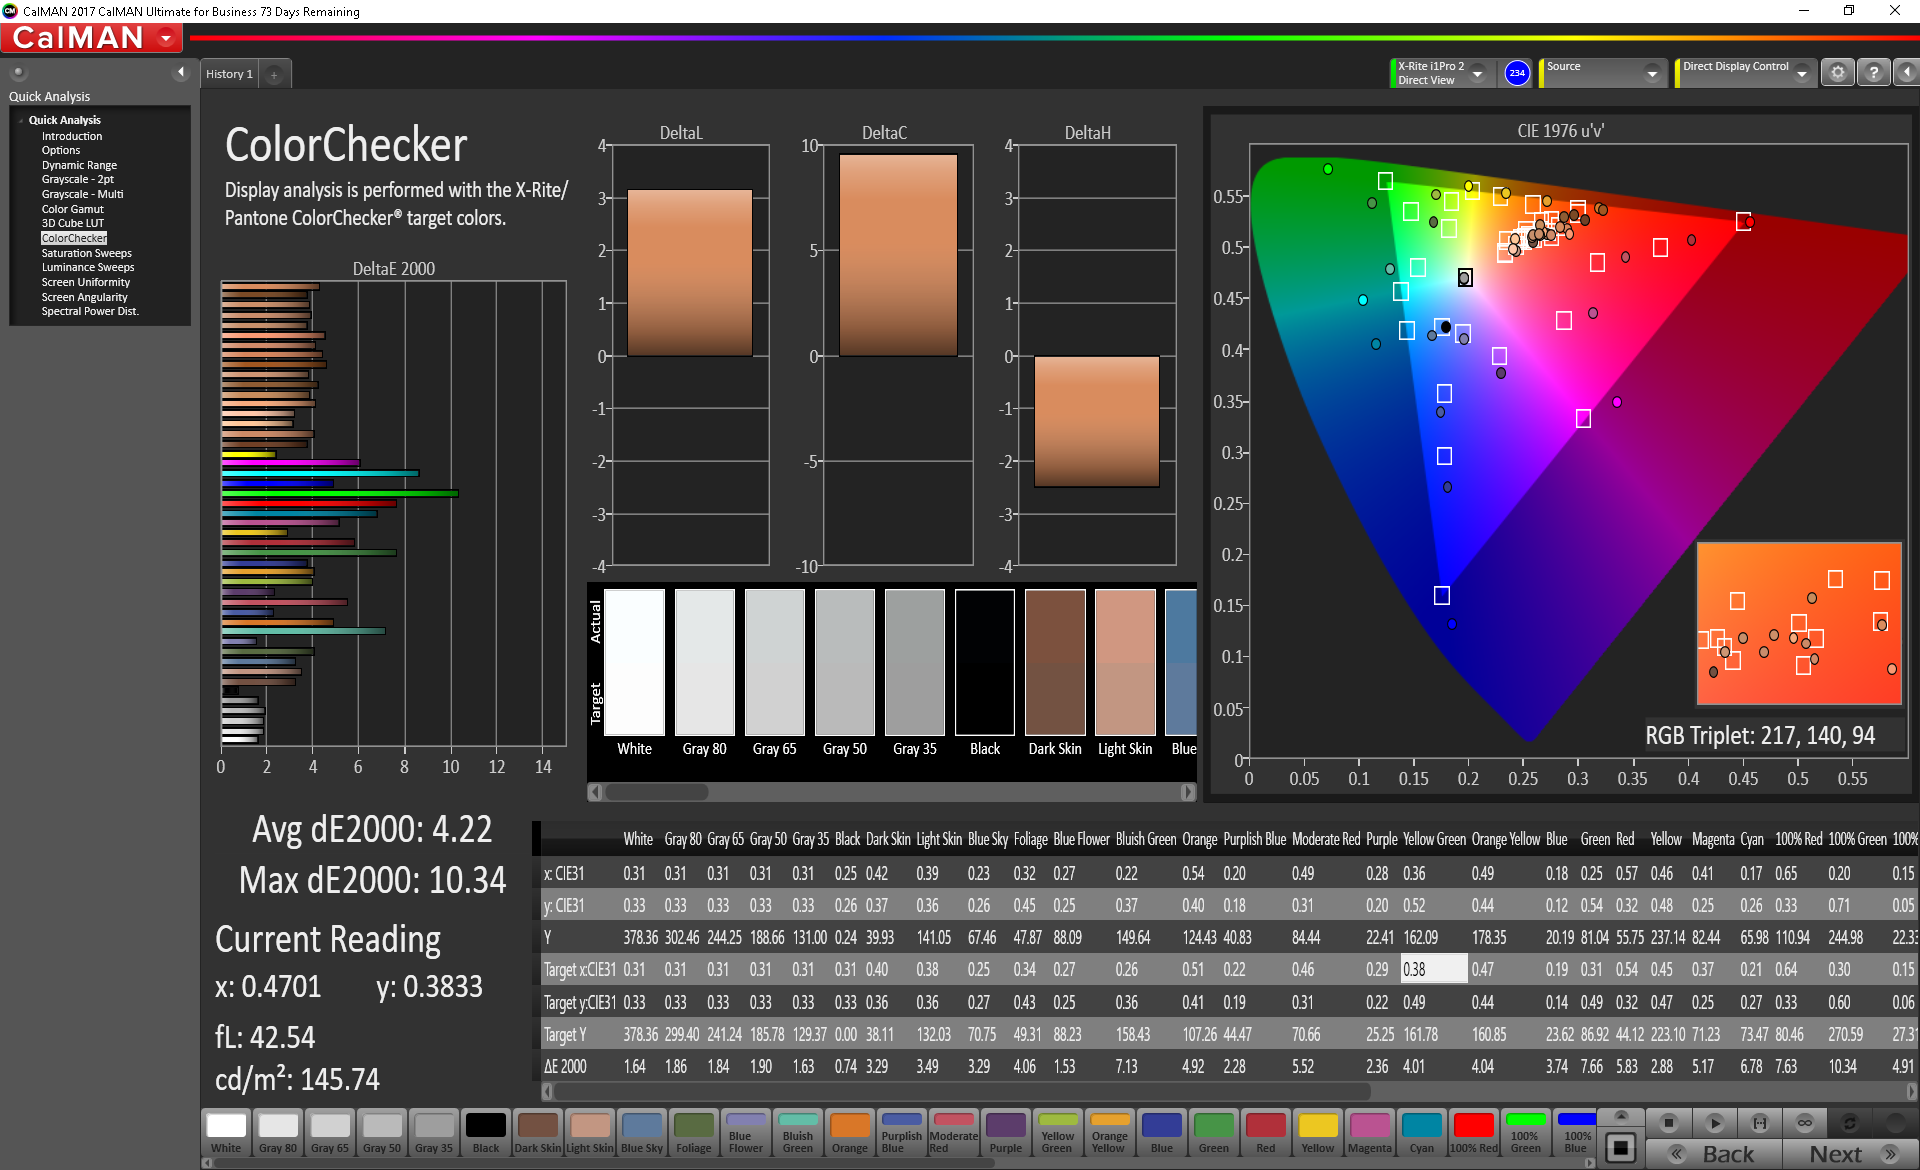
ΔE ColorChecker Calman: 4.95 | ∀{0.5-29.43 Ø4.73}
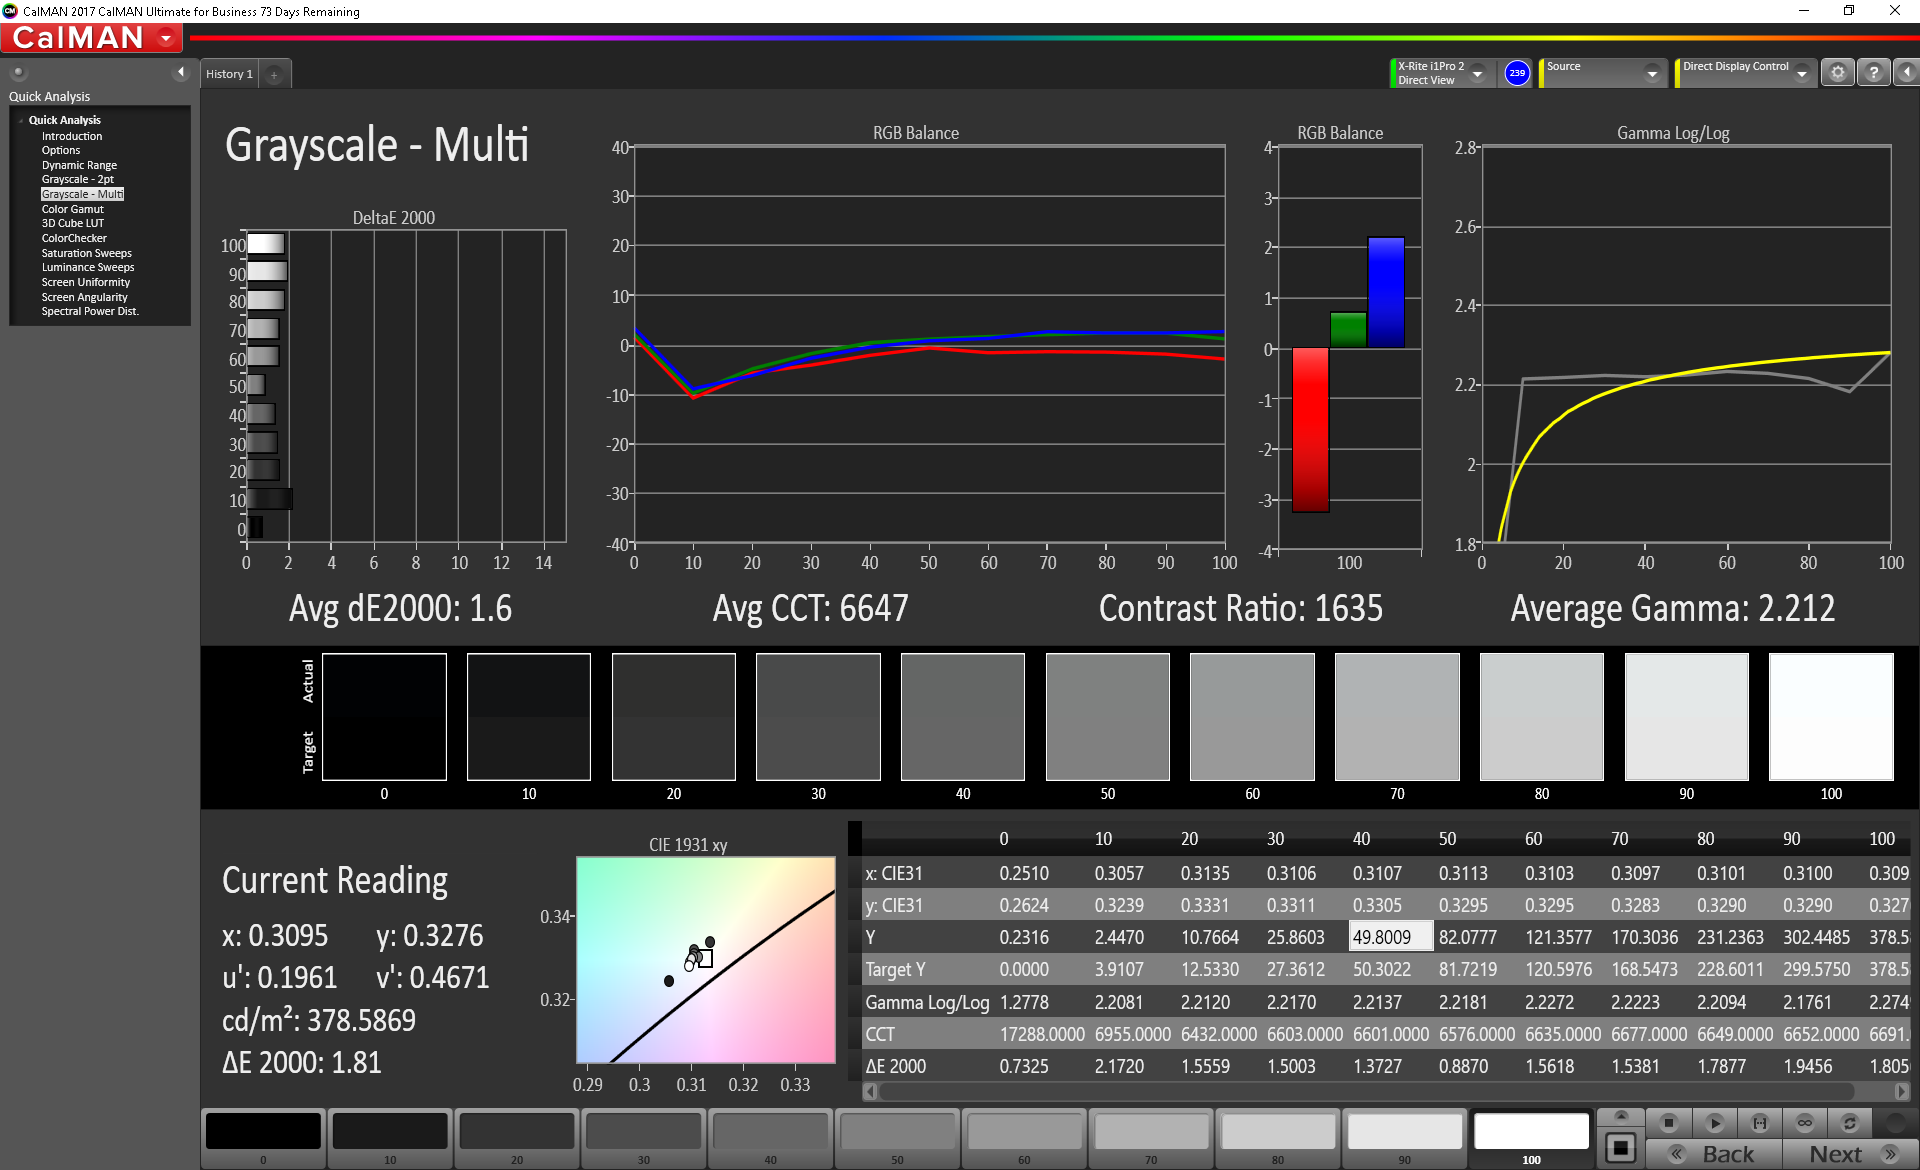
calibrated: 4.22
ΔE Greyscale Calman: 5.1 | ∀{0.09-98 Ø4.97}
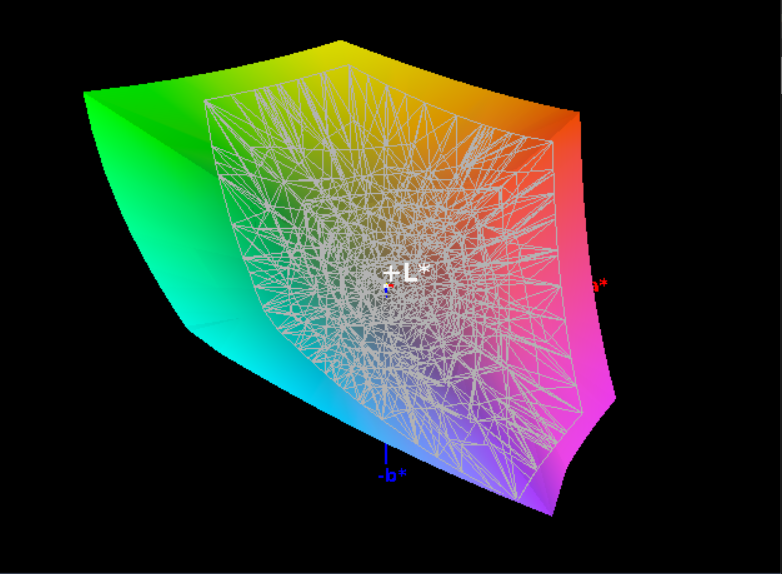
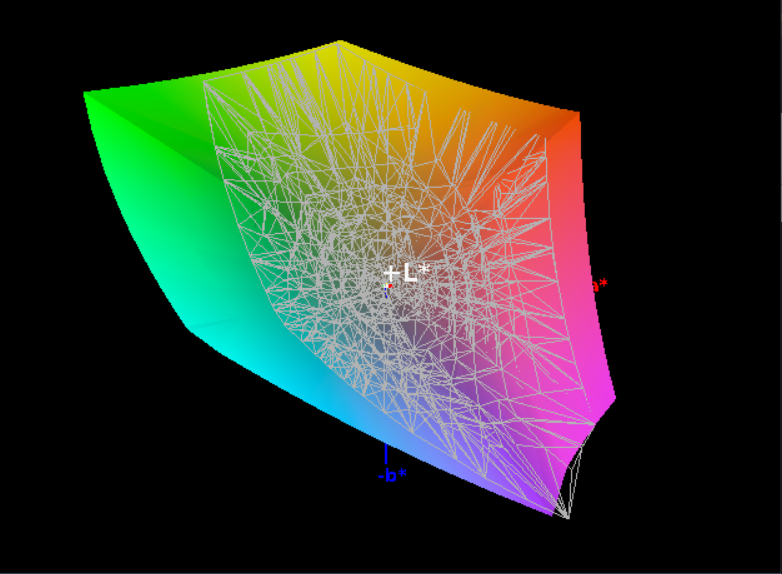
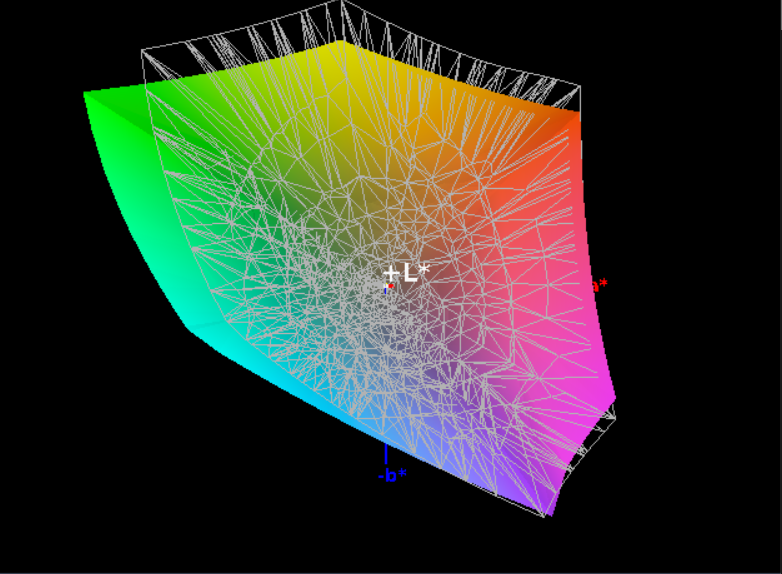
100% sRGB (Argyll 1.6.3 3D)
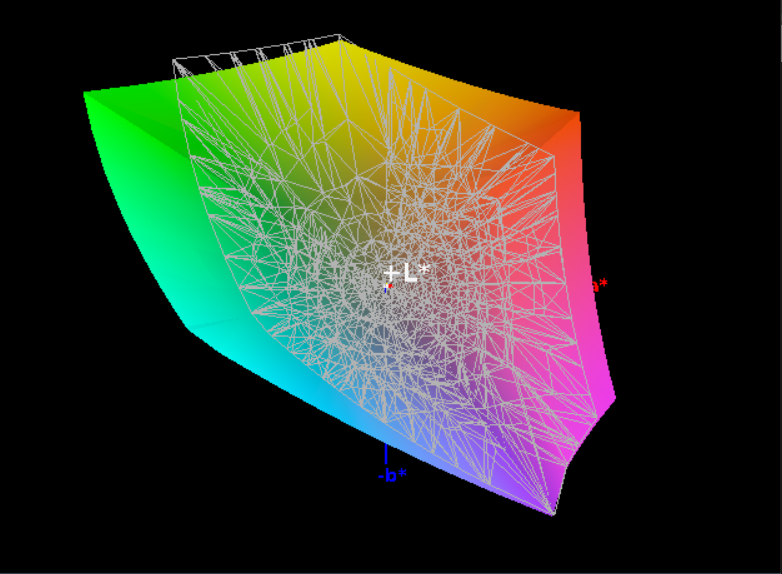
87.6% AdobeRGB 1998 (Argyll 1.6.3 3D)
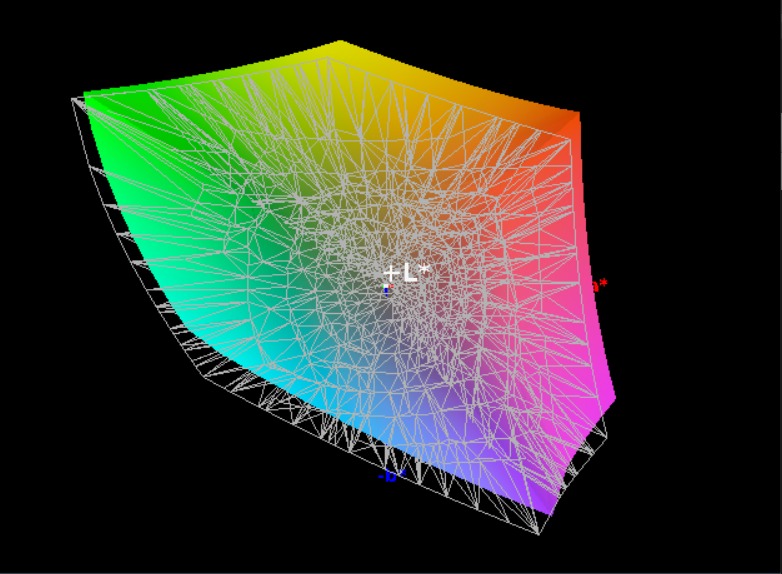
99.1% AdobeRGB 1998 (Argyll 3D)
99.9% sRGB (Argyll 3D)
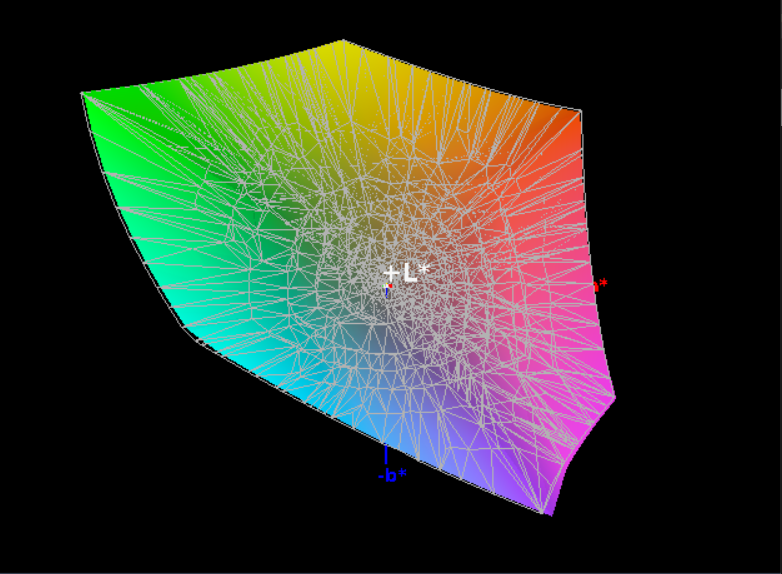
86.4% Display P3 (Argyll 3D)
Gamma: 2.234
CCT: 7543 K
| Lenovo ThinkPad P1-20MD002LUS B156ZAN03.2, IPS, 15.6", 3840x2160 | Lenovo ThinkPad X1 Extreme-20MF000XGE B156ZAN03.2, IPS, 15.6", 3840x2160 | Dell Precision 5530 Xeon E-2176M Sharp SHP148D / LQ156D1, IGZO, 15.6", 3840x2160 | HP EliteBook 1050 G1-4QY20EA AUO30EB, IPS LED, 15.6", 3840x2160 | Apple MacBook Pro 15 2018 (2.6 GHz, 560X) APPA040, IPS, 15.4", 2880x1800 | |
|---|---|---|---|---|---|
| Display | 0% | -12% | -20% | 0% | |
| Display P3 Coverage (%) | 86.4 | 86.3 0% | 76.5 -11% | 67.8 -22% | 98.7 14% |
| sRGB Coverage (%) | 99.9 | 100 0% | 98.4 -2% | 94.1 -6% | 99.9 0% |
| AdobeRGB 1998 Coverage (%) | 99.1 | 99.4 0% | 76.4 -23% | 67.9 -31% | 86.6 -13% |
| Response Times | -8% | 3% | 3% | 11% | |
| Response Time Grey 50% / Grey 80% * (ms) | 55.6 ? | 61.6 ? -11% | 48 ? 14% | 56 ? -1% | 43.2 ? 22% |
| Response Time Black / White * (ms) | 30.8 ? | 32 ? -4% | 33.6 ? -9% | 29 ? 6% | 31.2 ? -1% |
| PWM Frequency (Hz) | 1000 | 117000 ? | |||
| Screen | 8% | 2% | 0% | 27% | |
| Brightness middle (cd/m²) | 397.6 | 396 0% | 451.7 14% | 440 11% | 520 31% |
| Brightness (cd/m²) | 396 | 380 -4% | 440 11% | 389 -2% | 492 24% |
| Brightness Distribution (%) | 85 | 90 6% | 90 6% | 83 -2% | 88 4% |
| Black Level * (cd/m²) | 0.25 | 0.28 -12% | 0.4 -60% | 0.34 -36% | 0.39 -56% |
| Contrast (:1) | 1590 | 1414 -11% | 1129 -29% | 1294 -19% | 1333 -16% |
| Colorchecker dE 2000 * | 4.95 | 4 19% | 3.11 37% | 5.04 -2% | 1.2 76% |
| Colorchecker dE 2000 max. * | 10.23 | 7.6 26% | 8.62 16% | 6.99 32% | 2.3 78% |
| Colorchecker dE 2000 calibrated * | 4.22 | 0.9 79% | 3.07 27% | 2.04 52% | |
| Greyscale dE 2000 * | 5.1 | 6.1 -20% | 3.7 27% | 4.98 2% | 1.3 75% |
| Gamma | 2.234 98% | 2.25 98% | 2.11 104% | 2.48 89% | 2.18 101% |
| CCT | 7543 86% | 7786 83% | 6492 100% | 7777 84% | 6738 96% |
| Color Space (Percent of AdobeRGB 1998) (%) | 87.6 | 88.5 1% | 69 -21% | 61 -30% | |
| Color Space (Percent of sRGB) (%) | 100 | 100 0% | 98 -2% | 94 -6% | |
| Total Average (Program / Settings) | 0% /
4% | -2% /
-0% | -6% /
-3% | 13% /
18% |
* ... smaller is better
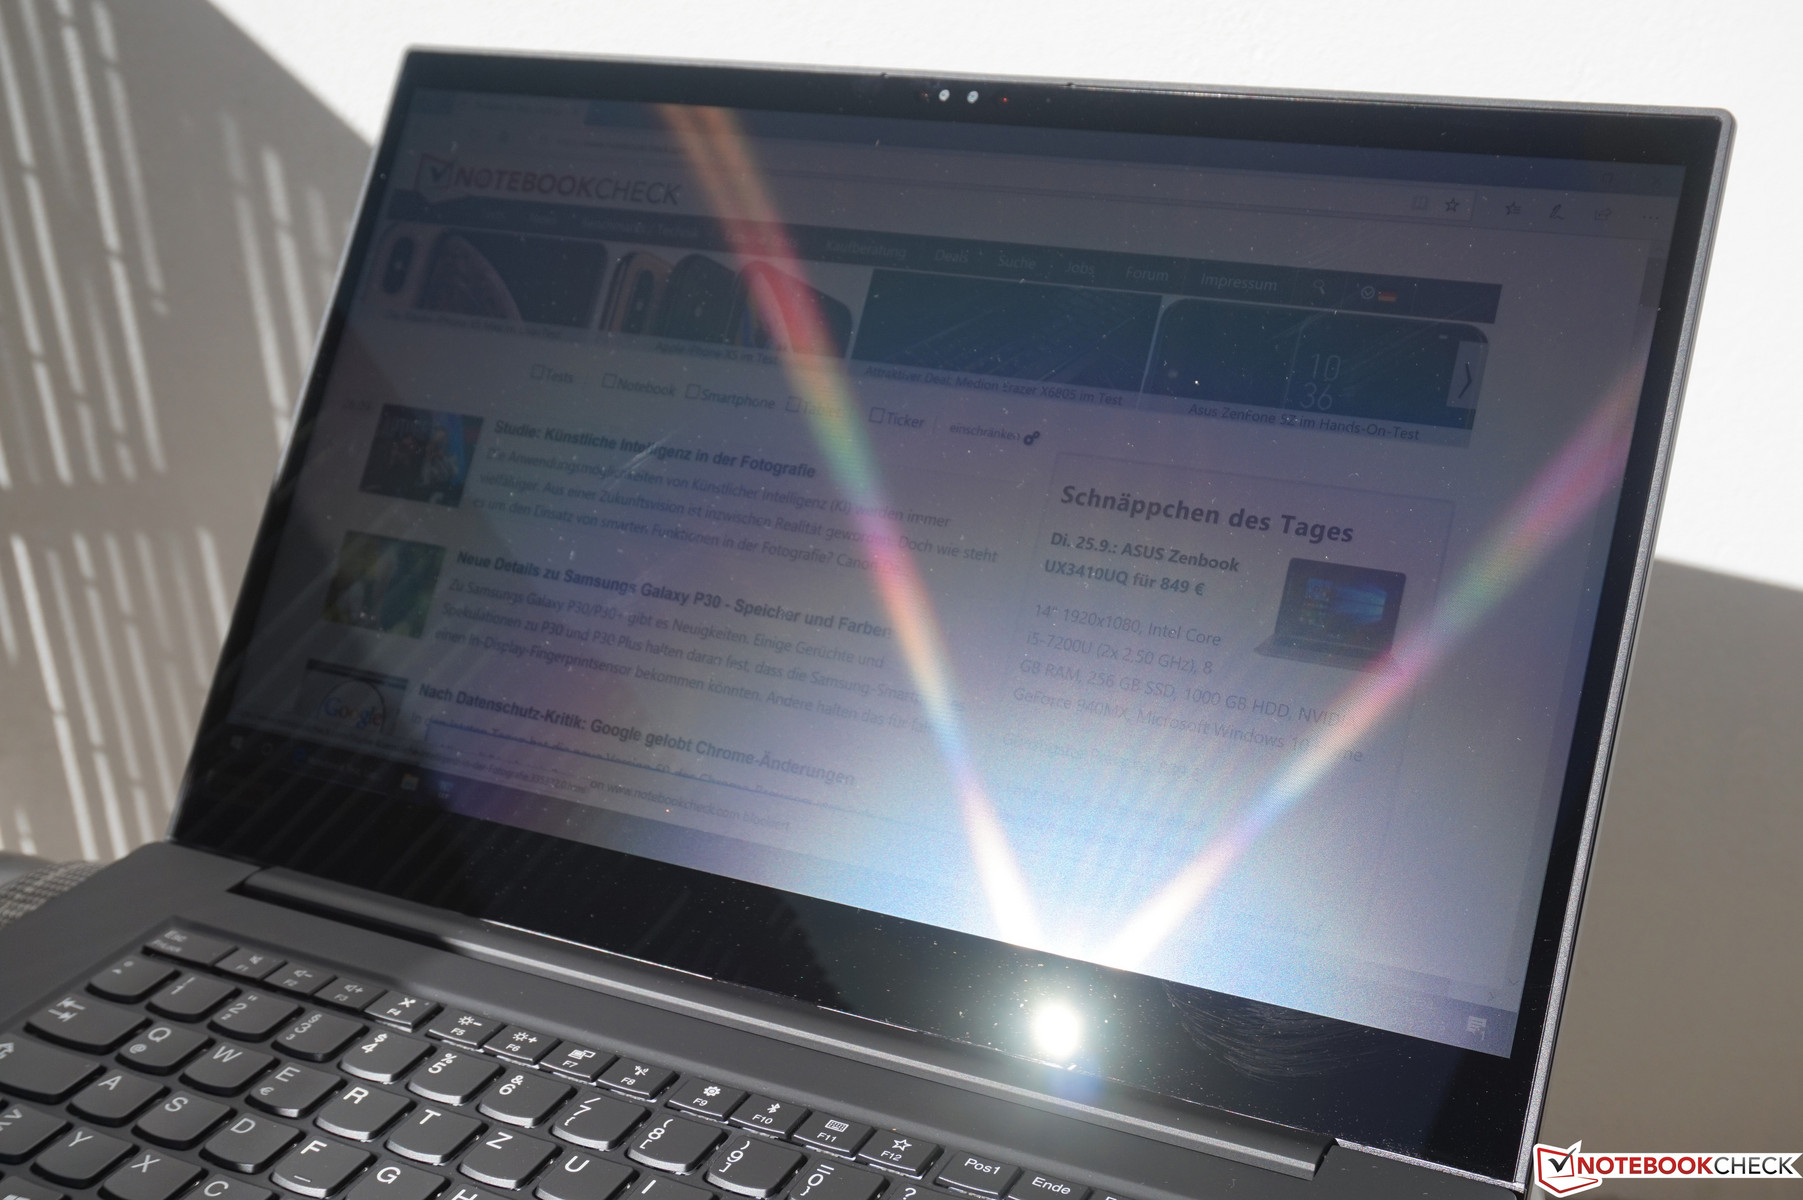
Resolution remains 4K/UHD (3840x2160), and the display still unfortunately features a glossy finish, which makes usage in brighter environments a bit of a challenge. It is fortunately quite bright, however, at 395.8 cd/m² average brightness (421.7 cd/m², with a brightness distribution of 85%). A black value measurement of 0.25 cd/m² yields the contrast ratio of 1590:1, which is good. The panel is designed for HDR capability, though its brightness falls far short of what would actually qualify it as an effective display in that regard.
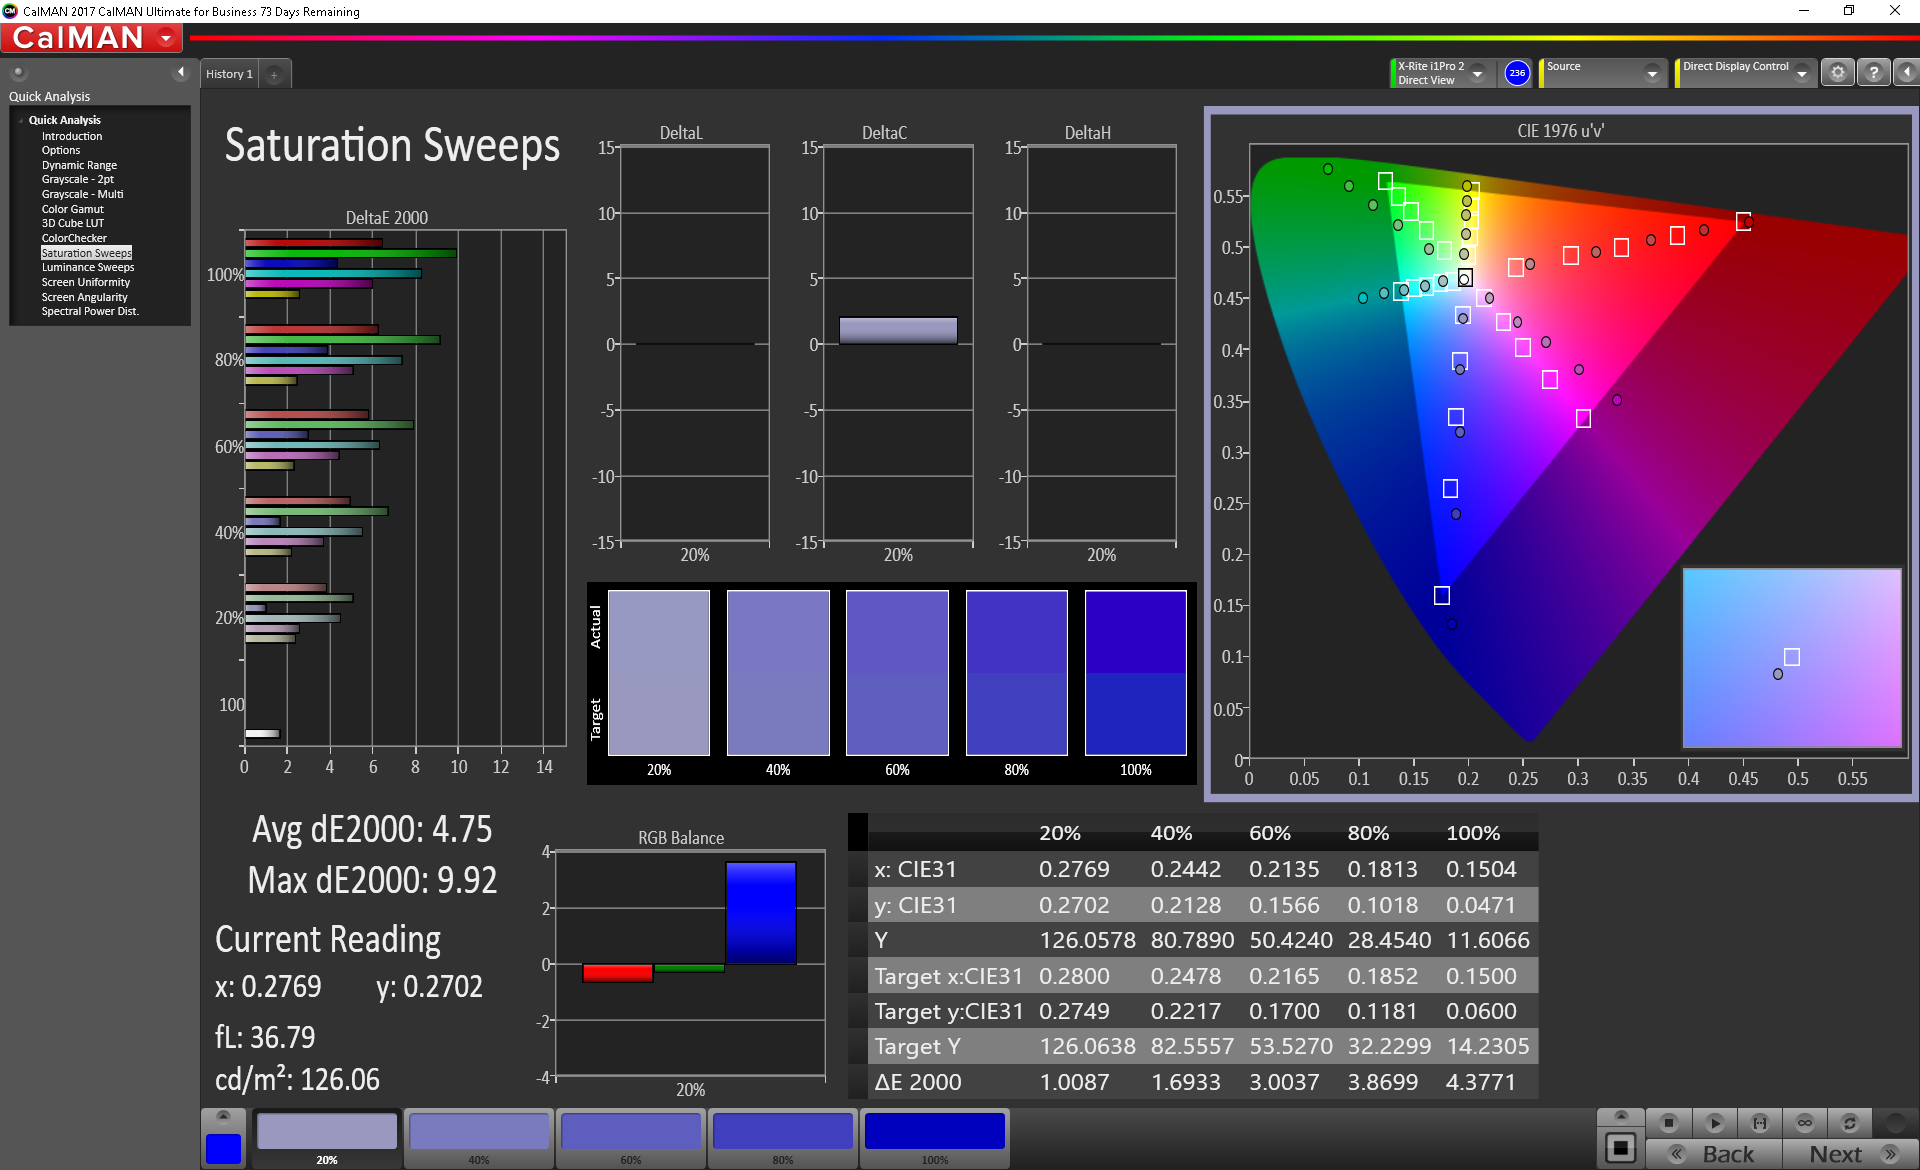
In terms of color coverage, our measurements are identical with those of the X1 Extreme, at 87.6 percent of AdobeRGB and 100 percent of sRGB. This tops the results from both the Precision 5530 and HP EliteBook 1050 G1 by a notable margin (some 20 to 26 percent difference of AdobeRGB). Please note that the results appear different from the X1 simply because we measured against sRGB with the P1 rather than AdobeRGB; they are, in fact, the same panel. The default color profile was used.
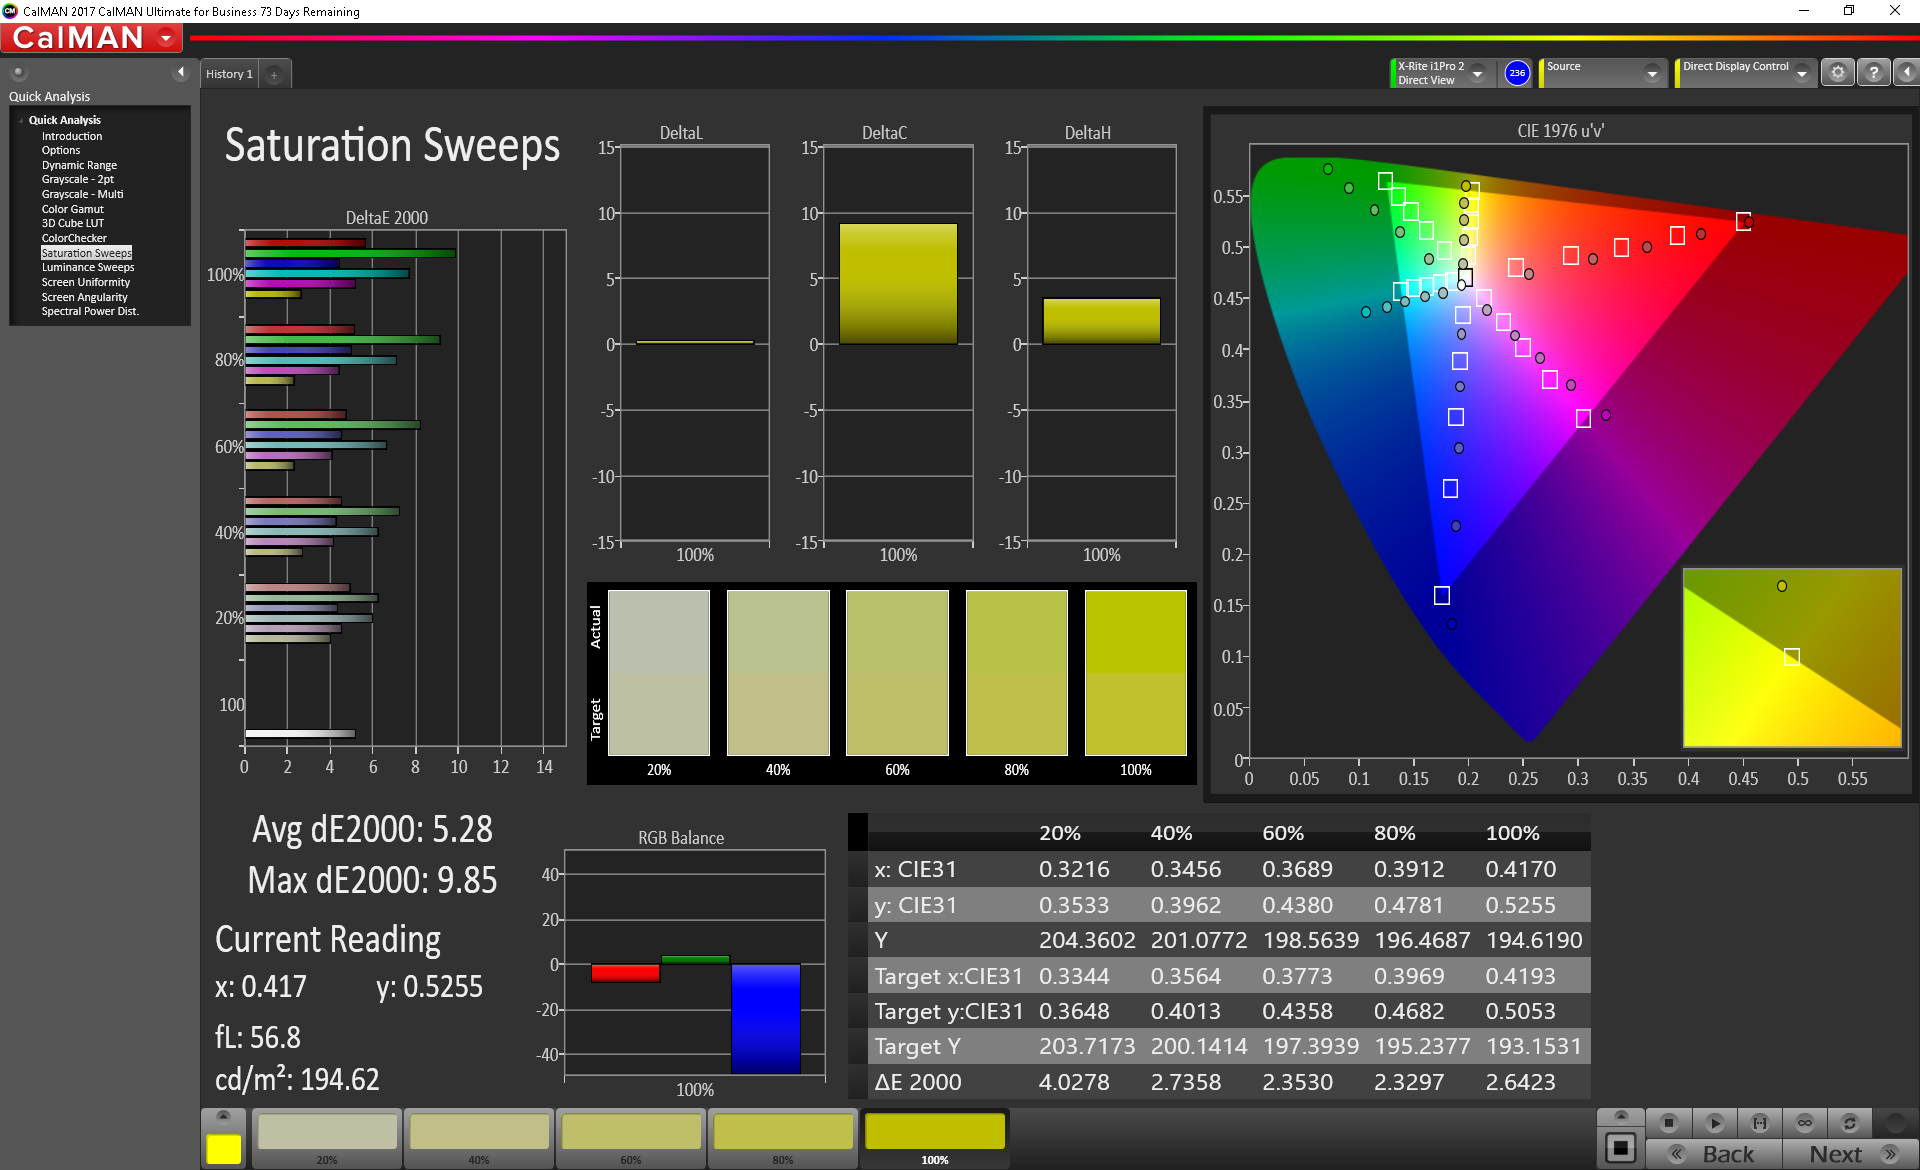
CalMAN measurements have fluctuated somewhat since the X1 Extreme values were recorded, but an average ColorChecker DeltaE of 4.95 and Greyscale DeltaE of 5.1 are still good results. The CCT Average (7543) and Gamma (2.234) are also very close to the previous results.
Display Response Times
| ↔ Response Time Black to White | ||
|---|---|---|
| 30.8 ms ... rise ↗ and fall ↘ combined | ↗ 16.4 ms rise | 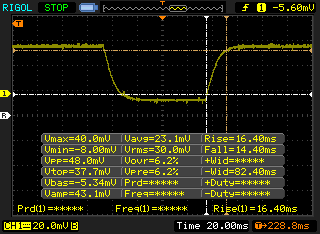 |
| ↘ 14.4 ms fall | ||
| The screen shows slow response rates in our tests and will be unsatisfactory for gamers. In comparison, all tested devices range from 0.1 (minimum) to 240 (maximum) ms. » 83 % of all devices are better. This means that the measured response time is worse than the average of all tested devices (19.9 ms). | ||
| ↔ Response Time 50% Grey to 80% Grey | ||
| 55.6 ms ... rise ↗ and fall ↘ combined | ↗ 38 ms rise | 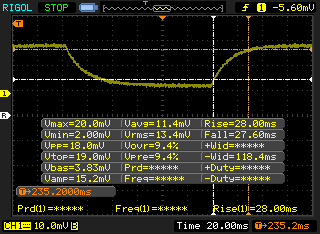 |
| ↘ 37.6 ms fall | ||
| The screen shows slow response rates in our tests and will be unsatisfactory for gamers. In comparison, all tested devices range from 0.165 (minimum) to 636 (maximum) ms. » 92 % of all devices are better. This means that the measured response time is worse than the average of all tested devices (31.1 ms). | ||
Screen Flickering / PWM (Pulse-Width Modulation)
| Screen flickering / PWM not detected | 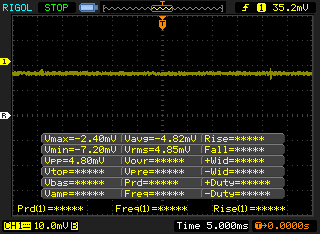 | ||
In comparison: 52 % of all tested devices do not use PWM to dim the display. If PWM was detected, an average of 7810 (minimum: 5 - maximum: 343500) Hz was measured. | |||
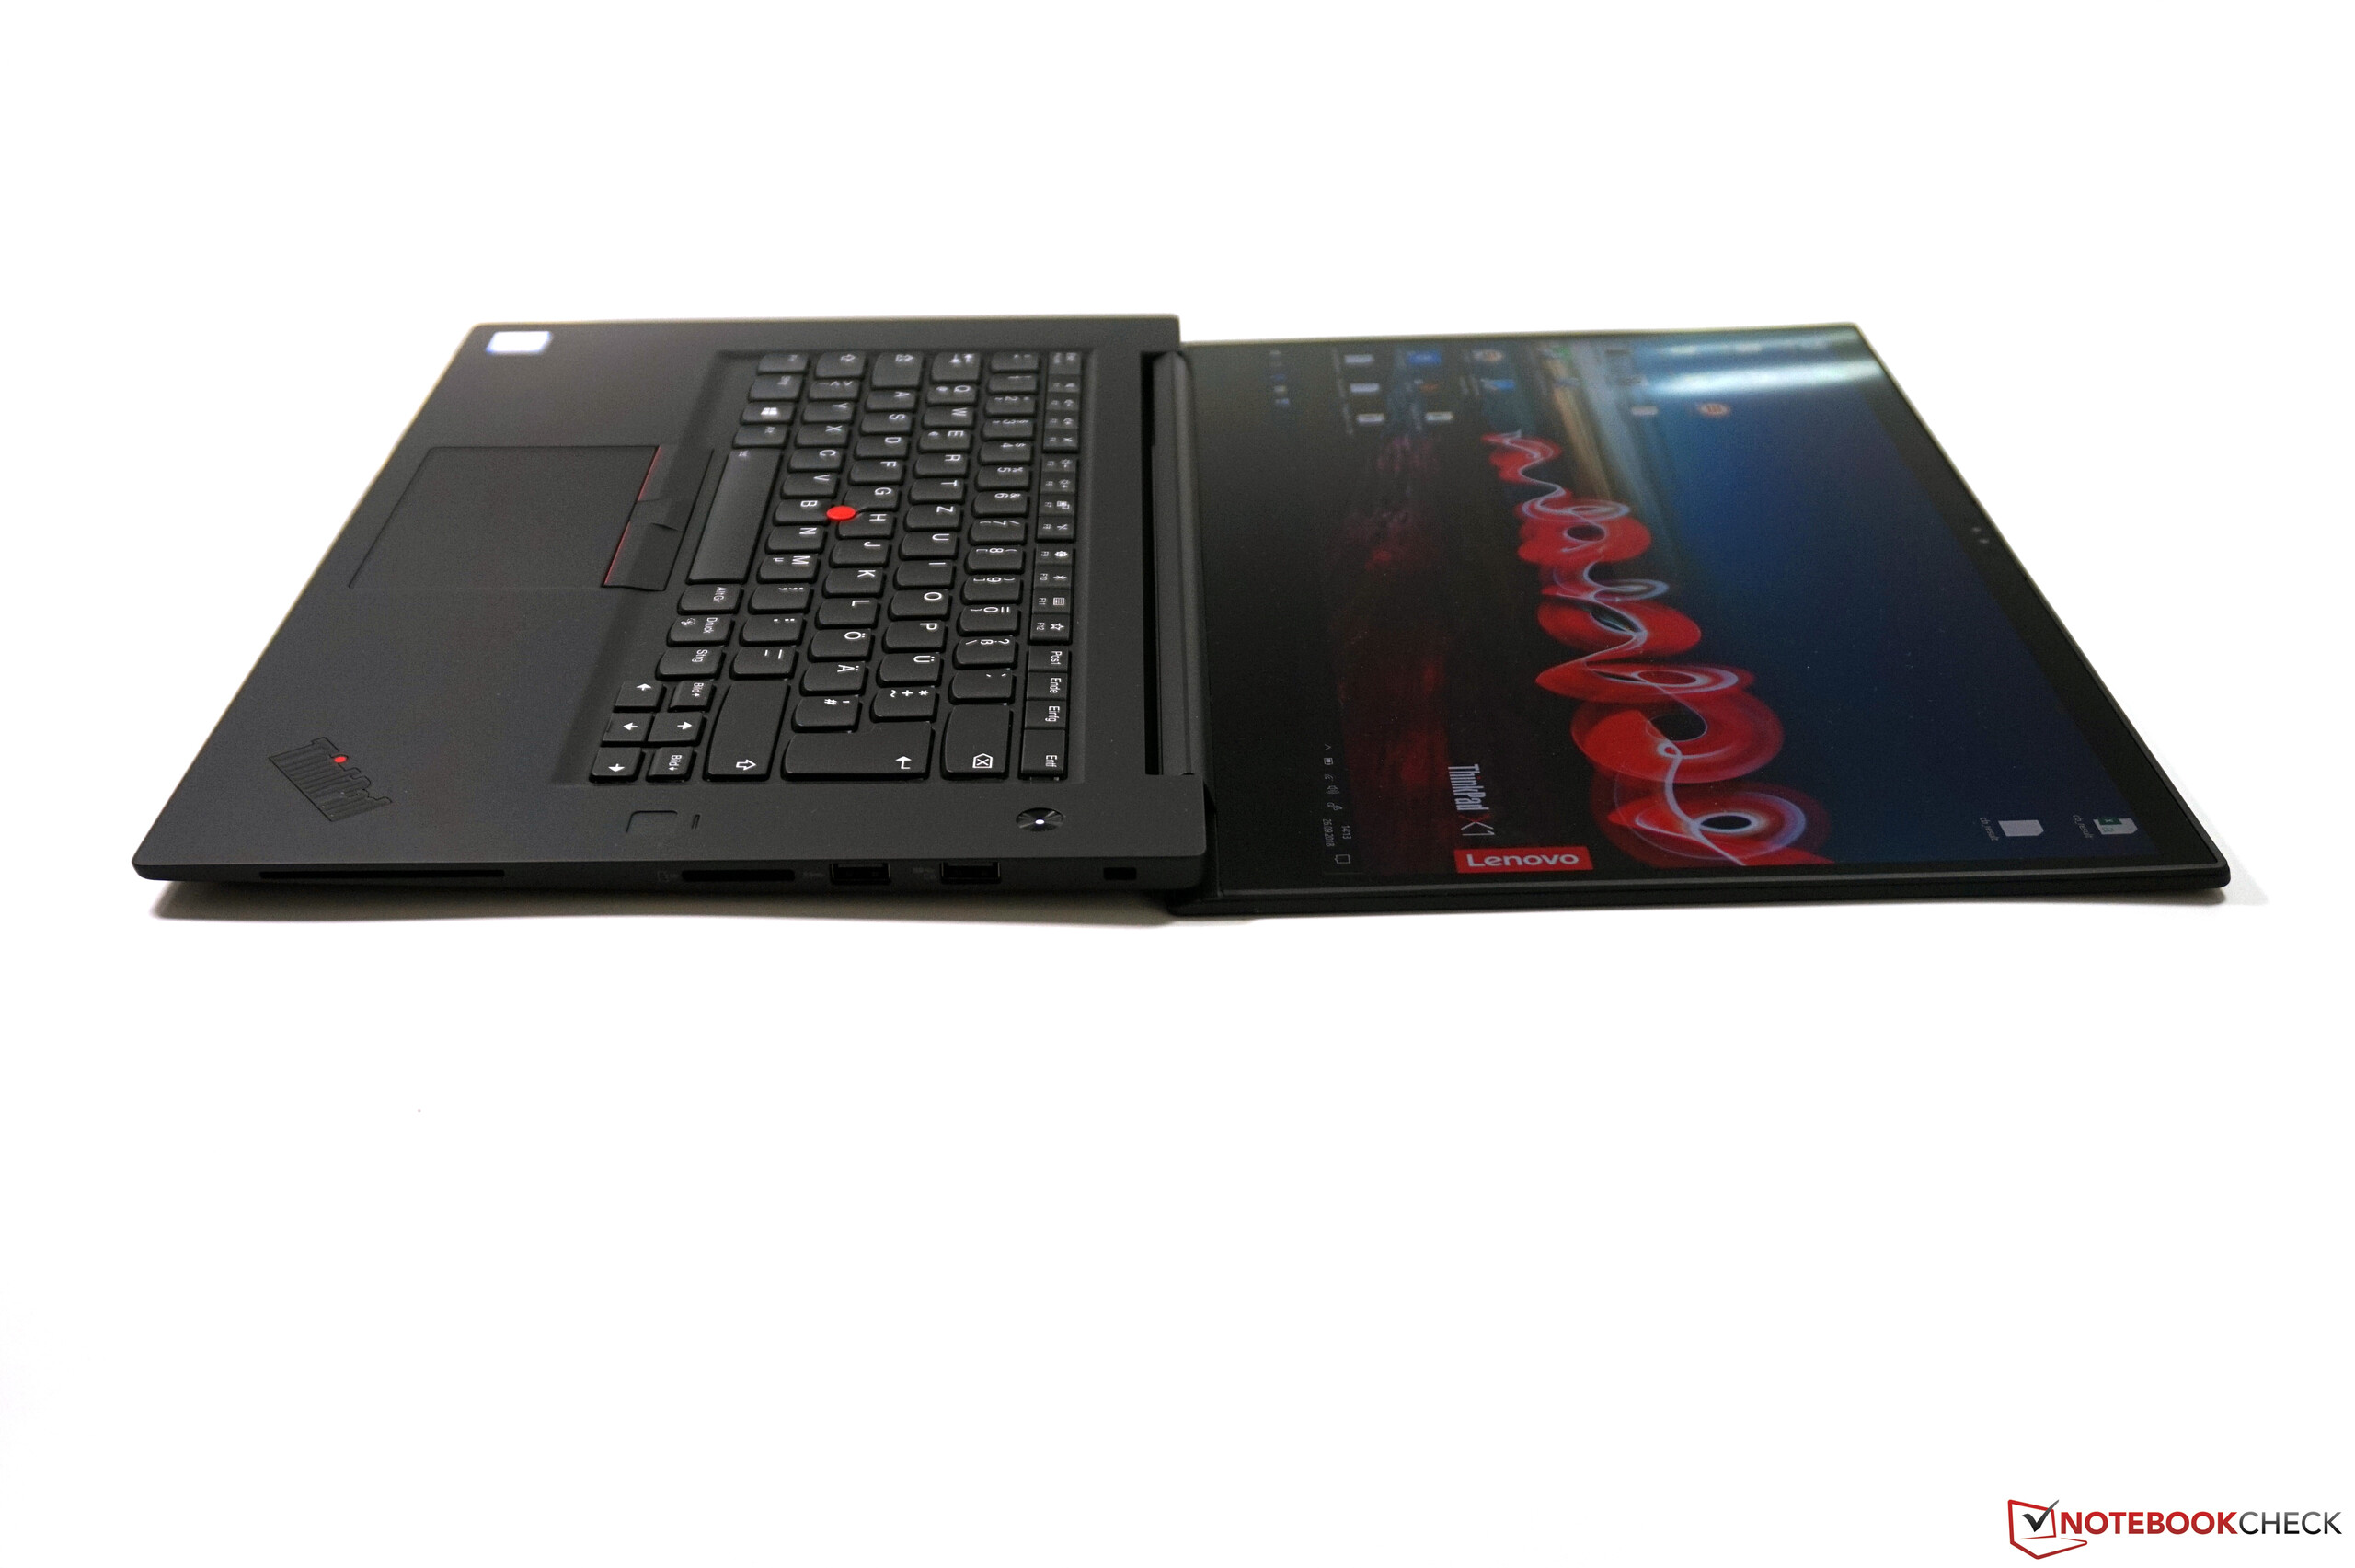
Outdoors, the P1 struggles thanks to its glossy display finish. The panel is bright, but the other competitors are brighter still. Viewing angles are excellent however.

Performance
While the ThinkPad P1 may be nearly identical to the X1 Extreme in most ways, it’s the internal components—CPU and GPU specifically—which differ from that of the X1 SKUs. For starters, although 8th-generation Core i5 and i7 CPUs are an option, there’s also the Xeon E-2176M, a true workstation-class processor. Similarly, rather than rely on conventional gaming GPUs from the NVIDIA GeForce lineup, the P1 offers either the NVIDIA Quadro P1000 or P2000 Max-Q to accommodate professional applications. RAM and storage range up to 64 GB and 2x 2 TB, respectively, with storage fully solid-state.
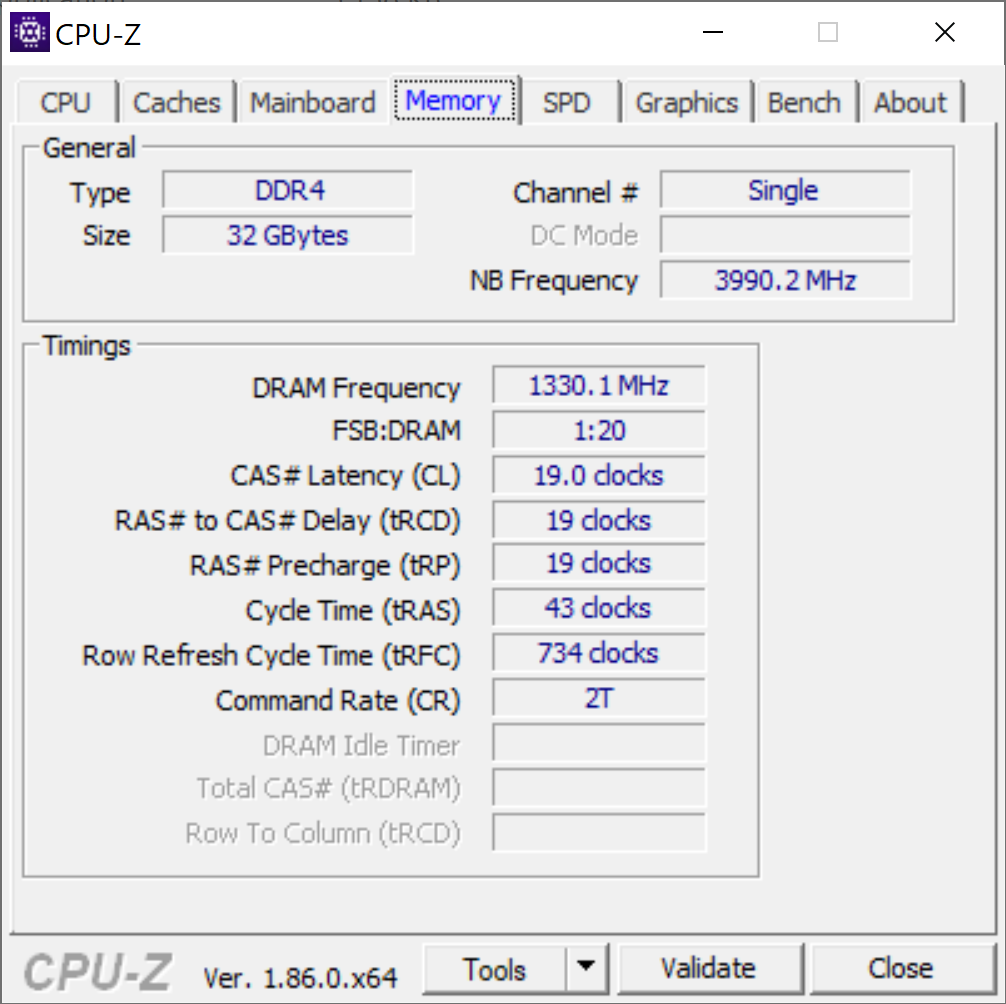
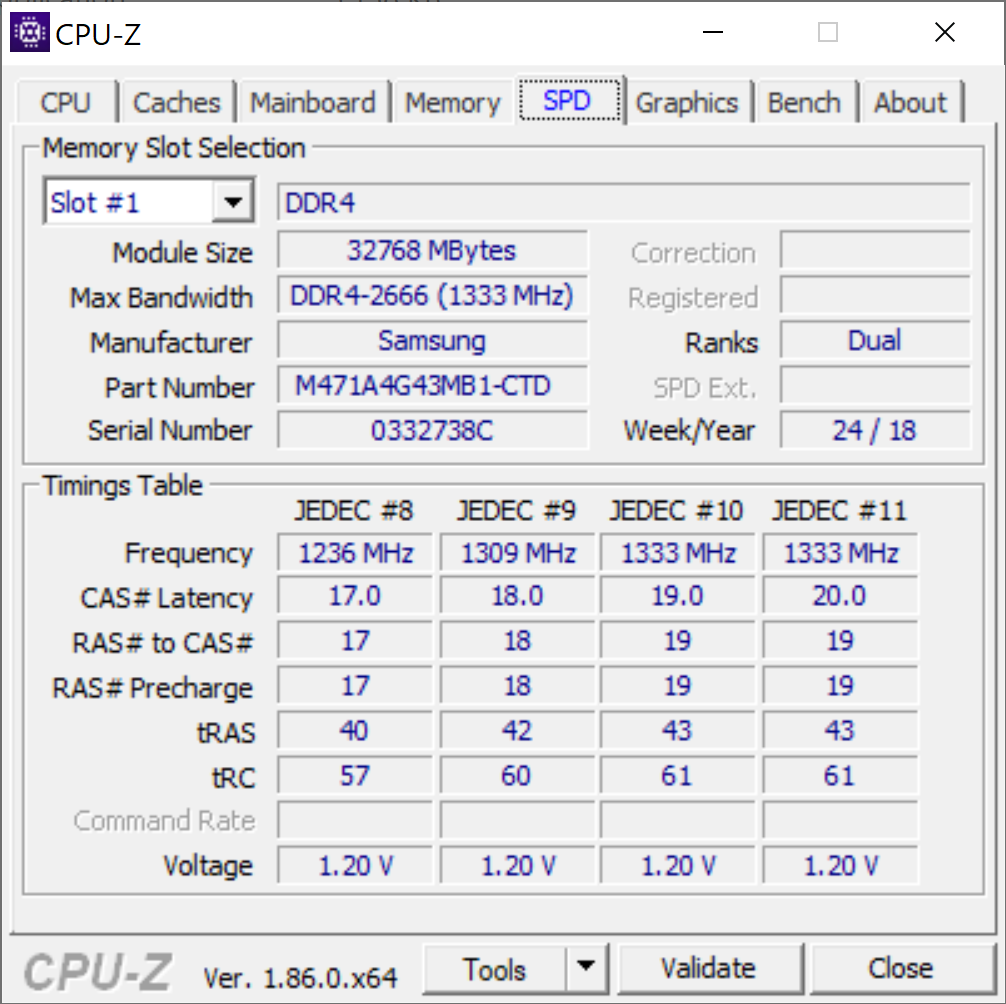
Our review unit is decked out with a Xeon E-2176M CPU, Quadro P2000 Max-Q GPU, 32 GB RAM (single DIMM), and a 2 TB NVMe SSD. Let’s see how it handles our bevy of performance tests.
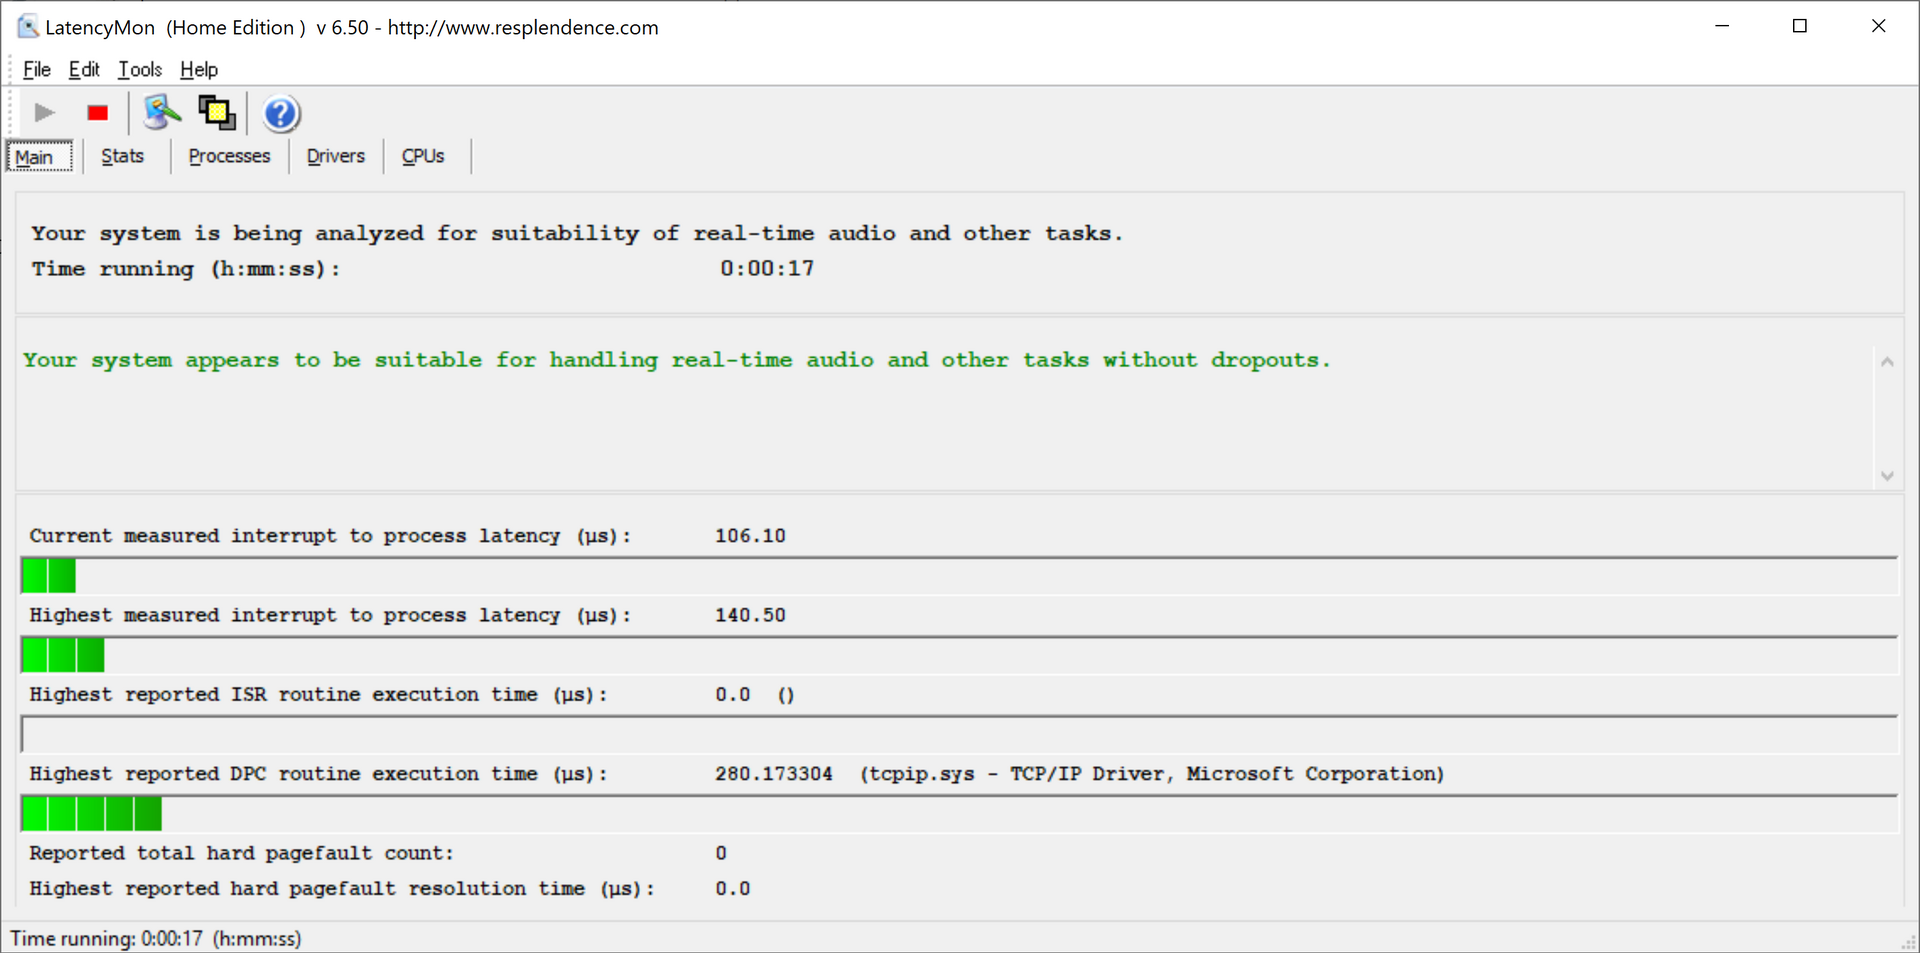
Operating unplugged, the 3DMark 11 performance score drops to just 6292. We do not detect any DPC Latencies.
Processor
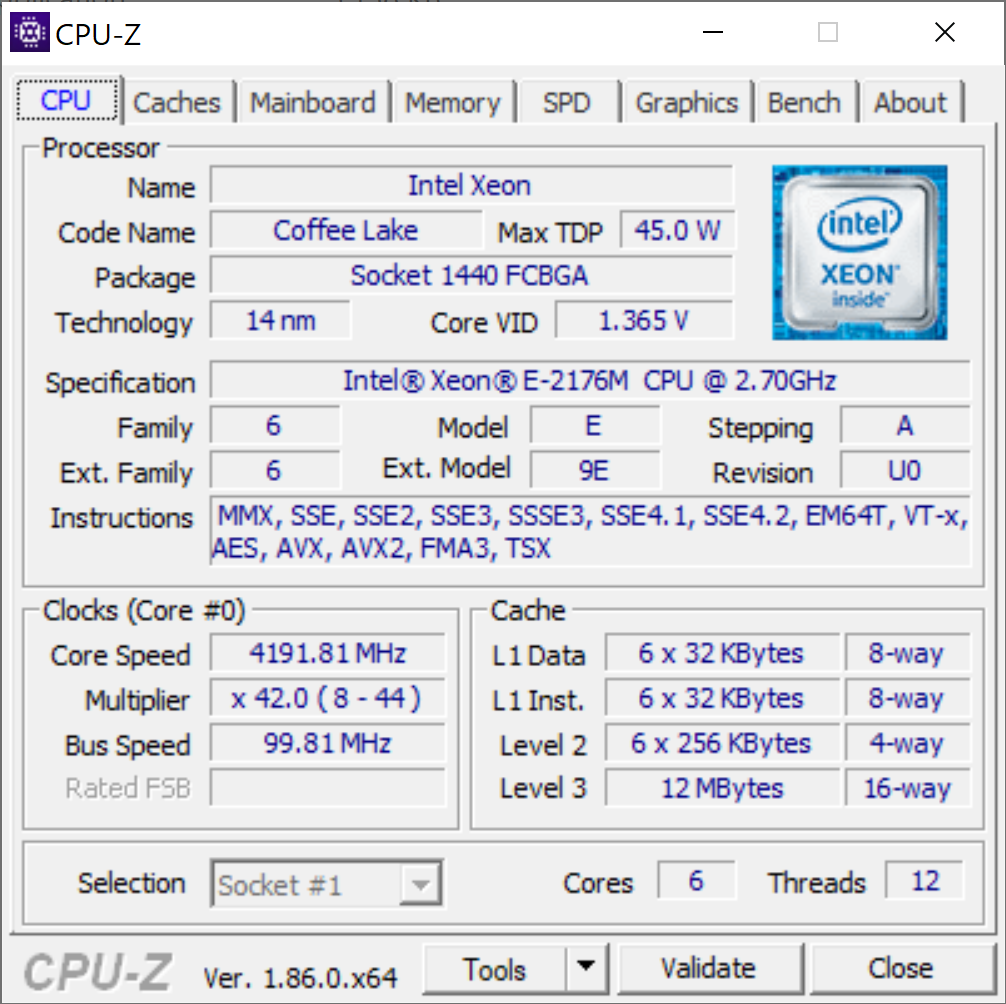
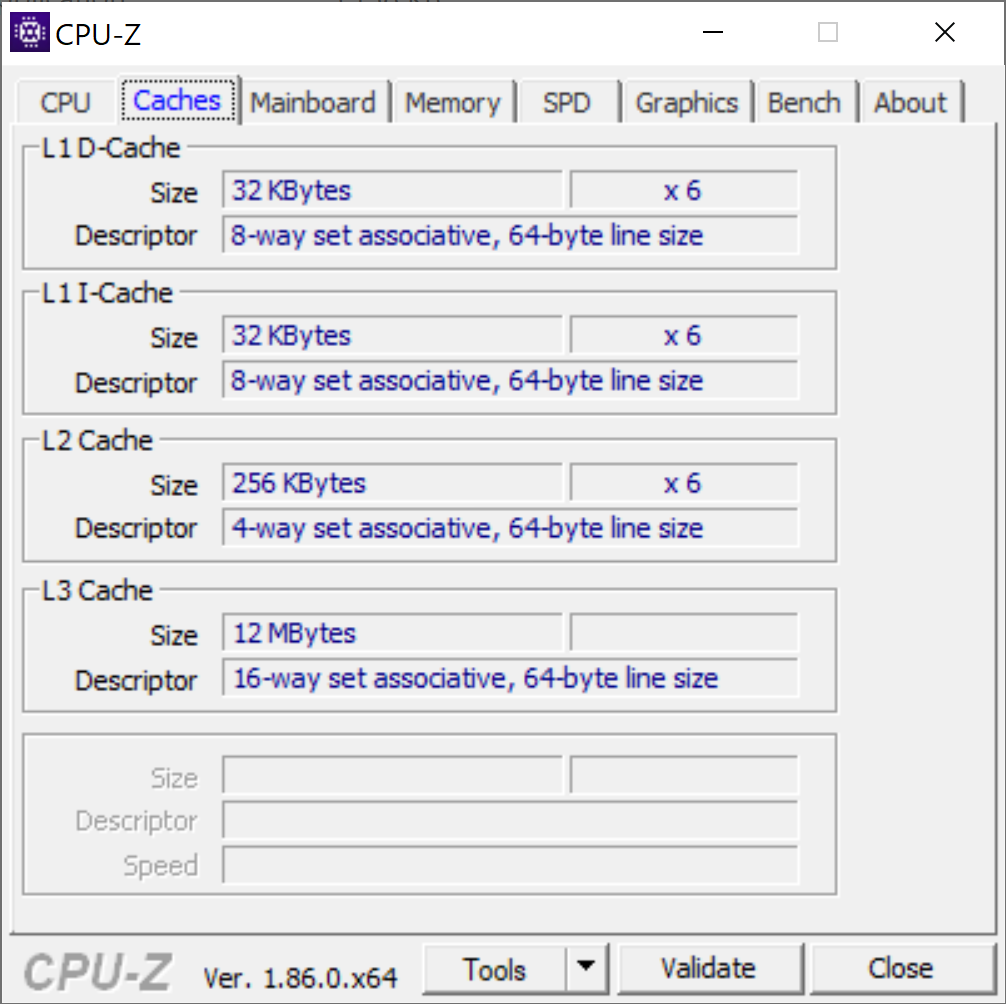
The Intel Xeon E-2176M is a hexacore CPU manufactured using Intel’s 14nm++ process and carrying a clock rate ranging between 2.7 and 4.4 GHz (4.1 GHz with all 6 cores active—vs 3.9 GHz on the i7-8750H). Up to twelve concurrent processing threads are possible via its support for Hyper-Threading. As compared with the Core i7-8750H, its clock rate is 300 MHz higher at turbo (500 MHz higher at base frequency), and it features a higher L3 cache of 12 MB (vs. 9 MB). It also supports ECC memory, though the RAM in our test unit is conventional. Both CPUs carry a TDP of 45 Watts.
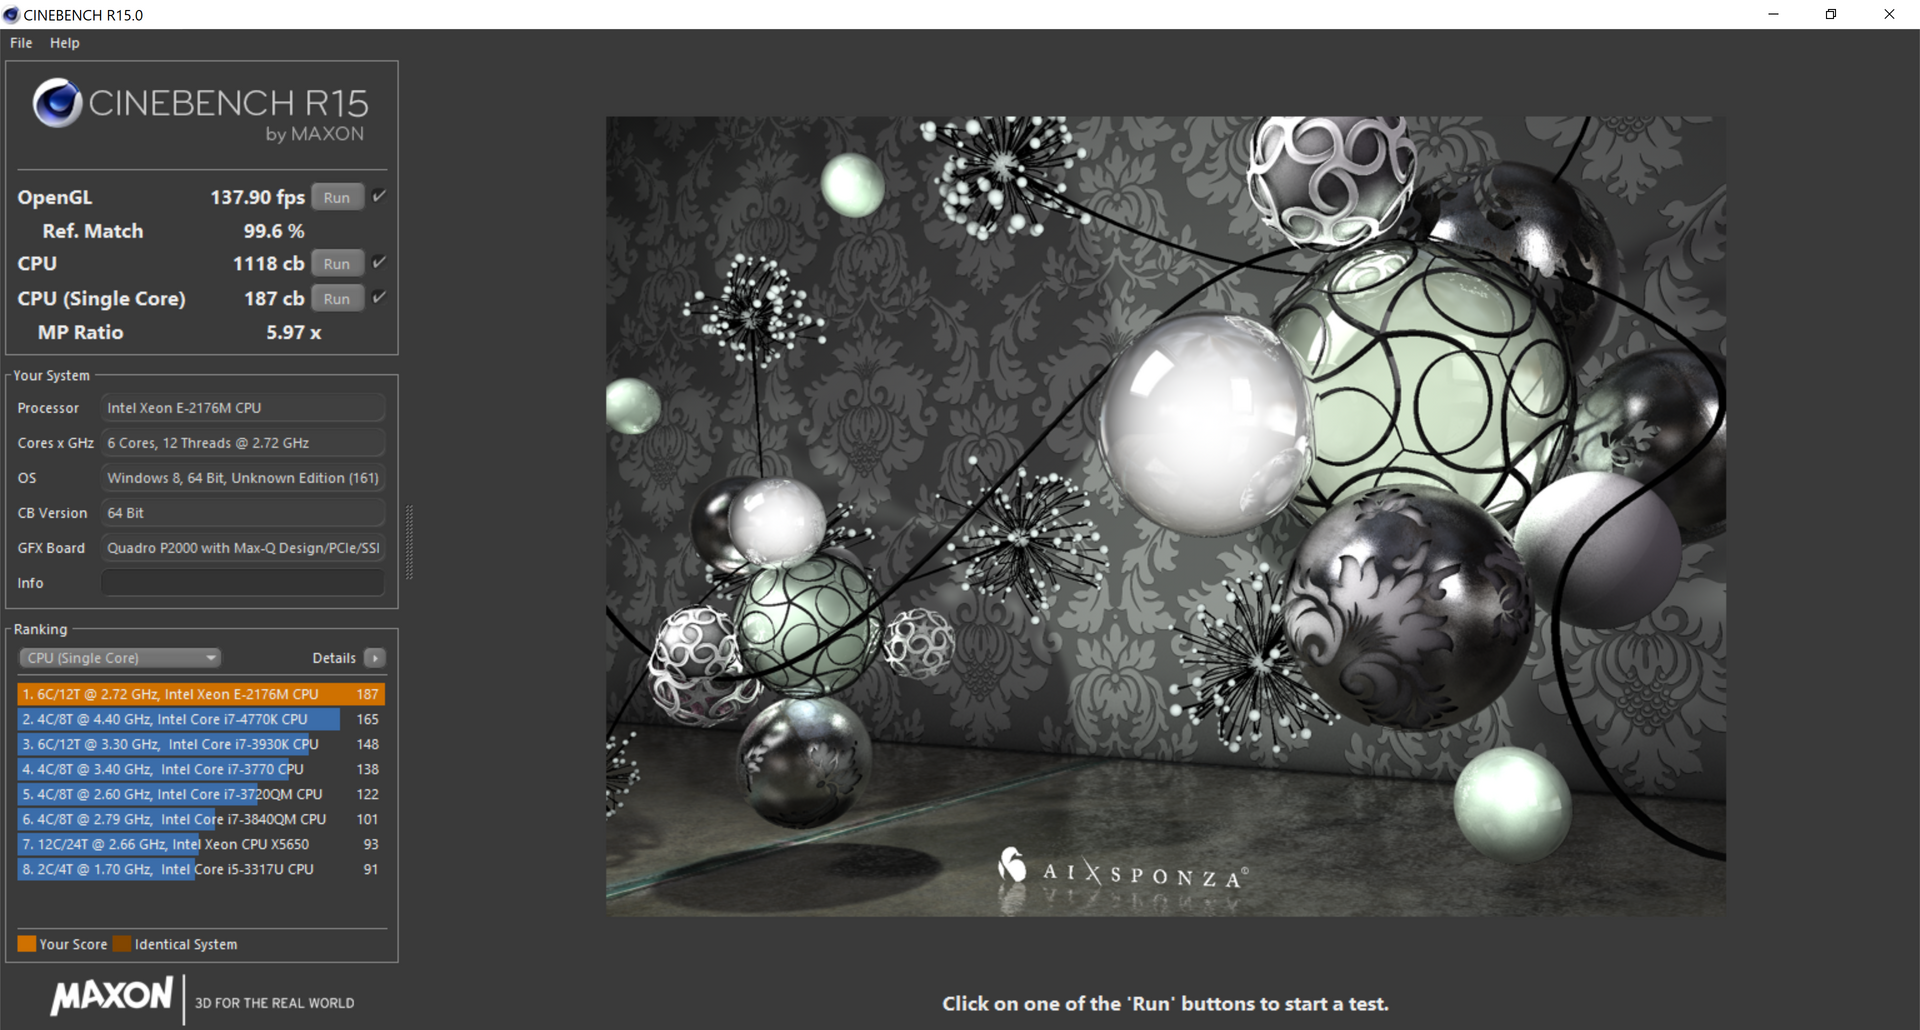
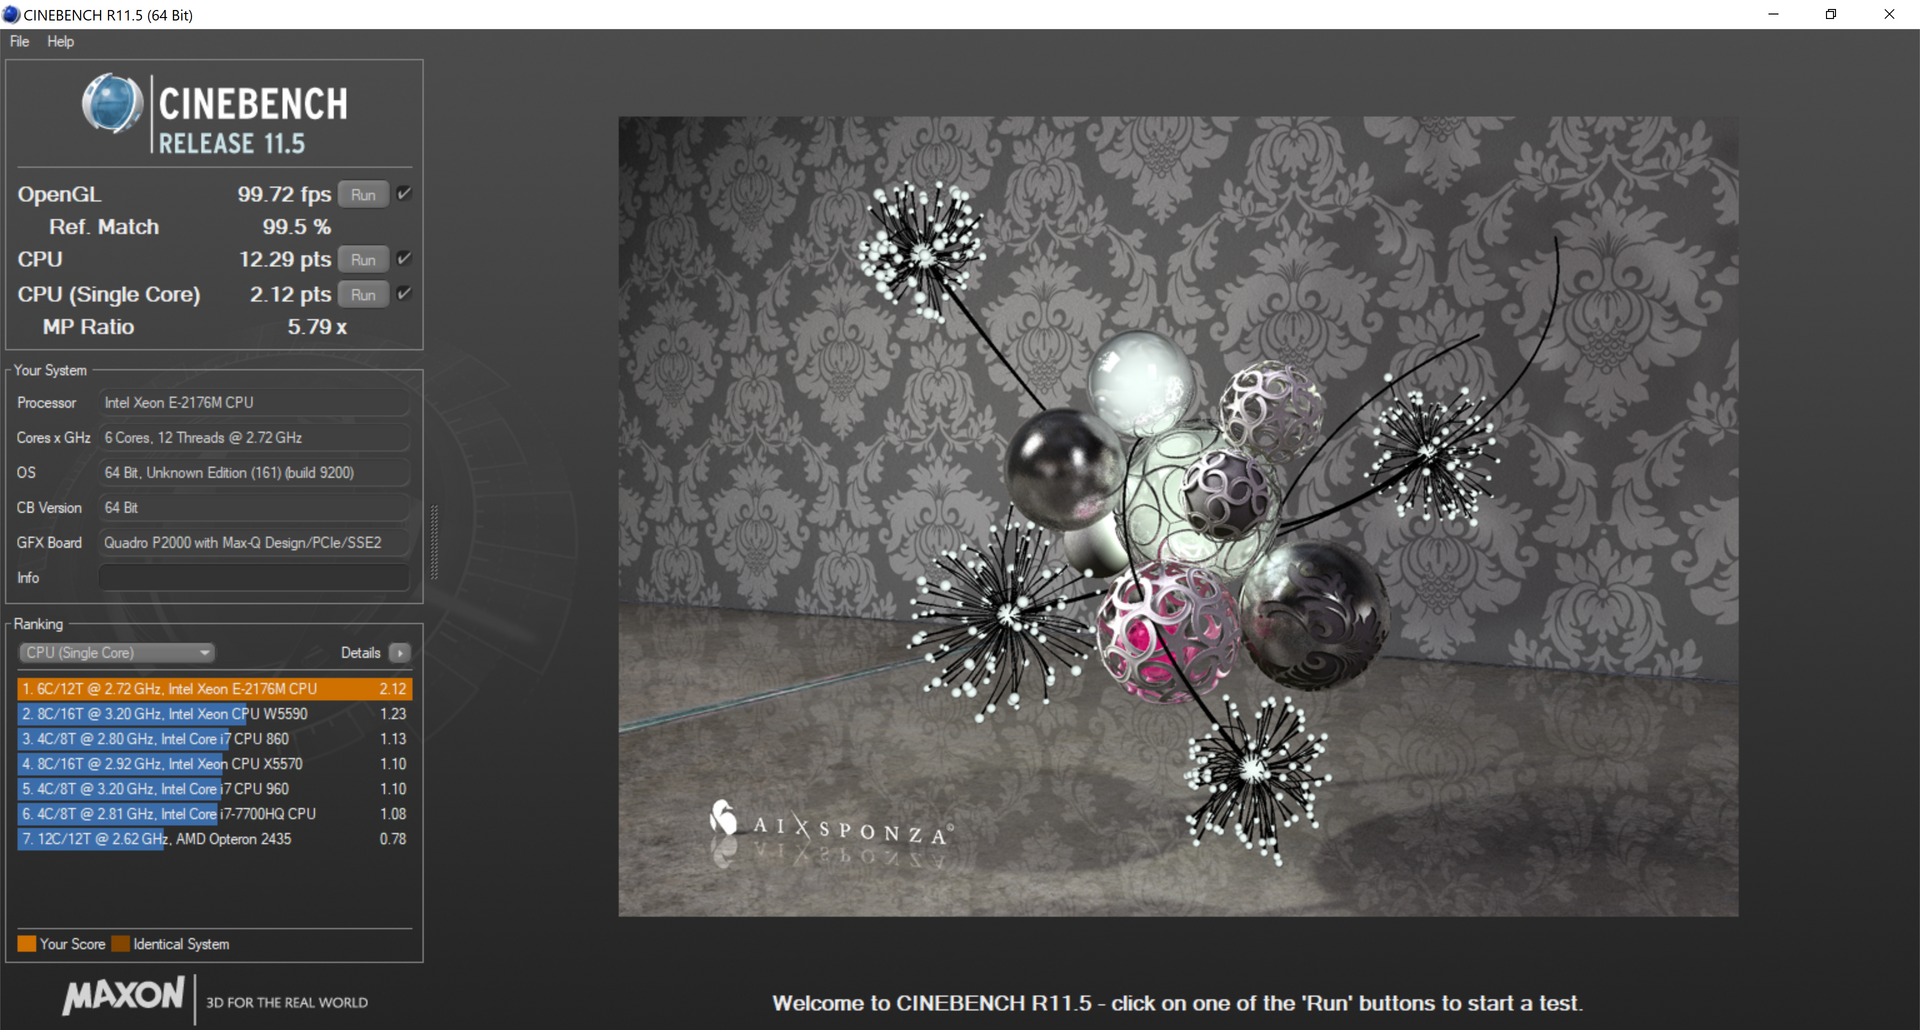
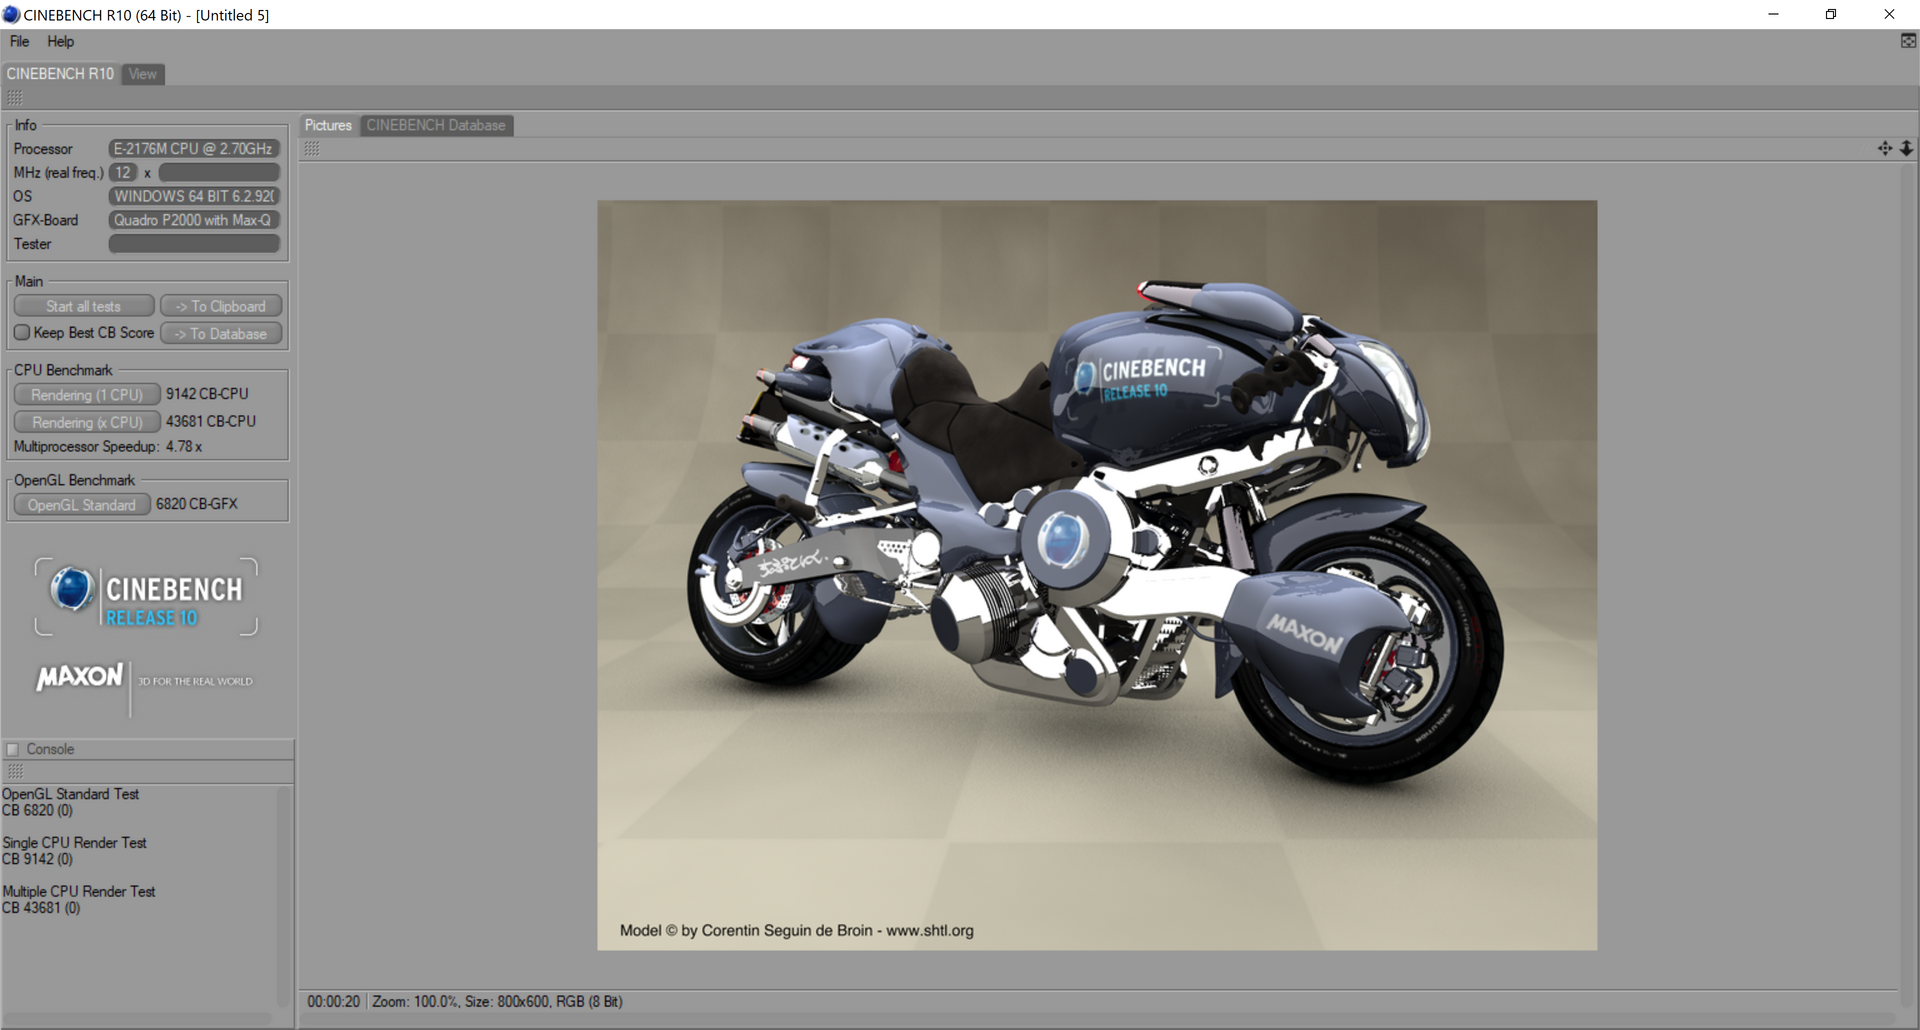
How does the CPU perform, though, in our array of tests? Thanks to its higher clock rates, in single-threaded operations, it tops the charts: 187 points in Cinebench R15 1-CPU (2 points behind the Precision 5530) and 2.12 points in Cinebench R11.5 1-CPU, some 6% above i7-8750H-equipped machines (such as the X1 Extreme). However, in multi-threaded benchmarks, the differences evaporate, with a score of 1118 points in Cinebench R15 x-CPU (vs. 1135 in our original tests of the X1 Extreme) and 12.29 points in the respective test within Cinebench R11.5. In the case of our X1 Extreme, undervolting the CPU actually resulted in superior performance by around 8% in the Cinebench R15 test, so there’s reason to believe similar results could be achieved with the P1 with the same strategy.
Without any CPU voltage adjustments in play, the ThinkPad P1 starts with a score of 1121 in our Cinebench R15 multi-CPU loop test before dropping into the 1015 – 1030 range for subsequent runs. The stock X1 Extreme (powered by its Core i7-8750H) has a marginal advantage here, as we noted earlier; it begins with a score of 1127 and then drops (runs 2 - ∞) into the 1050 – 1070 range. Apart from the MacBook Pro 15, which performs marginally better than the P1 in the sustained performance test, the P1 is in line with the rest of the competition here. Such a result doesn’t inspire a great amount of confidence in the actual performance premiums one might hope to expect from the pricier Xeon CPU. As far as our tests are concerned, it seems that the Xeon P1 actually loses out to i7-equipped machines in multi-core performance but manages superior results in single-core tests. Naturally, the fact that ECC RAM is also supported may prove to be of greater interest to companies indulging in professional CAD software and the like.
Speaking of which, the only machine we’ve reviewed that shares the P1’s Xeon E-2176M CPU is the Dell Precision 5530 (back in August), and in multi-core performance, the P1 edges out the Precision by a couple of percentage points on average. The two machines are more closely-matched in single-core tests, but across the board, the P1 still fares better here.
System Performance
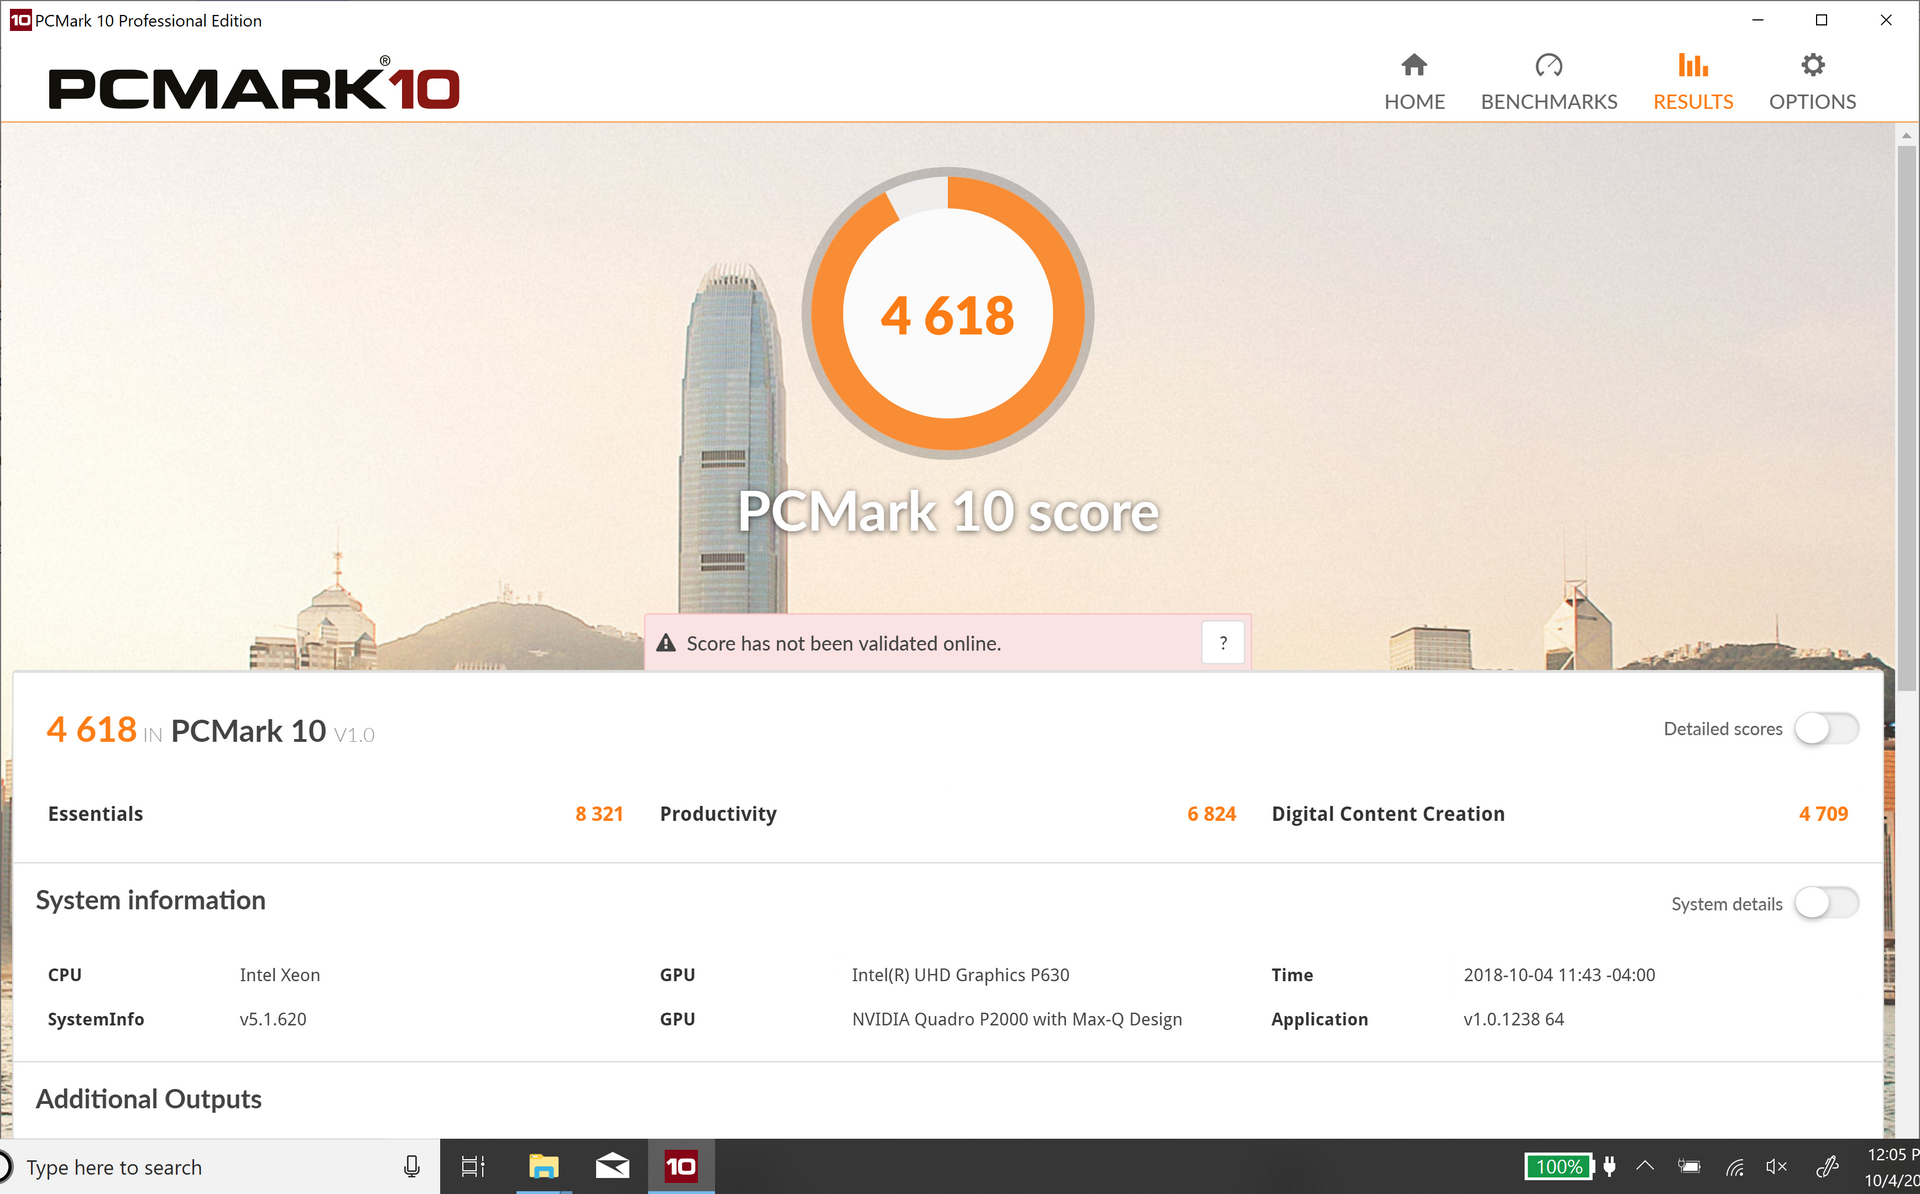
Subjectively, system performance is never a problem with the P1: we haven’t experienced any hiccups, hangs, or other concerns during our time with the test unit. Synthetically, the PCMark scores (such as the 4618 we received in PCMark 10) are actually a few percentage points below those we recorded from the X1 Extreme (and some 7 to 11 percent below the Precision 5530), but such discrepancies aren’t obvious during daily use, and their origins are not clear. As we often point out, suffice it to say that all of the machines in today’s comparison field in this section feel fast enough such that any small differences in synthetic performance results are not likely to bare themselves out in tangible form.
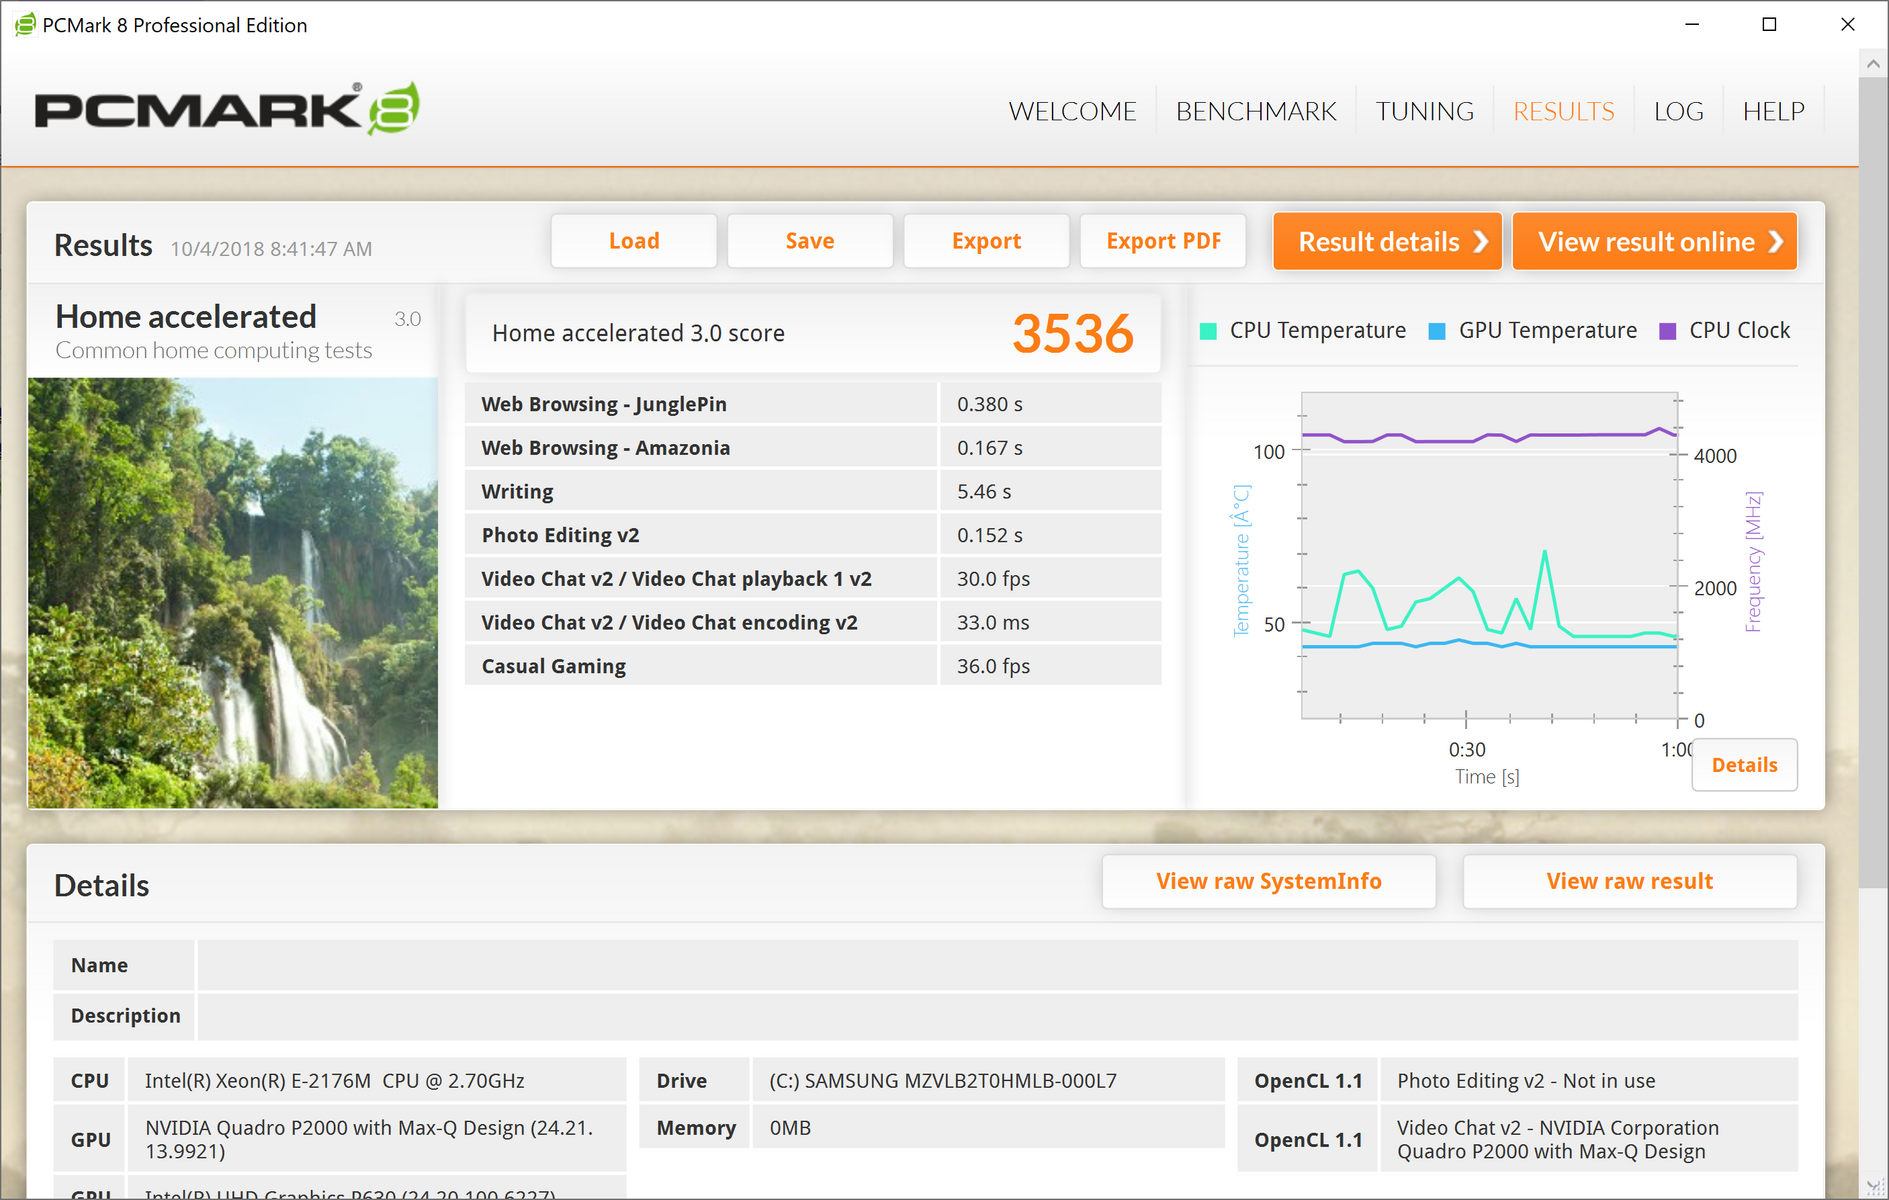
| PCMark 8 Home Score Accelerated v2 | 3536 points | |
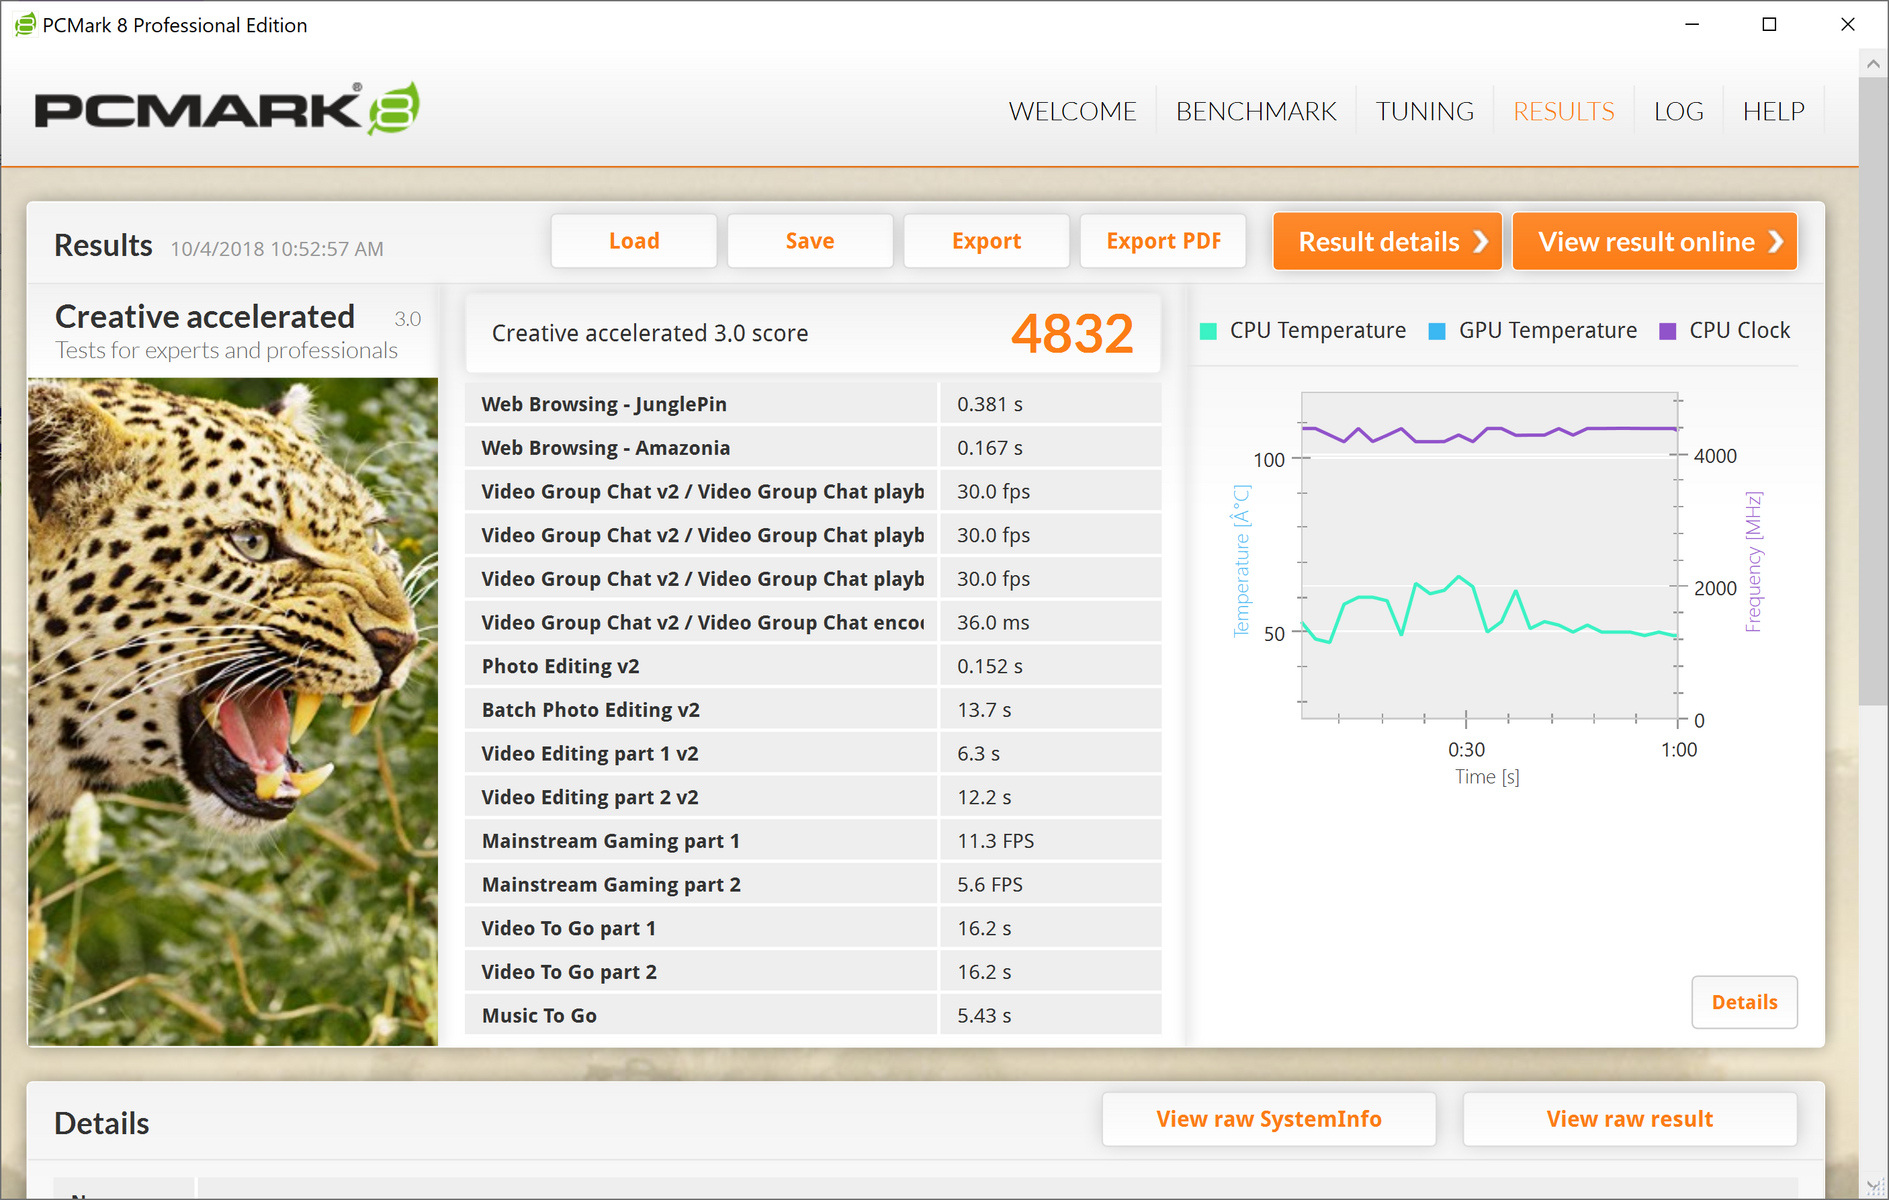
| PCMark 8 Creative Score Accelerated v2 | 4832 points | |
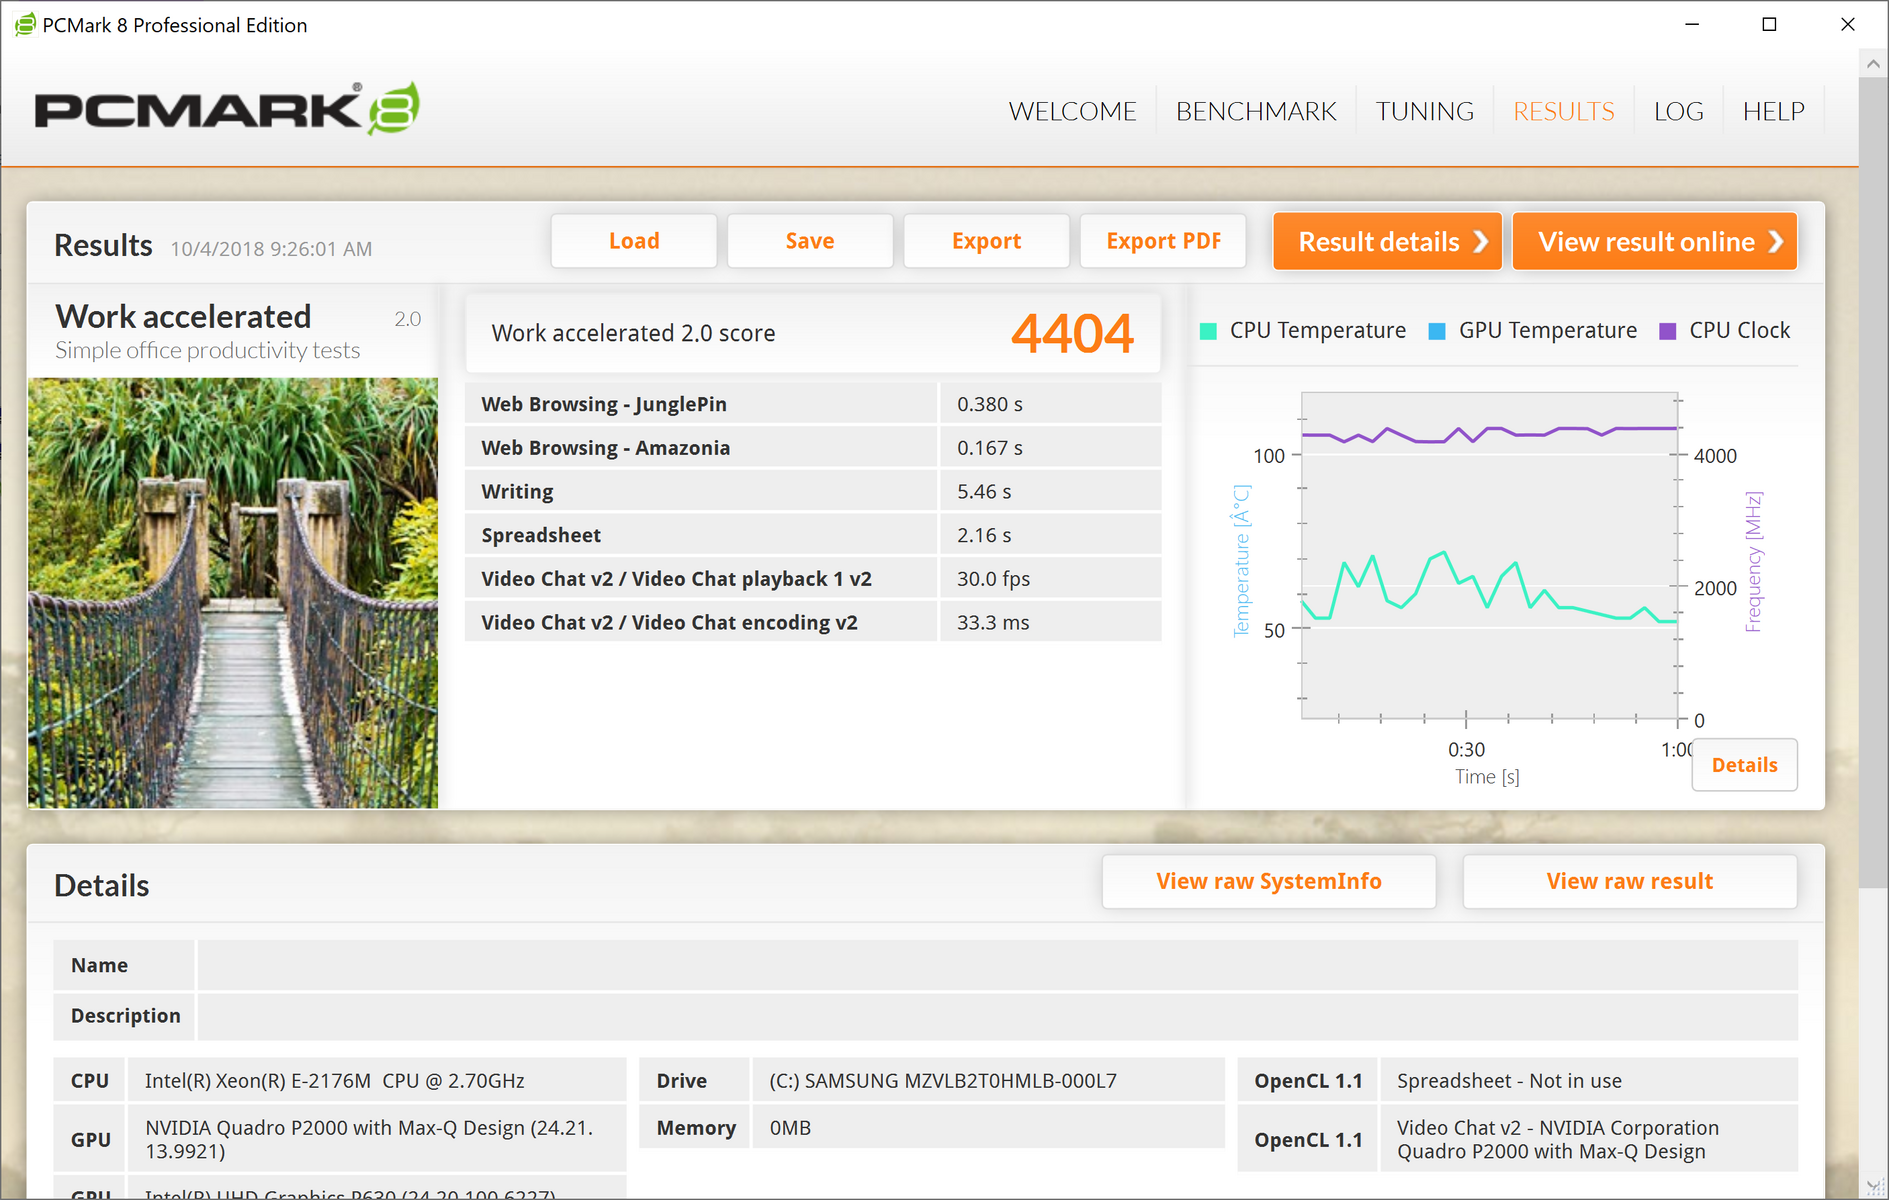
| PCMark 8 Work Score Accelerated v2 | 4404 points | |
| PCMark 10 Score | 4618 points | |
Help | ||
Storage Devices
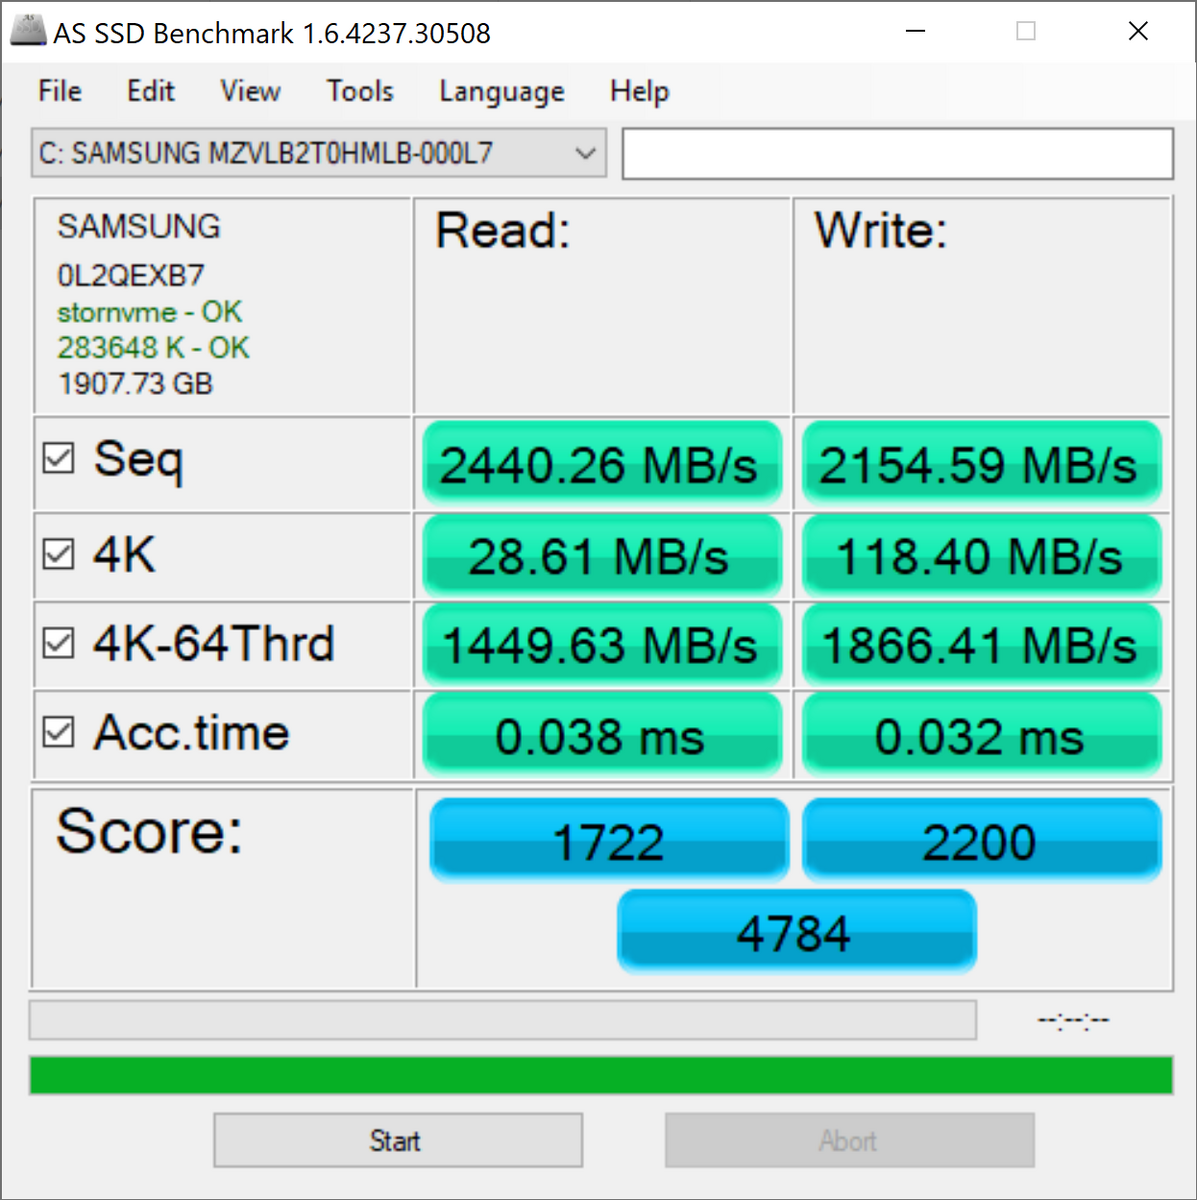
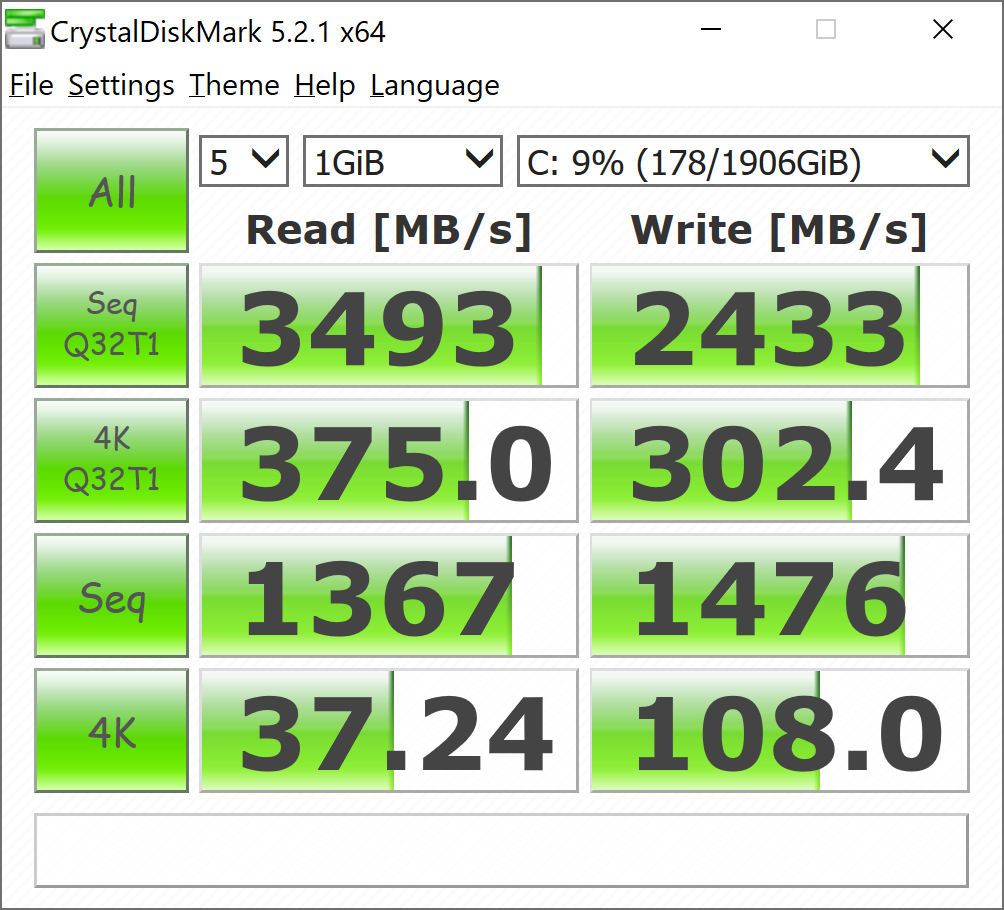
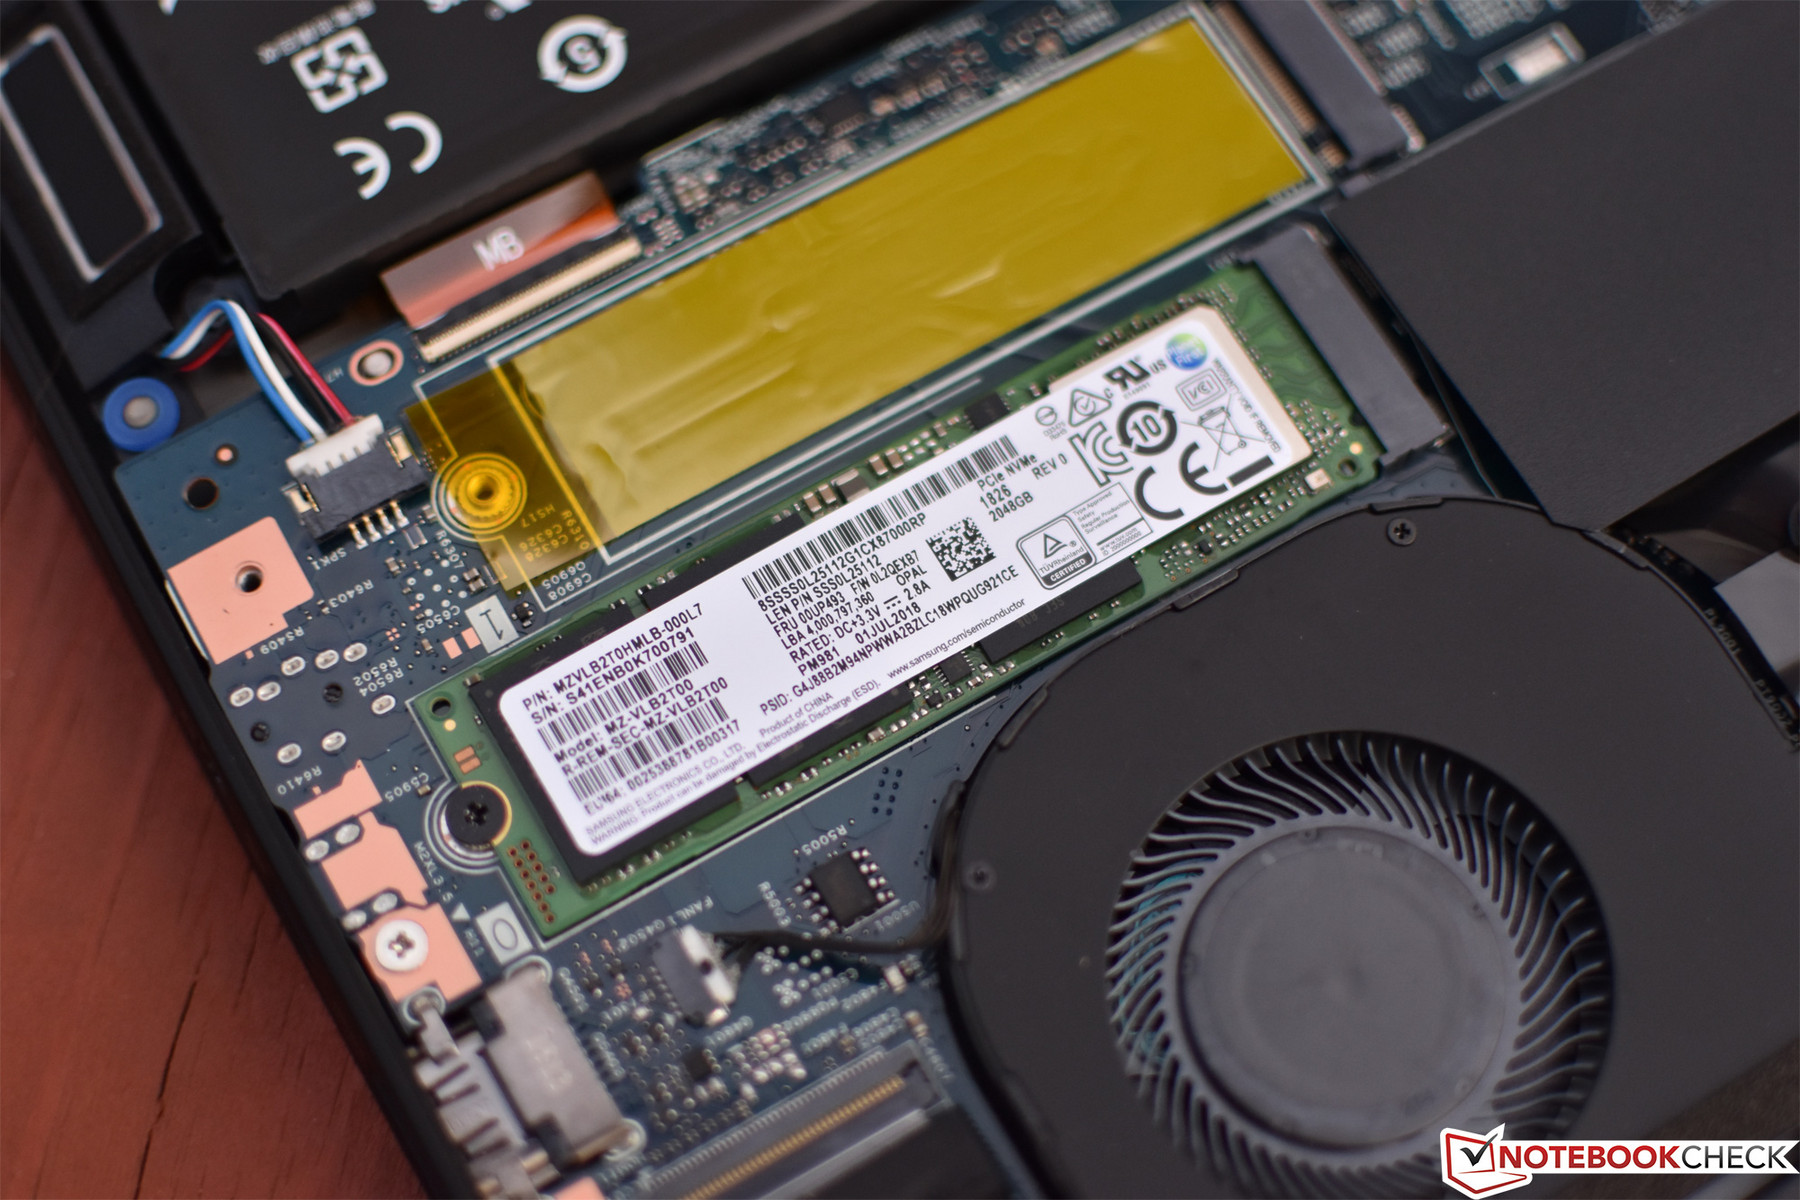
Storage performance is also not a concern on the ThinkPad P1. Our test unit arrived with a massive 2 TB Samsung PM981 NVMe SSD installed—a very expensive, and uncommon, piece of hardware indeed. With 4K-64 Read/Write speeds of 1449.63 / 1866.41 MB/s, however, as well as an overall AS SSD Score of 4784, if you’re looking for capacity and speed, this drive is quite clearly a good choice.
What’s more, the P1 actually provides two separate M.2 NVMe (PCIe-x4) slots, one of which is unpopulated in our review unit. That means that hypothetically the user could add a second 2 TB SSD, bringing the total capacity to 4 TB. Or, alternatively, the drives can be configured in RAID-0 for performance or RAID-1 for data redundancy. Again, upgrades and maintenance are a cinch on the ThinkPad P1, so this wouldn’t be too much trouble to implement as an aftermarket solution.
There is no conventional 2.5-inch drive bay within the P1, which isn’t surprising given the trends of the industry.
| Lenovo ThinkPad P1-20MD002LUS Samsung SSD PM981 MZVLB2T0HMLB | Lenovo ThinkPad X1 Extreme-20MF000XGE Samsung SSD PM981 MZVLB1T0HALR | Dell Precision 5530 Xeon E-2176M SK hynix PC400 512 GB | HP EliteBook 1050 G1-4QY20EA Toshiba XG5-P KXG50PNV2T04 | Apple MacBook Pro 15 2018 (2.6 GHz, 560X) Apple SSD AP0512 | Average Samsung SSD PM981 MZVLB2T0HMLB | |
|---|---|---|---|---|---|---|
| AS SSD | 19% | -37% | -38% | -97% | 4% | |
| Score Total (Points) | 4784 | 5355 12% | 2922 -39% | 2768 -42% | 2119 -56% | 4881 ? 2% |
| Score Write (Points) | 2200 | 2147 -2% | 1121 -49% | 1153 -48% | 347 -84% | 2139 ? -3% |
| Score Read (Points) | 1722 | 2132 24% | 1226 -29% | 1120 -35% | 1199 -30% | 1828 ? 6% |
| Access Time Write * (ms) | 0.032 | 0.028 12% | 0.053 -66% | 0.056 -75% | 0.0295 ? 8% | |
| Access Time Read * (ms) | 0.038 | 0.034 11% | 0.073 -92% | 0.051 -34% | 0.225 -492% | 0.0485 ? -28% |
| 4K-64 Write (MB/s) | 1866 | 1782 -5% | 926 -50% | 953 -49% | 163.5 -91% | 1789 ? -4% |
| 4K-64 Read (MB/s) | 1450 | 1805 24% | 970 -33% | 856 -41% | 965 -33% | 1527 ? 5% |
| 4K Write (MB/s) | 118.4 | 130.9 11% | 92.8 -22% | 105.4 -11% | 18.78 -84% | 128.8 ? 9% |
| 4K Read (MB/s) | 28.61 | 56.8 99% | 38.43 34% | 19.07 -33% | 9.46 -67% | 39.1 ? 37% |
| Seq Write (MB/s) | 2155 | 2336 8% | 1022 -53% | 948 -56% | 1644 -24% | 2217 ? 3% |
| Seq Read (MB/s) | 2440 | 2703 11% | 2169 -11% | 2454 1% | 2239 -8% | 2628 ? 8% |
* ... smaller is better

GPU/Workstation Performance
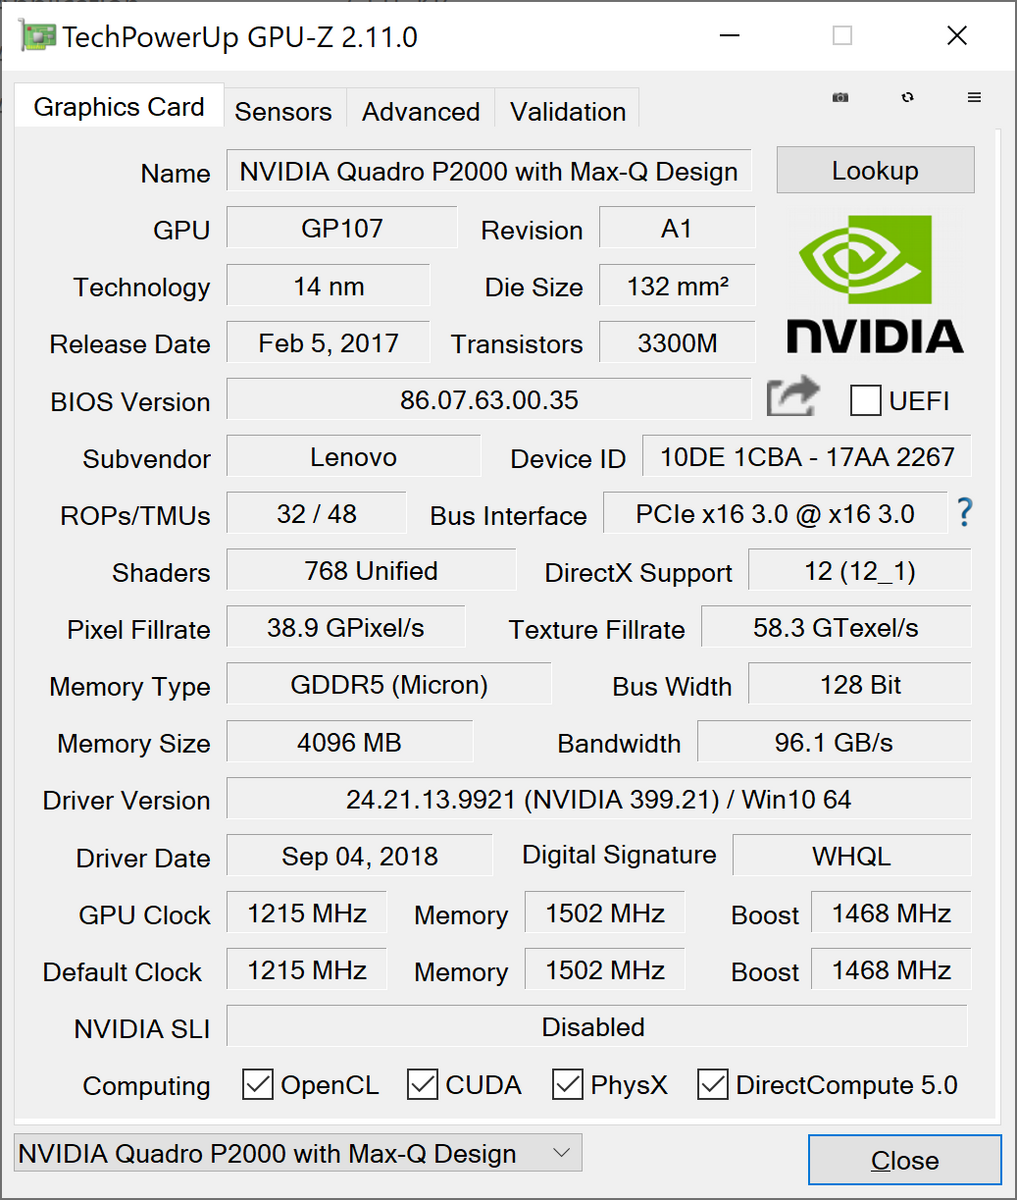
Another of the major differences between the X1 Extreme and the P1 is the GPU selection. Whereas the X1 Extreme is powered by a GeForce GTX 1050 Ti Max-Q, the ThinkPad P1 offers two GPU options, and both are workstation-class: the Quadro P1000 Max-Q and P2000 Max-Q. The differences in performance between these two options are notable; the P2000 alone is some 25 to 30 percent faster in our benchmarks, and since the GPU can’t be upgraded aftermarket, it’s important to opt for the one that fits your needs from the outset. It’ll be interesting to see how well the Max-Q variant of the P2000, which is likely to perform closer to the P1000, handles our testing today.
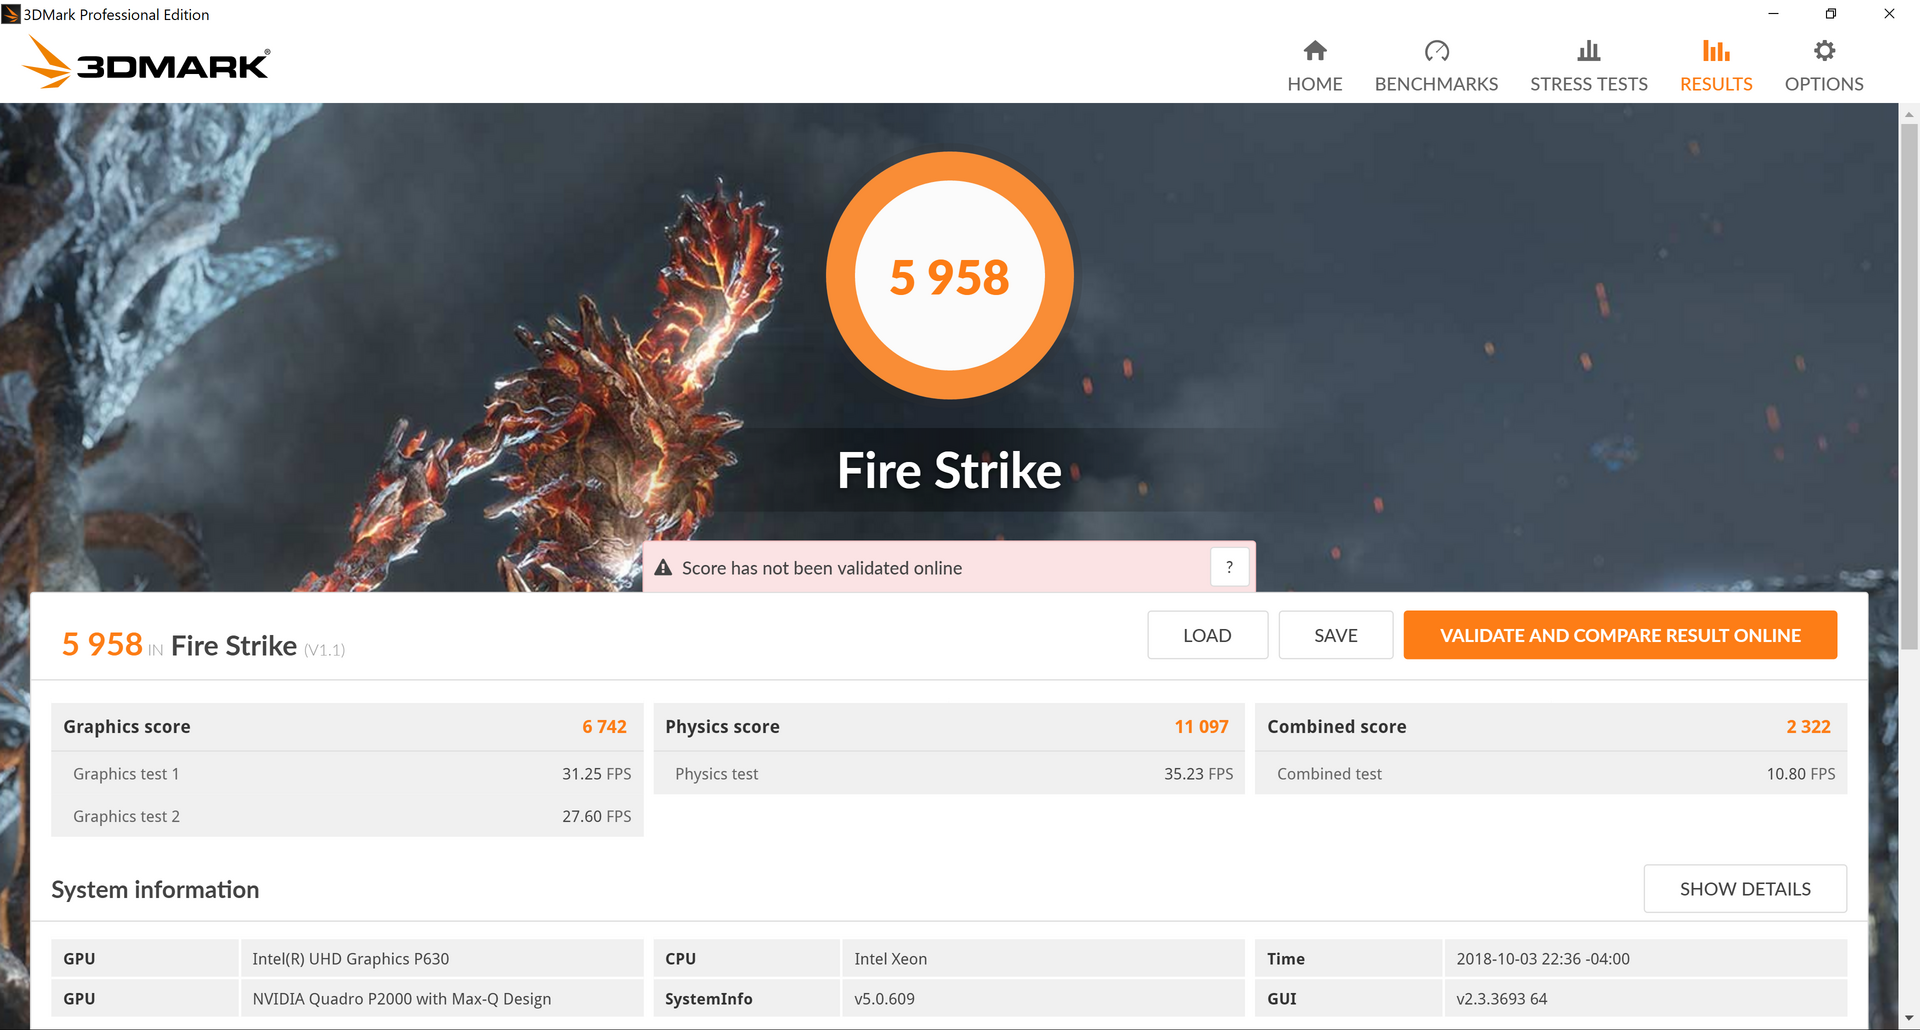
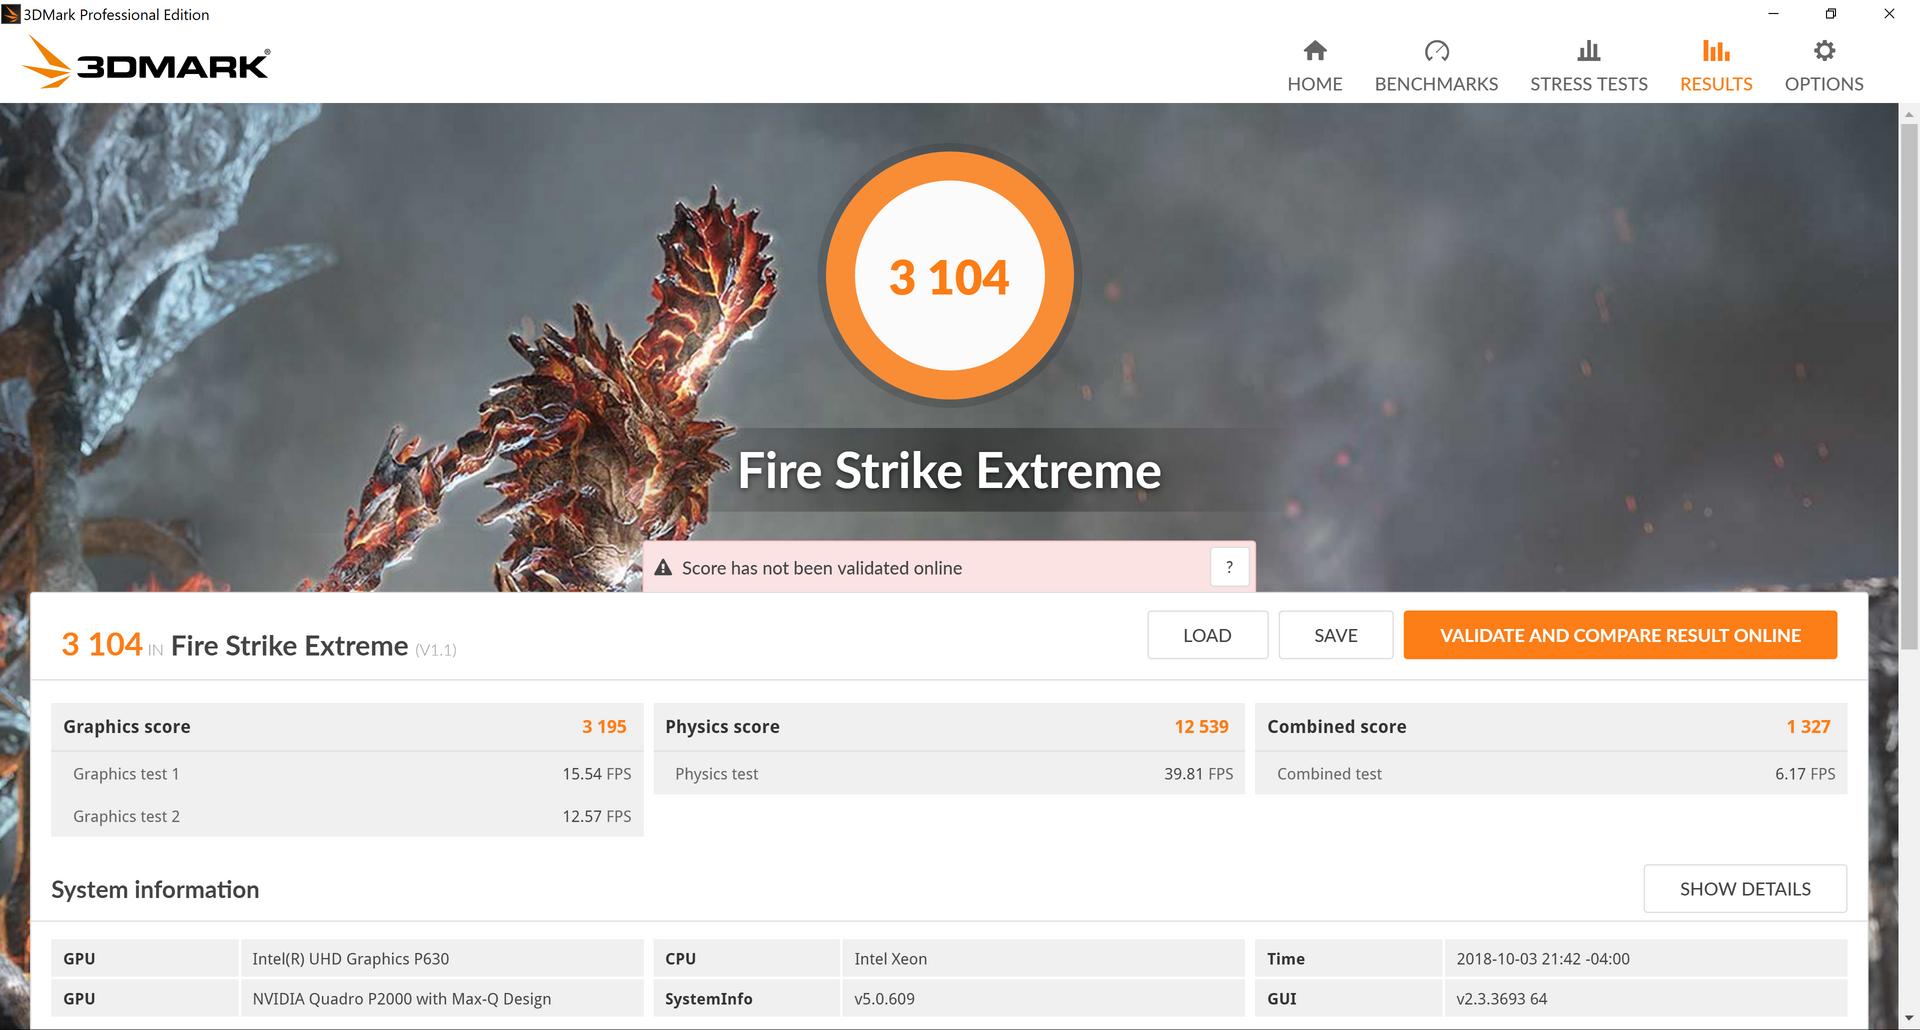
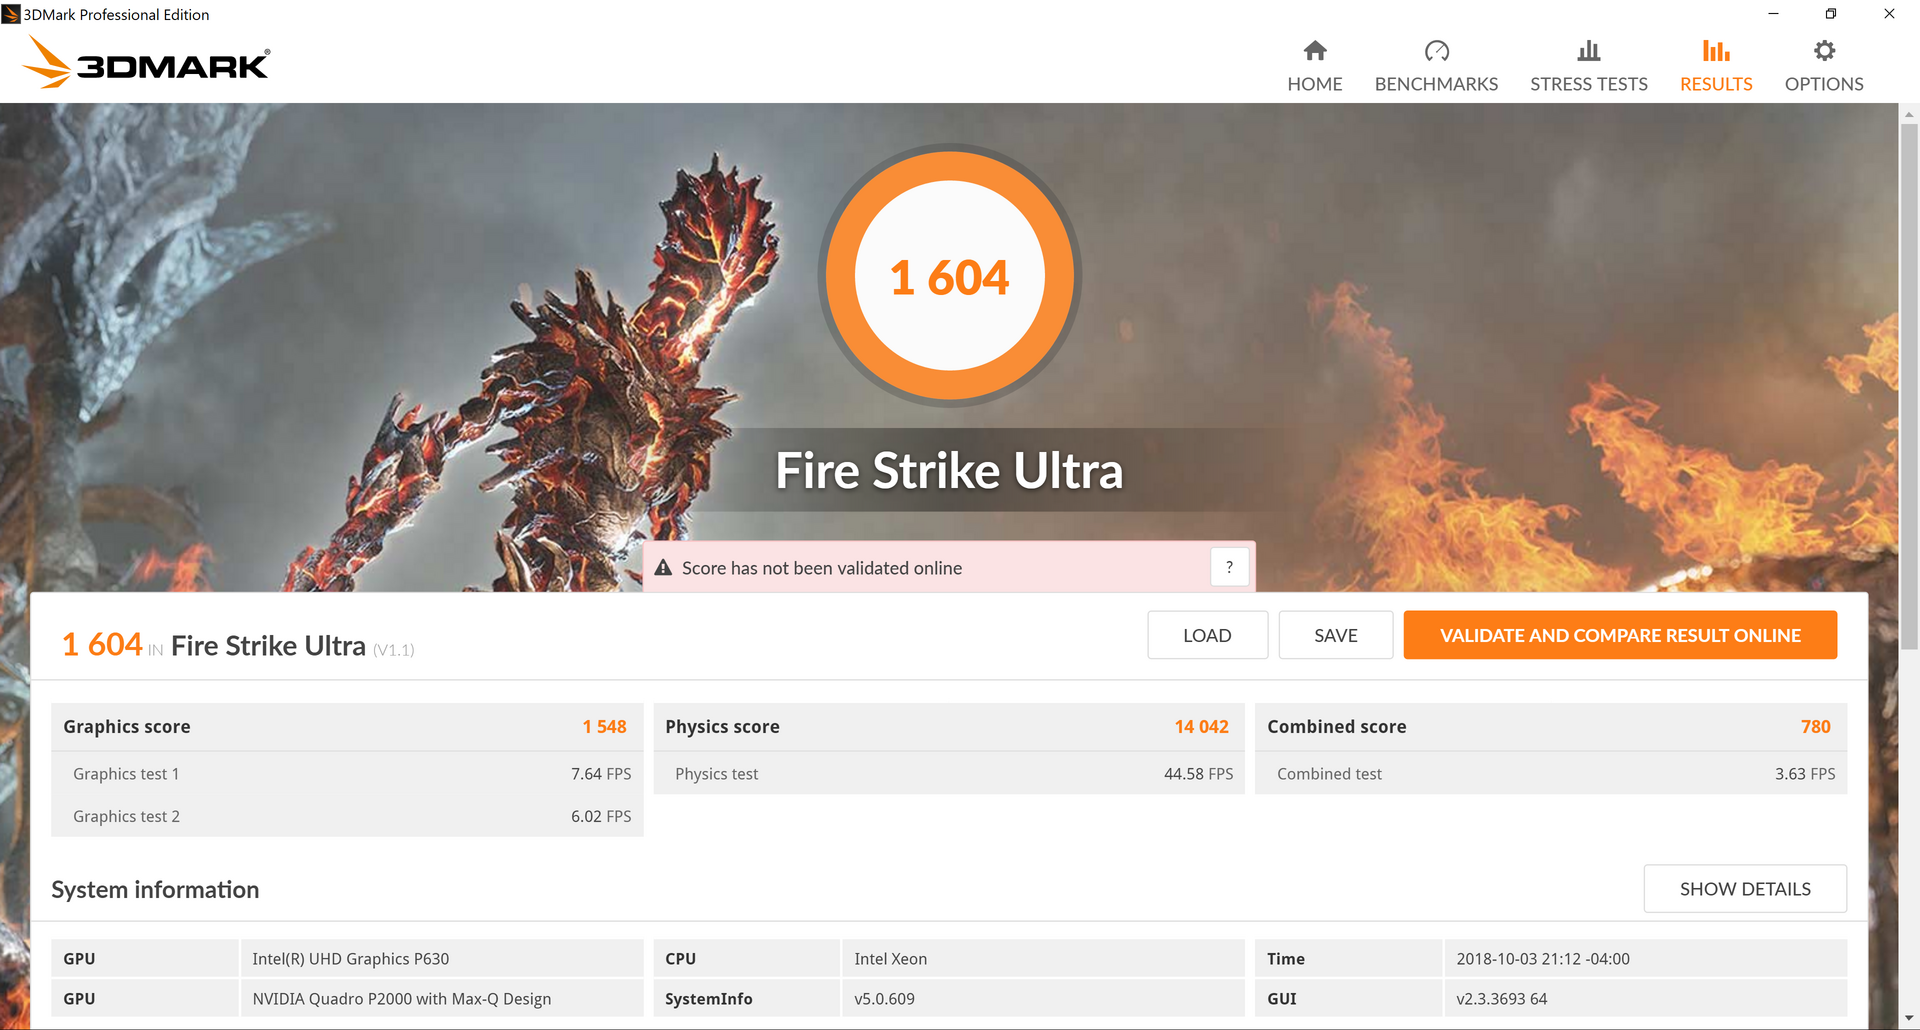
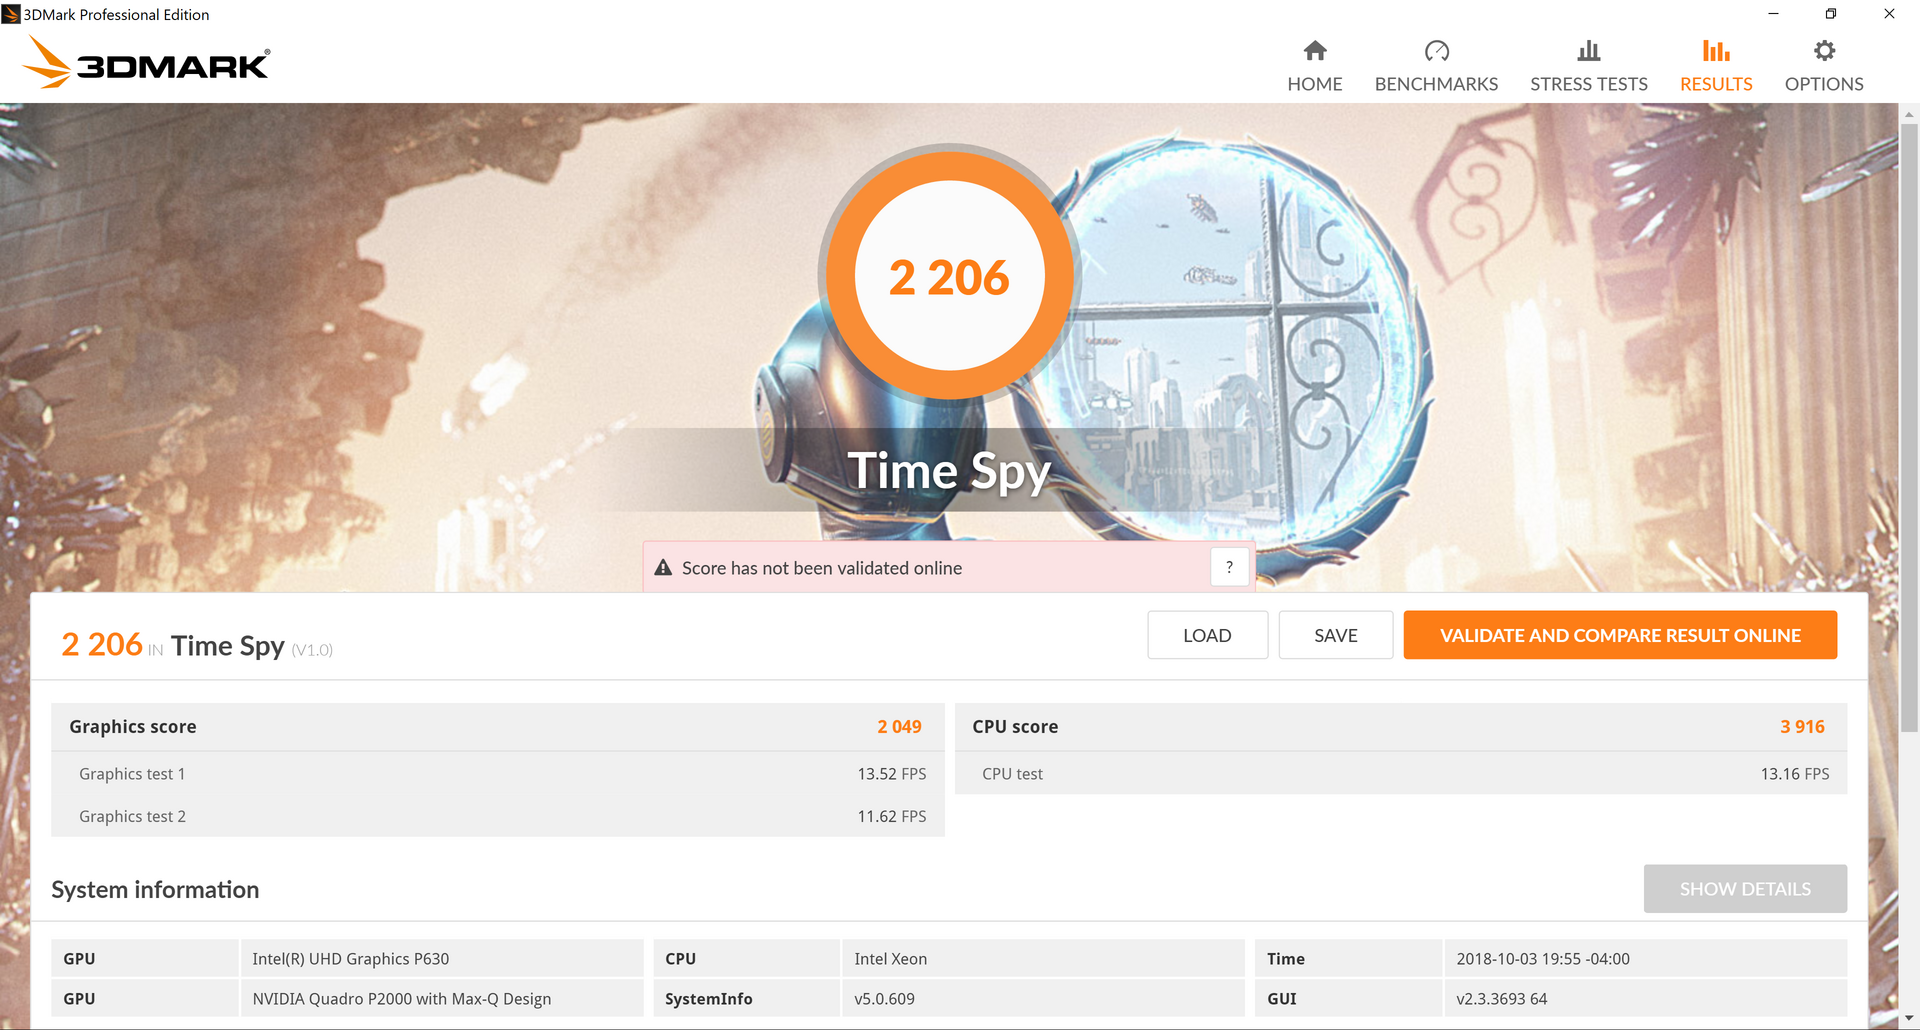
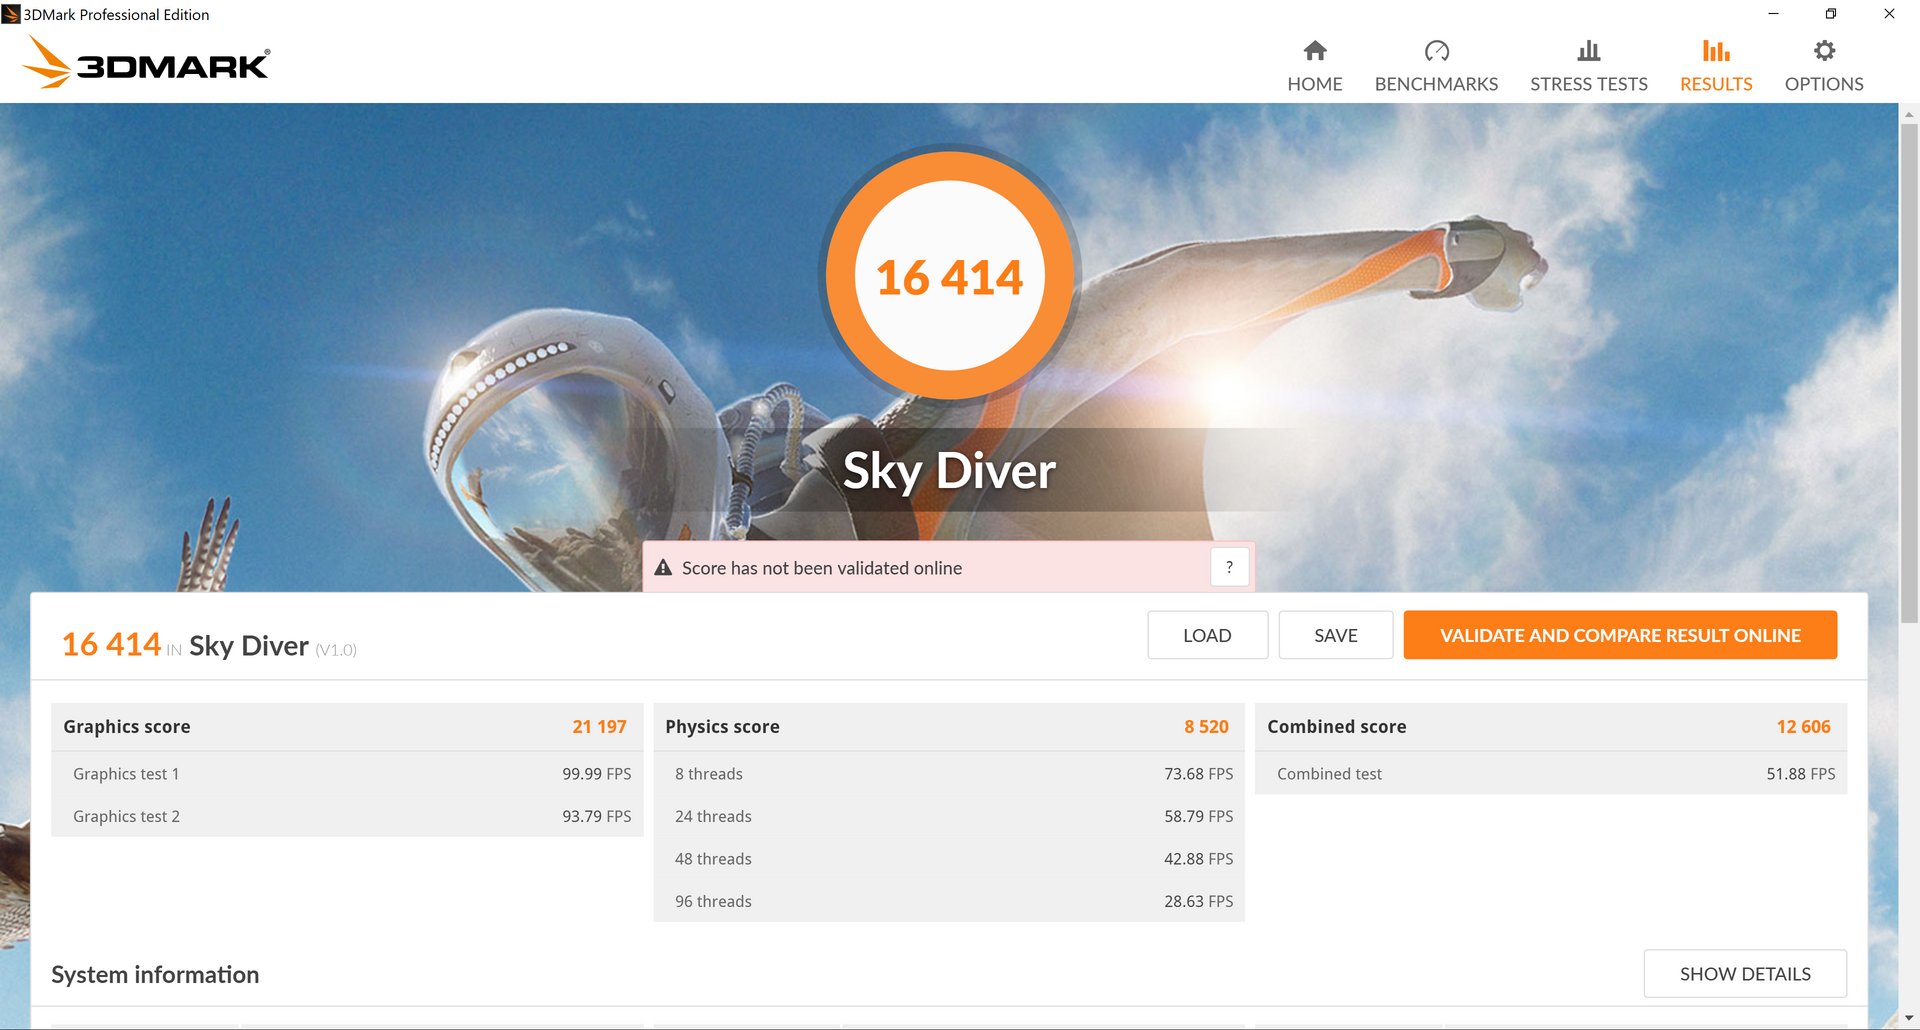
NVIDIA Quadro GPUs are professional graphics adapters and as such are not optimized for gaming (or gaming benchmarks) as are the GeForce GTX series GPUs. The X1 Extreme posts scores about 6 to 10 percent higher than the P1 in our 3DMark benchmarks.


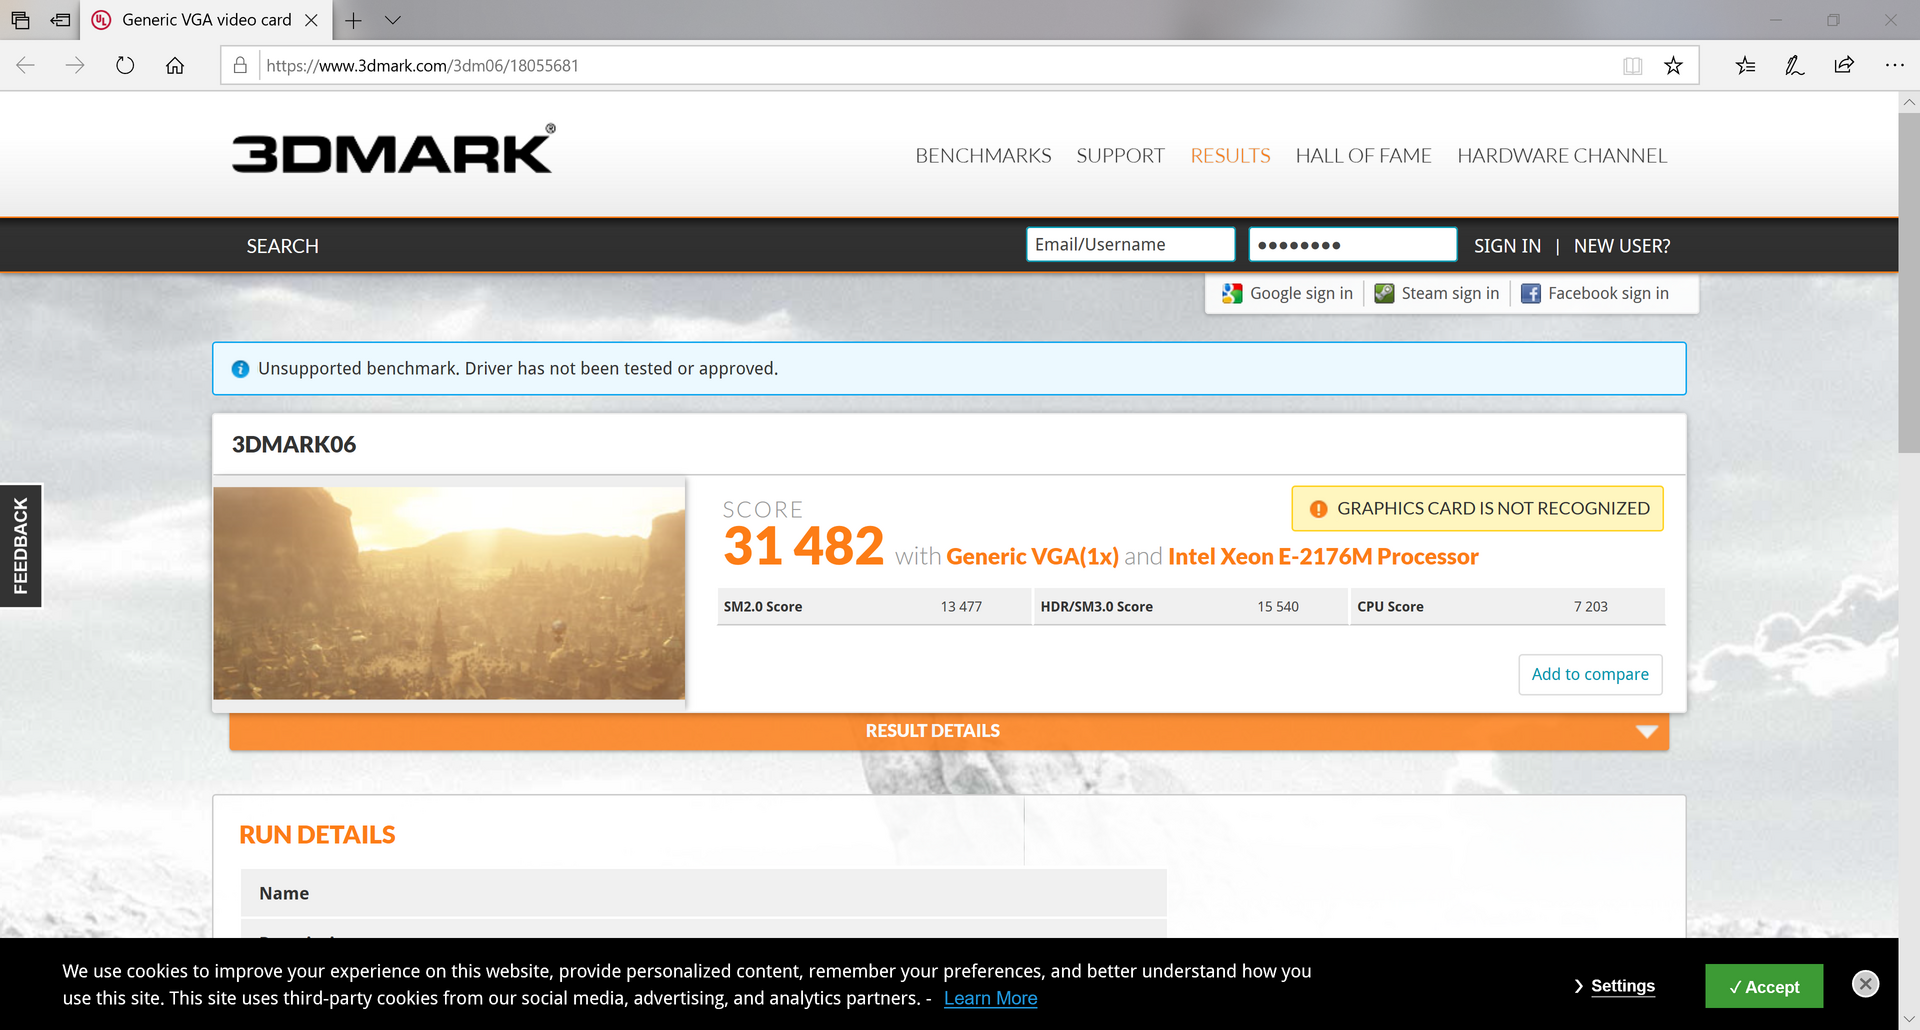
| 3DMark 06 Standard Score | 31482 points | |
| 3DMark Vantage P Result | 32724 points | |
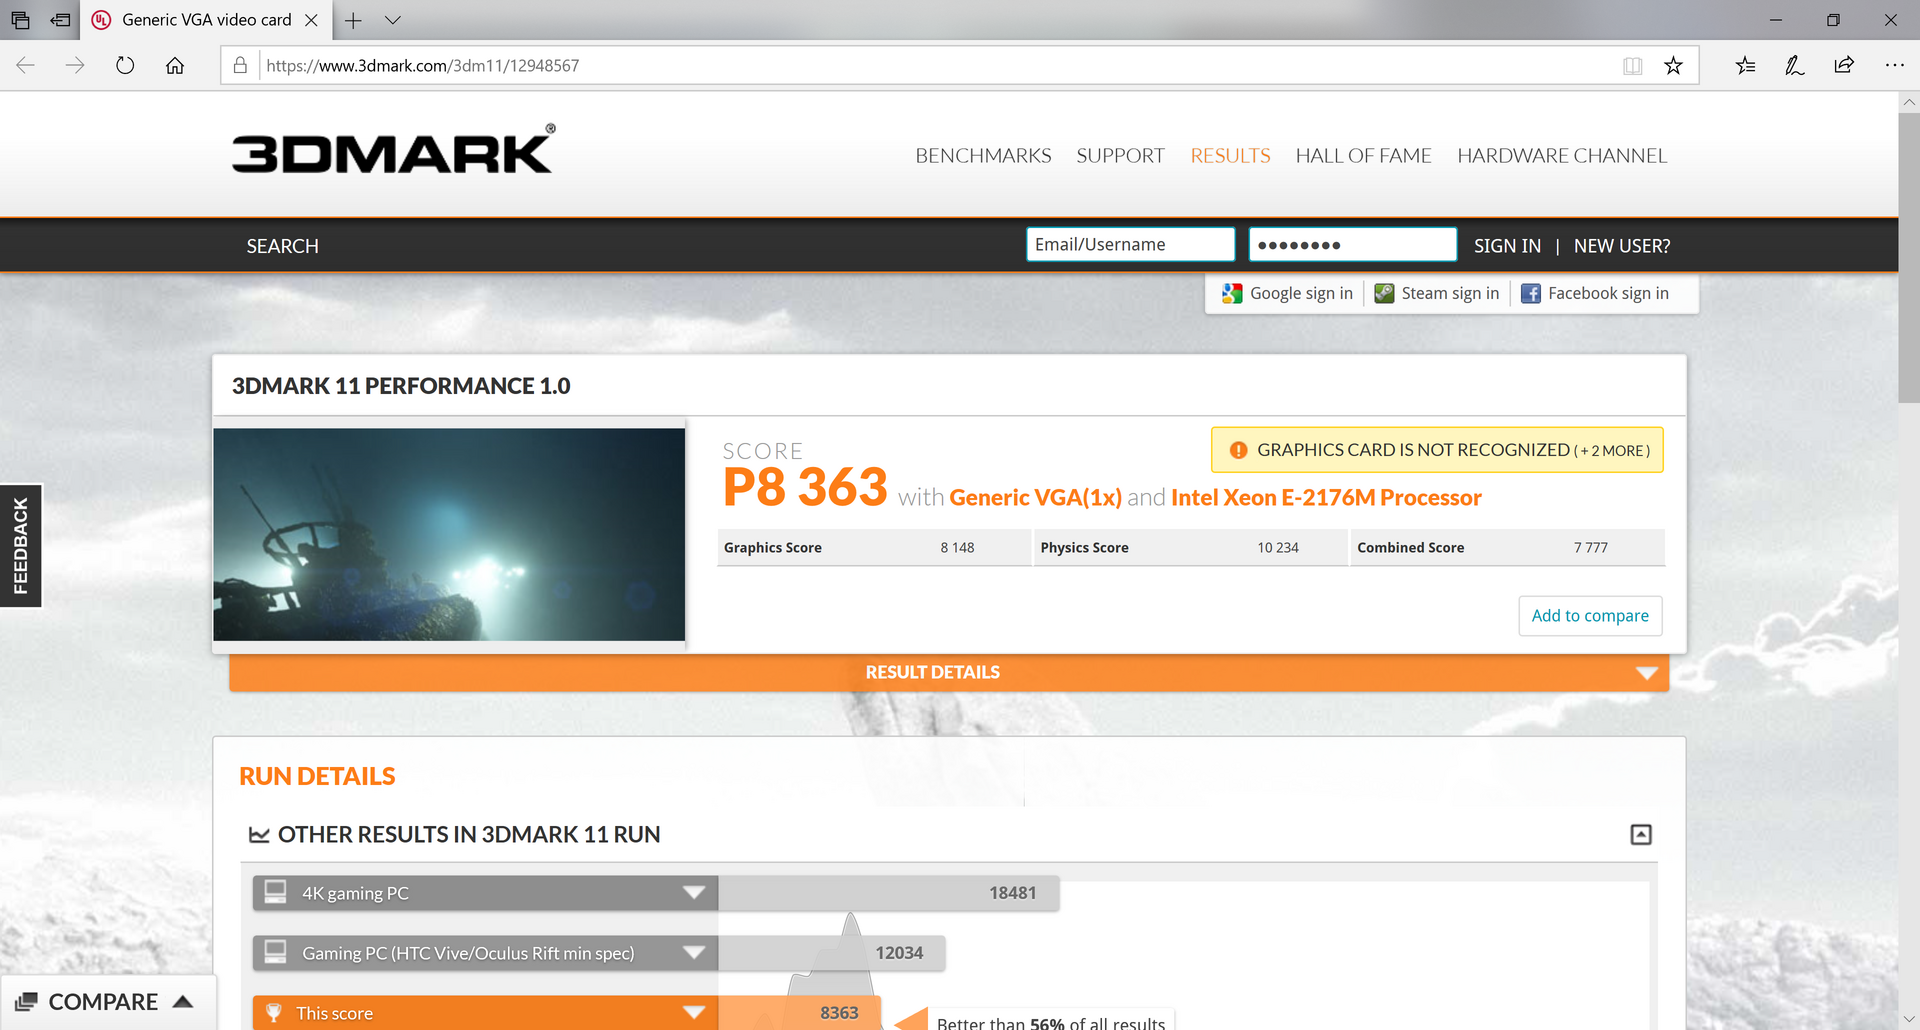
| 3DMark 11 Performance | 8363 points | |
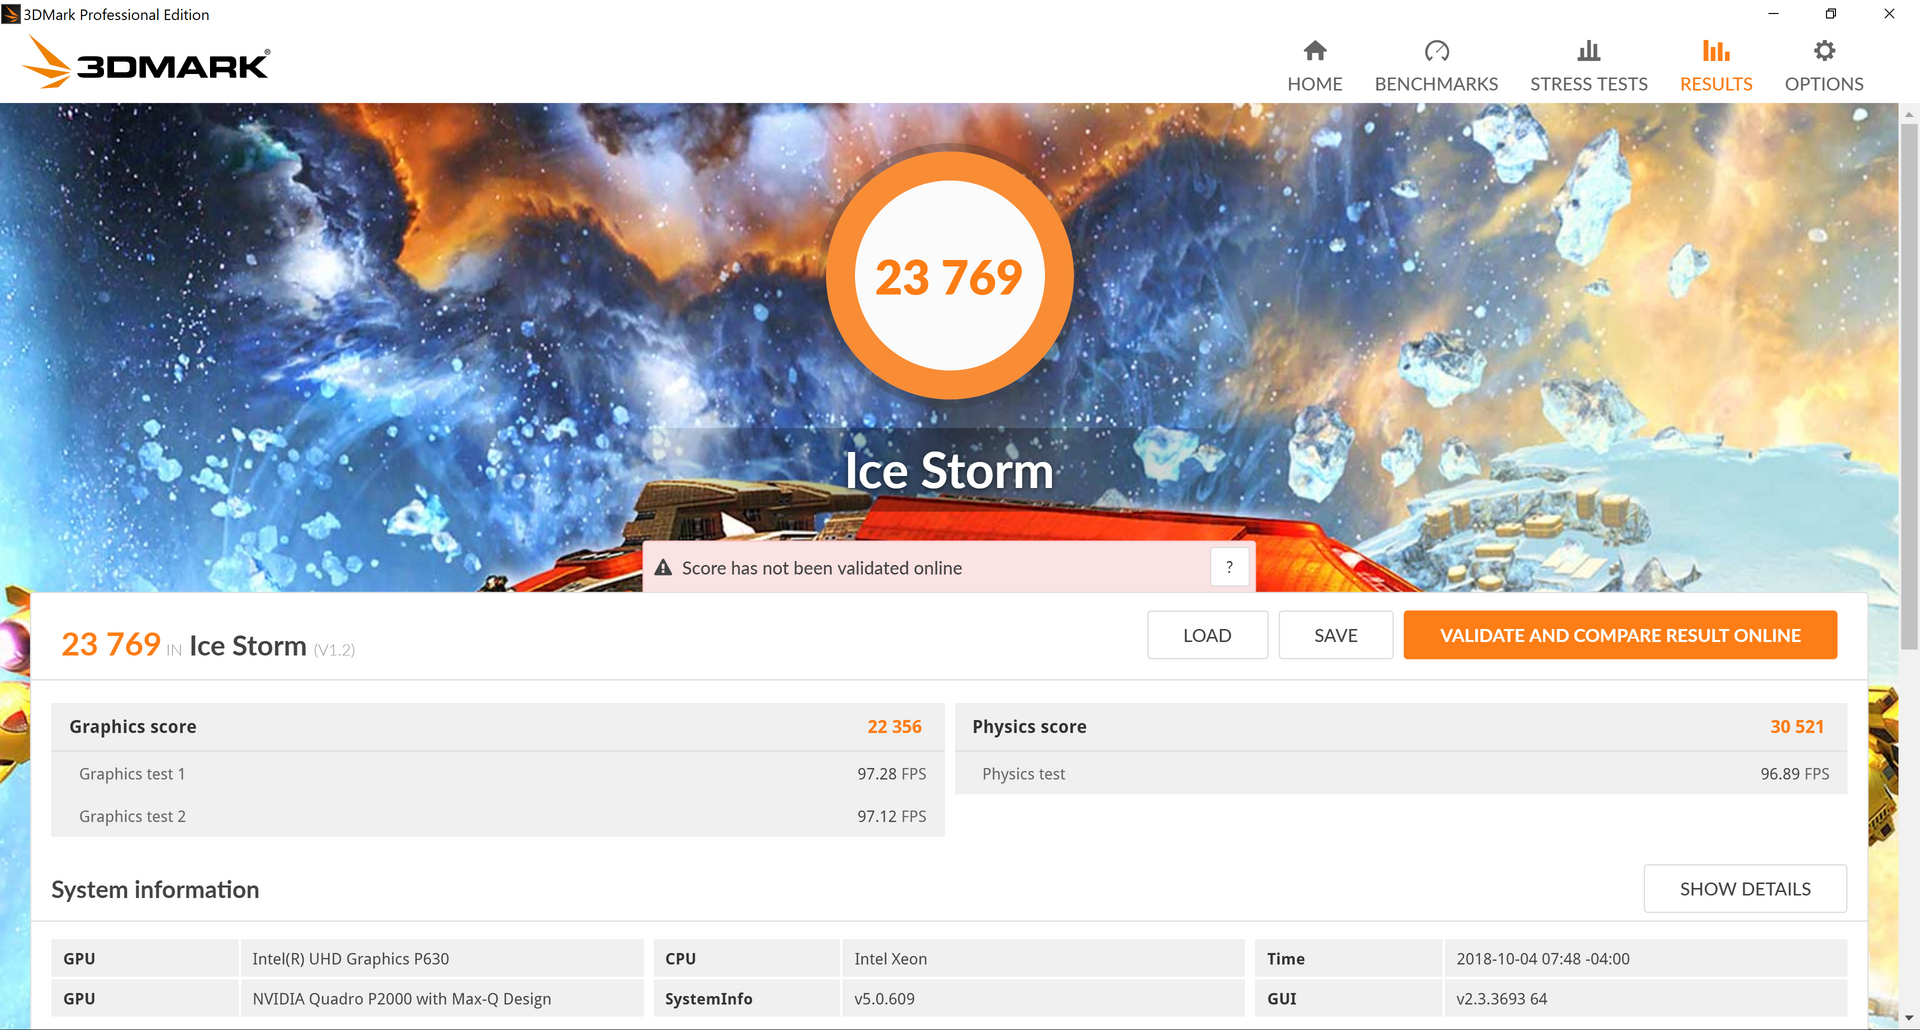
| 3DMark Ice Storm Standard Score | 23769 points | |
| 3DMark Cloud Gate Standard Score | 14996 points | |
| 3DMark Fire Strike Score | 5958 points | |
| 3DMark Fire Strike Extreme Score | 3104 points | |
| 3DMark Time Spy Score | 2206 points | |
Help | ||
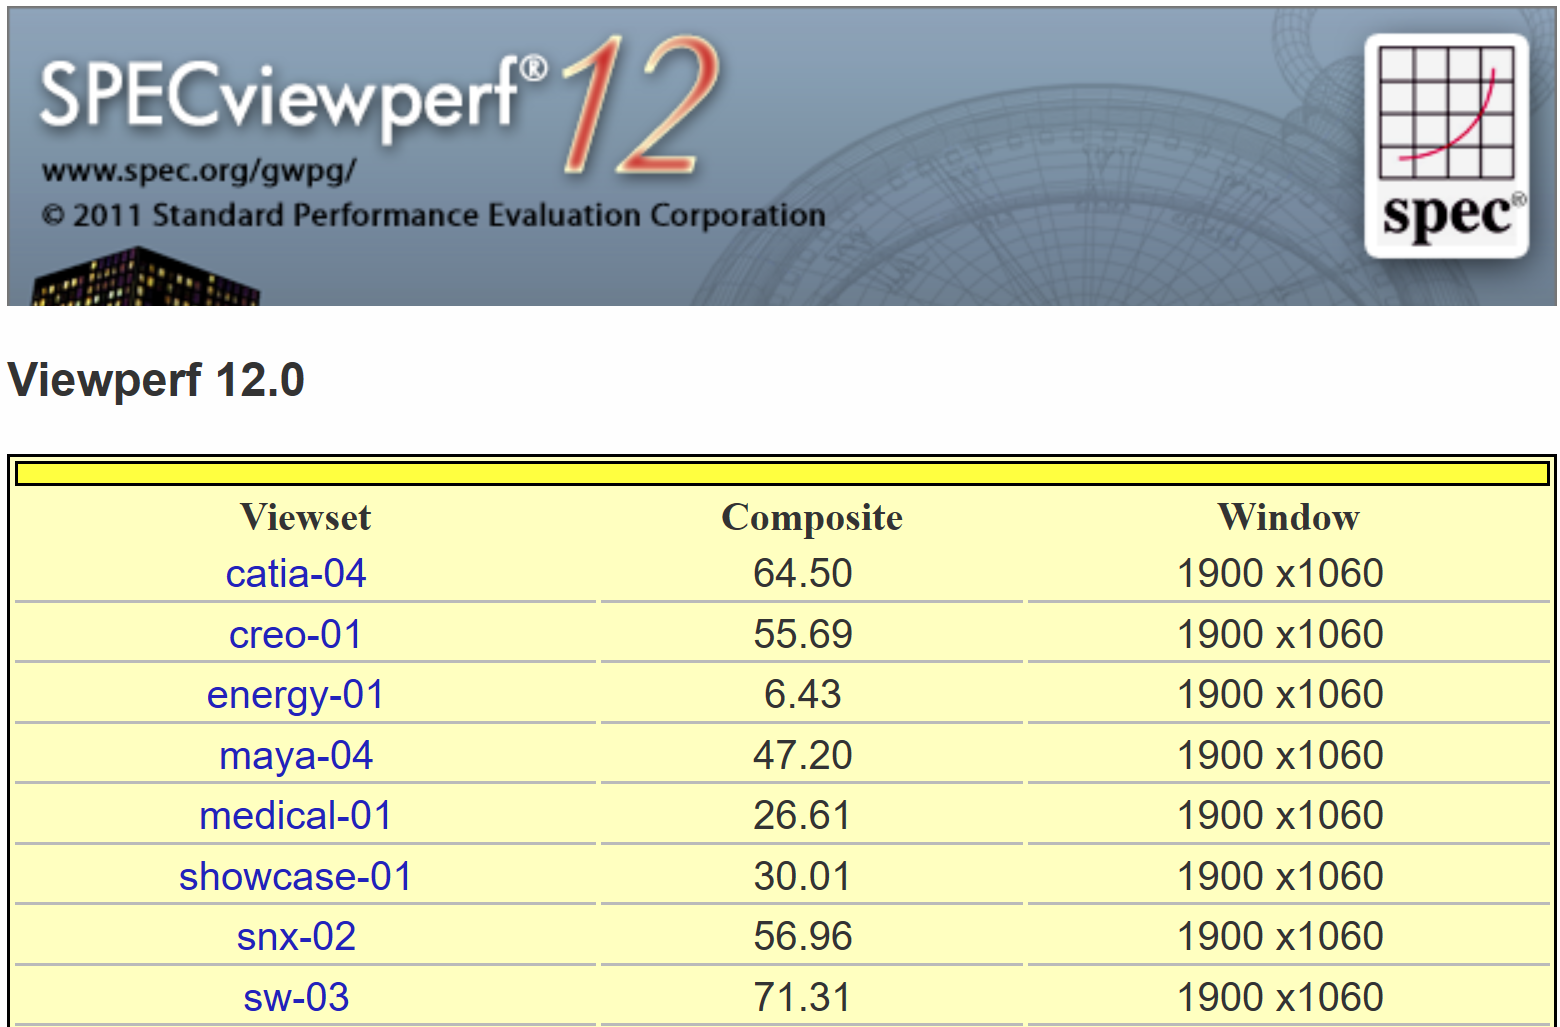
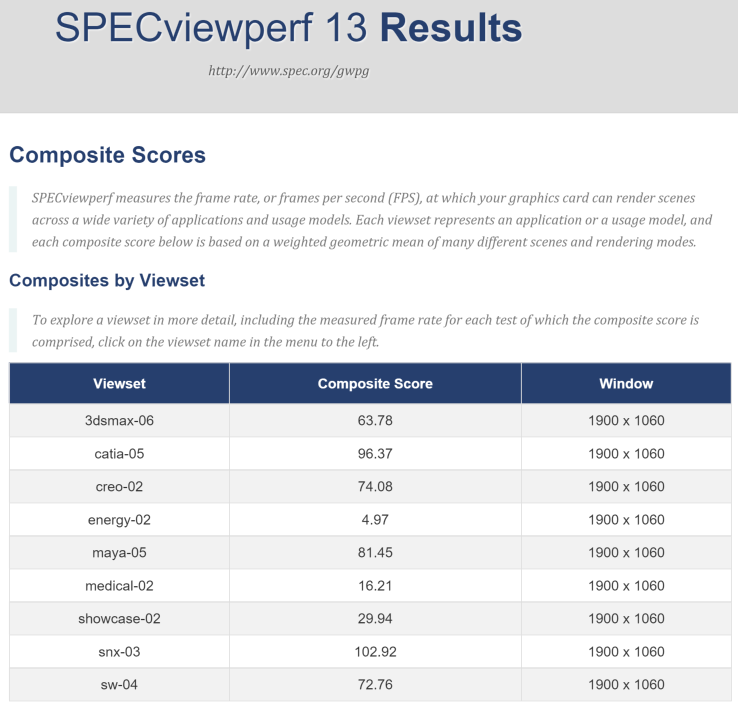
Turning our sights to workstation performance, results are mostly as expected. The Max-Q version of the P2000 is unsurprisingly quite a bit weaker than the conventional full-powered P2000, generally scoring lower than its uncapped sibling—sometimes by as much as 25 to 50 percent. In other tests, results are more closely-matched. Obviously we shouldn’t expect performance rivaling that of a fully-sized mobile workstation out of the ThinkPad P1 given its uncommon portability, but these are variables that it would be wise to account for prior to settling on a machine for a final purchase. You can find our full breakdown of the scores we received from SPECviewperf 12 and 13 in our detailed tables below.
| SPECviewperf 13 | |
| Solidworks (sw-04) | |
| Lenovo ThinkPad P52 20MAS03N00 | |
| Lenovo ThinkPad P1-20MD002LUS | |
| Siemens NX (snx-03) | |
| Lenovo ThinkPad P52 20MAS03N00 | |
| Lenovo ThinkPad P1-20MD002LUS | |
| Showcase (showcase-02) | |
| Lenovo ThinkPad P1-20MD002LUS | |
| Lenovo ThinkPad P52 20MAS03N00 | |
| Medical (medical-02) | |
| Lenovo ThinkPad P1-20MD002LUS | |
| Lenovo ThinkPad P52 20MAS03N00 | |
| Maya (maya-05) | |
| Lenovo ThinkPad P1-20MD002LUS | |
| Lenovo ThinkPad P52 20MAS03N00 | |
| Energy (energy-02) | |
| Lenovo ThinkPad P1-20MD002LUS | |
| Lenovo ThinkPad P52 20MAS03N00 | |
| Creo (creo-02) | |
| Lenovo ThinkPad P1-20MD002LUS | |
| Lenovo ThinkPad P52 20MAS03N00 | |
| Catia (catia-05) | |
| Lenovo ThinkPad P1-20MD002LUS | |
| Lenovo ThinkPad P52 20MAS03N00 | |
| 3ds Max (3dsmax-06) | |
| Lenovo ThinkPad P1-20MD002LUS | |
| Lenovo ThinkPad P52 20MAS03N00 | |
Gaming Performance
Though it isn’t optimized for gaming, the P2000 Max-Q can handle most modern games at High settings (at FHD/1080p resolution). Gaming at UHD/4K isn’t possible, however.
| low | med. | high | ultra | 4K | |
|---|---|---|---|---|---|
| Sleeping Dogs (2012) | 197 | 135 | 133 | 46 | |
| BioShock Infinite (2013) | 264 | 192 | 168 | 65 | |
| Metro: Last Light (2013) | 122 | 111 | 84 | 46 | |
| GRID 2 (2013) | 194 | 132 | 117 | 85 | |
| Company of Heroes 2 (2013) | 72 | 65 | 54 | 27 | |
| Total War: Rome II (2013) | 241 | 177 | 142 | 21 | |
| Thief (2014) | 57 | 54 | 51 | 44 | |
| Dirt Rally (2015) | 234 | 131 | 88 | 73 | 49 |
| The Witcher 3 (2015) | 106 | 73 | 32 | 25 | 12 |
| Batman: Arkham Knight (2015) | 100 | 92 | 59 | 58 | 17 |
| Metal Gear Solid V (2015) | 60 | 60 | 60 | 60 | 28 |
| Rise of the Tomb Raider (2016) | 44 | 40 | 36 | 32 | 15 |
| Ashes of the Singularity (2016) | 54.5 | 39.6 | 34.9 | 13 | |
| Doom (2016) | 103 | 104 | 63 | 61 | 20 |
| Deus Ex Mankind Divided (2016) | 70 | 53 | 31 | 16 | 10 |
| Prey (2017) | 140 | 111 | 109 | 109 | 36 |
| Middle-earth: Shadow of War (2017) | 67 | 49 | 38 | 29 | 13 |
| F1 2018 (2018) | 118 | 72 | 72 | 40 | 24 |
| Shadow of the Tomb Raider (2018) | 79 | 33 | 30 | 23 | 3 |
| Shadow of the Tomb Raider | |
| 1280x720 Lowest Preset | |
| Lenovo ThinkPad X1 Extreme-20MF000XGE | |
| Apple MacBook Pro 15 2018 (2.6 GHz, 560X) | |
| Lenovo ThinkPad P1-20MD002LUS | |
| 1920x1080 Medium Preset | |
| Lenovo ThinkPad X1 Extreme-20MF000XGE | |
| Lenovo ThinkPad P1-20MD002LUS | |
| Apple MacBook Pro 15 2018 (2.6 GHz, 560X) | |
| 1920x1080 High Preset AA:SM | |
| Lenovo ThinkPad X1 Extreme-20MF000XGE | |
| Lenovo ThinkPad P1-20MD002LUS | |
| Apple MacBook Pro 15 2018 (2.6 GHz, 560X) | |
| 1920x1080 Highest Preset AA:T | |
| Lenovo ThinkPad X1 Extreme-20MF000XGE | |
| Apple MacBook Pro 15 2018 (2.6 GHz, 560X) | |
| Lenovo ThinkPad P1-20MD002LUS | |
| 3840x2160 Highest Preset AA:T | |
| Lenovo ThinkPad X1 Extreme-20MF000XGE | |
| Apple MacBook Pro 15 2018 (2.6 GHz, 560X) | |
| Lenovo ThinkPad P1-20MD002LUS | |
| Batman: Arkham Knight | |
| 1280x720 Low / Off AF:Trilinear | |
| Dell Precision 5530 Xeon E-2176M | |
| Lenovo ThinkPad P1-20MD002LUS | |
| 1366x768 Normal / Off AF:4x | |
| Dell Precision 5530 Xeon E-2176M | |
| Lenovo ThinkPad P1-20MD002LUS | |
| 1920x1080 High / On (Interactive Smoke & Paper Debris Off) AA:SM AF:8x | |
| MSI WS63 7RF-290US | |
| Lenovo ThinkPad P1-20MD002LUS | |
| Dell Precision 5530 Xeon E-2176M | |
| 1920x1080 High / On AA:SM AF:16x | |
| Eurocom Tornado F5W | |
| Lenovo ThinkPad P1-20MD002LUS | |
| MSI WS63 7RF-290US | |
| Dell Precision 5530 Xeon E-2176M | |
| 3840x2160 High / On (Interactive Smoke & Paper Debris Off) AA:SM AF:8x | |
| Dell Precision 5530 Xeon E-2176M | |
| Lenovo ThinkPad P1-20MD002LUS | |
| Prey | |
| 1280x720 Low Preset AF:2x | |
| Lenovo ThinkPad P1-20MD002LUS | |
| Dell Precision 5530 Xeon E-2176M | |
| 1366x768 Medium Preset AA:FX AF:4x | |
| Dell Precision 5530 Xeon E-2176M | |
| 1920x1080 High Preset AA:2TX SM AF:8x | |
| Lenovo ThinkPad P1-20MD002LUS | |
| Dell Precision 5530 Xeon E-2176M | |
| 1920x1080 Very High Preset AA:2TX SM AF:16x | |
| Lenovo ThinkPad P1-20MD002LUS | |
| MSI WS63 7RF-290US | |
| Dell Precision 5530 Xeon E-2176M | |
| 3840x2160 High Preset AA:2TX SM AF:8x | |
| Lenovo ThinkPad P1-20MD002LUS | |
| Dell Precision 5530 Xeon E-2176M | |
Stress Test
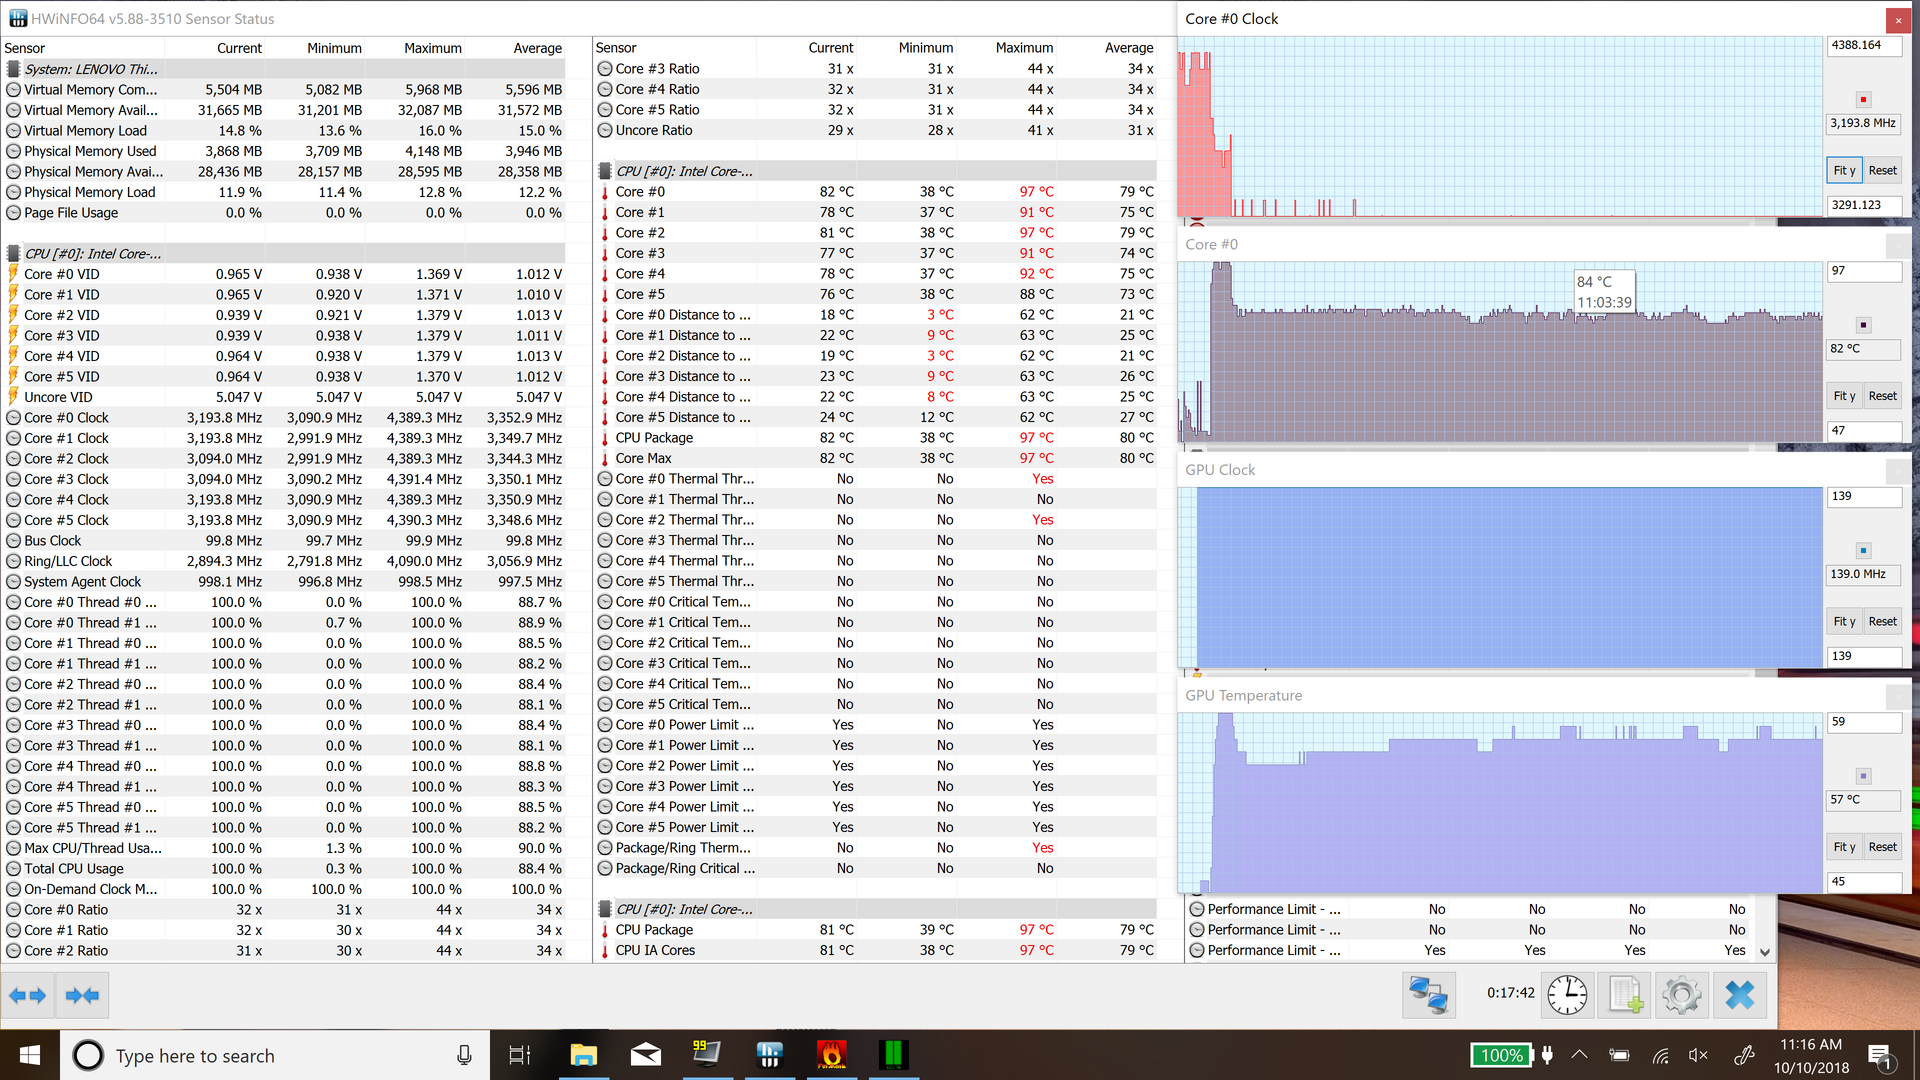
Synthetic full CPU stress produces an initial period (roughly 30 seconds) of full turbo clock rates (4.1 GHz) followed by a drop down to 3.7 GHz for the remainder of the test. Temperatures quickly max out at 97 °C before subsiding into the 83 °C range after the frequencies reduce. Meanwhile, synthetic GPU stress using FurMark provokes clock rates in the 1250 MHz range and temperatures stable at 65 – 66 °C. There is no recorded drop in performance or temperatures over time in this test.
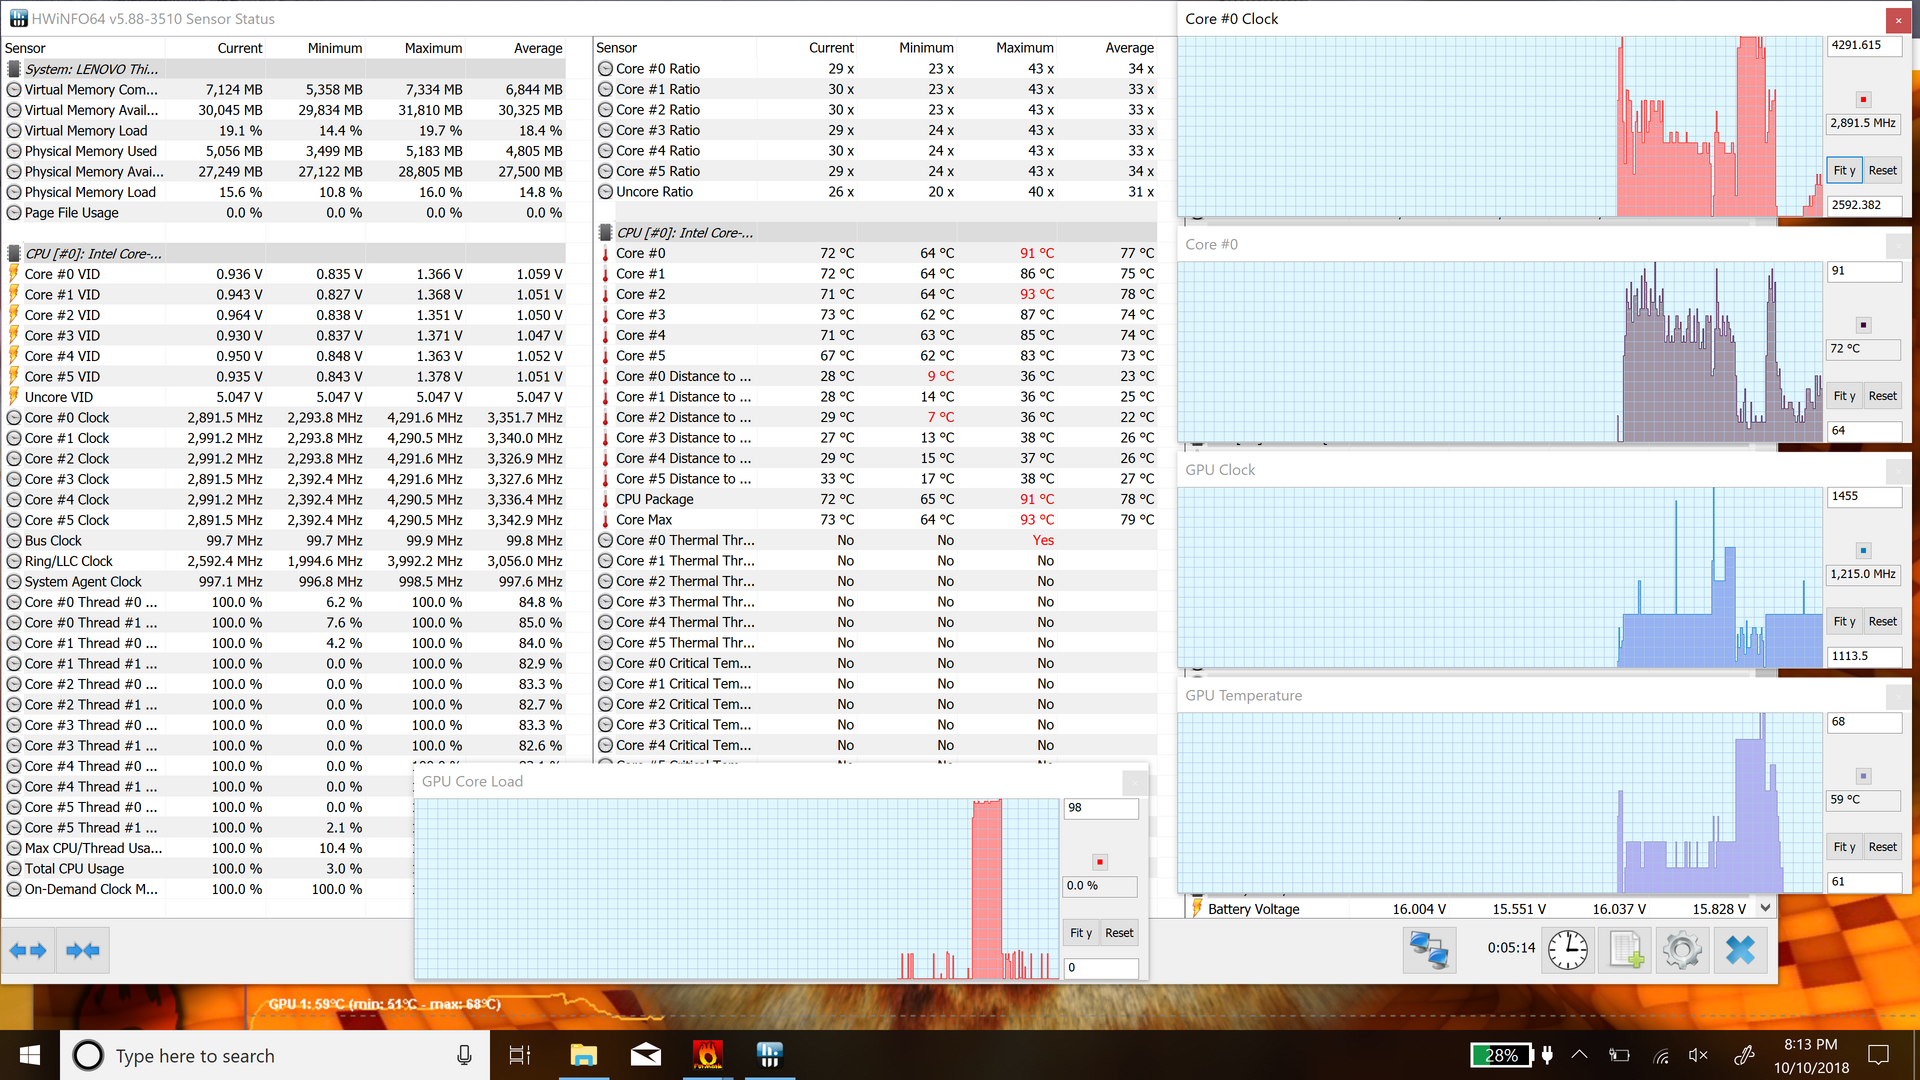
A combination of CPU and GPU stress does little to affect GPU frequency, which remains stable at the 1215 MHz level. However, frequencies aren’t the full story: the GPU core load drops all the way to 0%, and consequently, performance in the FurMark GPU window plummets to just 1 – 2 FPS. CPU performance sticks at around the 2.7 – 3.1 GHz mark, which isn’t bad, but which is considerably lower than the 3.7 GHz we received when it was tested separately. CPU temperatures are stable in the mid-80s C while GPU temperatures remain at 63 °C.
None of these scenarios produce CPU or GPU throttle states by definition, as clock rates remain above base frequencies 100 percent of the time during the testing. However, performance most certainly suffers greatly due to the reduction in core load on the GPU specifically (along with the reduced turbo frequencies of the CPU). As compared with the Precision 5530 (which struggled to sustain base CPU frequencies during periods of combined stress), the ThinkPad P1 does fare better, probably because of the Max-Q design. However, naturally, larger workstations with roomier cases and more aggressive cooling (such as the ThinkPad P71 and Eurocom Tornado F5W) come away with much more consistent performance.
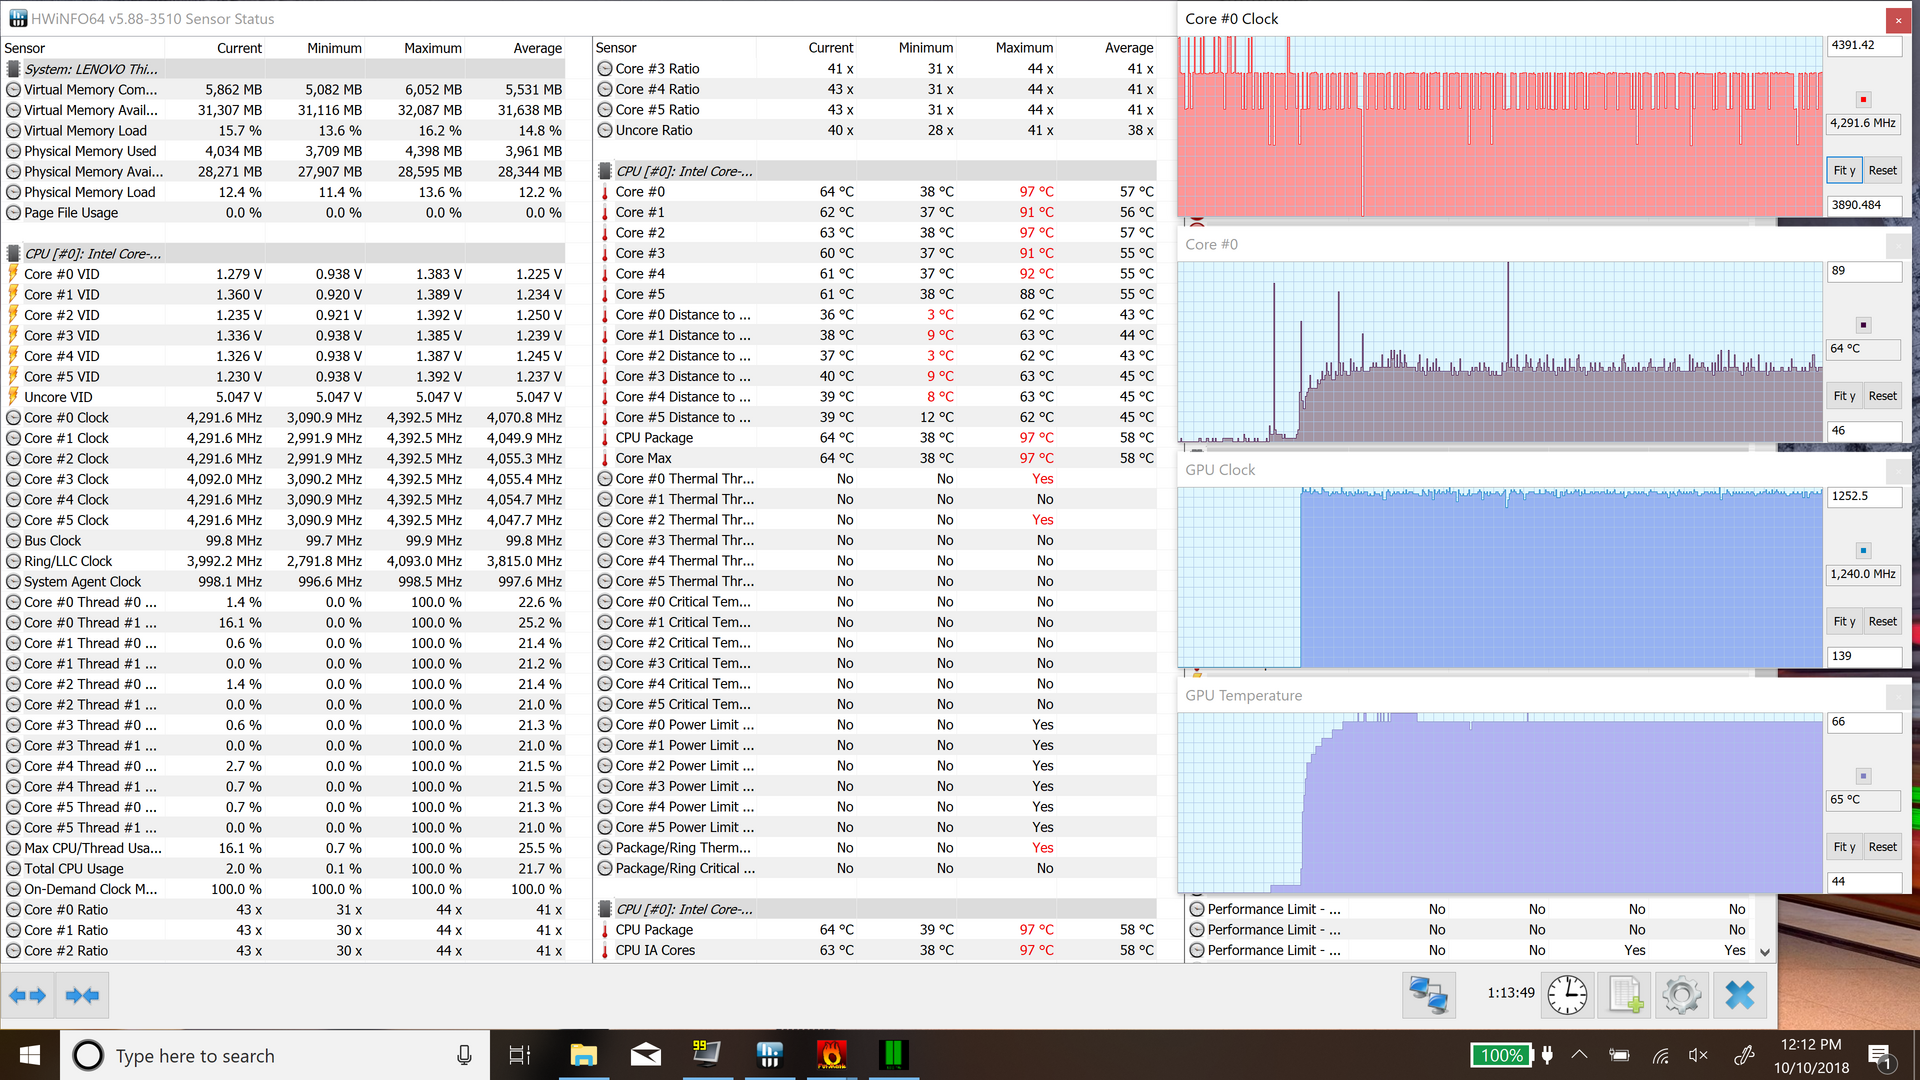
Witcher 3 stress provides a more realistic expectation of performance. Here, we see GPU clock rates maxing out at 1544 MHz with temperatures stable at 70 °C. CPU temperatures remain in the 60s C, meanwhile, as utilization is comparatively low; clock rates rest between 3.3 GHz and 4.3 GHz for the majority of the test.
| CPU Clock (GHz) | GPU Clock (MHz) | Average CPU Temperature (°C) | Average GPU Temperature (°C) | |
| Prime95 Stress | 3.7 | - | 83 | - |
| FurMark Stress | - | 1250 | - | 66 |
| Prime95 + FurMark Stress | 2.7 - 3.1 | 1215 | 85 | 63 |
| Witcher 3 Stress | 3.3 - 4.3 | 1544 | 63 | 70 |
Emissions
System Noise
Our fan noise measurements provide no surprises. By and large, the ThinkPad P1 is a relatively quiet machine (much like its X1 Extreme counterpart), with near-silent idle operation and load averages merely somewhat higher than the X1 Extreme—41.8 dB(A) vs. 36.4 dB(A). It’s notably quieter than both the Precision 5530 and Apple MacBook Pro 15—46.5 db(A) and 46.8 dB(A) under those same conditions—in part thanks to the NVIDIA Max-Q design which helps to regulate thermal development and keep values in balance. Our measurements during Witcher 3 Ultra are still just 39.1 dB(A)—not at all obtrusive and quite a bit lower than the Precision.
However, we do need to mention that while idling after a bit of stress, the fans will regularly rev up to medium RPMs for a few seconds to keep idle temperatures in check. Considering that the machine remains quite warm even after these short bursts of active cooling, it seems like this could have been better handled through the implementation of lengthier cooling sessions to bring temperatures even lower before disengaging the fans. It’s irritating in a quiet environment, but it is possible that Lenovo may be able to correct this later on via a firmware update.
We noticed only very minor electronic/static noise during our time with the P1.
Noise level
| Idle |
| 28.4 / 28.4 / 29.2 dB(A) |
| Load |
| 41.8 / 41.8 dB(A) |
 | ||
30 dB silent 40 dB(A) audible 50 dB(A) loud |
||
min: | ||
| Lenovo ThinkPad P1-20MD002LUS Quadro P2000 Max-Q, E-2176M, Samsung SSD PM981 MZVLB2T0HMLB | Lenovo ThinkPad X1 Extreme-20MF000XGE GeForce GTX 1050 Ti Max-Q, i7-8750H, Samsung SSD PM981 MZVLB1T0HALR | Dell Precision 5530 Xeon E-2176M Quadro P2000, E-2176M, SK hynix PC400 512 GB | HP EliteBook 1050 G1-4QY20EA GeForce GTX 1050 Max-Q, i7-8750H, Toshiba XG5-P KXG50PNV2T04 | Lenovo ThinkPad X1 Carbon 2018-20KGS03900 UHD Graphics 620, i5-8550U, Samsung SSD PM981 MZVLB512HAJQ | Apple MacBook Pro 15 2018 (2.6 GHz, 560X) Radeon Pro 560X, i7-8850H, Apple SSD AP0512 | |
|---|---|---|---|---|---|---|
| Noise | 2% | -5% | -6% | 3% | -5% | |
| off / environment * (dB) | 28.3 | 28.8 -2% | 28.4 -0% | 30.25 -7% | 28.9 -2% | 29.6 -5% |
| Idle Minimum * (dB) | 28.4 | 28.8 -1% | 28.4 -0% | 30.25 -7% | 28.9 -2% | 30.1 -6% |
| Idle Average * (dB) | 28.4 | 28.8 -1% | 28.4 -0% | 30.25 -7% | 28.9 -2% | 30.1 -6% |
| Idle Maximum * (dB) | 29.2 | 31.3 -7% | 28.4 3% | 31.8 -9% | 32.5 -11% | 30.1 -3% |
| Load Average * (dB) | 41.8 | 36.4 13% | 46.5 -11% | 44.7 -7% | 35.1 16% | 46.8 -12% |
| Witcher 3 ultra * (dB) | 39.1 | 36.4 7% | 46.5 -19% | 36 8% | ||
| Load Maximum * (dB) | 41.8 | 39.2 6% | 46.5 -11% | 42 -0% | 35.1 16% | 46.8 -12% |
* ... smaller is better
Temperature
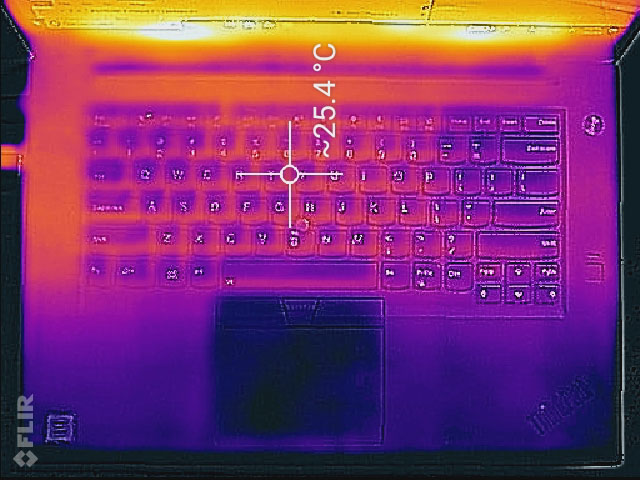
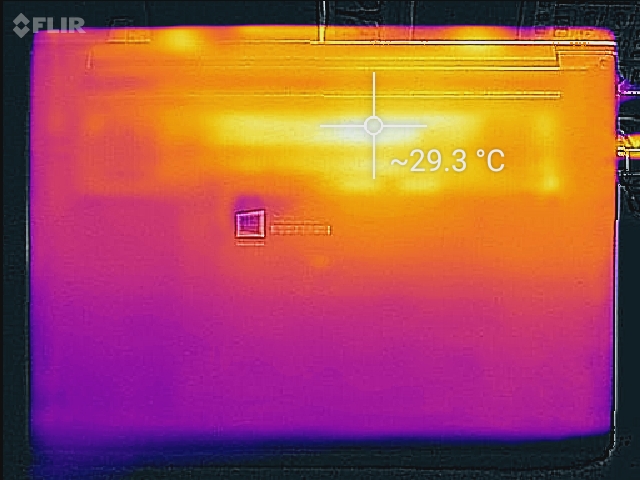
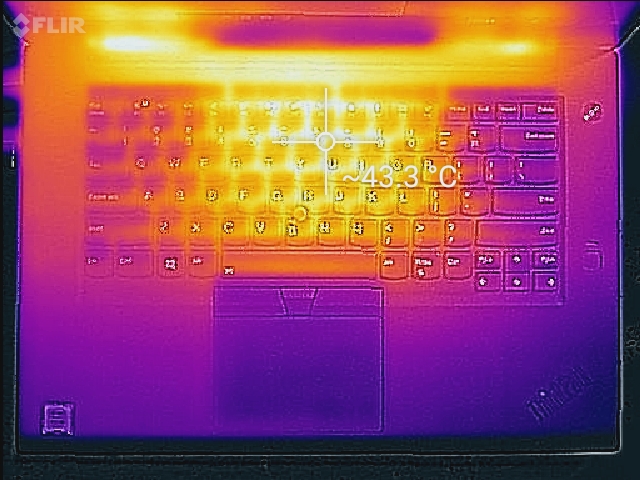
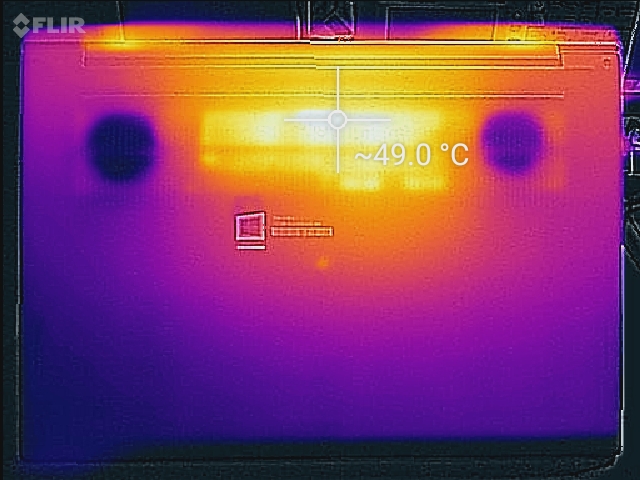
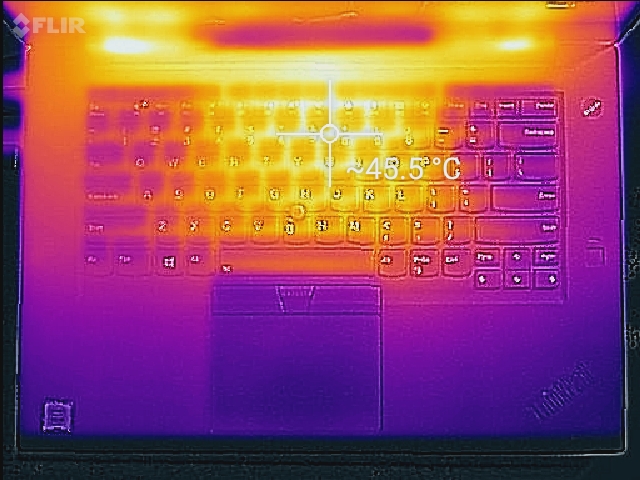
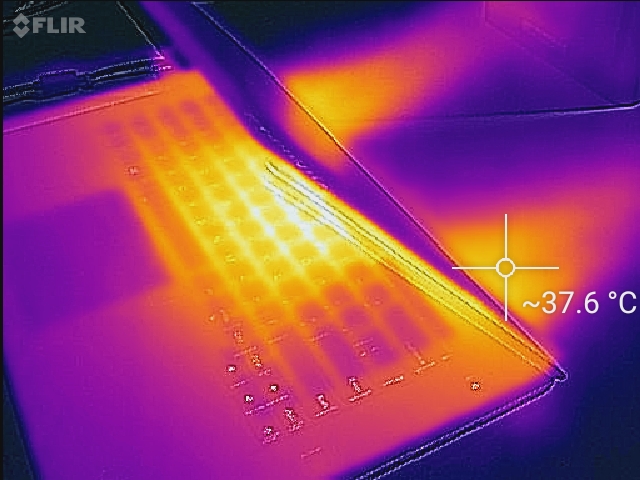
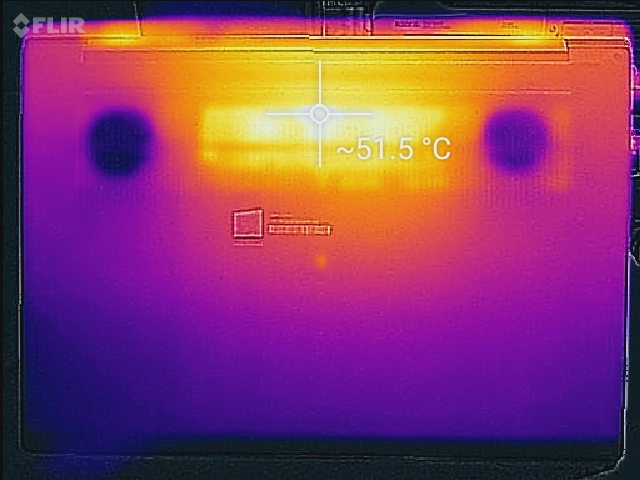
While idling, surface temperatures generally remain quite low—an average of 24.8 °C / 27.6 °C on bottom/top respectively (against an ambient temperature of 20 °C). Witcher 3 load provokes the highest temperatures of our three profiles; although averages are still just 33.9 °C / 33.7 °C, hot spots along the rear (where heat exhausts through the hinge cavity) reach 45.6 °C / 50.8 °C (rear center). Obviously it’s not advisable to operate a workstation on your lap while it’s being stressed, but it’s actually possible to manage with the ThinkPad P1 thanks to its funneling of the vast majority of the heat to the center quadrants.
(±) The maximum temperature on the upper side is 43.4 °C / 110 F, compared to the average of 38.2 °C / 101 F, ranging from 22.2 to 69.8 °C for the class Workstation.
(-) The bottom heats up to a maximum of 50 °C / 122 F, compared to the average of 41.1 °C / 106 F
(+) In idle usage, the average temperature for the upper side is 24.8 °C / 77 F, compared to the device average of 32 °C / 90 F.
(±) Playing The Witcher 3, the average temperature for the upper side is 33.9 °C / 93 F, compared to the device average of 32 °C / 90 F.
(+) The palmrests and touchpad are cooler than skin temperature with a maximum of 28.8 °C / 83.8 F and are therefore cool to the touch.
(±) The average temperature of the palmrest area of similar devices was 27.8 °C / 82 F (-1 °C / -1.8 F).
Speakers
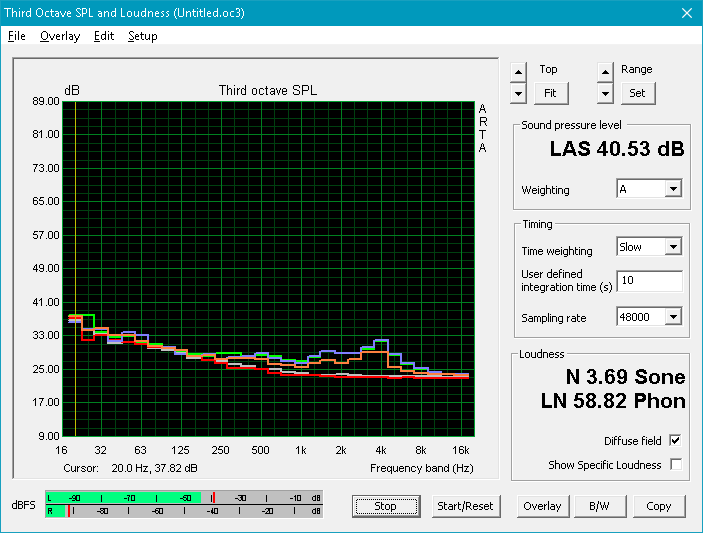
The two bottom-mounted internal speakers in the ThinkPad P1 are decent overall and exceed the quality of many other actual workstations. When compared to other high-end crossover-category devices, however, they don’t fare quite as well. Both the XPS 15 and MacBook Pro 15 produce better overall sound with superior linearity and, in the MacBook Pro’s case, notably higher volume also. As with most down-firing speakers, the quality and volume of the audio is enhanced when the notebook is resting on a flat, hard surface off which the sound can reflect.
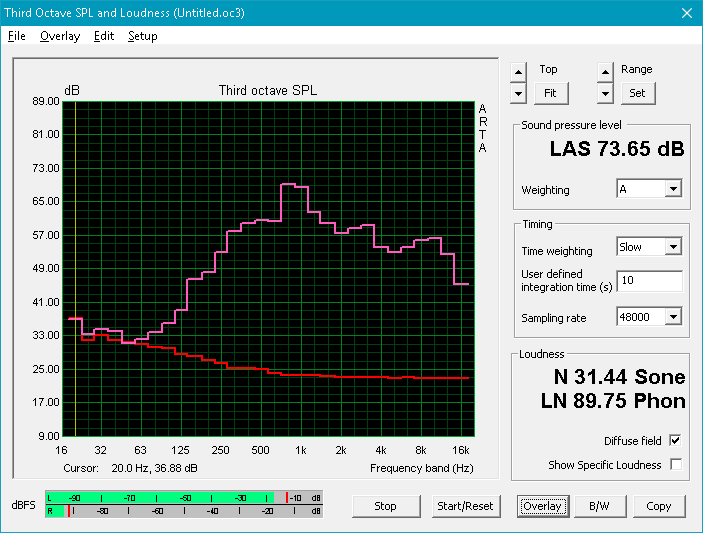
Lenovo ThinkPad P1-20MD002LUS audio analysis
(±) | speaker loudness is average but good (73.7 dB)
Bass 100 - 315 Hz
(±) | reduced bass - on average 10.1% lower than median
(±) | linearity of bass is average (12.3% delta to prev. frequency)
Mids 400 - 2000 Hz
(±) | higher mids - on average 5.9% higher than median
(±) | linearity of mids is average (8.9% delta to prev. frequency)
Highs 2 - 16 kHz
(+) | balanced highs - only 2% away from median
(+) | highs are linear (5.1% delta to prev. frequency)
Overall 100 - 16.000 Hz
(±) | linearity of overall sound is average (21.8% difference to median)
Compared to same class
» 77% of all tested devices in this class were better, 6% similar, 17% worse
» The best had a delta of 7%, average was 17%, worst was 35%
Compared to all devices tested
» 62% of all tested devices were better, 7% similar, 31% worse
» The best had a delta of 4%, average was 24%, worst was 134%
Apple MacBook Pro 15 2018 (2.6 GHz, 560X) audio analysis
(+) | speakers can play relatively loud (85 dB)
Bass 100 - 315 Hz
(+) | good bass - only 4.7% away from median
(±) | linearity of bass is average (8.3% delta to prev. frequency)
Mids 400 - 2000 Hz
(+) | balanced mids - only 1.8% away from median
(+) | mids are linear (3.5% delta to prev. frequency)
Highs 2 - 16 kHz
(+) | balanced highs - only 2.6% away from median
(+) | highs are linear (5.7% delta to prev. frequency)
Overall 100 - 16.000 Hz
(+) | overall sound is linear (6.4% difference to median)
Compared to same class
» 4% of all tested devices in this class were better, 1% similar, 95% worse
» The best had a delta of 5%, average was 17%, worst was 45%
Compared to all devices tested
» 1% of all tested devices were better, 0% similar, 99% worse
» The best had a delta of 4%, average was 24%, worst was 134%
Energy Management
Power Consumption
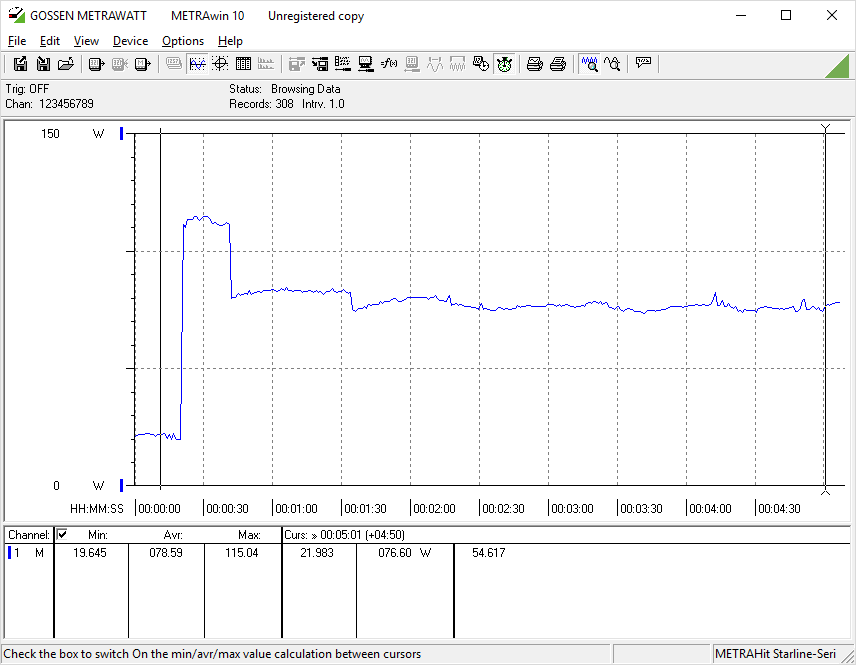
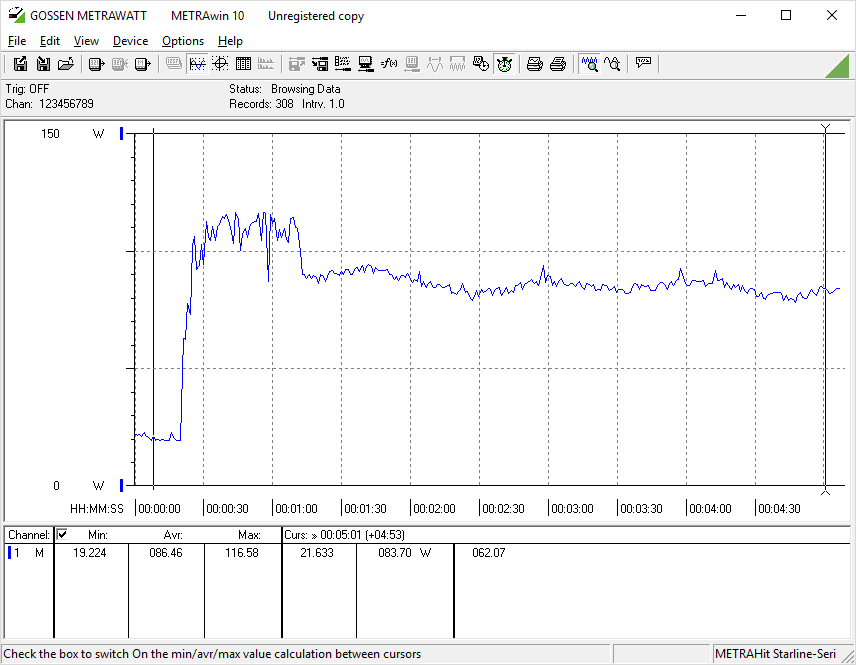
We observe markedly reduced power consumption from the ThinkPad P1 when compared with the Dell Precision 5530 (which features the conventional Quadro P2000 variant of our Max-Q GPU). However, part of this reduction in consumption (the Load Maximum measurement, specifically) is due to intense performance throttling—even though CPU/GPU frequencies technically don’t drop below base rates, as explained above. Witcher 3 values, which as usual are more likely indicative of what you might expect from more conventional processing activities, come to an average of 77.9 W, meanwhile—just a bit above that of the Precision 5530 (76.5 W). Optimus switchable graphics are supported and help to keep idle values reasonable.
| Off / Standby | |
| Idle | |
| Load |
|
Key:
min: | |
| Lenovo ThinkPad P1-20MD002LUS E-2176M, Quadro P2000 Max-Q, Samsung SSD PM981 MZVLB2T0HMLB, IPS, 3840x2160, 15.6" | Lenovo ThinkPad X1 Extreme-20MF000XGE i7-8750H, GeForce GTX 1050 Ti Max-Q, Samsung SSD PM981 MZVLB1T0HALR, IPS, 3840x2160, 15.6" | Dell Precision 5530 Xeon E-2176M E-2176M, Quadro P2000, SK hynix PC400 512 GB, IGZO, 3840x2160, 15.6" | HP EliteBook 1050 G1-4QY20EA i7-8750H, GeForce GTX 1050 Max-Q, Toshiba XG5-P KXG50PNV2T04, IPS LED, 3840x2160, 15.6" | Apple MacBook Pro 15 2018 (2.6 GHz, 560X) i7-8850H, Radeon Pro 560X, Apple SSD AP0512, IPS, 2880x1800, 15.4" | |
|---|---|---|---|---|---|
| Power Consumption | -11% | -18% | 5% | 17% | |
| Idle Minimum * (Watt) | 7.1 | 7.6 -7% | 9.8 -38% | 6.1 14% | 3.4 52% |
| Idle Average * (Watt) | 14.4 | 14.8 -3% | 16.8 -17% | 10.2 29% | 11 24% |
| Idle Maximum * (Watt) | 14.6 | 17.6 -21% | 16.9 -16% | 13.4 8% | 14.9 -2% |
| Load Average * (Watt) | 93.9 | 86 8% | 102.3 -9% | 82 13% | 78.9 16% |
| Witcher 3 ultra * (Watt) | 77.9 | 85 -9% | 76.5 2% | ||
| Load Maximum * (Watt) | 88.3 | 118.9 -35% | 114.5 -30% | 122 -38% | 91.2 -3% |
* ... smaller is better
Battery Life
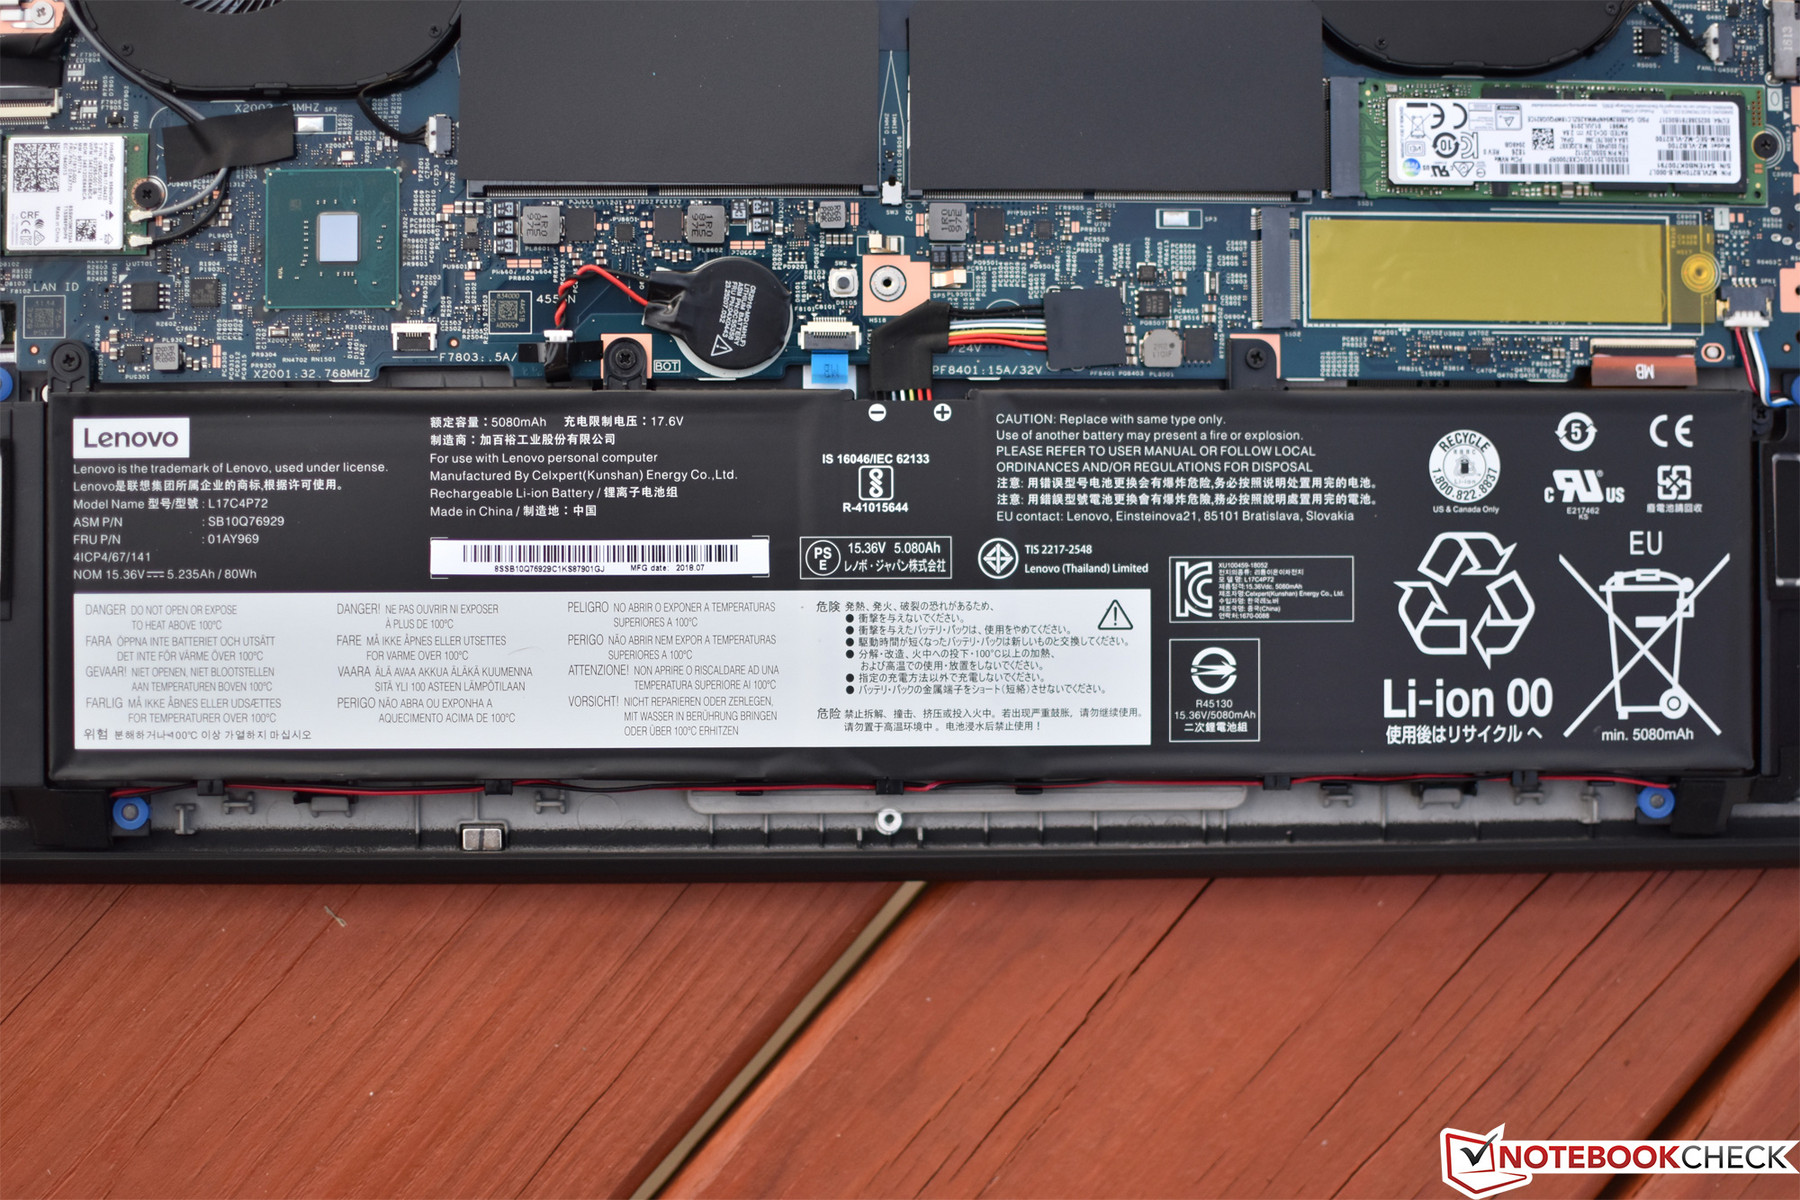
Battery life is below that of the X1 Extreme at just 5 hours and 20 minutes in our standardized Wi-Fi web surfing test. This is a full hour less than the 6 hours and 24 minutes logged during our testing of the X1 Extreme and fully three hours less than the 8 hours, 21 minutes managed by the Precision 5530. The MacBook Pro 15 leads in this category with an impressive 10 hours and 14 minutes of runtime.
| Lenovo ThinkPad P1-20MD002LUS E-2176M, Quadro P2000 Max-Q, 80 Wh | Lenovo ThinkPad X1 Extreme-20MF000XGE i7-8750H, GeForce GTX 1050 Ti Max-Q, 80 Wh | Dell Precision 5530 Xeon E-2176M E-2176M, Quadro P2000, 97 Wh | HP EliteBook 1050 G1-4QY20EA i7-8750H, GeForce GTX 1050 Max-Q, 96 Wh | Lenovo ThinkPad X1 Carbon 2018-20KGS03900 i5-8550U, UHD Graphics 620, 57 Wh | Apple MacBook Pro 15 2018 (2.6 GHz, 560X) i7-8850H, Radeon Pro 560X, 83 Wh | |
|---|---|---|---|---|---|---|
| Battery runtime | 21% | 58% | 64% | 64% | 92% | |
| WiFi v1.3 (h) | 5.3 | 6.4 21% | 8.4 58% | 8.7 64% | 8.7 64% | 10.2 92% |
| Reader / Idle (h) | 11.5 | 16.5 | 17.1 | 22.1 | ||
| Witcher 3 ultra (h) | 1.1 | 1.5 | ||||
| Load (h) | 2 | 1.8 | 2.1 | 1.8 |
Pros
Cons
Verdict
Alongside the growing popularity of lightweight gaming machines, thin-and-light workstations (in the vein of Dell’s Precision 5530) have also carved out a segment of the market for themselves, and Lenovo’s ThinkPad P1 represents a strong addition to this budding lineup.
Considering that the two machines are identical in design, not much has changed with the ThinkPad P1 since our review of the X1 Extreme a couple of weeks ago. We’re still impressed by the sturdy, high-quality, and attractive case, colorful IPS display, strong CPU and GPU performance, unobtrusive yet effective cooling, and top-notch input devices. We also appreciate the simplicity of maintenance and upgrades, with an easy-to-remove bottom cover and plenty of opportunity for expansion (dual-channel RAM up to 64 GB, dual PCIe x4 M.2 slots).
The X1 Extreme was already a head-turning premium consumer-grade offering, but the design also holds a lot of merit when viewed from the perspective of an ultraportable workstation.
Of course, compromises do apply when you’re essentially slicing the size and weight of a typical workstation by 30 to 50%. The ThinkPad P1 manages good performance under most workloads, but combined heavy stress serves as a sobering reminder of the limitations of such a design. With NVIDIA’s Max-Q at the helm, temperatures and power consumption never get out of hand, but GPU performance plummets (and CPU performance is notably reduced) under the heaviest of computing loads. Still, workstation performance is adequate to handle the majority of modeling and design demands, even if it is below conventional P2000-powered devices (such as the Precision 5530).
Most of our original X1 Extreme quibbles also still apply to the ThinkPad P1. Pressure on the display lid still produced a conspicuous initial creak/pop, and fan operation while idling remains subject to random (and aurally irritating) surges. Battery life falls short of category leaders by a significant margin. And the lack of anti-glare display configurations makes for troublesome operation in brighter environments.
The (roughly) $4,220 price of our positively decked-out review unit—with its massive 2 TB NVMe SSD—is also sure to give pause. Users may find slightly more affordable options with comparable performance in the X1 Extreme, Precision 5530, EliteBook 1050 G1, or even XPS 15-9570. However, there isn’t much explicitly wrong with the P1, and what it gets right in balance goes a long way toward justifying its value in the ever-competitive business universe.
Lenovo ThinkPad P1-20MD002LUS
- 10/11/2018 v6 (old)
Steve Schardein
