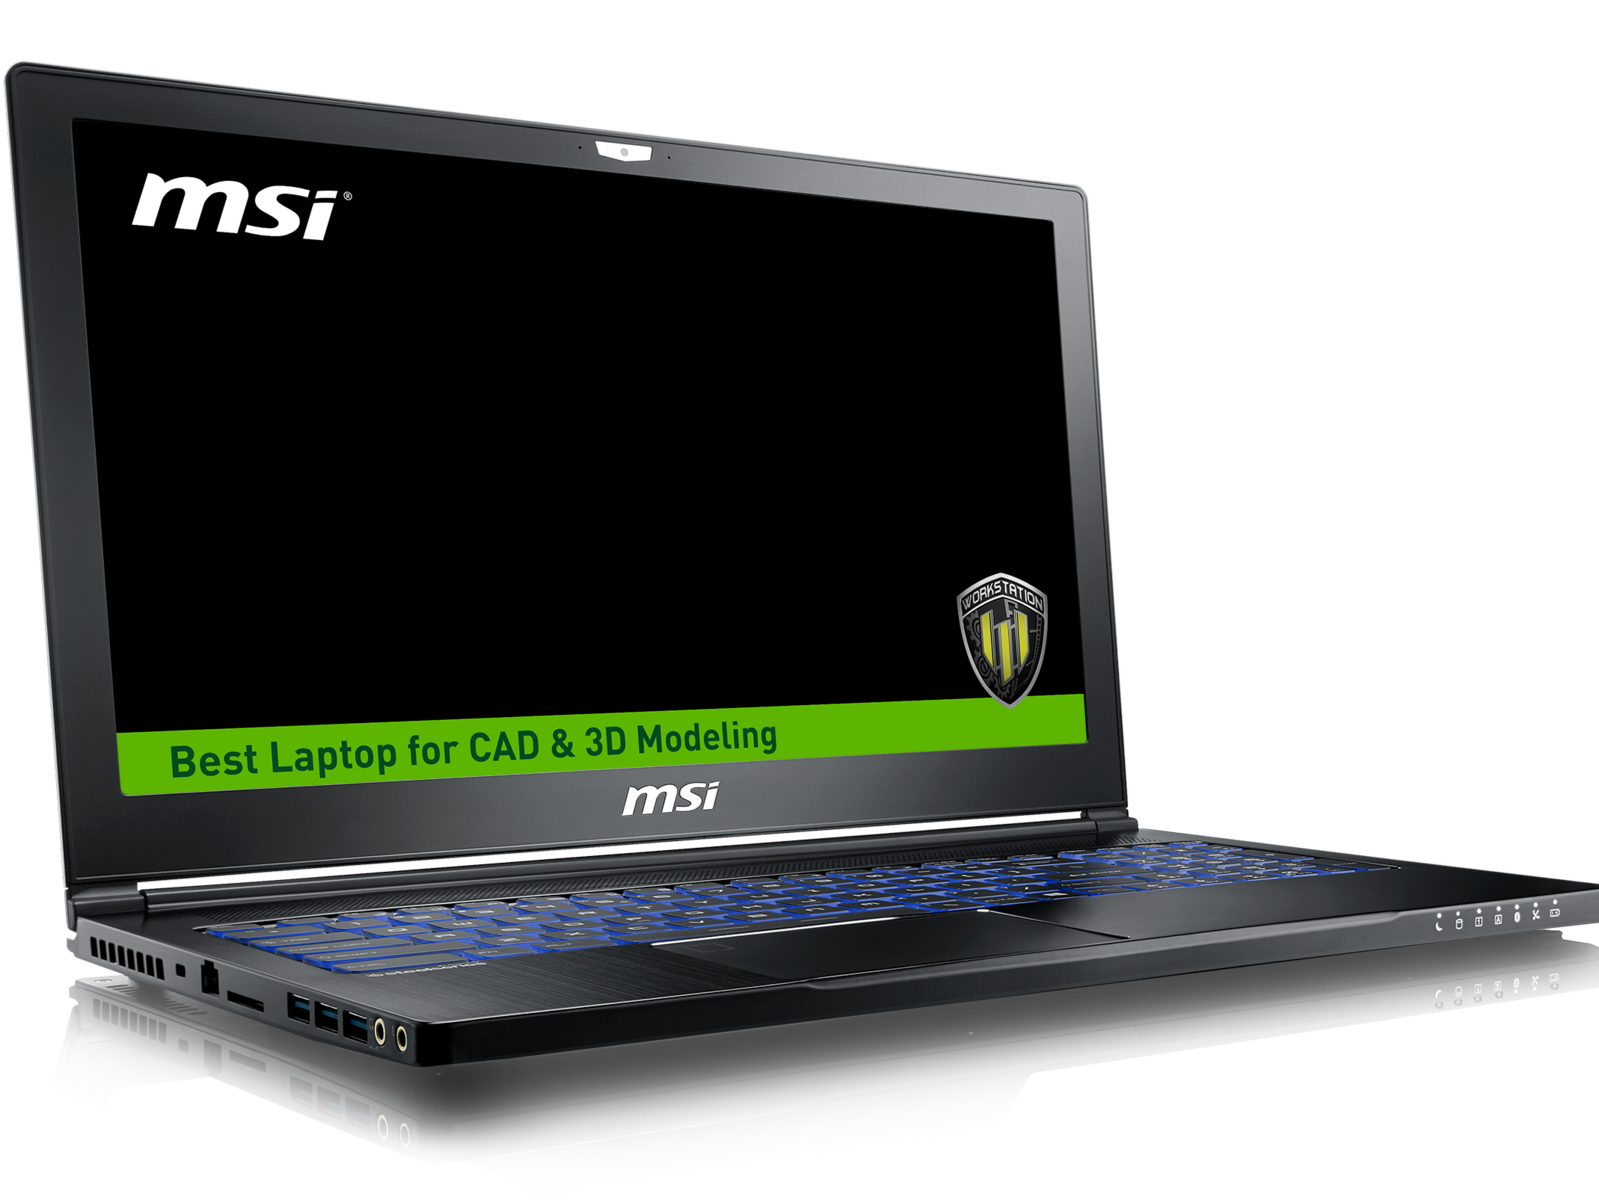
MSI WS63 7RF (i7-7700HQ, FHD, P3000) Workstation Review
The MSI G series is home to some of the most popular gaming notebooks available. In an attempt to leverage their superior position in the gaming space, the gaming G series also exists as the workstation W series designed for professional use. The W series is distinguished by the switch to Quadro GPUs and sometimes Xeon CPUs instead of the respective GeForce and Core ix equivalents, but nearly everything about the W series is otherwise identical to the G series.
The WS63 is the successor to the aging WS60 in the same way that the GS63VR is the successor to the GS60. MSI unveiled this very configuration equipped with the brand new Quadro P3000 earlier this year at Computex 2017. There are just two SKUs available at the time of writing starting for $2500 USD with either FHD or 4K UHD displays. We recommend checking out our existing reviews on the GS63VR as the WS63 is essentially identical from the bottom up save for the Quadro P3000 GPU. As such, we'll be jumping right into the performance of the WS63 since details on the chassis, build quality, and connectivity features have already been covered on our GS63VR pages.
Case
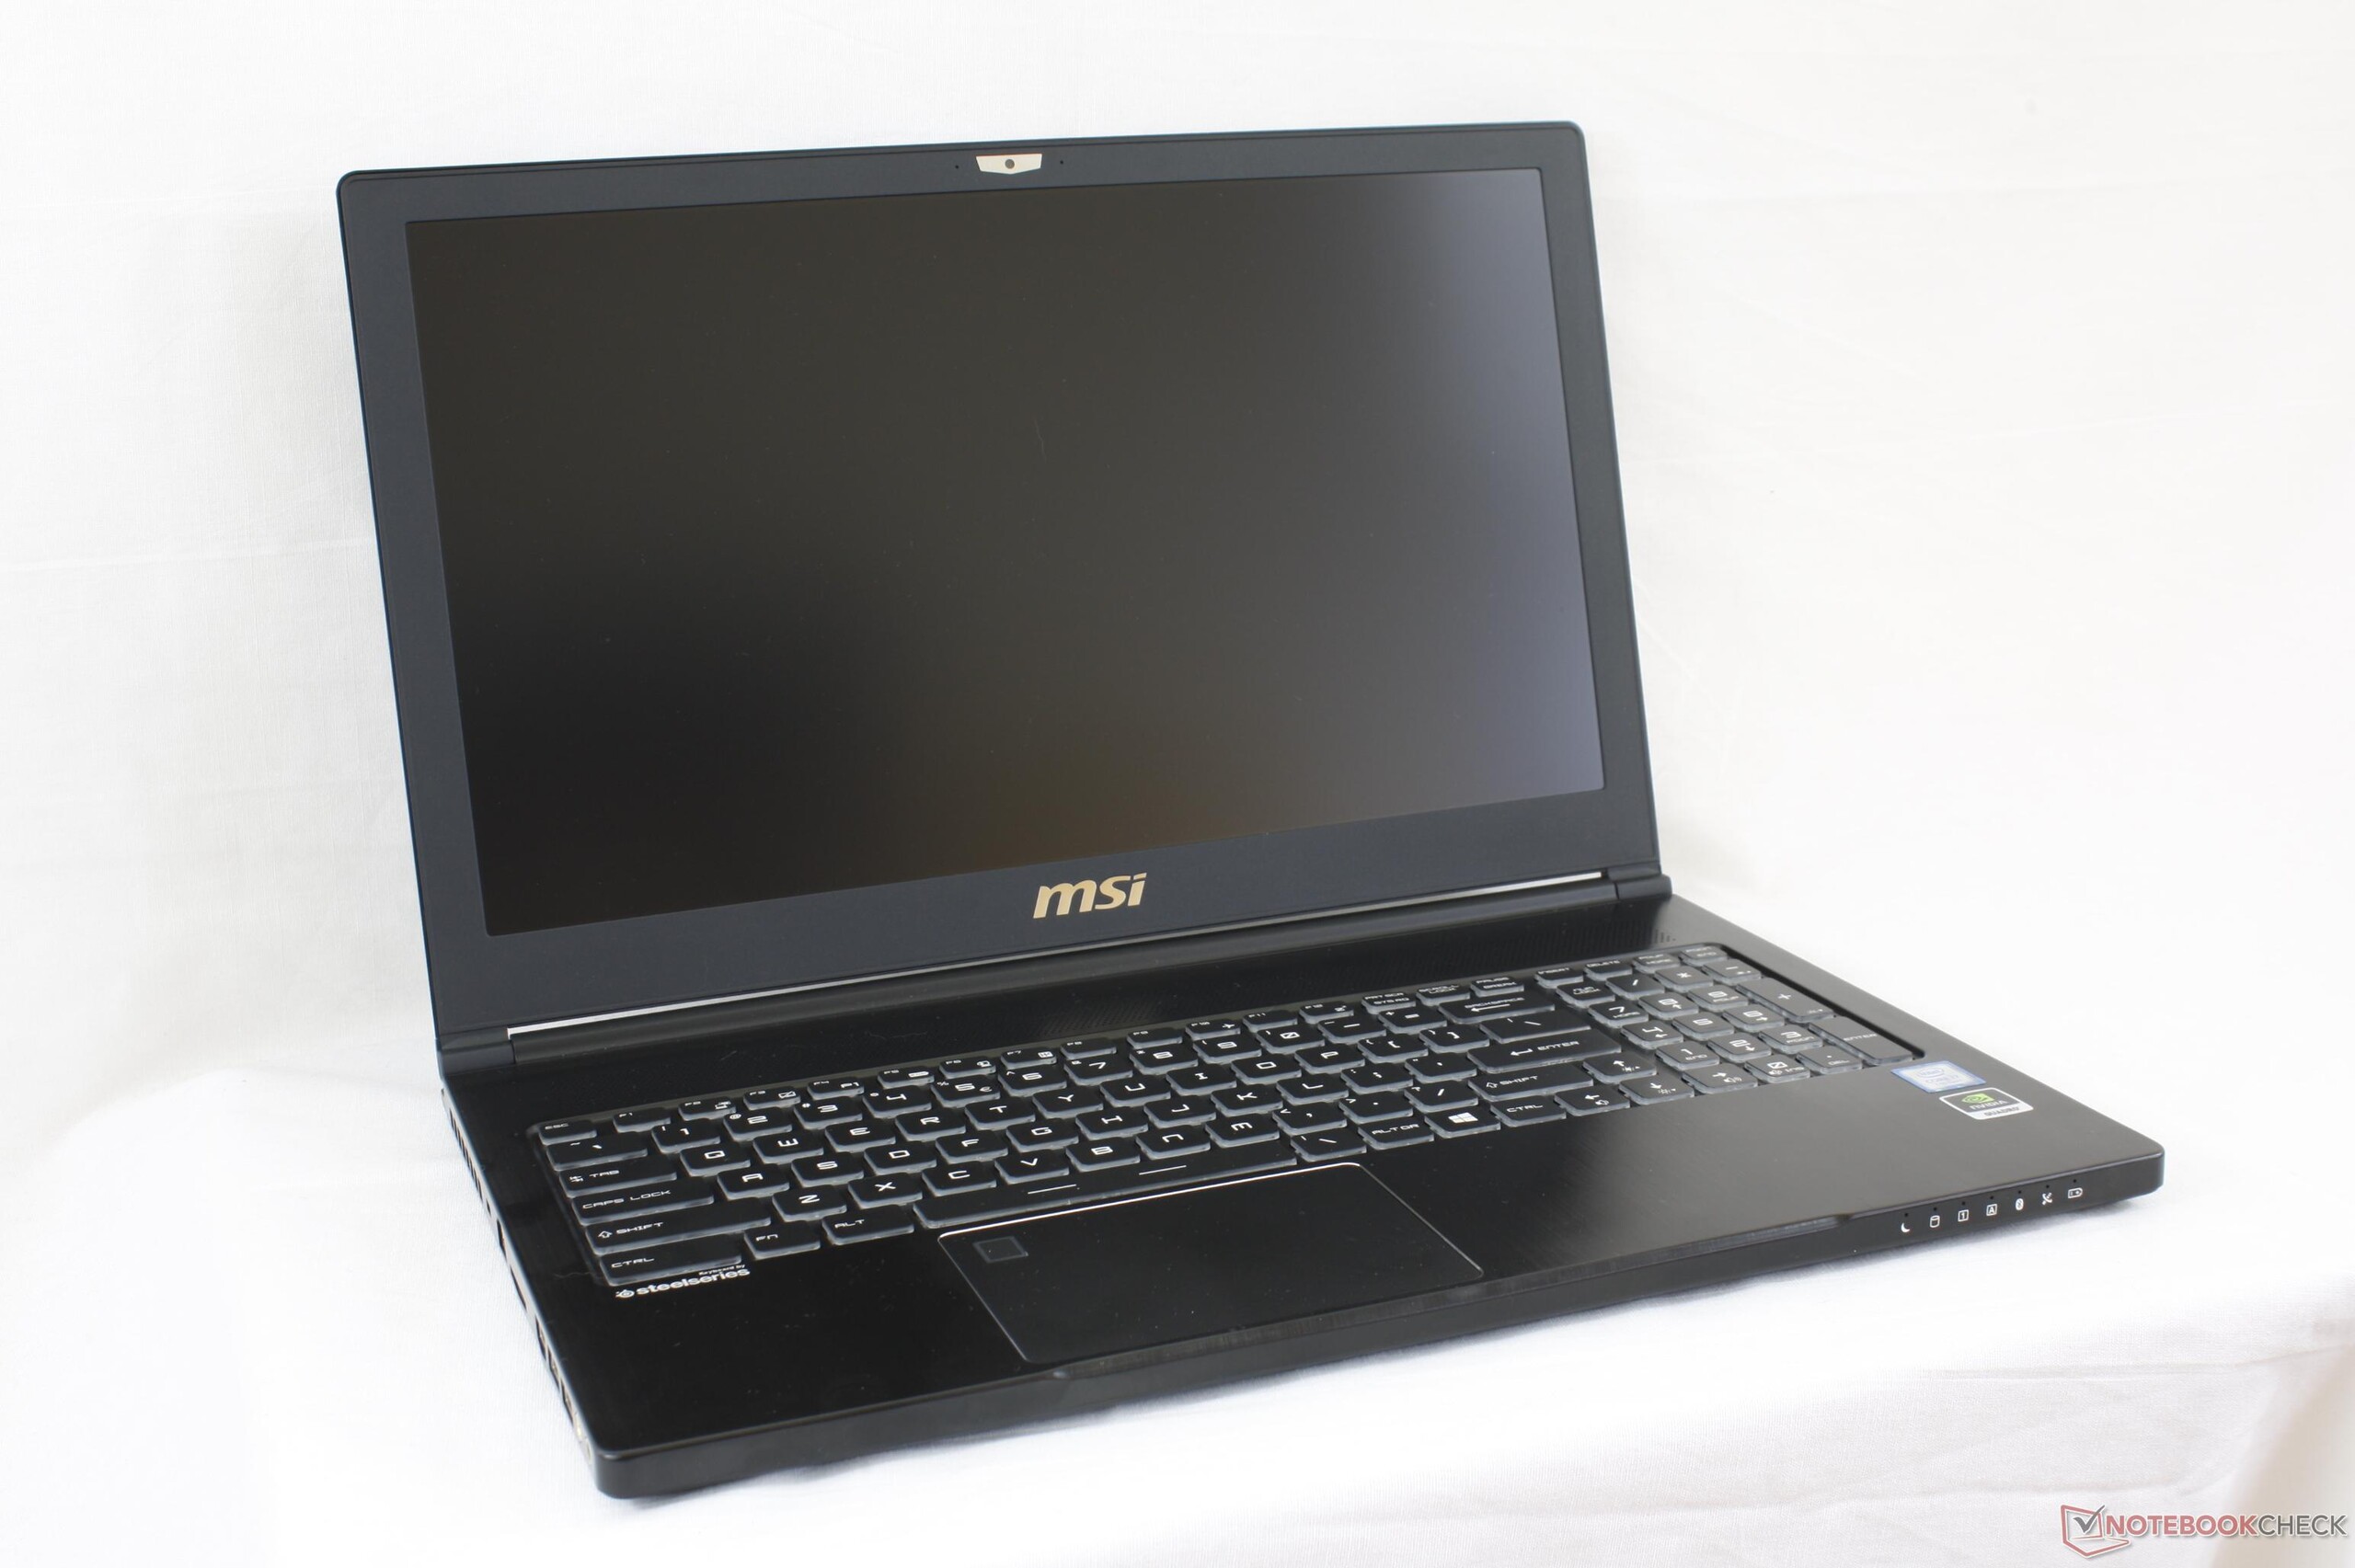
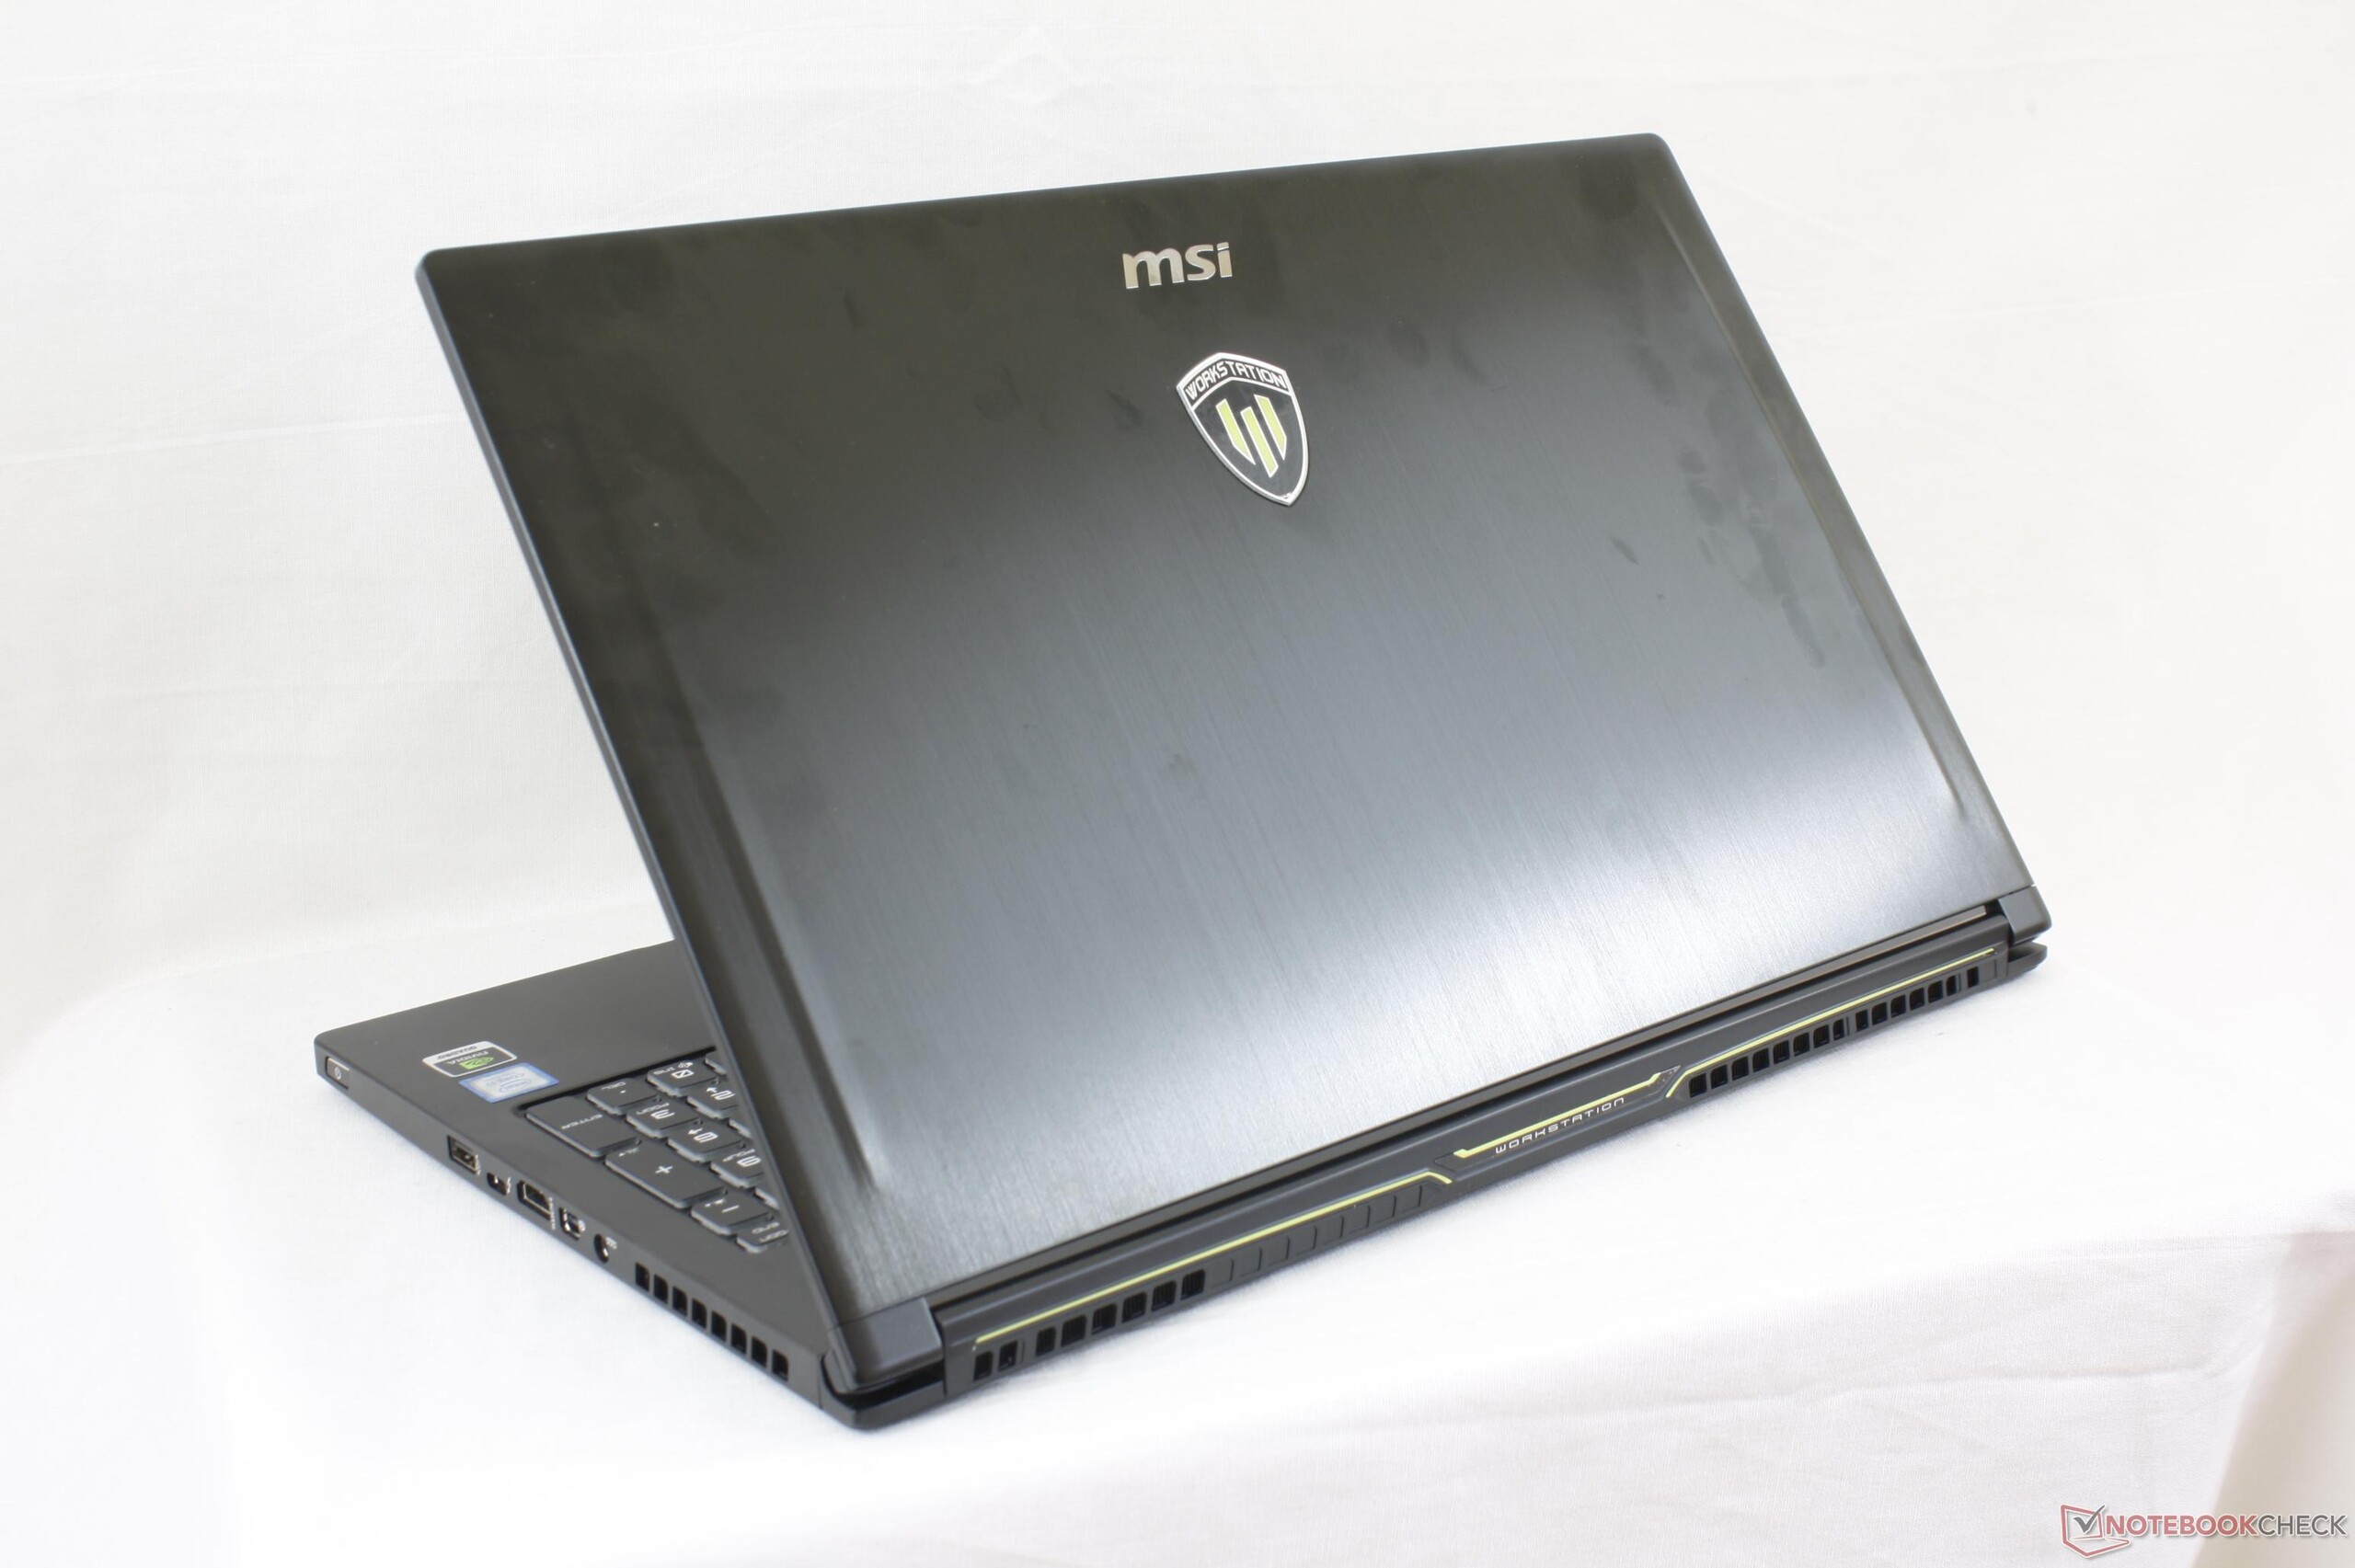
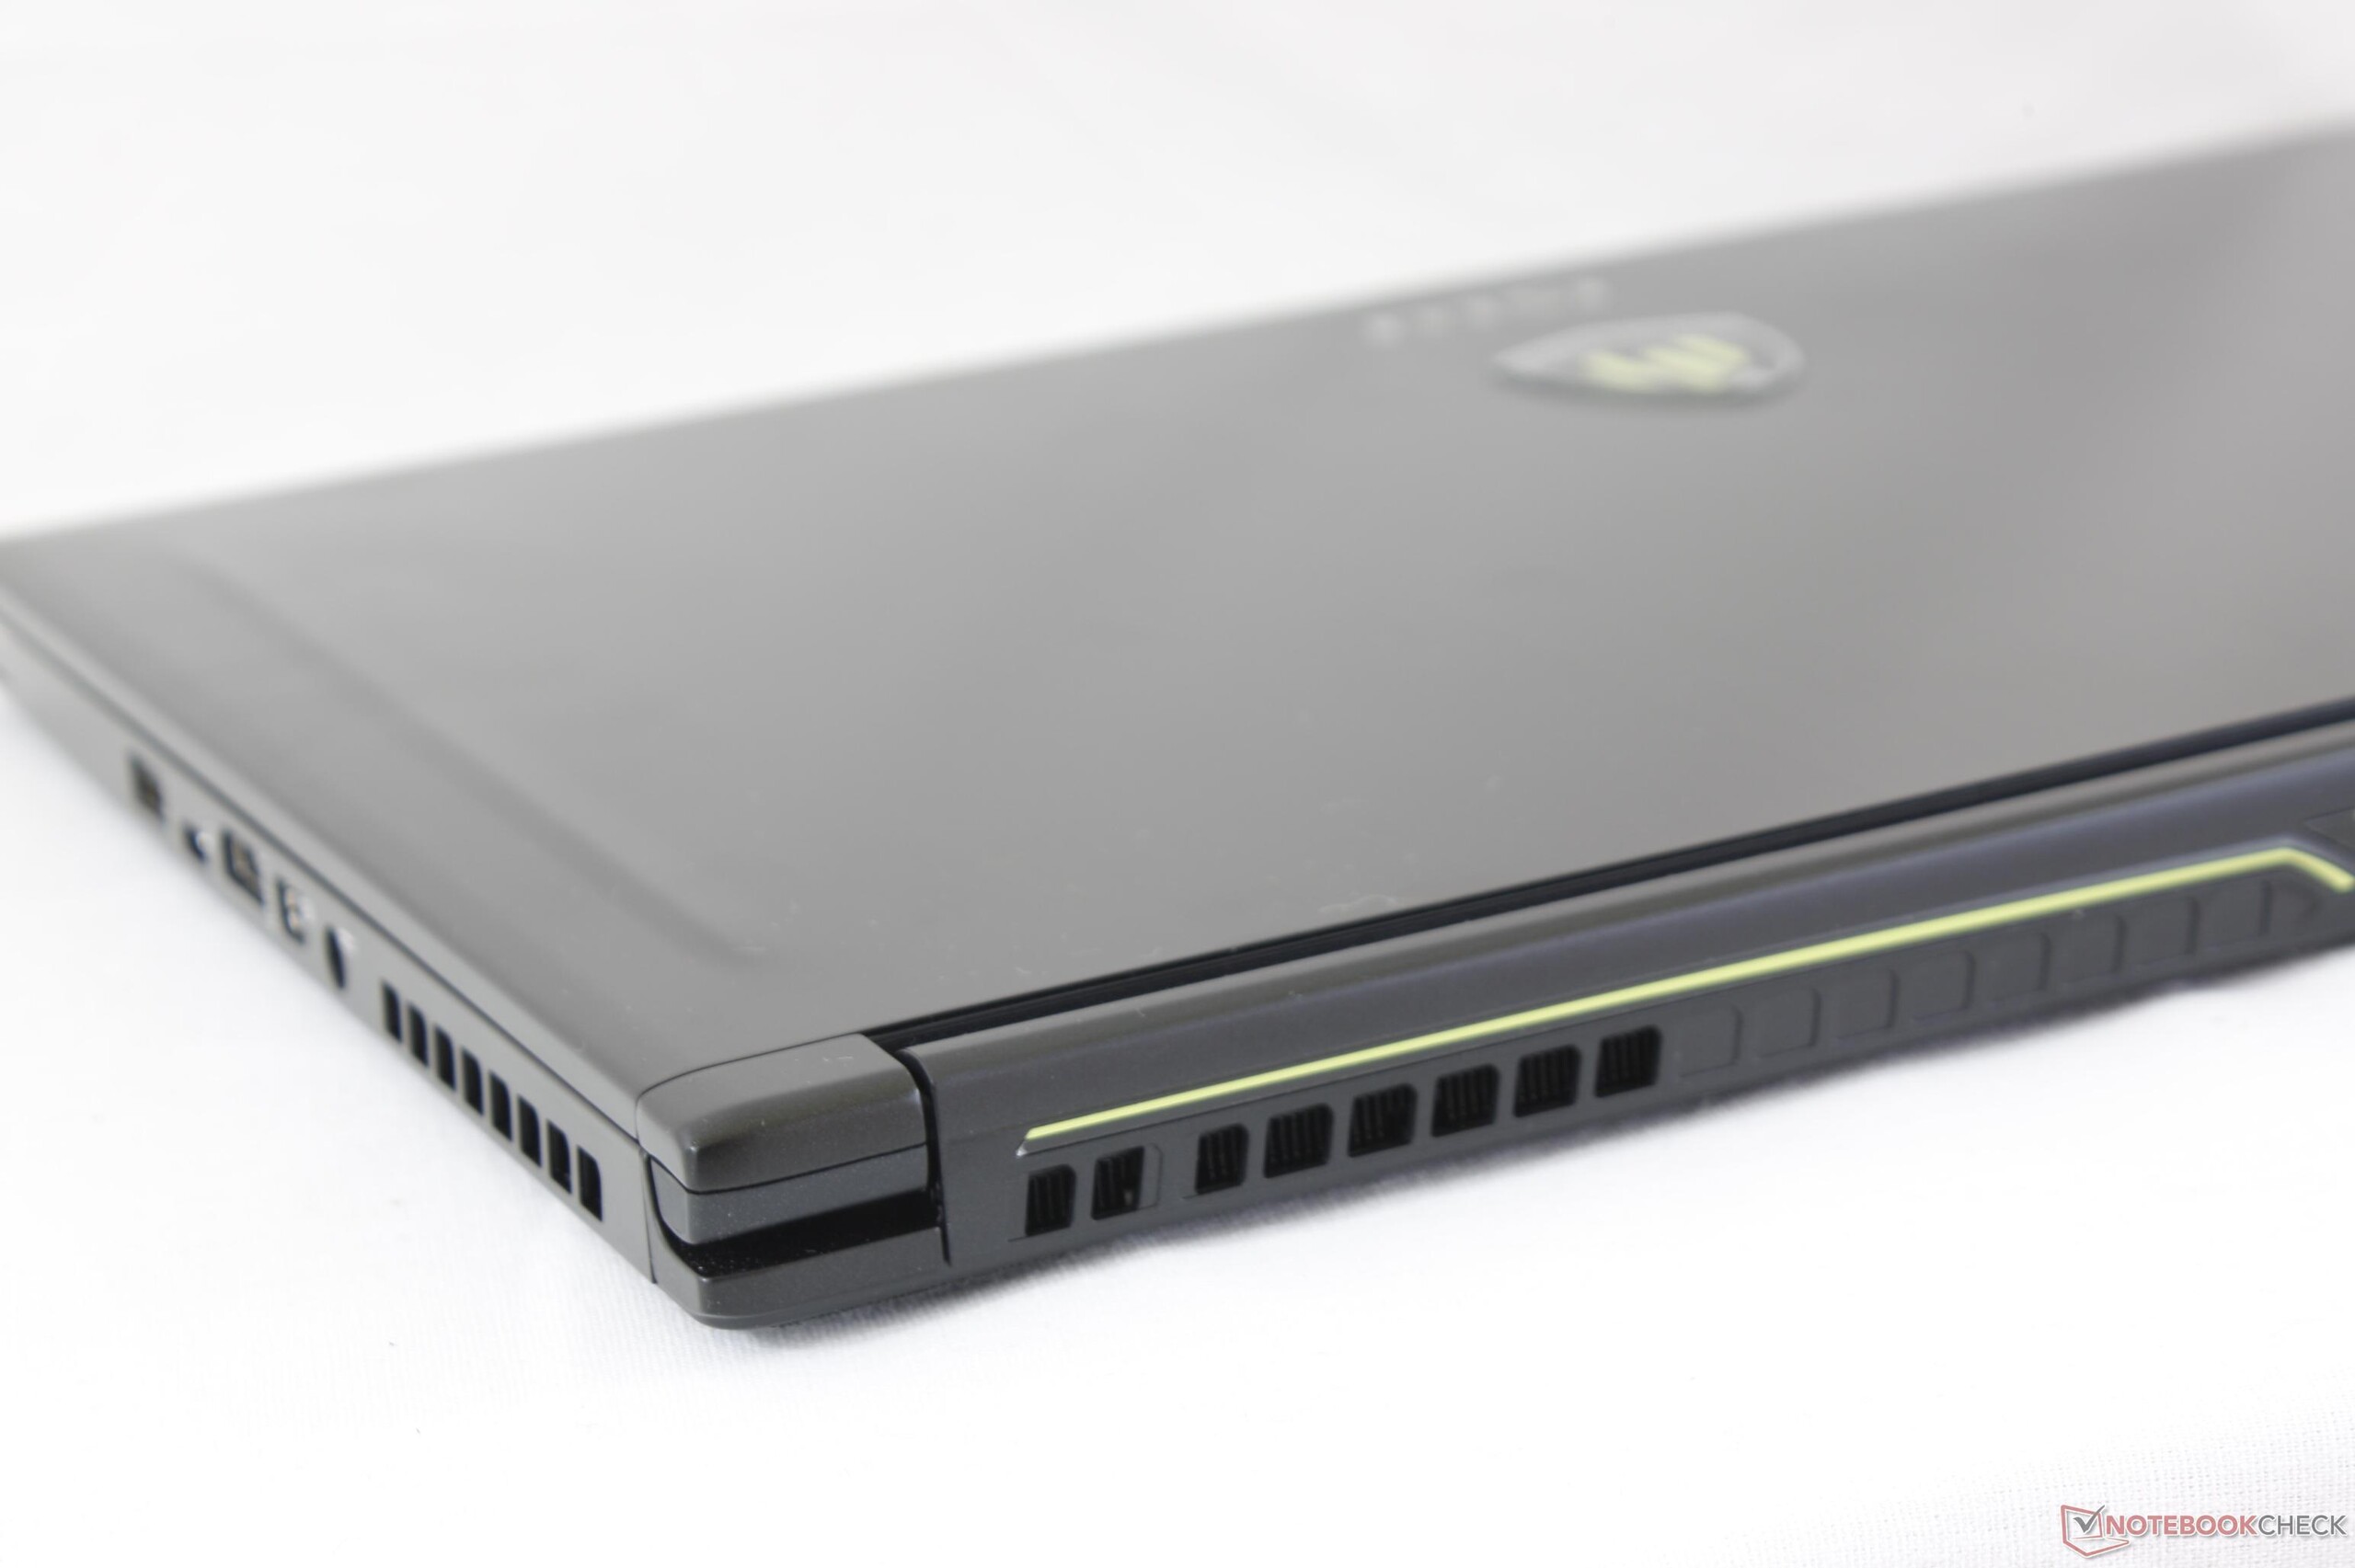
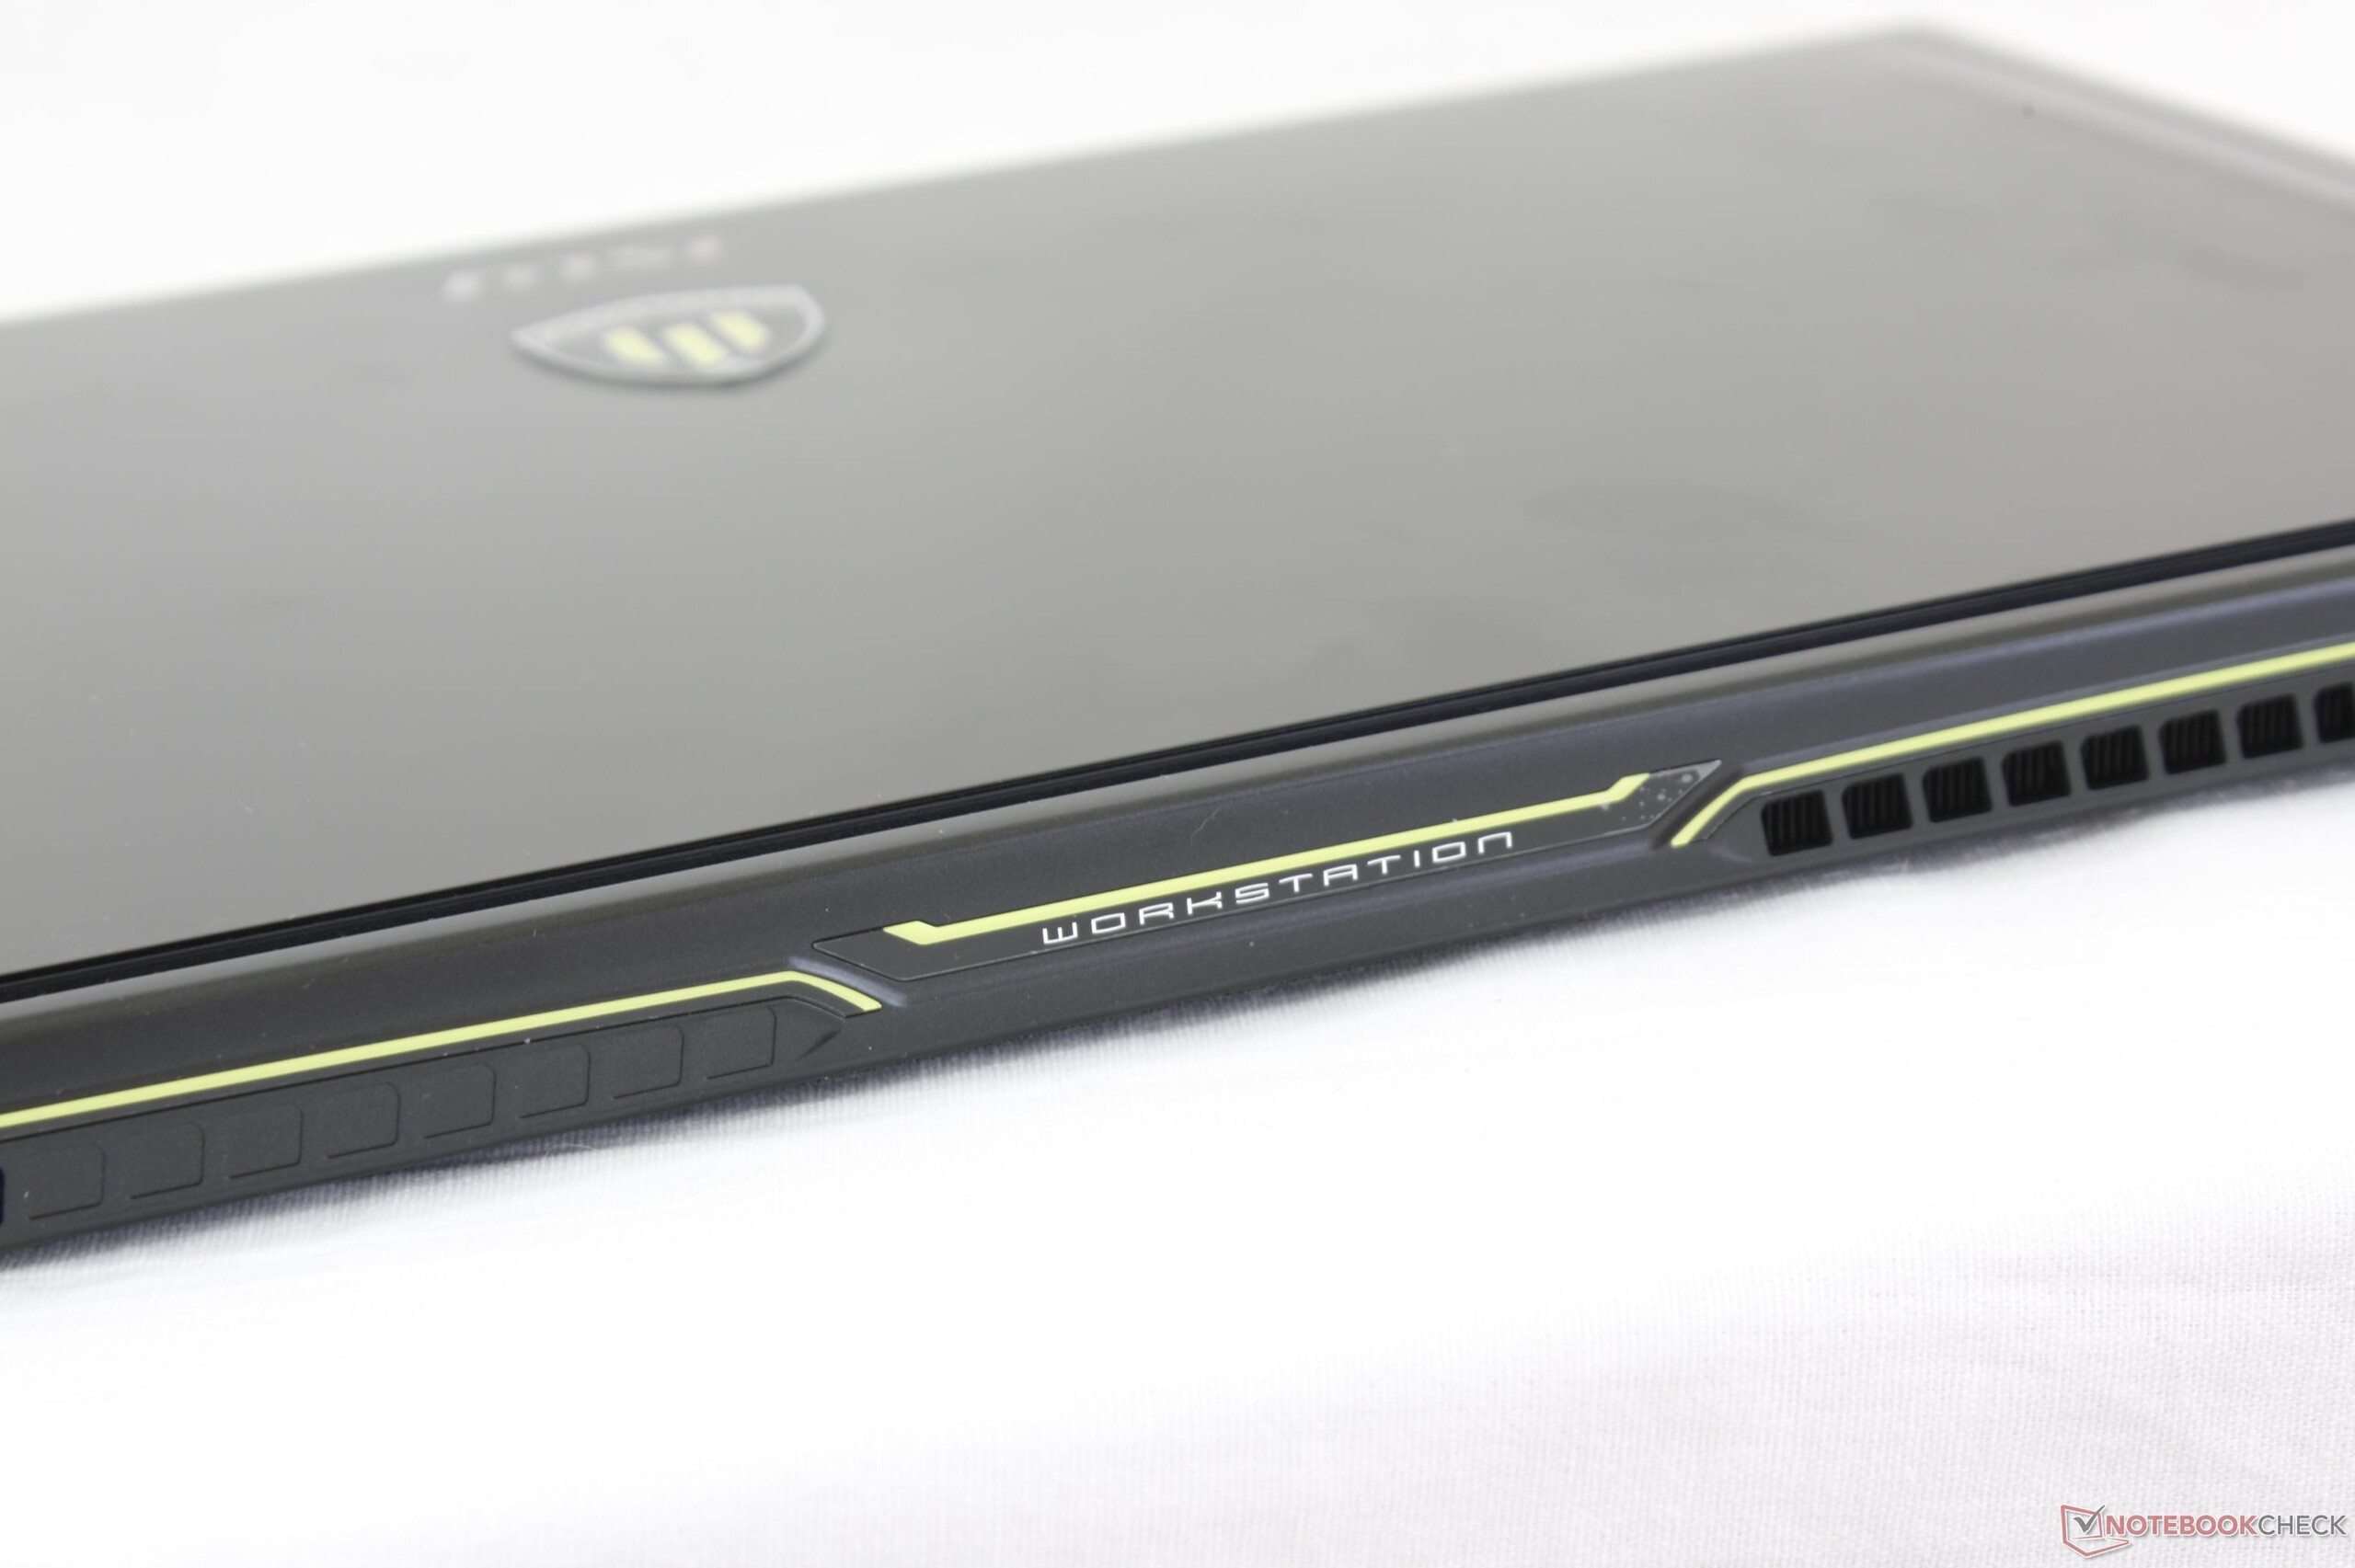
The big advantage of the GS63 over "traditional" mobile workstations is its slimmer and lighter design lifted directly from the superthin gaming GS series. The ThinkPad P51 and ZBook 15 G3, for example, are each several millimeters thicker and several hundred grams heavier than the GS63. The Precision 5520 based on the XPS 15 9560 is even smaller in footprint, but current SKUs are limited to the slower Quadro M1200 GPU.
Chassis quality is excellent on our test unit with no unintended gaps or crevices between materials. Nonetheless, some of our previous GS63VR and GS73VR test units had edges and corners that were not perfectly aligned that could potentially be present on the GS63 series. Rigidity is not even close to that of the thicker ThinkPad P51, Zbook 15, or Celsius H760 because of the thinner and more flexible build of the WS and GS series. The system is more susceptible to bumps and bruises overall.
Connectivity
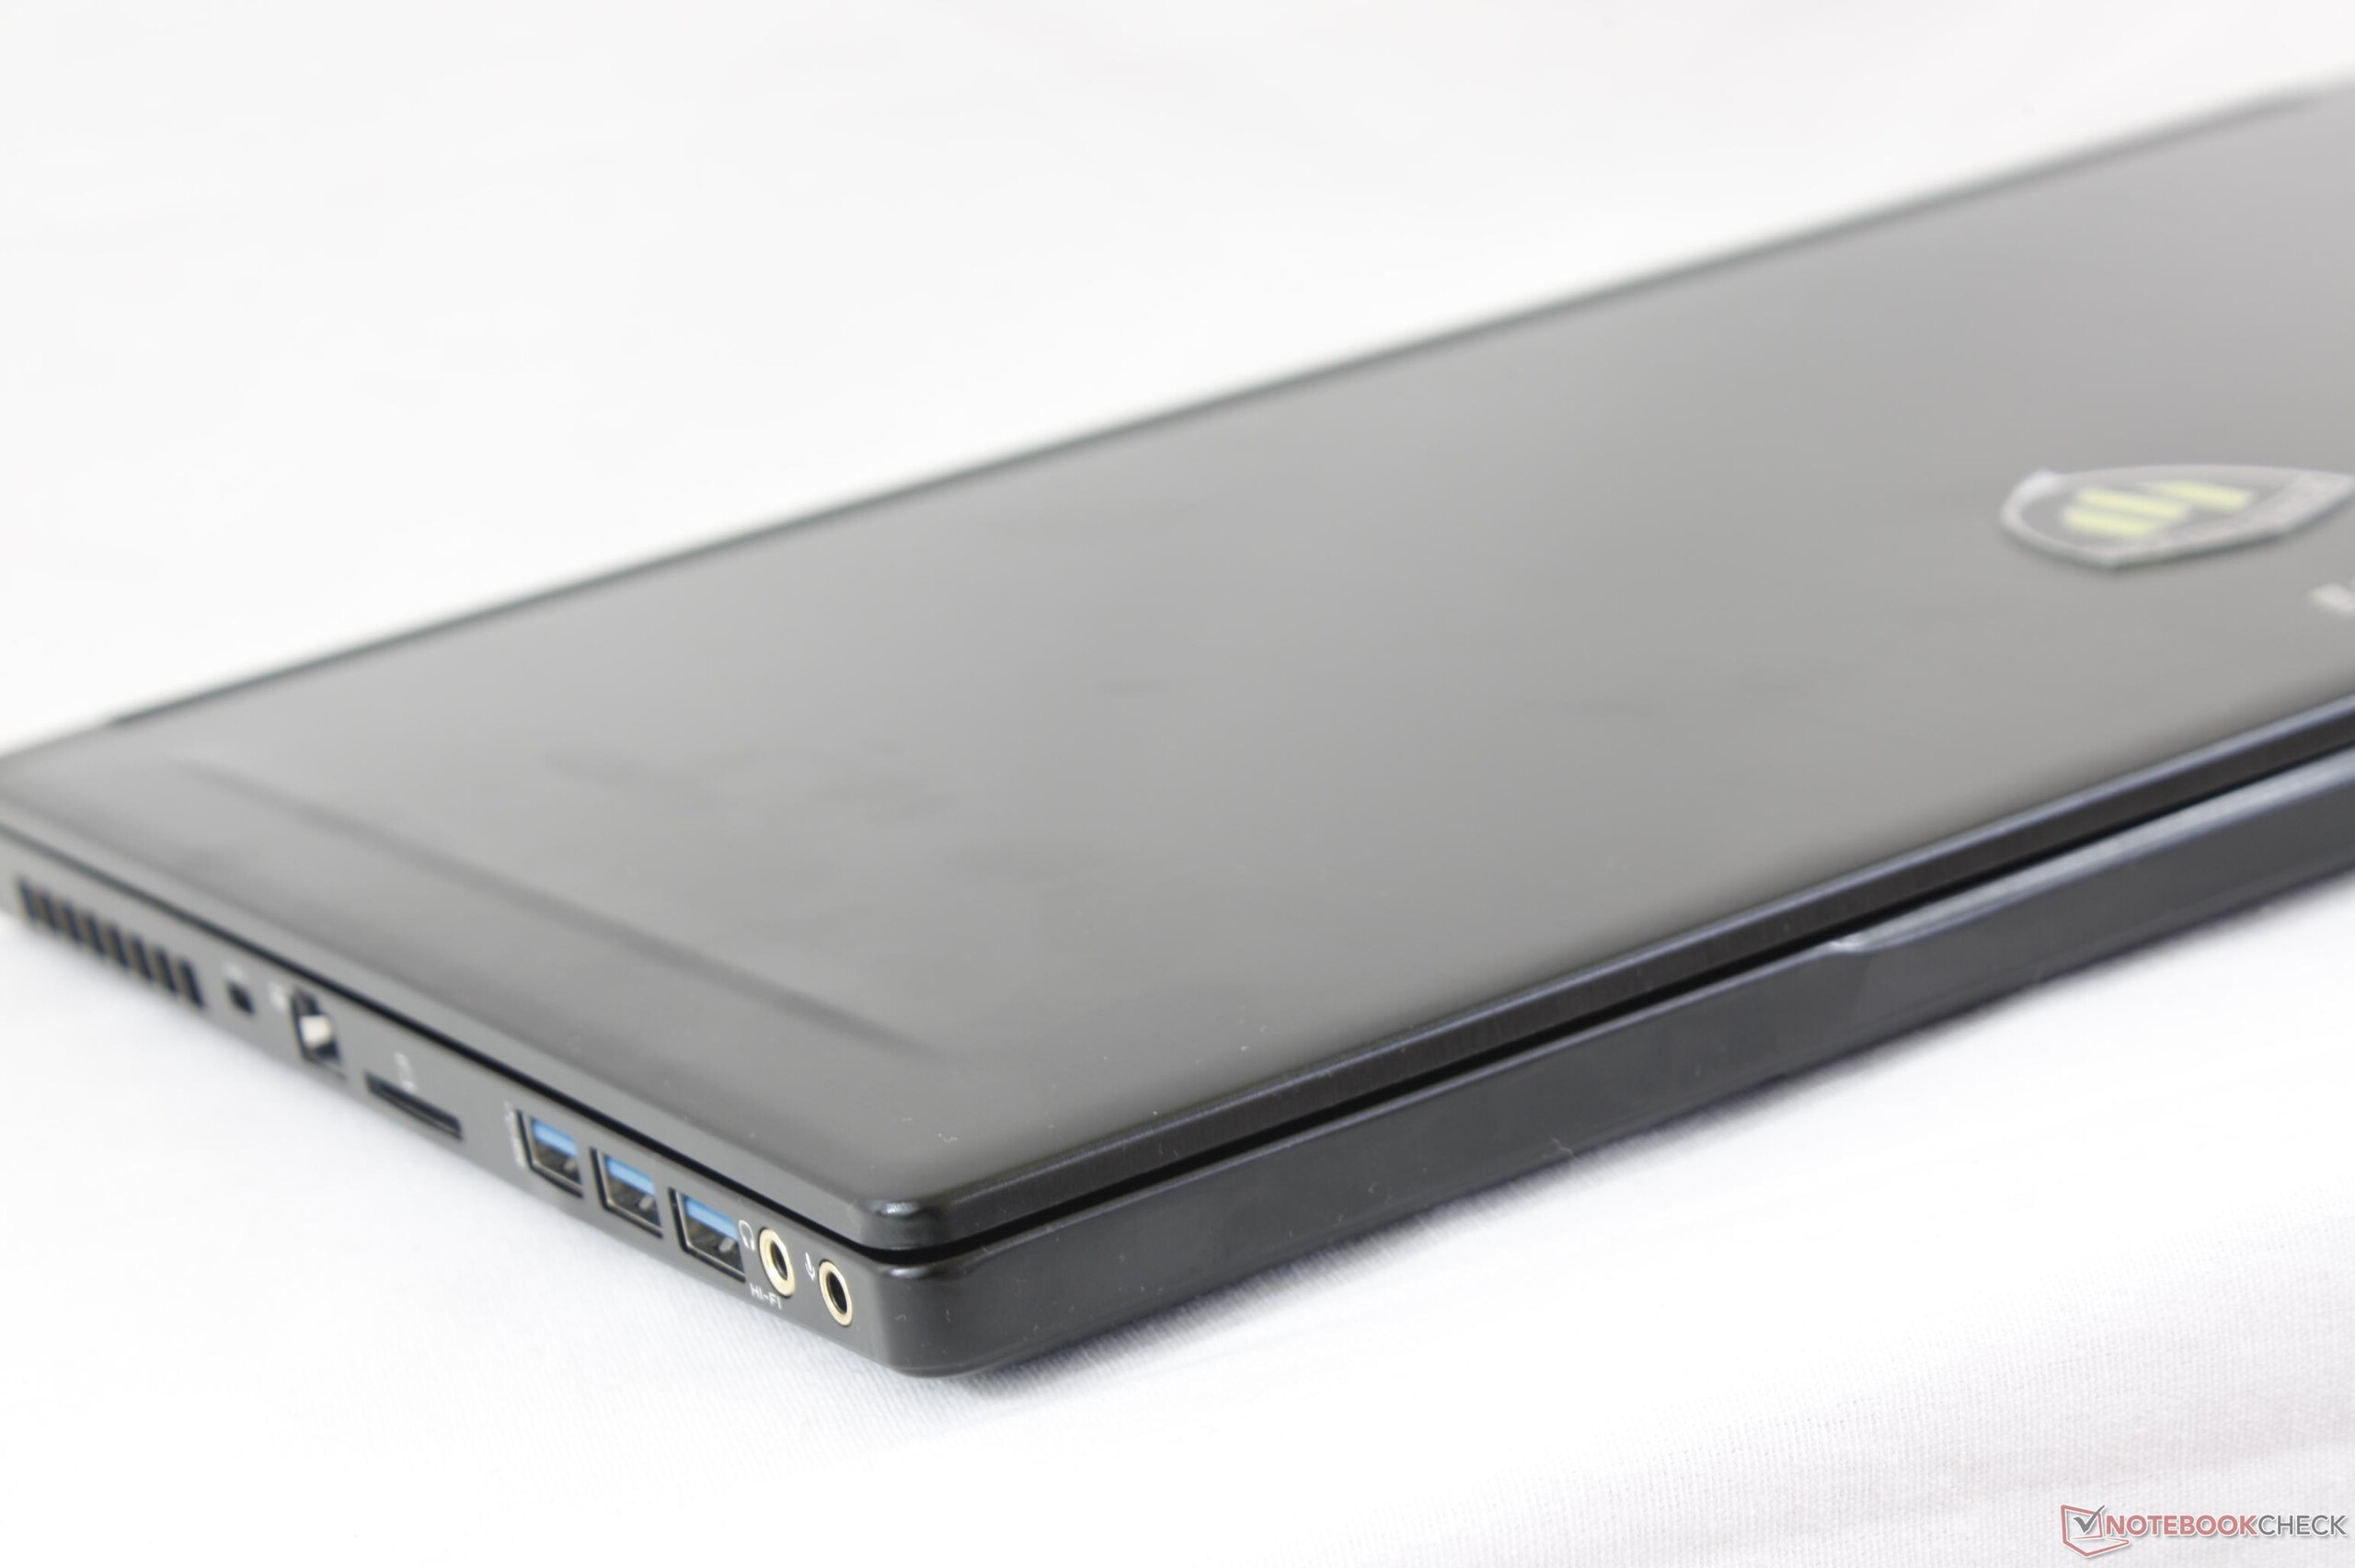
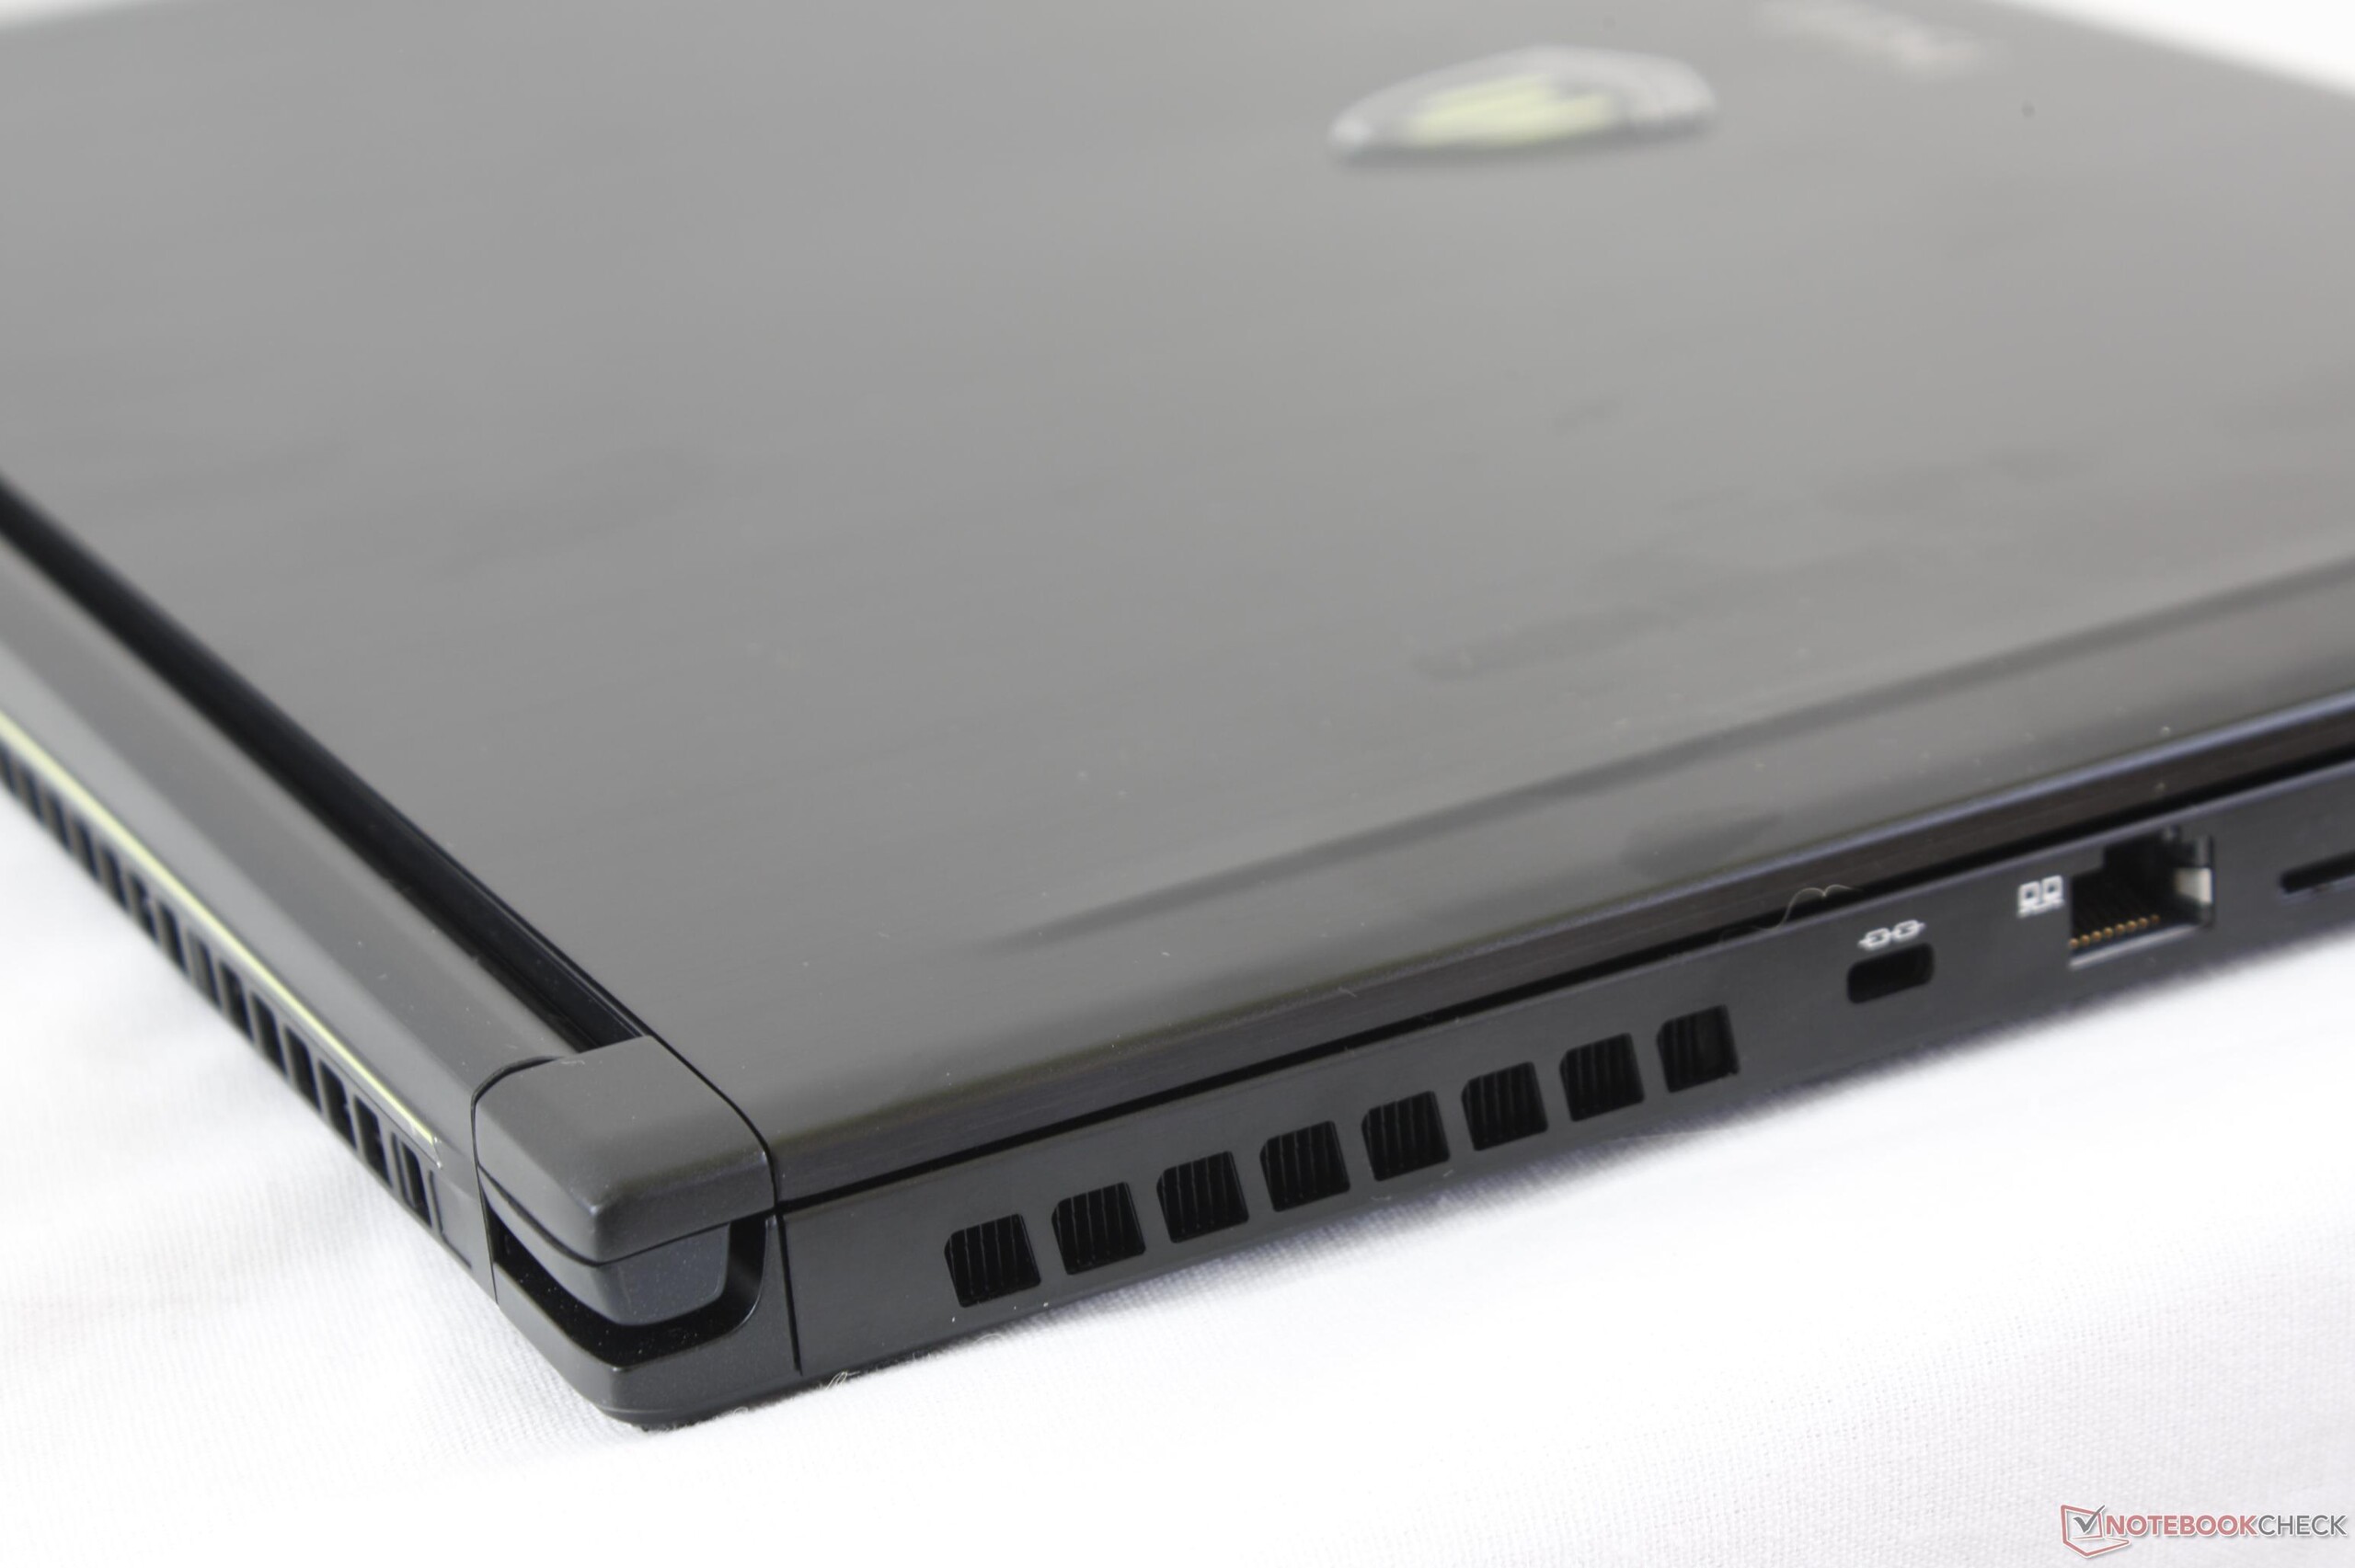
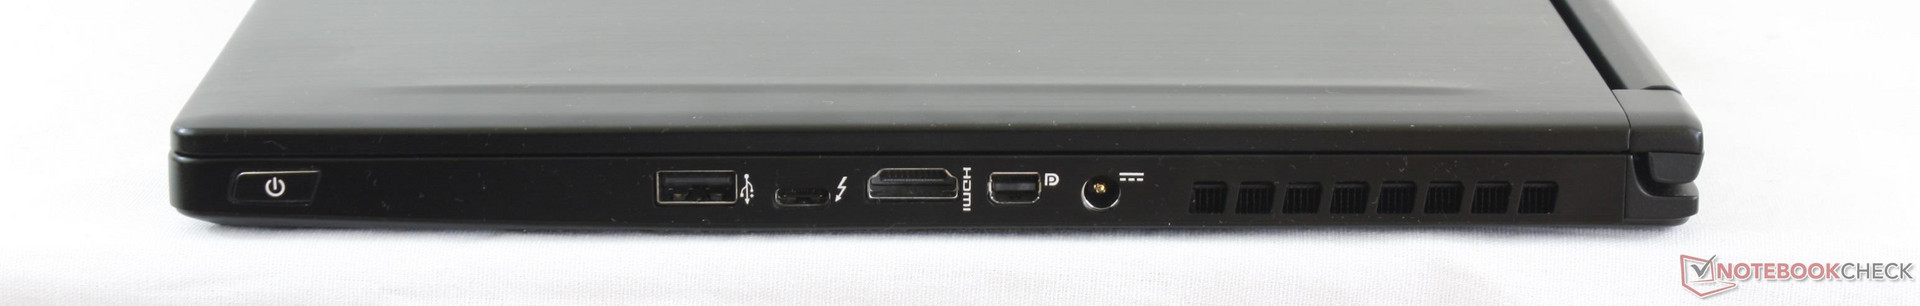
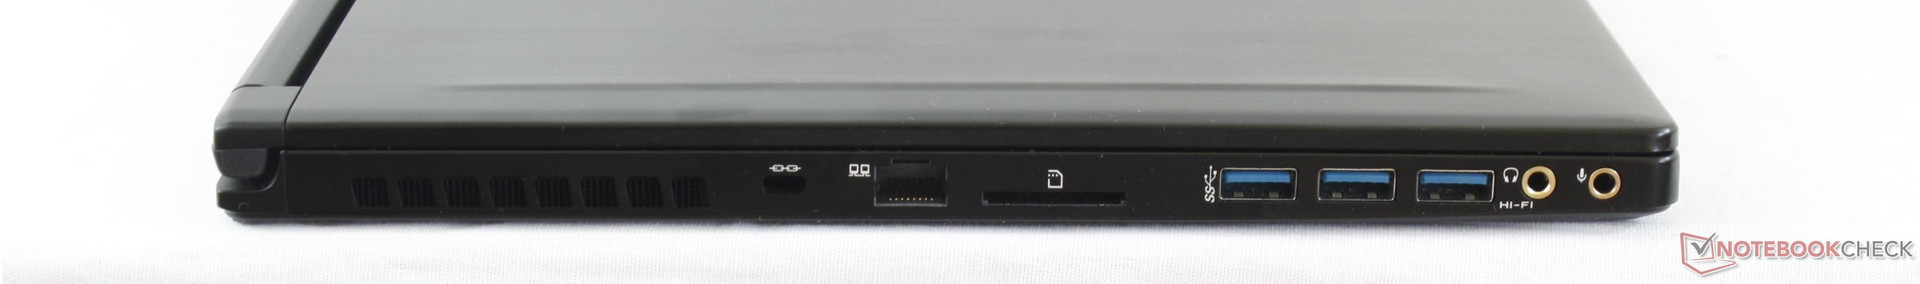
The WS63 packs in a lot of ports considering the small size including the all-important Thunderbolt 3 port. As a workstation, however, it's missing a handful of staples such as VGA, Smart Card, and ExpressCard. Users will have to rely on the versatility of the Thunderbolt 3 port to make up for the omitted features and it's also somewhat disappointing to see HDMI 1.4 instead of the newer 2.0 standard. Port positioning is somewhat unfavorable as many are very close to the front where cables are more likely to entangle. The three USB ports in particular are packed so closely together that thicker USB cables may prevent the adjacent USB port from being used.
SD Card Reader
The integrated SD reader has not been upgraded and continues to be very slow. Transfer rates average just 25 MB/s when using our Toshiba UHS-II SDXC test card and moving 1 GB worth of files from the card to desktop will take 40 seconds. Most SD readers on other notebooks are several times faster than what the MSI GS/WS series currently offer.
| SD Card Reader | |
| average JPG Copy Test (av. of 3 runs) | |
| Dell Precision 5520 UHD | |
| Lenovo ThinkPad P51 20HH0016GE | |
| MSI WT72-6QM | |
| MSI WS63 7RF-290US | |
| maximum AS SSD Seq Read Test (1GB) | |
| Dell Precision 5520 UHD | |
| Lenovo ThinkPad P51 20HH0016GE | |
| MSI WT72-6QM | |
| MSI WS63 7RF-290US | |
Software
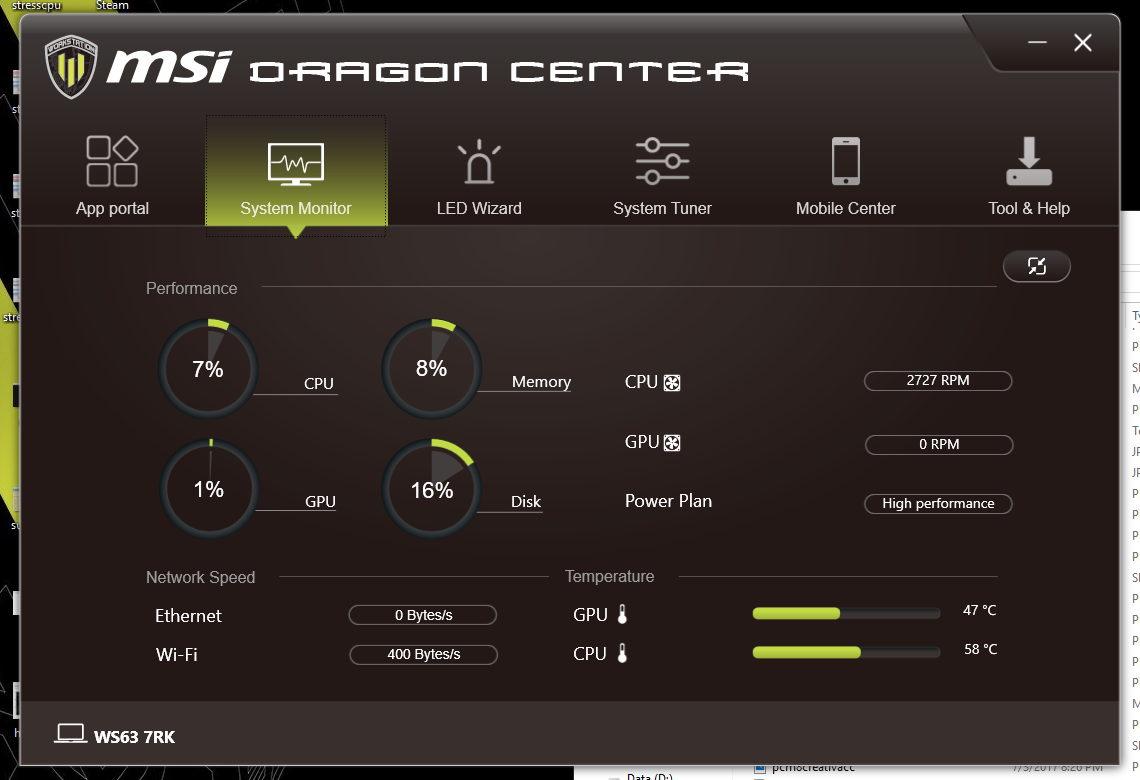
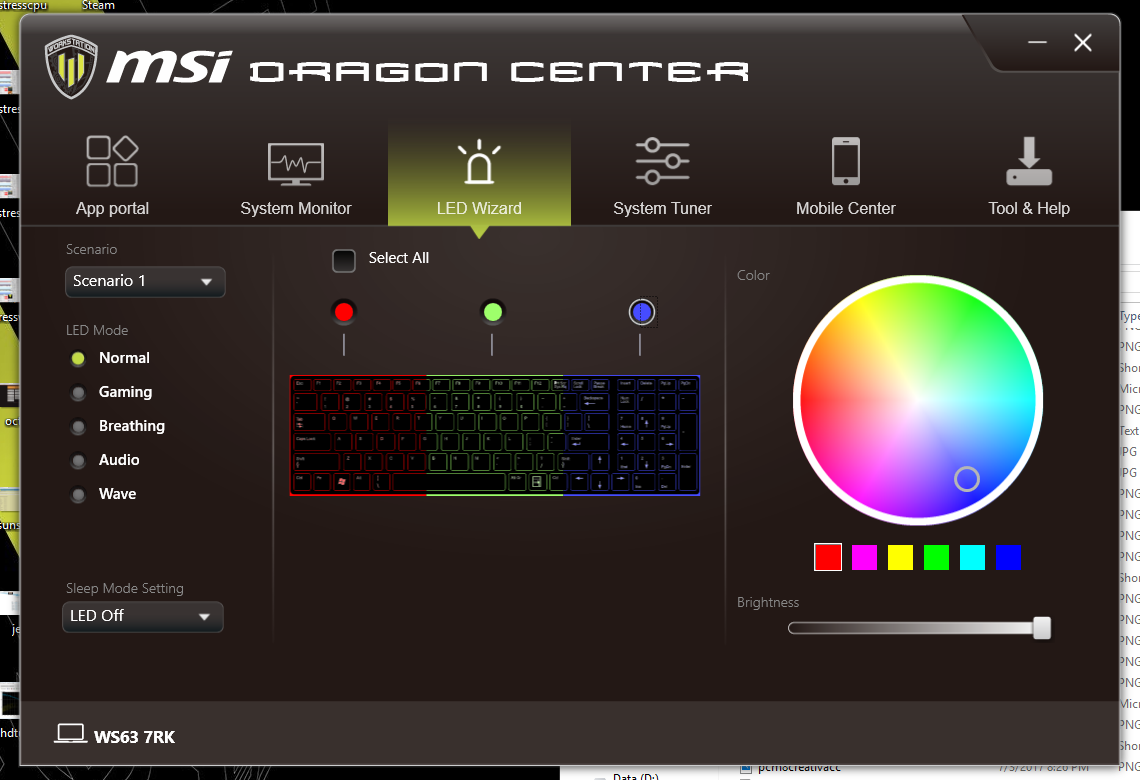
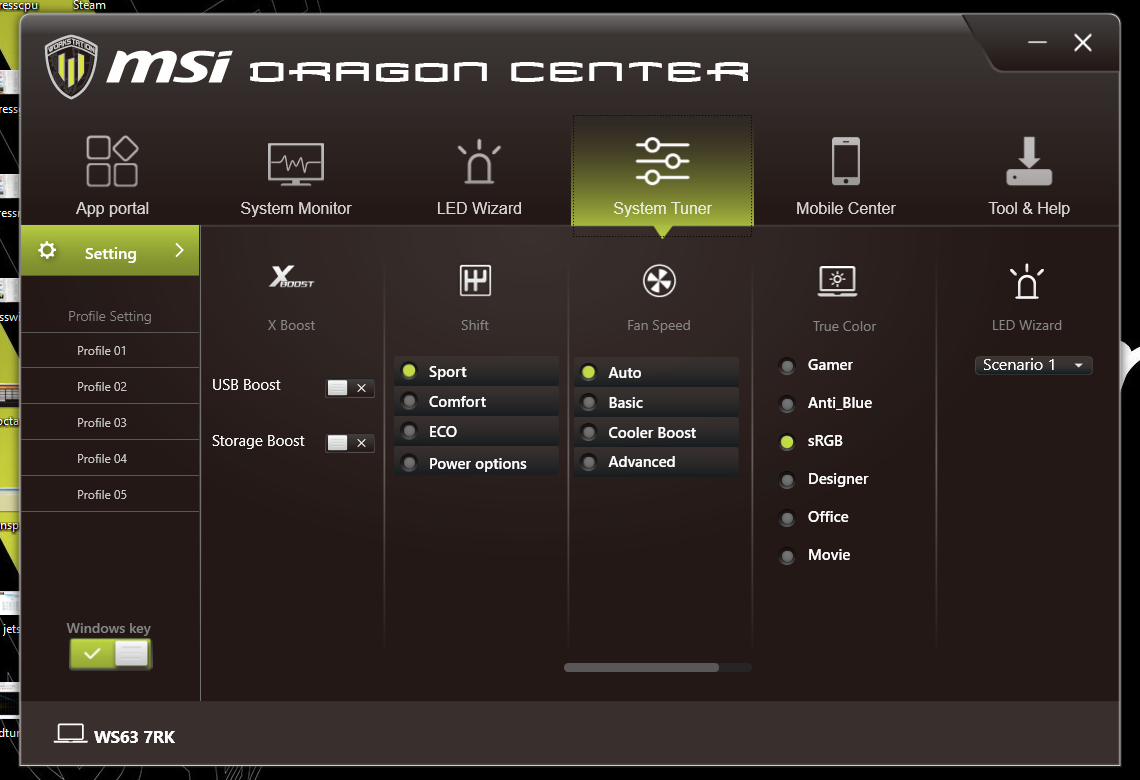
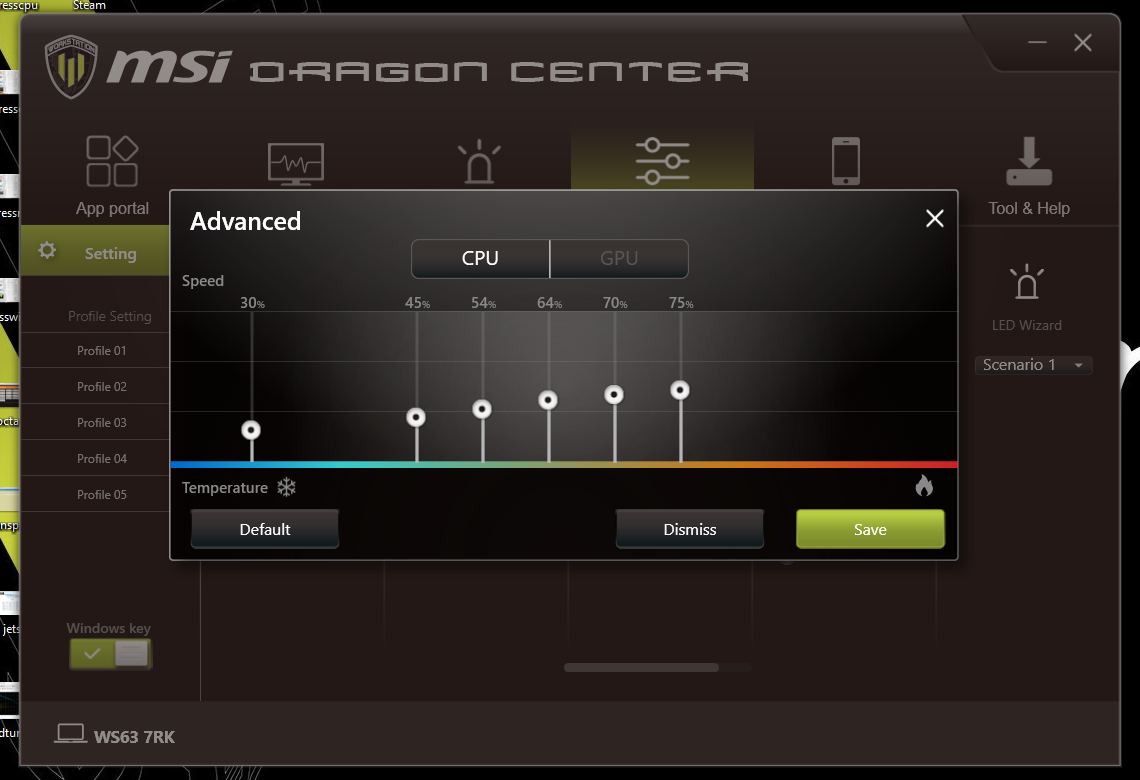
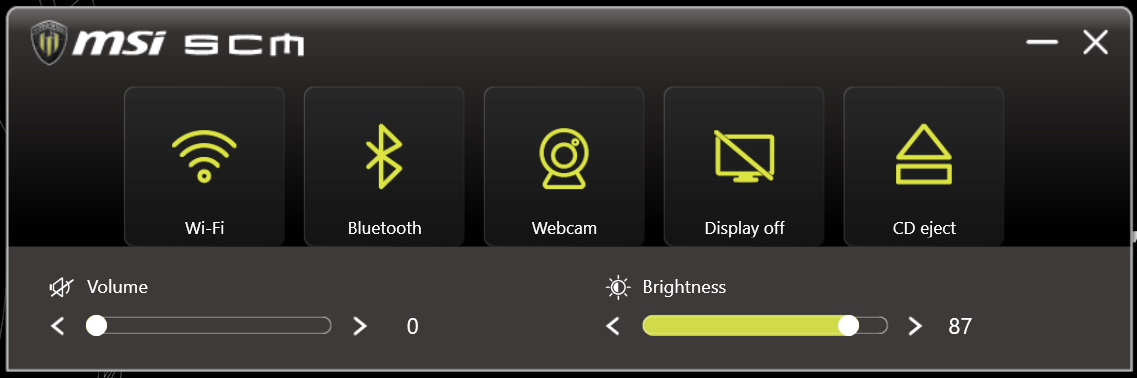
The same Dragon Center and System Control Manager software as found on the G series is back with some altered colors. The UI is intuitive and easy to use when compared to the crowded and smaller font approach of the Aorus/Gigabyte notebooks. Temperature and fan controls aren't as advanced as on the EVGA SC15. The gaming-centric MSI Mobile Center is still supported for monitoring systems vitals via smartphone if desired.
The Nahimic audio software is conspicuously missing on the system.
Communication
MSI has swapped out the gaming-centric Killer 1535 module in the GS series for the Intel 8265. WS63 owners will miss out on the Killer software and hardware features, but basic performance will be essentially identical. We are able to record a real-world transfer rate of 638 Mbps against a theoretical maximum of 867 Mbps when standing one meter away from our Linksys EA8500 test router. WAN options are not available unlike on the ThinkPad P51.
| Networking | |
| iperf3 transmit AX12 | |
| MSI GS63VR 7RF-228US | |
| MSI WS63 7RF-290US | |
| Lenovo ThinkPad P51 20HH0016GE | |
| Dell Precision 5520 UHD | |
| iperf3 receive AX12 | |
| MSI GS63VR 7RF-228US | |
| Lenovo ThinkPad P51 20HH0016GE | |
| MSI WS63 7RF-290US | |
| Dell Precision 5520 UHD | |
Accessories
There are no included extras outside of a large velvet cleaning cloth. A Thunderbolt 3 adapter for VGA or Smart Card would have been a neat addition considering the workstation audience.
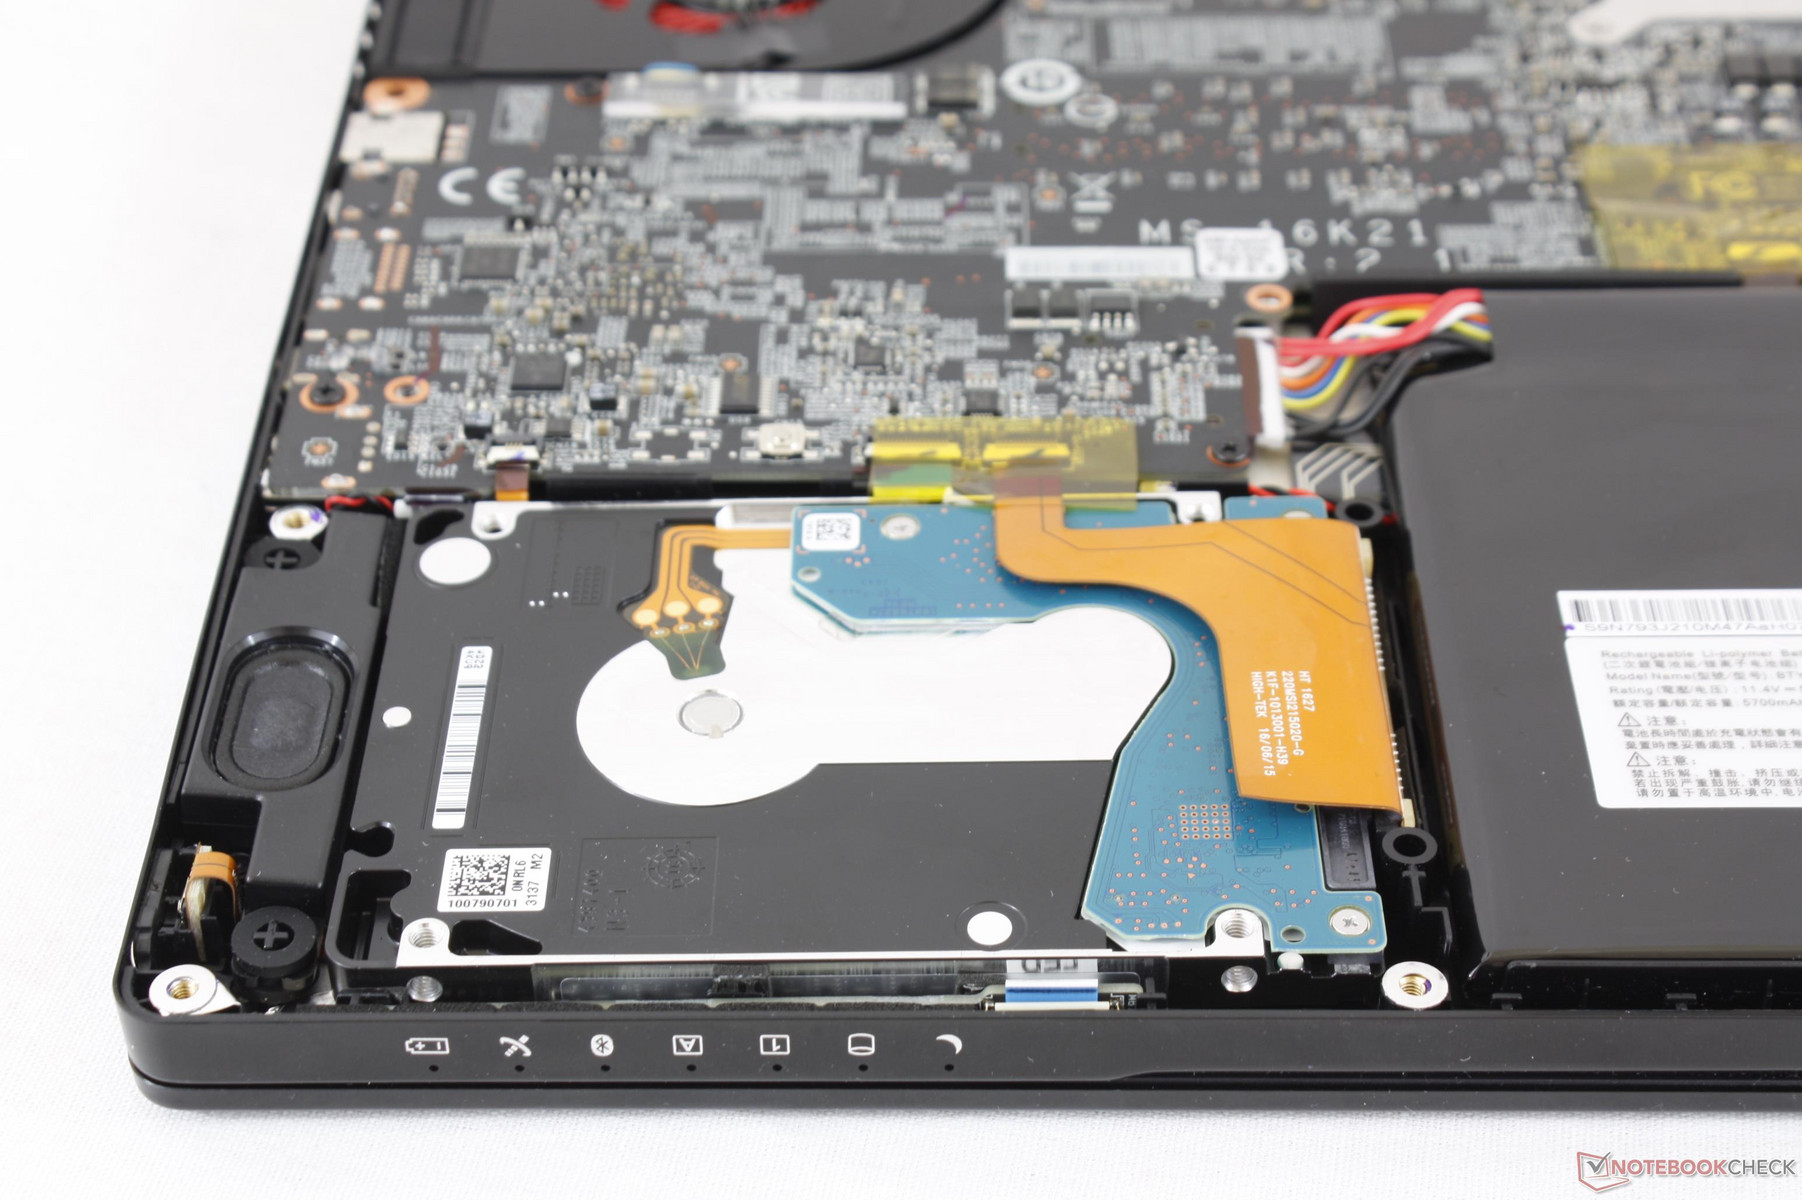
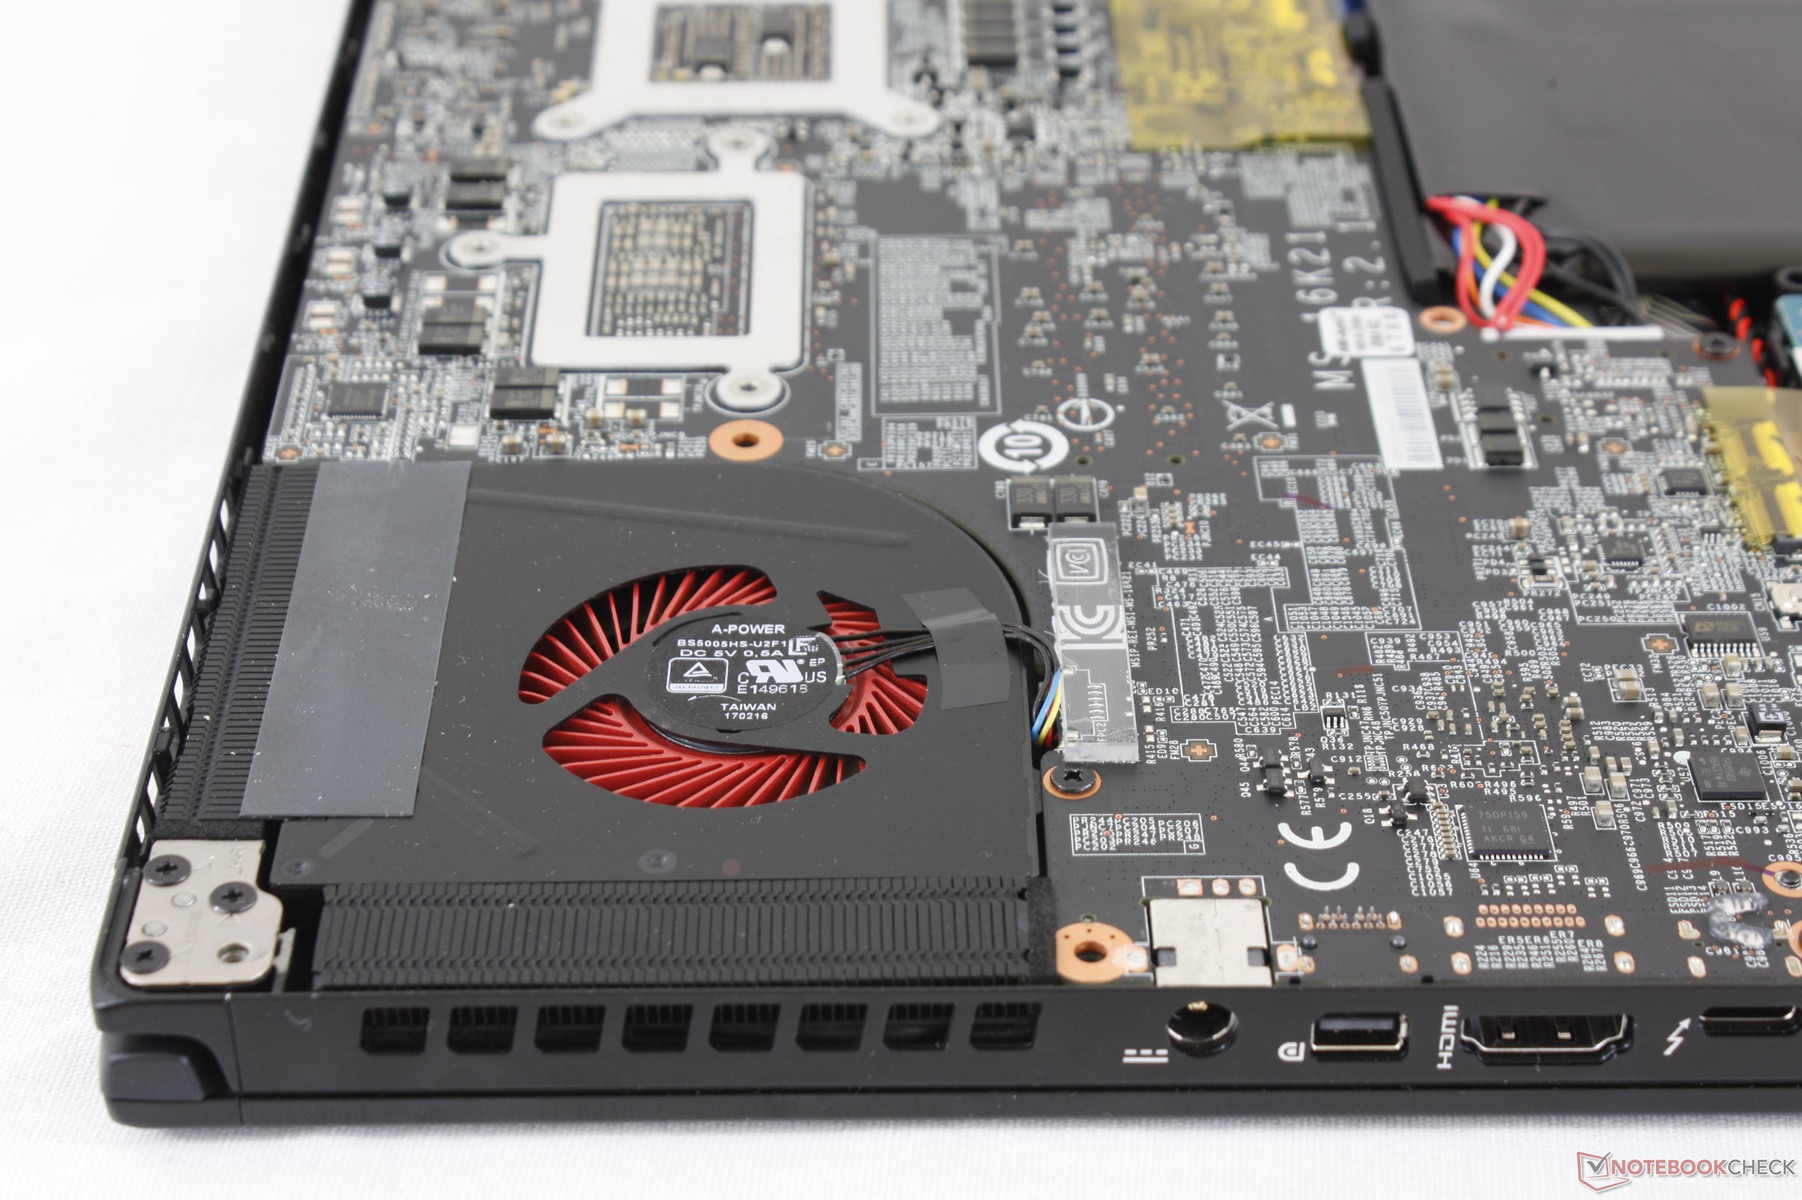
Maintenance
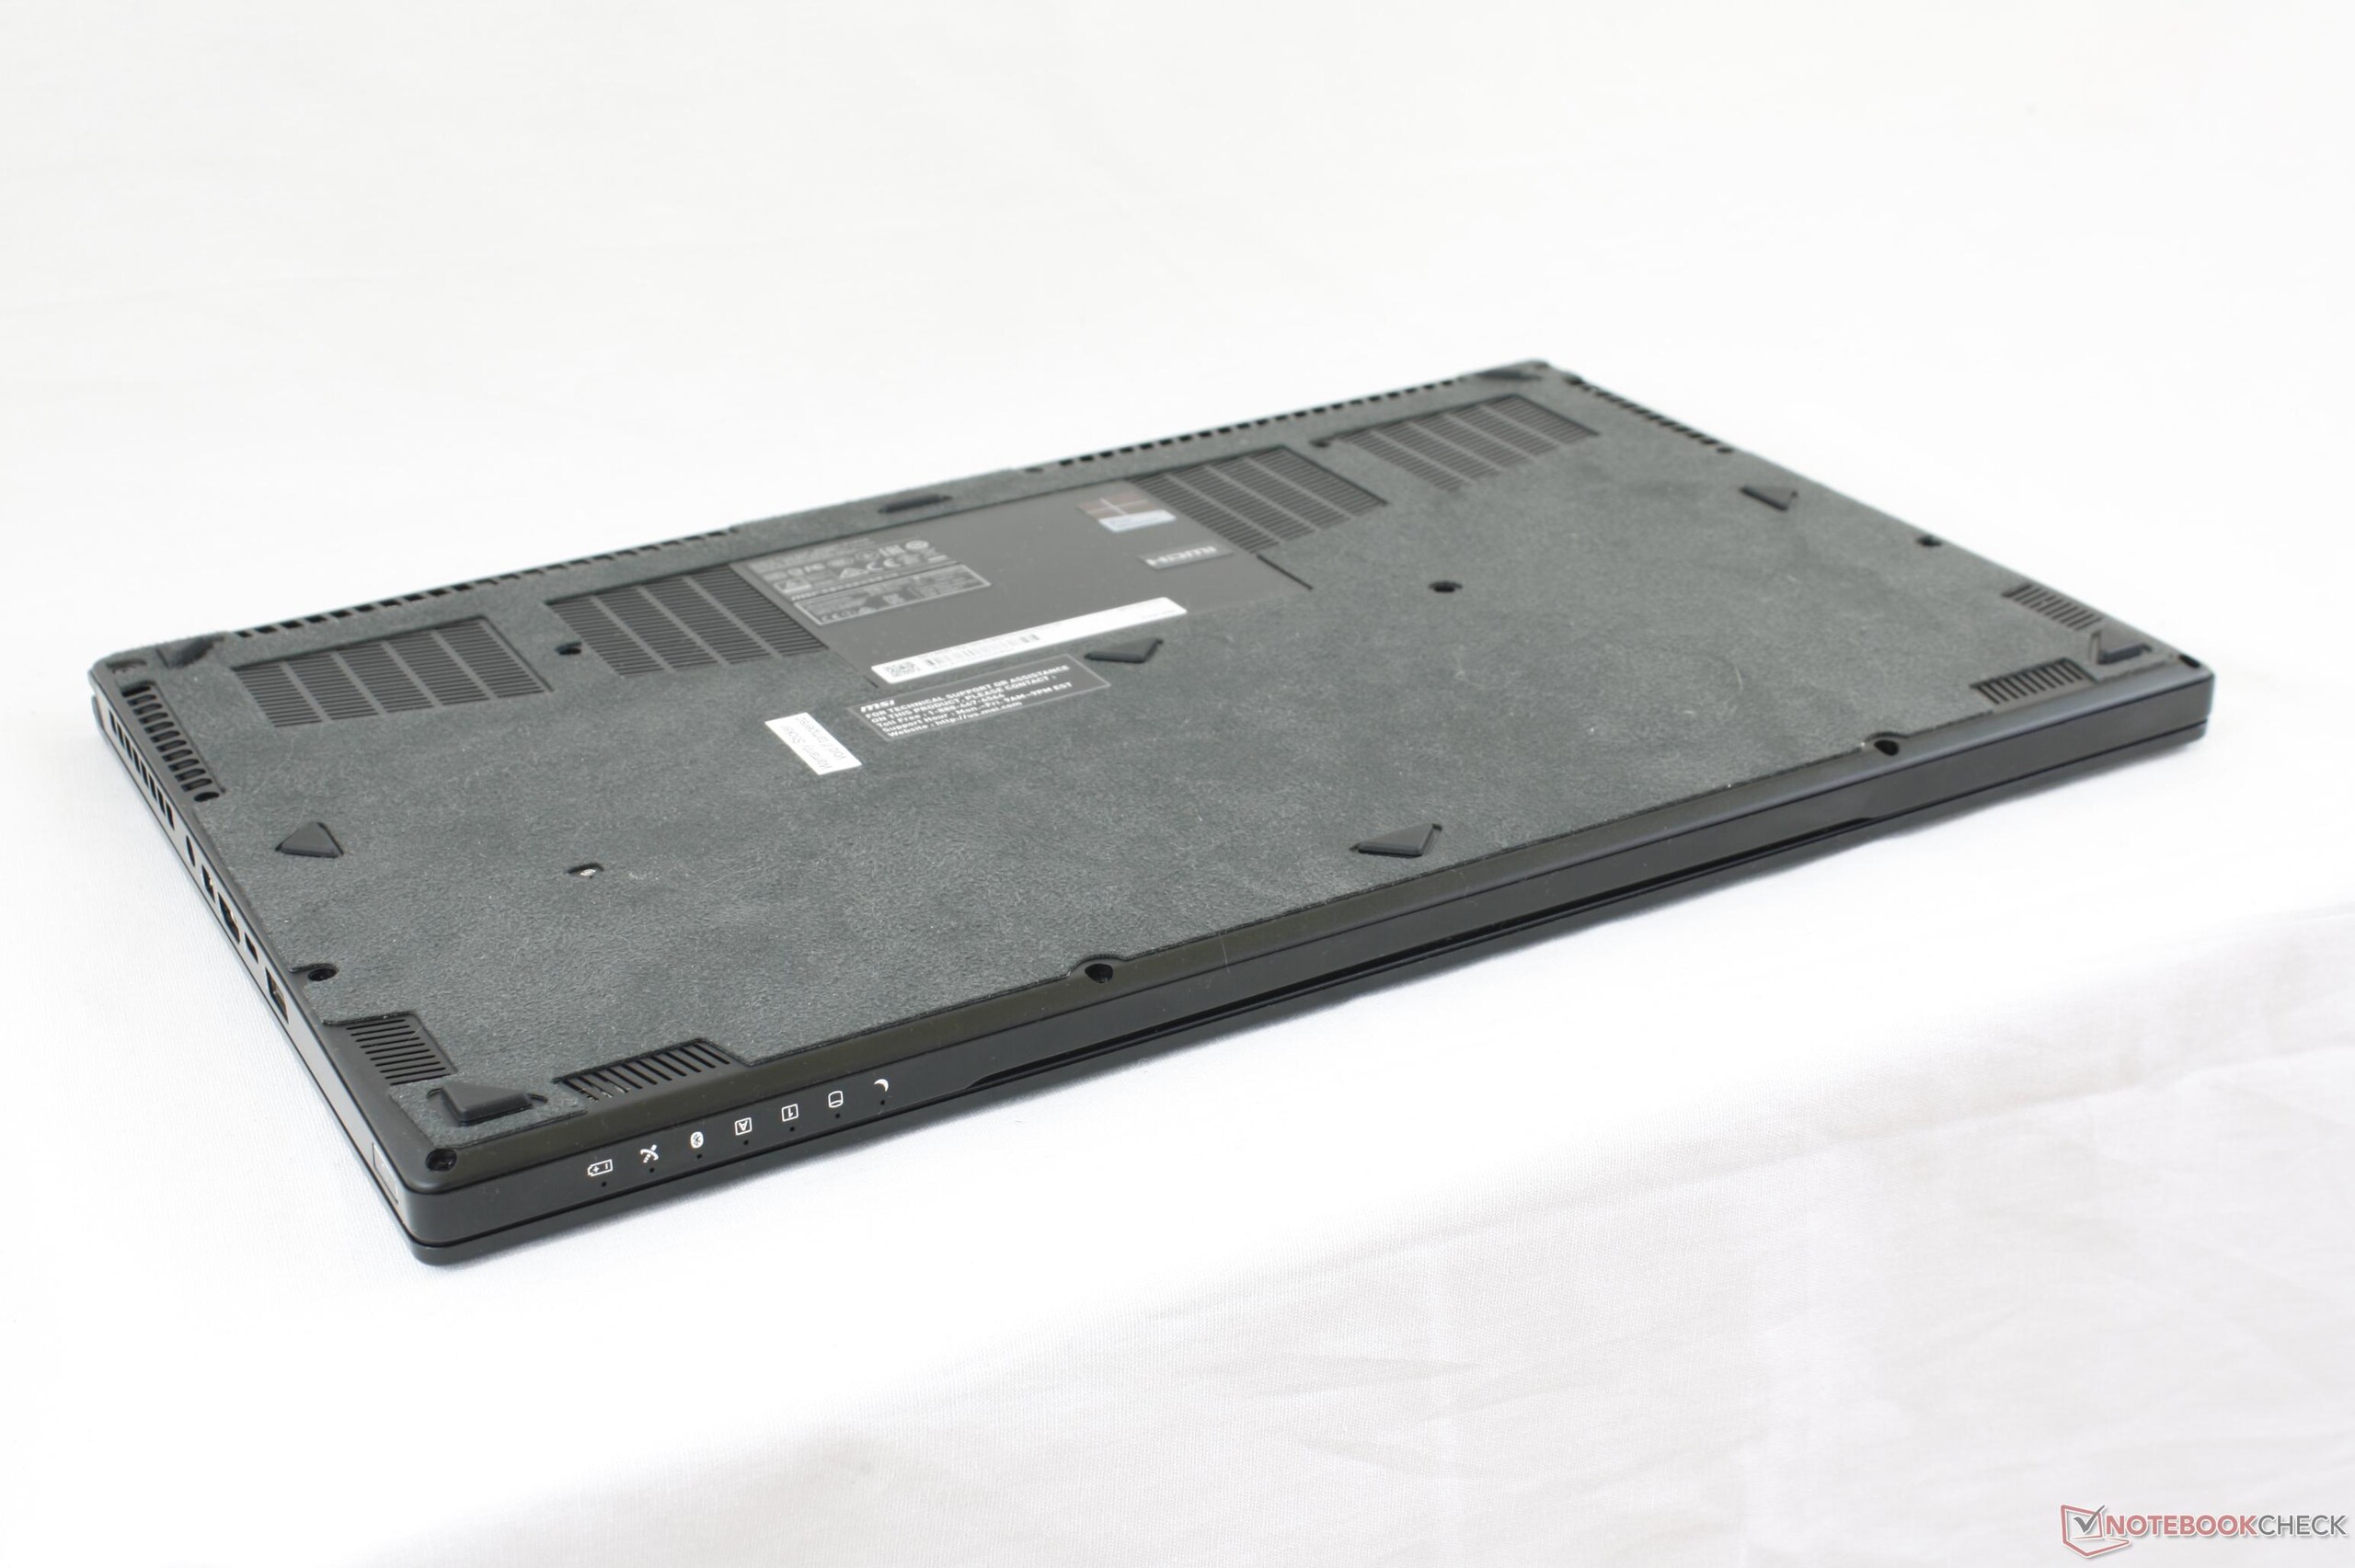
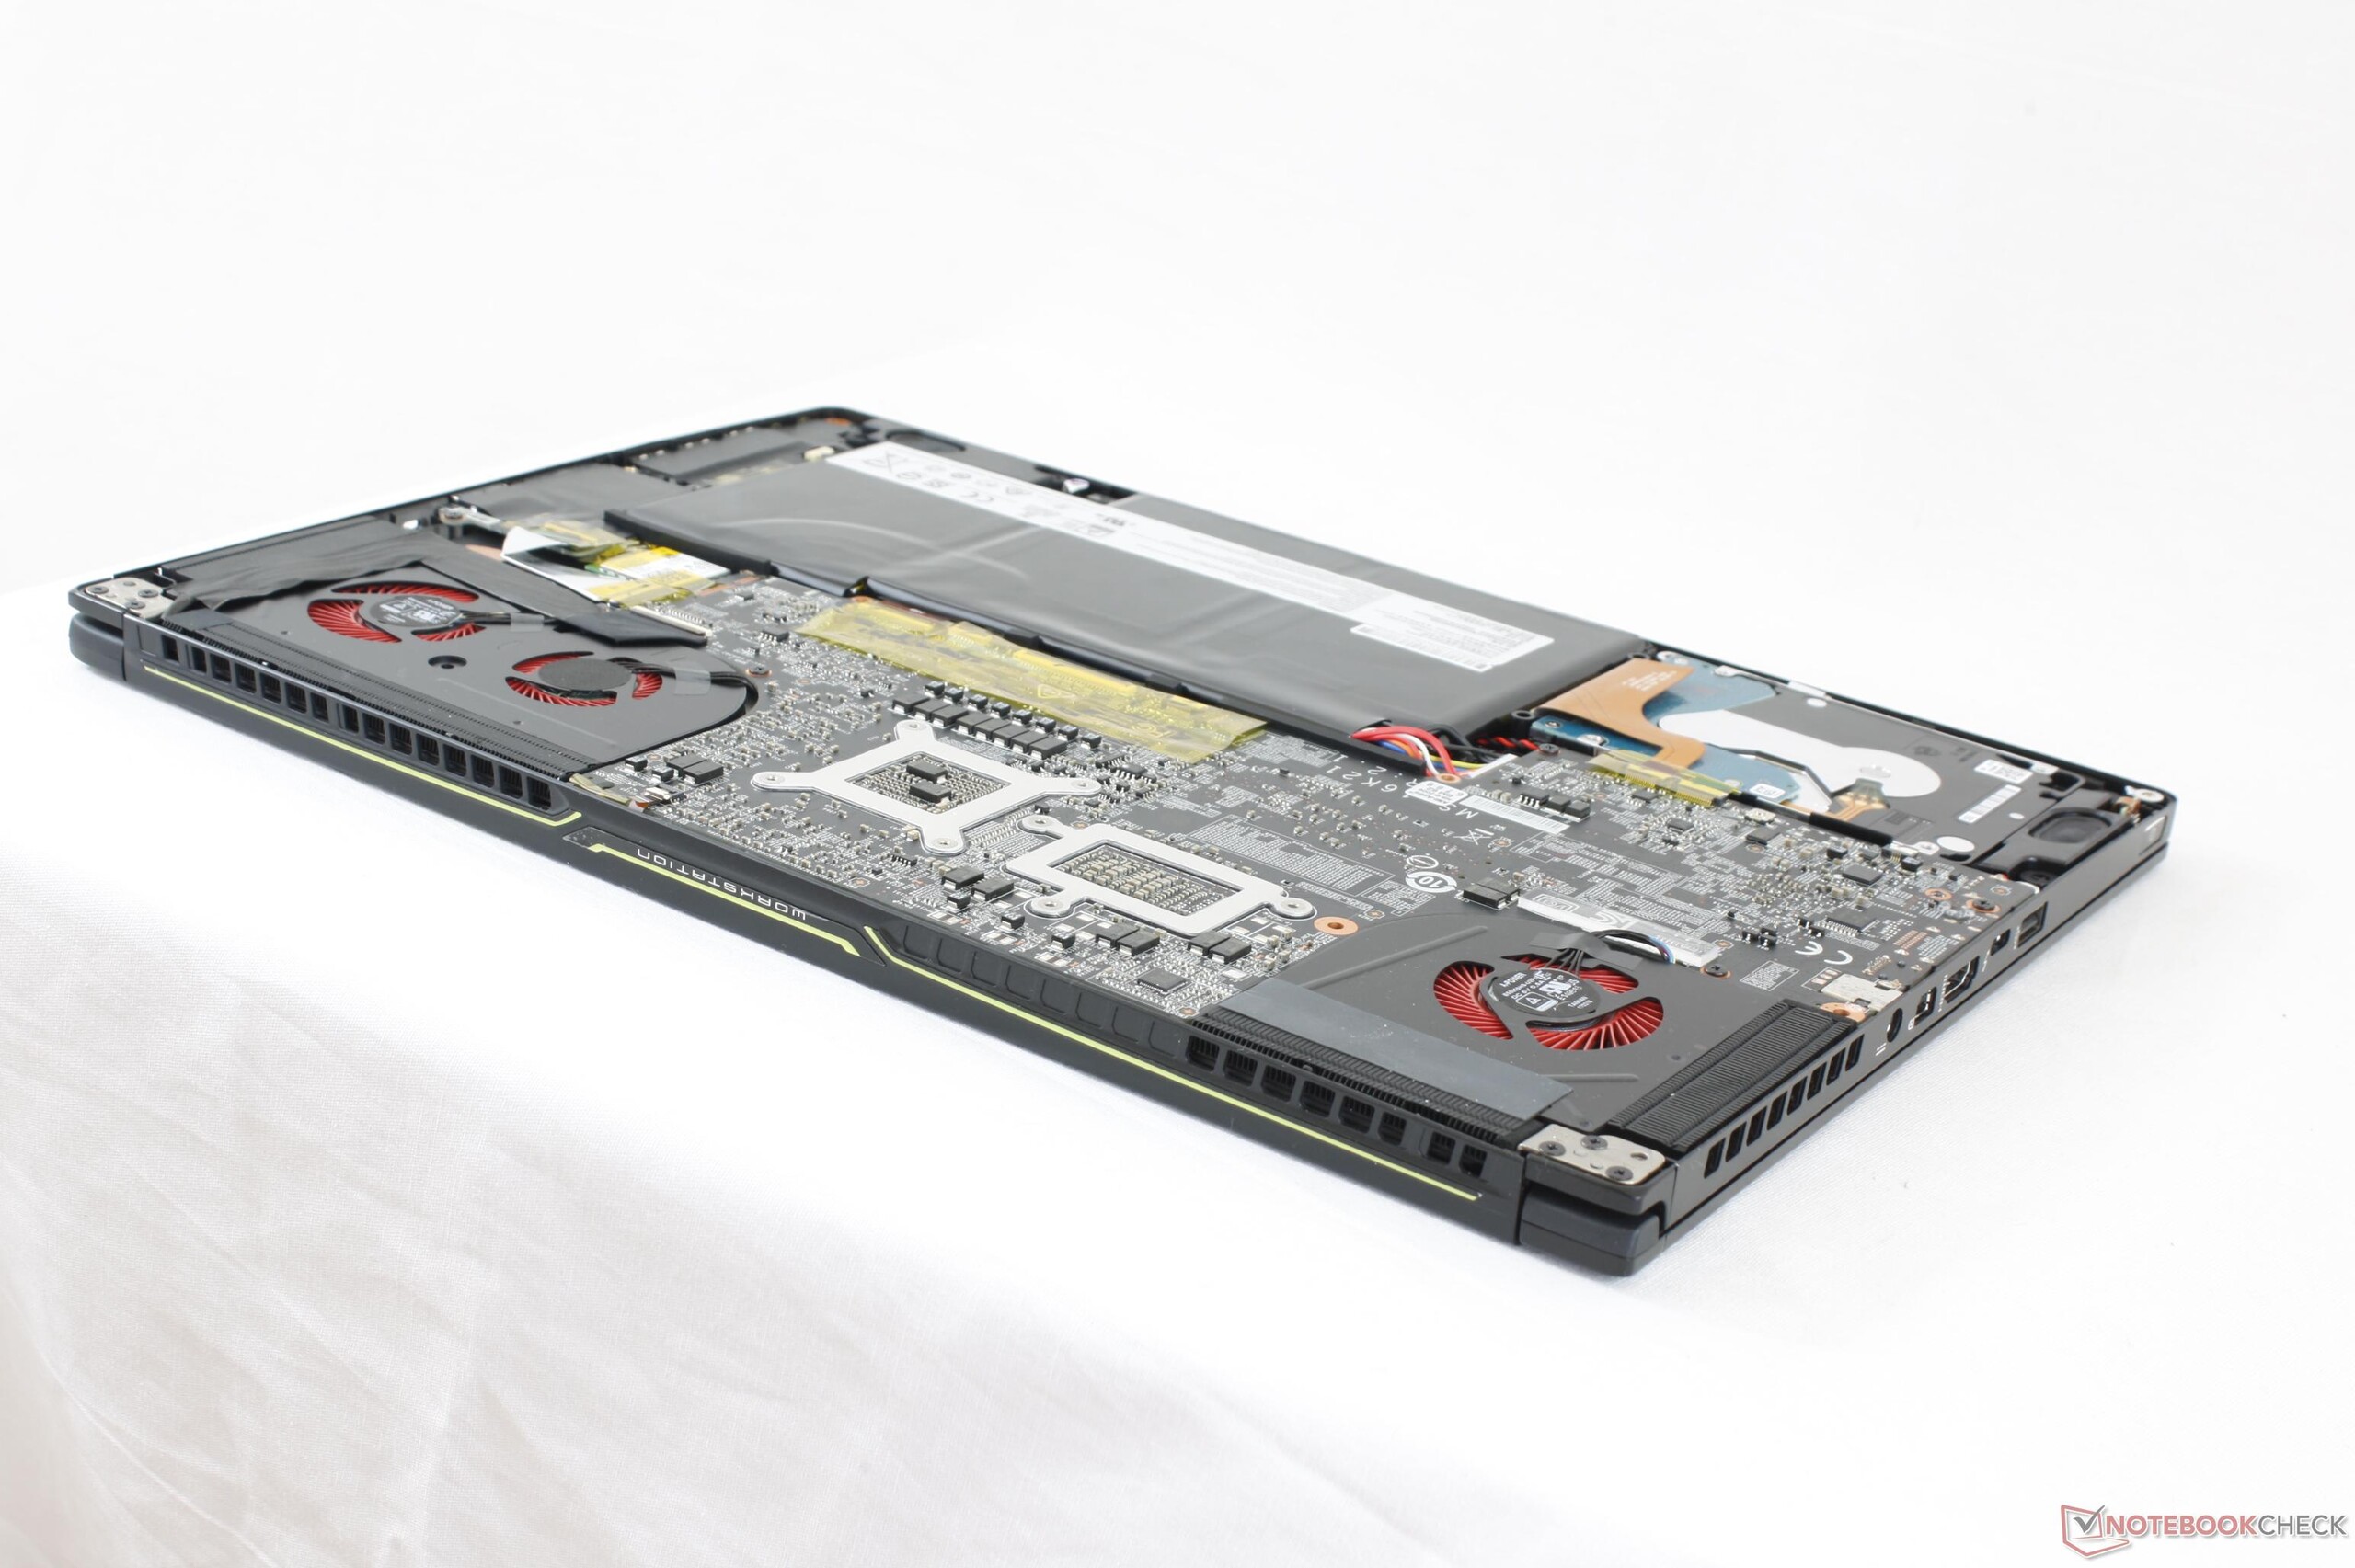
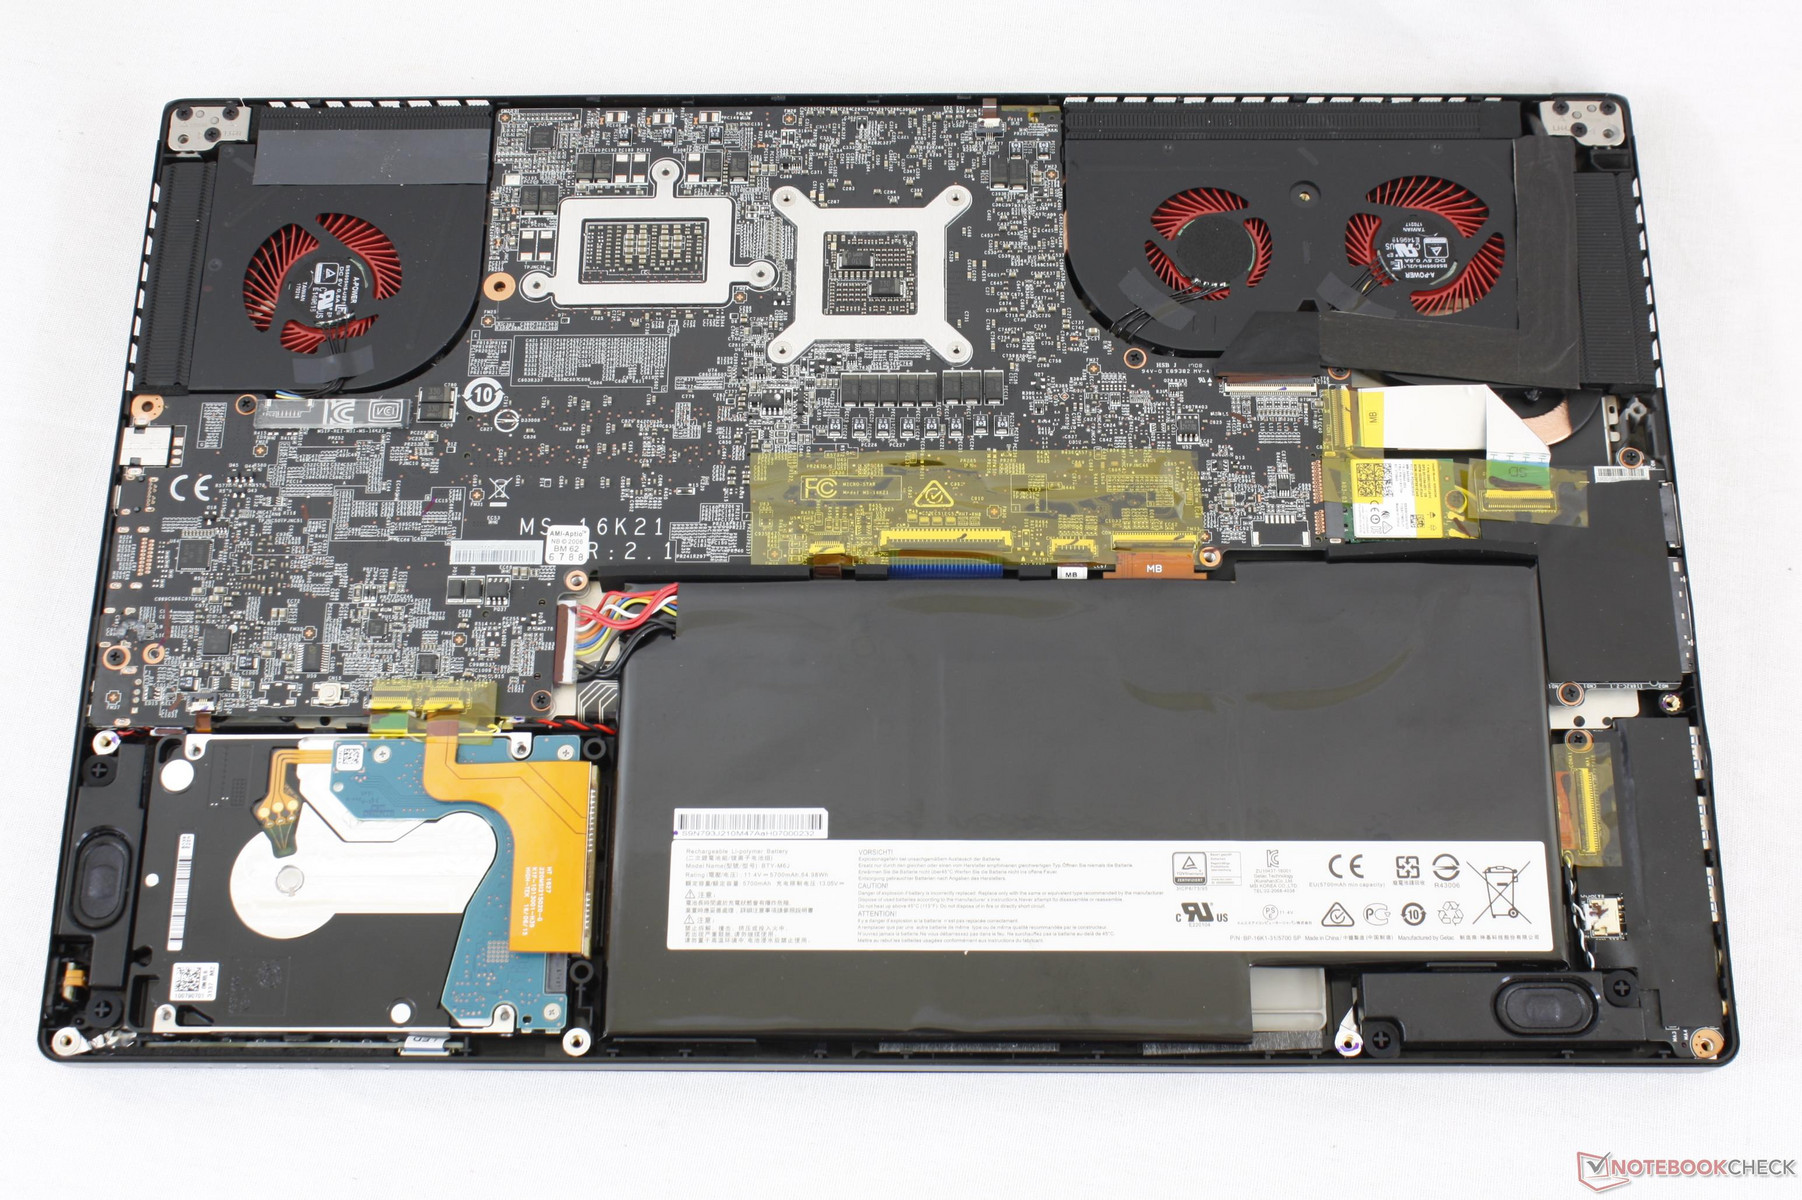
The bottom panel comes off fairly easily with just a Philips screwdriver. Only the battery, WLAN module, and secondary HDD are immediately accessible as most of the core components are on the other side of the motherboard. Removing the bottom panel will still void the warranty which is disappointing for a business-class laptop where serviceability is key.
Warranty
MSI workstations come with 3-year warranty as standard (plus global warranty for the first year) similar to HP's ZBook series.
Input Devices
Keyboard and Touchpad
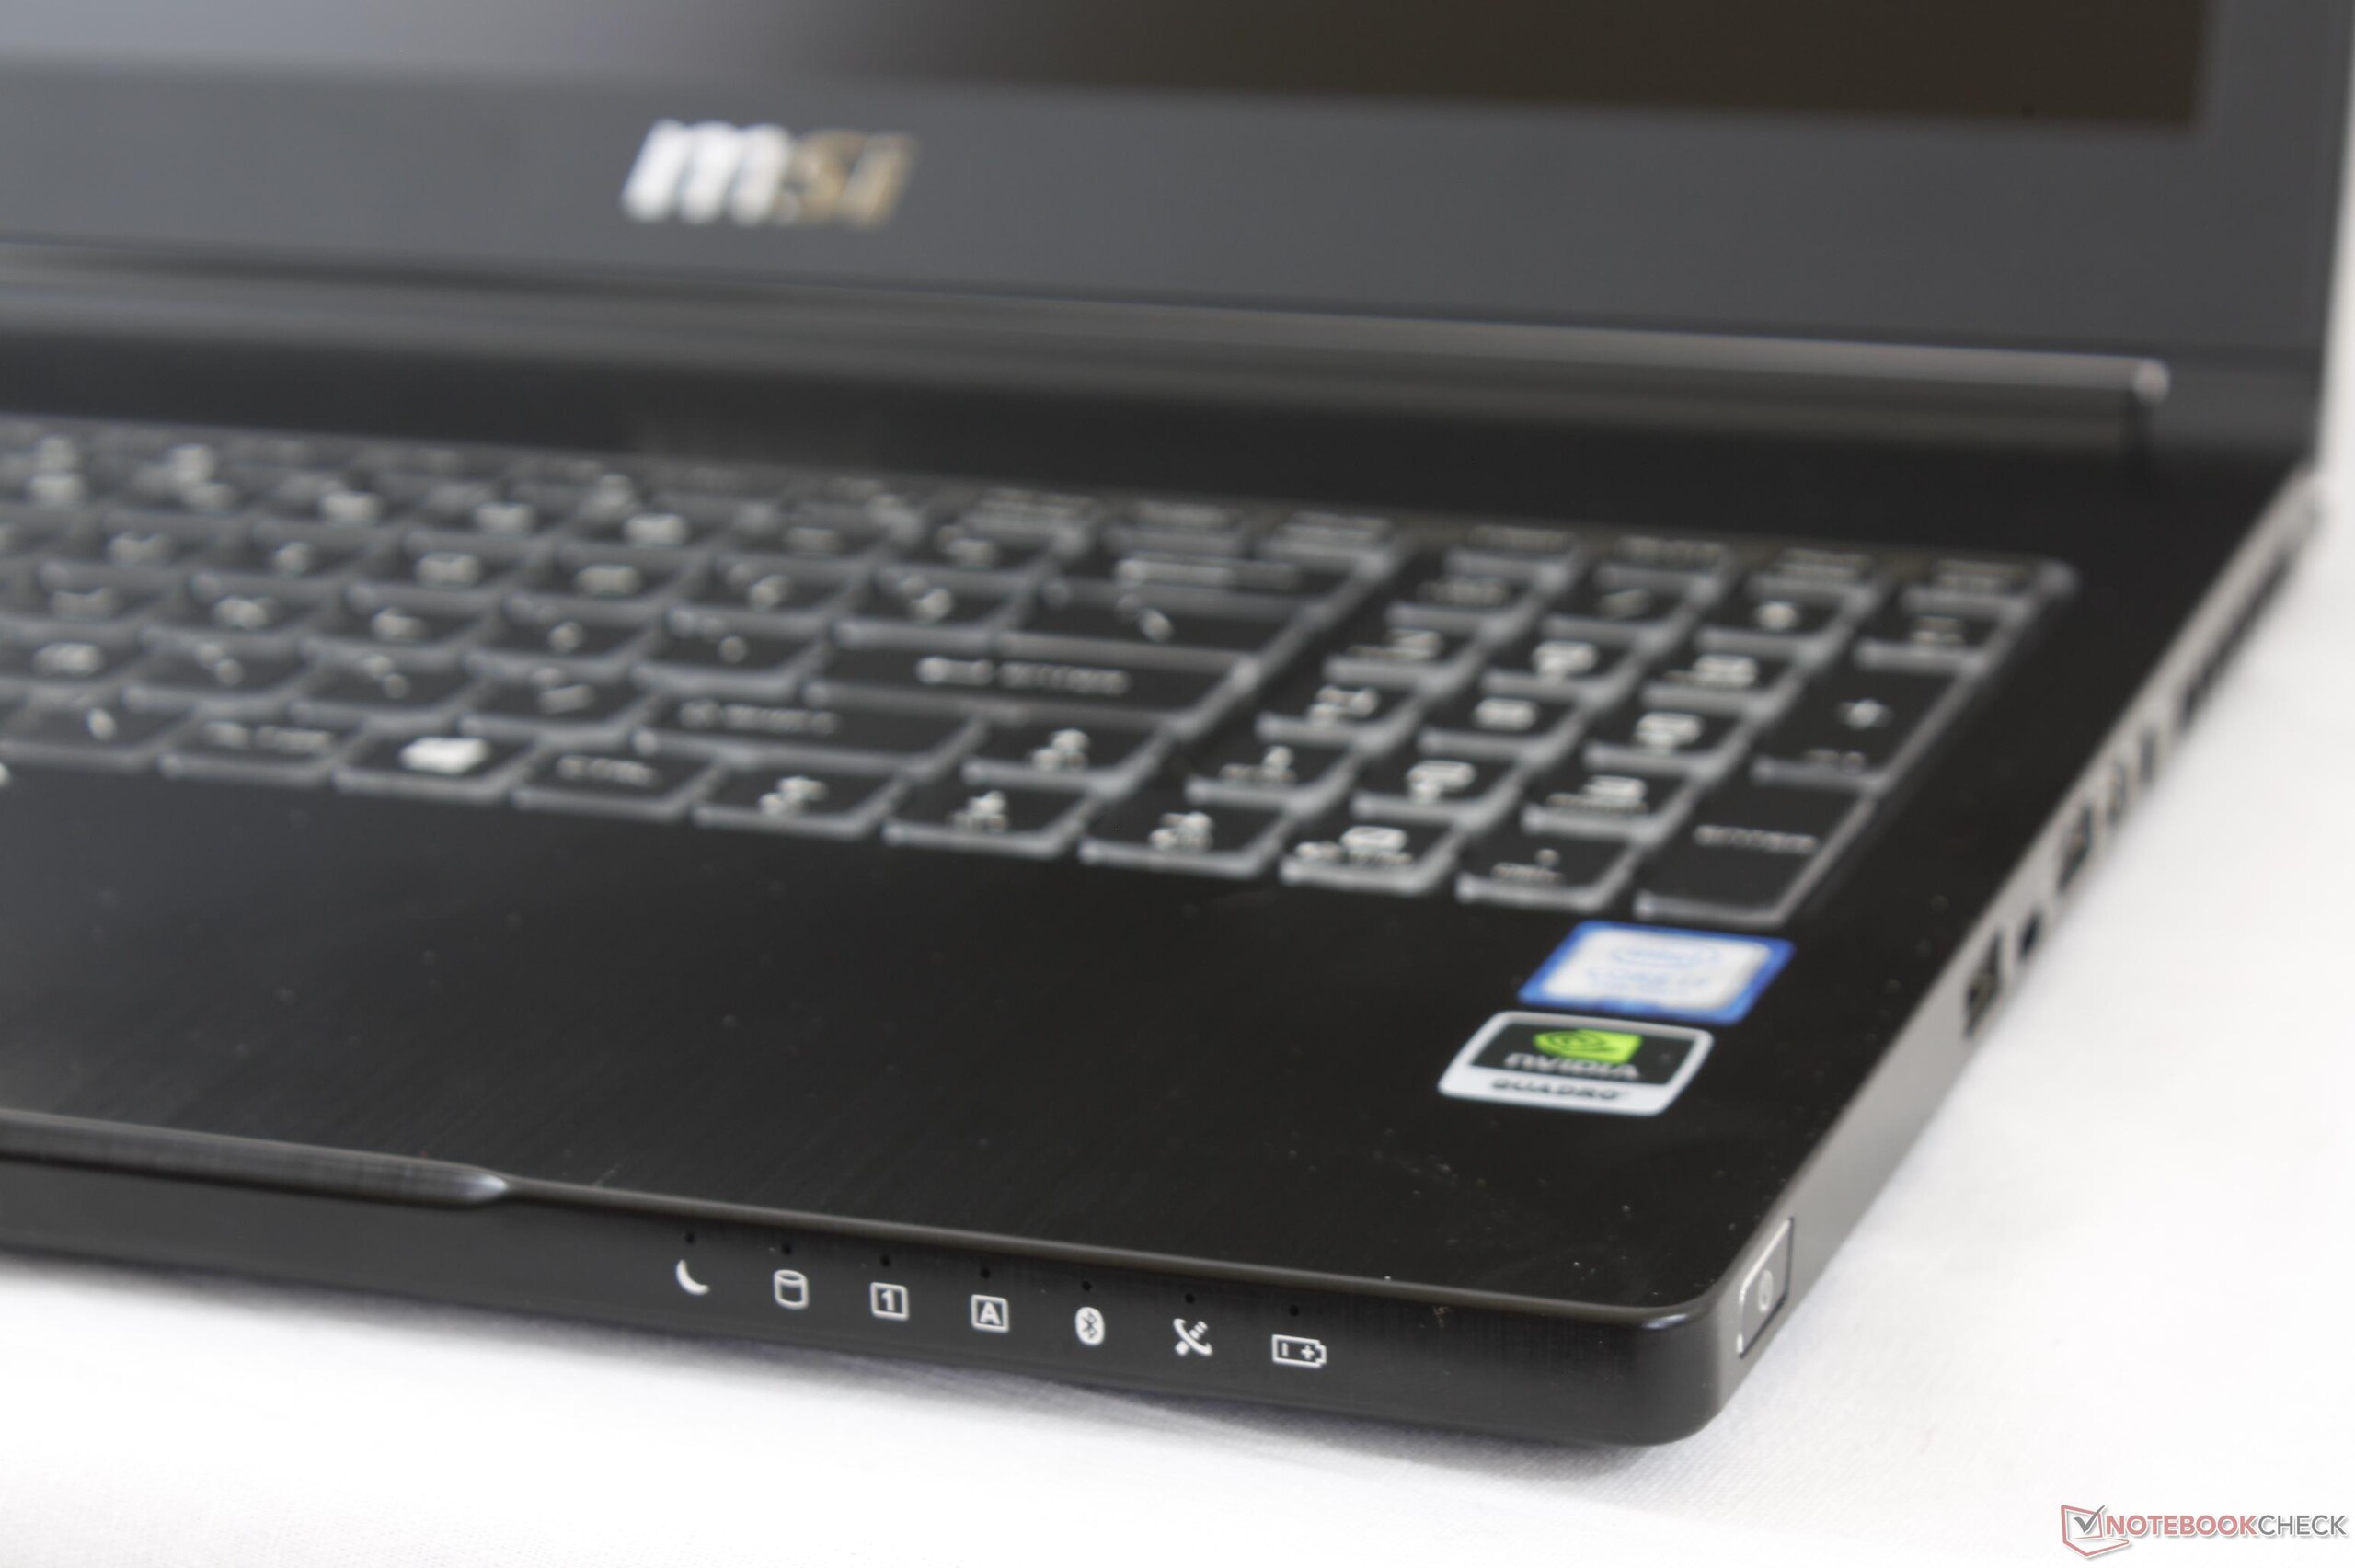
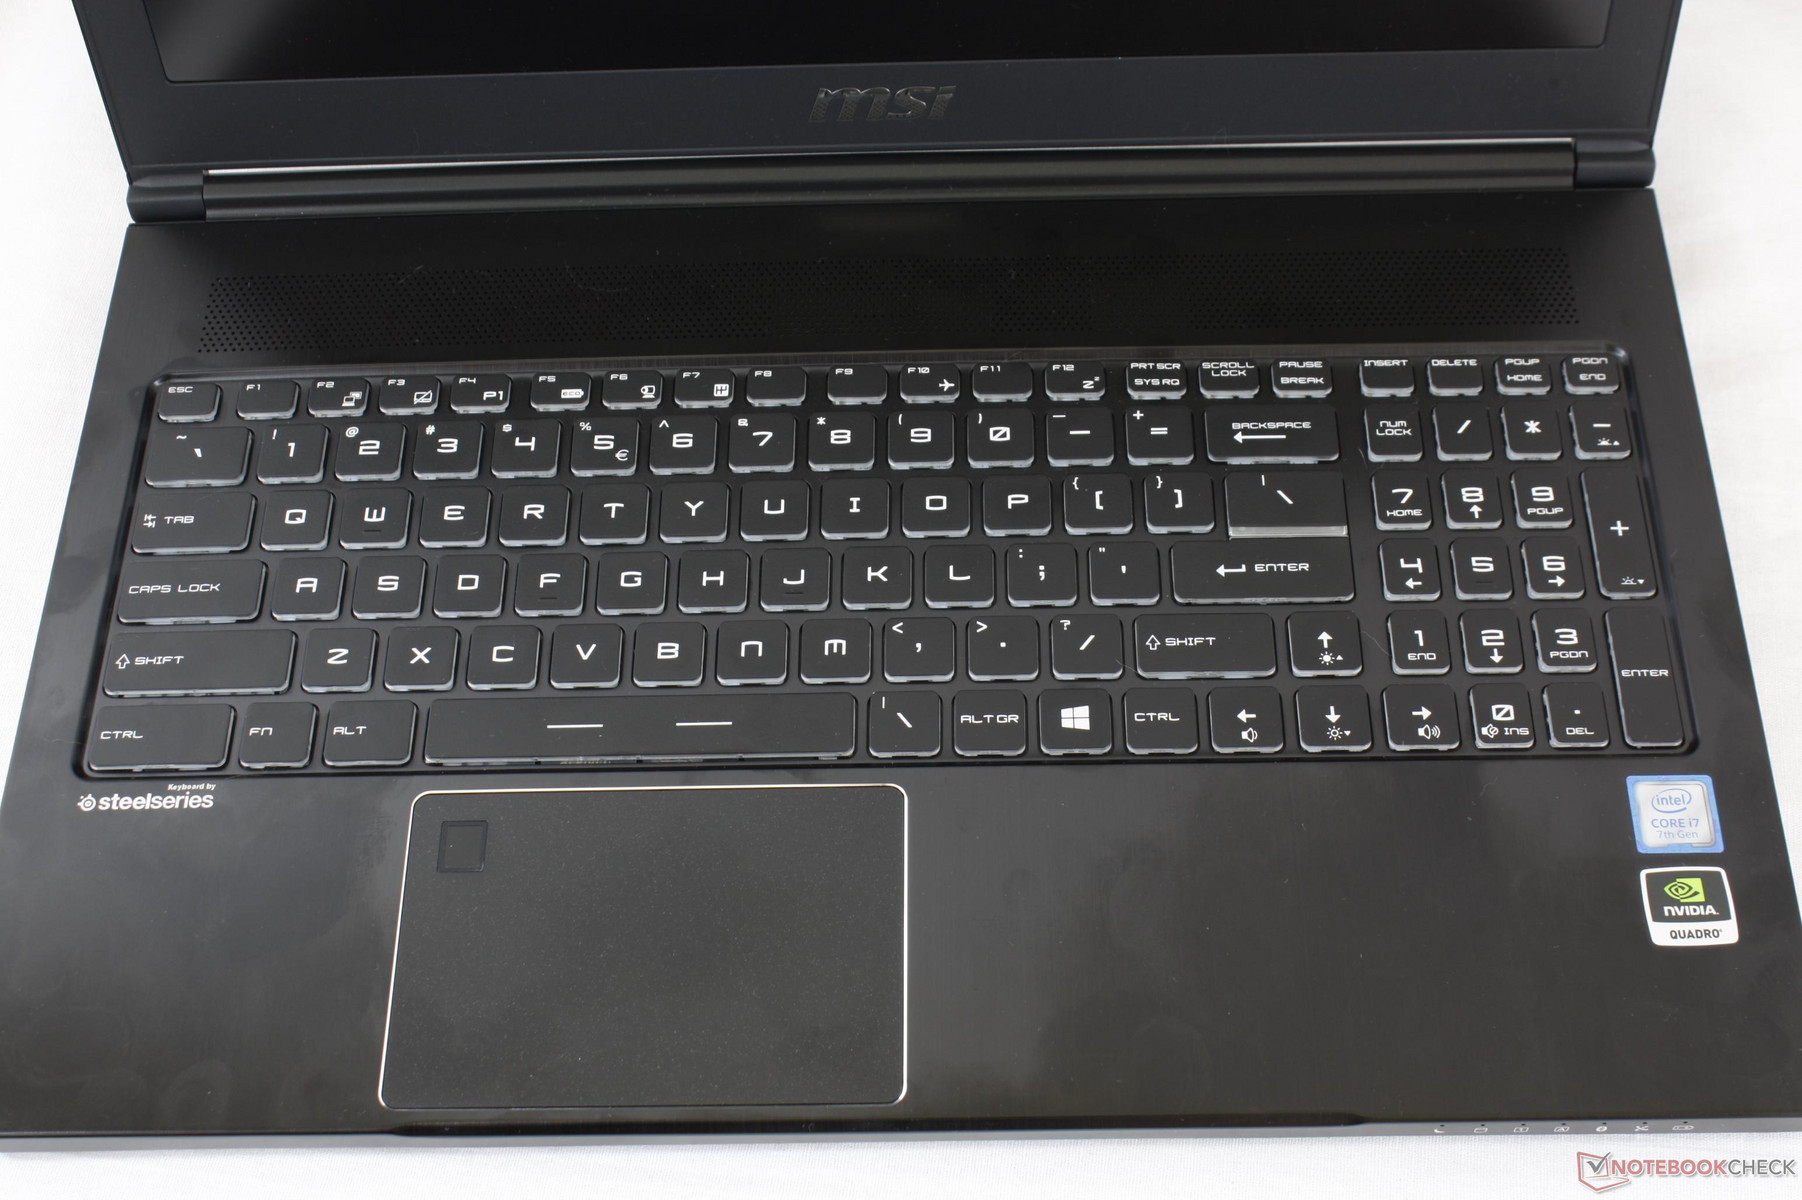
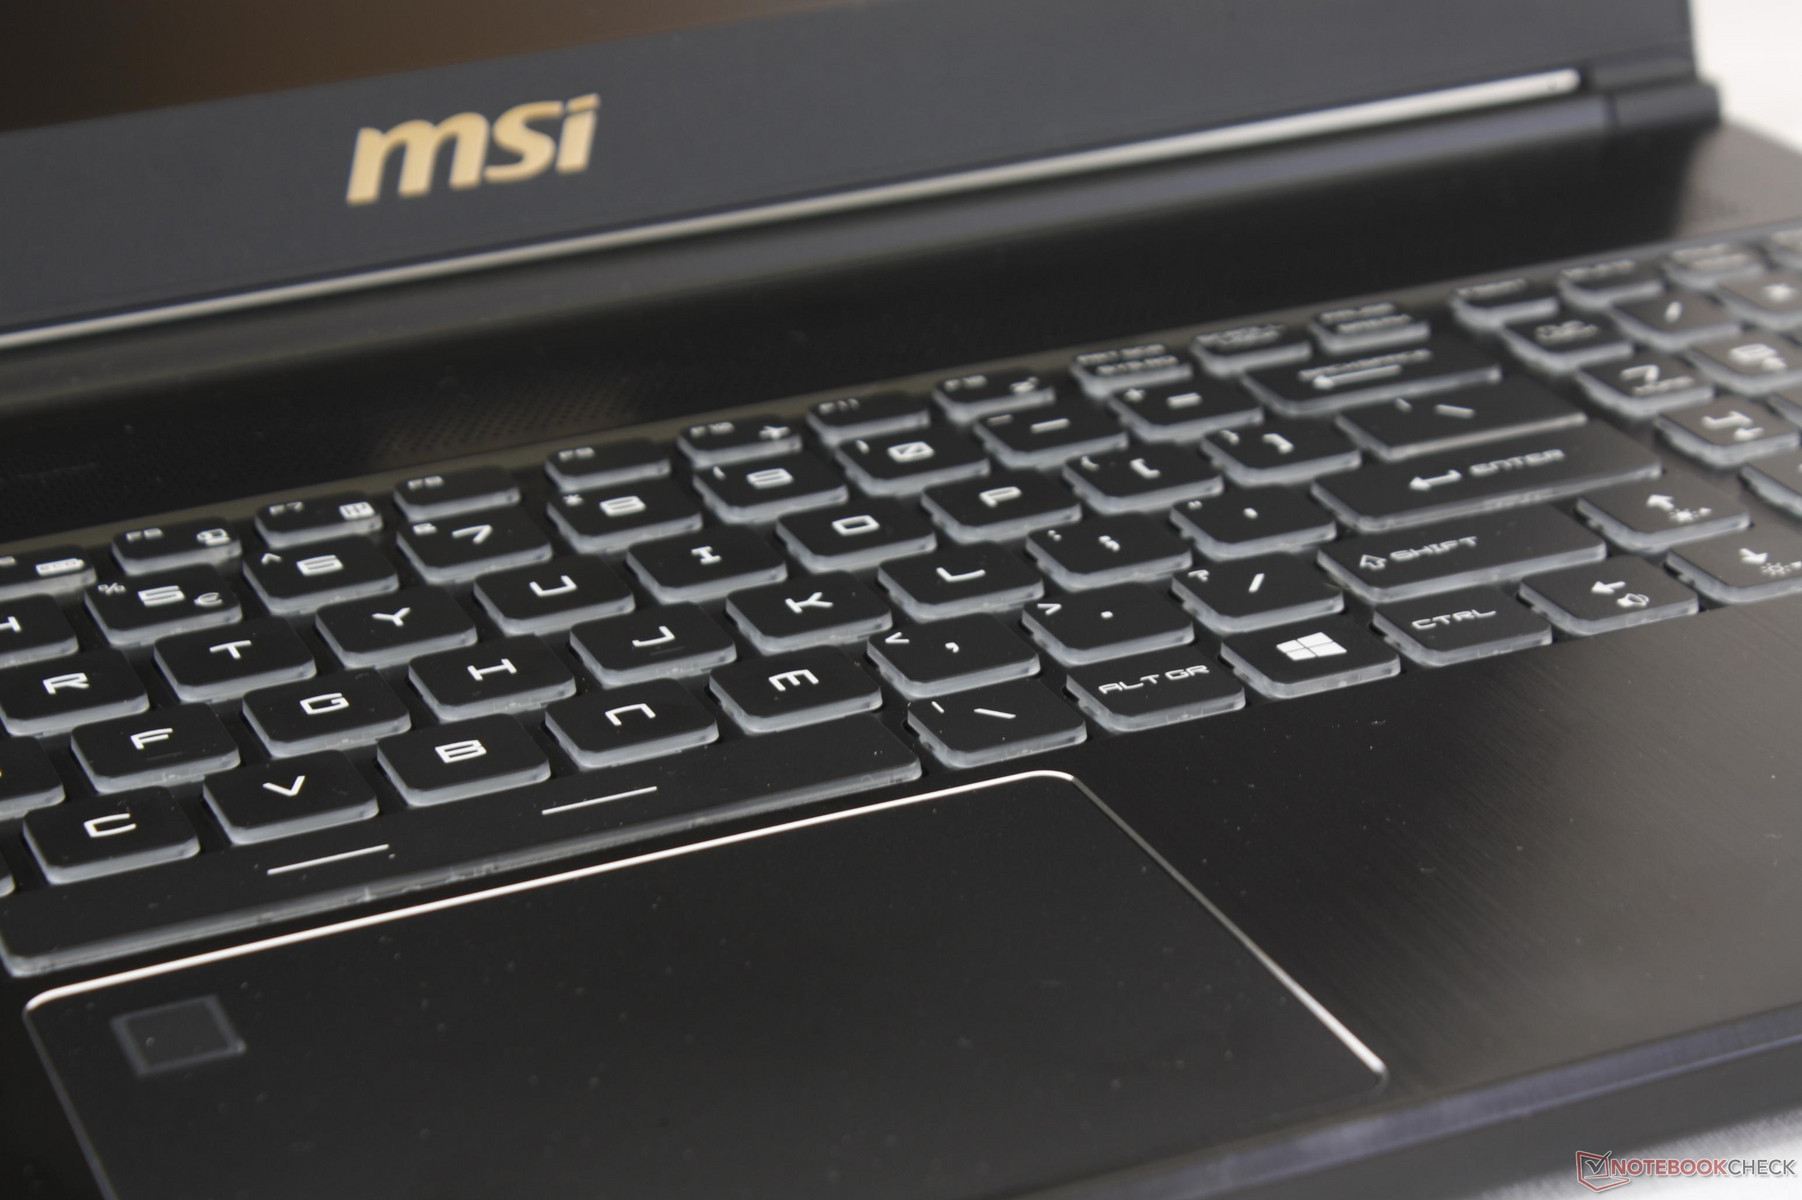
The keyboards of larger mobile workstations have a distinct advantage over the WS63. Since the chassis designs of traditional workstations are generally tougher and sturdier, their keyboard keys are subsequently firmer to press. The keys on the MSI are still comfortable to type on even though they are slightly softer in feedback and clatter a bit more loudly. MSI is one the few manufacturers to offer a three-zone RGB backlight instead of a TrackPoint for its workstation series.
The chrome-lined trackpad (10.5 x 7.0 cm) is larger in surface area than the ones on the ZBook 15 or Celsius H760 since it lacks dedicated mouse buttons. Multi-touch gestures are thus easier at the expense of accurate clicks and simpler drag-and-drop motions. The integrated mouse keys are shallow in travel with poor feedback when pressed. We find tapping on the surface to input clicks to be easier and less tiresome than physically clicking on the corners of the trackpad. Otherwise, the trackpad surface is smooth and reliable for normal cursor control at both slow and fast speeds.
A fingerprint reader is integrated onto the top left corner of the trackpad as an additional security feature for the WS63. The problem with this approach is that this small portion of the trackpad becomes unusable for cursor control and is essentially a dead zone. Most manufacturers integrate fingerprint readers outside of the trackpad around the palm rests instead.
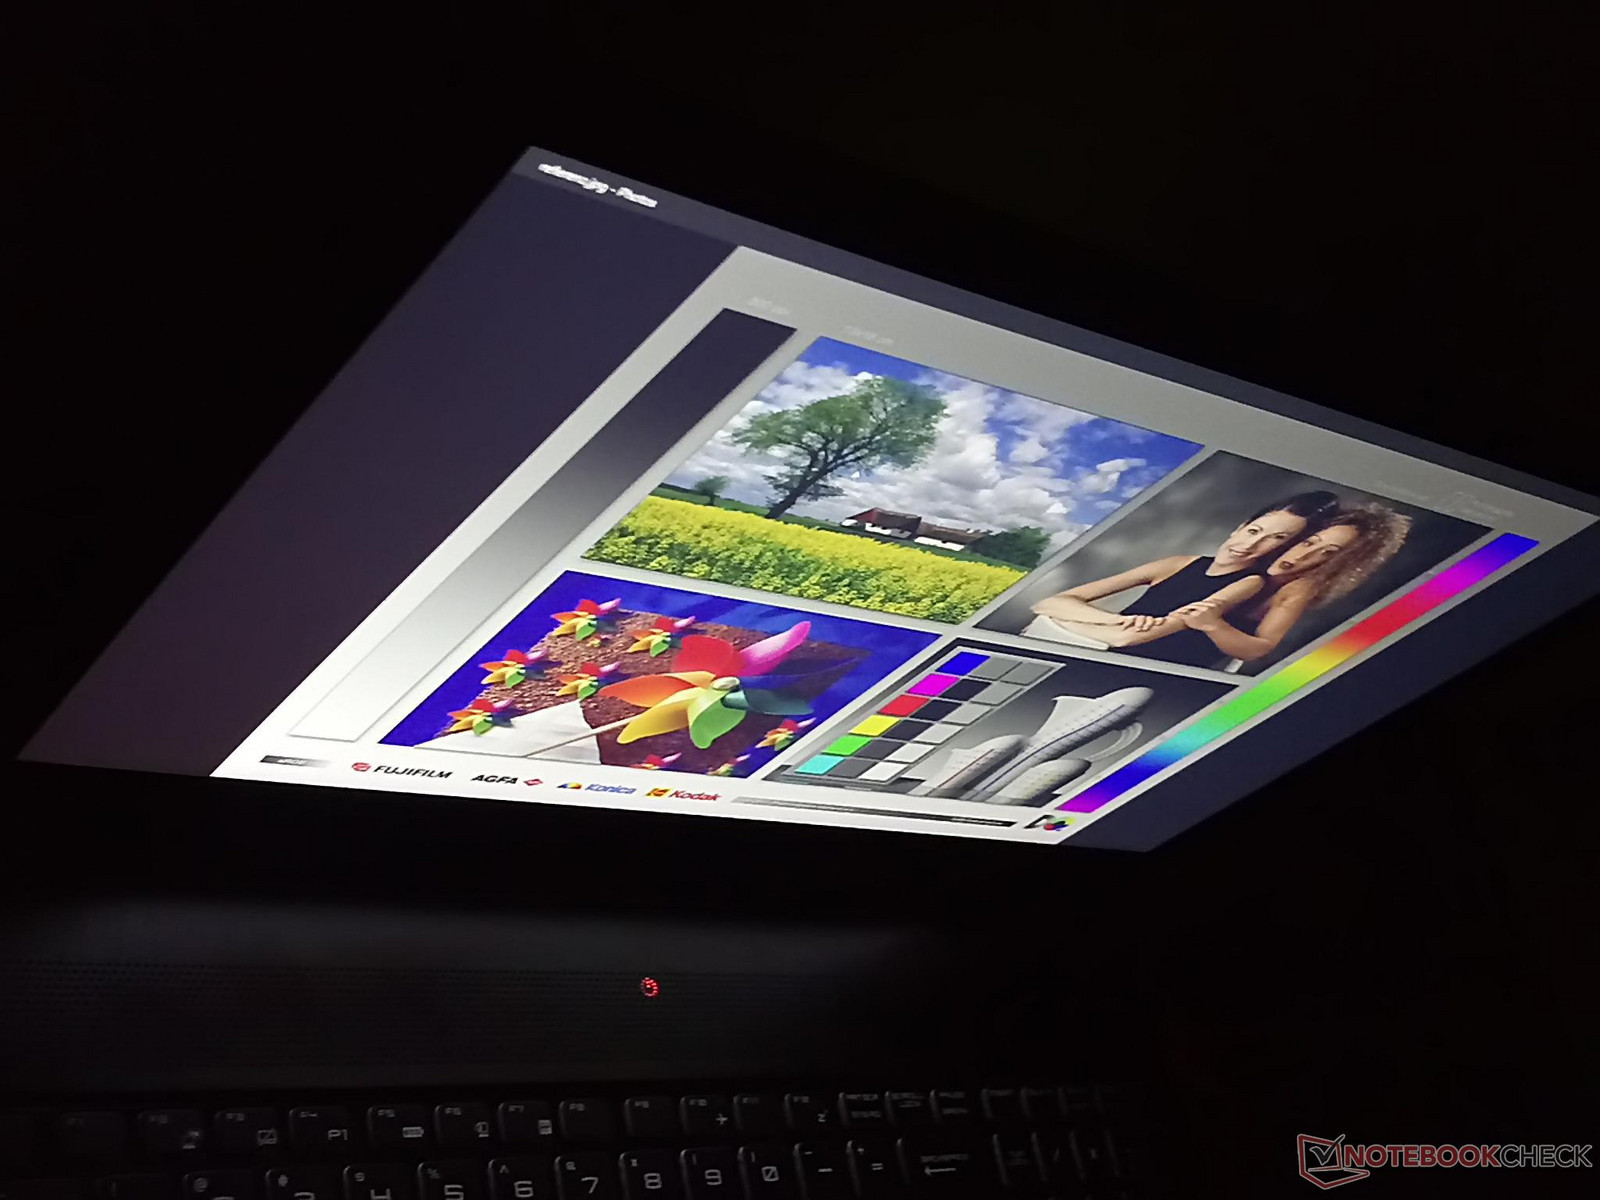
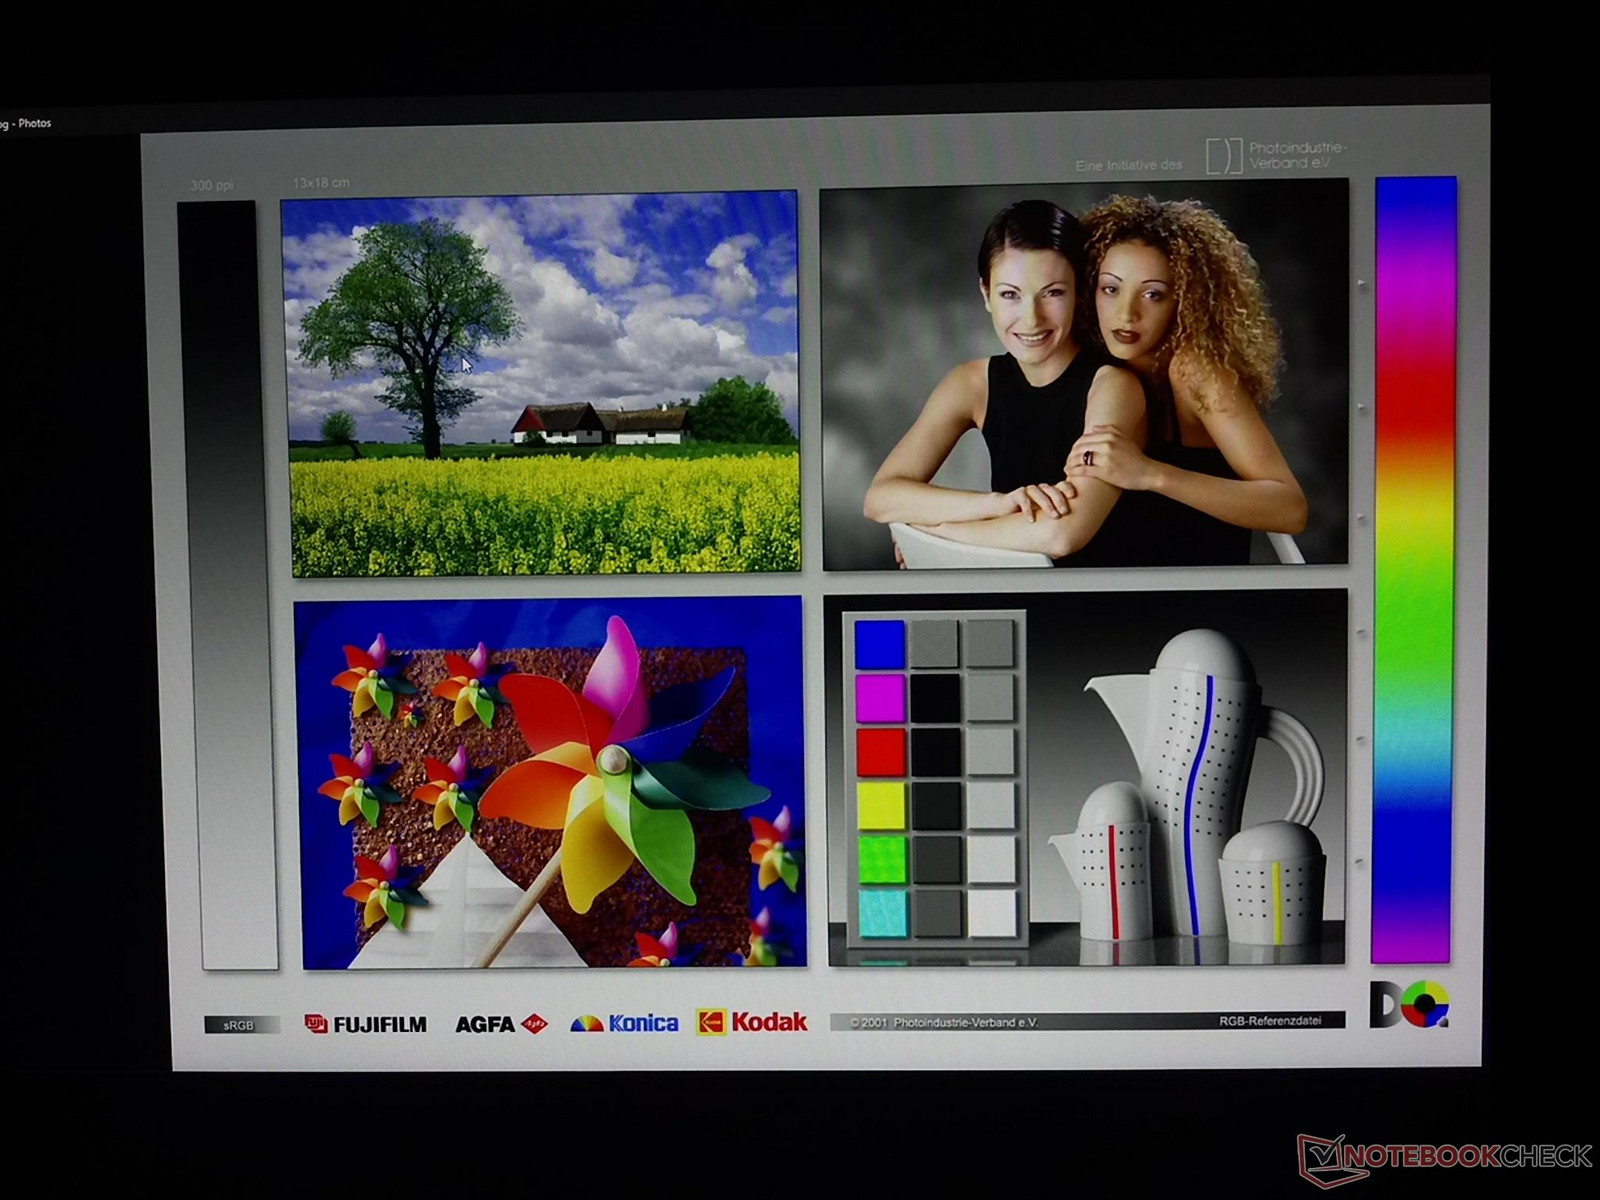
Display
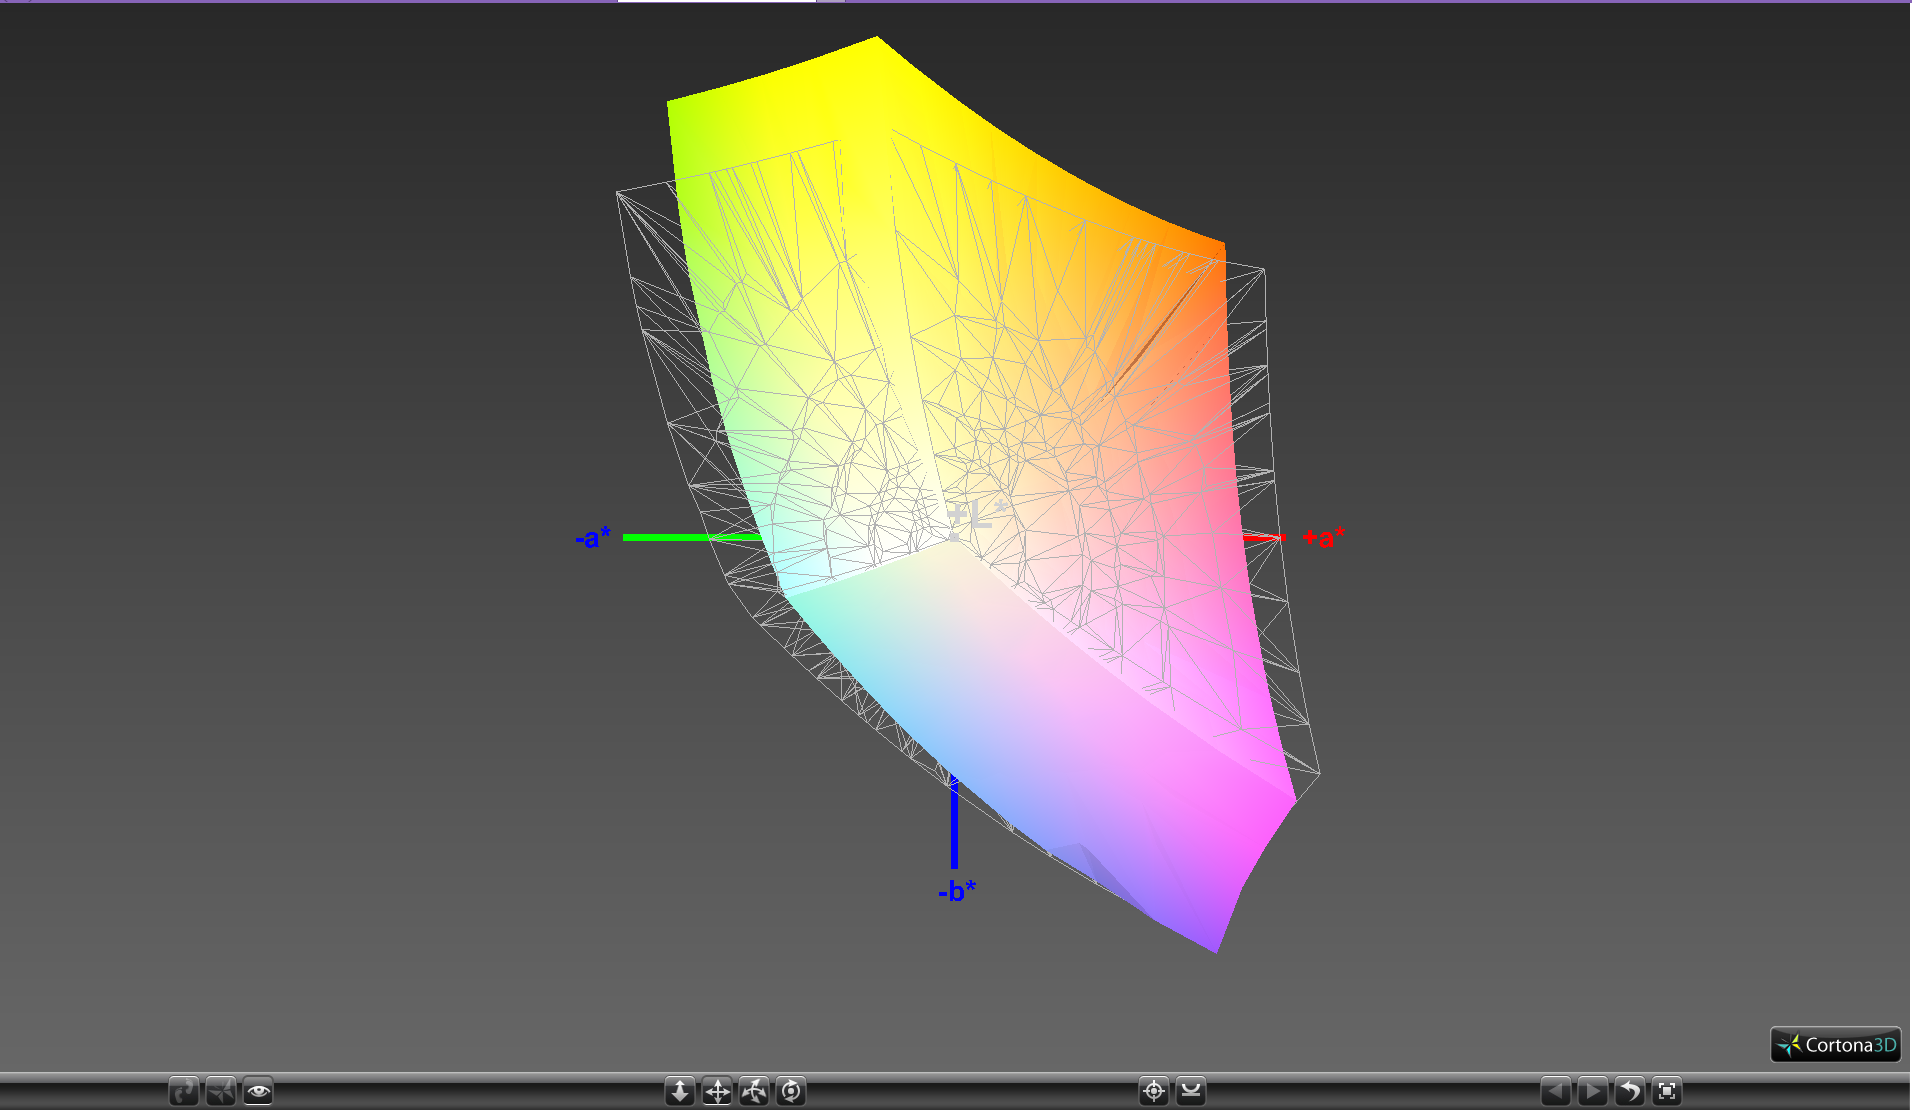
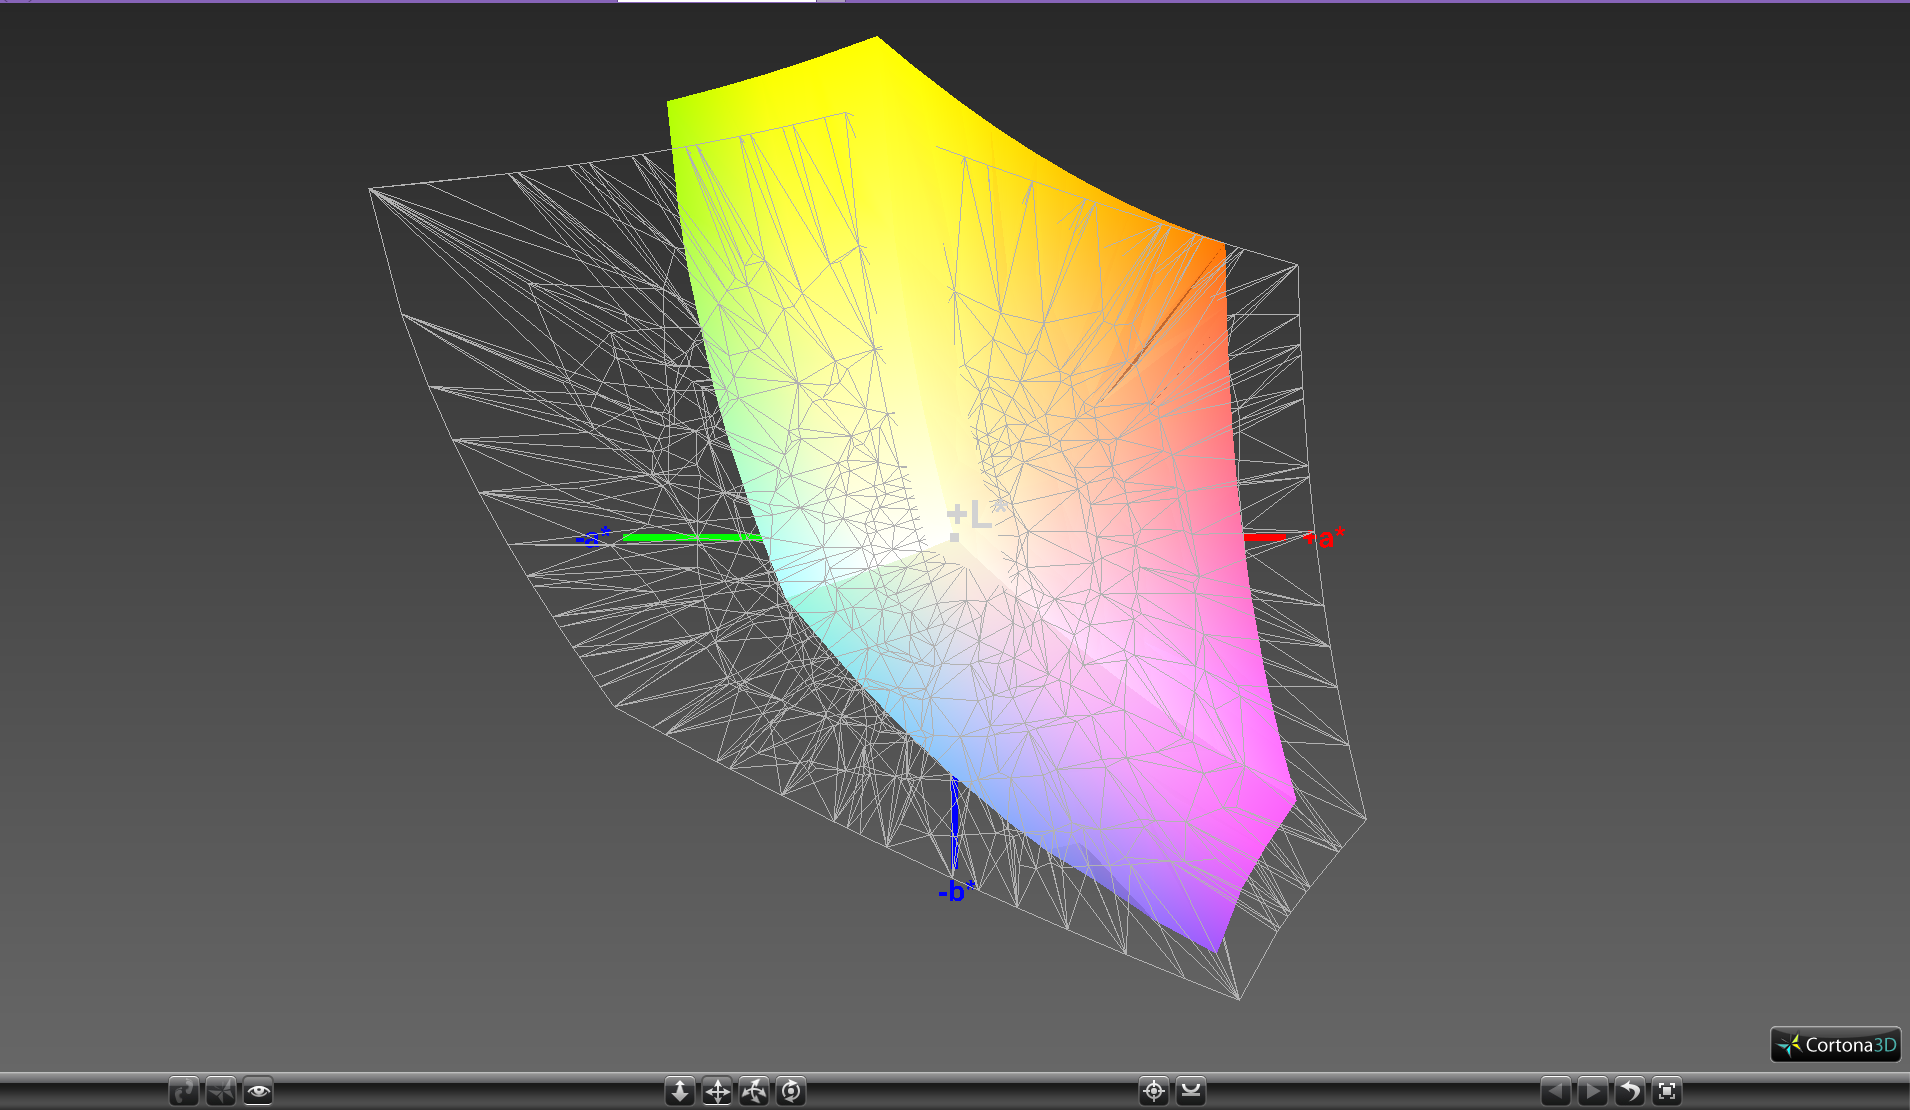
The 1080p LG Philips LP156W6 IPS panel in use can also be found on the GE62VR and Asus GL502VY gaming notebooks. While contrast levels are great, nothing about the display is particularly special from a workstation point of view. Its backlight brightness of almost 300 nits could have been brighter to take better advantage of the lightweight chassis and color coverage is narrower than the sRGB standard. The WS63 is also available with a 4K UHD panel that will almost surely exhibit different properties than our 1080p SKU, but it is highly unlikely that the 4K UHD panel will be the superior Sharp IGZO panel as found on the Precision 5520 or Razer Blade.
The most jarring aspect of the display is the presence of pulse-width modulation (PWM) on all brightness levels. Strangely enough, the 4K UHD GS63VR SKU does not exhibit PWM on the maximum brightness setting while the FHD GS63VR SKU does. Our WS63 configuration mimics that of the FHD GS63VR SKU but at a higher PWM frequency rate (21740 Hz vs. 202 Hz). We made absolute sure to disable any automatic brightness settings or power-saving features that might induce PWM, but results remain the same. Our prediction is that the 4K UHD WS63 will not exhibit PWM based on our data. Most users will fortunately not notice the screen flickering during use.
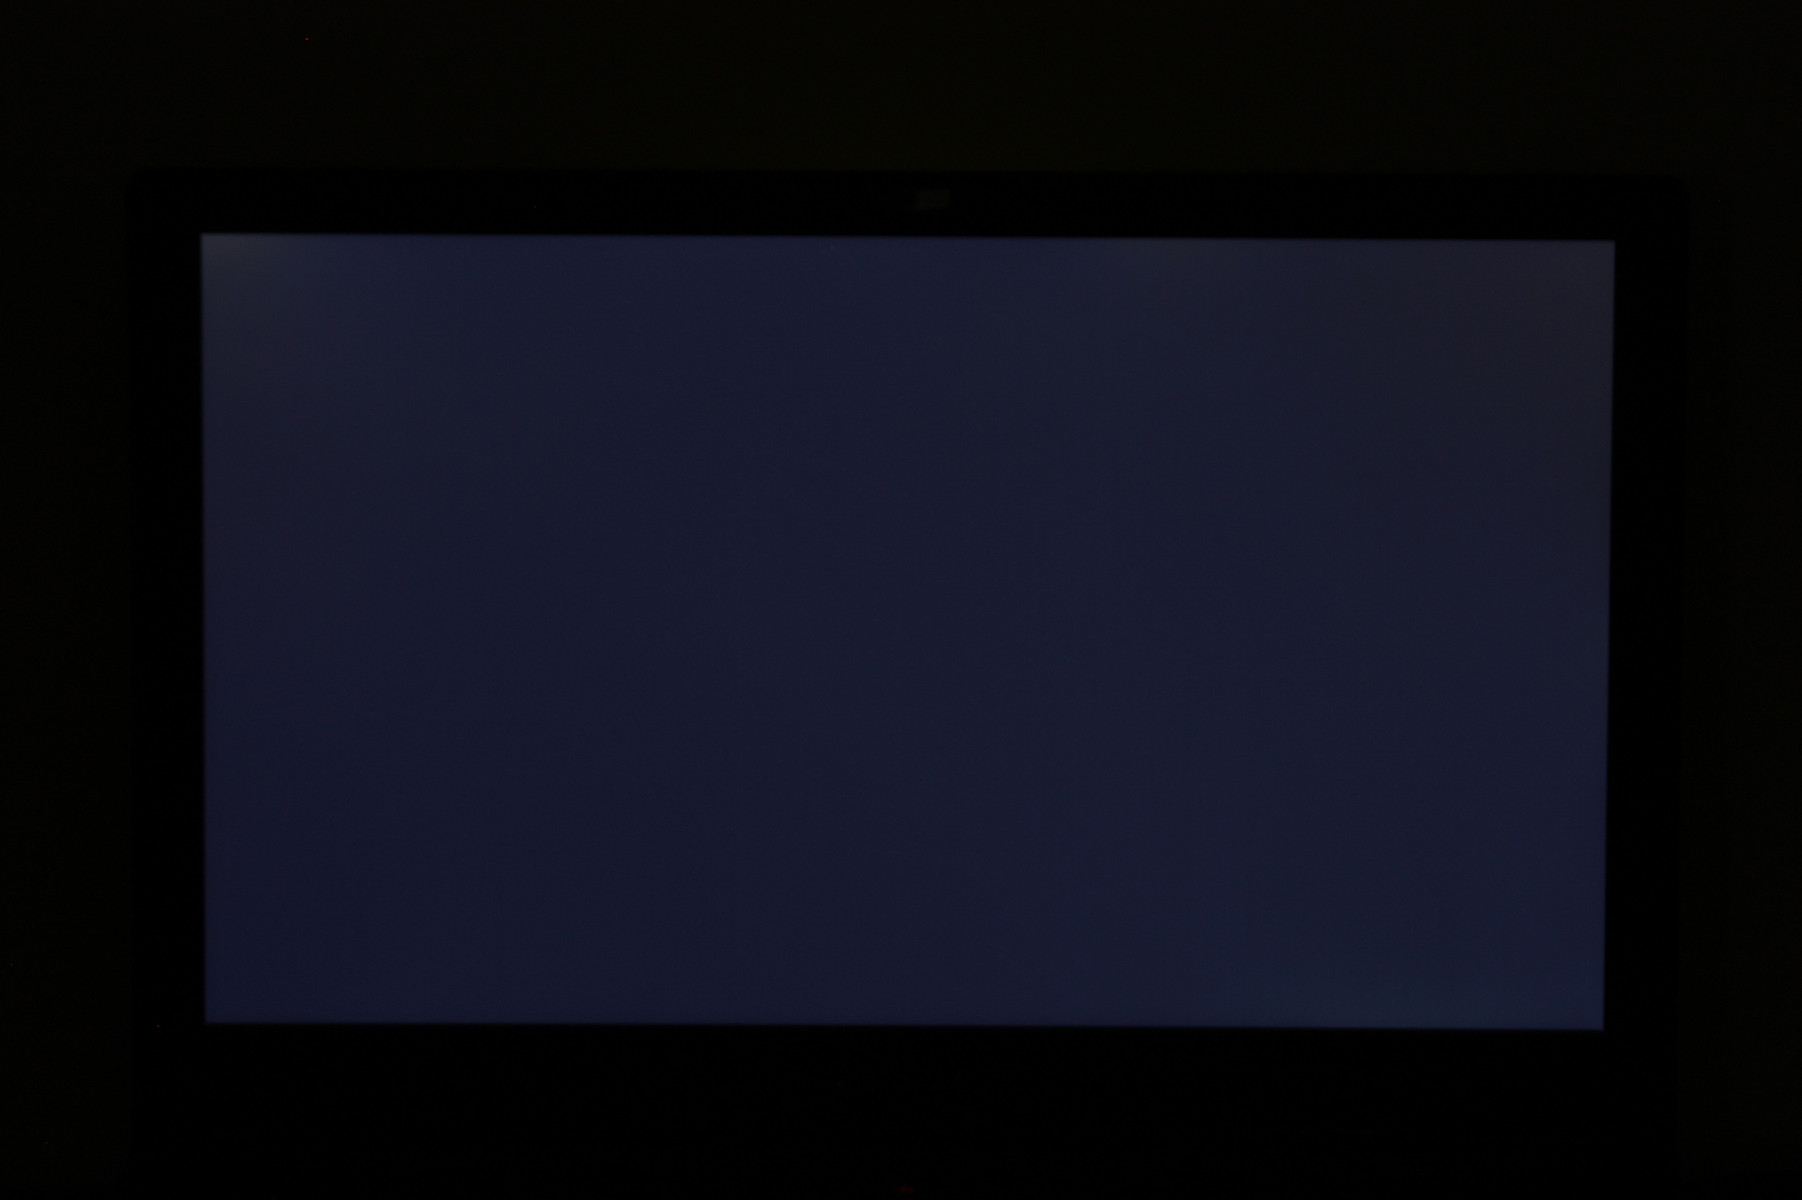
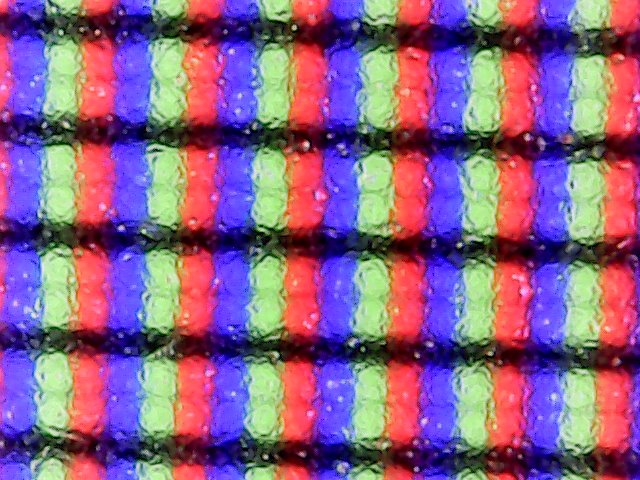
We can notice no major uneven backlight bleeding issues on our particular unit. Display graininess is also not very noticeable despite the matte overlay especially when compared to the thick matte panel on the EVGA SC15.
| |||||||||||||||||||||||||
Brightness Distribution: 92 %
Center on Battery: 302.5 cd/m²
Contrast: 976:1 (Black: 0.31 cd/m²)
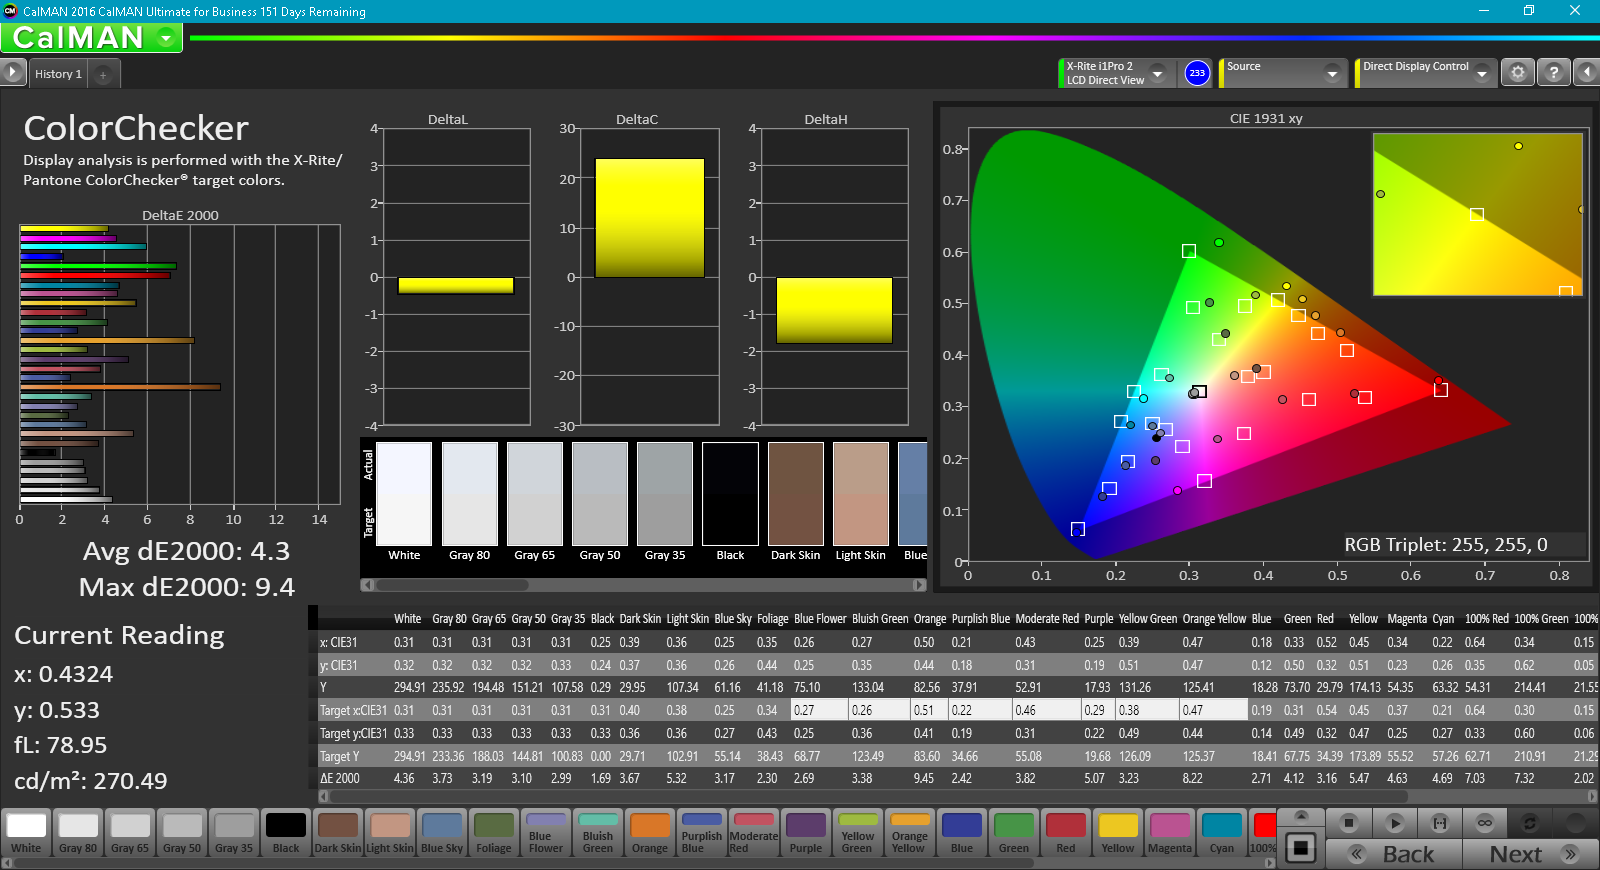
ΔE ColorChecker Calman: 4.3 | ∀{0.5-29.43 Ø4.73}
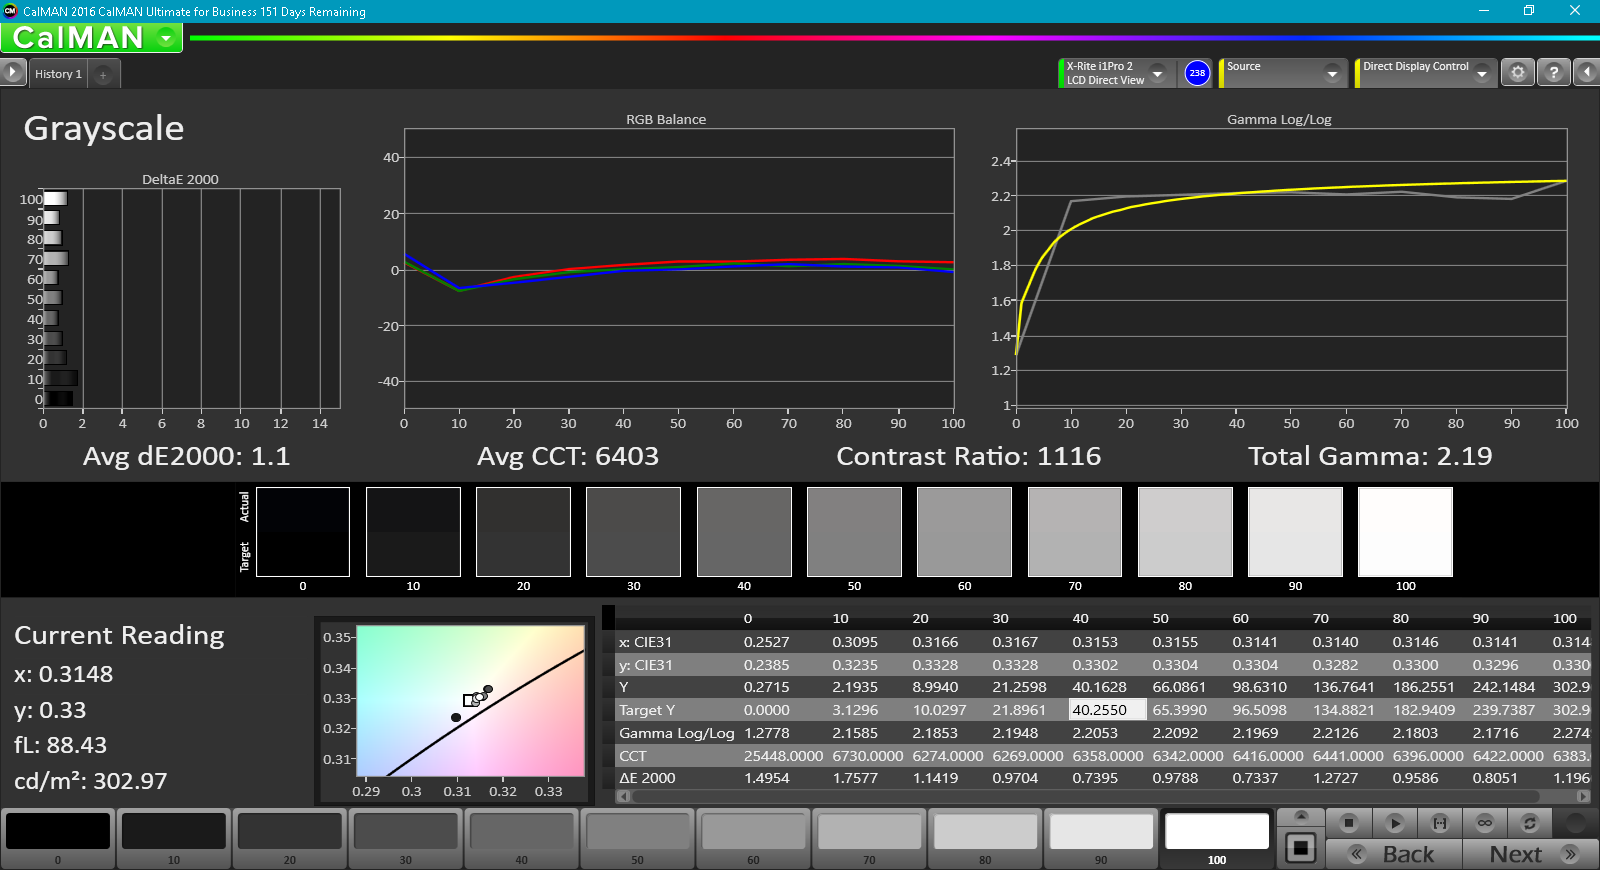
ΔE Greyscale Calman: 3.1 | ∀{0.09-98 Ø4.97}
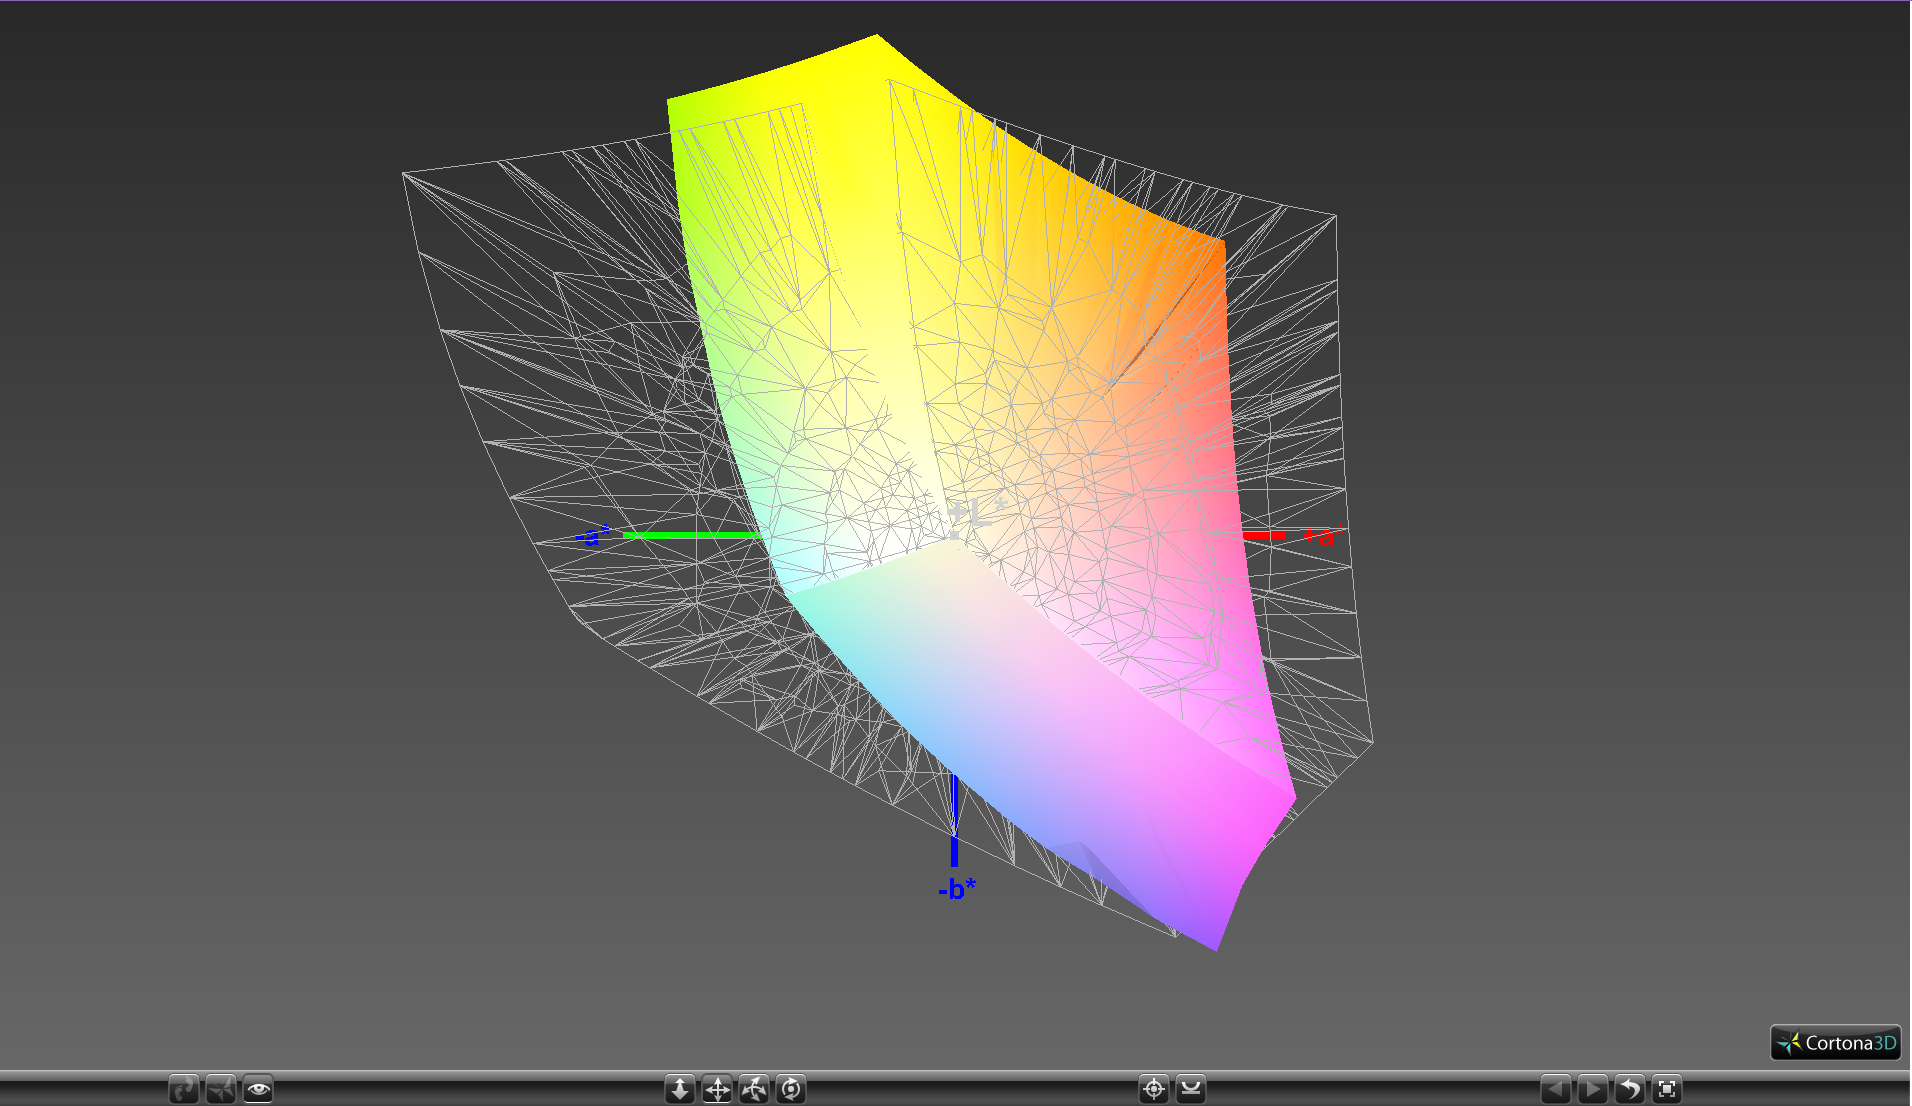
84.3% sRGB (Argyll 1.6.3 3D)
55% AdobeRGB 1998 (Argyll 1.6.3 3D)
61.5% AdobeRGB 1998 (Argyll 3D)
84.2% sRGB (Argyll 3D)
63.6% Display P3 (Argyll 3D)
Gamma: 2.16
CCT: 7071 K
| MSI WS63 7RF-290US ID: LGD046F, Name: LG Philips LP156W6, Dell P/N: 3874Y, IPS, 15.6", 1920x1080 | Lenovo ThinkPad P51 20HH0016GE LEN40BD, B156ZAN02.1, IPS, 15.6", 3840x2160 | Dell Precision 5520 UHD SHP1476, IPS, 15.6", 3840x2160 | Fujitsu Celsius H760 LGD046F LP156WF6-SPP1, IPS LED, 15.6", 1920x1080 | MSI WS60-6QJE316H11 SDC424B, IPS, 15.6", 3840x2160 | |
|---|---|---|---|---|---|
| Display | 38% | 12% | -1% | -7% | |
| Display P3 Coverage (%) | 63.6 | 86.3 36% | 67.4 6% | 63.9 0% | 55.1 -13% |
| sRGB Coverage (%) | 84.2 | 99.5 18% | 98.5 17% | 82.4 -2% | 83 -1% |
| AdobeRGB 1998 Coverage (%) | 61.5 | 99.3 61% | 68.9 12% | 60.3 -2% | 56.9 -7% |
| Response Times | 9% | -41% | 11% | 19% | |
| Response Time Grey 50% / Grey 80% * (ms) | 38 ? | 40.8 ? -7% | 59.2 ? -56% | 38 ? -0% | 34 ? 11% |
| Response Time Black / White * (ms) | 33 ? | 25.2 ? 24% | 41.6 ? -26% | 26 ? 21% | 24 ? 27% |
| PWM Frequency (Hz) | 21740 ? | 1316 ? | |||
| Screen | 15% | 6% | 3% | -10% | |
| Brightness middle (cd/m²) | 302.5 | 317 5% | 372.4 23% | 341 13% | 237 -22% |
| Brightness (cd/m²) | 295 | 309 5% | 368 25% | 310 5% | 208 -29% |
| Brightness Distribution (%) | 92 | 89 -3% | 90 -2% | 82 -11% | 77 -16% |
| Black Level * (cd/m²) | 0.31 | 0.36 -16% | 0.48 -55% | 0.34 -10% | 0.26 16% |
| Contrast (:1) | 976 | 881 -10% | 776 -20% | 1003 3% | 912 -7% |
| Colorchecker dE 2000 * | 4.3 | 2.7 37% | 2.6 40% | 3.8 12% | 4.42 -3% |
| Colorchecker dE 2000 max. * | 9.4 | 4.1 56% | 5.6 40% | 10.8 -15% | 8.54 9% |
| Greyscale dE 2000 * | 3.1 | 3 3% | 3.7 -19% | 2 35% | 4.43 -43% |
| Gamma | 2.16 102% | 2.27 97% | 2.14 103% | 2.17 101% | 2.23 99% |
| CCT | 7071 92% | 6077 107% | 7096 92% | 6581 99% | 6133 106% |
| Color Space (Percent of AdobeRGB 1998) (%) | 55 | 87.6 59% | 63 15% | 54 -2% | 52.5 -5% |
| Color Space (Percent of sRGB) (%) | 84.3 | 99.5 18% | 99 17% | 82.2 -2% | 82.9 -2% |
| Total Average (Program / Settings) | 21% /
19% | -8% /
1% | 4% /
3% | 1% /
-6% |
* ... smaller is better
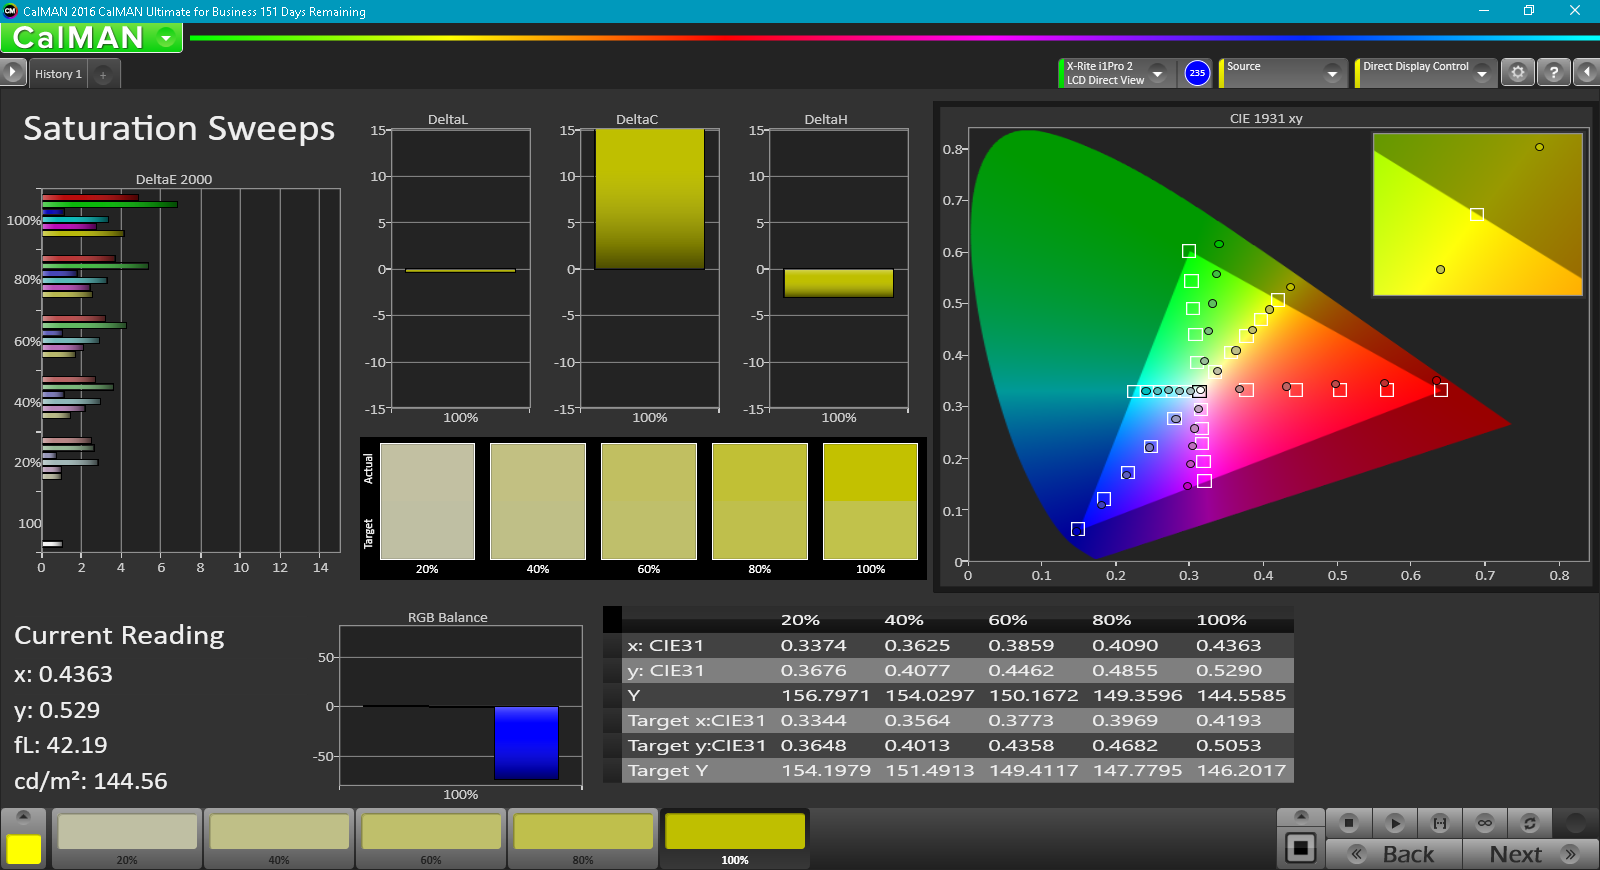
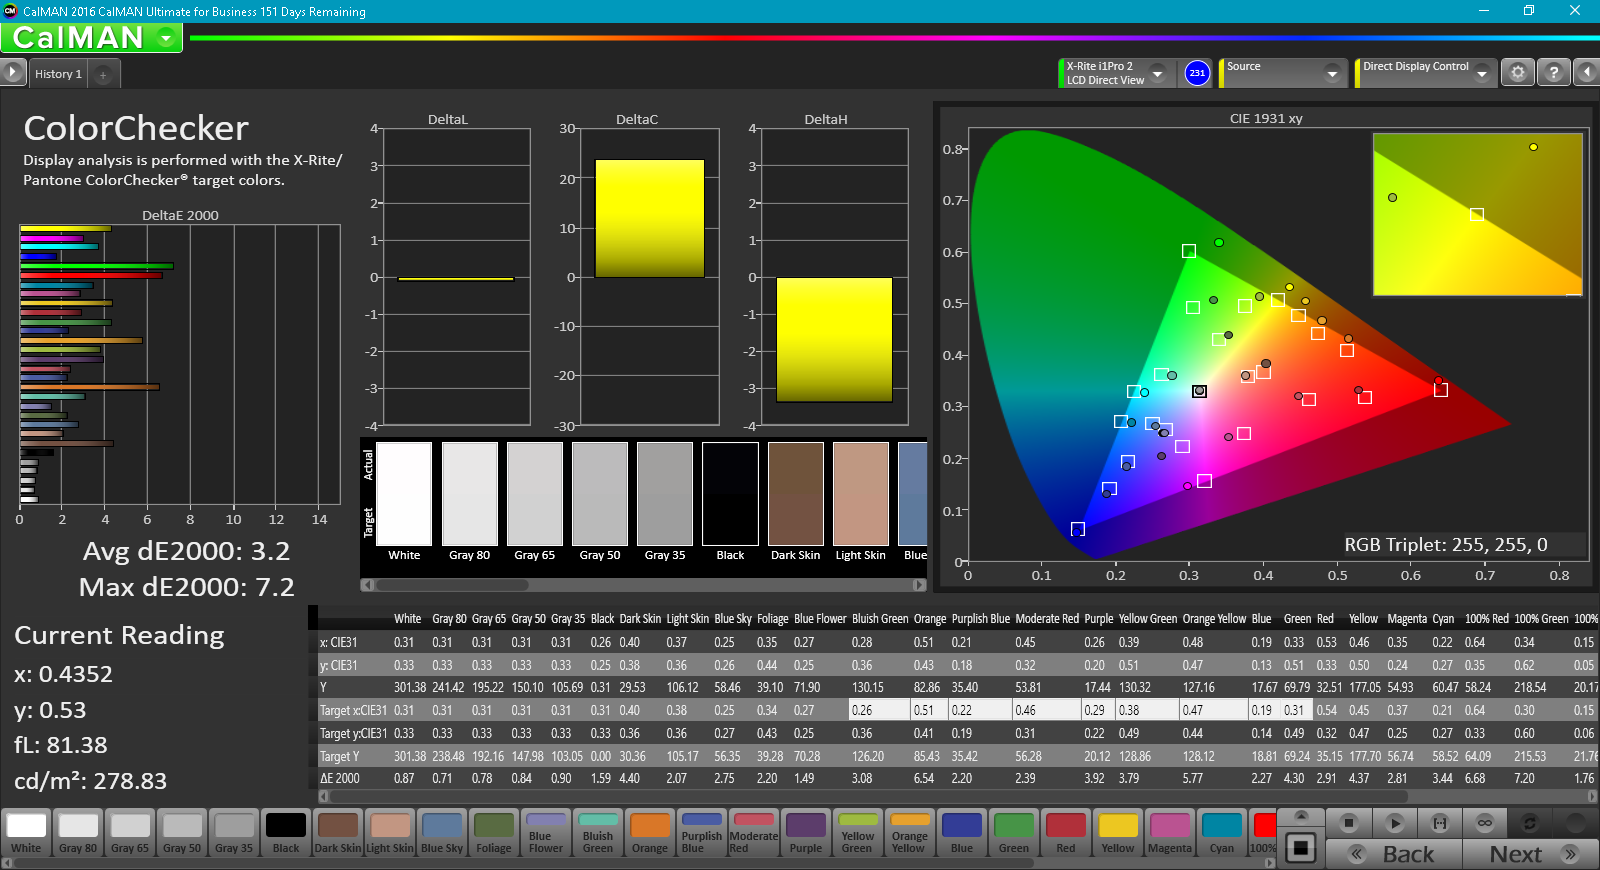
Color coverage is approximately 84 percent and 55 percent of the sRGB and AdobeRGB standards, respectively. Graphic artists who demand full sRGB coverage will be disappointed by what the WS63 offers as most other workstations and even some multimedia offerings have panels that cover sRGB in its entirety.
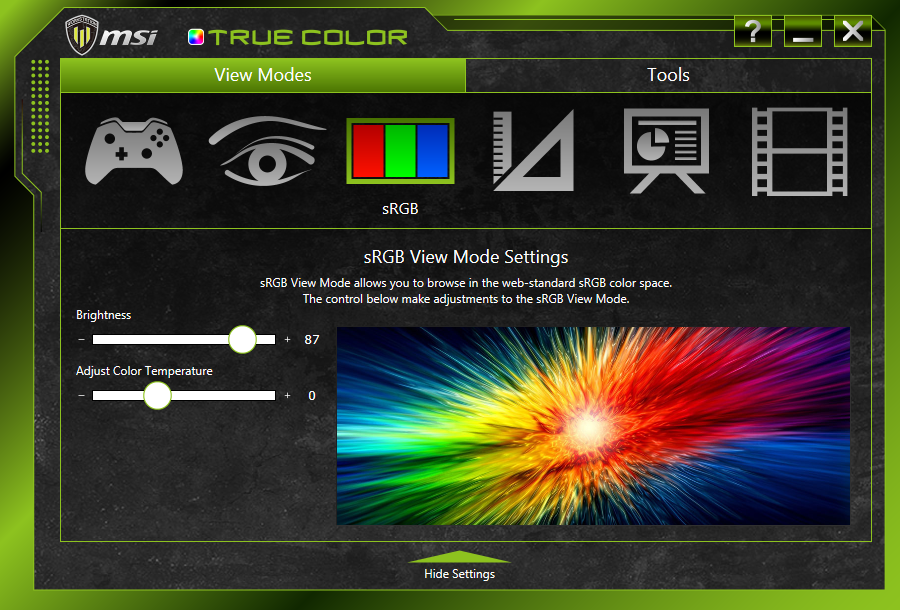
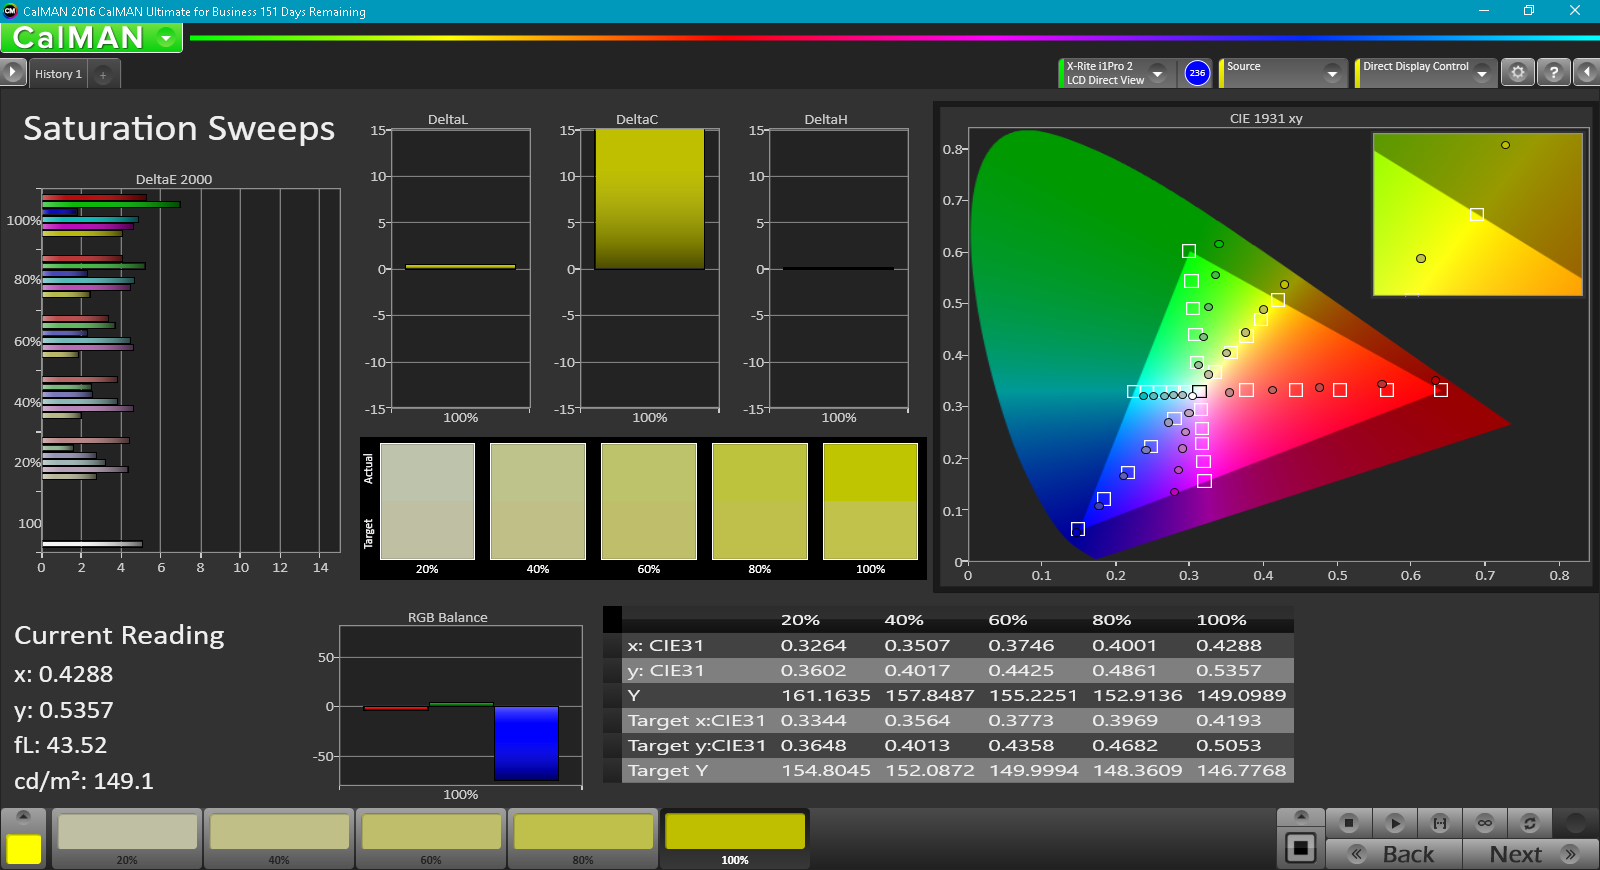
Additional measurements with an X-Rite spectrophotometer reveal generally accurate colors and grayscale when the MSI True Color software is set to sRGB mode. From a workstation standpoint, however, we were expecting more. Our own calibration efforts improved grayscale and colors even further as shown by the before and after data below. Grayscale and colors become very well balanced, but higher saturation levels are represented less accurately since sRGB coverage is not perfect.

Display Response Times
| ↔ Response Time Black to White | ||
|---|---|---|
| 33 ms ... rise ↗ and fall ↘ combined | ↗ 20 ms rise | 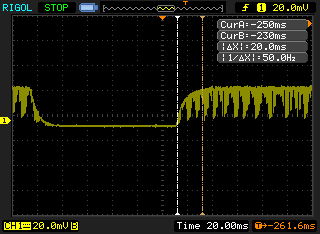 |
| ↘ 13 ms fall | ||
| The screen shows slow response rates in our tests and will be unsatisfactory for gamers. In comparison, all tested devices range from 0.1 (minimum) to 240 (maximum) ms. » 89 % of all devices are better. This means that the measured response time is worse than the average of all tested devices (19.9 ms). | ||
| ↔ Response Time 50% Grey to 80% Grey | ||
| 38 ms ... rise ↗ and fall ↘ combined | ↗ 20 ms rise | 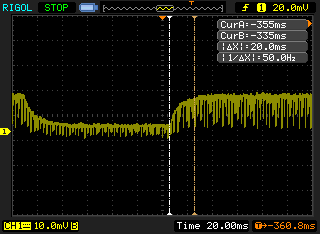 |
| ↘ 18 ms fall | ||
| The screen shows slow response rates in our tests and will be unsatisfactory for gamers. In comparison, all tested devices range from 0.165 (minimum) to 636 (maximum) ms. » 55 % of all devices are better. This means that the measured response time is worse than the average of all tested devices (31.1 ms). | ||
Screen Flickering / PWM (Pulse-Width Modulation)
| Screen flickering / PWM detected | 21740 Hz | ≤ 100 % brightness setting | 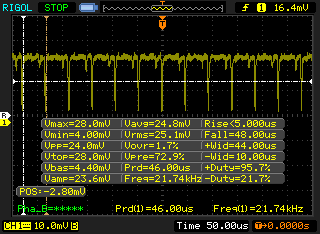 |
The display backlight flickers at 21740 Hz (worst case, e.g., utilizing PWM) Flickering detected at a brightness setting of 100 % and below. There should be no flickering or PWM above this brightness setting. The frequency of 21740 Hz is quite high, so most users sensitive to PWM should not notice any flickering. In comparison: 52 % of all tested devices do not use PWM to dim the display. If PWM was detected, an average of 7798 (minimum: 5 - maximum: 343500) Hz was measured. | |||
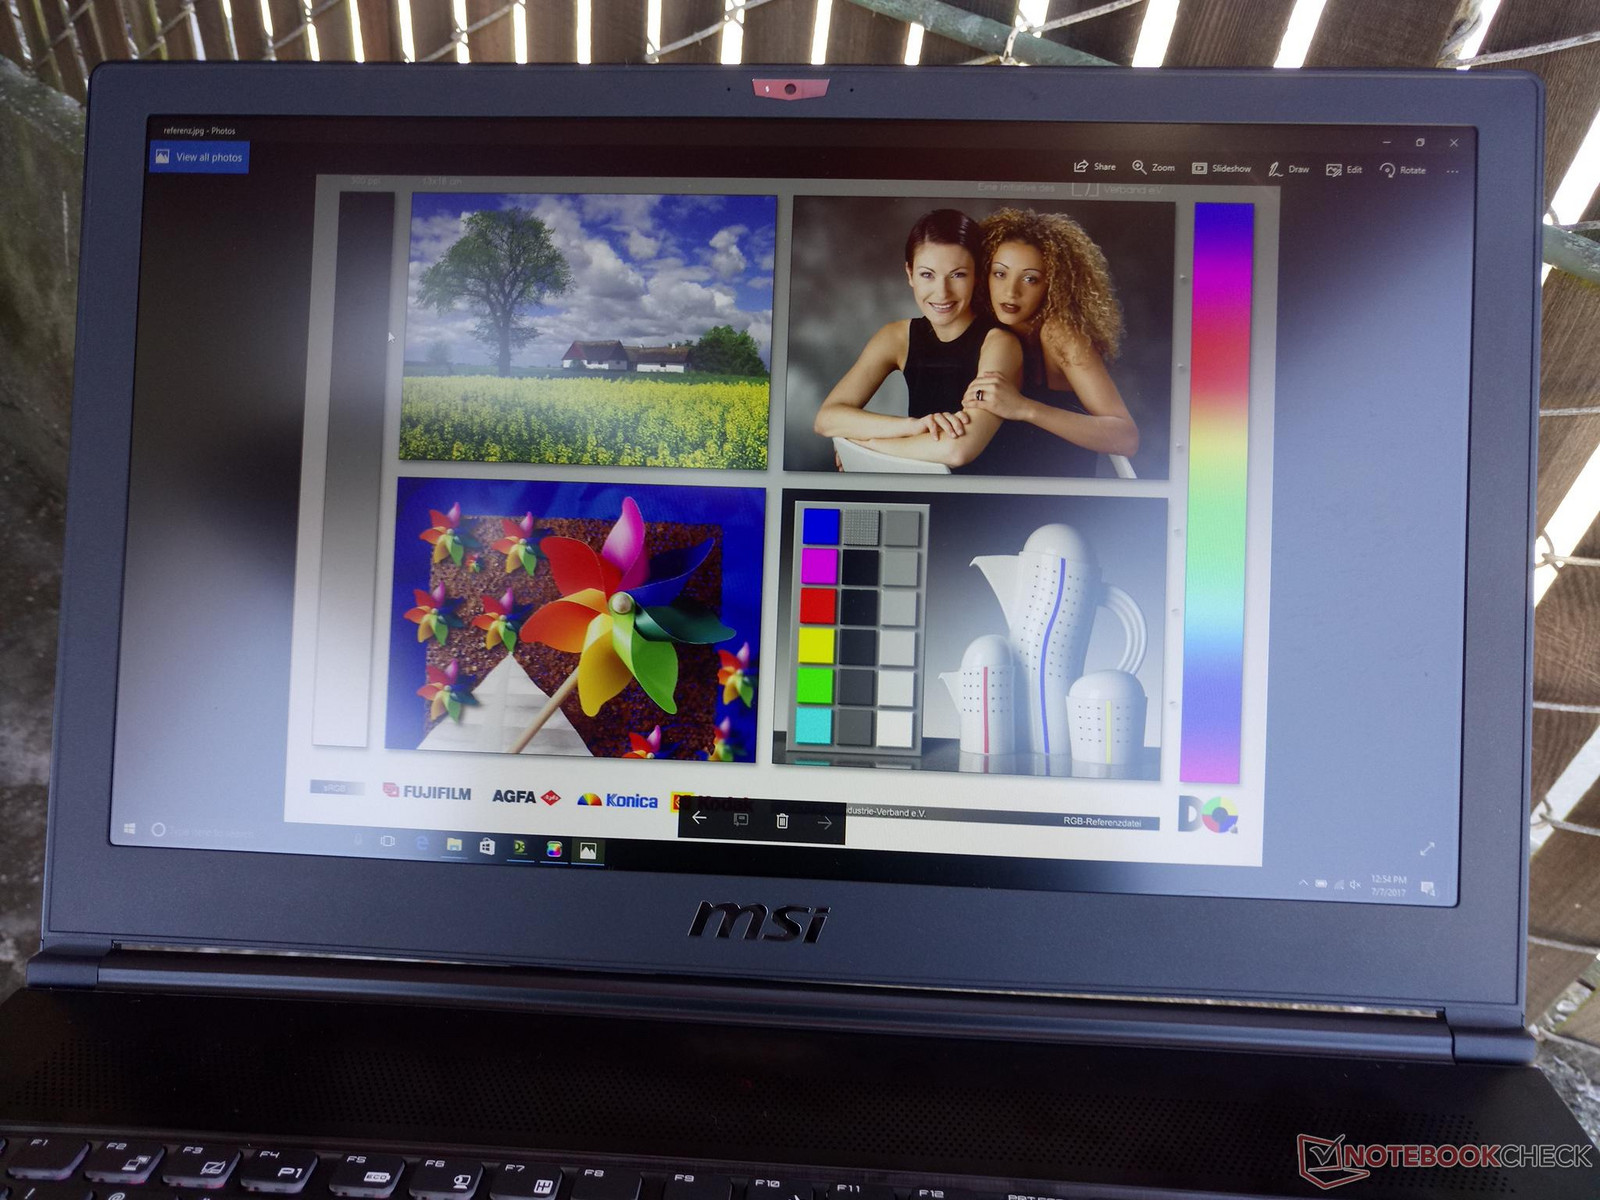
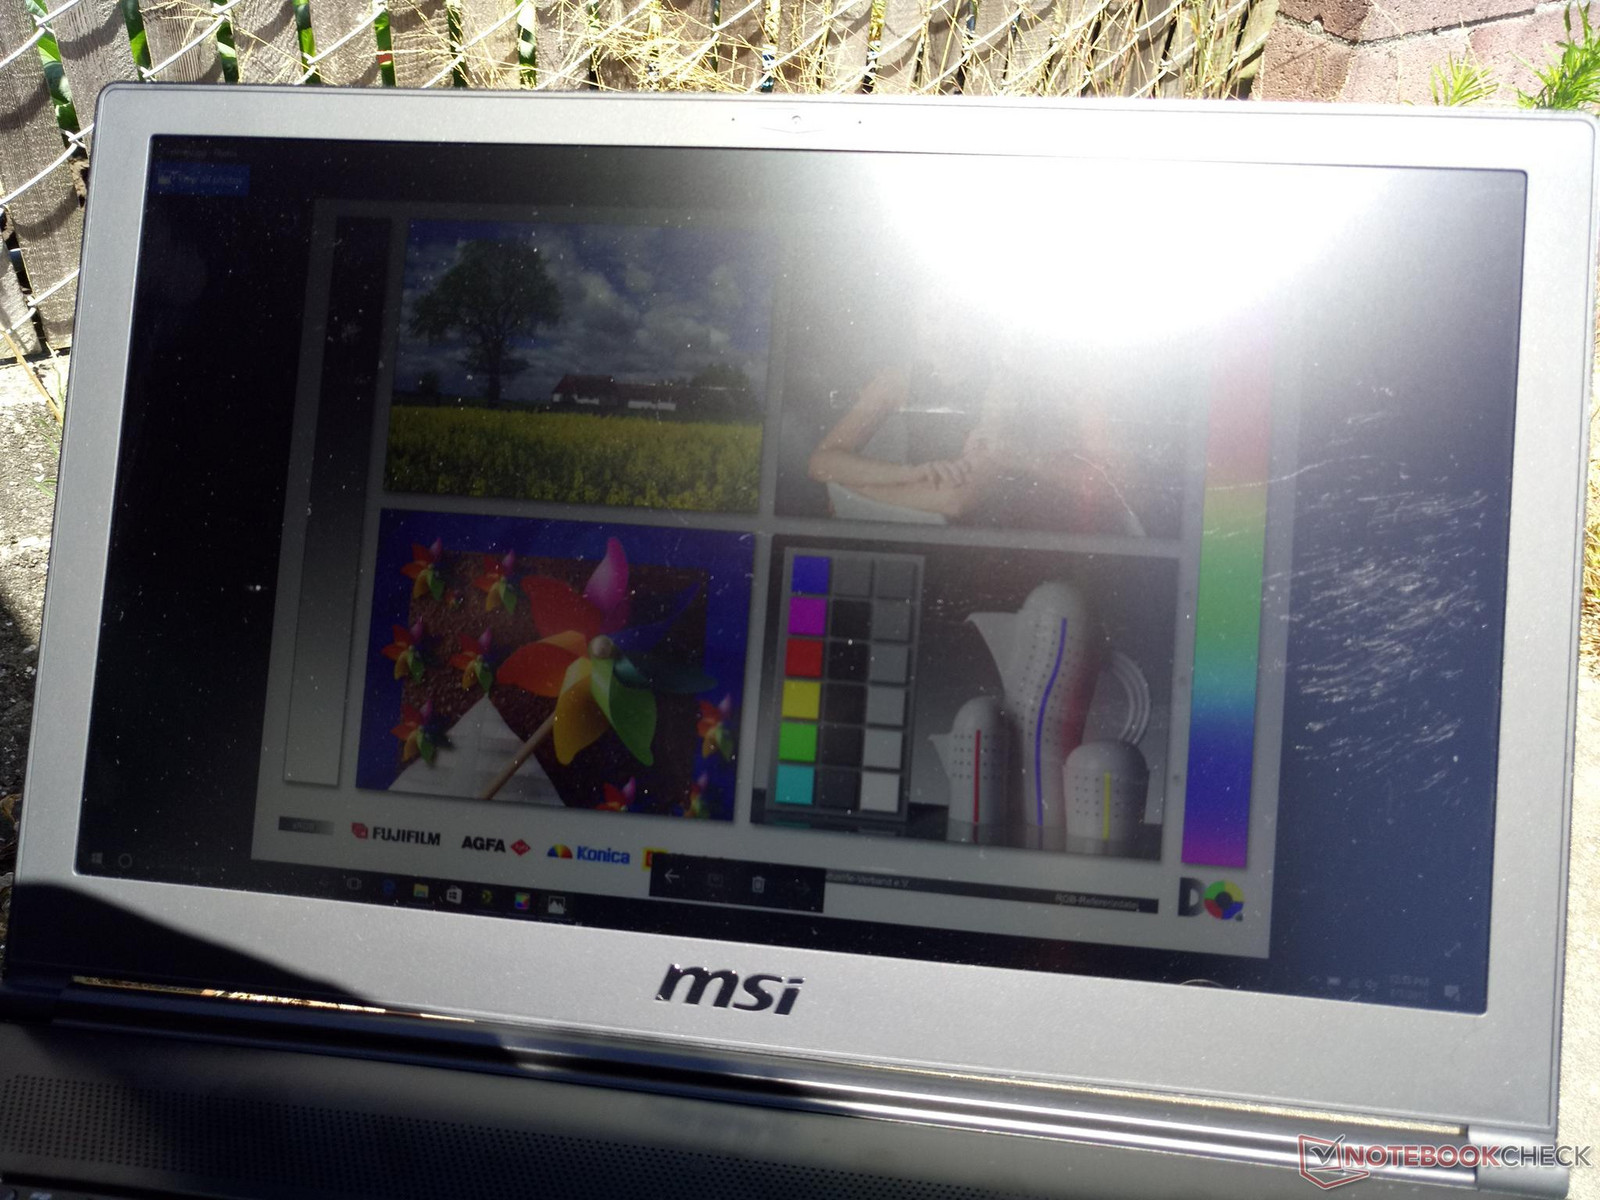
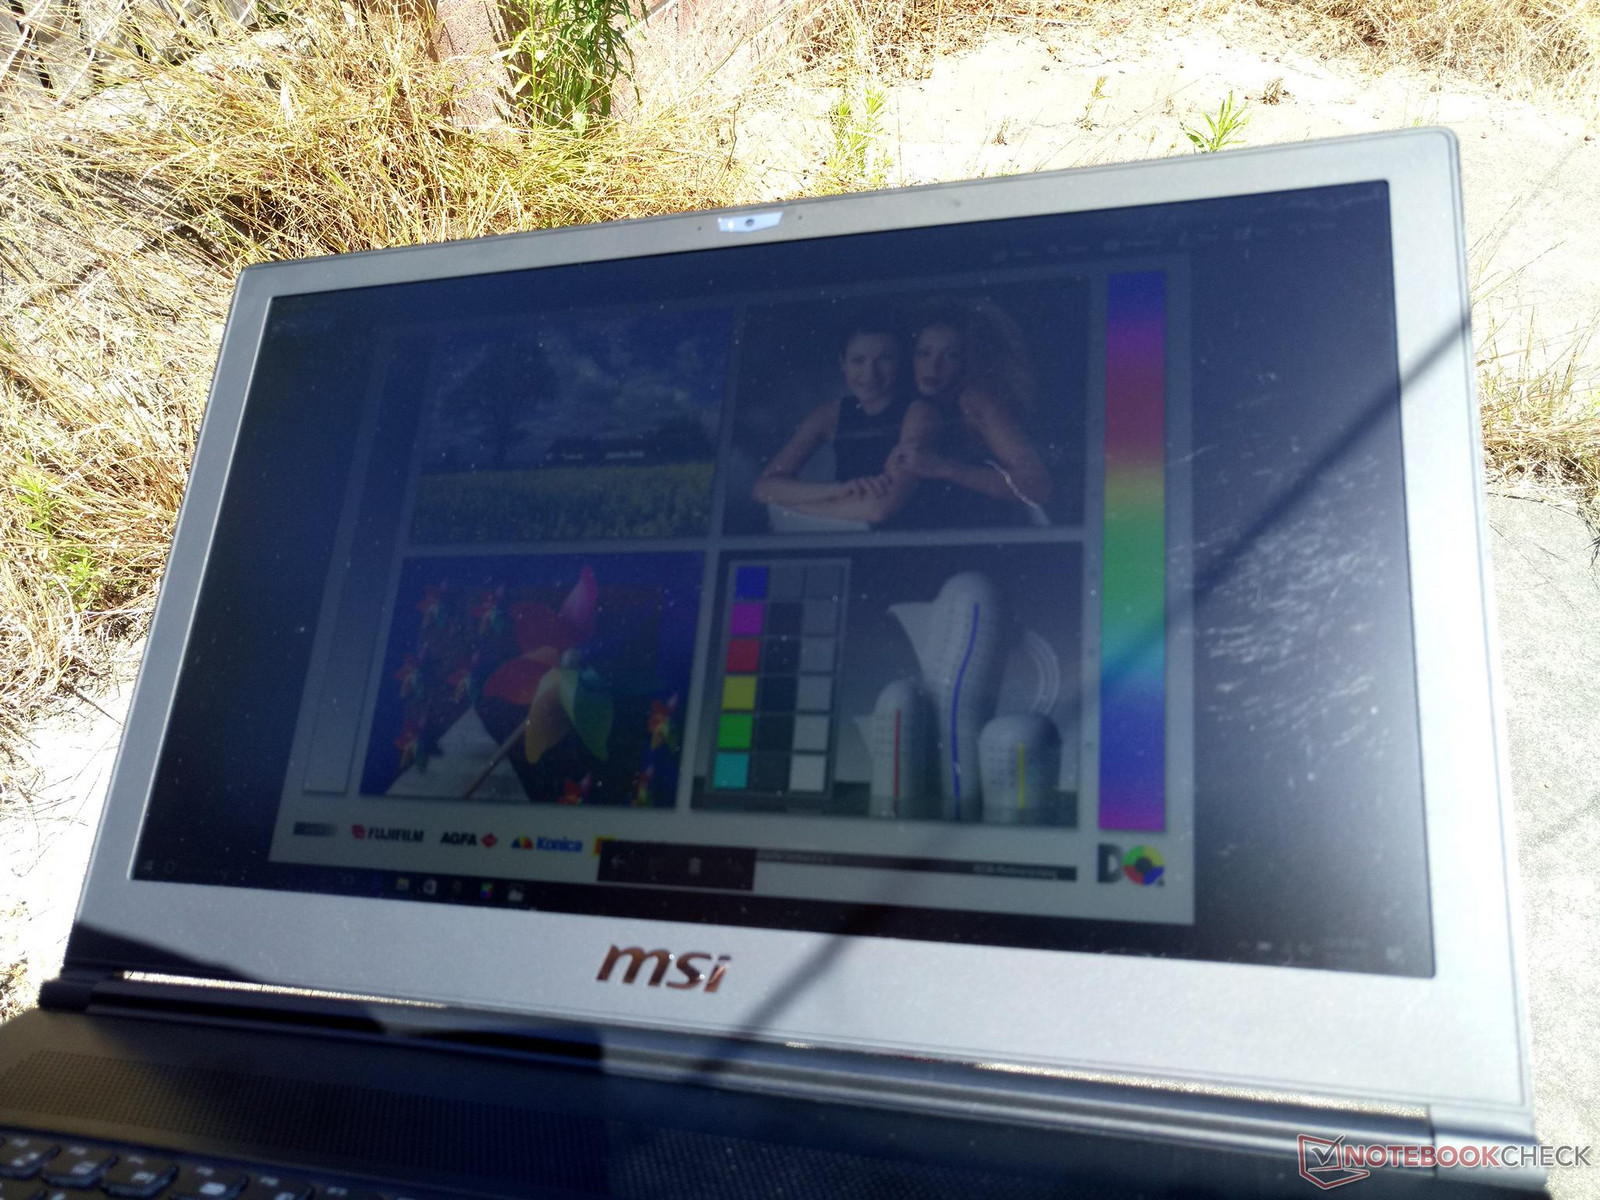
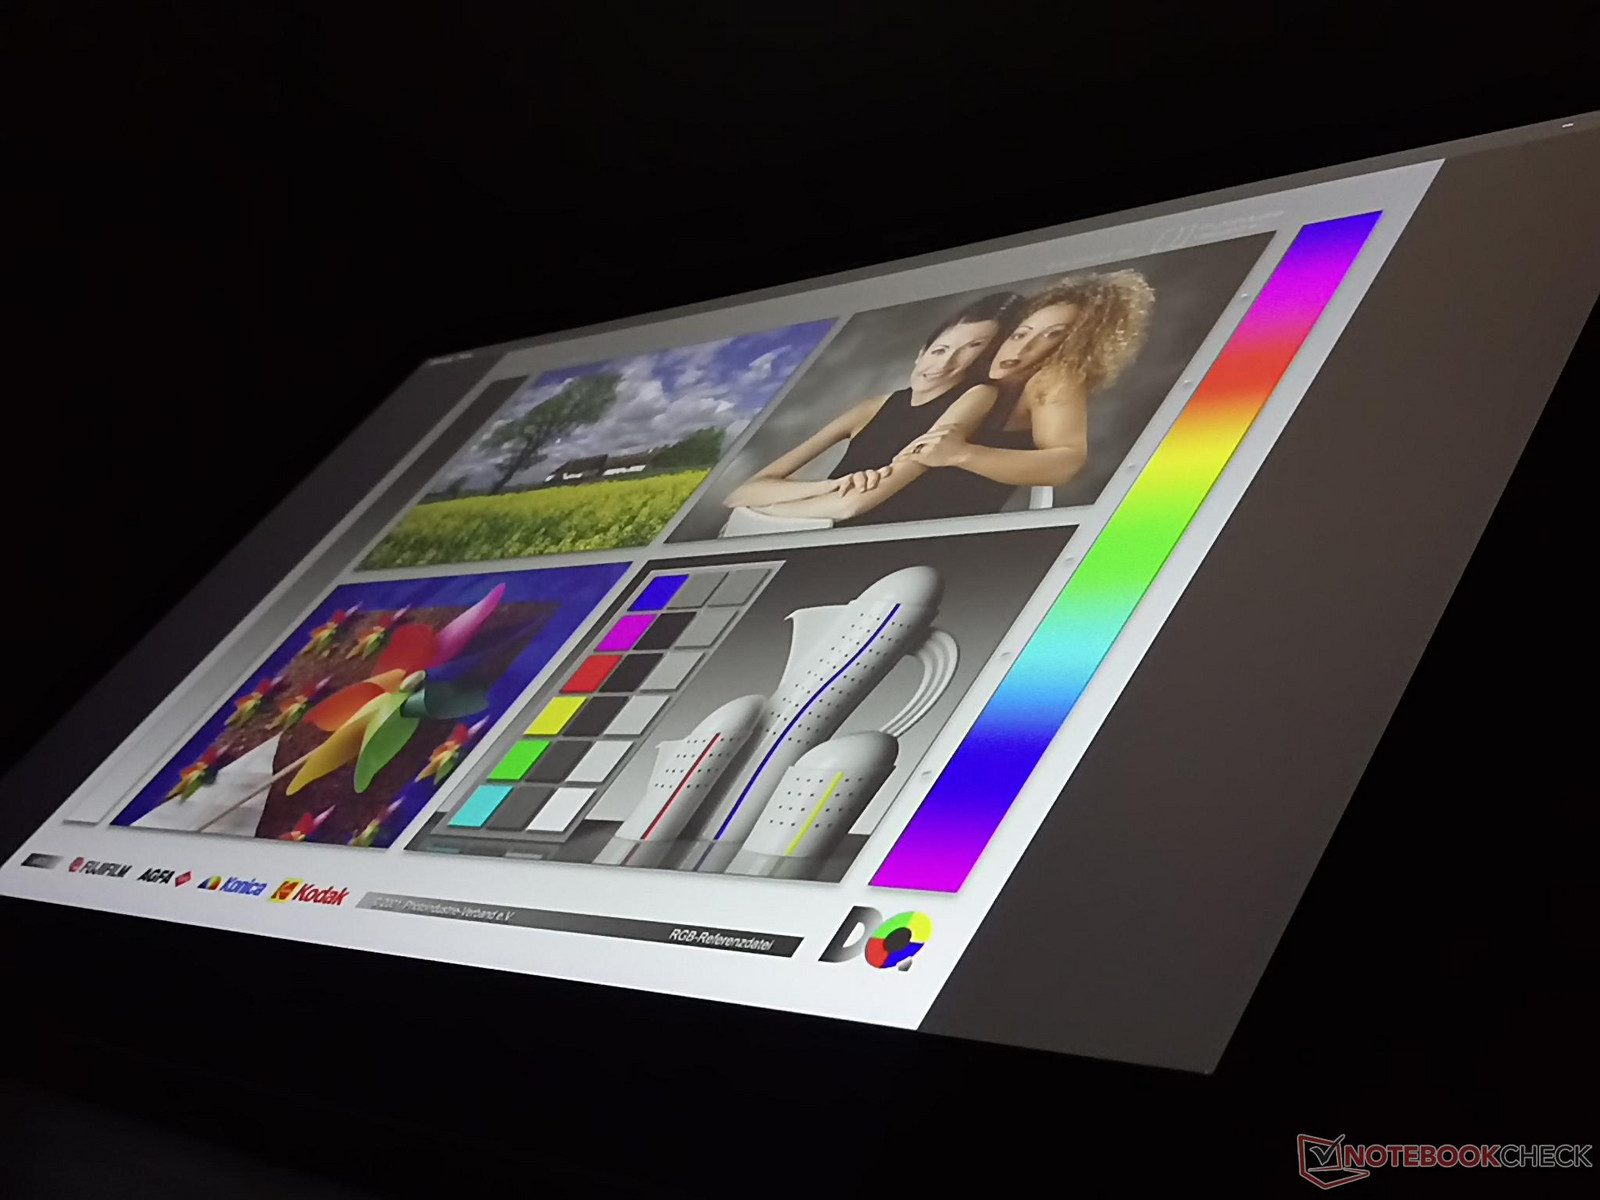
Outdoor visibility is average at best if working under shade. Direct sunlight will instantly wash out colors and text on the matte panel. Both the wide IPS viewing angles and 180-degree hinges can only compensate so much for the insufficient backlight.
Performance
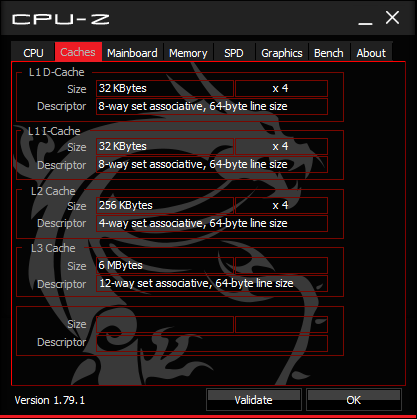
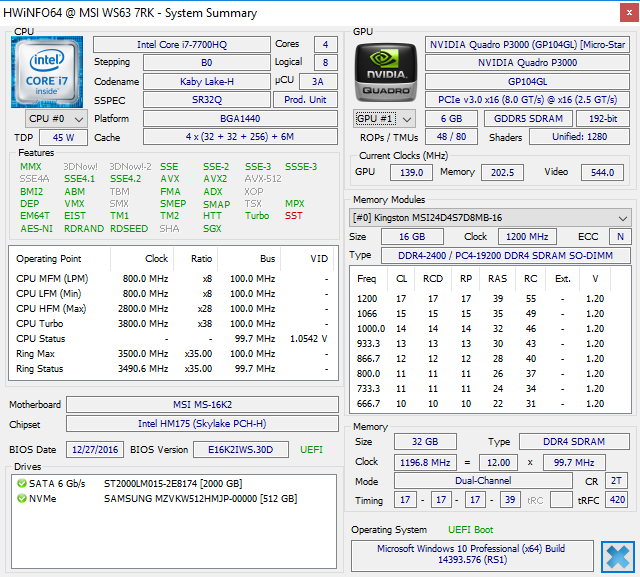
MSI has opted to skip the Xeon CPU series on the WS60 in favor of the consumer-oriented Core i7-7700HQ. This may be a deal breaker for certain users who depend on the very large L3 cache of Xeon CPUs and their native support for ECC RAM. We've not heard about any official plans so far to reintroduce the WS63 with Xeon options.
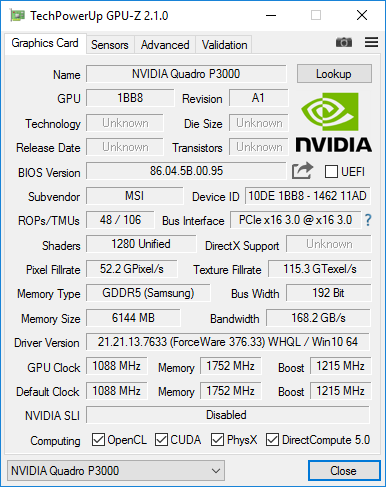
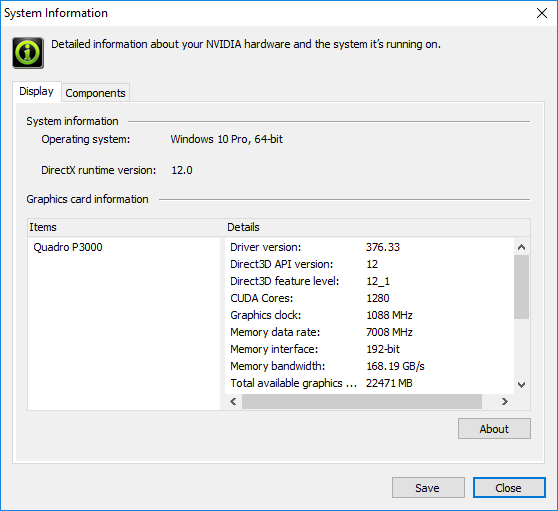
The defining feature of the WS63 lies instead on its new Quadro P3000 GPU with 6 GB of GDDR5 VRAM. This is one of the first available mobile workstations sporting the Pascal-based P3000 that shares many design features with the popular consumer-oriented GTX 1060. GPU-Z does in fact show the P3000 to have equal numbers of unified shaders and ROPs as the GTX 1060 but with less texture mapping units (80 vs. 106) and slower core and memory clock rates. If the jump from Maxwell to Pascal is of any indication, then the P3000 should be significantly faster than the outgoing Quadro M3000M found on most other mobile workstations.
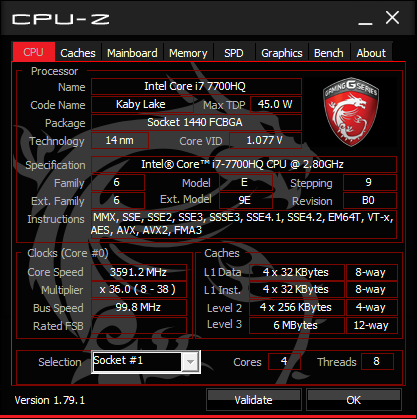
Processor
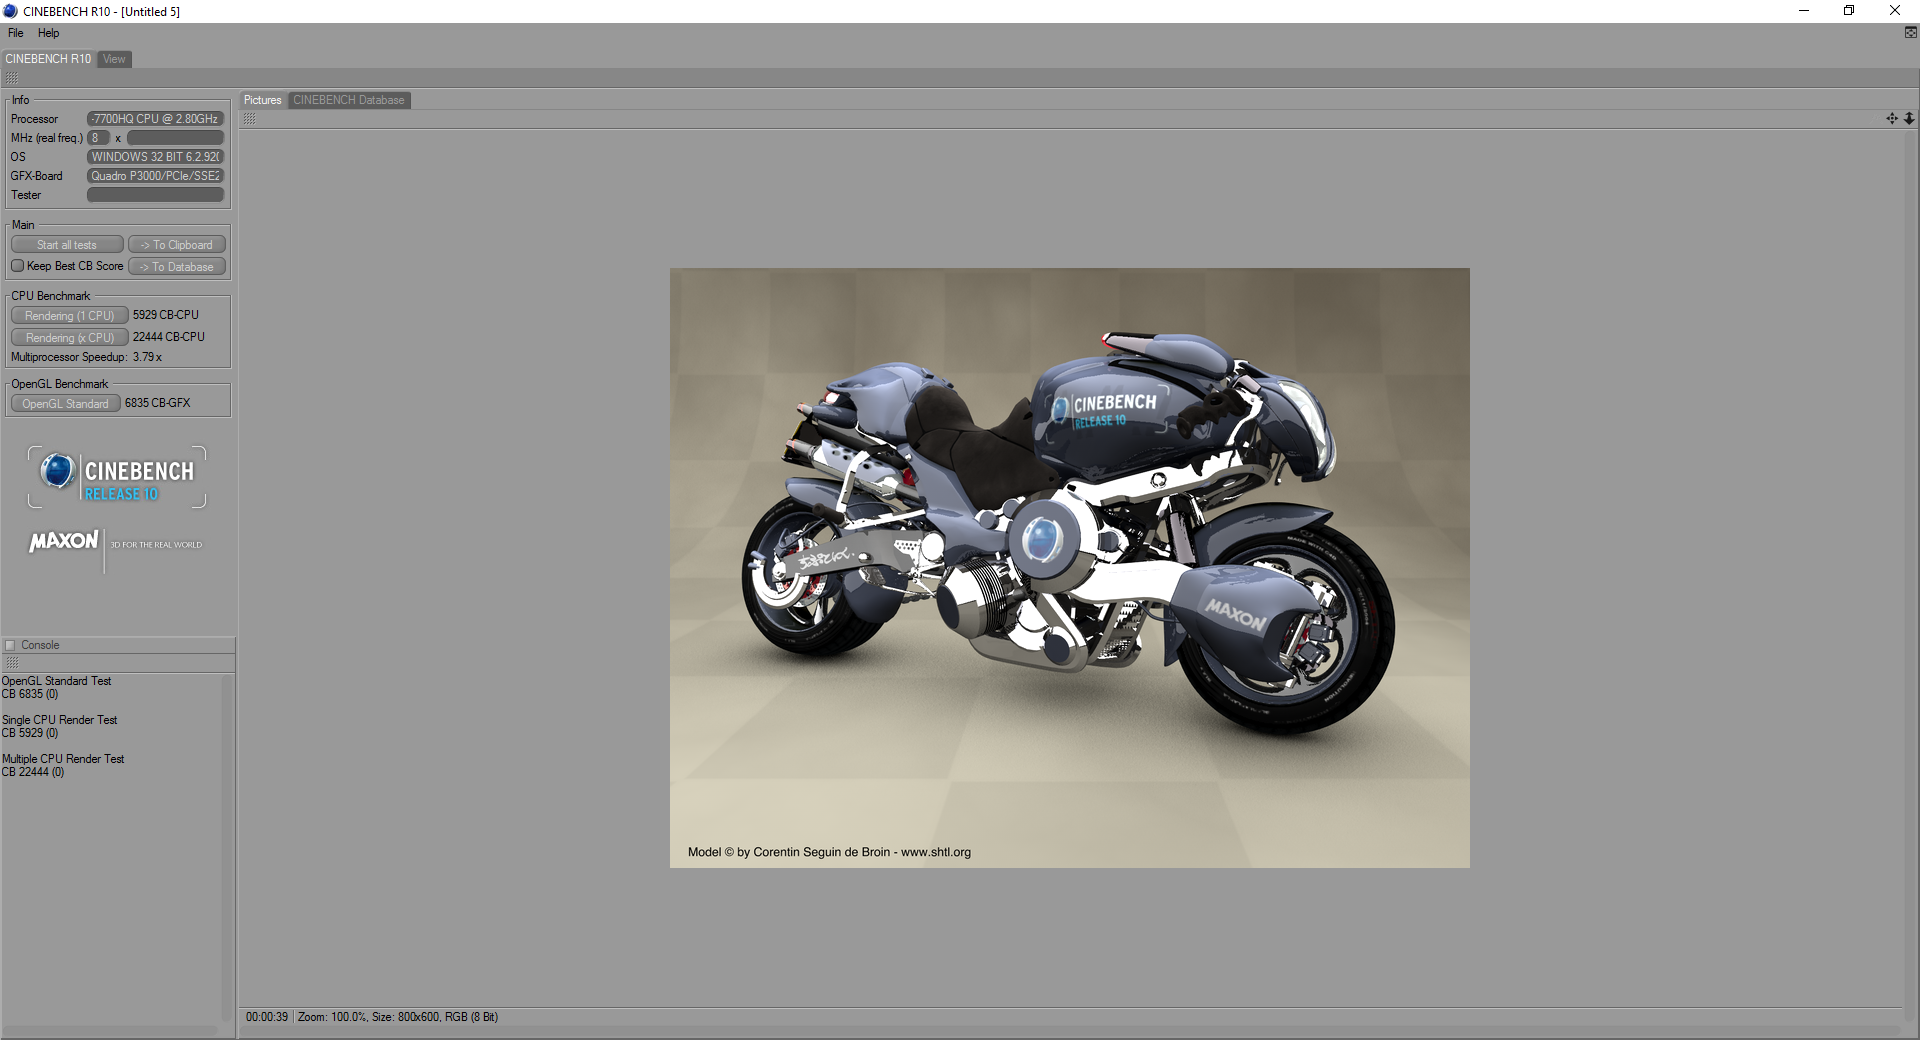
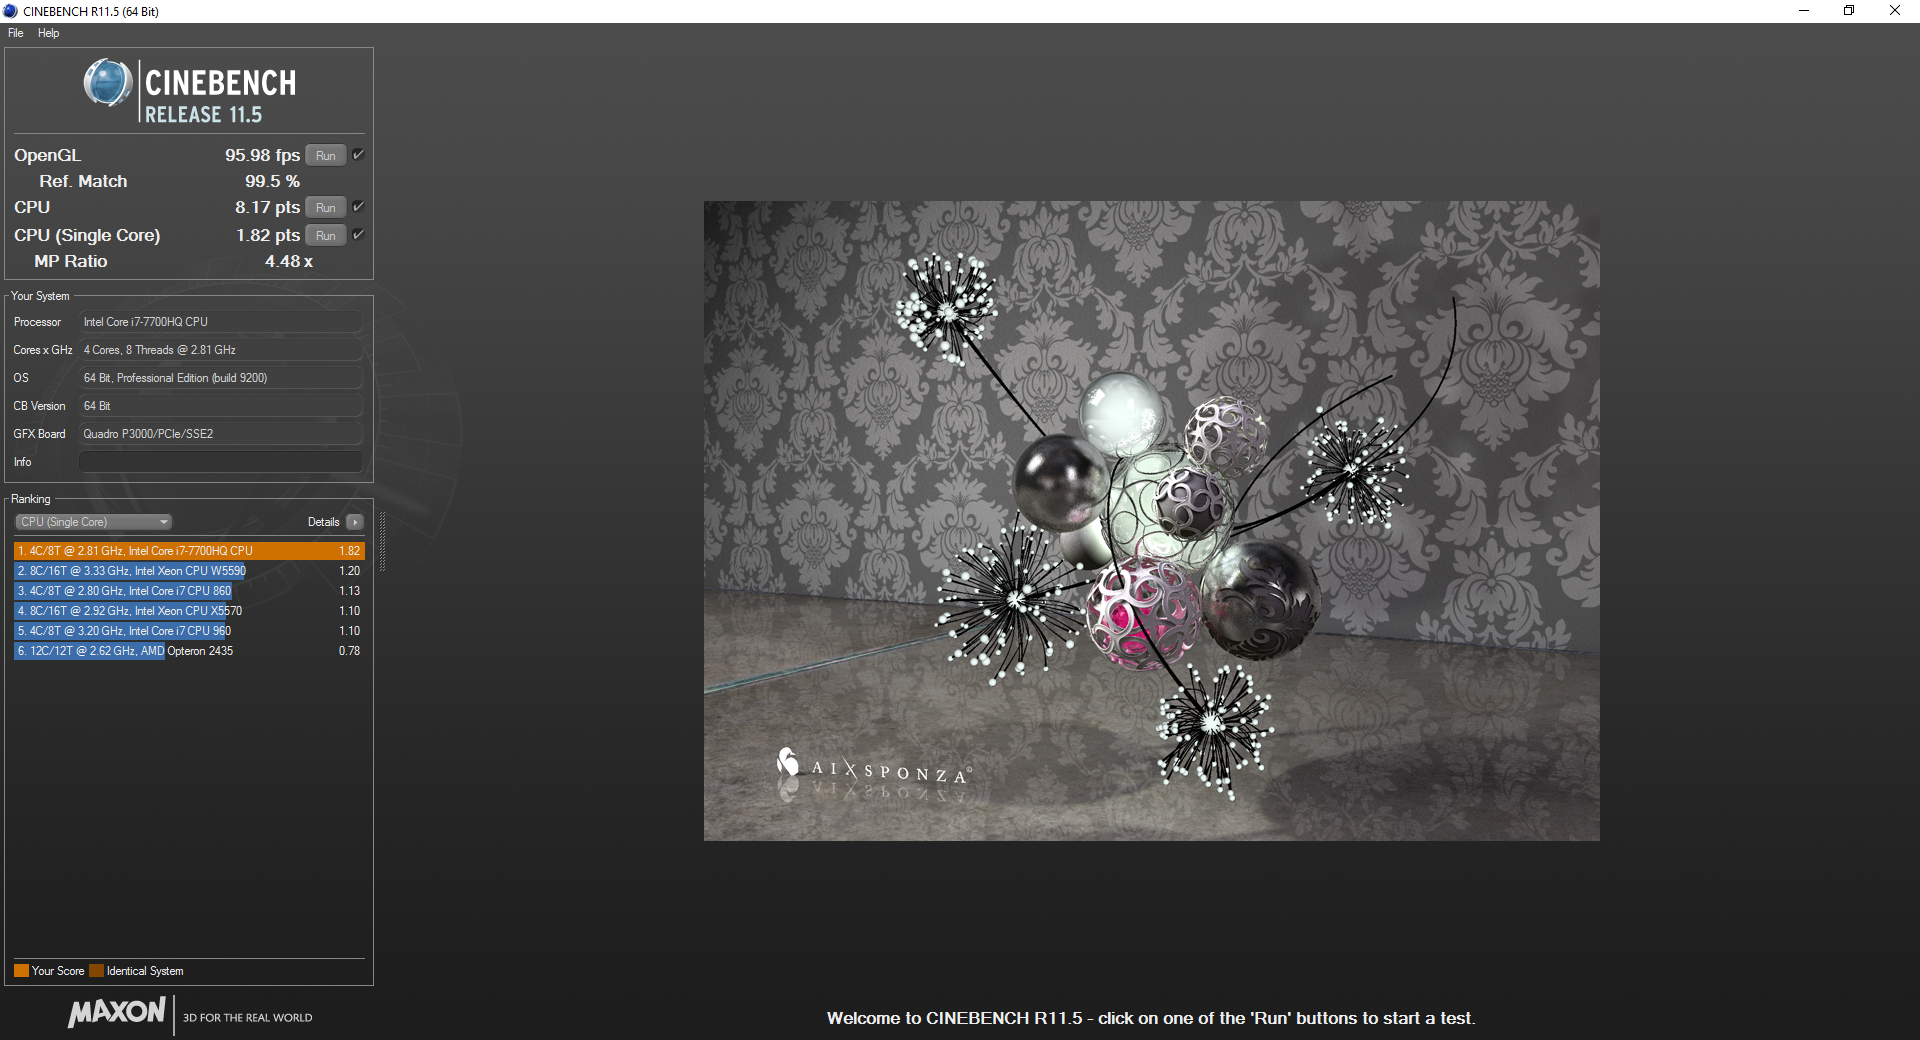
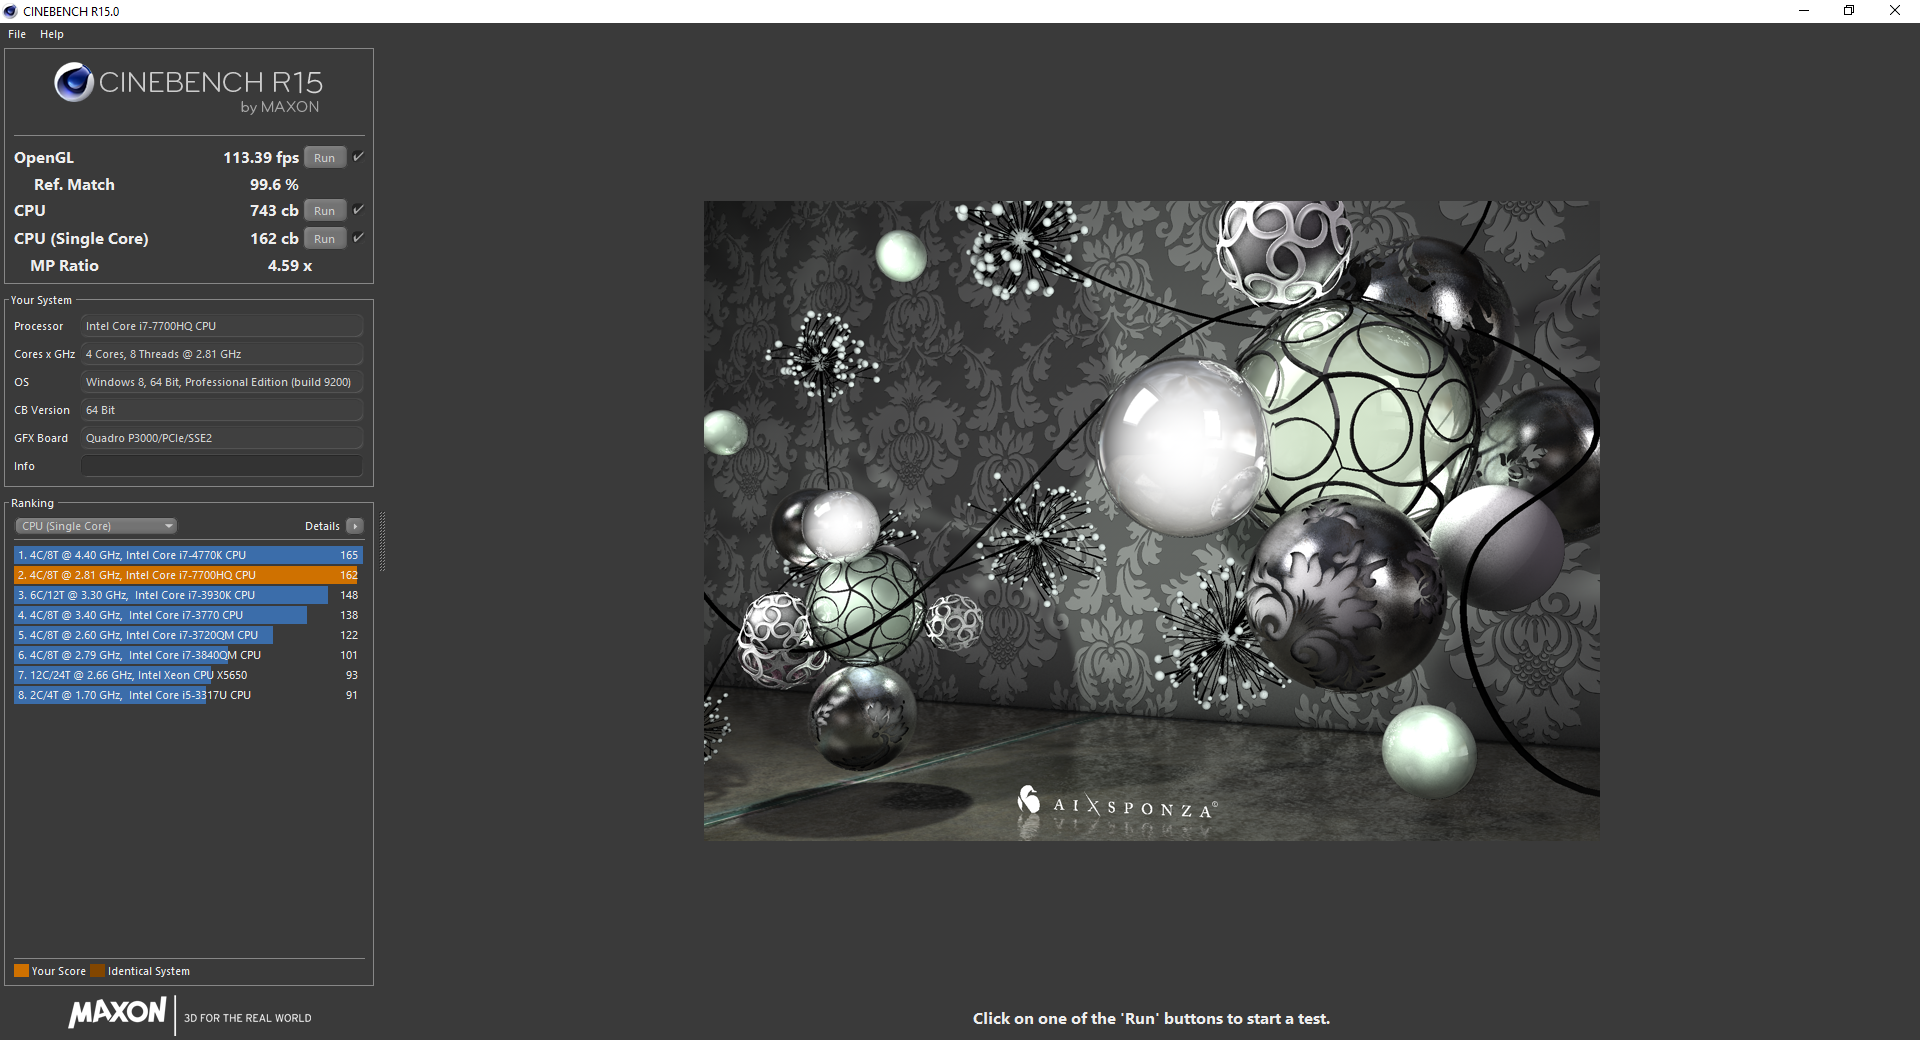
CPU performance is identical to the GS63VR according to CineBench benchmarks and only marginally faster than the Broadwell i7-5700HQ and Skylake i7-6700HQ CPUs in multi-threaded workloads. The Xeon E3-1505M v5 clocks in slightly slower while the octa-core Xeon E5-2680 desktop processor can potentially be over twice as fast.
Running CineBench R15 Multi-Thread in a loop results in steady scores throughout the run with a drop of only 2 to 3 percent. This is in stark contrast to our GS63VR or Precision 5520 test units where scores either fell over time or became irregular due to potential temperature throttling. MSI may have updated the BIOS for the WS63 to perform more consistently when under high CPU loads. See our dedicated page on the Core i7-7700HQ for more technical information and benchmark comparisons.
| Cinebench R15 | |
| CPU Single 64Bit | |
| Dell Precision 5520 UHD | |
| Lenovo ThinkPad P71-20HK0004GE | |
| MSI GS63VR 7RF-228US | |
| MSI WS63 7RF-290US | |
| MSI WS60 6QJ-535VPL | |
| MSI GE62 2QC-468XPL | |
| MSI GE72VR-6RF16H21 | |
| Nvidia Titan X (Pascal) | |
| CPU Multi 64Bit | |
| Nvidia Titan X (Pascal) | |
| Lenovo ThinkPad P71-20HK0004GE | |
| MSI WS63 7RF-290US | |
| MSI GS63VR 7RF-228US | |
| MSI GE62 2QC-468XPL | |
| MSI GE72VR-6RF16H21 | |
| MSI WS60 6QJ-535VPL | |
| Dell Precision 5520 UHD | |
| Cinebench R11.5 | |
| CPU Single 64Bit | |
| Dell Precision 5520 UHD | |
| Lenovo ThinkPad P71-20HK0004GE | |
| MSI WS63 7RF-290US | |
| MSI GS63VR 7RF-228US | |
| MSI GE62 2QC-468XPL | |
| MSI GE72VR-6RF16H21 | |
| Nvidia Titan X (Pascal) | |
| CPU Multi 64Bit | |
| Nvidia Titan X (Pascal) | |
| Lenovo ThinkPad P71-20HK0004GE | |
| MSI GS63VR 7RF-228US | |
| MSI WS63 7RF-290US | |
| MSI GE62 2QC-468XPL | |
| Dell Precision 5520 UHD | |
| MSI GE72VR-6RF16H21 | |
| Cinebench R10 | |
| Rendering Multiple CPUs 32Bit | |
| Nvidia Titan X (Pascal) | |
| Lenovo ThinkPad P71-20HK0004GE | |
| MSI WS63 7RF-290US | |
| MSI GS63VR 7RF-228US | |
| MSI GE62 2QC-468XPL | |
| MSI GE72VR-6RF16H21 | |
| Rendering Single 32Bit | |
| Lenovo ThinkPad P71-20HK0004GE | |
| MSI WS63 7RF-290US | |
| MSI GS63VR 7RF-228US | |
| MSI GE62 2QC-468XPL | |
| MSI GE72VR-6RF16H21 | |
| Nvidia Titan X (Pascal) | |
| wPrime 2.10 - 1024m | |
| MSI WS60 6QJ-535VPL | |
| Dell Precision 5520 UHD | |
| MSI GS63VR 7RF-228US | |
| MSI WS63 7RF-290US | |
| MSI GE62 2QC-468XPL | |
* ... smaller is better
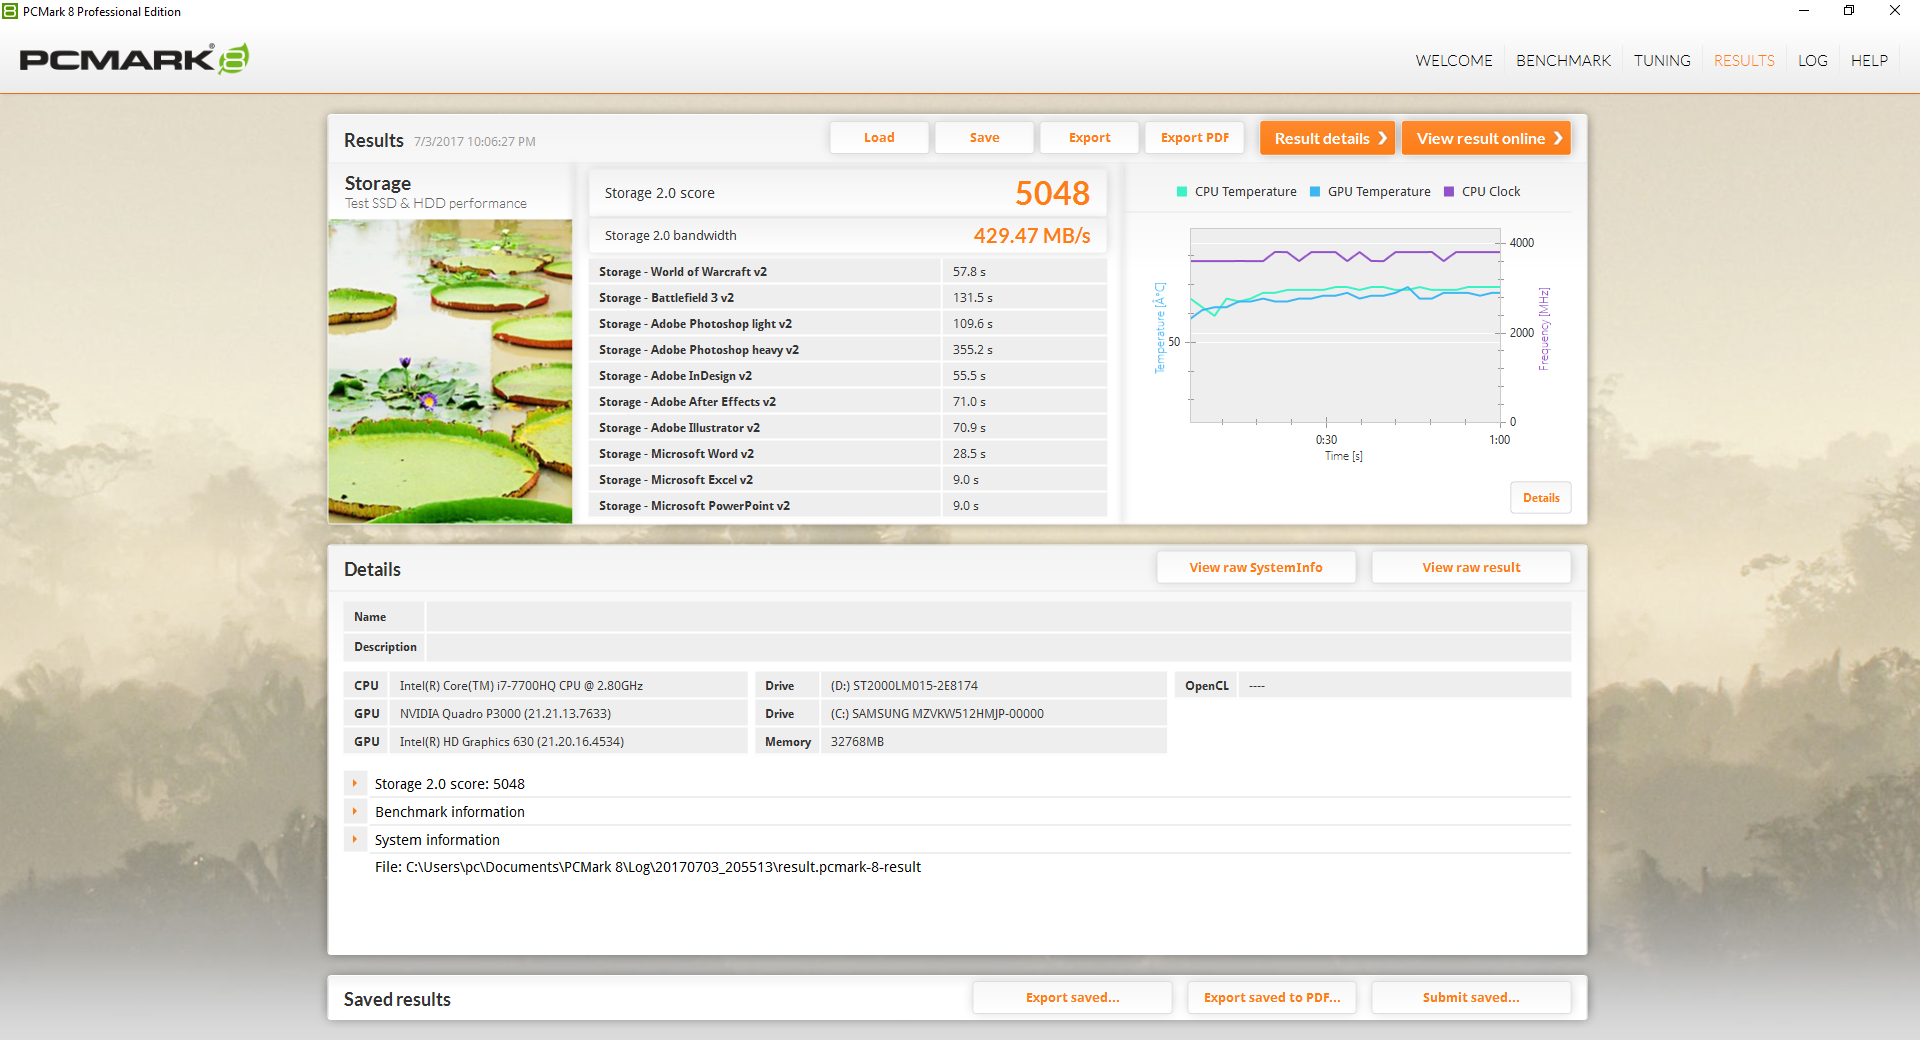
System Performance
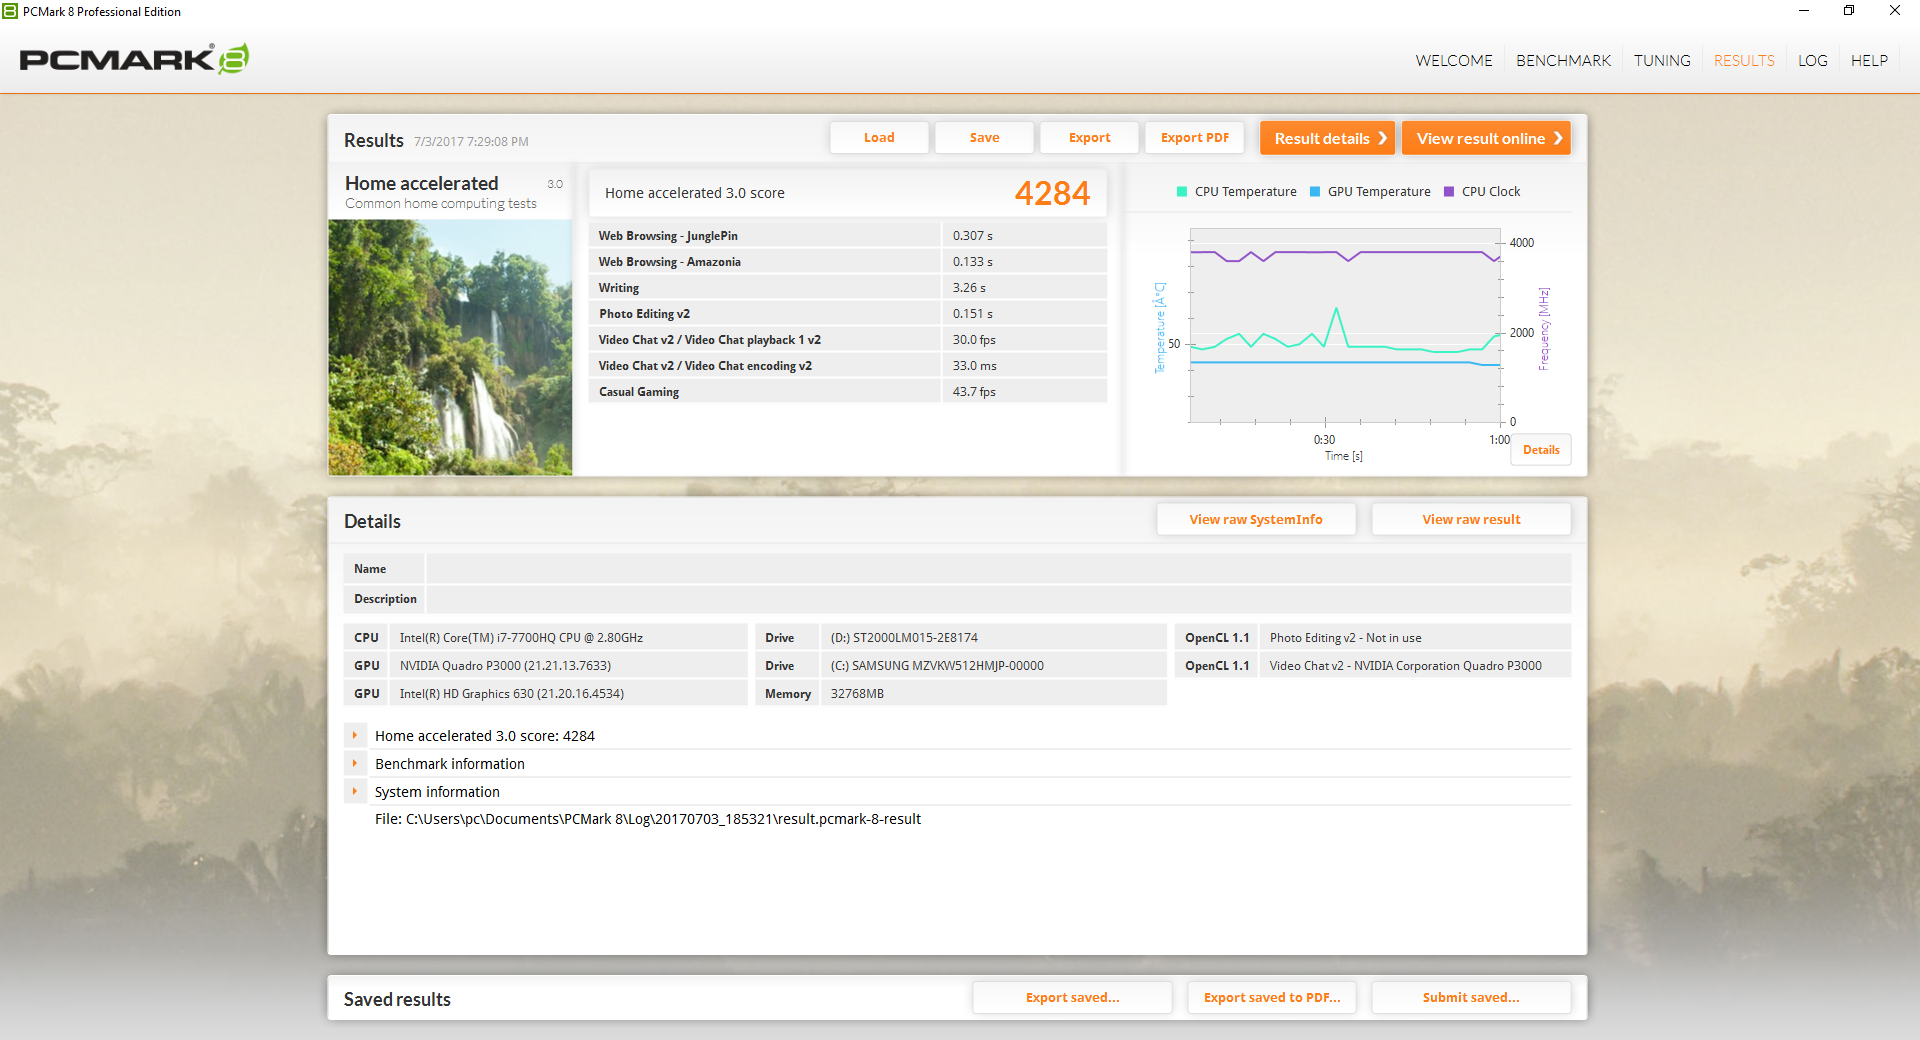
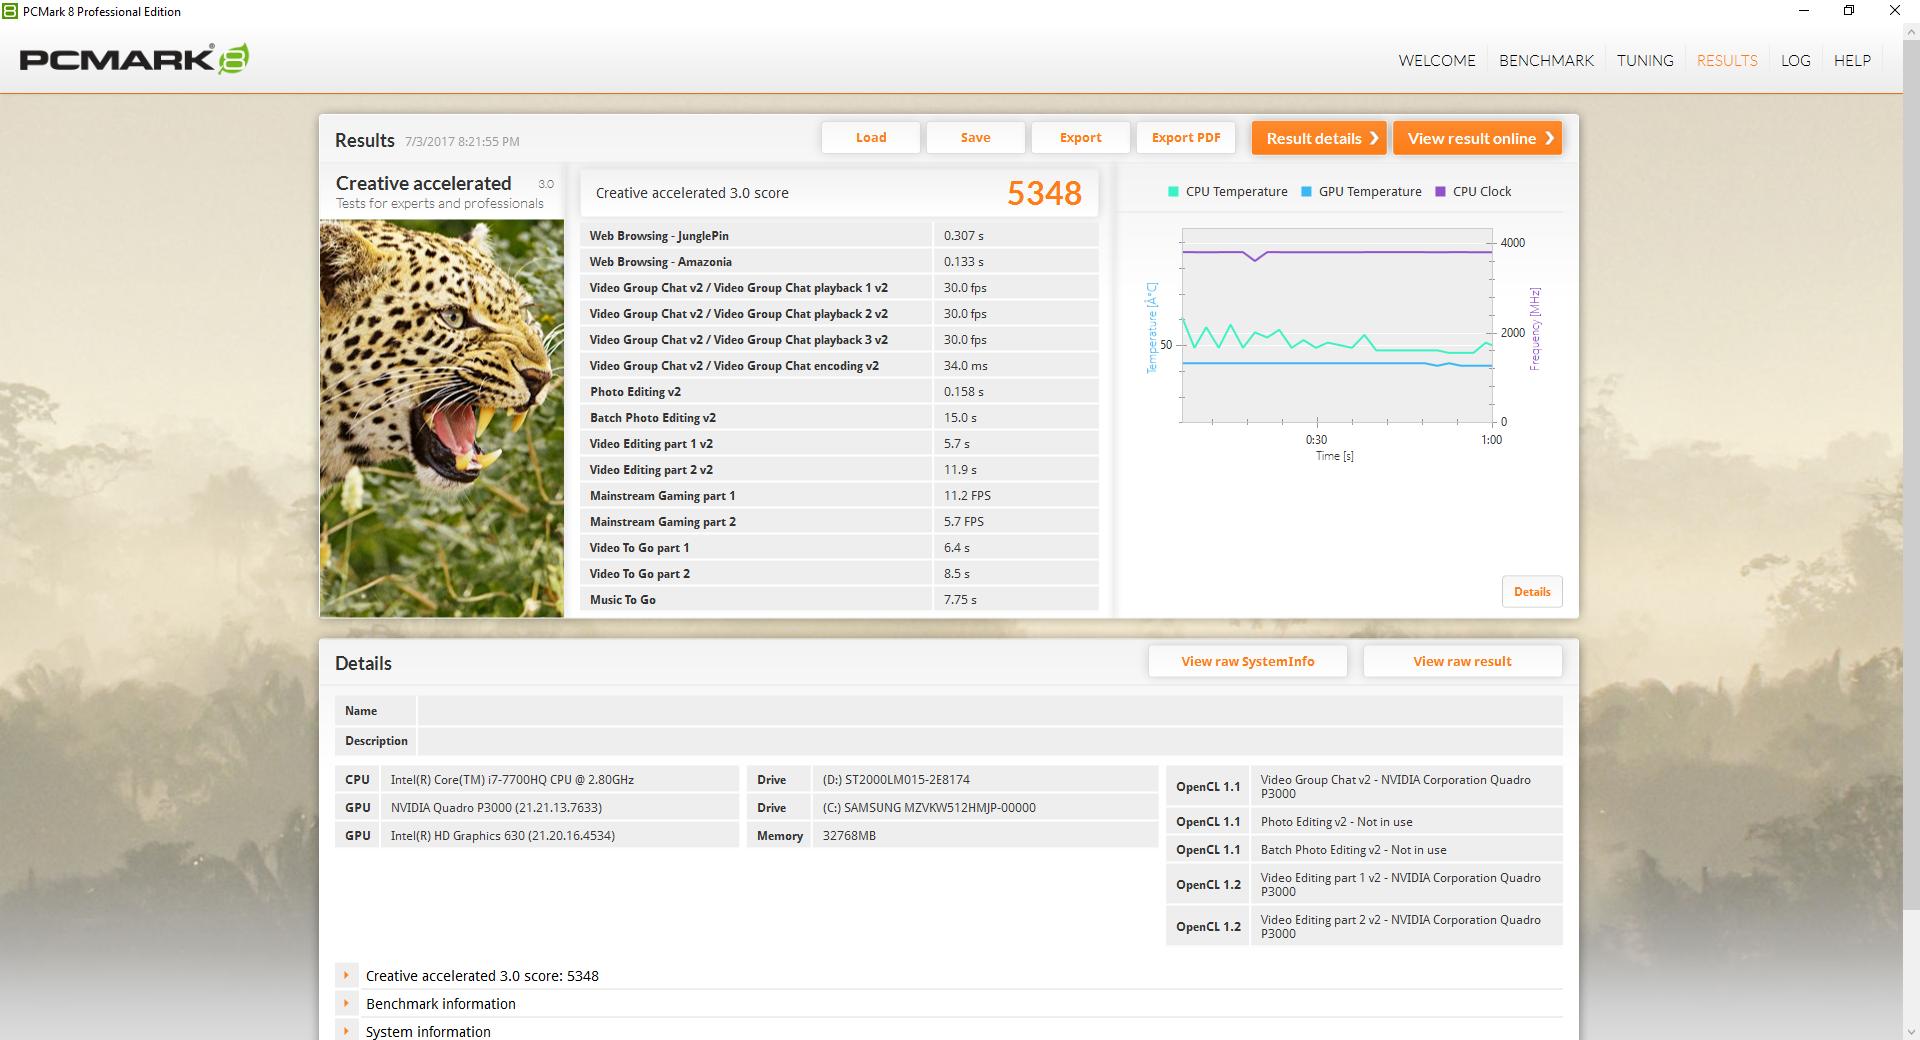
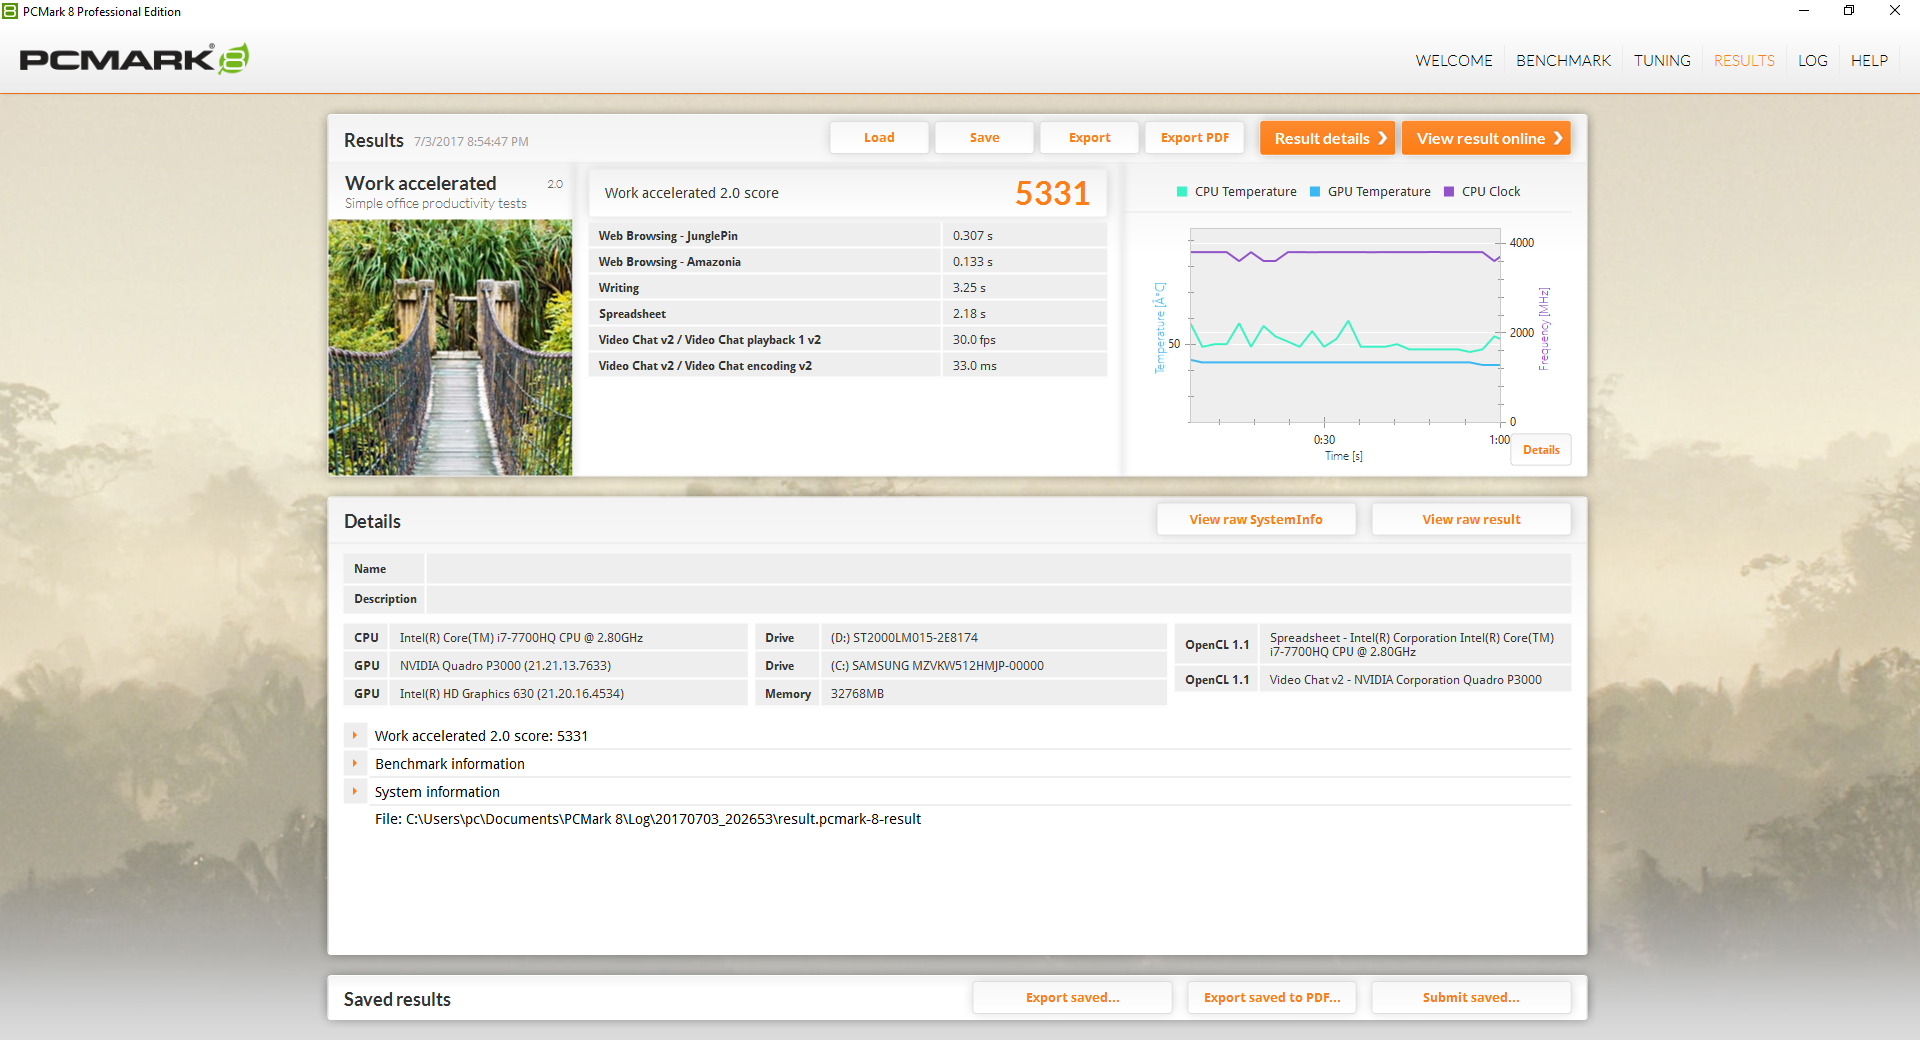
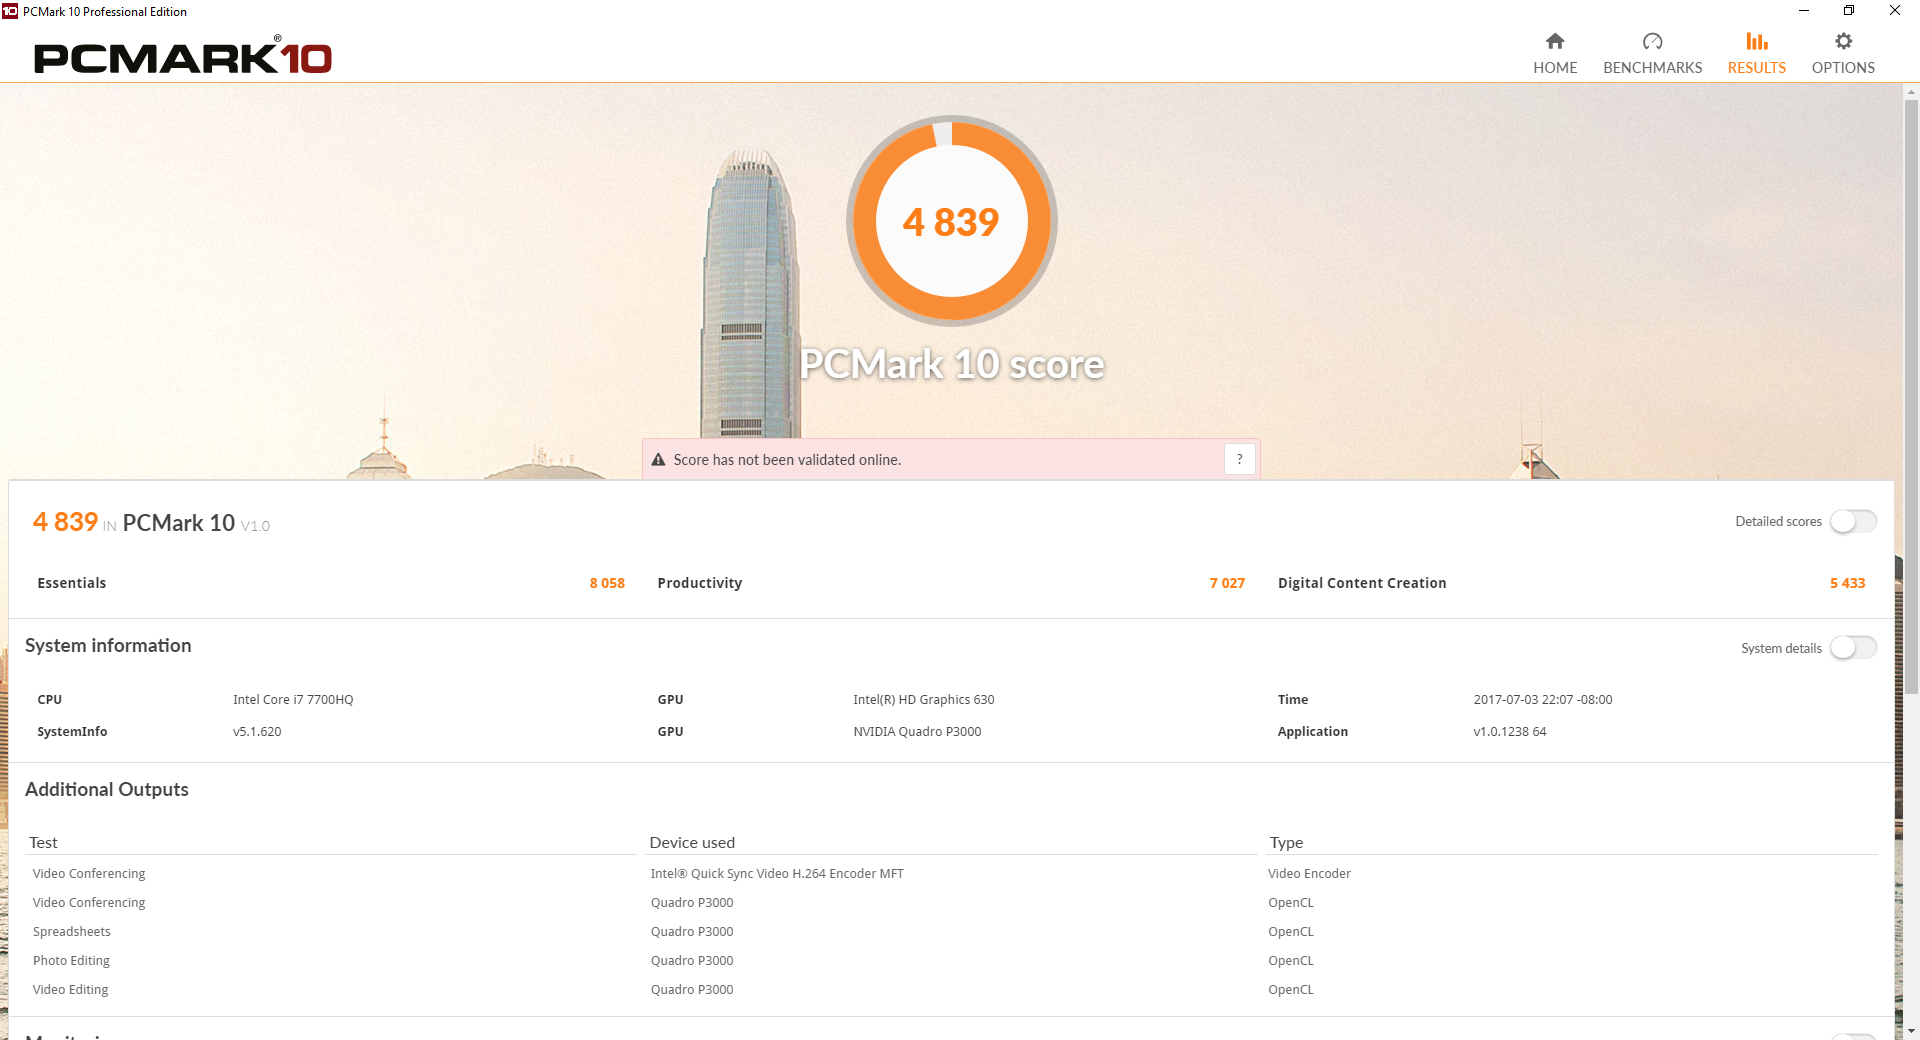
PCMark 8 ranks the system noticeably faster than the WS60 and ThinkPad P51. Subjectively, system performance is smooth and we can notice no software hitches during use.
| PCMark 8 | |
| Home Score Accelerated v2 | |
| EVGA SC15 | |
| MSI WS63 7RF-290US | |
| Lenovo ThinkPad P51 20HH0016GE | |
| MSI WS60-6QJE316H11 | |
| Work Score Accelerated v2 | |
| EVGA SC15 | |
| MSI WS63 7RF-290US | |
| Lenovo ThinkPad P51 20HH0016GE | |
| MSI WS60-6QJE316H11 | |
| Creative Score Accelerated v2 | |
| EVGA SC15 | |
| Lenovo ThinkPad P51 20HH0016GE | |
| MSI WS63 7RF-290US | |
| PCMark 8 Home Score Accelerated v2 | 4284 points | |
| PCMark 8 Creative Score Accelerated v2 | 5348 points | |
| PCMark 8 Work Score Accelerated v2 | 5331 points | |
Help | ||
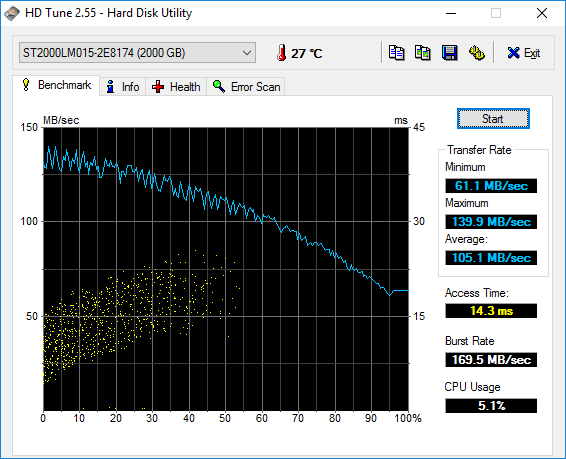
Storage Devices
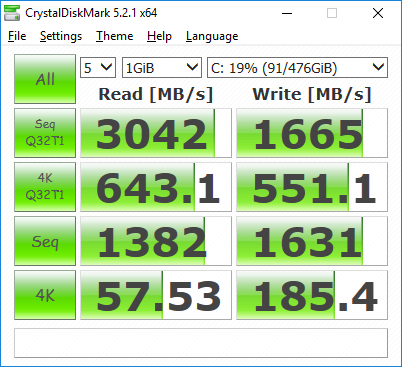
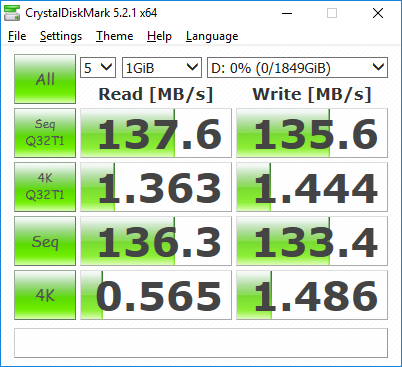
Our test unit houses a primary 512 GB Samsung SM961 M.2 NVMe SSD and a secondary 2 TB Seagate ST2000LM015 HDD. Unsurprisingly, SSD performance is similar to the ThinkPad P51 and Precision 5520 since all three systems can be configured with the same Samsung drive. Our older WS60 and its RAID 0 SATA III drives don't even come close to the newer NVMe SSDs as the table below illustrates. The secondary Seagate HDD returns an average transfer rate of 105 MB/s on HD Tune which is fast for a 5400 RPM drive.
See our growing table of SSDs and HDDs for more benchmark comparisons.
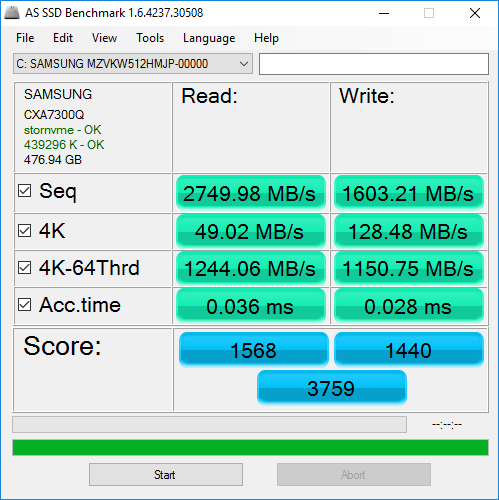
| MSI WS63 7RF-290US Samsung SM961 MZVKW512HMJP m.2 PCI-e | MSI WS60 6QJ-535VPL 2x Plextor PX512M6GV-2280 (RAID 0) | Lenovo ThinkPad P51 20HH0016GE Samsung PM961 NVMe MZVLW512HMJP | Dell Precision 5520 UHD Samsung SM961 MZVKW512HMJP m.2 PCI-e | Fujitsu Celsius H760 Samsung SM951 MZVPV512 m.2 PCI-e | |
|---|---|---|---|---|---|
| AS SSD | -55% | -4% | -1% | -17% | |
| Copy Game MB/s (MB/s) | 1121 | 1140 2% | 921 -18% | 978 -13% | |
| Copy Program MB/s (MB/s) | 447.3 | 425.6 -5% | 372.8 -17% | 571 28% | |
| Copy ISO MB/s (MB/s) | 1760 | 1607 -9% | 1659 -6% | 1325 -25% | |
| Score Total (Points) | 3759 | 1392 -63% | 3424 -9% | 3681 -2% | 2201 -41% |
| Score Write (Points) | 1440 | 543 -62% | 917 -36% | 1379 -4% | 623 -57% |
| Score Read (Points) | 1568 | 557 -64% | 1690 8% | 1554 -1% | 1048 -33% |
| Access Time Write * (ms) | 0.028 | 0.041 -46% | 0.025 11% | 0.023 18% | 0.018 36% |
| Access Time Read * (ms) | 0.036 | 0.054 -50% | 0.032 11% | 0.038 -6% | 0.036 -0% |
| 4K-64 Write (MB/s) | 1151 | 375.8 -67% | 623 -46% | 1055 -8% | 285 -75% |
| 4K-64 Read (MB/s) | 1244 | 437.1 -65% | 1372 10% | 1223 -2% | 801 -36% |
| 4K Write (MB/s) | 128.5 | 85 -34% | 143.1 11% | 155.3 21% | 188 46% |
| 4K Read (MB/s) | 49.02 | 32.19 -34% | 55.6 13% | 51.5 5% | 34 -31% |
| Seq Write (MB/s) | 1603 | 821 -49% | 1506 -6% | 1694 6% | 1492 -7% |
| Seq Read (MB/s) | 2750 | 880 -68% | 2624 -5% | 2799 2% | 1916 -30% |
* ... smaller is better

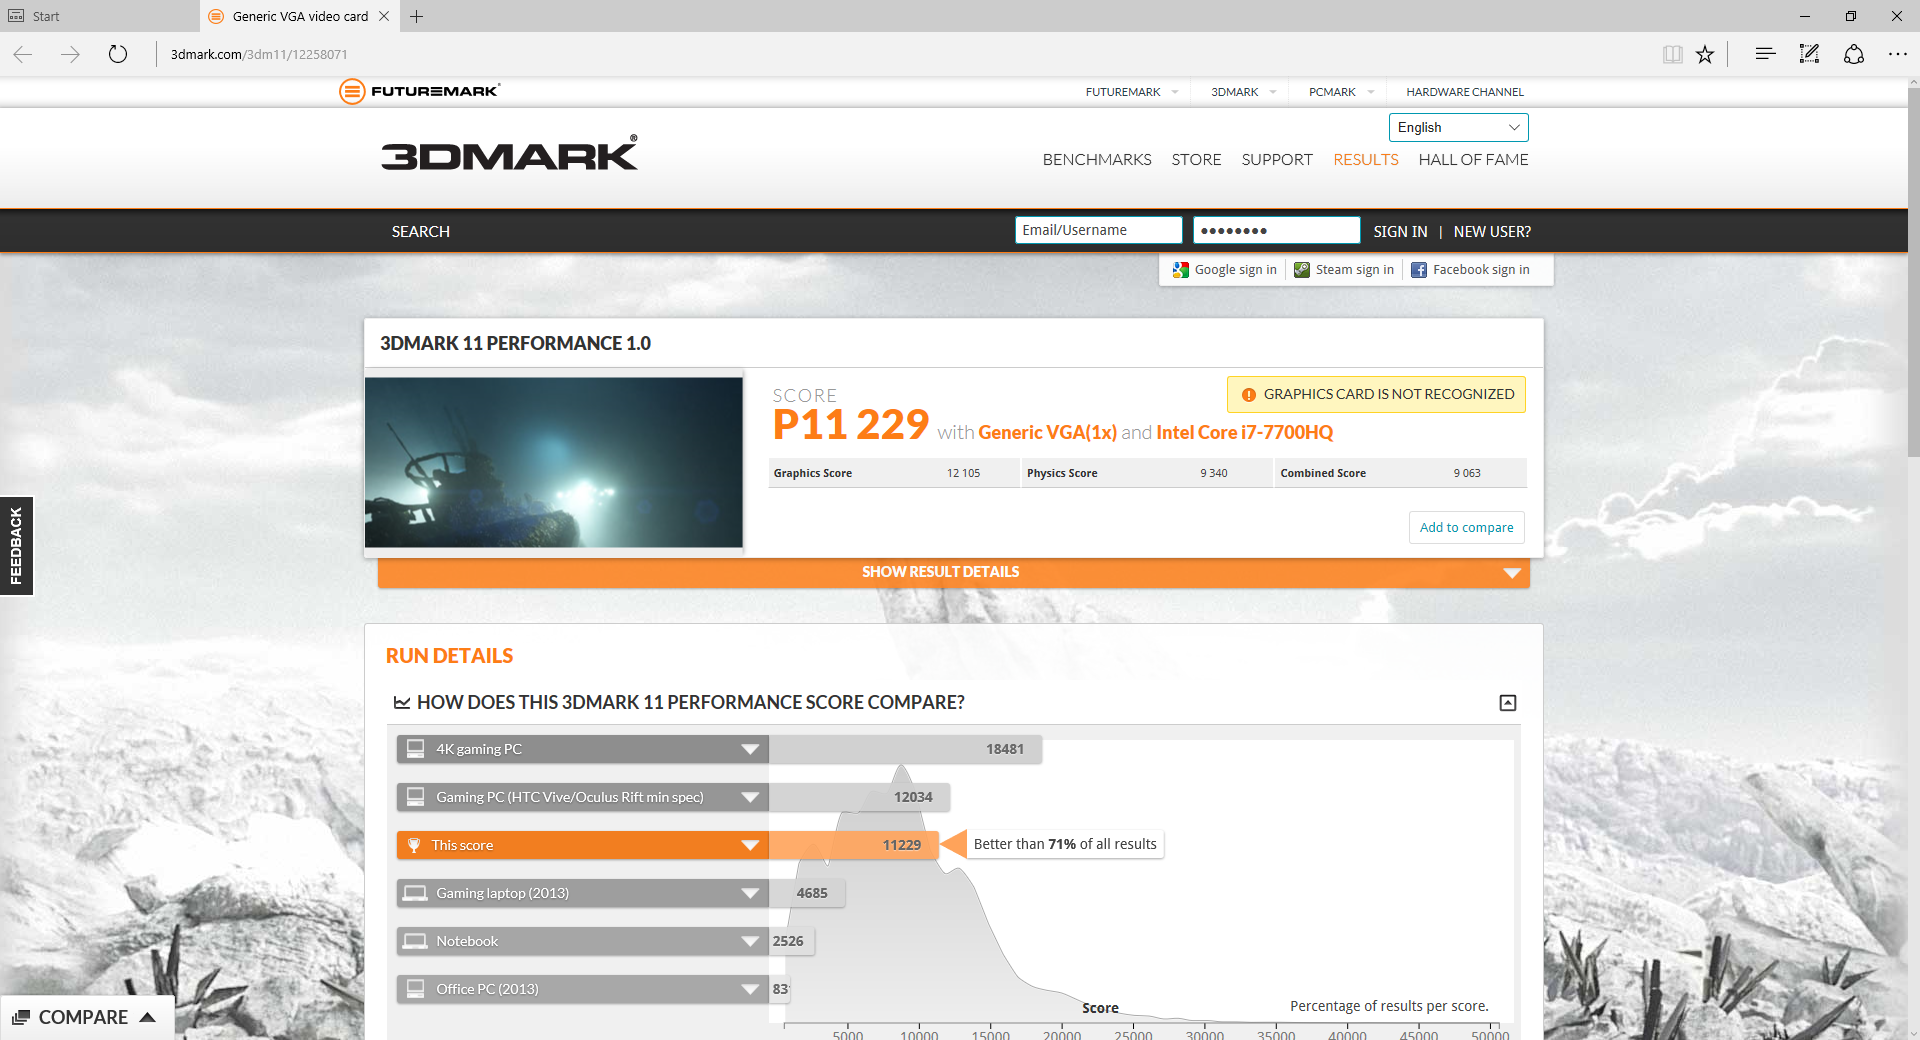
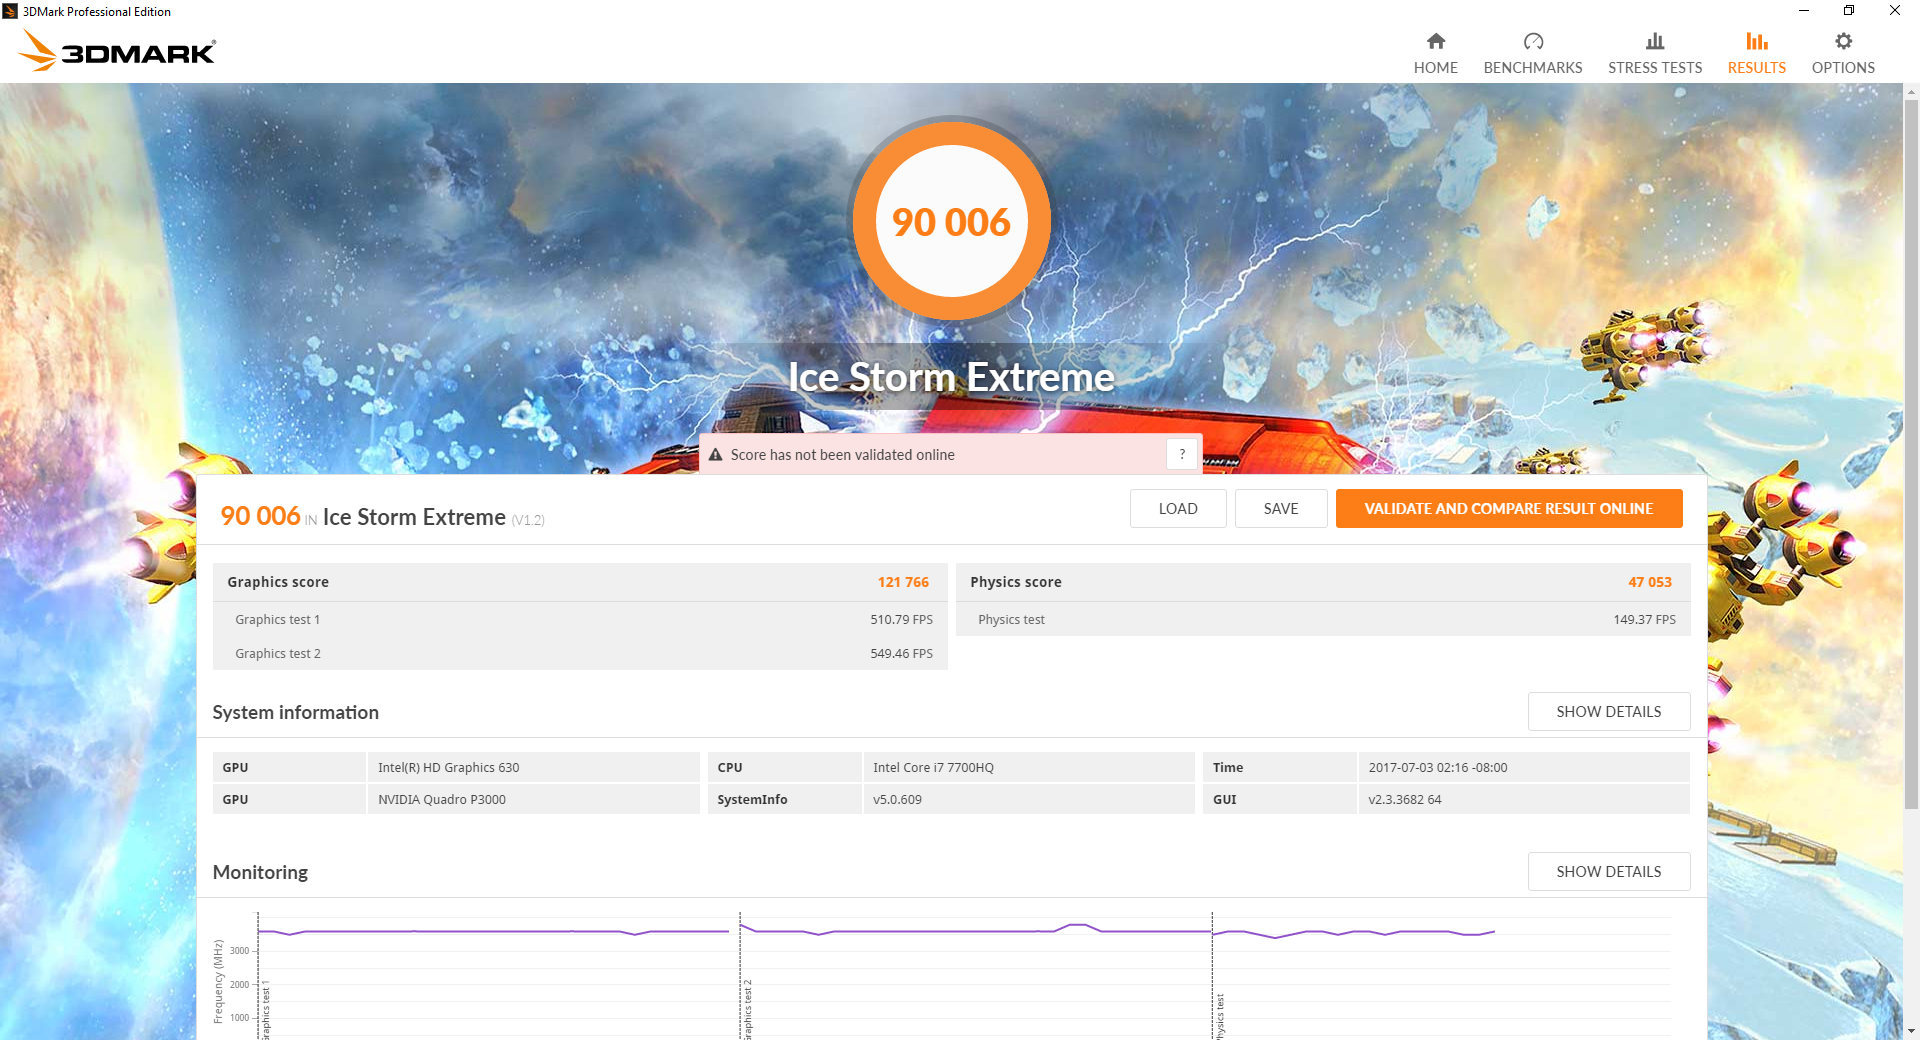
GPU Performance
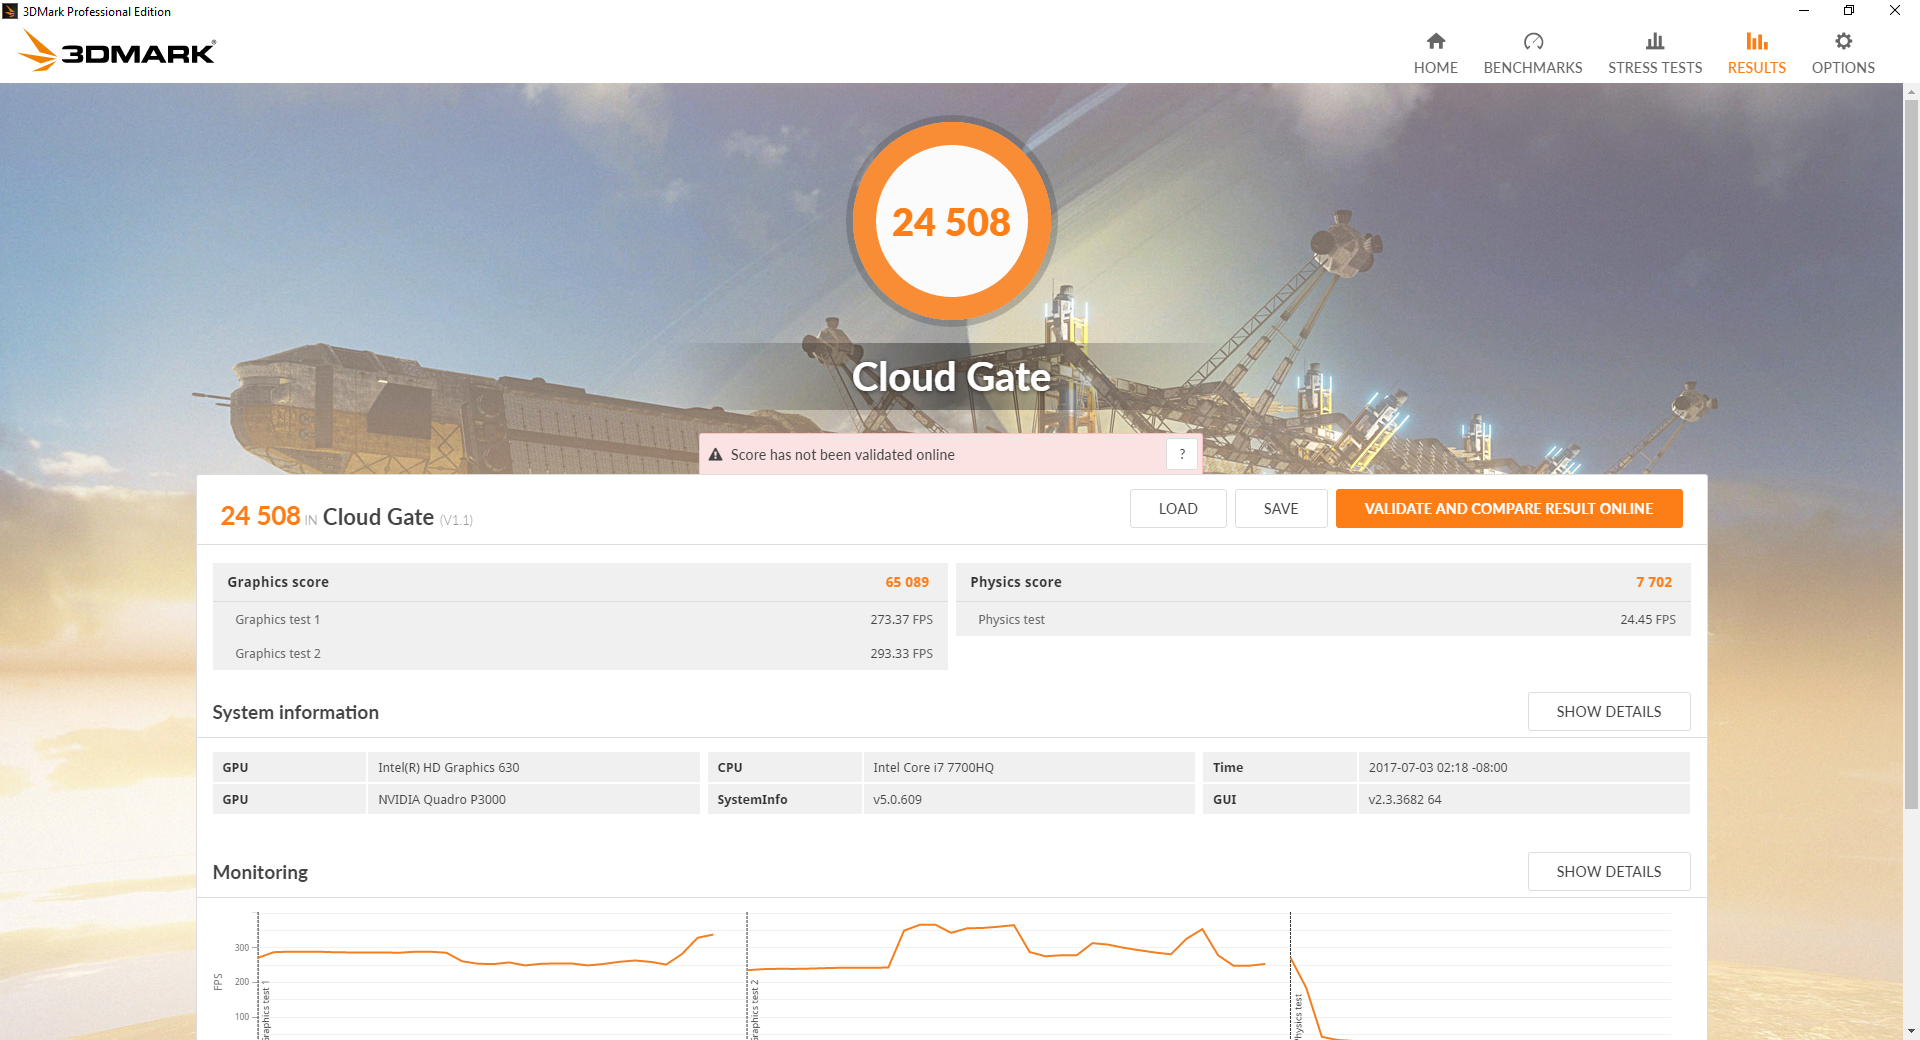
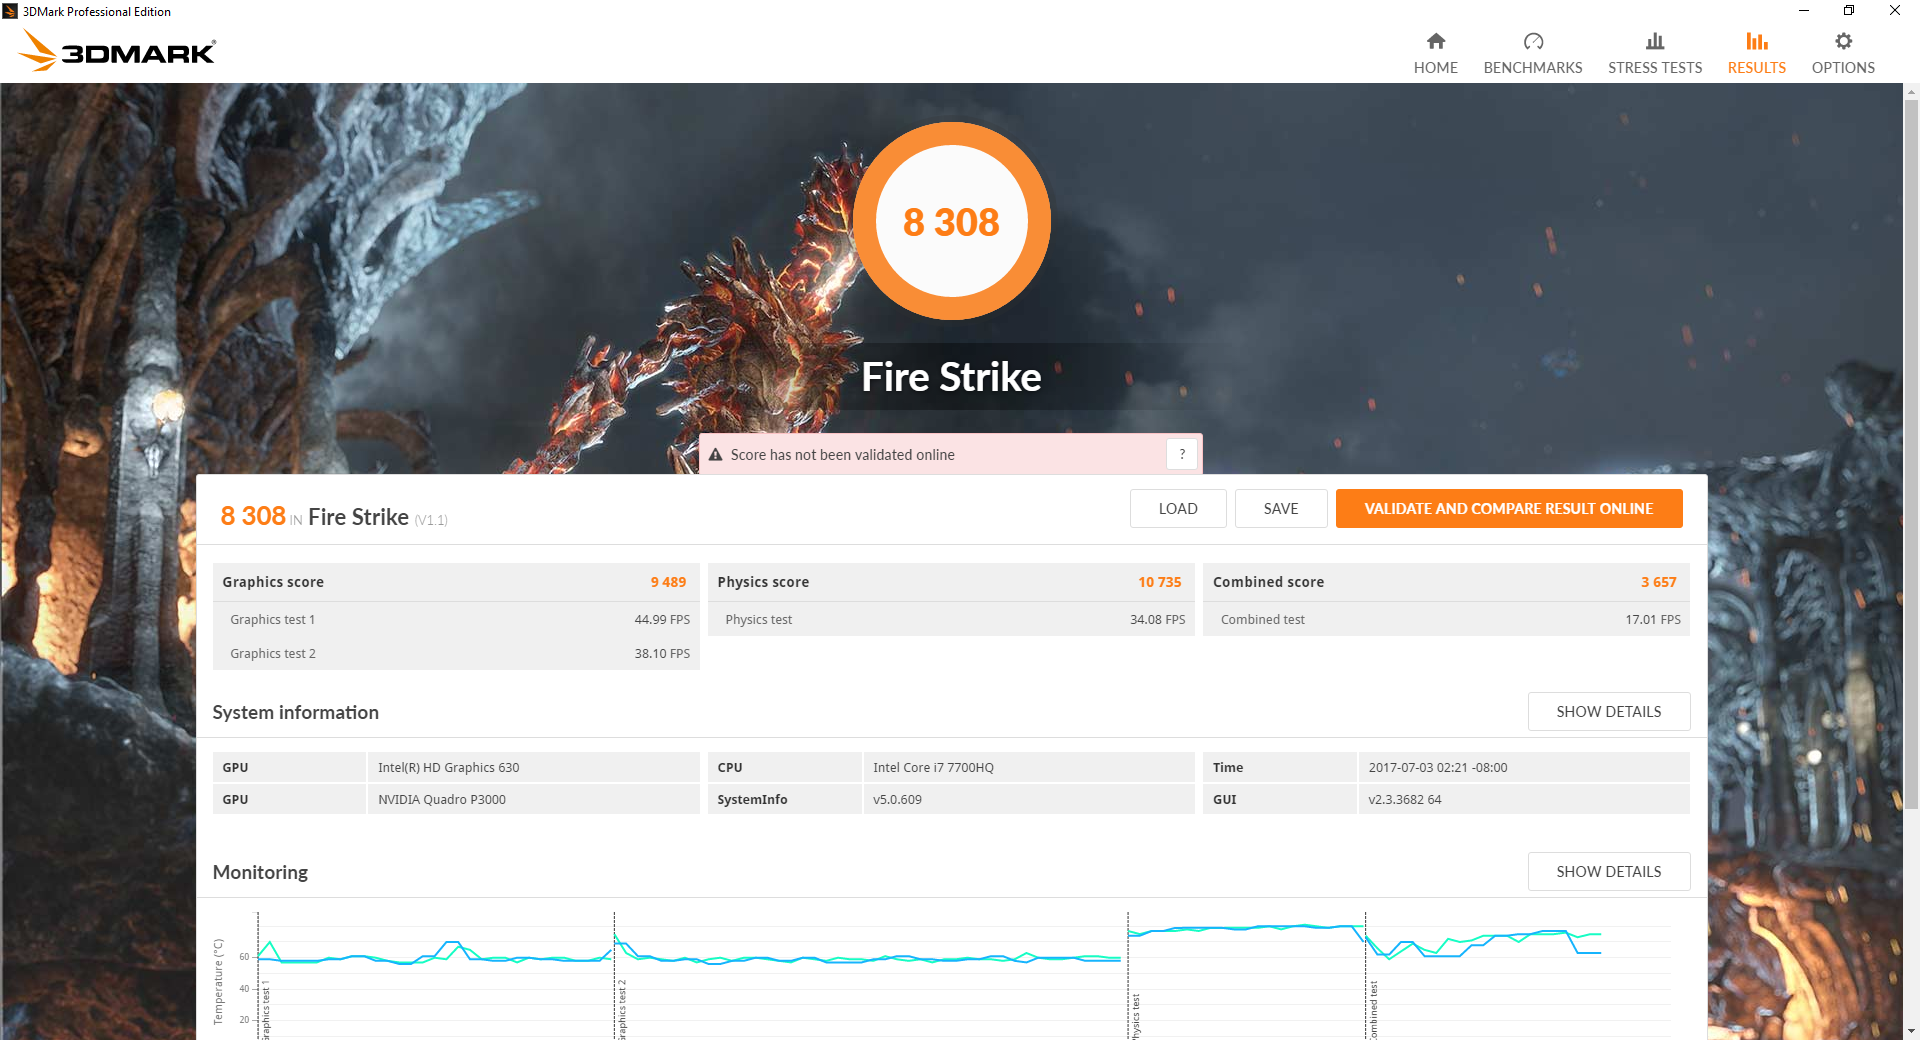
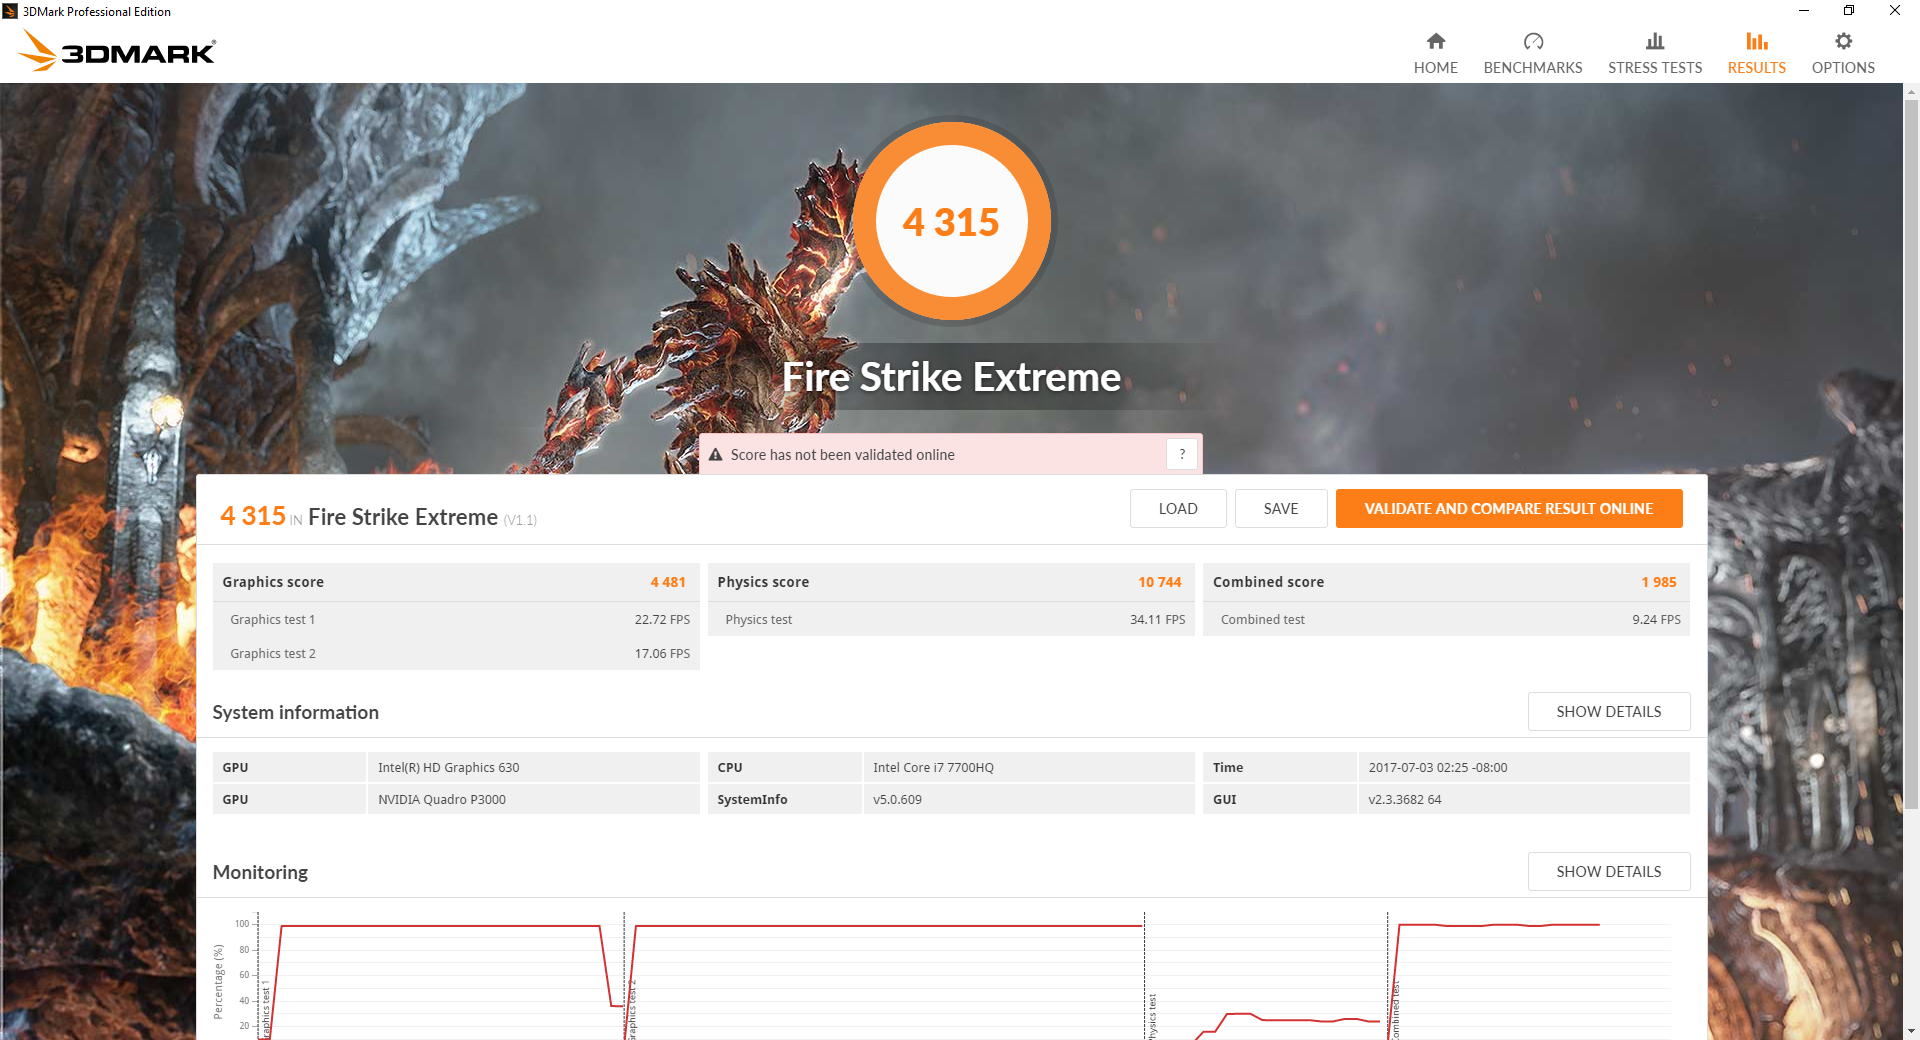
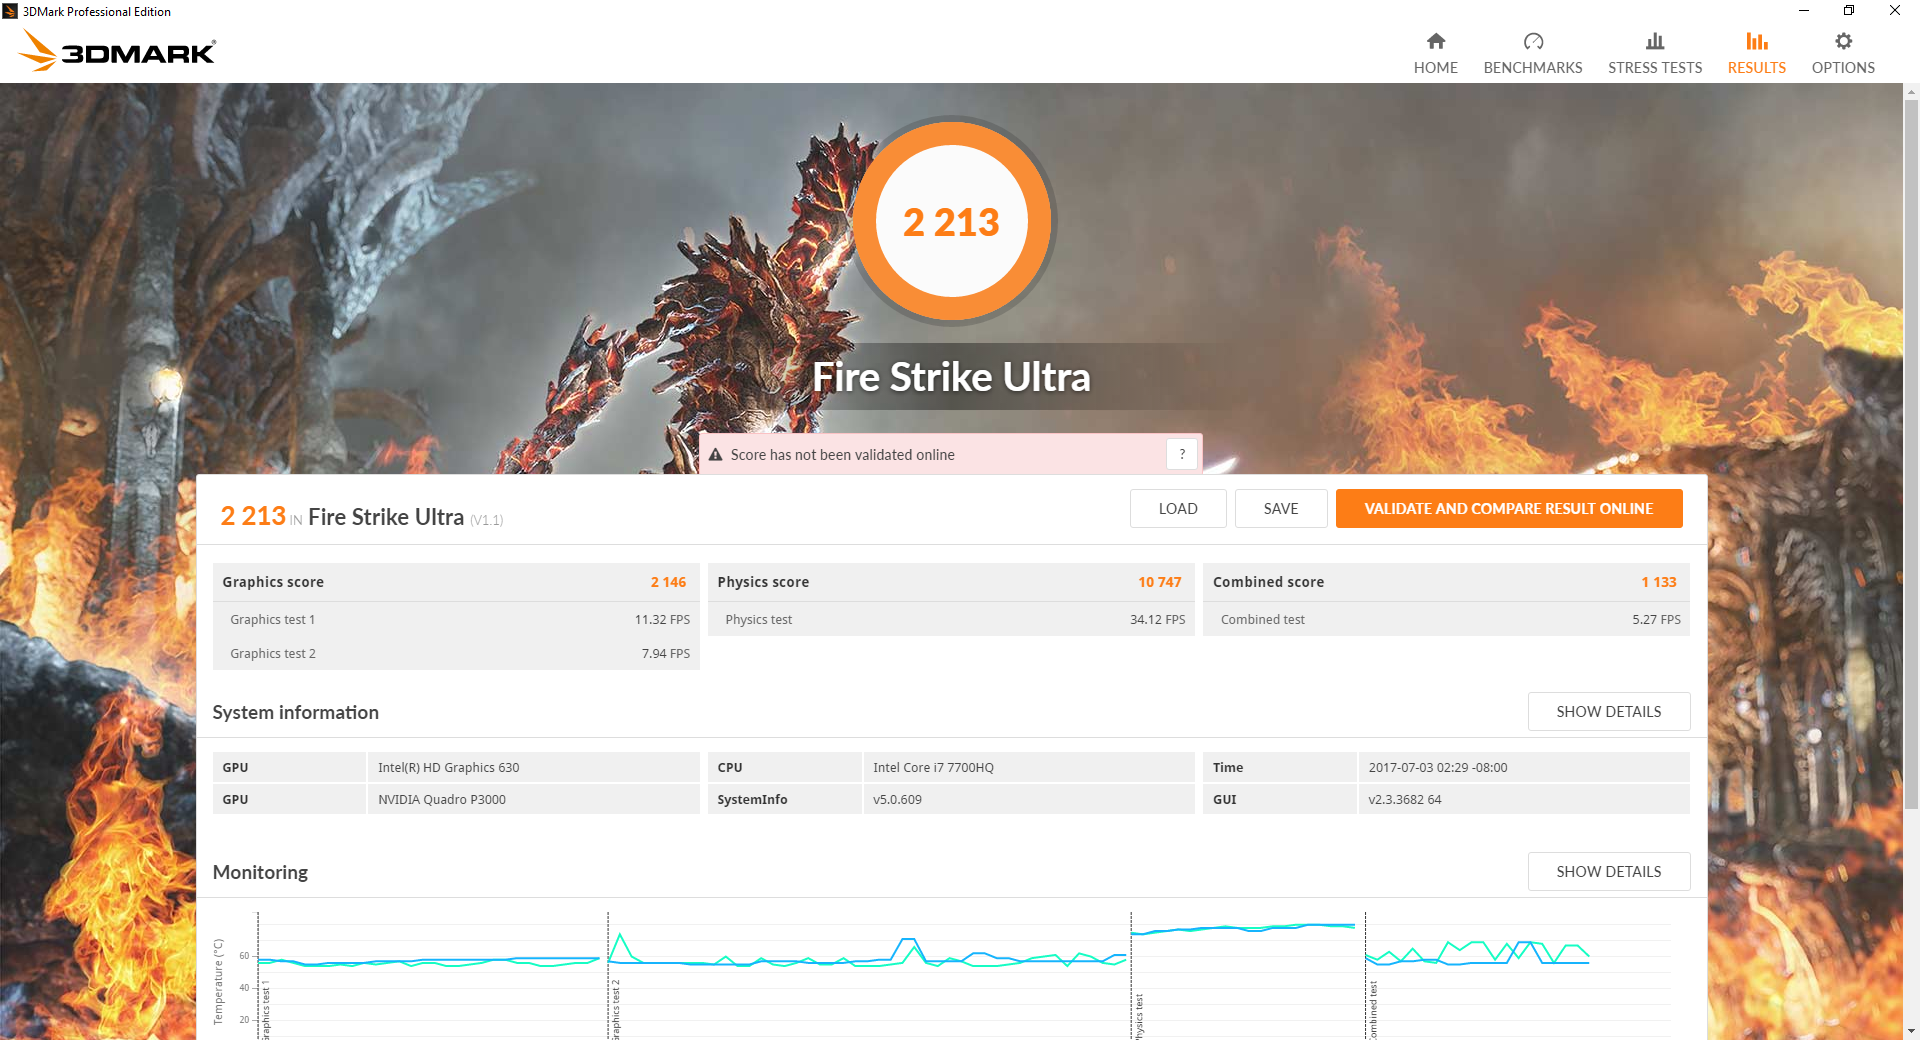
3DMark benchmarks rank the P3000 to be nearly identical to the GTX 980M. This represents a large 43 percent increase in raw graphics power over the M3000M that this particular Pascal GPU supplants and is even slightly faster than the flagship M5000M in the much larger MSI WT72. Interestingly, SpecViewPerf 12 shows the performance gap between the P3000 and M3000M to be slightly smaller overall with the M5000M outperforming it in some cases. The P4000 in the latest Celsius H970 brings an even greater performance advantage similar to the jump from a GTX 1060 to a GTX 1070.
Gaming performance sits comfortably between the GTX 1050 Ti and GTX 1060 to represent a significant jump from the M3000M. Though not its primary function, the P3000 is more than capable at playing modern titles at respectable 1080p settings.
See our dedicated page on the Quadro P3000 for more technical information and benchmark comparisons.
| Rise of the Tomb Raider - 1920x1080 Very High Preset AA:FX AF:16x | |
| EVGA SC15 | |
| Asus Strix GL502VY-DS71 | |
| MSI WS63 7RF-290US | |
| Lenovo ThinkPad P70-20ER000XUS | |
| Asus GL753VE-DS74 | |
| HP ZBook 17 G3 TZV66eA | |
| HP Pavilion 15 Power 1GK62AV | |
| low | med. | high | ultra | |
|---|---|---|---|---|
| BioShock Infinite (2013) | 92.1 | |||
| Metro: Last Light (2013) | 67.5 | |||
| Thief (2014) | 65 | |||
| The Witcher 3 (2015) | 66 | 33 | ||
| Batman: Arkham Knight (2015) | 73 | 49 | ||
| Metal Gear Solid V (2015) | 60 | |||
| Fallout 4 (2015) | 51.9 | |||
| Rise of the Tomb Raider (2016) | 53.6 | |||
| Ashes of the Singularity (2016) | 52.5 | 47.8 | ||
| Doom (2016) | 73 | |||
| Overwatch (2016) | 89.9 | |||
| Mafia 3 (2016) | 36.5 | |||
| Prey (2017) | 89.3 |
Stress Test
We stress the notebook to identify for any potential throttling or stability issues. If only under Prime95 stress, the CPU can run steady at 3.1 to 3.2 GHz against a base clock rate of 2.8 GHz. This is compared to the same processor in the EVGA SC15 that can maintain a slightly higher clock rate of 3.4 GHz when under similar conditions. Turbo Boost potential is more limiting on the WS63 likely due to its more delicate balance between fan noise and processor performance compared to the larger SC15. Running both Prime95 and FurMark to stress the CPU and GPU simultaneously will bring CPU temperatures as high as 95 C with a cycling clock rate between 2.8 GHz and 3.2 GHz. It's good to see that the CPU will not throttle even if under extreme conditions and within such a thin chassis design, but a more consistent clock rate is always preferable. GPU temperature remains remarkably cool for a notebook under stress at just 72 C.
Running Witcher 3 is more representative of gaming loads compared to the conditions above. The CPU and GPU run at a steady 56 C and 58 C, respectively, with the GPU at a constant Boost clock rate of 1280 MHz against its base rate of 1088 MHz. CPU clock rates in particular remain steady at just 1.3 GHz to explain the quieter-than-expected fan noise in the next section below. Frame rates are steady with no significant dips even after running Witcher 3 for nearly an hour.
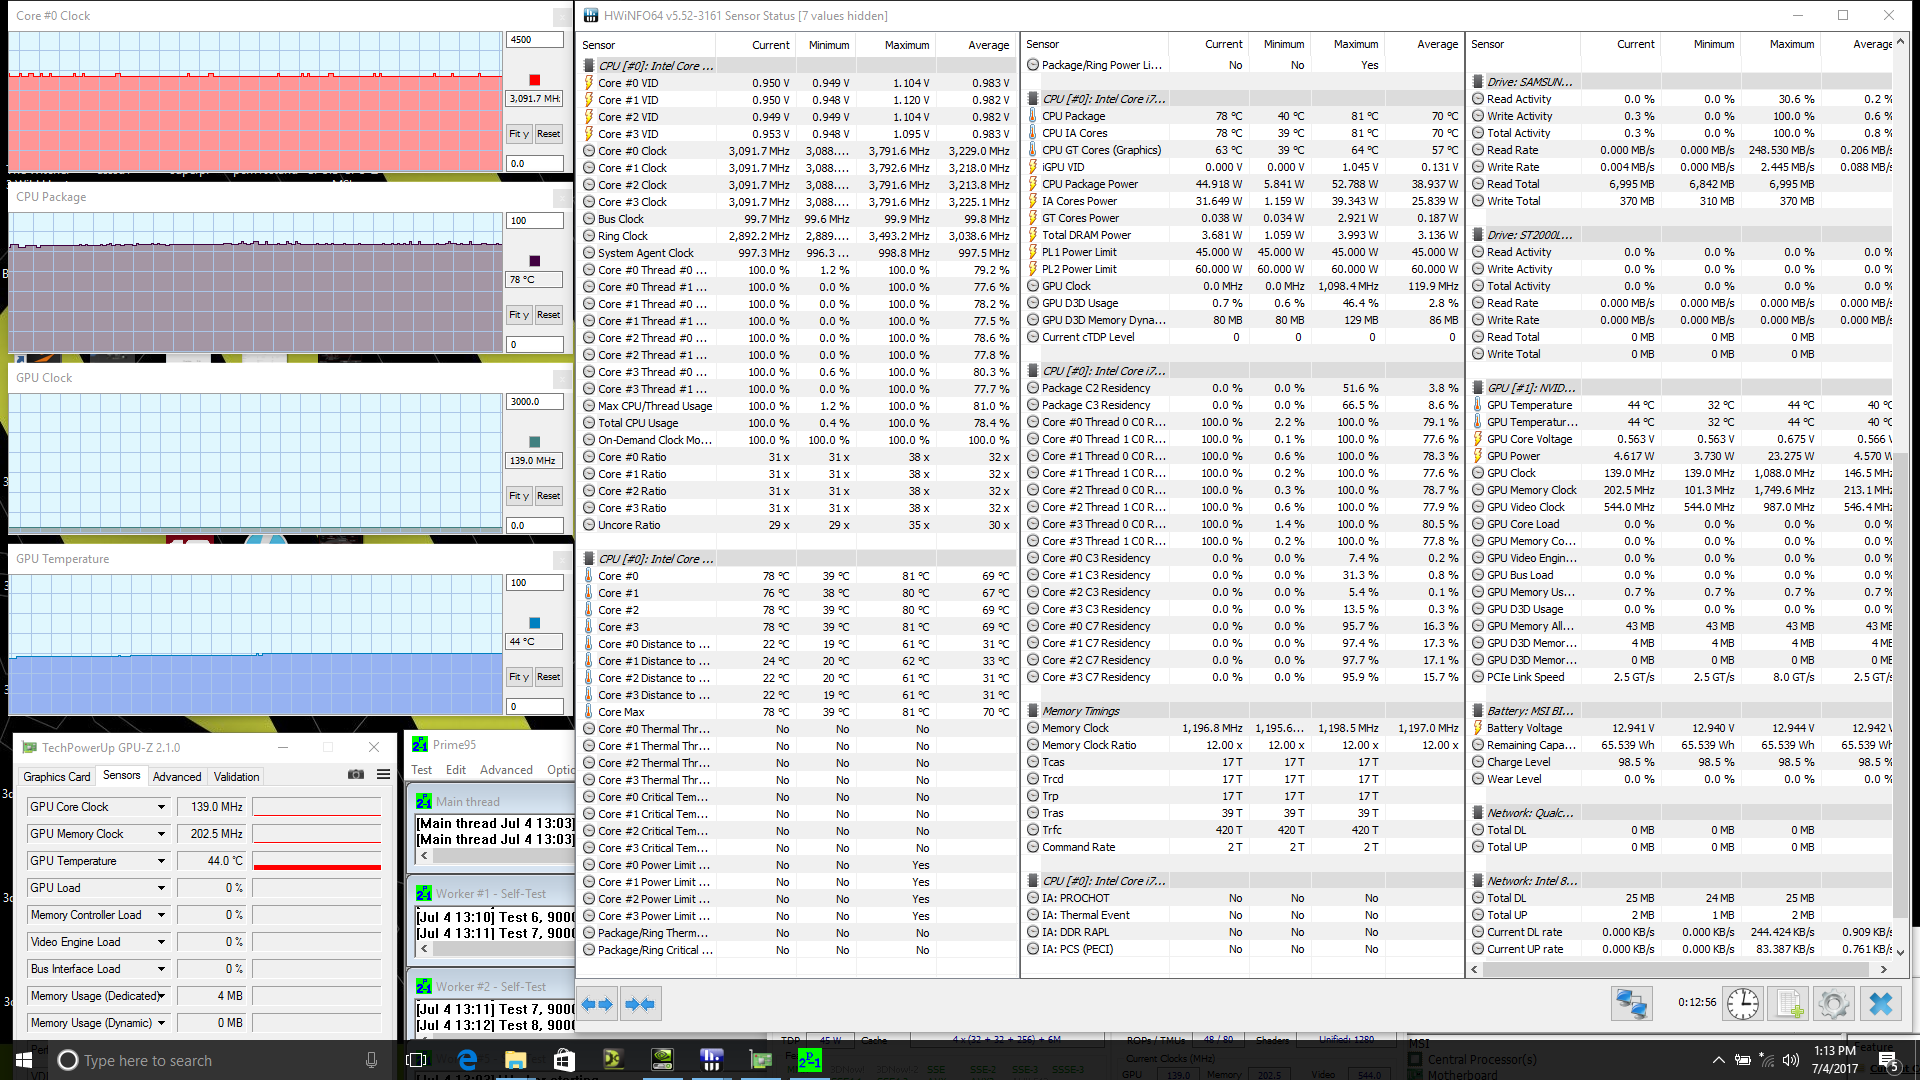
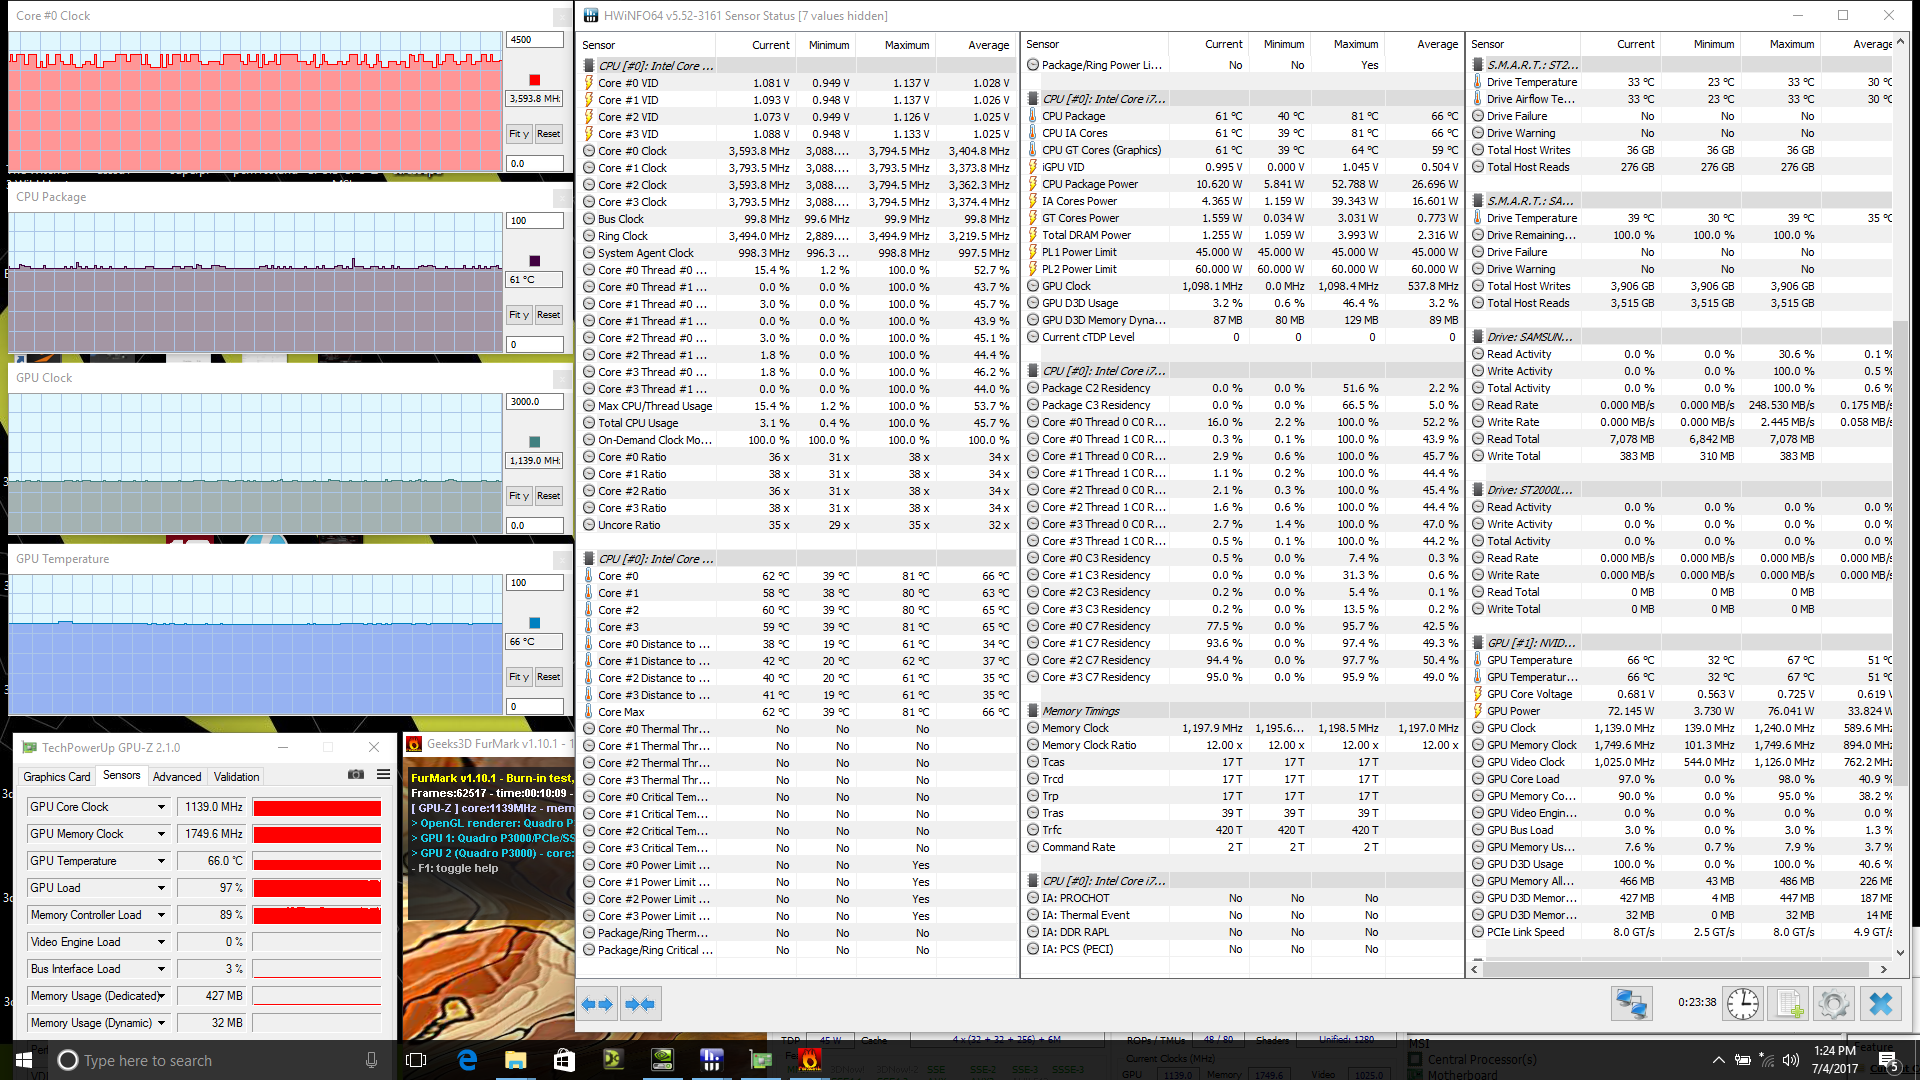
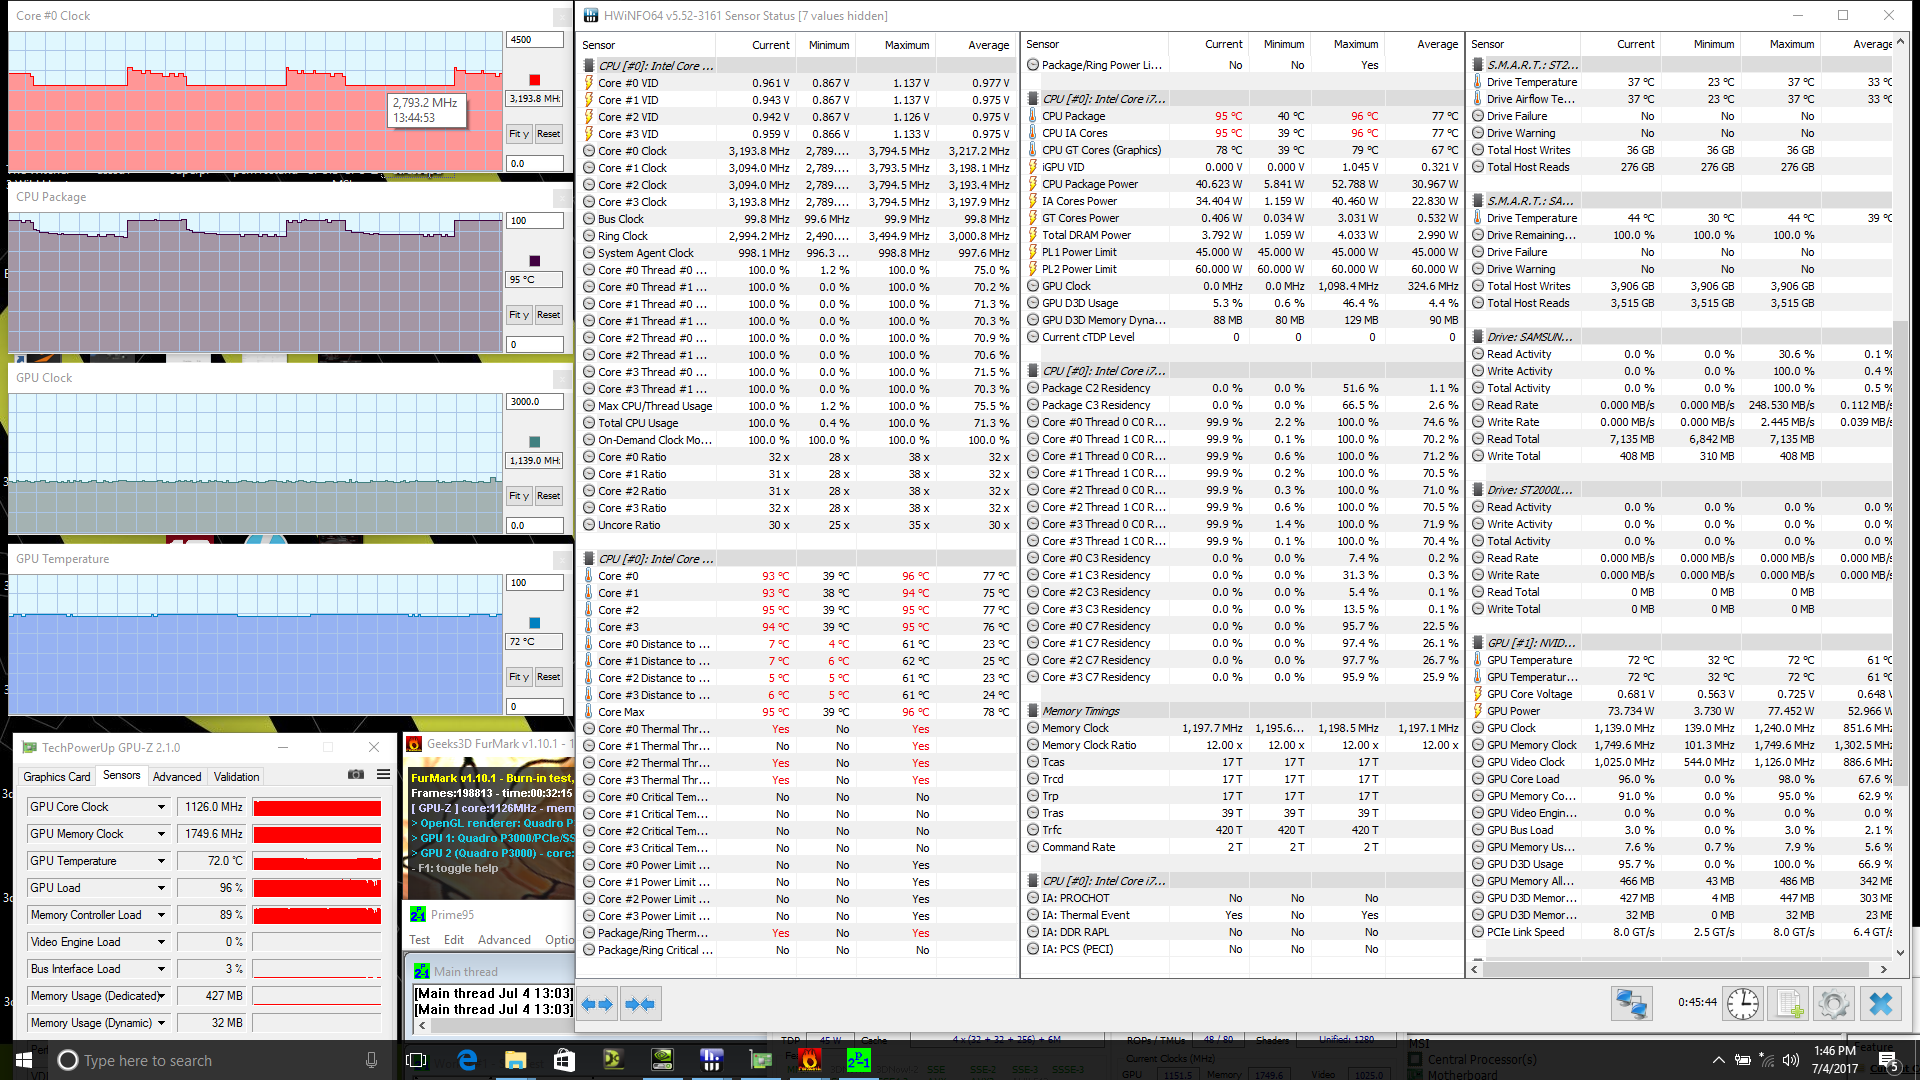
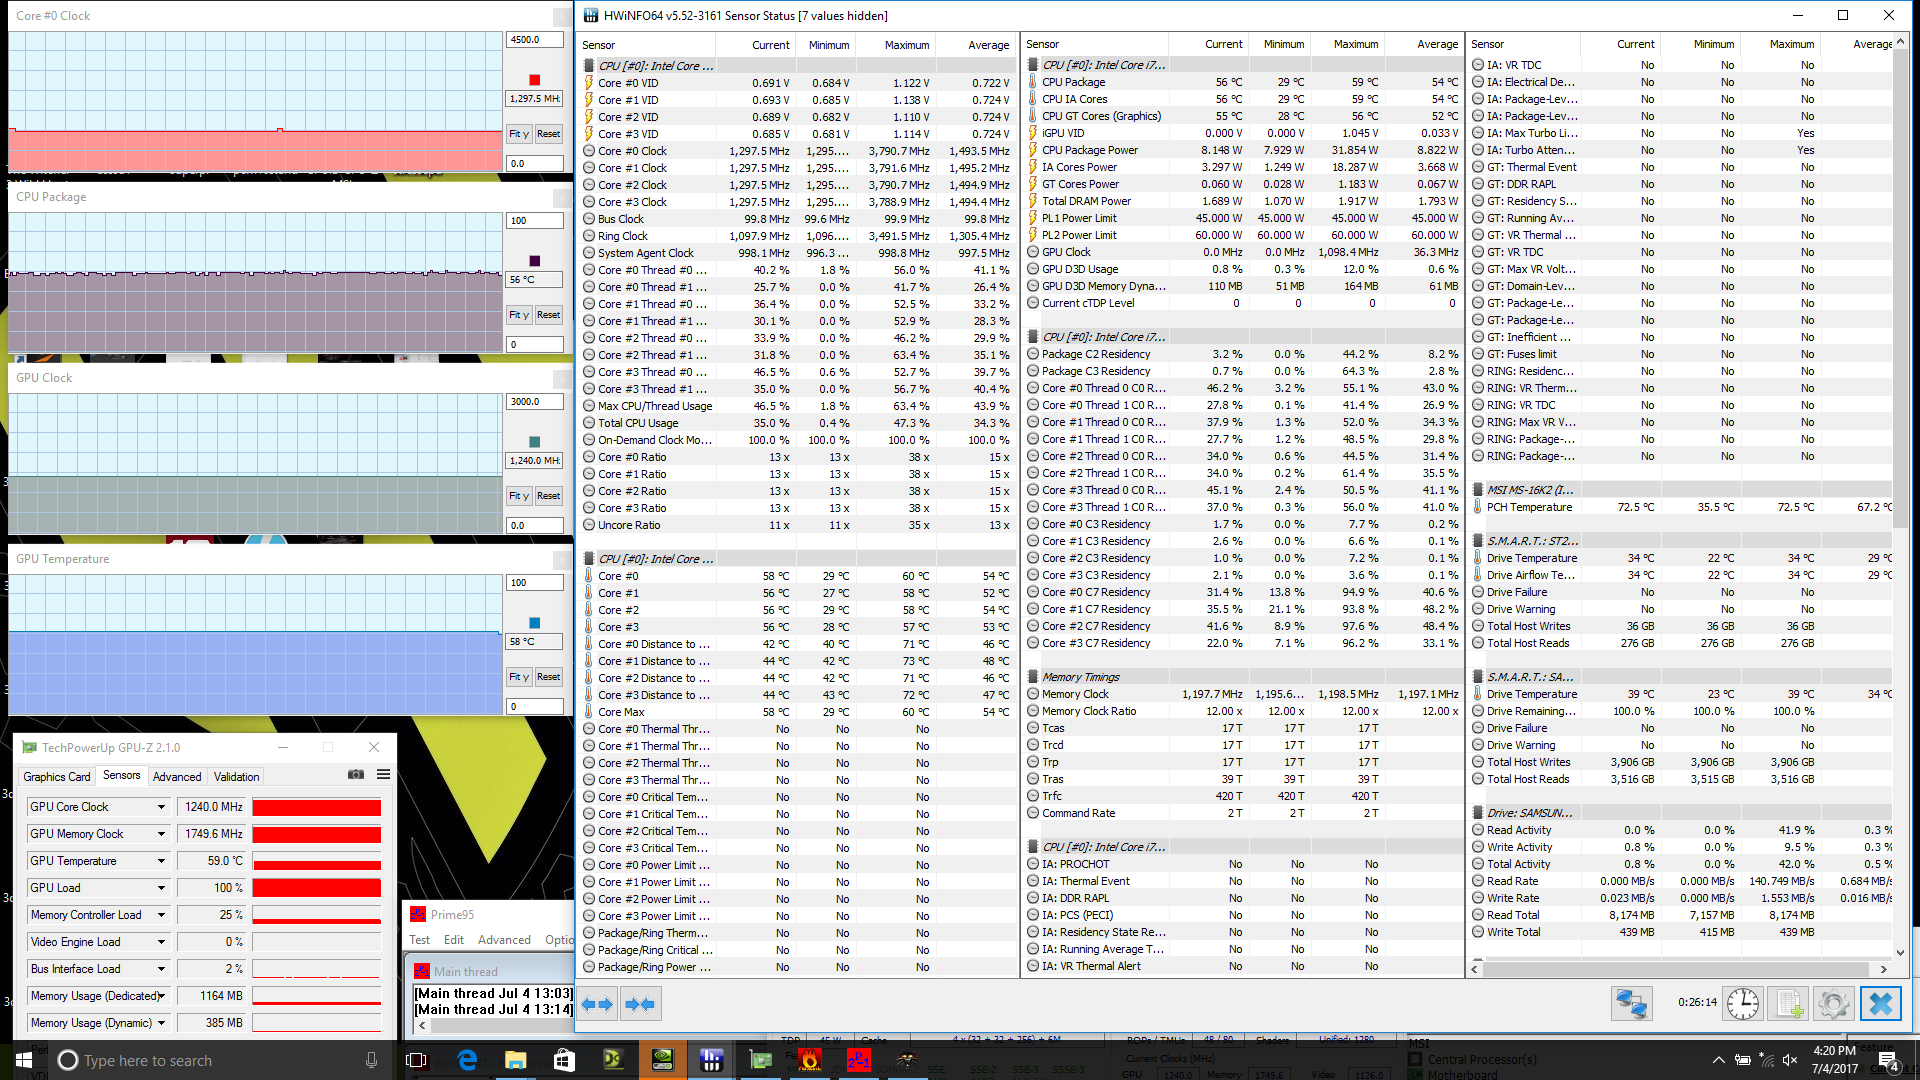
| CPU Clock (GHz) | GPU Clock (MHz) | Average CPU Temperature (°C) | Average GPU Temperature (°C) | |
| Prime95 Stress | 3.1 | -- | 78 | 44 |
| FurMark Stress | -- | 1139 | 61 | 66 |
| Prime95 + FurMark Stress | 2.8 - 3.2 | 1139 | 85 - 95 | 72 |
| Witcher 3 Stress | 1.3 | 1240 | 56 | 58 |
Emissions
System Noise
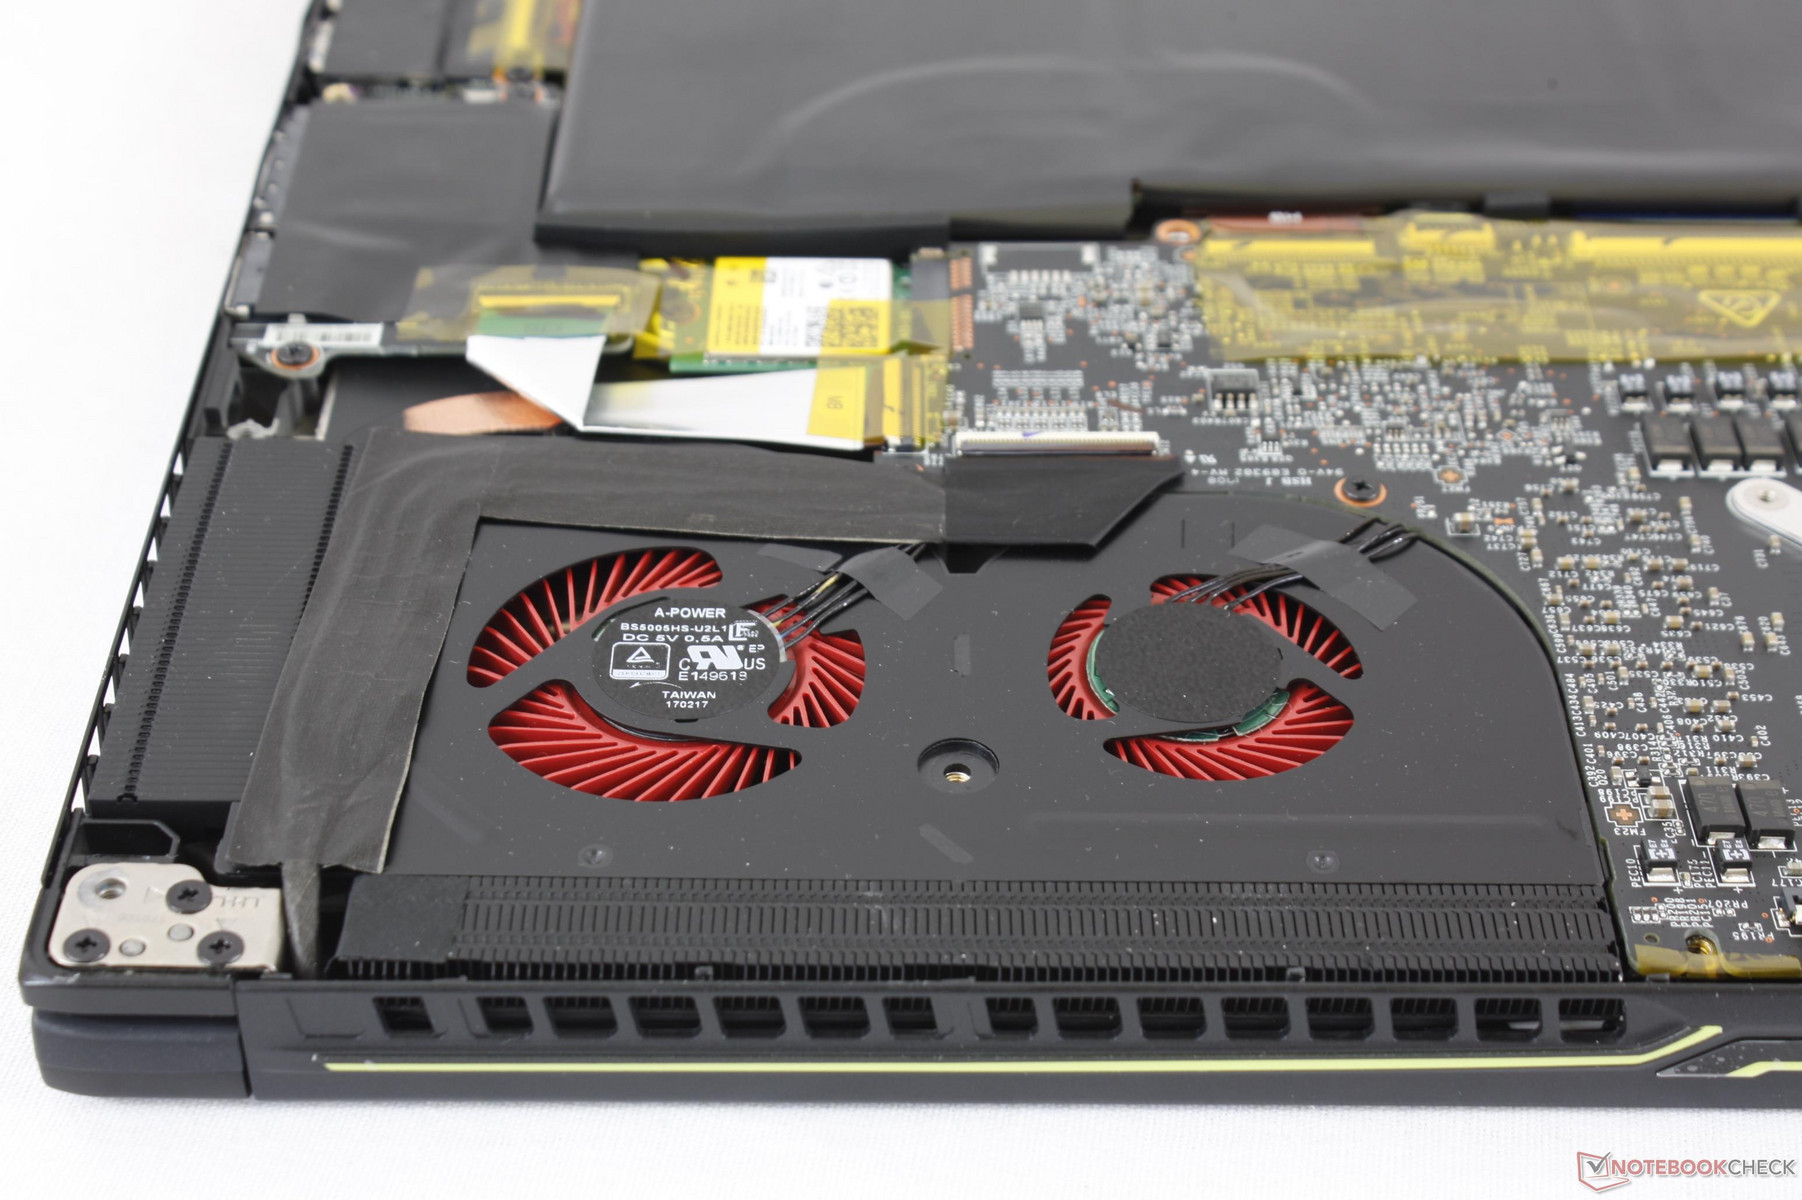
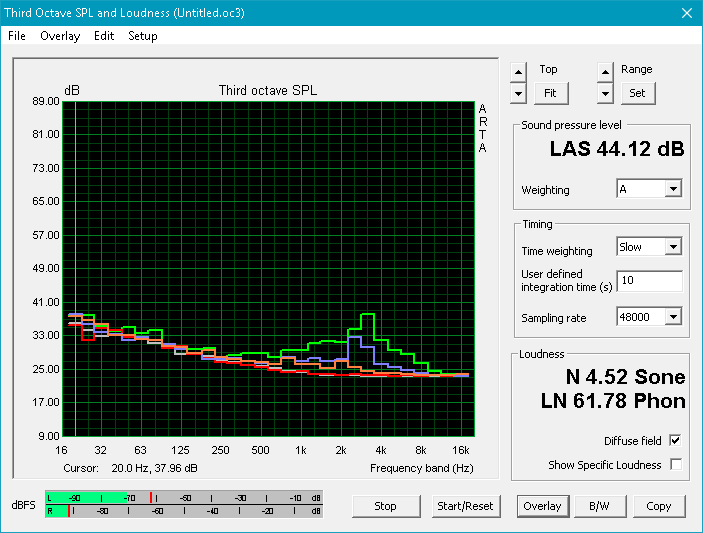
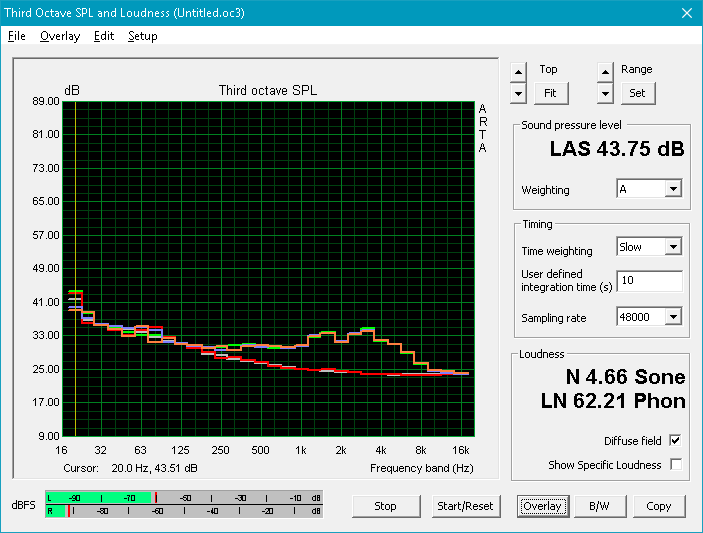
We've criticized the fan noise of the GS series in the past and the situation has improved somewhat on the WS63 since the P3000 operates at a slower clock rate than the GTX 1060. The system is almost never silent except after a cold boot and one of the three fans will always be active and audible at about 32 dB(A) no matter the profile setting. Fan noise jumps slightly if streaming video or browsing but will thankfully not pulsate and is generally consistent during everyday browsing loads.
Medium load with 3DMark06 will bump fan noise up to 38 dB(A) to be very similar to our past GS63VR test units. The interesting part, however, is that fan noise will actually be quieter at just 35.8 dB(A) when running Witcher 3. This may be due to the slower CPU and GPU clock rates as shown during our stress test section above when compared to dedicated gaming notebooks.
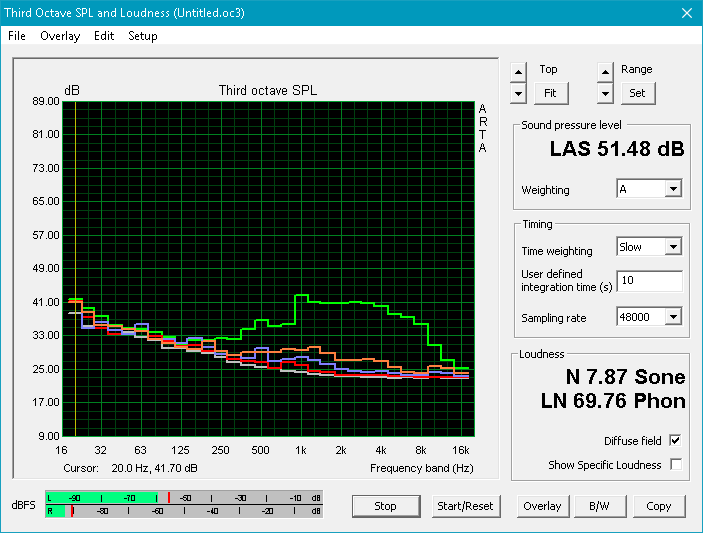
One thing to note of the WS63/GS63VR/GS73VR series is the higher-pitched fan noise. The addition of a third smaller fan may aid in reducing temperatures even further, but fan noise can be more noticeable than on other notebooks if assuming the same dB level because of the greater sound frequency. This is represented by the sharper frequency peaks from our fan noise measurements below and is a characteristic unique to the WS/GS series.
Electronic noise or coil whine was not present on our unit.
Noise level
| Idle |
| 28.1 / 28.1 / 32 dB(A) |
| Load |
| 38 / 47.2 dB(A) |
 | ||
30 dB silent 40 dB(A) audible 50 dB(A) loud |
||
min: | ||
| MSI WS63 7RF-290US Quadro P3000, i7-7700HQ, Samsung SM961 MZVKW512HMJP m.2 PCI-e | Lenovo ThinkPad P51 20HH0016GE Quadro M2200, E3-1505M v6, Samsung PM961 NVMe MZVLW512HMJP | Dell Precision 5520 UHD Quadro M1200, E3-1505M v6, Samsung SM961 MZVKW512HMJP m.2 PCI-e | MSI WS60-6QJE316H11 Quadro M2000M, E3-1505M v5, Toshiba NVMe THNSN5128GP | HP ZBook 15 G3 Quadro M2000M, E3-1505M v5, Samsung SM951 MZVPV512HDGL m.2 PCI-e | Fujitsu Celsius H760 Quadro M2000M, E3-1505M v5, Samsung SM951 MZVPV512 m.2 PCI-e | |
|---|---|---|---|---|---|---|
| Noise | 5% | -7% | -20% | -7% | -3% | |
| off / environment * (dB) | 28.1 | 29.6 -5% | 28.7 -2% | 30 -7% | 29 -3% | |
| Idle Minimum * (dB) | 28.1 | 29.6 -5% | 28.7 -2% | 37.2 -32% | 30 -7% | 29 -3% |
| Idle Average * (dB) | 28.1 | 29.6 -5% | 32.1 -14% | 37.2 -32% | 30 -7% | 29 -3% |
| Idle Maximum * (dB) | 32 | 29.6 7% | 32.1 -0% | 37.2 -16% | 30 6% | 29 9% |
| Load Average * (dB) | 38 | 32.2 15% | 41.3 -9% | 42.1 -11% | 45.3 -19% | 43.1 -13% |
| Witcher 3 ultra * (dB) | 35.8 | 45.5 -27% | ||||
| Load Maximum * (dB) | 47.2 | 36.6 22% | 45.5 4% | 50.7 -7% | 49.7 -5% | 49.2 -4% |
* ... smaller is better
Temperature
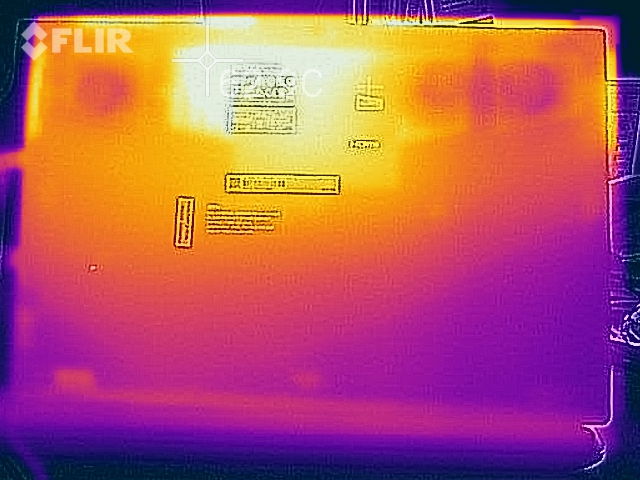
Surface temperatures are flat with no notable hot spots when idling on desktop. When under maximum load, temperatures are unsurprisingly similar to our previous GS63VR model given that the P3000 is an offshoot of the GTX 1060. Certain areas of the keyboard can be as warm 46 C while the underside of the system can get significantly warmer at over 60 C. Surfaces will never become this hot when simply browsing or streaming, but expect warmer temperatures than the ThinkPad P51 and ZBook 15 G3 especially around the palm rests and keyboard.
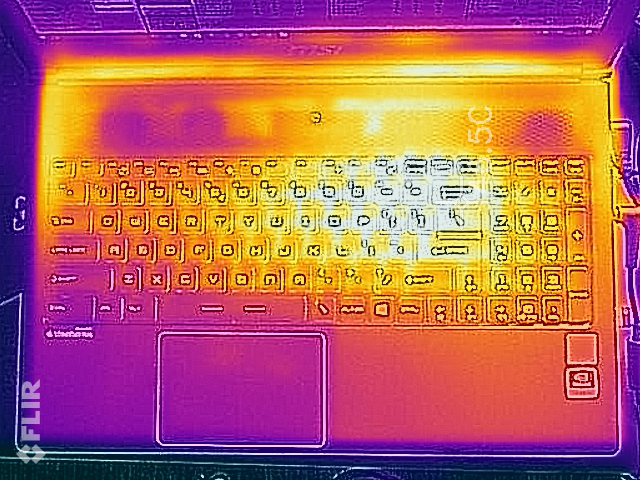
(-) The maximum temperature on the upper side is 46.4 °C / 116 F, compared to the average of 38.2 °C / 101 F, ranging from 22.2 to 69.8 °C for the class Workstation.
(-) The bottom heats up to a maximum of 62 °C / 144 F, compared to the average of 41.1 °C / 106 F
(+) In idle usage, the average temperature for the upper side is 27.2 °C / 81 F, compared to the device average of 32 °C / 90 F.
(±) Playing The Witcher 3, the average temperature for the upper side is 36.2 °C / 97 F, compared to the device average of 32 °C / 90 F.
(±) The palmrests and touchpad can get very hot to the touch with a maximum of 36.4 °C / 97.5 F.
(-) The average temperature of the palmrest area of similar devices was 27.8 °C / 82 F (-8.6 °C / -15.5 F).
Speakers
The internal stereo speakers lack bass and are treble heavy. Pink noise measurements show a poorer reproduction of the lower frequency ranges when compared to the Precision 5520 and larger GT72VR. Higher volume settings do not introduce any static or distracting reverberations of the surrounding chassis.
Hi-Fi audio output is supported via the same ESS Sabre DAC as found on the GS and GT series. We're not sure if professional graphic artists will ever require studio-grade high impedance headphones for work, but the option is here nevertheless.
")


MSI WS63 7RF-290US audio analysis
(-) | not very loud speakers (66.6 dB)
Bass 100 - 315 Hz
(-) | nearly no bass - on average 17.1% lower than median
(±) | linearity of bass is average (11.9% delta to prev. frequency)
Mids 400 - 2000 Hz
(±) | higher mids - on average 6.4% higher than median
(-) | mids are not linear (15.4% delta to prev. frequency)
Highs 2 - 16 kHz
(+) | balanced highs - only 4.8% away from median
(±) | linearity of highs is average (10.8% delta to prev. frequency)
Overall 100 - 16.000 Hz
(-) | overall sound is not linear (35.1% difference to median)
Compared to same class
» 99% of all tested devices in this class were better, 1% similar, 0% worse
» The best had a delta of 7%, average was 17%, worst was 35%
Compared to all devices tested
» 93% of all tested devices were better, 1% similar, 6% worse
» The best had a delta of 4%, average was 24%, worst was 134%
Apple MacBook 12 (Early 2016) 1.1 GHz audio analysis
(+) | speakers can play relatively loud (83.6 dB)
Bass 100 - 315 Hz
(±) | reduced bass - on average 11.3% lower than median
(±) | linearity of bass is average (14.2% delta to prev. frequency)
Mids 400 - 2000 Hz
(+) | balanced mids - only 2.4% away from median
(+) | mids are linear (5.5% delta to prev. frequency)
Highs 2 - 16 kHz
(+) | balanced highs - only 2% away from median
(+) | highs are linear (4.5% delta to prev. frequency)
Overall 100 - 16.000 Hz
(+) | overall sound is linear (10.2% difference to median)
Compared to same class
» 7% of all tested devices in this class were better, 2% similar, 91% worse
» The best had a delta of 5%, average was 18%, worst was 53%
Compared to all devices tested
» 5% of all tested devices were better, 1% similar, 94% worse
» The best had a delta of 4%, average was 24%, worst was 134%
Frequency Comparison (Checkbox selectable!)
Graph 1: Pink Noise 100% Vol.; Graph 2: Audio off
Energy Management
Power Consumption
Power consumption under medium to high loads is slightly less than a GTX 1060-powered gaming notebook and generally more efficient than the WS60. Running 3DMark06 and Witcher 3 will draw about 80 W and 90 W, respectively, compared to 80 W to 120 W on the EVGA SC15 equipped with the same CPU and GPU. The WS63 is even more efficient than the Quadro M5000M-powered MSI WT72 even though the P3000 scores similarly in 3DMark benchmarks.
Maximum load with Prime95 and FurMark will draw about 162 W from a medium-sized power adapter (15.5 x 7.5 x 3.0 cm) rated for up to 180 W.
| Off / Standby | |
| Idle | |
| Load |
|
Key:
min: | |
| MSI WS63 7RF-290US i7-7700HQ, Quadro P3000, Samsung SM961 MZVKW512HMJP m.2 PCI-e, IPS, 1920x1080, 15.6" | MSI WS60-6QJE316H11 E3-1505M v5, Quadro M2000M, Toshiba NVMe THNSN5128GP, IPS, 3840x2160, 15.6" | EVGA SC15 i7-7700HQ, GeForce GTX 1060 Mobile, Toshiba NVMe THNSN5256GPU7, , 1920x1080, 15.6" | HP ZBook 17 G3 TZV66eA E3-1535M v5, Quadro M3000M, Samsung SM951 MZVPV256HDGL m.2 PCI-e, IPS, 1920x1080, 17.3" | MSI WT72-6QM E3-1505M v5, Quadro M5000M, Toshiba NVMe THNSN5256GPU7, IPS, 1920x1080, 17.3" | |
|---|---|---|---|---|---|
| Power Consumption | -59% | -57% | -0% | -79% | |
| Idle Minimum * (Watt) | 11 | 18.8 -71% | 25.8 -135% | 6.7 39% | 24.8 -125% |
| Idle Average * (Watt) | 14.2 | 29.6 -108% | 26.6 -87% | 12.5 12% | 29.7 -109% |
| Idle Maximum * (Watt) | 14.6 | 30.3 -108% | 26.7 -83% | 13.2 10% | 30.1 -106% |
| Load Average * (Watt) | 77.7 | 90.4 -16% | 80.3 -3% | 128.2 -65% | 105.2 -35% |
| Witcher 3 ultra * (Watt) | 89.1 | 121.2 -36% | |||
| Load Maximum * (Watt) | 161.7 | 150.2 7% | 159.3 1% | 158.9 2% | 192.2 -19% |
* ... smaller is better
Battery Life
Internal battery capacity is larger than on the WS60/GS60 and runtimes are subsequently longer. Users can expect just over 4.5 hours of real-world WLAN use and over 7 hours if simply idling on desktop at the lowest possible brightness setting. While a significant improvement over the previous generation, other thicker 15-inch workstations like the ThinkPad P51 and Celsius H760 have even larger batteries and slightly longer runtimes.
Charging from near empty to full capacity will take around 2.5 hours.
| MSI WS63 7RF-290US i7-7700HQ, Quadro P3000, 65 Wh | MSI WS60-6QJE316H11 E3-1505M v5, Quadro M2000M, 47 Wh | Lenovo ThinkPad P51 20HH0016GE E3-1505M v6, Quadro M2200, 90 Wh | Dell Precision 5520 UHD E3-1505M v6, Quadro M1200, 97 Wh | MSI WT72-6QM E3-1505M v5, Quadro M5000M, Wh | HP ZBook 15 G3 E3-1505M v5, Quadro M2000M, 90 Wh | |
|---|---|---|---|---|---|---|
| Battery runtime | -50% | 70% | 14% | -3% | 60% | |
| Reader / Idle (h) | 7.1 | 2.7 -62% | 16.4 131% | 12.1 70% | 6.9 -3% | 13.7 93% |
| WiFi v1.3 (h) | 4.7 | 1.8 -62% | 6.9 47% | 4.2 -11% | 4.1 -13% | 6.4 36% |
| Load (h) | 1.2 | 0.9 -25% | 1.6 33% | 1 -17% | 1.3 8% | 1.8 50% |
Pros
Cons
Verdict
The traditional Dell Precision, Lenovo ThinkPad P, and HP ZBook series of mobile workstations are heavy and hulking designs. The MSI WS series dares to look the other way by offering something lighter and sleeker without sacrificing core performance. Nvidia's new Quadro P3000 makes the WS63 a compelling buy with its overall lower power consumption than a Quadro M5000M notebook while still offering nearly the same level of performance as a GTX 980M. It's almost shocking to see the new WS63 outperform last year's ZBook 15 G3 that can cost thousands more. Professionals who desire GPU performance and portability above all else need not look any further.
Main drawbacks are predictable as the thin design and light weight naturally lead to fewer options. The chassis is more flexible, fan noise is higher-pitched, and serviceability is more difficult as one may expect given the smaller size. CPU temperatures are much warmer when under extreme loads and Turbo Boost speeds tend to fluctuate as a result. Not having a significantly brighter display than other workstations also seems like a missed opportunity since it would have made the already portable system an even better travel companion. We're hoping that future revisions will add options for full sRGB or AdobeRGB support on top of Xeon CPU and ECC RAM features to push the WS series deeper into the workstation category.
The WS63 is quite the jump from the WS60 from a performance and design standpoint. It's still light on certain features and continues to feel more like a workstation-gaming hybrid rather than a full-on workstation.
MSI WS63 7RF-290US
- 07/09/2017 v6 (old)
Allen Ngo
Price comparison
