HP Pavilion 15 Power (i7-7700HQ, GTX 1050) Laptop Review
The Pavilion 15 Power is an evolution of both the Pavilion 15t and Pavilion 15z. Its HQ-class Kaby Lake processor and GTX 1050 GPU target mainstream gamers and heavy multimedia users who would rather not spend a little more on the HP Omen series or the similarly equipped Dell XPS 15 9560 or Lenovo Yoga 720.
Current configurations start for as low as $680 USD with the i5-7300HQ CPU, AMD Radeon RX 550 GPU, 6 GB RAM, 1080p IPS display, and 1 TB HDD and can go up to $1650 USD if configured with the i7-7700HQ, GTX 1050 GPU, 16 GB RAM, 4K UHD IPS display, and 256 GB NVMe SSD. Our test system today is the higher-end option but with the 1080p display and standard M.2 SSD for roughly $1000 USD as provided by Cukusa.com. See our existing reviews on previous Pavilion systems for more information on the series.
Case
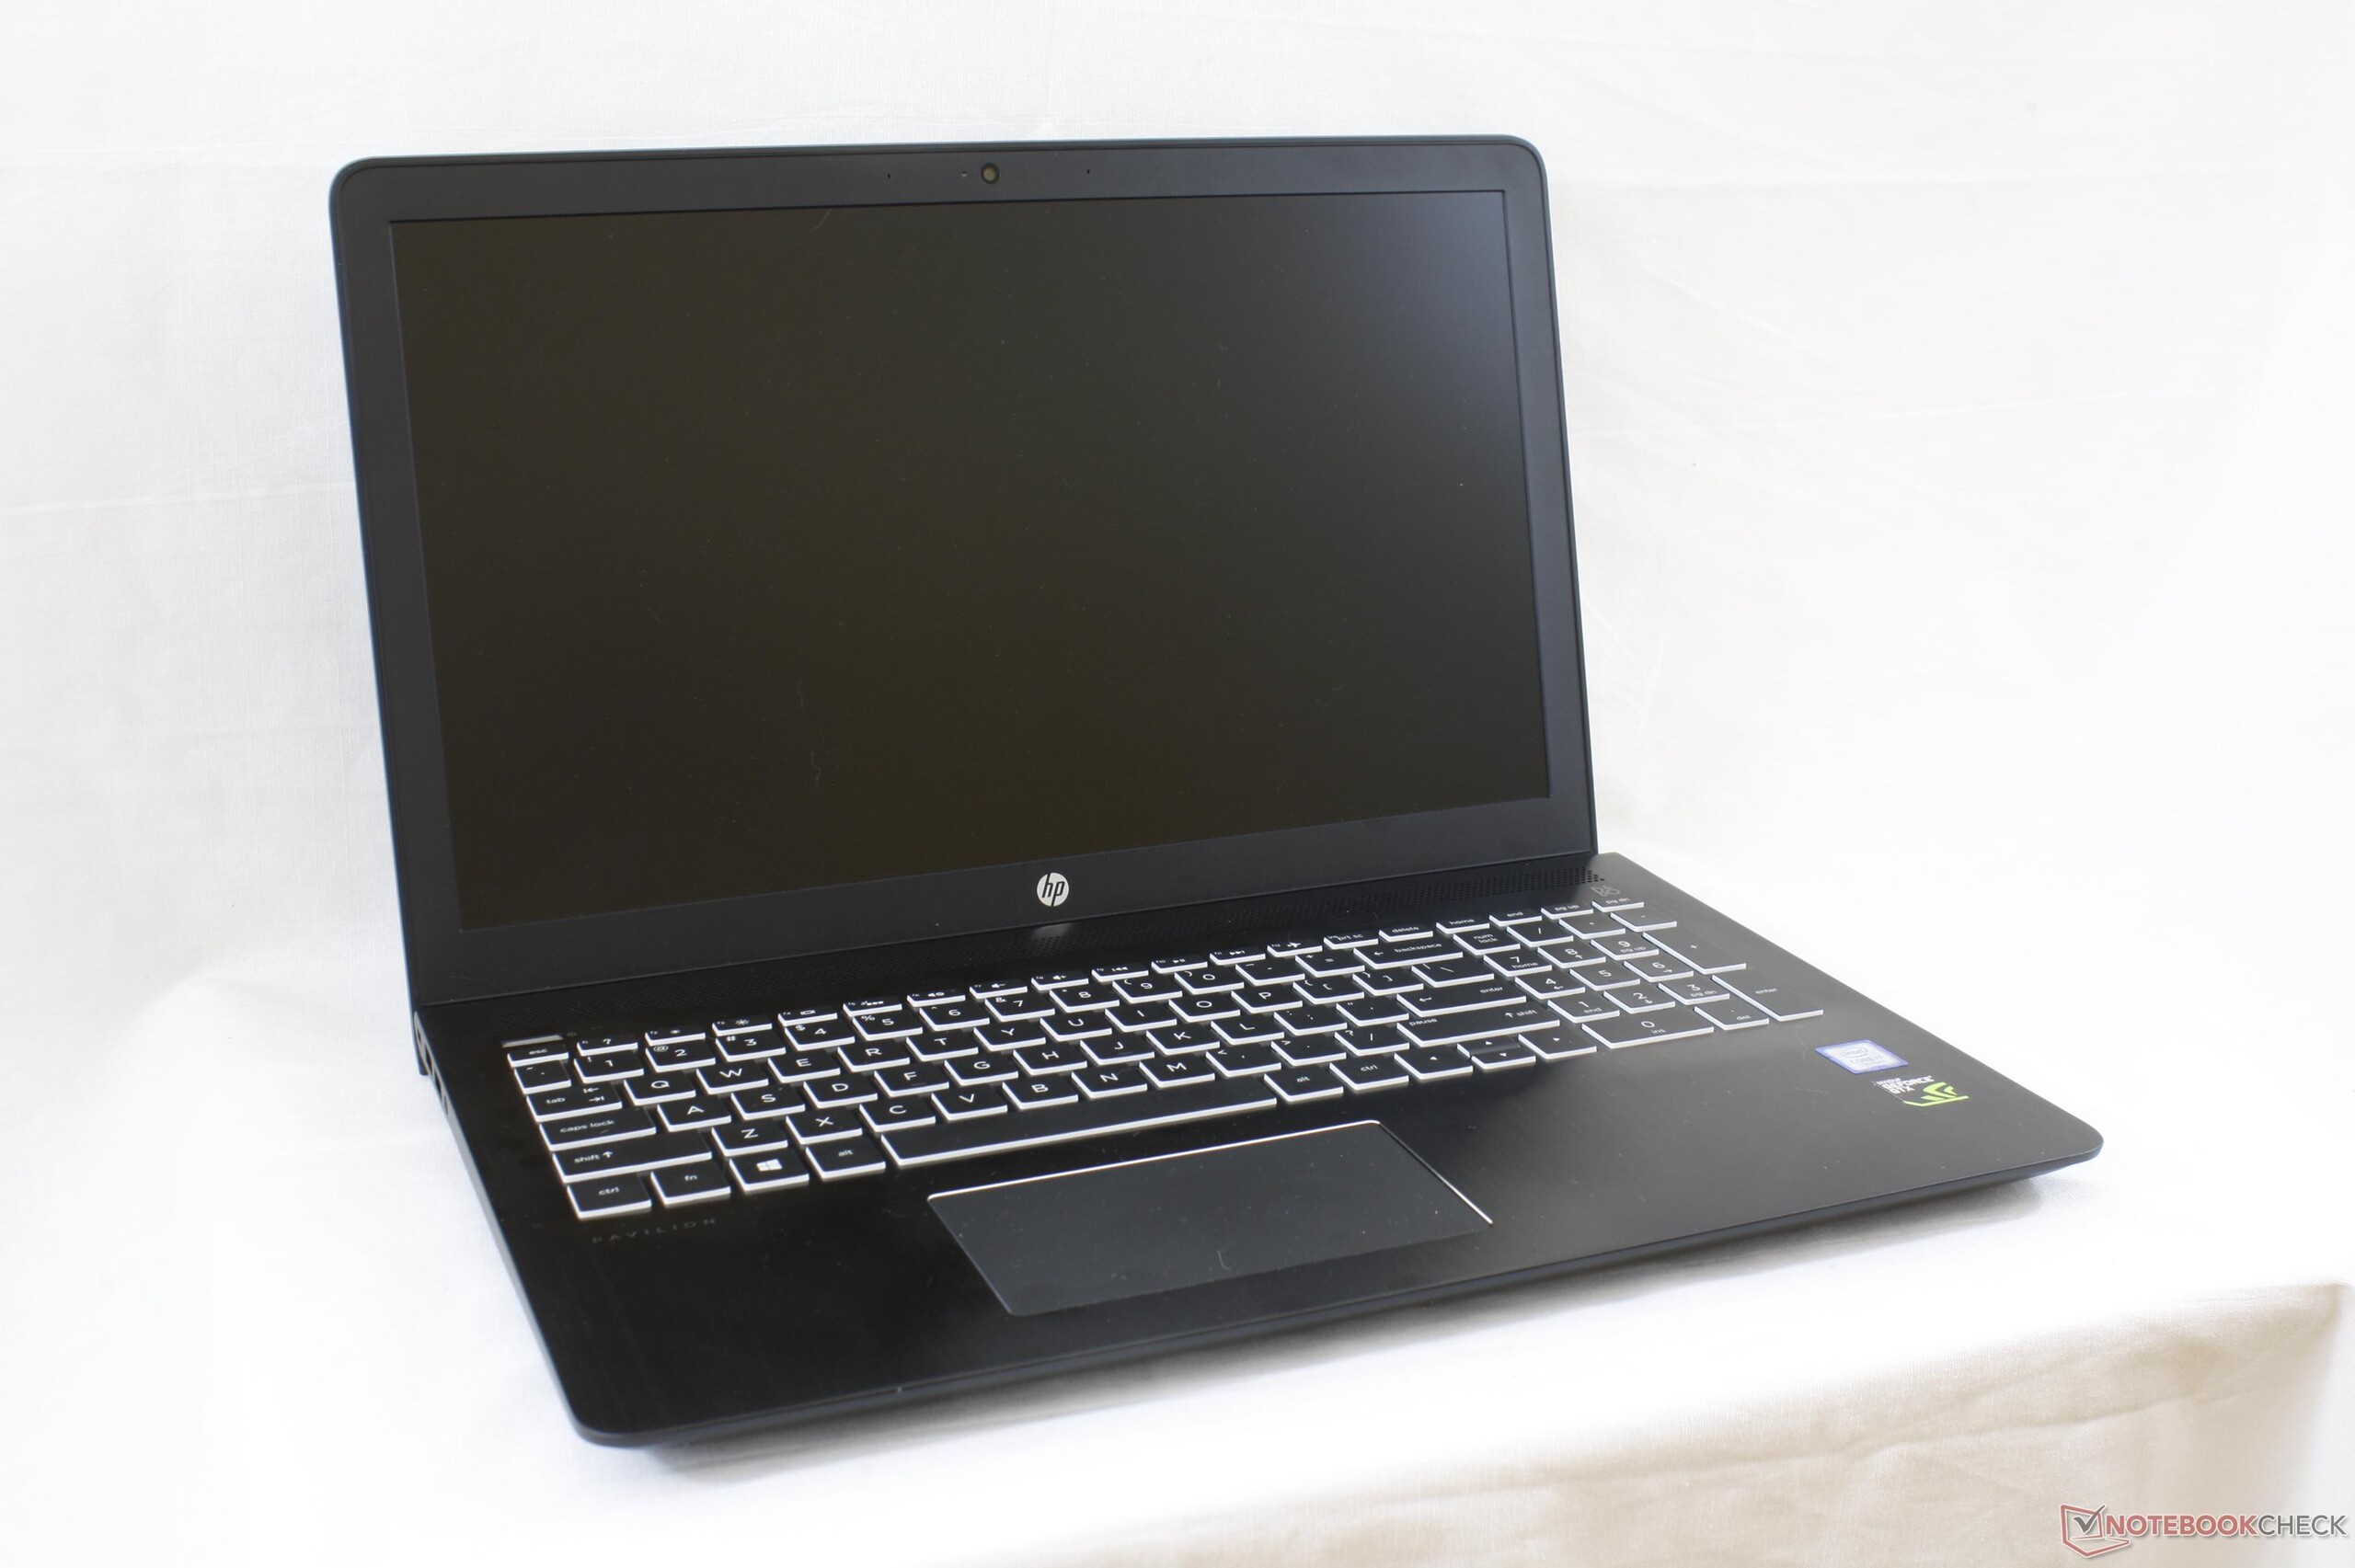
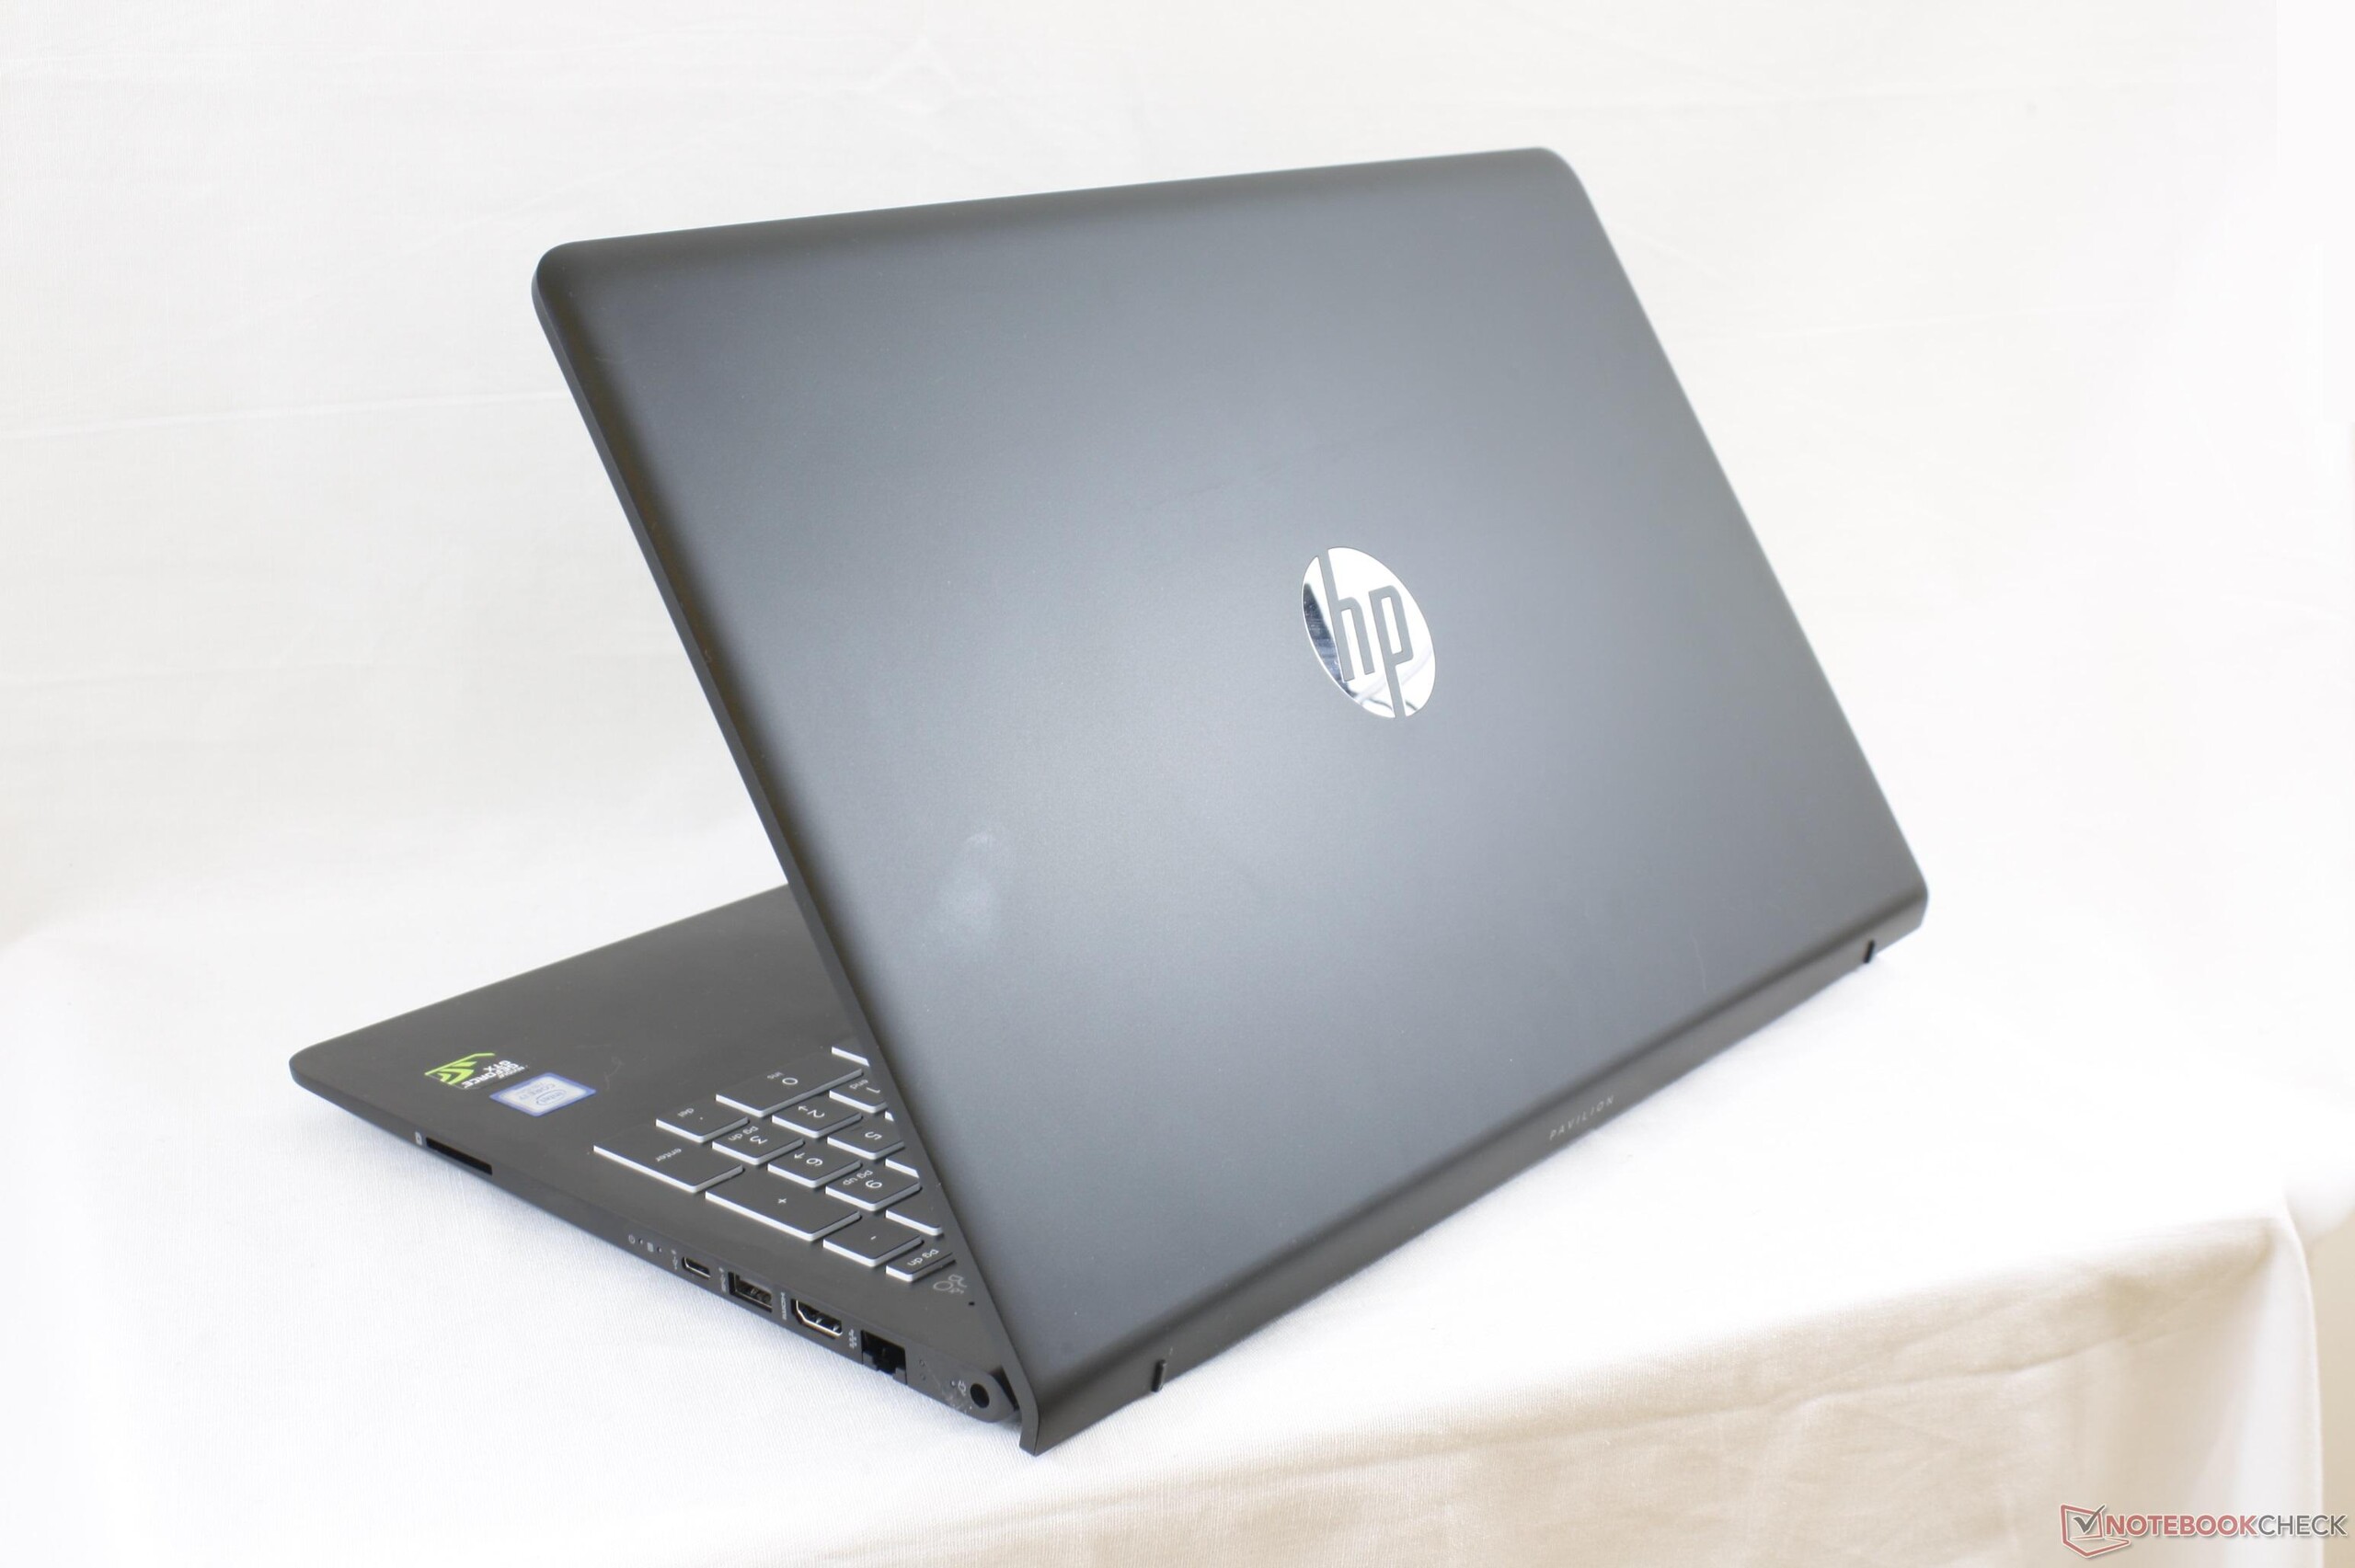
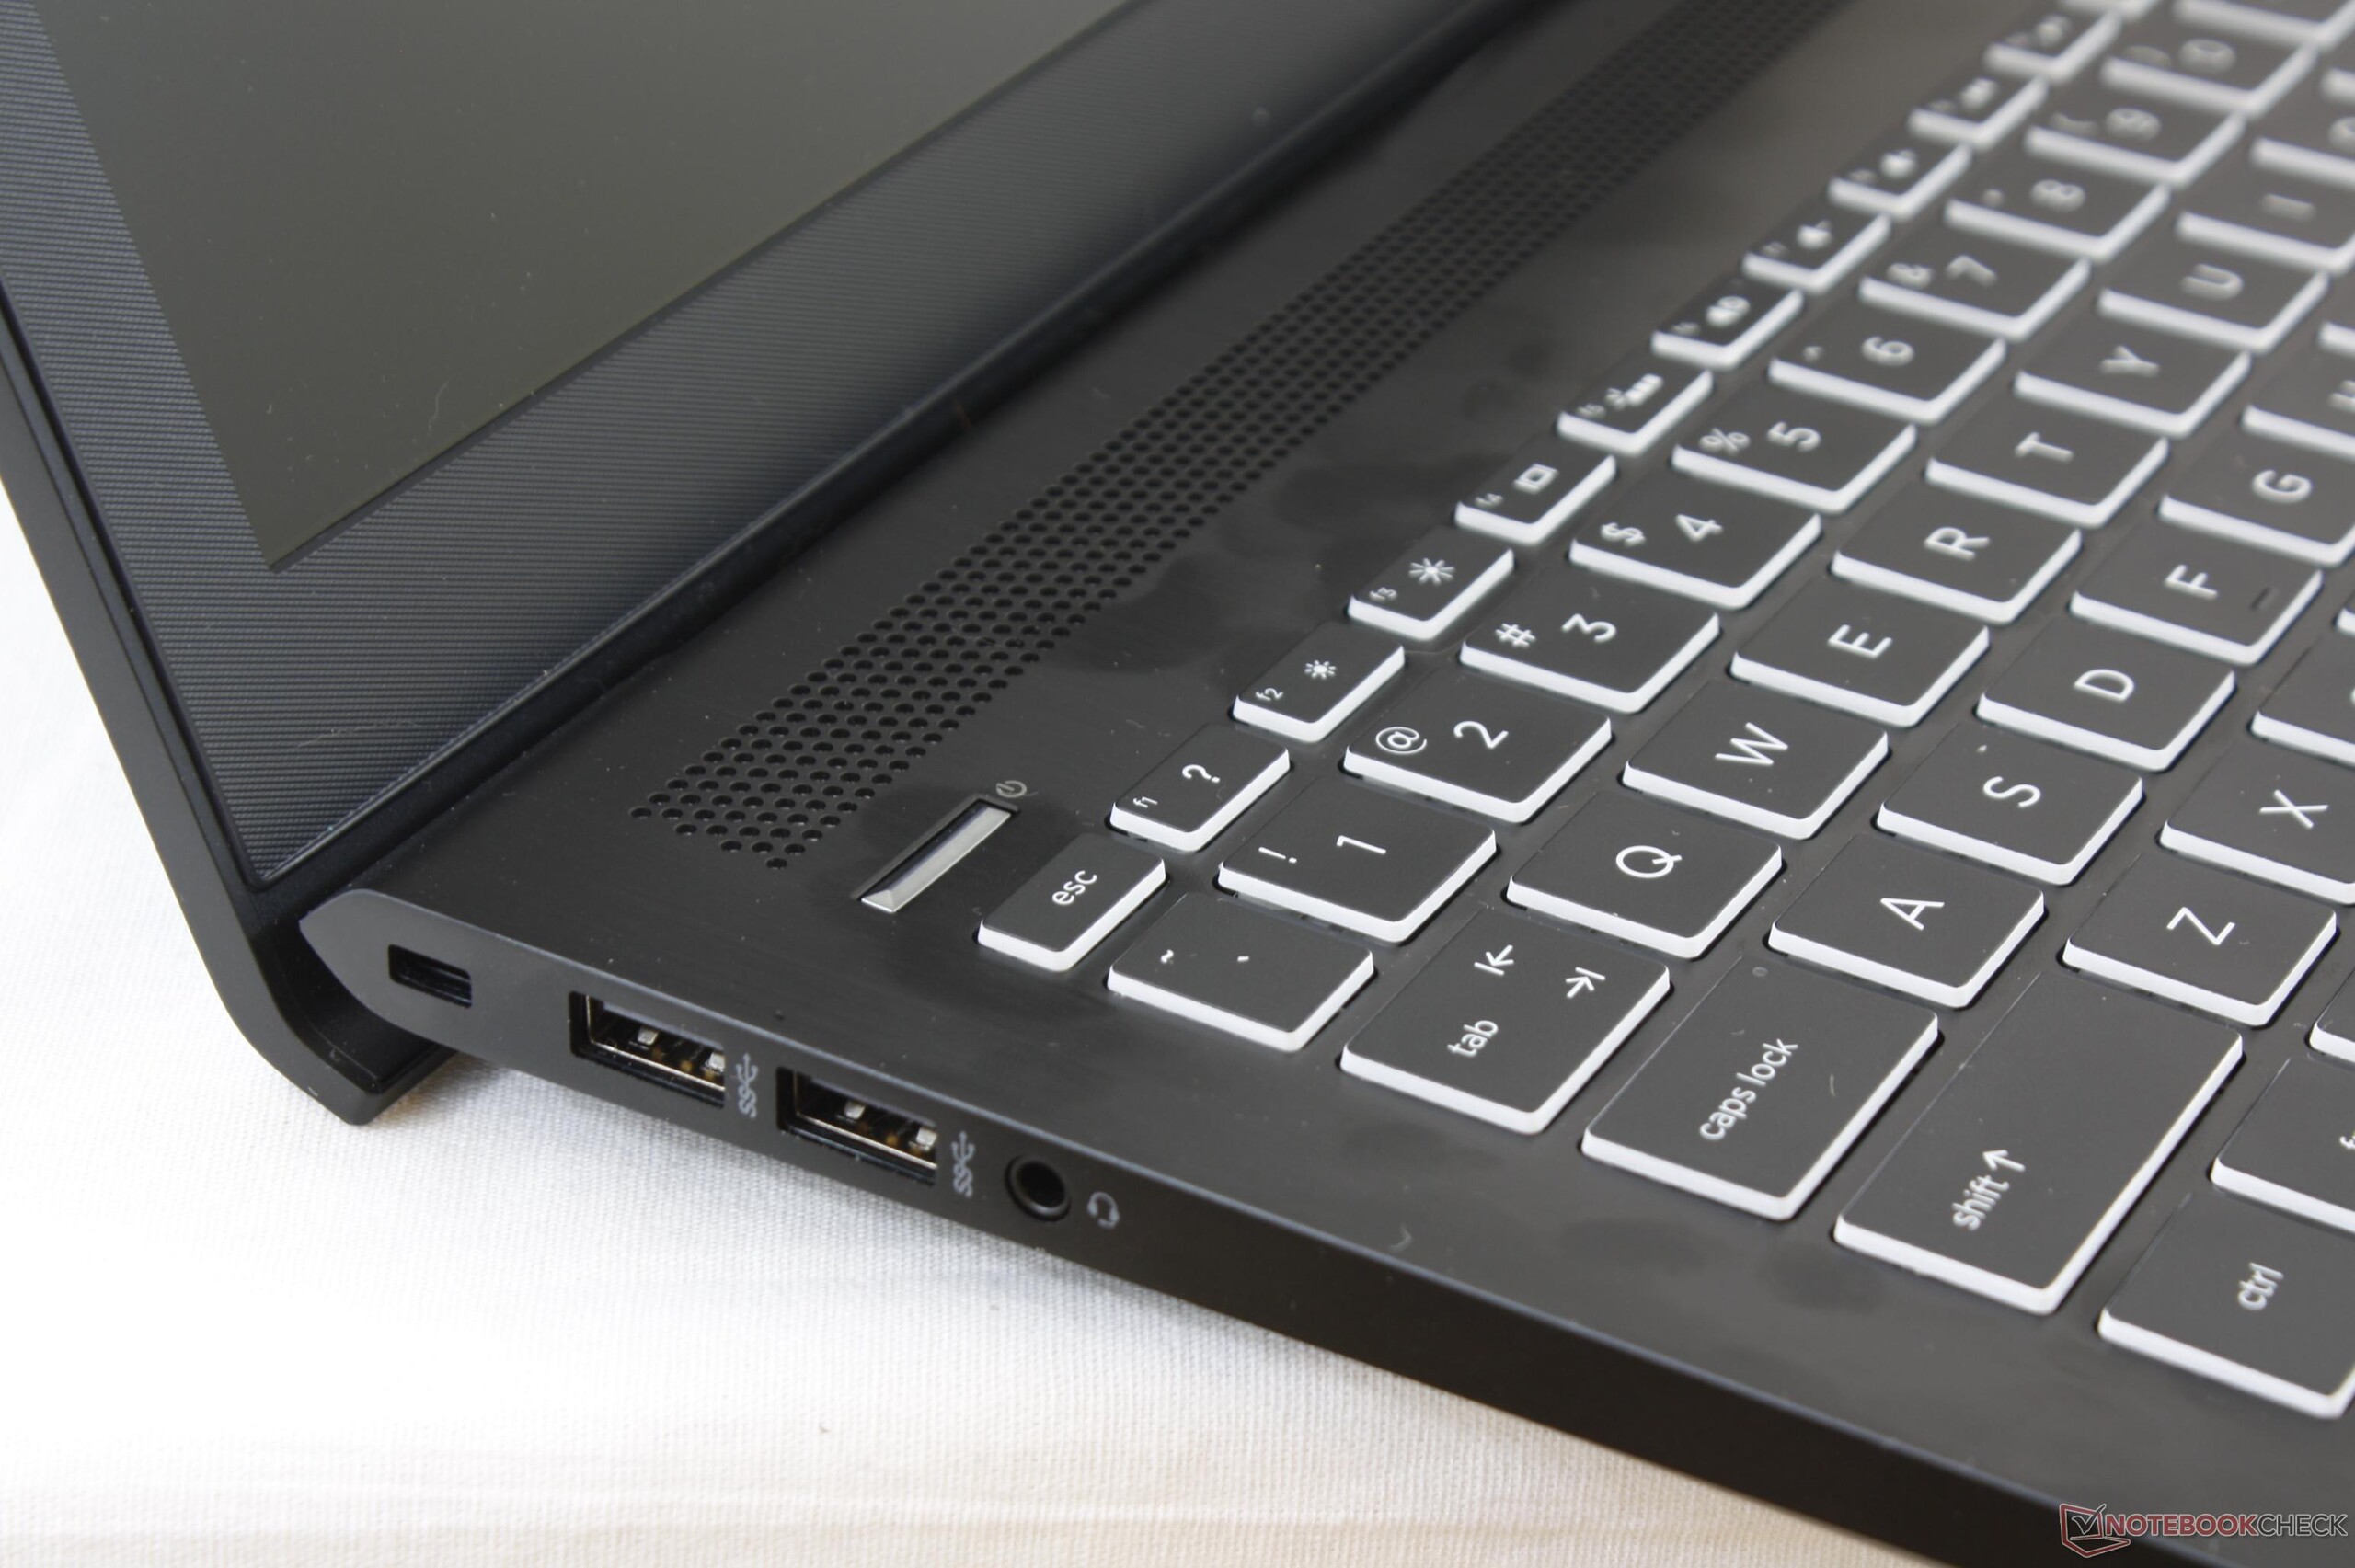
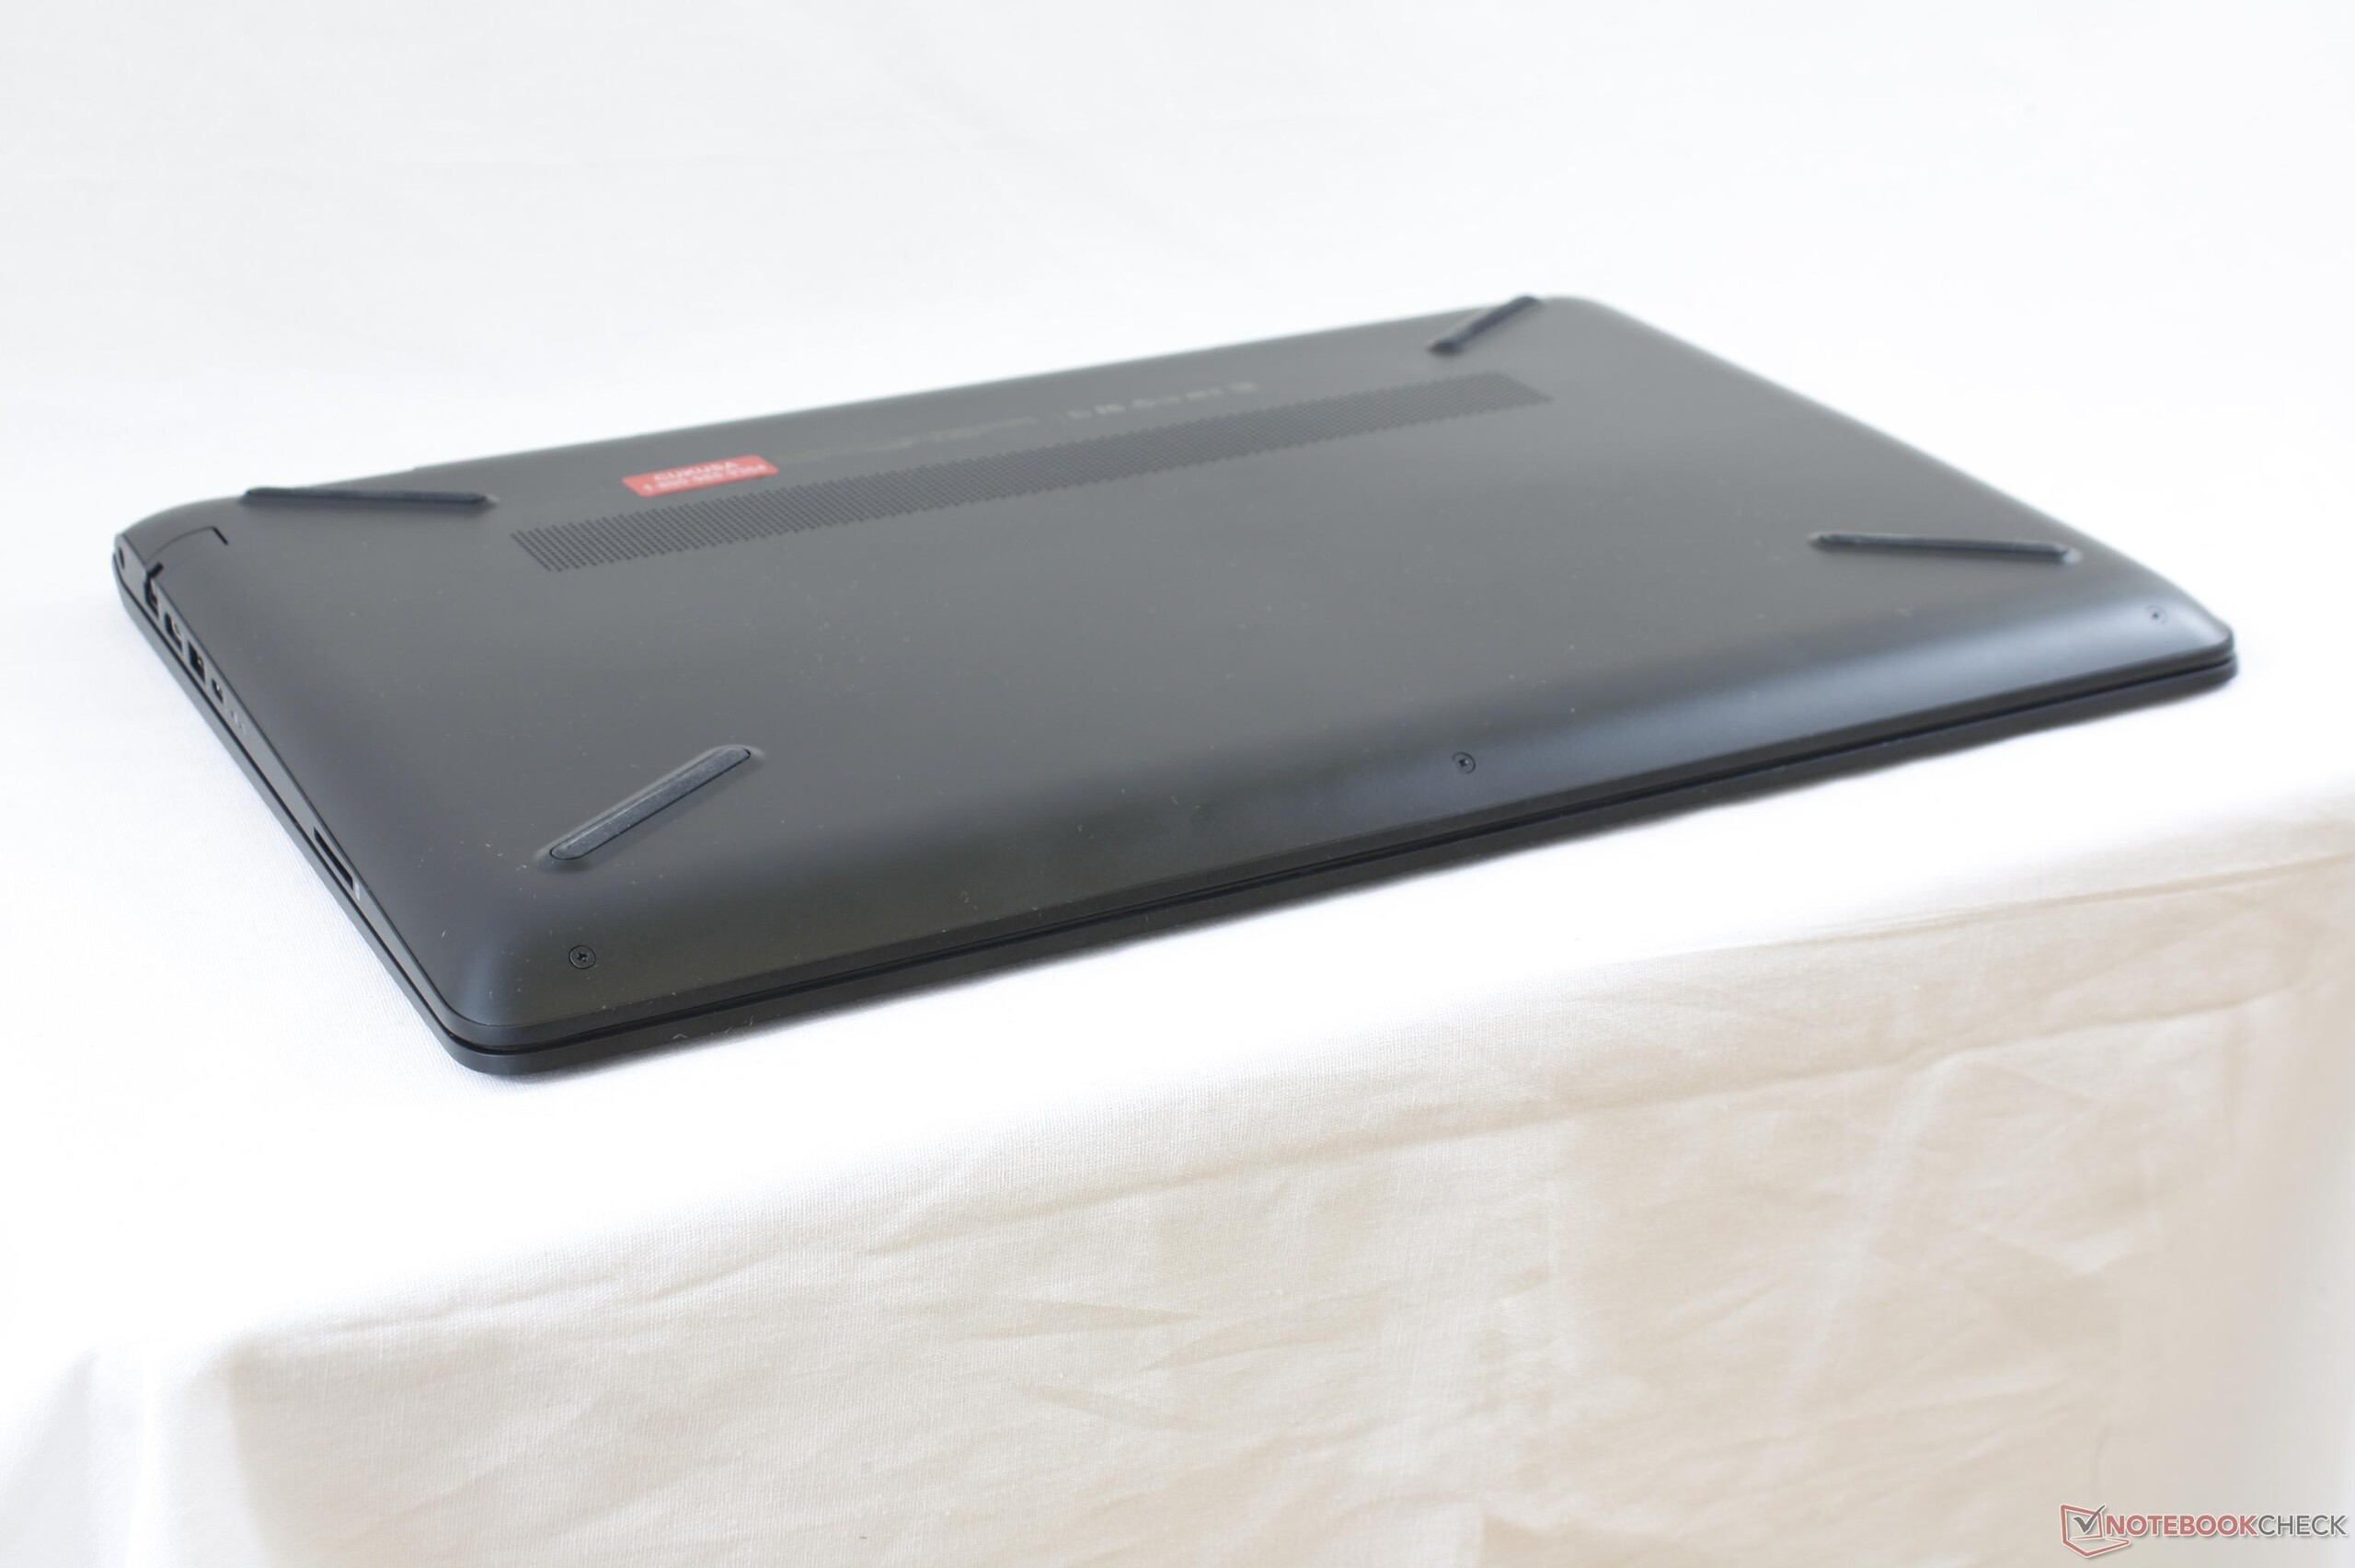
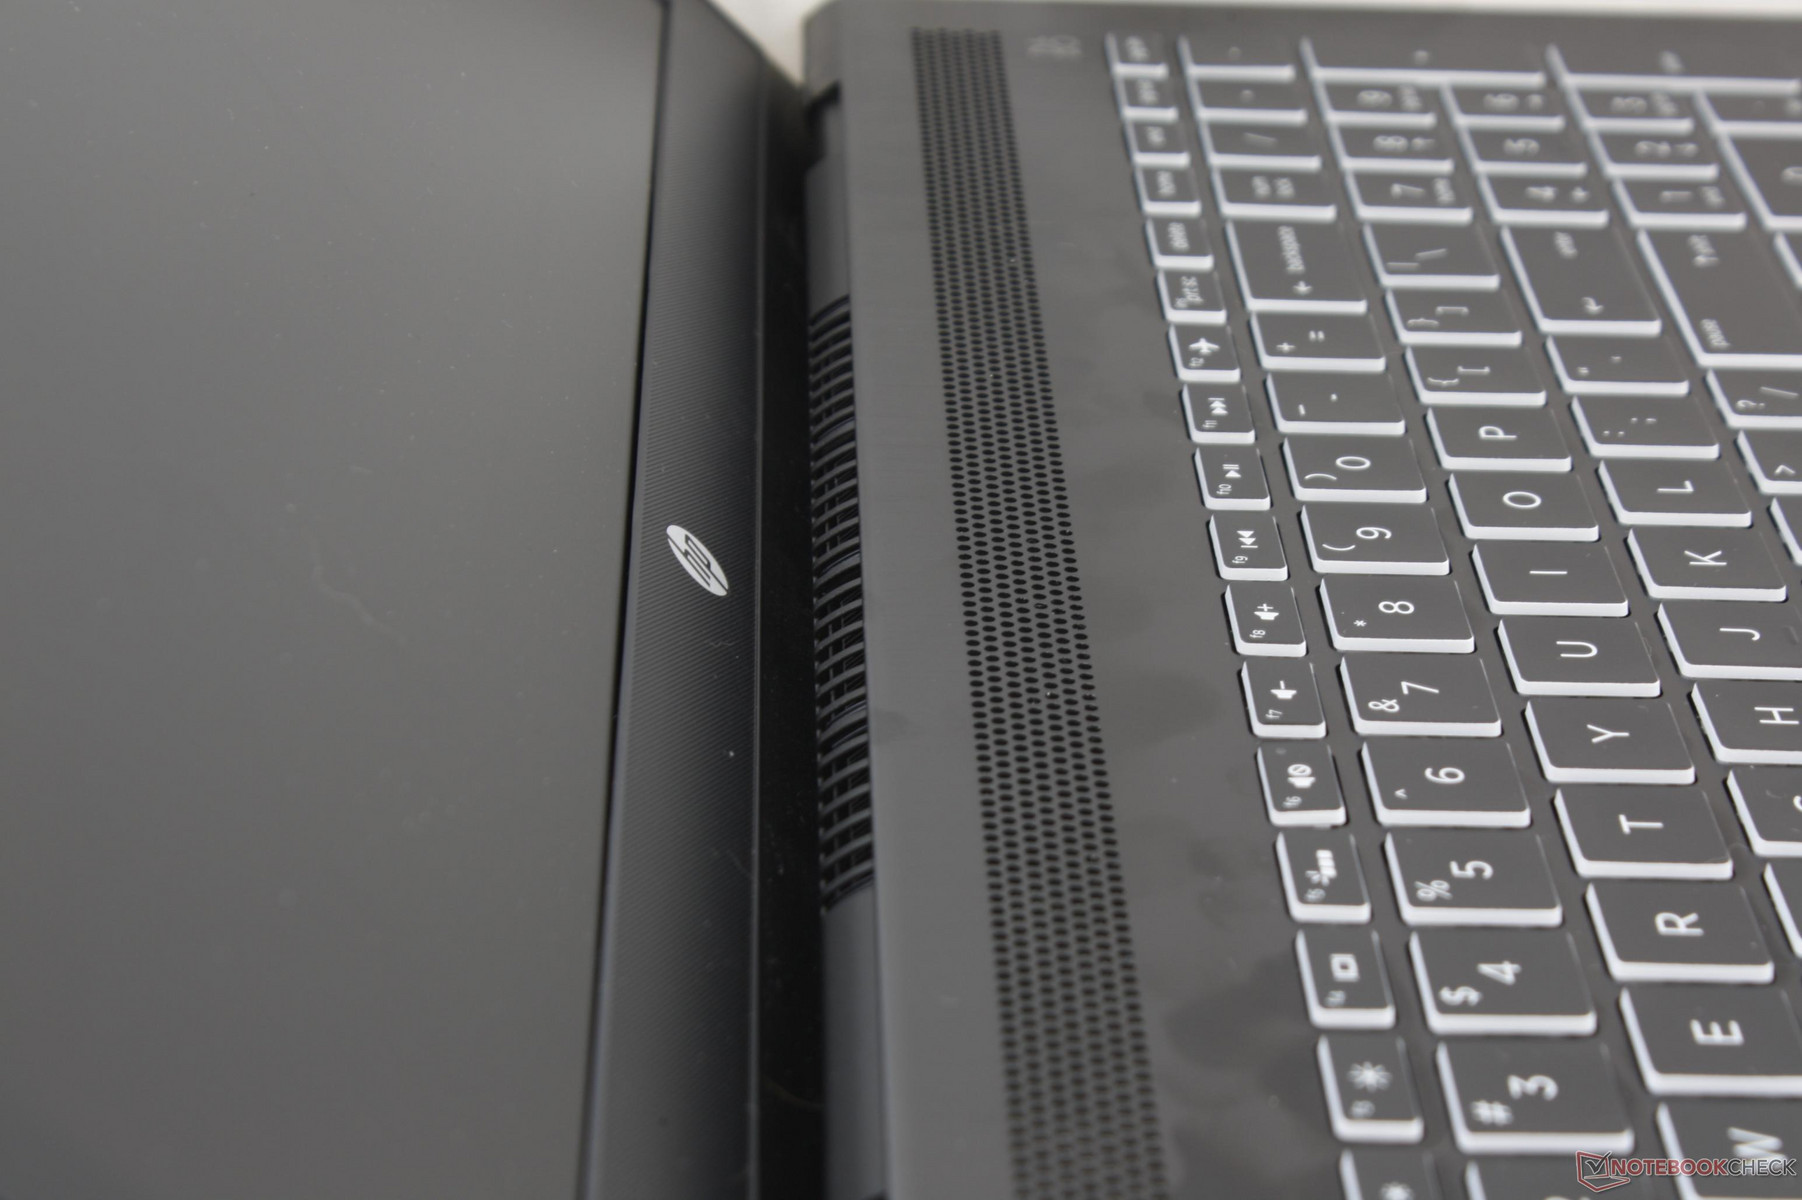
The chassis is a considerable improvement over the standard Pavilion 15 in terms of looks and rigidity. Edges and corners are sharper, stronger, and more defined for an improved aesthetic. Attempting to twist the brushed aluminum base results in very slight warping and creaking that shouldn't be an issue in practice.
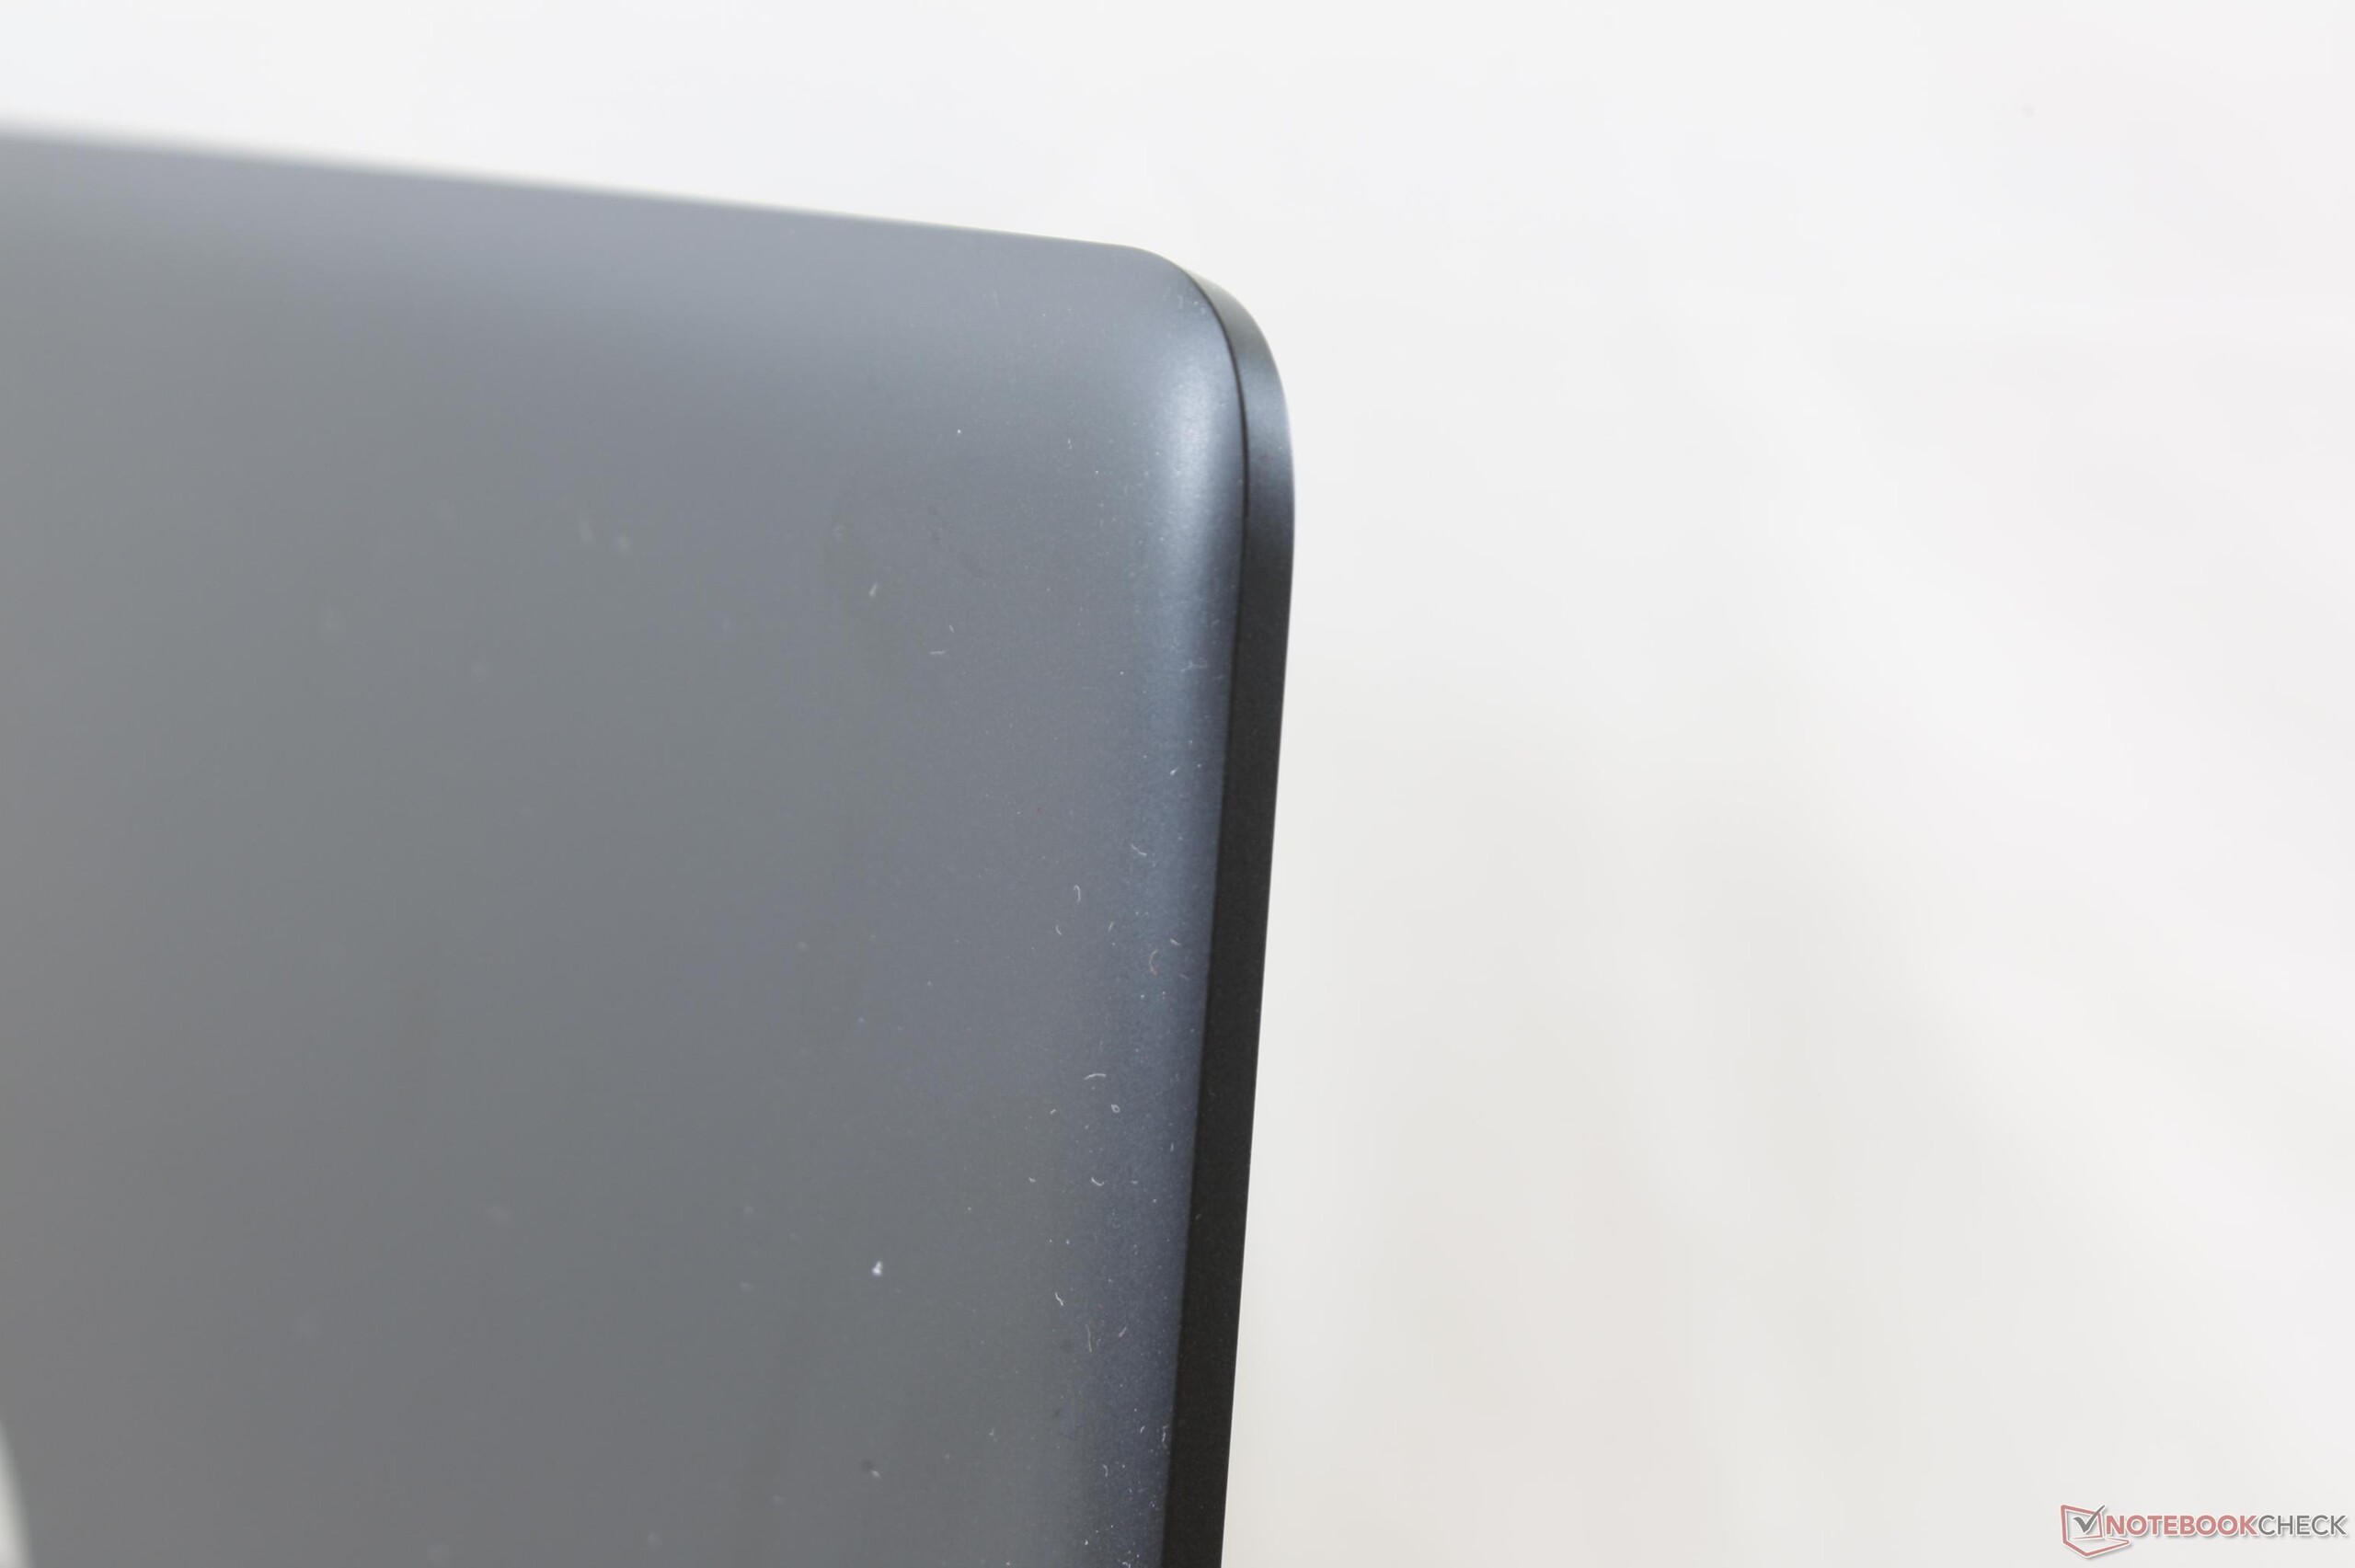
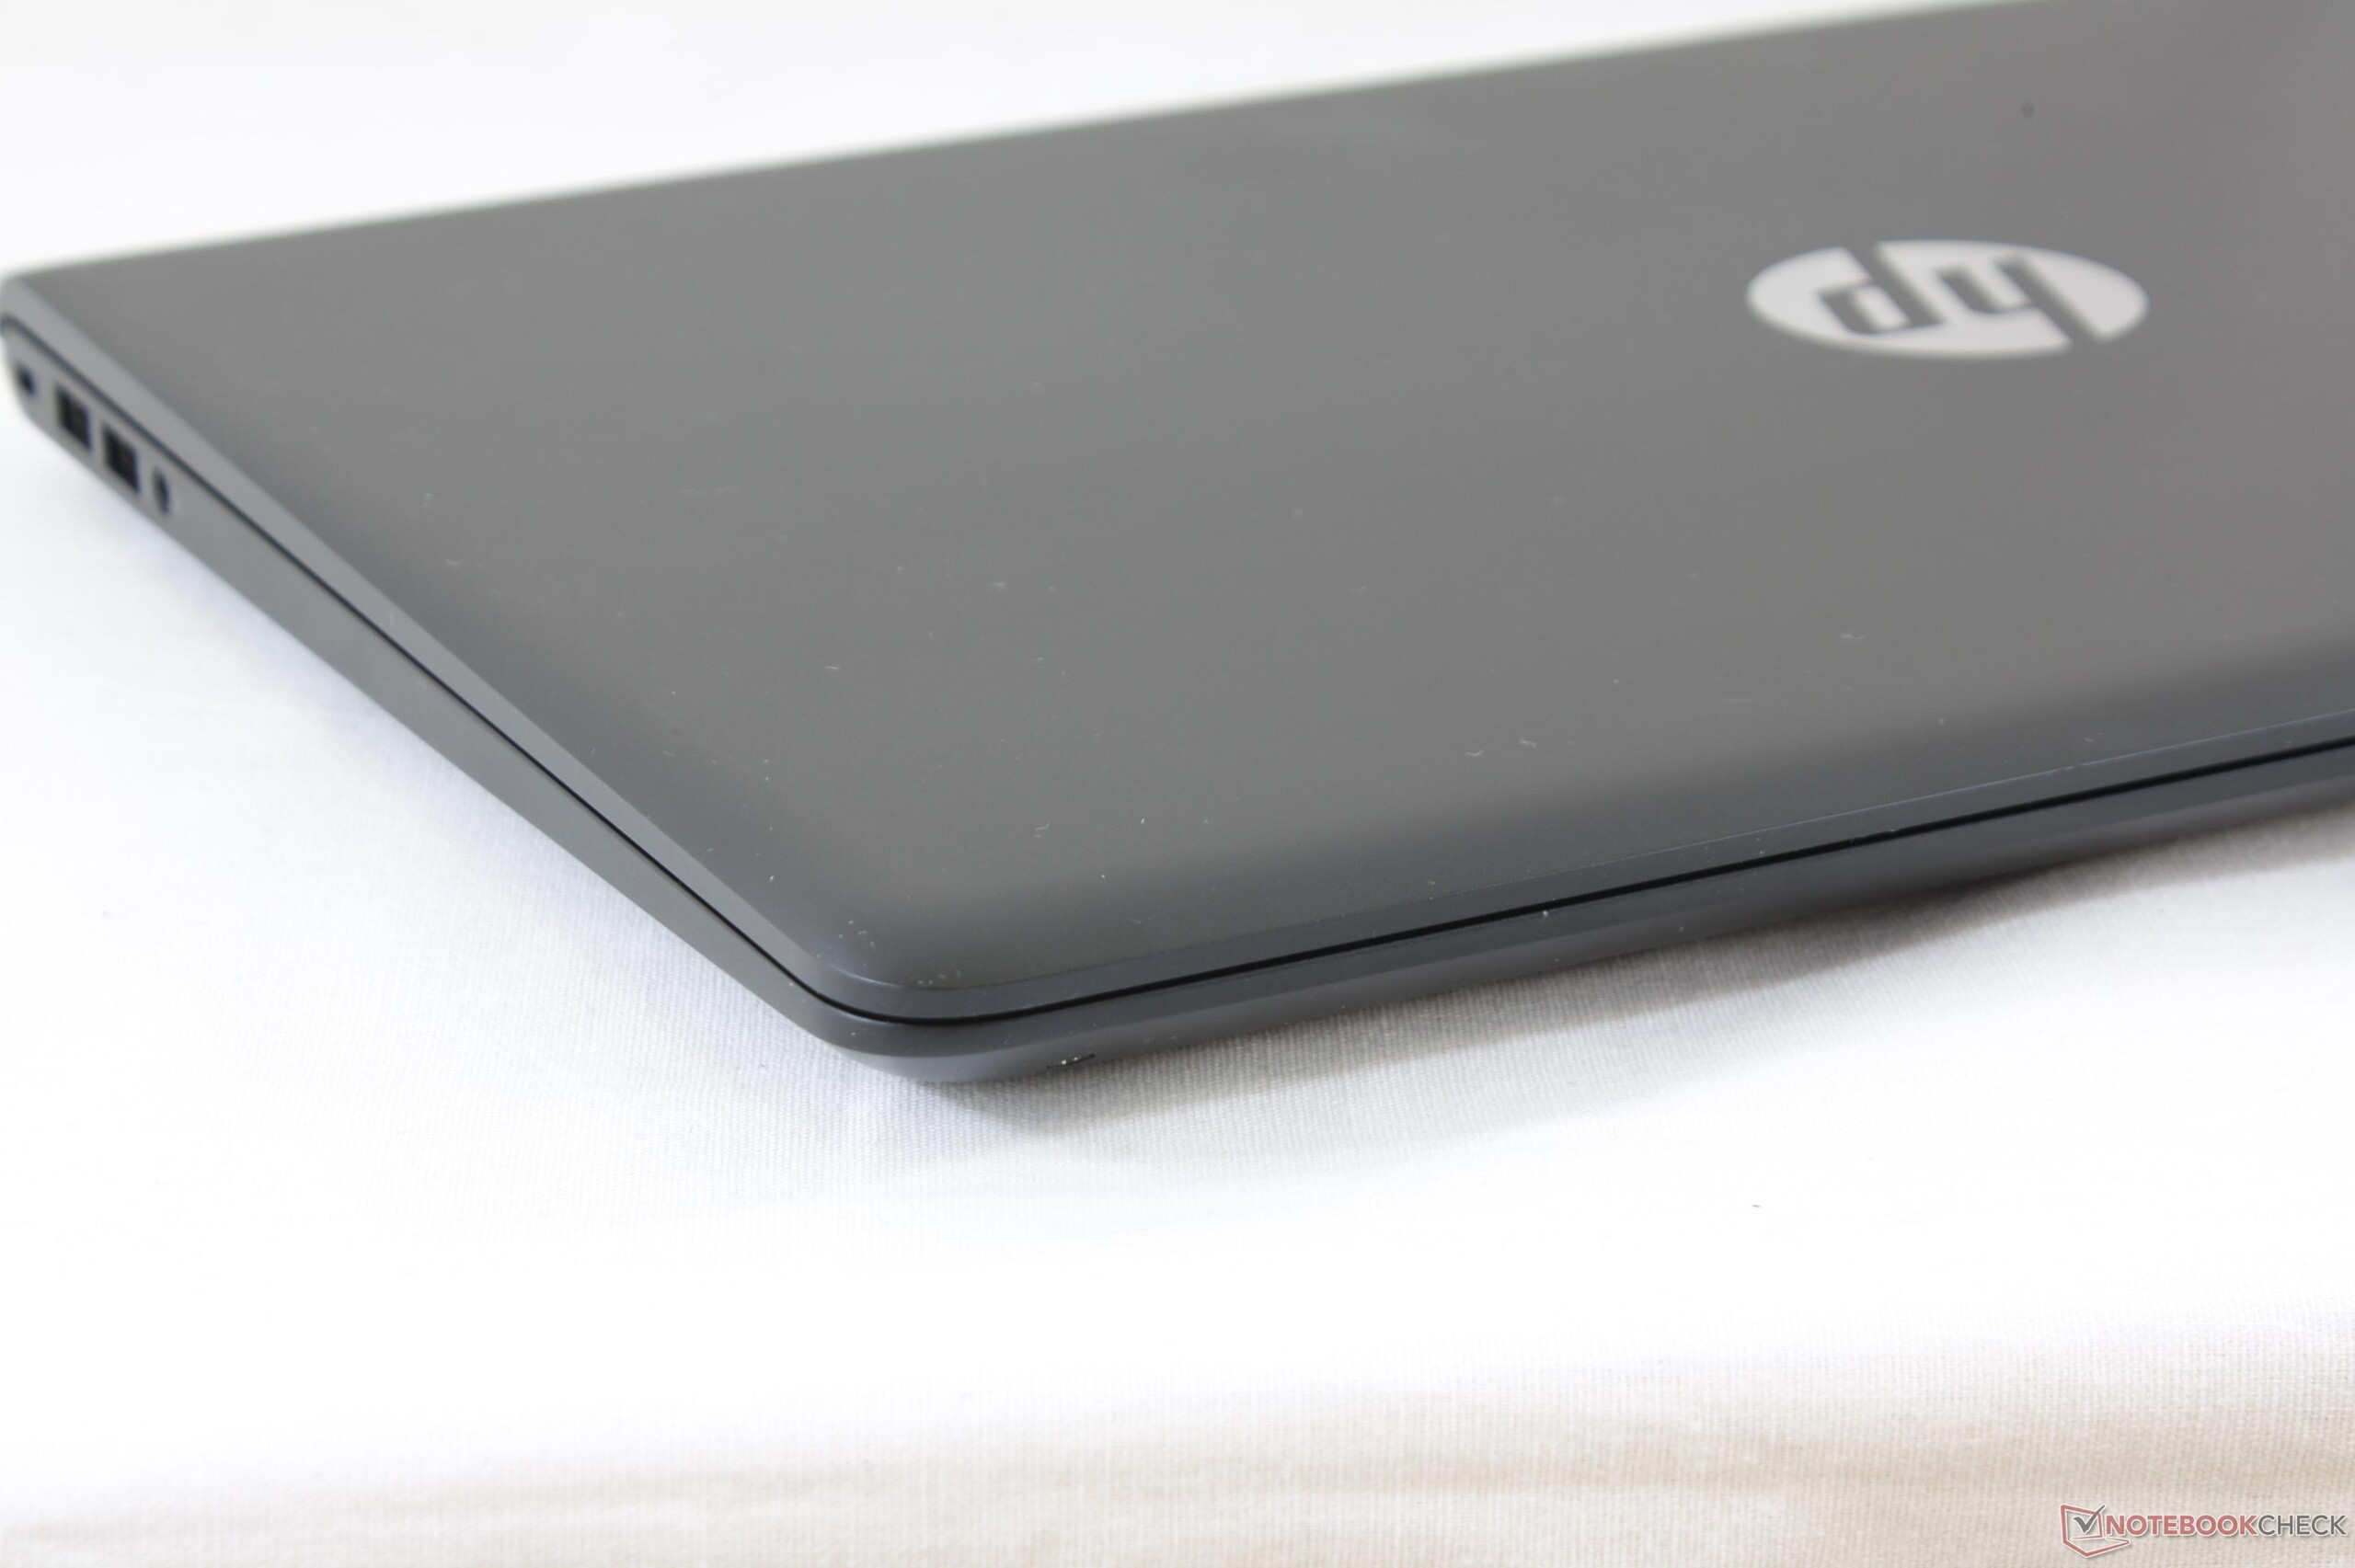
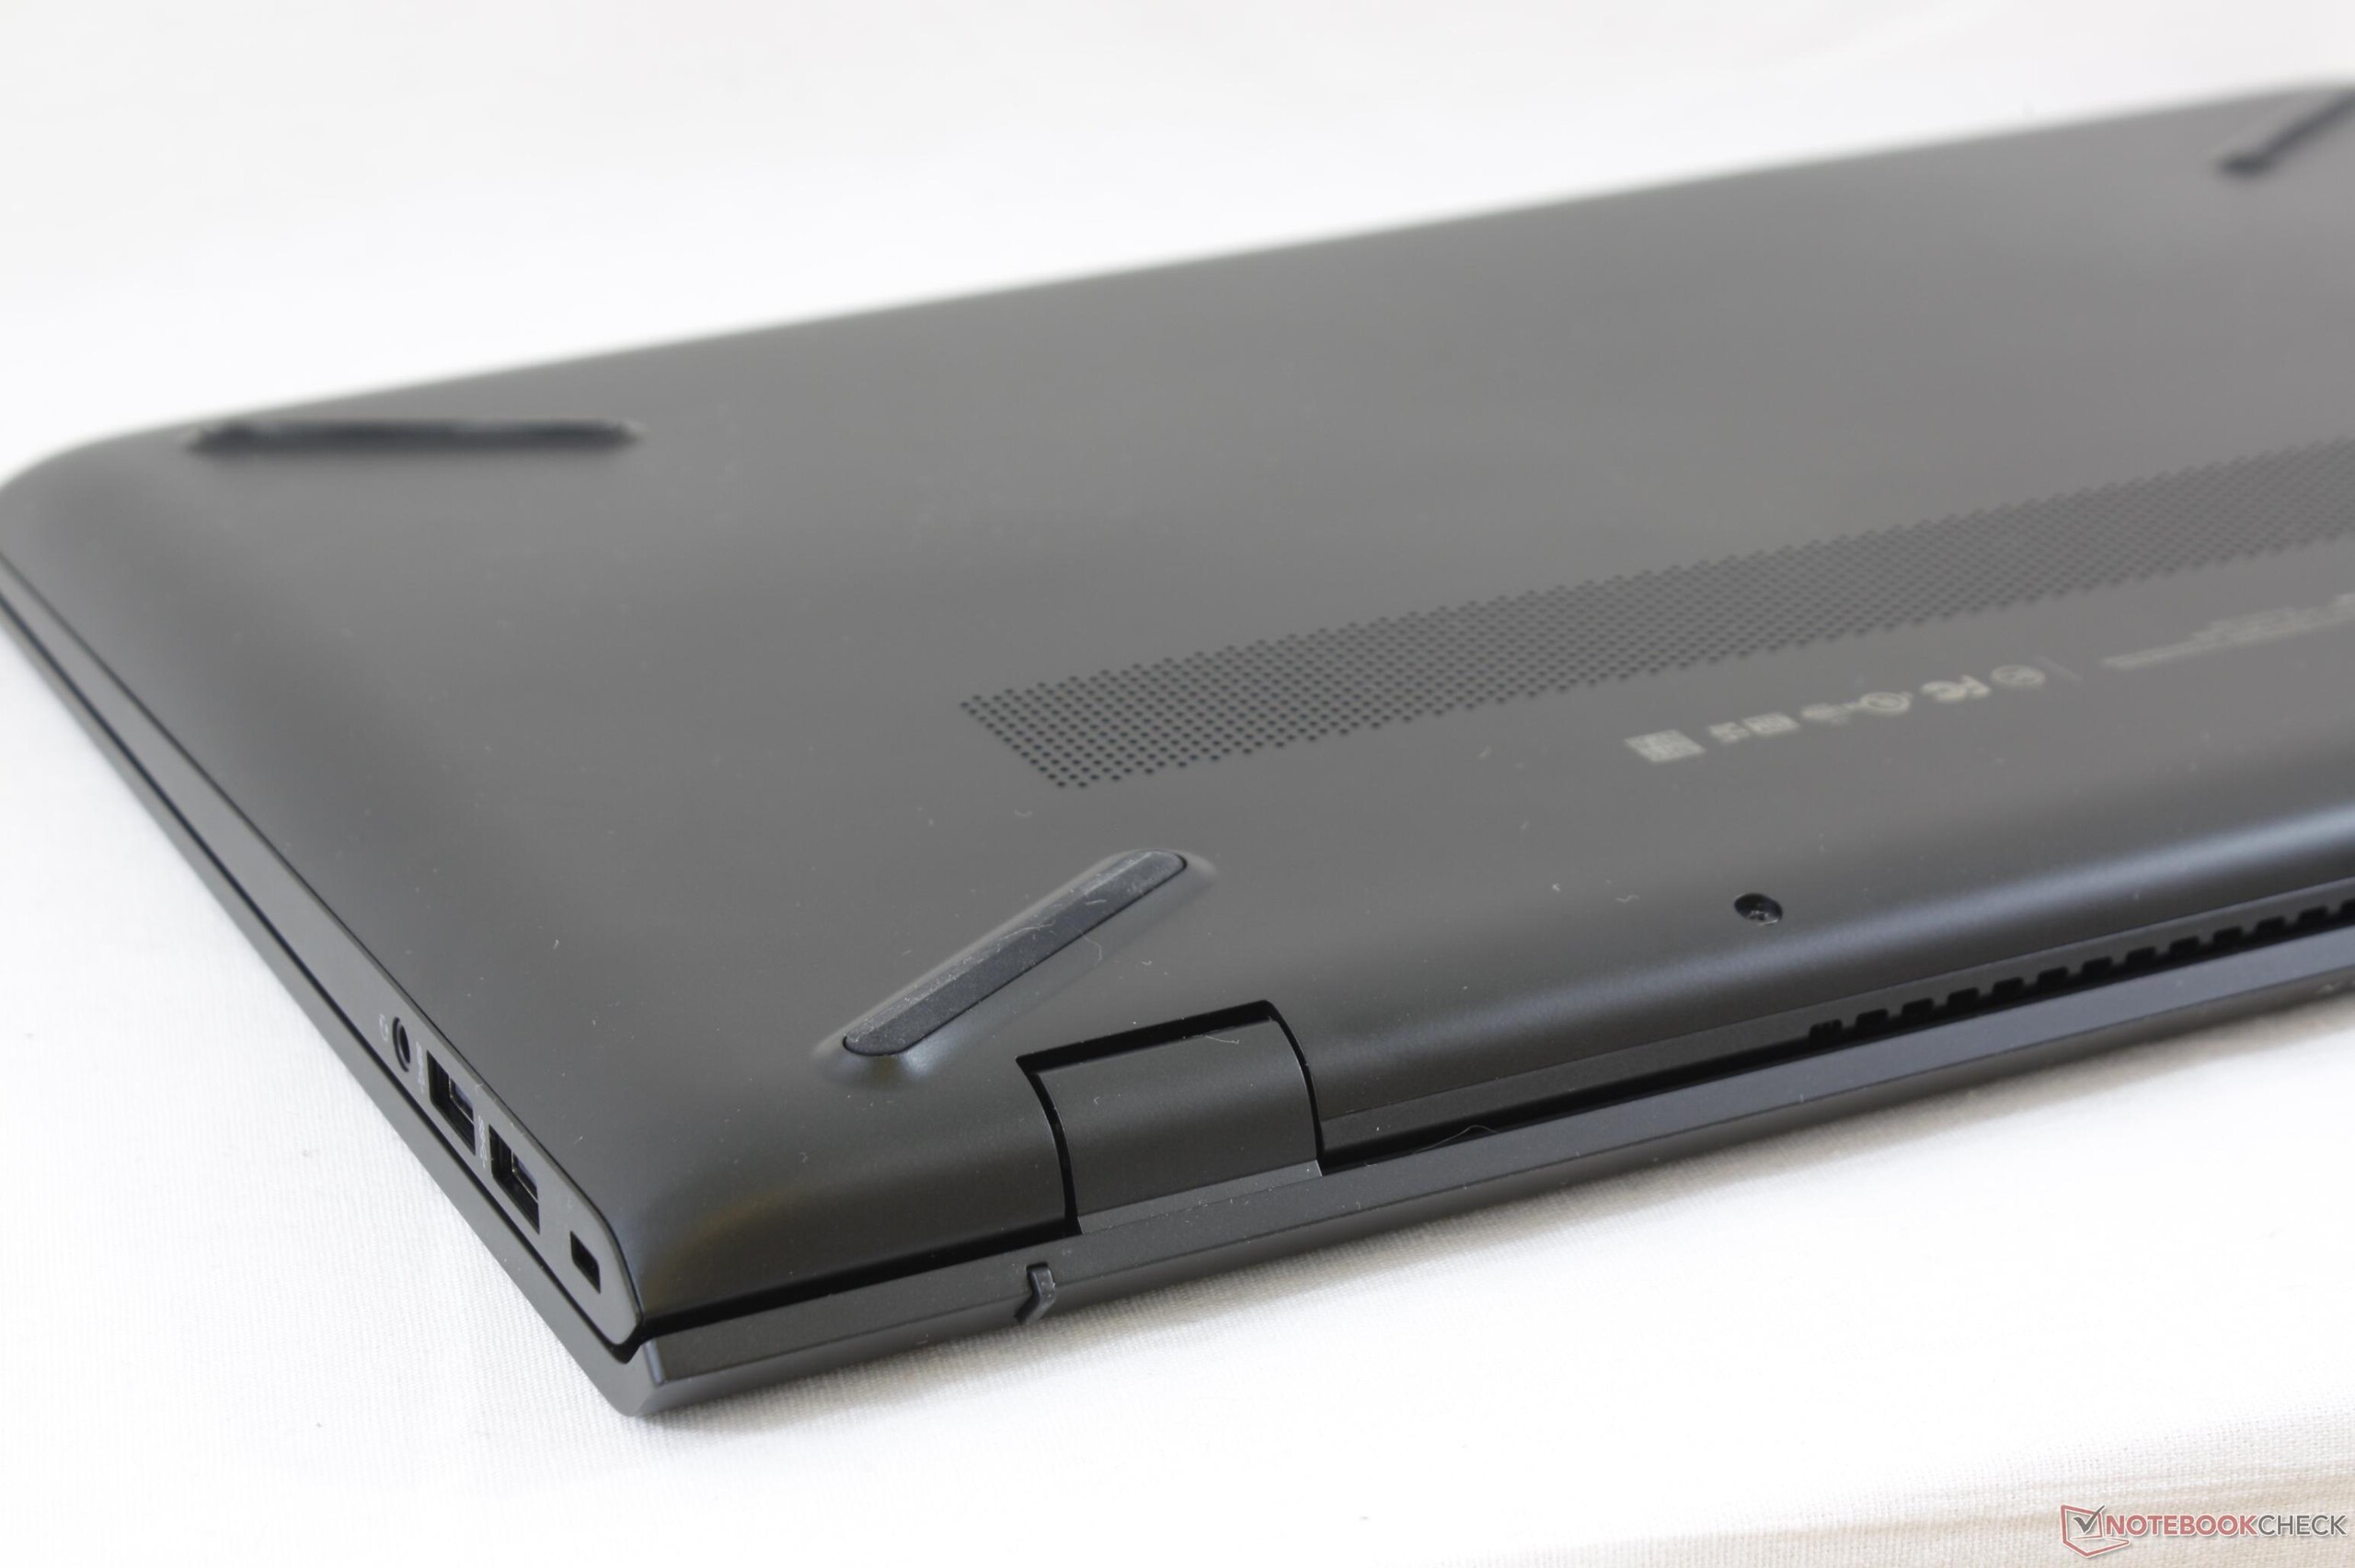
The lid is far less impressive even though it appears sleeker than the older design. The hooked rear is a good idea on paper as it lifts the base slightly for improved airflow and ergonomics, but the display teeters more easily and the maximum angle is limited to about 150 degrees. The unique lid design also occupies the entire rear edge of the system and thus takes away potential space for ports and ventilation. Resistance to side-to-side twisting is average at best and is easily the most flexible part of the notebook. Build quality is otherwise excellent with no unintended gaps or crevices on our test unit.
Dimensions and weight are not significantly different from other 15-inch multimedia notebooks including the Acer Aspire VX15, Lenovo Legion Y520, and the Samsung Odyssey. Costlier alternatives with newer narrow bezel designs like the Yoga 720 and XPS 15 9560 are indeed much smaller than the HP. We're not too surprised to see that the Pavilion 15 Power is nearly identical to the Pavilion 15t in size and weight since both share many similar internal qualities despite the completely different chassis designs.
Connectivity
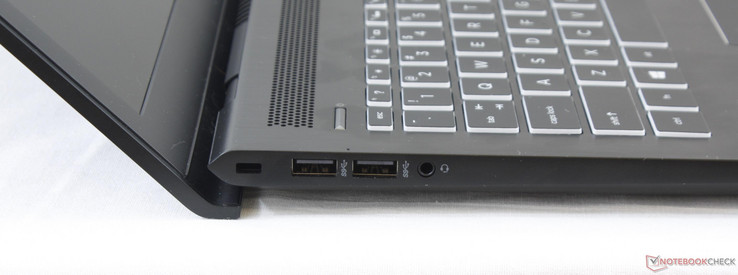
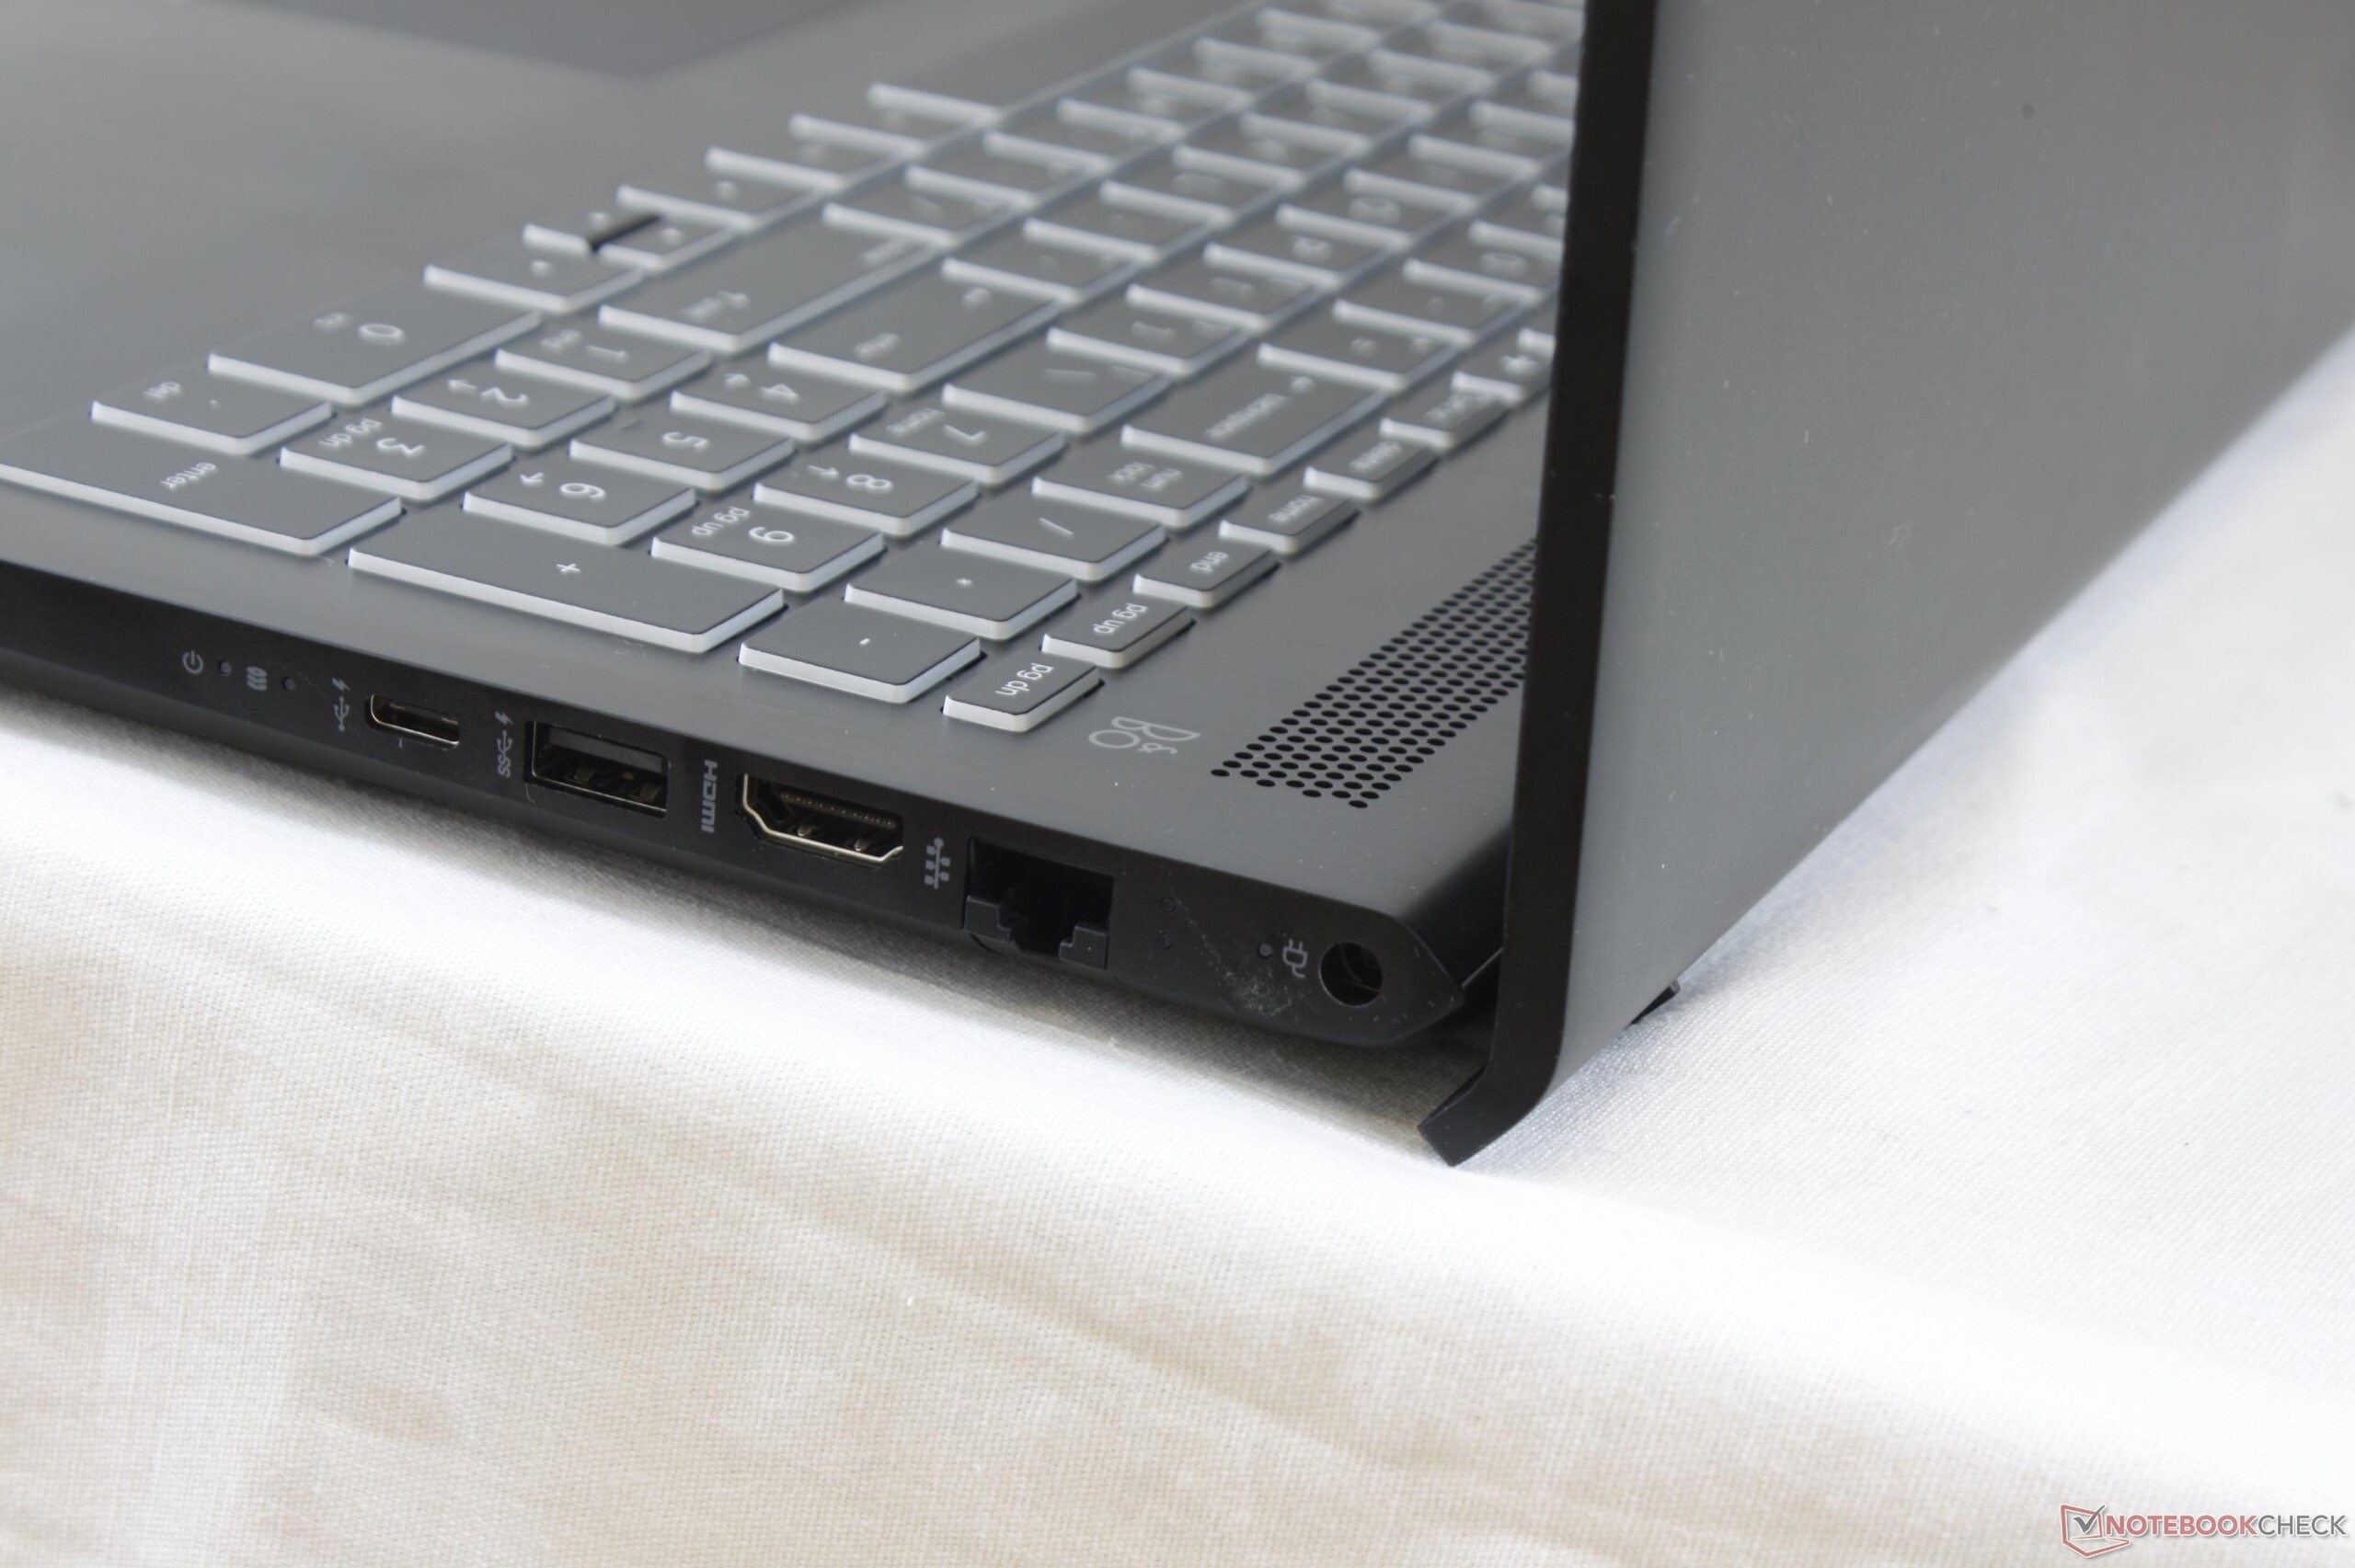
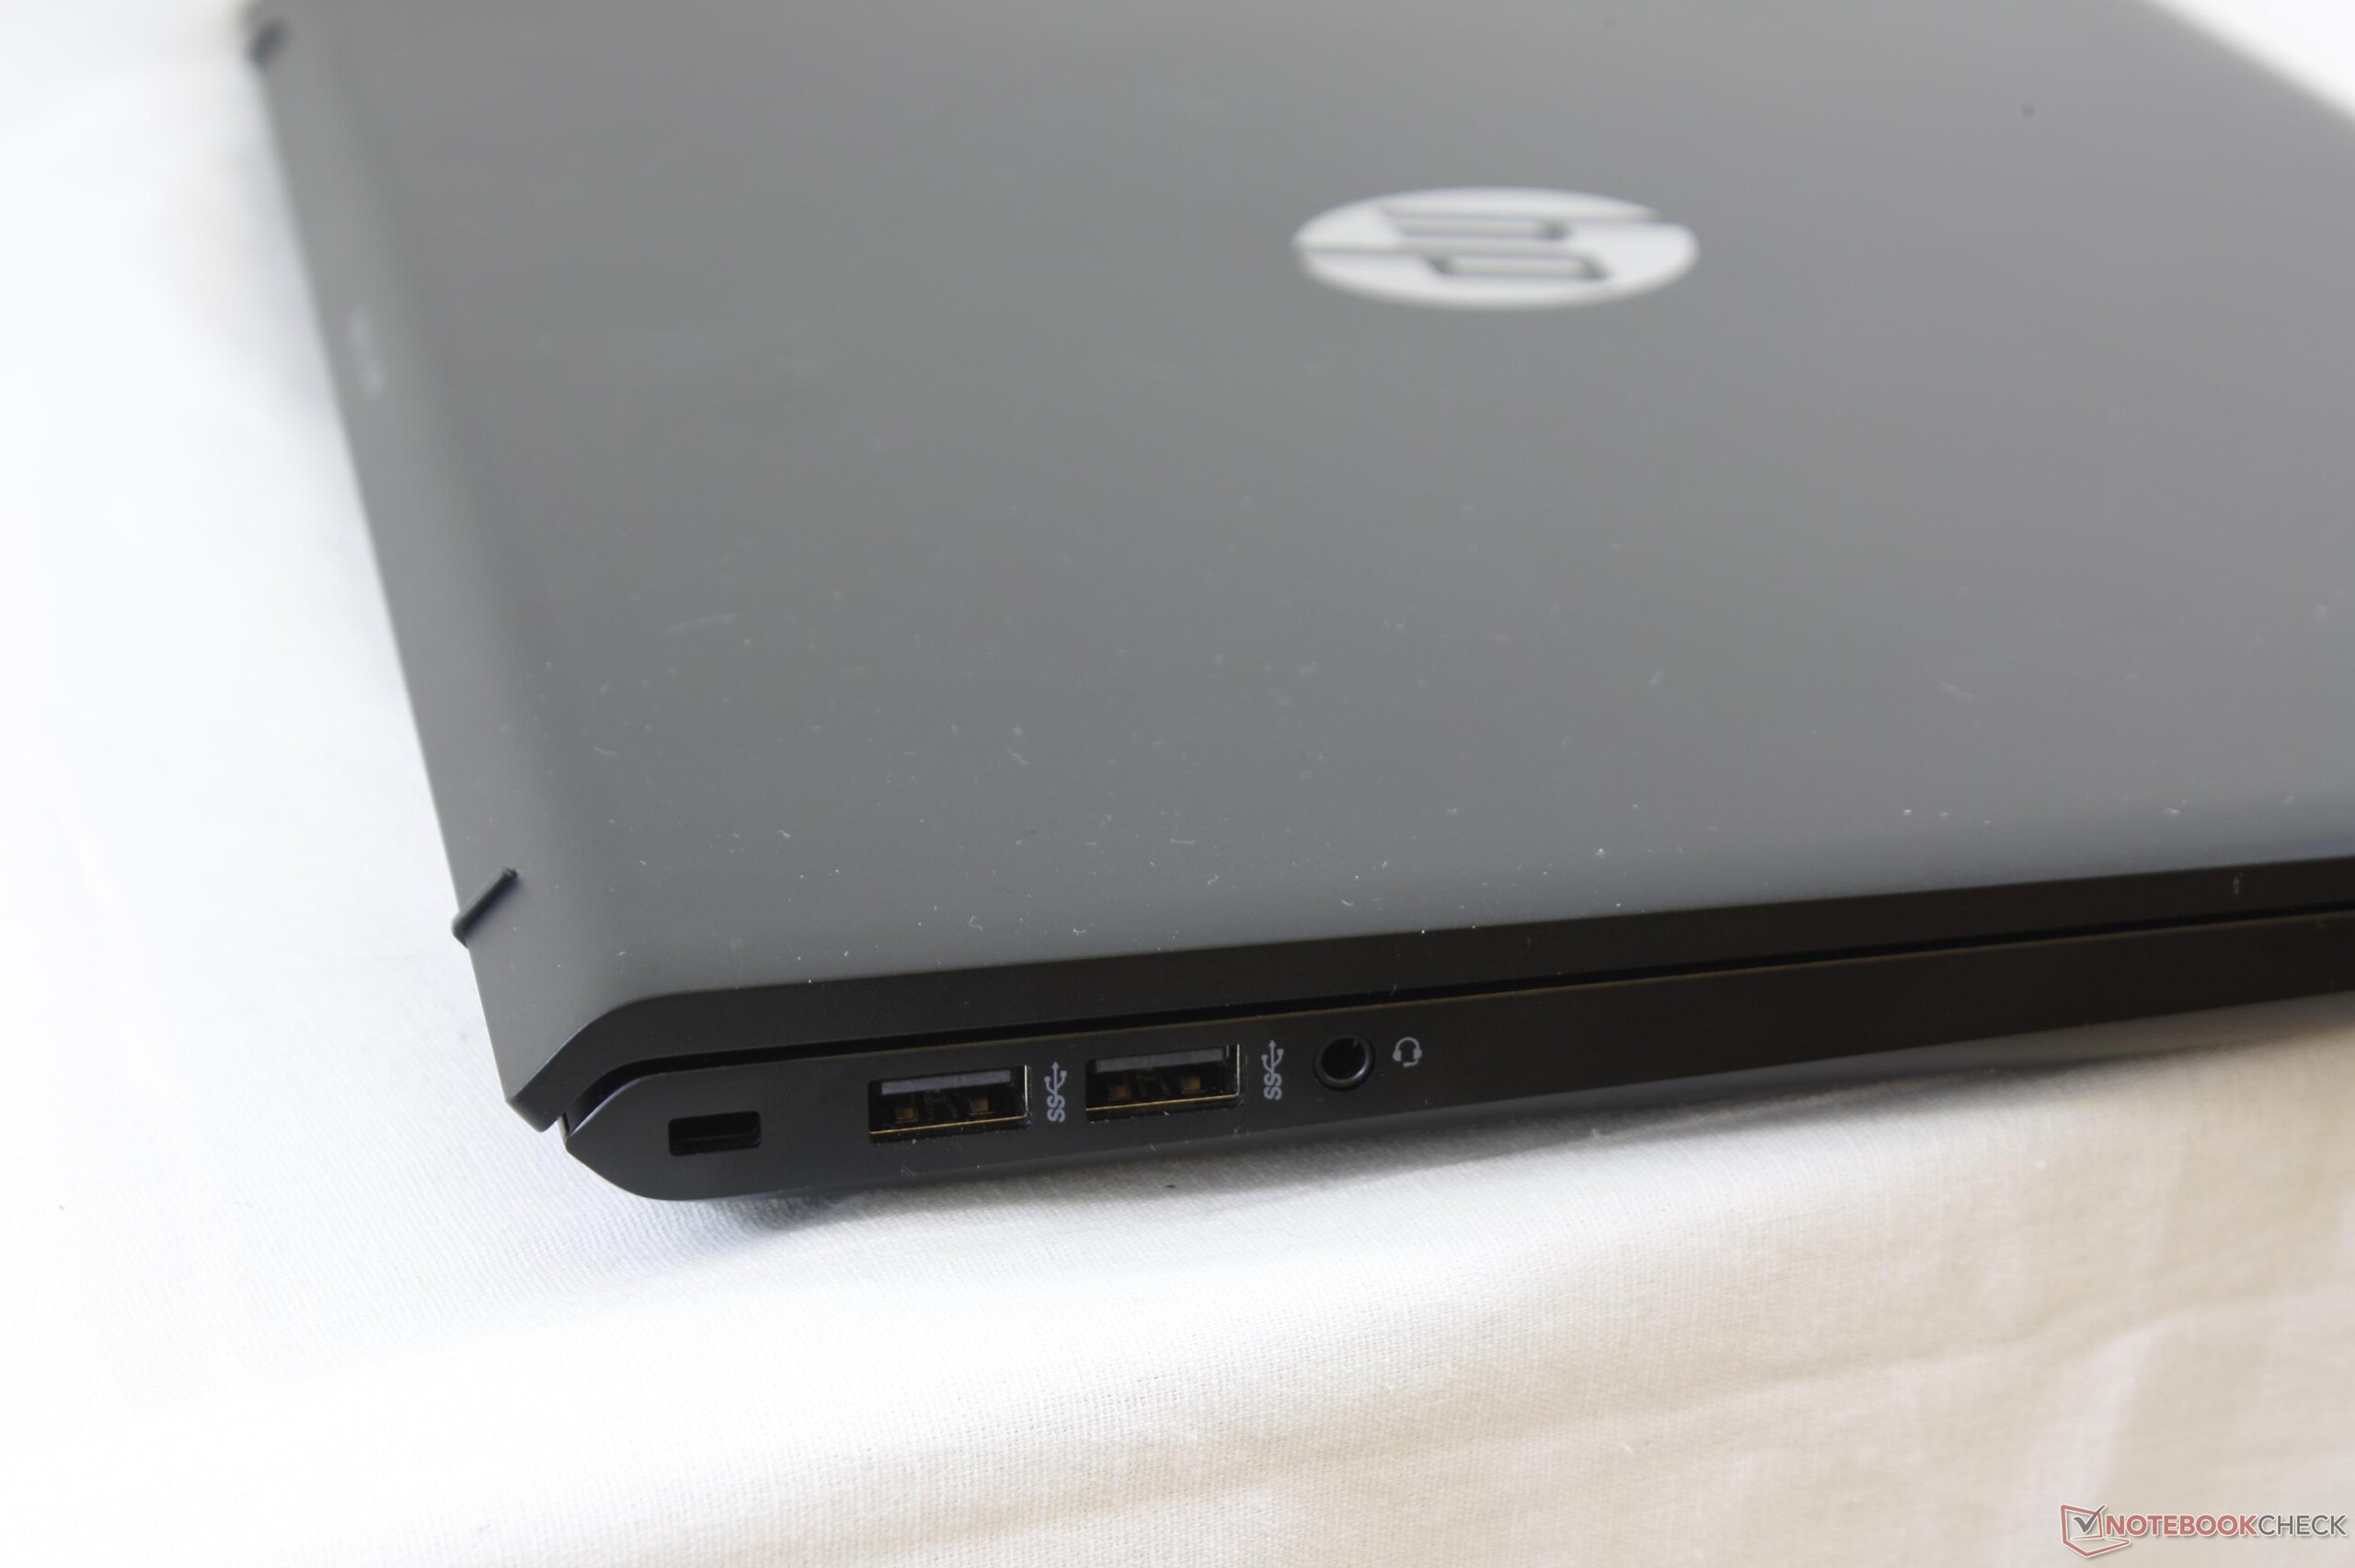
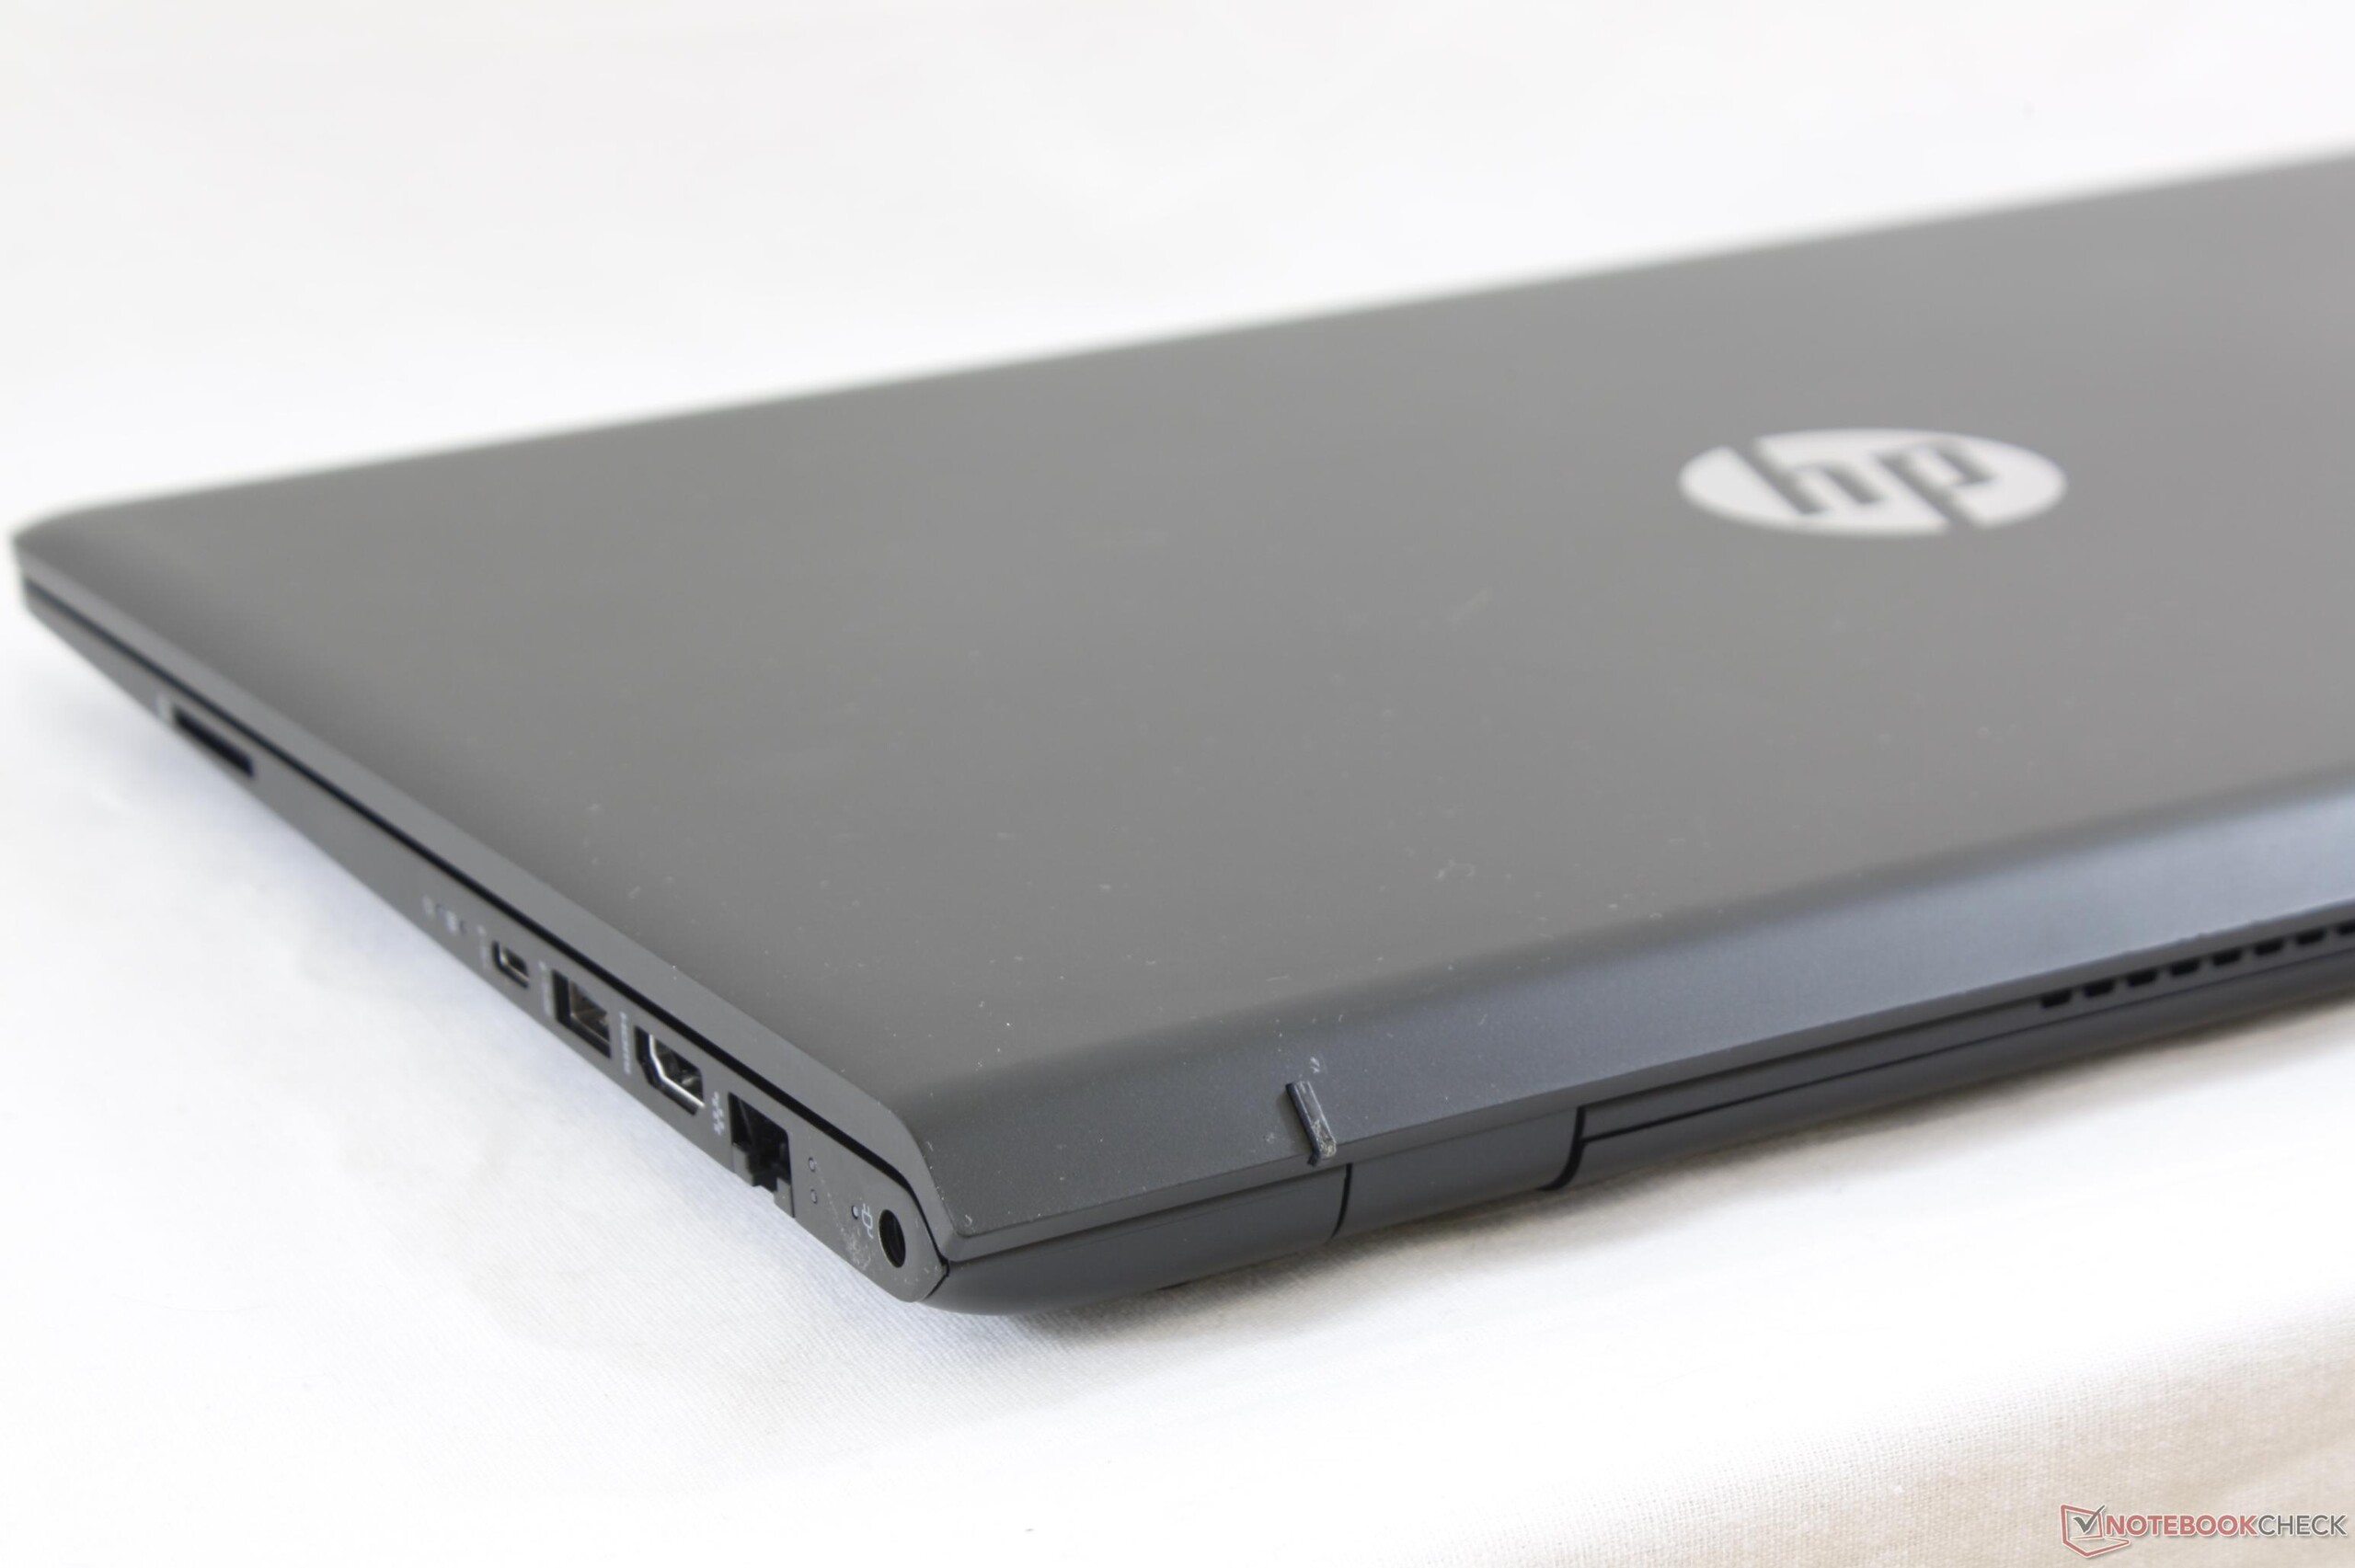
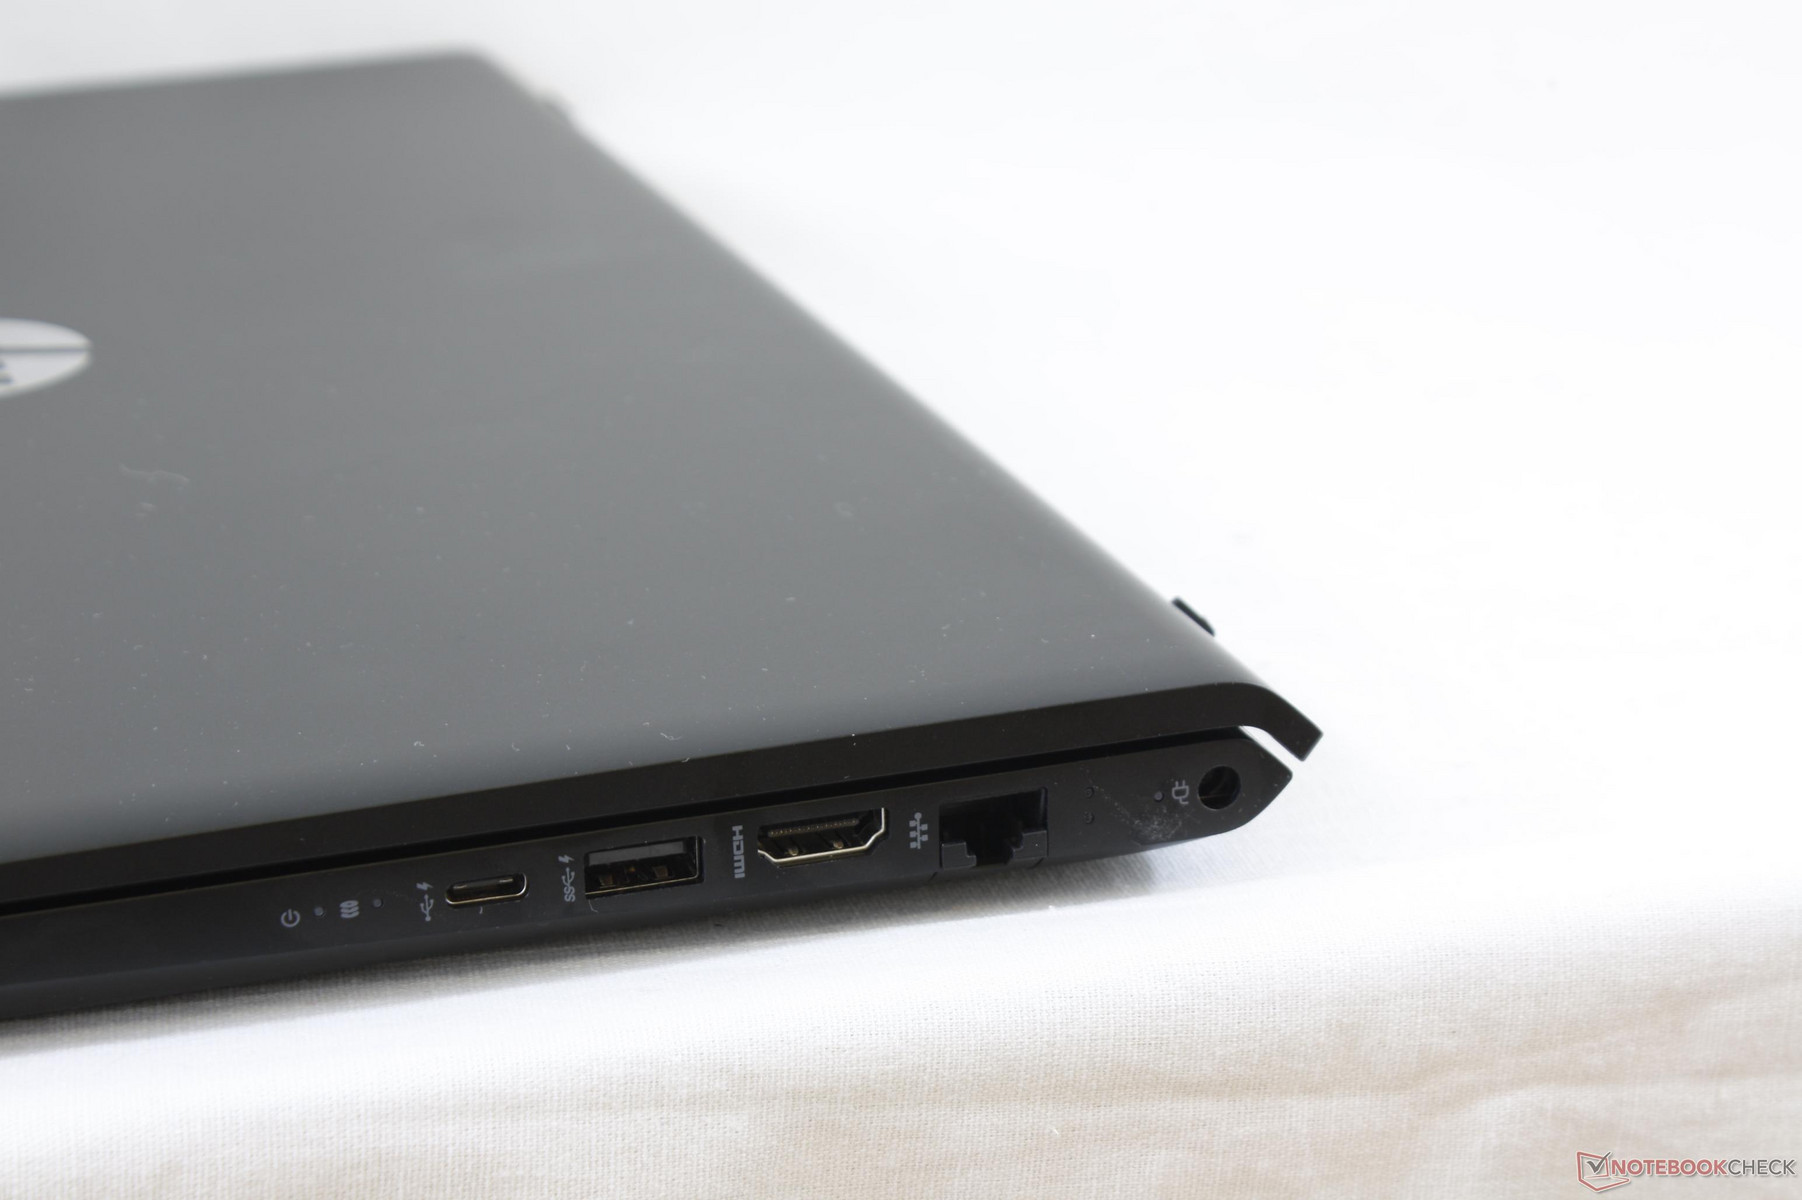
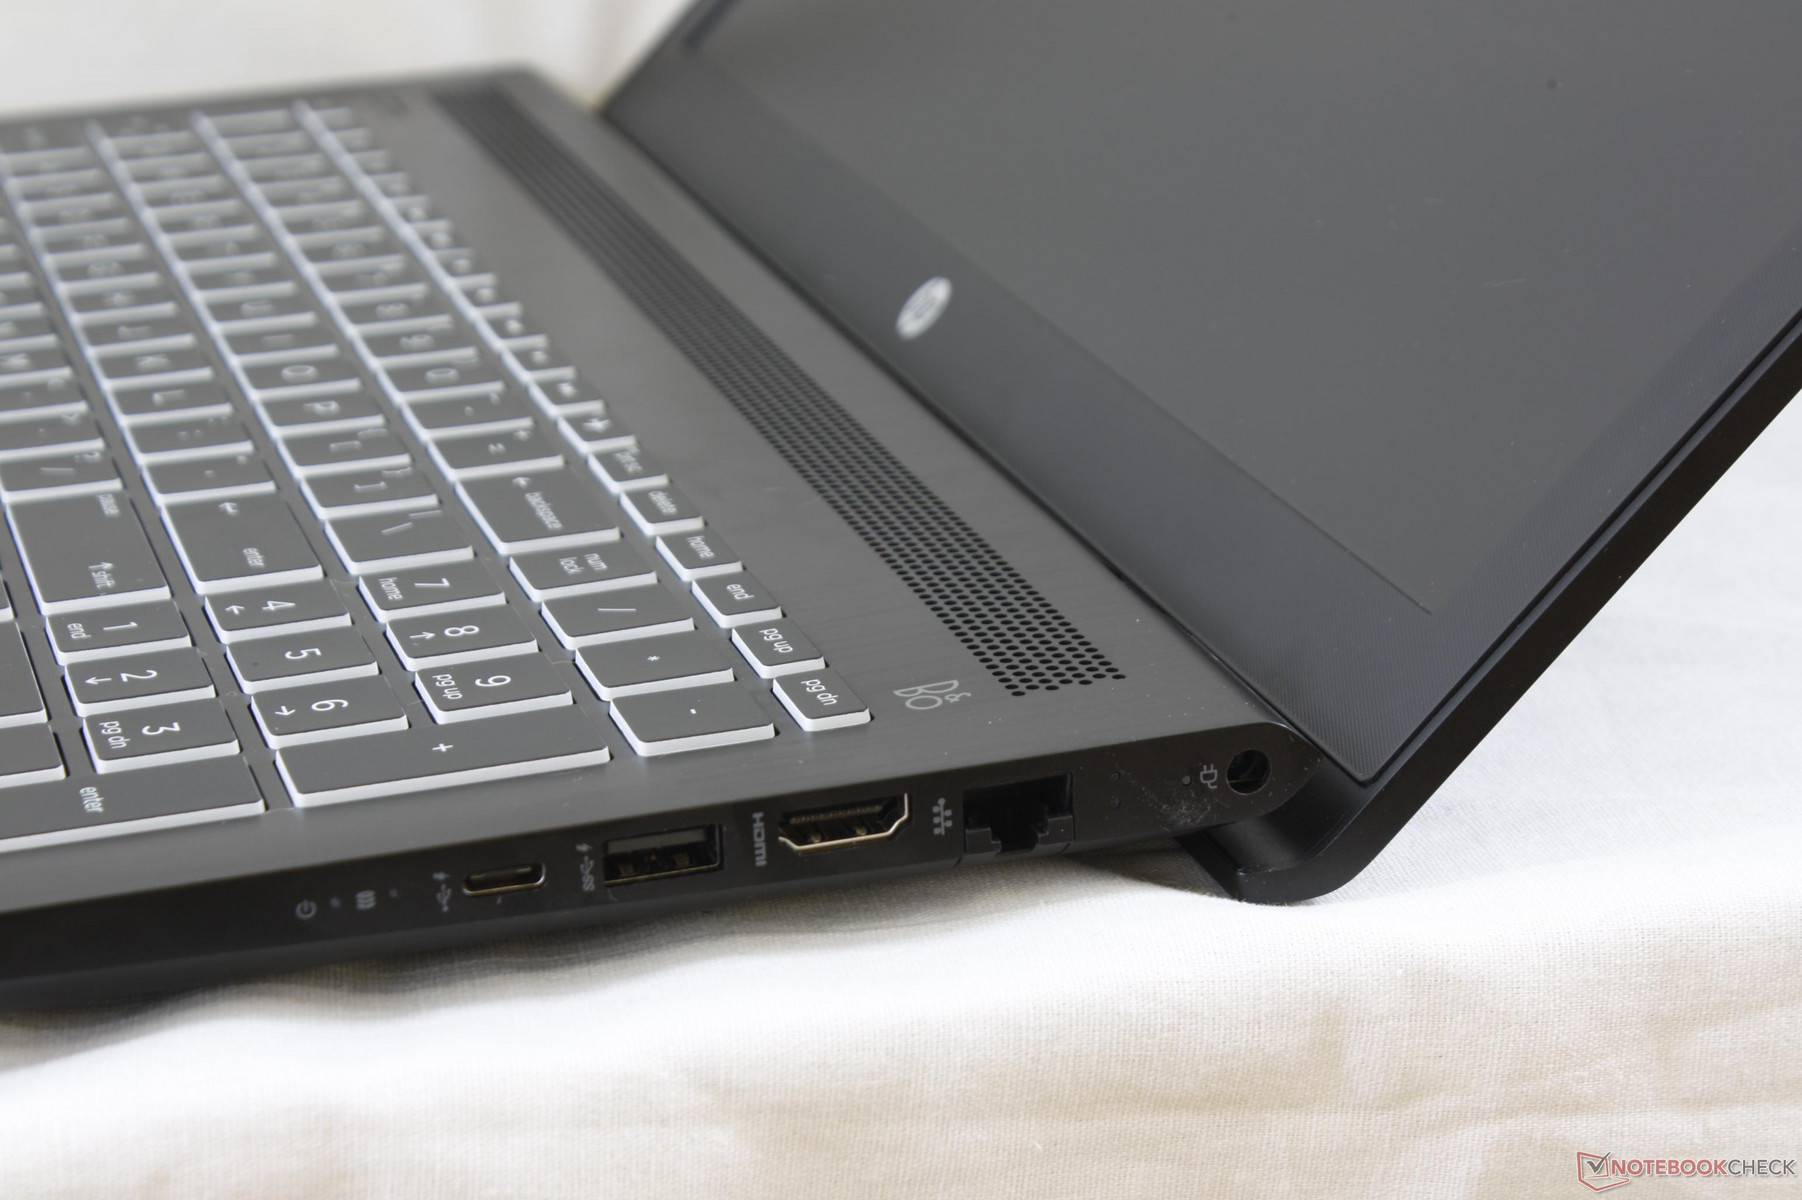
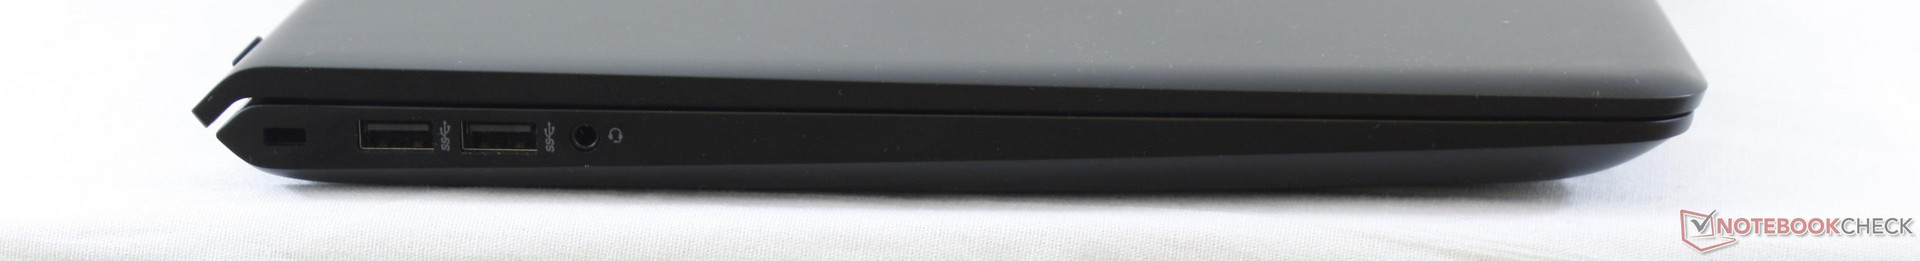
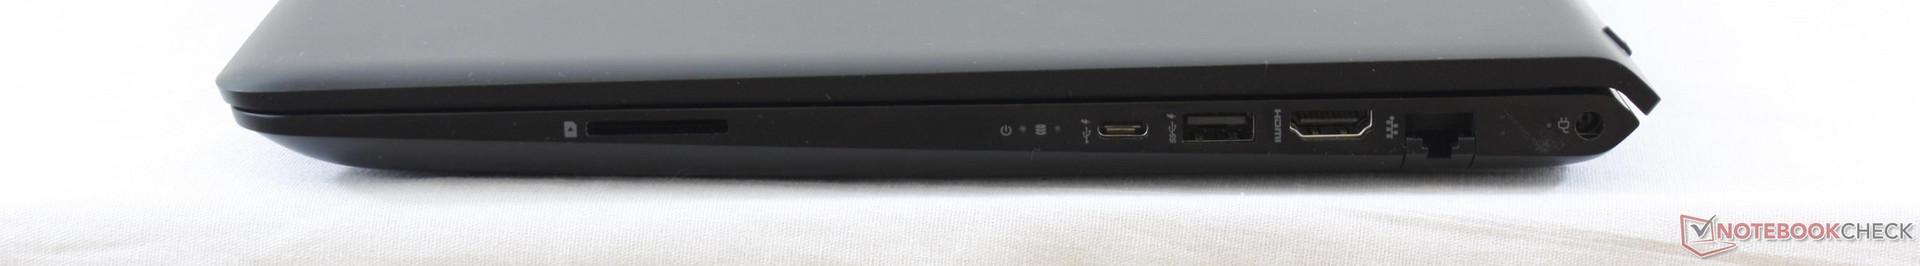
Available ports are nearly identical to the Pavilion 15t with the addition of a USB Type-C Gen. 1 port and the removal of the optical drive. HP elected to not include Thunderbolt 3 support and to instead reserve this feature for its higher-end Spectre and Omen series of notebooks. The ports are otherwise well positioned and easy to reach with none on the rear.
SD Card Reader
Transfer rates from the spring-loaded SD card reader average about 80 MB/s to be significantly faster than the card readers on the Samsung Odyssey and MSI GS63, but still significantly slower than the card reader on the XPS 15 series. Transferring 1 GB worth of photos from our Toshiba UHS-II test card to desktop will take about 13 seconds.
A fully inserted SD card protrudes by about 1 mm from the edge of the notebook.
| SD Card Reader | |
| average JPG Copy Test (av. of 3 runs) | |
| HP Pavilion 15 Power 1GK62AV | |
| Lenovo Legion Y520-15IKBN-80WK001KUS | |
| Samsung Odyssey NP800G5M-X01US | |
| maximum AS SSD Seq Read Test (1GB) | |
| Lenovo Legion Y520-15IKBN-80WK001KUS | |
| HP Pavilion 15 Power 1GK62AV | |
| Samsung Odyssey NP800G5M-X01US | |
Communication
All SKUs ship with the same Intel 7265 2x2 WLAN module for 802.11ac and Bluetooth connectivity. We are able to record real-world average transfer rates of 645 Mbps when standing one meter away from our Linksys EA8500 test router against the theoretical maximum of 867 Mbps with no notable connectivity issues.
| Networking | |
| iperf3 transmit AX12 | |
| Lenovo Yoga 720-15IKB-80X7 | |
| HP Pavilion 15 Power 1GK62AV | |
| Samsung Odyssey NP800G5M-X01US | |
| iperf3 receive AX12 | |
| Lenovo Yoga 720-15IKB-80X7 | |
| HP Pavilion 15 Power 1GK62AV | |
| Samsung Odyssey NP800G5M-X01US | |
Accessories
There are no included extras outside of the AC adapter and Quick Start guide. HP offers generic bags and USB-based mice and speakers that can be used on most any notebook.
Maintenance
Unless if it's an EliteBook, ElitePad, or ZBook, HP consumer laptops are generally more difficult to service compared to those from Lenovo, Dell, and others. The trend continues here on the Pavilion 15 Power as the bottom panel is latched on extremely tightly around its sharp edges and corners even after removing the surrounding Philips screws. Cukusa provides a servicing guide for users who want to disassemble the notebook for upgrades and servicing.
Warranty
The standard one-year limited warranty applies if purchased directly from HP.com. Cukusa will cover additional parts installed by the reseller such as RAM and storage drives for up to three years. Please see our Guarantees, Return policies and Warranties FAQ for country-specific information.
Input Devices
Keyboard
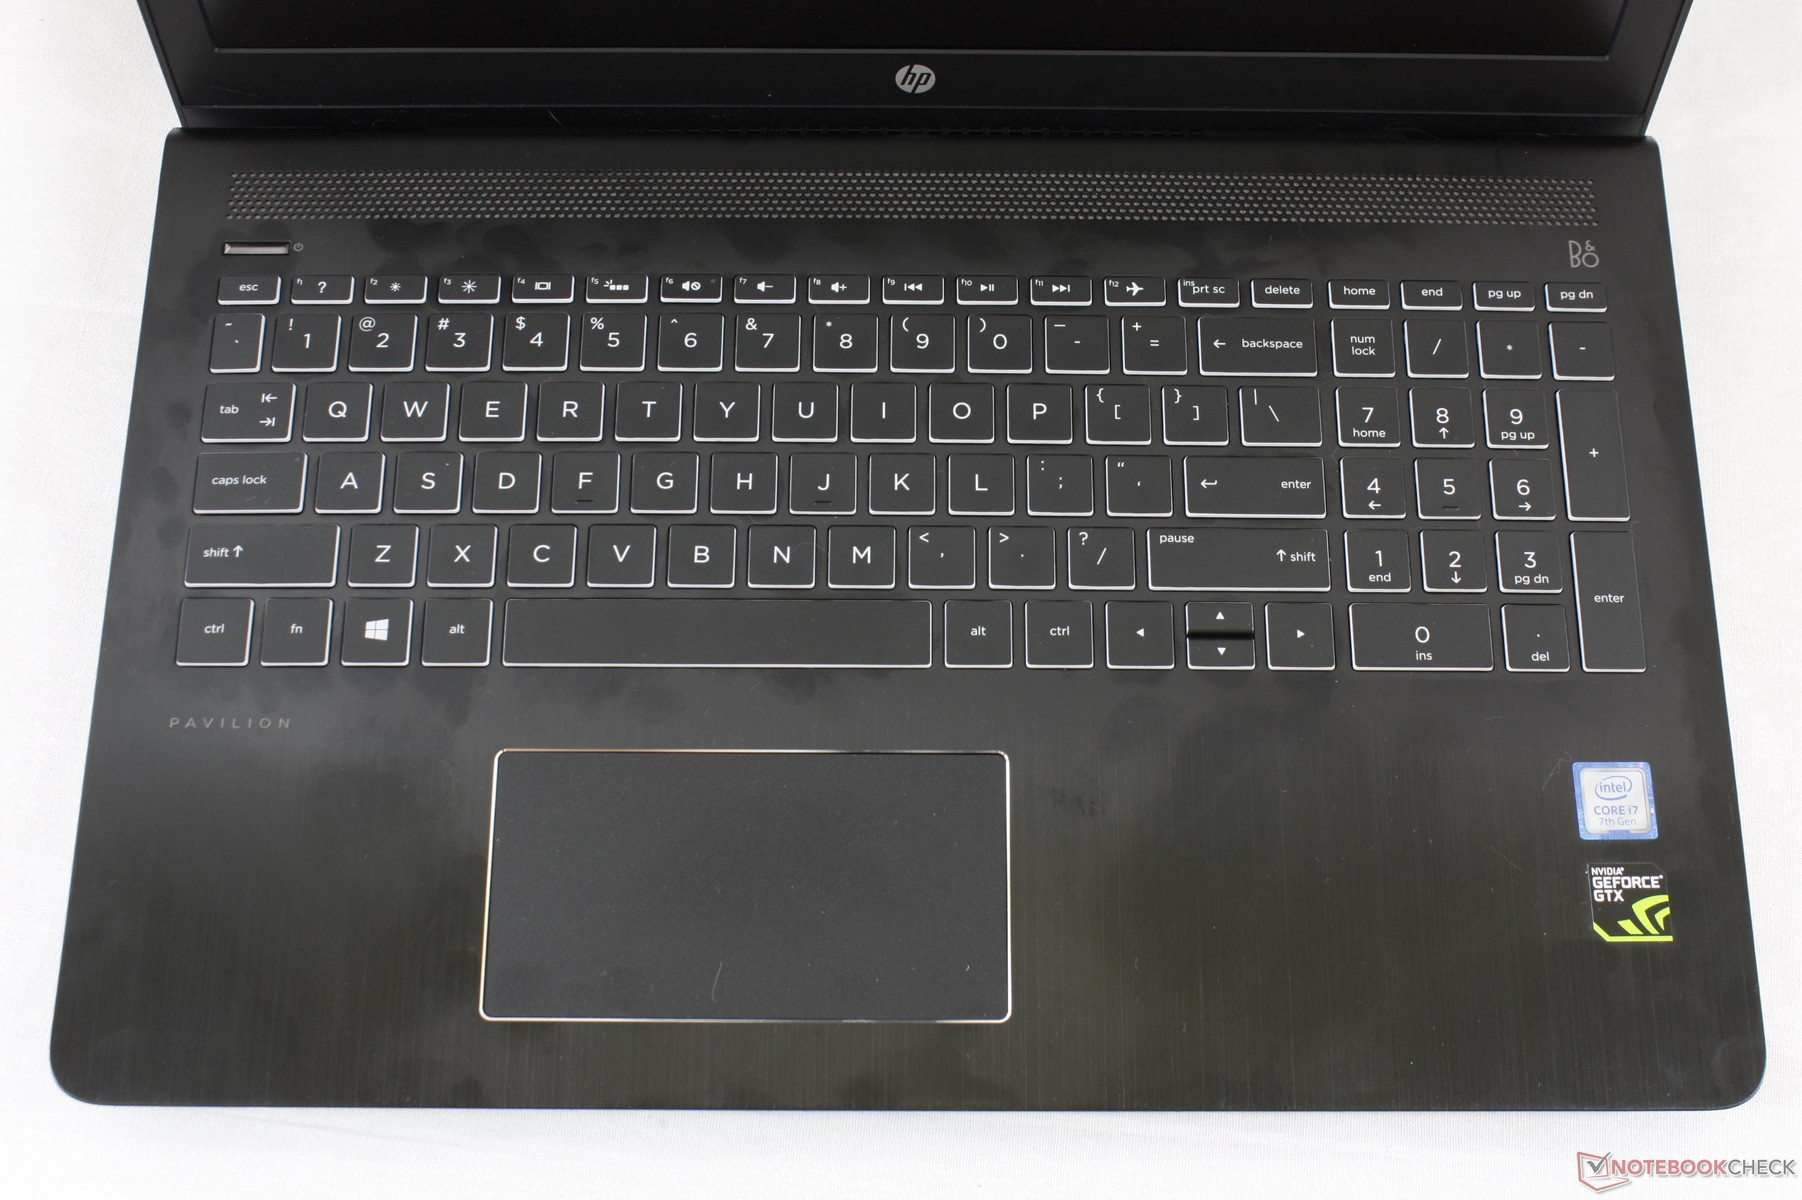
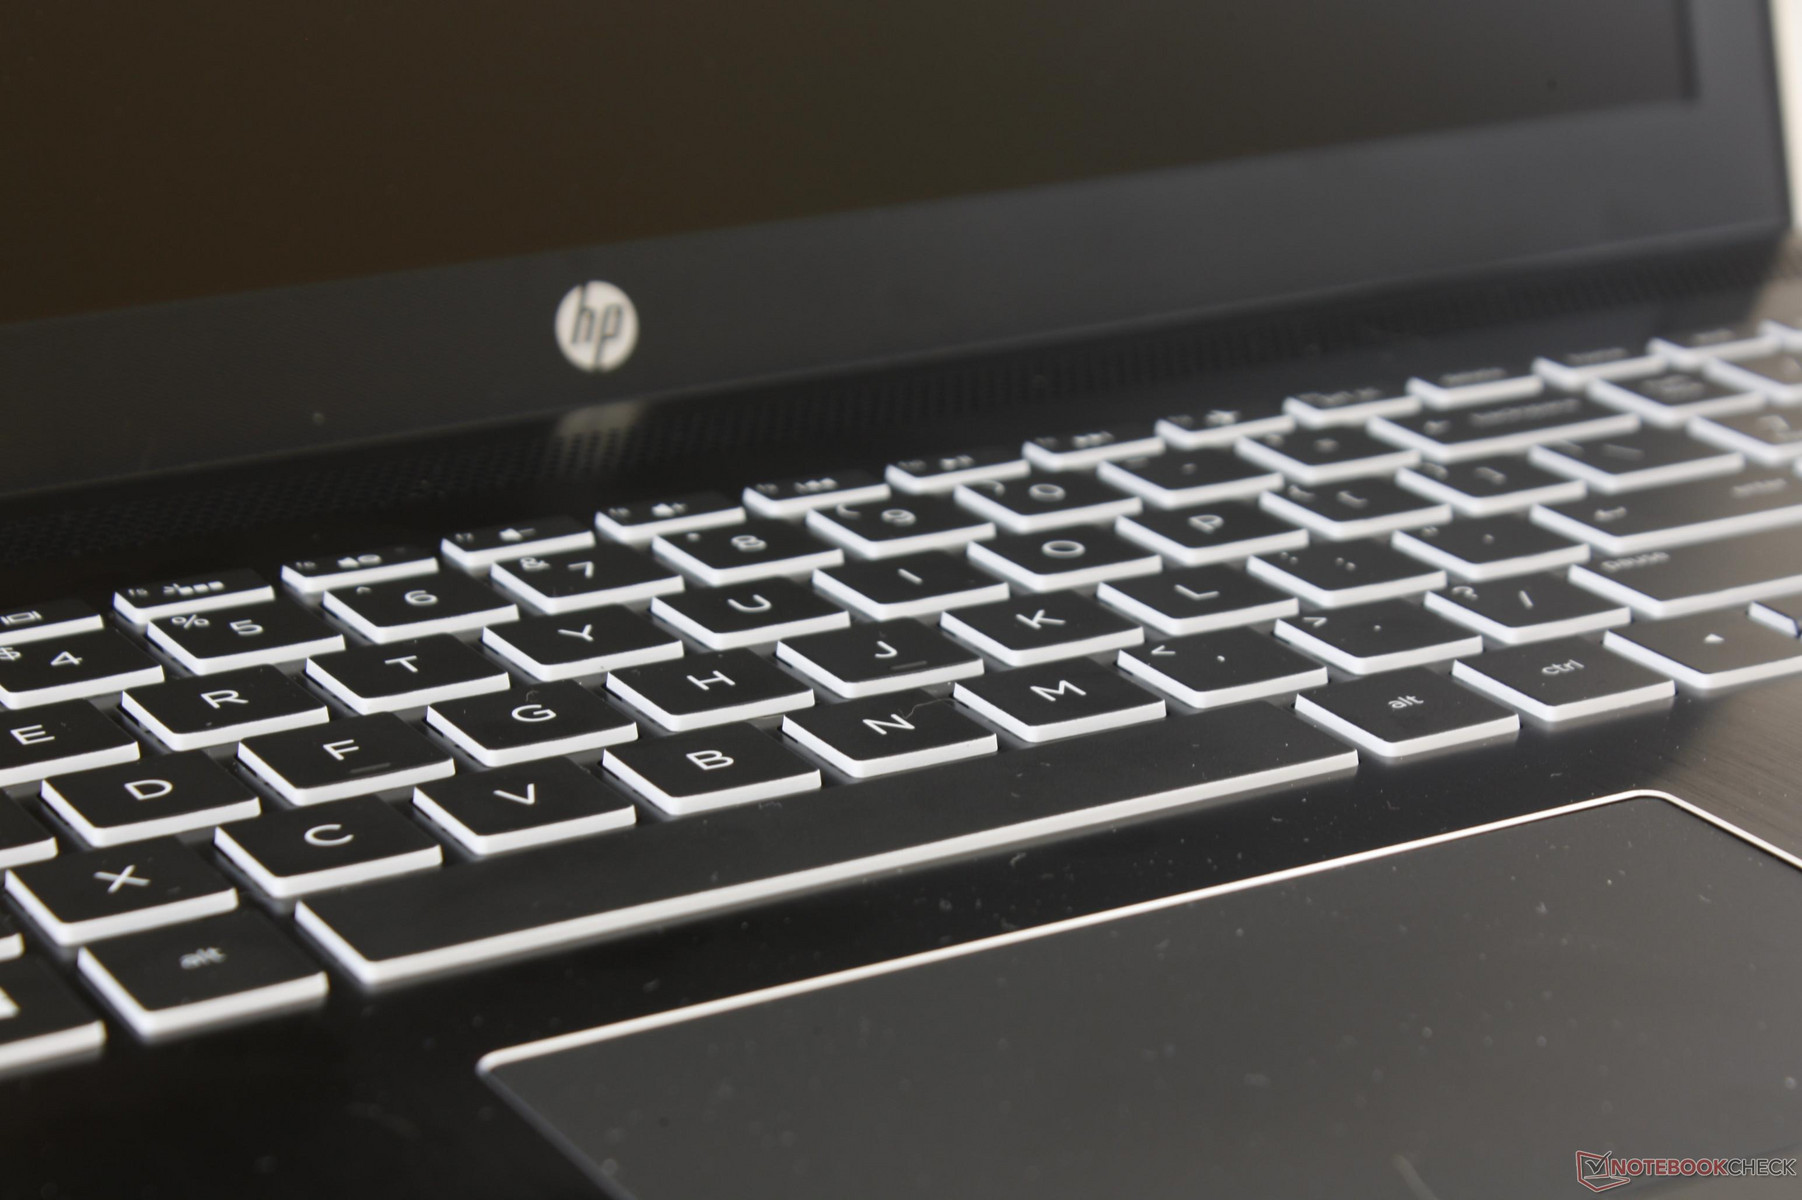
The Chiclet keyboard (~34.2 x 10.0 cm) is an improvement over the Pavilion 15t series. Since the Pavilion 15 Power chassis is more rigid, the center surface of the keyboard is firmer to press with improved tactile feedback. The plastic keys still feel softer in feedback when compared to the XPS 15 or Lenovo ThinkPad X series, but clatter is very low for a relatively quiet typing experience.
A white backlight is available that can only be toggled on or off as is common across most HP notebooks. Notebooks from competing manufacturers may have two, three, or more keyboard brightness settings in comparison.
Touchpad
The extra-wide chrome-trimmed trackpad (11.5 x 6.0 cm) is slightly smaller in surface area than on the Pavilion 15 (12.0 x 6.5 cm) and XPS 15 (10.5 x 8.5 cm). The Synaptics software can recognize up to three-finger inputs without any issues and the plastic surface flexes only slightly when applying strong pressure with a finger. While cursor control is responsive and glide is smooth, key feedback is far too spongy and weak. Dragging and dropping is quite difficult as a result and we recommend using an external mouse if possible.
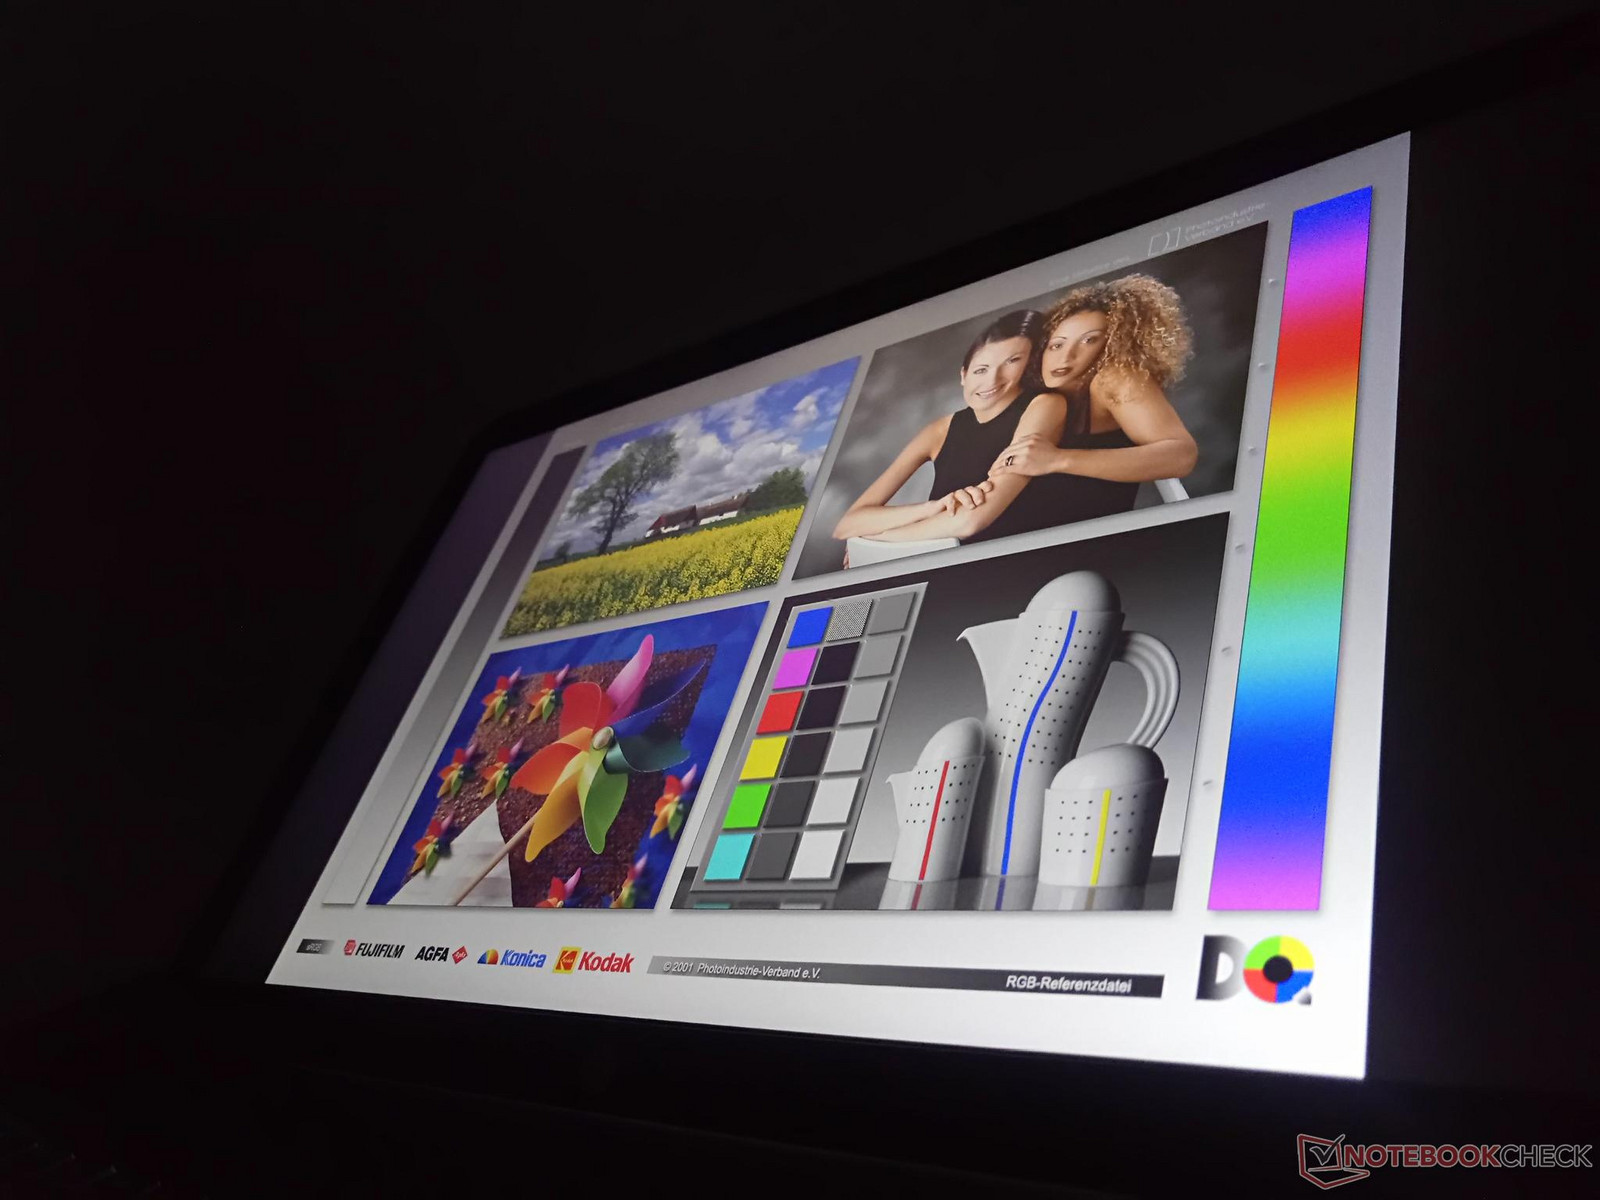
Display
The Pavilion 15 Power series includes three display options: Matte 1080p IPS, glossy 1080p IPS touchscreen, and matte 4K UHD IPS. Our test unit is equipped with the same AU Optronics AUO41ED matte 1080p IPS panel that is also used on the Pavilion 15t. This time, however, the backlight is noticeably brighter even if contrast levels, response times, are color spaces remain nearly identical between the two models. The 4K UHD panel will very likely exhibit different contrast levels and color spaces than the 1080p option not unlike the FHD and 4K UHD panels of the Spectre x360 15 series. Users who want G-Sync or 120 Hz display options will have to look at the new Omen series as neither are available on the Pavilion 15 Power.
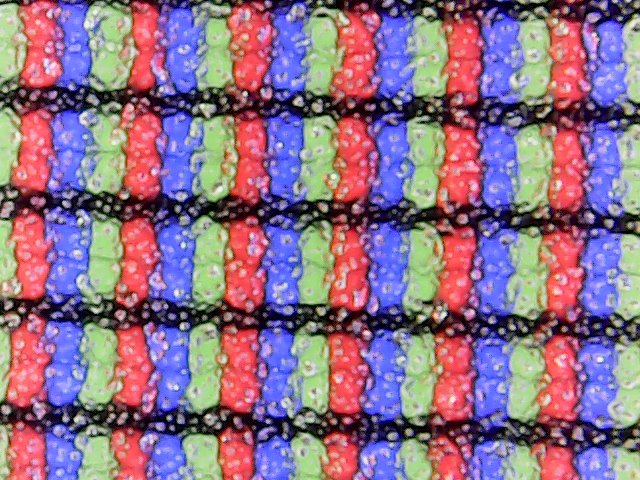
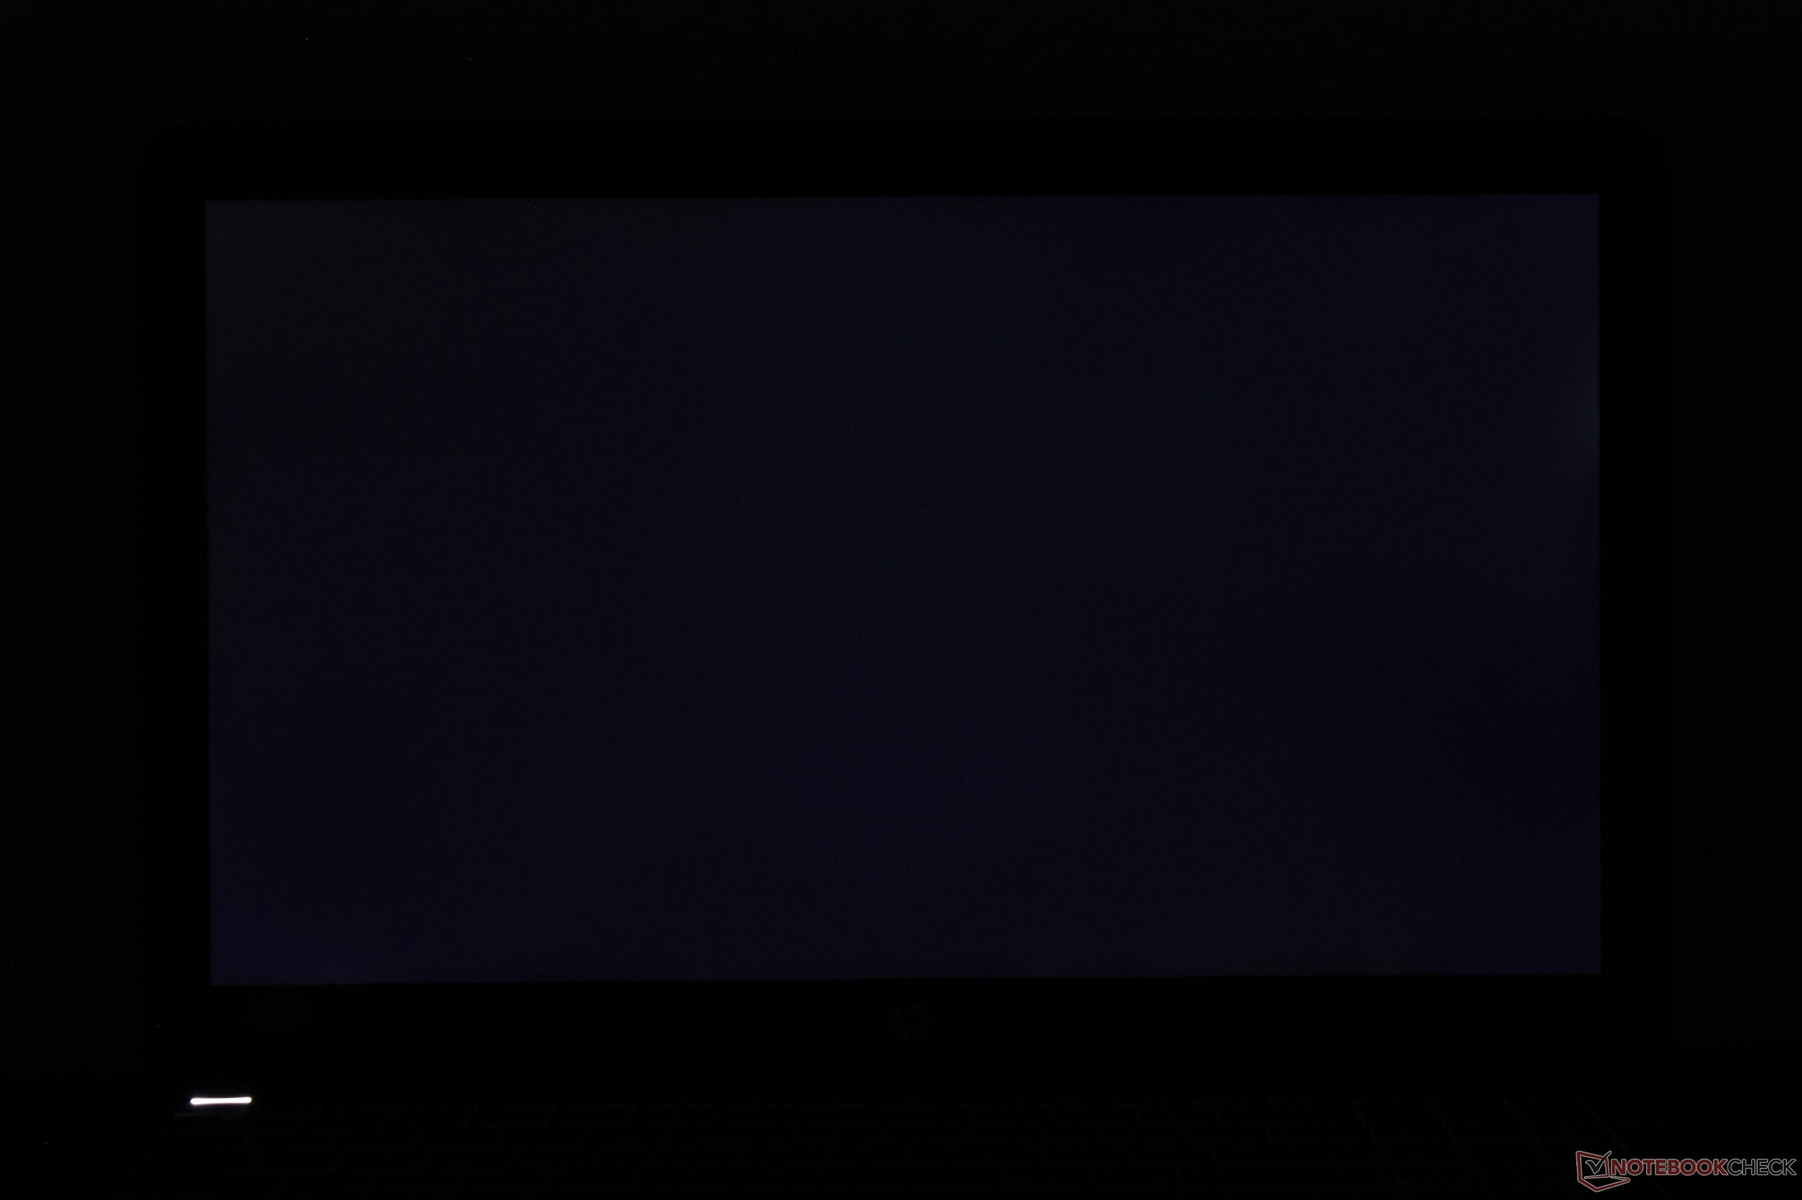
Subjectively, display quality is crisp and color temperature is not overly cool as may happen on cheaper panels. There is a slight graininess to the screen especially when compared to glossy alternatives, but we don't find it to be overly distracting during regular use. Backlight bleeding is very subtle and nigh unnoticeable around the left and right edges of our unit.
| |||||||||||||||||||||||||
Brightness Distribution: 81 %
Center on Battery: 256.6 cd/m²
Contrast: 1351:1 (Black: 0.19 cd/m²)
ΔE ColorChecker Calman: 5 | ∀{0.5-29.43 Ø4.73}
ΔE Greyscale Calman: 2.7 | ∀{0.09-98 Ø4.97}
57.7% sRGB (Argyll 1.6.3 3D)
36.7% AdobeRGB 1998 (Argyll 1.6.3 3D)
40.03% AdobeRGB 1998 (Argyll 3D)
57.9% sRGB (Argyll 3D)
38.81% Display P3 (Argyll 3D)
Gamma: 2.32
CCT: 6599 K
| HP Pavilion 15 Power 1GK62AV ID: AU Optronics AUO41ED, IPS, 15.6", 1920x1080 | Lenovo Yoga 720-15IKB-80X7 Chi Mei CMN N156HCE-EN1, IPS, 15.6", 1920x1080 | Lenovo Legion Y520-15IKBN-80WK001KUS LP156WF6-SPK3, IPS, 15.6", 1920x1080 | Acer Aspire VX15 VX5-591G-589S BOE CQ NV156HFM-N42, IPS, 15.6", 1920x1080 | Samsung Odyssey NP800G5M-X01US IPS, 15.6", 1920x1080 | HP Pavilion 15t-X7P42AV AU Optronics AUO41ED, IPS, 15.6", 1920x1080 | |
|---|---|---|---|---|---|---|
| Display | 63% | 4% | 22% | -2% | ||
| Display P3 Coverage (%) | 38.81 | 65 67% | 40.56 5% | 47.11 21% | 38.03 -2% | |
| sRGB Coverage (%) | 57.9 | 90.8 57% | 59.4 3% | 70.4 22% | 56.5 -2% | |
| AdobeRGB 1998 Coverage (%) | 40.03 | 65.8 64% | 41.9 5% | 48.71 22% | 39.29 -2% | |
| Response Times | 15% | -41% | -20% | -10% | -6% | |
| Response Time Grey 50% / Grey 80% * (ms) | 38.8 ? | 29.6 ? 24% | 58.8 ? -52% | 46 ? -19% | 38.8 ? -0% | 44.4 ? -14% |
| Response Time Black / White * (ms) | 28 ? | 26.4 ? 6% | 36 ? -29% | 34 ? -21% | 33.6 ? -20% | 27.2 ? 3% |
| PWM Frequency (Hz) | 25510 ? | 21550 ? | 20000 ? | 19230 ? | ||
| Screen | 2% | -29% | 2% | -28% | -31% | |
| Brightness middle (cd/m²) | 256.6 | 300.9 17% | 239 -7% | 277 8% | 255.9 0% | 209.7 -18% |
| Brightness (cd/m²) | 243 | 285 17% | 244 0% | 268 10% | 249 2% | 193 -21% |
| Brightness Distribution (%) | 81 | 92 14% | 88 9% | 91 12% | 90 11% | 75 -7% |
| Black Level * (cd/m²) | 0.19 | 0.24 -26% | 0.35 -84% | 0.26 -37% | 0.48 -153% | 0.19 -0% |
| Contrast (:1) | 1351 | 1254 -7% | 683 -49% | 1065 -21% | 533 -61% | 1104 -18% |
| Colorchecker dE 2000 * | 5 | 5 -0% | 7.3 -46% | 5.05 -1% | 5.9 -18% | 7.8 -56% |
| Colorchecker dE 2000 max. * | 20.1 | 10.2 49% | 24.7 -23% | 8.93 56% | 18.9 6% | 24.1 -20% |
| Greyscale dE 2000 * | 2.7 | 7 -159% | 4.9 -81% | 2.97 -10% | 5.6 -107% | 7.3 -170% |
| Gamma | 2.32 95% | 2.34 94% | 2.19 100% | 2.39 92% | 2.21 100% | 2.39 92% |
| CCT | 6599 98% | 6578 99% | 7332 89% | 6466 101% | 7250 90% | 5771 113% |
| Color Space (Percent of AdobeRGB 1998) (%) | 36.7 | 59 61% | 35 -5% | 38 4% | 44.8 22% | 39.3 7% |
| Color Space (Percent of sRGB) (%) | 57.7 | 90 56% | 55 -5% | 59 2% | 70.1 21% | 56.5 -2% |
| Total Average (Program / Settings) | 27% /
16% | -35% /
-31% | -5% /
-0% | -5% /
-15% | -13% /
-21% |
* ... smaller is better
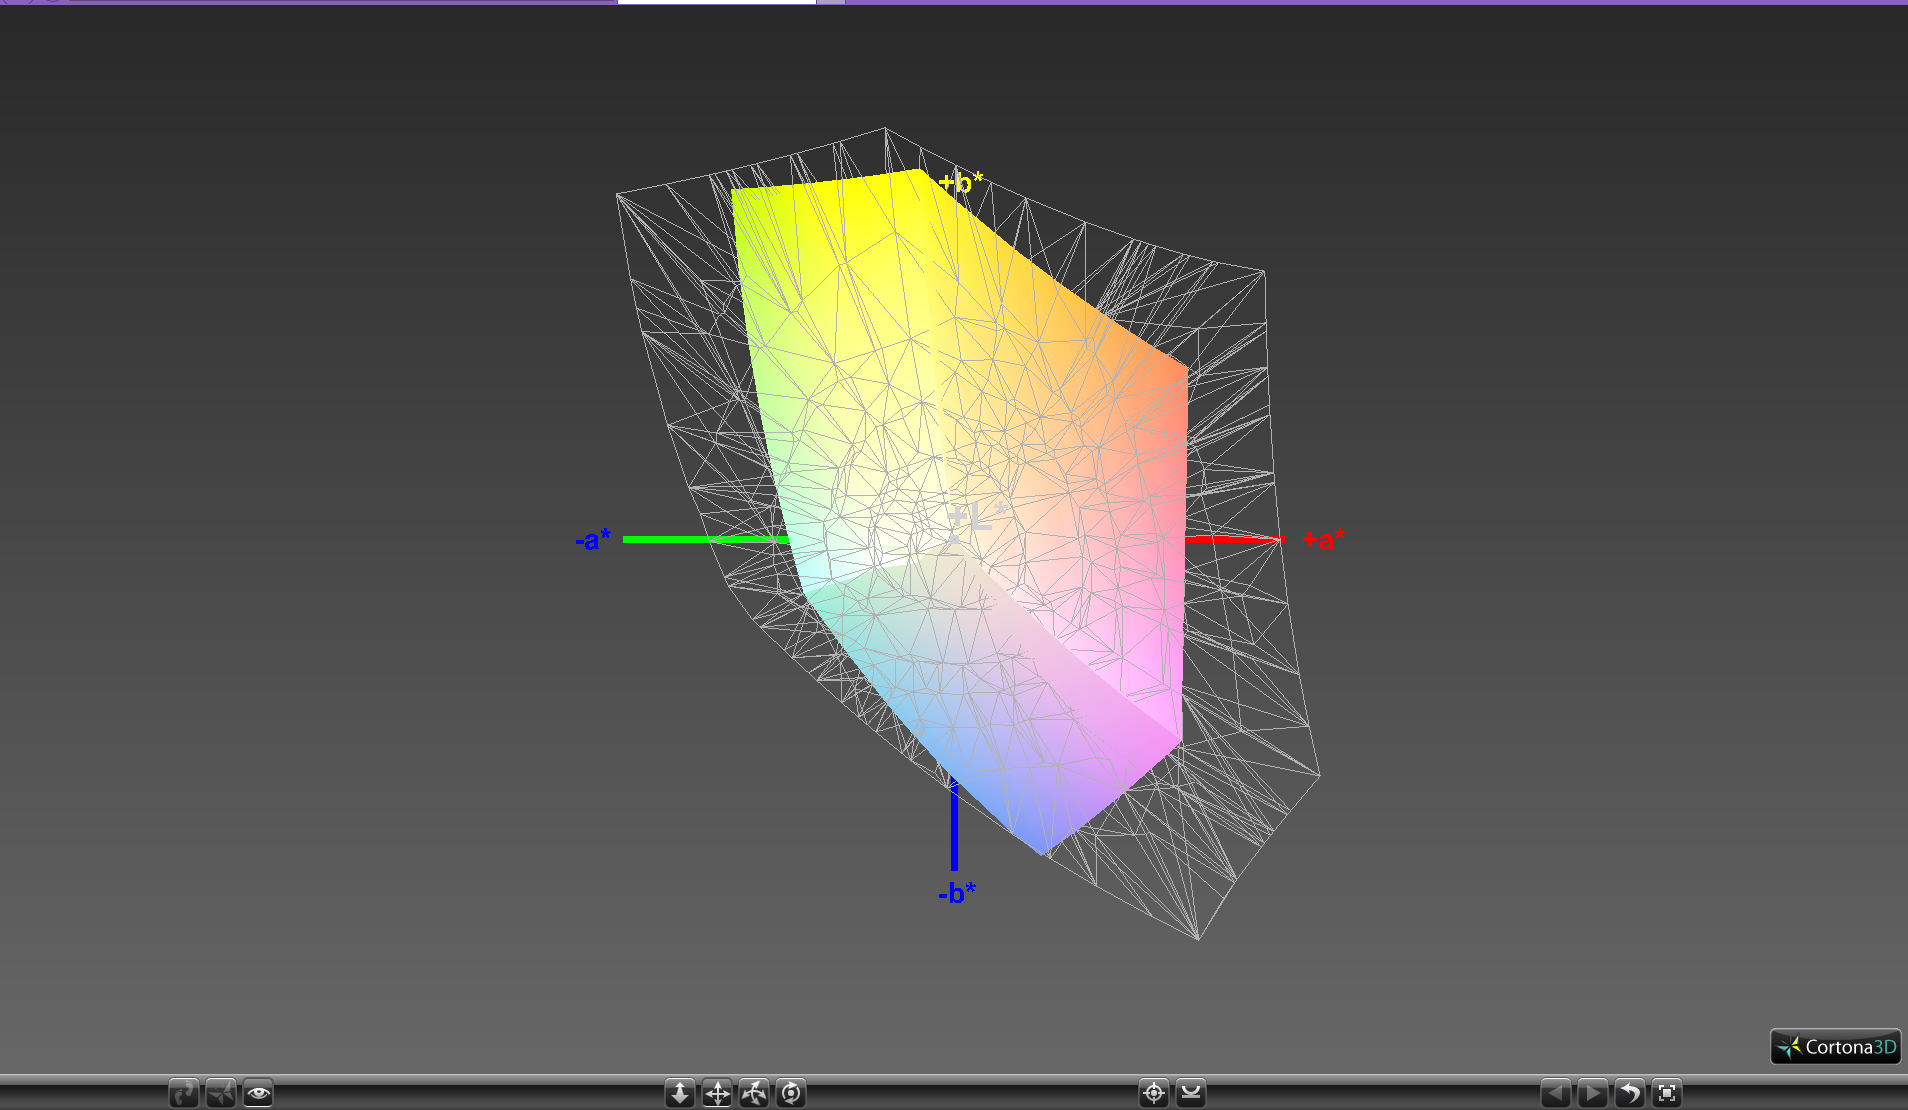
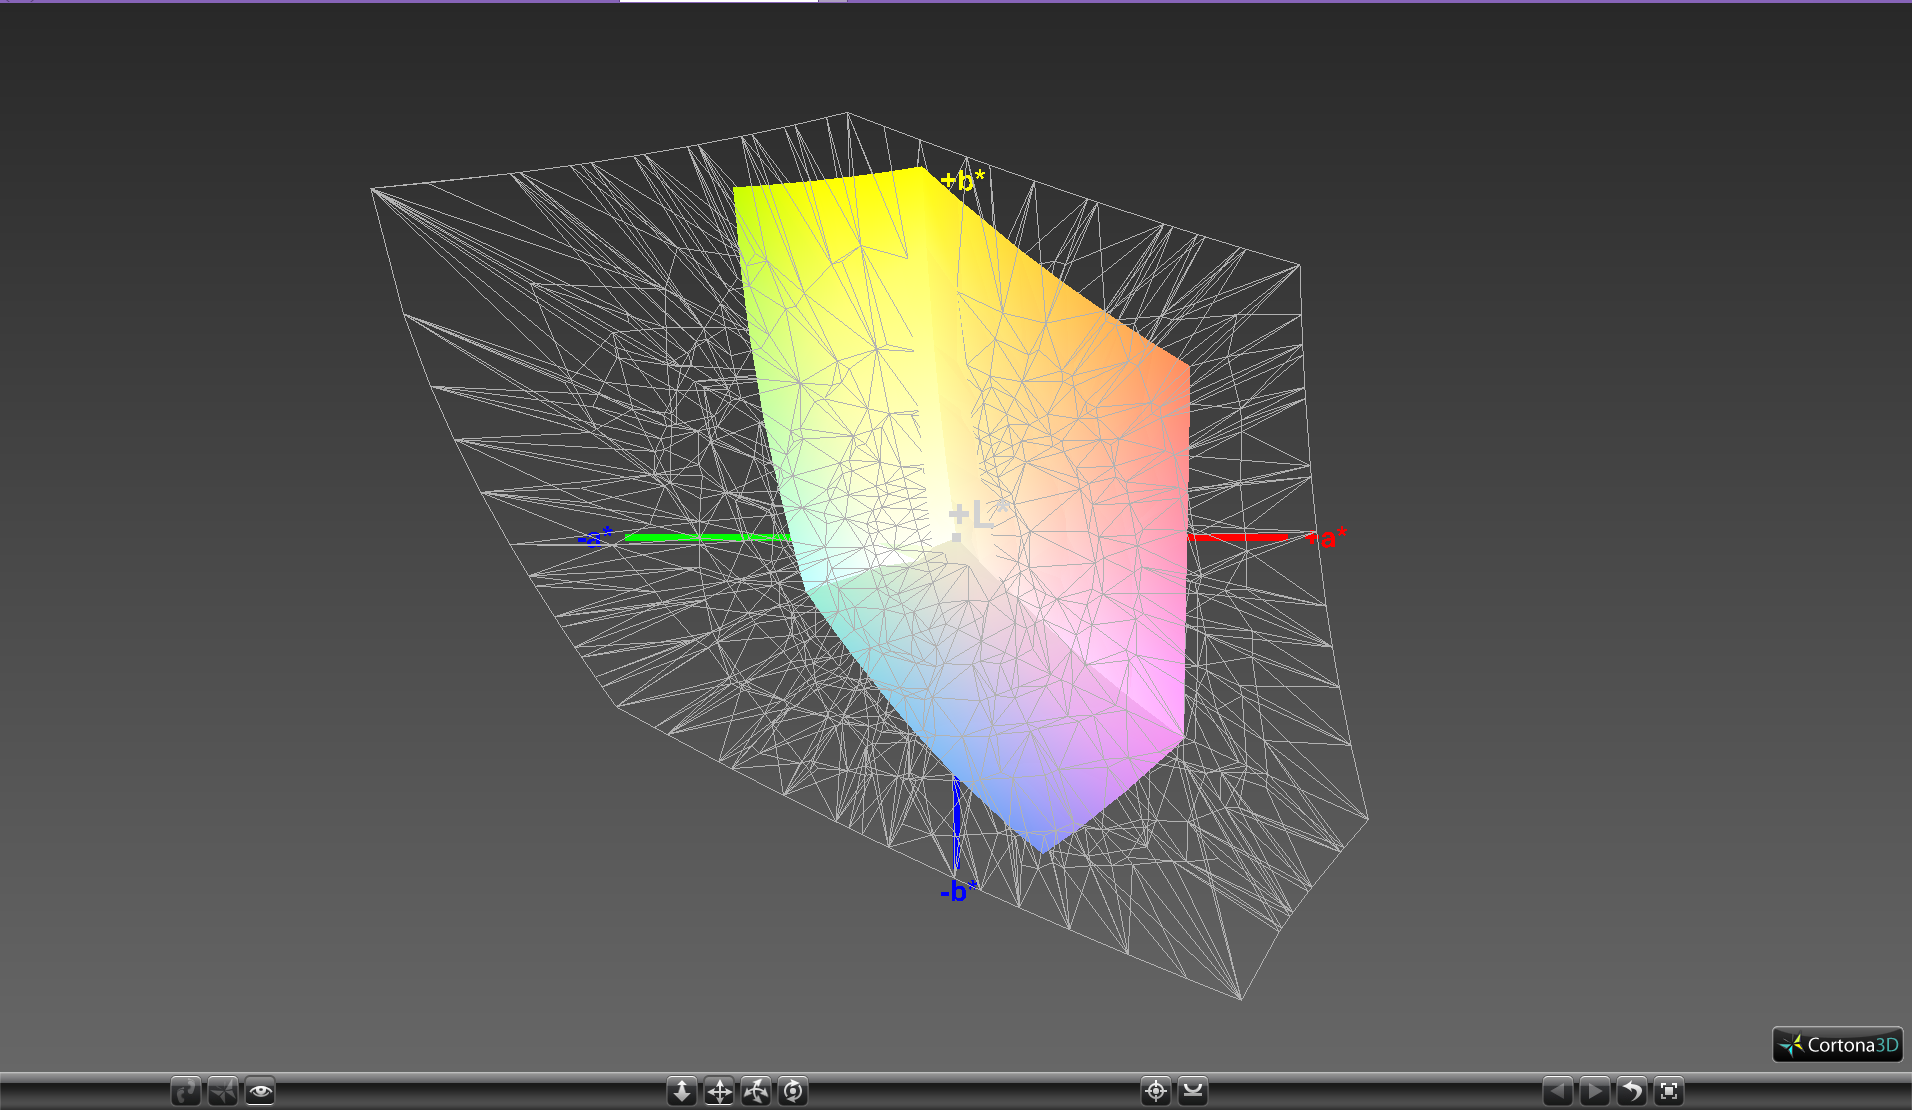
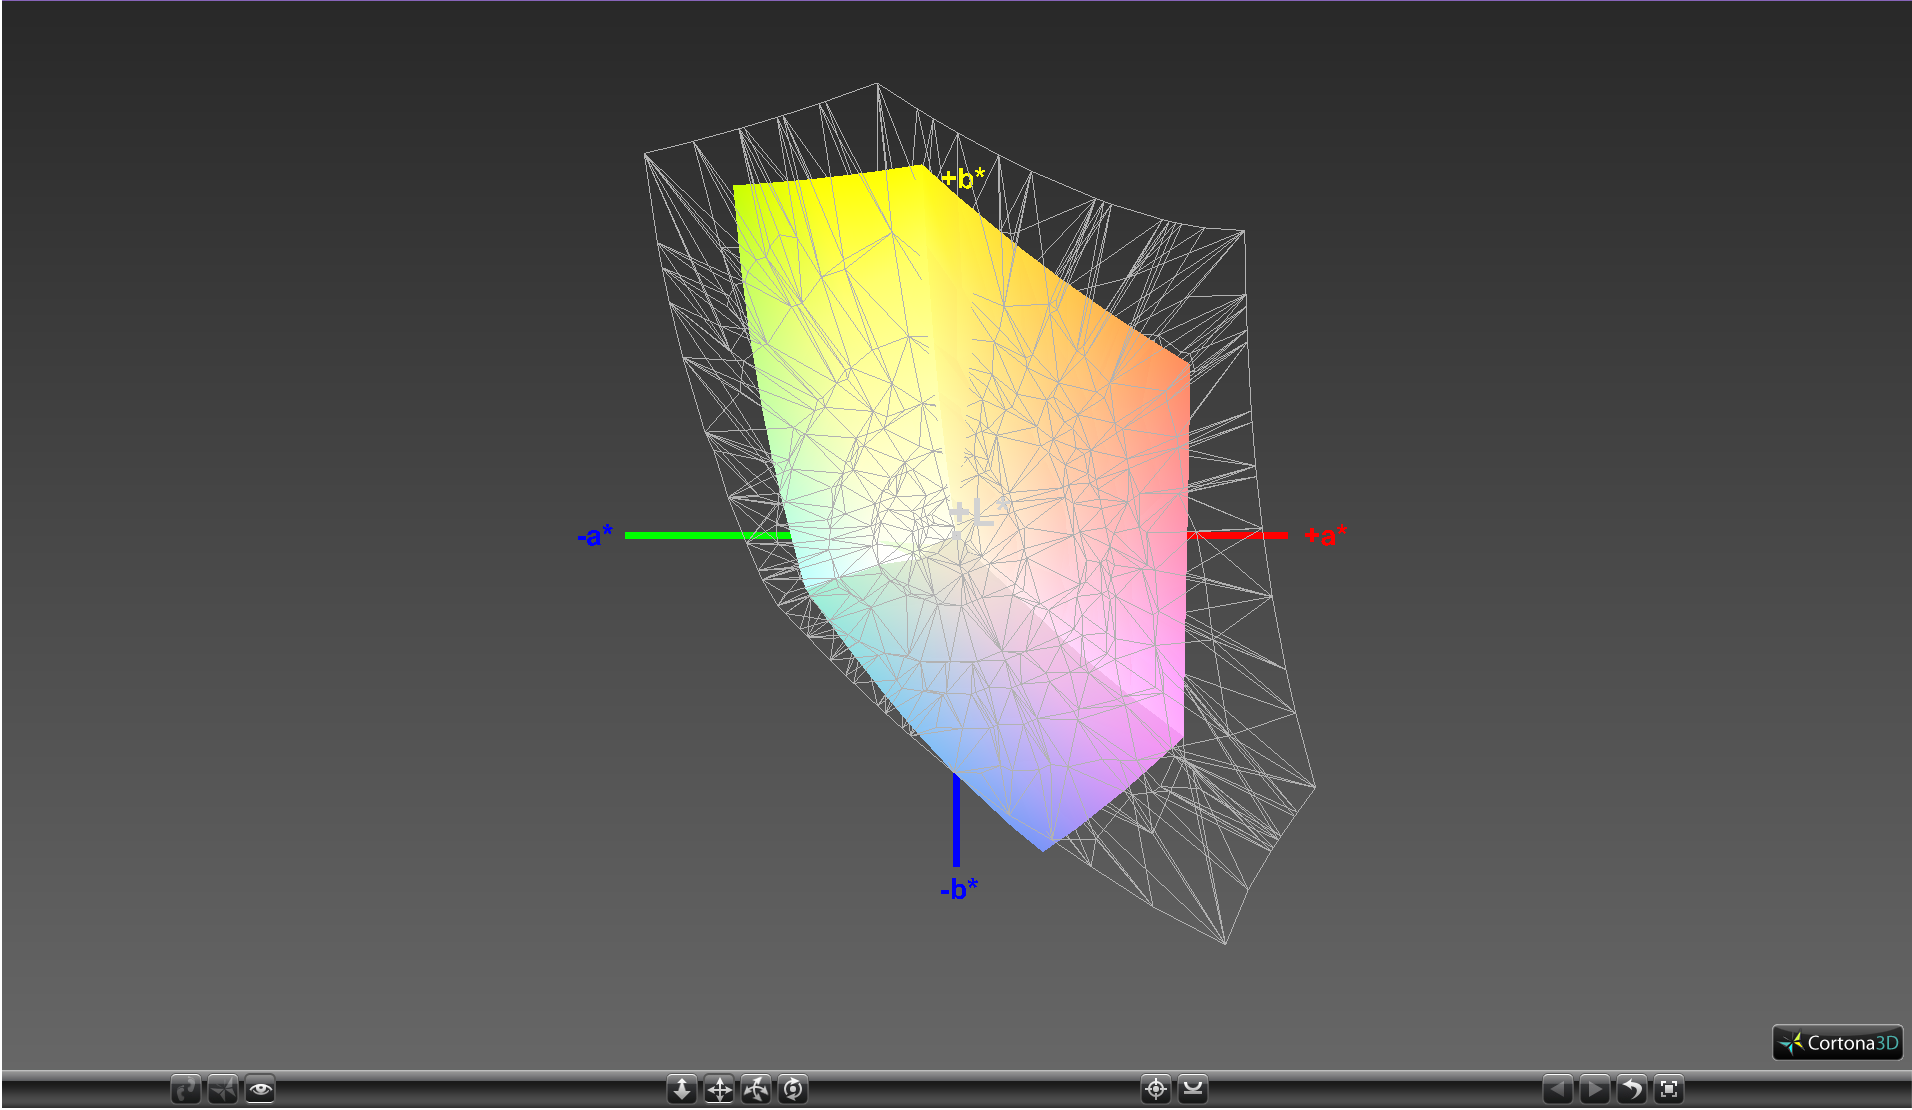
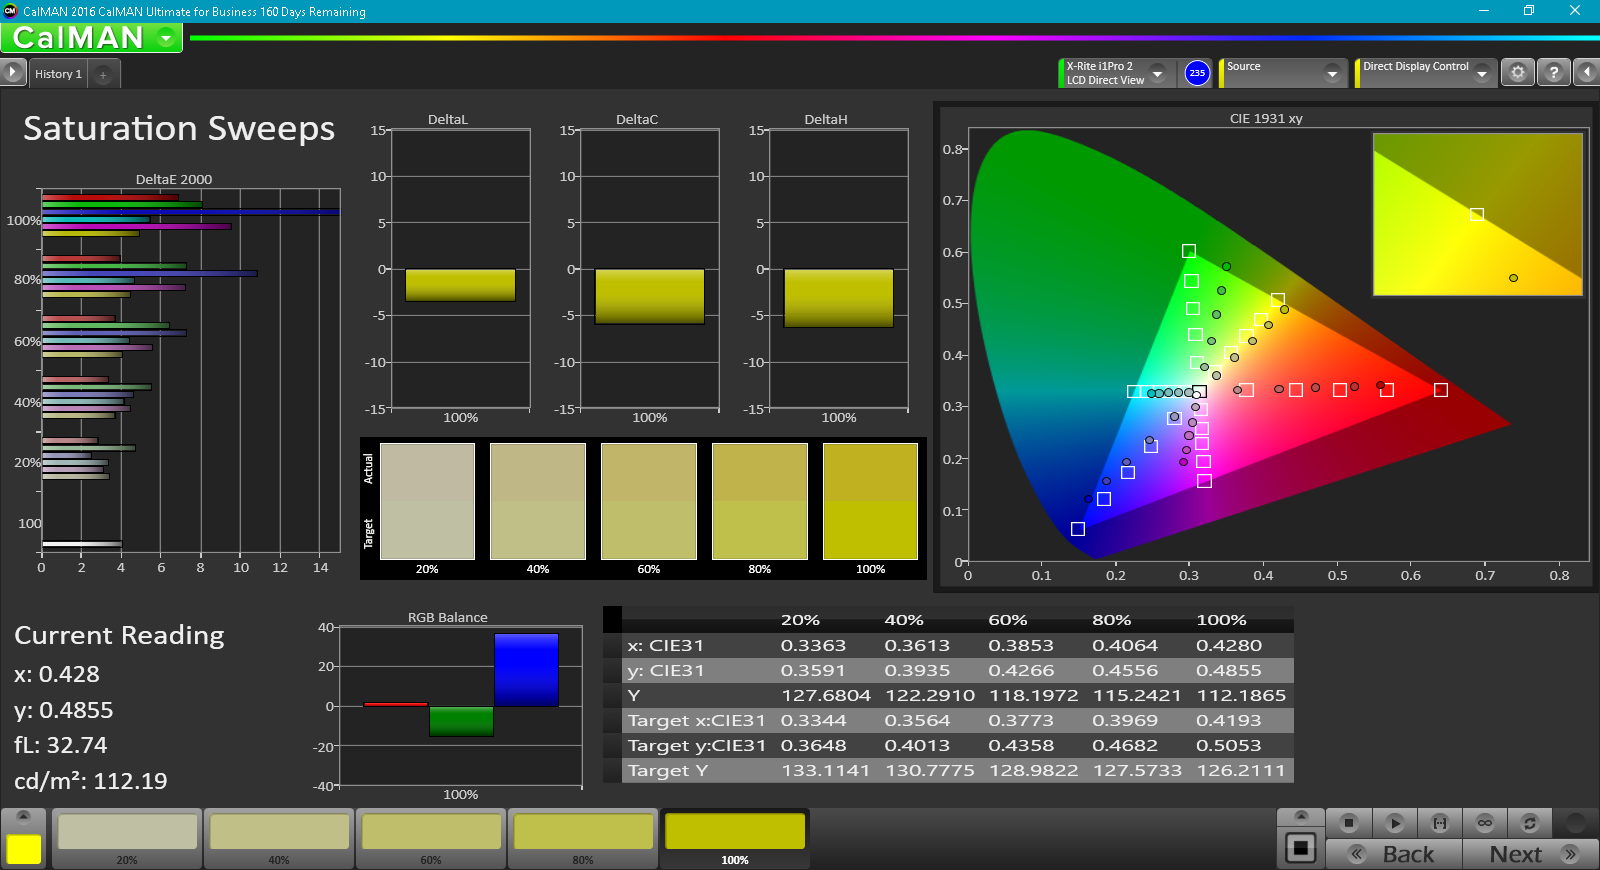
Color coverage is approximately 57 percent and 38 percent of the sRGB and AdobeRGB standards, respectively, not unlike the Pavilion 15t. This limited color space is standard on many mainstream IPS panels and users looking for wider gamuts may want to consider the Yoga 720, XPS 15 series, or even the new Spectre x360 15 instead. For gaming and everyday browsing purposes, however, the colors are sufficient.
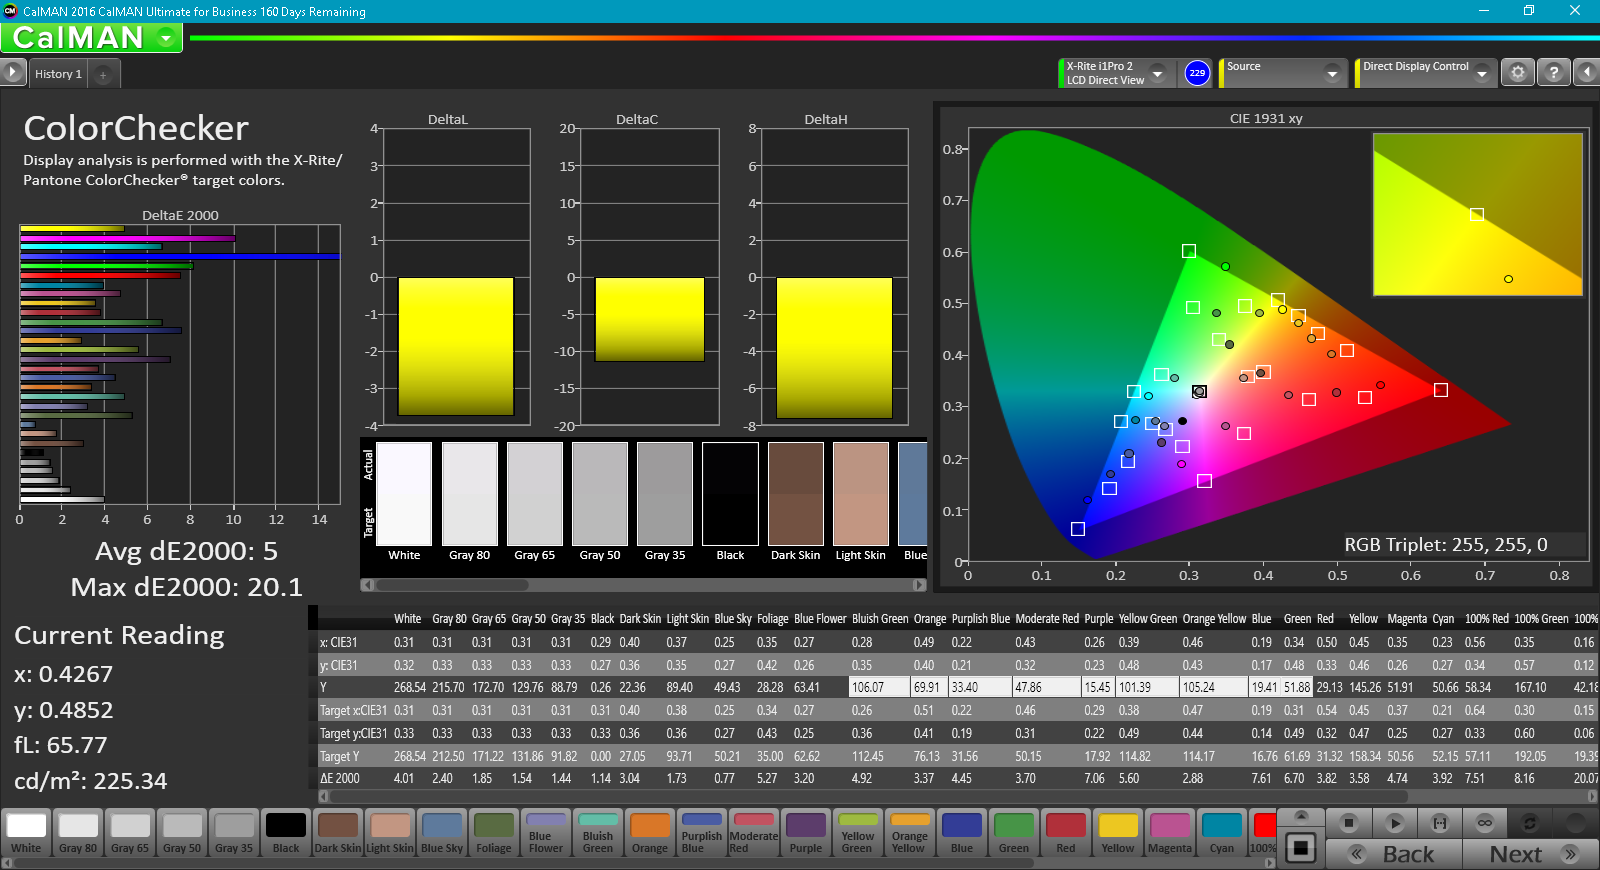
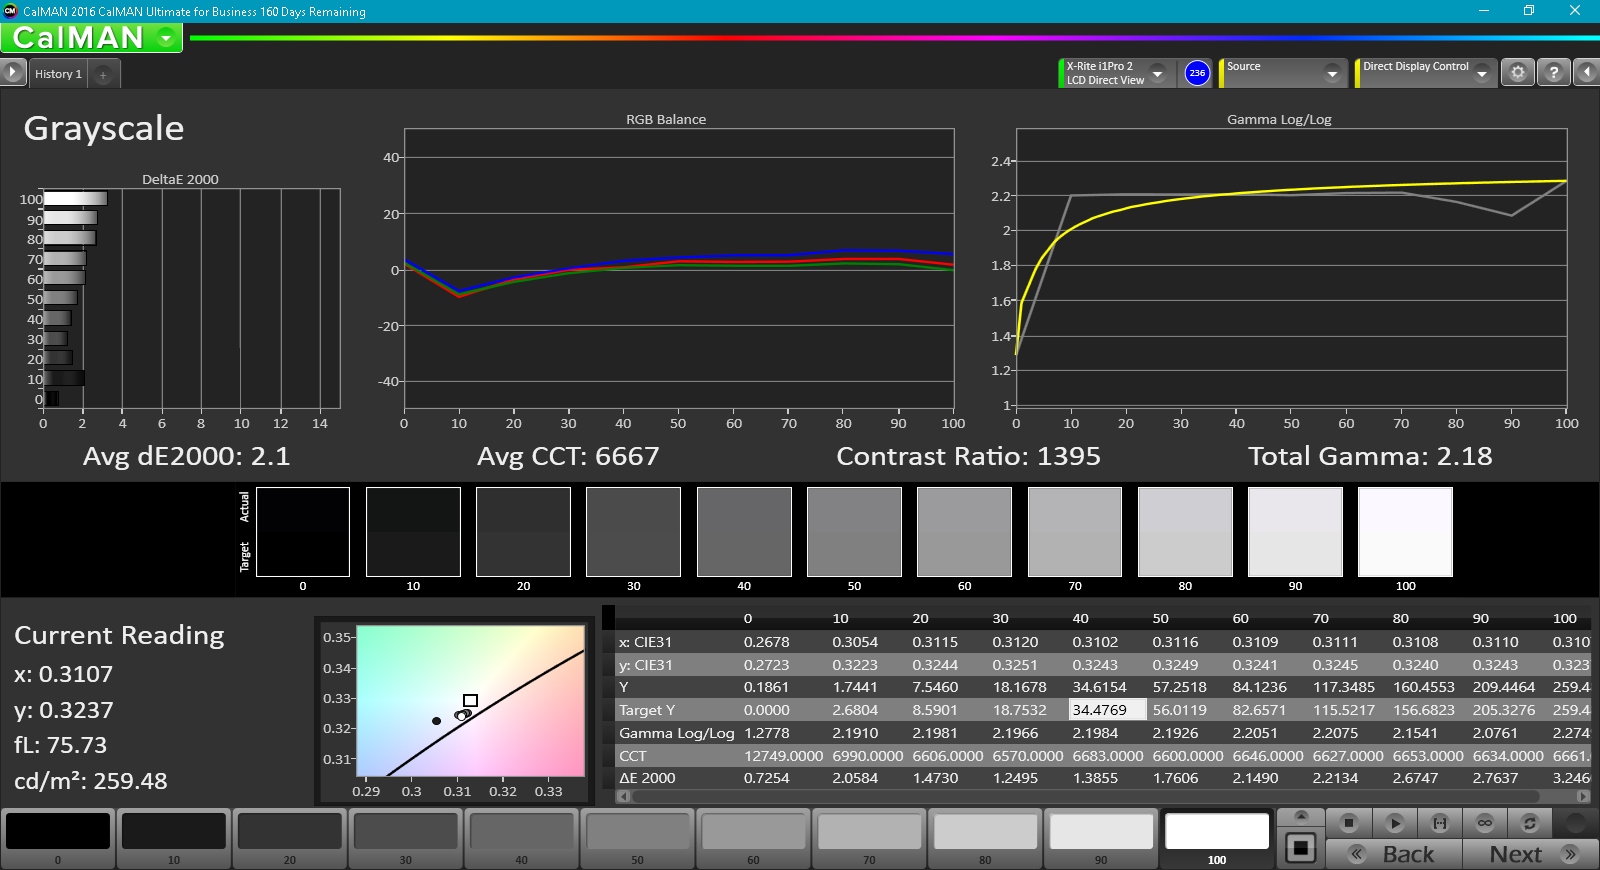
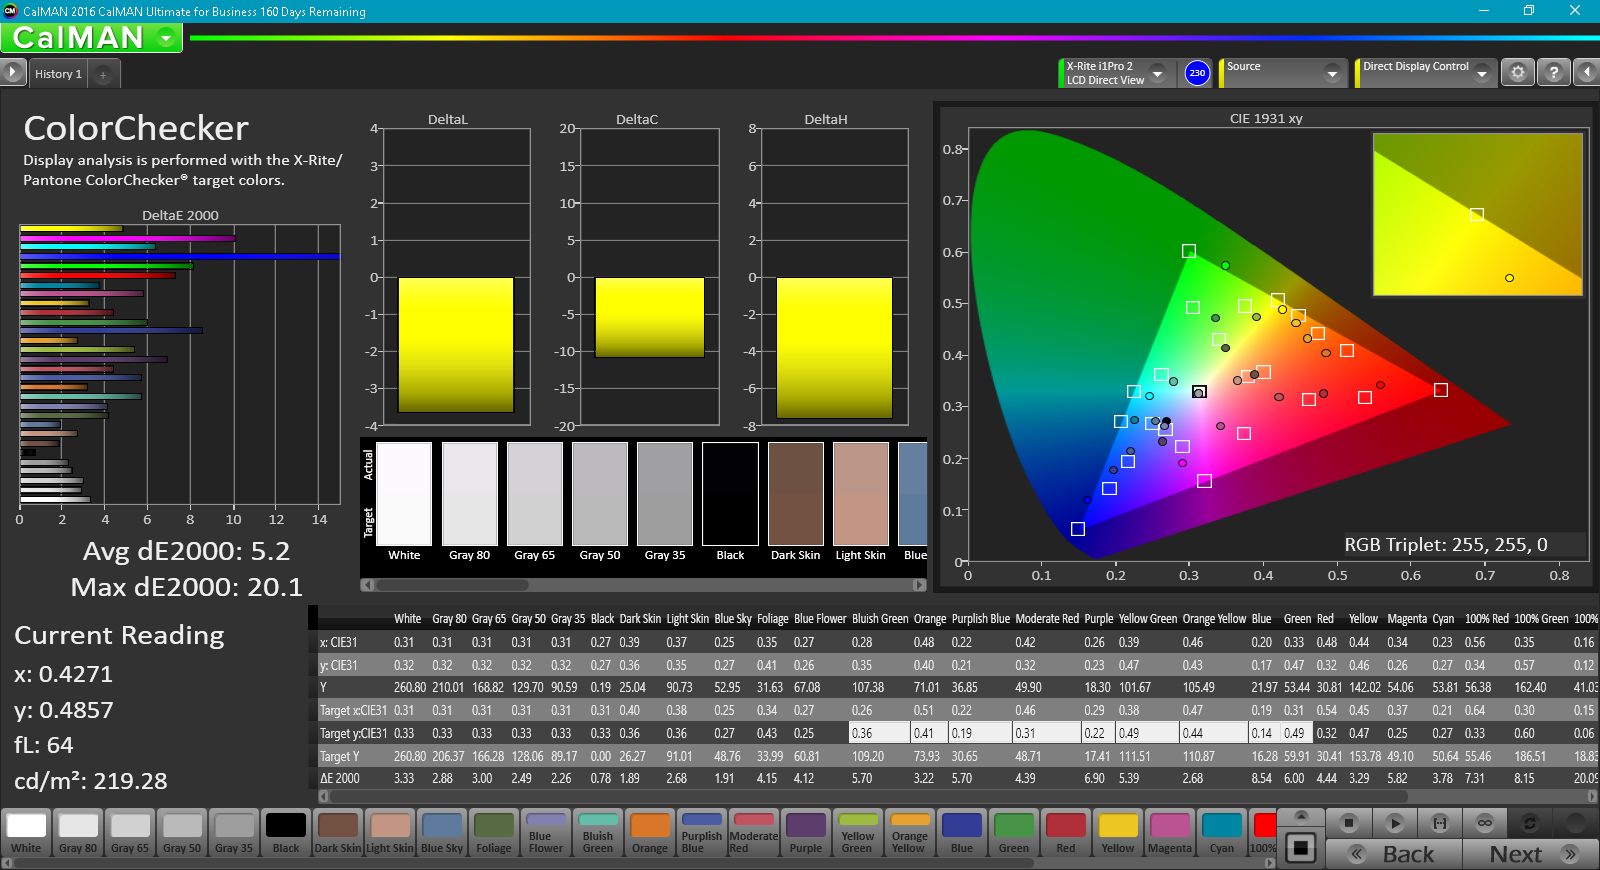
Further measurements with an X-Rite spectrophotometer reveal accurate grayscale and colors out of the box and an average grayscale DeltaE of 2.7. This is somewhat of a surprise given that the Pavilion 15t ships with a very similar AU Optronics panel but at a poorly calibrated state. Colors become increasingly inaccurate the higher the saturation level due to the panel's limited sRGB coverage.


Display Response Times
| ↔ Response Time Black to White | ||
|---|---|---|
| 28 ms ... rise ↗ and fall ↘ combined | ↗ 16.4 ms rise | 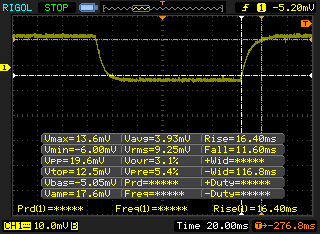 |
| ↘ 11.6 ms fall | ||
| The screen shows relatively slow response rates in our tests and may be too slow for gamers. In comparison, all tested devices range from 0.1 (minimum) to 240 (maximum) ms. » 71 % of all devices are better. This means that the measured response time is worse than the average of all tested devices (19.9 ms). | ||
| ↔ Response Time 50% Grey to 80% Grey | ||
| 38.8 ms ... rise ↗ and fall ↘ combined | ↗ 20 ms rise | 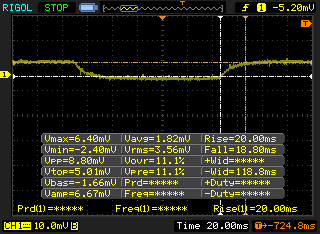 |
| ↘ 18.8 ms fall | ||
| The screen shows slow response rates in our tests and will be unsatisfactory for gamers. In comparison, all tested devices range from 0.165 (minimum) to 636 (maximum) ms. » 58 % of all devices are better. This means that the measured response time is worse than the average of all tested devices (31.1 ms). | ||
Screen Flickering / PWM (Pulse-Width Modulation)
| Screen flickering / PWM not detected | 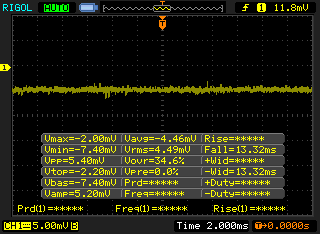 | ||
In comparison: 52 % of all tested devices do not use PWM to dim the display. If PWM was detected, an average of 7798 (minimum: 5 - maximum: 343500) Hz was measured. | |||
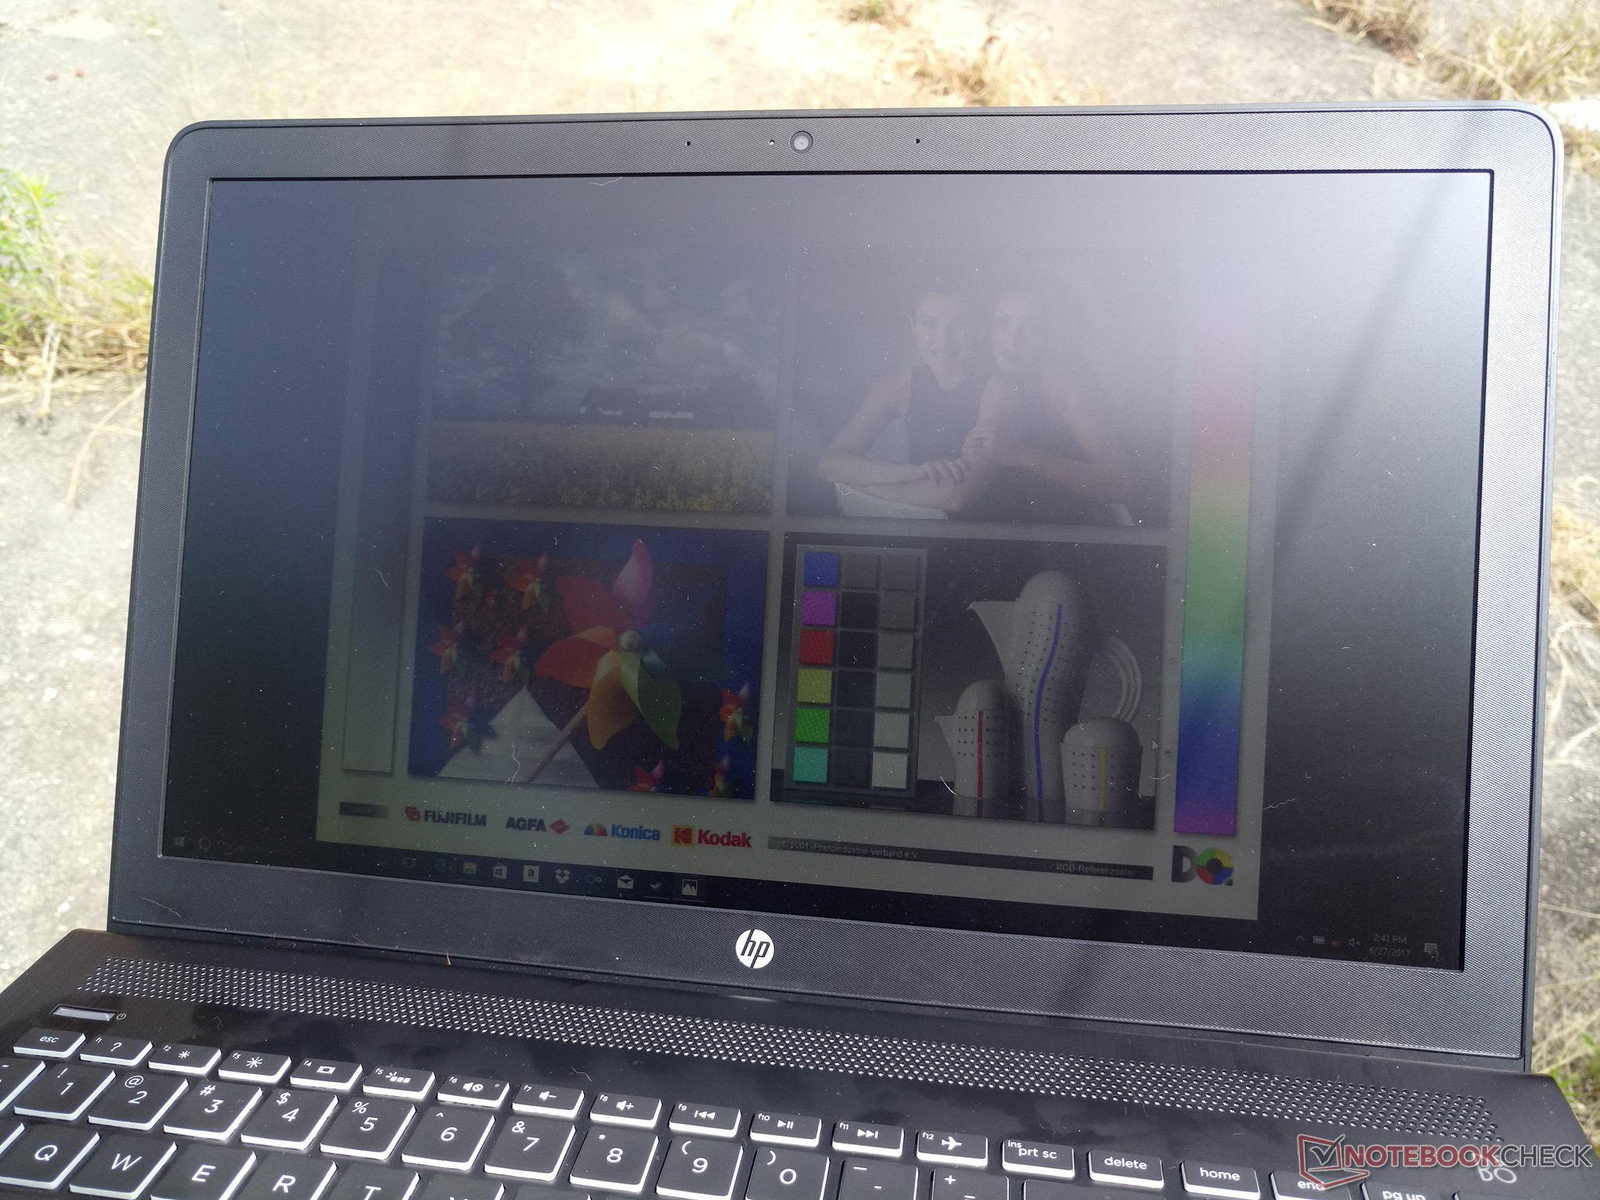
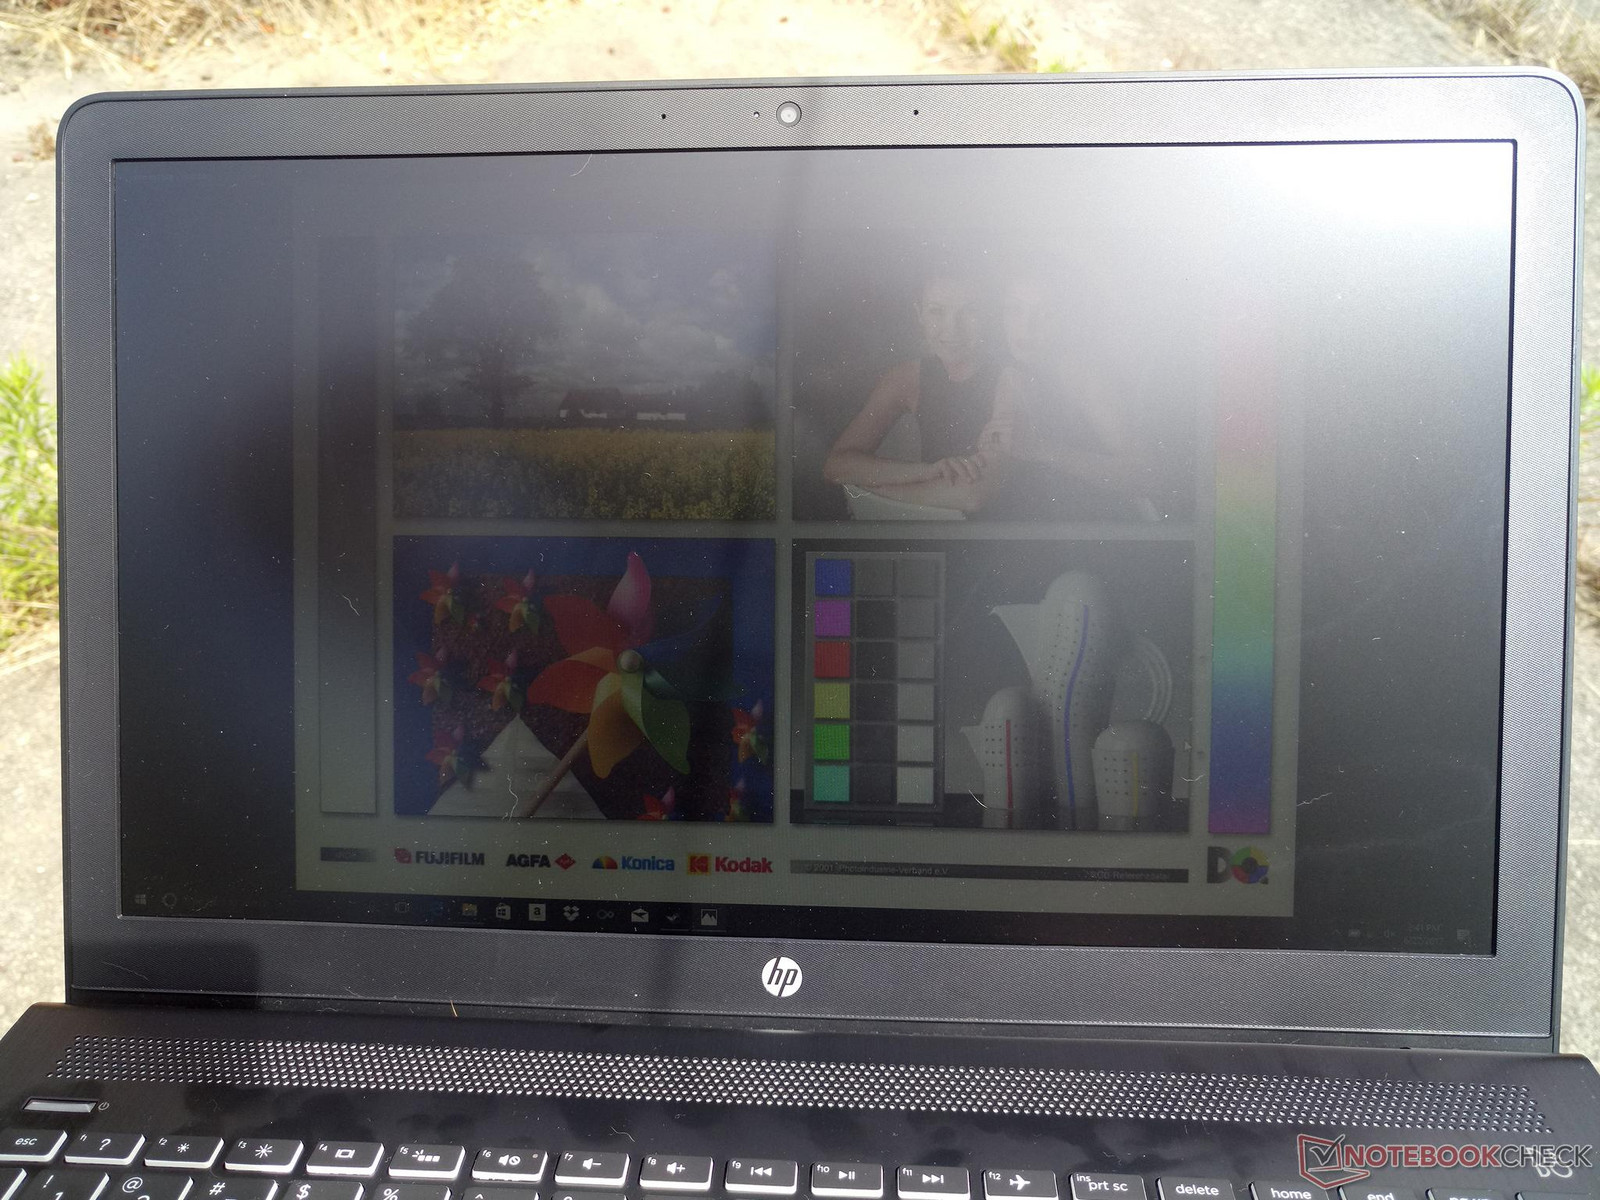
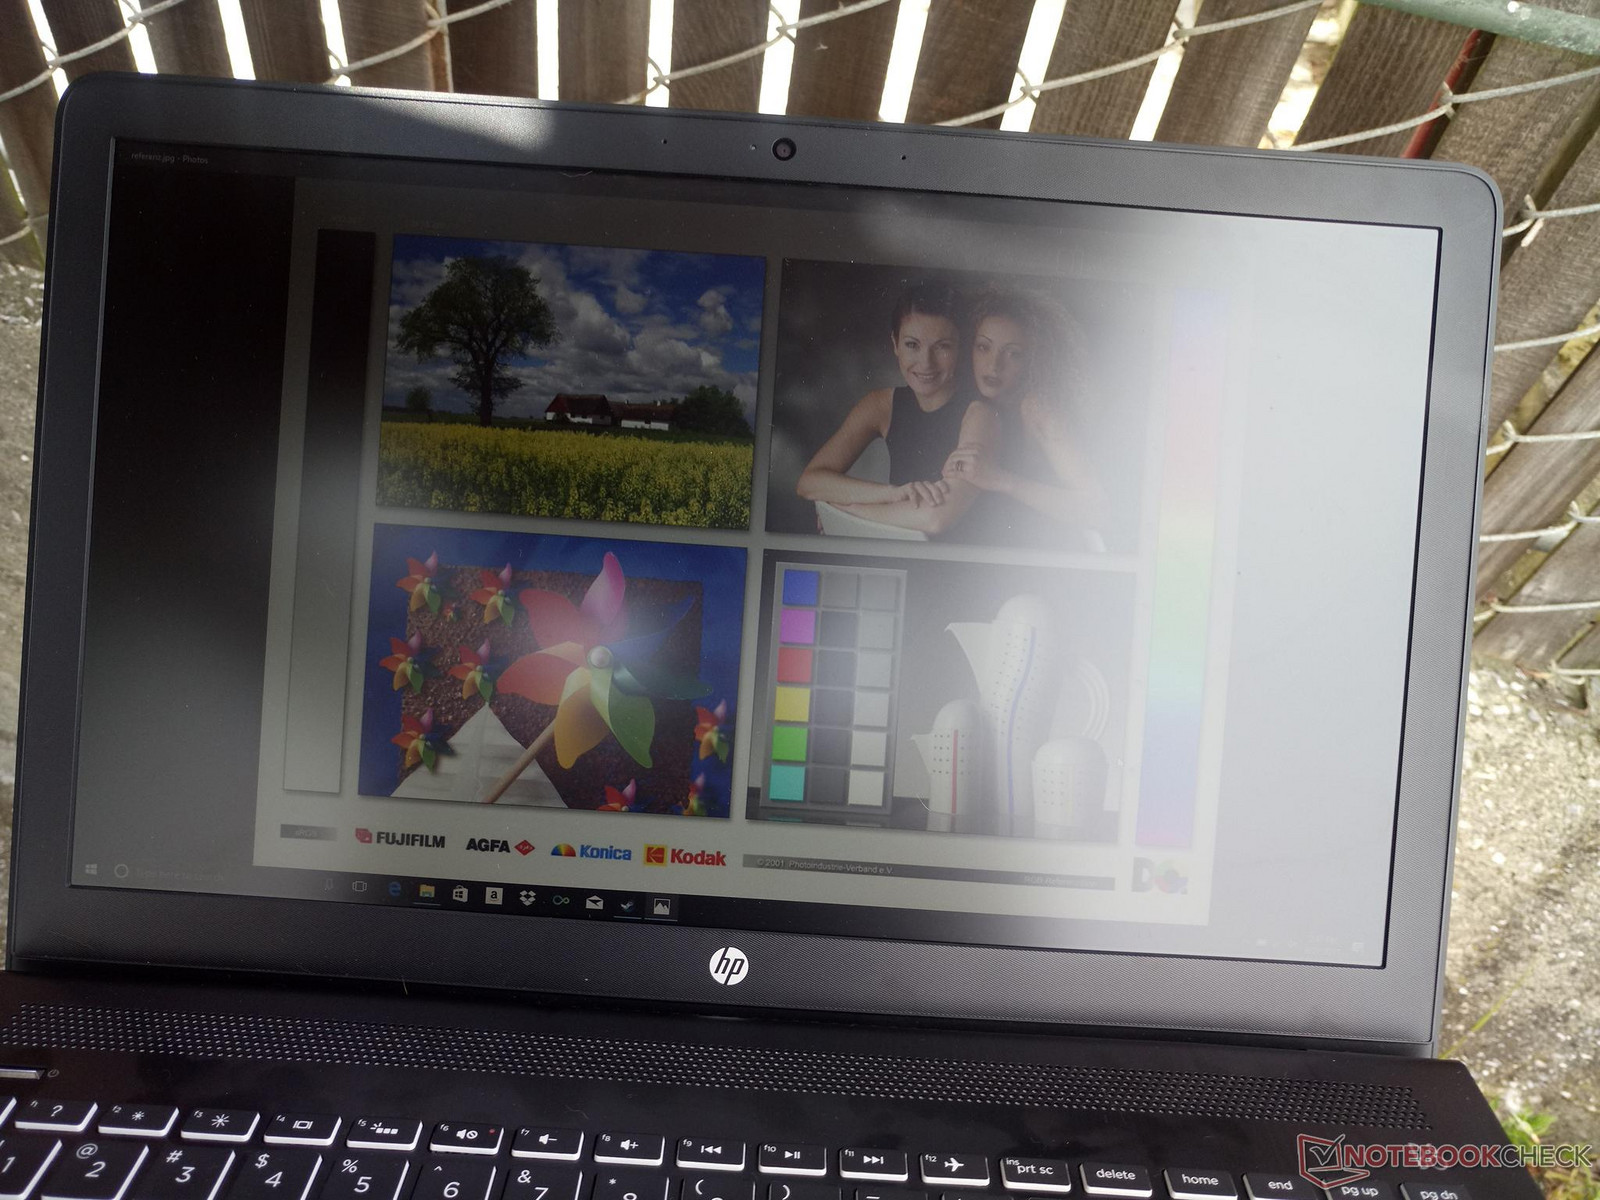
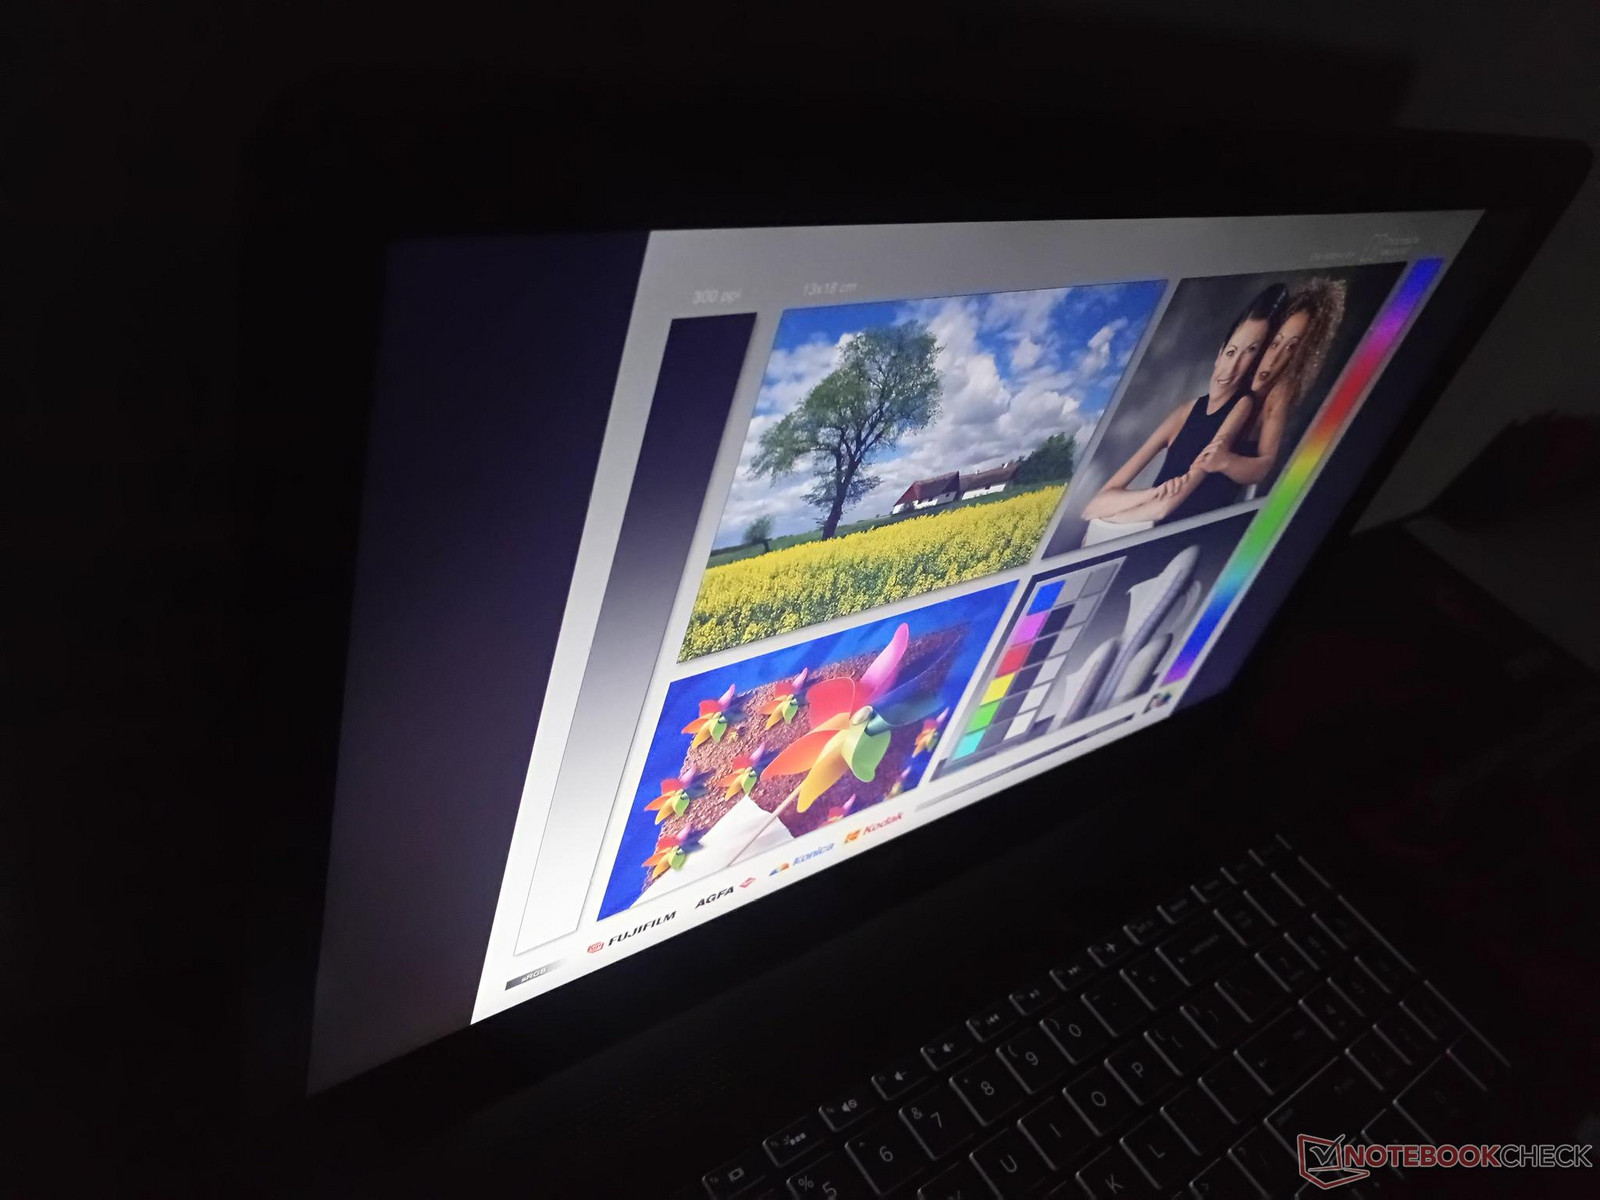
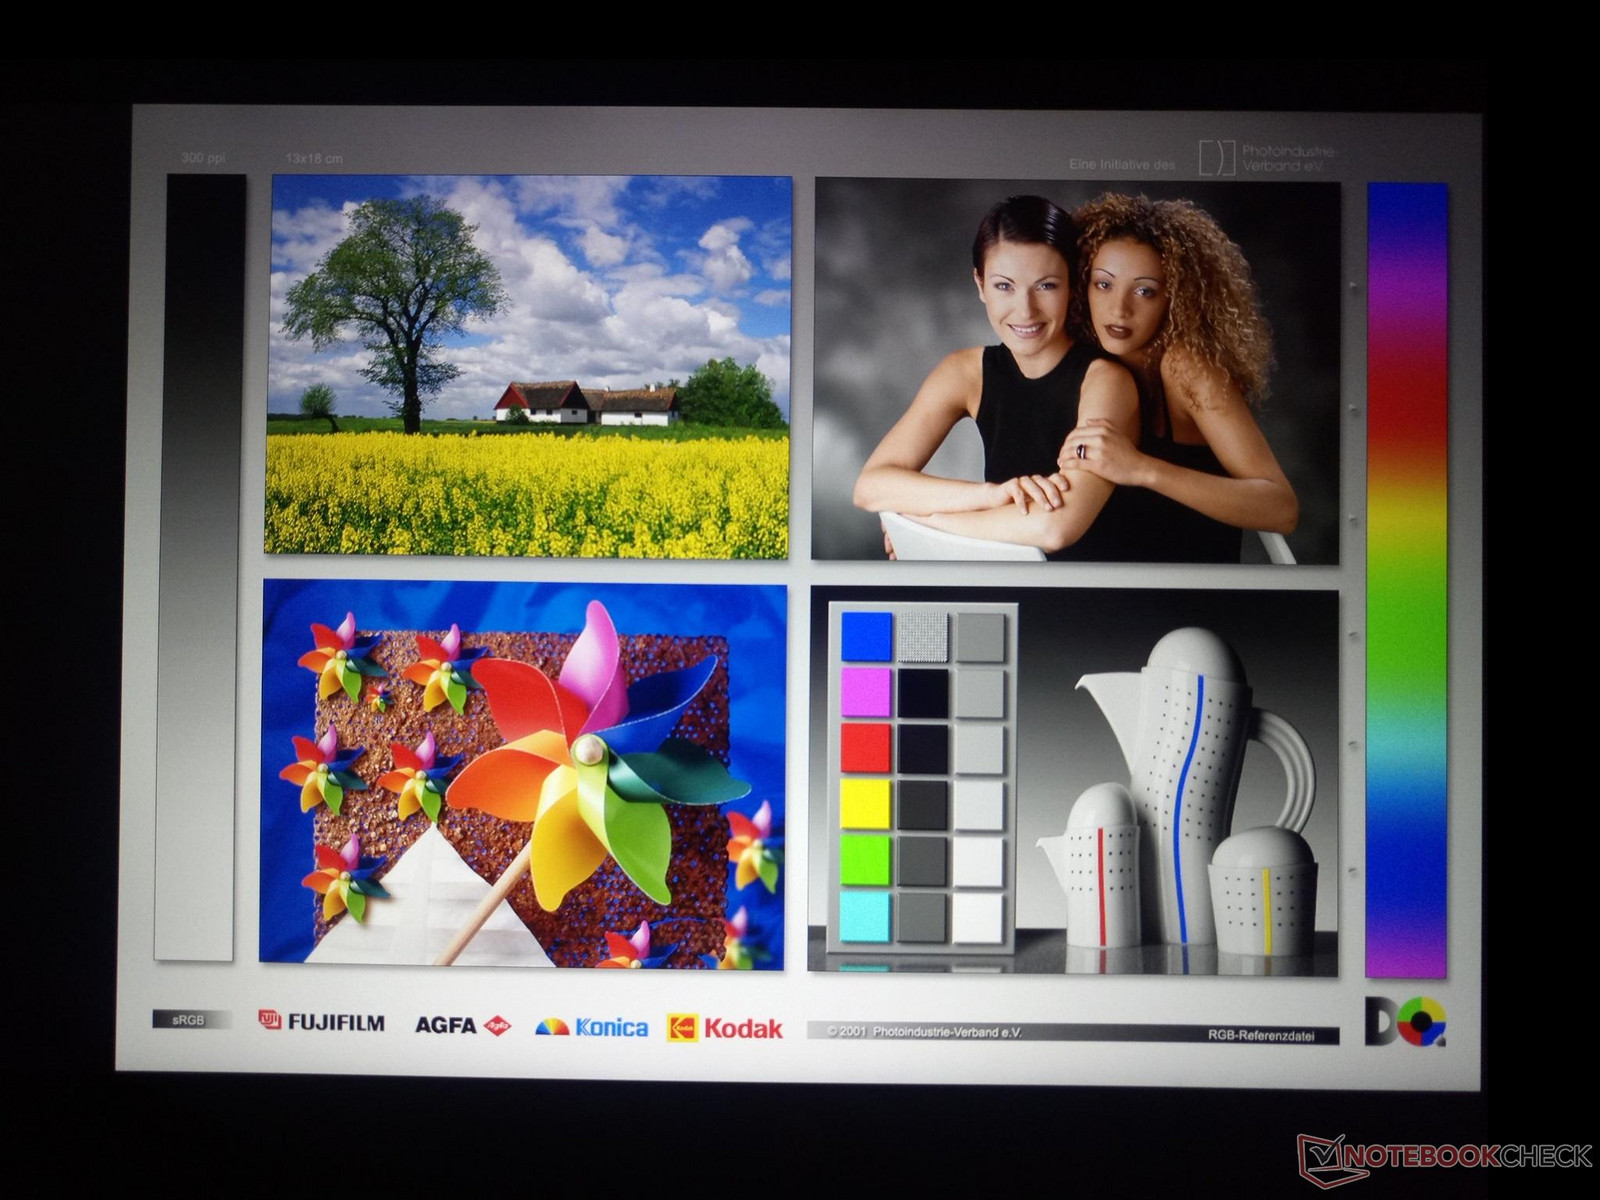
Outdoor visibility is average at best. The backlight is easily overwhelmed by ambient overcast lighting or direct sunlight and colors will appear washed out as a result. Glare isn't a huge issue, but we can only imagine that the glossy 1080p option will fare even worse than our matte SKU. Viewing angles are wide as expected from an IPS panel with no major contrast or color degradation unless if viewing from its extremities.
Performance
The Pavilion Power series can be configured with either the Core i5-7300HQ or Core i7-7700HQ CPU and the Radeon RX 550 or GeForce GTX 1050 GPU. The AMD graphics option is limited to 2 GB of GDDR5 VRAM while the Nvidia configuration can come with either 2 GB or 4 GB of GDDR5 VRAM. HP also offers this same chassis as a "non-Power" variant with the more efficient ULV Core i5-7200U CPU and integrated HD Graphics 620 GPU. Such a configuration is geared more towards word processing and video streaming rather than gaming and intensive multi-tasking.
Optimus is included on the Nvidia configurations for switching to the integrated HD Graphics 630 as needed.
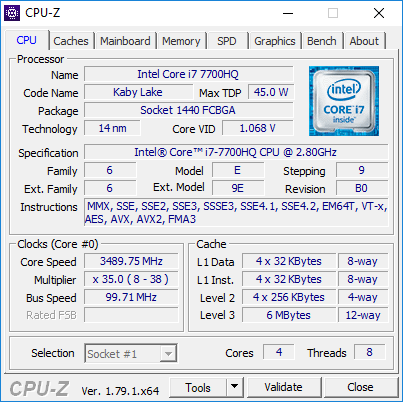
Processor
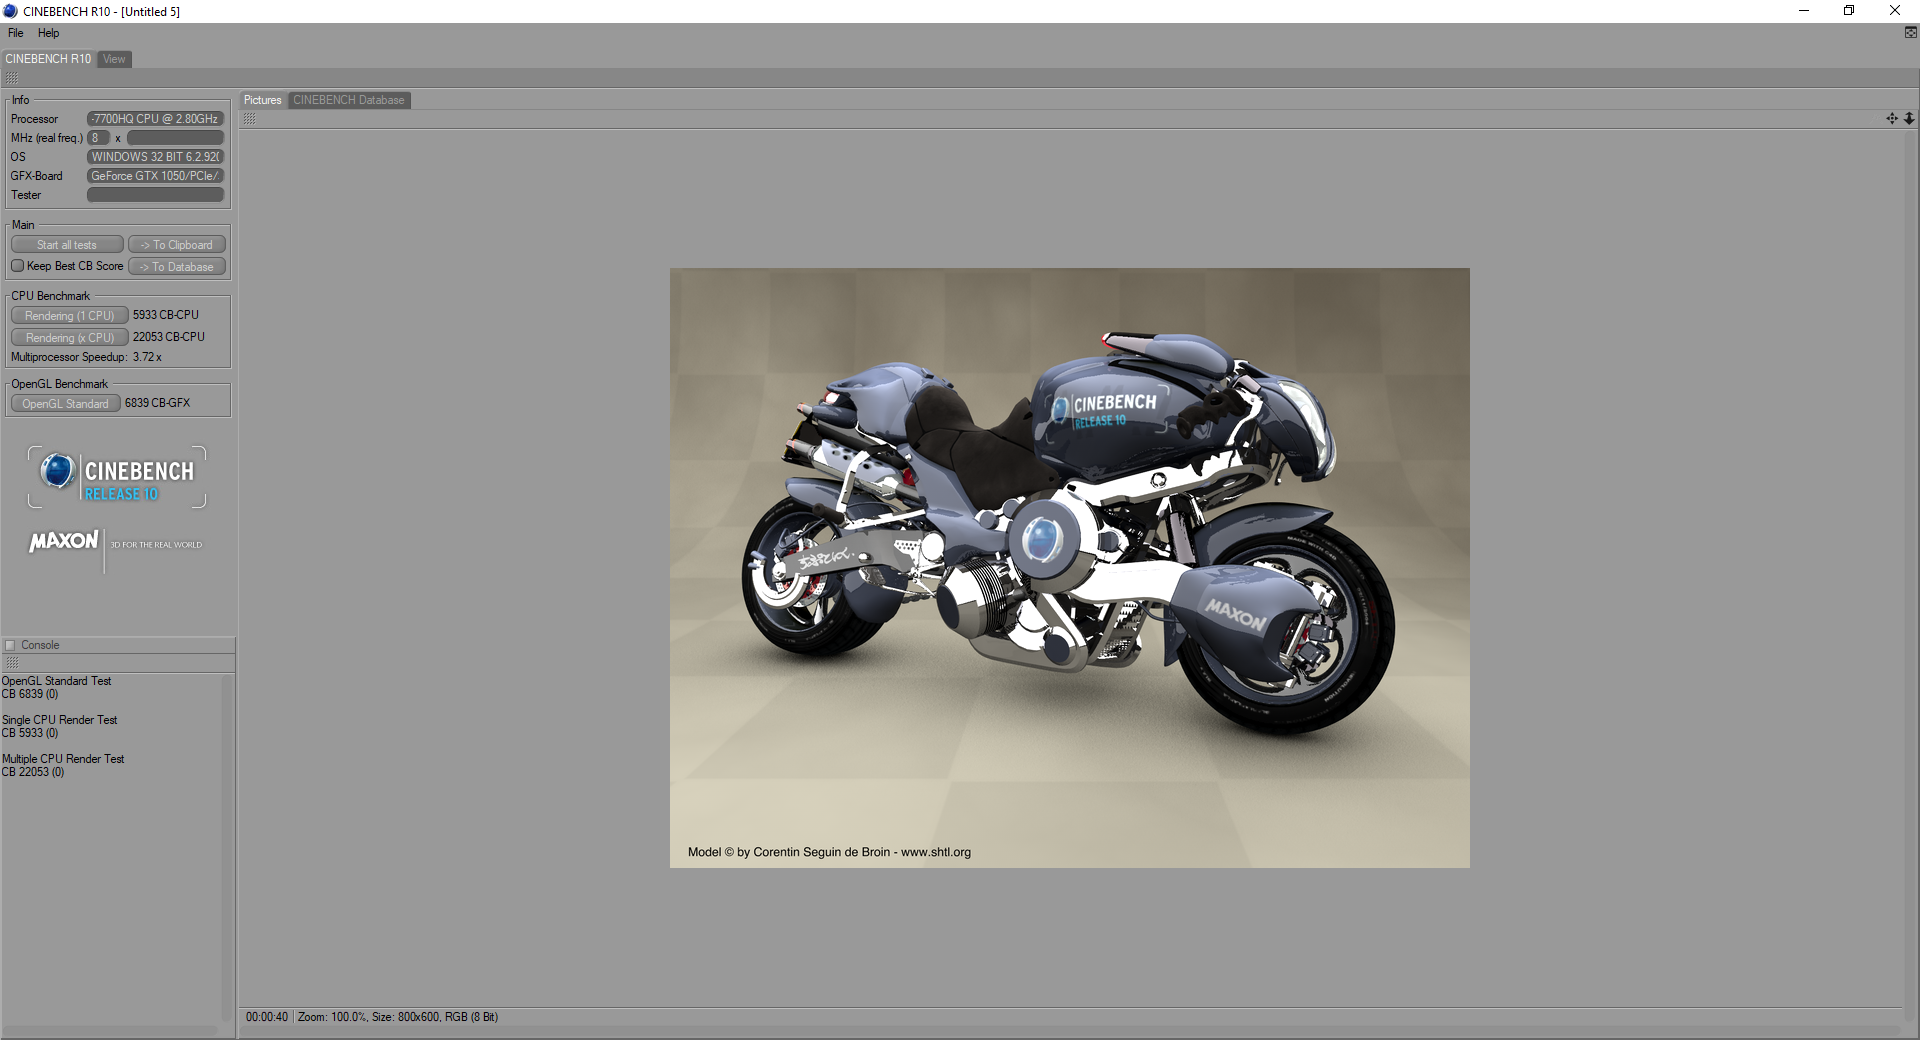
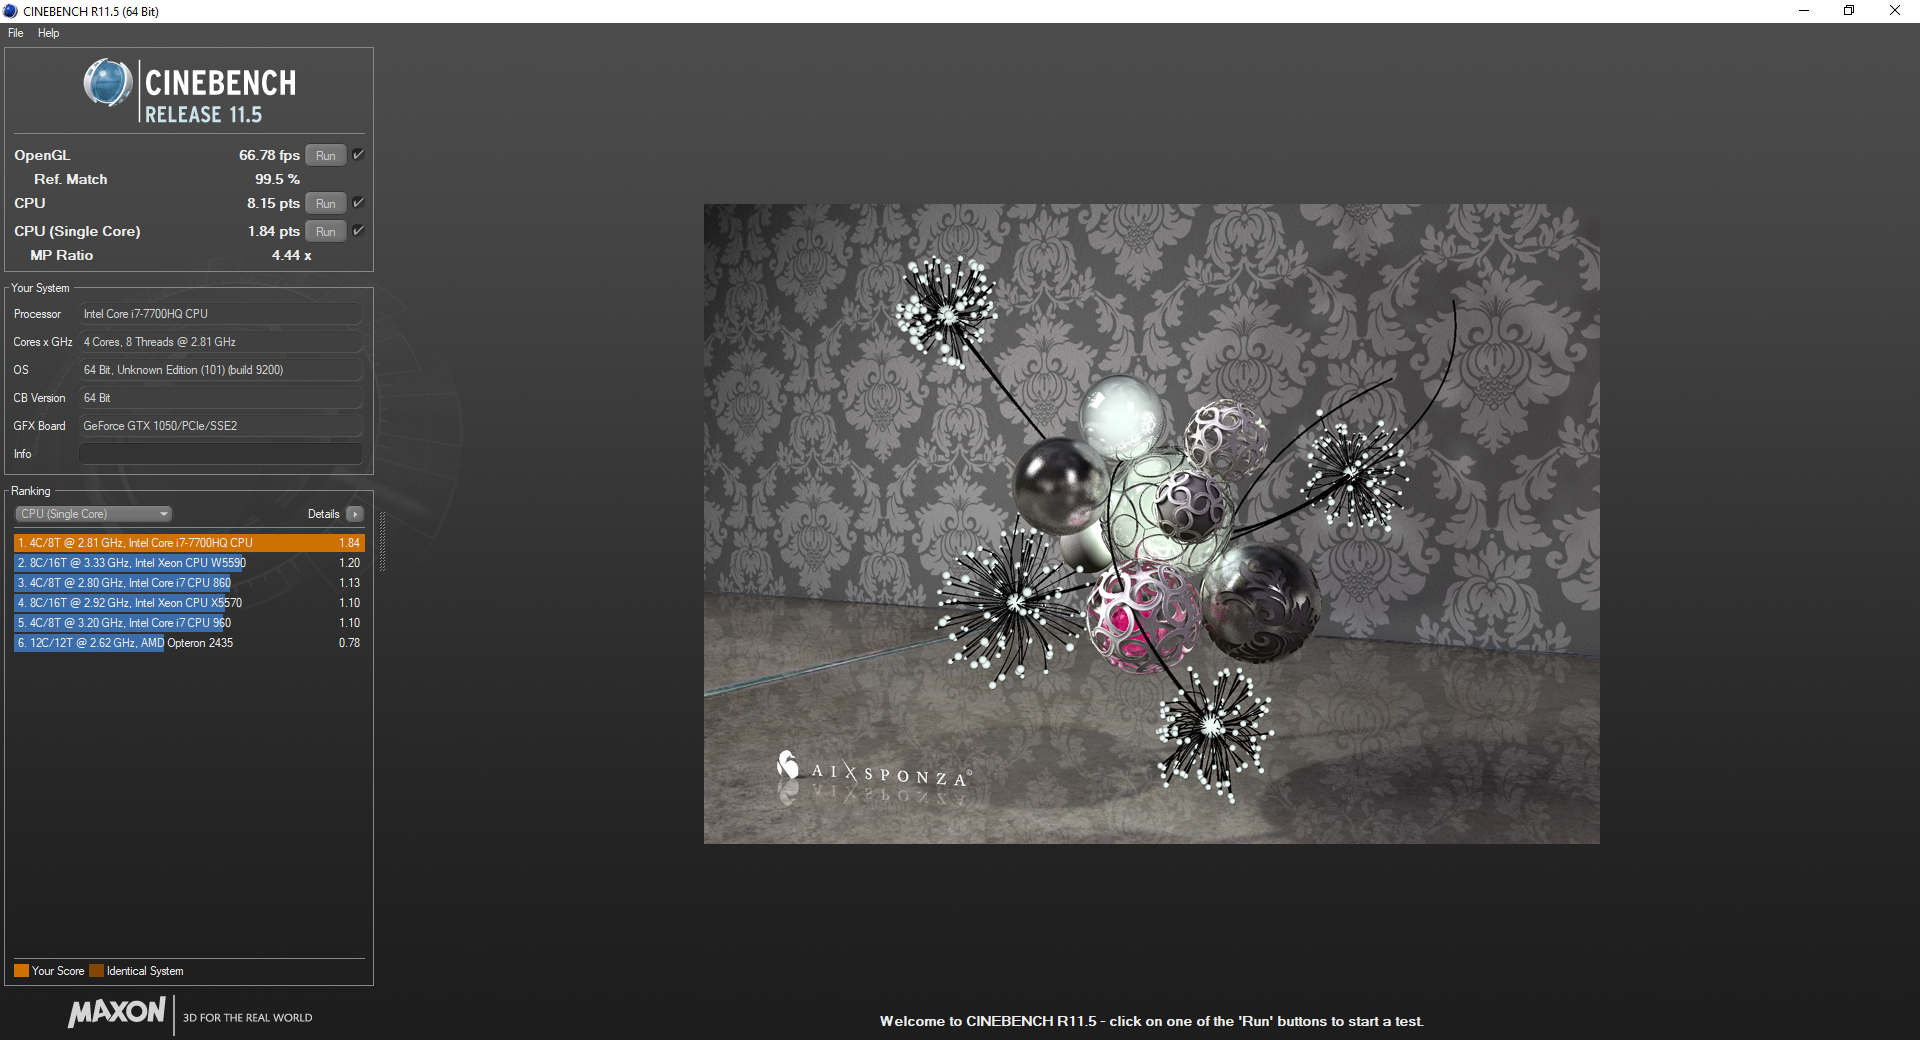
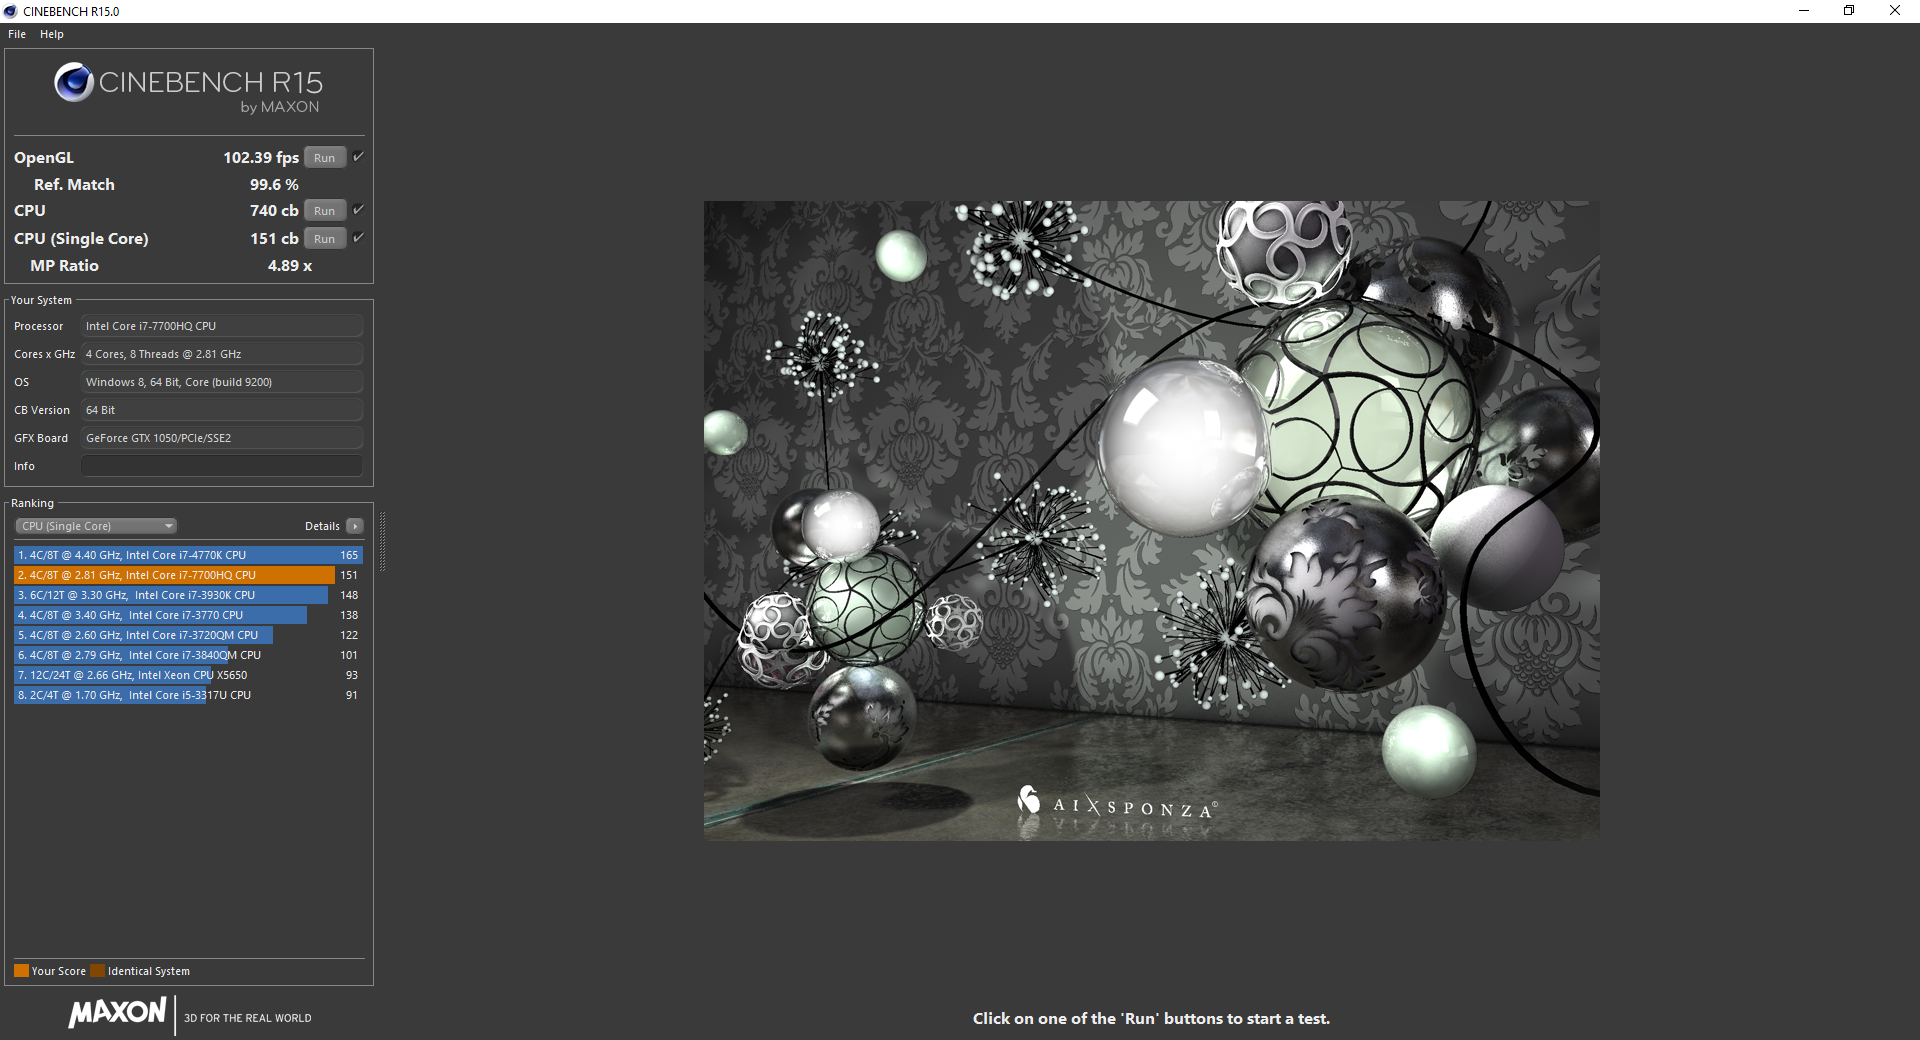
The Core i7-7700HQ in our Pavilion Power performs where we expect it to be according to CineBench benchmarks. Users will see very marginal boosts over the older i7-6700HQ and i7-5700HQ in both single- and multi-threaded workloads while the stock desktop i7-7700K will be roughly 20 to 25 percent faster than our i7-7700HQ. The lower-end Pavilion Power SKU with the i5-7300HQ will be over 30 percent slower than the quad-core i7-7700HQ in multi-threaded workloads since it is a dual-core chip.
Running CineBench Multi-Thread in a loop results in no steadily decreasing scores over time which is especially important on a gaming notebook. In comparison, the same i7-7700HQ CPU in our MSI GS63VR can drop in performance by as much as 10 to 15 percent when subjected to the same testing conditions. See our dedicated CPU page on the Core i7-7700HQ for more technical information and bechmarks.
| wPrime 2.10 - 1024m | |
| Lenovo IdeaPad Y50 | |
| HP Pavilion 15 Power 1GK62AV | |
| MSI GP62-2QEi781FD | |
| Eurocom Tornado F5 | |
* ... smaller is better
System Performance
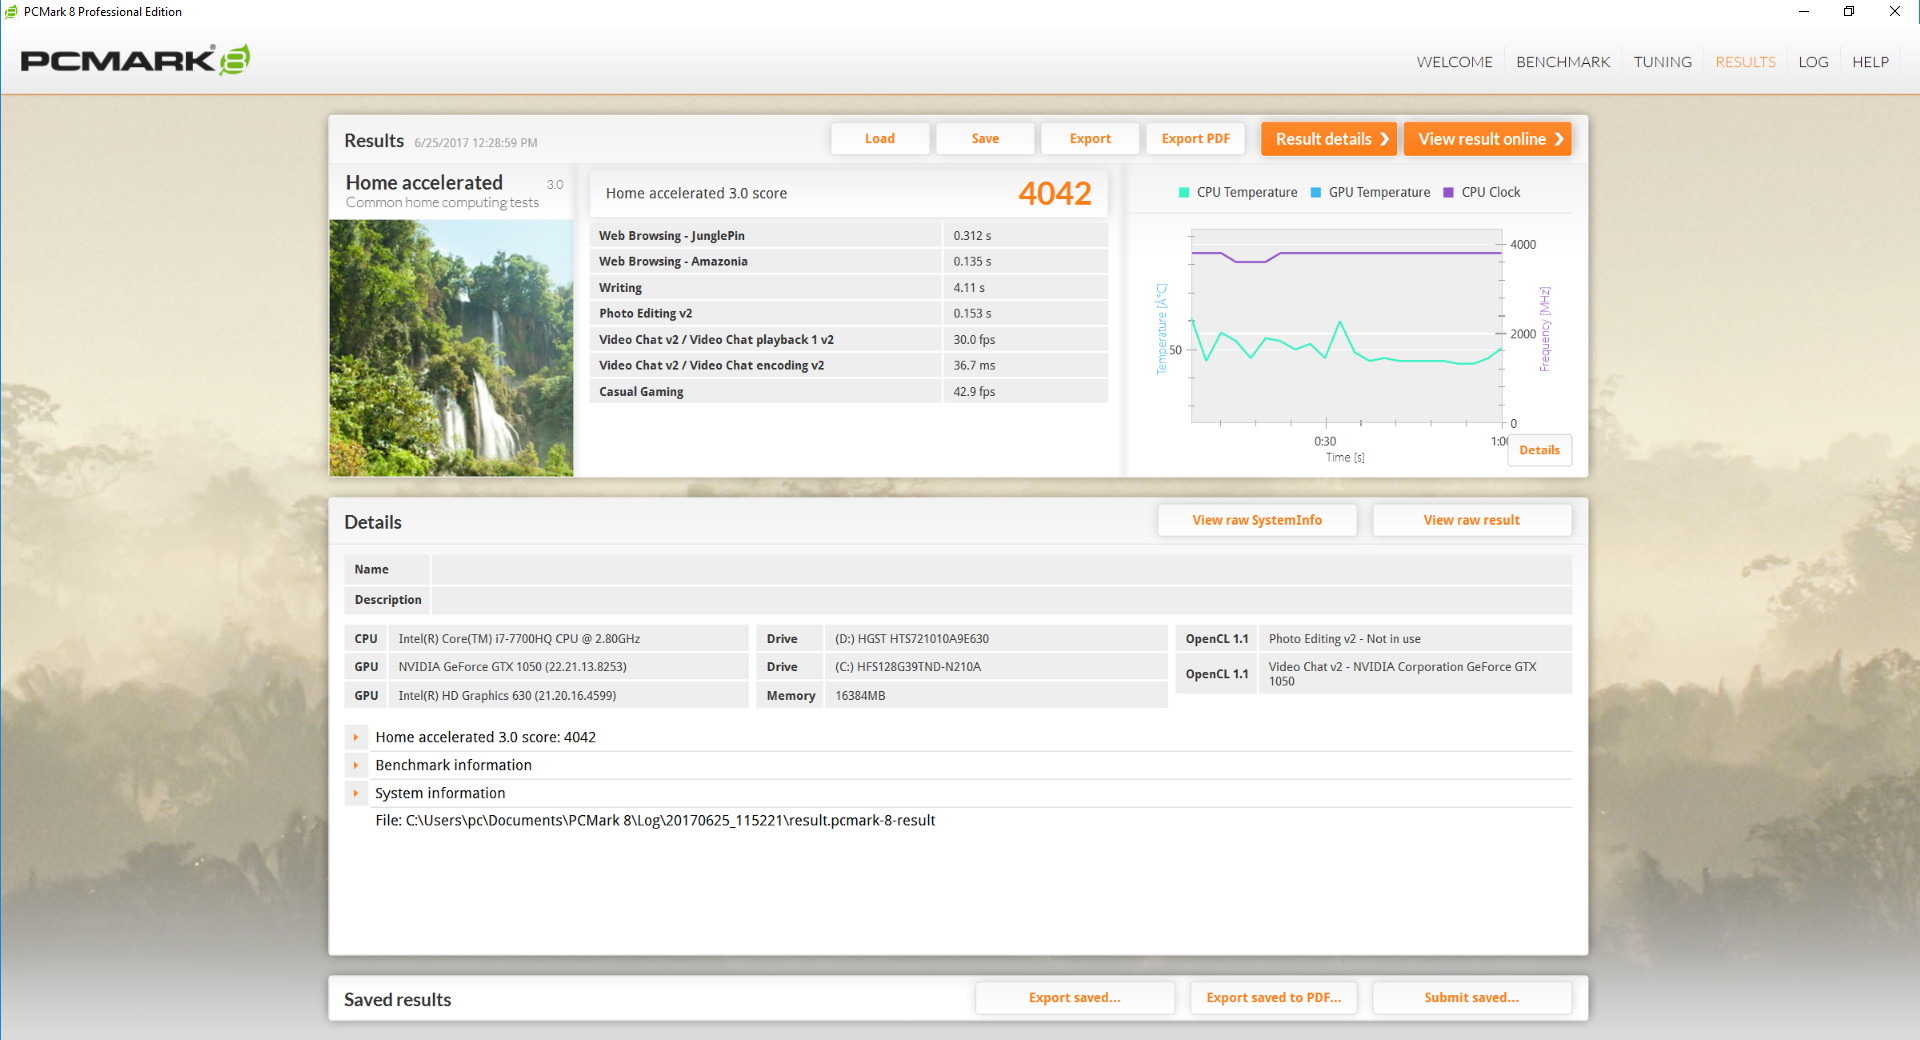
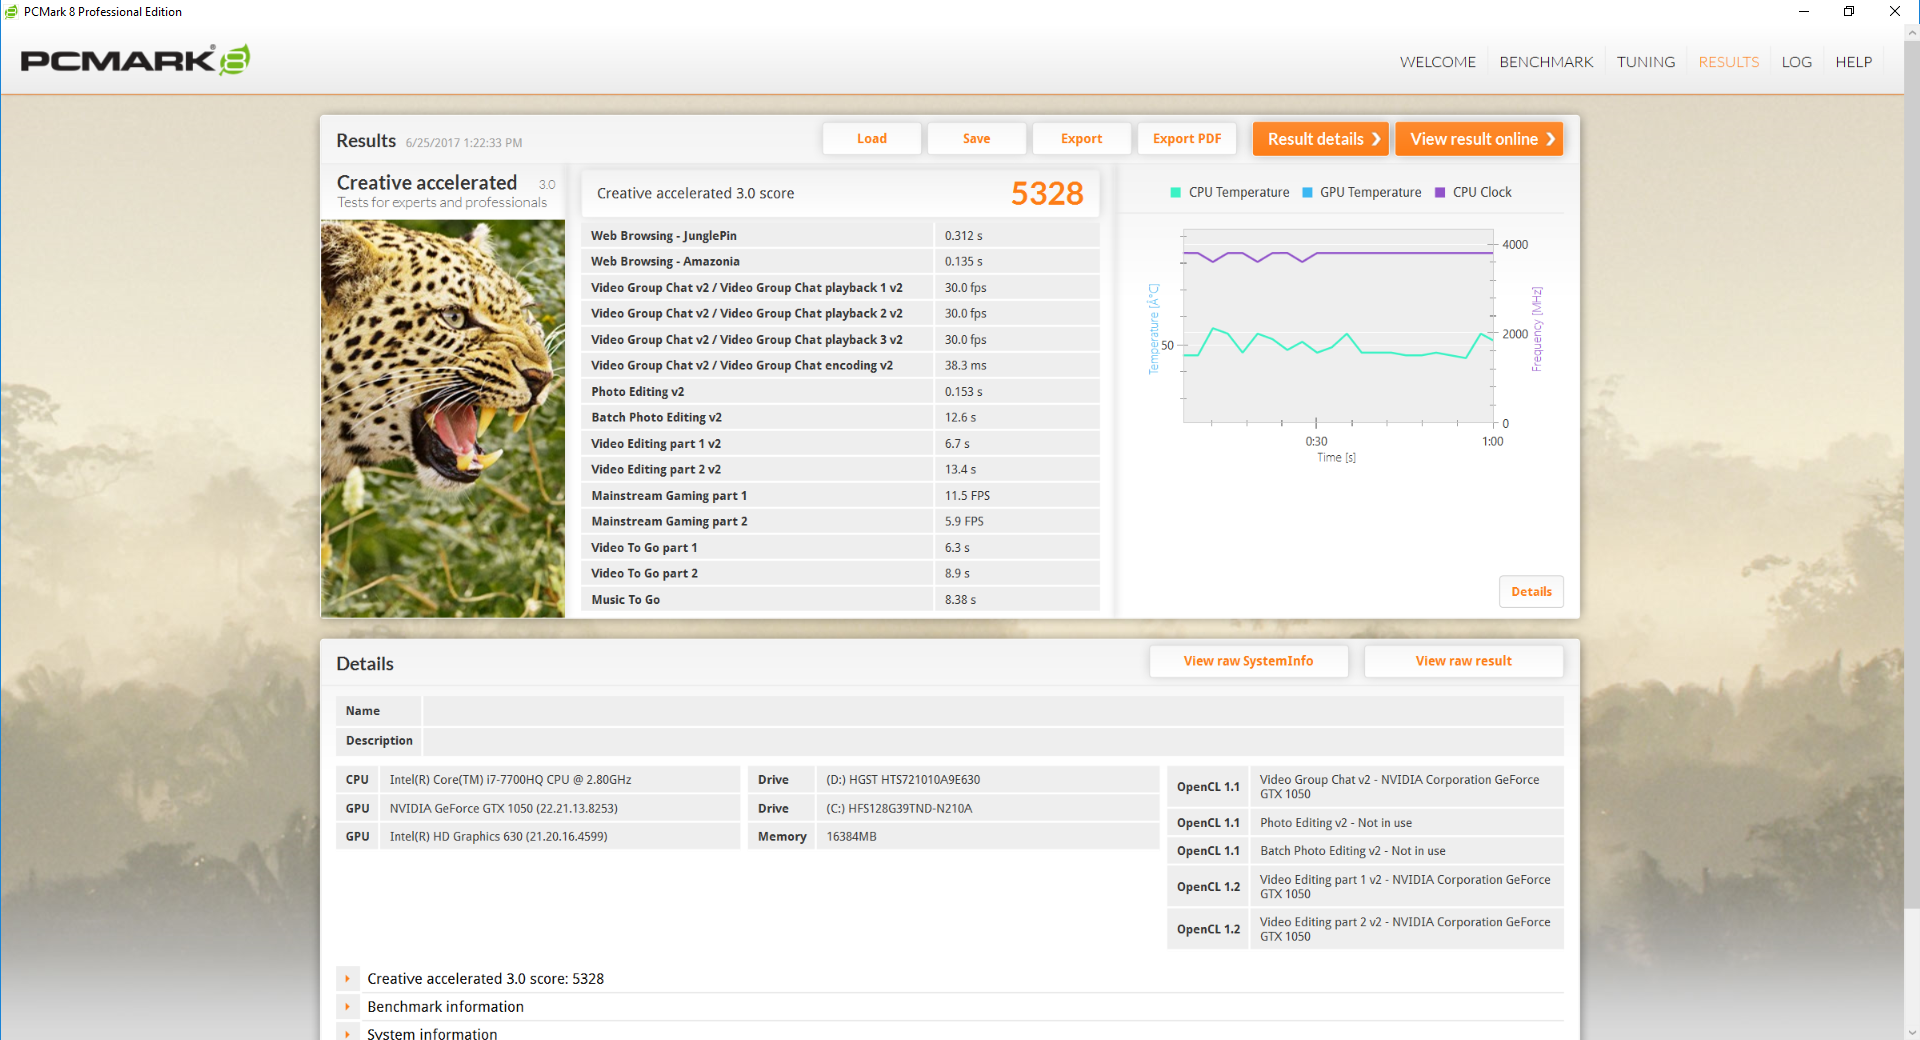
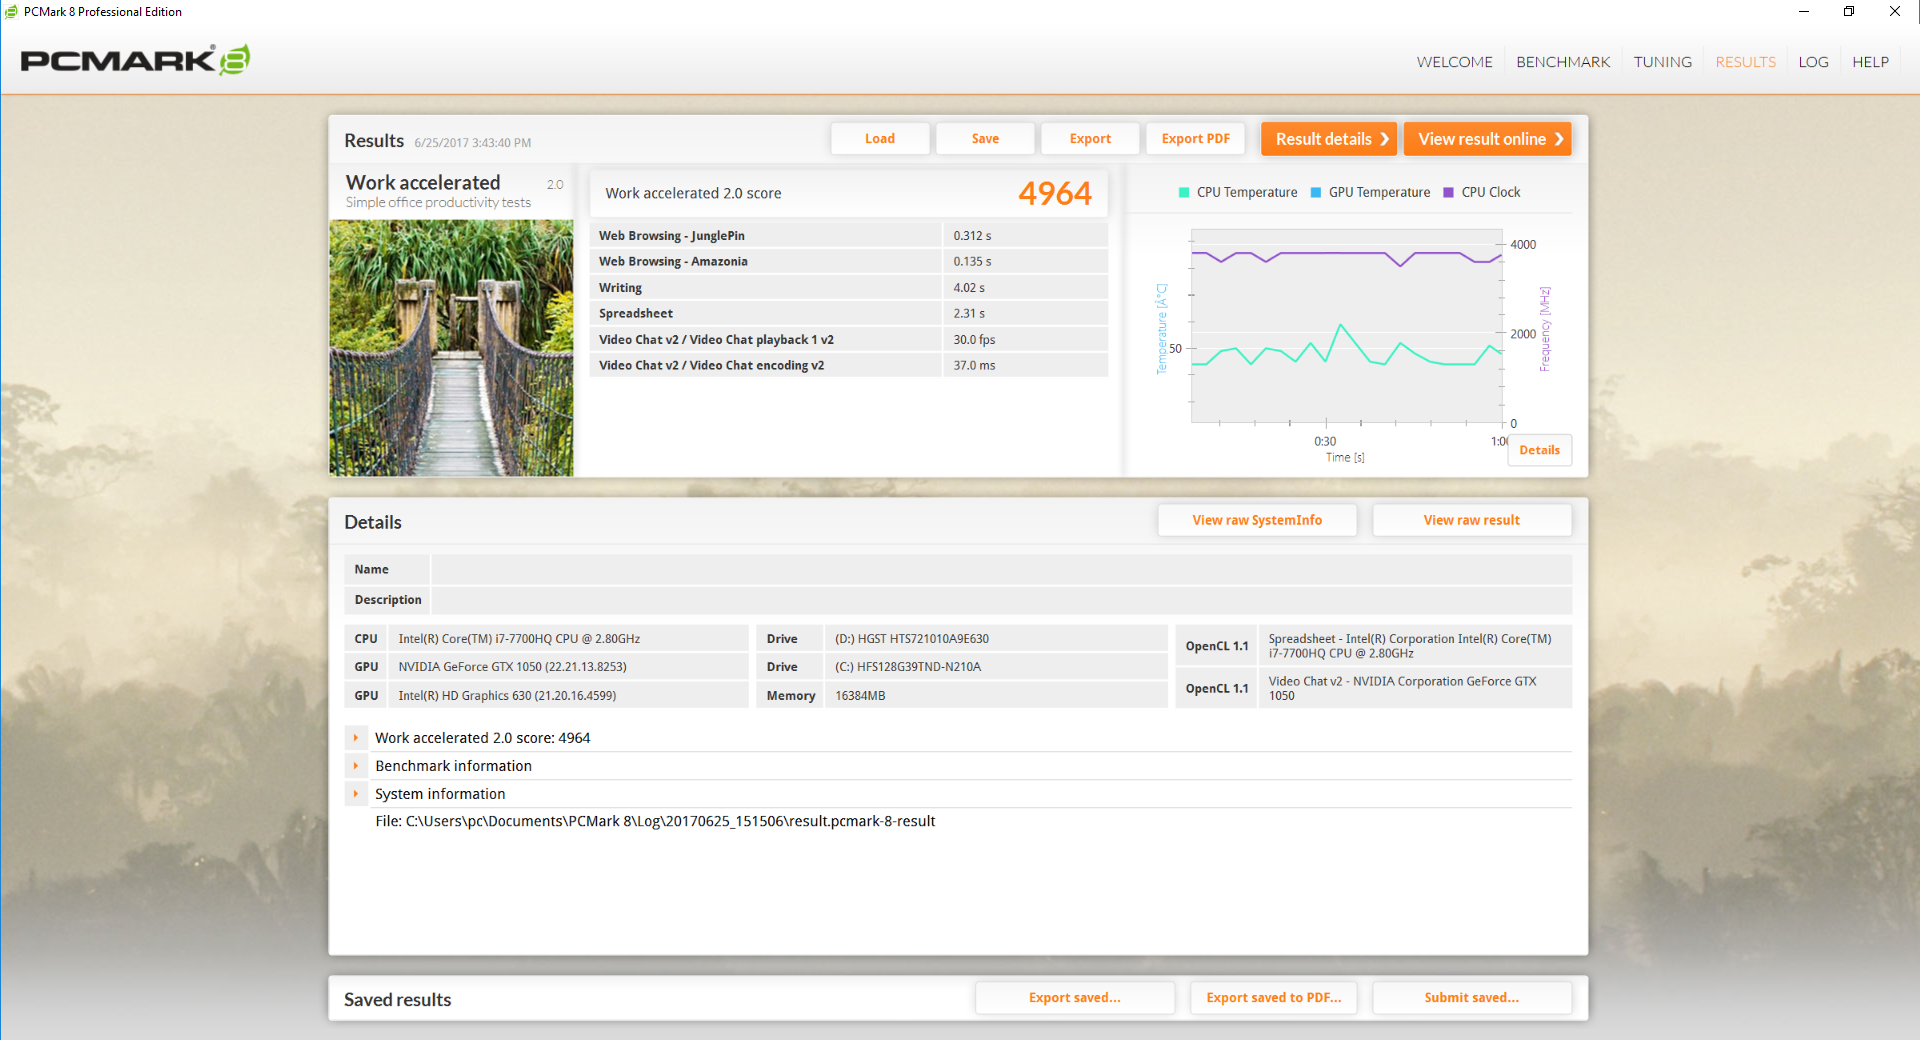
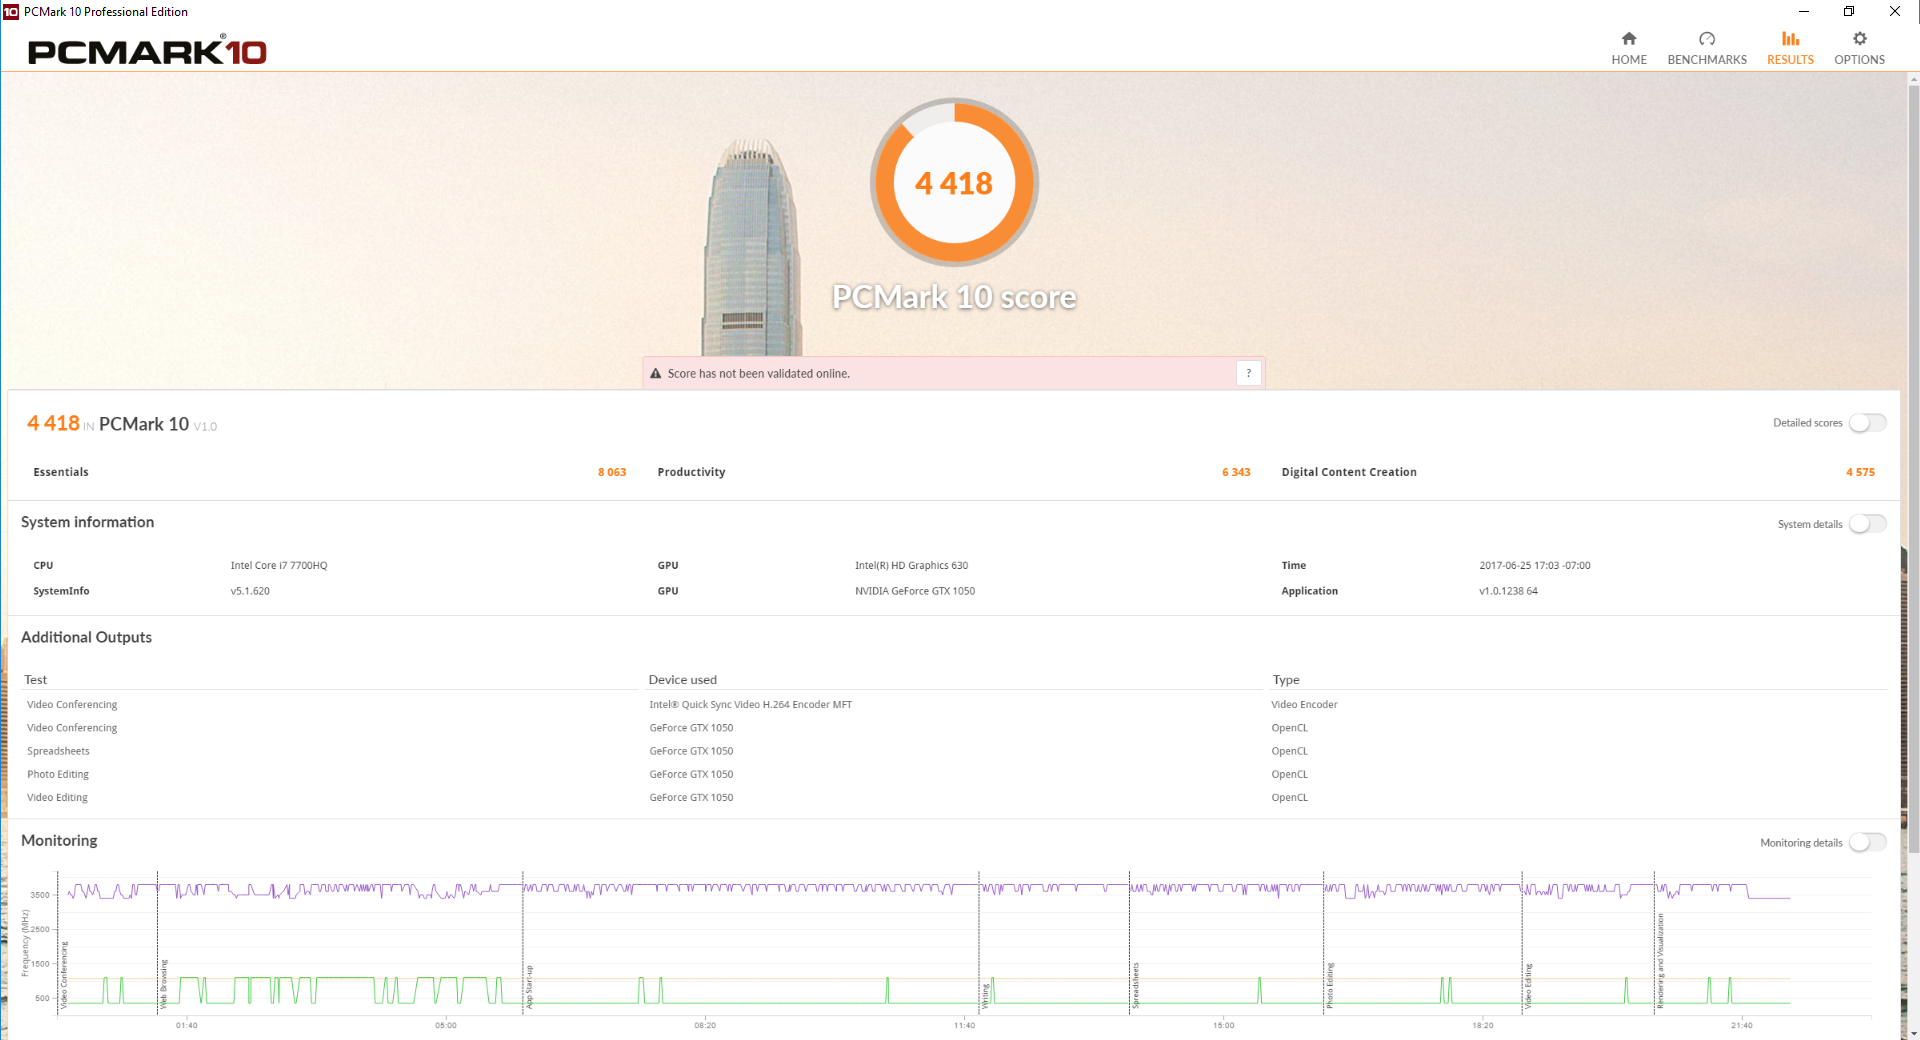
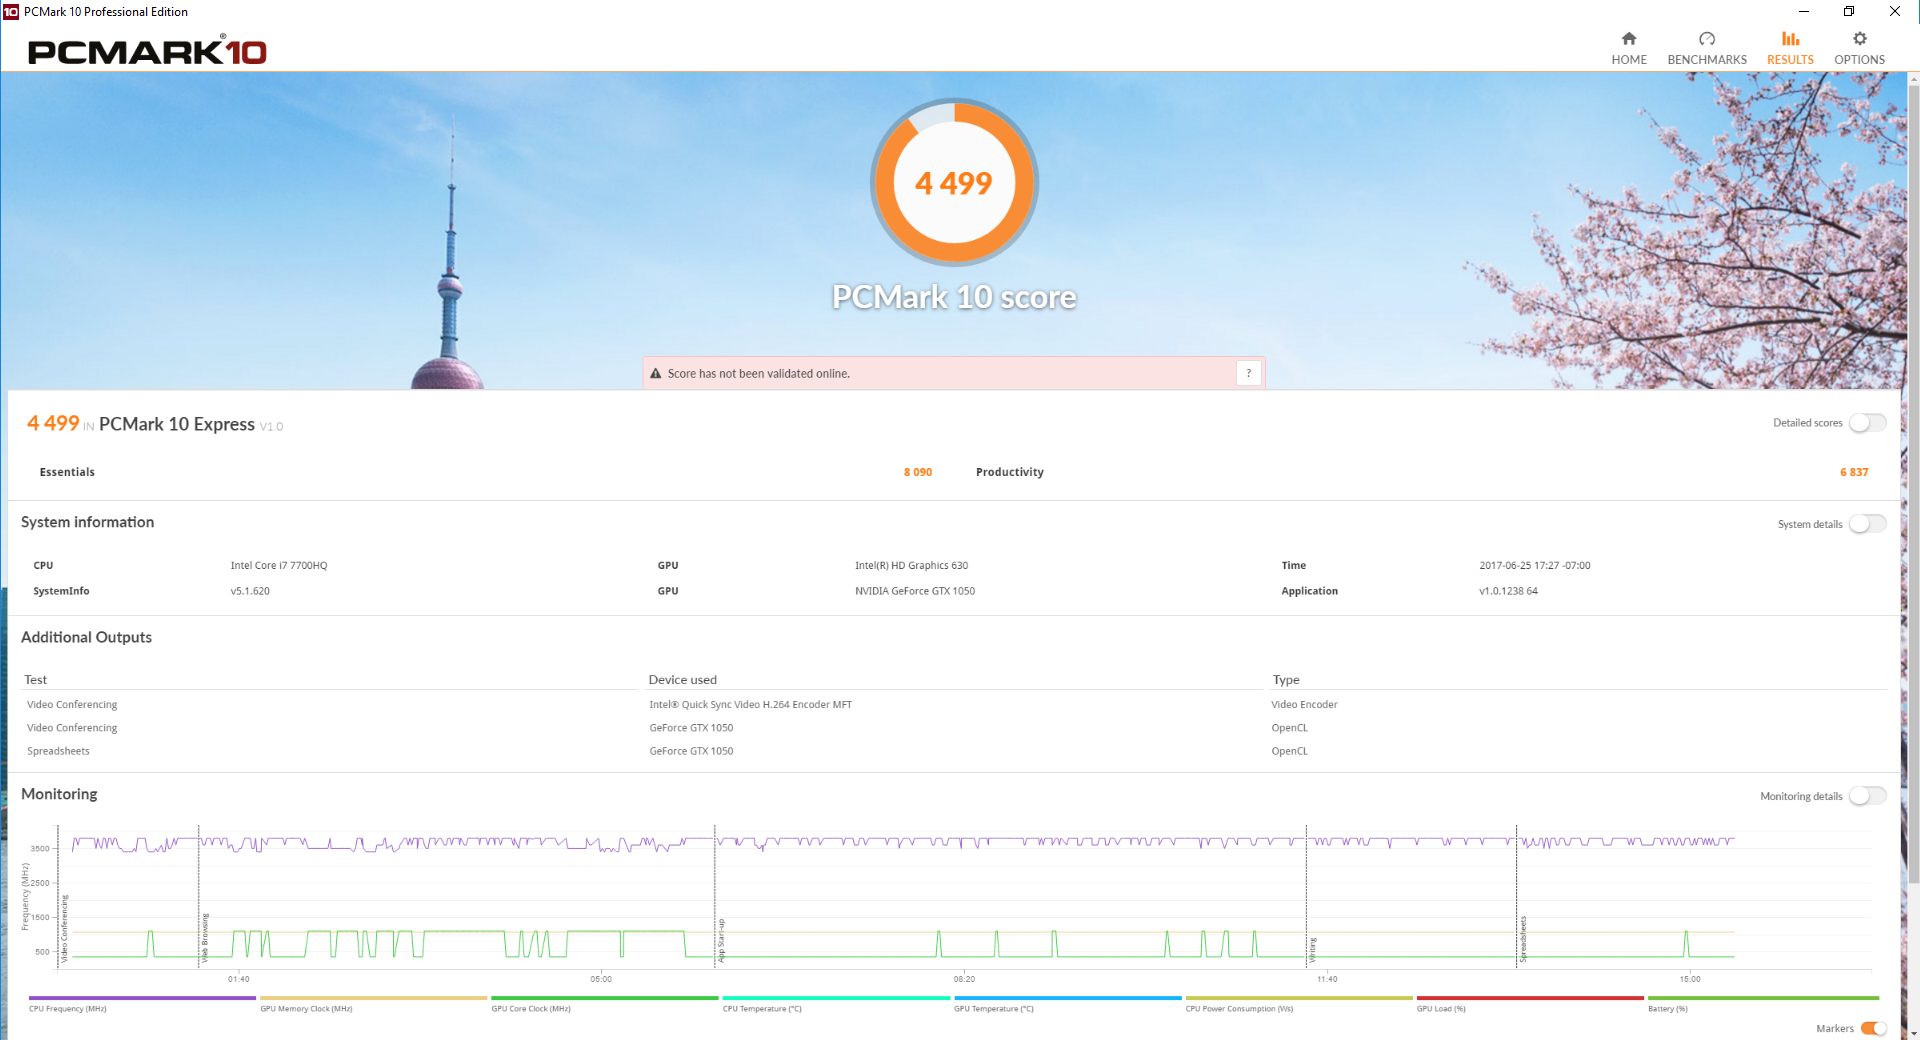
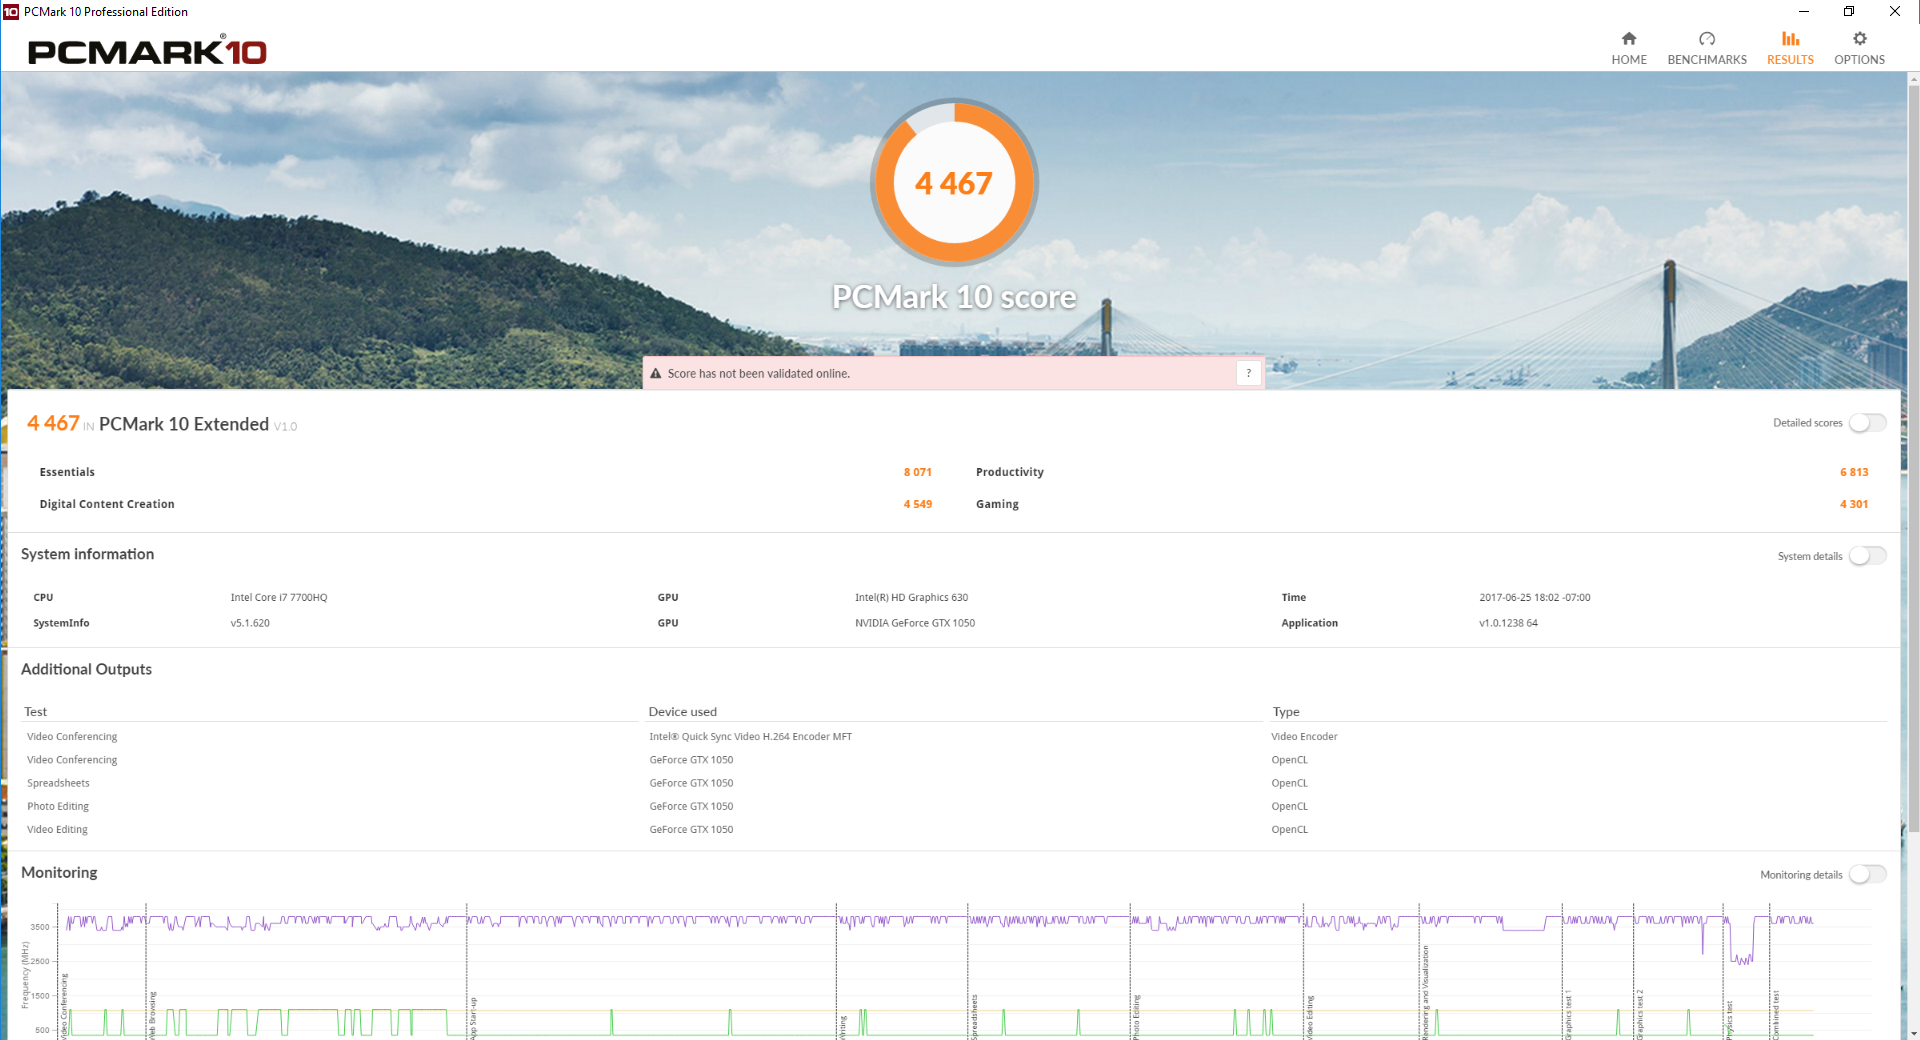
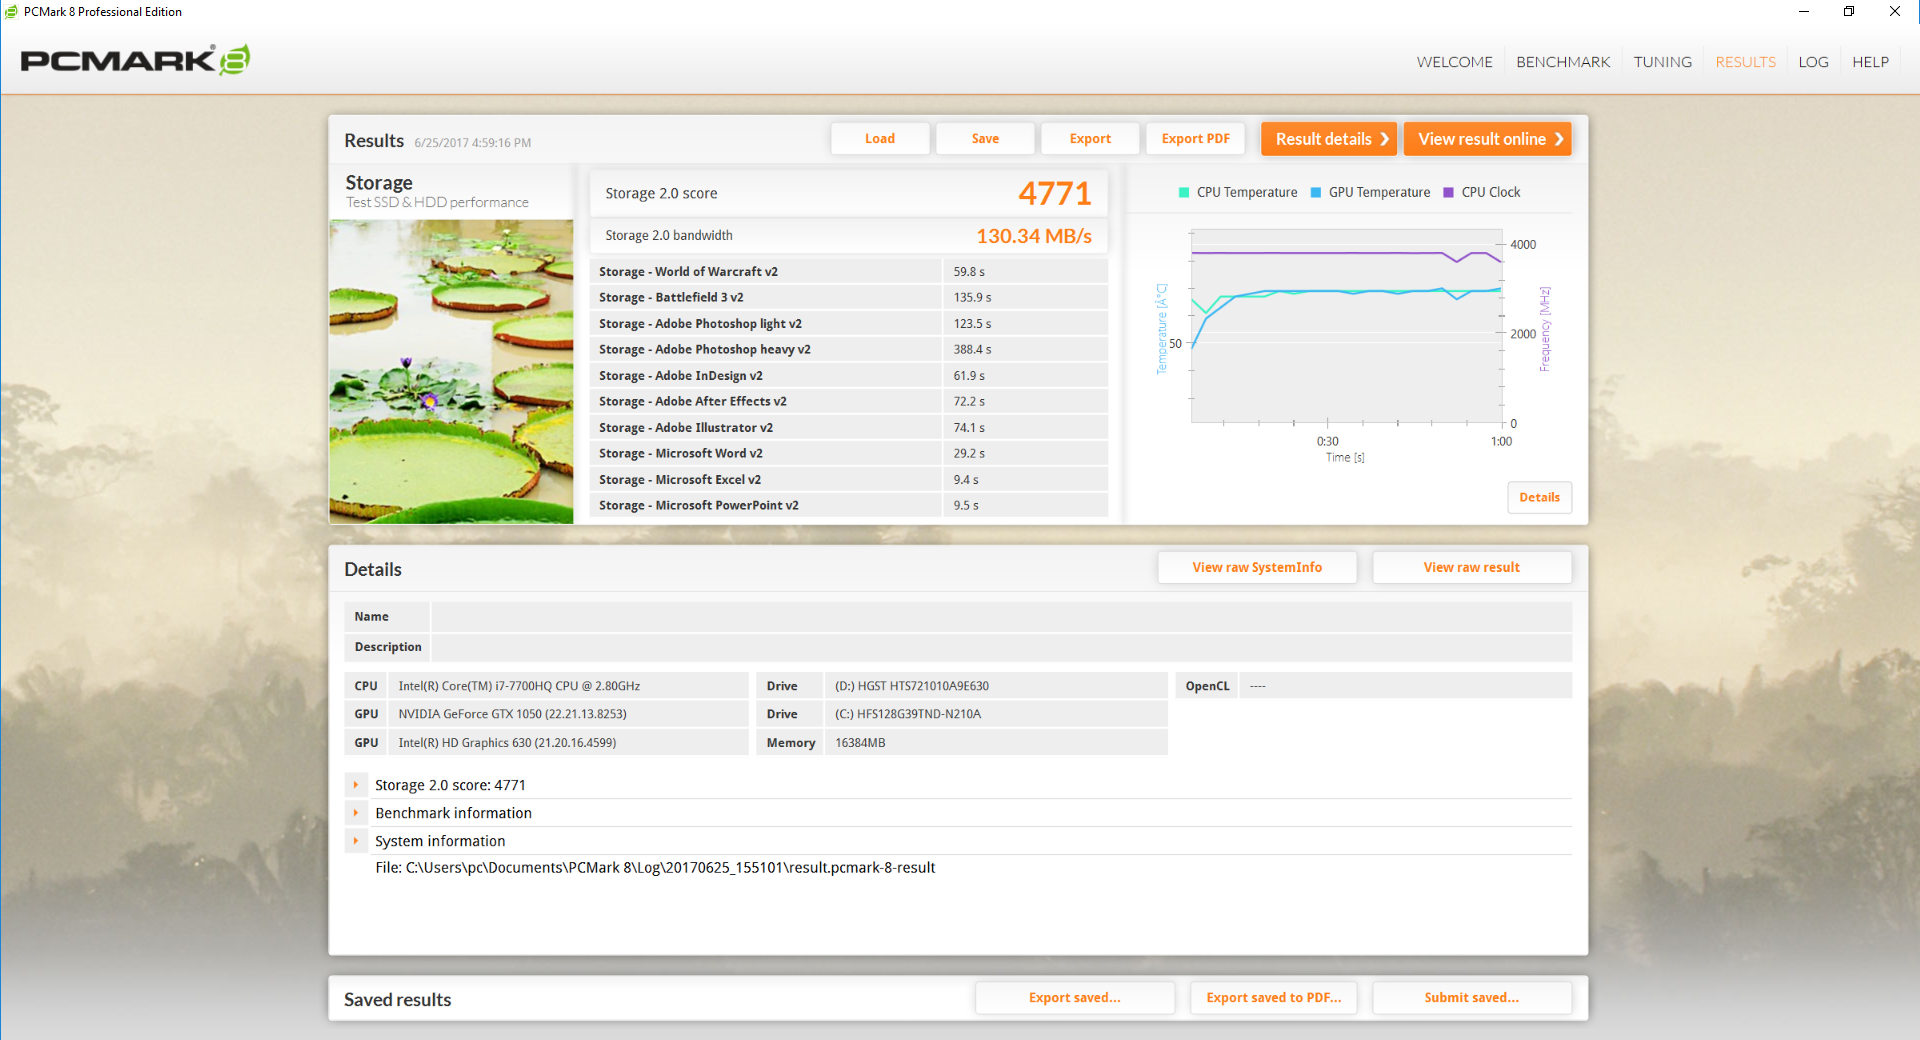
PCMark 8 ranks the HP within single-digit percentages from the similarly equipped Samsung Odyssey and Lenovo Yoga 720. PCMark 10 scores are also included below without direct comparisons since the benchmark is brand new. Subjectively, we experienced no notable software hitches during our time with the test unit.
| PCMark 8 | |
| Home Score Accelerated v2 | |
| HP Pavilion 15 Power 1GK62AV | |
| Samsung Odyssey NP800G5M-X01US | |
| Lenovo Yoga 720-15IKB-80X7 | |
| Work Score Accelerated v2 | |
| Samsung Odyssey NP800G5M-X01US | |
| HP Pavilion 15 Power 1GK62AV | |
| Lenovo Yoga 720-15IKB-80X7 | |
| Creative Score Accelerated v2 | |
| Samsung Odyssey NP800G5M-X01US | |
| HP Pavilion 15 Power 1GK62AV | |
| Lenovo Yoga 720-15IKB-80X7 | |
| PCMark 8 Home Score Accelerated v2 | 4042 points | |
| PCMark 8 Creative Score Accelerated v2 | 5328 points | |
| PCMark 8 Work Score Accelerated v2 | 4964 points | |
Help | ||
Storage Devices
A total of two internal storage options are available in the form of M.2 2280 and 2.5-inch SATA III. NVMe M.2 SSDs are supported and the 2.5-inch bay can accept both 7 mm or 9.5 mm drives.
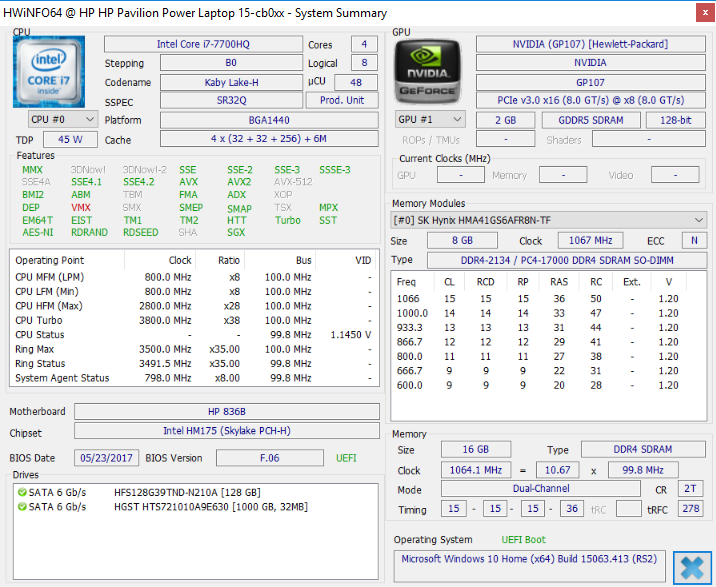
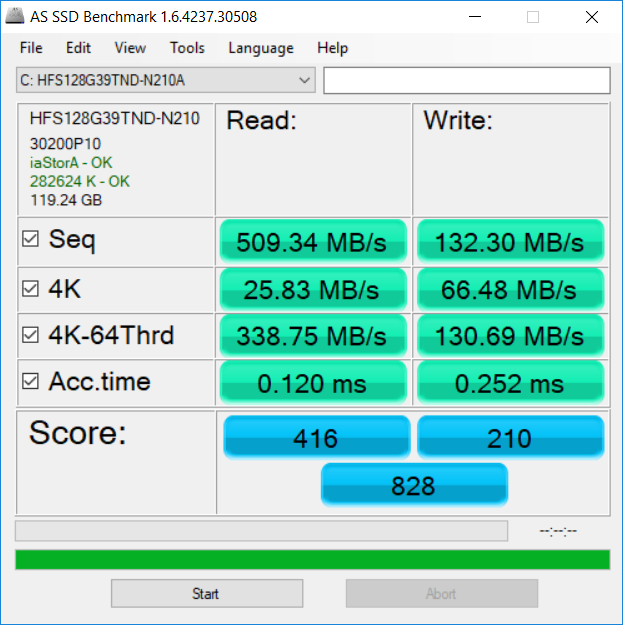
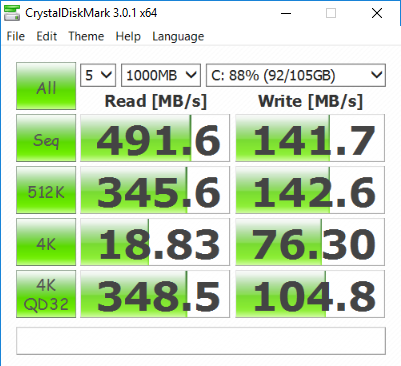
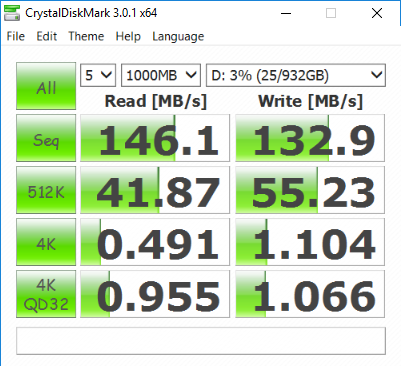
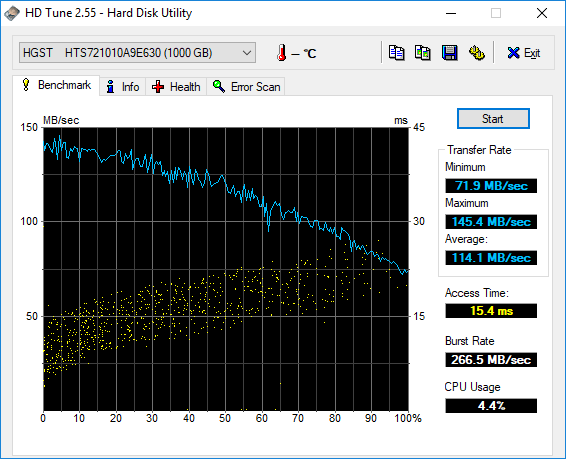
Our test system is equipped with a primary 256 GB SK Hynix HFS256G39TND-N210A SATA III M.2 drive and a secondary 1 TB HGST HTS721010A9E630 HDD. While sequential read rates from the primary drive are excellent for a SATA III SSD, its sequential write rates are on the slow side at only 132 MB/s. Unsurprisingly, overall performance is similar to the 128 GB SK Hynix SSD found on our Acer Aspire VX15. Meanwhile, transfer rates from the Toshiba HDD average about 114 MB/s according to HD Tune, which is quite fast for a 7200 RPM drive.
See our list of HDDs and SSDs for more benchmark comparisons.
| HP Pavilion 15 Power 1GK62AV SK Hynix HFS256G39TND-N210A | Lenovo Yoga 720-15IKB-80X7 Samsung PM961 MZVLW256HEHP | Lenovo Legion Y520-15IKBN-80WK001KUS Samsung PM961 MZVLW256HEHP | Acer Aspire VX15 VX5-591G-589S Hynix HFS128G39TND | Samsung Odyssey NP800G5M-X01US Samsung PM961 NVMe MZVLW128HEGR | |
|---|---|---|---|---|---|
| AS SSD | -103% | 289% | 1% | 145% | |
| Copy Game MB/s (MB/s) | 204.3 | 1115 446% | 157.6 -23% | 240.5 18% | |
| Copy Program MB/s (MB/s) | 176.6 | 502 184% | 111.1 -37% | 299.5 70% | |
| Copy ISO MB/s (MB/s) | 297.3 | 1912 543% | 195 -34% | 1560 425% | |
| Score Total (Points) | 828 | 942 14% | 2617 216% | 882 7% | 1592 92% |
| Score Write (Points) | 210 | 48 -77% | 807 284% | 218 4% | 376 79% |
| Score Read (Points) | 416 | 646 55% | 1232 196% | 444 7% | 852 105% |
| Access Time Write * (ms) | 0.252 | 4.15 -1547% | 0.027 89% | 0.261 -4% | 0.031 88% |
| Access Time Read * (ms) | 0.12 | 0.08 33% | 0.065 46% | 0.077 36% | 0.066 45% |
| 4K-64 Write (MB/s) | 130.7 | 15.3 -88% | 529 305% | 113.9 -13% | 176.4 35% |
| 4K-64 Read (MB/s) | 338.8 | 371.6 10% | 919 171% | 361.4 7% | 564 66% |
| 4K Write (MB/s) | 66.5 | 1.2 -98% | 139.4 110% | 90.8 37% | 124.1 87% |
| 4K Read (MB/s) | 25.83 | 47.1 82% | 48.57 88% | 32.29 25% | 44.75 73% |
| Seq Write (MB/s) | 132.3 | 311.7 136% | 1392 952% | 130.2 -2% | 752 468% |
| Seq Read (MB/s) | 509 | 2277 347% | 2649 420% | 507 0% | 2433 378% |
* ... smaller is better

GPU Performance
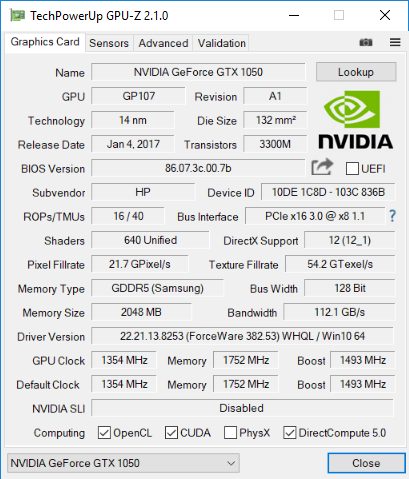
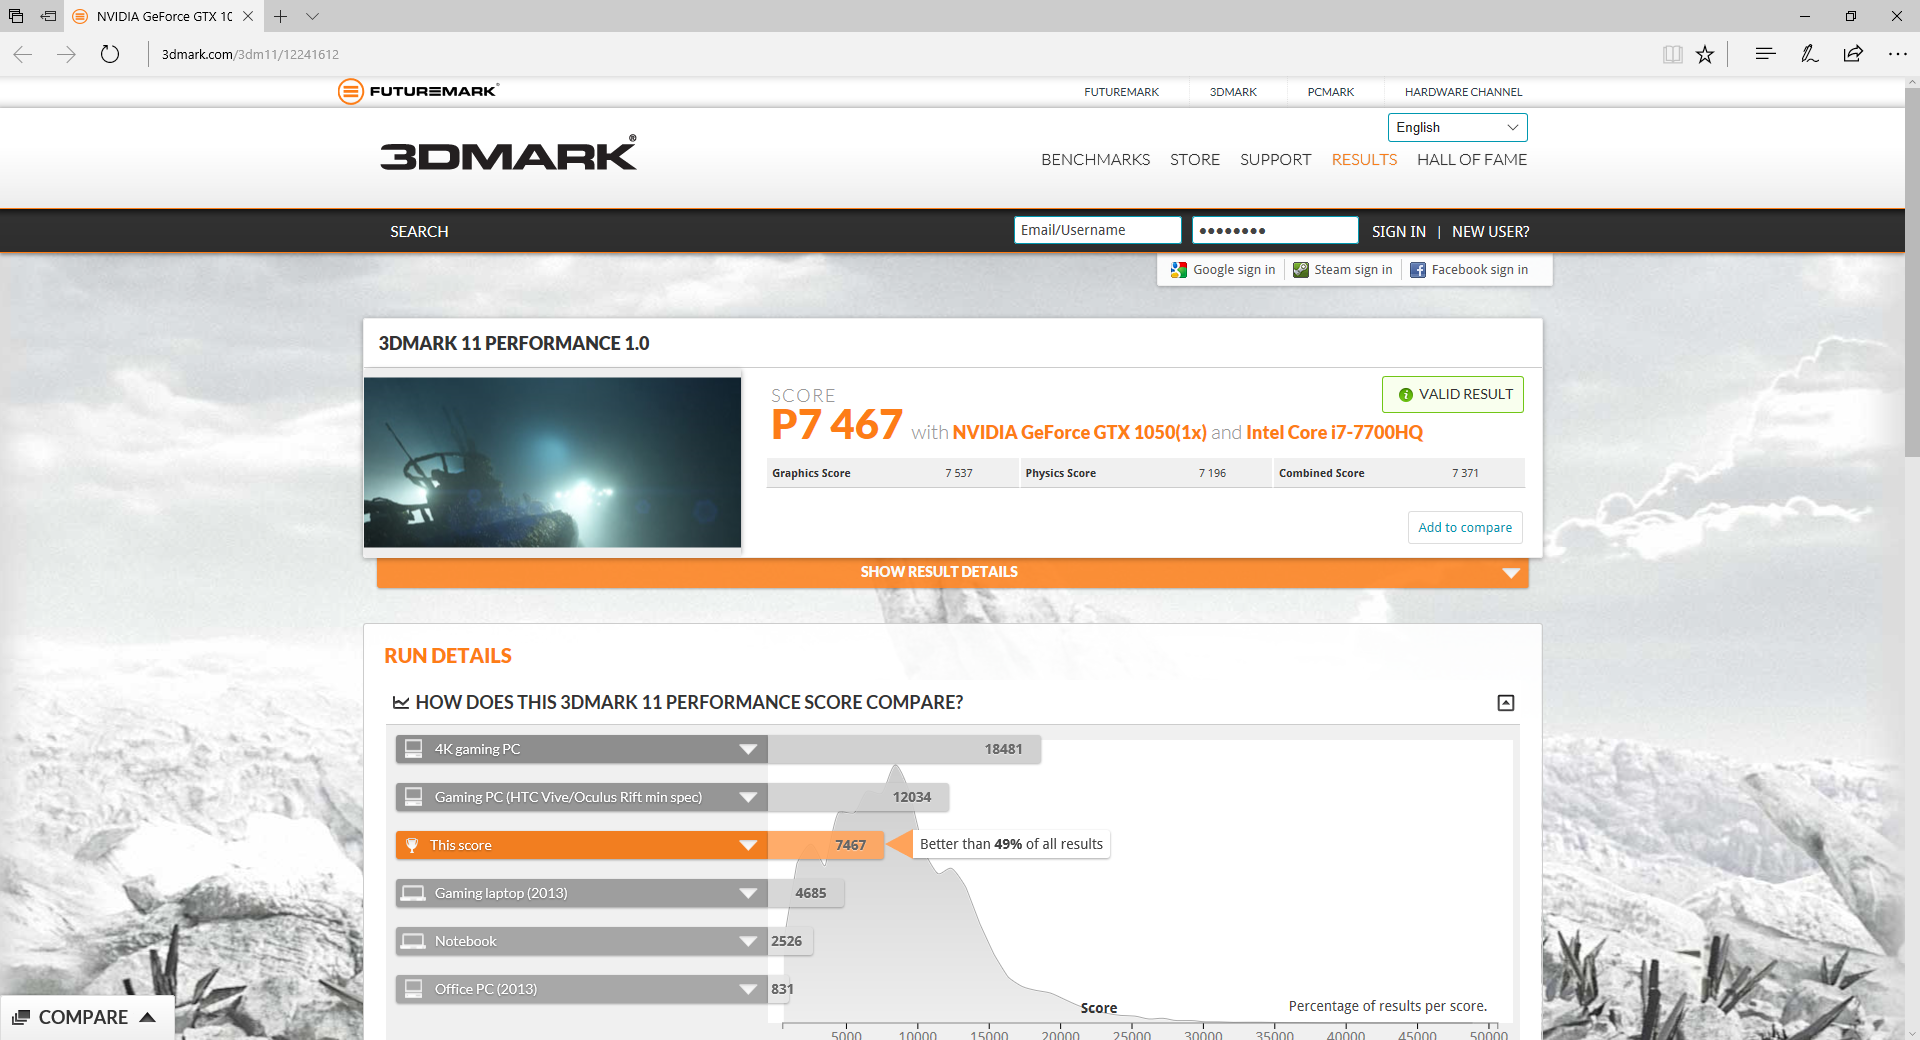
3DMark scores are essentially the same as on the Samsung Odyssey despite the fact that the latter utilizes half the VRAM. The Pavilion 15 Power sits comfortably between the GTX 960M and GTX 970M while being about 25 percent slower than the GTX 1050 Ti. Upgrading from the old GTX 950M will bring a notable graphics boost of about 60 percent.
See our dedicated review on the GTX 1050 for more information on the Pascal series.
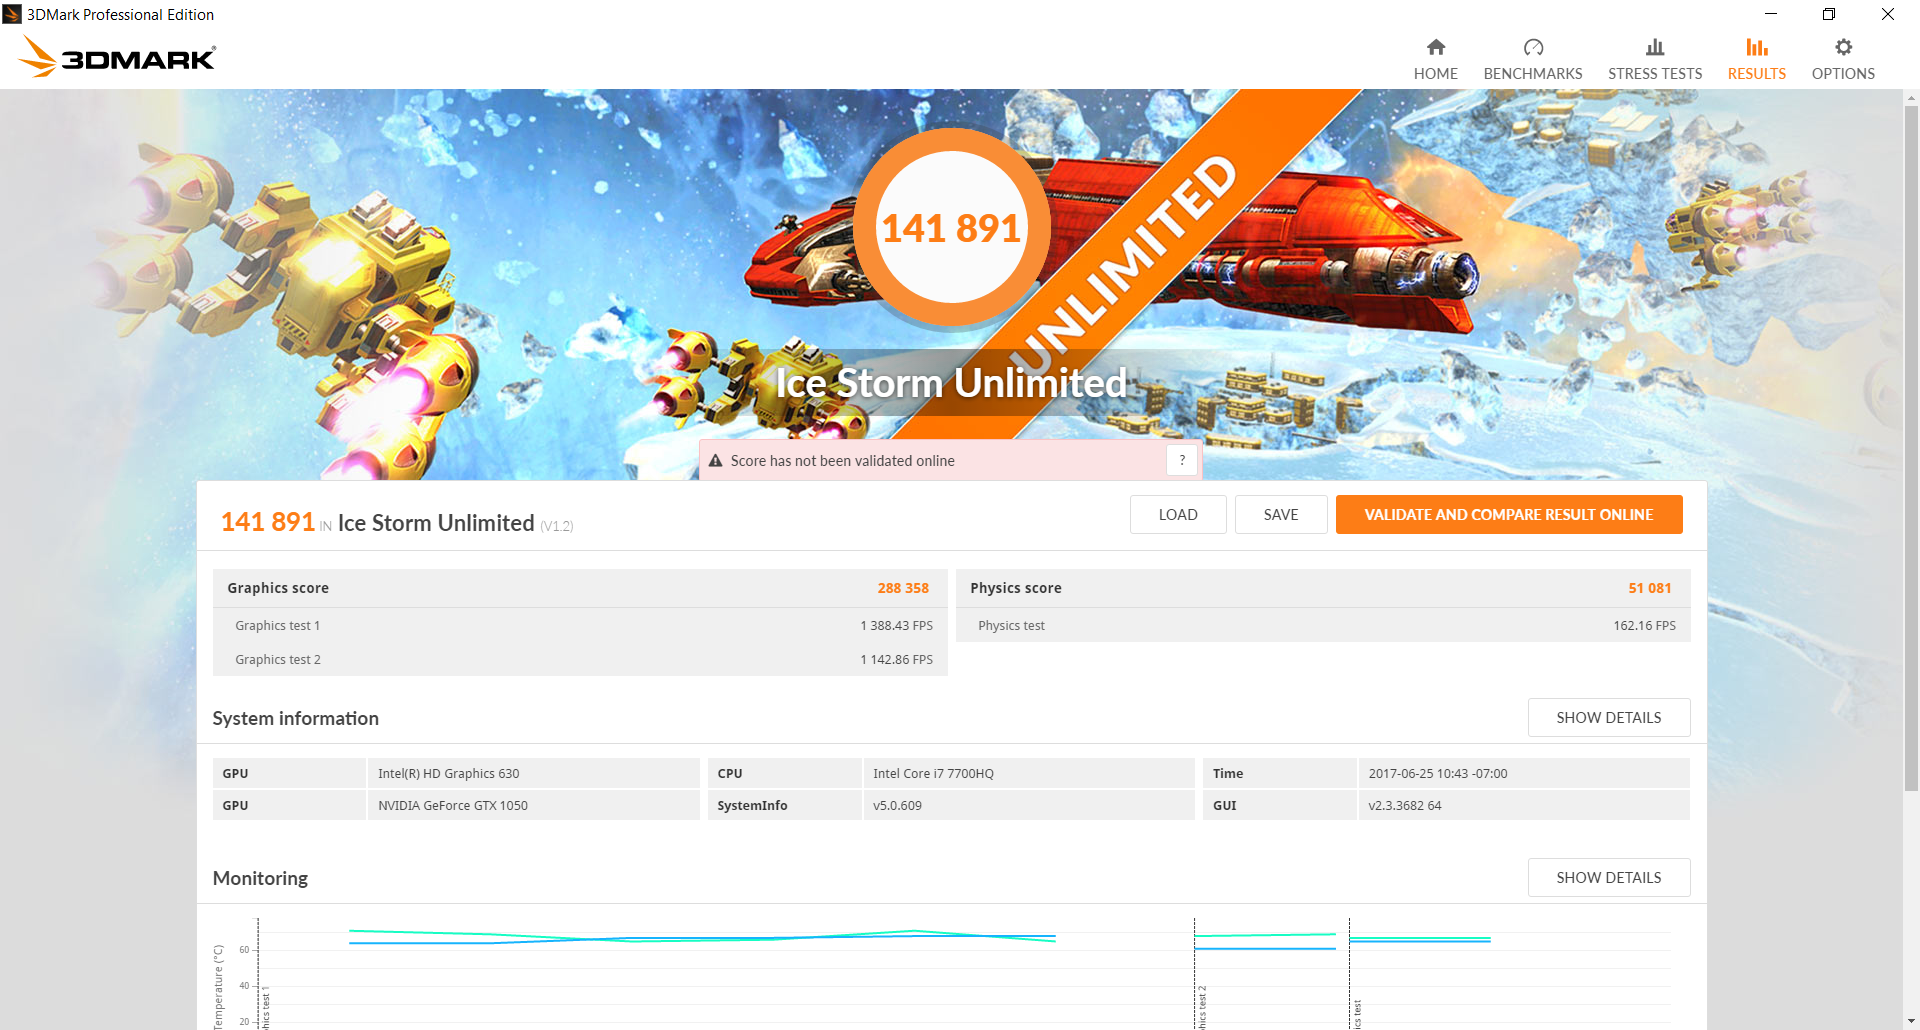
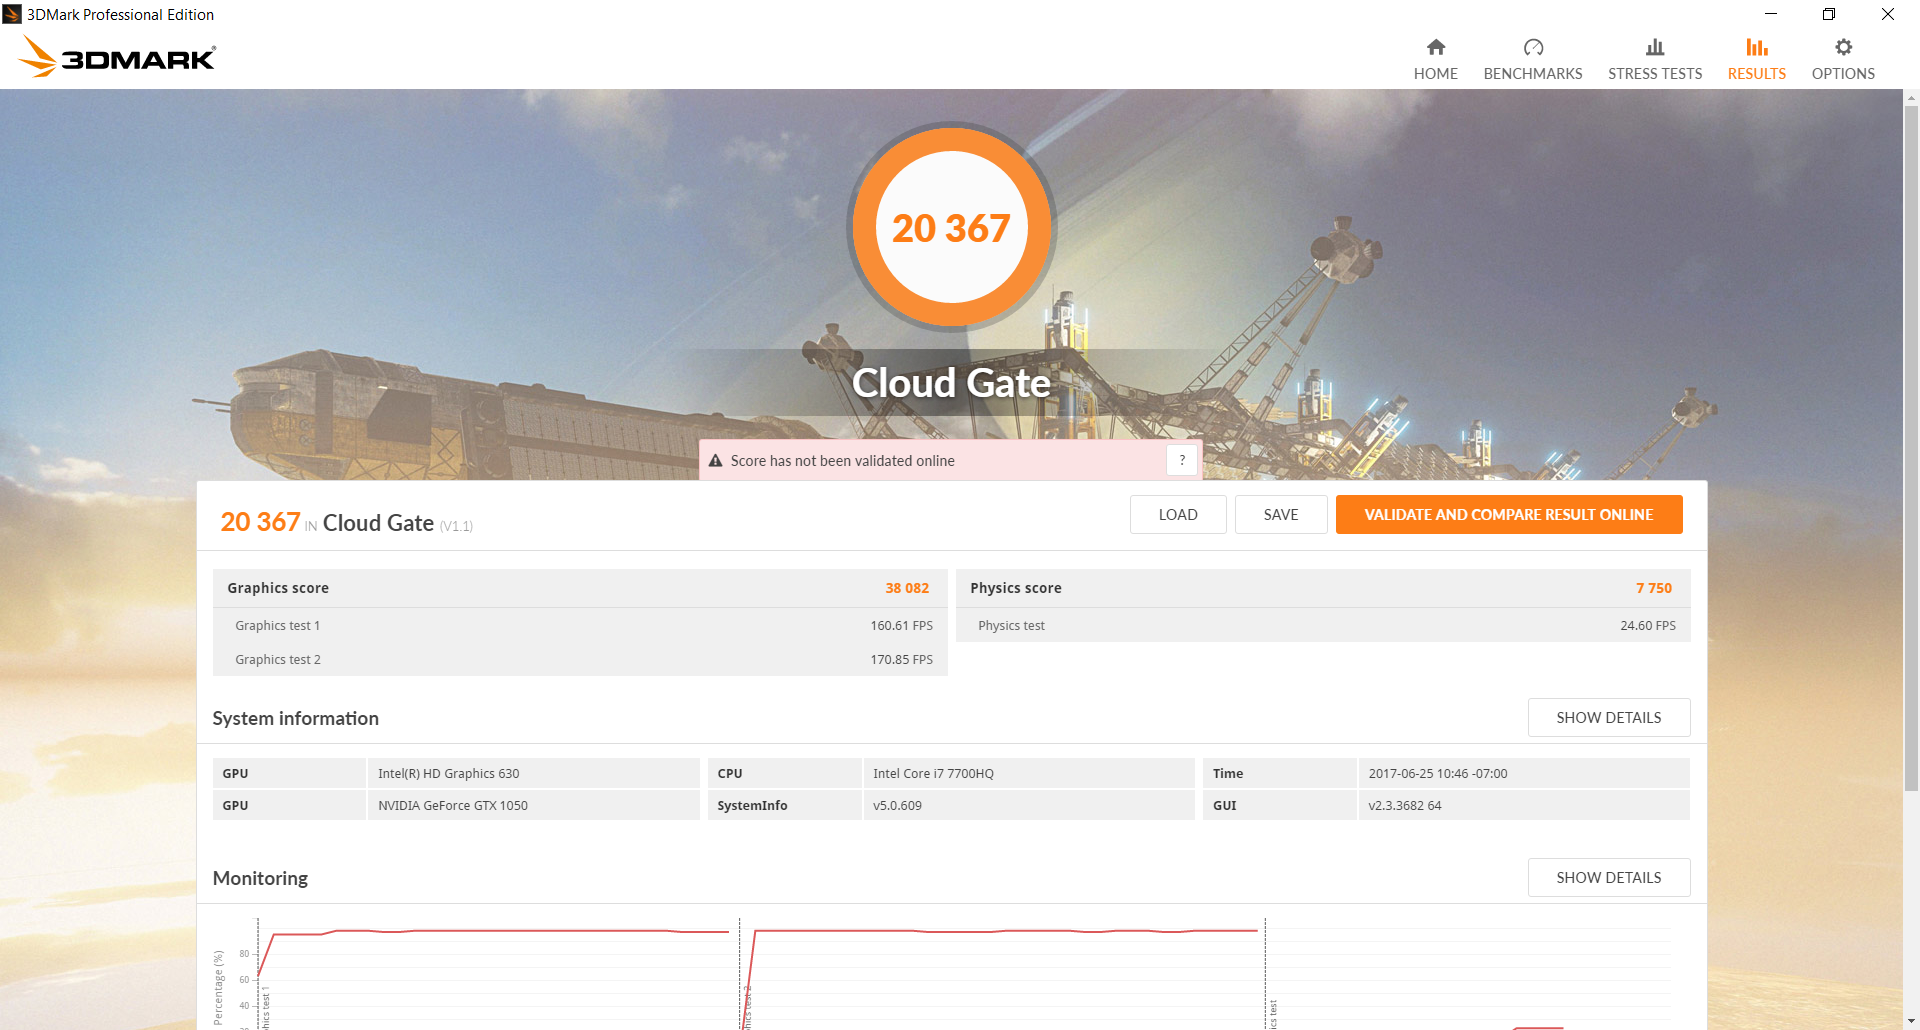
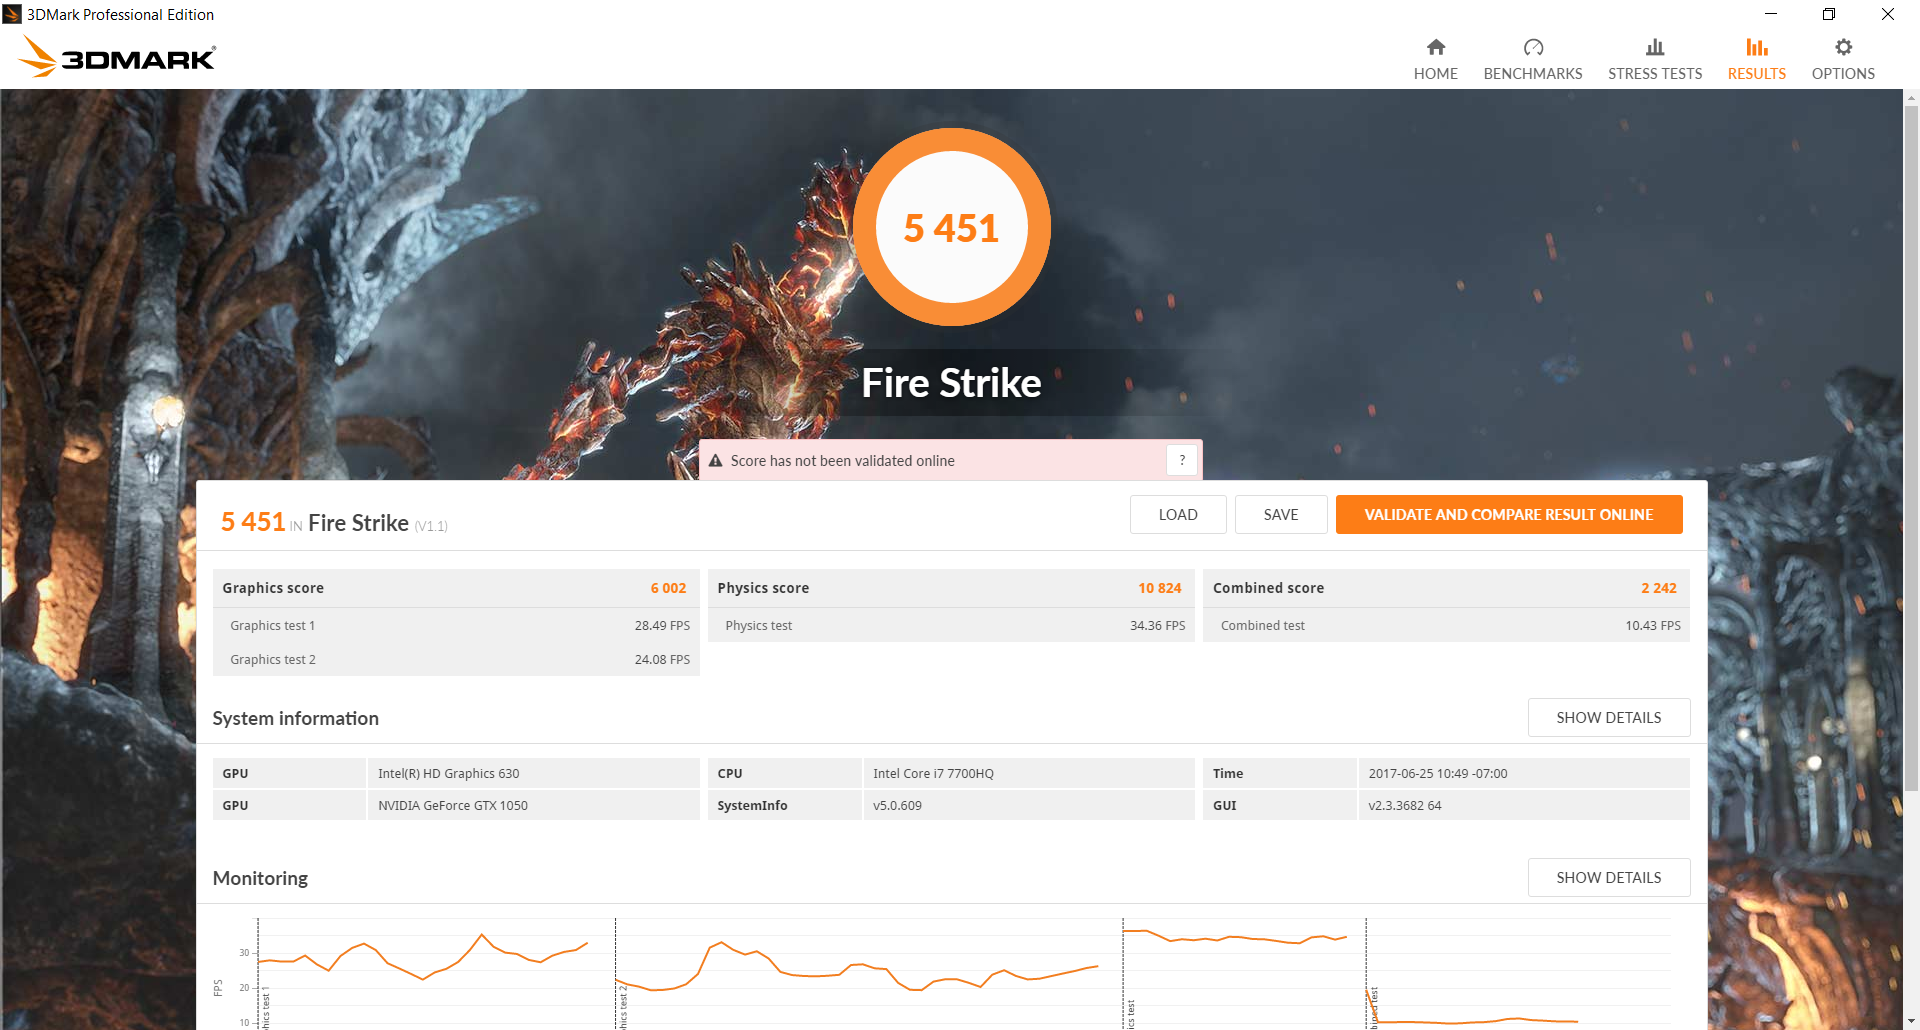
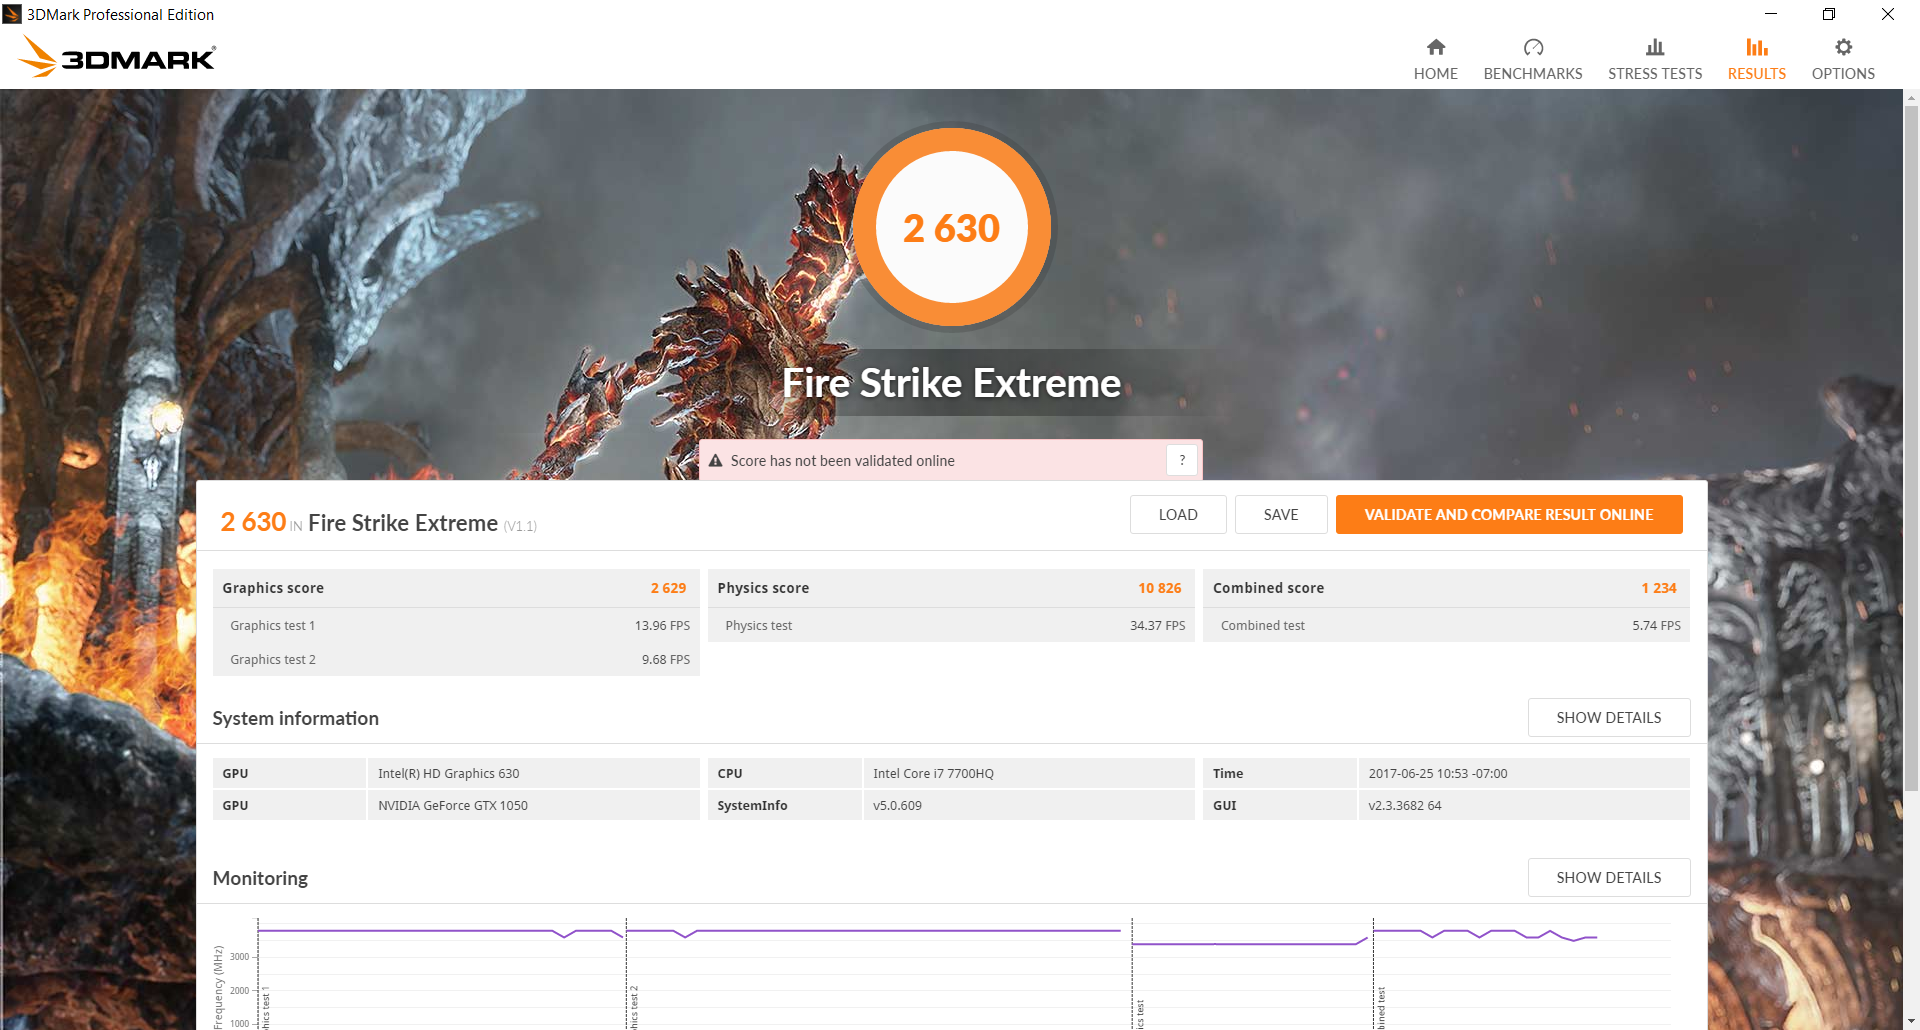
| 3DMark 11 Performance | 7467 points | |
| 3DMark Ice Storm Standard Score | 114747 points | |
| 3DMark Cloud Gate Standard Score | 20367 points | |
| 3DMark Fire Strike Score | 5451 points | |
| 3DMark Fire Strike Extreme Score | 2630 points | |
Help | ||
Gaming Performance
The GTX 1050 is powerful enough to play most modern titles on maximum 1080p settings while maintaining average frame rates above 30 FPS. Frame rates at or above 60 FPS are largely unattainable unless if resolution settings are well below the native setting. The 2 GB VRAM advantage over the Samsung Odyssey does not appear to significantly impact frame rates with Batman Arkham Knight being the notable exception. Performance advantages over the GTX 950M can be even greater in real-world gaming conditions compared to the above synthetic 3DMark benchmarks.
See our GTX 1050 GPU page for more technical information and gaming benchmarks.
| Rise of the Tomb Raider - 1920x1080 Very High Preset AA:FX AF:16x | |
| Aorus x3 Plus v7 | |
| Asus Strix GL502VT-DS74 | |
| MSI GeForce GTX 1050 Ti | |
| Zotac GeForce GTX 1050 2GB | |
| HP Pavilion 15 Power 1GK62AV | |
| HP Omen 15-ax007ng | |
| HP Pavilion 17 FHD V3A33AV | |
| Asus N752VX-GC131T | |
| low | med. | high | ultra | |
|---|---|---|---|---|
| Guild Wars 2 (2012) | 43.3 | |||
| StarCraft II: Heart of the Swarm (2013) | 114 | |||
| BioShock Infinite (2013) | 63.1 | |||
| Metro: Last Light (2013) | 78.9 | 43.6 | ||
| Thief (2014) | 73.8 | 41.4 | ||
| The Witcher 3 (2015) | 69 | 40.2 | 21 | |
| Batman: Arkham Knight (2015) | 89 | 78 | 44 | |
| Metal Gear Solid V (2015) | 60 | 60 | 60 | 48.2 |
| Dota 2 Reborn (2015) | 94.9 | |||
| Fallout 4 (2015) | 41.8 | 33.7 | ||
| Rise of the Tomb Raider (2016) | 38.4 | 32.9 | ||
| Ashes of the Singularity (2016) | 54.3 | 38.7 | 33.8 | |
| Doom (2016) | 103.6 | 81.5 | 38.4 | 35.3 |
| Overwatch (2016) | 92.2 | 55.5 | ||
| Mafia 3 (2016) | 40.6 | 27.8 | ||
| Prey (2017) | 144 | 83.3 | 60.7 | 49.9 |
Stress Test
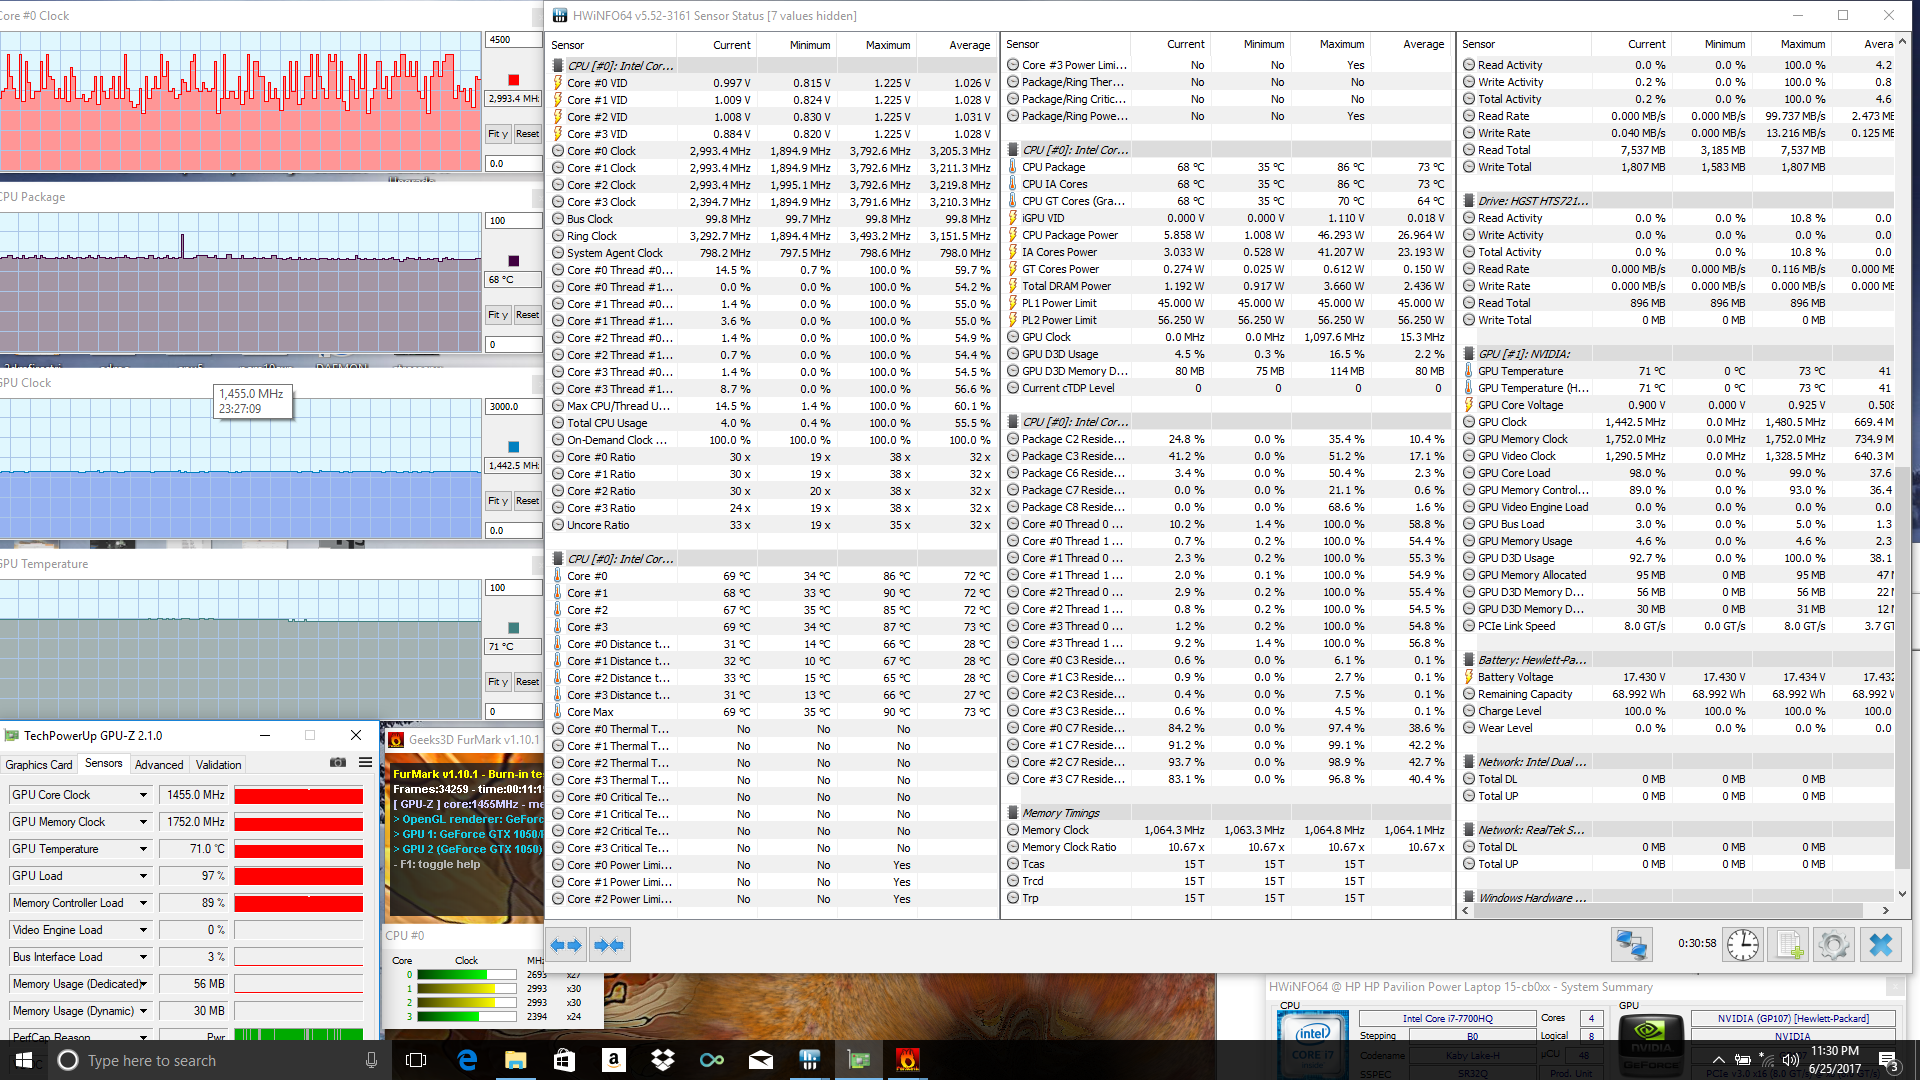
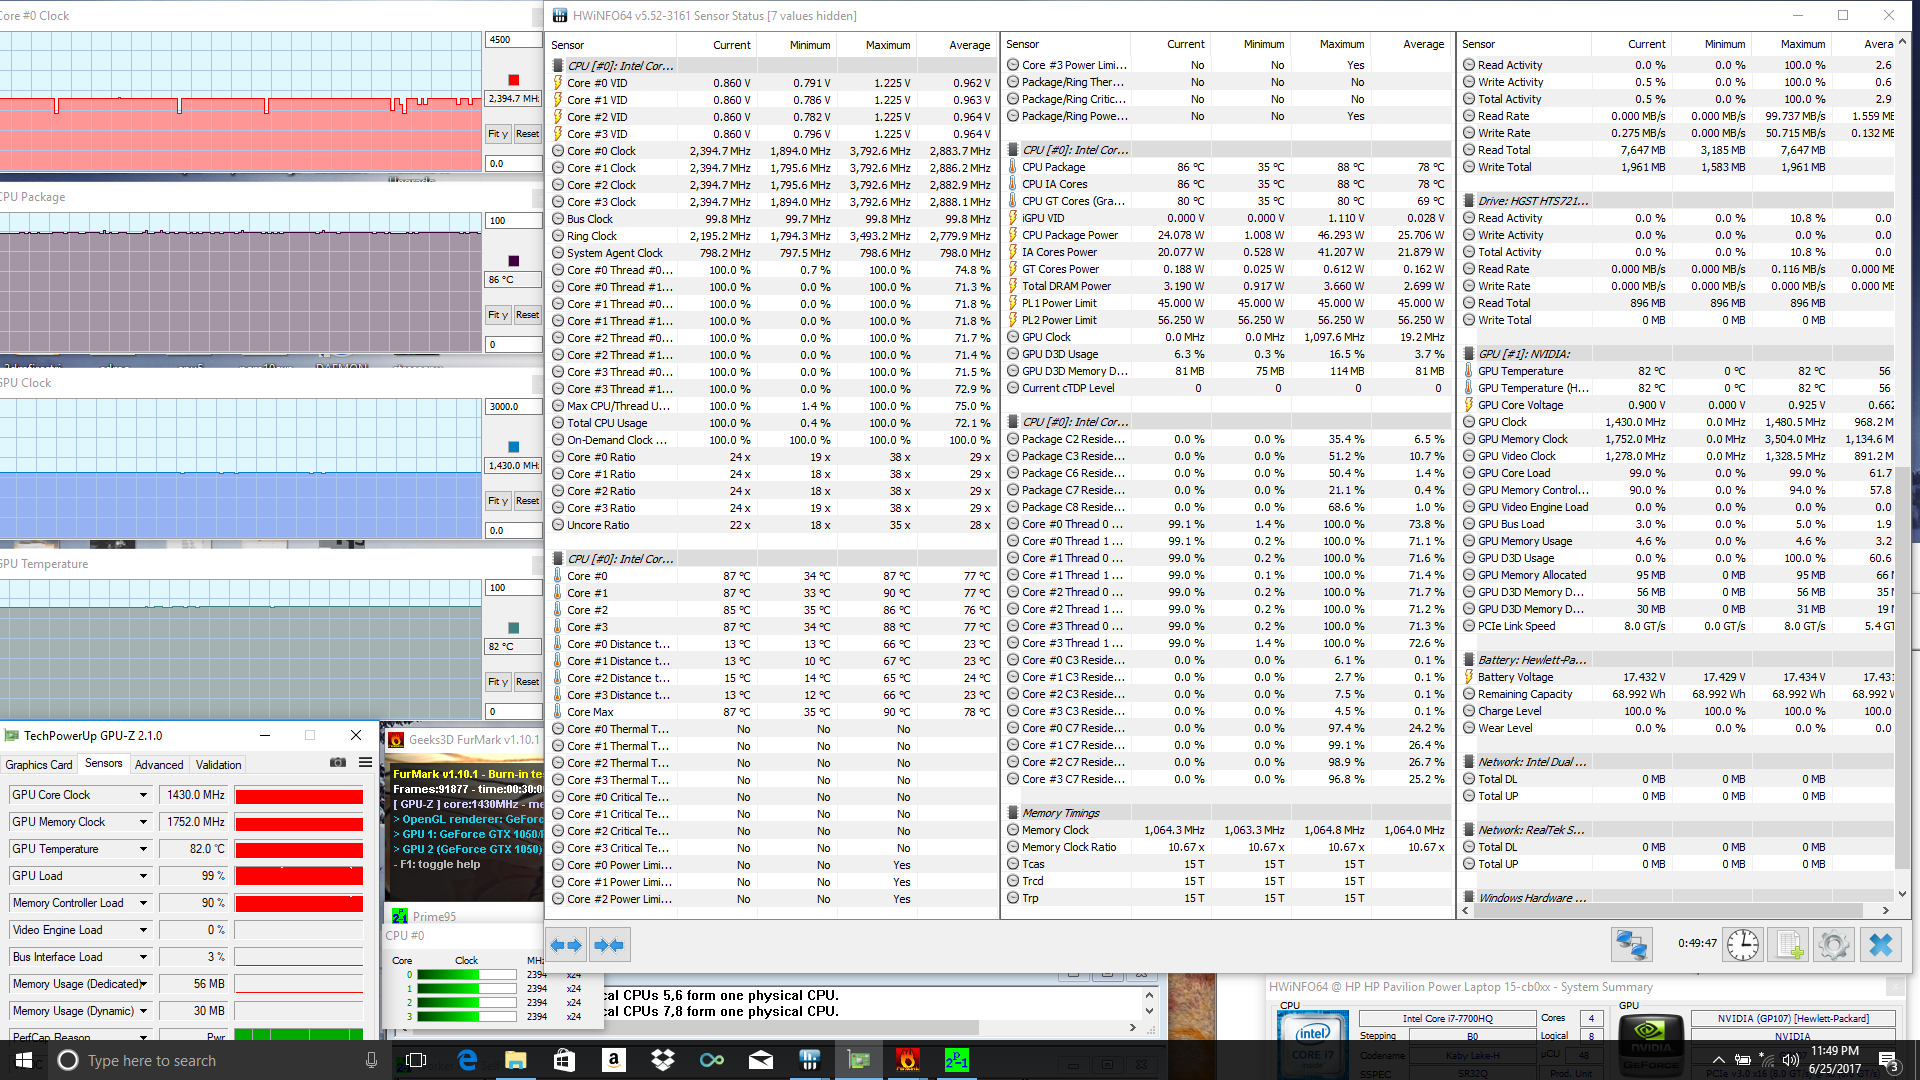
We stress the notebook in order to identify for any potential throttling or hardware issues. With just Prime95 active to stress the CPU, we can observe the processor running at a steady 3.4 GHz or a full 600 MHz above its base clock rate. While impressive, CPU temperature plateaus at a very warm 86 C compared to 76 C on the Samsung Odyssey under similar conditions. Running both Prime95 and FurMark simultaneously will bring the CPU down to just 2.4 GHz with temperatures in the mid 80 C range for both the CPU and GPU.
Witcher 3 stress is more representative of gaming loads. The CPU will maintain clock rates at or above 2.4 GHz depending on the load while GPU clock rates are steady at 1658 MHz compared to its base clock of 1354 MHz. Core temperatures stabilize in the low 70 C range.
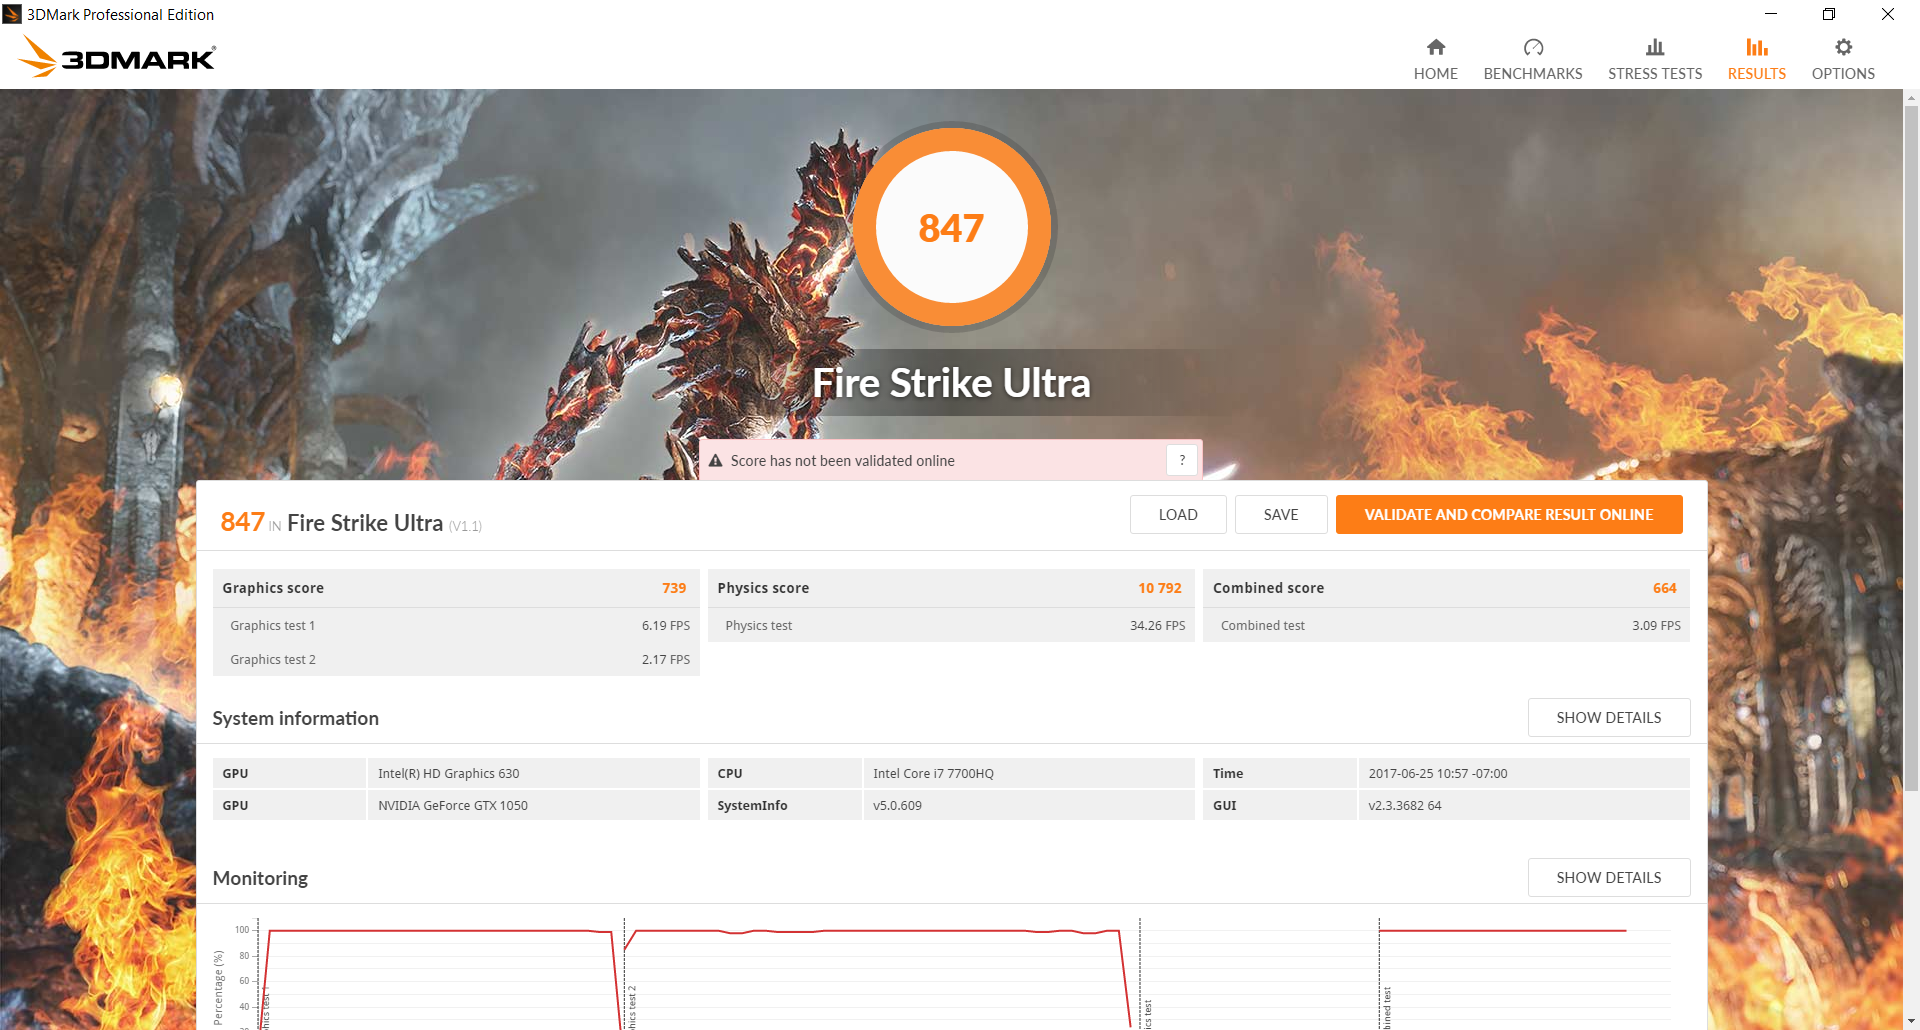
Running on batteries will throttle the GPU while the CPU remains the same. A 3DMark 11 run on battery power returns a Graphics score 6056 points compared to 7537 points when on mains.
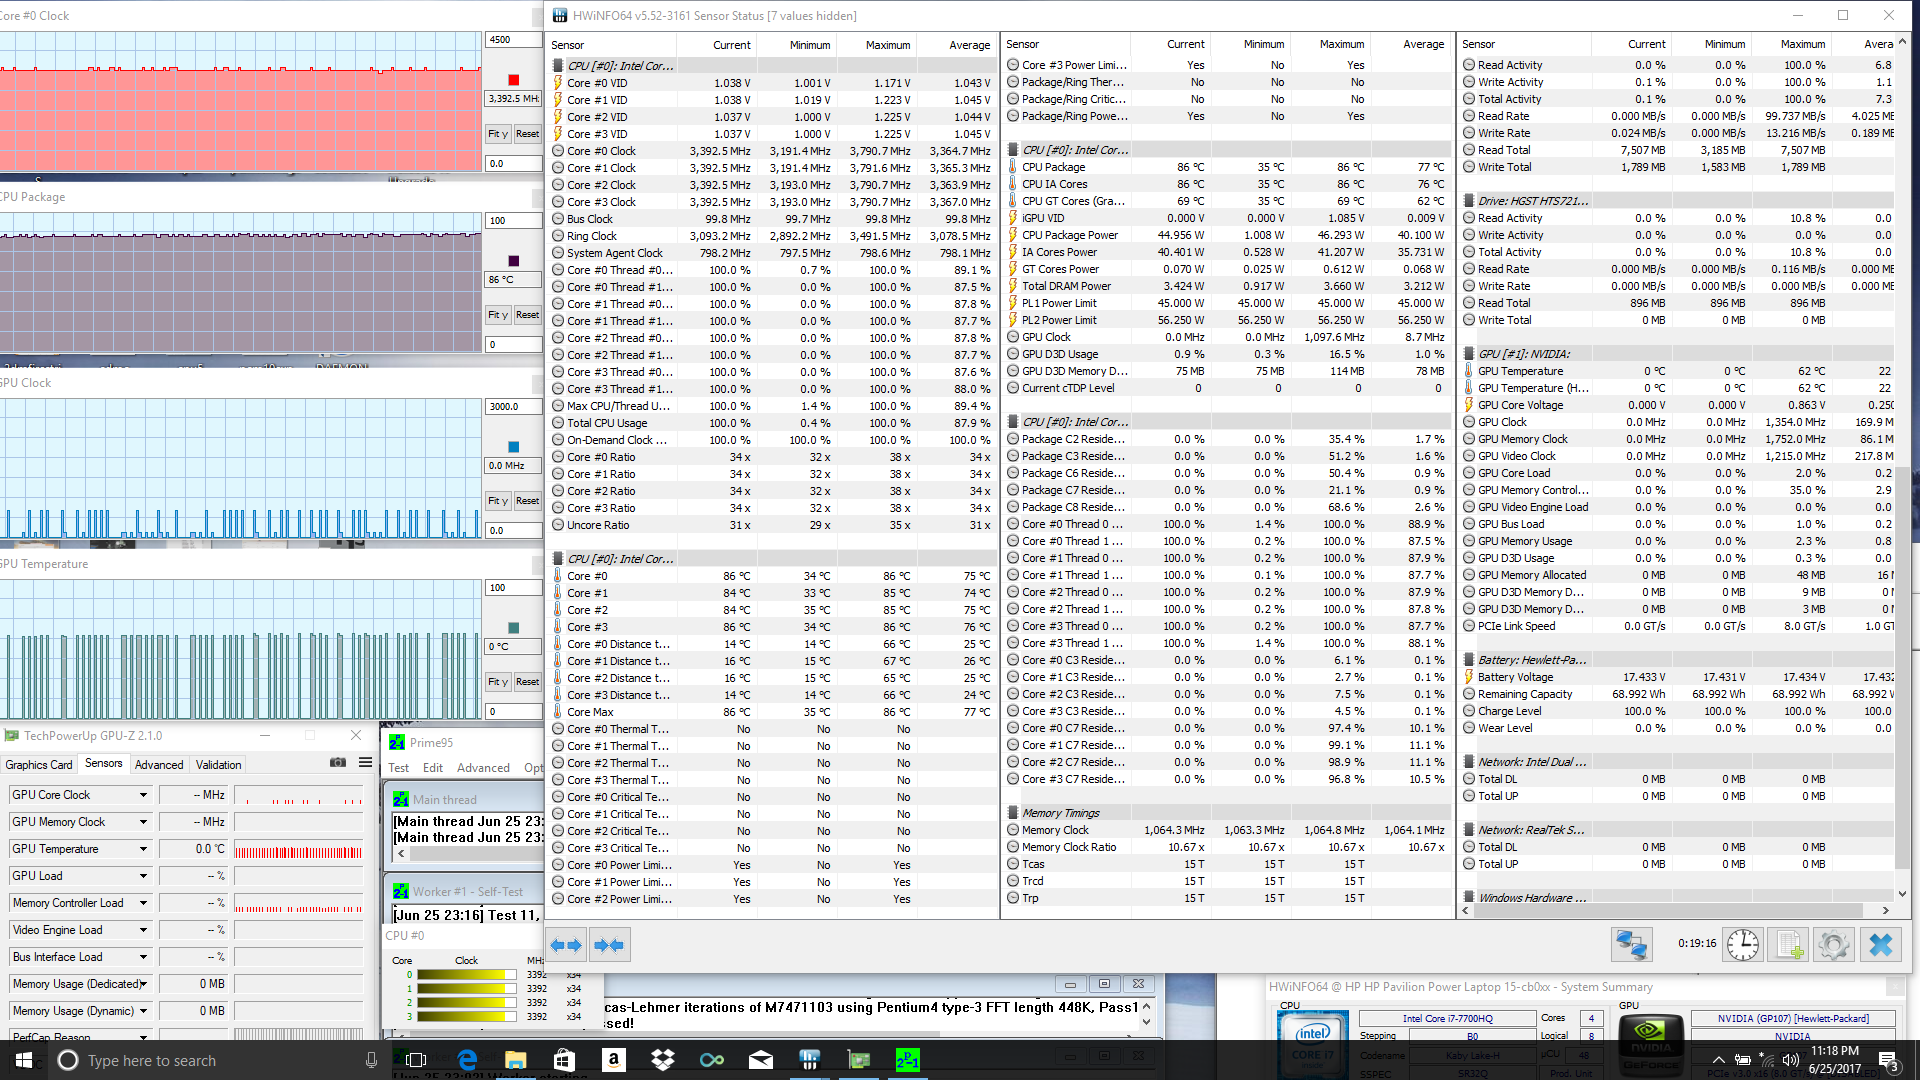
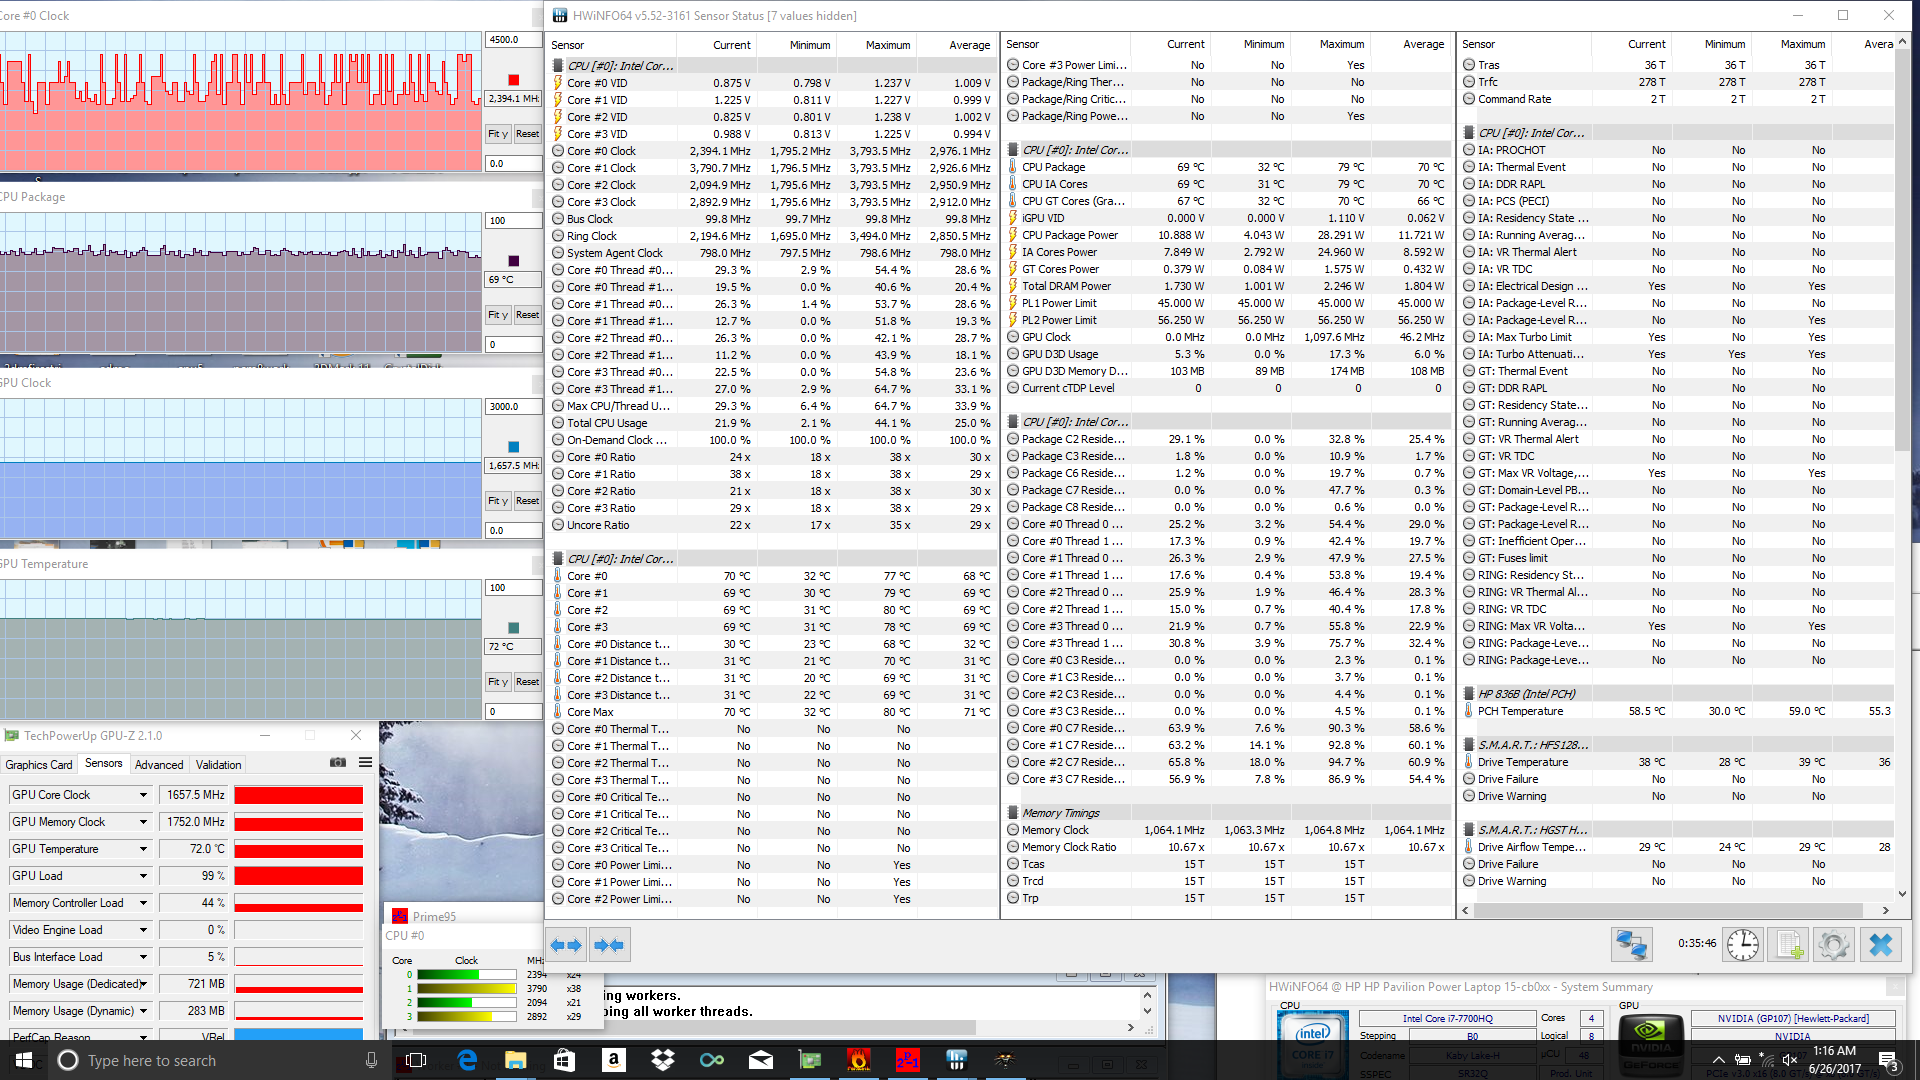
| CPU Clock (GHz) | GPU Clock (MHz) | Average CPU Temperature (°C) | Average GPU Temperature (°C) | |
| Prime95 Stress | 3.4 | -- | 86 | -- |
| FurMark Stress | -- | 1443 | 68 | 71 |
| Prime95 + FurMark Stress | 2.4 | 1430 | 86 | 82 |
| Witcher 3 Stress | 2.4+ | 1658 | 69 | 72 |
Emissions
System Noise
The fans are always active no matter the system load or power setting. Fan behavior has not improved over the older Pavilion 15t design and this is unfortunate as the system is generally louder than other 15-inch notebooks during day-to-day browsing loads. Average load as represented by 3DMark06 will induce a fan noise of 43 dB(A) while Witcher 3 will be slightly louder at 45 dB(A). We consider the mid-to-high 40 dB(A) range to be distracting when gaming and so we recommend headphones if possible to muffle the fan noise.
Our unit exhibited no signs of electronic noise or coil whining during our tests. Even if it did, however, it would have to be louder than just a whisper in order to overpower the constant fan noise.
Noise level
| Idle |
| 32.1 / 32.2 / 32.2 dB(A) |
| Load |
| 43.3 / 49.6 dB(A) |
 | ||
30 dB silent 40 dB(A) audible 50 dB(A) loud |
||
min: | ||
| HP Pavilion 15 Power 1GK62AV GeForce GTX 1050 Mobile, i7-7700HQ, SK Hynix HFS256G39TND-N210A | Lenovo Yoga 720-15IKB-80X7 GeForce GTX 1050 Mobile, i7-7700HQ, Samsung PM961 MZVLW256HEHP | Lenovo Legion Y520-15IKBN-80WK001KUS GeForce GTX 1050 Ti Mobile, i7-7700HQ, Samsung PM961 MZVLW256HEHP | Samsung Odyssey NP800G5M-X01US GeForce GTX 1050 Mobile, i7-7700HQ, Samsung PM961 NVMe MZVLW128HEGR | HP Pavilion 15t-bc200 X7P44AV GeForce GTX 1050 Mobile, i7-7700HQ, Intel SSD 600p SSDPEKKW256G7 | |
|---|---|---|---|---|---|
| Noise | 9% | 7% | 3% | 1% | |
| off / environment * (dB) | 27.8 | 28.2 -1% | 27.7 -0% | 28.1 -1% | 28.9 -4% |
| Idle Minimum * (dB) | 32.1 | 28.2 12% | 30.5 5% | 28.1 12% | 32.3 -1% |
| Idle Average * (dB) | 32.2 | 28.2 12% | 30.5 5% | 29.1 10% | 32.3 -0% |
| Idle Maximum * (dB) | 32.2 | 28.2 12% | 30.6 5% | 29.1 10% | 32.3 -0% |
| Load Average * (dB) | 43.3 | 39 10% | 40 8% | 49.2 -14% | 43.2 -0% |
| Witcher 3 ultra * (dB) | 45 | 40 11% | |||
| Load Maximum * (dB) | 49.6 | 46.3 7% | 42.6 14% | 49.2 1% | 45.2 9% |
* ... smaller is better
Temperature
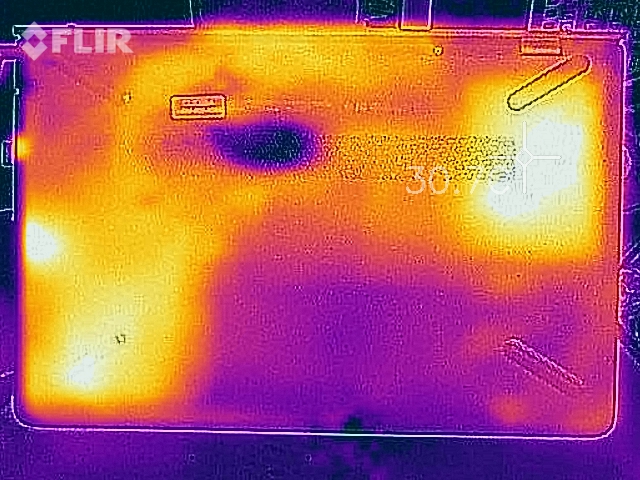
Surface temperatures are flat when idling with the bottom side being a few degrees C warmer than the top. Maximum load with both Prime95 and FurMark active will warm the right side of the notebook noticeably more than the left due to the positioning of the processors and M.2 SSD. This uneven surface temperature development keeps the WASD keys relatively cool for gaming, but the right hand will feel warmer than the left when typing.
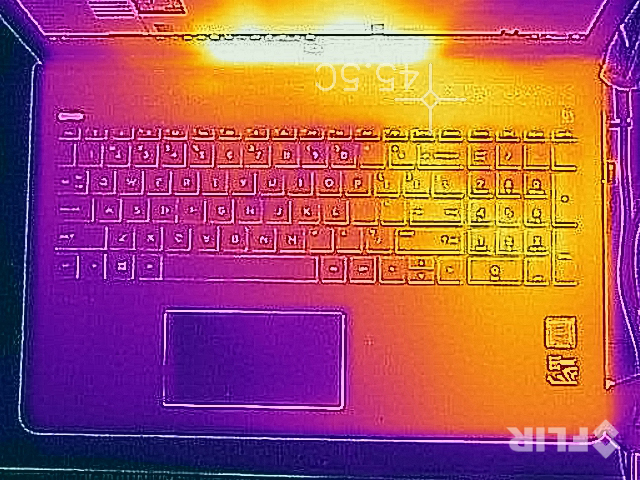
Additionally, it's interesting to note that heat exhausts upwards towards the front of the screen unlike on most notebooks where ventilation grilles on the edges or rear are far more common. The screen surface will become very warm as a result as shown by our temperature maps below. Surface temperatures can reach 60 C on the bottom of the notebook near the ventilation grilles.
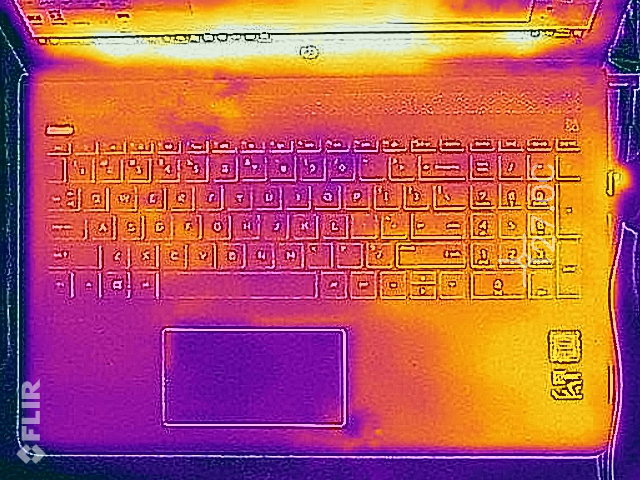
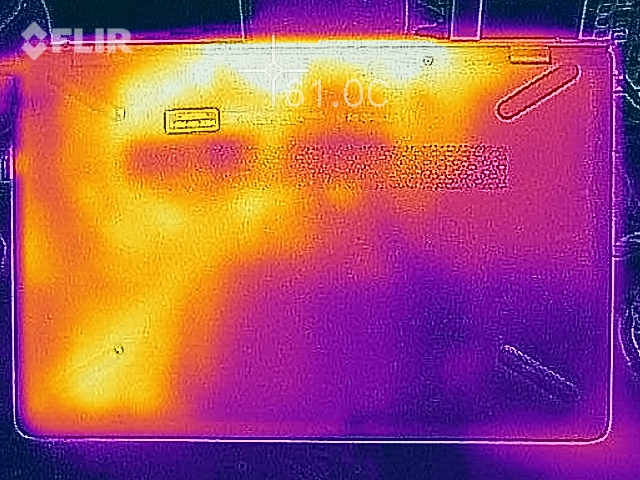
(±) The maximum temperature on the upper side is 44.6 °C / 112 F, compared to the average of 36.8 °C / 98 F, ranging from 21 to 71 °C for the class Multimedia.
(-) The bottom heats up to a maximum of 60 °C / 140 F, compared to the average of 39.1 °C / 102 F
(+) In idle usage, the average temperature for the upper side is 26.2 °C / 79 F, compared to the device average of 31.3 °C / 88 F.
(±) Playing The Witcher 3, the average temperature for the upper side is 34.4 °C / 94 F, compared to the device average of 31.3 °C / 88 F.
(-) The palmrests and touchpad can get very hot to the touch with a maximum of 41 °C / 105.8 F.
(-) The average temperature of the palmrest area of similar devices was 28.7 °C / 83.7 F (-12.3 °C / -22.1 F).
Speakers
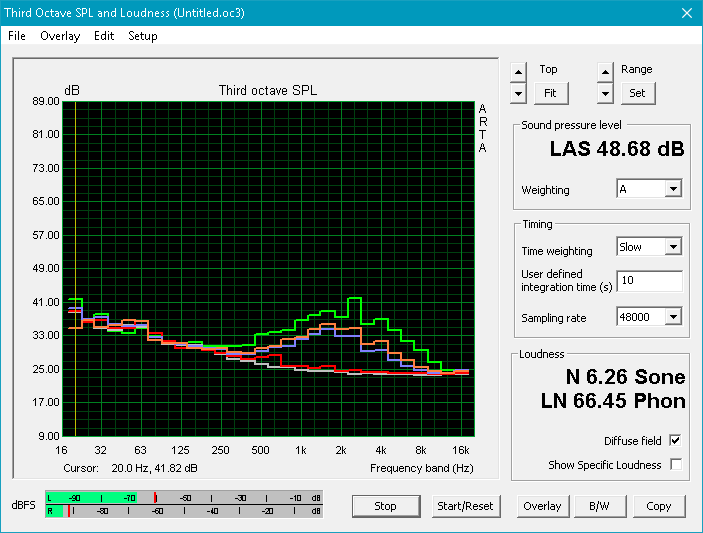
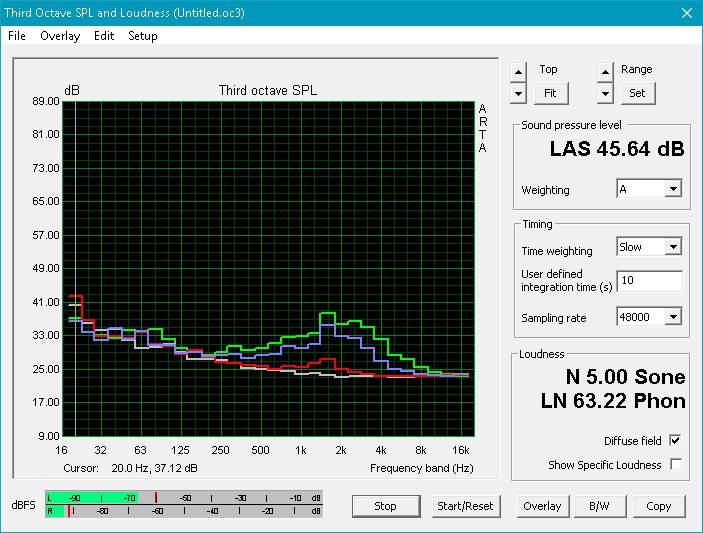
Maximum volume is slightly louder than on the Pavilion 15t, but quality isn't necessarily any better. Our pink noise measurements show an uneven reproduction of bass and treble frequencies compared to the more balanced and smoother curve of the larger Eurocom Sky X7E2 speakers. Though bass is sorely lacking, high volume settings will not reverberate the chassis at all or introduce any static. The integrated speakers aren't necessarily bad in Ultrabook terms, but they're certainly subpar for a multimedia machine.
")


HP Pavilion 15 Power 1GK62AV audio analysis
(-) | not very loud speakers (68.5 dB)
Bass 100 - 315 Hz
(-) | nearly no bass - on average 17.7% lower than median
(±) | linearity of bass is average (13.4% delta to prev. frequency)
Mids 400 - 2000 Hz
(+) | balanced mids - only 4.2% away from median
(±) | linearity of mids is average (8.8% delta to prev. frequency)
Highs 2 - 16 kHz
(+) | balanced highs - only 3.5% away from median
(±) | linearity of highs is average (11.6% delta to prev. frequency)
Overall 100 - 16.000 Hz
(±) | linearity of overall sound is average (26.8% difference to median)
Compared to same class
» 92% of all tested devices in this class were better, 2% similar, 6% worse
» The best had a delta of 5%, average was 17%, worst was 45%
Compared to all devices tested
» 82% of all tested devices were better, 4% similar, 14% worse
» The best had a delta of 4%, average was 24%, worst was 134%
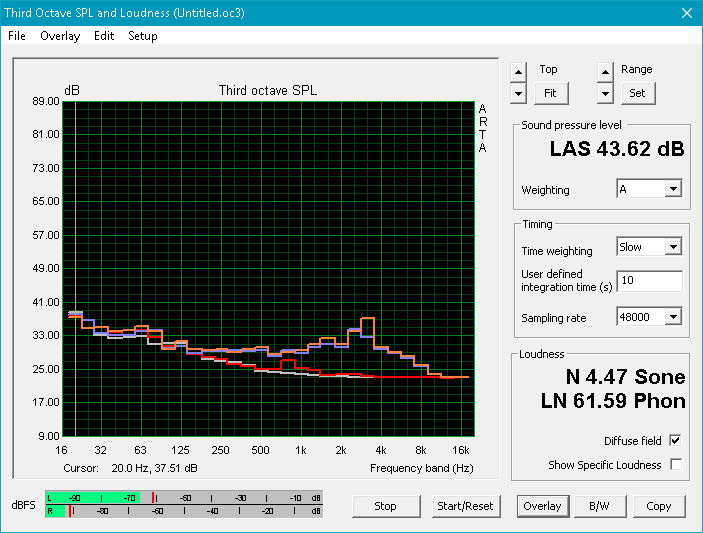
Apple MacBook 12 (Early 2016) 1.1 GHz audio analysis
(+) | speakers can play relatively loud (83.6 dB)
Bass 100 - 315 Hz
(±) | reduced bass - on average 11.3% lower than median
(±) | linearity of bass is average (14.2% delta to prev. frequency)
Mids 400 - 2000 Hz
(+) | balanced mids - only 2.4% away from median
(+) | mids are linear (5.5% delta to prev. frequency)
Highs 2 - 16 kHz
(+) | balanced highs - only 2% away from median
(+) | highs are linear (4.5% delta to prev. frequency)
Overall 100 - 16.000 Hz
(+) | overall sound is linear (10.2% difference to median)
Compared to same class
» 7% of all tested devices in this class were better, 2% similar, 91% worse
» The best had a delta of 5%, average was 18%, worst was 53%
Compared to all devices tested
» 5% of all tested devices were better, 1% similar, 94% worse
» The best had a delta of 4%, average was 24%, worst was 134%
Frequency Comparison (Checkbox selectable!)
Graph 1: Pink Noise 100% Vol.; Graph 2: Audio off
Energy Management
Power Consumption
Idling on desktop will draw anywhere from 9 W up to 17 W depending on the power profile and display brightness setting. Average load as represented by 3DMark06 will demand about 77 W to be in between the HP Pavilion 17 (7700HQ, 960M) and Asus Strix GL502VT (7700HQ, 970M).
Maximum load with Prime95 and FurMark will draw 106 W from a power adapter (~14.0 x 6.5 x 2.5 cm) rated for up to 150 W. This is an unusually high power overhead which isn't necessarily bad, but a smaller and more portable 130 W or 140 W adapter would have worked just as well.
| Off / Standby | |
| Idle | |
| Load |
|
Key:
min: | |
| HP Pavilion 15 Power 1GK62AV i7-7700HQ, GeForce GTX 1050 Mobile, SK Hynix HFS256G39TND-N210A, IPS, 1920x1080, 15.6" | Samsung Odyssey NP800G5M-X01US i7-7700HQ, GeForce GTX 1050 Mobile, Samsung PM961 NVMe MZVLW128HEGR, IPS, 1920x1080, 15.6" | Lenovo Legion Y520-15IKBN-80WK001KUS i7-7700HQ, GeForce GTX 1050 Ti Mobile, Samsung PM961 MZVLW256HEHP, IPS, 1920x1080, 15.6" | Asus Strix GL502VT-DS74 6700HQ, GeForce GTX 970M, Lite-On CV1-8B128, IPS, 1920x1080, 15.6" | HP Pavilion 17 FHD V3A33AV 6700HQ, GeForce GTX 960M, SanDisk Z400s SD8SNAT-128G, IPS, 1920x1080, 17.3" | |
|---|---|---|---|---|---|
| Power Consumption | 7% | 4% | -30% | 12% | |
| Idle Minimum * (Watt) | 9.4 | 6.7 29% | 8.5 10% | 11.1 -18% | 5.3 44% |
| Idle Average * (Watt) | 9.7 | 8.9 8% | 9.1 6% | 14.1 -45% | 10.6 -9% |
| Idle Maximum * (Watt) | 16.8 | 10.8 36% | 9.7 42% | 18.4 -10% | 11.8 30% |
| Load Average * (Watt) | 76.5 | 81.8 -7% | 79.9 -4% | 96.5 -26% | 70.9 7% |
| Witcher 3 ultra * (Watt) | 86.5 | 92.2 -7% | 97.7 -13% | ||
| Load Maximum * (Watt) | 105.6 | 122.7 -16% | 121.5 -15% | 159.5 -51% | 119.8 -13% |
* ... smaller is better
Battery Life
The internal 70 Wh battery is larger in capacity compared to the 43 Wh and 63 Wh batteries on the Samsung Odyssey and Pavilion 15t, respectively. Runtimes are almost twice that of the Samsung when under similar WLAN loads and nearly identical to the new Yoga 720. Users can expect about 8 hours of real-world WLAN use before automatic shutdown.
Recharging from near empty to full capacity will take just under 2 hours.
| HP Pavilion 15 Power 1GK62AV i7-7700HQ, GeForce GTX 1050 Mobile, 70 Wh | Lenovo Yoga 720-15IKB-80X7 i7-7700HQ, GeForce GTX 1050 Mobile, 72 Wh | Lenovo Legion Y520-15IKBN-80WK001KUS i7-7700HQ, GeForce GTX 1050 Ti Mobile, 45 Wh | Acer Aspire VX15 VX5-591G-589S i5-7300HQ, GeForce GTX 1050 Mobile, 52.5 Wh | Samsung Odyssey NP800G5M-X01US i7-7700HQ, GeForce GTX 1050 Mobile, 43 Wh | HP Pavilion 15t-X7P42AV i7-7700HQ, GeForce GTX 1050 Mobile, 63.3 Wh | |
|---|---|---|---|---|---|---|
| Battery runtime | 0% | -51% | -31% | -37% | -5% | |
| Reader / Idle (h) | 16.2 | 17.8 10% | 8.5 -48% | 10.2 -37% | 16 -1% | |
| WiFi v1.3 (h) | 8 | 8.1 1% | 4 -50% | 5.5 -31% | 4.4 -45% | 6.5 -19% |
| Load (h) | 1.8 | 1.6 -11% | 0.8 -56% | 1.3 -28% | 1.9 6% |
Pros
Cons
Verdict

The Pavilion 15 Power is the stronger and more easily recommendable notebook compared to the standard Pavilion 15 if HQ-class CPUs and Pascal graphics are desirable options. The chassis is a significant update to the point where even typing feels more comfortable and the backlight is brighter for an overall better experience. Buyers should be aware of the average display rigidity, more difficult serviceability, and limited sRGB coverage that make the system unfavorable for graphics editing work.
Pricing is the main issue for the Pavilion 15 Power. The XPS 15 9560 is still the 15-inch notebook to beat and if assuming similar configurations between the two systems (7700HQ, GTX 1050, FHD. 1 TB HDD, 8 GB RAM), the XPS 15 currently costs $1200 USD compared to $1040 USD for the Pavilion on HP.com (or $920 USD through Cukusa.com). The extra $200 or $300 goes a long way as the Dell is unequivocally superior to the Pavilion 15 Power in portability, connectivity, display quality, serviceability, and chassis rigidity. It may run warmer and somewhat louder in general, but the short list of disadvantages are easily eclipsed by the benefits. If budget is tight, however, it's definitely worth skipping over the older Pavilion 15t for the Pavilion 15 Power.
HP Pavilion 15 Power 1GK62AV
- 07/03/2017 v6 (old)
Allen Ngo
Price comparison
