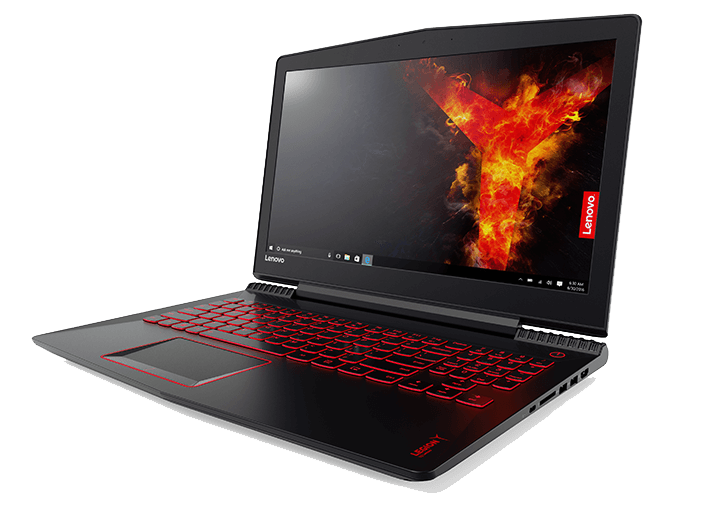
Lenovo Legion Y520 15IKBN (7700HQ, FHD, GTX 1050 Ti) Laptop Review
Just a couple of weeks ago, we reviewed the new Lenovo Legion Y720, which we found to be a terrific contender within the midrange gaming notebook segment. Not only was it well-priced given its specifications, but it was solidly built with predominantly reliable performance during gaming. Still, those looking for an even more affordable option—and not concerned with the flashier aspects of typical gaming rig yore, or 4K display options, or potential VR capabilities—will be pleased to hear that today, we’re evaluating the Y720’s more ordinary, middle-of-the-road sibling, the Y520.
Currently priced at around $1,060 for our configuration, the Y520 setup we’re evaluating today may succumb to some inevitable compromises, but nevertheless, at the component level, this is still nothing to sneeze at. It packs an Intel Core i7-7700HQ CPU, paired with an NVIDIA GeForce GTX 1050 Ti GPU, and augmented by a 256 GB NVMe SSD and 16 GB of DDR4 memory. Let’s see how it stacks up against other budget gaming notebooks, courtesy of our unrelenting testing routine.
Case
While the Y720 featured an aluminum-lined display back and a showier overall presentation, the Y520 is forced (by cost constraints) to defer to a purely plastic construction. This hardly affects the stability of the base unit, which—while resting on a surface especially—easily rivals that of most other comparable competitors, with hardly any flex when pressure is applied (thanks also to the large rubber feet lining the bottom of the device). However, the display lid seems unmistakably flimsy, and it’s admittedly a bit difficult to shake the budget PC sentiment at first glance. In other words, whereas the Asus ROG Strix GL553VD fought to preserve construction materials and aesthetics in pursuit of its (roughly) $1,100 price tag, the Y520 does enough to get by and focuses instead on what’s inside.
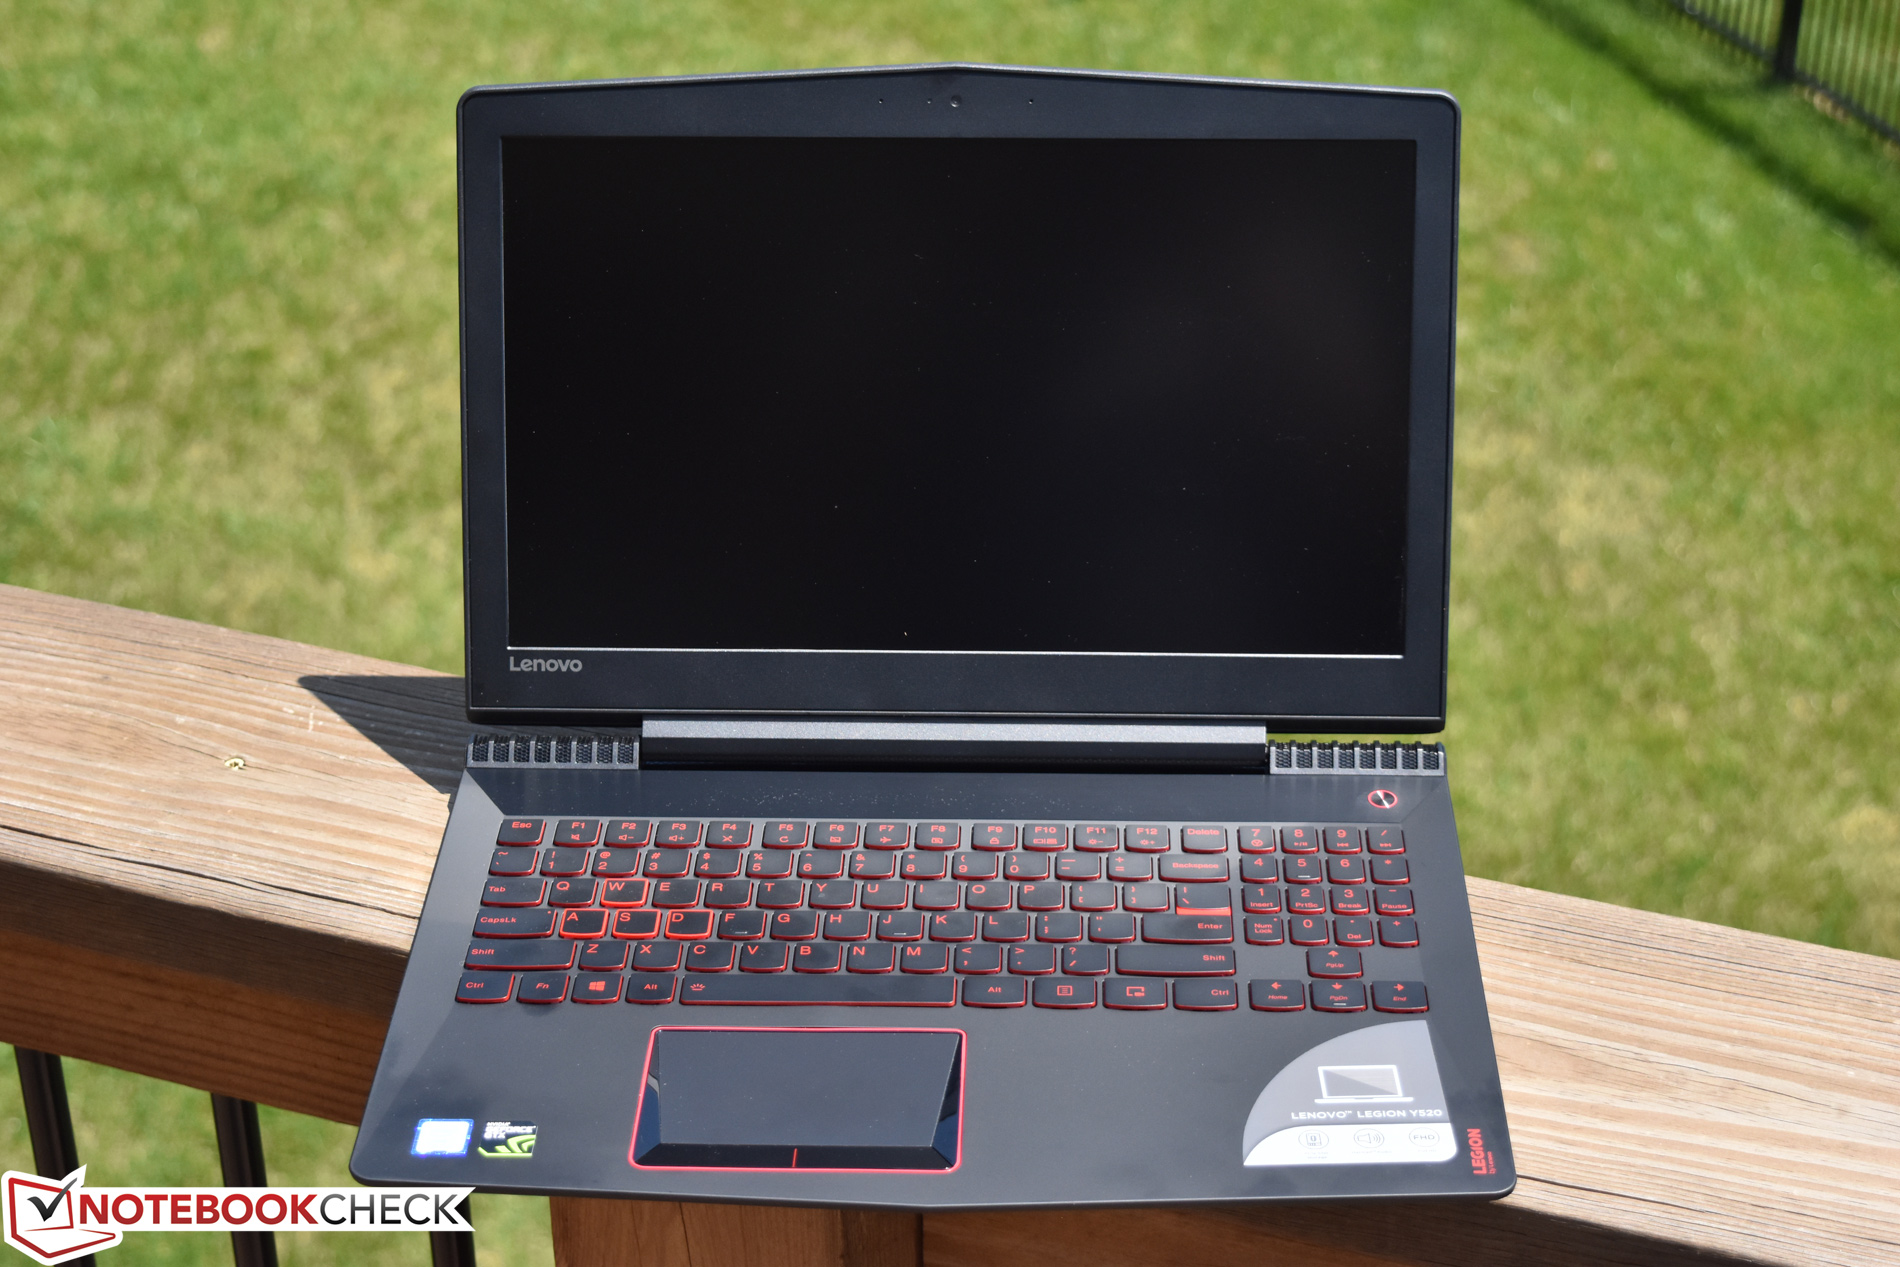
Fortunately, the concerns over construction subside fairly quickly upon opening the machine. While it isn’t the most extroverted of gaming notebook designs by a far cry, the matte black palm rest and keyboard surround paired with red accents (and keyboard backlighting) is unmistakably Alienware/ASUS ROG in its styling. It’s been said before (in our Y720 review), but the material here is extremely prone to fingerprints. Nevertheless, it’s haptically-pleasing, and (as we’ll explore later in greater detail) it doesn’t heat up much at all under load.
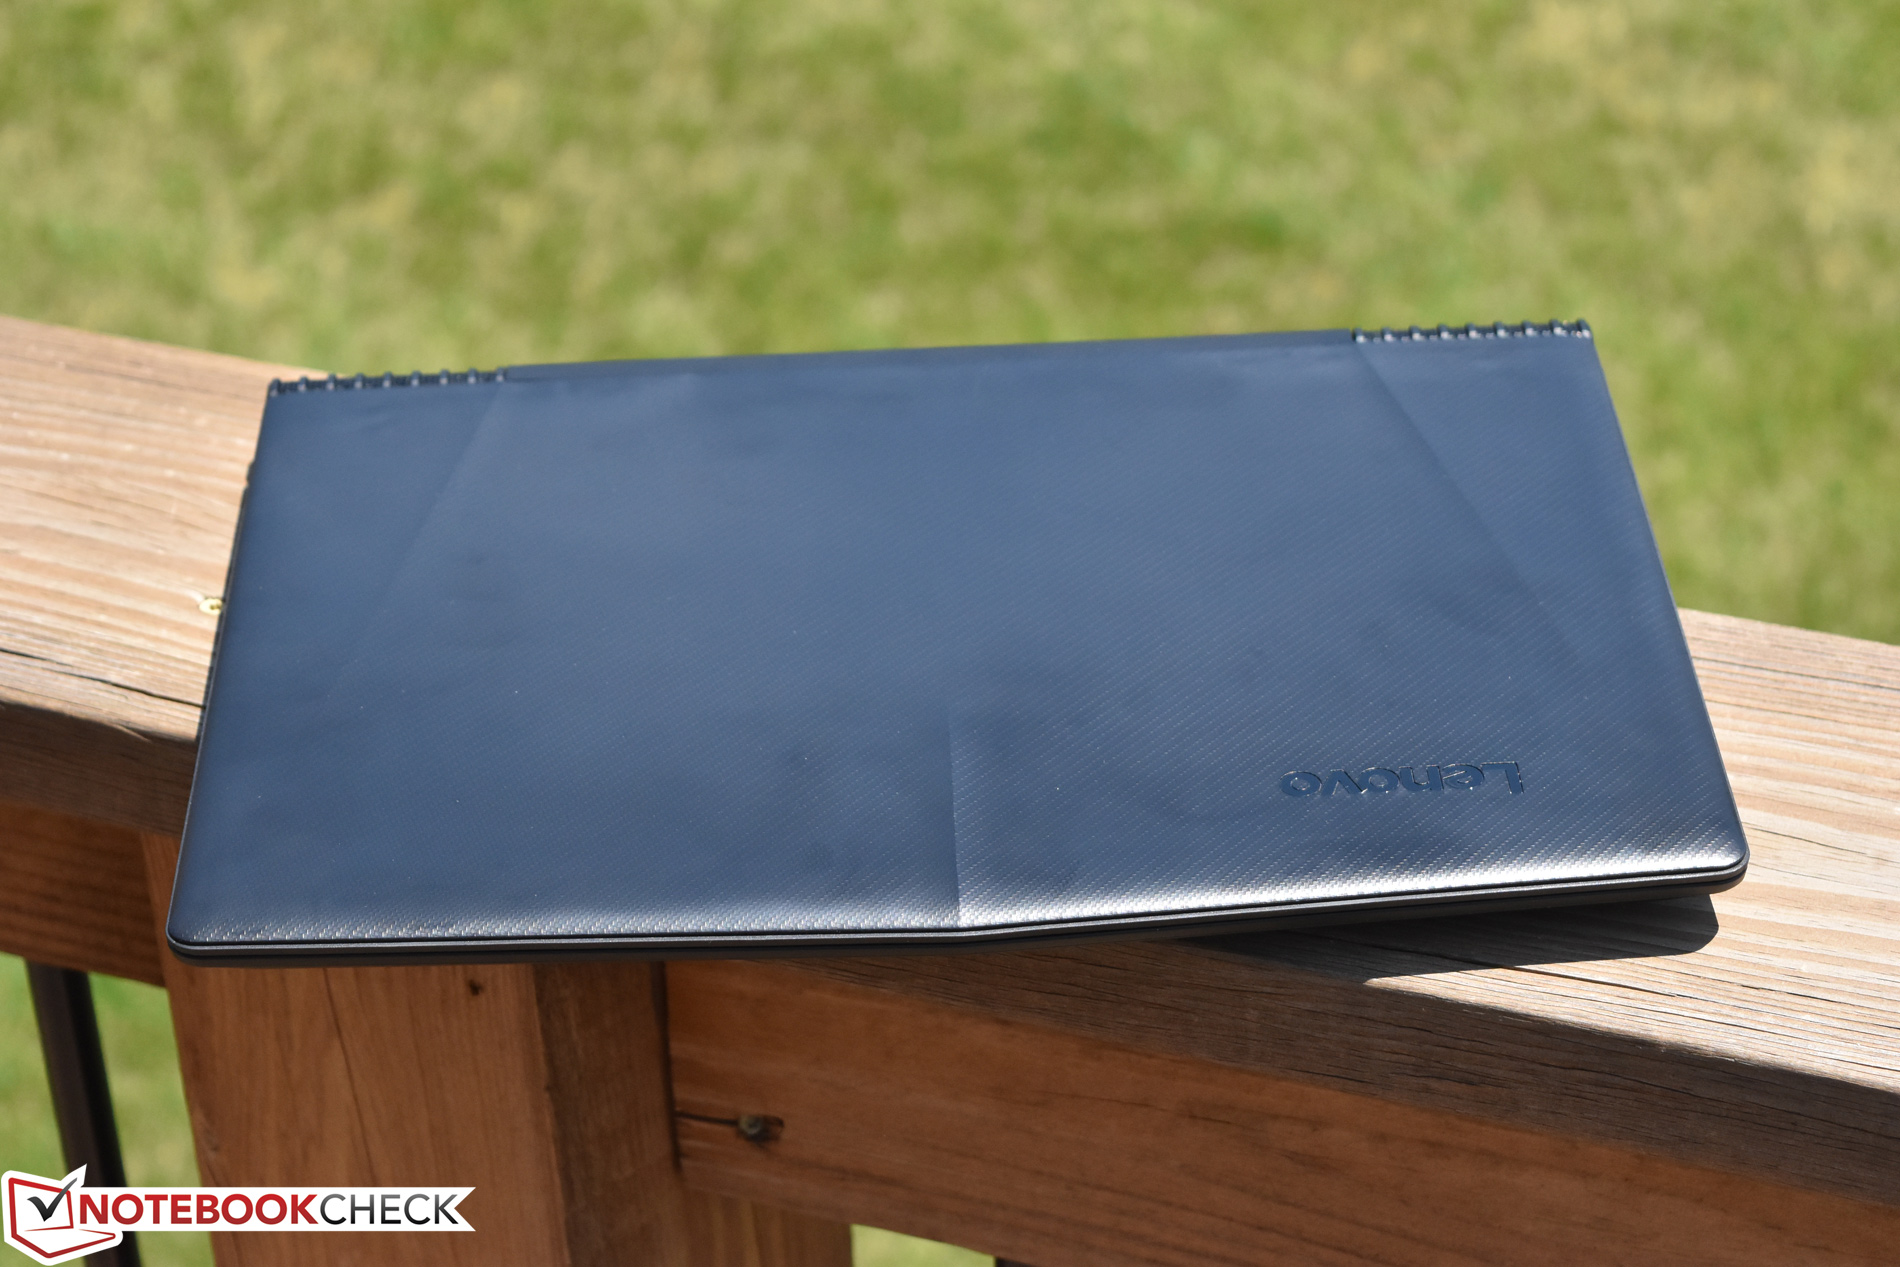
Partially thanks to its plastic construction, the Y520 is among the lighter of the 15.6-inch gaming notebooks in its class. We measured a total weight of just 2.524 kg. The hinges (center-mounted) also bode well for portable use; they easily handle the lightweight display, effectively suppressing vibration and bouncing during motion or typing. It’s also possible to open the display lid with one hand, thanks to nearly all the weight being concentrated in the base unit.
Connectivity
The Y520 features a fairly standard array of ports for a 15.6-inch machine—but a little thin overall for a gaming notebook. On the positive side, there are four total USB ports, two of which are USB 3.0, one which is USB 3.1 Type-C Gen 1, and the final of which is USB 2.0. Apart from this, other items worth mentioning are the lack of video output apart from a single HDMI port (though USB Type-C technically can be repurposed for this), and the full-sized SD card port, which actually only accepts half of an inserted card (and thus cannot be relied upon for long-term storage expansion).


SD Card Reader
Though some machines feature considerably faster card readers, the Legion Y520’s isn’t bad. With 74.74 MB/s and 89.74 MB/s in our JPG copy test and AS SSD Read Tests, respectively, it’s near the top of the pack of direct competitors we’re comparing against in today’s review. Notebooks such as the Dell XPS 15-9560, however, manage speeds that are roughly anywhere from 60 to 180 percent faster. The card reader only accepts half of an inserted card.
| SD Card Reader | |
| average JPG Copy Test (av. of 3 runs) | |
| Dell XPS 15 9560 (i7-7700HQ, UHD) | |
| Lenovo Legion Y520-15IKBN-80WK001KUS | |
| Asus ROG Strix GL553VD-DS71 | |
| MSI GS63VR 7RF-228US | |
| Samsung Odyssey NP800G5M-X01US | |
| maximum AS SSD Seq Read Test (1GB) | |
| Dell XPS 15 9560 (i7-7700HQ, UHD) | |
| Asus ROG Strix GL553VD-DS71 | |
| Lenovo Legion Y520-15IKBN-80WK001KUS | |
| MSI GS63VR 7RF-228US | |
| Samsung Odyssey NP800G5M-X01US | |
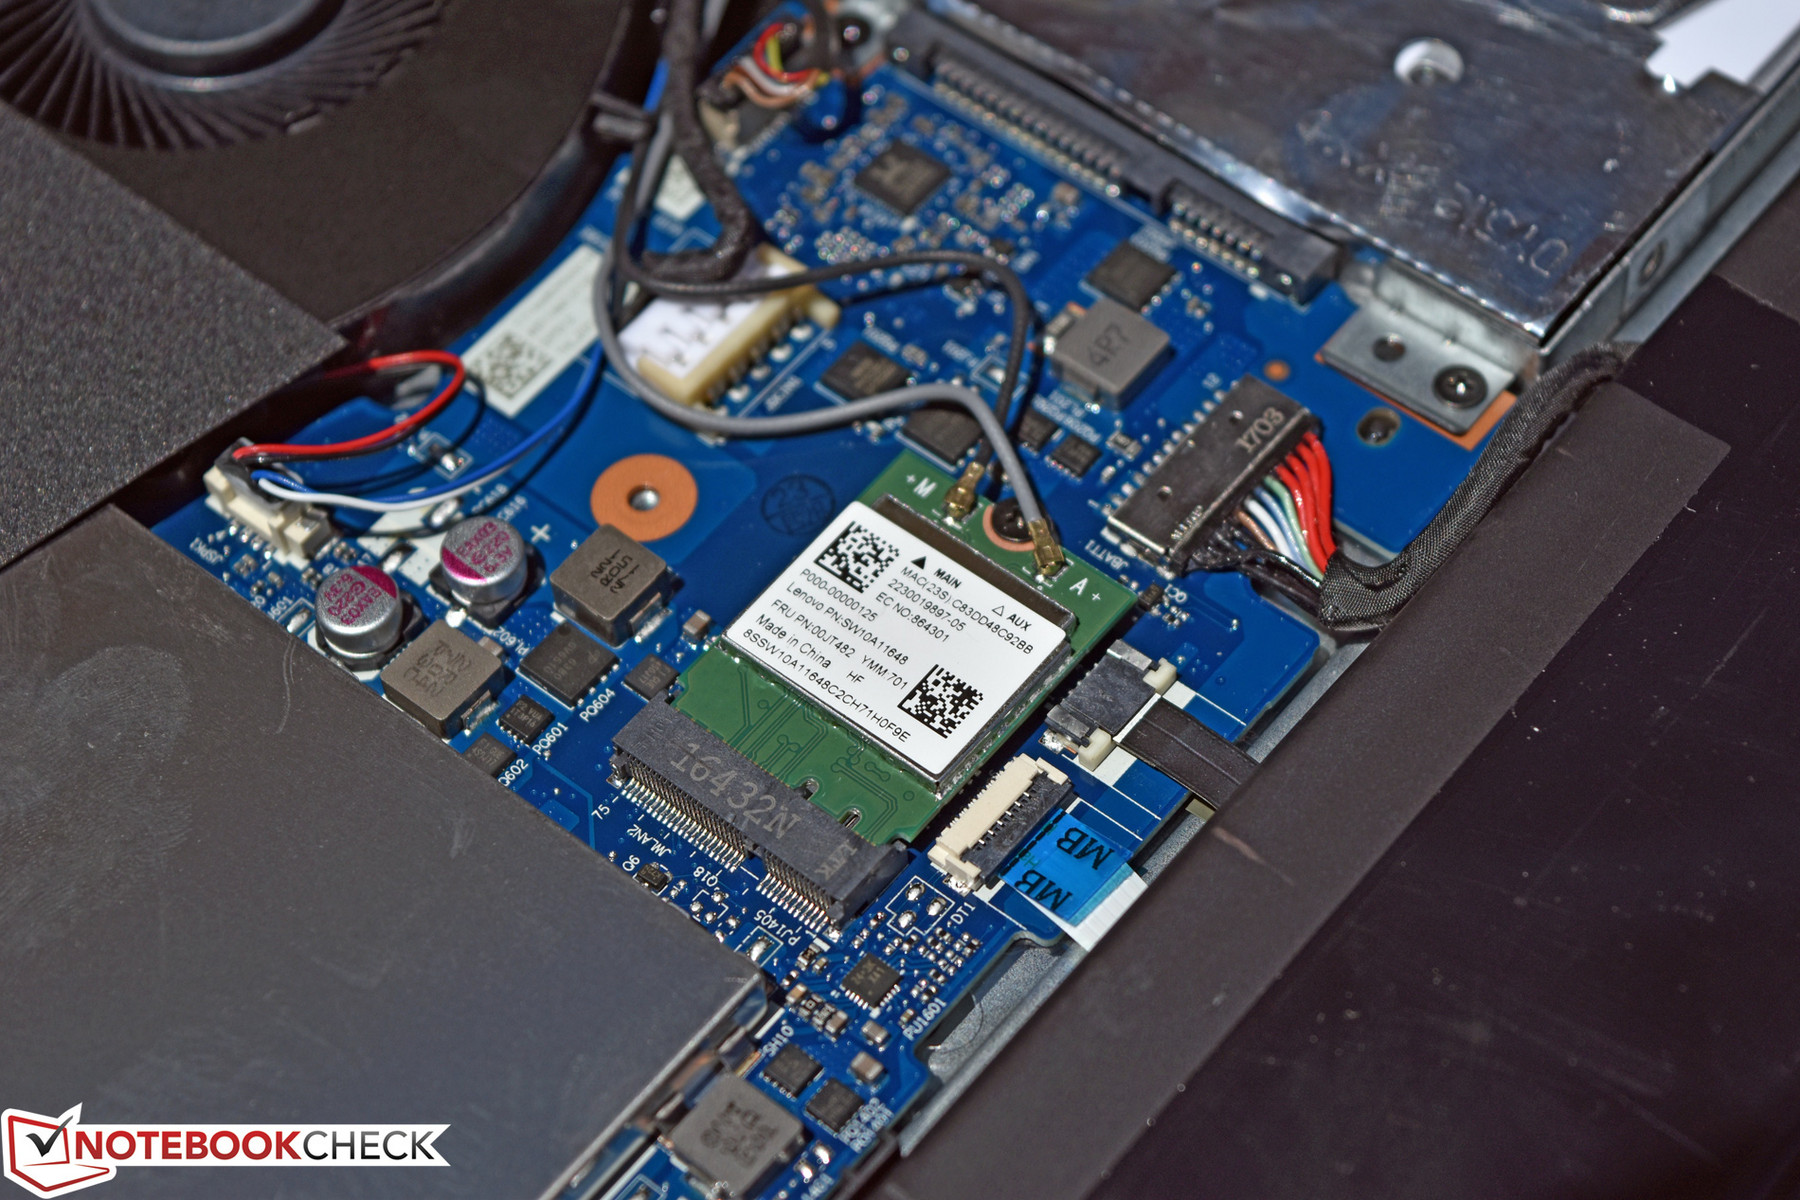
Communication
It’s probably no surprise that the Y520’s Realtek 8821AE Wireless-AC adapter can’t match the Intel Dual Band Wireless-AC 8265 of the Y720 or the Killer Wireless options in the Alienware/MSI devices, but even still, the 307 MB/s and 282 MB/s receive/transmit results we received are a bit underwhelming. It’s certainly fast enough for most purposes, but for heavier-duty transfers, it would probably be wise to opt for an Ethernet connection.
Speaking of which, the Realtek Gigabit Ethernet port features an expandable flap to accommodate its presence along the left side of the machine.
Software
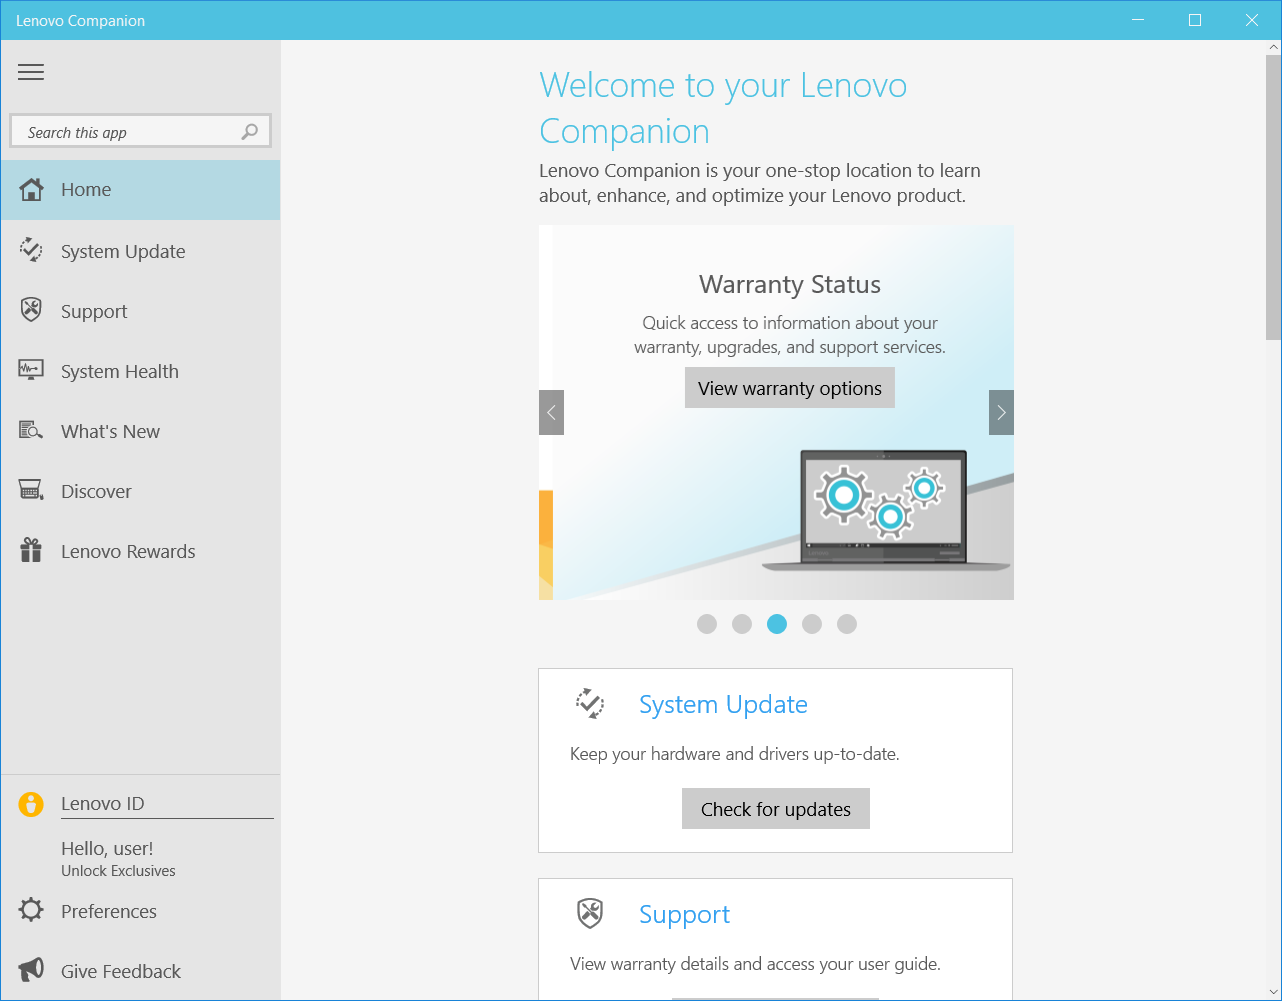
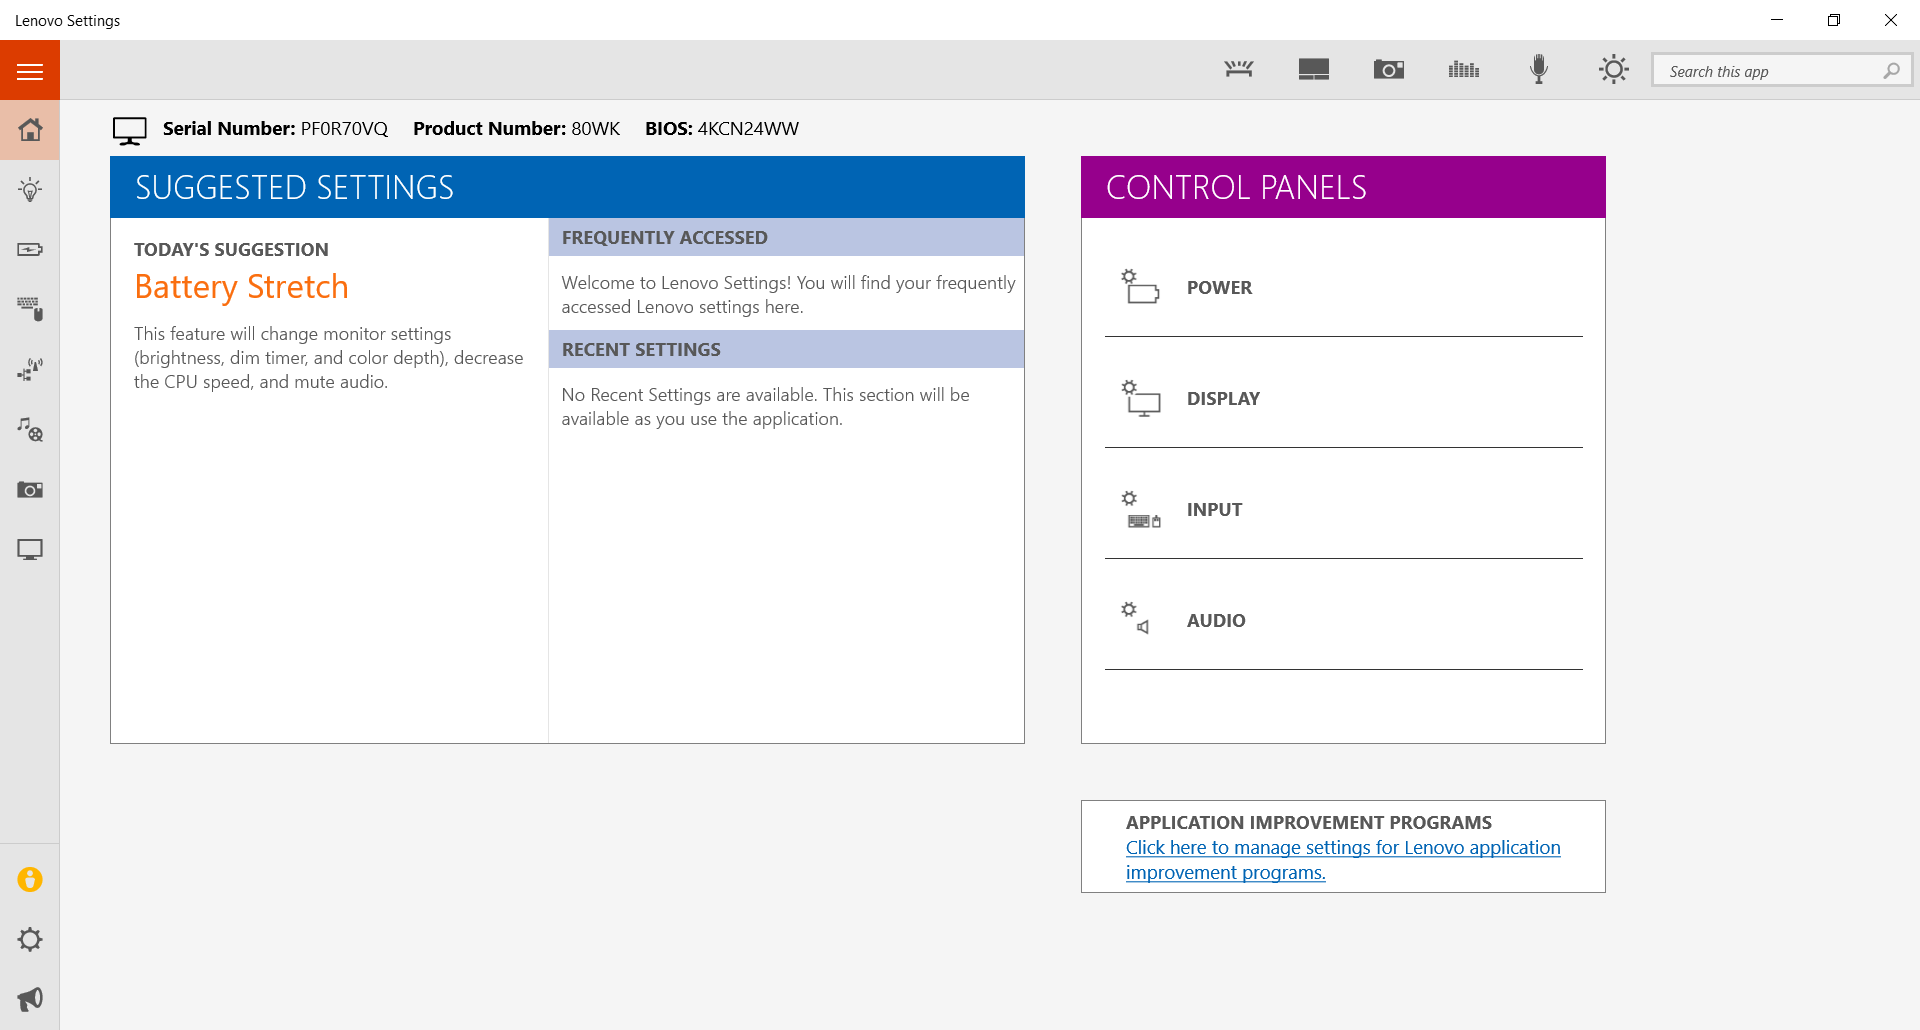
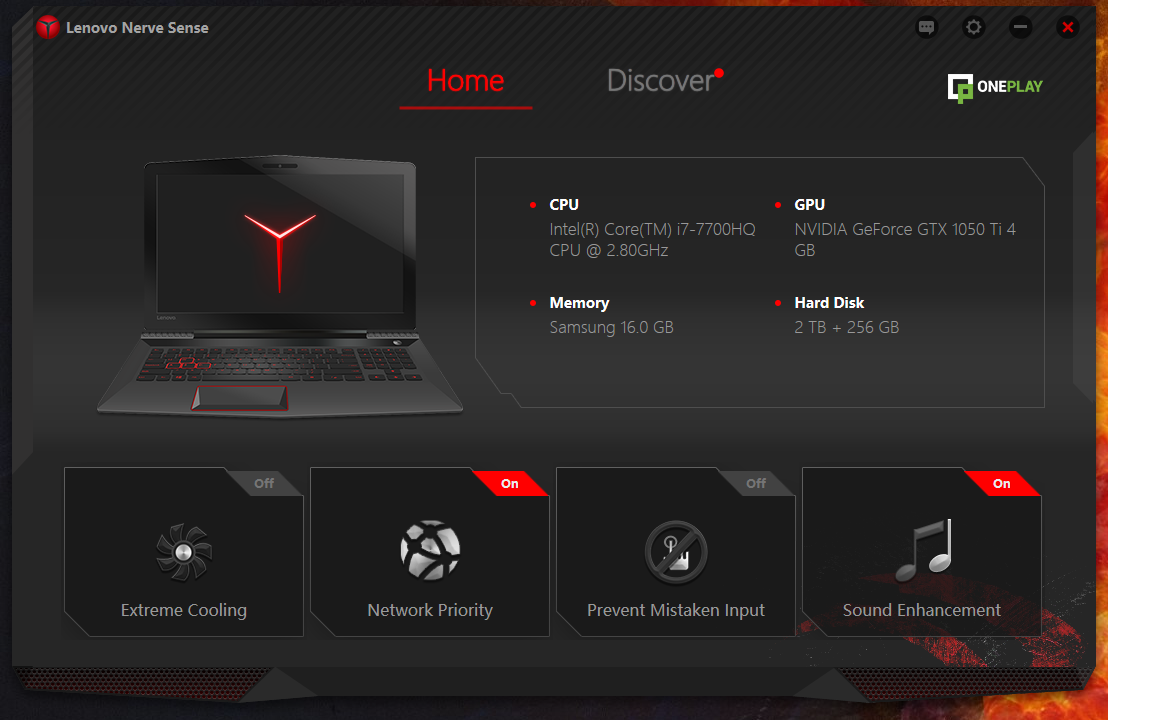
The Y520 includes a few different software packages. The first is Lenovo Companion, which can be used for system/driver updates, support, and diagnostics. Lenovo Settings is a central hub drawing together various options for battery management, input devices, audio, webcam, and display. Finally, Lenovo Nerve Sense features on/off toggles and some supplemental options for Extreme Cooling, network prioritization of gaming apps, palm/Windows Key rejection during gaming, and automatic Dolby sound enhancement with detected games.
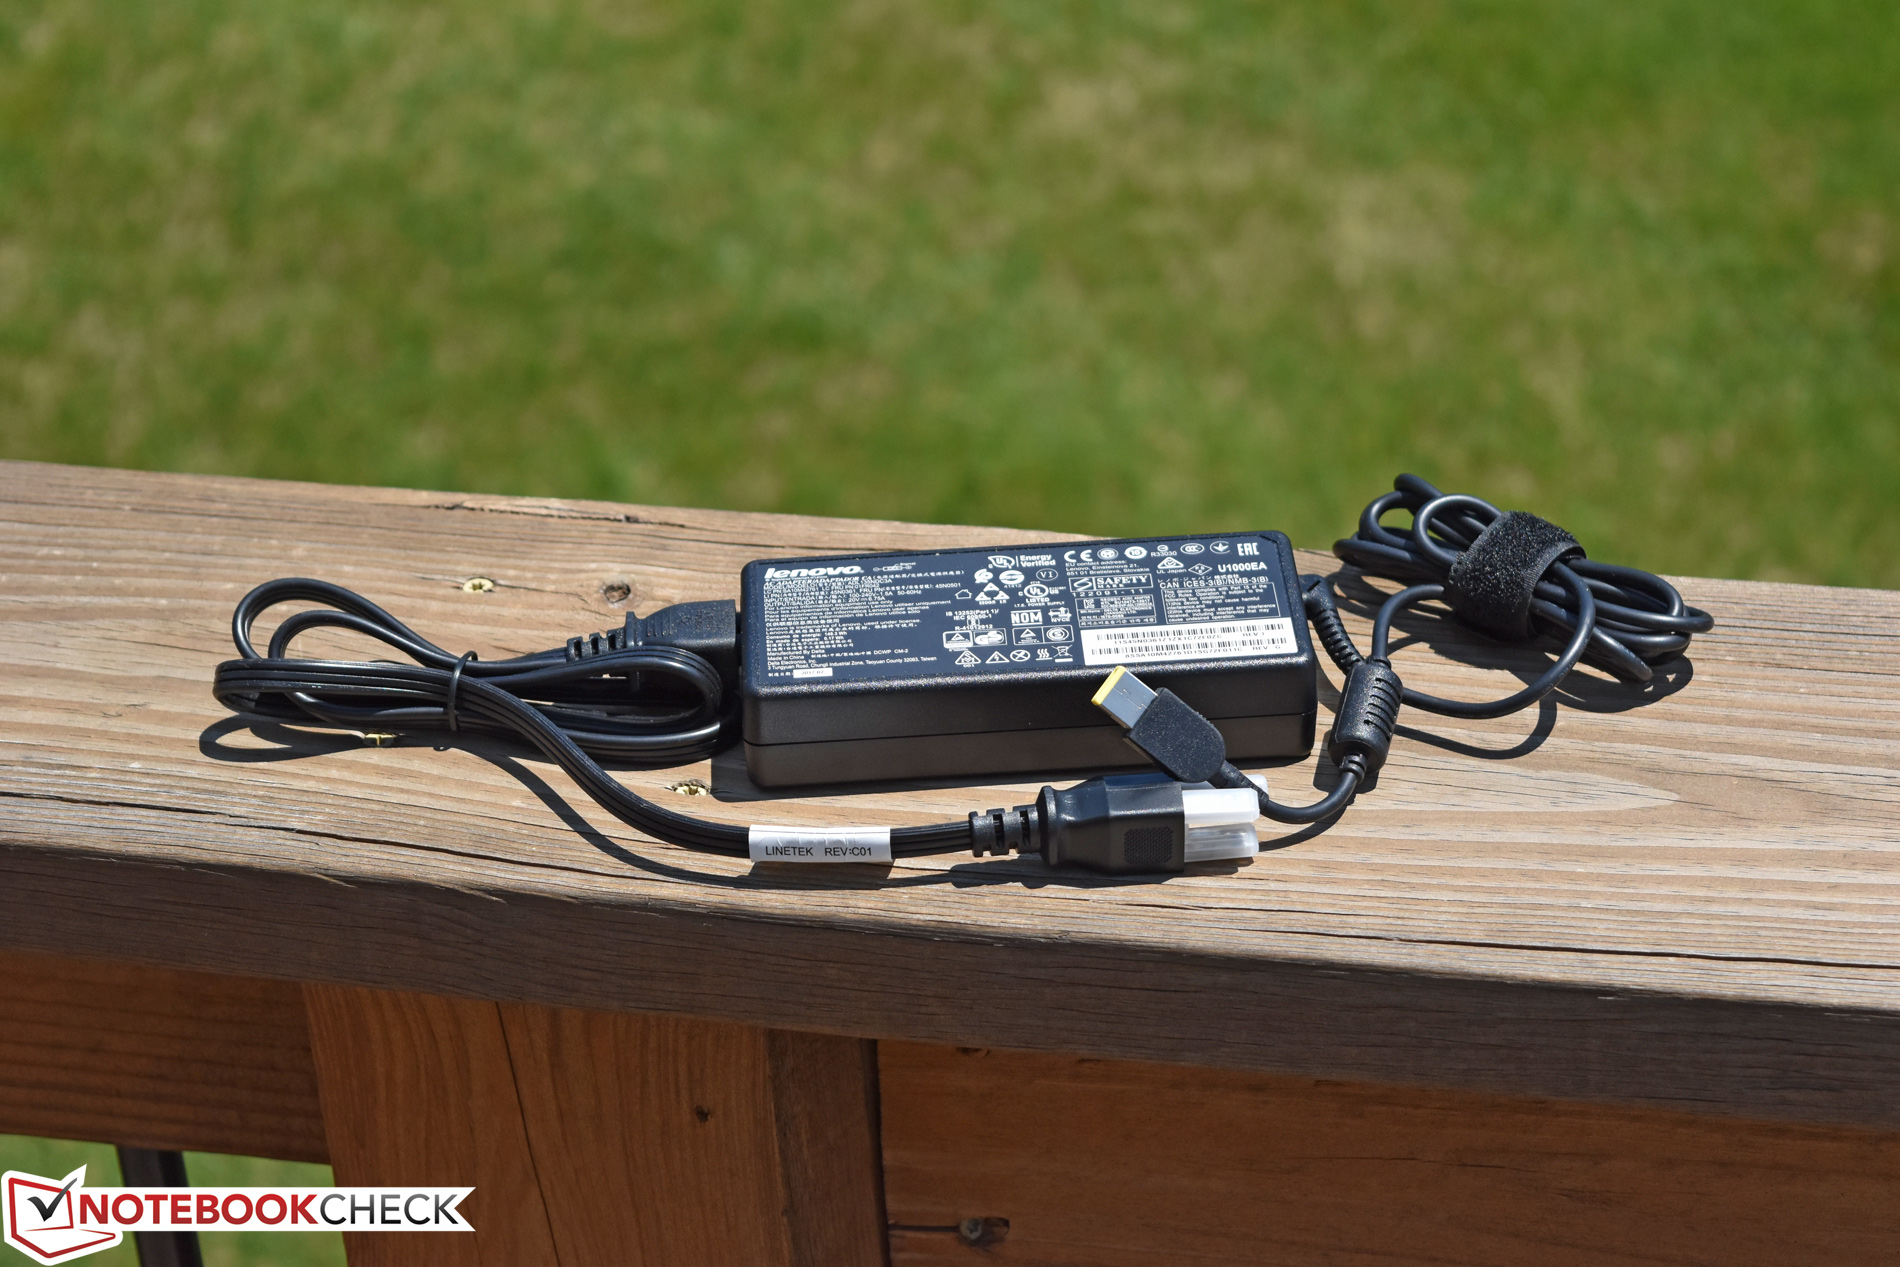
Accessories
The Legion Y520 includes no other accessories apart from a mid-sized (540 g) 135 W AC Adapter.
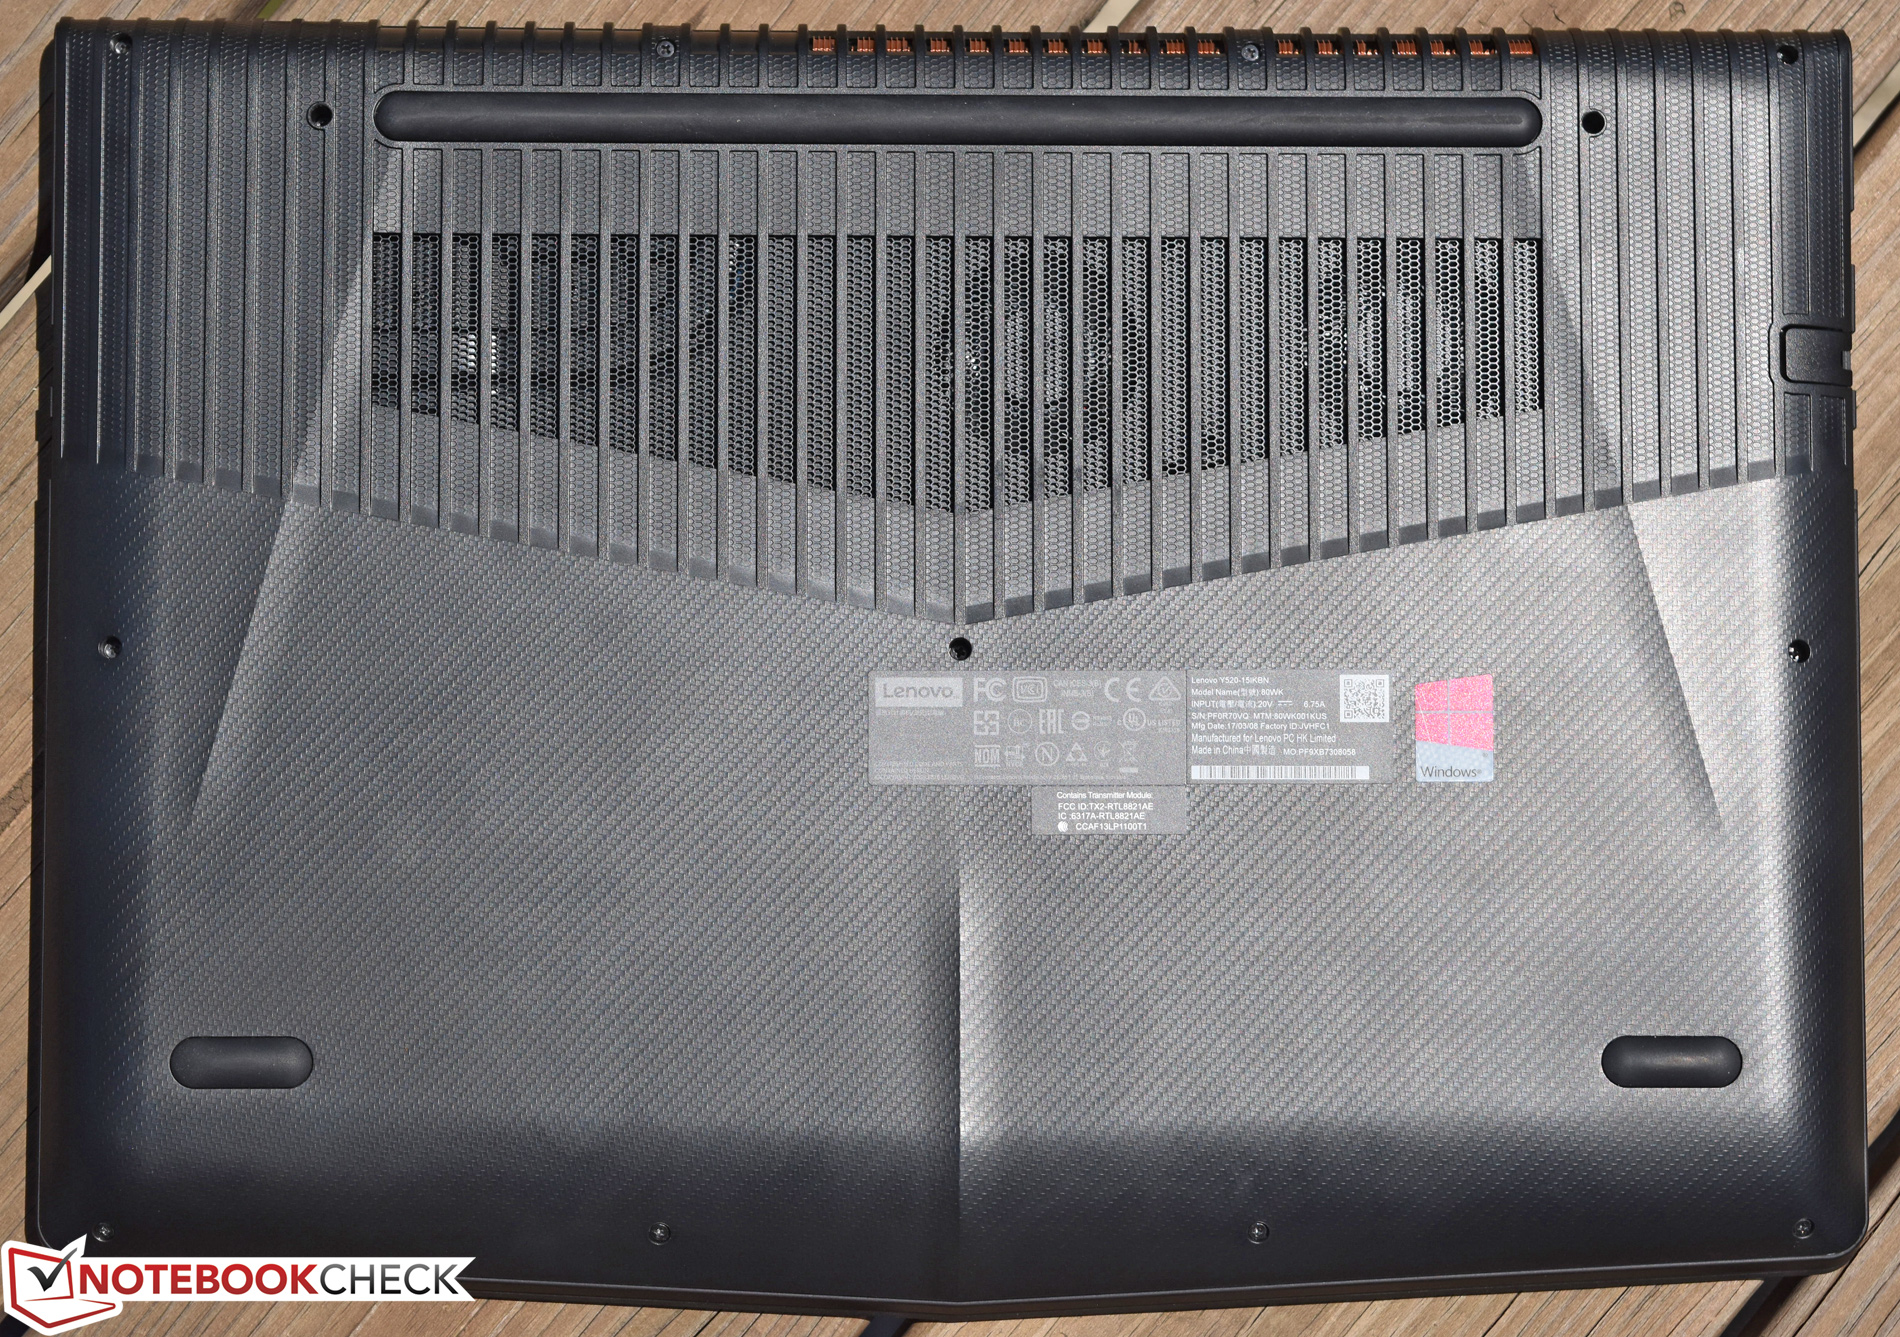
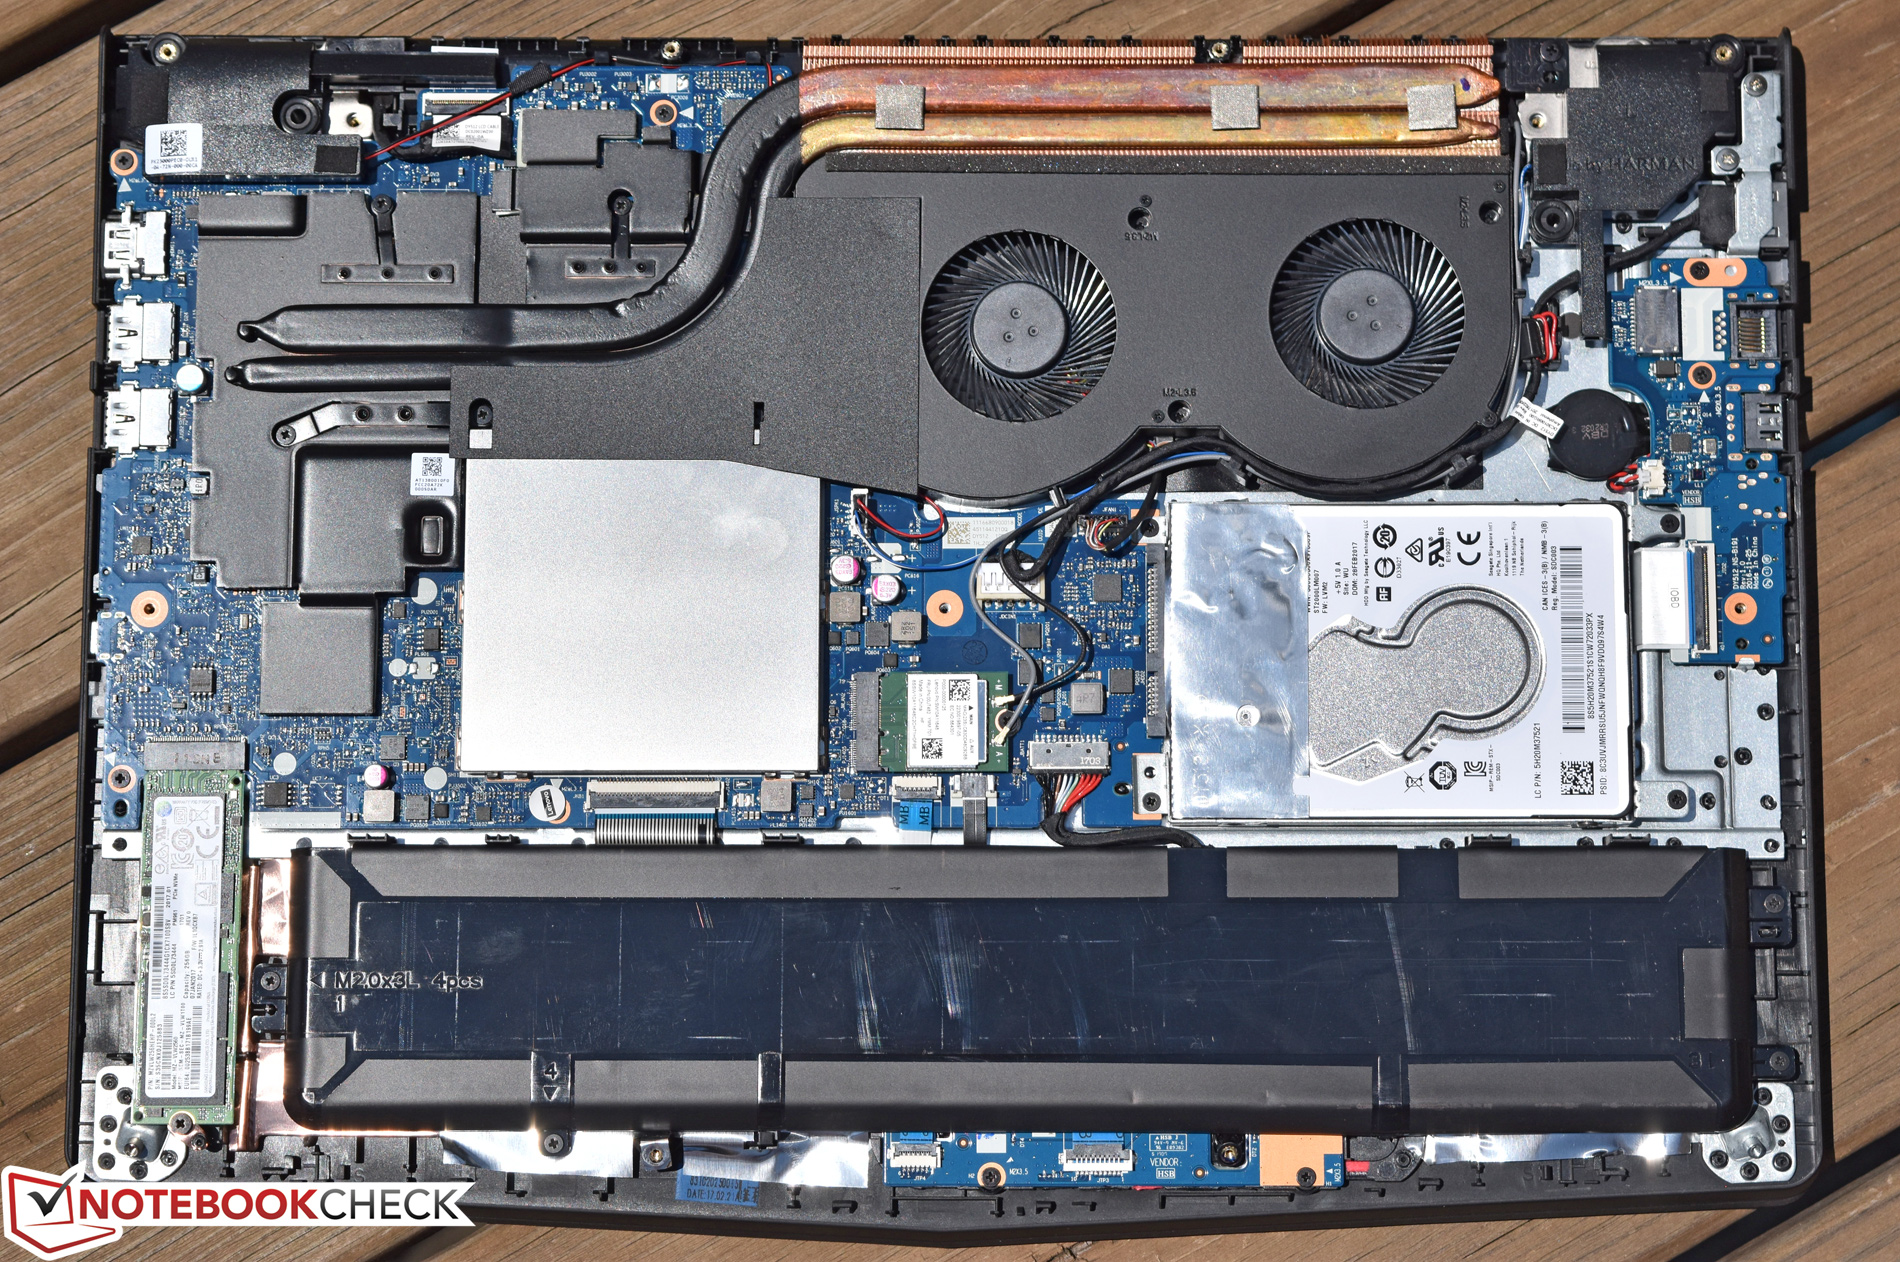
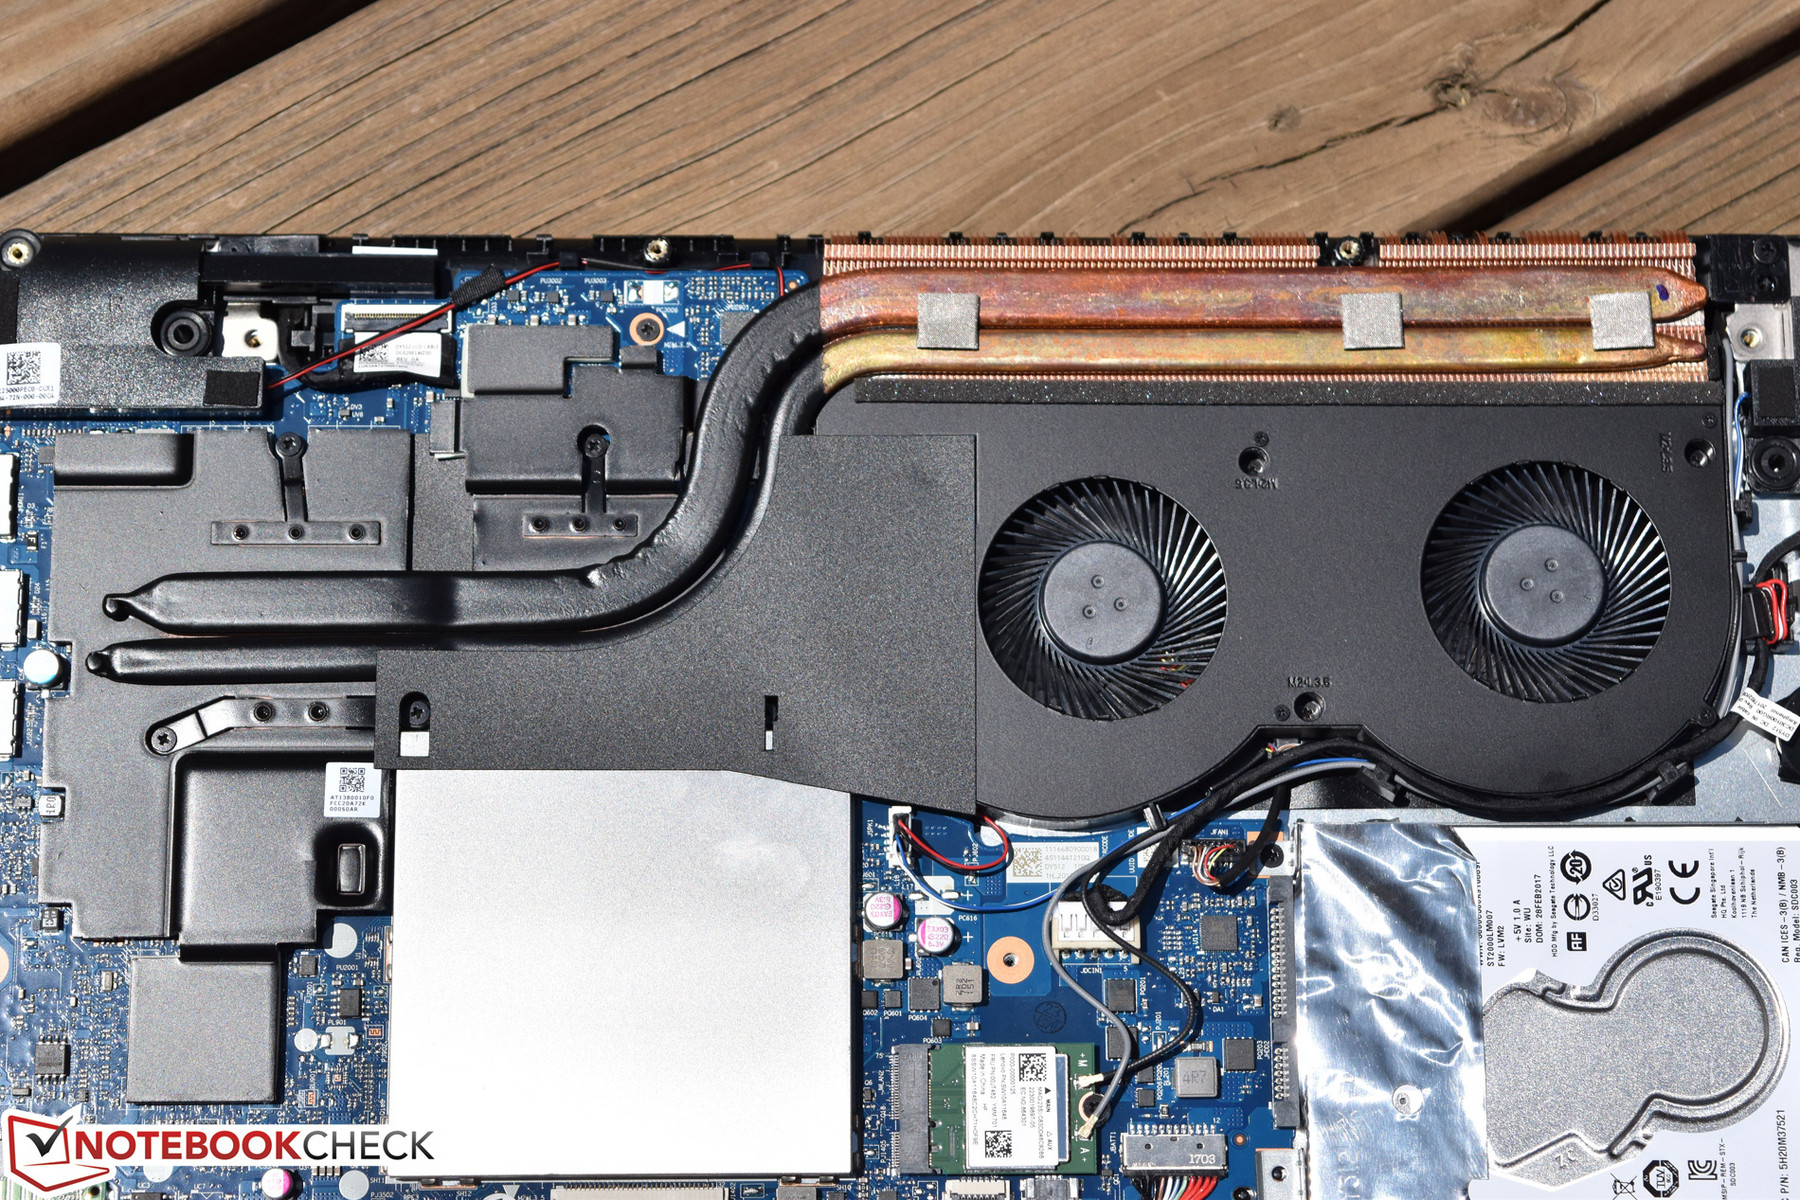
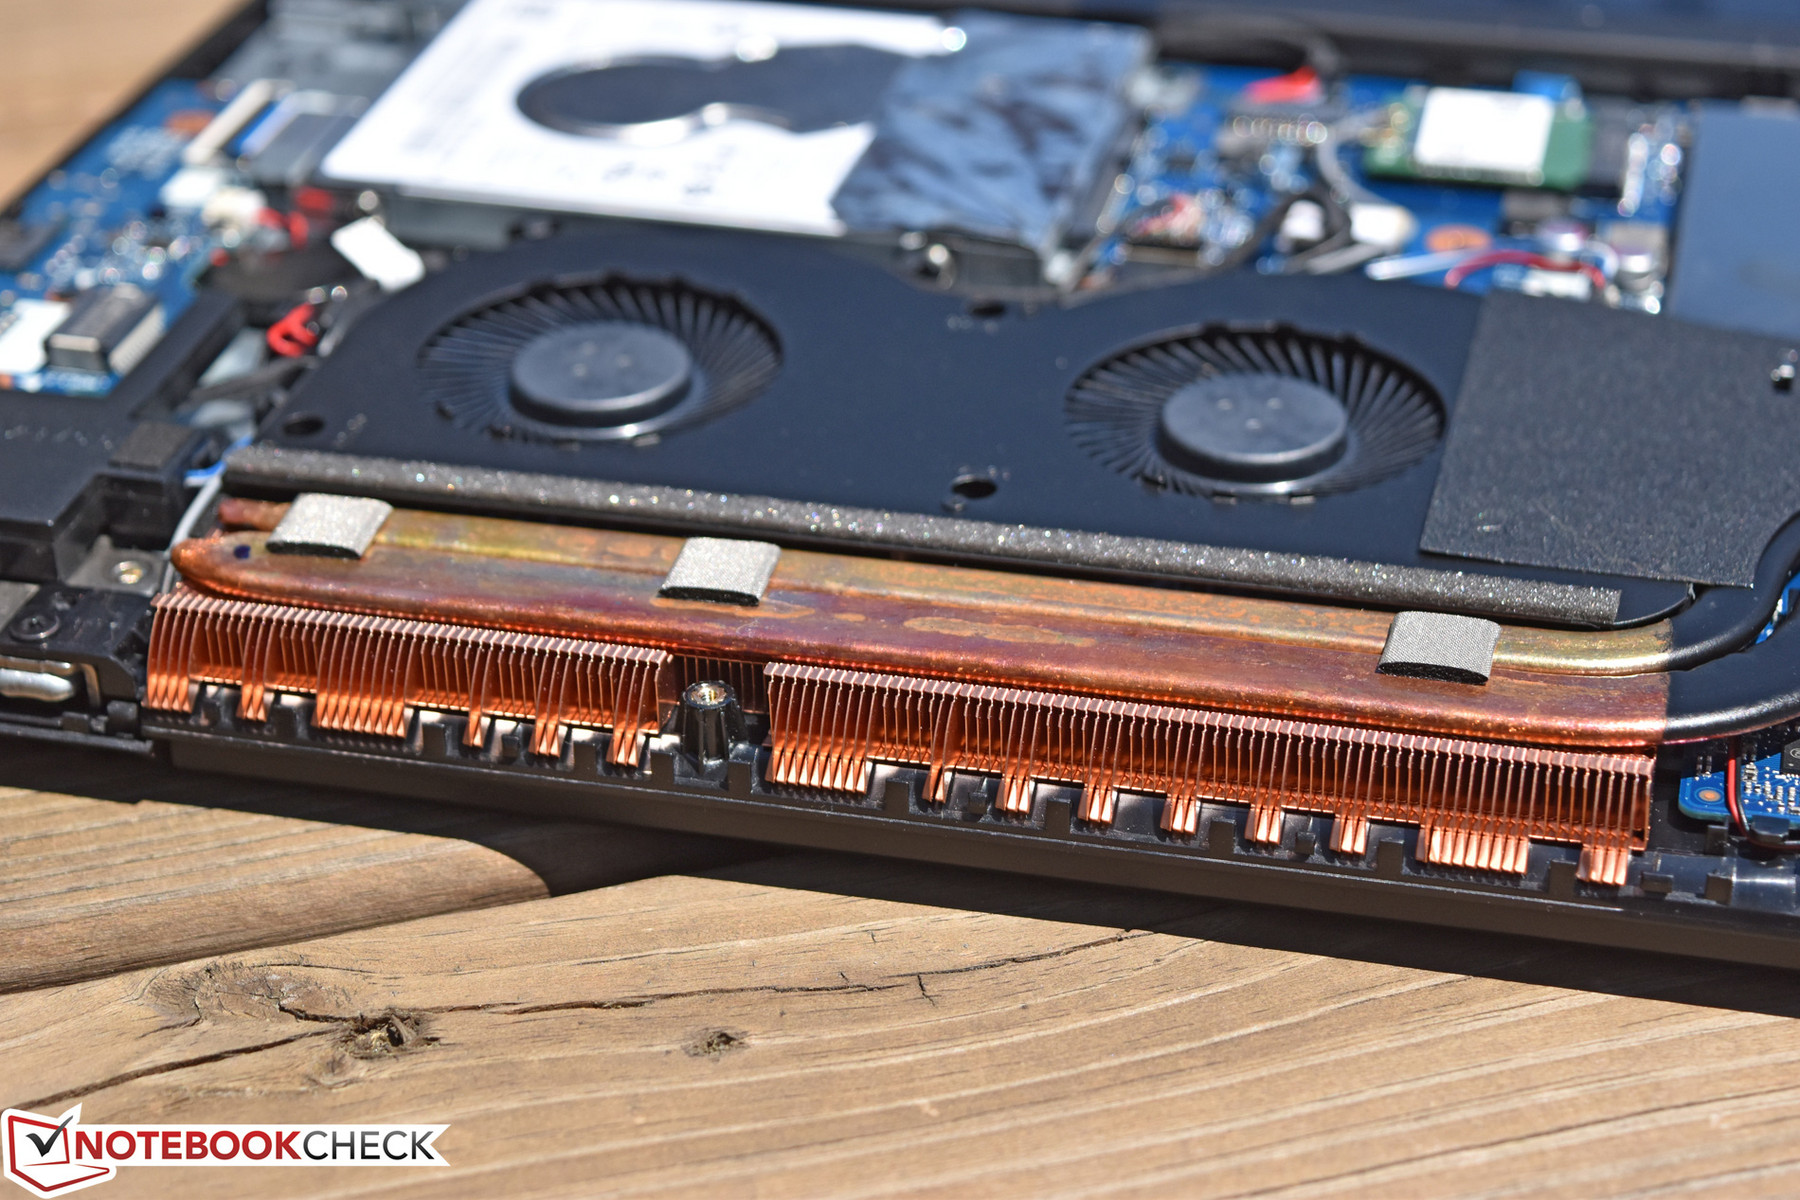
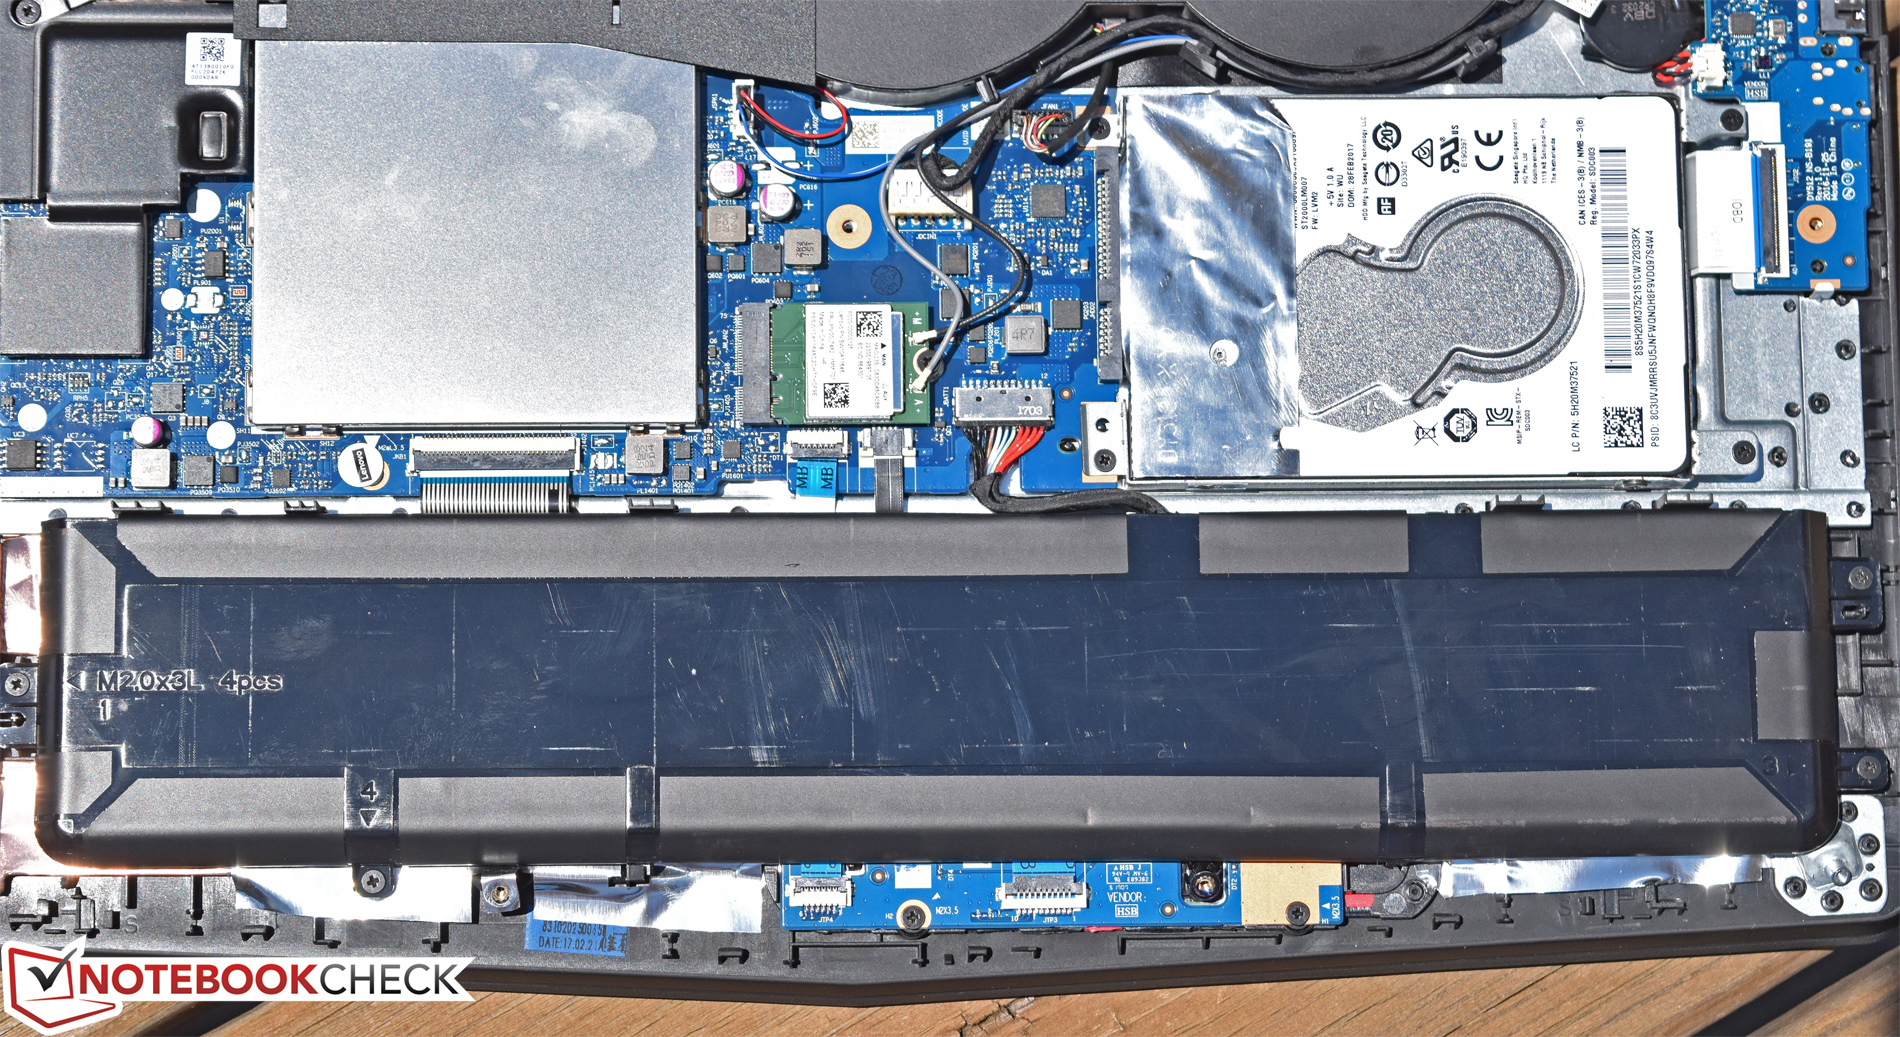
Maintenance

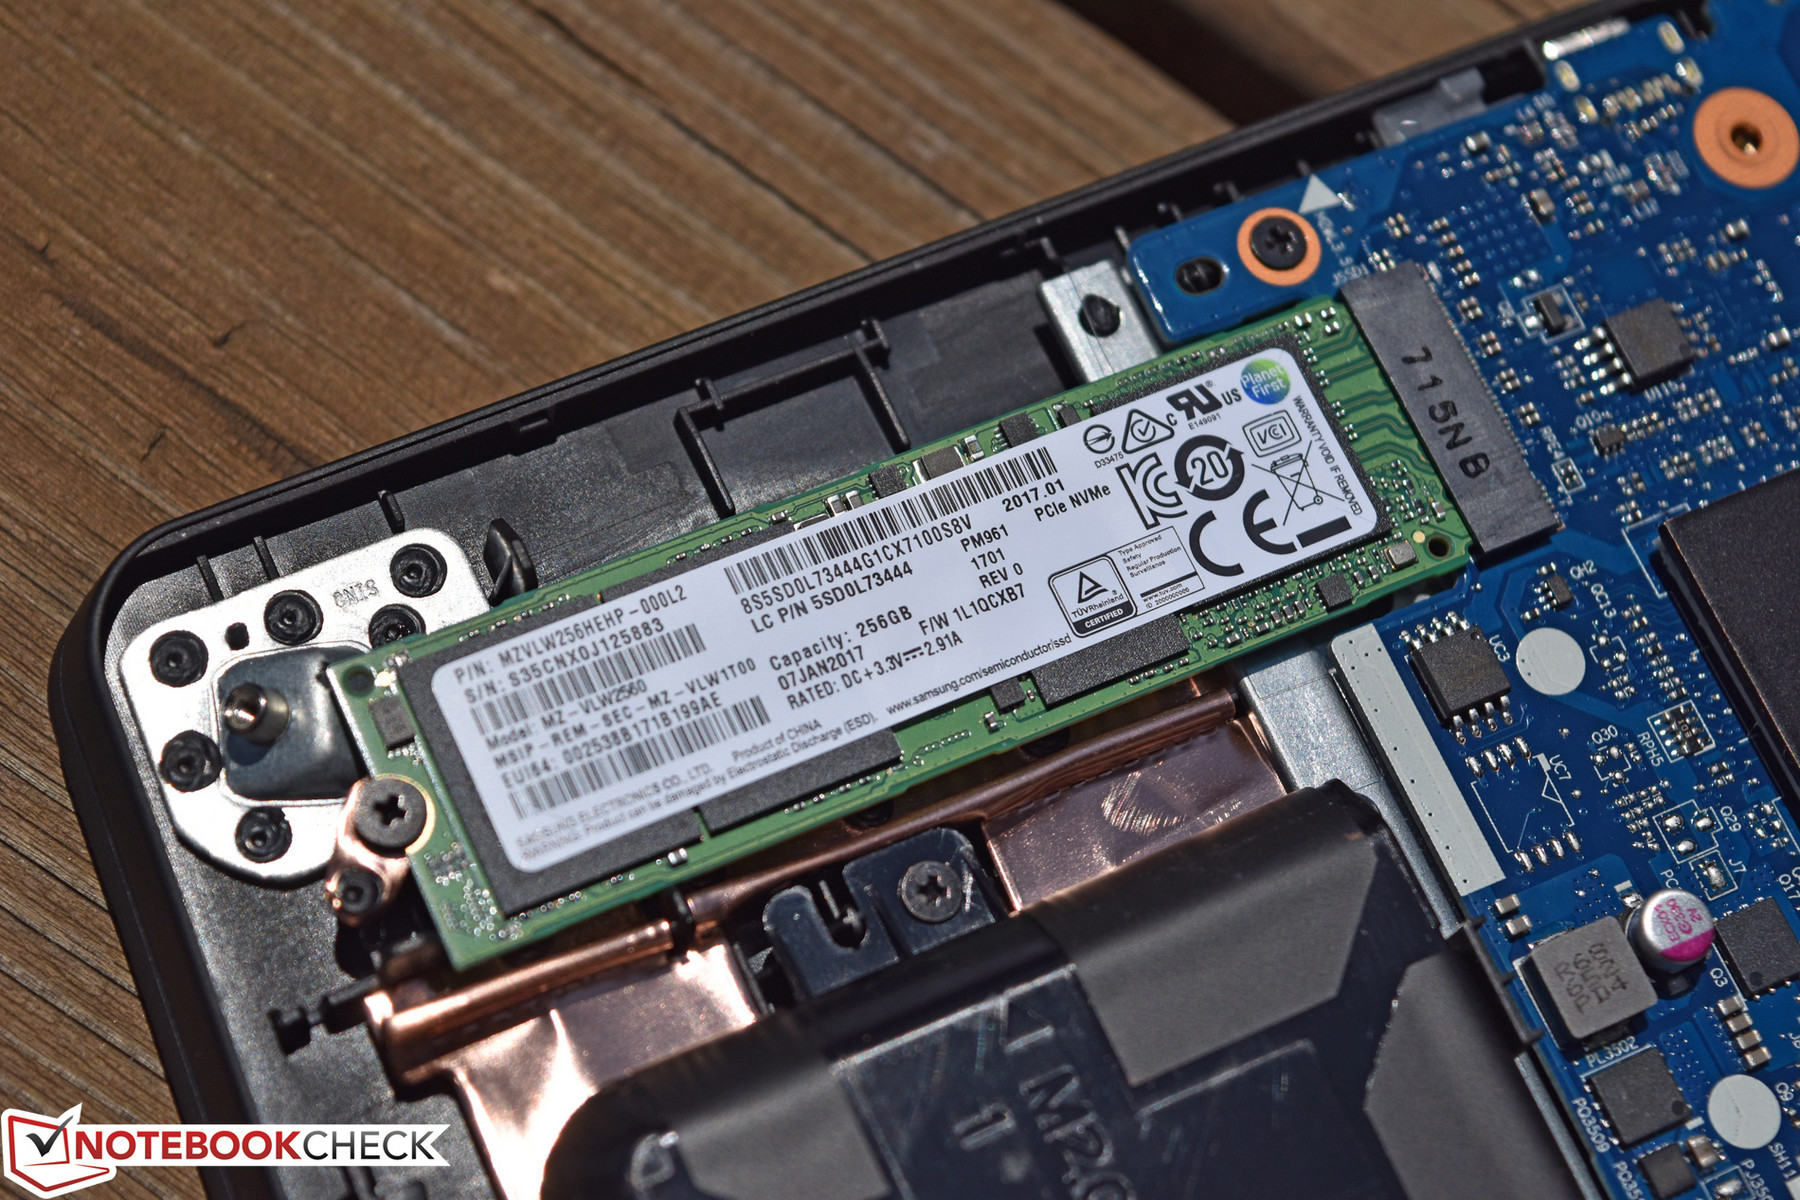
13 Phillips-head screws and a somewhat tightly-affixed bottom panel come between the user and the Legion Y520’s replaceable/upgradeable FRUs. Those include both storage devices (2.5-inch hard drive and M.2 NVMe SSD), both RAM DIMMs (covered by a metal shield), the WLAN adapter, the CMOS battery, the heatsink/fan assembly, and the internal battery. Disassembly certainly isn’t as easy as many other gaming models, but it’s not really all that difficult either.
Warranty
The Y520 comes standard with a 1-year depot (carry-in or mail-in) warranty. Please see our Guarantees, Return policies and Warranties FAQ for country-specific information.
Input Devices
Keyboard
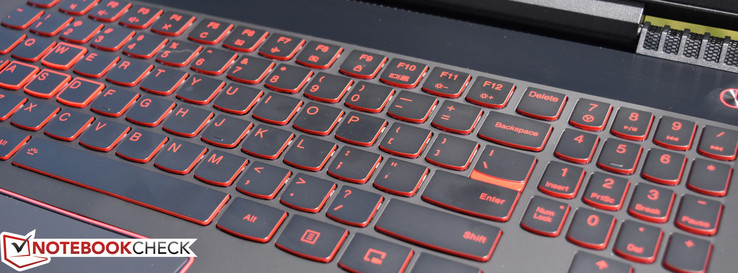
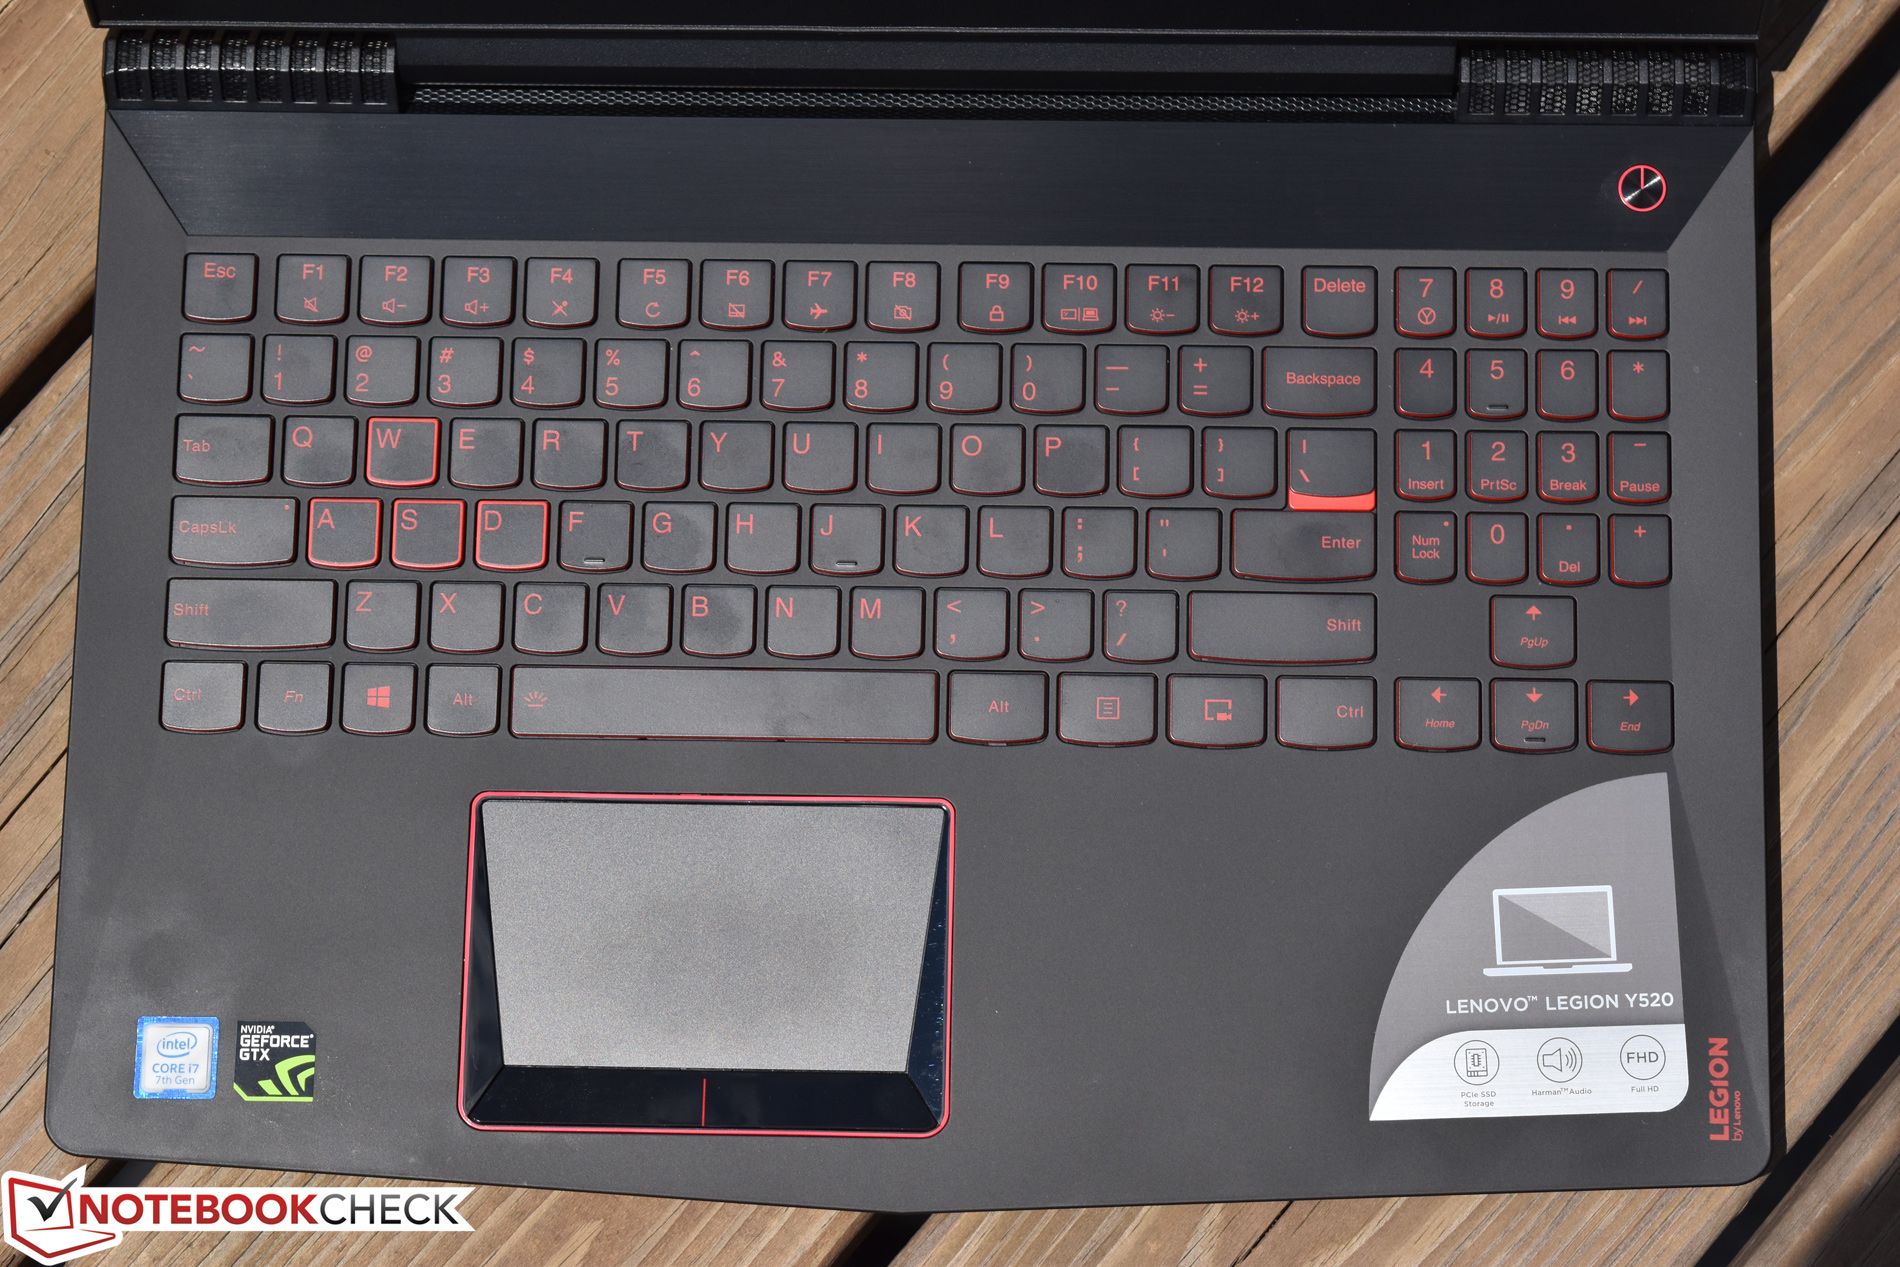
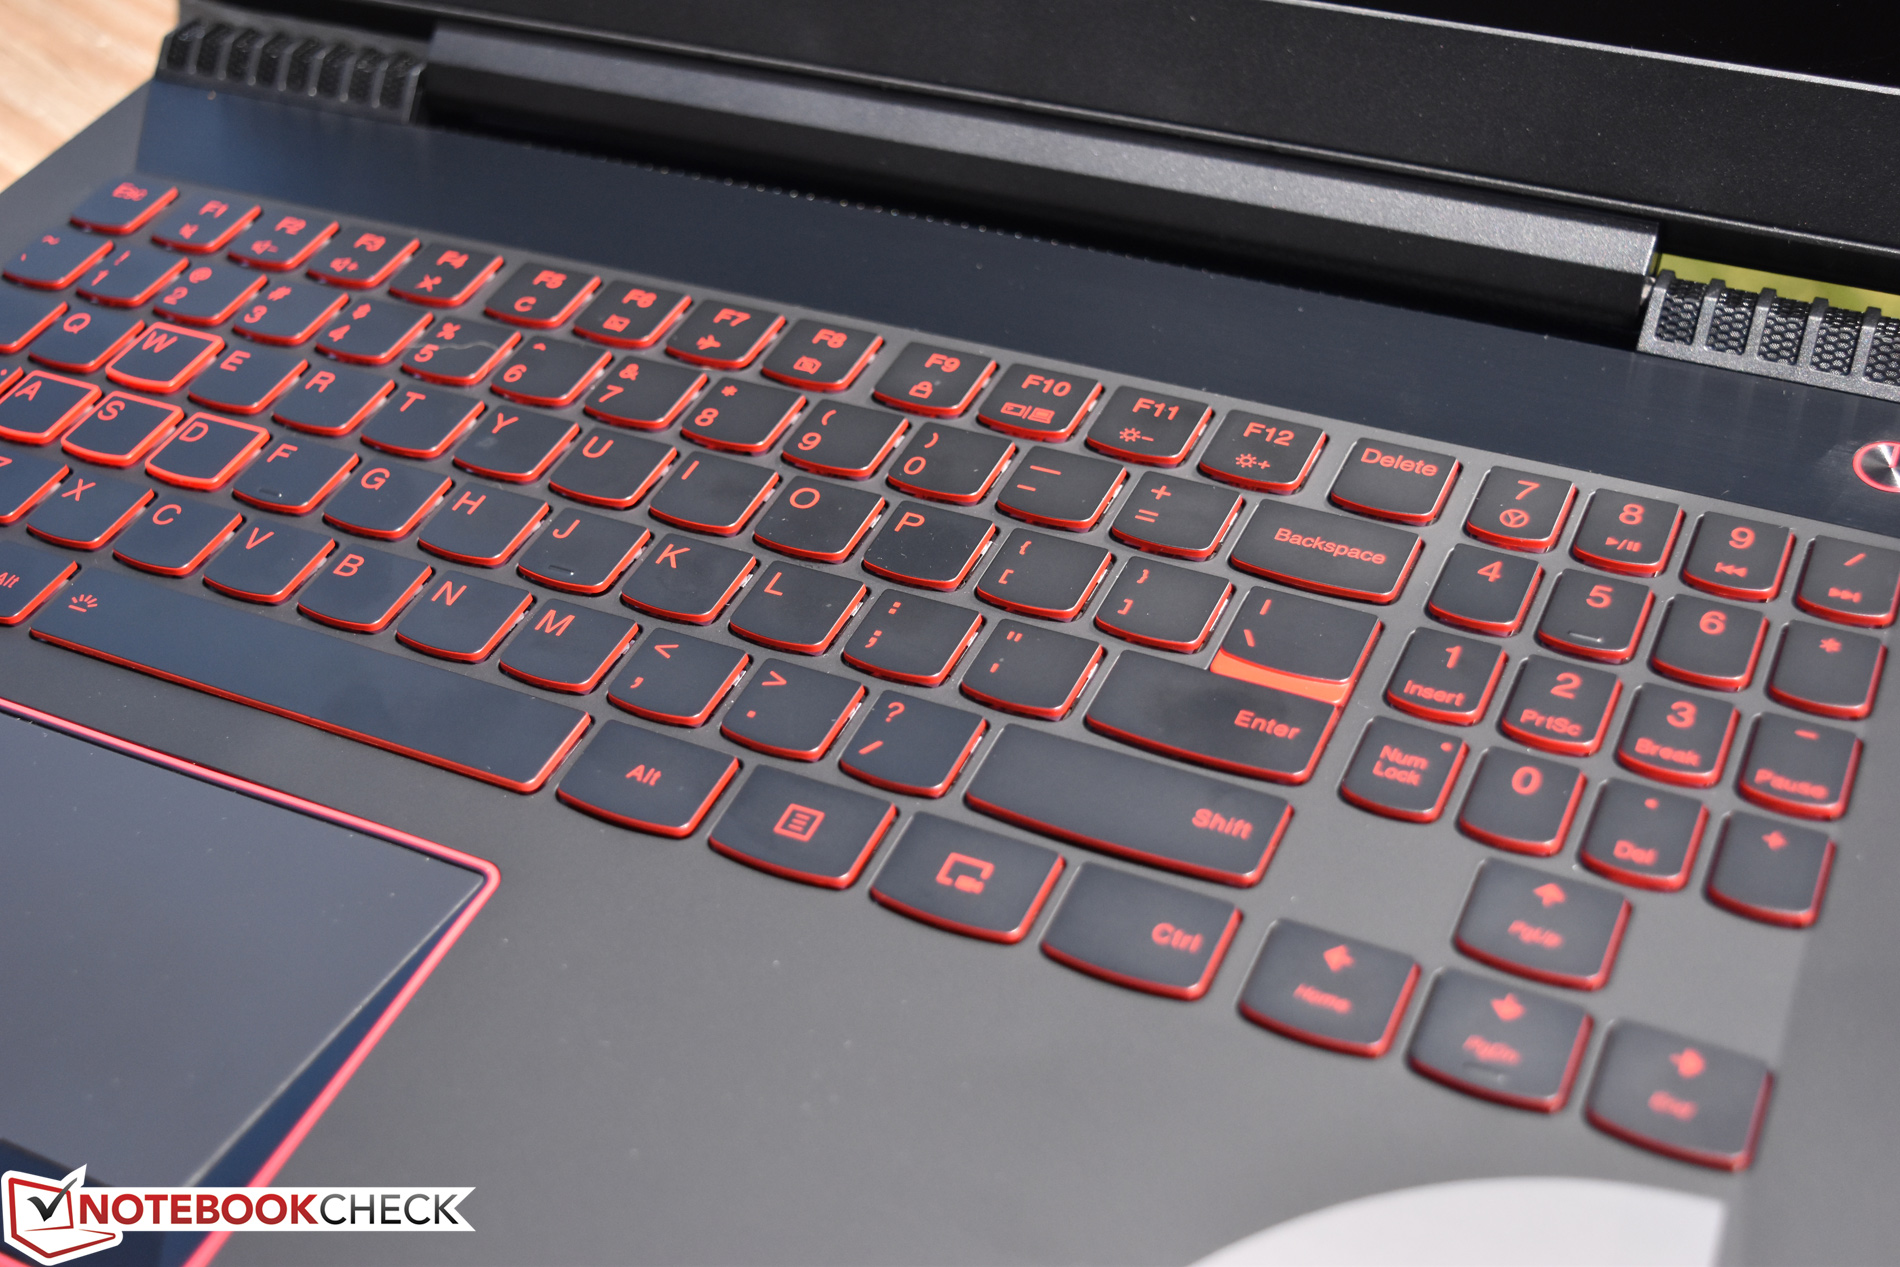
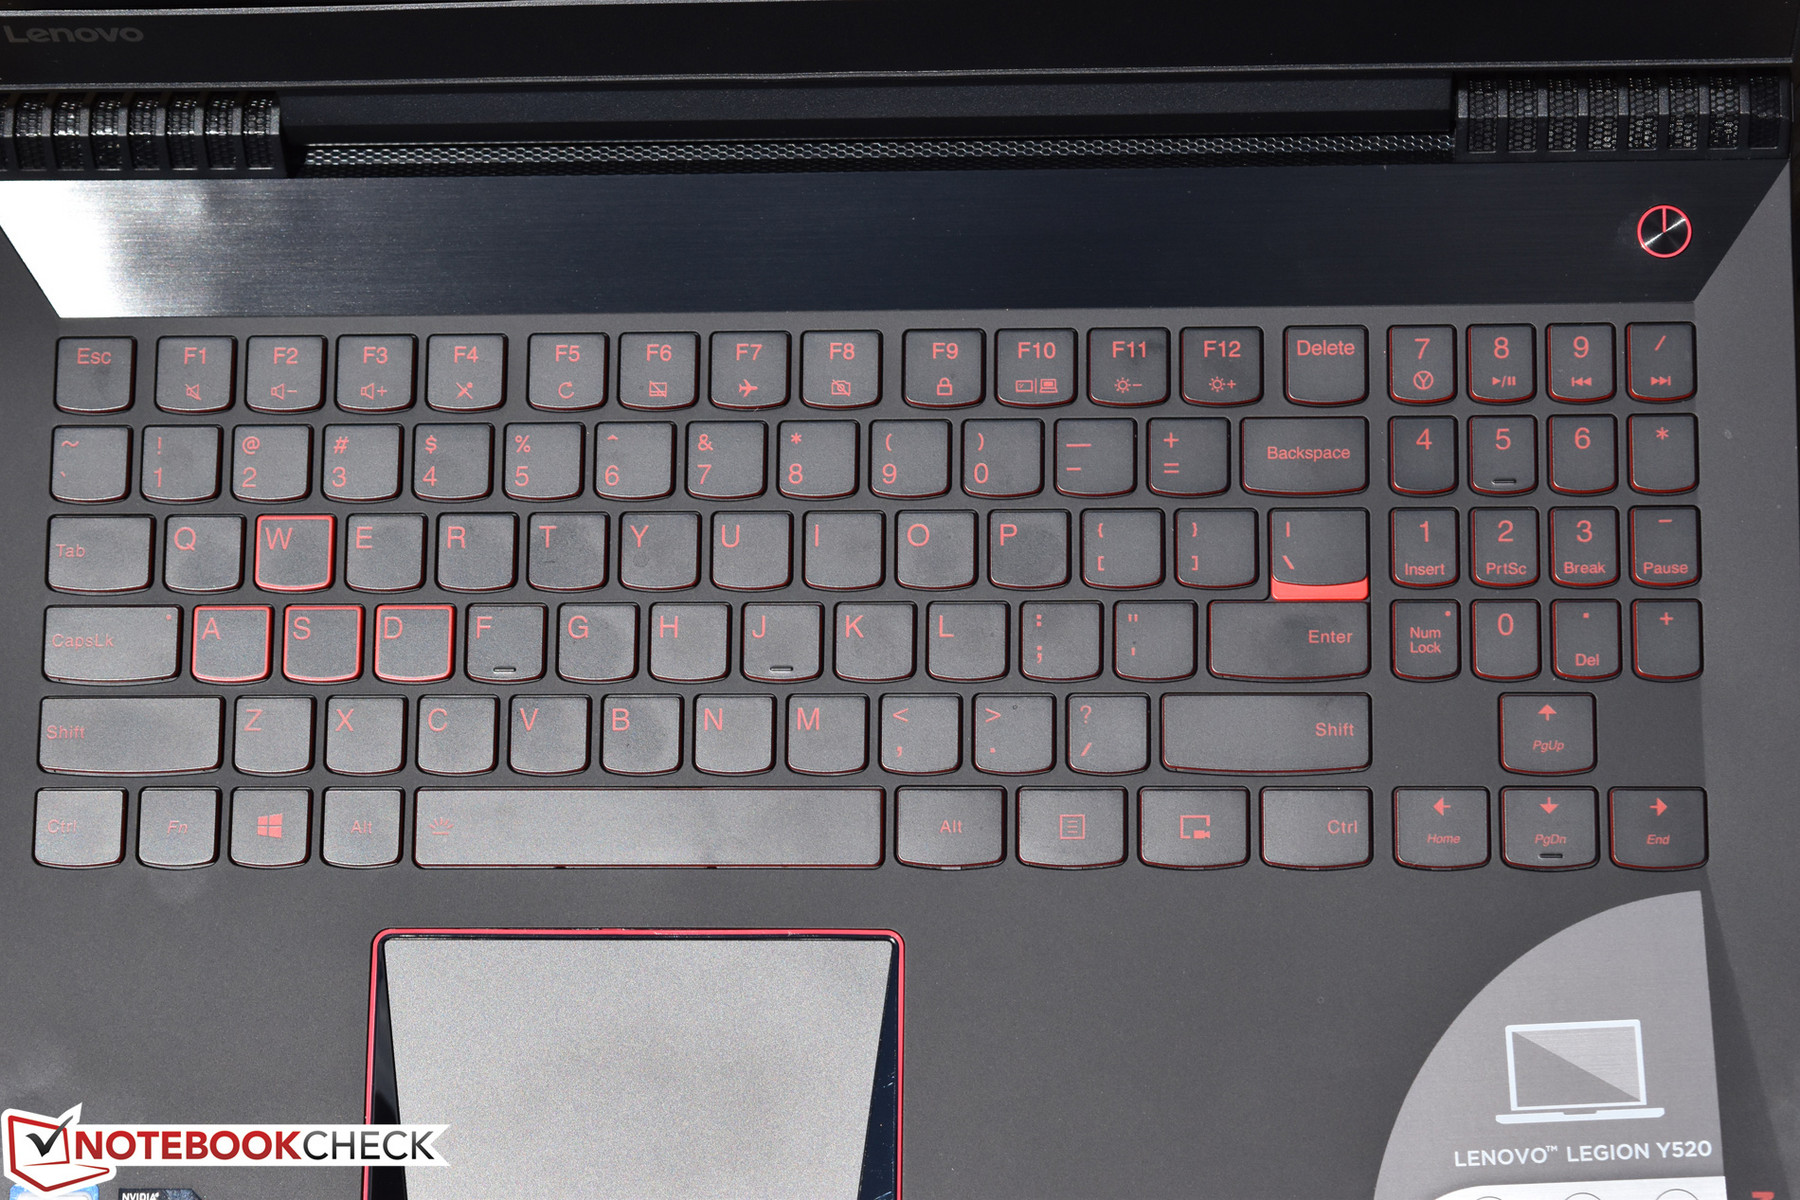
The Y520’s keyboard features well-sized and spaced keys with a comfortable smooth surface (which is unfortunately as much of a fingerprint magnet as the rest of the casing materials). The oversized arrow keys feature an extended width to better accommodate gaming usage, though the number pad on the right side is, oppositely, a bit cramped due to its reduced width. The keys overall operate with a medium stroke and a comfortable sense of feedback. They’re also relatively quiet. The only criticism is the visibility of the key labels, which are colored red against a black background—not the best contrast. Fortunately, backlighting does remediate this problem in lower-light conditions.
There is a dedicated key for video recording located directly to the left of the right CTRL key. Recorded videos can later be easily viewed from within the Lenovo Nerve Sense application (which we covered previously).
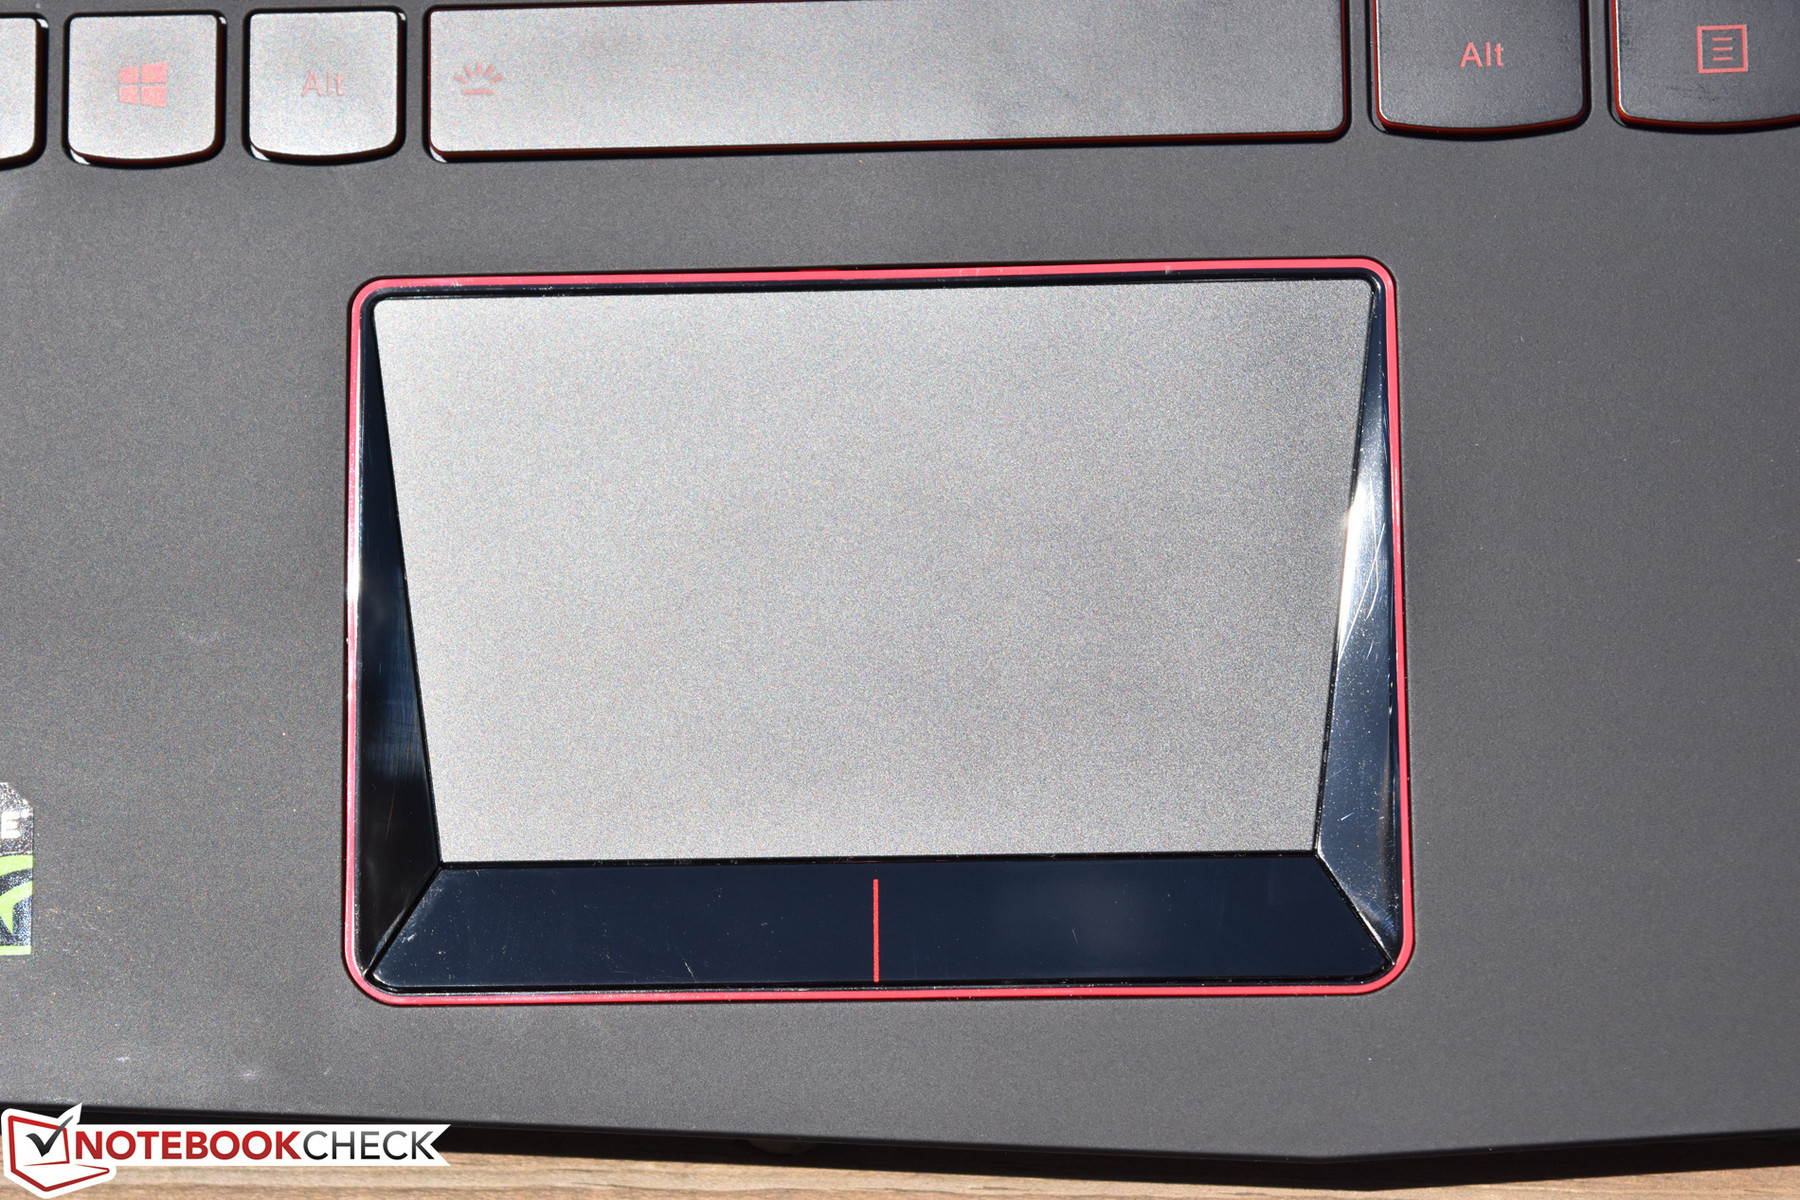
Touchpad
The Synaptics touchpad, as usual, is quite good overall. Its responsiveness and accuracy are solid, and the surface is smooth and comfortable (it’s a far cry from glass, but it’s an agreeable plastic finish). The two separate physical buttons are center-mounted, meaning that the left side of the right button (and the right side of the left button) does not depress. This can lead to some headaches during the adjustment period to the input devices, but overall, the buttons are still fairly comfortable to use.
Display
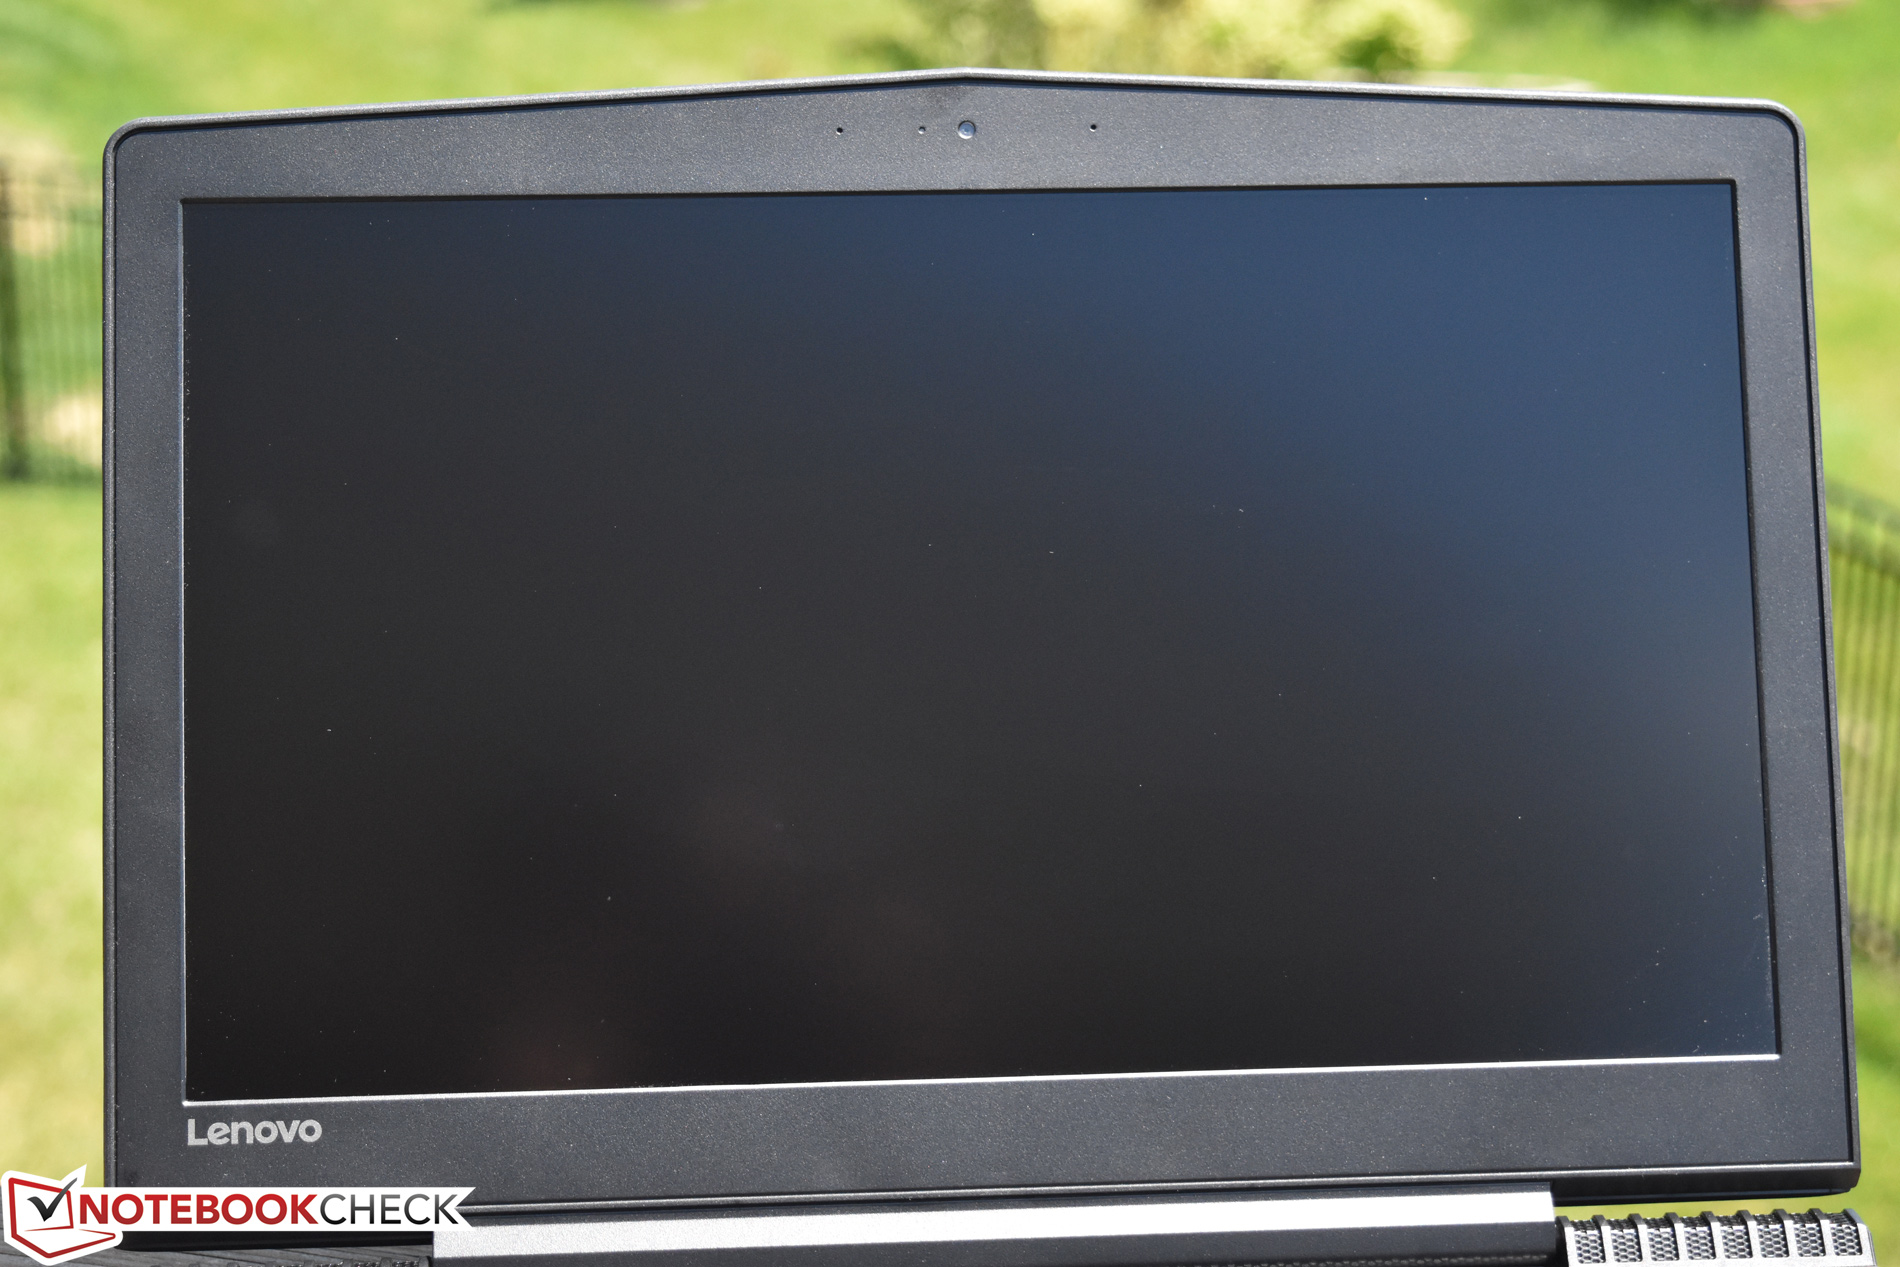
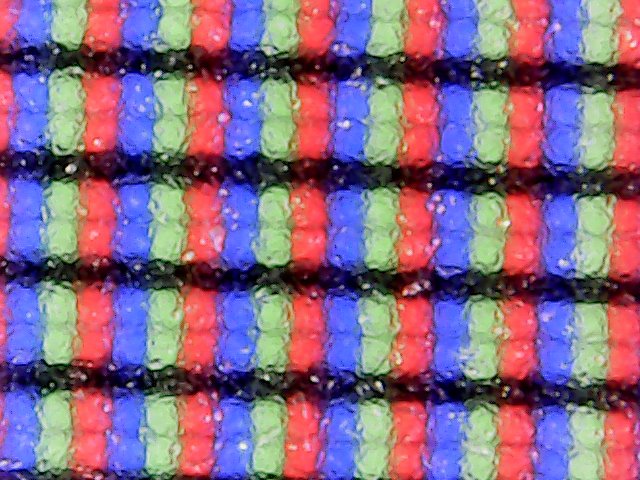
Unlike its higher-end sibling, the Legion Y520 does not include an option for a 4K screen. Instead, we received a 1920x1080 resolution IPS anti-glare panel. That computes to a PPI of 141, just fine for most purposes—and, unlike 4K, 1080p is appropriate for gaming at native resolution when paired with the GTX 1050 Ti. Upon first glance, brightness and contrast seem average, and color saturation doesn’t appear to be the panel’s strong suit.

| |||||||||||||||||||||||||
Brightness Distribution: 88 %
Center on Battery: 239 cd/m²
Contrast: 683:1 (Black: 0.35 cd/m²)
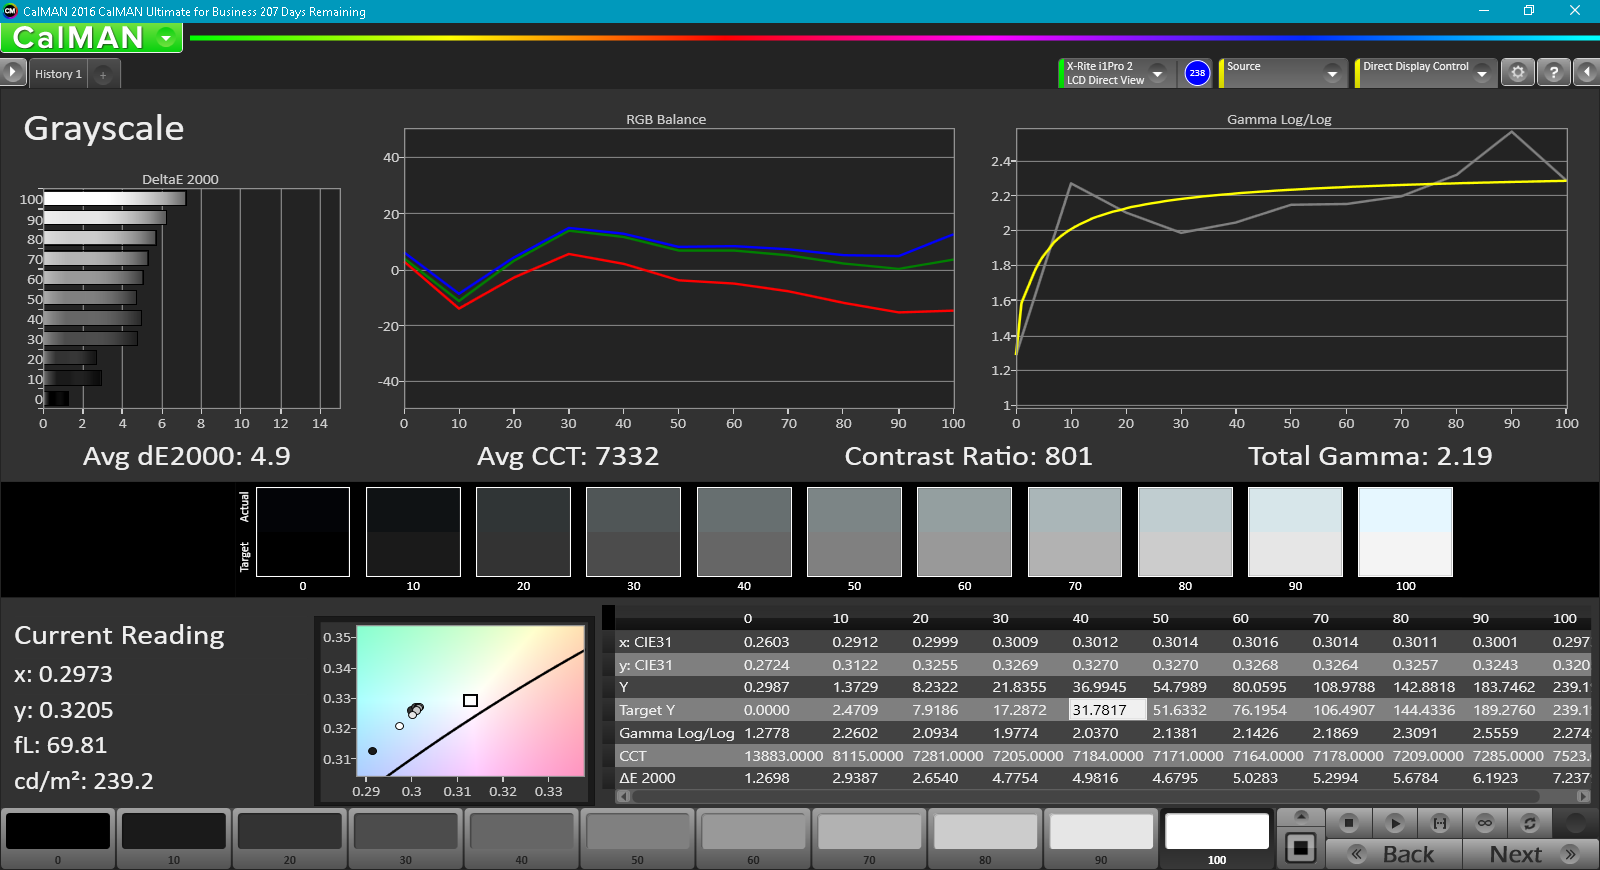
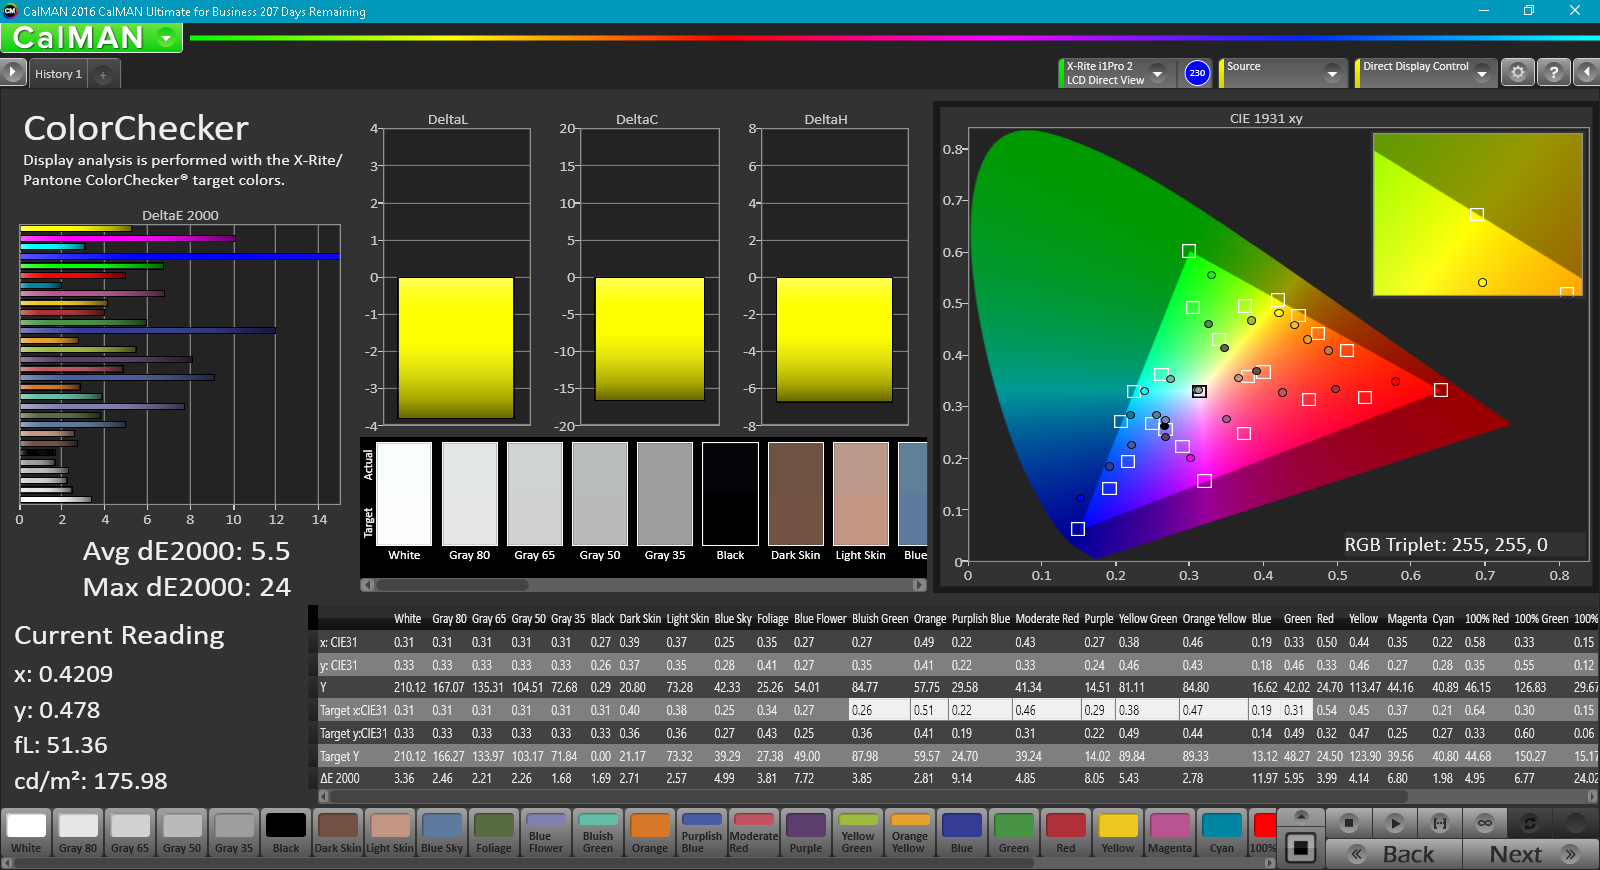
ΔE ColorChecker Calman: 7.3 | ∀{0.5-29.43 Ø4.71}
ΔE Greyscale Calman: 4.9 | ∀{0.09-98 Ø4.96}
55% sRGB (Argyll 1.6.3 3D)
35% AdobeRGB 1998 (Argyll 1.6.3 3D)
Gamma: 2.19
CCT: 7332 K
| Lenovo Legion Y520-15IKBN-80WK001KUS LP156WF6-SPK3, IPS, 15.6", 1920x1080 | Lenovo Legion Y720 80VR002XGE LG Philips LGD0533 LP156WF6-SPK3, IPS, 15.6", 1920x1080 | Samsung Odyssey NP800G5M-X01US IPS, 15.6", 1920x1080 | MSI GS63VR 7RF-228US IPS, 15.6", 3840x2160 | Asus ROG Strix GL553VD-DS71 BOE HF NV156FHM-N43, IPS, 15.6", 1920x1080 | Alienware 15 R3 HPJGK_B156HTN (AUO51ED), TN, 15.6", 1920x1080 | |
|---|---|---|---|---|---|---|
| Display | ||||||
| Display P3 Coverage (%) | 38.43 | 47.11 | 48.21 | 67.6 | 66 | |
| sRGB Coverage (%) | 57.5 | 70.4 | 72.6 | 90.8 | 90.5 | |
| AdobeRGB 1998 Coverage (%) | 39.75 | 48.71 | 49.81 | 66.4 | 66.2 | |
| Response Times | 30% | 21% | 43% | -1% | 62% | |
| Response Time Grey 50% / Grey 80% * (ms) | 58.8 ? | 43 ? 27% | 38.8 ? 34% | 28 ? 52% | 57.6 ? 2% | 25 ? 57% |
| Response Time Black / White * (ms) | 36 ? | 24 ? 33% | 33.6 ? 7% | 23.6 ? 34% | 37.2 ? -3% | 12 ? 67% |
| PWM Frequency (Hz) | 21550 ? | 21000 ? | 19230 ? | 1351 ? | ||
| Screen | 15% | 4% | 0% | 43% | 16% | |
| Brightness middle (cd/m²) | 239 | 288 21% | 255.9 7% | 274.2 15% | 289.3 21% | 386 62% |
| Brightness (cd/m²) | 244 | 275 13% | 249 2% | 263 8% | 280 15% | 382 57% |
| Brightness Distribution (%) | 88 | 86 -2% | 90 2% | 92 5% | 93 6% | 93 6% |
| Black Level * (cd/m²) | 0.35 | 0.36 -3% | 0.48 -37% | 0.44 -26% | 0.29 17% | 0.39 -11% |
| Contrast (:1) | 683 | 800 17% | 533 -22% | 623 -9% | 998 46% | 990 45% |
| Colorchecker dE 2000 * | 7.3 | 5.29 28% | 5.9 19% | 8 -10% | 3.1 58% | 10.2 -40% |
| Colorchecker dE 2000 max. * | 24.7 | 9.97 60% | 18.9 23% | 14.6 41% | 7.1 71% | 15.81 36% |
| Greyscale dE 2000 * | 4.9 | 4.5 8% | 5.6 -14% | 9.1 -86% | 2.1 57% | 11.28 -130% |
| Gamma | 2.19 100% | 2.39 92% | 2.21 100% | 2.24 98% | 2.22 99% | 2.23 99% |
| CCT | 7332 89% | 6839 95% | 7250 90% | 5020 129% | 6226 104% | 11383 57% |
| Color Space (Percent of AdobeRGB 1998) (%) | 35 | 37 6% | 44.8 28% | 45.7 31% | 59 69% | 59 69% |
| Color Space (Percent of sRGB) (%) | 55 | 57 4% | 70.1 27% | 72.1 31% | 91 65% | 90 64% |
| Total Average (Program / Settings) | 23% /
18% | 13% /
6% | 22% /
7% | 21% /
35% | 39% /
24% |
* ... smaller is better
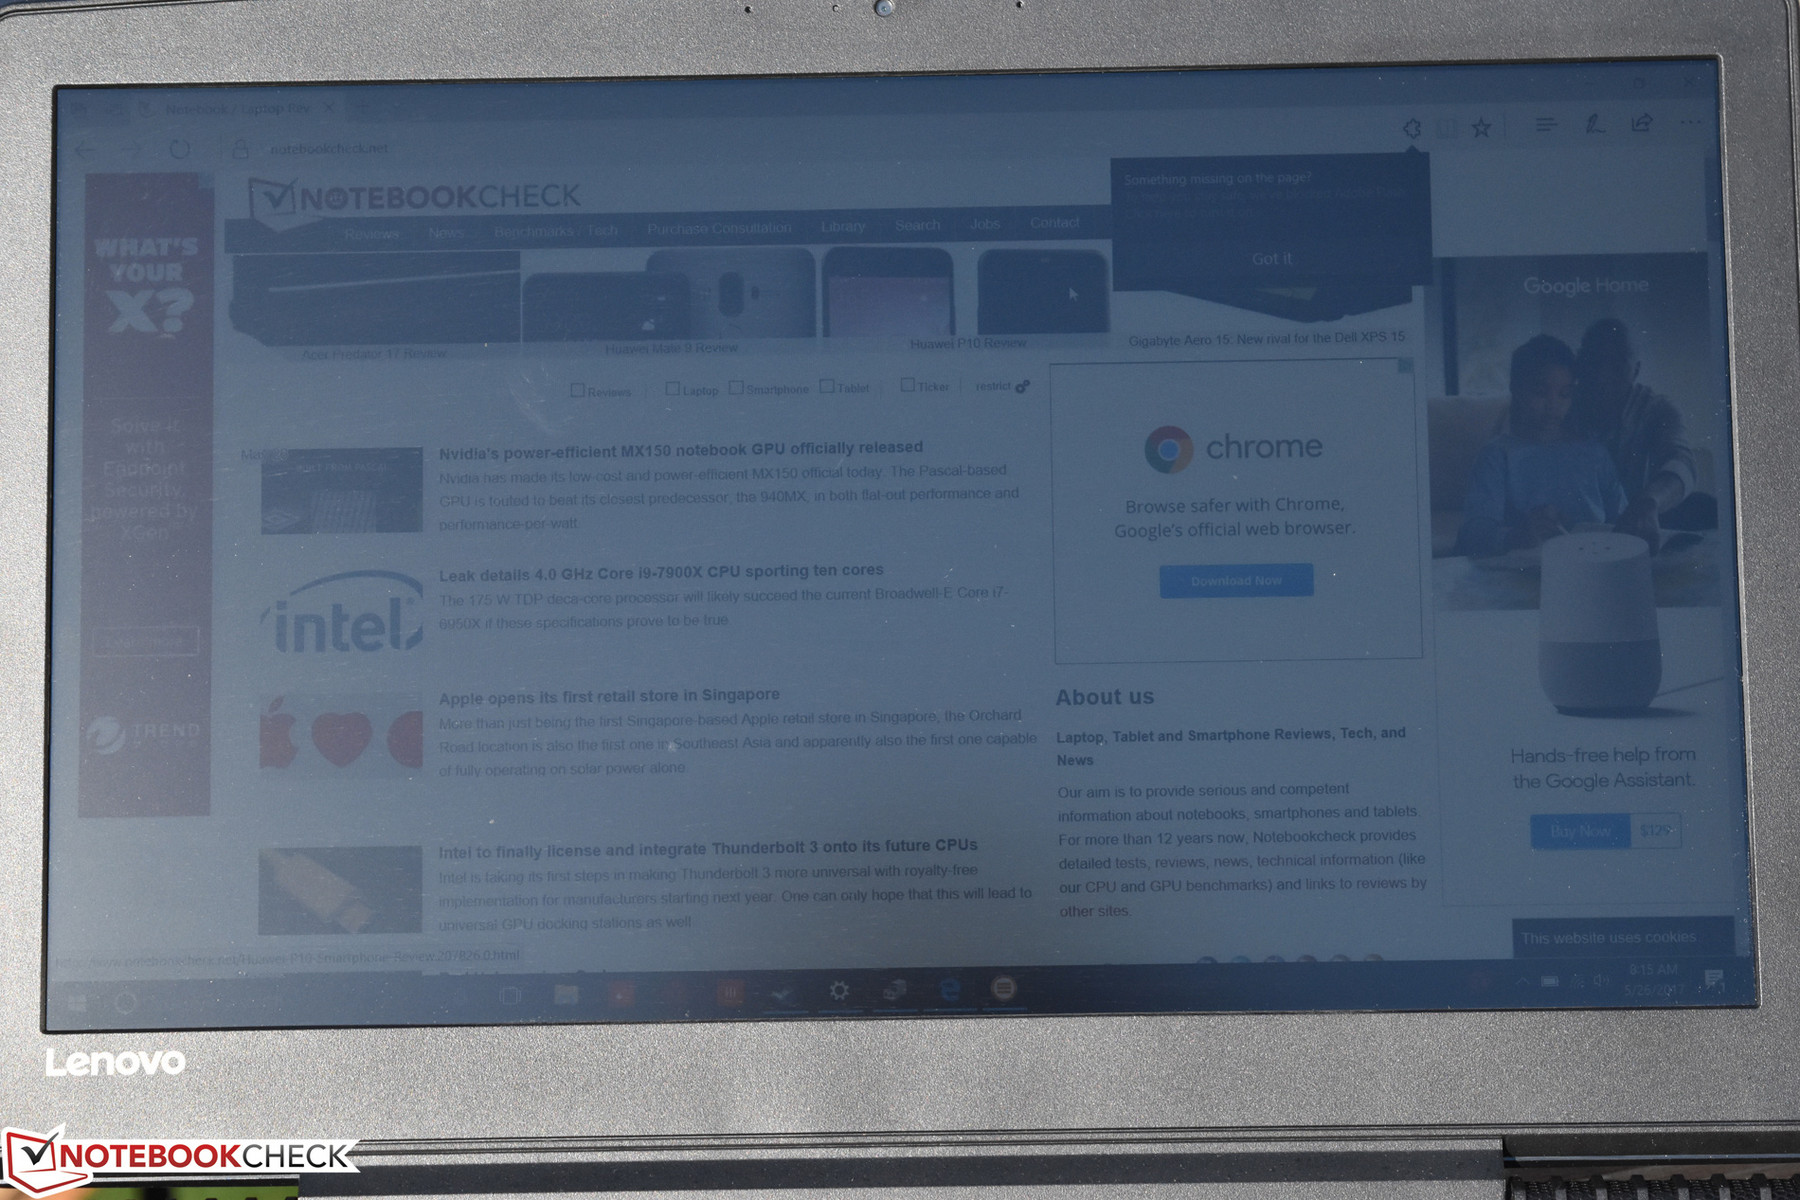
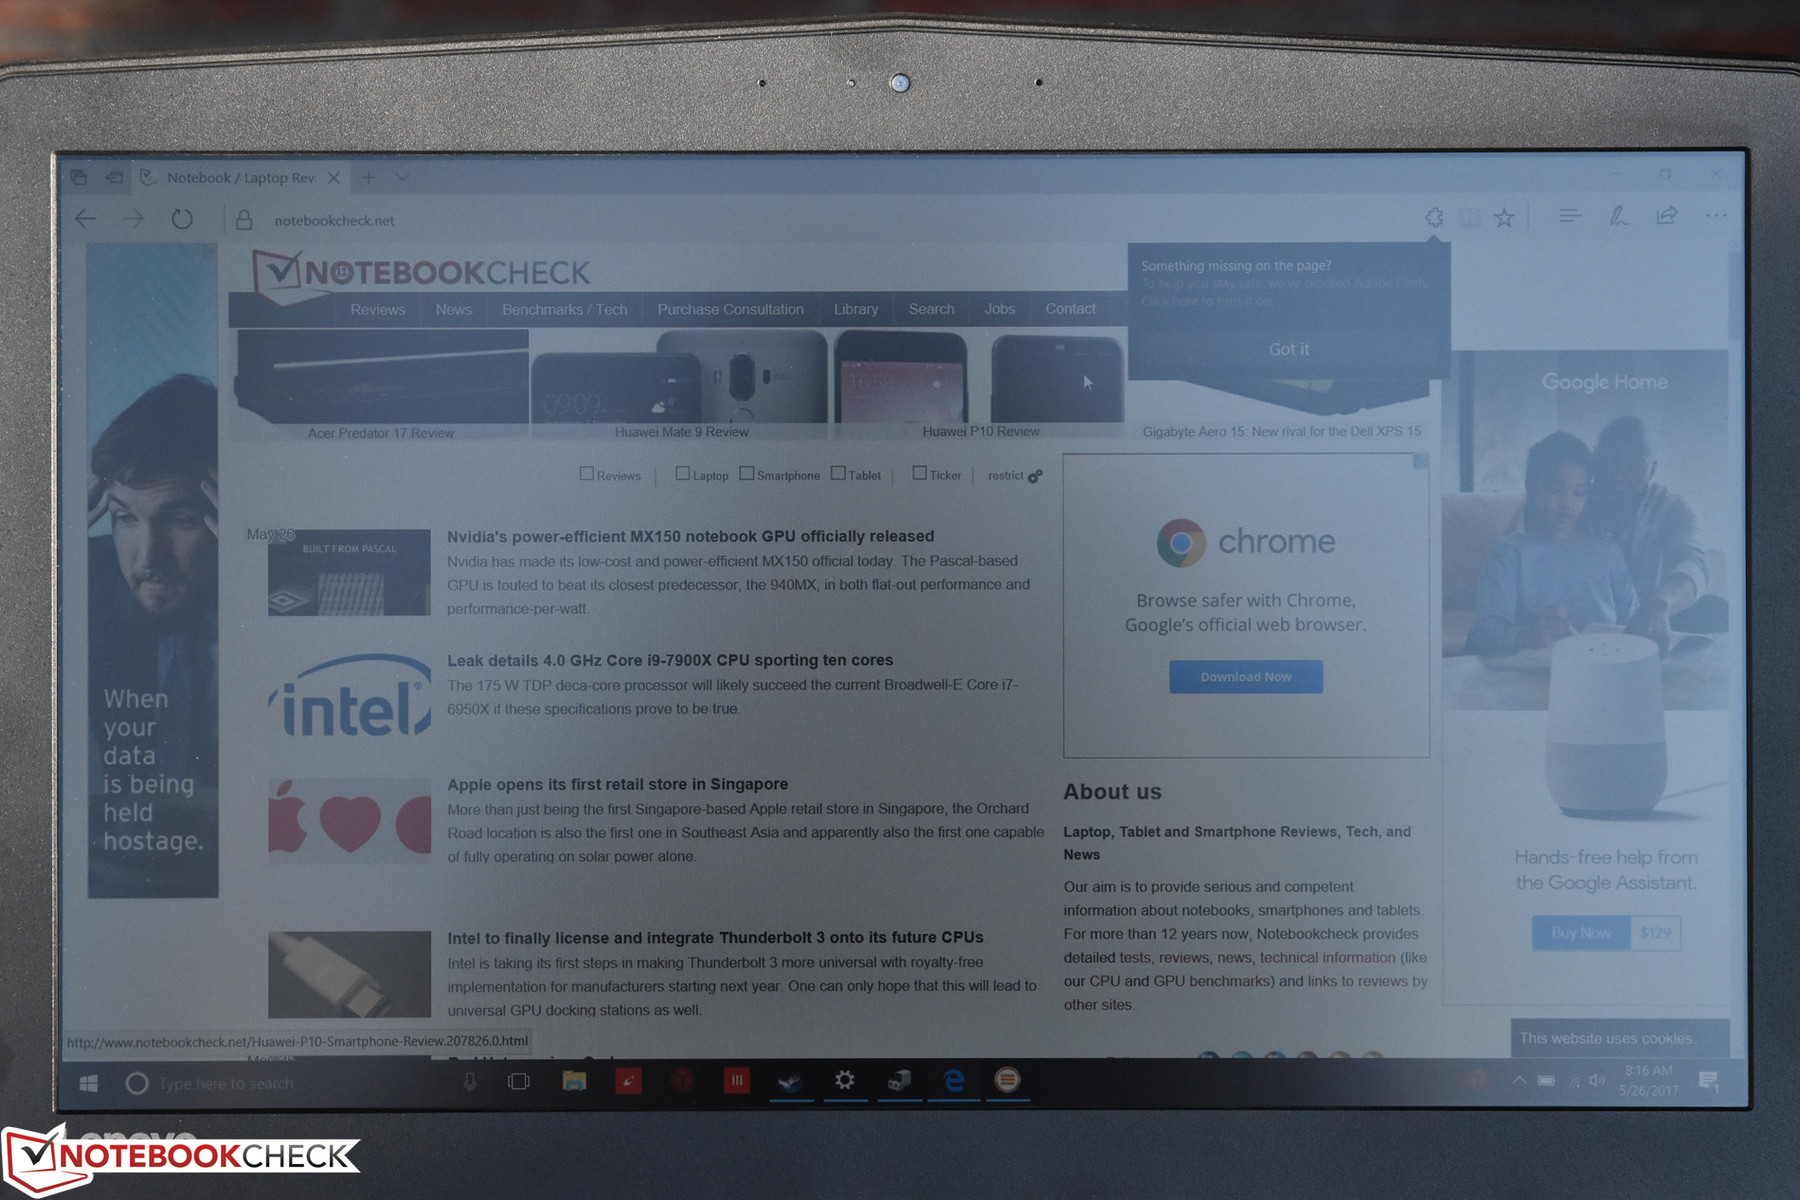
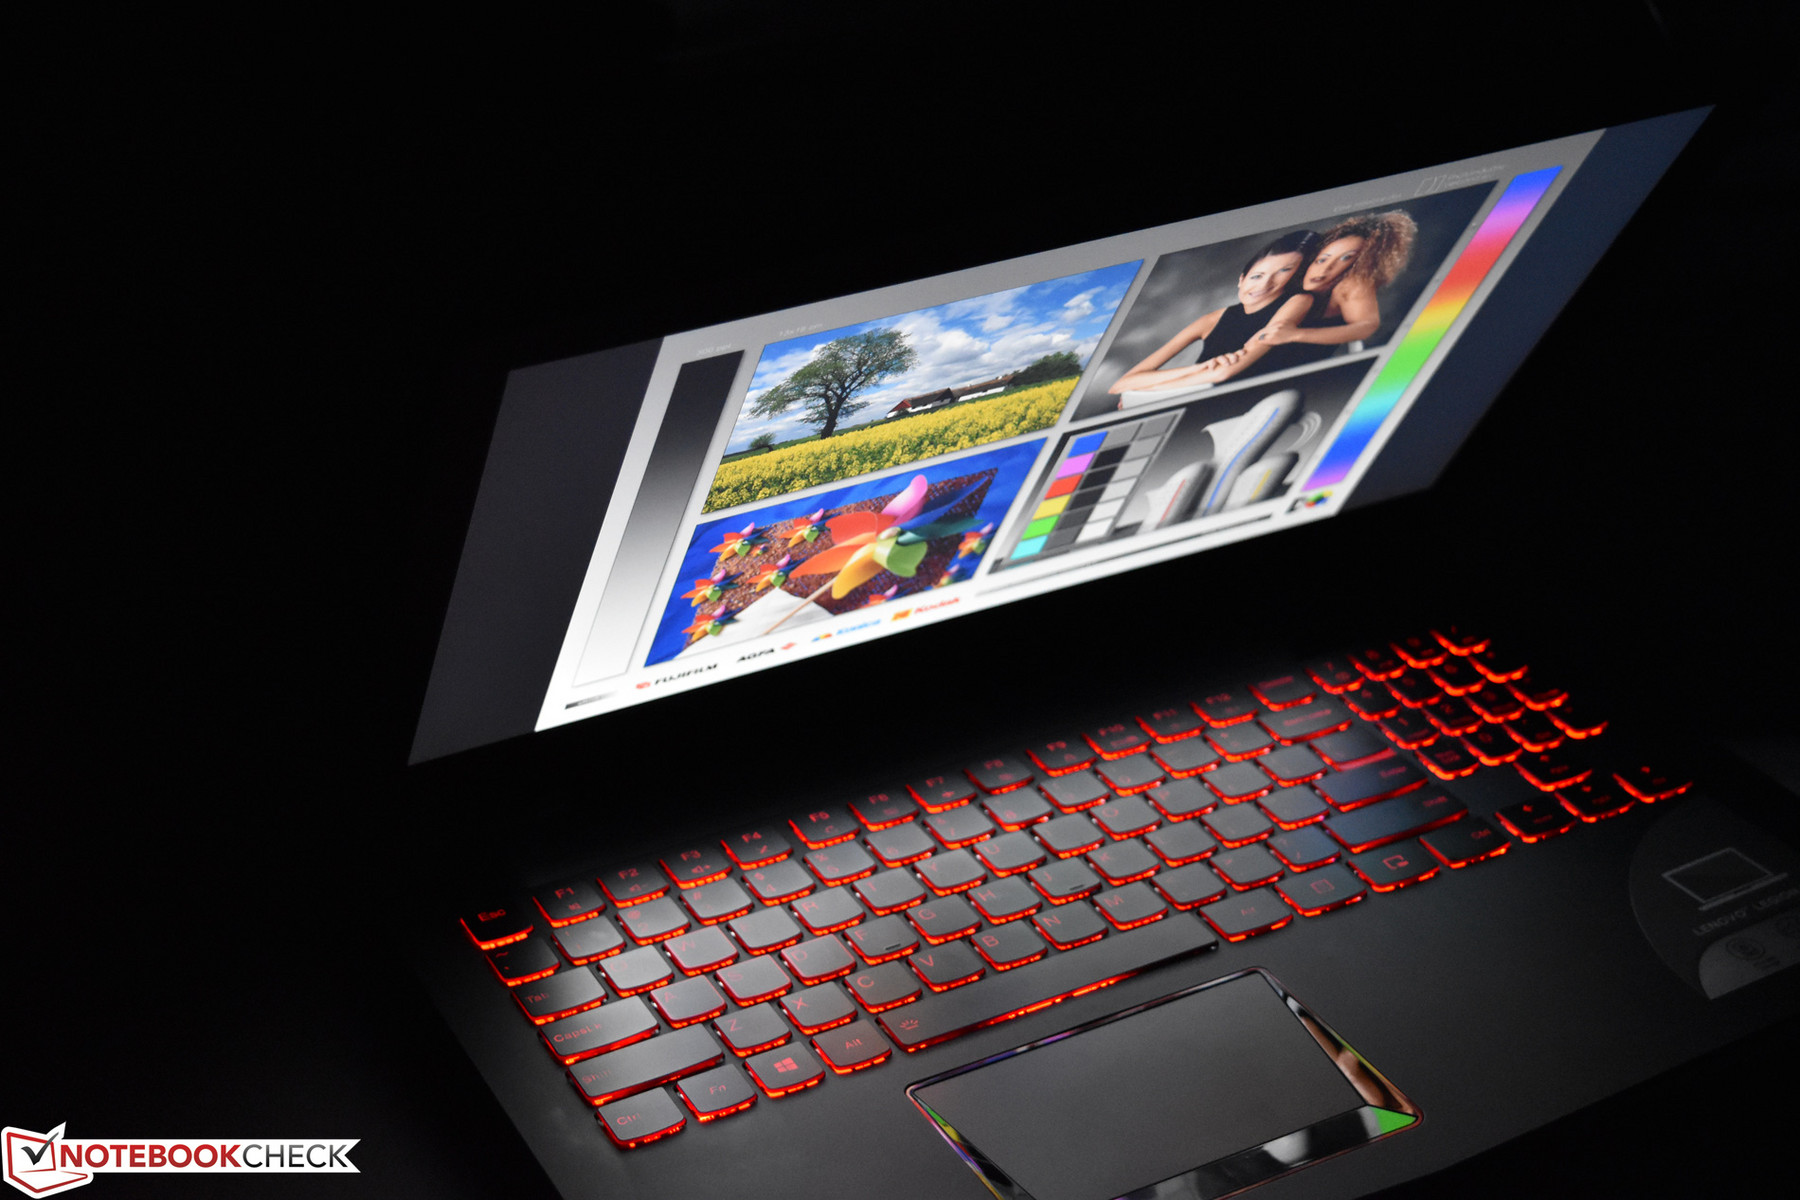
We measured an average brightness of just 244.3 cd/m², which is subpar, but suitable for indoor environments. Meanwhile, the black value of 0.35 cd/m² yields a contrast ratio of just 683:1, which is also merely adequate. At least brightness is fairly uniform across the breadth of the panel; we recorded a brightness distribution of 88%, which is relatively even. The right side of the panel is measurably brighter than the left, but in practice, it’s unnoticeable. What is noticeable, however, is the visible clouding/backlight bleed on dark screens. Have a look at our attached photo above for an (exaggerated) example of what this looks like in a dark room.
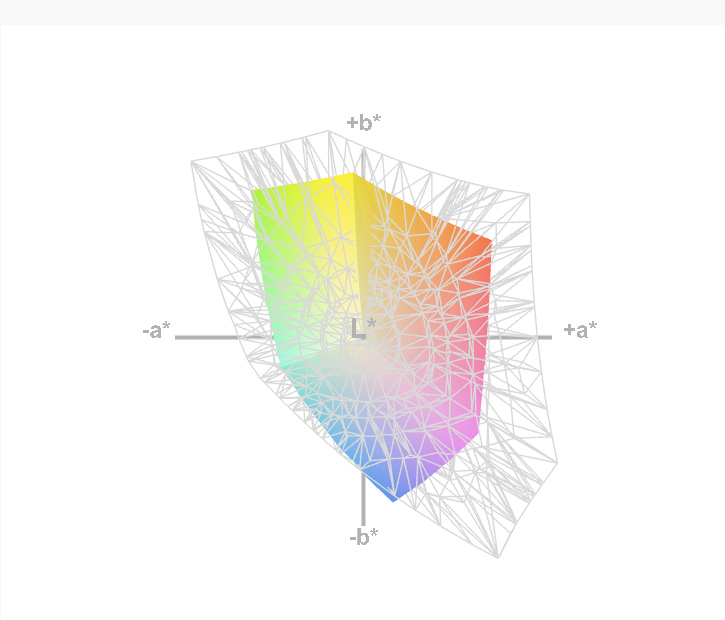
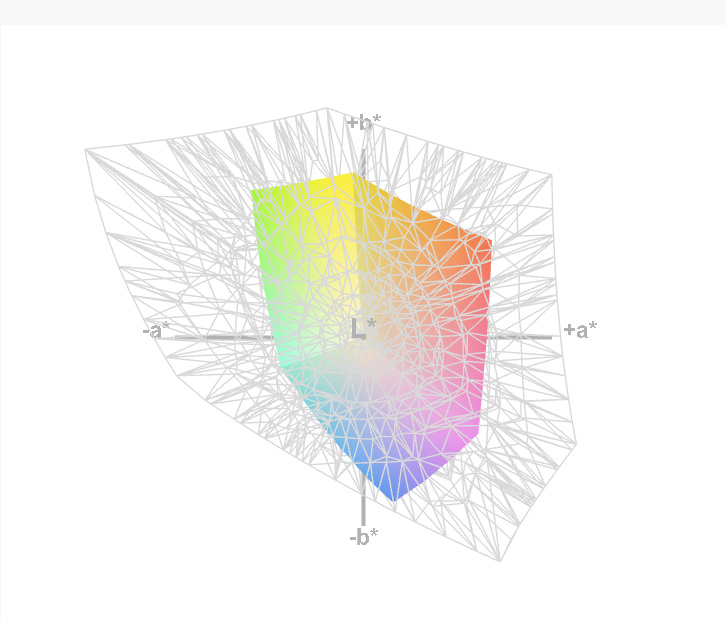
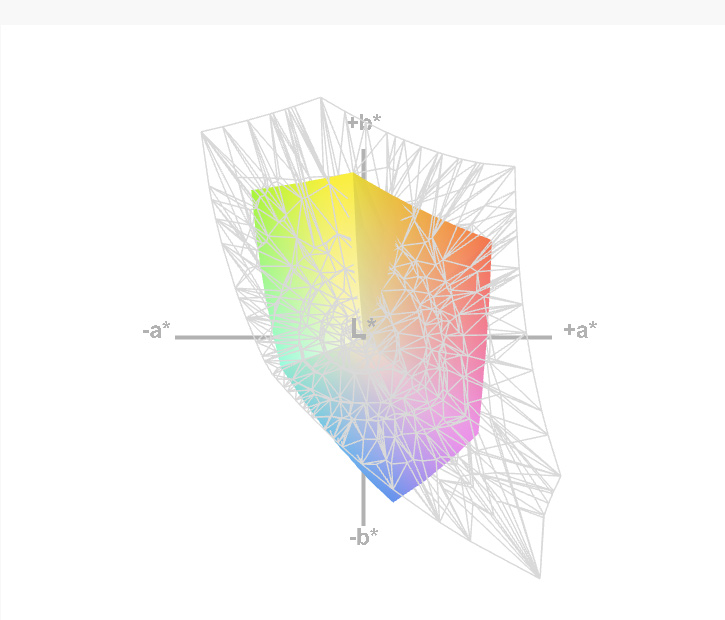
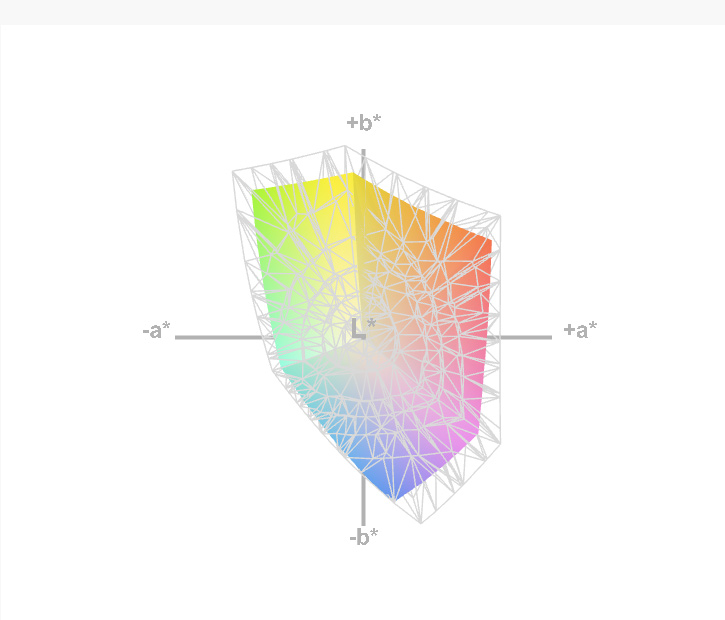
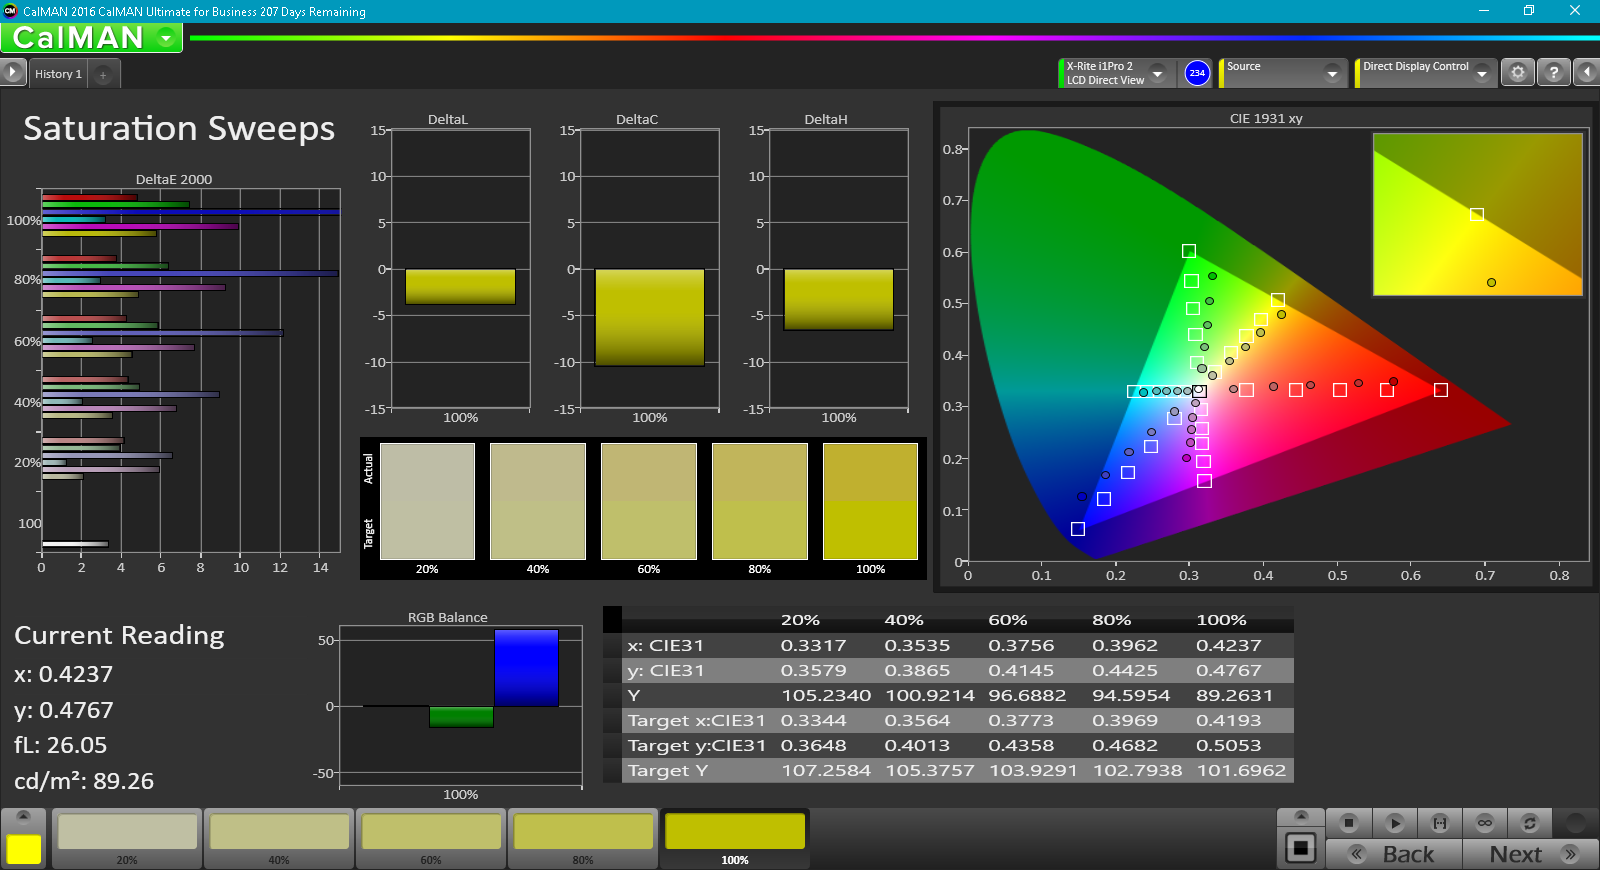
Color saturation and sRGB/AdobeRGB coverage, meanwhile, is sorely lacking. With just 55 percent of the sRGB color space covered by the panel, colors predictably appear rather drab and washed-out. AdobeRGB, of course, is even further from ideal, with only 35 percent coverage measured. The results from competing machines from other manufacturers are all considerably more positive.
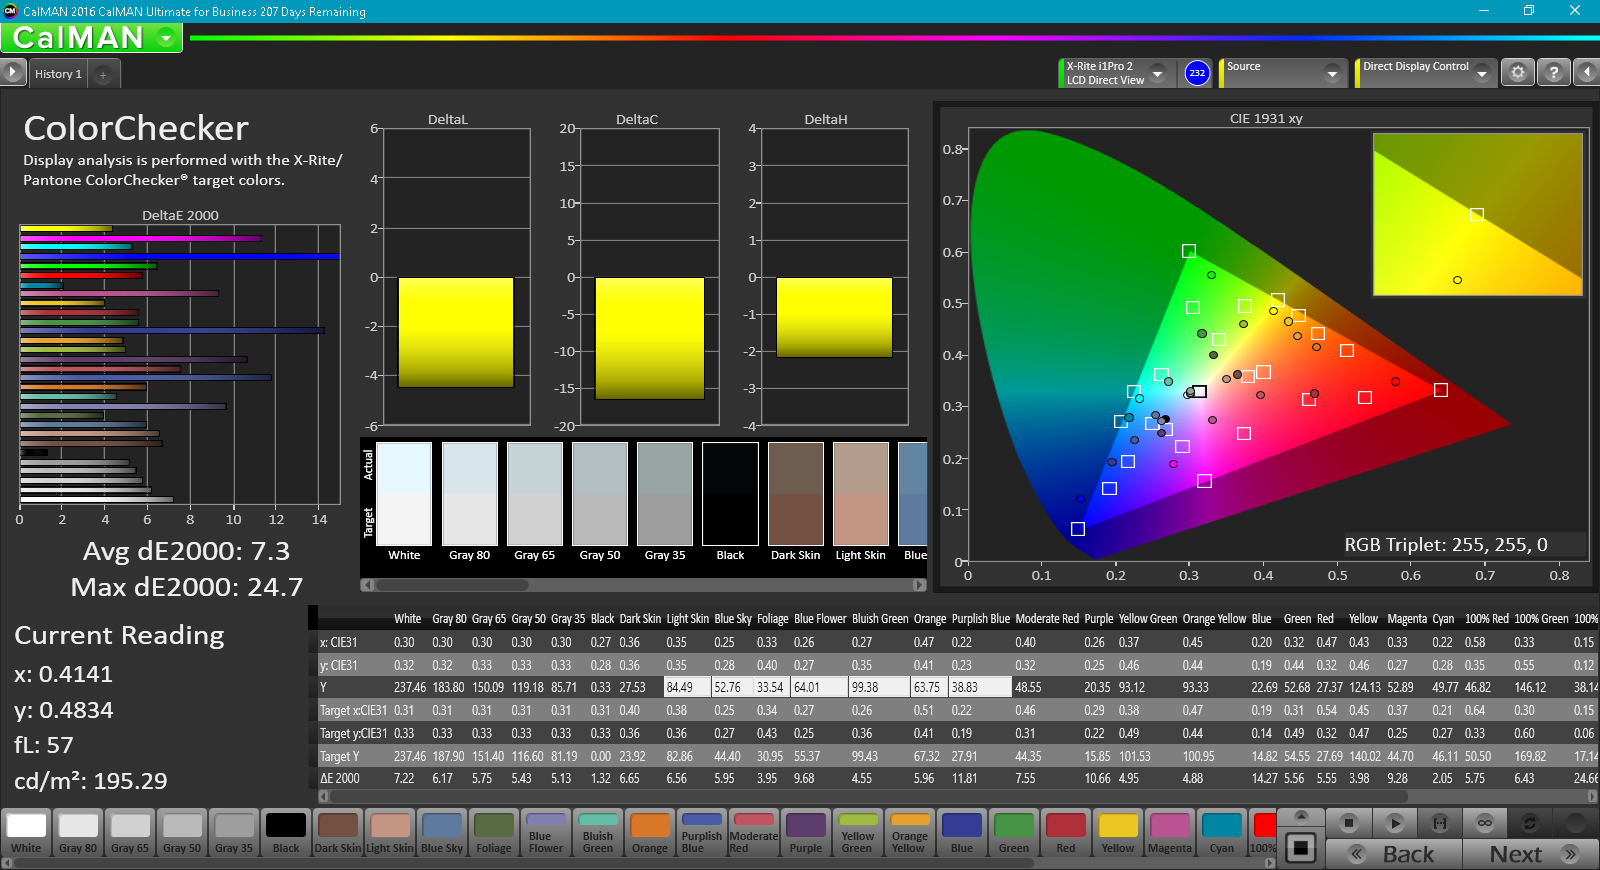
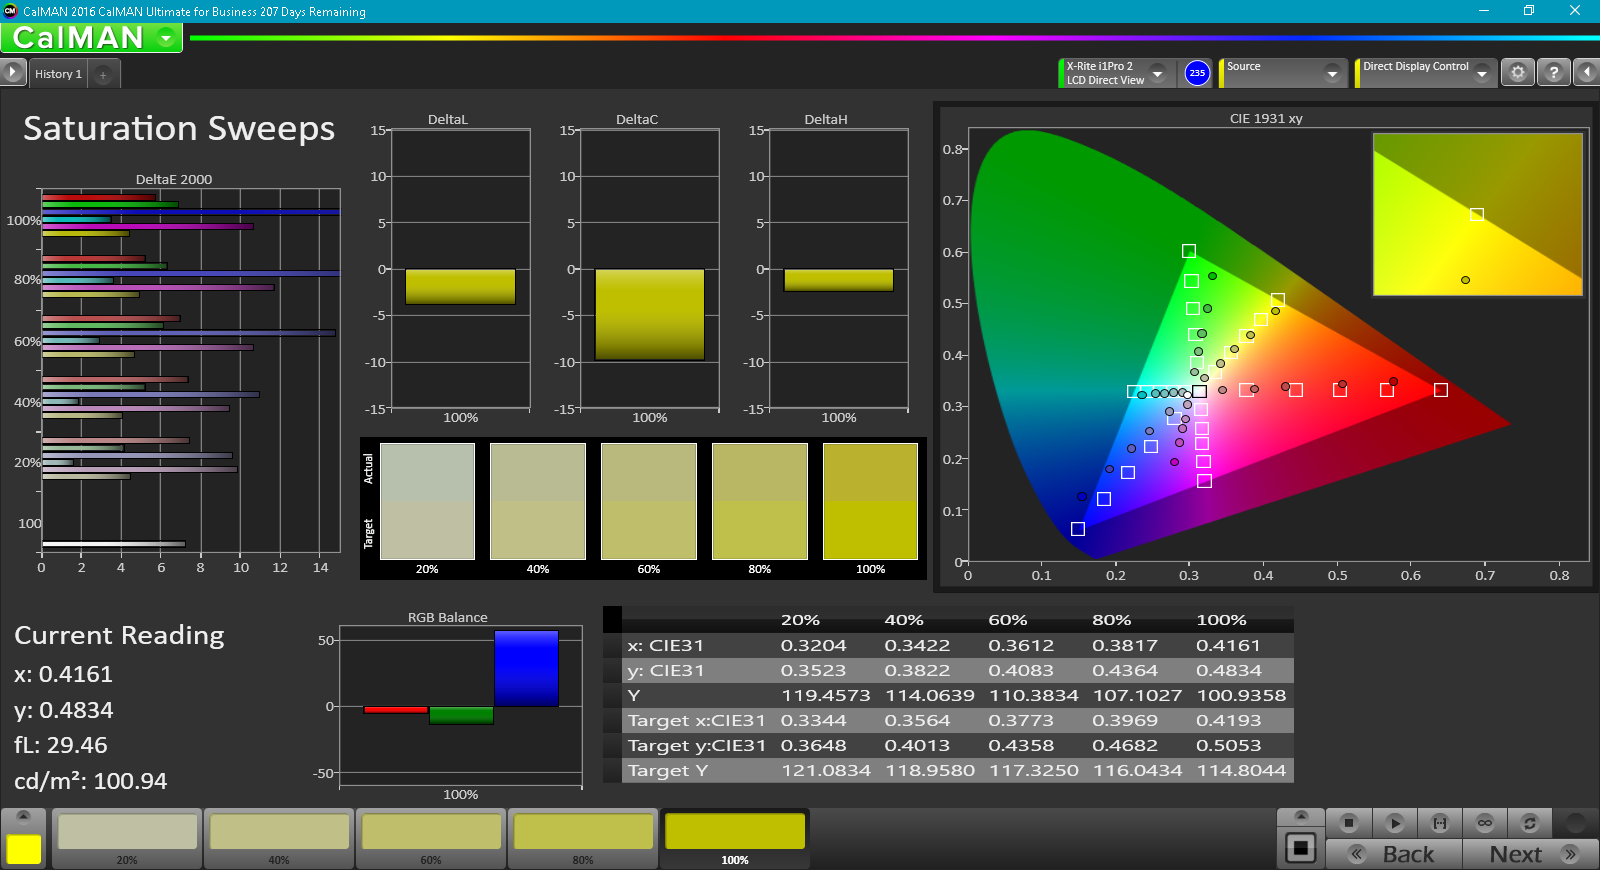
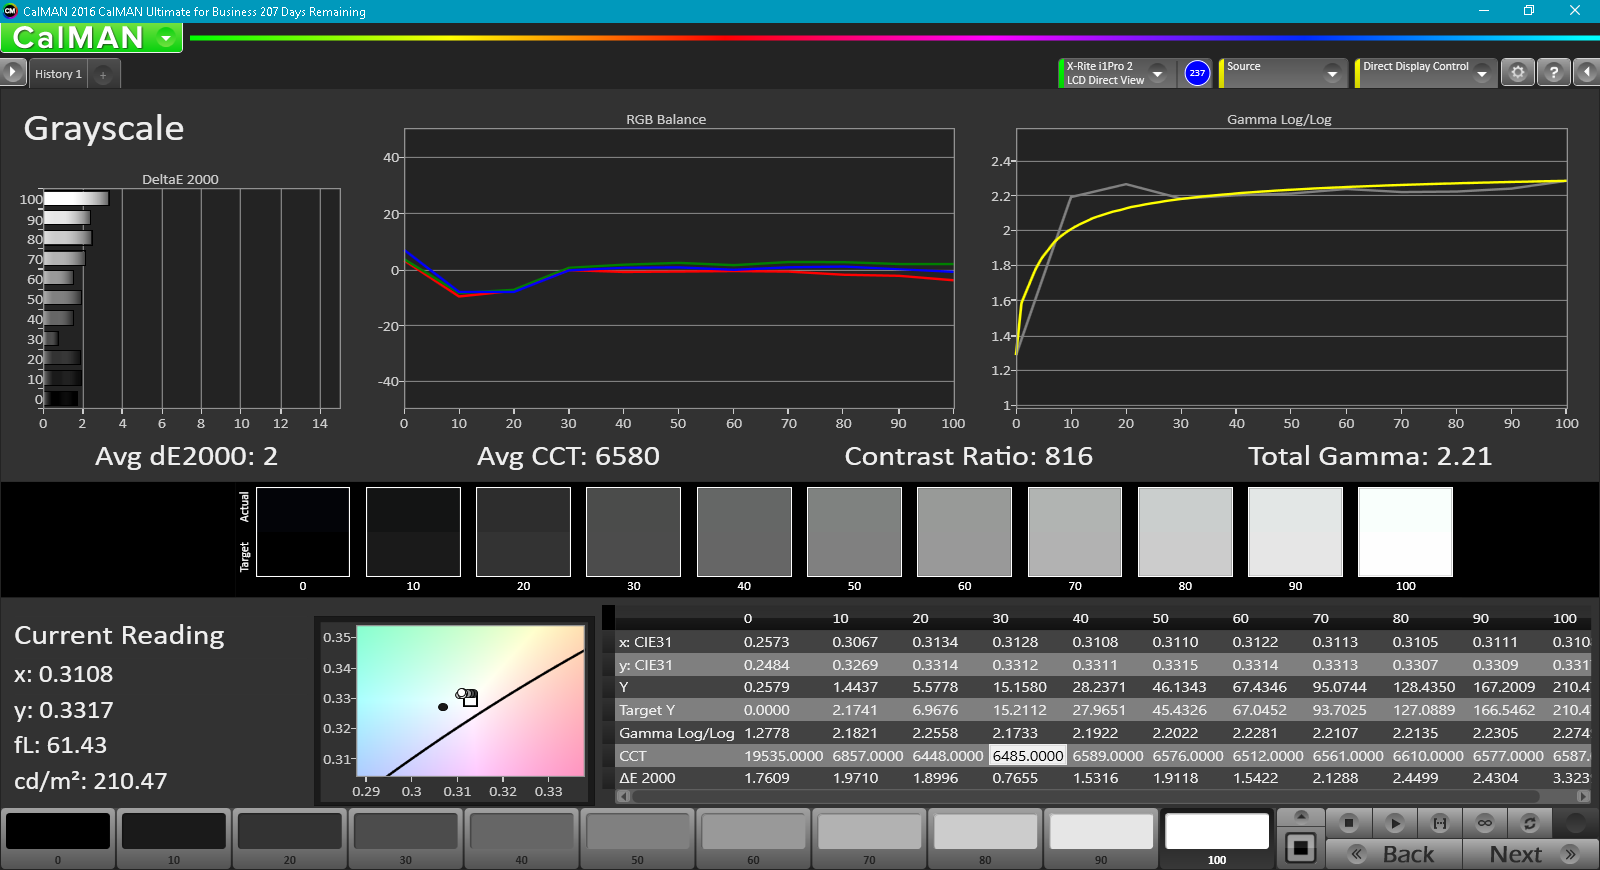
CalMAN 5’s results aren’t terribly offensive, but they’re nothing impressive, either. With ColorChecker and Greyscale DeltaE values of 7.3 and 4.9, respectively, color accuracy isn’t the panel’s strong suit. Total gamma, however, is close to ideal at 2.19 (ideal: 2.4), while the CCT average of 7332K is on the cool side (ideal: 6500K). The panel responded well to calibration (for those so inclined), however, which brought the average Colorchecker / Greyscale DeltaE readings down to 5.5 / 2.0 with a nearly perfect CCT Average of 6580.
Display Response Times
| ↔ Response Time Black to White | ||
|---|---|---|
| 36 ms ... rise ↗ and fall ↘ combined | ↗ 23.6 ms rise | 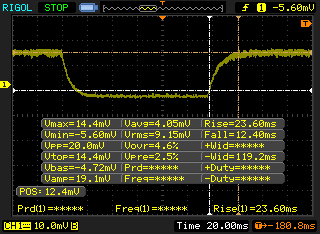 |
| ↘ 12.4 ms fall | ||
| The screen shows slow response rates in our tests and will be unsatisfactory for gamers. In comparison, all tested devices range from 0.1 (minimum) to 240 (maximum) ms. » 94 % of all devices are better. This means that the measured response time is worse than the average of all tested devices (19.8 ms). | ||
| ↔ Response Time 50% Grey to 80% Grey | ||
| 58.8 ms ... rise ↗ and fall ↘ combined | ↗ 33.6 ms rise | 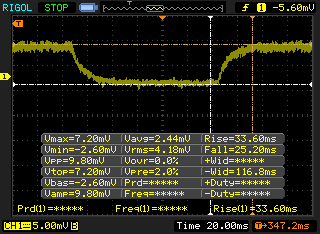 |
| ↘ 25.2 ms fall | ||
| The screen shows slow response rates in our tests and will be unsatisfactory for gamers. In comparison, all tested devices range from 0.165 (minimum) to 636 (maximum) ms. » 95 % of all devices are better. This means that the measured response time is worse than the average of all tested devices (30.9 ms). | ||
Screen Flickering / PWM (Pulse-Width Modulation)
| Screen flickering / PWM detected | 21550 Hz | ≤ 99 % brightness setting | 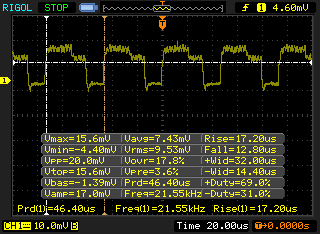 |
The display backlight flickers at 21550 Hz (worst case, e.g., utilizing PWM) Flickering detected at a brightness setting of 99 % and below. There should be no flickering or PWM above this brightness setting. The frequency of 21550 Hz is quite high, so most users sensitive to PWM should not notice any flickering. In comparison: 52 % of all tested devices do not use PWM to dim the display. If PWM was detected, an average of 7744 (minimum: 5 - maximum: 343500) Hz was measured. | |||
Although we did detect PWM from the display on all brightness levels below 100 percent, the frequency (21550 Hz) was sufficiently high that it is unlikely to be bothersome to most users.
Outdoors, the panel is usable in shaded areas thanks to the anti-glare coating and wide IPS viewing angles… though it does struggle a bit thanks to its subpar brightness and merely decent contrast ratio. Those same deficiencies, predictably, render usage in sunlight considerably more challenging.
Performance
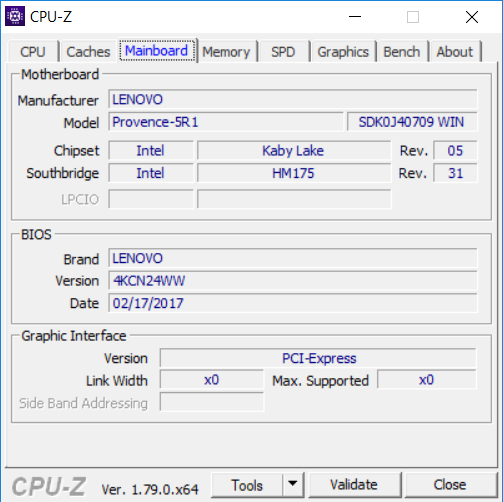
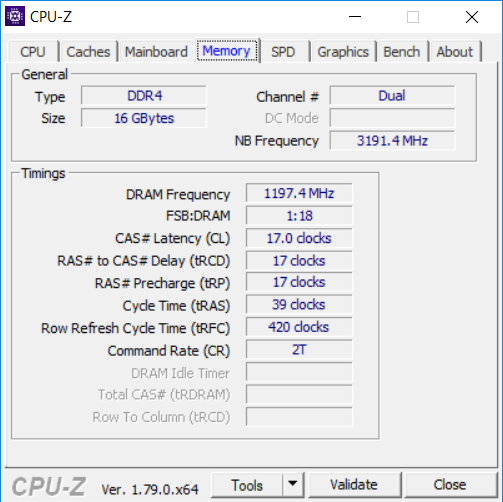
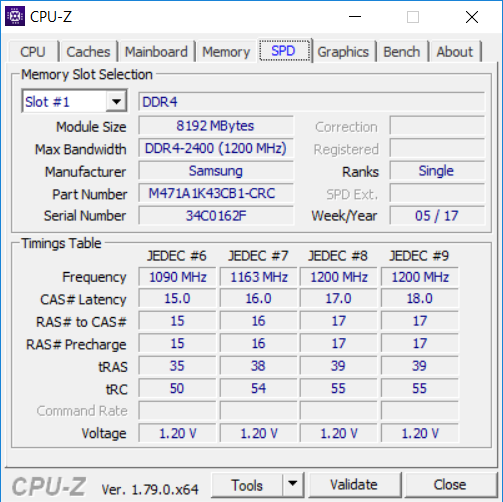
While the Legion Y520 isn’t necessarily going for the most luxurious build or attractive styling, its internal components are hardly anything to be ashamed of. Our review unit features an Intel Core i7-7700HQ quad-core CPU, NVIDIA GeForce GTX 1050 Ti GPU, 16 GB of DDR4 dual-channel memory, and a 256 GB NVMe SSD. While 4K gaming isn’t in the conversation, this machine ought to be handle most 1080p challenges without too much trouble.
Entry-level Y520 notebooks with a Core i5 CPU, 8 GB of RAM, and a conventional mechanical hard drive (no preinstalled SSD) can be had for as little as $780 as of this writing. As previously mentioned, the RAM and SSD are mostly easy to upgrade if the user chooses to do so post-purchase. Straight from the factory, our exact configuration will currently run you around $1,060.
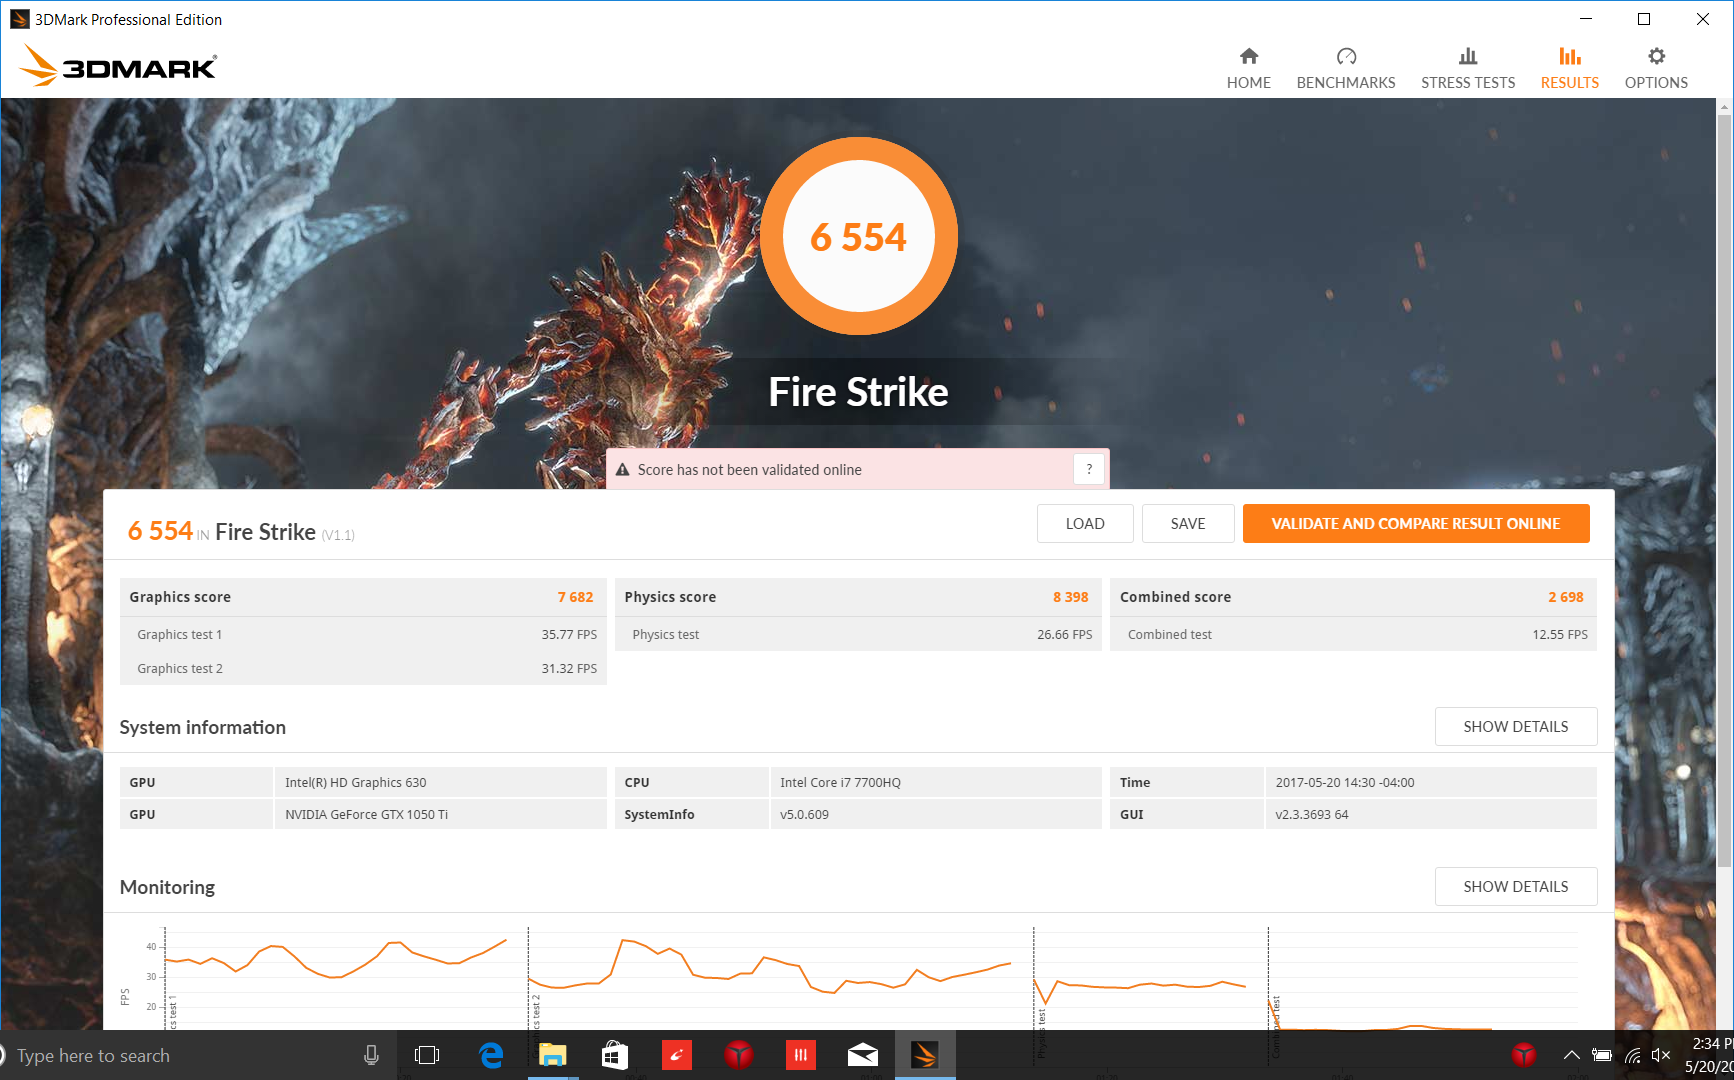
We’ll take a much deeper look at each facet of the machine’s performance next. Before we get to that, however, a couple of quick notes: performance while on battery is (as is usually the case with gaming machines) notably diminished; a secondary run of 3DMark Fire Strike produced a score of 5549, 28 percent below our original score (7682).
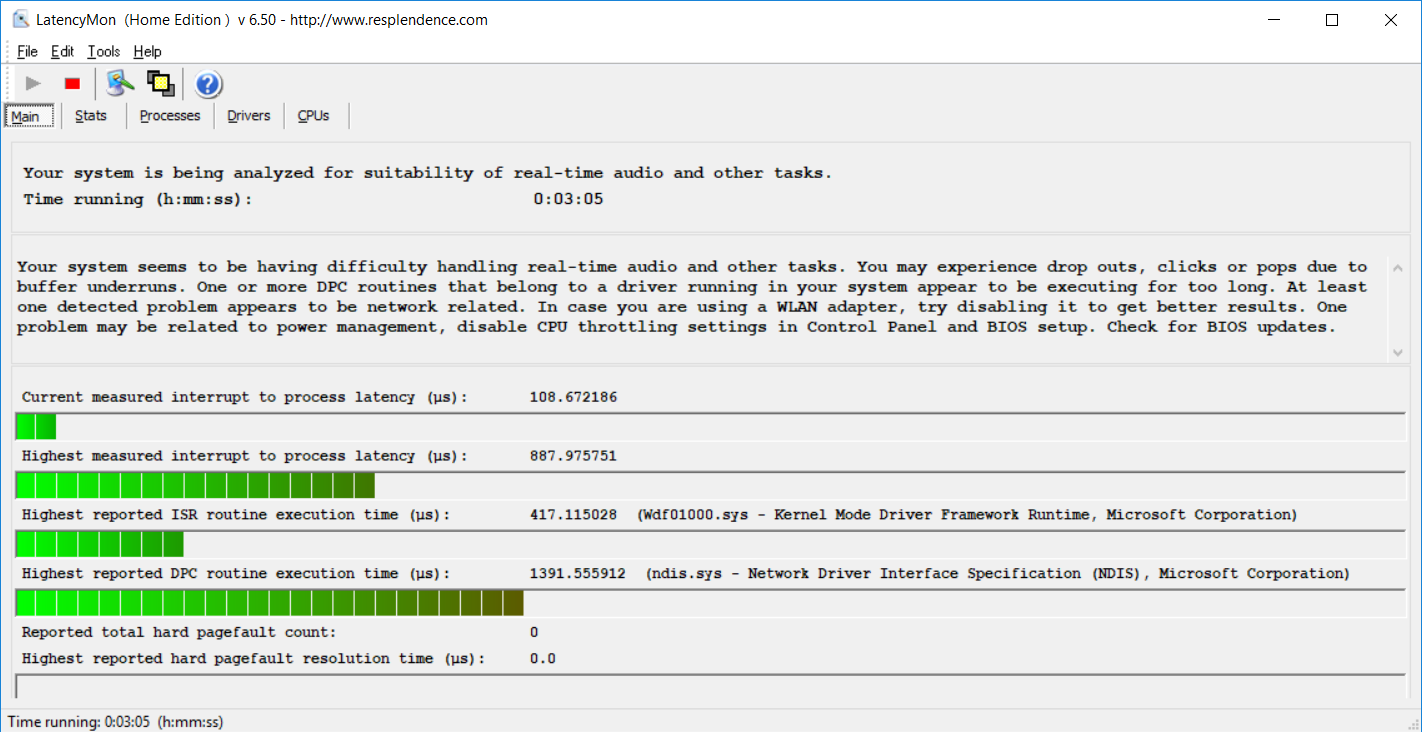
LatencyMon reports no latency issues, meanwhile, suggesting that the device should be able to handle real-time audio and video streaming without difficulty.
Processor
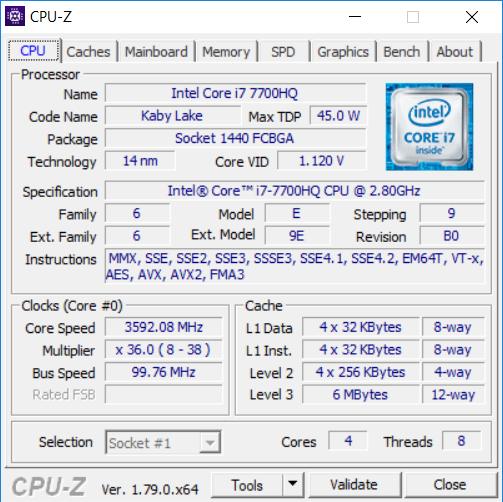
The Intel Core i7-7700HQ has already been exhaustively evaluated here at Notebookcheck. This quad-core Kaby Lake 14 nm CPU features a 2.8 GHz base clock rate with the capability of increasing its frequency to up to 3.8 GHz/3.6 GHz/3.4 GHz (single-core/dual-core/quad-core), provided thermal headroom exists. With a max TDP of 45 W, it’s also well-suited for notebooks of this size.
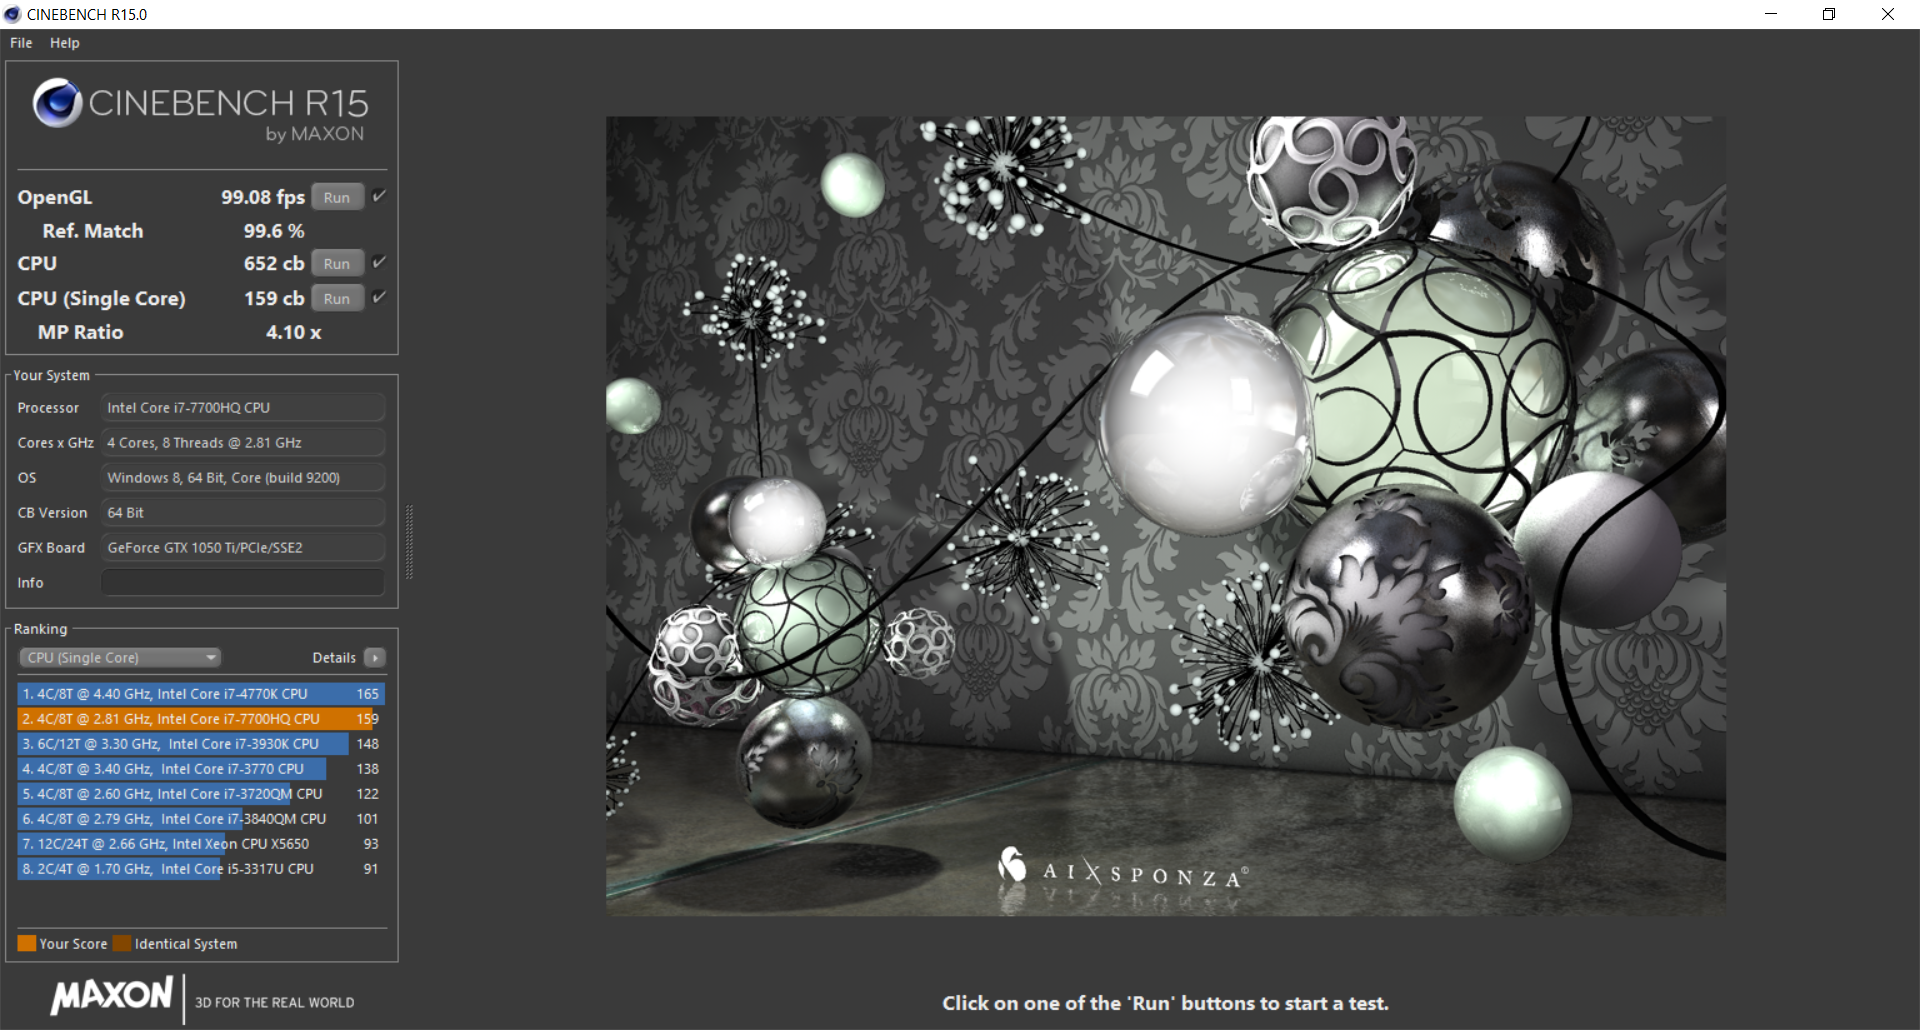
Oddly enough, however, although single-core performance is right where we’d expect it to be, our multi-core tests revealed a deficiency of over 10 percent as compared to the Y720 (which features the same CPU). For instance, although the Y720—along with every other notebook in our comparison field—scores well above a 700 on this test (737 to be exact), the Y520 only manages a score of 652. At first we suspected possible thermal limitations, so we engaged the so-called Extreme Cooling mode and monitored temperatures while re-running the test—and the results were practically unchanged. Of course, a score of 652 in Cinebench R15 isn’t anything to be ashamed of, but when it’s 10 to 15 percent below the rest of the notebooks out there packing the same CPU, it is a little bit disappointing.
Our new Cinebench R15 loop test, which seeks to approximate real-world stability under realistic sustained loads, at least yielded positive results. The graph featured a bit of unexplained fluctuation, but the differences between scores, at their extremes, were still below 5 percent. This test was performed with Extreme Cooling off, also, so it’s possible that enabling it might further compress the graph. The results here suggest mostly stable performance in real-world usage—so at least we know that thermal limitations are not of paramount concern on the CPU side. We’ll explore this from another angle in our Stress Test section later on.
| wPrime 2.10 - 1024m | |
| Asus ROG Strix GL553VD-DS71 | |
| MSI GS63VR 7RF-228US | |
| Samsung Odyssey NP800G5M-X01US | |
* ... smaller is better
System Performance
Subjectively, general operation of the Y520 is smooth and without hiccups or pauses. Startup and shutdown procedures are also very fast, as are sleep/resume cycles. Due to a problem with the system configuration, we have been unable to collect scores from successful PCMark 8 benchmark runs thus far. However, we are currently troubleshooting the matter and will reach out to Lenovo for answers if we continue to have no success. We will update this article with any new information as soon as it becomes available.
Storage Devices
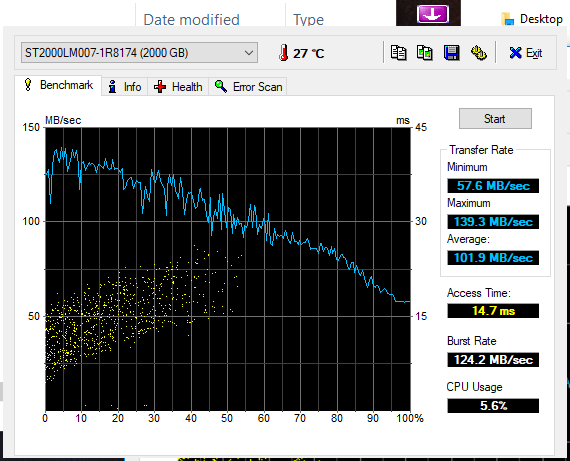
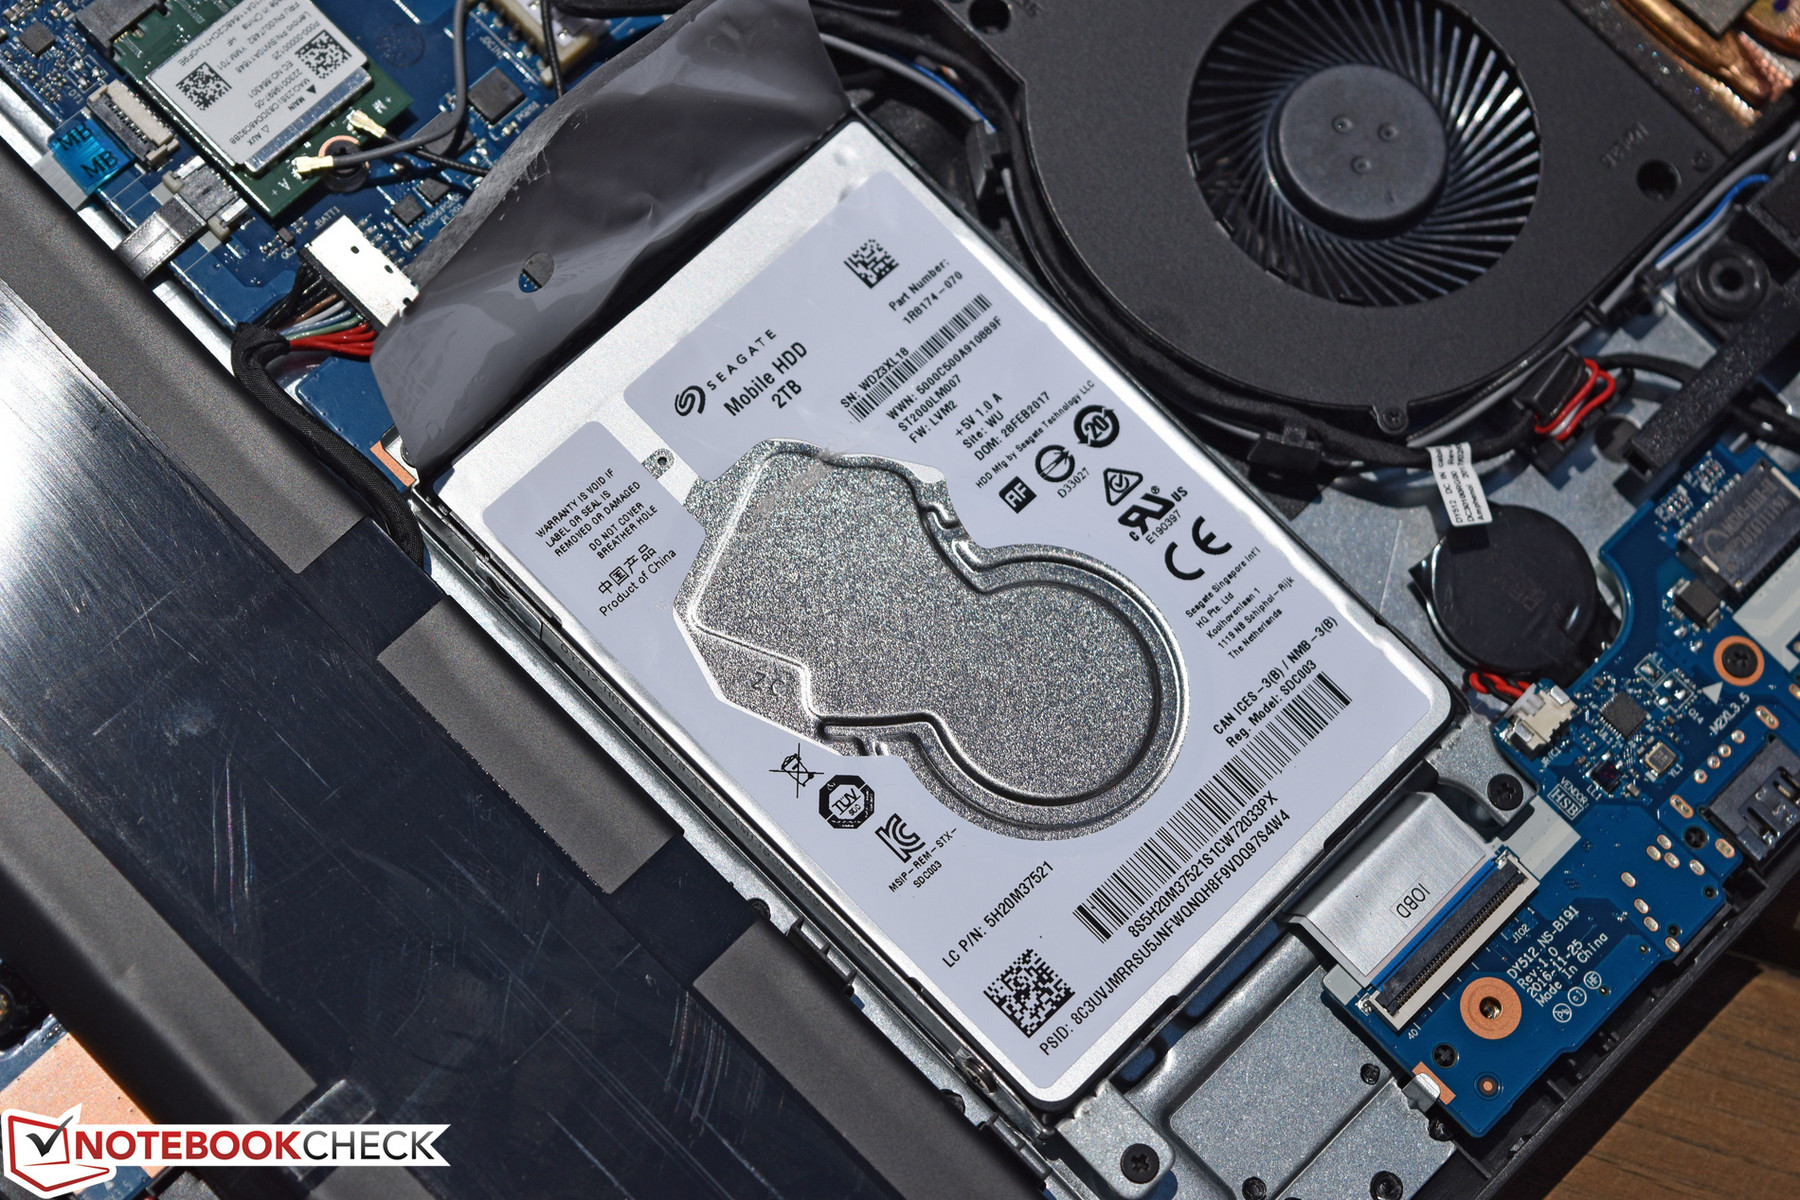
At the lowest end of the pricing spectrum, Y520 configurations with basic 1 TB 5400 RPM hard drives are available. Naturally, much more positive results are possible with solid-state storage, and in the case of our review unit, we received the best of both worlds: the speed of a 256 GB M.2 NVMe SSD combined with a 2 TB mechanical hard drive. This is (currently) a $190 upgrade total, with the SSD alone comprising $160 of the premium. The results, however, speak for themselves.
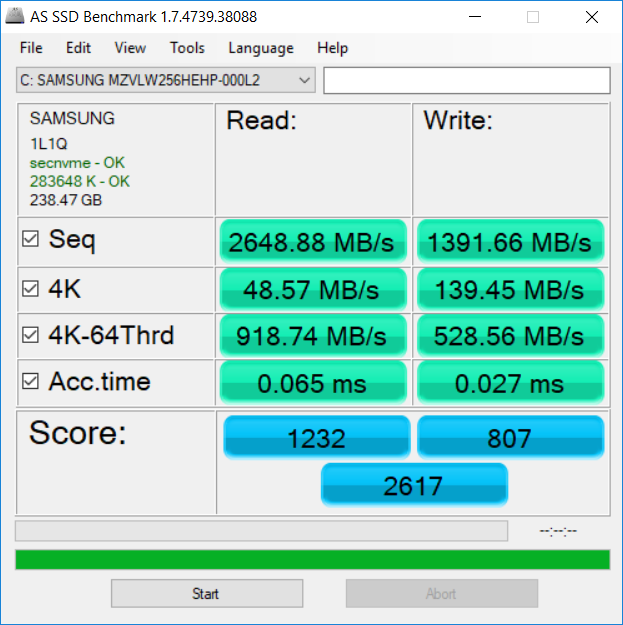
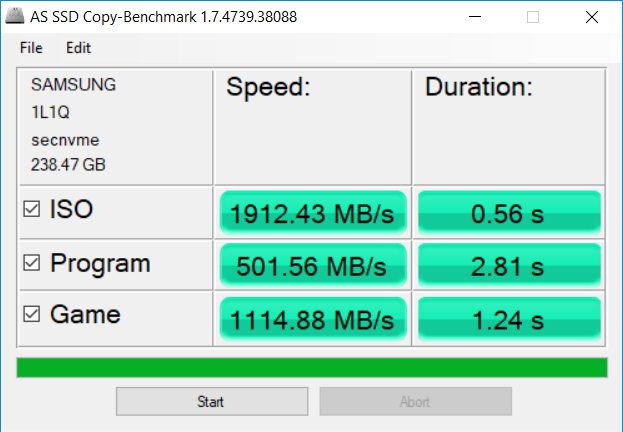
The PCIe SSD in the Legion Y520 is already fast from the start, but in order to further boost performance and solicit more realistic benchmark values from our tests, we performed a switch from SATA RAID interface over to AHCI in the system firmware setup menu, after which we followed these steps to switch from RAID to AHCI drivers within Windows 10 without requiring a reinstallation of the operating system. The result was an excellent total score of 2617 from AS SSD (1232 Read, 807 Write) with sequential read/write values of 2649 MB/s and 1392 MB/s, respectively. Coupled with the also very high 4K-64 R/W values, those are blistering speeds which should easily communicate the fluidity with which the system moves through everyday tasks.
As we mentioned previously, storage upgrades are relatively easy on the Y520, requiring only the removal of the rear cover (which isn’t too difficult a task).
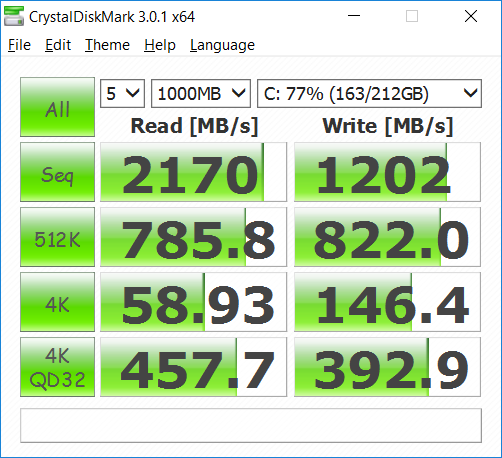
| Lenovo Legion Y520-15IKBN-80WK001KUS Samsung PM961 MZVLW256HEHP | Lenovo Legion Y720 80VR002XGE Samsung PM961 MZVLW256HEHP | Samsung Odyssey NP800G5M-X01US Samsung PM961 NVMe MZVLW128HEGR | MSI GS63VR 7RF-228US Samsung SM961 MZVKW512HMJP m.2 PCI-e | Alienware 15 R3 | |
|---|---|---|---|---|---|
| CrystalDiskMark 3.0 | 1% | -31% | 20% | -22% | |
| Read Seq (MB/s) | 2170 | 2196 1% | 1518 -30% | 2141 -1% | 1123 -48% |
| Write Seq (MB/s) | 1202 | 1144 -5% | 798 -34% | 1621 35% | 429.2 -64% |
| Read 512 (MB/s) | 786 | 747 -5% | 460.5 -41% | 499.7 -36% | 833 6% |
| Write 512 (MB/s) | 822 | 810 -1% | 195.8 -76% | 1531 86% | 428.1 -48% |
| Read 4k (MB/s) | 58.9 | 60.1 2% | 47.16 -20% | 54.2 -8% | 37.8 -36% |
| Write 4k (MB/s) | 146.4 | 153.5 5% | 143.1 -2% | 158.2 8% | 122.9 -16% |
| Read 4k QD32 (MB/s) | 457.7 | 485.4 6% | 521 14% | 632 38% | 542 18% |
| Write 4k QD32 (MB/s) | 392.9 | 396.3 1% | 176.4 -55% | 527 34% | 429.8 9% |

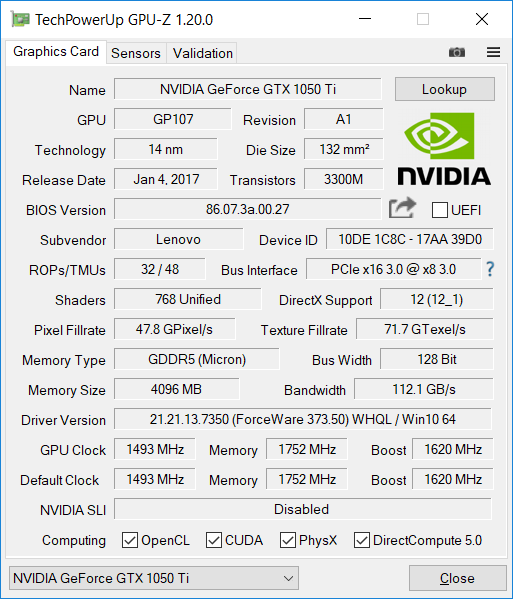
GPU Performance
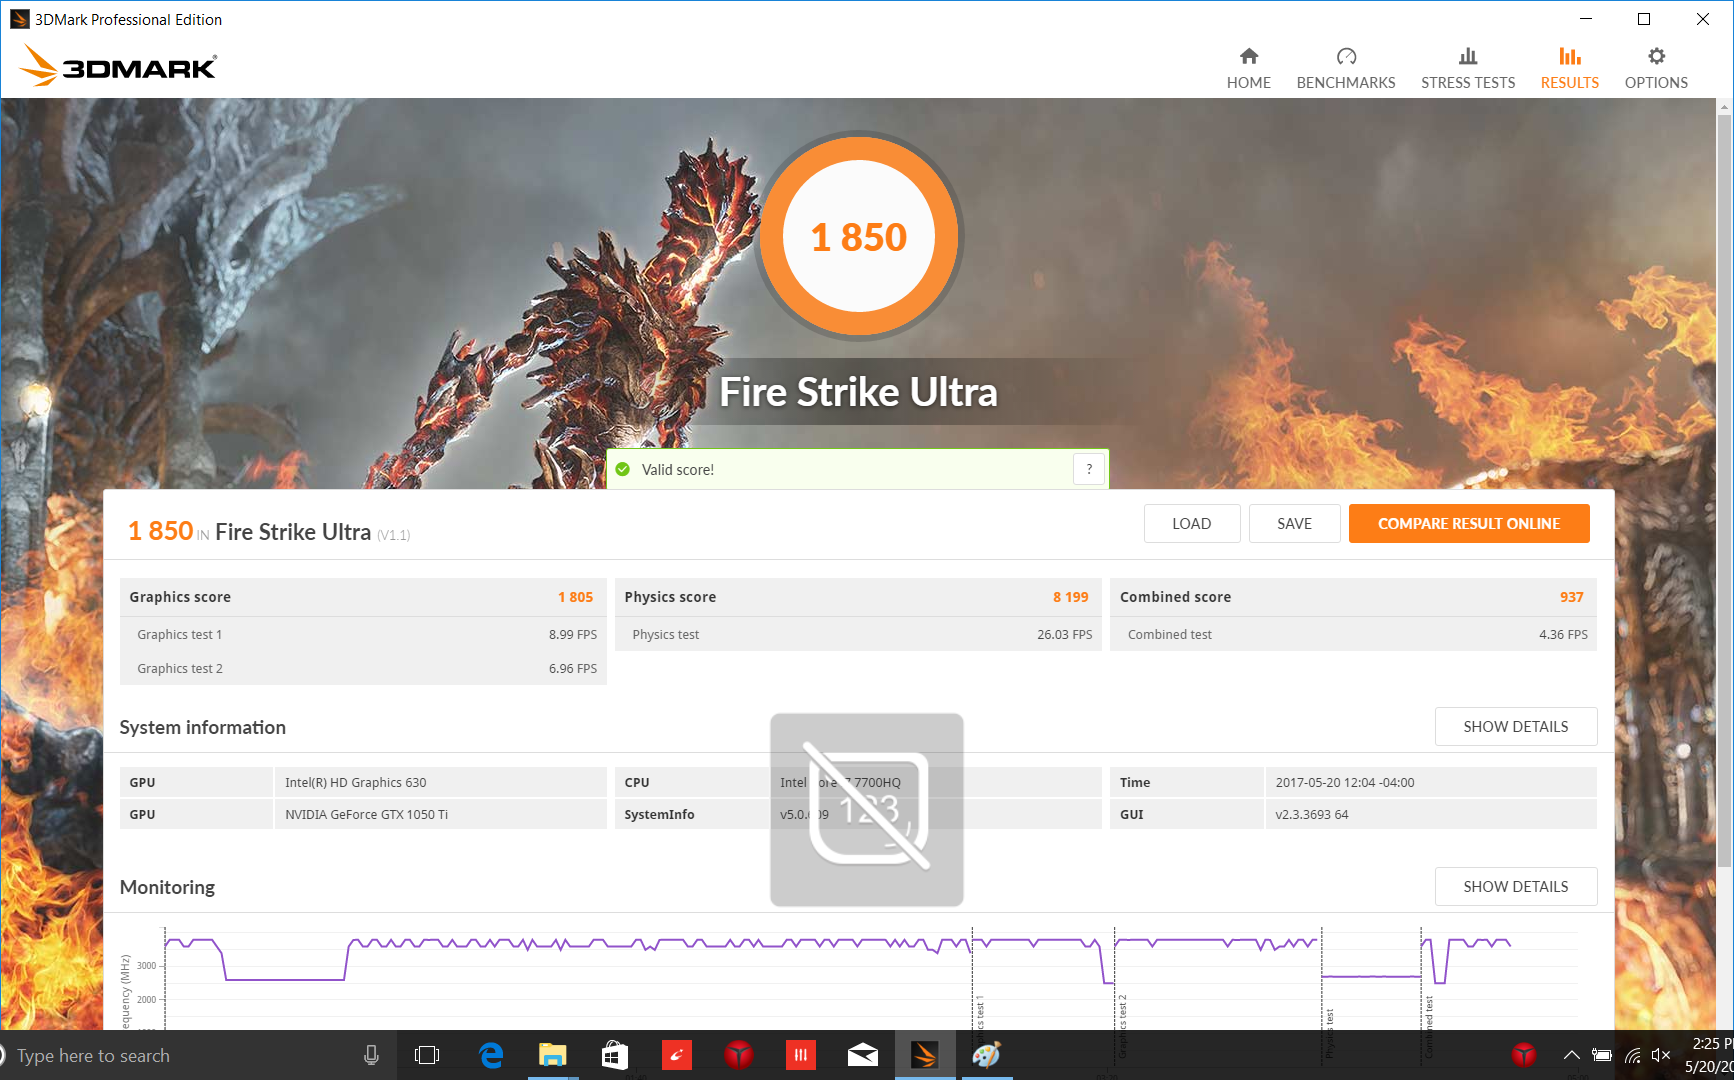
The performance of the GTX 1050 Ti essentially splits the difference between the GTX 1050 and GTX 1060, and that should be fine for most gaming purposes at 1080p resolution. The score of 7682 we received in Fire Strike Graphics is 45% below that of the GTX 1060 in the Legion Y720, but that still indicates a very capable machine nonetheless.

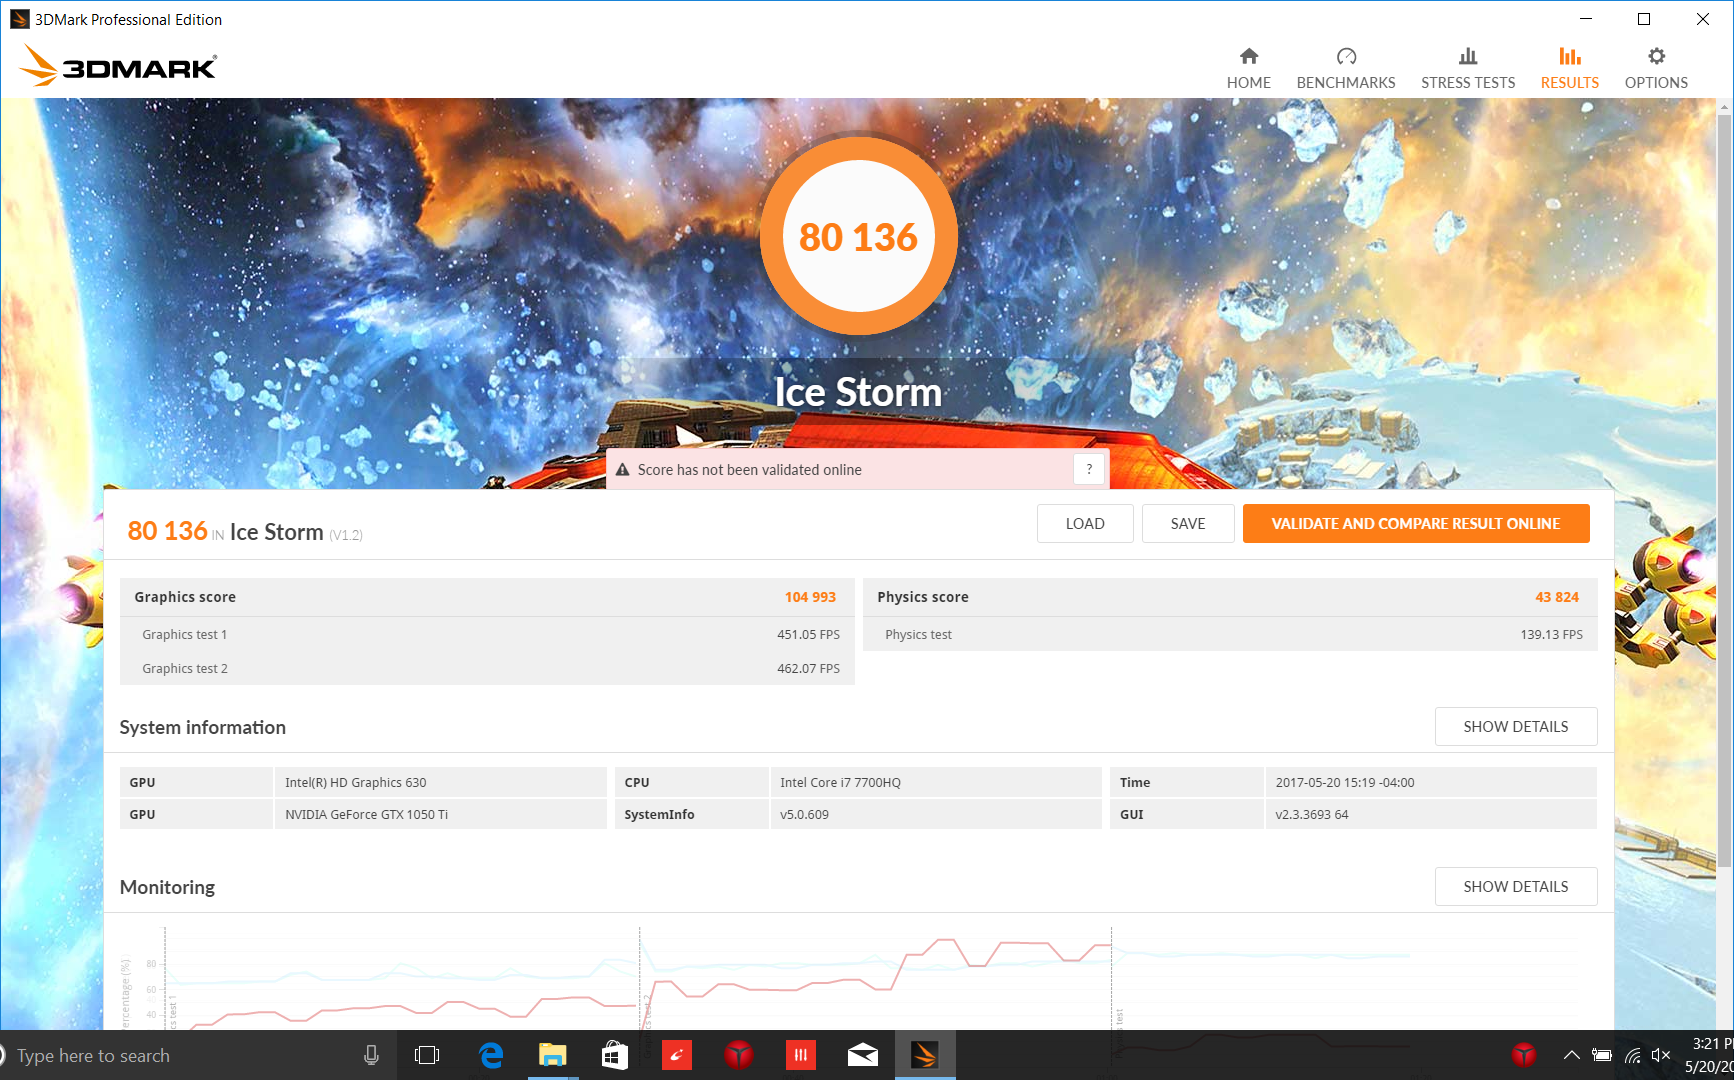
| 3DMark Ice Storm Standard Score | 80136 points | |
| 3DMark Cloud Gate Standard Score | 19356 points | |
| 3DMark Fire Strike Score | 6554 points | |
| 3DMark Fire Strike Extreme Score | 3492 points | |
Help | ||
Gaming Performance
Our benchmarks show that, as expected, most modern games are playable on high settings at the native resolution (1920x1080). However, the machine is not nearly as future-proofed as the Y720, which packs a GTX 1060 instead.
| Batman: Arkham Knight | |
| 3840x2160 High / On (Interactive Smoke & Paper Debris Off) AA:SM AF:8x (sort by value) | |
| MSI GS63VR 7RF-228US | |
| 1920x1080 High / On AA:SM AF:16x (sort by value) | |
| Lenovo Legion Y520-15IKBN-80WK001KUS | |
| Samsung Odyssey NP800G5M-X01US | |
| MSI GS63VR 7RF-228US | |
| 1920x1080 High / On (Interactive Smoke & Paper Debris Off) AA:SM AF:8x (sort by value) | |
| Lenovo Legion Y520-15IKBN-80WK001KUS | |
| Samsung Odyssey NP800G5M-X01US | |
| 1366x768 Normal / Off AF:4x (sort by value) | |
| Lenovo Legion Y520-15IKBN-80WK001KUS | |
| Samsung Odyssey NP800G5M-X01US | |
| 1280x720 Low / Off AF:Trilinear (sort by value) | |
| Lenovo Legion Y520-15IKBN-80WK001KUS | |
| Samsung Odyssey NP800G5M-X01US | |
| Rise of the Tomb Raider | |
| 3840x2160 High Preset AA:FX AF:4x (sort by value) | |
| MSI GS63VR 7RF-228US | |
| 1920x1080 Very High Preset AA:FX AF:16x (sort by value) | |
| Lenovo Legion Y520-15IKBN-80WK001KUS | |
| Samsung Odyssey NP800G5M-X01US | |
| MSI GS63VR 7RF-228US | |
| Asus ROG Strix GL553VD-DS71 | |
| Dell Inspiron 15 7000 7567 | |
| 1920x1080 High Preset AA:FX AF:4x (sort by value) | |
| Lenovo Legion Y520-15IKBN-80WK001KUS | |
| Samsung Odyssey NP800G5M-X01US | |
| Asus ROG Strix GL553VD-DS71 | |
| Dell Inspiron 15 7000 7567 | |
| 1366x768 Medium Preset AF:2x (sort by value) | |
| Lenovo Legion Y520-15IKBN-80WK001KUS | |
| Samsung Odyssey NP800G5M-X01US | |
| Dell Inspiron 15 7000 7567 | |
| 1024x768 Lowest Preset (sort by value) | |
| Lenovo Legion Y520-15IKBN-80WK001KUS | |
| Dell Inspiron 15 7000 7567 | |
| low | med. | high | ultra | |
|---|---|---|---|---|
| BioShock Infinite (2013) | 227 | 189 | 174 | 74 |
| The Witcher 3 (2015) | 38 | |||
| Batman: Arkham Knight (2015) | 113 | 101 | 64 | 41 |
| Rise of the Tomb Raider (2016) | 122 | 76 | 45 | 38 |
Stress Test
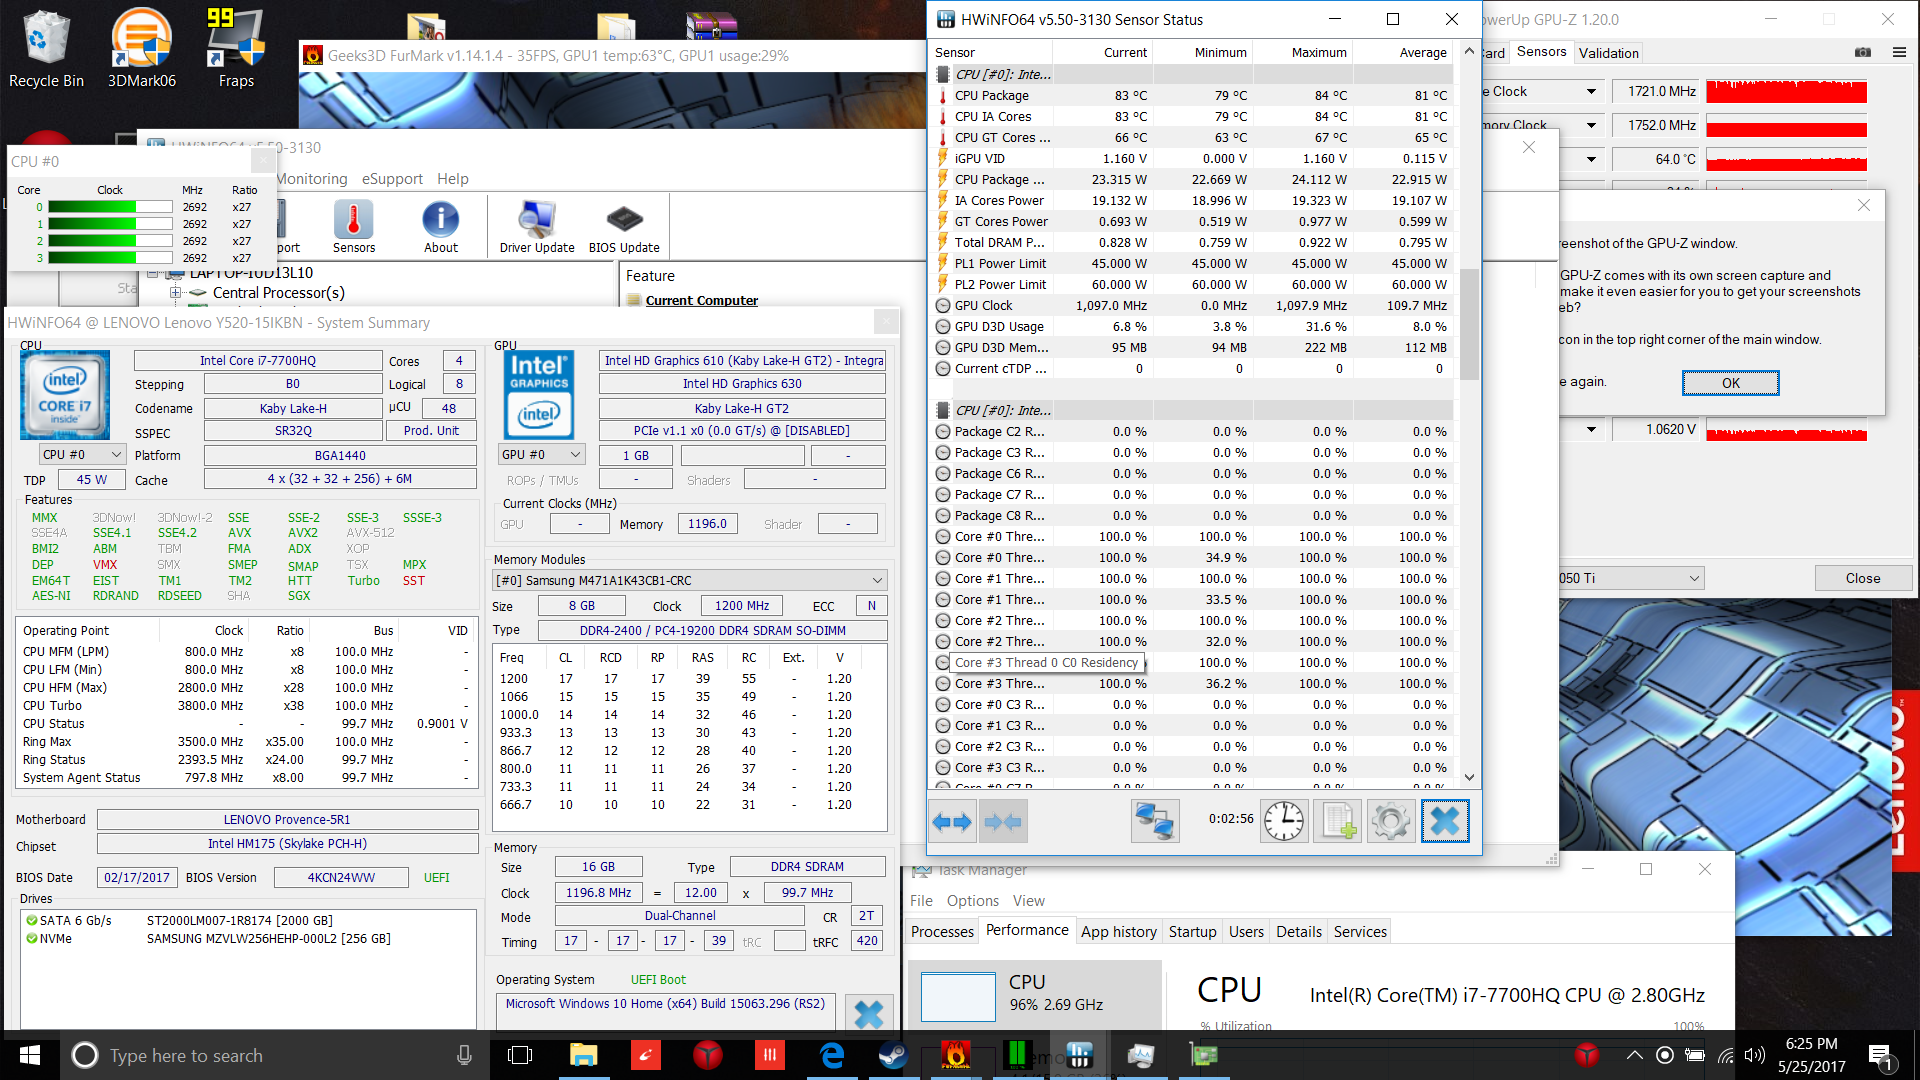
Our conventional stress testing regimen of weighing down a machine with FurMark and Prime95 is a great way of discerning just how far a machine can be pushed before it reaches its thermal and power consumption limits. In this test, we witnessed CPU clock rates stable at 2.7 GHz (never above) with temperatures of around 84 °C alongside GPU clock rates hovering within the 1700 MHz range (with a temperature of 65 °C). The CPU clock rate is actually slightly below the base frequency for the chip, which classifies the behavior as throttling. However, it is highly unlikely that the user will ever experience such conditions during real-world usage.
On the other hand, for a more realistic look at a device’s sustained performance (separate from our Cinebench R15 loop test we explored earlier), we turn to our new Witcher 3 Ultra stress test. Over the course of an hour, we tracked and graphed the FPS reported during the test, along with thermal data. During the test, CPU temperatures remained safely positioned in the 60 °C – 66 °C range, while GPU temperatures never exceeded 68 °C (sticking most of the time around the 66 °C mark). No thermal throttling of any type was reported by the system during the test.
Emissions
System Noise
Without Extreme Cooling enabled (which is most of the time, as the setting automatically reverts to off after a reboot or sleep/resume cycle), the Legion Y520 is a relatively unobtrusive machine. Even while under load, the average noise level we recorded was 40 dB(A) with a maximum of only 42.6 dB(A). That’s within a couple percentage points of the Y720’s values, and it’s considerably better than all of the rest of the notebooks in today’s comparison field—even including the Samsung Odyssey, which is only running a GTX 1050 (and which still is 23% louder on average under load).
While idling, although the fan does continue to run, it’s practically inaudible.
Noise level
| Idle |
| 30.5 / 30.5 / 30.6 dB(A) |
| Load |
| 40 / 42.6 dB(A) |
 | ||
30 dB silent 40 dB(A) audible 50 dB(A) loud |
||
min: | ||
| Lenovo Legion Y520-15IKBN-80WK001KUS GeForce GTX 1050 Ti Mobile, i7-7700HQ, Samsung PM961 MZVLW256HEHP | Lenovo Legion Y720 80VR002XGE GeForce GTX 1060 Mobile, i7-7700HQ, Samsung PM961 MZVLW256HEHP | Samsung Odyssey NP800G5M-X01US GeForce GTX 1050 Mobile, i7-7700HQ, Samsung PM961 NVMe MZVLW128HEGR | Asus ROG Strix GL553VD-DS71 GeForce GTX 1050 Mobile, i7-7700HQ, HGST Travelstar 7K1000 HTS721010A9E630 | Alienware 15 R3 GeForce GTX 1070 Mobile, i7-7700HQ | |
|---|---|---|---|---|---|
| Noise | -2% | -4% | -12% | -15% | |
| off / environment * (dB) | 27.7 | 30.3 -9% | 28.1 -1% | 30.6 -10% | 30 -8% |
| Idle Minimum * (dB) | 30.5 | 31 -2% | 28.1 8% | 33.4 -10% | 31 -2% |
| Idle Average * (dB) | 30.5 | 30.9 -1% | 29.1 5% | 33.4 -10% | 32 -5% |
| Idle Maximum * (dB) | 30.6 | 31.5 -3% | 29.1 5% | 33.4 -9% | 42 -37% |
| Load Average * (dB) | 40 | 38.7 3% | 49.2 -23% | 46.5 -16% | 49 -23% |
| Witcher 3 ultra * (dB) | 40 | 42 -5% | |||
| Load Maximum * (dB) | 42.6 | 41.9 2% | 49.2 -15% | 49.6 -16% | 50 -17% |
* ... smaller is better
Temperature
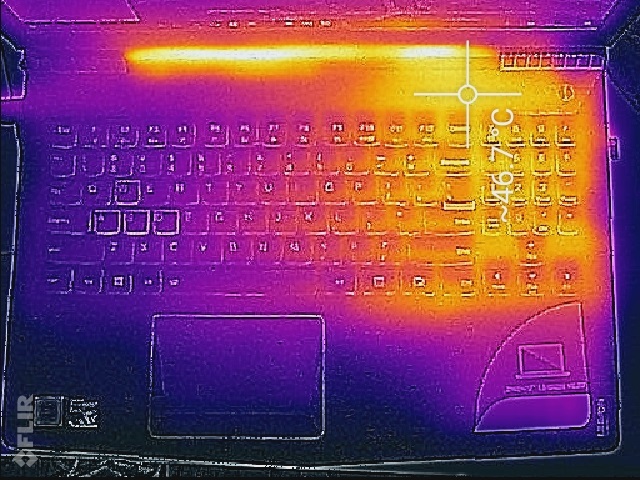
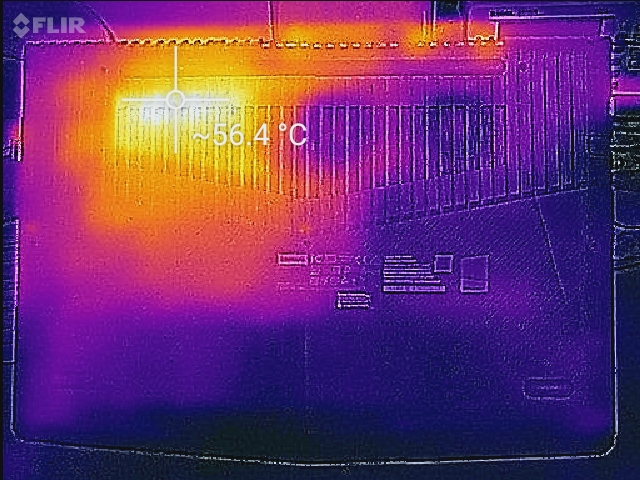
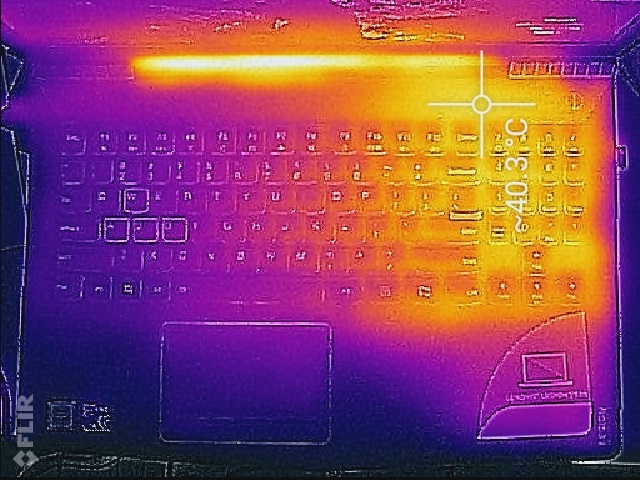
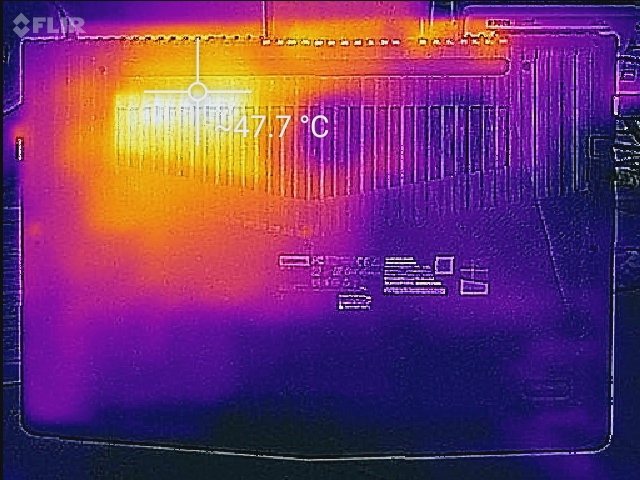
Even alongside the Legion Y520’s low noise levels, temperature development still remains mostly unproblematic. Under max load, we measured average temperatures of 30.7 °C / 29.9 °C on top/bottom respectively (against an ambient room temperature of 21 °C), which is extremely reasonable for a gaming notebook. The palm rests also remain cool, with only the number pad exhibiting any noticeable thermal development (at 40.6 °C). The only hot spot worth mentioning is the top left quadrant of the underside of the notebook, which reached 55.8 °C and would be rather uncomfortable if resting on the lap.
Idle temperatures were only slightly higher than ambient ones, with readings of 25.1 °C / 24.7 °C on top/bottom, respectively.
(-) The maximum temperature on the upper side is 46.8 °C / 116 F, compared to the average of 40.4 °C / 105 F, ranging from 21.2 to 68.8 °C for the class Gaming.
(-) The bottom heats up to a maximum of 55.8 °C / 132 F, compared to the average of 43.2 °C / 110 F
(+) In idle usage, the average temperature for the upper side is 25.1 °C / 77 F, compared to the device average of 33.9 °C / 93 F.
(+) Playing The Witcher 3, the average temperature for the upper side is 28 °C / 82 F, compared to the device average of 33.9 °C / 93 F.
(+) The palmrests and touchpad are cooler than skin temperature with a maximum of 27.2 °C / 81 F and are therefore cool to the touch.
(±) The average temperature of the palmrest area of similar devices was 28.8 °C / 83.8 F (+1.6 °C / 2.8 F).
Speakers
The Legion Y520 features two top-mounted speakers flanking the central hinge beneath the display, and for the most part, they sound pretty balanced (apart from a predictable lack of bass). The included Dolby Audio software applies an annoying reverb effect by default as a part of its Surround Virtualizer feature, which we immediately disabled. The Volume Leveler feature is perhaps more useful, though while gaming with headphones especially you’ll want to disable it for full dynamic effect.
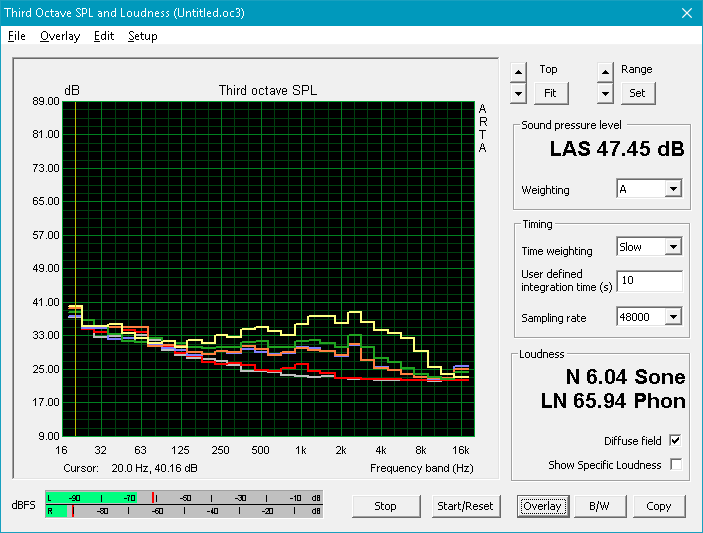
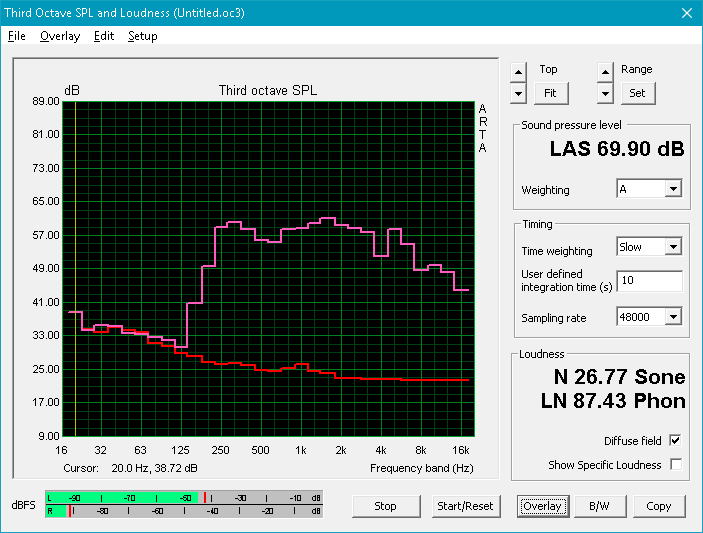
Lenovo Legion Y520-15IKBN-80WK001KUS audio analysis
(-) | not very loud speakers (71.9 dB)
Bass 100 - 315 Hz
(±) | reduced bass - on average 13.9% lower than median
(-) | bass is not linear (15.9% delta to prev. frequency)
Mids 400 - 2000 Hz
(+) | balanced mids - only 2.2% away from median
(+) | mids are linear (3.8% delta to prev. frequency)
Highs 2 - 16 kHz
(+) | balanced highs - only 3.7% away from median
(±) | linearity of highs is average (10.7% delta to prev. frequency)
Overall 100 - 16.000 Hz
(±) | linearity of overall sound is average (22.4% difference to median)
Compared to same class
» 80% of all tested devices in this class were better, 6% similar, 14% worse
» The best had a delta of 6%, average was 18%, worst was 132%
Compared to all devices tested
» 66% of all tested devices were better, 6% similar, 29% worse
» The best had a delta of 4%, average was 23%, worst was 134%
Alienware 15 R3 audio analysis
(+) | speakers can play relatively loud (82 dB)
Bass 100 - 315 Hz
(-) | nearly no bass - on average 19.1% lower than median
(±) | linearity of bass is average (10.4% delta to prev. frequency)
Mids 400 - 2000 Hz
(±) | higher mids - on average 6.7% higher than median
(±) | linearity of mids is average (7.5% delta to prev. frequency)
Highs 2 - 16 kHz
(+) | balanced highs - only 3.6% away from median
(+) | highs are linear (5.2% delta to prev. frequency)
Overall 100 - 16.000 Hz
(±) | linearity of overall sound is average (21.6% difference to median)
Compared to same class
» 77% of all tested devices in this class were better, 5% similar, 18% worse
» The best had a delta of 6%, average was 18%, worst was 132%
Compared to all devices tested
» 61% of all tested devices were better, 7% similar, 32% worse
» The best had a delta of 4%, average was 23%, worst was 134%
Frequency Comparison (Checkbox selectable!)
Graph 1: Pink Noise 100% Vol.; Graph 2: Audio off
Energy Management
Power Consumption
The Legion Y520 manages lower power consumption than just about every other laptop in our field apart from the Samsung Odyssey, with which it’s essentially neck-and-neck (and which only features a GTX 1050). The idle average consumption of 9.1 W is very reasonable for its size and class, and even under load, the average of 79.9 W isn’t bad. We measured a load maximum value of 121.5 W, which is well below the power adapter capacity of 135 W. Hopefully these values will lead to respectable battery life figures.
| Off / Standby | |
| Idle | |
| Load |
|
Key:
min: | |
| Lenovo Legion Y520-15IKBN-80WK001KUS i7-7700HQ, GeForce GTX 1050 Ti Mobile, Samsung PM961 MZVLW256HEHP, IPS, 1920x1080, 15.6" | Lenovo Legion Y720 80VR002XGE i7-7700HQ, GeForce GTX 1060 Mobile, Samsung PM961 MZVLW256HEHP, IPS, 1920x1080, 15.6" | Samsung Odyssey NP800G5M-X01US i7-7700HQ, GeForce GTX 1050 Mobile, Samsung PM961 NVMe MZVLW128HEGR, IPS, 1920x1080, 15.6" | Asus ROG Strix GL553VD-DS71 i7-7700HQ, GeForce GTX 1050 Mobile, HGST Travelstar 7K1000 HTS721010A9E630, IPS, 1920x1080, 15.6" | Alienware 15 R3 i7-7700HQ, GeForce GTX 1070 Mobile, , TN, 1920x1080, 15.6" | |
|---|---|---|---|---|---|
| Power Consumption | -8% | 3% | -10% | -108% | |
| Idle Minimum * (Watt) | 8.5 | 8 6% | 6.7 21% | 7.7 9% | 19 -124% |
| Idle Average * (Watt) | 9.1 | 10.9 -20% | 8.9 2% | 11.7 -29% | 23 -153% |
| Idle Maximum * (Watt) | 9.7 | 11.8 -22% | 10.8 -11% | 12 -24% | 29 -199% |
| Load Average * (Watt) | 79.9 | 70 12% | 81.8 -2% | 80.5 -1% | 85 -6% |
| Witcher 3 ultra * (Watt) | 97.7 | 102 -4% | 92.2 6% | ||
| Load Maximum * (Watt) | 121.5 | 148 -22% | 122.7 -1% | 128.4 -6% | 192 -58% |
* ... smaller is better
Battery Life
Unfortunately, the 45 Wh 3-cell battery in our review unit doesn’t do the device any favors in this department. There are also no upgraded sizes available for the Y520, so those looking for better battery life would be happier with the Y720 instead (which packs a 33% larger 60 Wh battery). Fortunately, most users probably don’t mind this, seeing as a gaming PC even as portable as this one still generally remains a gaming PC these days; it’s unlikely that it will be meant to replace the Dell XPS 13s and HP Spectres of modern-day computing.
Our Wi-Fi Surfing benchmark lasted for just 4 hours on the Legion Y520, enough to get you through a brief trip or for some occasional unplugged use around the house. Under load, the Y520 succumbed in just 46 minutes, while the Battery Eater Pro Reader’s Test went for 8 hours and 29 minutes.


| Lenovo Legion Y520-15IKBN-80WK001KUS i7-7700HQ, GeForce GTX 1050 Ti Mobile, 45 Wh | Lenovo Legion Y720 80VR002XGE i7-7700HQ, GeForce GTX 1060 Mobile, 60 Wh | Samsung Odyssey NP800G5M-X01US i7-7700HQ, GeForce GTX 1050 Mobile, 43 Wh | MSI GS63VR 7RF-228US i7-7700HQ, GeForce GTX 1060 Mobile, 65 Wh | Asus ROG Strix GL553VD-DS71 i7-7700HQ, GeForce GTX 1050 Mobile, 48 Wh | Alienware 15 R3 i7-7700HQ, GeForce GTX 1070 Mobile, 99 Wh | |
|---|---|---|---|---|---|---|
| Battery runtime | 49% | 31% | 12% | 0% | 33% | |
| Reader / Idle (h) | 8.5 | 11.8 39% | 10.2 20% | 6.4 -25% | 7.3 -14% | 6.4 -25% |
| WiFi v1.3 (h) | 4 | 6.3 58% | 4.4 10% | 3.9 -2% | 4.6 15% | 4.4 10% |
| Load (h) | 0.8 | 1.2 50% | 1.3 63% | 1.3 63% | 0.8 0% | 1.7 113% |
Pros
Cons
Verdict
The Lenovo Legion Y520 is a good choice for a gamer on a budget. It features solid CPU and GPU performance, relatively easy maintenance and upgradeability, and good input devices. While construction and styling obviously was forced to subordinate to raw functionality, the sacrifices will soon be forgotten if the machine is mostly used around the house anyway… and the price ($1,060 as configured) certainly doesn’t hurt, either.
The NVIDIA GTX 1050 Ti is a far cry from the GTX 1070/1080 adapters we find in higher-end gaming notebooks, but it should be able to handle most modern games at 1080p resolution and high settings with respectable framerates. Stability under sustained gaming loads (as well as heavy CPU operation) is very good overall, revealing no signs of weakness in the realm of thermal management. And the Y520 configuration we evaluated today is also well equipped in the storage department, with an extremely fast 256 GB NVMe SSD supplemented by a 2 TB secondary mechanical hard drive.
The Lenovo Legion Y520 is a good choice for a gamer on a budget. It’s fast, it’s reliable and stable, and it provides the basics at a significant discount over higher-end models.
The biggest drawback here is the lack of available GPU upgrade options—though we suppose it’s hardly a surprise given the existence of the Y720 as the logical next step up. Apart from the merely midrange GPU capabilities, however, the Y520 does cut a few other notable corners to reach its goal of affordability in the gaming sector. The first of those is the aforementioned construction and design; gone are the rigid metal surfaces and RGB zoned keyboard backlighting options of the Y720—the Y520 is all plastic and unapologetically red and black. Other notebooks, such as the ASUS ROG Strix GL553VD, emphasize casing and design quality over other items, and so they feature some of the higher-end design and bells and whistles that are absent from the all-business Y520. The other significant disappointment is the screen, which—while decent—lacks in brightness and color saturation. Again, the Y720 offers upgrade options, while the Y520 doesn’t.
For a few hundred bucks more, the Y720 may prove an even more compelling package (depending on budget). And other machines, such as the Dell Inspiron 15 7567, are comparably-priced and also worth a look. But for what it is, the Y520 succeeds well enough. It’s fast, it’s reliable and stable, and it provides the basics at a significant discount over higher-end models.
Lenovo Legion Y520-15IKBN-80WK001KUS
- 05/26/2017 v6 (old)
Steve Schardein
Price comparison
