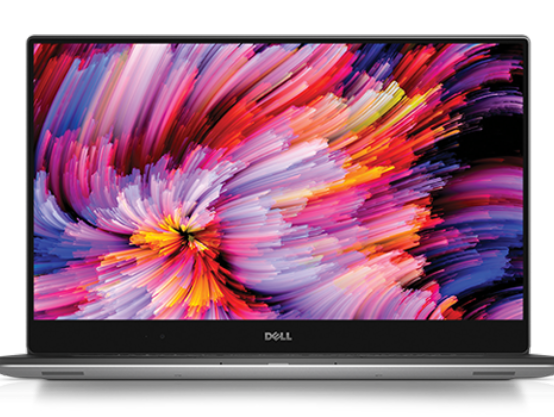
Dell XPS 15 9560 (i7-7700HQ, UHD) Laptop Review

Dell wasted no time in making available the refreshed XPS 15 9560 now that the GTX 1050 and 1050 Ti have been made official. When compared to the XPS 15 9550, the 9560 has updated both the Skylake CPU and Maxwell GPU to the appropriate Kaby Lake and Pascal processors.
Most everything else about the XPS 15 9560, however, remains essentially identical to last year's model. As such, we recommend checking out our first XPS 15 9560 review and our previous XPS 15 9550 pages for more details on the chassis and hardware. Our latest 9560 test unit carries a faster i7-7700HQ CPU, a higher resolution 4K UHD glossy touchscreen, and a larger 97 Wh battery compared to the i5-7300HQ, matte FHD display, and 56 Wh battery on our first SKU. The configuration in review runs for about $400 to $500 more than our i5-7300HQ unit, so we'll be diving into the benefits as well the drawbacks of this pricier SKU.
Case
The chassis remains unchanged from the previous few iterations of the series. This is far from being a complaint as build quality remains top notch with no noticeable defects or unintended gaps on our test unit. Both the aluminum base and lid are very resistant to twists and depressions and the edge-to-edge Gorilla Glass on the touchscreen SKUs adds another layer of rigidity to an already sturdy design. Surfaces are not as stiff compared to the MacBook Pro 15 and certain Latitude models with Dell's Tri-Metal design, but the XPS 15 chassis still holds up very well in the multimedia consumer segment.
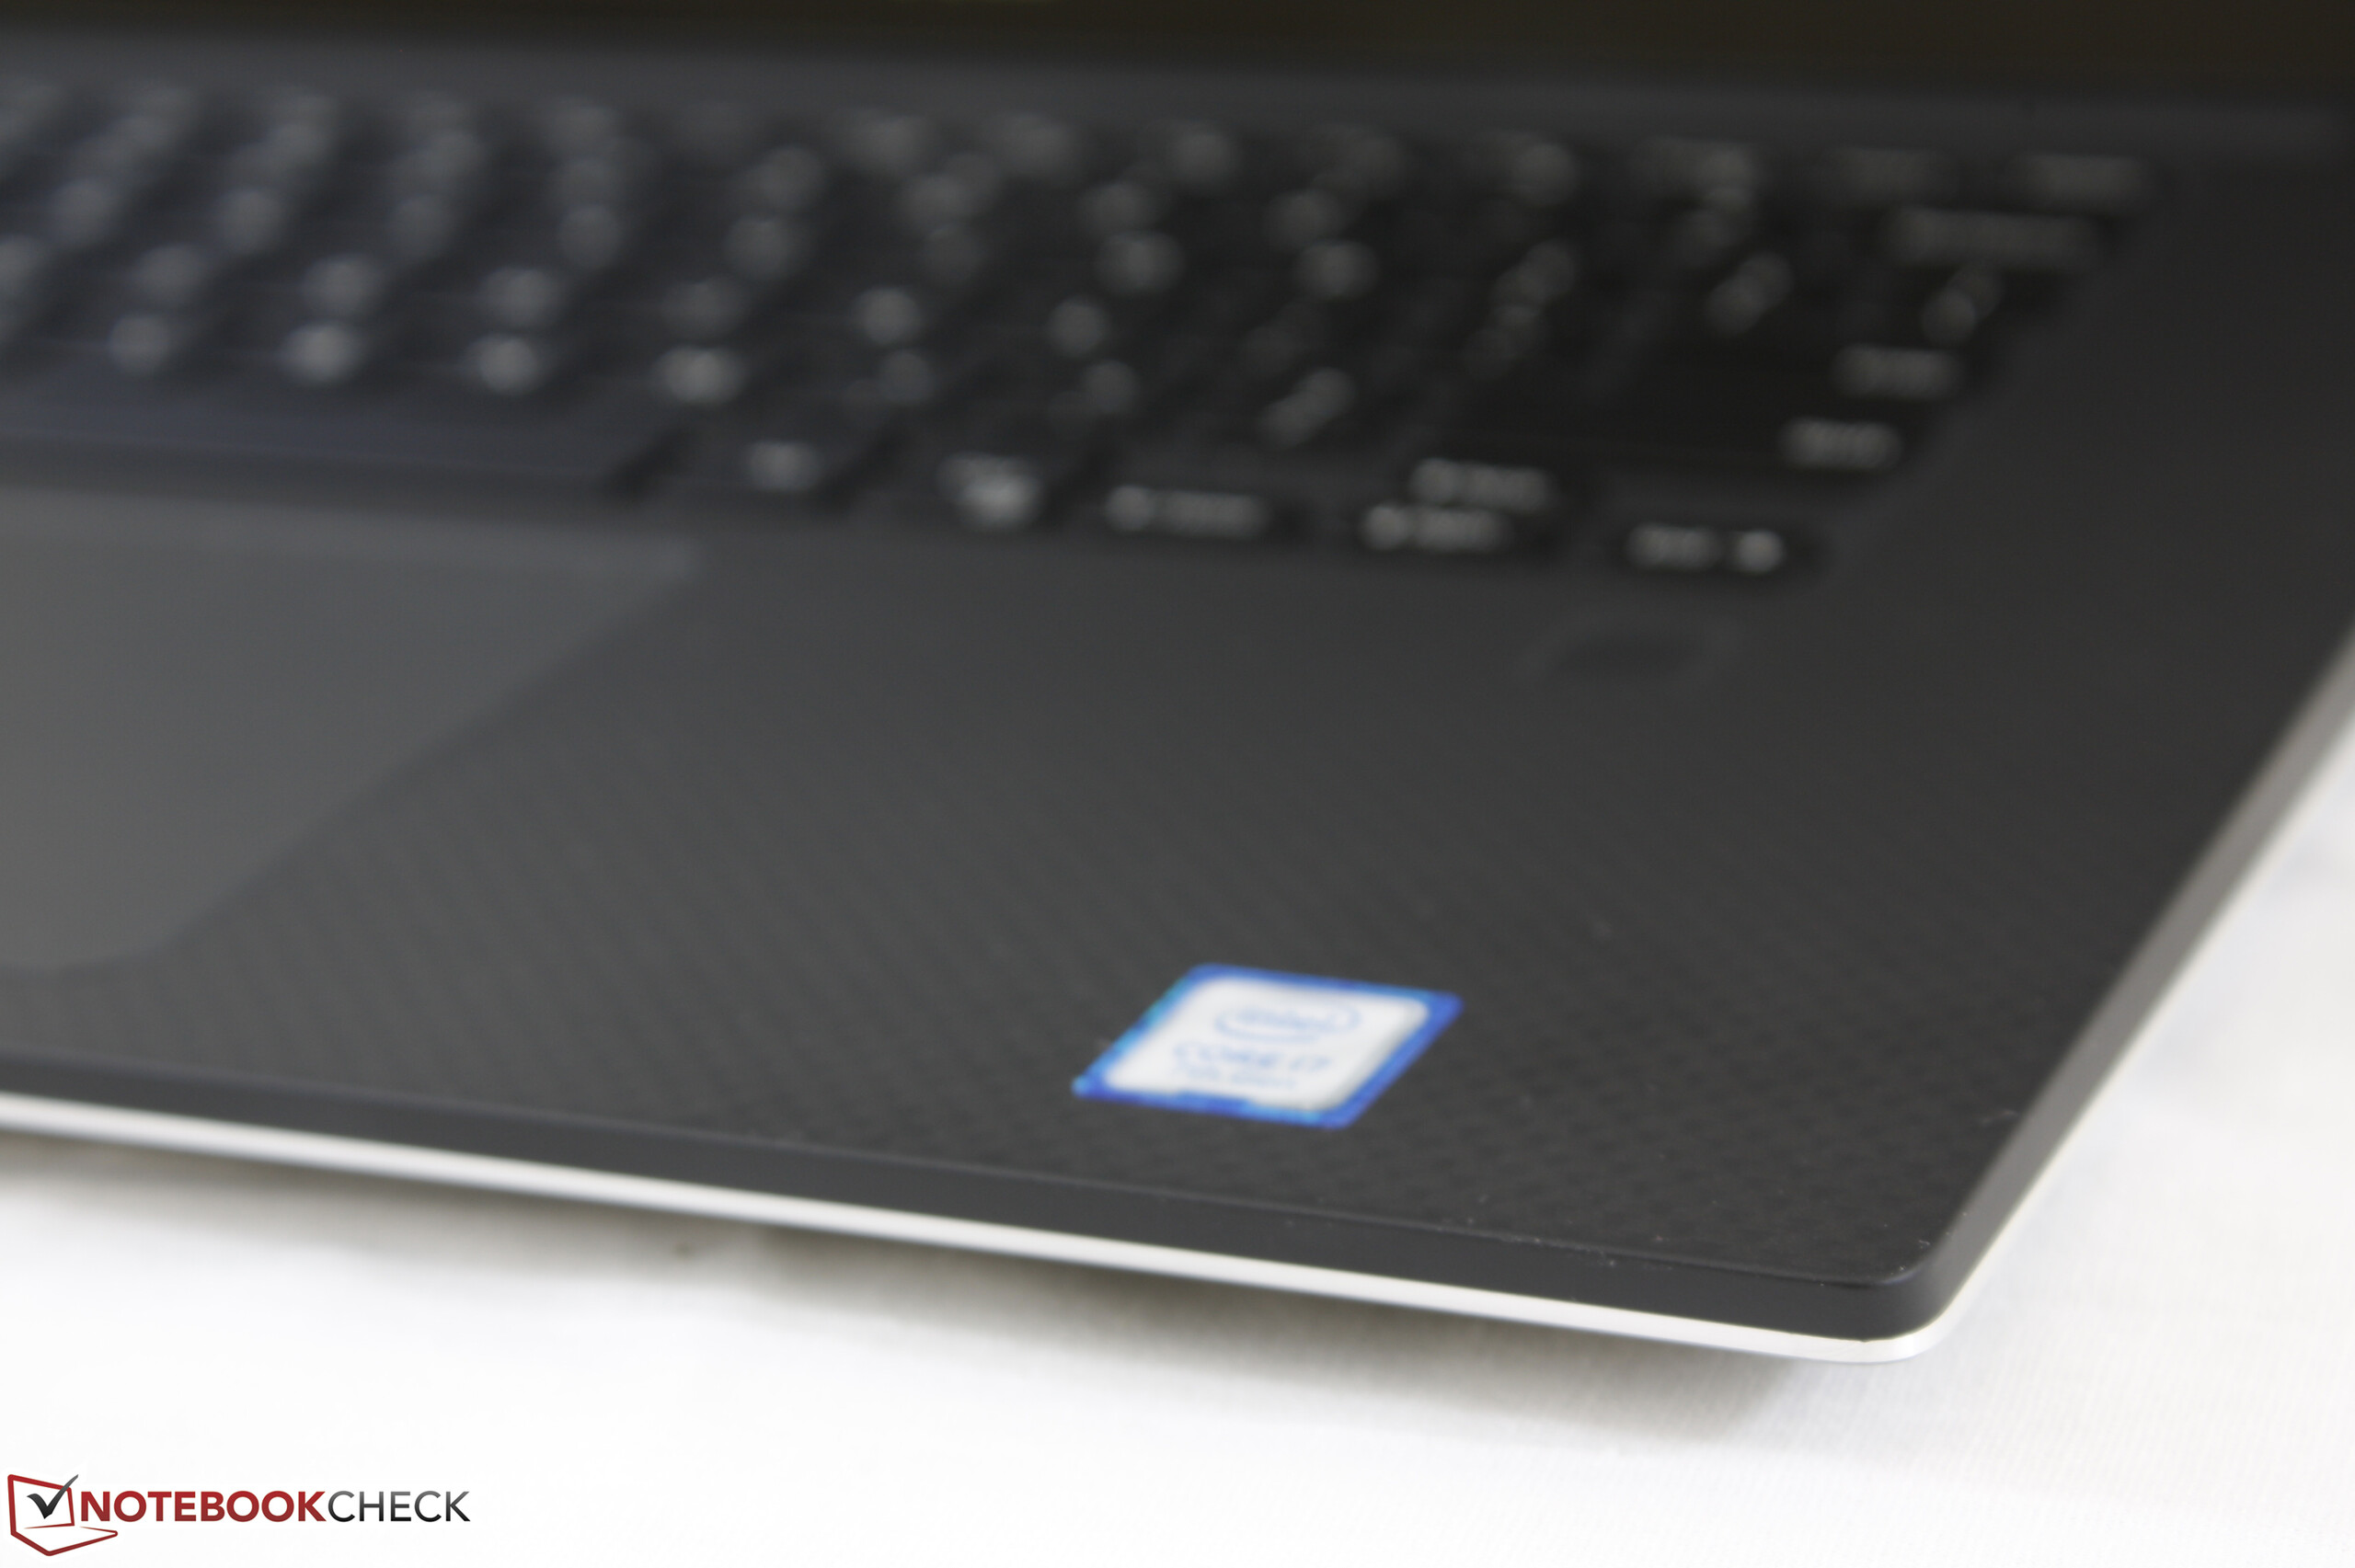
Noticeable downsides to the chassis are mostly superficial. The trackpad, carbon fiber palm rests, and black plastic keys all attract fingerprints and grease very easily. Additionally, the infamous suboptimal webcam placement will continue to irk some users; Perhaps a 360-degree hinge like the recent XPS 13 2-in-1 can solve the issue.
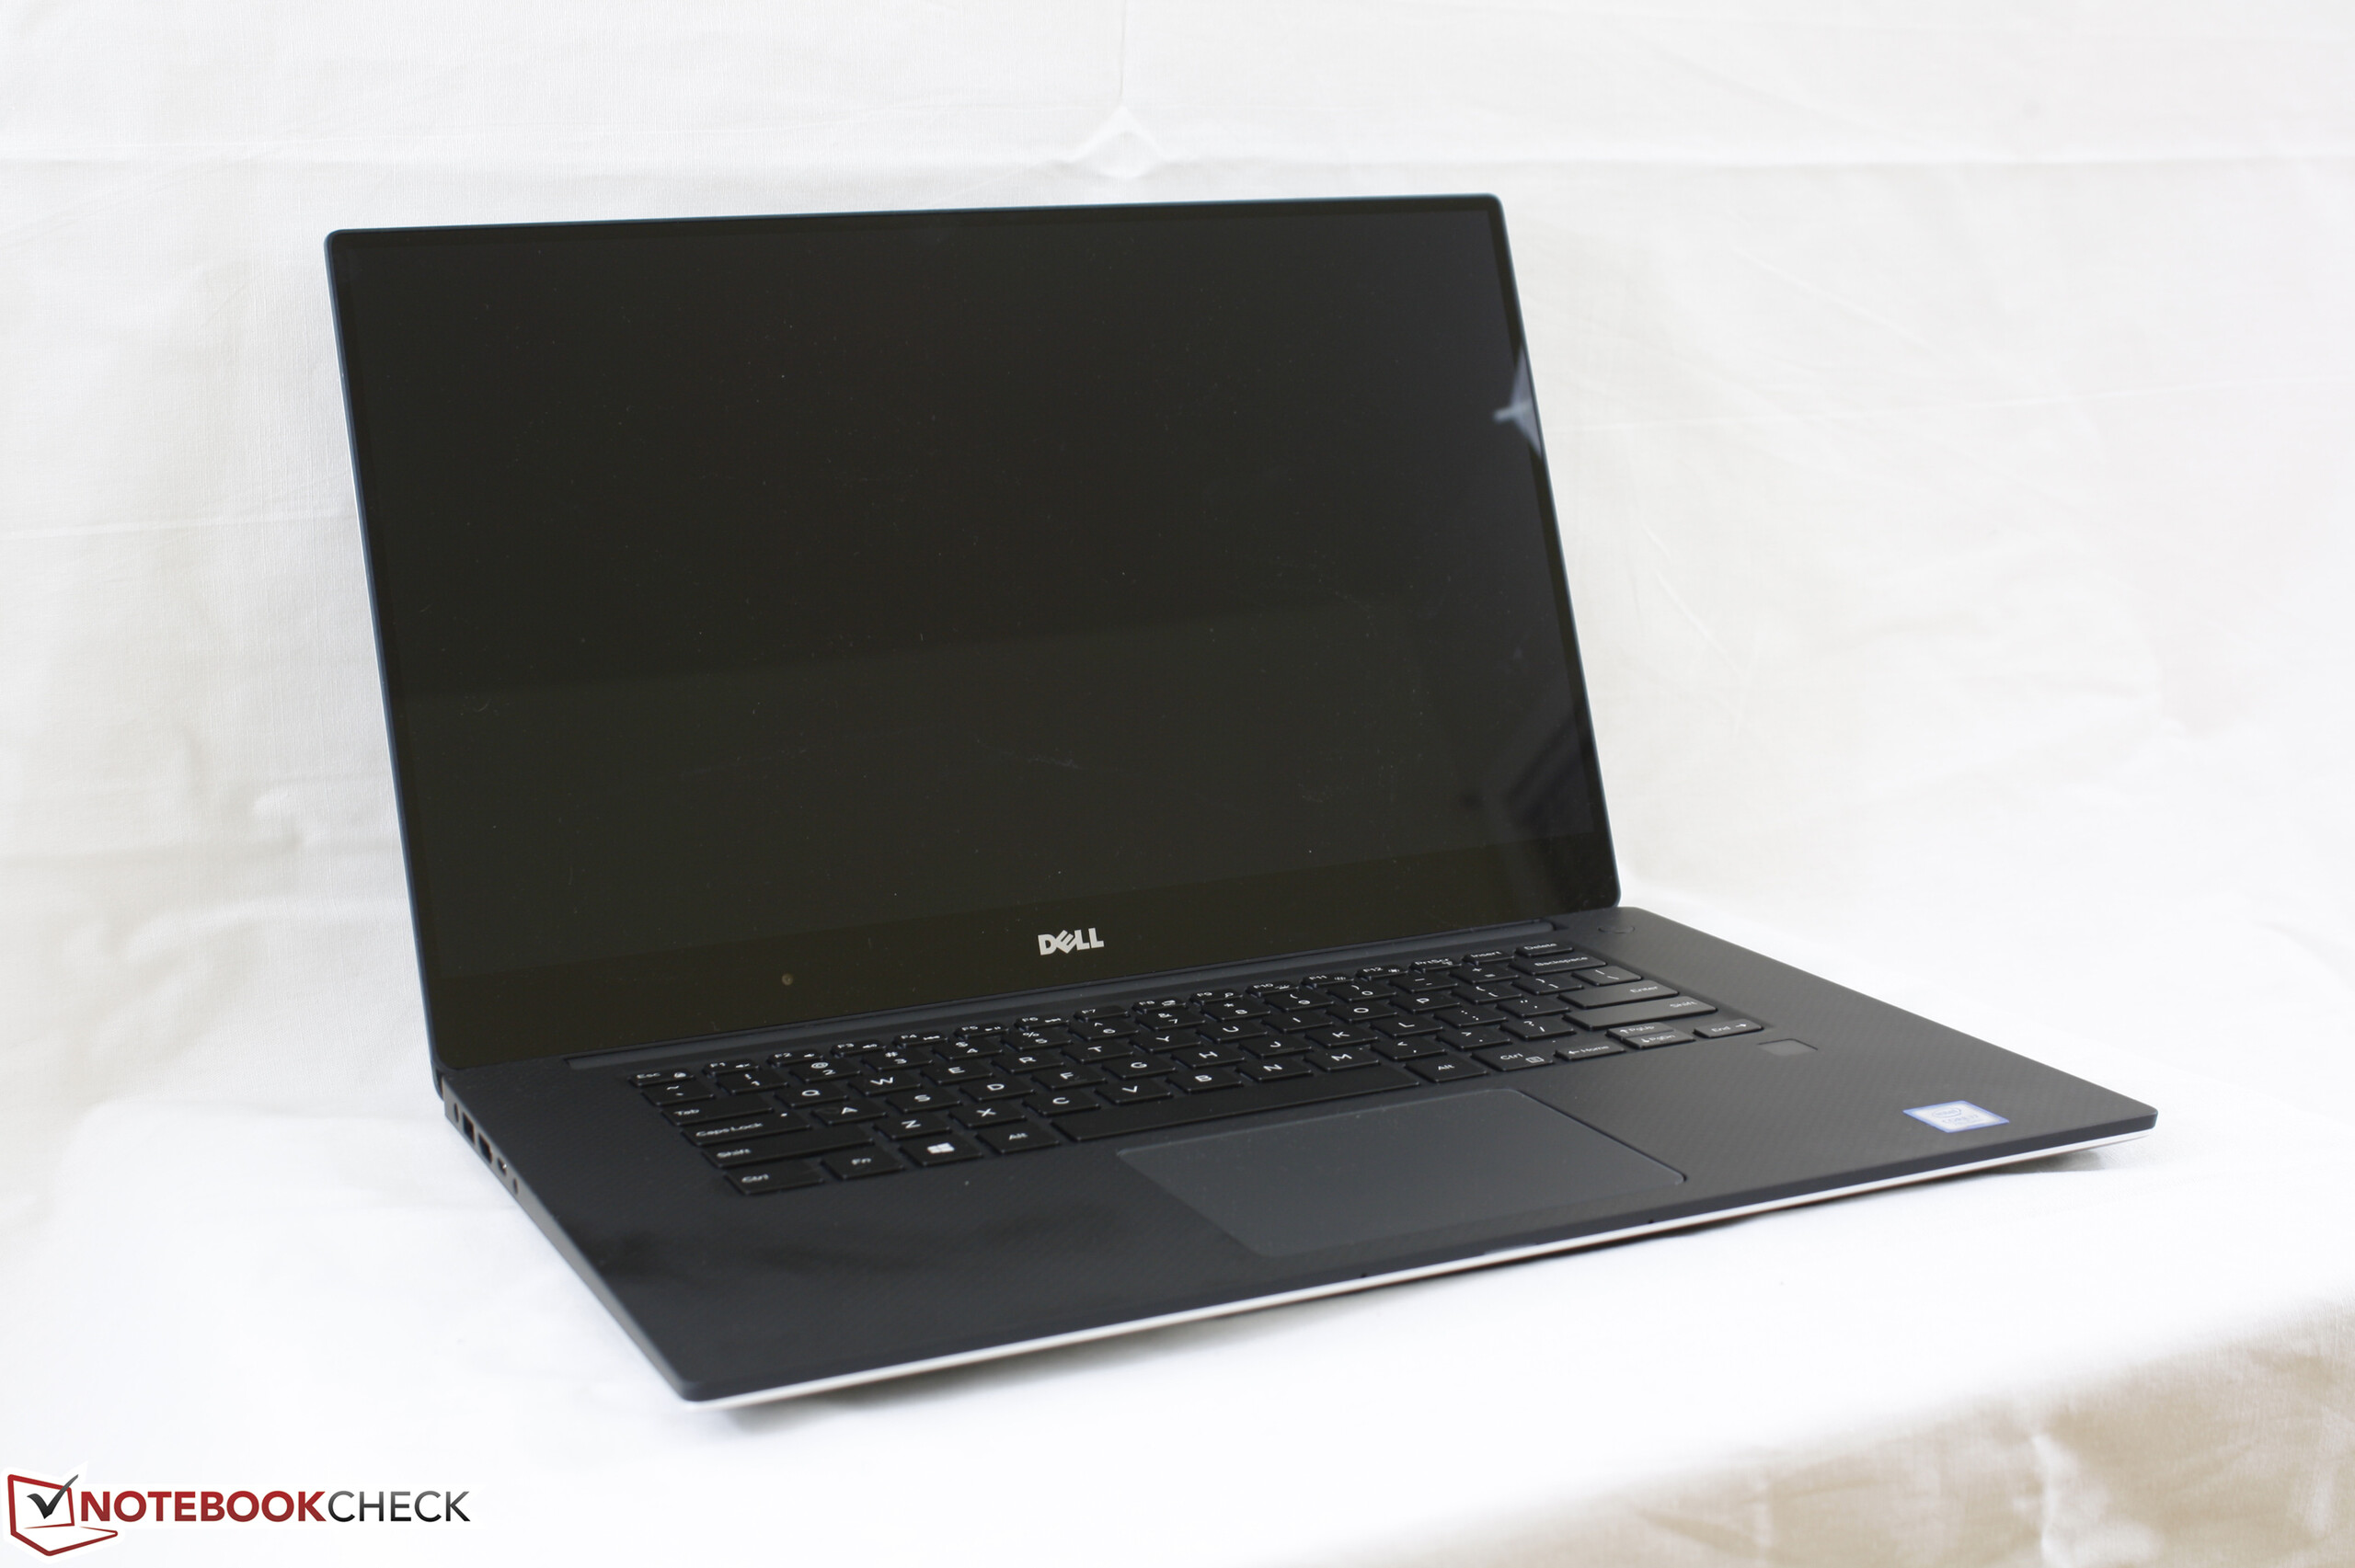
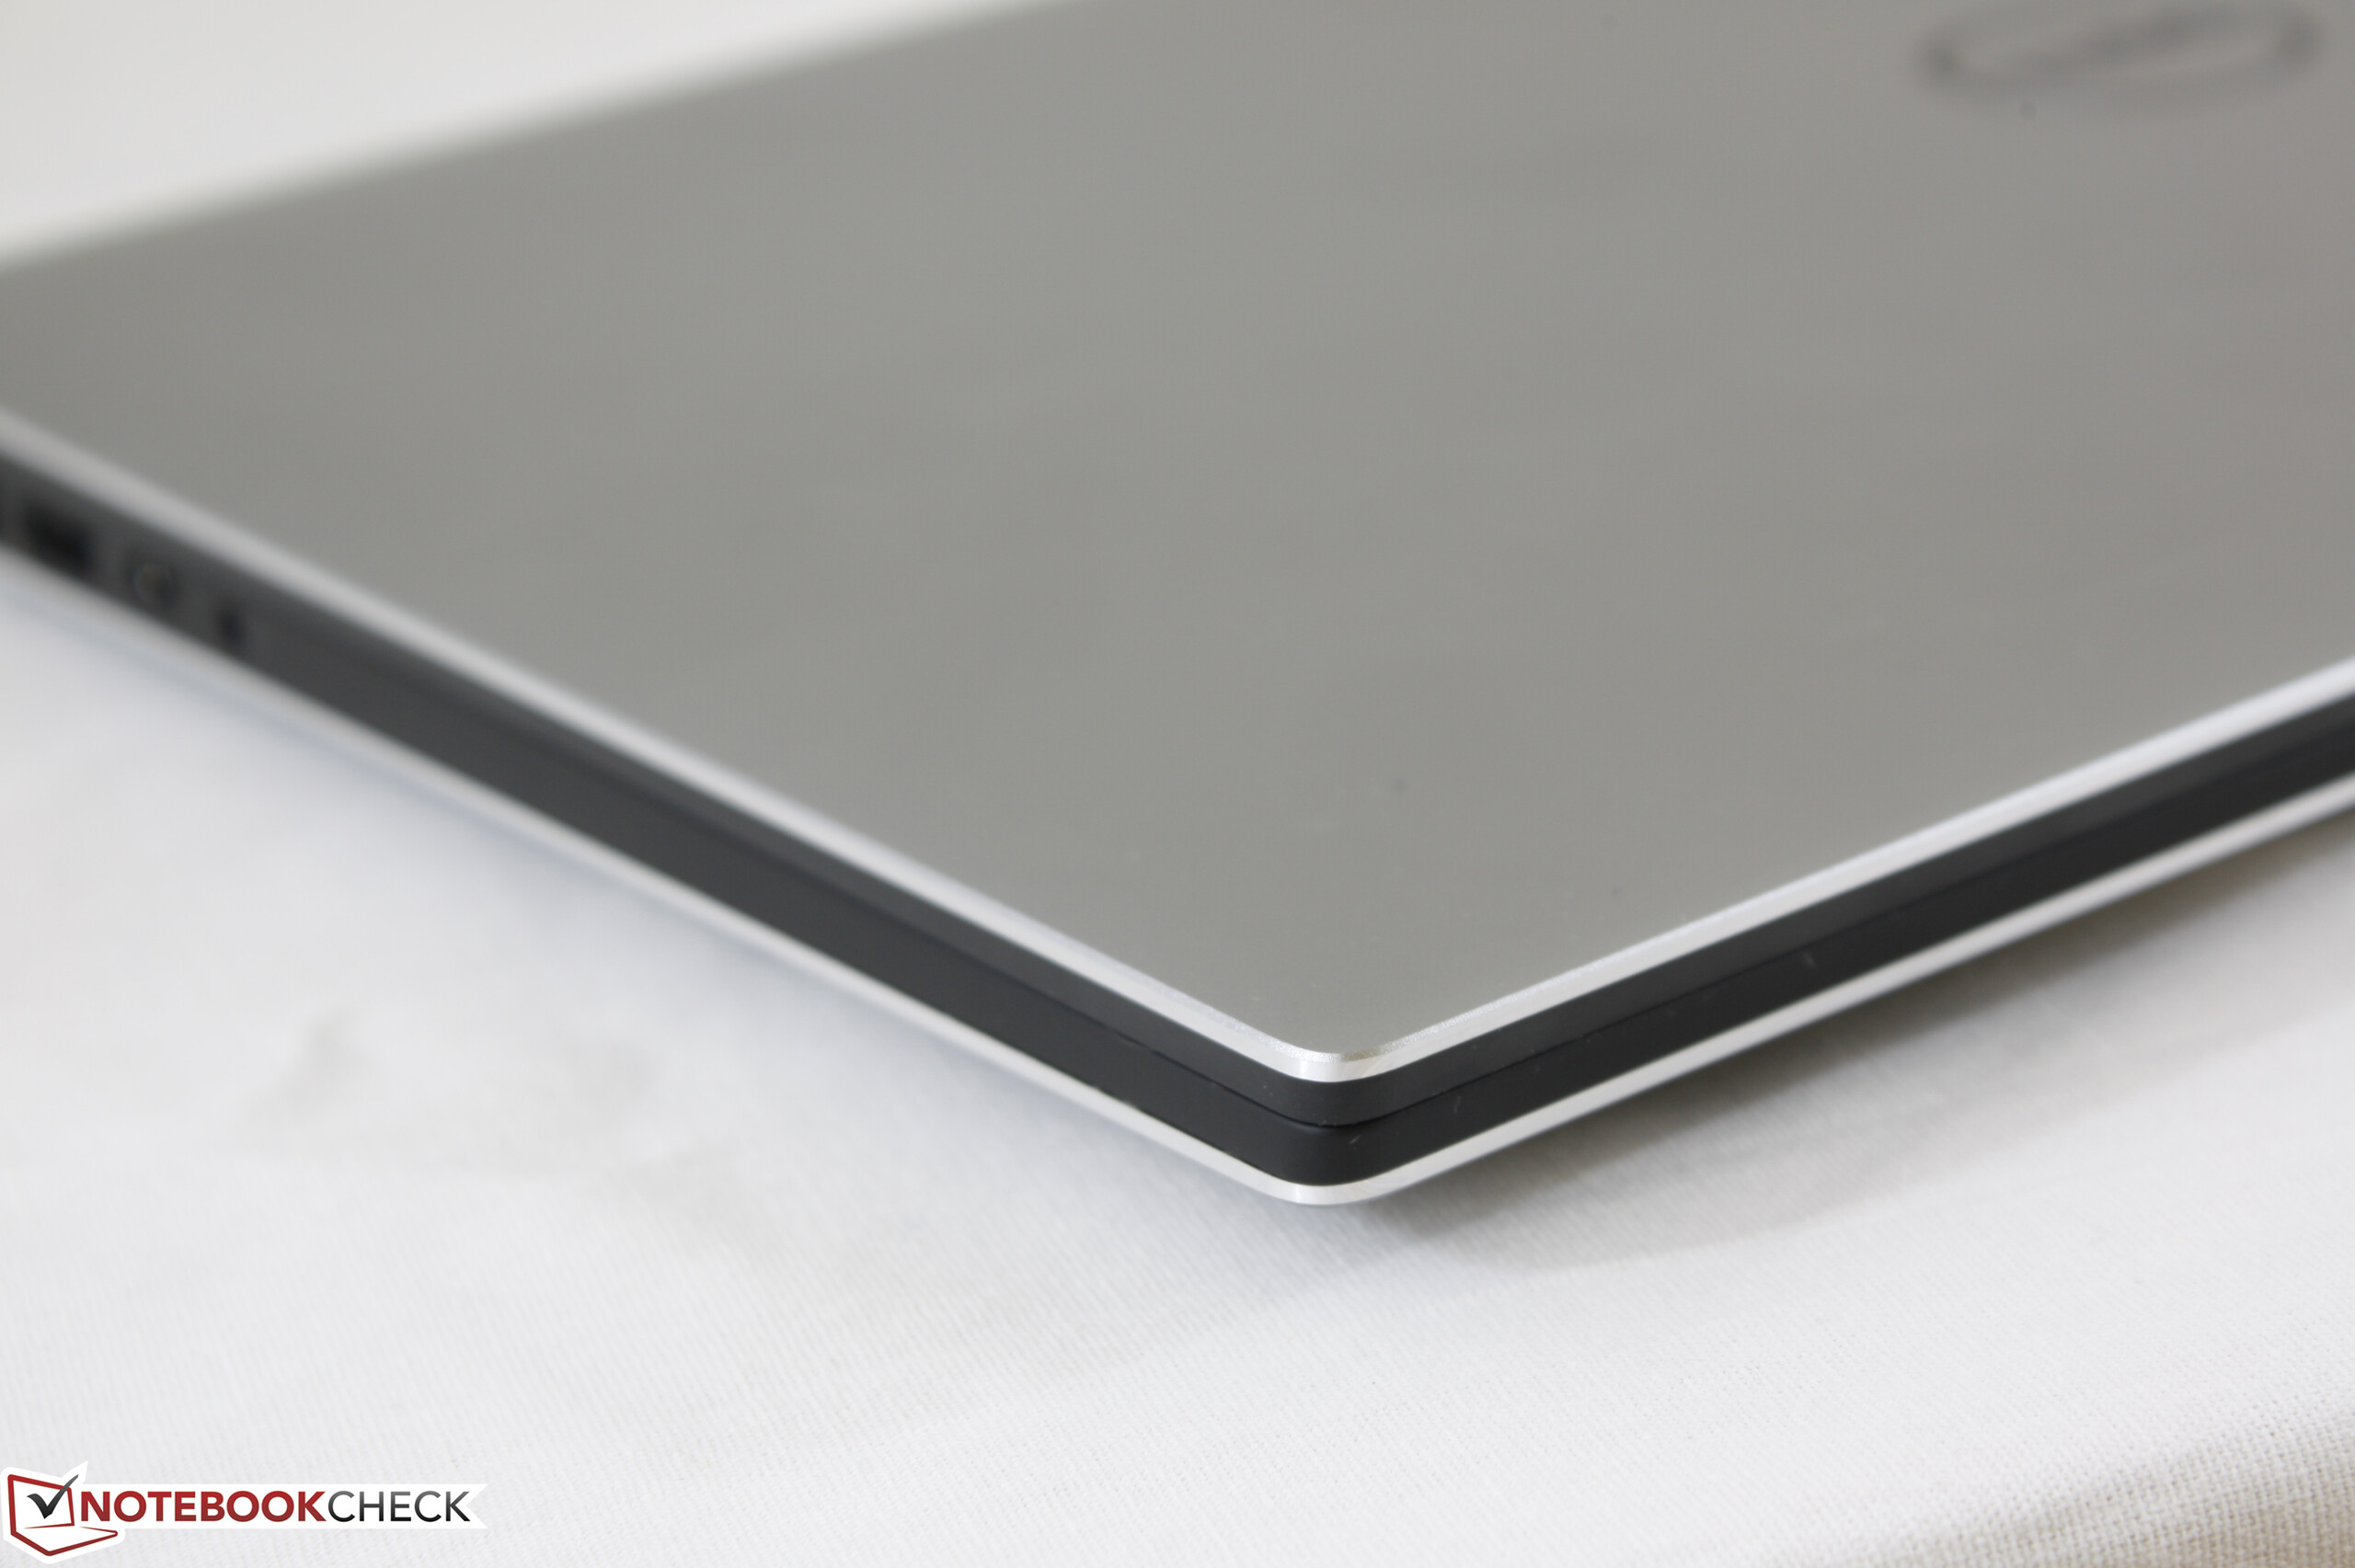

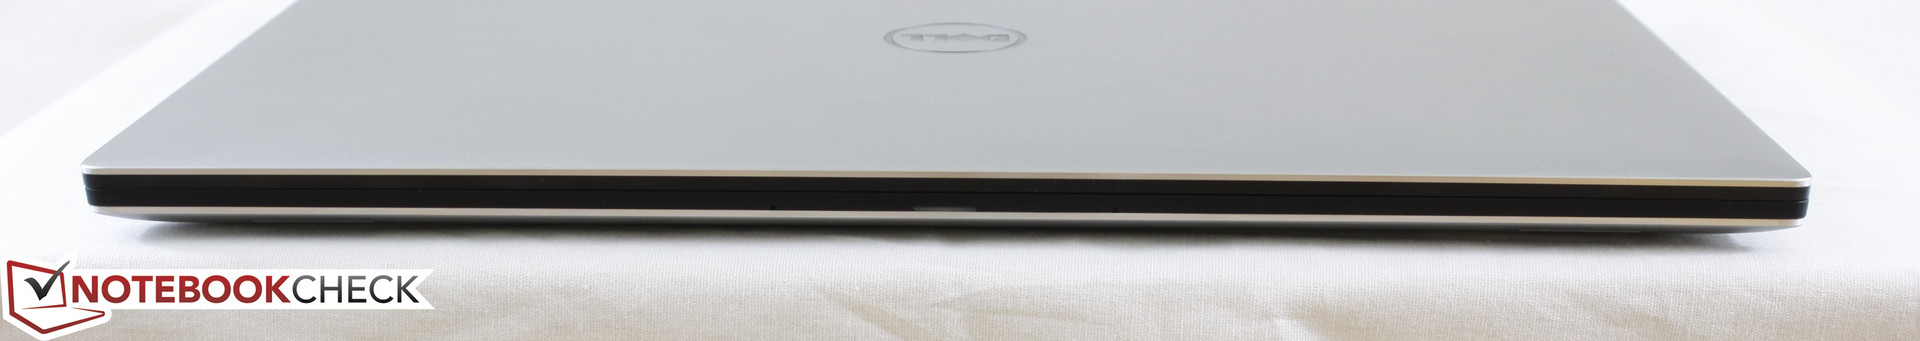
The InfinityEdge display makes the XPS 15 one of the smallest notebooks in its size class. With that said, more manufacturers have been incorporating similar narrow bezel designs including on the HP Spectre, Lenovo Yoga, and Asus Zenbook series, so Dell's advantage has been slowly waning. The XPS 15 is not necessarily the lightest 15-inch notebook either as the discrete Nvidia graphics solution is noticeably more powerful and demanding than what competing multimedia notebooks have to offer.
Connectivity
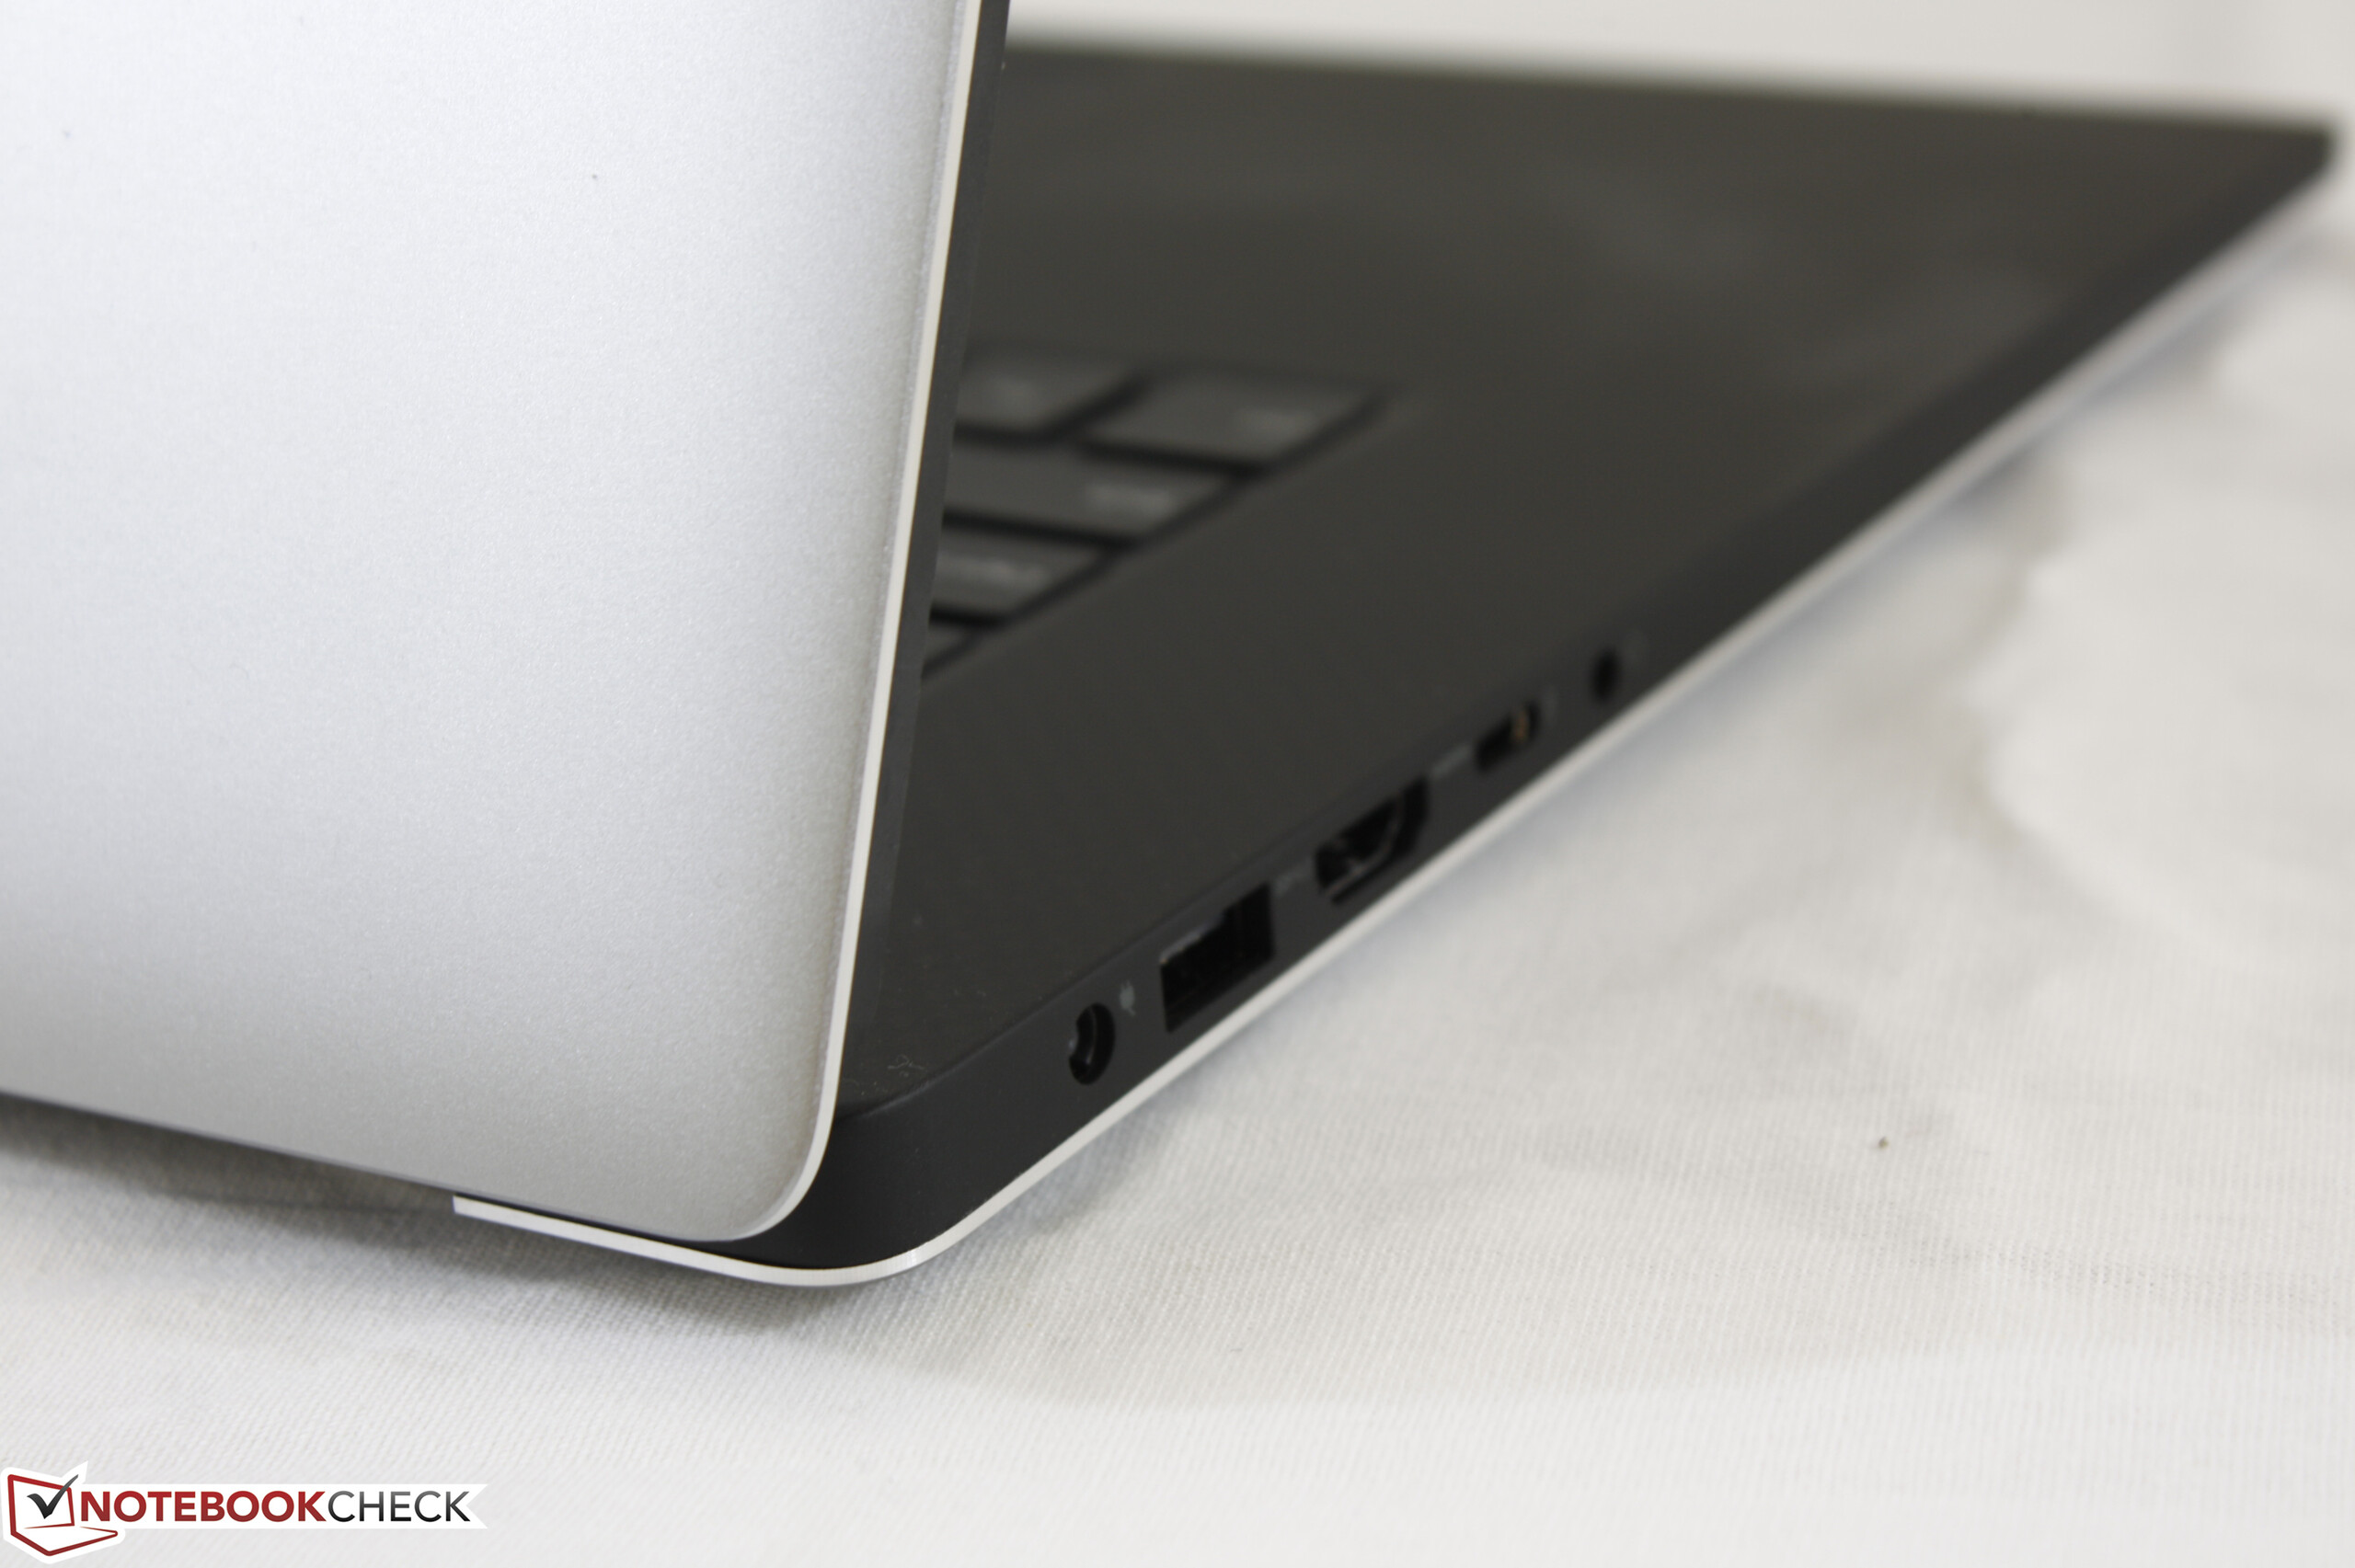
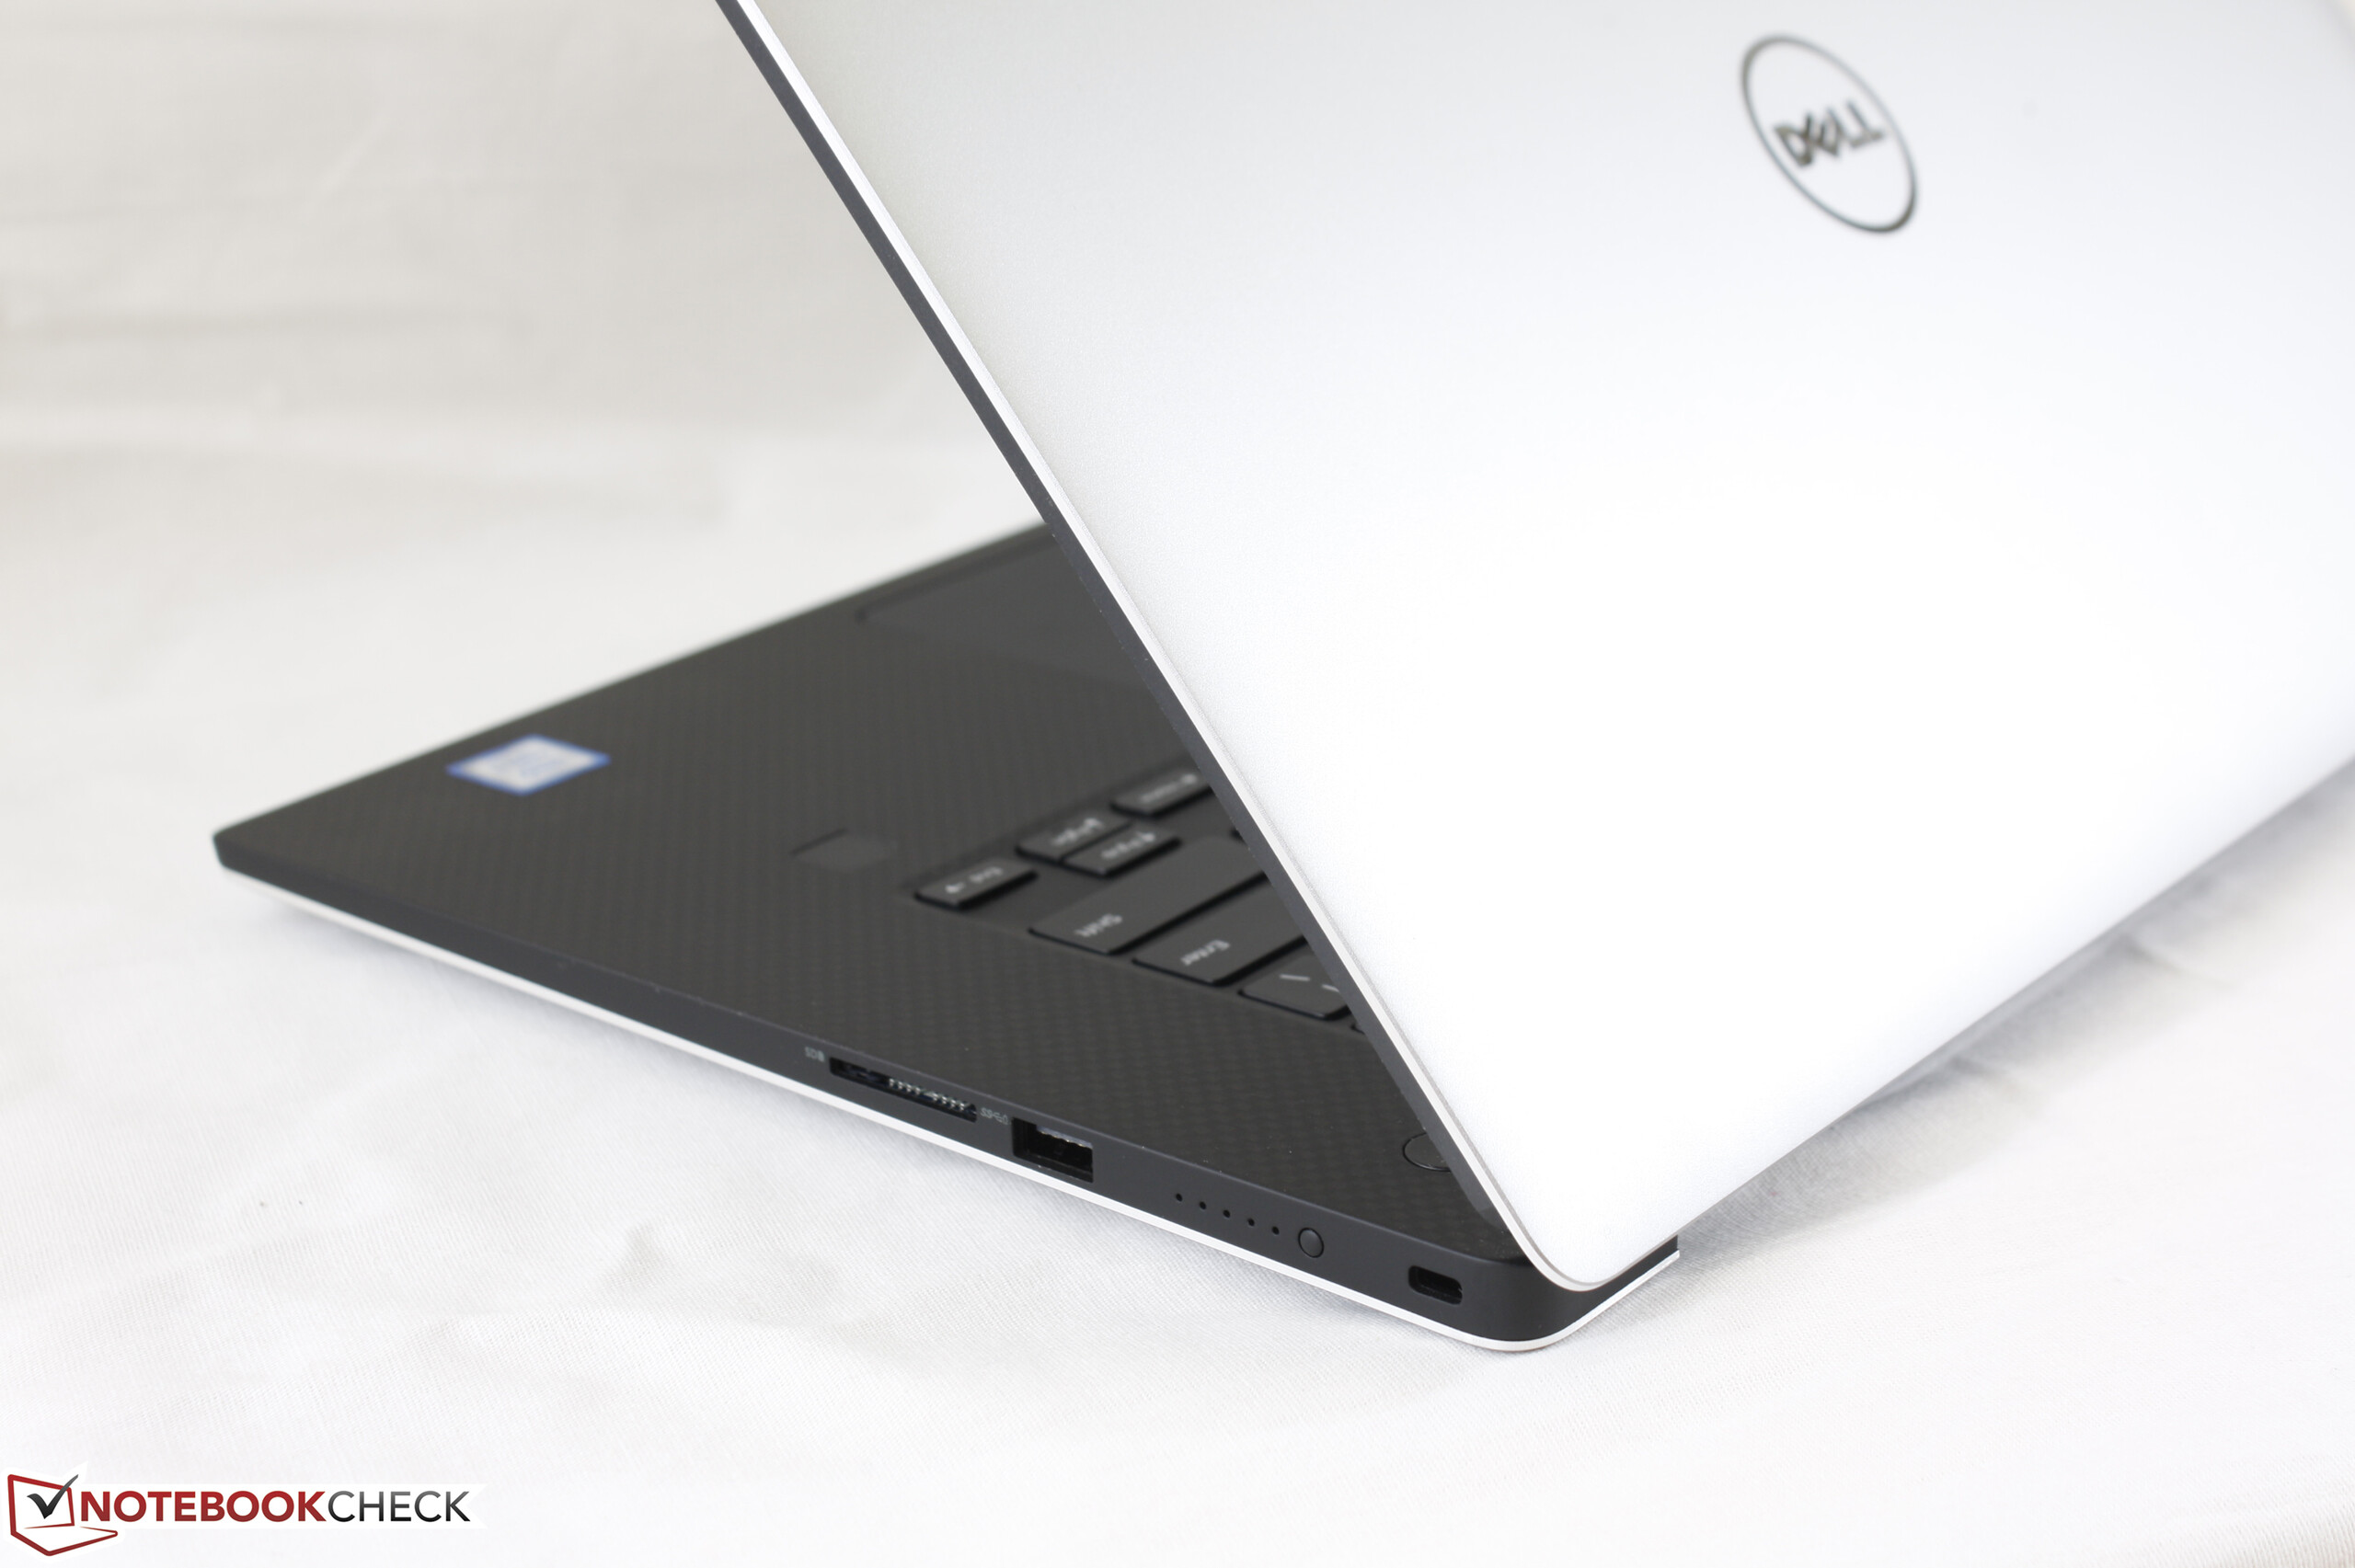
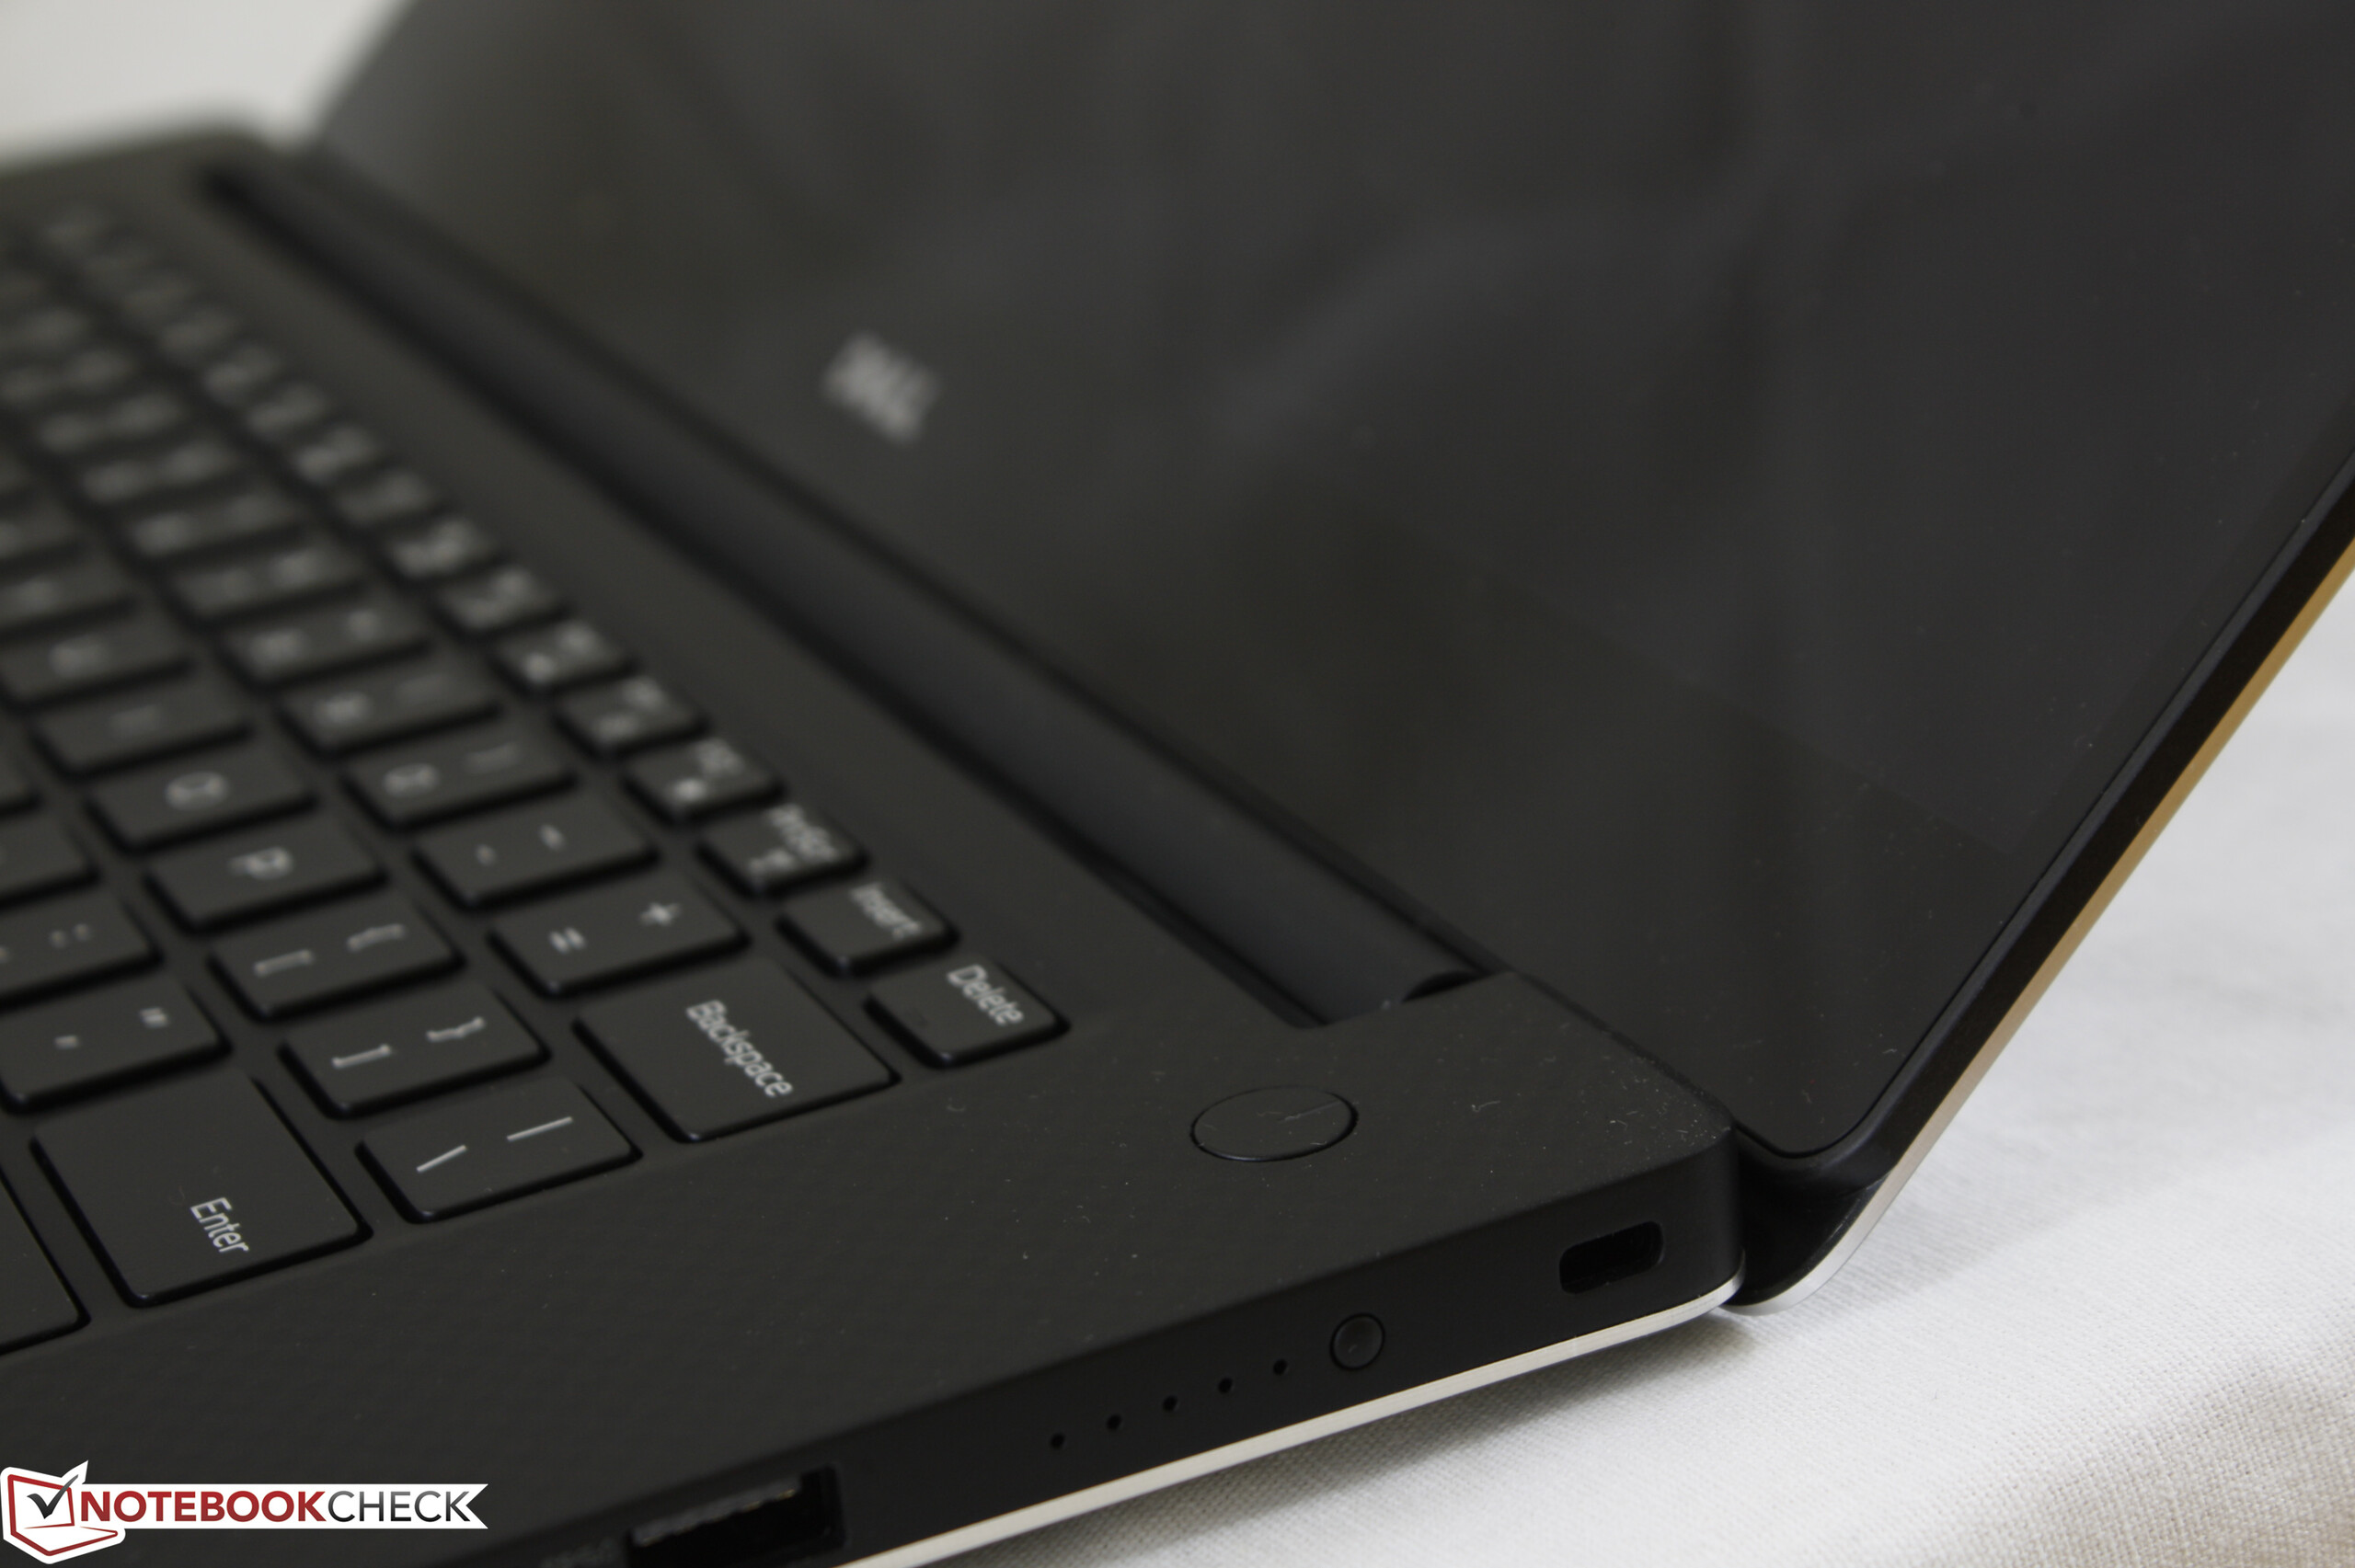
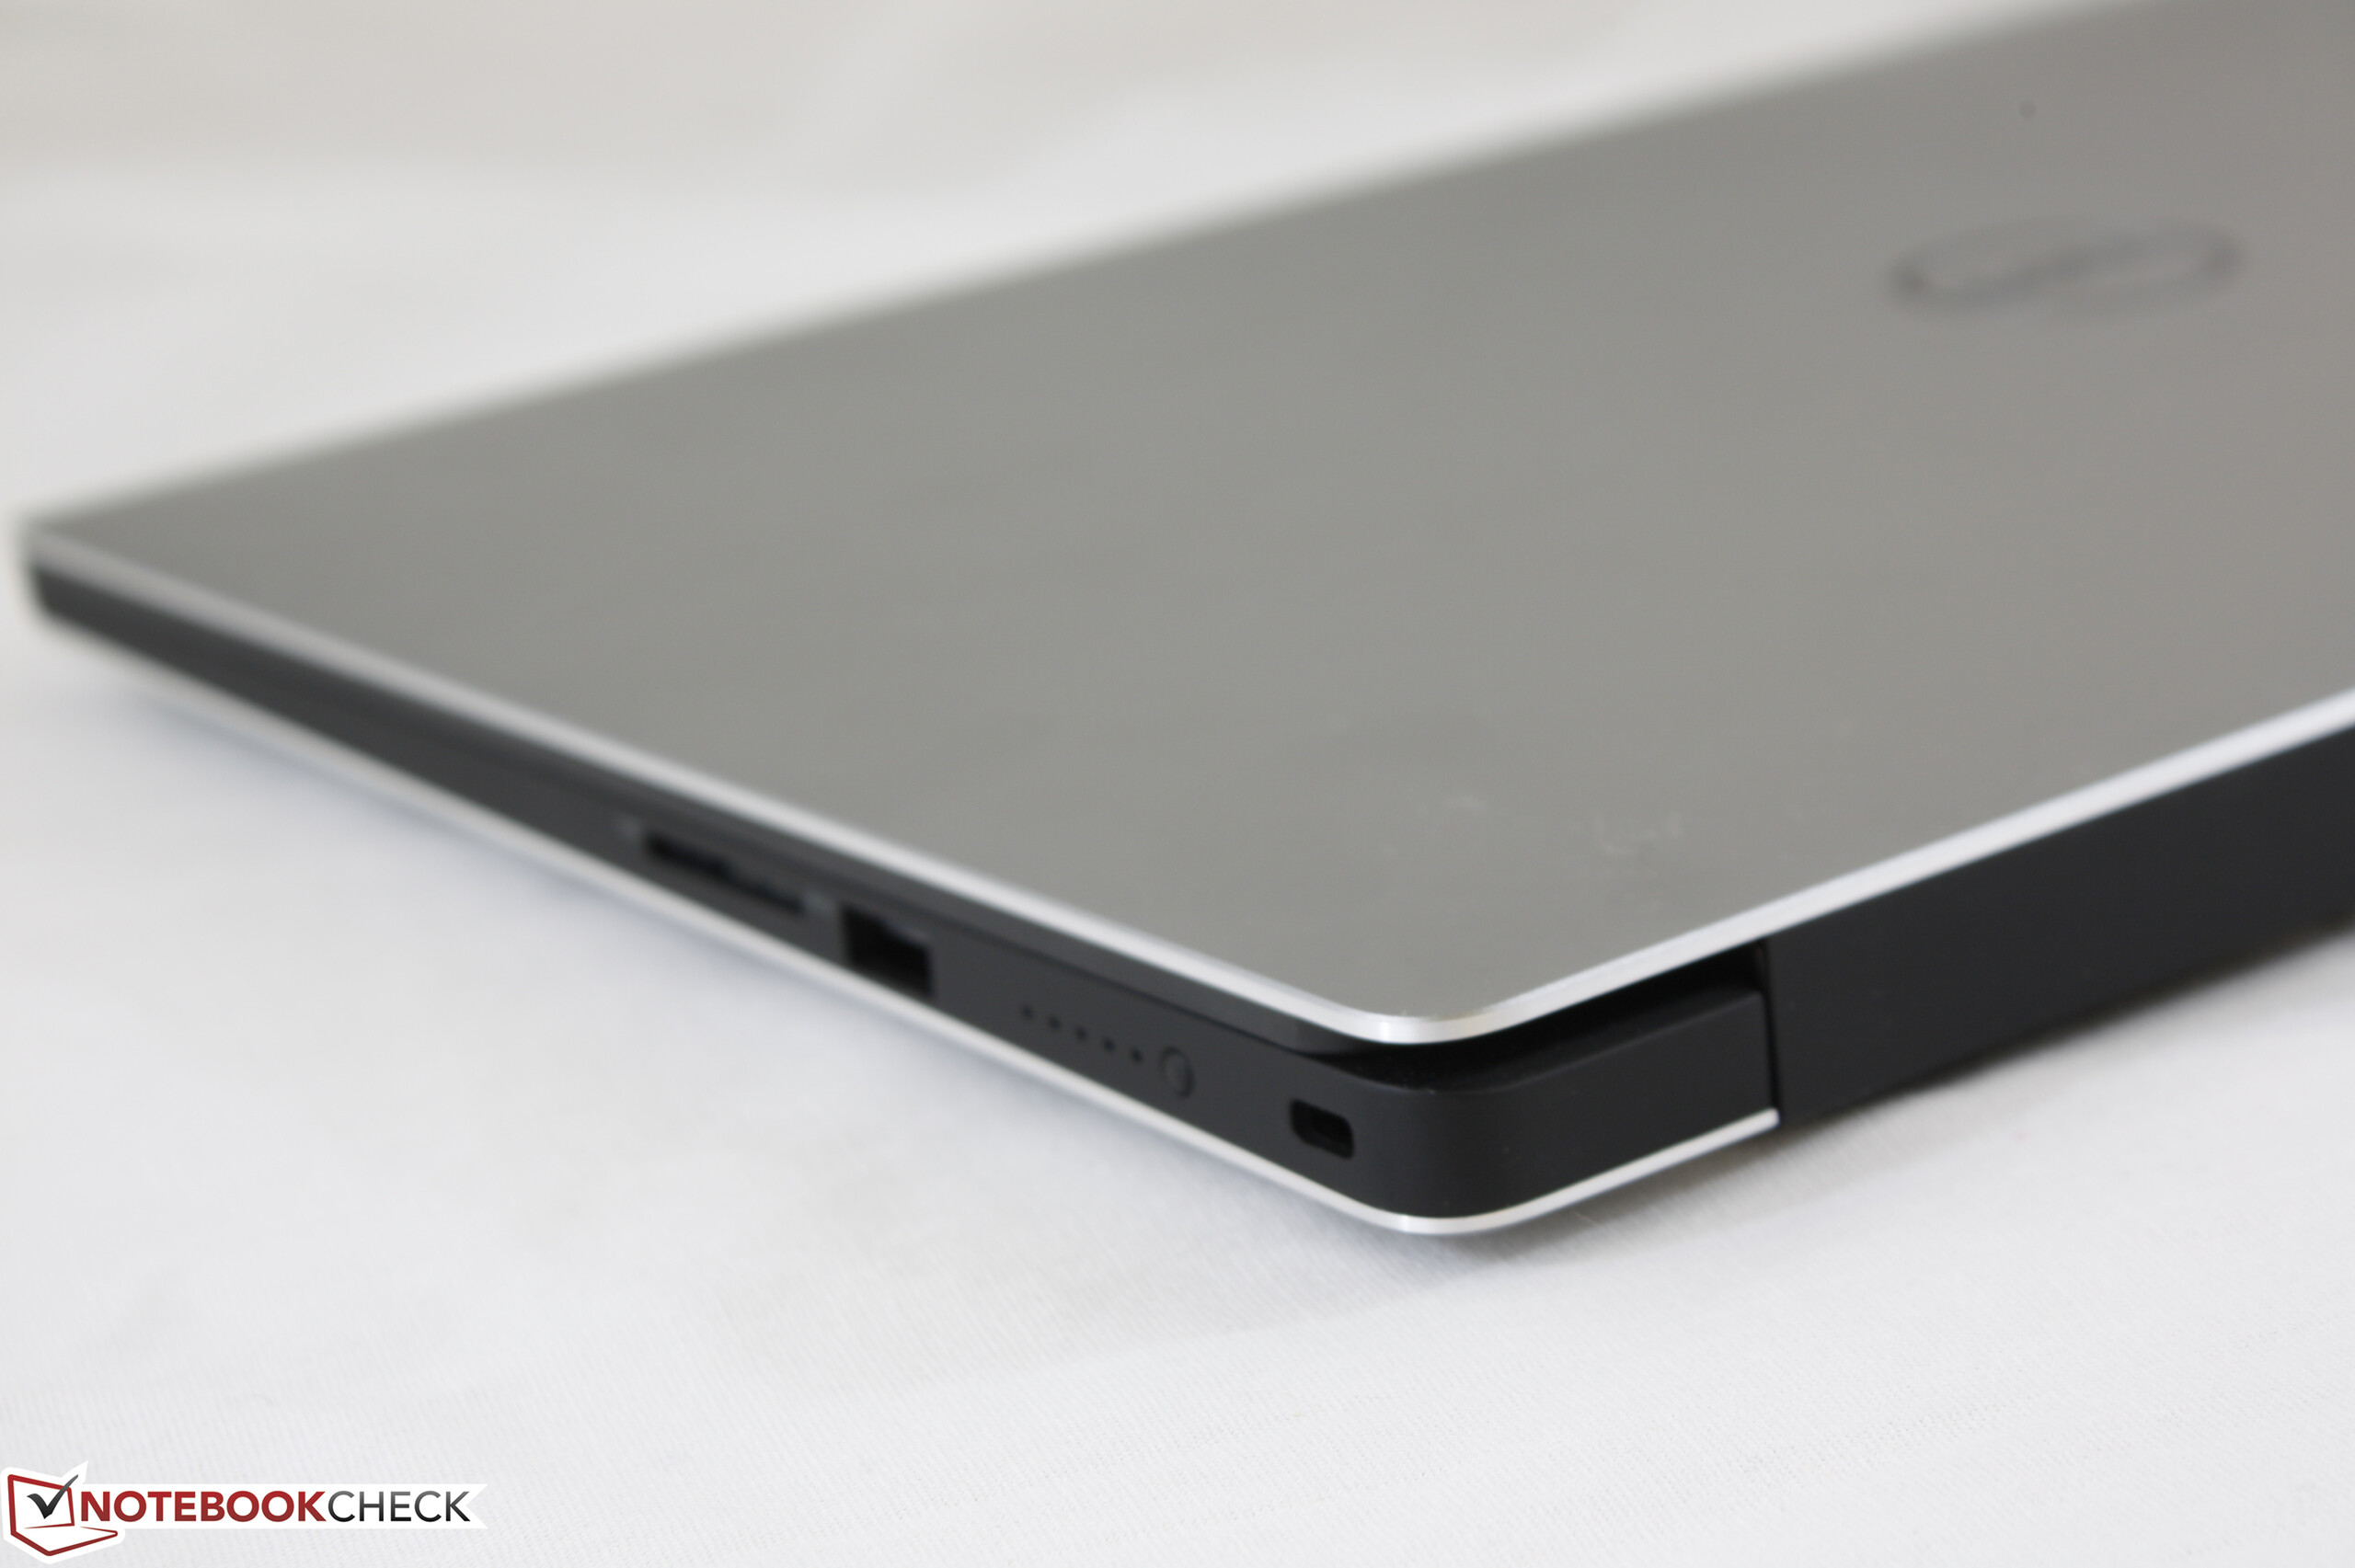
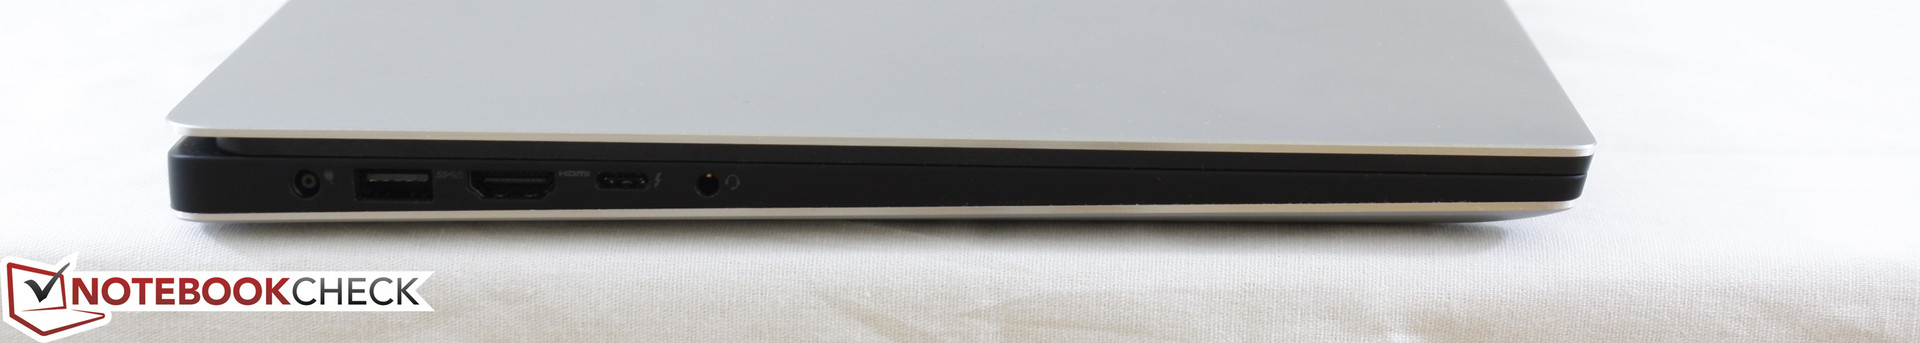
Ports remain identical to last year's XPS 15 9550 including the much-appreciated full-size USB Type-A ports. The system is lacking a dedicated mDP port but makes up for it with USB Type-C and Thunderbolt 3 compatibility. We will see in a future review whether or not the cut-down Thunderbolt 3 port can hinder future external graphics support on the system. The ports are otherwise easy to reach, though they are quite close to one another. A thick HDMI cable, for example, can potentially block access to the adjacent USB port on the left edge of the system.
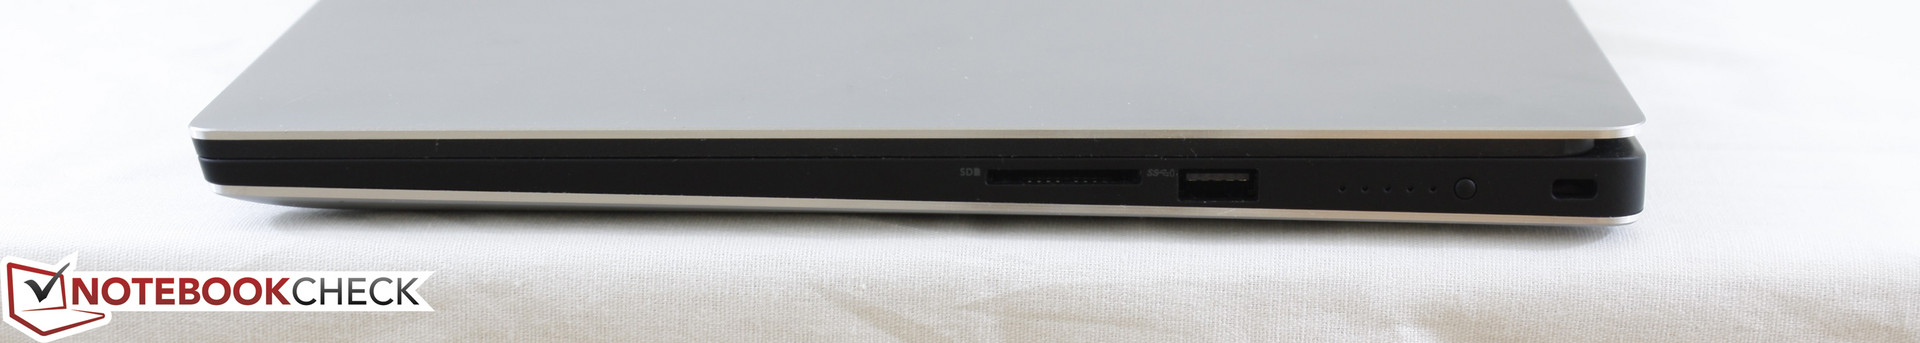
SD Card Reader
Dell has fortunately not downgraded the integrated card reader in this iteration of the XPS as it continues to read at phenomenal speeds. AS SSD measures a transfer rate of about 253 MB/s with our Toshiba Exceria SDHC UHS-II test card compared to <100 MB/s on most cheaper machines. Note that this Toshiba SD card is rated for up to 260 MB/s, so the system is already reading quite close to the limitations of our test card. While we experienced slow transfer rates on our previous XPS 15 9560 test unit due to its primary HDD bottleneck, this higher-end NVMe configuration shows no slowdowns. Transferring 1 GB worth of photos from the card to desktop will take about 9 seconds.
The card reader itself is not spring loaded. Roughly one-third of the length of the SD card will protrude from the edge of the notebook when properly inserted.
| SD Card Reader | |
| average JPG Copy Test (av. of 3 runs) | |
| HP Spectre x360 15-bl002xx | |
| Dell XPS 15 9560 (i7-7700HQ, UHD) | |
| Asus FX502VM-AS73 | |
| maximum AS SSD Seq Read Test (1GB) | |
| Dell XPS 15 9560 (i7-7700HQ, UHD) | |
| HP Spectre x360 15-bl002xx | |
| Asus FX502VM-AS73 | |
Communication
Like the latest batch of XPS 13 notebooks, the XPS 15 comes standard with Killer 1535 WLAN and integrated Bluetooth 4.1. This gaming-centric 2x2 WiFi card includes more features than the more common Intel 8260 card, though most users will be indifferent to the extras available. Our real-world WLAN tests exhibit consistent transfer rates and reliability at an average of 648 Mbps compared to the advertised maximum of 867 Mbps.
See our review on the Killer 1535 for more technical information and performance features.
| Networking | |
| iperf3 transmit AX12 | |
| Dell XPS 15 9560 (i7-7700HQ, UHD) | |
| Asus FX502VM-AS73 | |
| HP Spectre x360 15-bl002xx | |
| iperf3 receive AX12 | |
| Dell XPS 15 9560 (i7-7700HQ, UHD) | |
| HP Spectre x360 15-bl002xx | |
| Asus FX502VM-AS73 | |
Accessories
No extras are included in the box outside of the Quick Start guide and AC adapter. Users may want to consider USB Type-C or Thunderbolt 3 adapters for added versatility such as the Dell DA200.
Maintenance
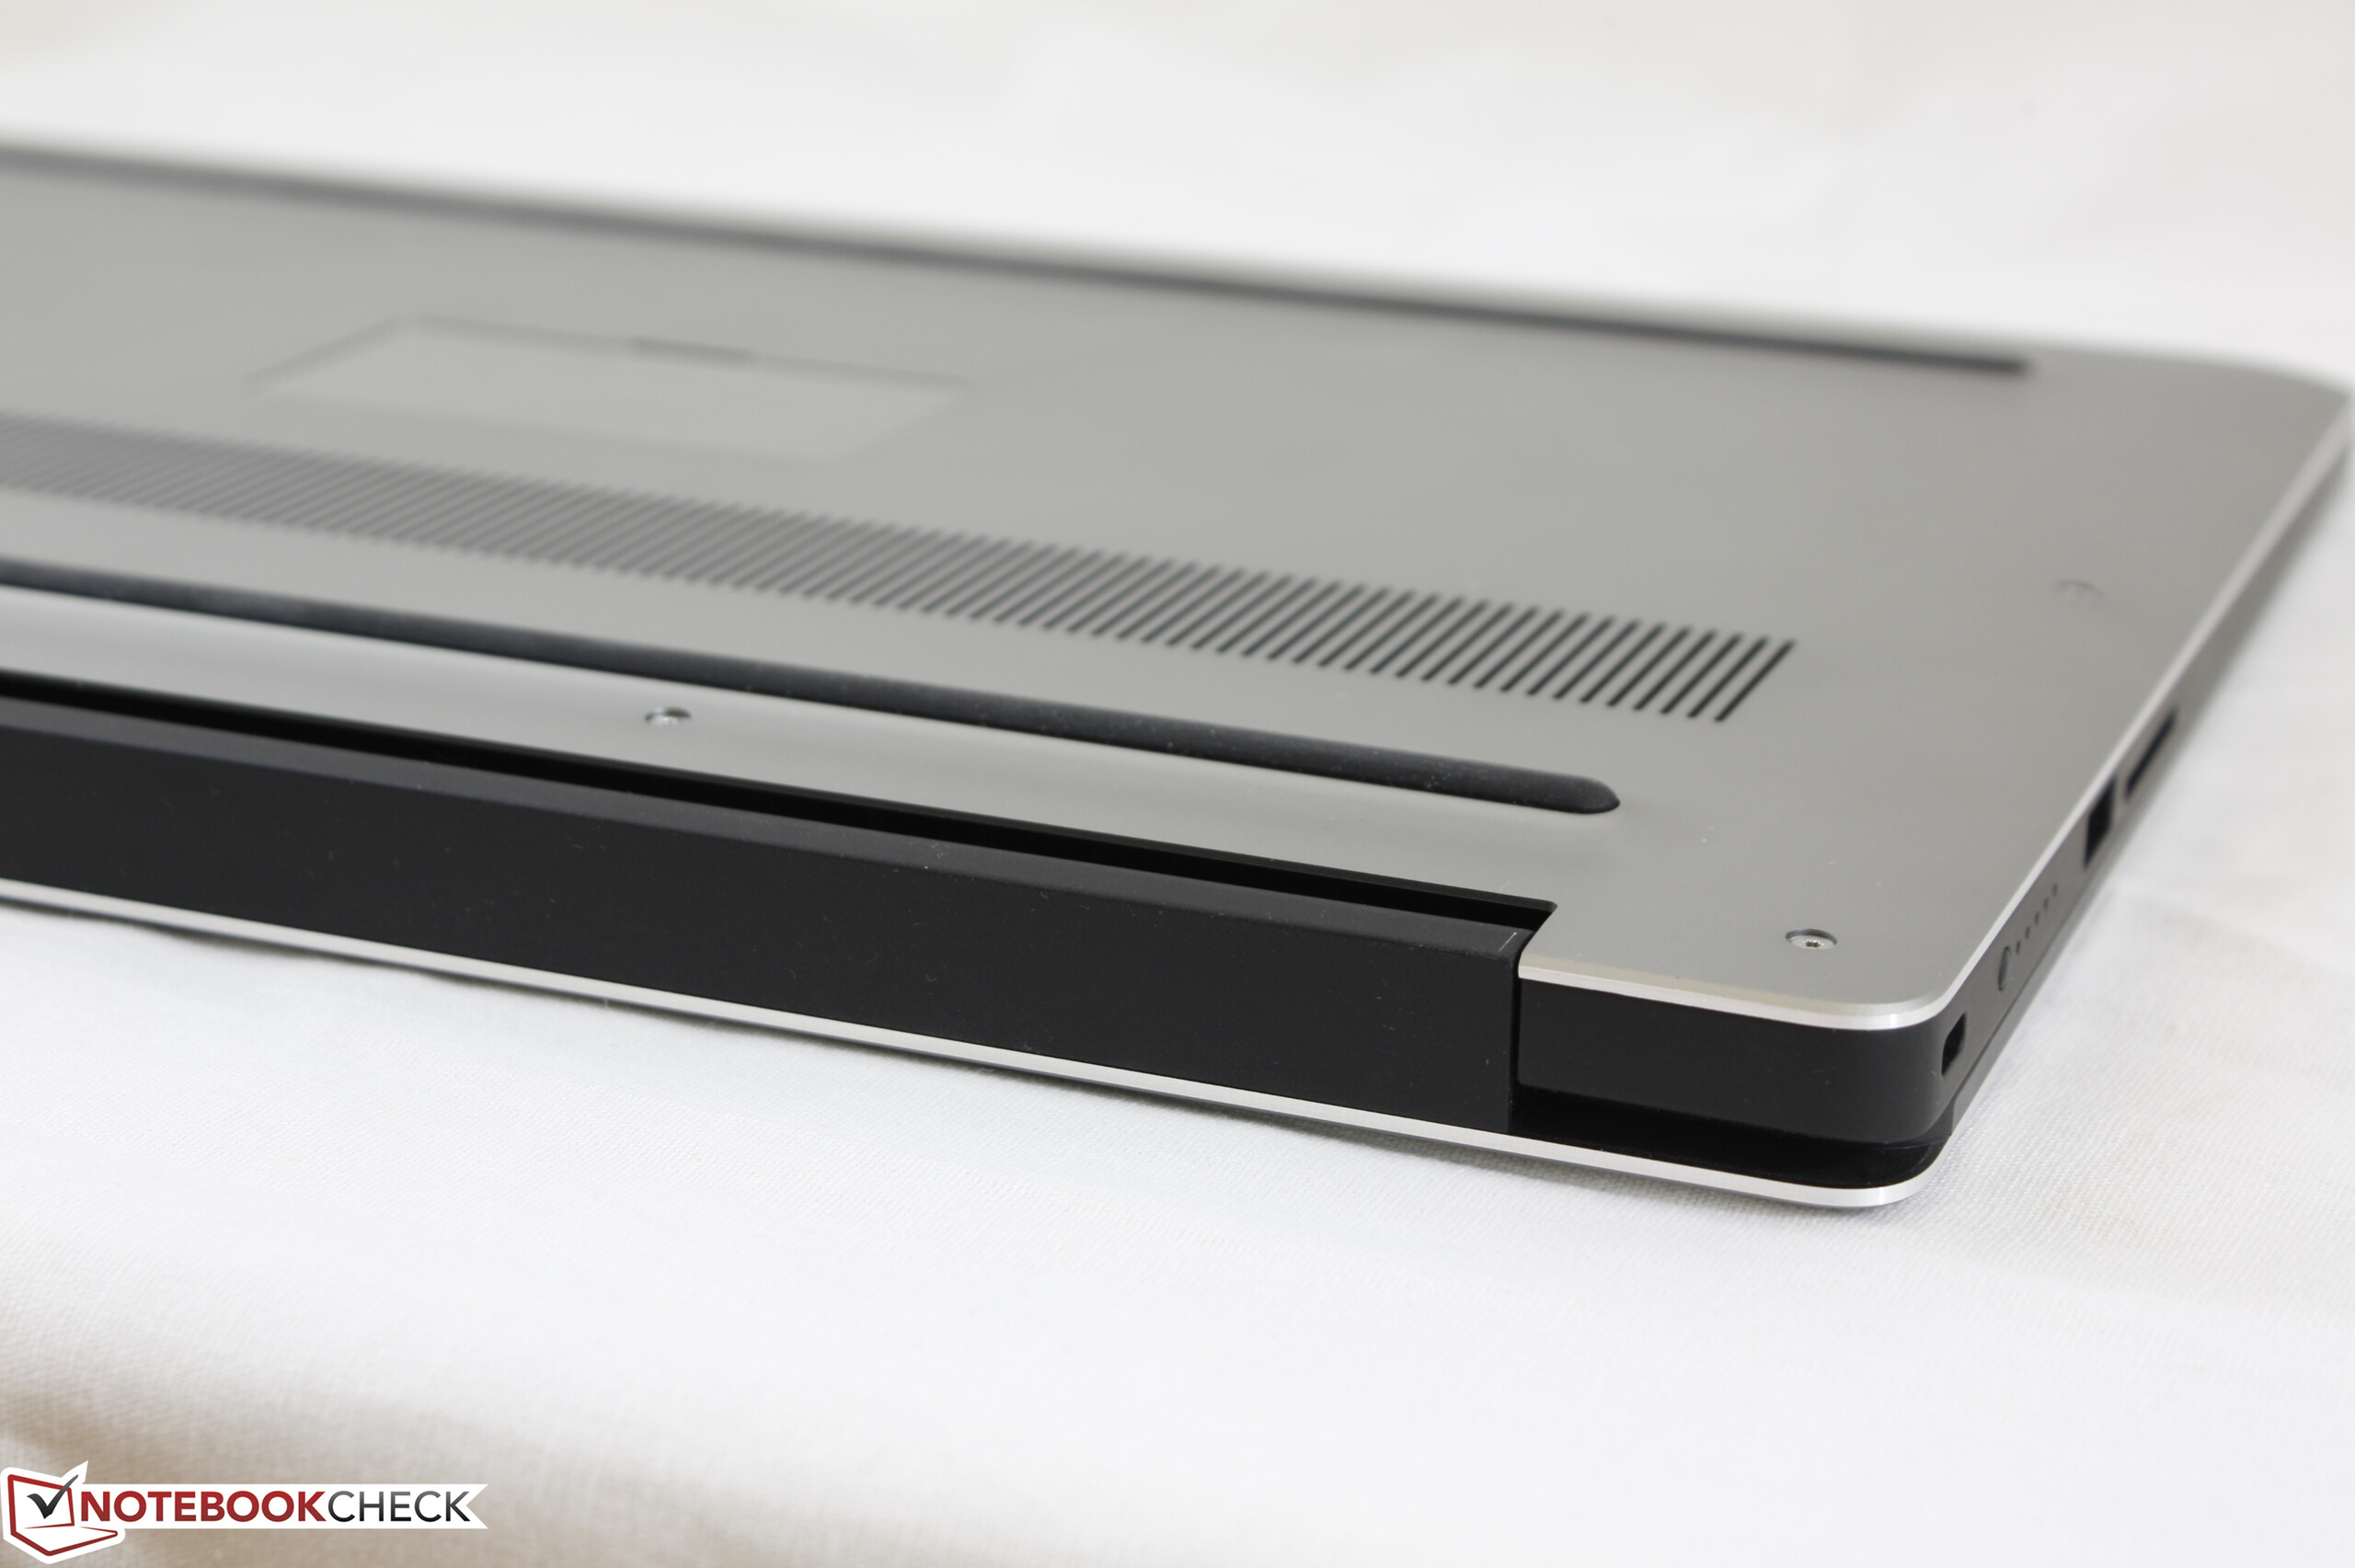
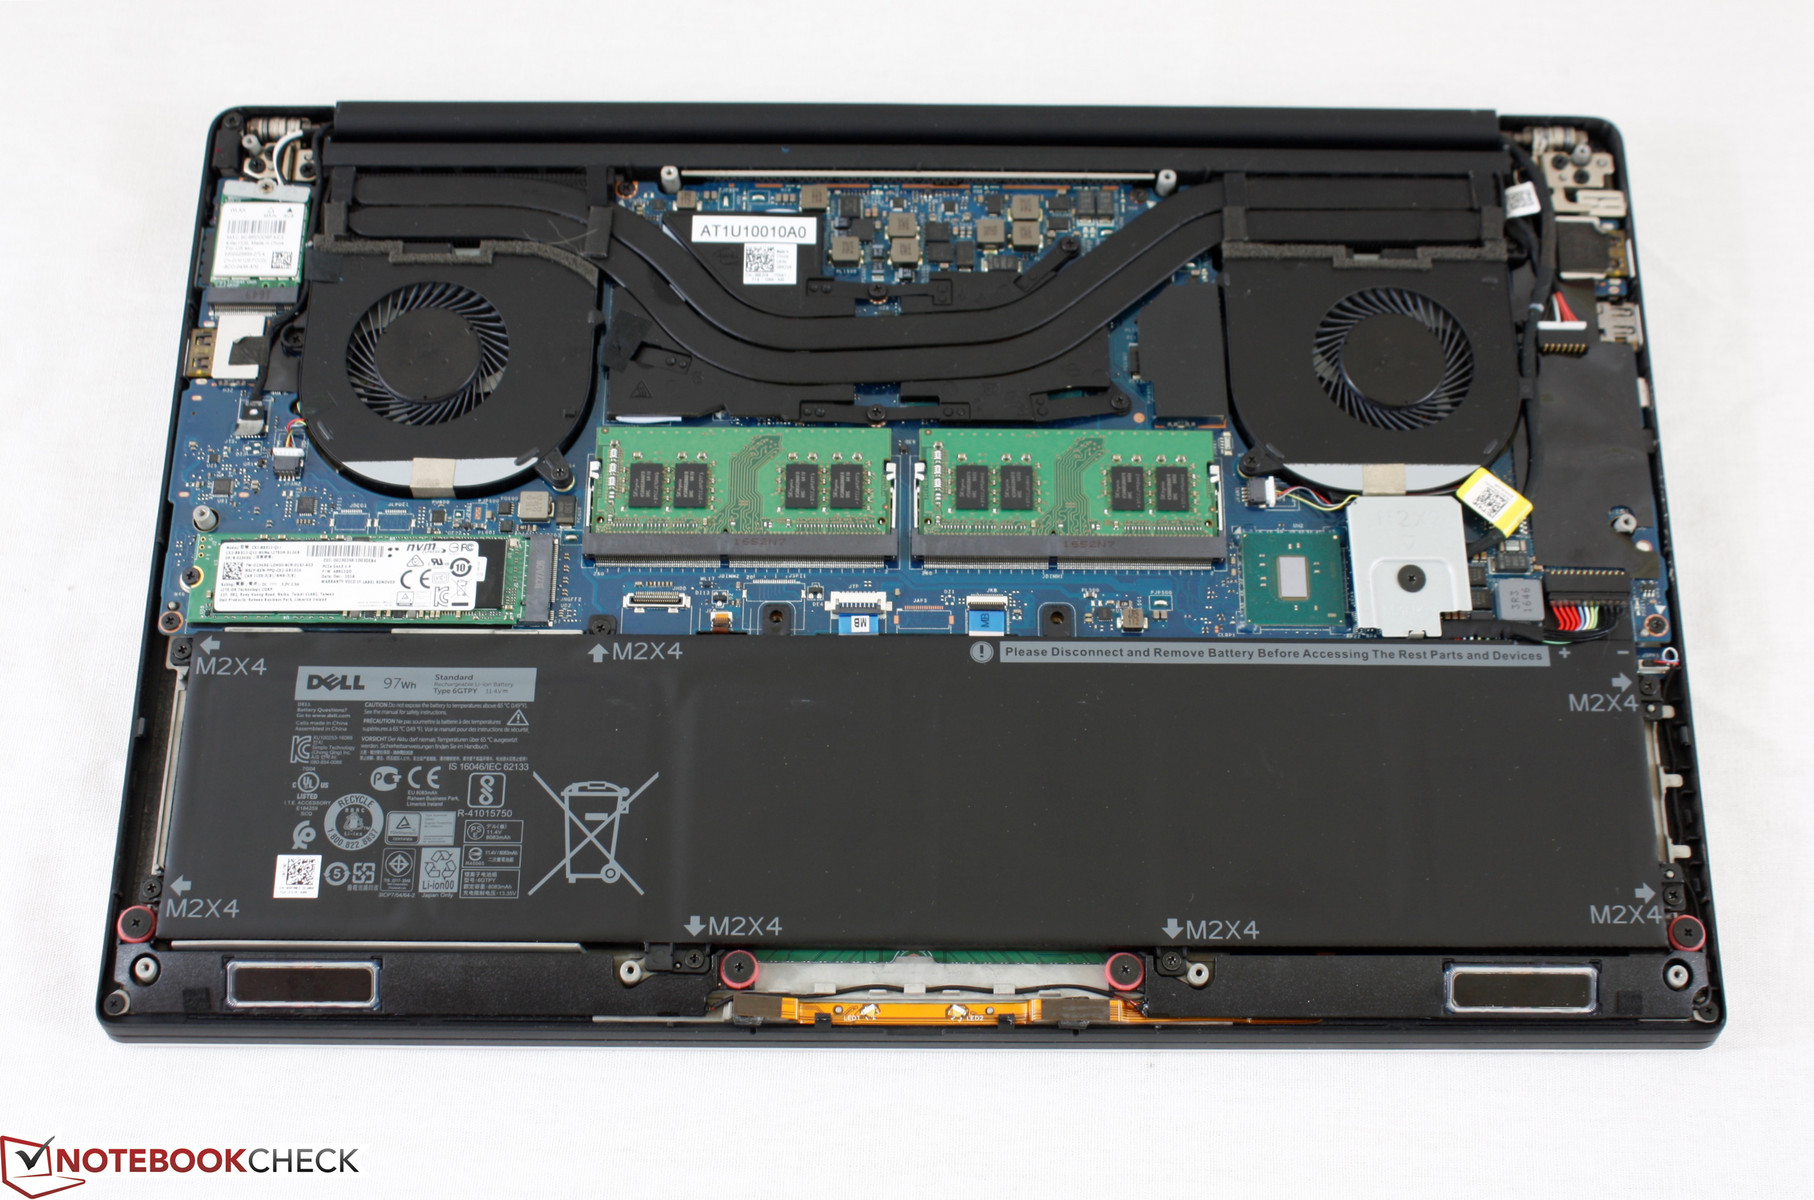
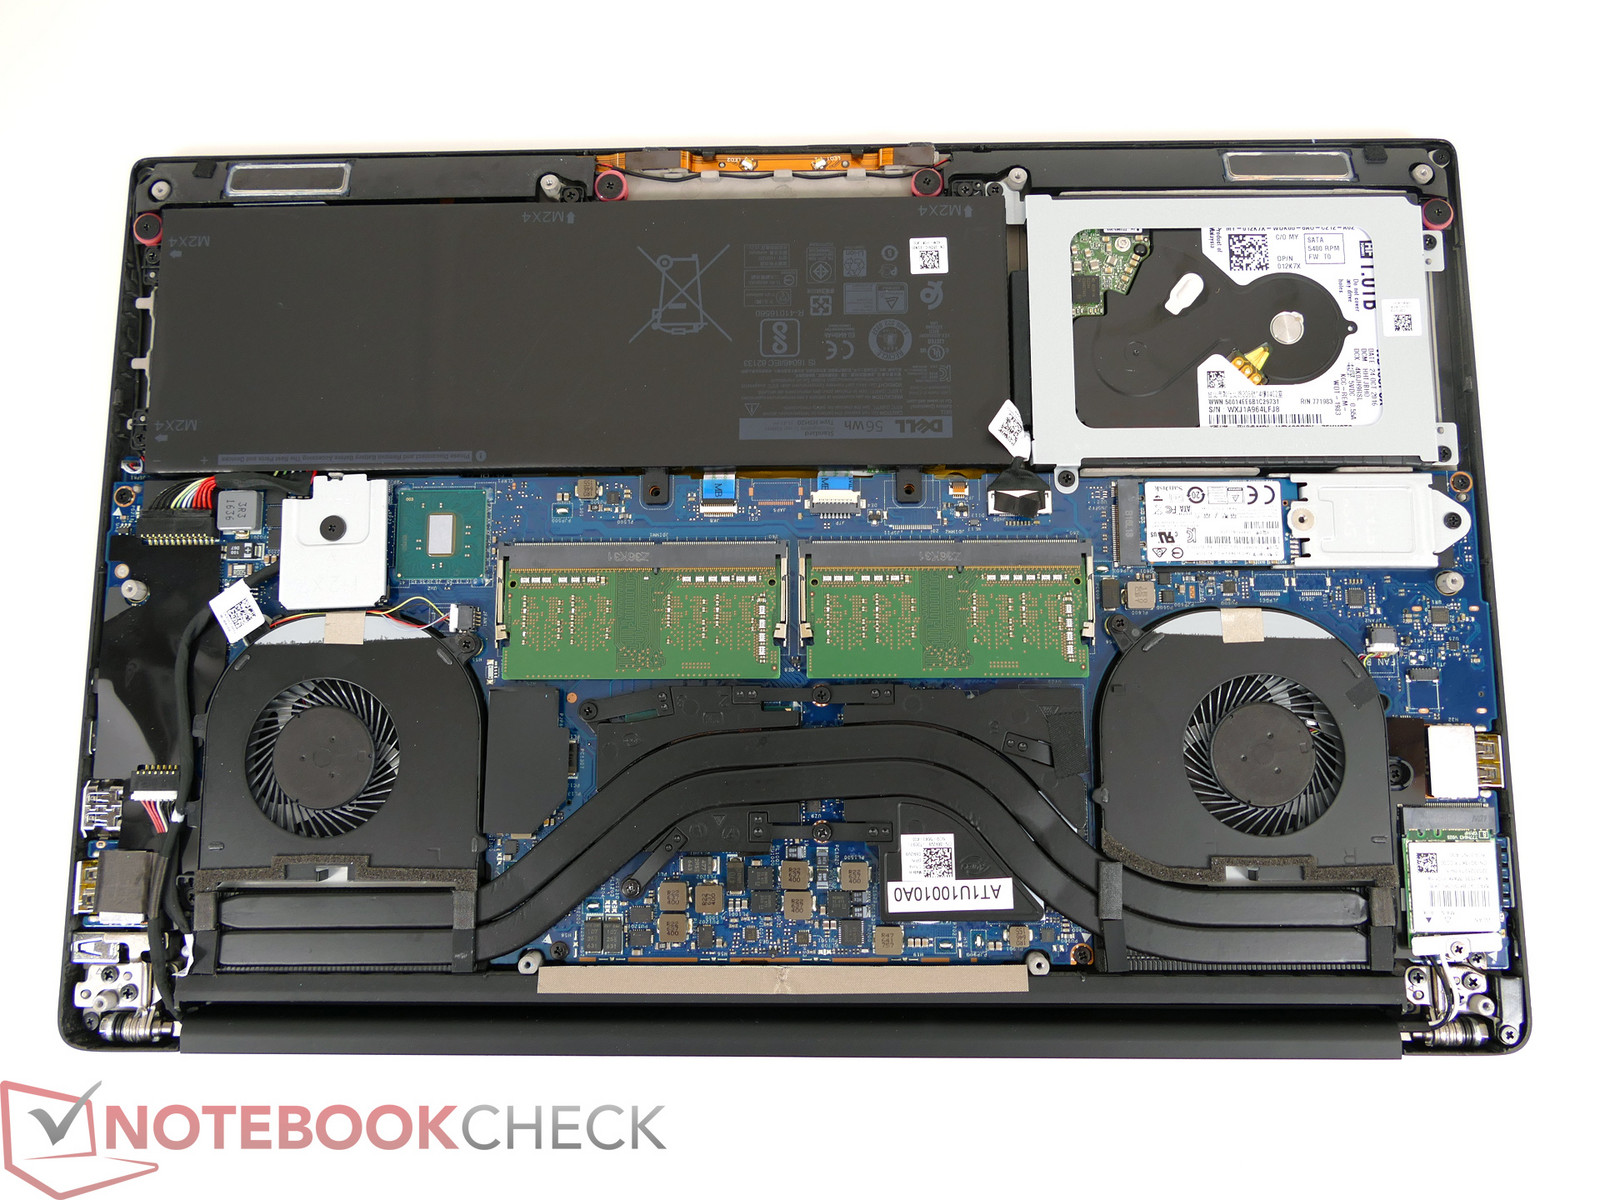
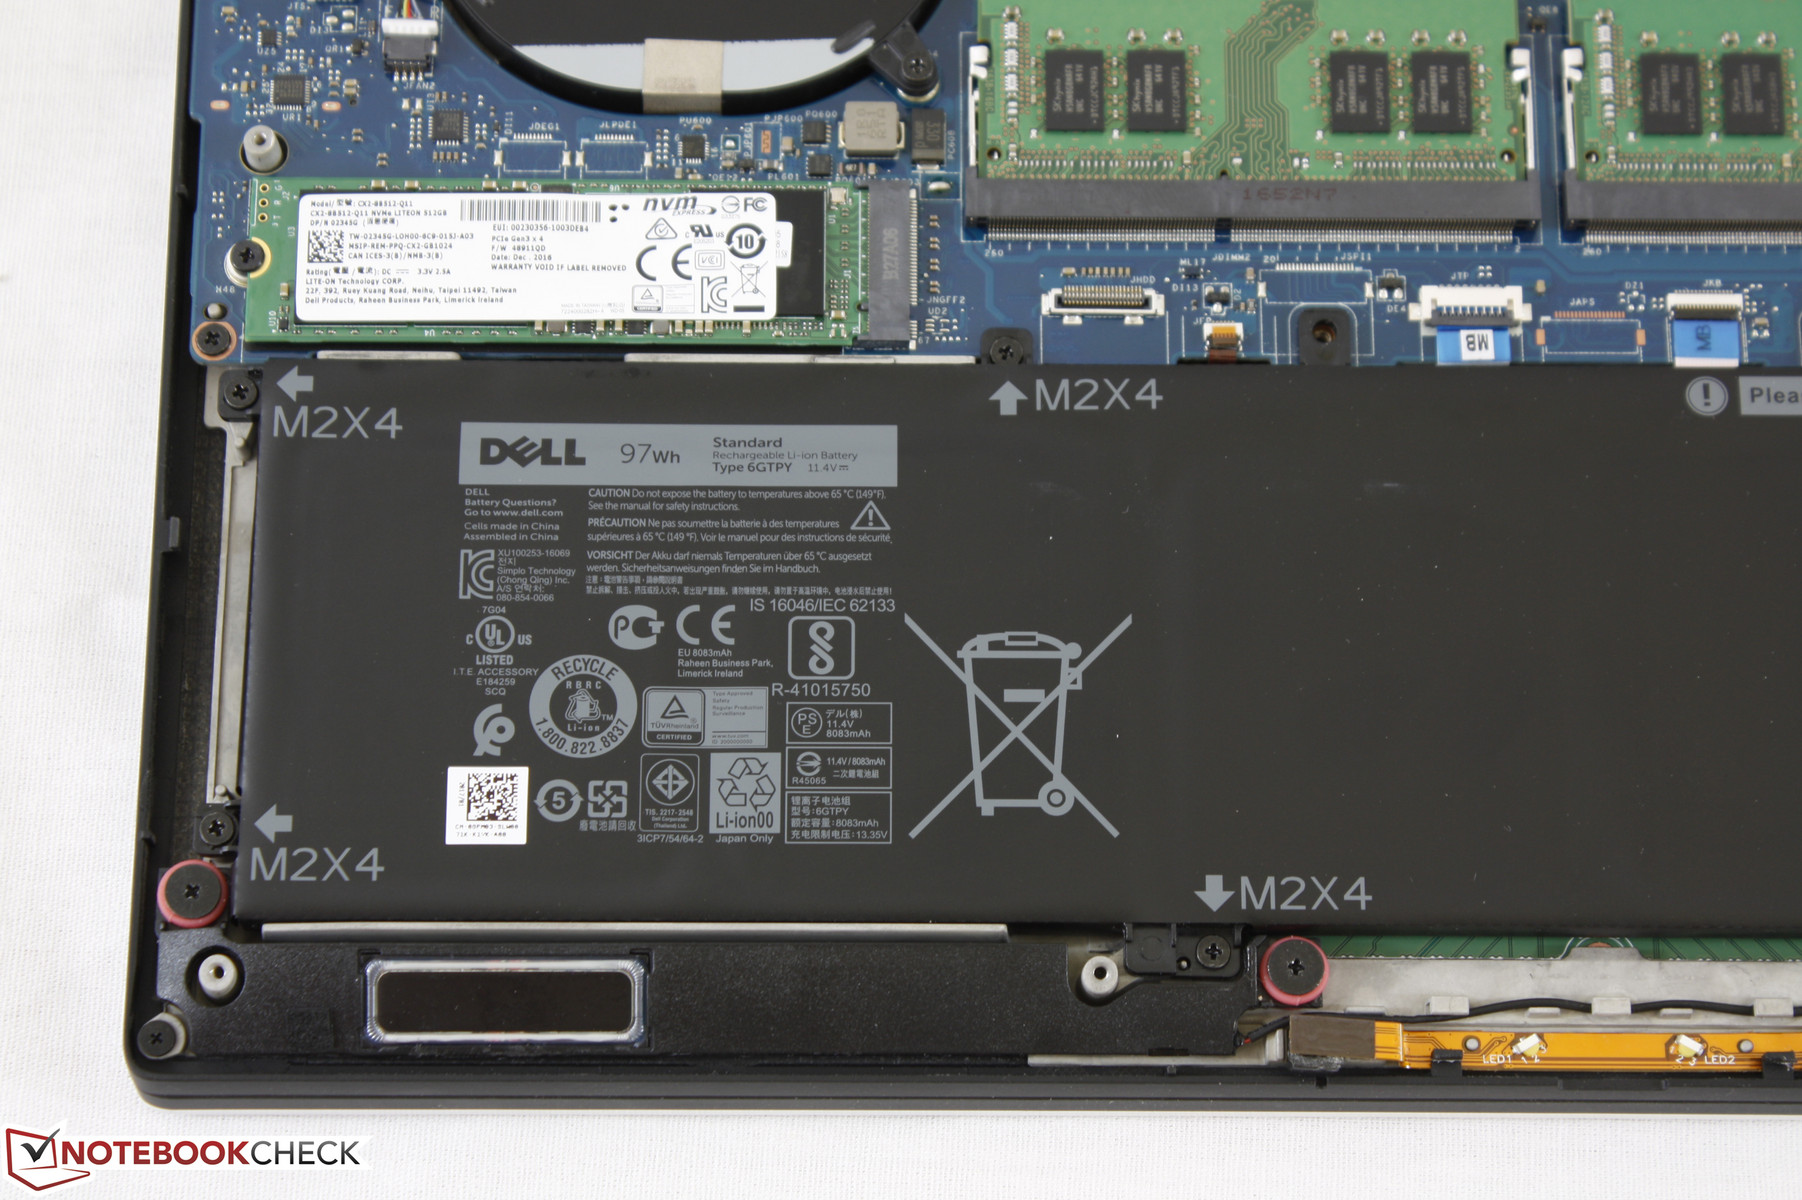
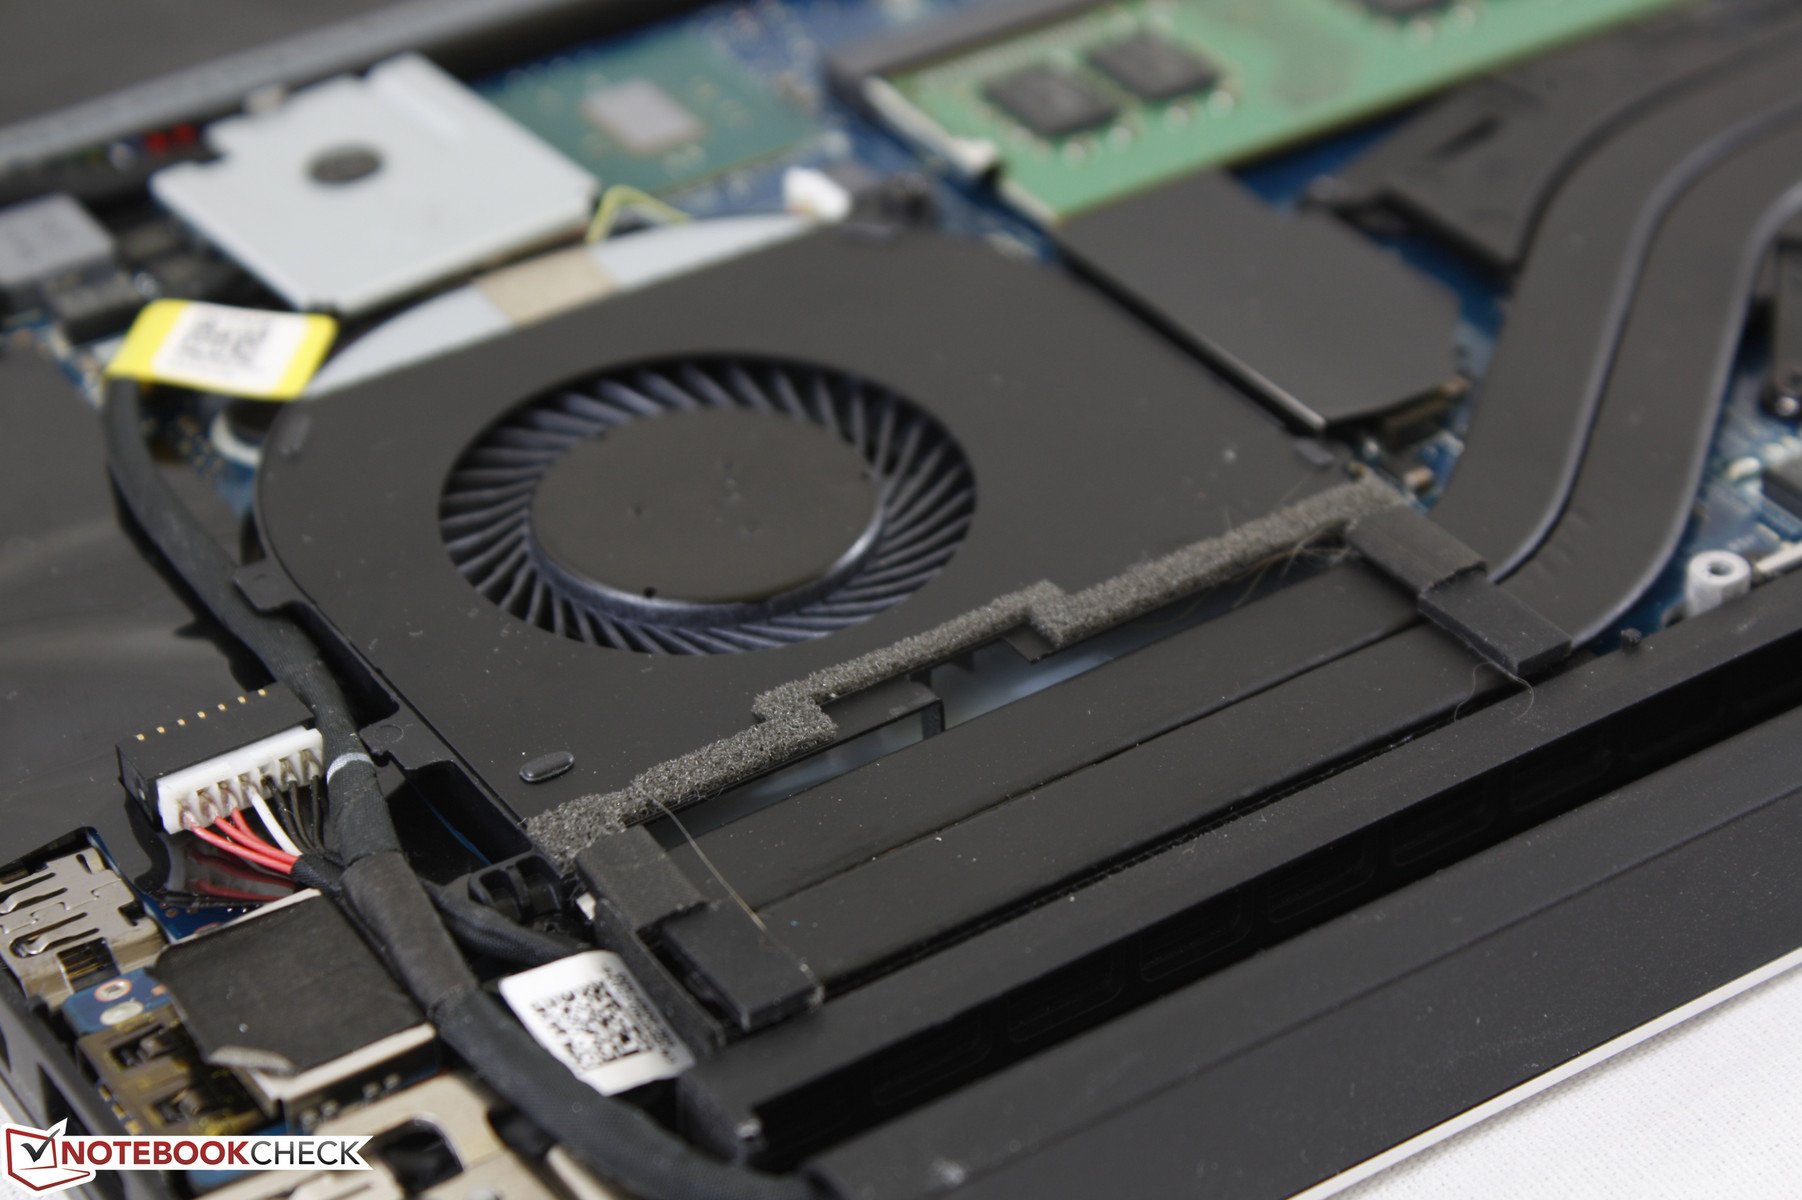
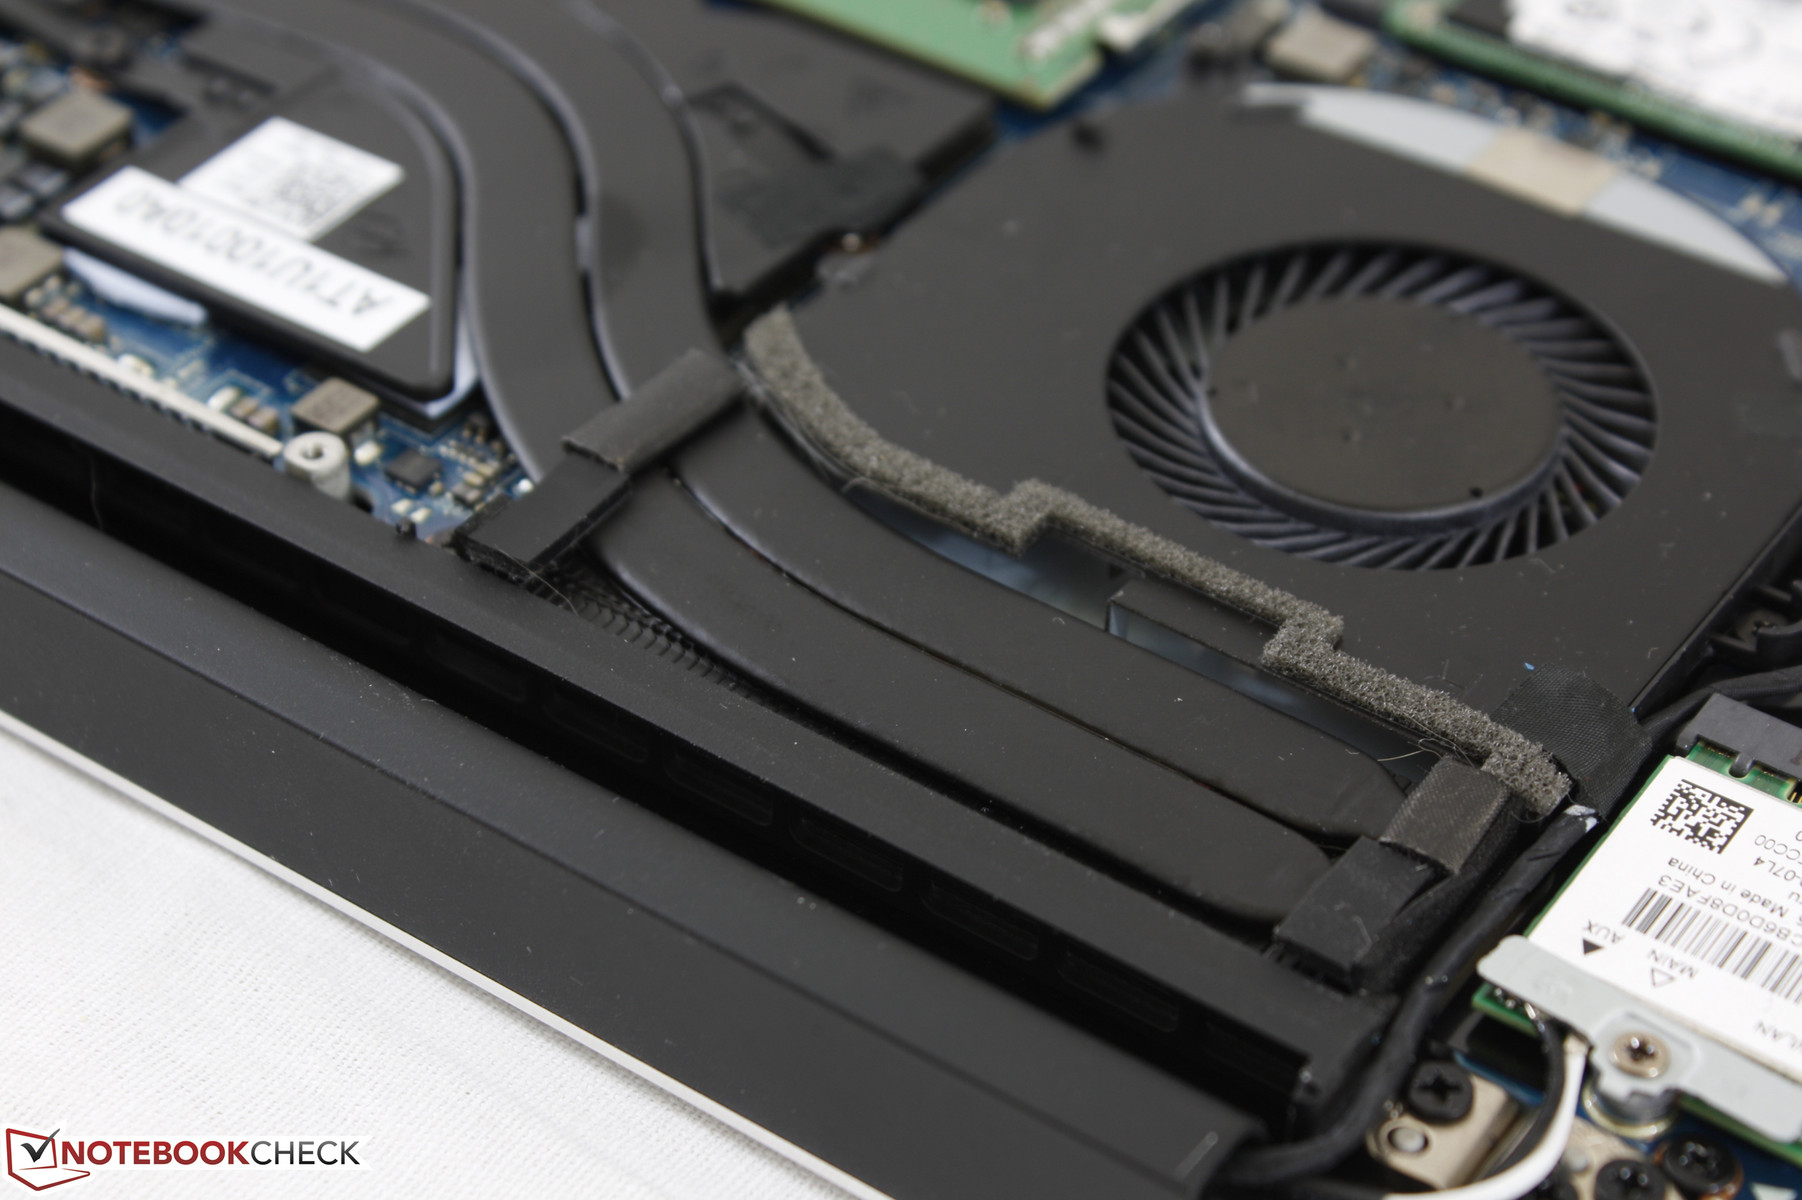
Both a Philips screwdriver and T5 hex wrench are needed to pop open the bottom panel. Once removed, users will have easy access to both DDR4 SODIMM slots and either one storage slot or two depending on the configuration. The battery capacity gained when opting out of the secondary 2.5-inch SATA III slot is clear as shown by our comparison images below.
Warranty
The standard one-year limited warranty applies to buyers in the US. Extended support is optional with accidental damage protection up to four years.
Please see our Guarantees, Return Policies and Warranties FAQ for country-specific information.
Input Devices
Keyboard and Touchpad
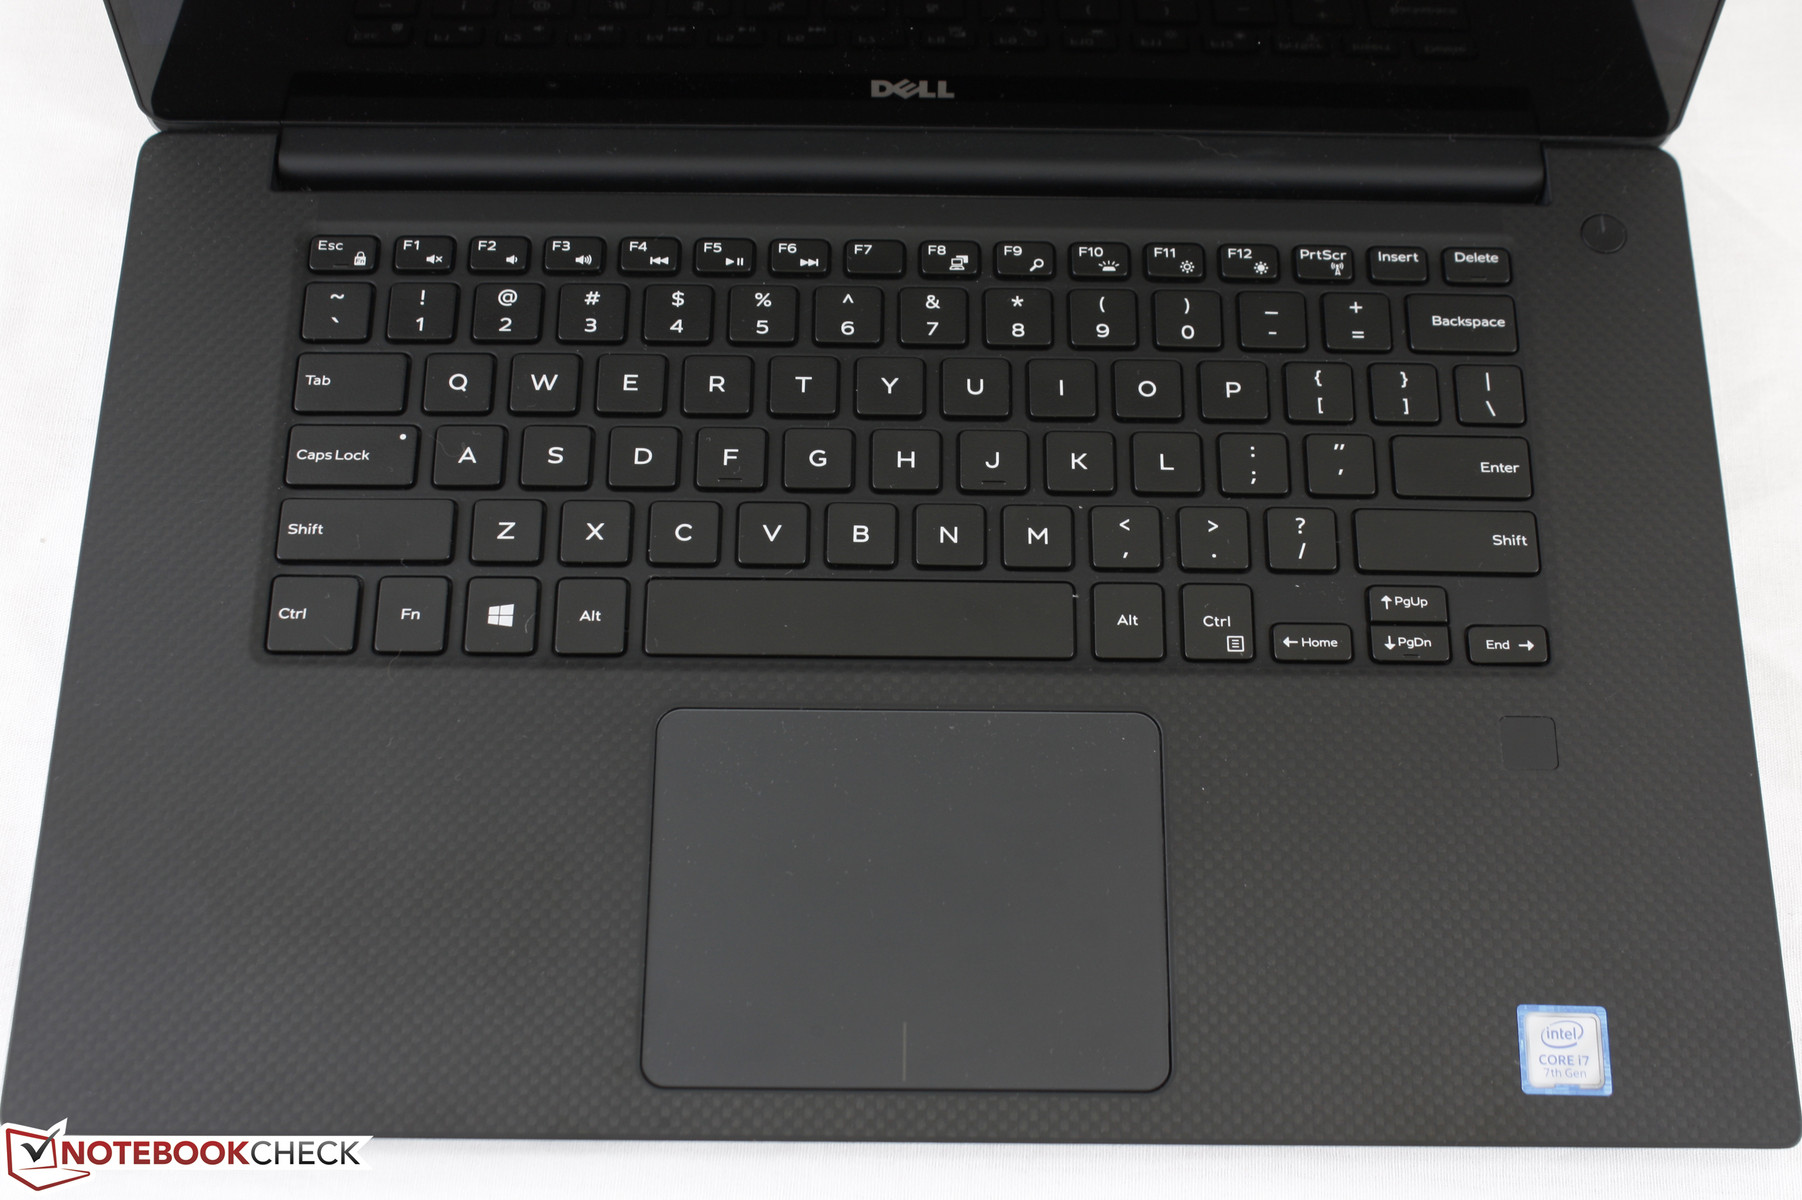
Users will have the same typing experience as on the previous XPS 15 iterations. Key travel is shallow at just 1.3 mm compared to 1.5 mm on the HP Pavilion 14t, 1.6 mm on the Asus ZenBook UX310, or 2.2 mm on the Precision 3510 or Gigabyte P55W series. Thus, users who are accustomed to desktop keyboards will be wishing for more depth on these backlit Chiclet keys. Tactile feedback is otherwise firm and relatively quiet with only the small F keys and Arrow keys suffering from softer strokes. We find the Lenovo AccuType keyboard on most newer ThinkPads to be firmer with deeper travel than what the XPS series currently has to offer.
The integrated touchpad (10.5 x 8.5 cm) works without any issues for simple cursor control. Its integrated mouse keys are very shallow in travel with a quiet yet firm auditory feedback when pressed. Tactile feedback could have been stronger, however, though this is a minor complaint.

Display
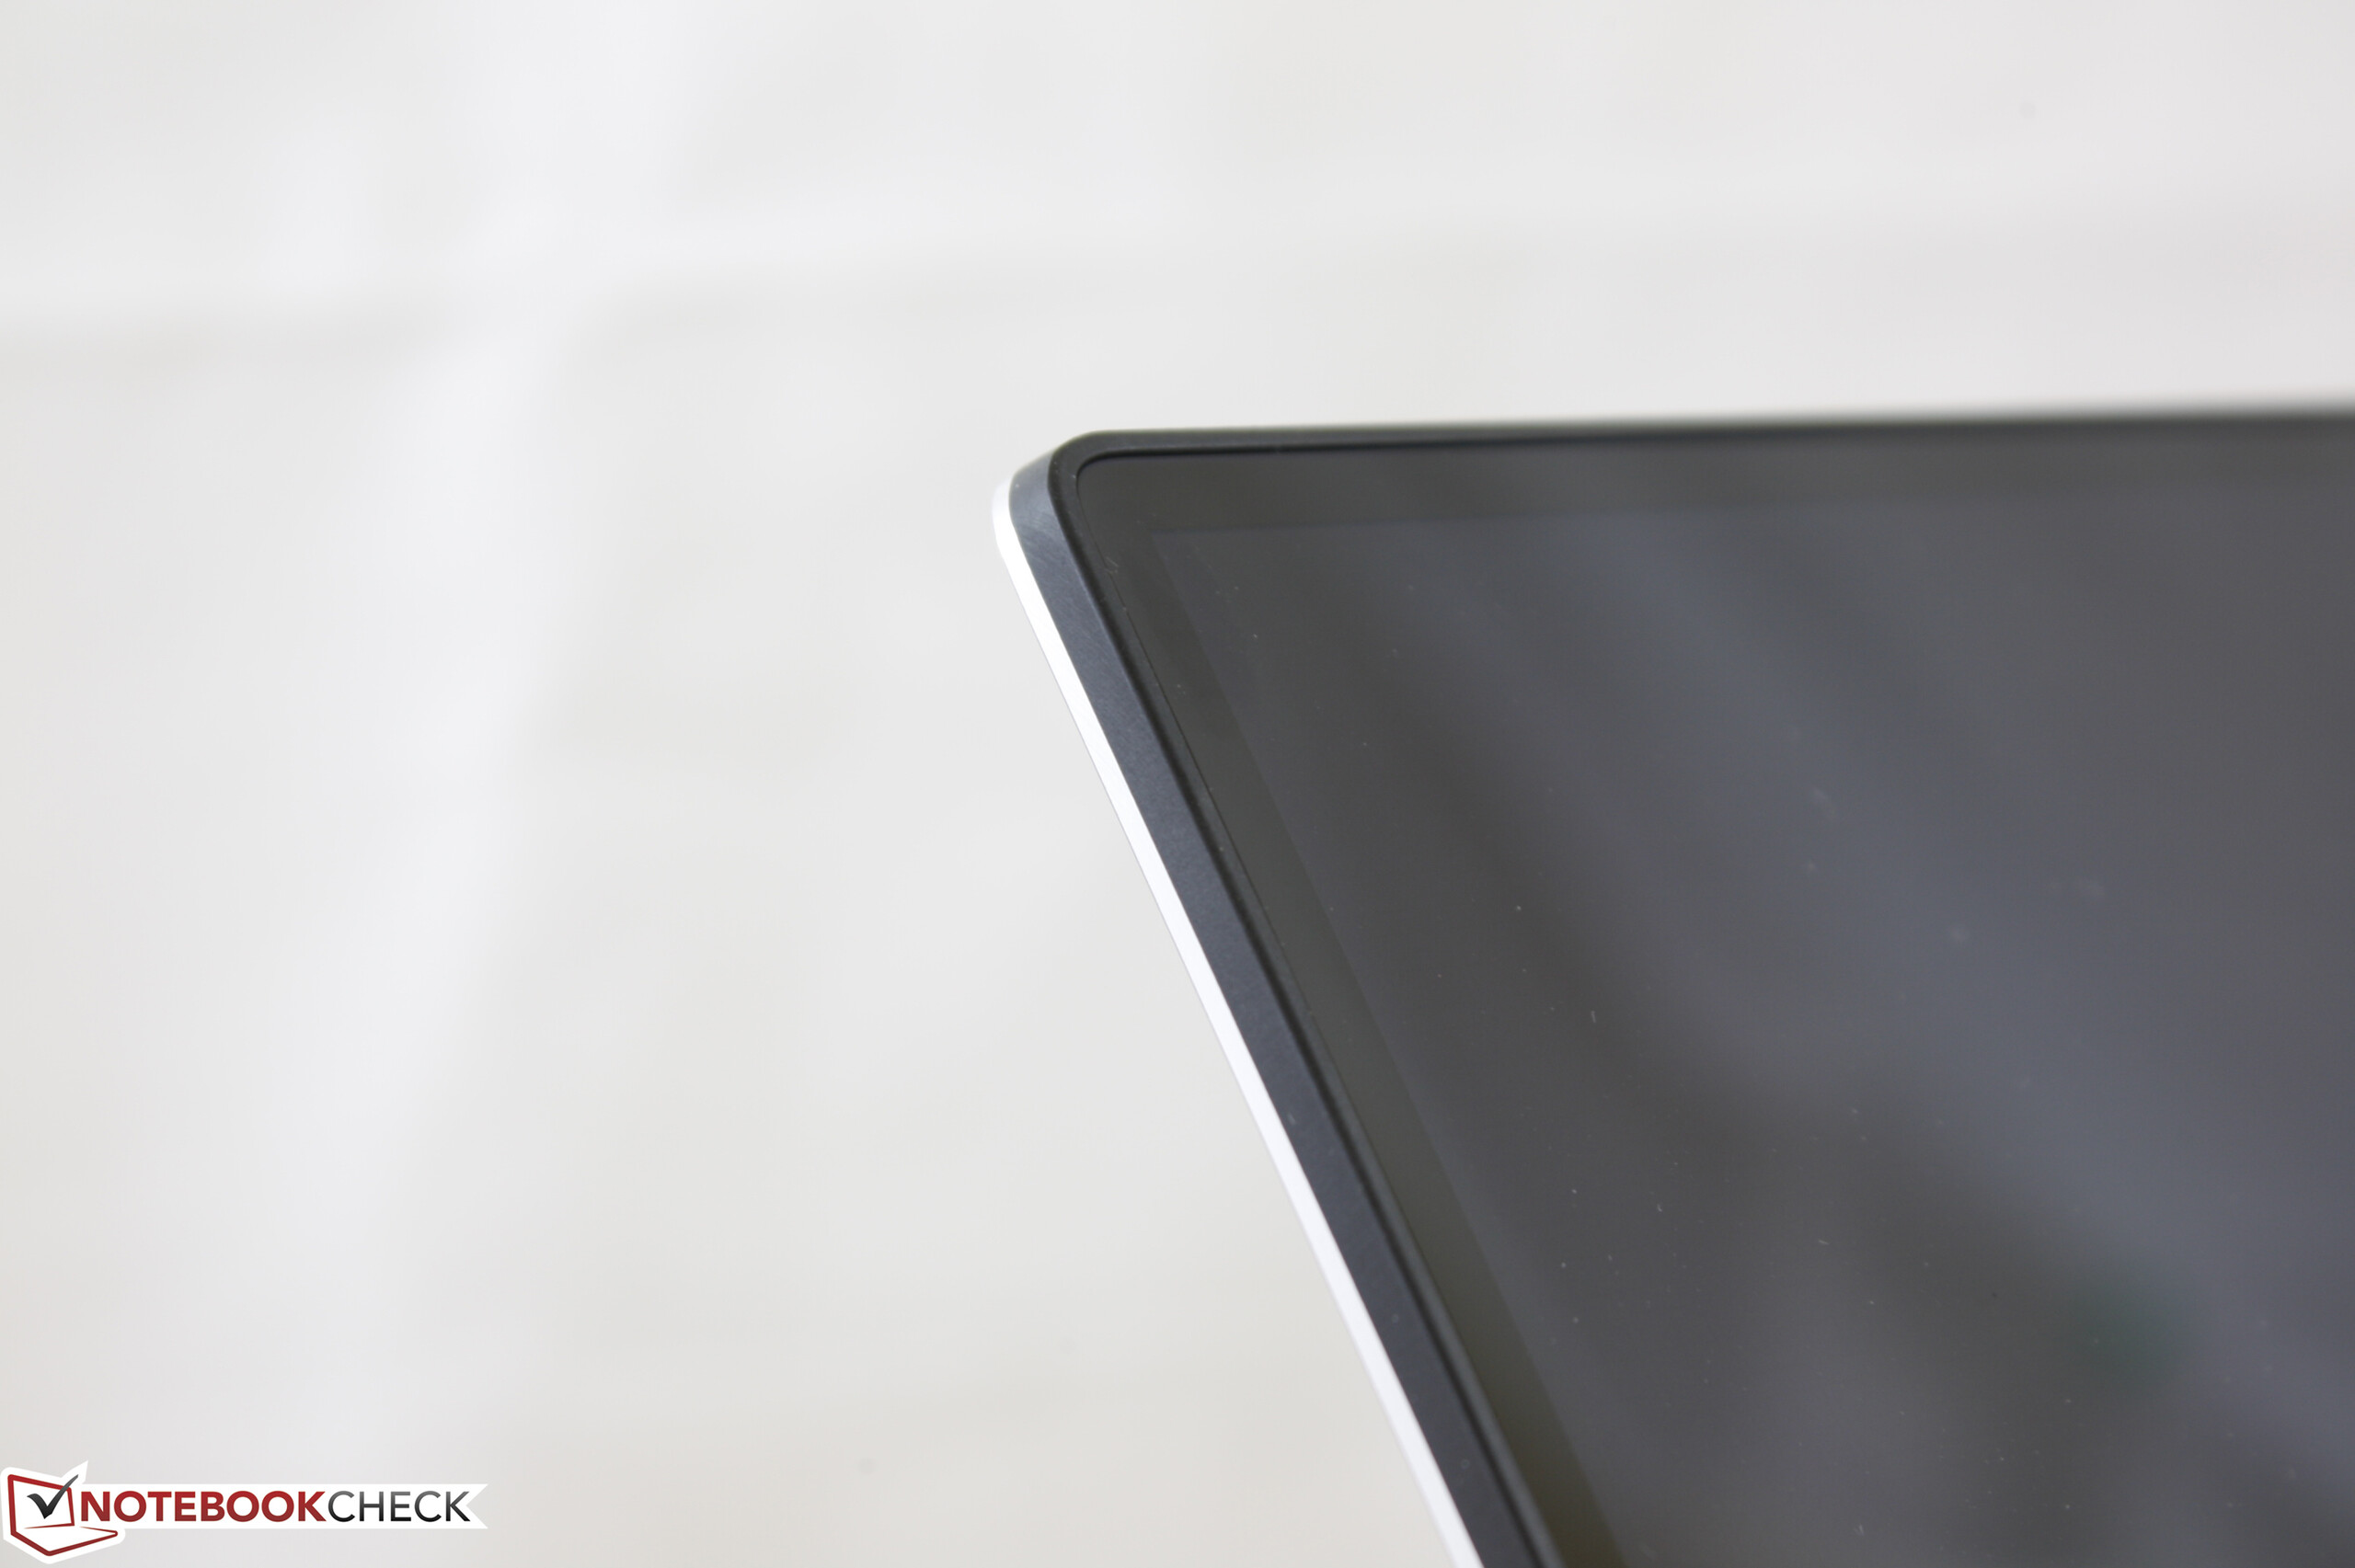
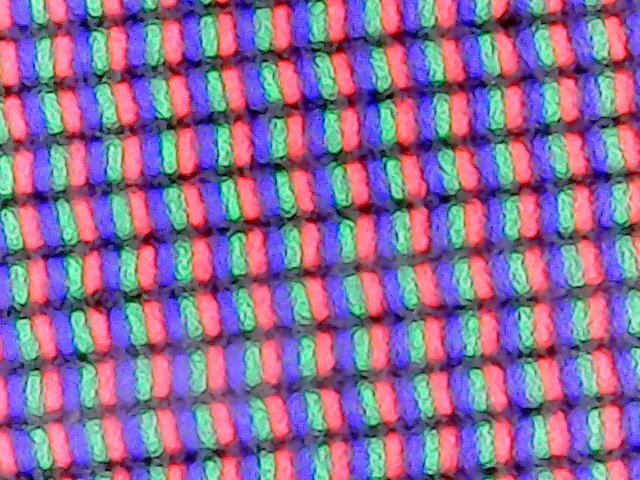
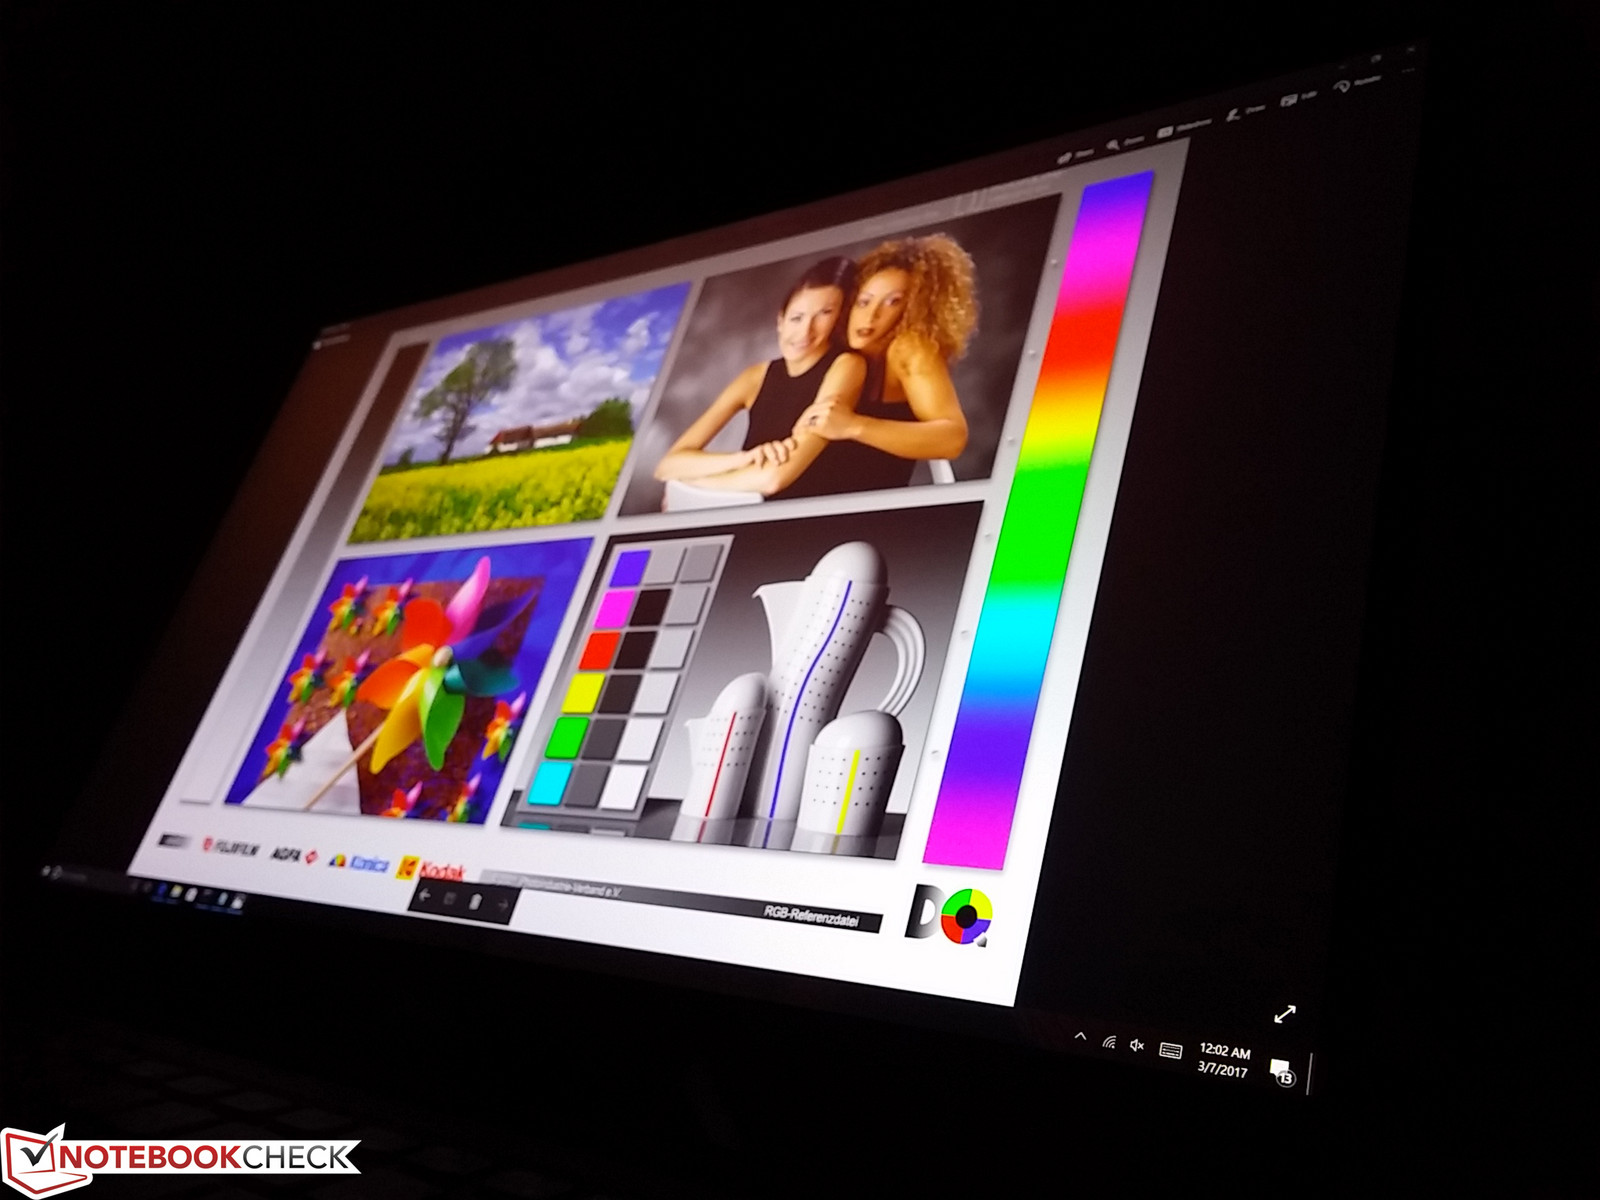
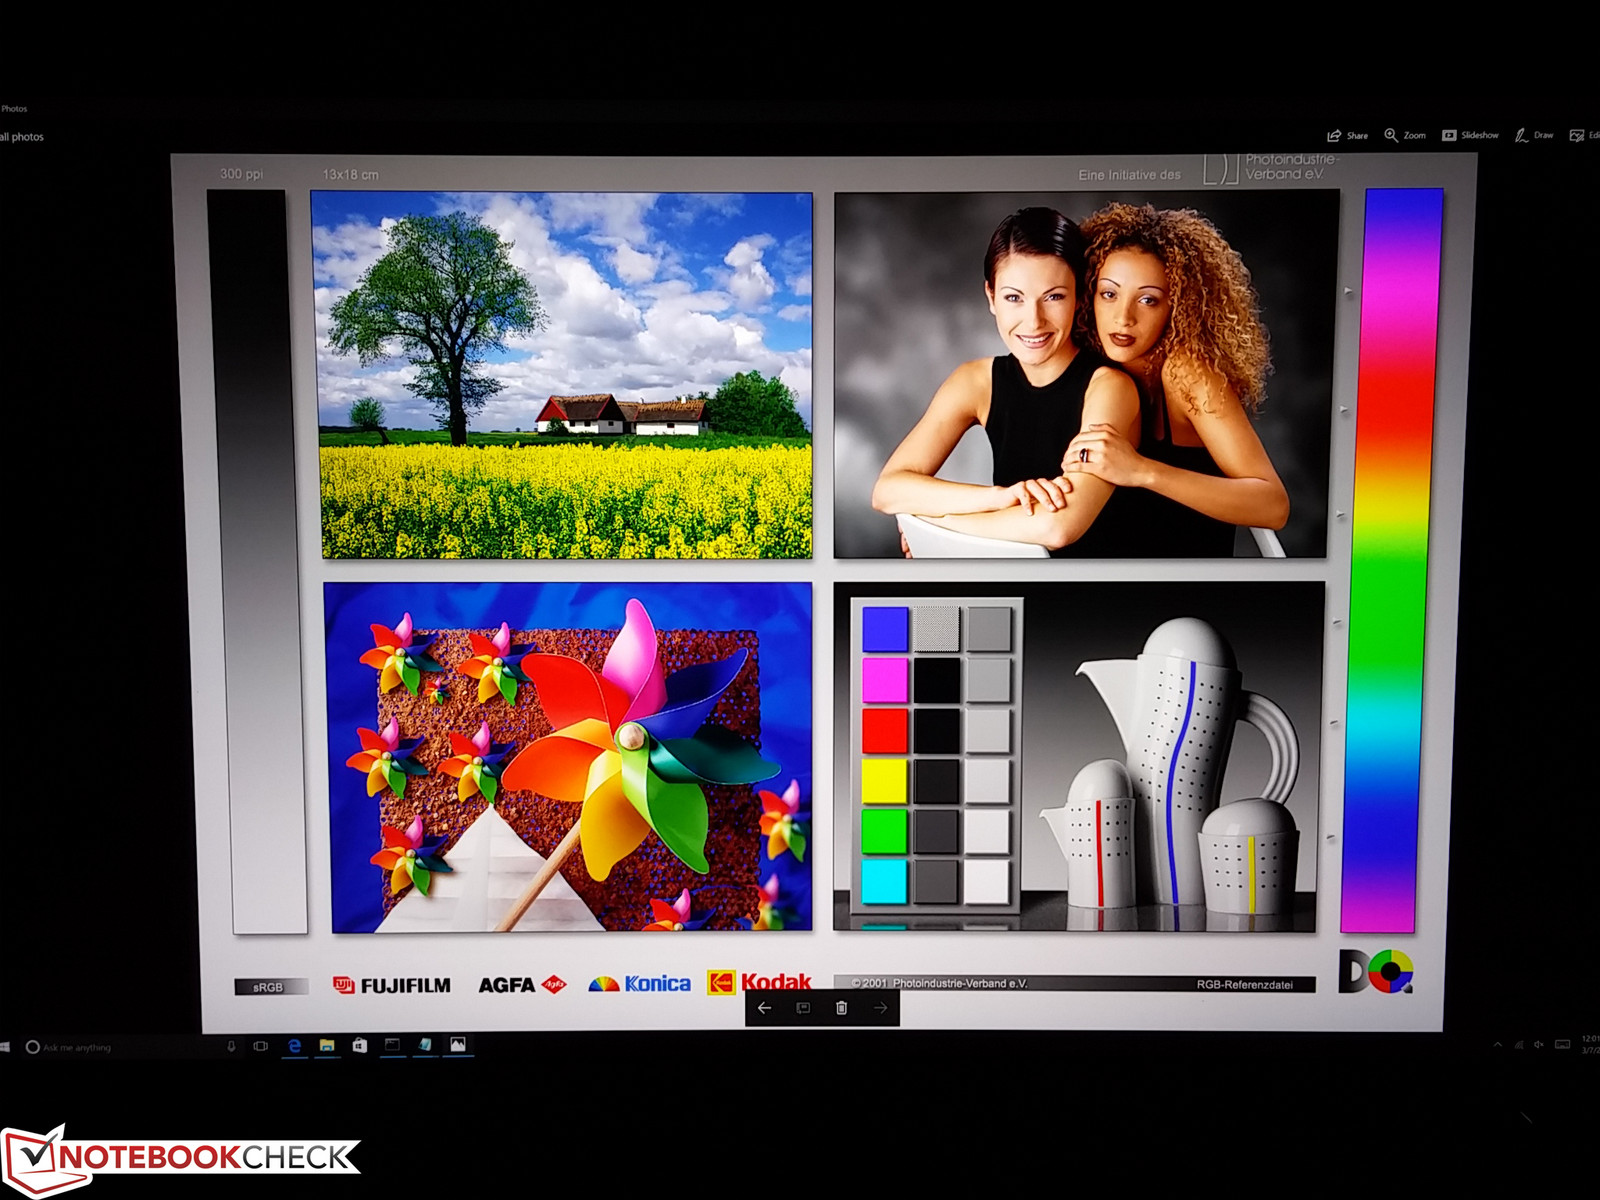
The XPS series is dazzling not only because of its thin InfinityEdge bezel but also because of its high-end displays. The glossy 4K UHD touchscreen here is once again using Sharp's signature IGZO panel for very wide colors and extreme clarity with very minimal graininess. Very similar IGZO panels can also be found on the recent Precision 7510, Precision 3510, and even the Razer Blade series, all of which are high-end or professional systems. With that said, our measurements on the 4K UHD XPS 15 9560 are nearly identical to last year's 4K UHD XPS 15 9550, so not much has improved on the already excellent display. Core characteristics like backlight brightness, contrast, and color space remain almost unchanged. Dell advertises a maximum brightness of 350 nits and we can confirm this with our own instruments.
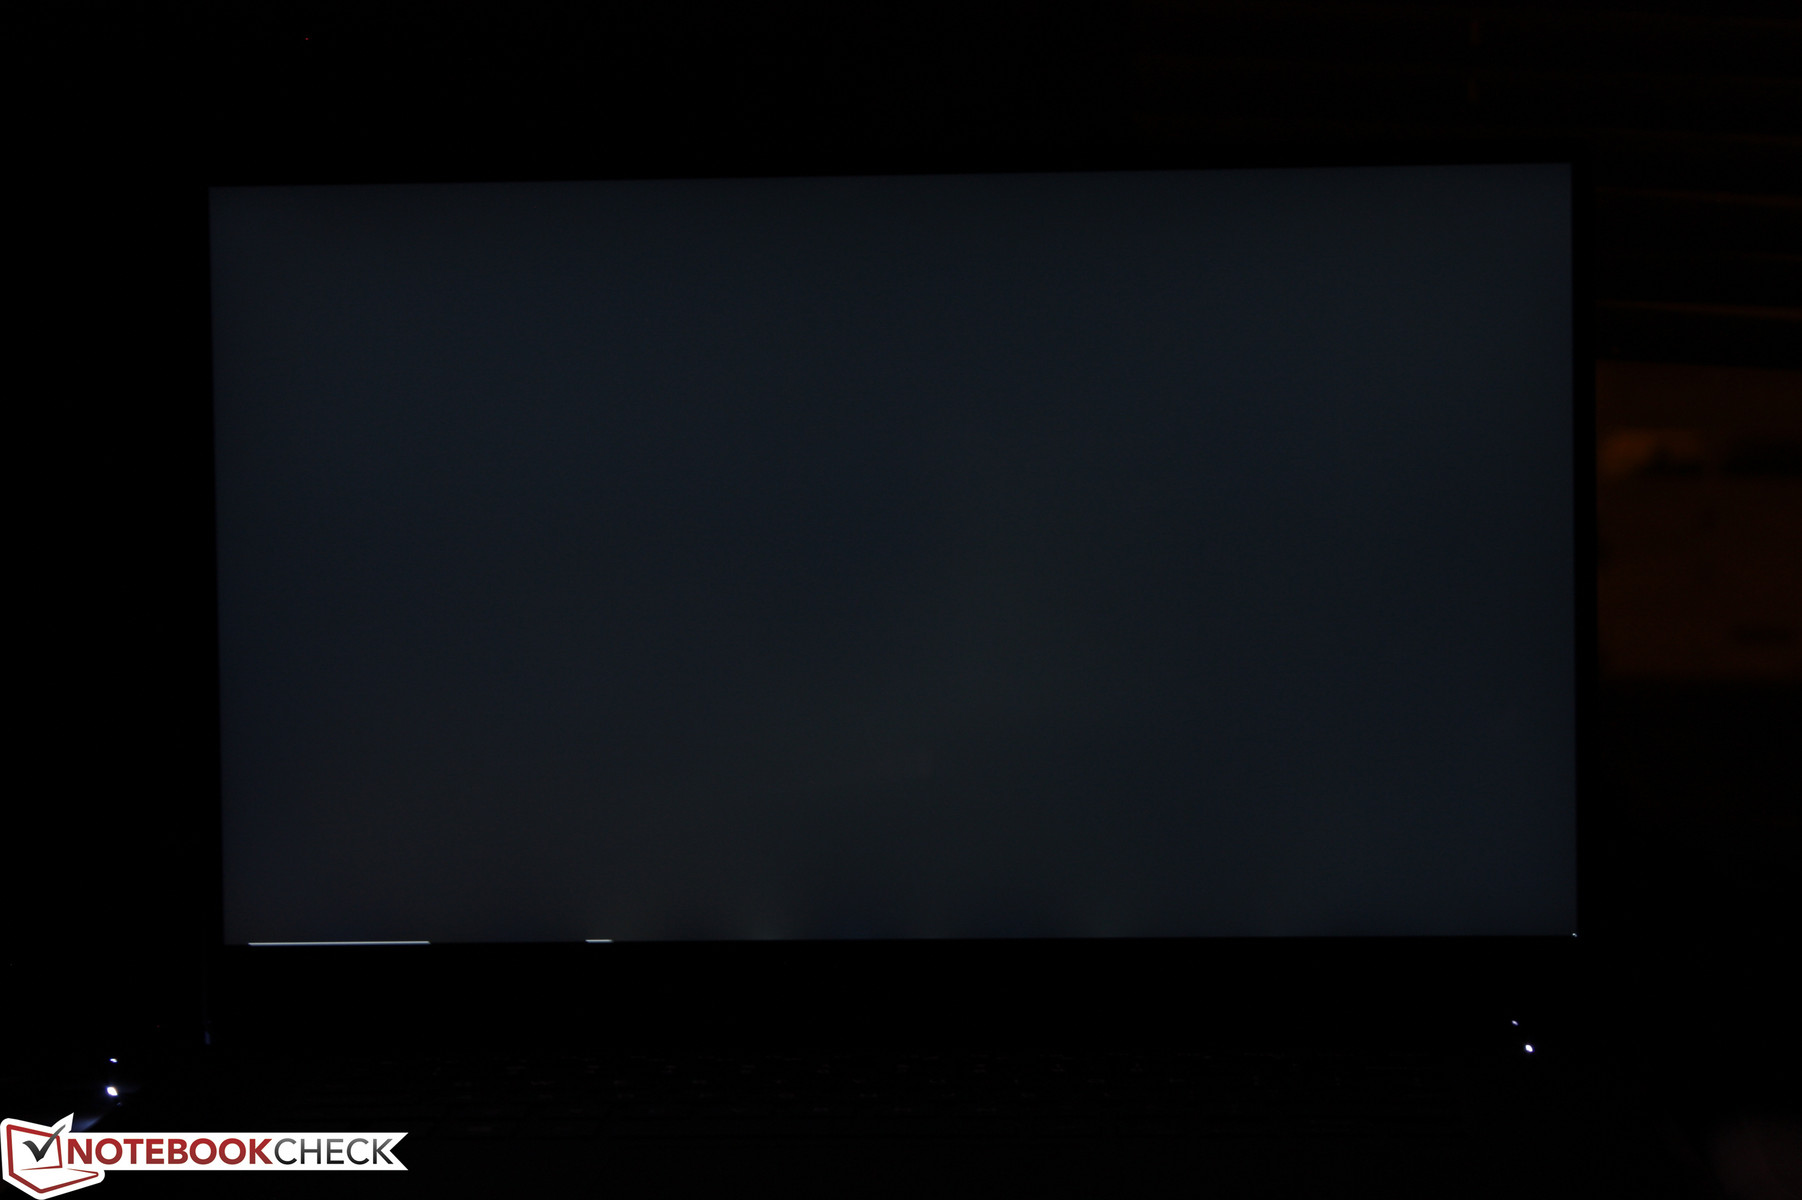
Some nitpicks about the UHD display are its average response times and some very slight backlight bleeding on the bottom edge of the screen on our test unit. Additionally, brightness uniformity could have been better as we measured higher brightness levels on the top left of the screen (381 nits) compared to the bottom right (334 nits). Subjectively, however, colors are deep and text is incredibly crisp as expected from such a high native resolution.
| |||||||||||||||||||||||||
Brightness Distribution: 87 %
Center on Battery: 370.1 cd/m²
Contrast: 1000:1 (Black: 0.37 cd/m²)
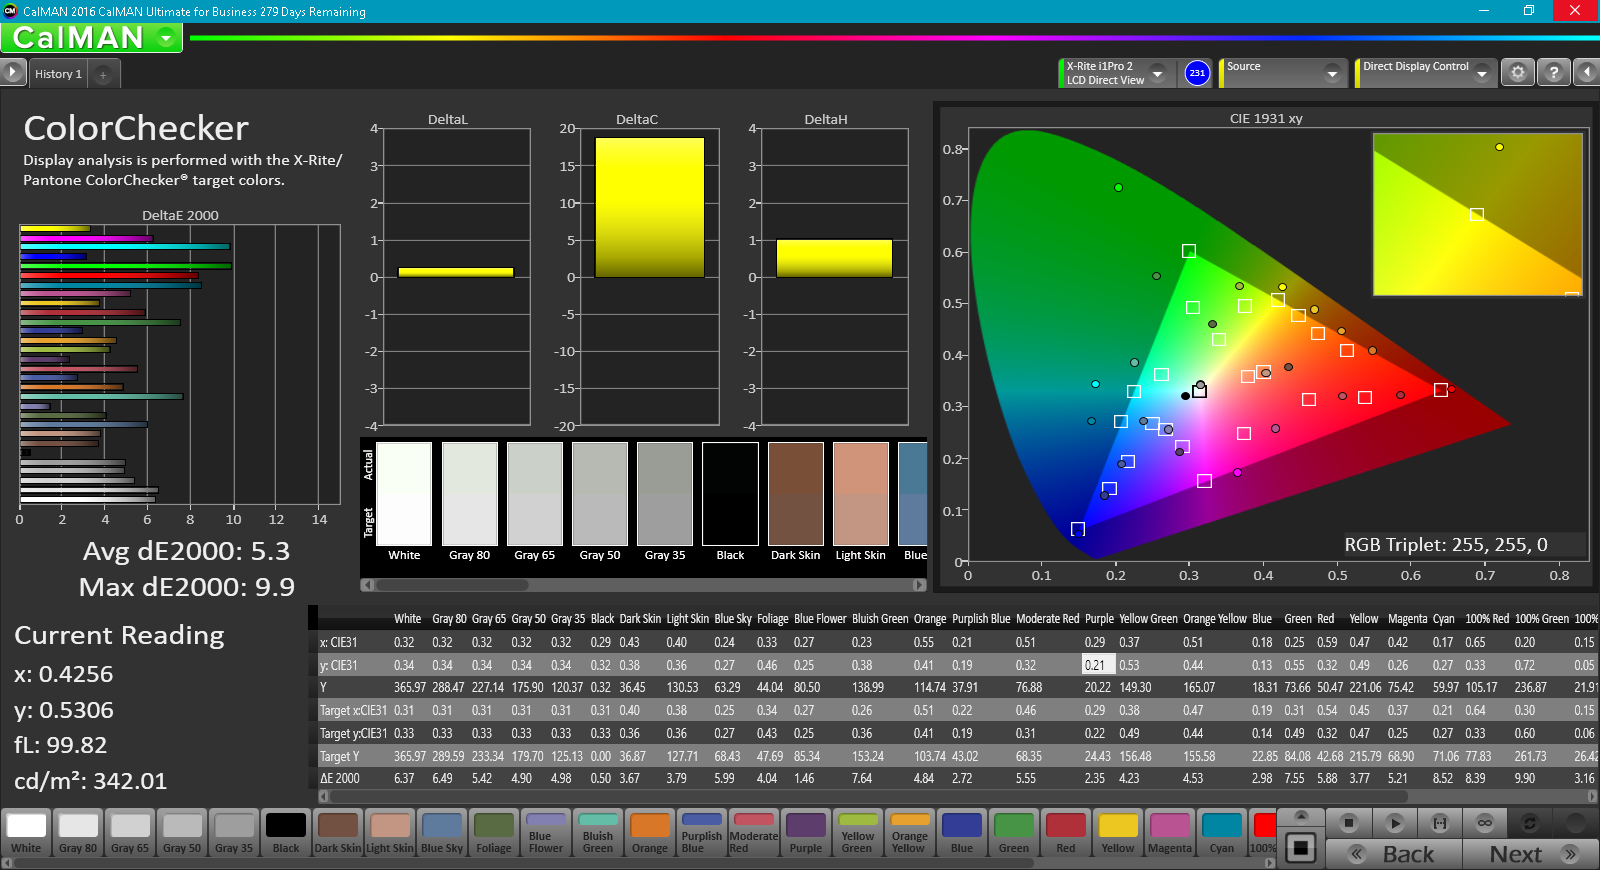
ΔE ColorChecker Calman: 5.3 | ∀{0.5-29.43 Ø4.71}
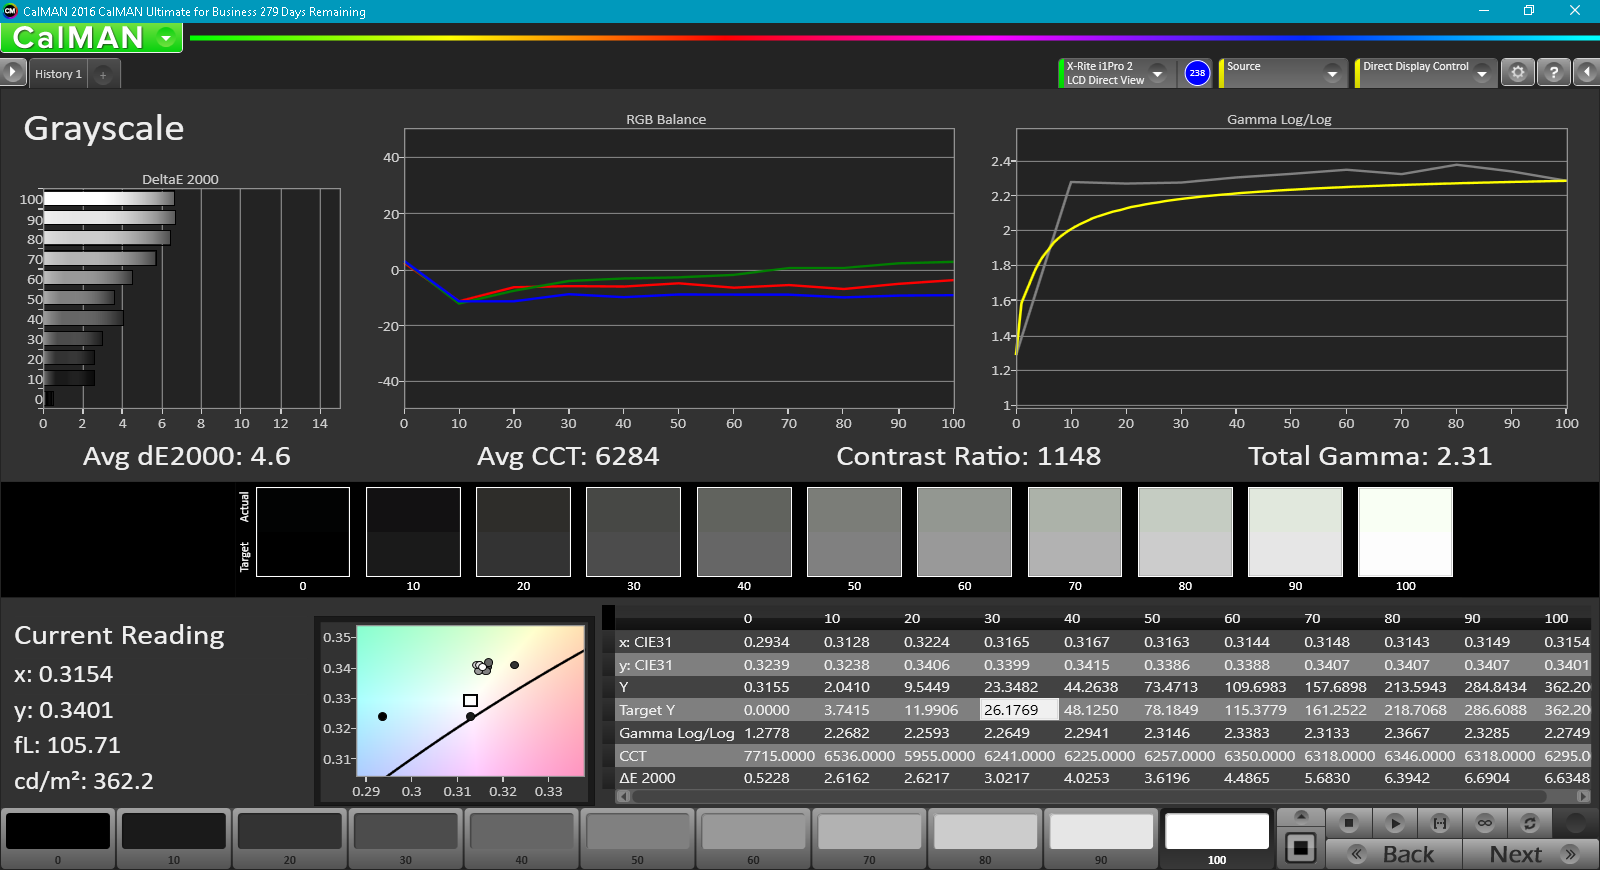
ΔE Greyscale Calman: 4.6 | ∀{0.09-98 Ø4.96}
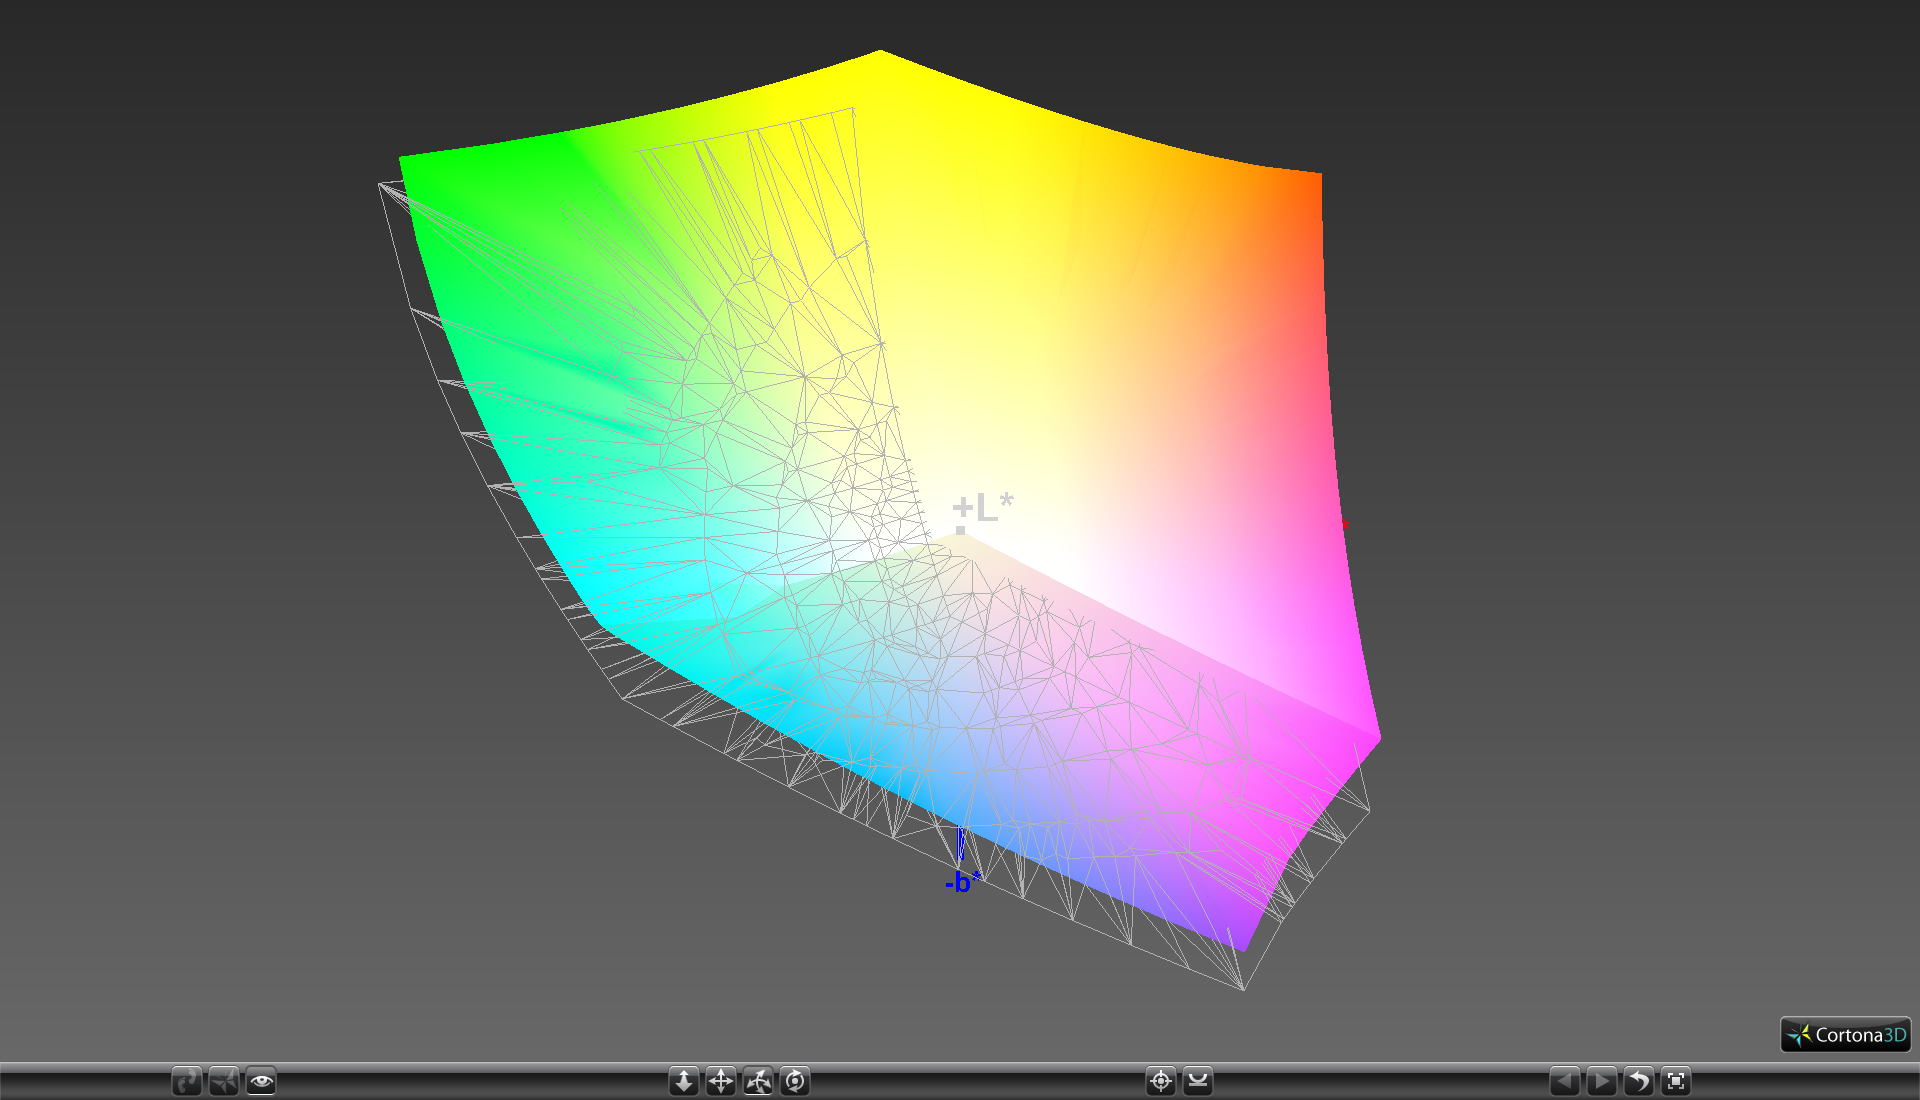
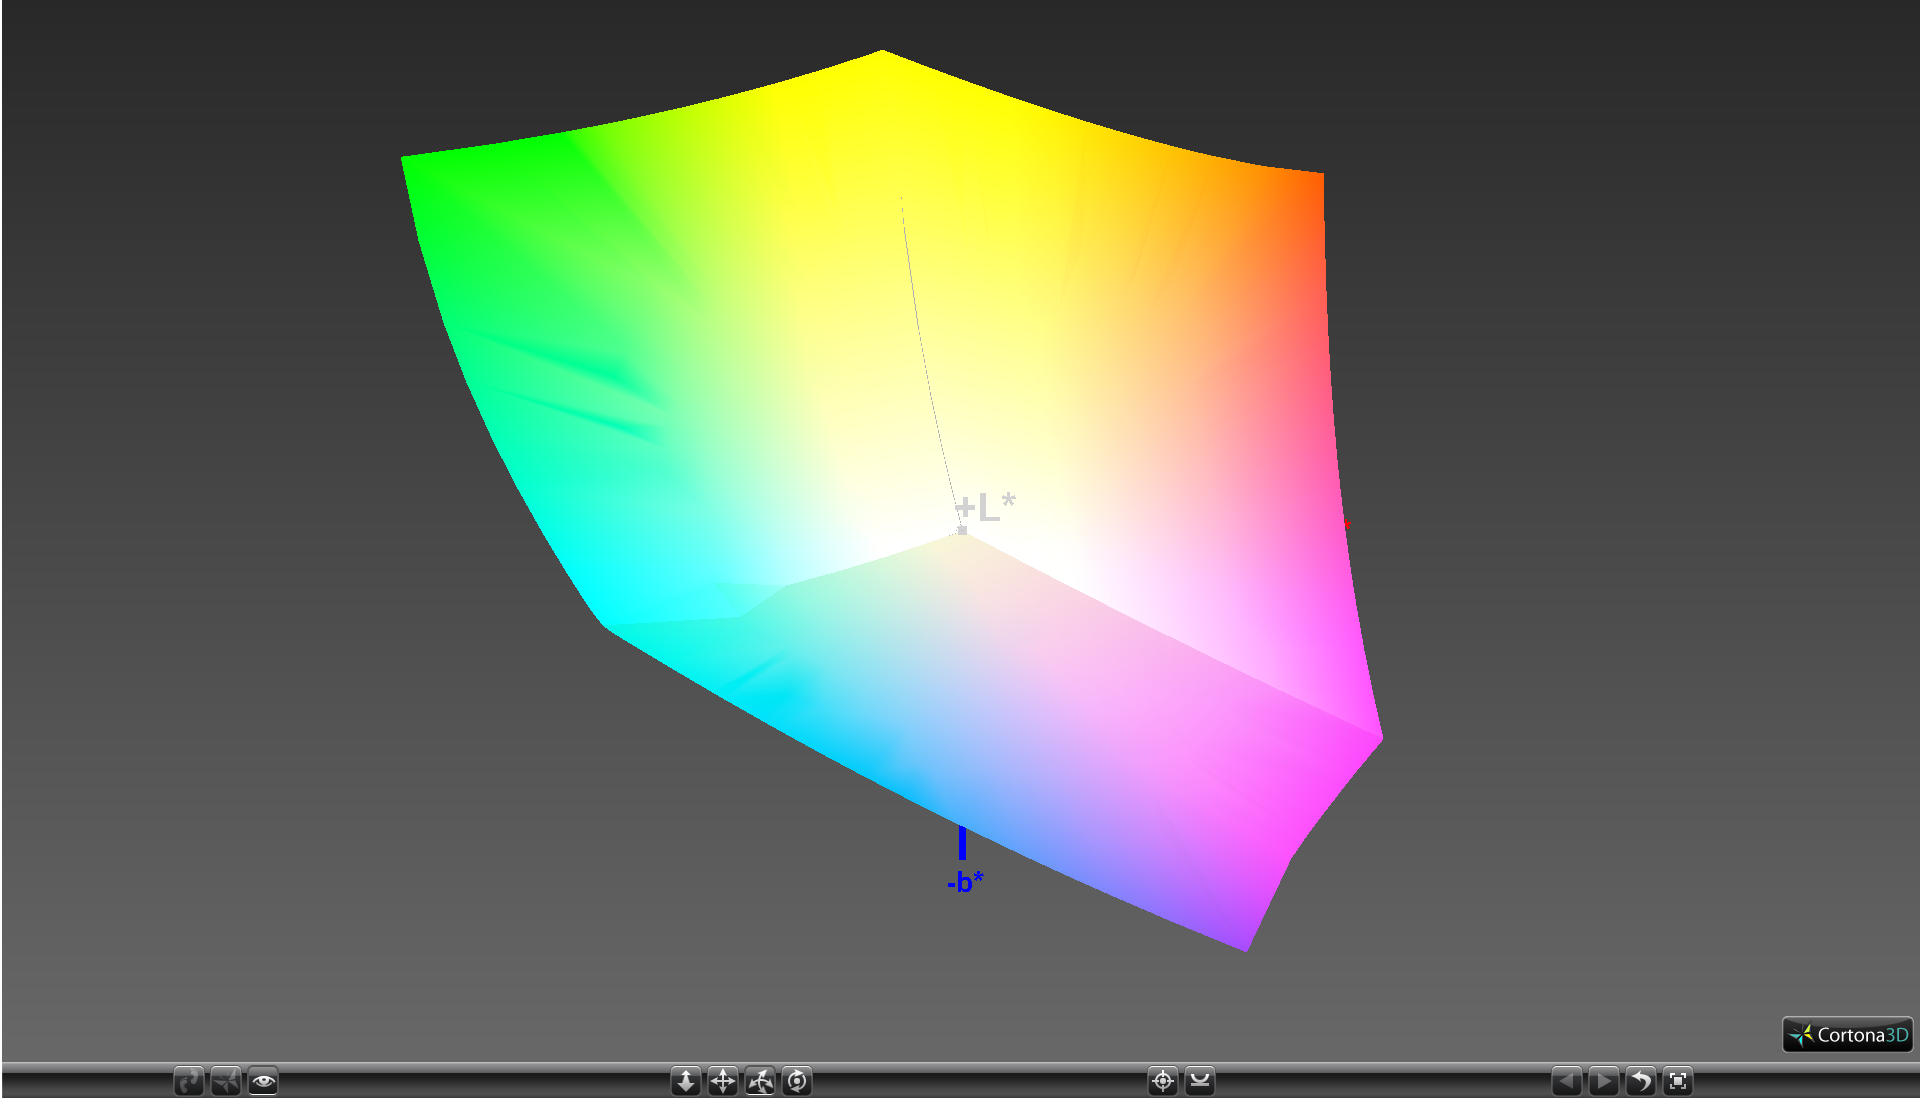
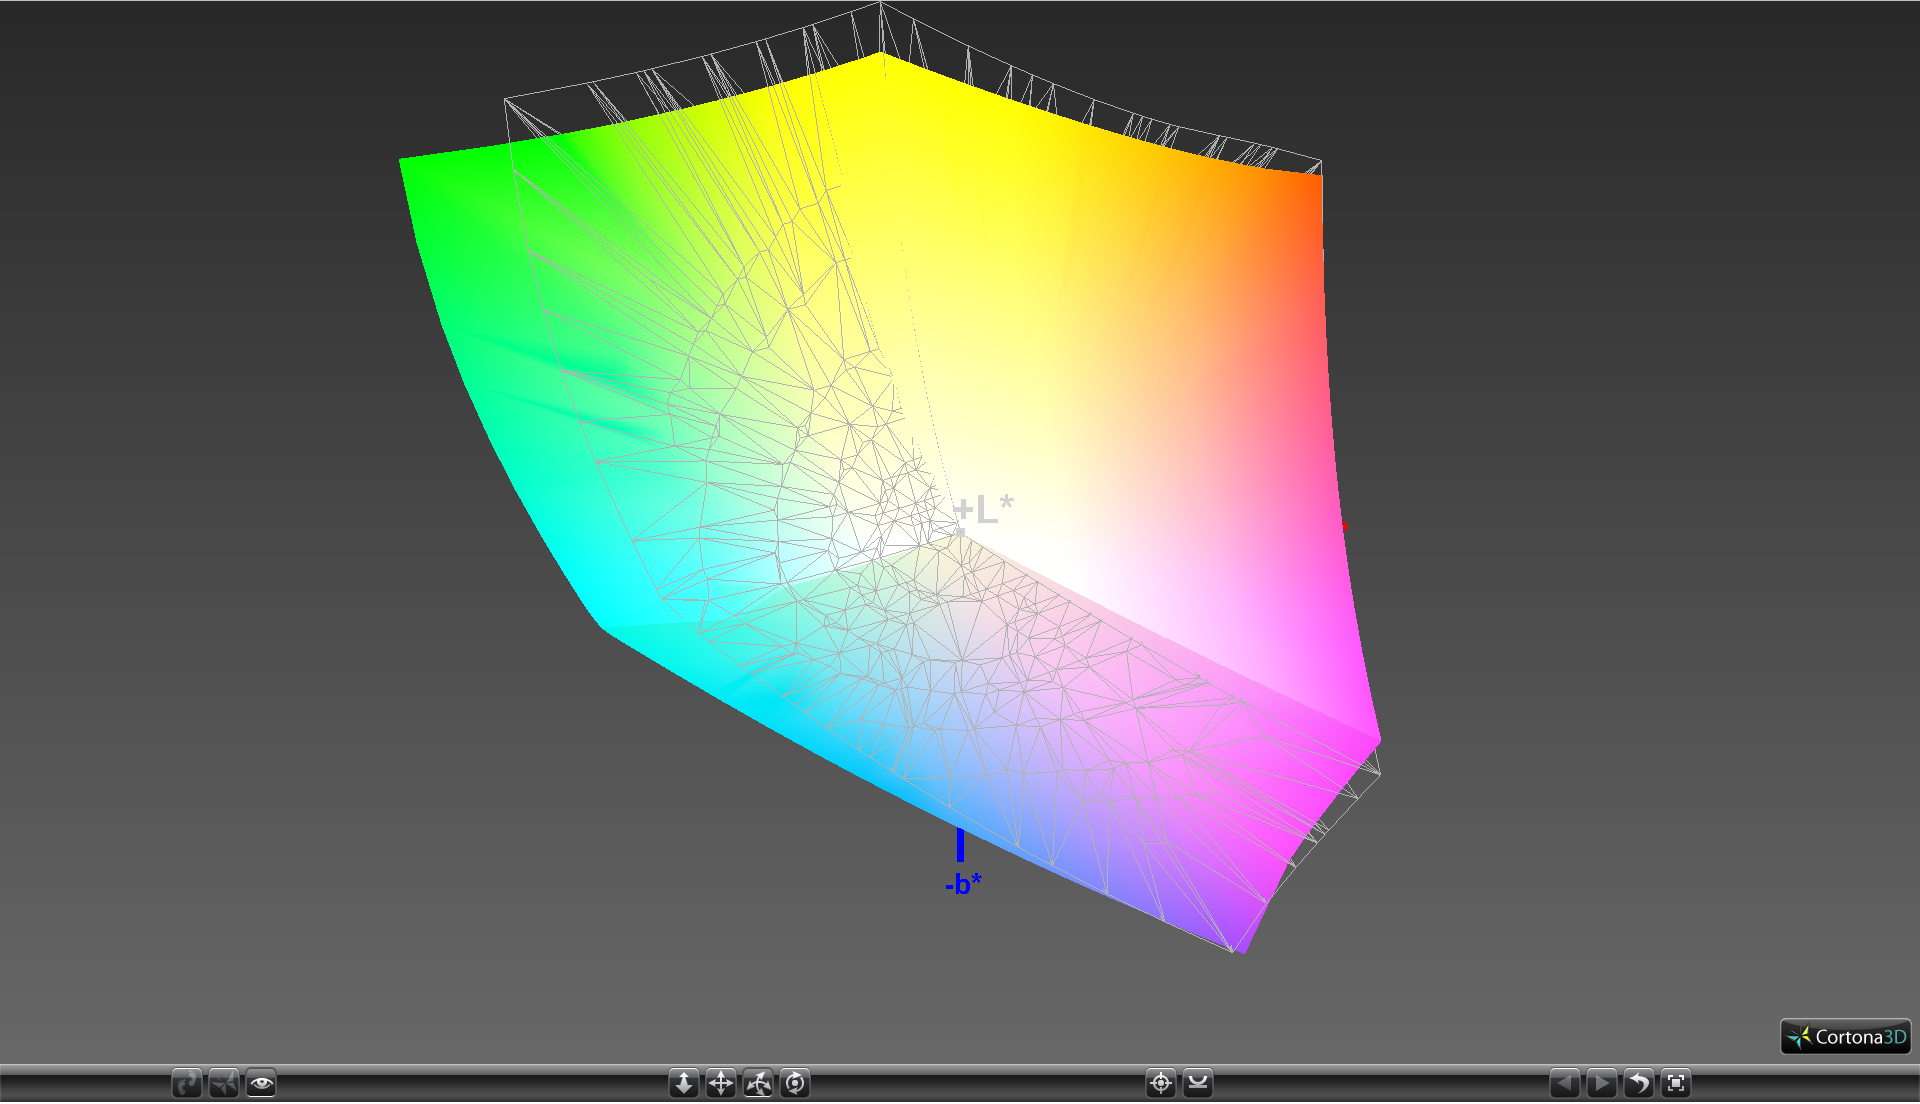
100% sRGB (Argyll 1.6.3 3D)
88.3% AdobeRGB 1998 (Argyll 1.6.3 3D)
100% AdobeRGB 1998 (Argyll 3D)
100% sRGB (Argyll 3D)
89.7% Display P3 (Argyll 3D)
Gamma: 2.31
CCT: 6284 K
| Dell XPS 15 9560 (i7-7700HQ, UHD) IGZO IPS, 15.6", 3840x2160 | Asus FX502VM-AS73 TN LED, 15.6", 1920x1080 | Apple MacBook Pro 15 2016 (2.9 GHz, 460) Apple APPA030, IPS, 15.4", 2880x1800 | HP Spectre x360 15-bl002xx UHD UWVA eDP BrightView WLED-backlit , IPS, 15.6", 3840x2160 | Dell XPS 15 2017 9560 (7300HQ, Full-HD) Sharp SHP1453 LQ156M1, LED IGZO IPS InfinityEdge, 15.6", 1920x1080 | |
|---|---|---|---|---|---|
| Display | -54% | -1% | -24% | -18% | |
| Display P3 Coverage (%) | 89.7 | 38.28 -57% | 99 10% | 67.9 -24% | 68.9 -23% |
| sRGB Coverage (%) | 100 | 56.9 -43% | 100 0% | 88.2 -12% | 98.9 -1% |
| AdobeRGB 1998 Coverage (%) | 100 | 39.47 -61% | 87.3 -13% | 64.4 -36% | 70.9 -29% |
| Response Times | 47% | -12% | 12% | -14% | |
| Response Time Grey 50% / Grey 80% * (ms) | 57.2 ? | 28.4 ? 50% | 46 ? 20% | 44 ? 23% | 54 ? 6% |
| Response Time Black / White * (ms) | 39.2 ? | 22.4 ? 43% | 56 ? -43% | 38.8 ? 1% | 52.4 ? -34% |
| PWM Frequency (Hz) | 962 | 119000 ? | 1000 ? | ||
| Screen | -36% | 20% | 15% | 2% | |
| Brightness middle (cd/m²) | 370.1 | 209.5 -43% | 420 13% | 351.5 -5% | 400 8% |
| Brightness (cd/m²) | 356 | 205 -42% | 401 13% | 336 -6% | 392 10% |
| Brightness Distribution (%) | 87 | 92 6% | 90 3% | 83 -5% | 89 2% |
| Black Level * (cd/m²) | 0.37 | 0.69 -86% | 0.3 19% | 0.24 35% | 0.26 30% |
| Contrast (:1) | 1000 | 304 -70% | 1400 40% | 1465 47% | 1538 54% |
| Colorchecker dE 2000 * | 5.3 | 4.7 11% | 3.33 37% | 3.3 38% | 4.9 8% |
| Colorchecker dE 2000 max. * | 9.9 | 19.7 -99% | 5.11 48% | 7.3 26% | 11 -11% |
| Greyscale dE 2000 * | 4.6 | 1.8 61% | 2.73 41% | 1.9 59% | 7.2 -57% |
| Gamma | 2.31 95% | 2.23 99% | 2.48 89% | 2.09 105% | 2.11 104% |
| CCT | 6284 103% | 6975 93% | 6457 101% | 6784 96% | 6911 94% |
| Color Space (Percent of AdobeRGB 1998) (%) | 88.3 | 36.2 -59% | 78.09 -12% | 64.4 -27% | 64.2 -27% |
| Color Space (Percent of sRGB) (%) | 100 | 56.6 -43% | 99.97 0% | 88.2 -12% | 98.9 -1% |
| Total Average (Program / Settings) | -14% /
-29% | 2% /
12% | 1% /
7% | -10% /
-4% |
* ... smaller is better
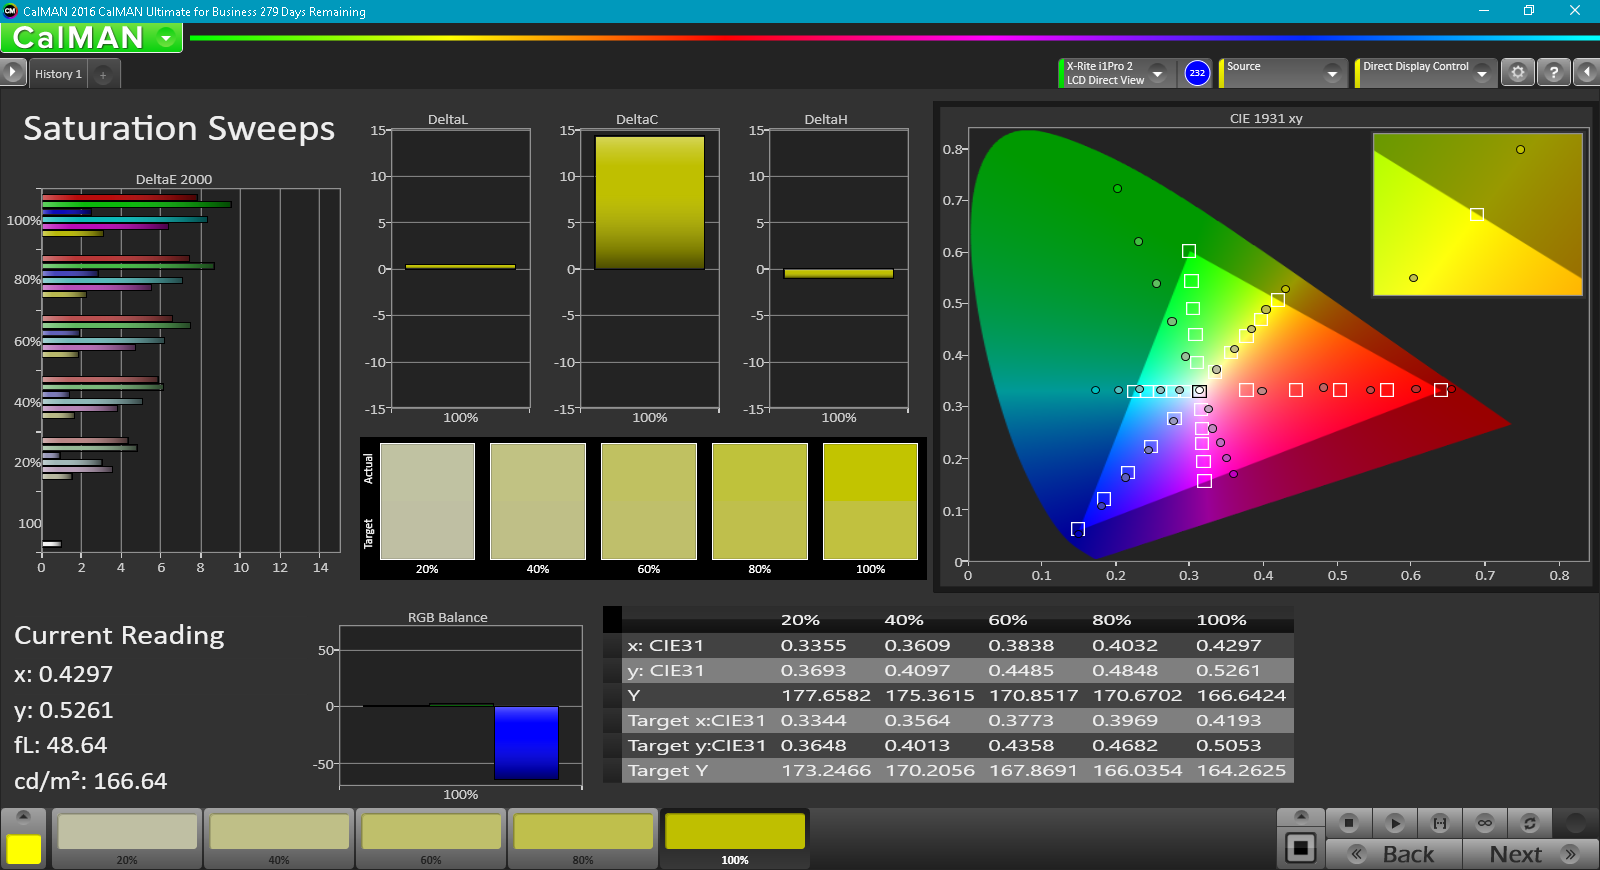
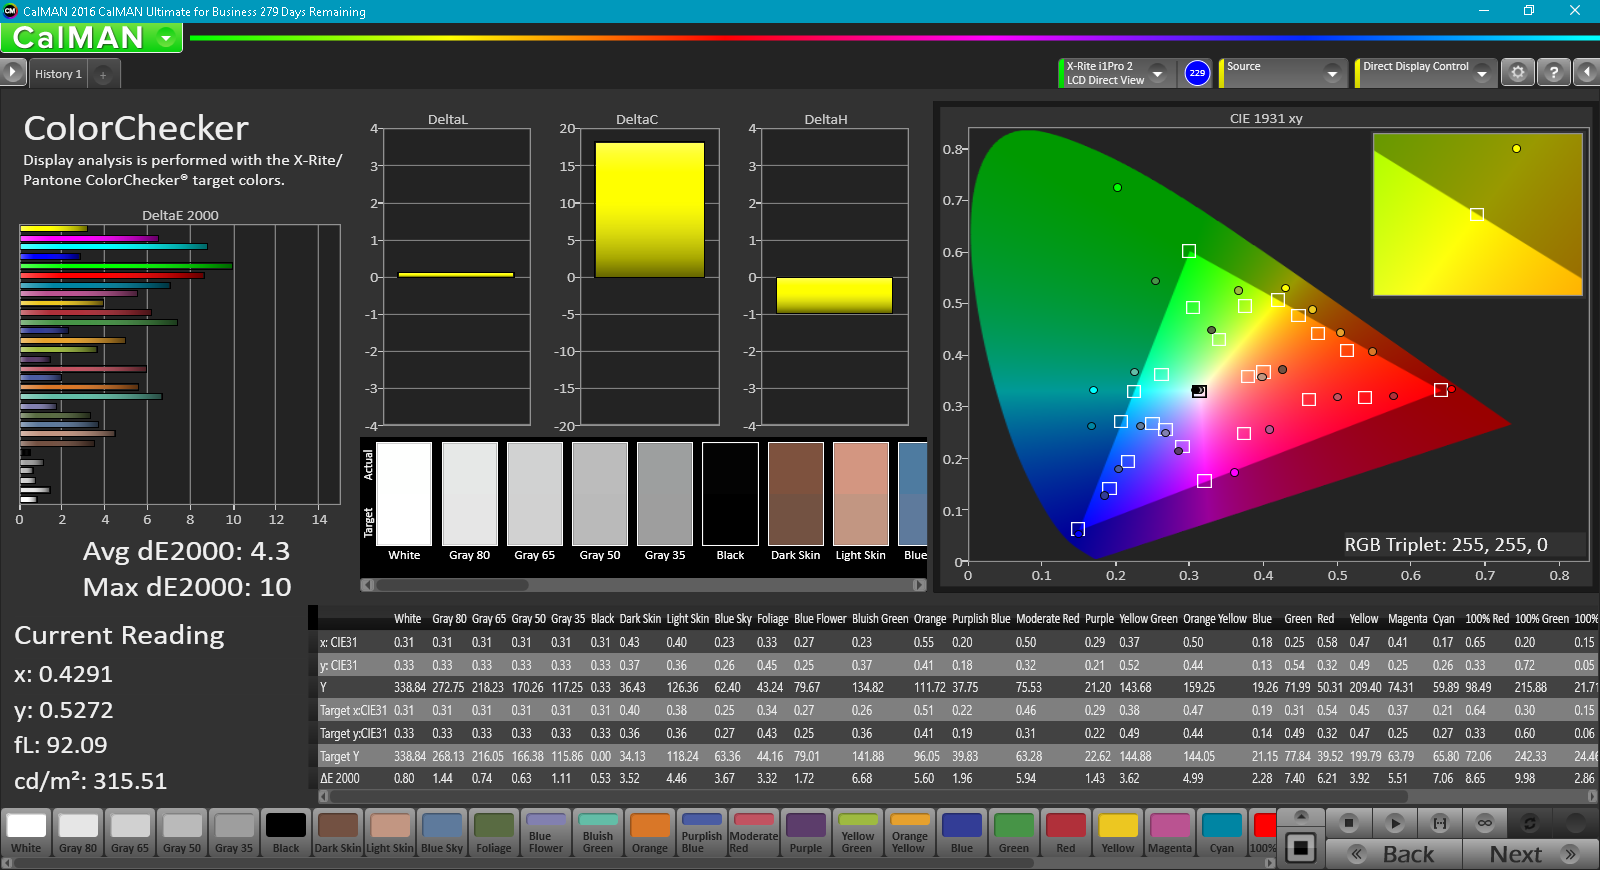
Dell advertises the XPS 15 as the "only laptop with 100% Adobe RGB color". Our measurements show that the reproducible color space of the 4K UHD panel is slightly shifted from the AdobeRGB standard, so coverage is a bit less than 100 percent. Nonetheless, the 4K UHD SKU has a wider gamut than the FHD SKU and essentially all other multimedia notebooks we've tested for that matter including the latest MacBook Pro 15.
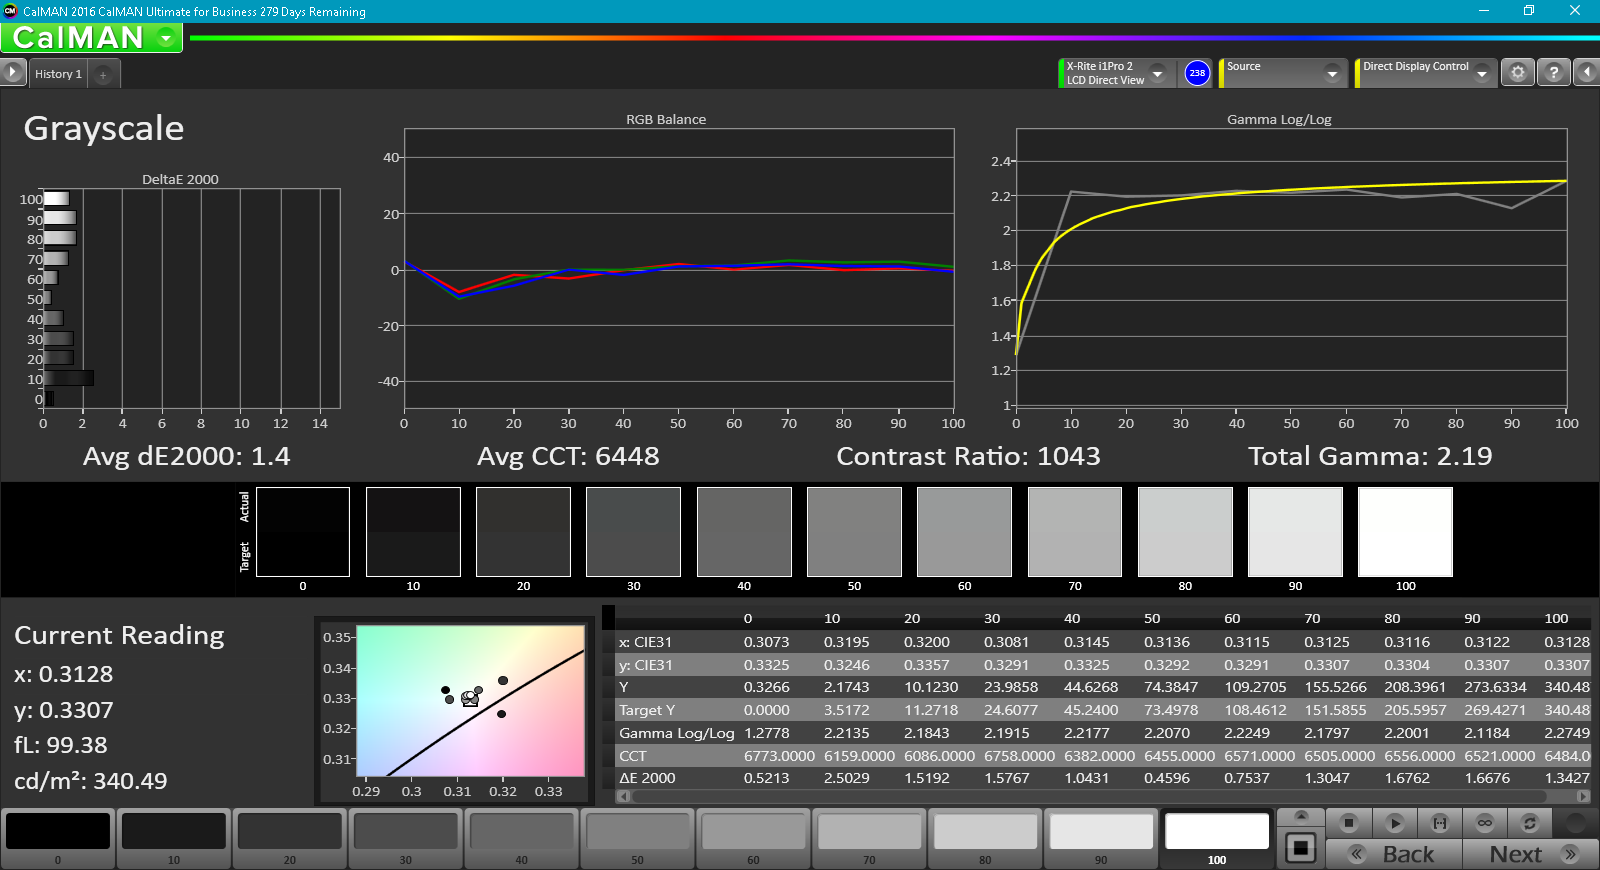
Further display measurements with a X-Rite spectrophotometer reveal good colors and average grayscale out of the box. A calibration brings gamma closer to the 2.2 ideal for sRGB and improves grayscale as well, though colors remain largely the same. More fine-tuning should bring colors closer to the sRGB standard since the panel covers more than the defined spectrum.

Display Response Times
| ↔ Response Time Black to White | ||
|---|---|---|
| 39.2 ms ... rise ↗ and fall ↘ combined | ↗ 23.6 ms rise | 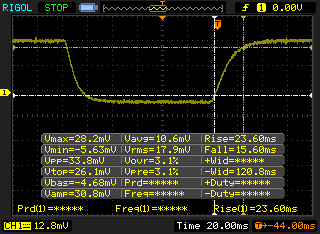 |
| ↘ 15.6 ms fall | ||
| The screen shows slow response rates in our tests and will be unsatisfactory for gamers. In comparison, all tested devices range from 0.1 (minimum) to 240 (maximum) ms. » 97 % of all devices are better. This means that the measured response time is worse than the average of all tested devices (19.8 ms). | ||
| ↔ Response Time 50% Grey to 80% Grey | ||
| 57.2 ms ... rise ↗ and fall ↘ combined | ↗ 27.2 ms rise | 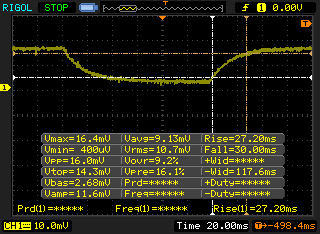 |
| ↘ 30 ms fall | ||
| The screen shows slow response rates in our tests and will be unsatisfactory for gamers. In comparison, all tested devices range from 0.165 (minimum) to 636 (maximum) ms. » 94 % of all devices are better. This means that the measured response time is worse than the average of all tested devices (30.9 ms). | ||
Screen Flickering / PWM (Pulse-Width Modulation)
| Screen flickering / PWM detected | 962 Hz | 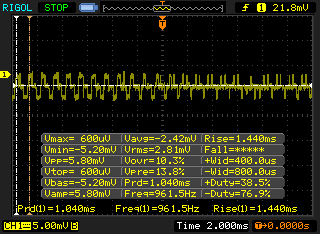 | |
The display backlight flickers at 962 Hz (worst case, e.g., utilizing PWM) . The frequency of 962 Hz is quite high, so most users sensitive to PWM should not notice any flickering. In comparison: 52 % of all tested devices do not use PWM to dim the display. If PWM was detected, an average of 7741 (minimum: 5 - maximum: 343500) Hz was measured. | |||
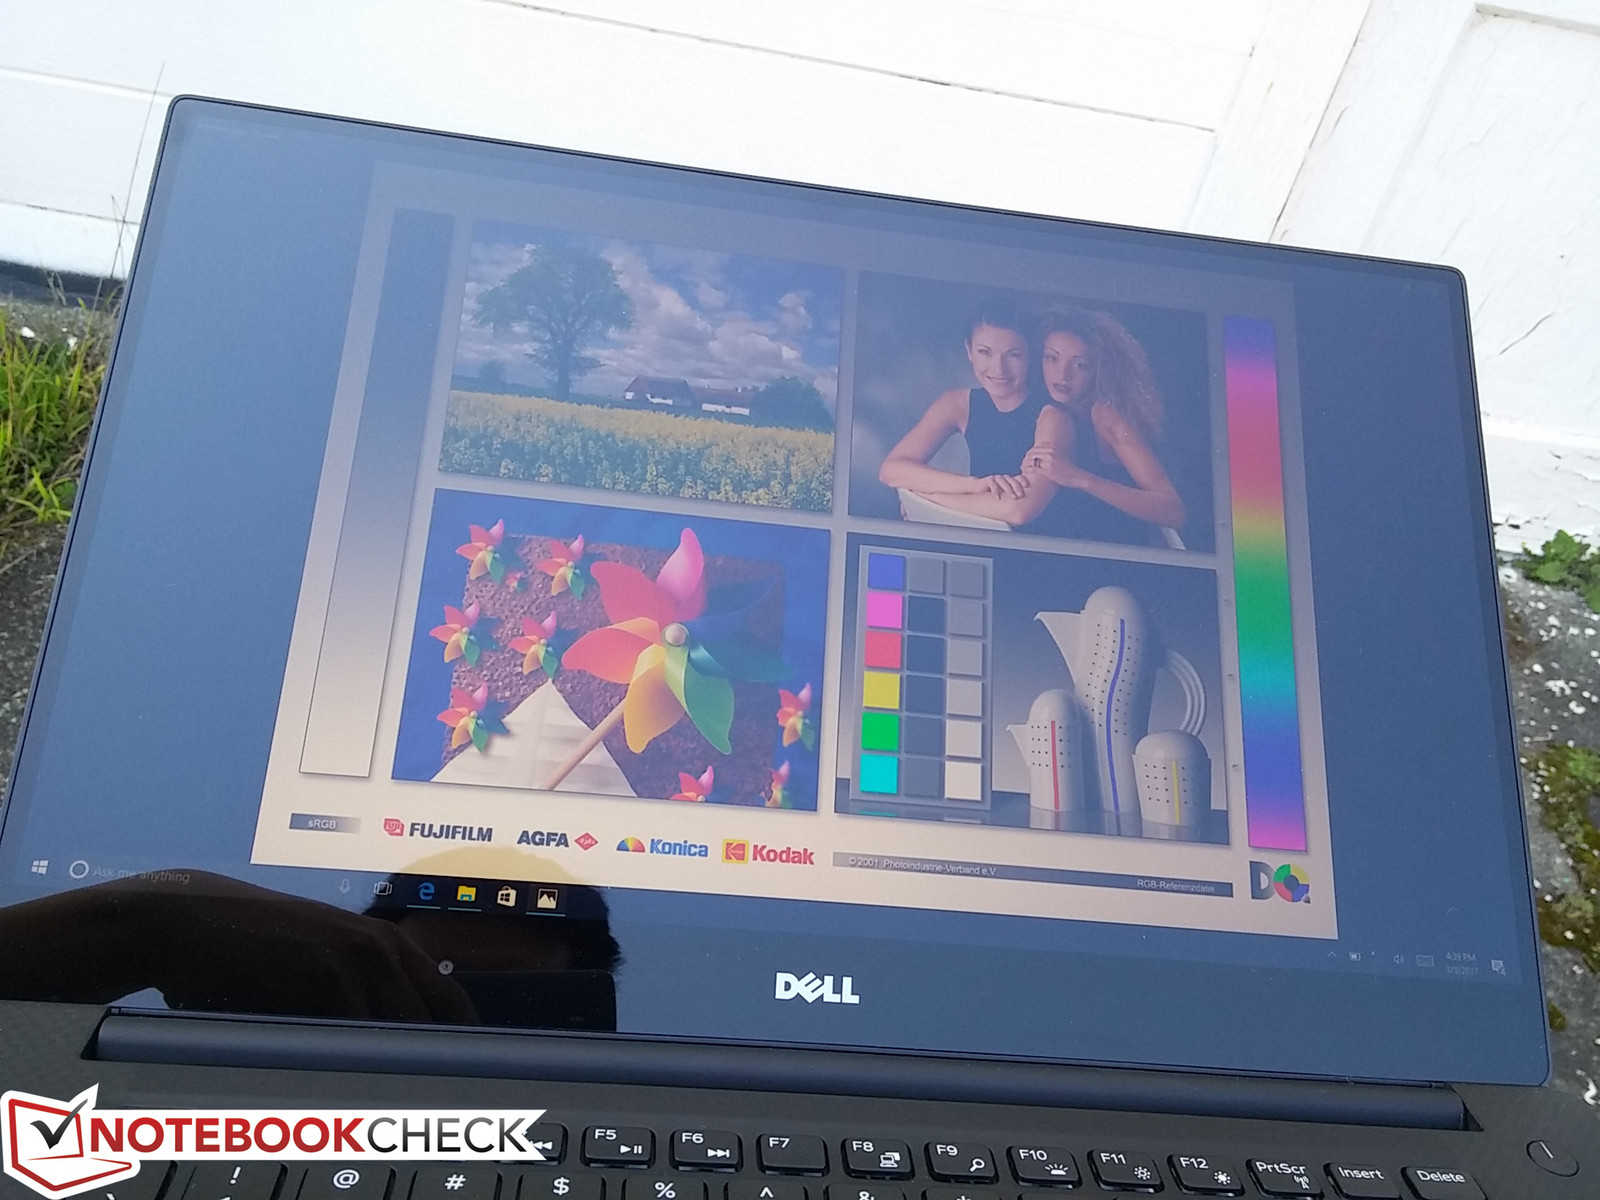
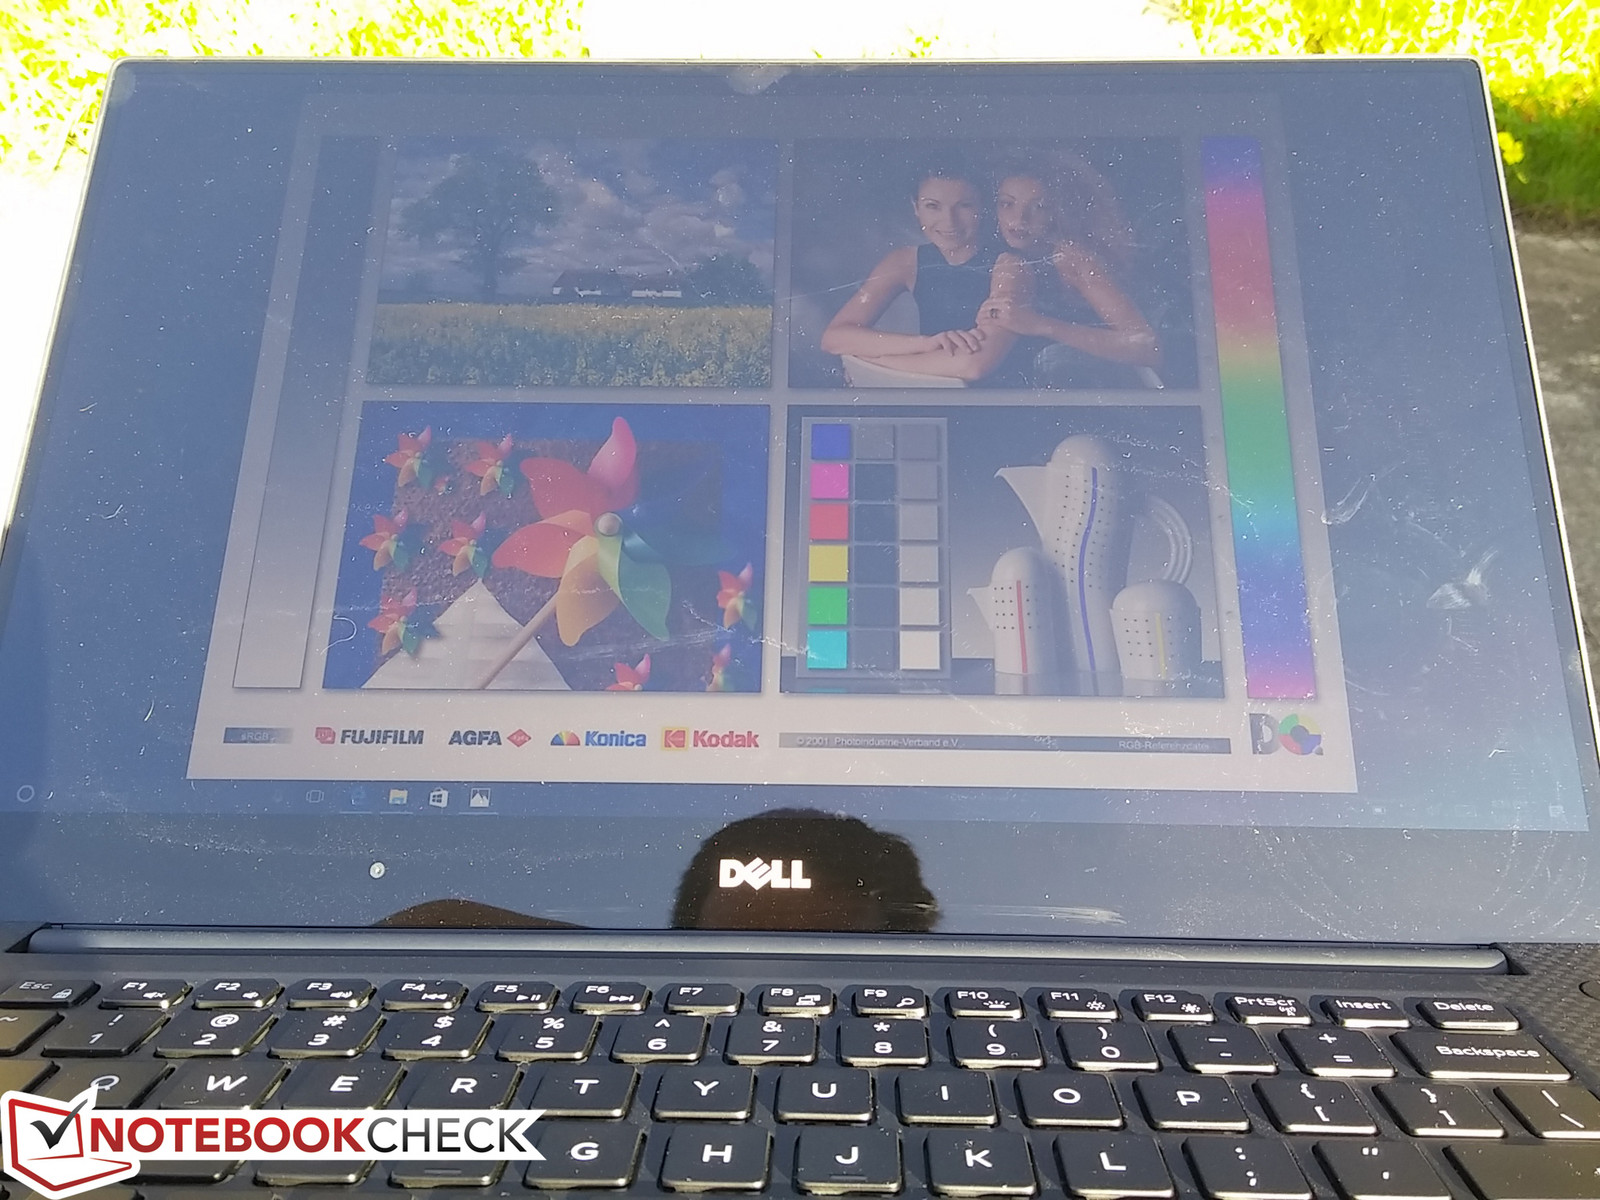
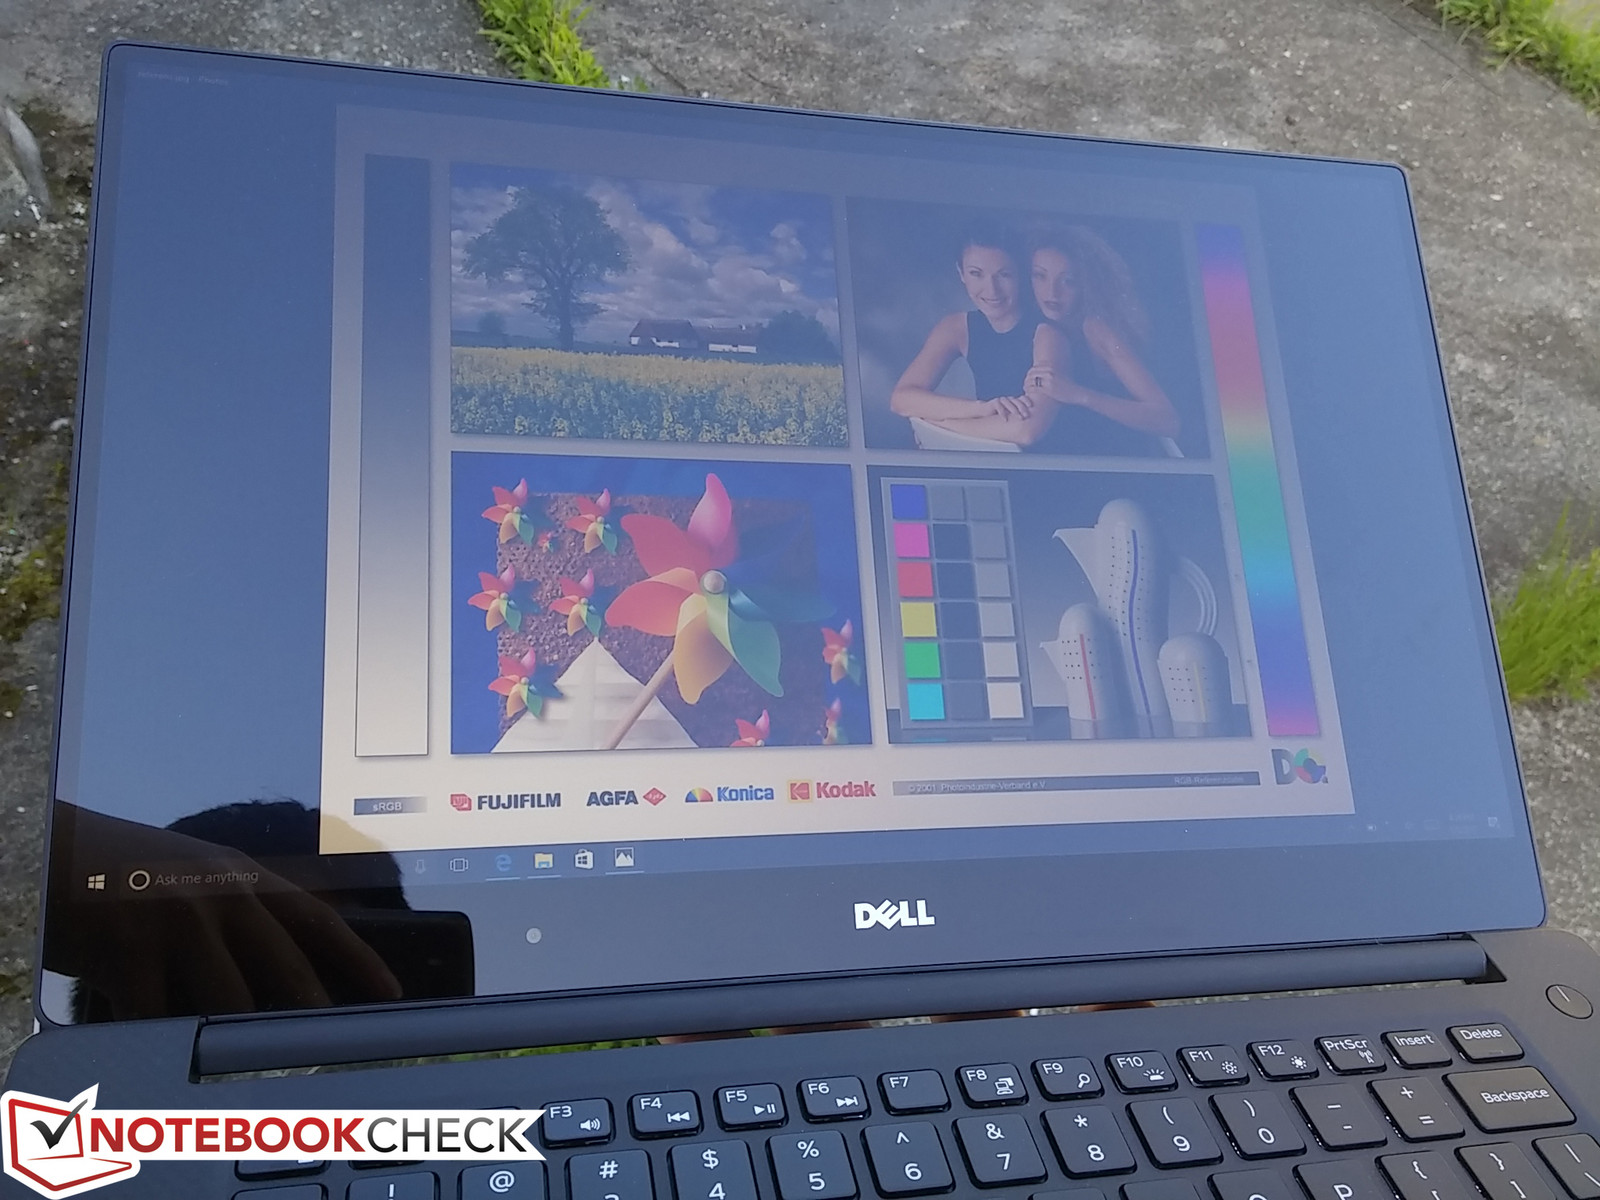
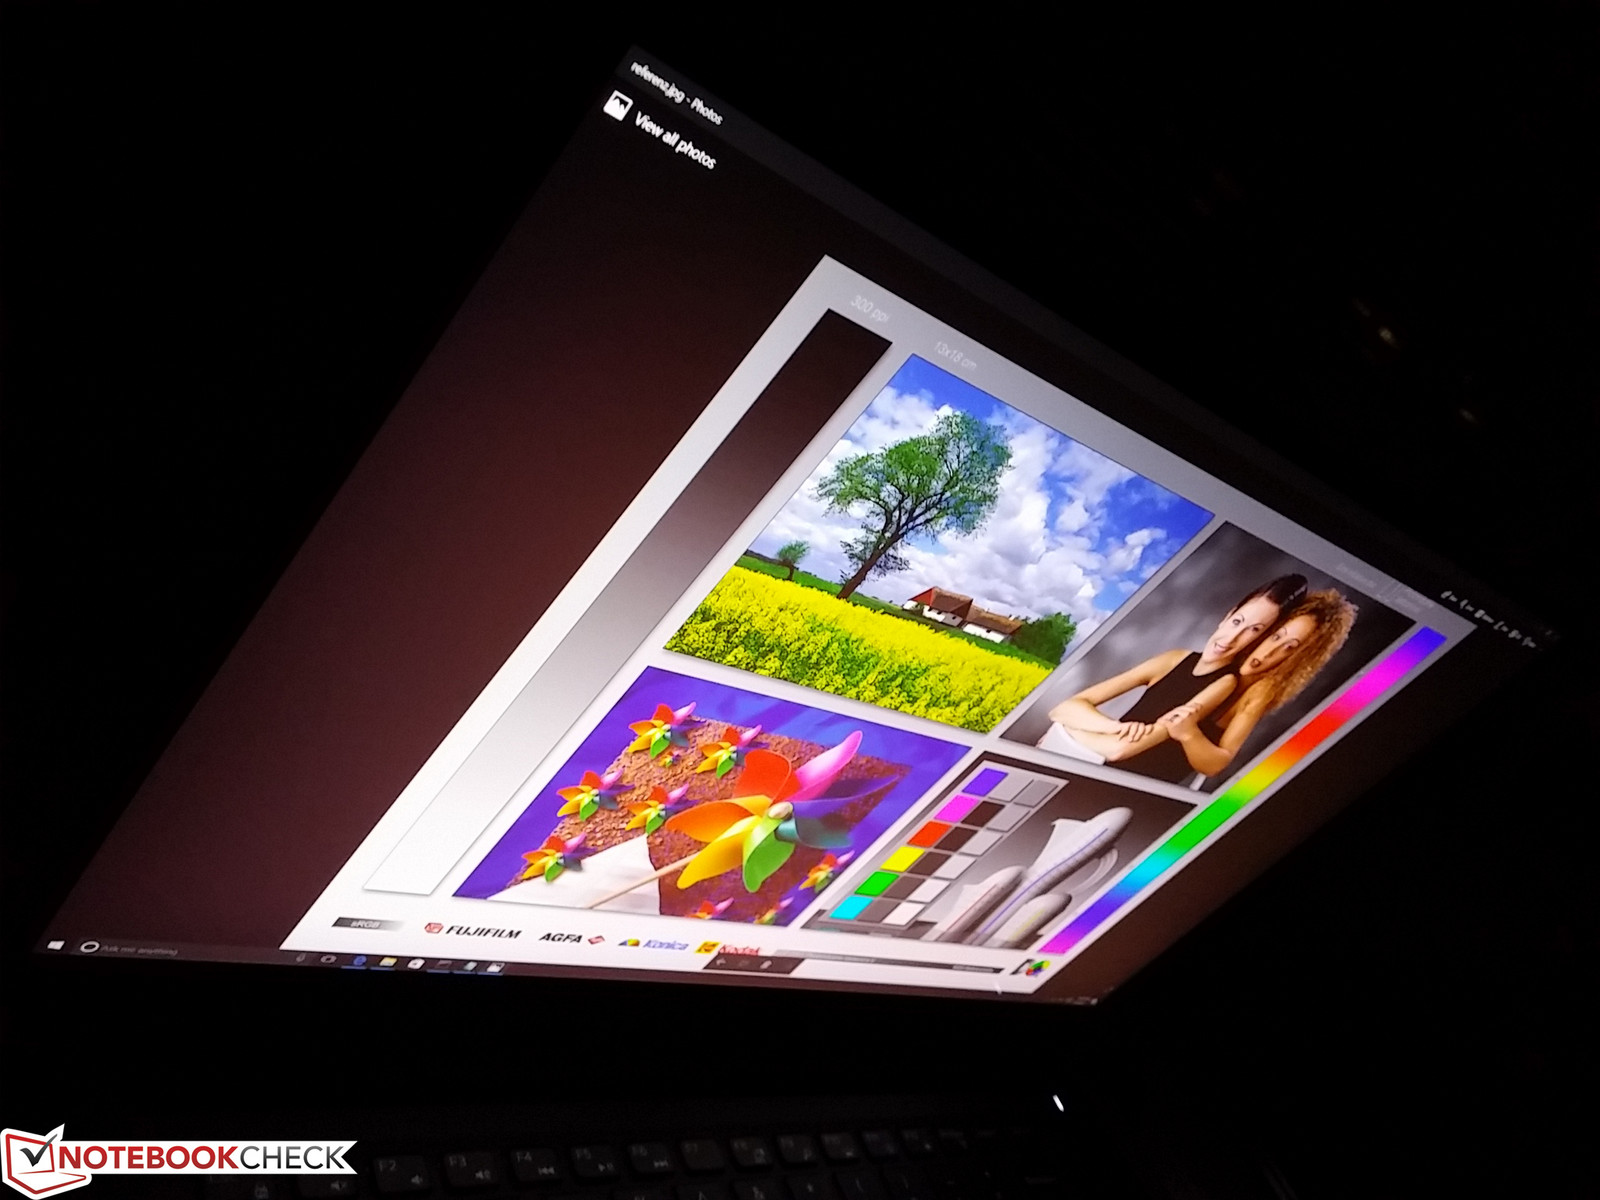
The high contrast, wide IPS angles, and relatively bright backlight all help when using the notebook outdoors and under shade. Any brighter, however, and users will begin lamenting toe super-glossy display. The backlight is simply not bright enough to overcome direct sunlight and glare will indubitably be an issue. In this case, the matte FHD SKU is preferred over the 4K UHD SKU when outdoors. Viewing angles are wide with just slight hints of contrast and color shifts when viewing from extreme angles.
Performance
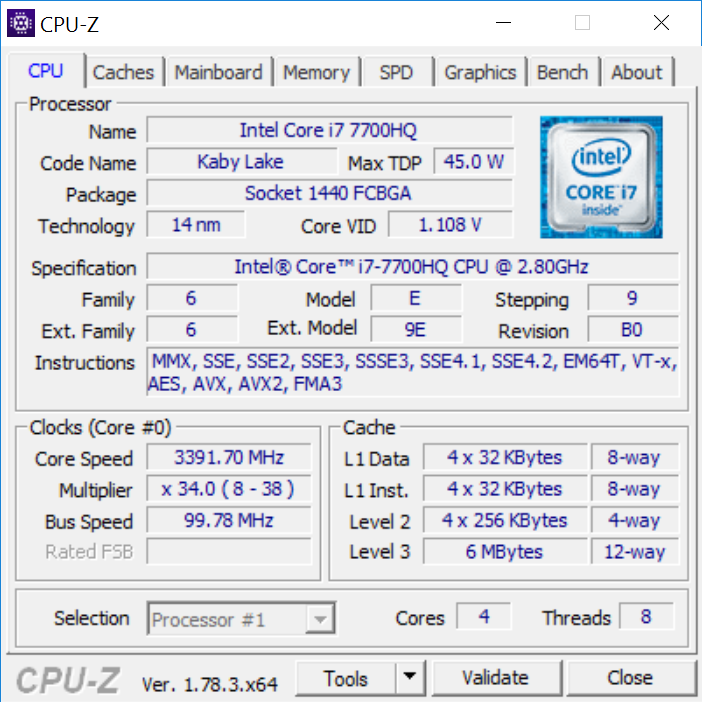
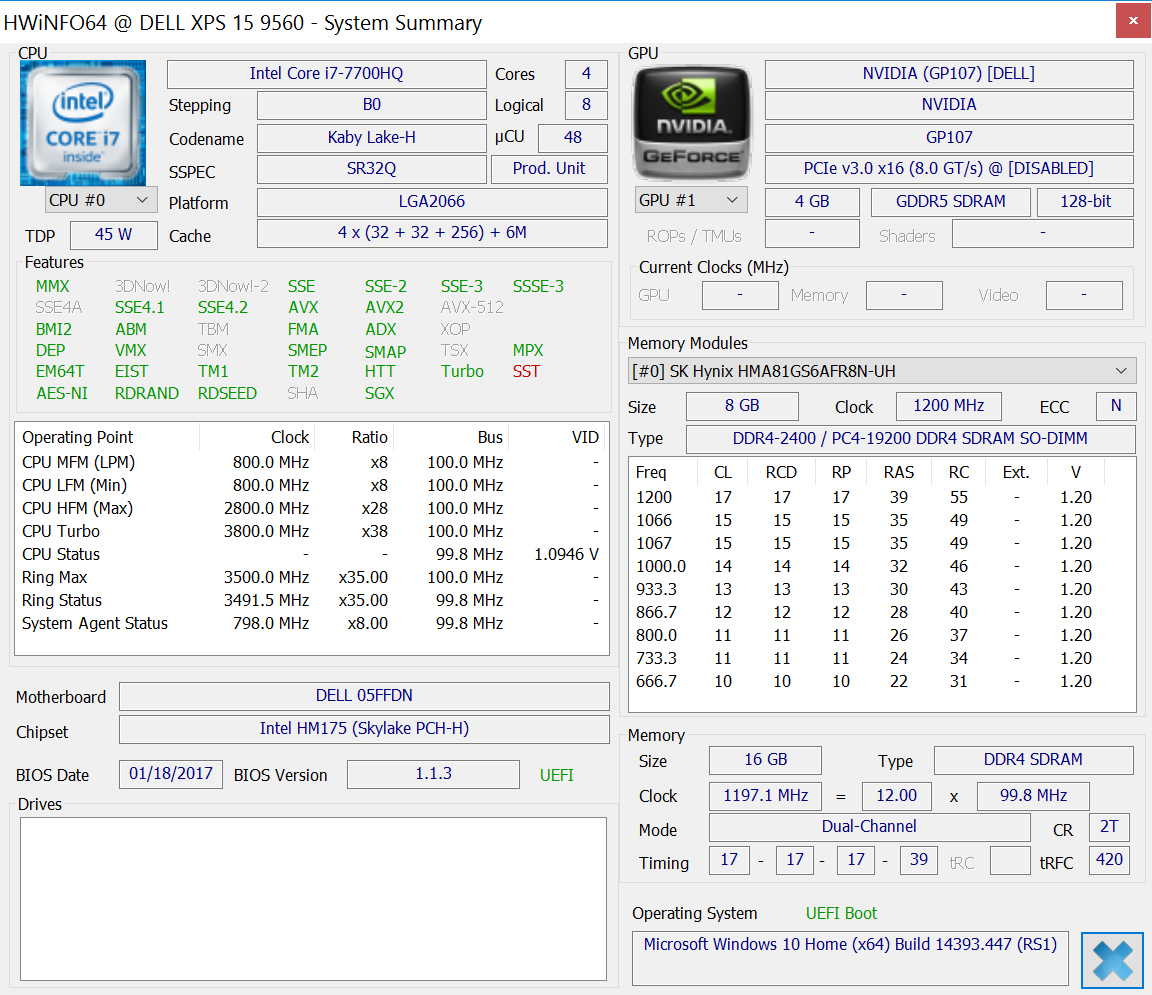
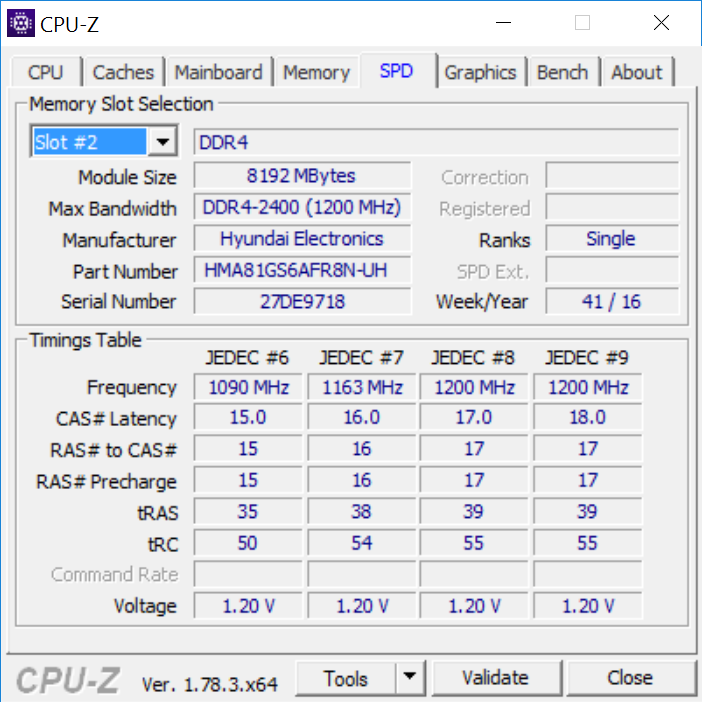
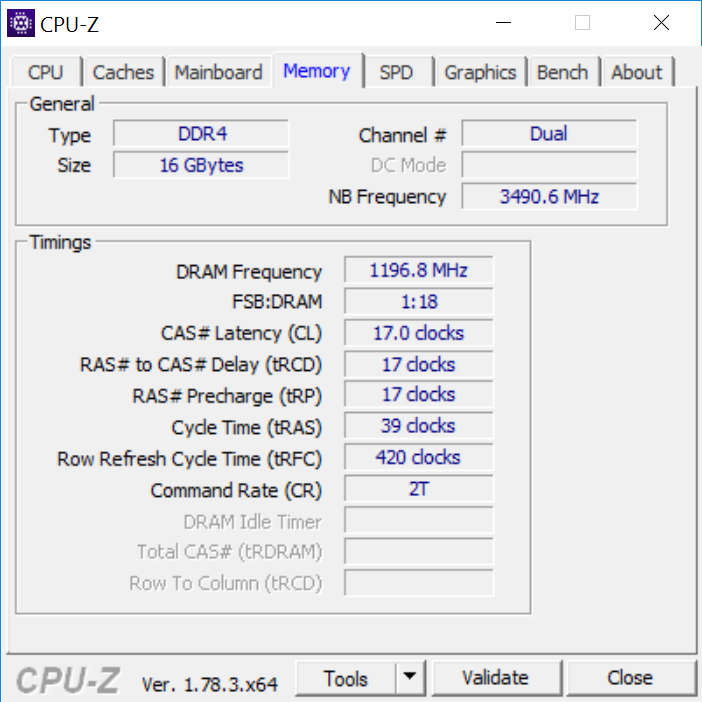
The 2.8 GHz i7-7700HQ is the highest CPU option currently available on the XPS 15 while lower-end configurations can be equipped with either the i3-7100H or the i5-7300HQ. This particular processor is a common find on high-end gaming machines including the MSI GE72 7RE or Gigabyte P57X v7, so there is no doubt that the 45 W CPU will be more than capable for both common office tasks and demanding software. Expandable DDR4 RAM can be configured from 8 GB up to 32 GB while the 4 GB GeForce GTX 1050 is fixed across all SKUs but the lowest-end iGPU-only $999 USD configuration. Users can't mix and match CPUs or GPUs with certain displays or storage capacities as the SKU selection is fixed.
Optimus graphics switching to the integrated HD Graphics 630 is supported for configurations with the dedicated GTX 1050.
Processor
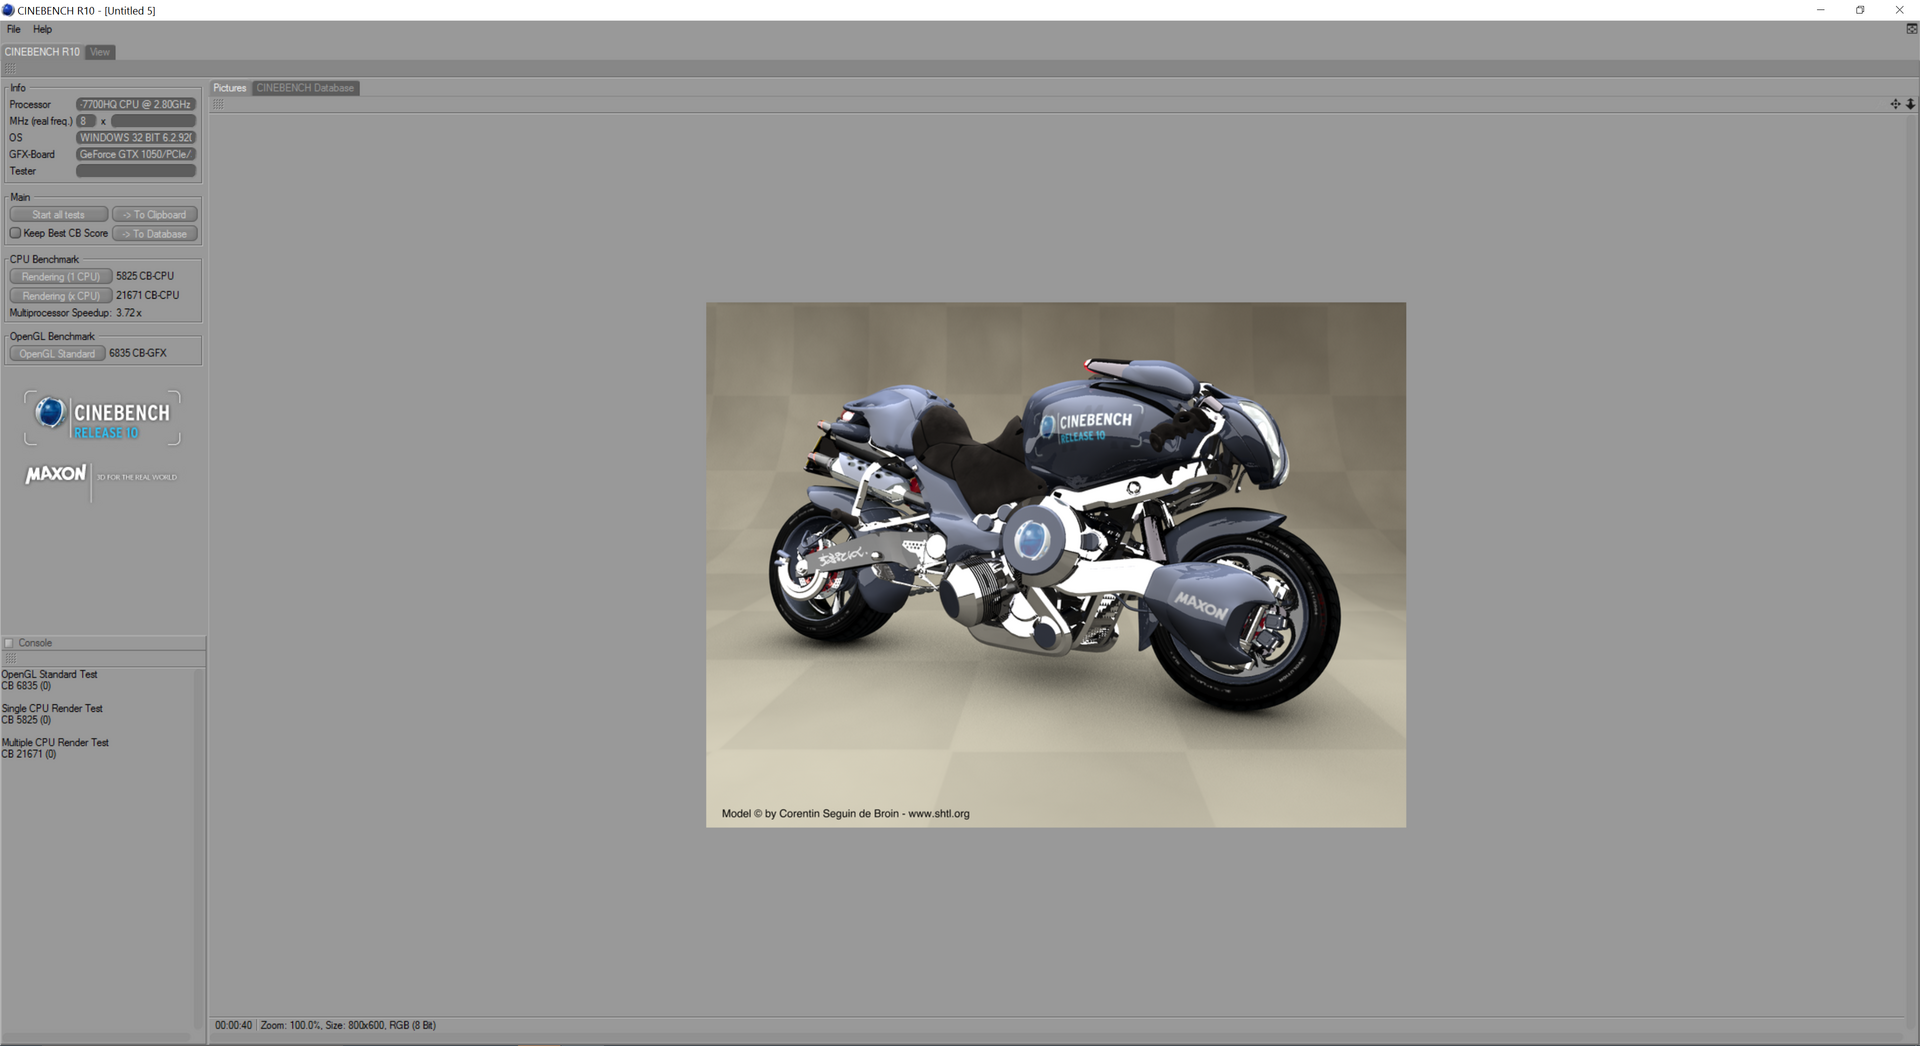
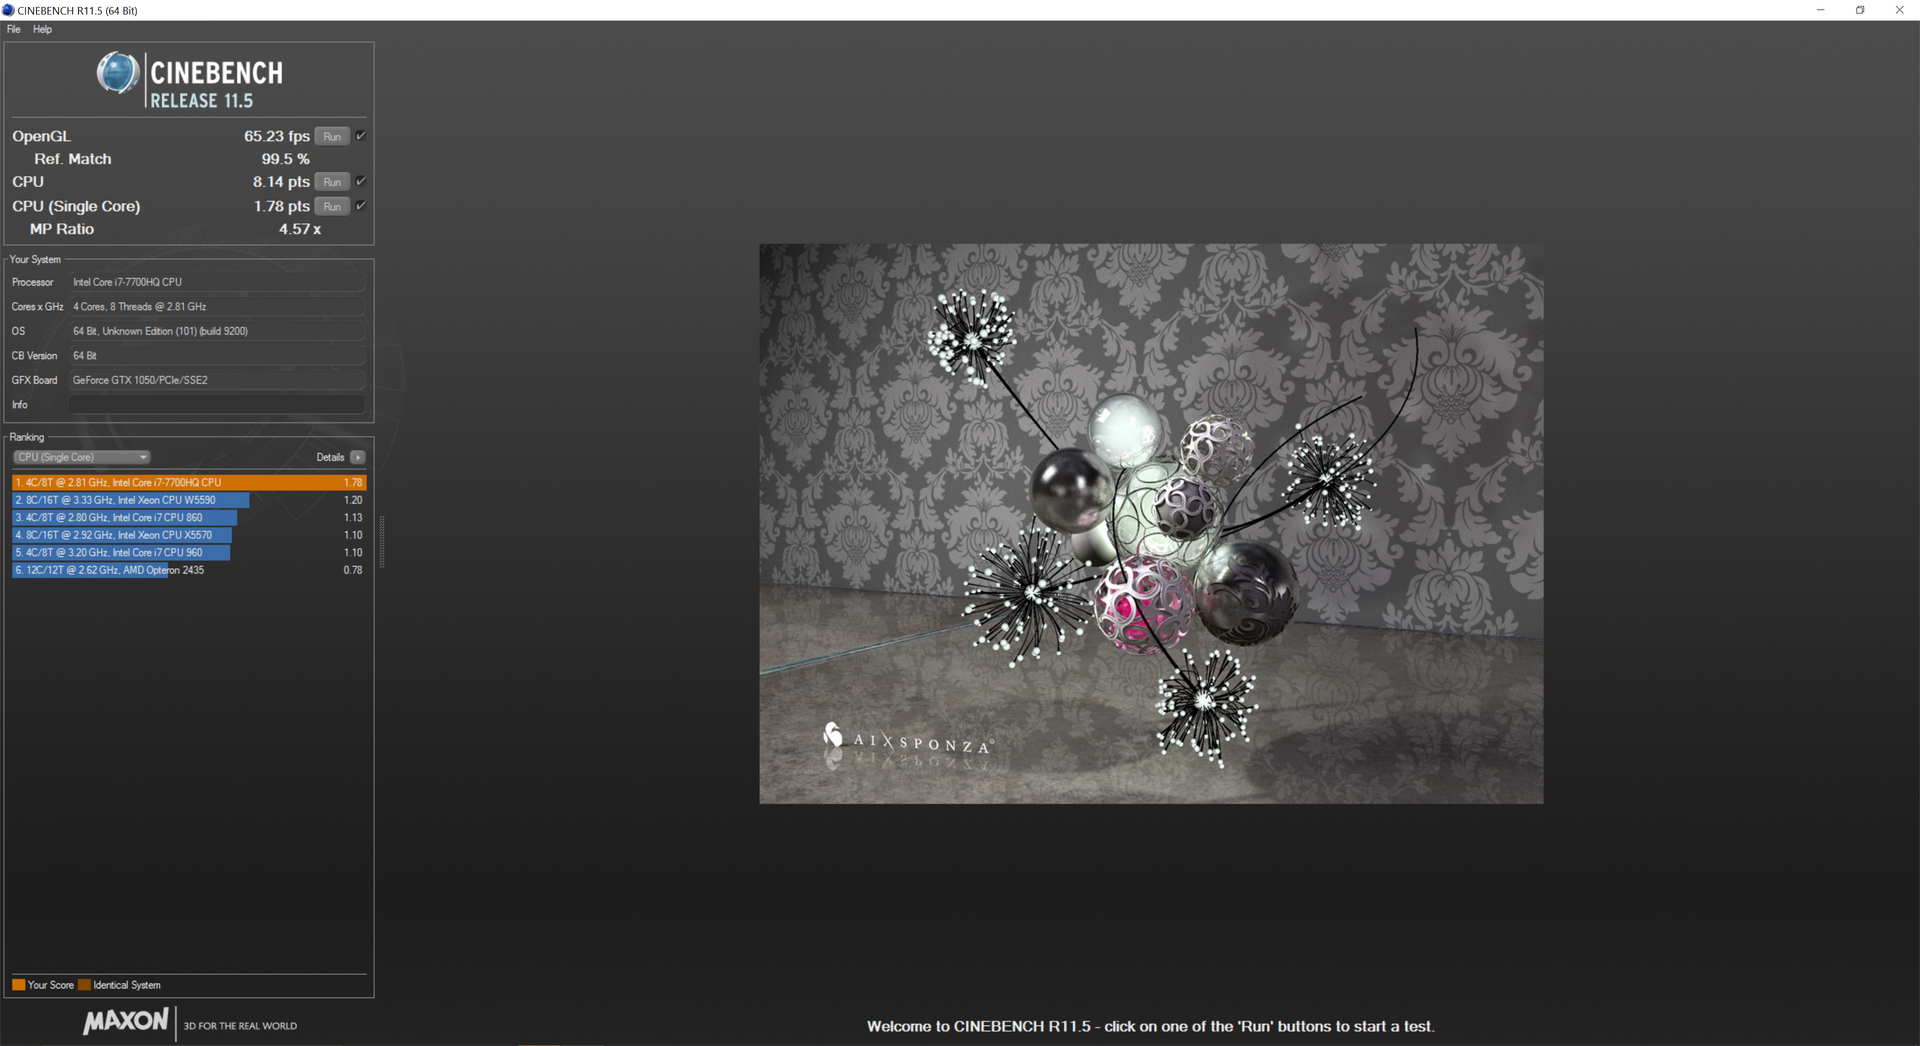
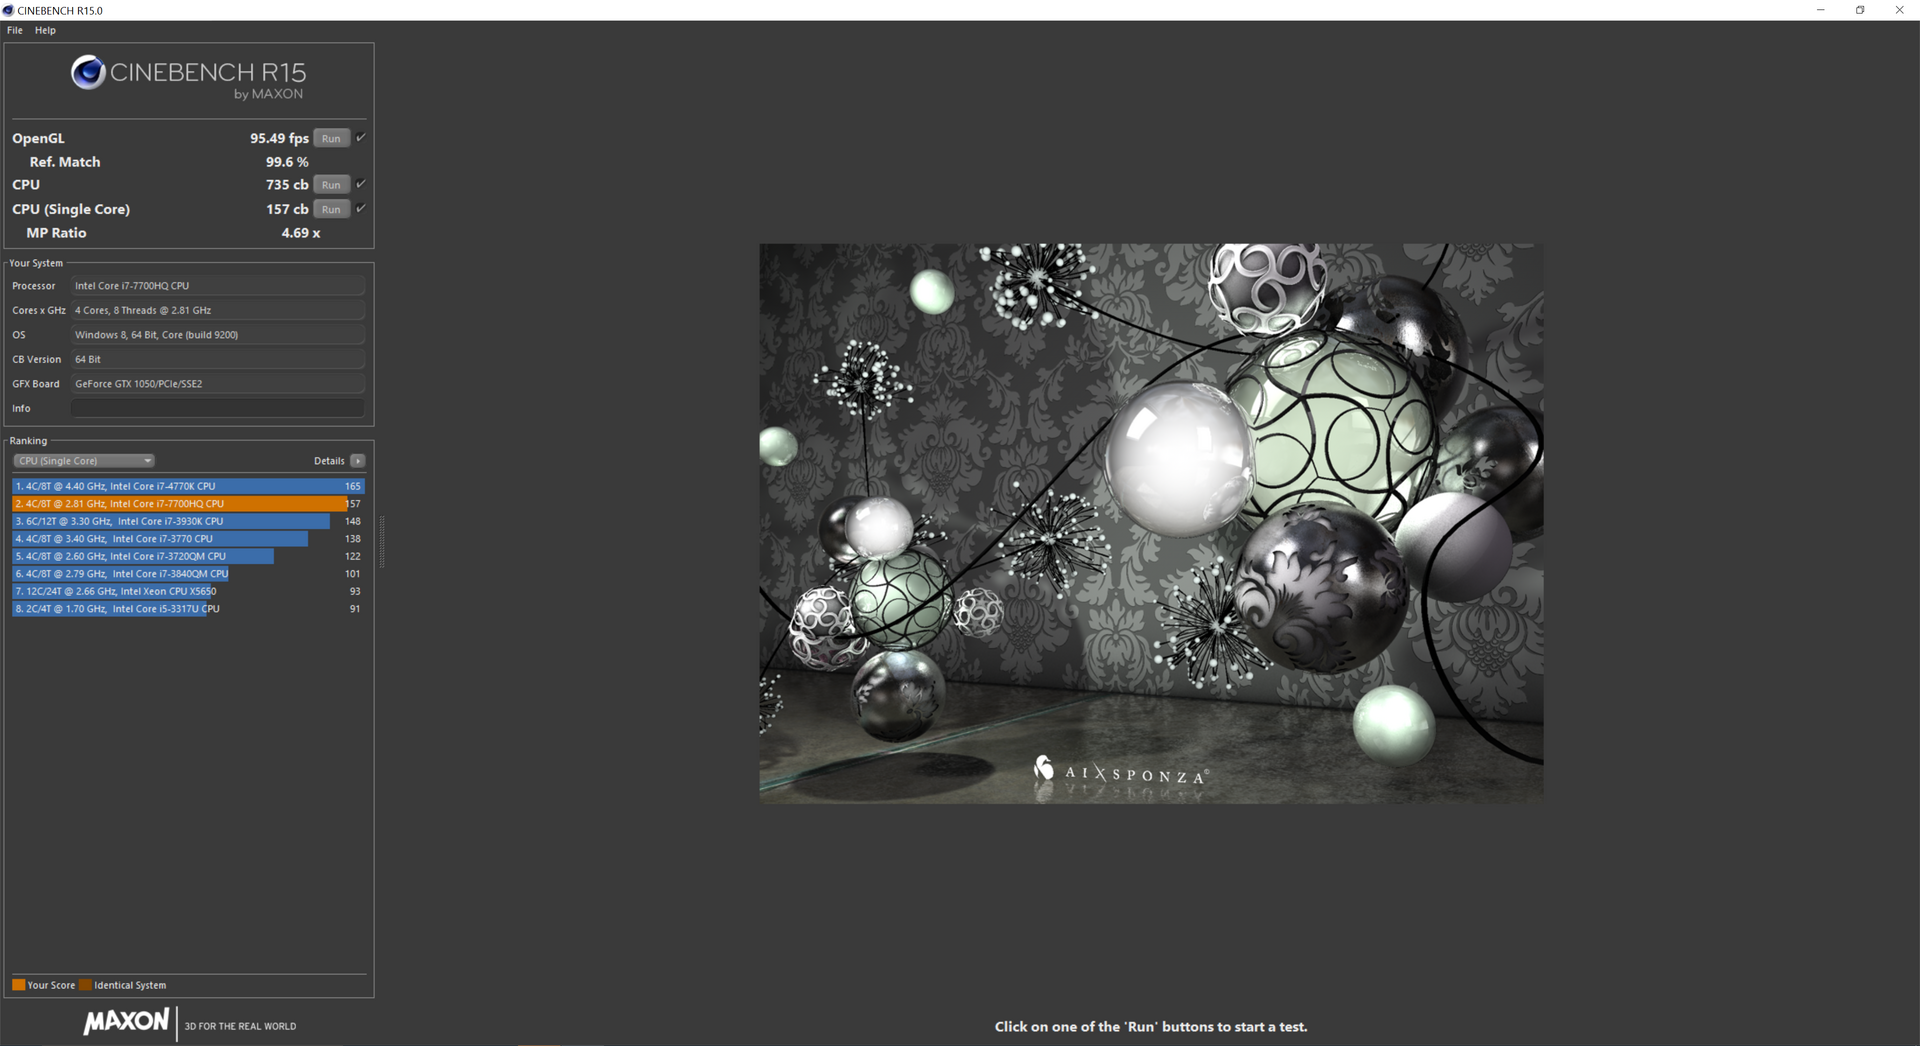
The Kaby Lake i7-7700HQ is but a small performance leap over the Skylake i7-6700HQ and even the Broadwell i7-5700HQ with score gaps within 5 percent of one another according to CineBench benchmarks. The gaps widen a bit when processing single-threaded loads, but nothing significant considering the generational differences. Jumping from the Haswell i7-4700HQ to the i7-7700HQ will net performance gains of 20 percent and 30 percent in single- and multi-threaded workloads, respectively. CineBench results are a near match between our Dell and the similarly equipped MSI GT62VR gaming notebook. Slight throttling occurs on the Dell as uninterrupted looping runs of CineBench R15 Multi-Thread result in a 10 percent drop in score from 735 points to about 670 points.
It's worth noting that the i5-7300HQ in the lower-end XPS 15 SKU is almost 50 percent slower than our i7 configuration in multi-threaded workloads. While still more than sufficient for silky-smooth web browsing and even gaming, power users intending to use the notebook for moderate editing or CAD work may want to consider the faster i7-7700HQ CPU instead.
See our dedicated CPU page on the i7-7700HQ for more technical information and benchmark comparisons.
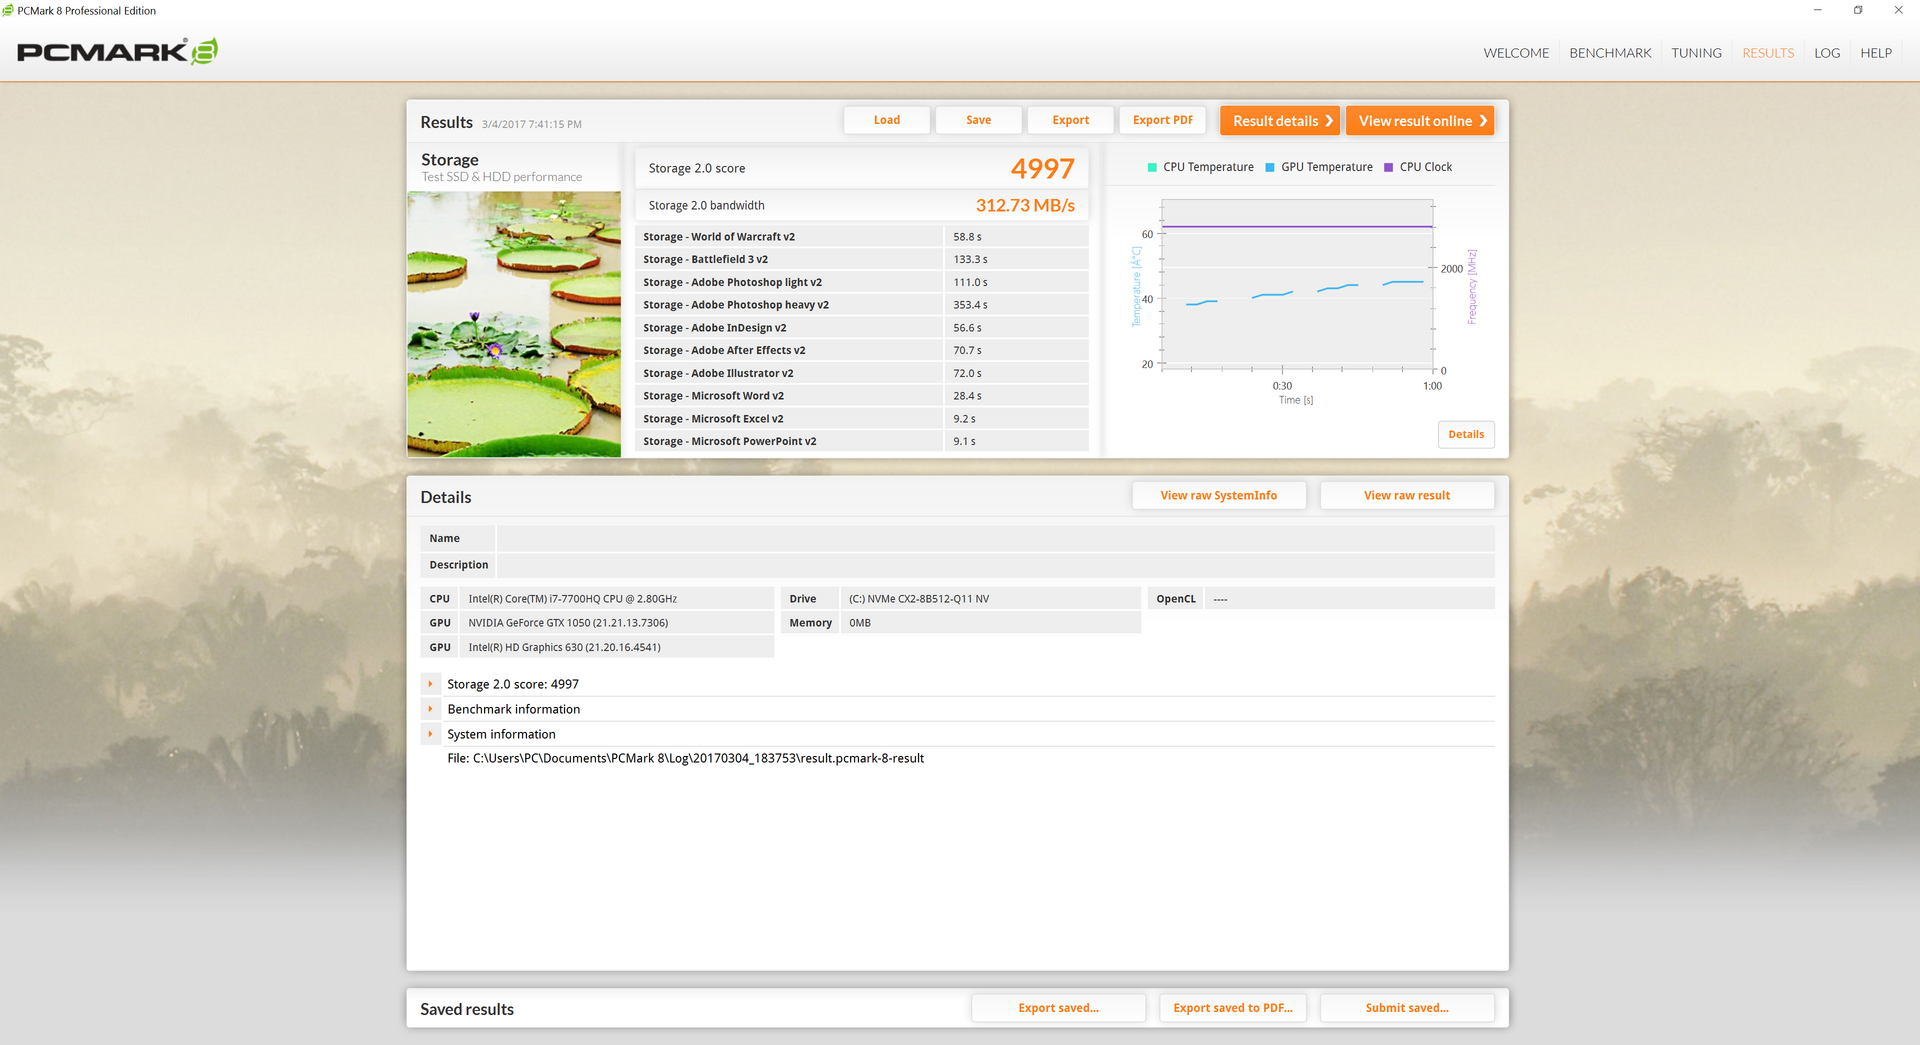
System Performance
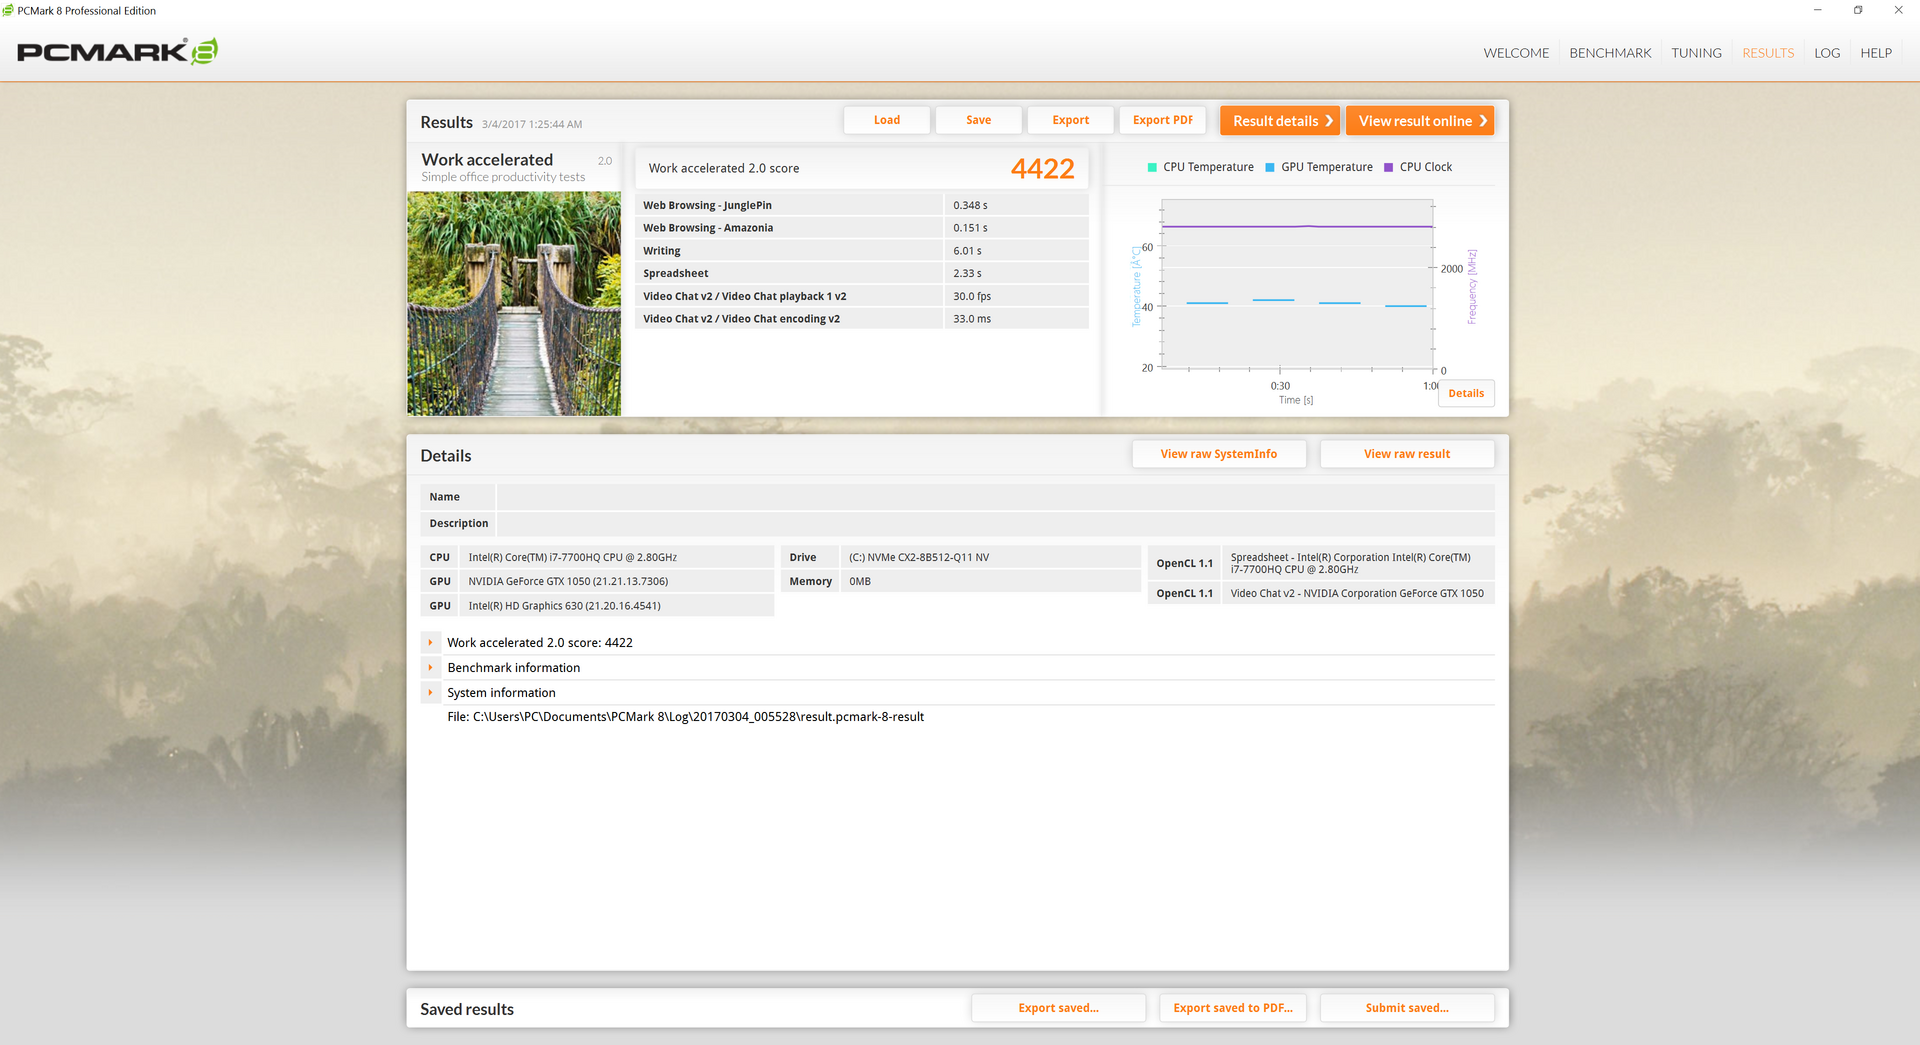
PCMark 8 benchmarks rank the system in the same ballpark as both the MacBook Pro 15 and HP Spectre x360 15. Strangely enough, our less powerful XPS 15 SKU with the i7-7300HQ and primary HDD outscores our higher-end SKU just slightly possibly due to the differences in display resolution. Subjectively, the system runs smoothly with no notable hardware or software hitches during our time with the test unit.
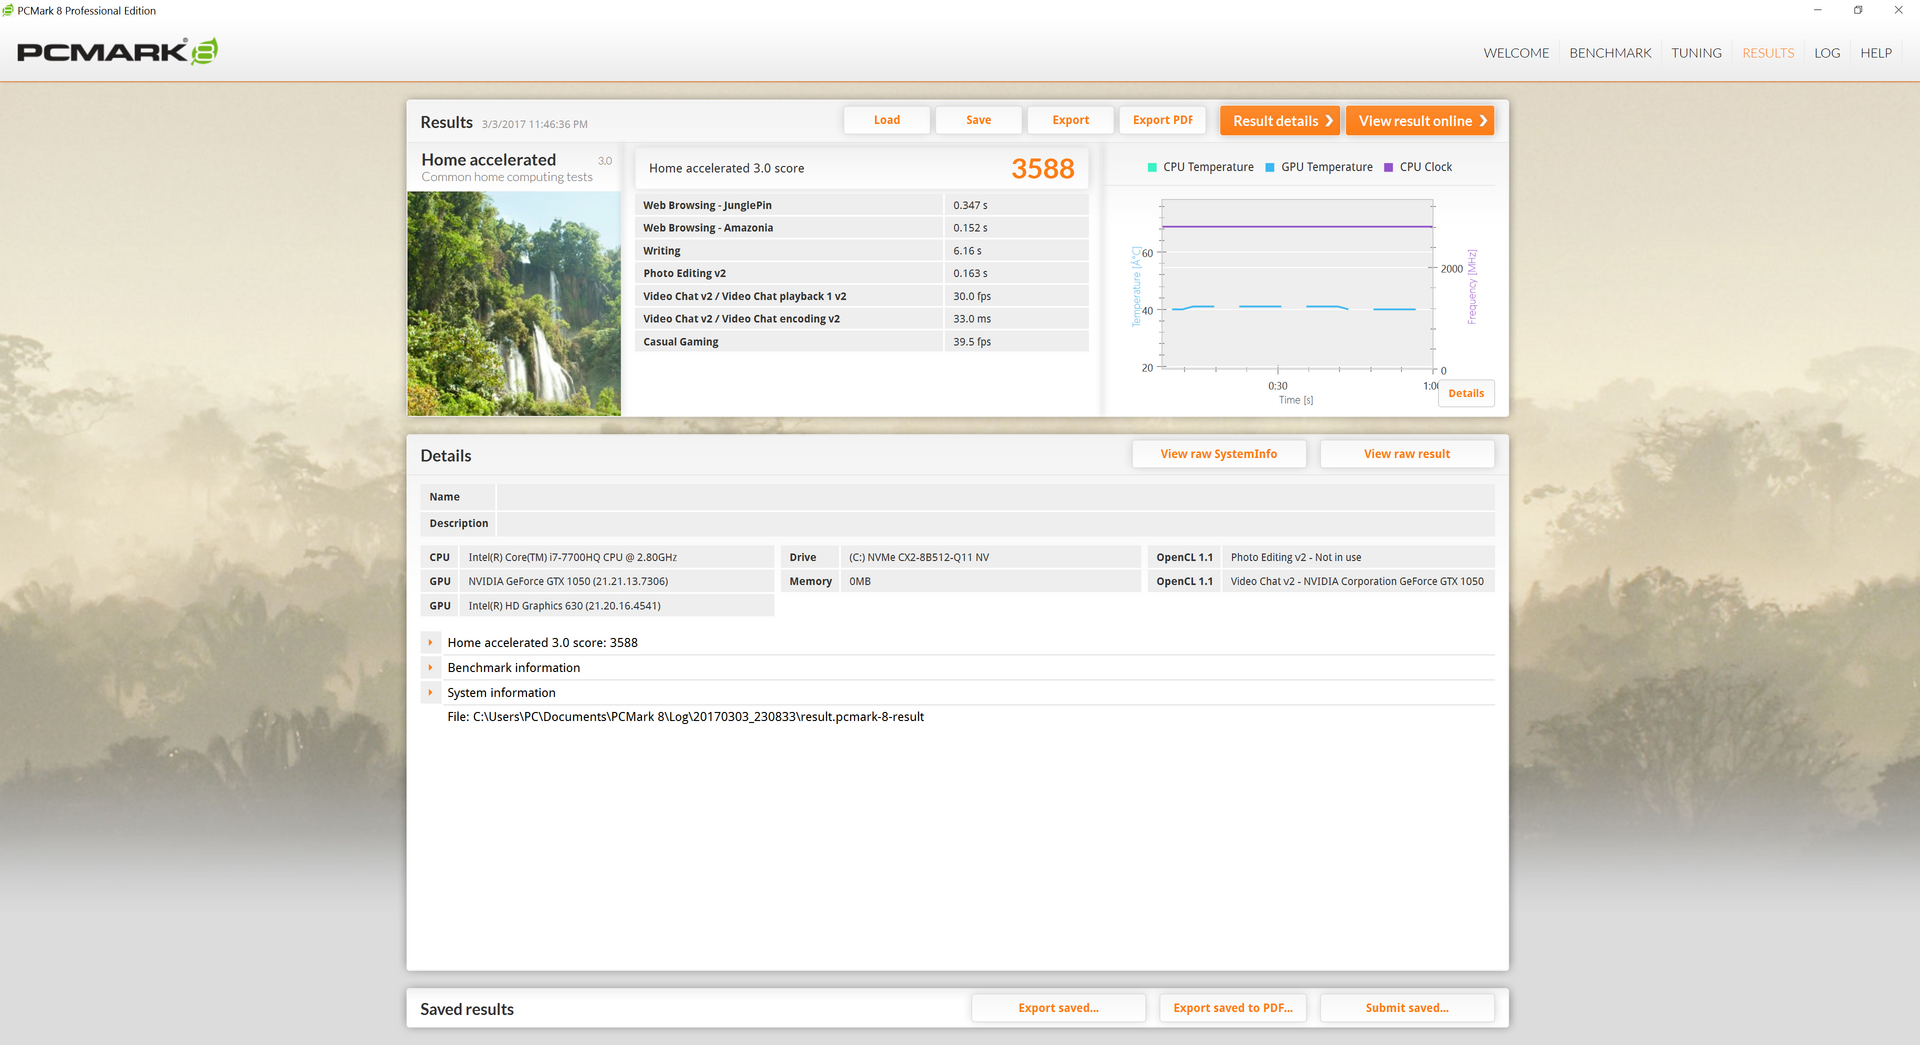
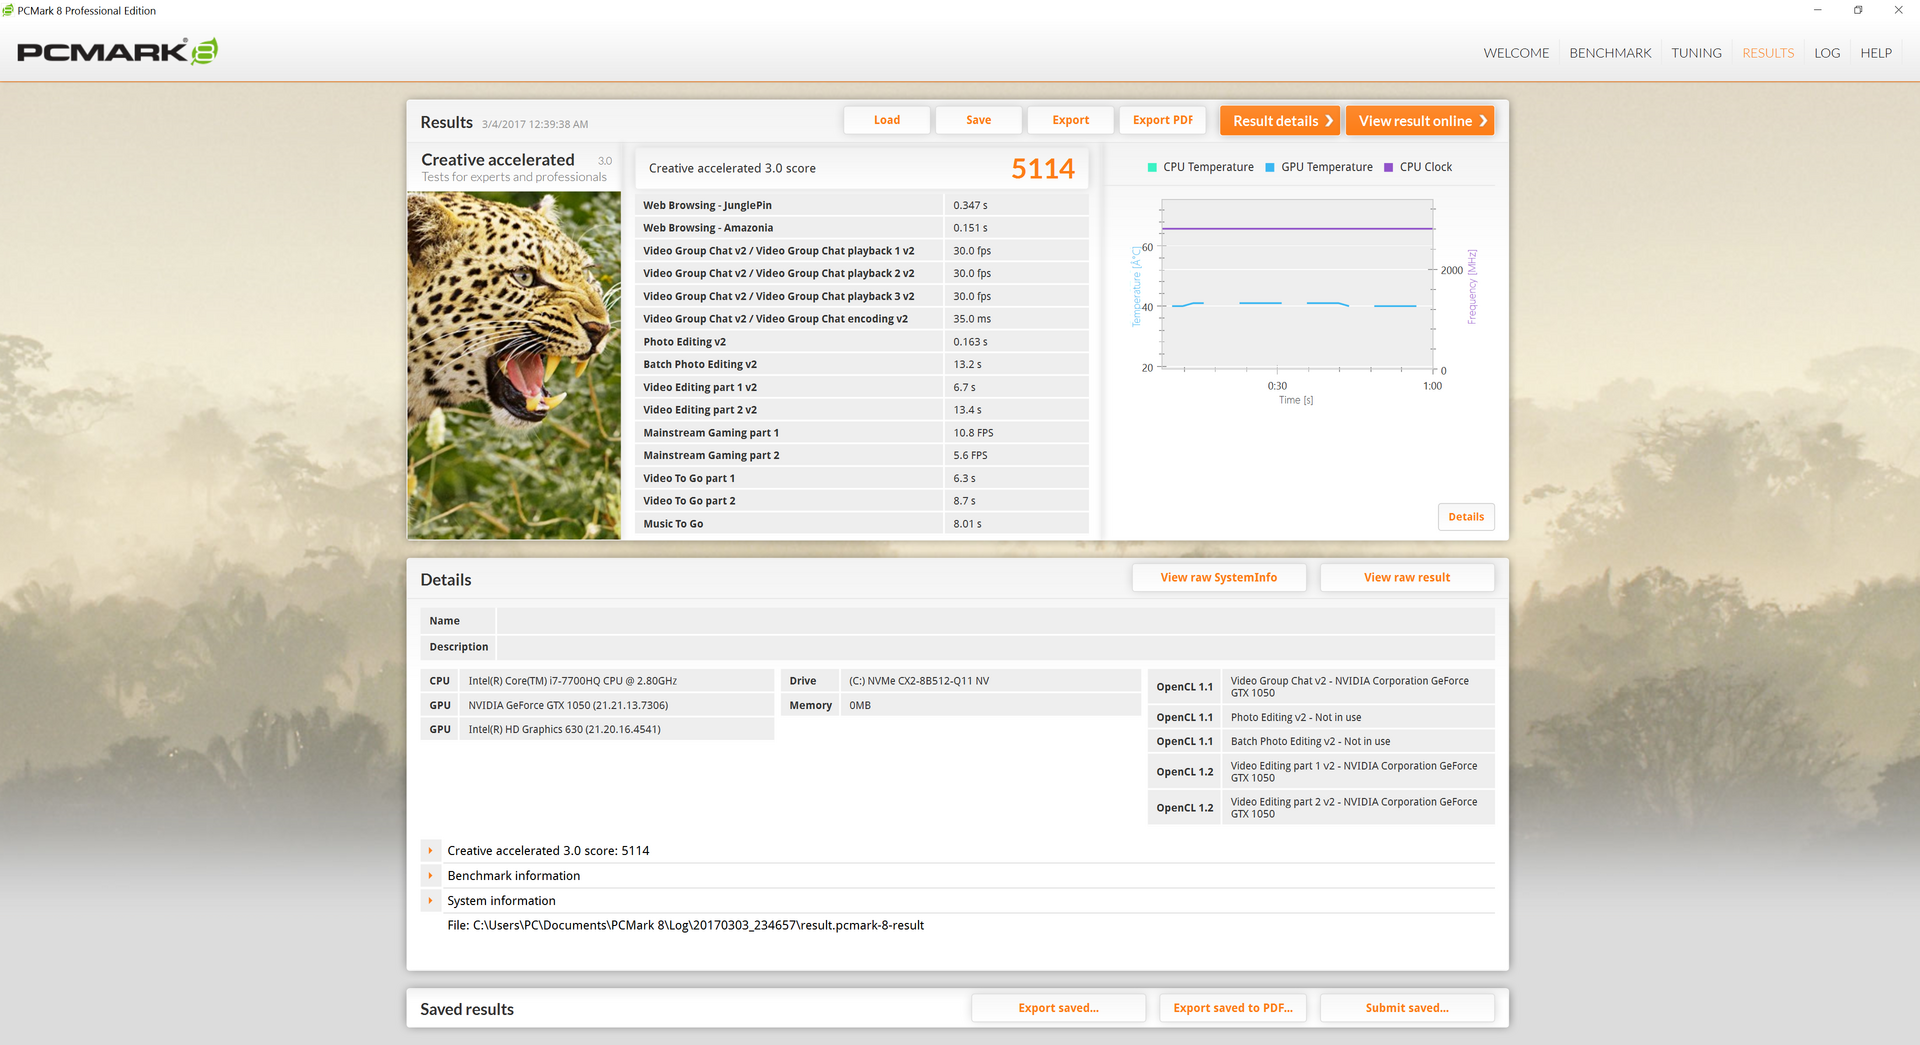
| PCMark 8 Home Score Accelerated v2 | 3588 points | |
| PCMark 8 Creative Score Accelerated v2 | 5114 points | |
| PCMark 8 Work Score Accelerated v2 | 4422 points | |
Help | ||
Storage Devices
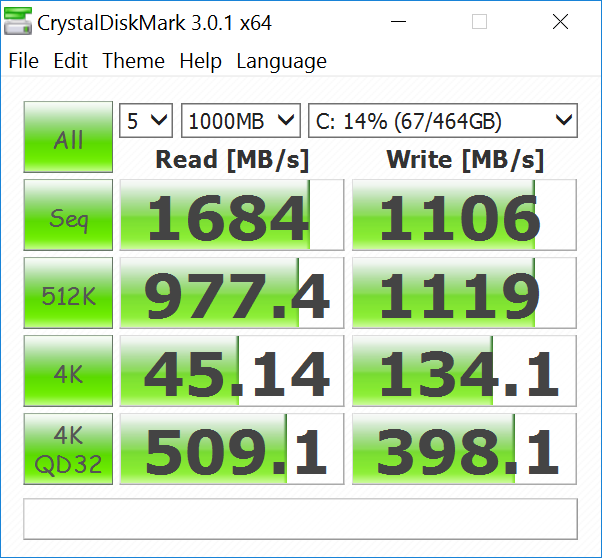
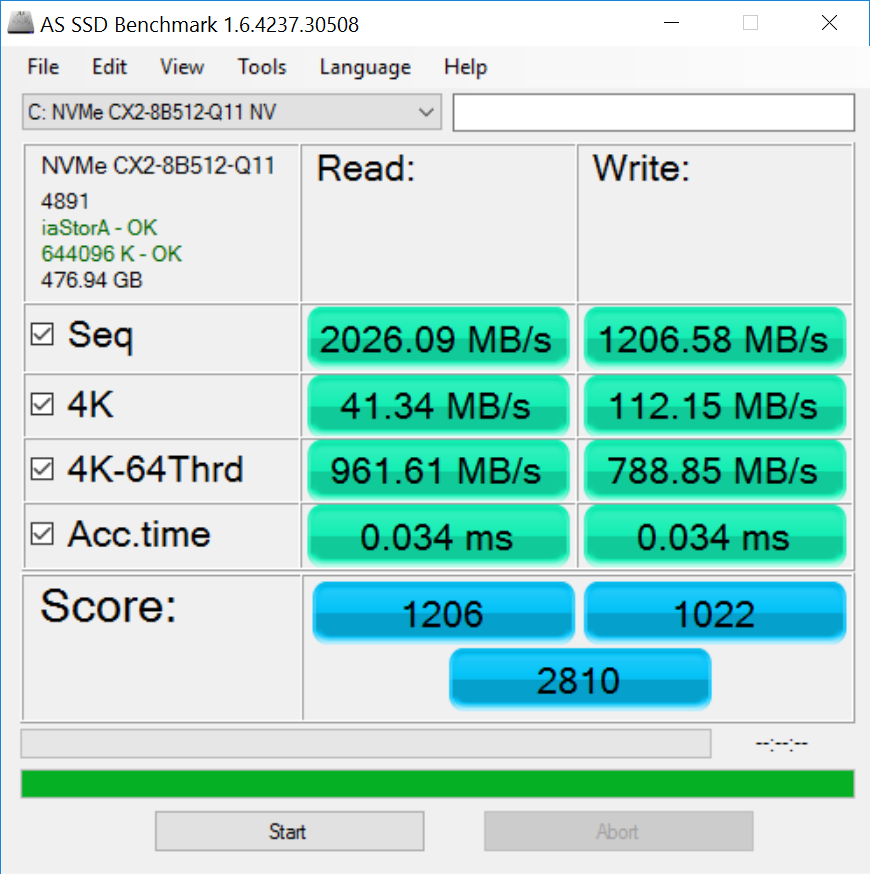
The 512 GB Lite-On CX2-8B512 NVMe SSD in our test unit is about on par with the Apple SM1024L SSD in the MacBook and the Toshiba XG3 in the HP Spectre x360 15 with some slight differences. Sequential write speeds and both reading and writing of small QD32 blocks on our Dell unit are slower than on the MacBook according to CDM. Otherwise, the Lite-On SSD performs about where we expect it to be for a NVMe drive. Results will likely differ on SKUs with the 256 GB or 1 TB SSD option.
See our growing table of HDDs and SSDs for more benchmark comparisons.
| Dell XPS 15 9560 (i7-7700HQ, UHD) Lite-On CX2-8B512-Q11 | Asus FX502VM-AS73 SK Hynix HFS256G39TND-N210A | Apple MacBook Pro 15 2016 (2.9 GHz, 460) Apple SSD SM1024L | HP Spectre x360 15-bl002xx Toshiba XG4 NVMe (THNSN5512GPUK) | Dell Latitude 15 E5570 Samsung SSD PM871 MZ7LN128HCHP | |
|---|---|---|---|---|---|
| CrystalDiskMark 3.0 | -62% | -11% | -11% | -58% | |
| Read Seq (MB/s) | 1684 | 503 -70% | 1458 -13% | 1266 -25% | 474.7 -72% |
| Write Seq (MB/s) | 1106 | 138.2 -88% | 1440 30% | 982 -11% | 155 -86% |
| Read 512 (MB/s) | 977 | 343.5 -65% | 914 -6% | 834 -15% | 393.6 -60% |
| Write 512 (MB/s) | 1119 | 137.8 -88% | 1058 -5% | 714 -36% | 119.7 -89% |
| Read 4k (MB/s) | 45.14 | 29.36 -35% | 9.786 -78% | 40.72 -10% | 34 -25% |
| Write 4k (MB/s) | 134.1 | 70.9 -47% | 10.9 -92% | 139.4 4% | 96.6 -28% |
| Read 4k QD32 (MB/s) | 509 | 369.9 -27% | 679 33% | 527 4% | 383.3 -25% |
| Write 4k QD32 (MB/s) | 398.1 | 99.7 -75% | 562 41% | 395.2 -1% | 100.2 -75% |

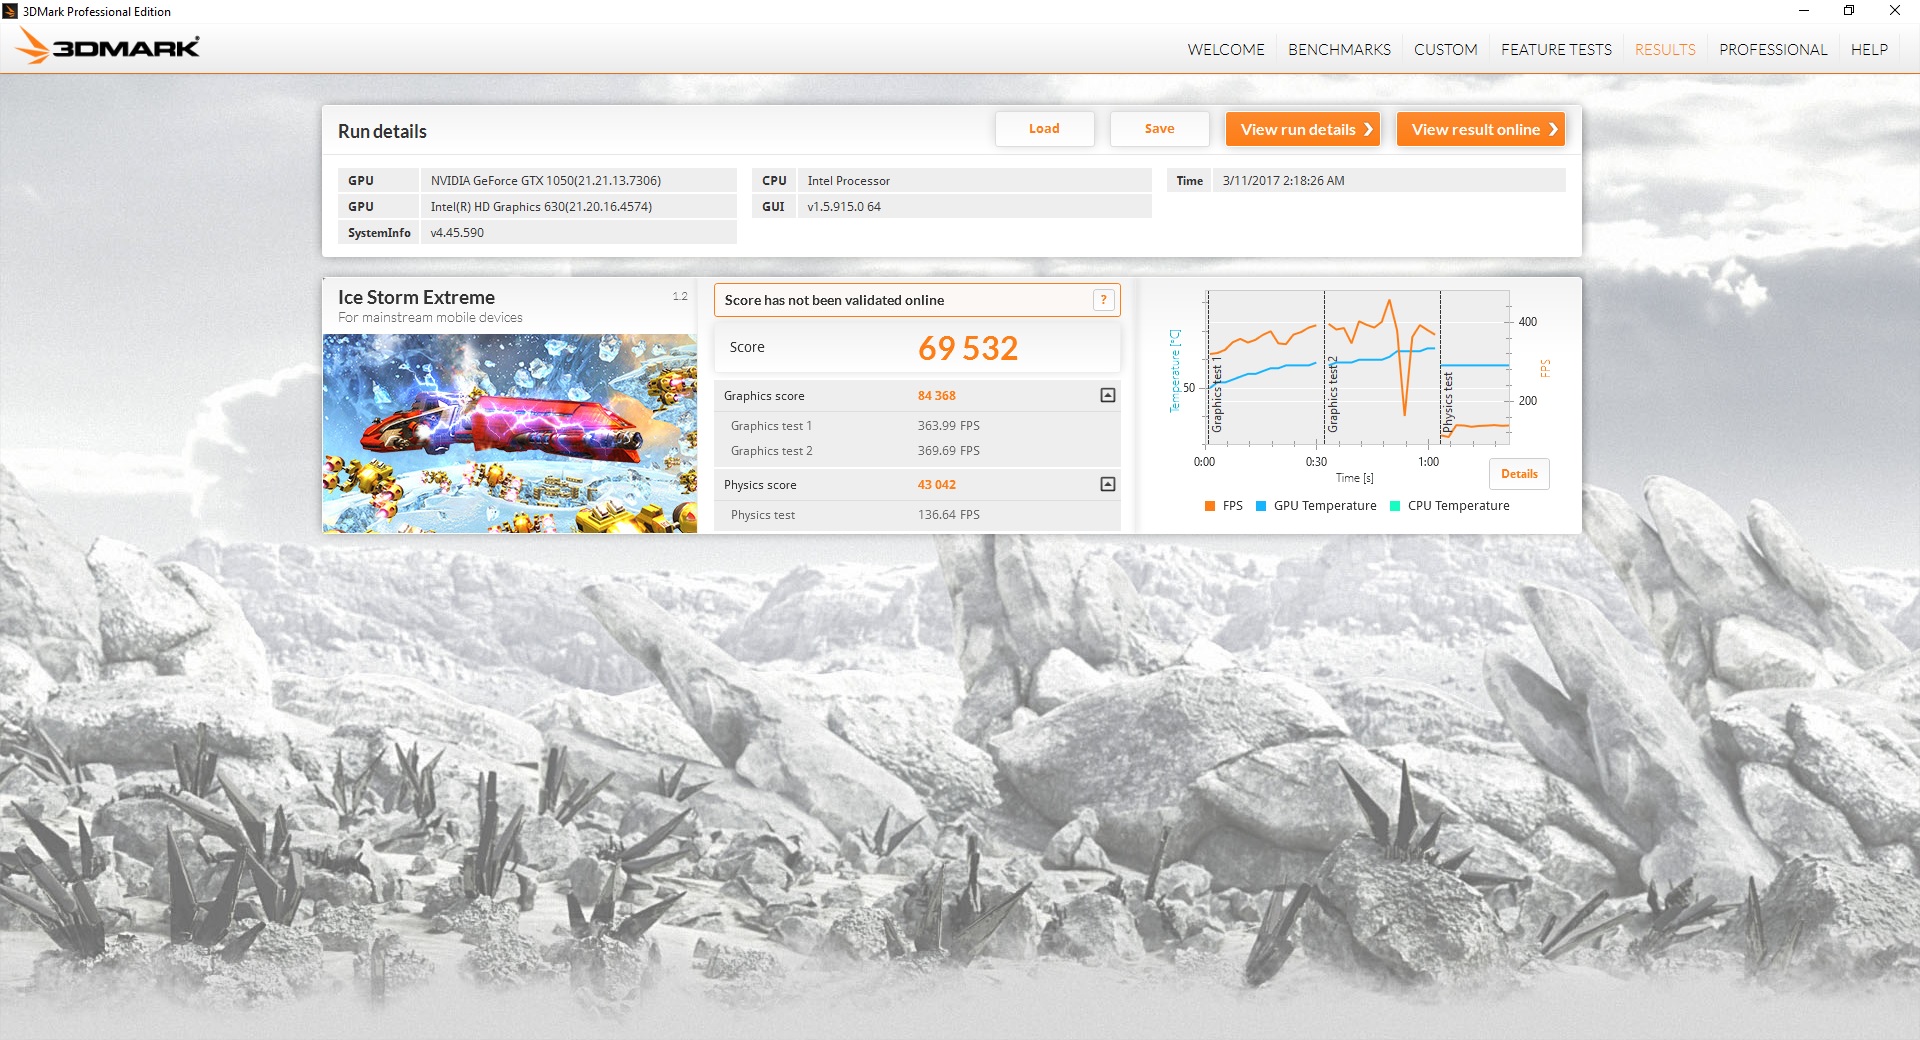
GPU Performance
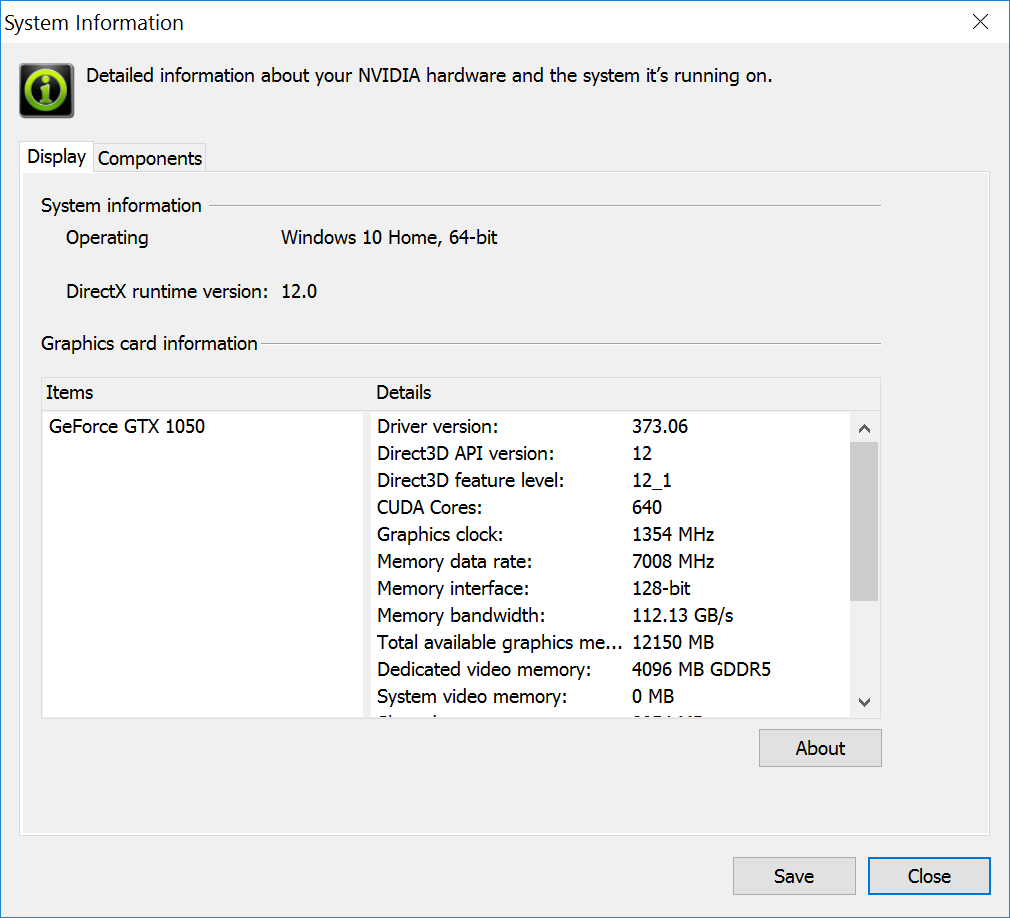
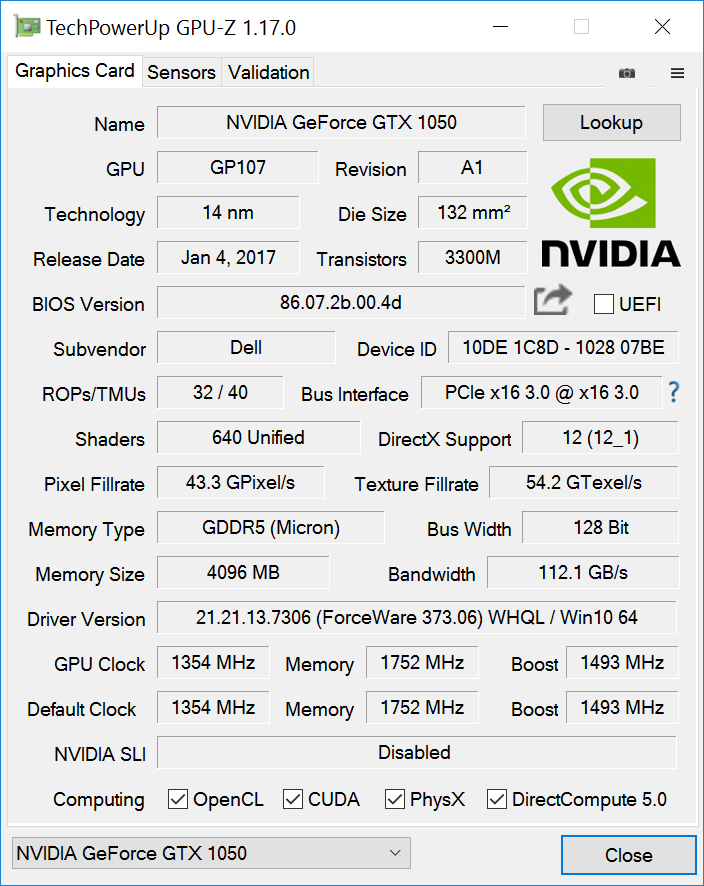
A notable feature of last year's XPS 15 was its GTX 960M, which still remains quite the powerful GPU for a multimedia class notebook. Fast forward to 2017 and now the XPS 15 comes with the even more powerful GTX 1050 Pascal GPU.
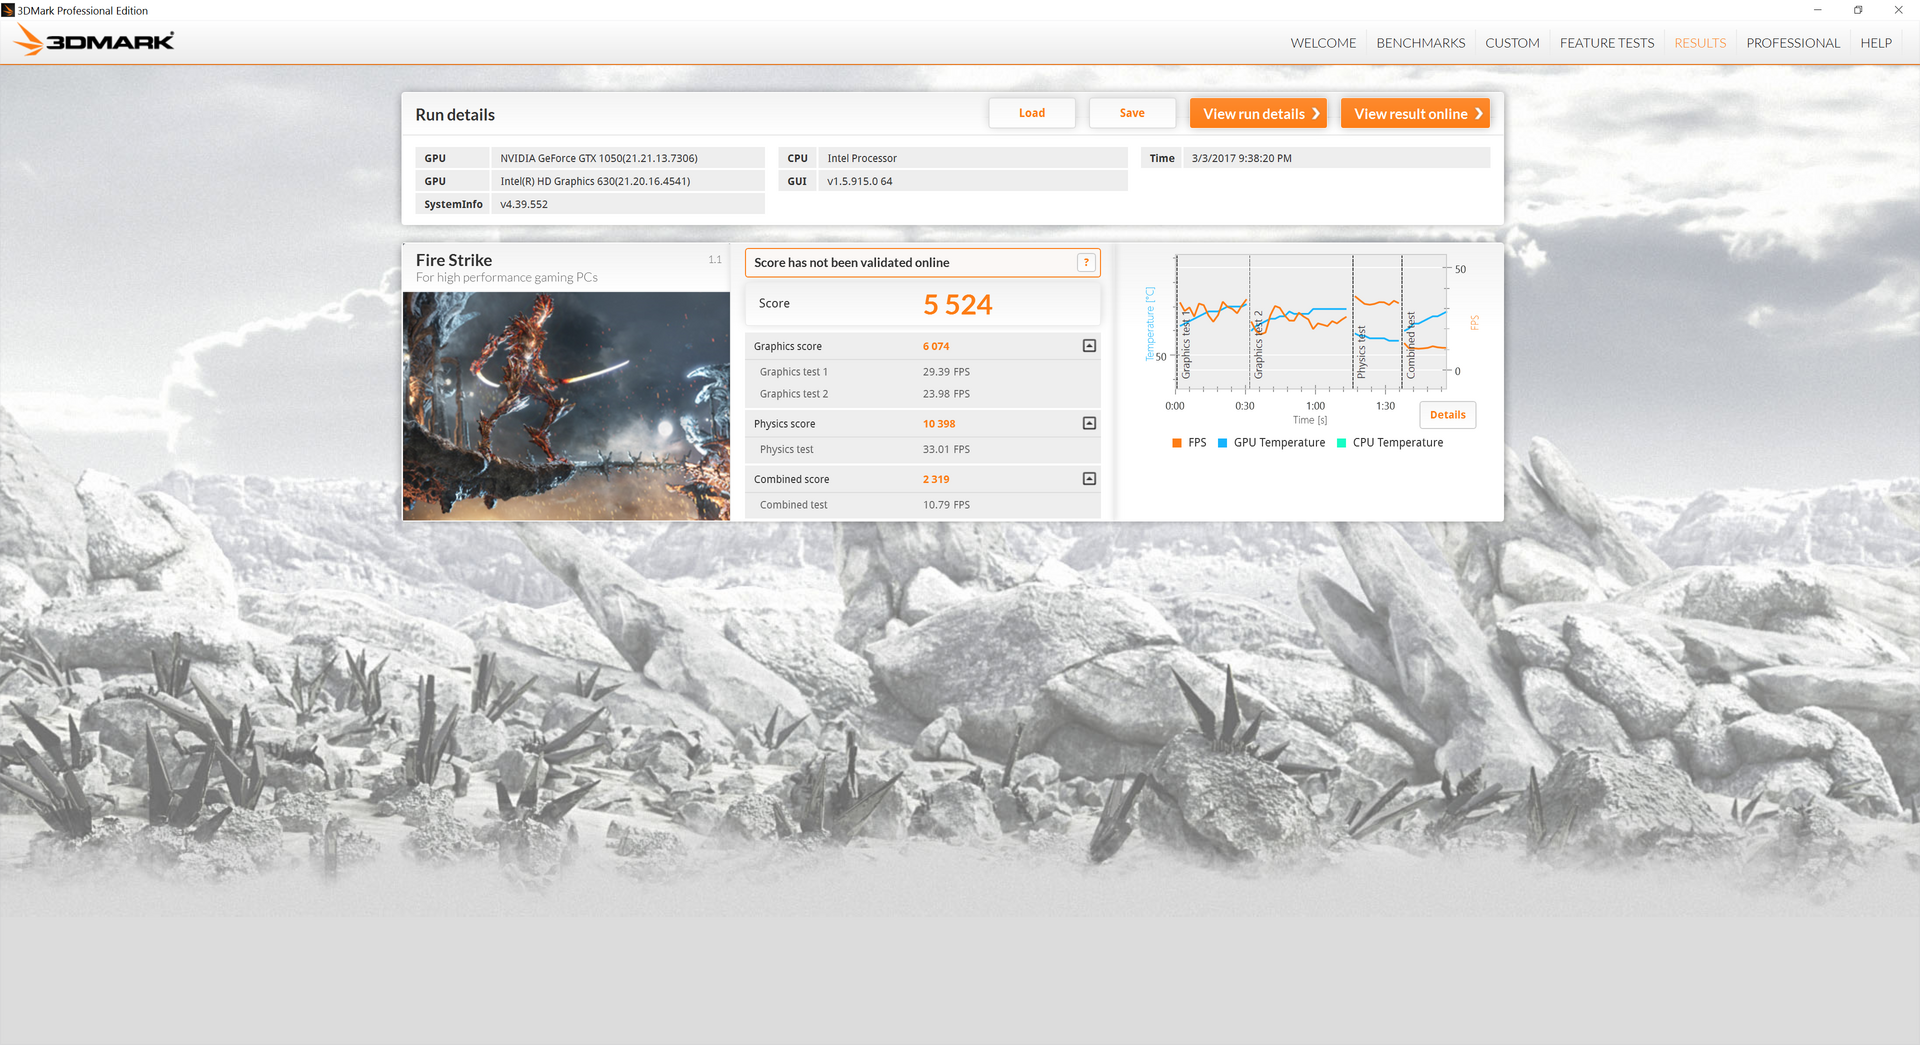
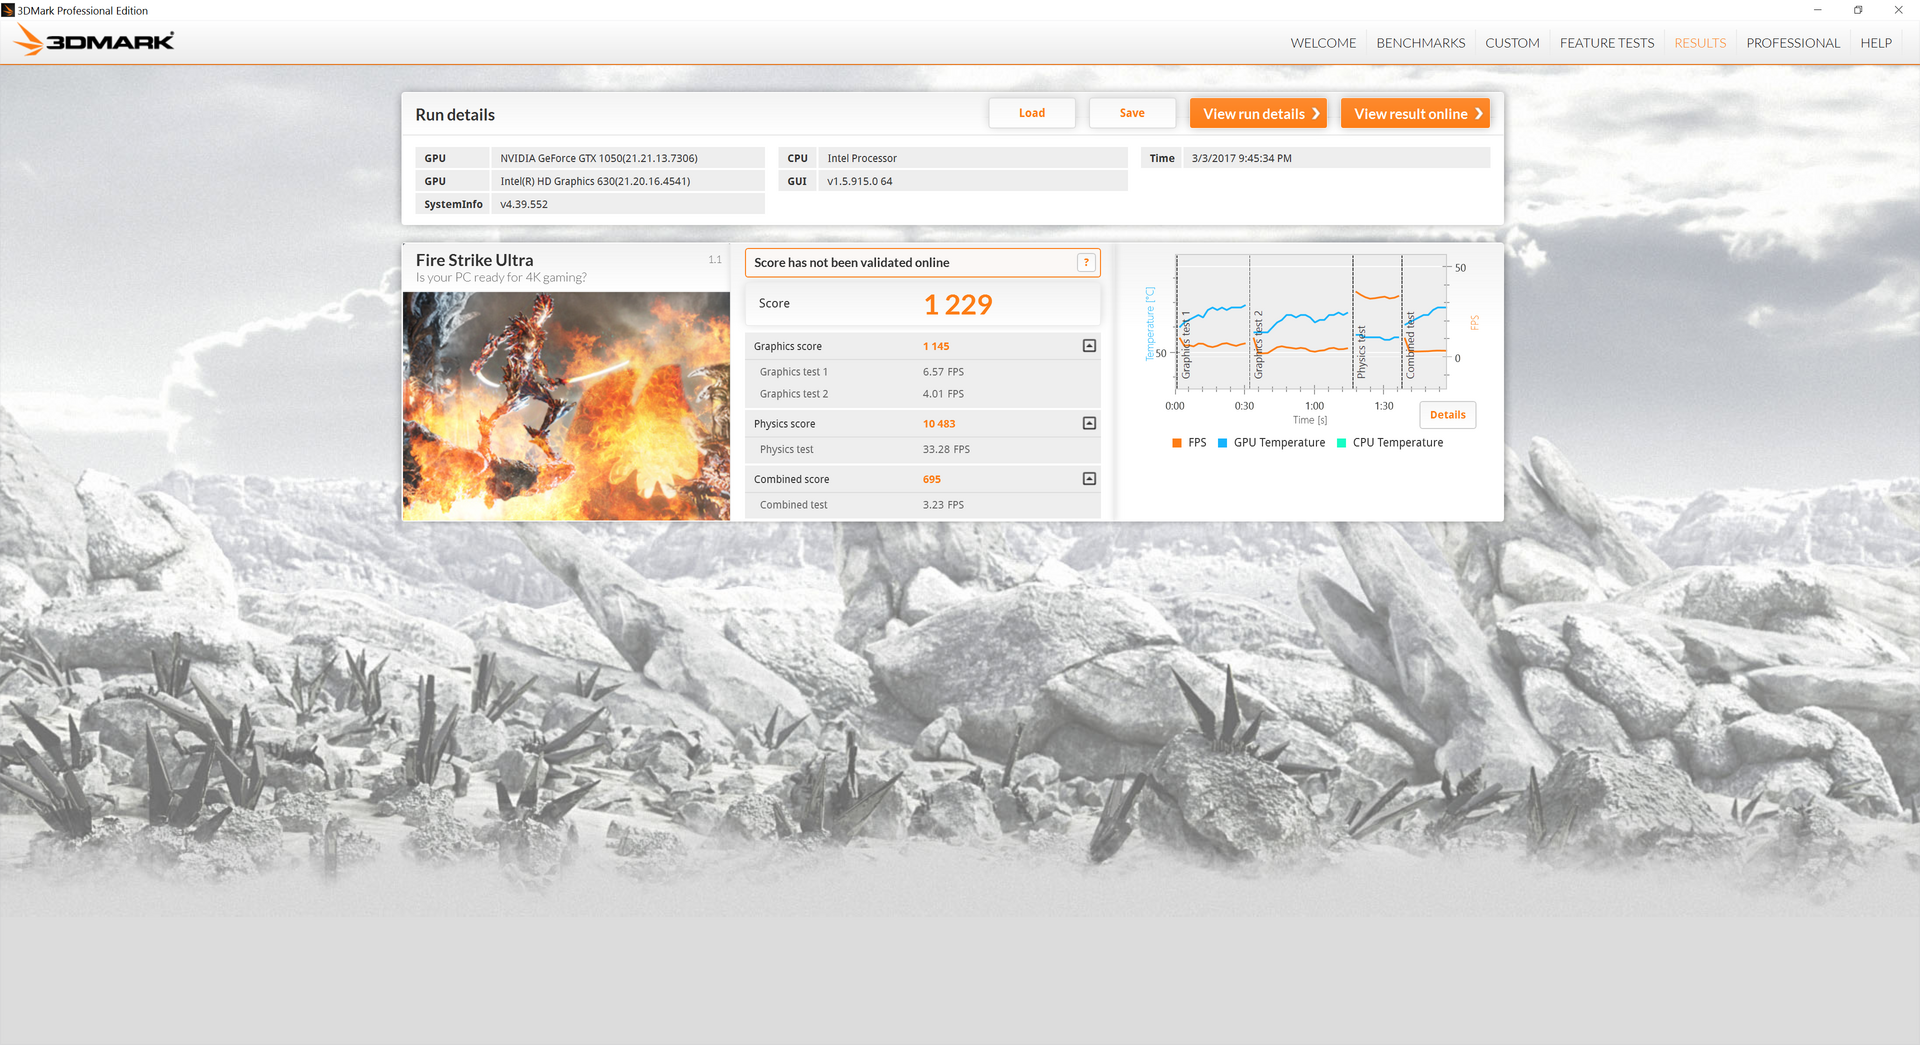
According to 3DMark Fire Strike benchmarks, users can expect a 35 to 45 percent performance increase when jumping from the GTX 960M to the GTX 1050 or about a 30 percent increase when compared to the Radeon Pro 460 in the latest MacBook Pro 15. The GPU sits comfortably between the GTX 960M and 970M, both of which were common finds on gaming notebooks of yesteryear. When compared to our desktop 2 GB GTX 1050 reference card, the 4 GB GTX 1050 in the Dell is behind by about 10 to 15 percent.

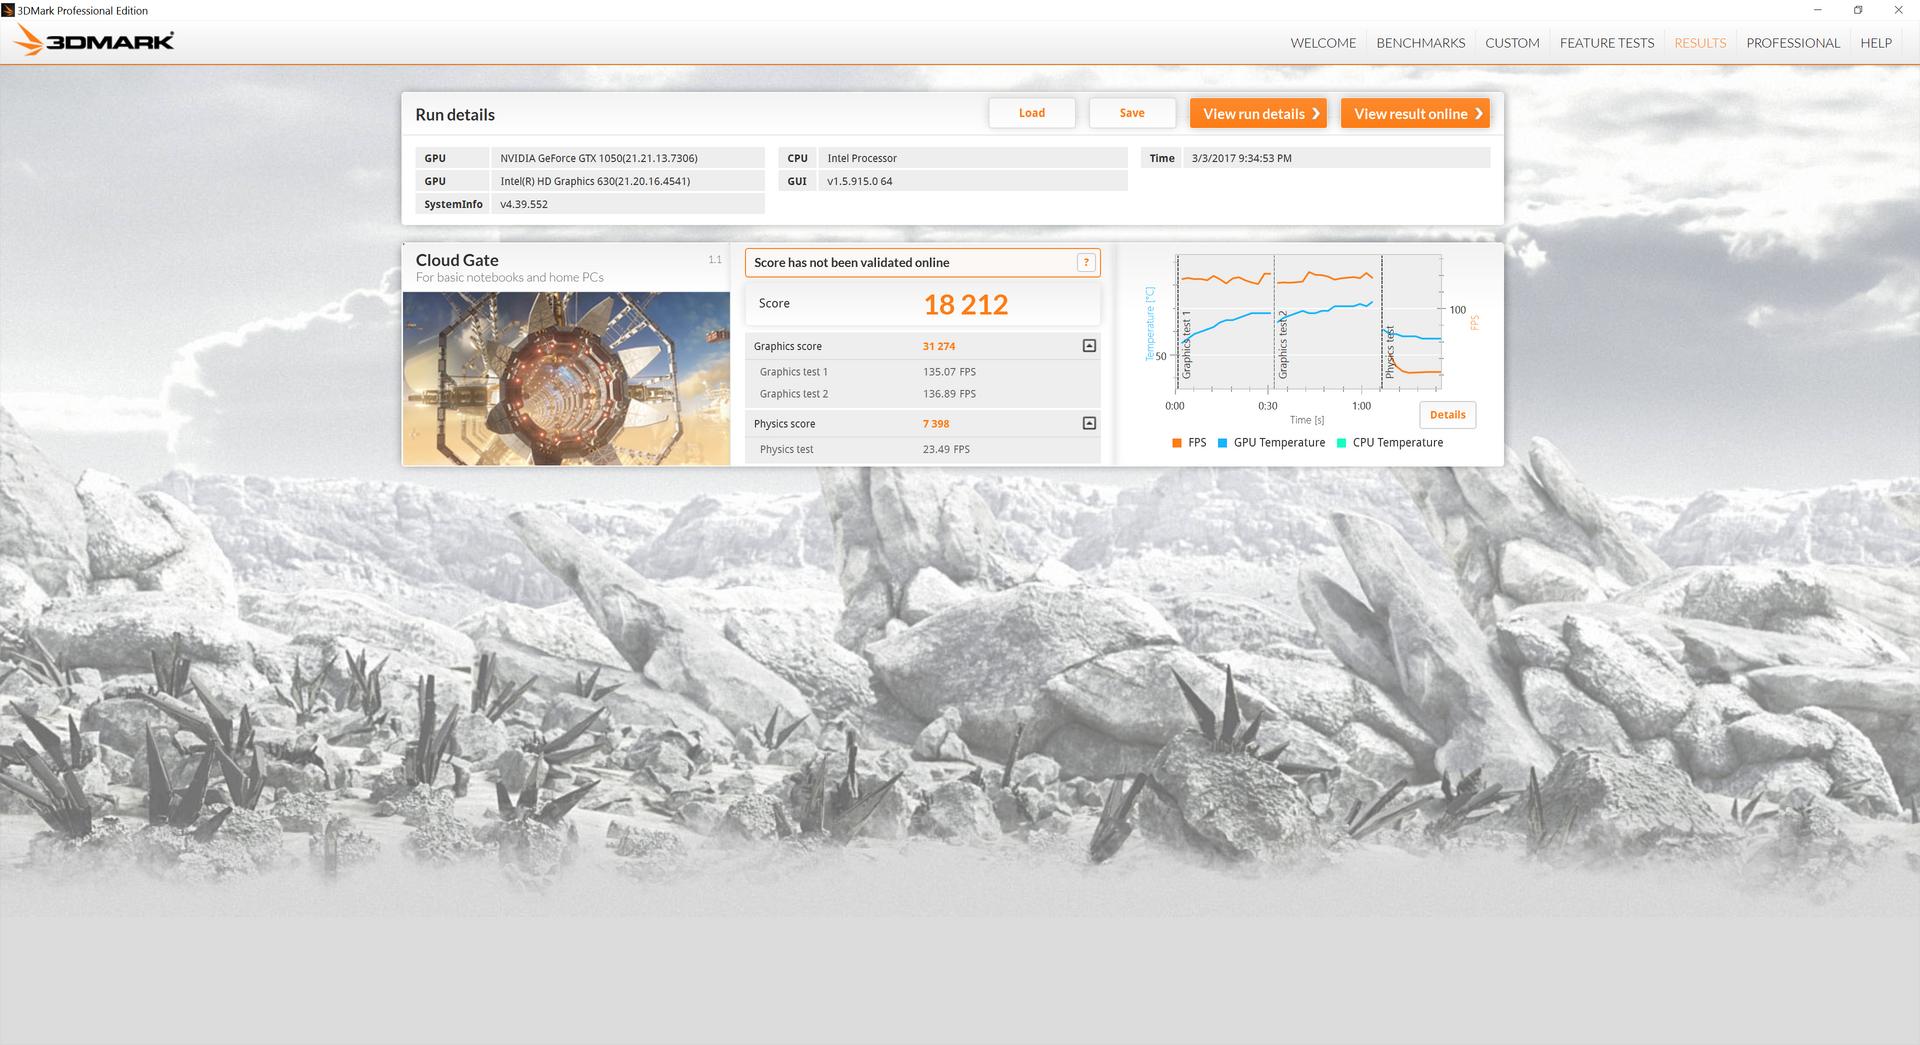
| 3DMark Ice Storm Standard Score | 31054 points | |
| 3DMark Cloud Gate Standard Score | 18212 points | |
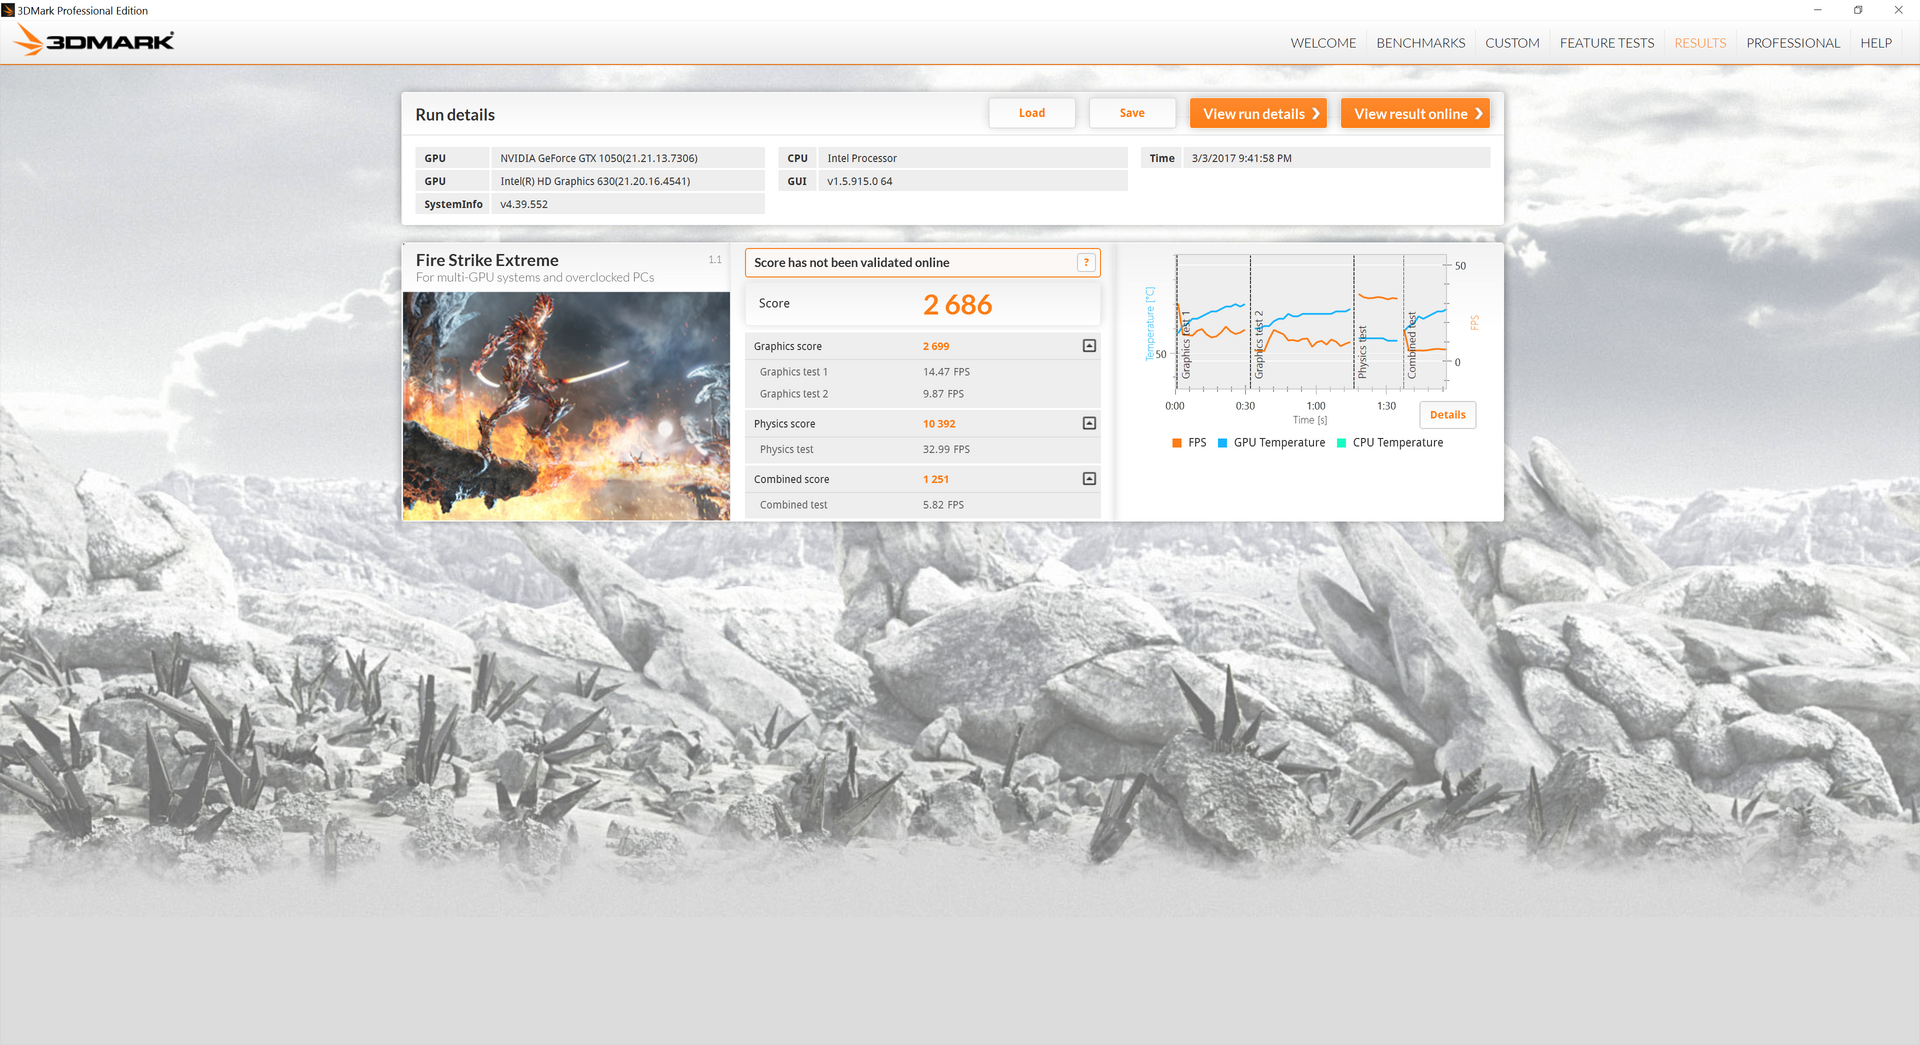
| 3DMark Fire Strike Score | 5524 points | |
| 3DMark Fire Strike Extreme Score | 2686 points | |
Help | ||
Gaming Performance
From a multimedia notebook perspective, the ability to play most demanding games on high settings and at native 1080p deserves praise. Tested games perform 40 to 50 percent faster on the new XPS 15 9560 compared to the older XPS 15 9550. Attempting to play modern games at the native 4K UHD resolution, however, is not recommended unless if graphical settings are reduced substantially. Furthermore, moderate ghosting is present and is very noticeable on FPS titles like Fallout 4 and Overwatch. Hardcore gamers may find the XPS 15 unacceptable especially now that newer dedicated gaming notebooks have 5 ms/120 Hz display options.
See our dedicated GTX 1050 GPU page for more technical information and benchmark comparisons.
| Rise of the Tomb Raider - 1920x1080 Very High Preset AA:FX AF:16x | |
| Asus FX502VM-AS73 | |
| MSI GE72 7RE-046 | |
| Zotac GeForce GTX 1050 2GB | |
| Dell XPS 15 9560 (i7-7700HQ, UHD) | |
| Dell XPS 15 9550 i7 FHD | |
| Metro: Last Light - 1920x1080 Very High (DX11) AF:16x | |
| Asus FX502VM-AS73 | |
| Aorus X3 Plus v5 | |
| Zotac GeForce GTX 1050 2GB | |
| Dell XPS 15 9560 (i7-7700HQ, UHD) | |
| Dell XPS 15 9550 i7 FHD | |
| BioShock Infinite - 1920x1080 Ultra Preset, DX11 (DDOF) | |
| Asus FX502VM-AS73 | |
| Aorus X3 Plus v5 | |
| Zotac GeForce GTX 1050 2GB | |
| Dell XPS 15 9560 (i7-7700HQ, UHD) | |
| Dell XPS 15 9550 i7 FHD | |
| Thief - 1920x1080 Very High Preset AA:FXAA & High SS AF:8x | |
| Asus FX502VM-AS73 | |
| Aorus X3 Plus v5 | |
| Dell XPS 15 9560 (i7-7700HQ, UHD) | |
| Dell XPS 15 9550 i7 FHD | |
| Batman: Arkham Knight - 1920x1080 High / On AA:SM AF:16x | |
| MSI GE72 7RE-046 | |
| Dell XPS 15 9560 (i7-7700HQ, UHD) | |
| Dell XPS 15 9550 i7 FHD | |
| Fallout 4 - 1920x1080 Ultra Preset AA:T AF:16x | |
| Asus FX502VM-AS73 | |
| MSI GE72 7RE-046 | |
| Aorus X3 Plus v5 | |
| Zotac GeForce GTX 1050 2GB | |
| Dell XPS 15 9560 (i7-7700HQ, UHD) | |
| Dell XPS 15 9550 i7 FHD | |
| Doom - 1920x1080 Ultra Preset AA:SM | |
| Asus FX502VM-AS73 | |
| MSI GE72 7RE-046 | |
| Dell XPS 15 9560 (i7-7700HQ, UHD) | |
| Zotac GeForce GTX 1050 2GB | |
| Overwatch - 1920x1080 Epic (Render Scale 100 %) AA:SM AF:16x | |
| Asus FX502VM-AS73 | |
| MSI GE72 7RE-046 | |
| Zotac GeForce GTX 1050 2GB | |
| Dell XPS 15 9560 (i7-7700HQ, UHD) | |
| Mafia 3 - 1920x1080 High Preset | |
| Asus FX502VM-AS73 | |
| MSI GE72 7RE-046 | |
| Zotac GeForce GTX 1050 2GB | |
| Dell XPS 15 9560 (i7-7700HQ, UHD) | |
| low | med. | high | ultra | 4K | |
|---|---|---|---|---|---|
| StarCraft II: Heart of the Swarm (2013) | 71 | ||||
| BioShock Infinite (2013) | 152.5 | 66 | |||
| Metro: Last Light (2013) | 83.9 | 45.1 | |||
| Thief (2014) | 76 | 41.9 | |||
| The Witcher 3 (2015) | 64.9 | 38.2 | 19.8 | ||
| Batman: Arkham Knight (2015) | 83 | 48 | 33 | 15 | |
| Metal Gear Solid V (2015) | 60 | 53.4 | 24.8 | ||
| Dota 2 Reborn (2015) | 34 | ||||
| Fallout 4 (2015) | 41.7 | 34.6 | 14 | ||
| Rise of the Tomb Raider (2016) | 71.9 | 39.8 | 32.9 | 13.1 | |
| Ashes of the Singularity (2016) | 34.9 | 29.8 | |||
| Doom (2016) | 57 | 53.8 | 17.5 | ||
| Overwatch (2016) | 90.7 | 54.5 | 30.2 | ||
| Mafia 3 (2016) | 21 |
Stress Test
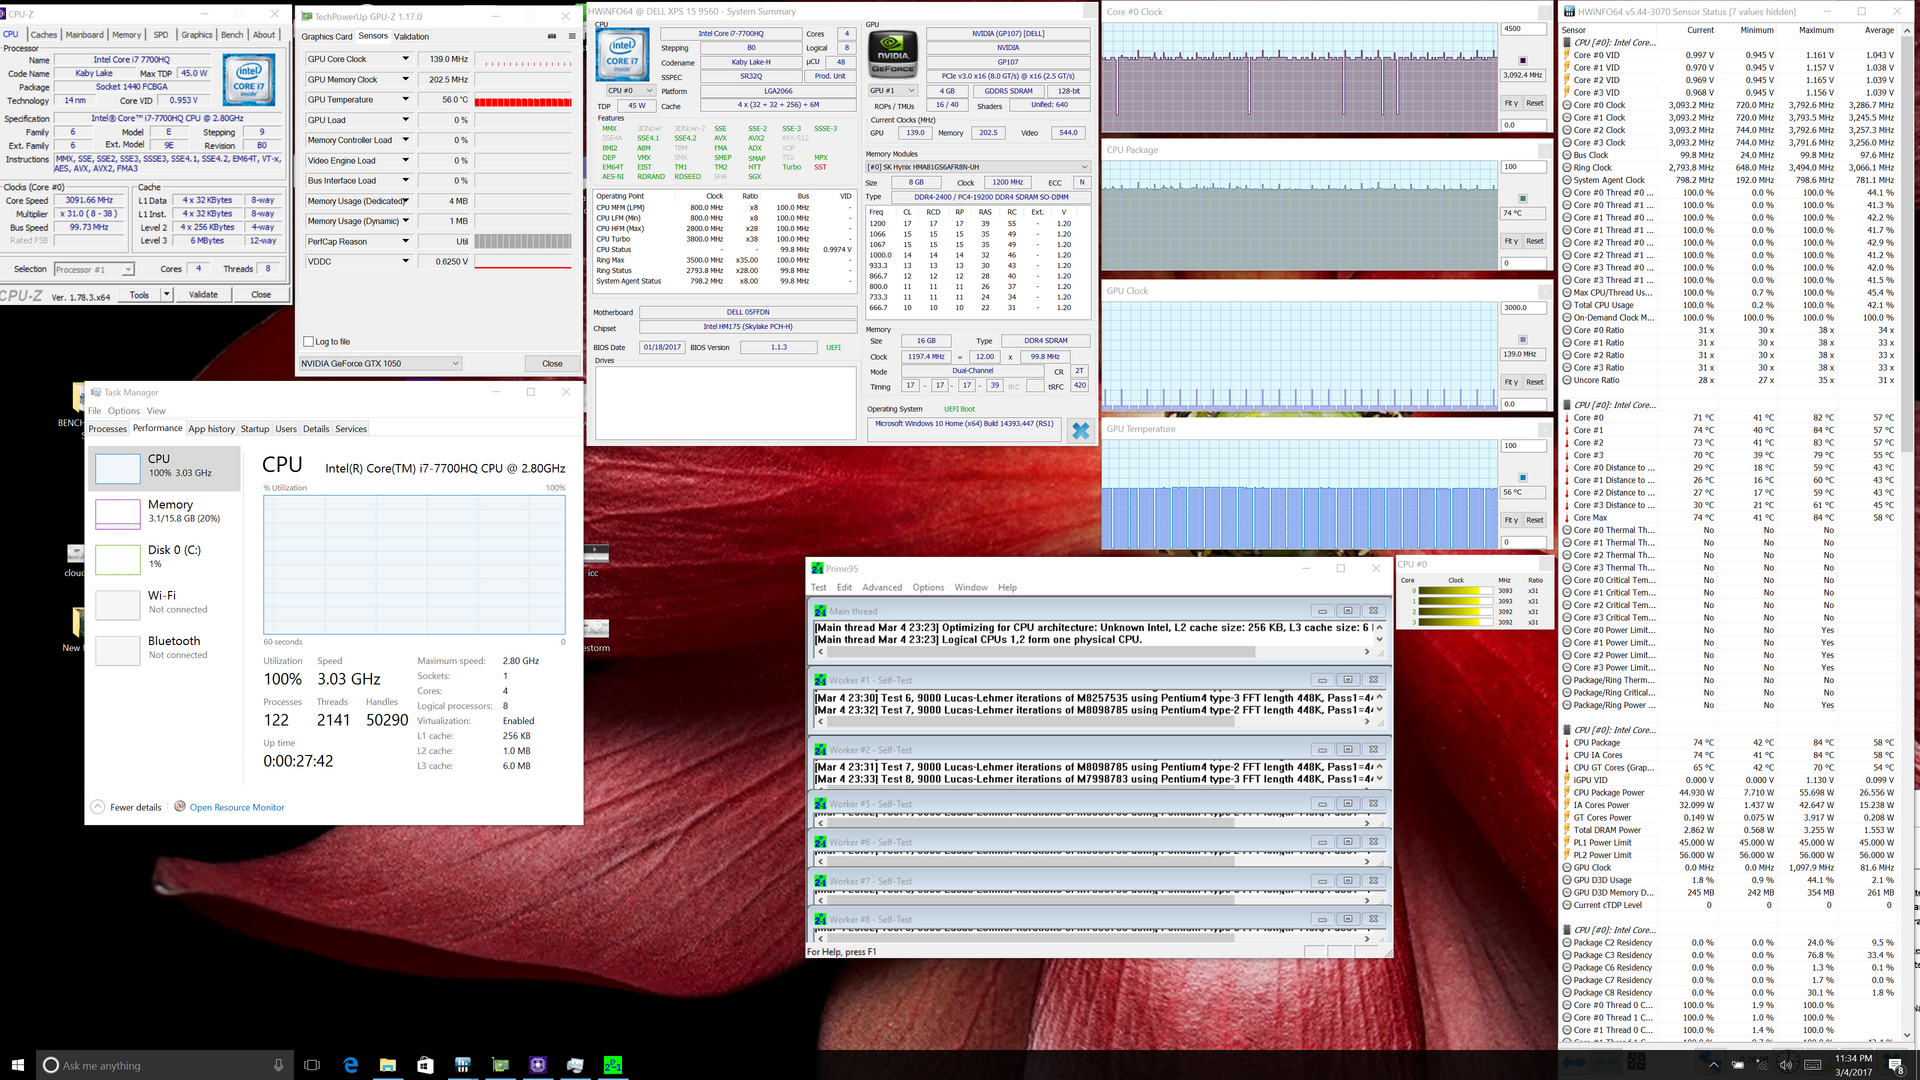
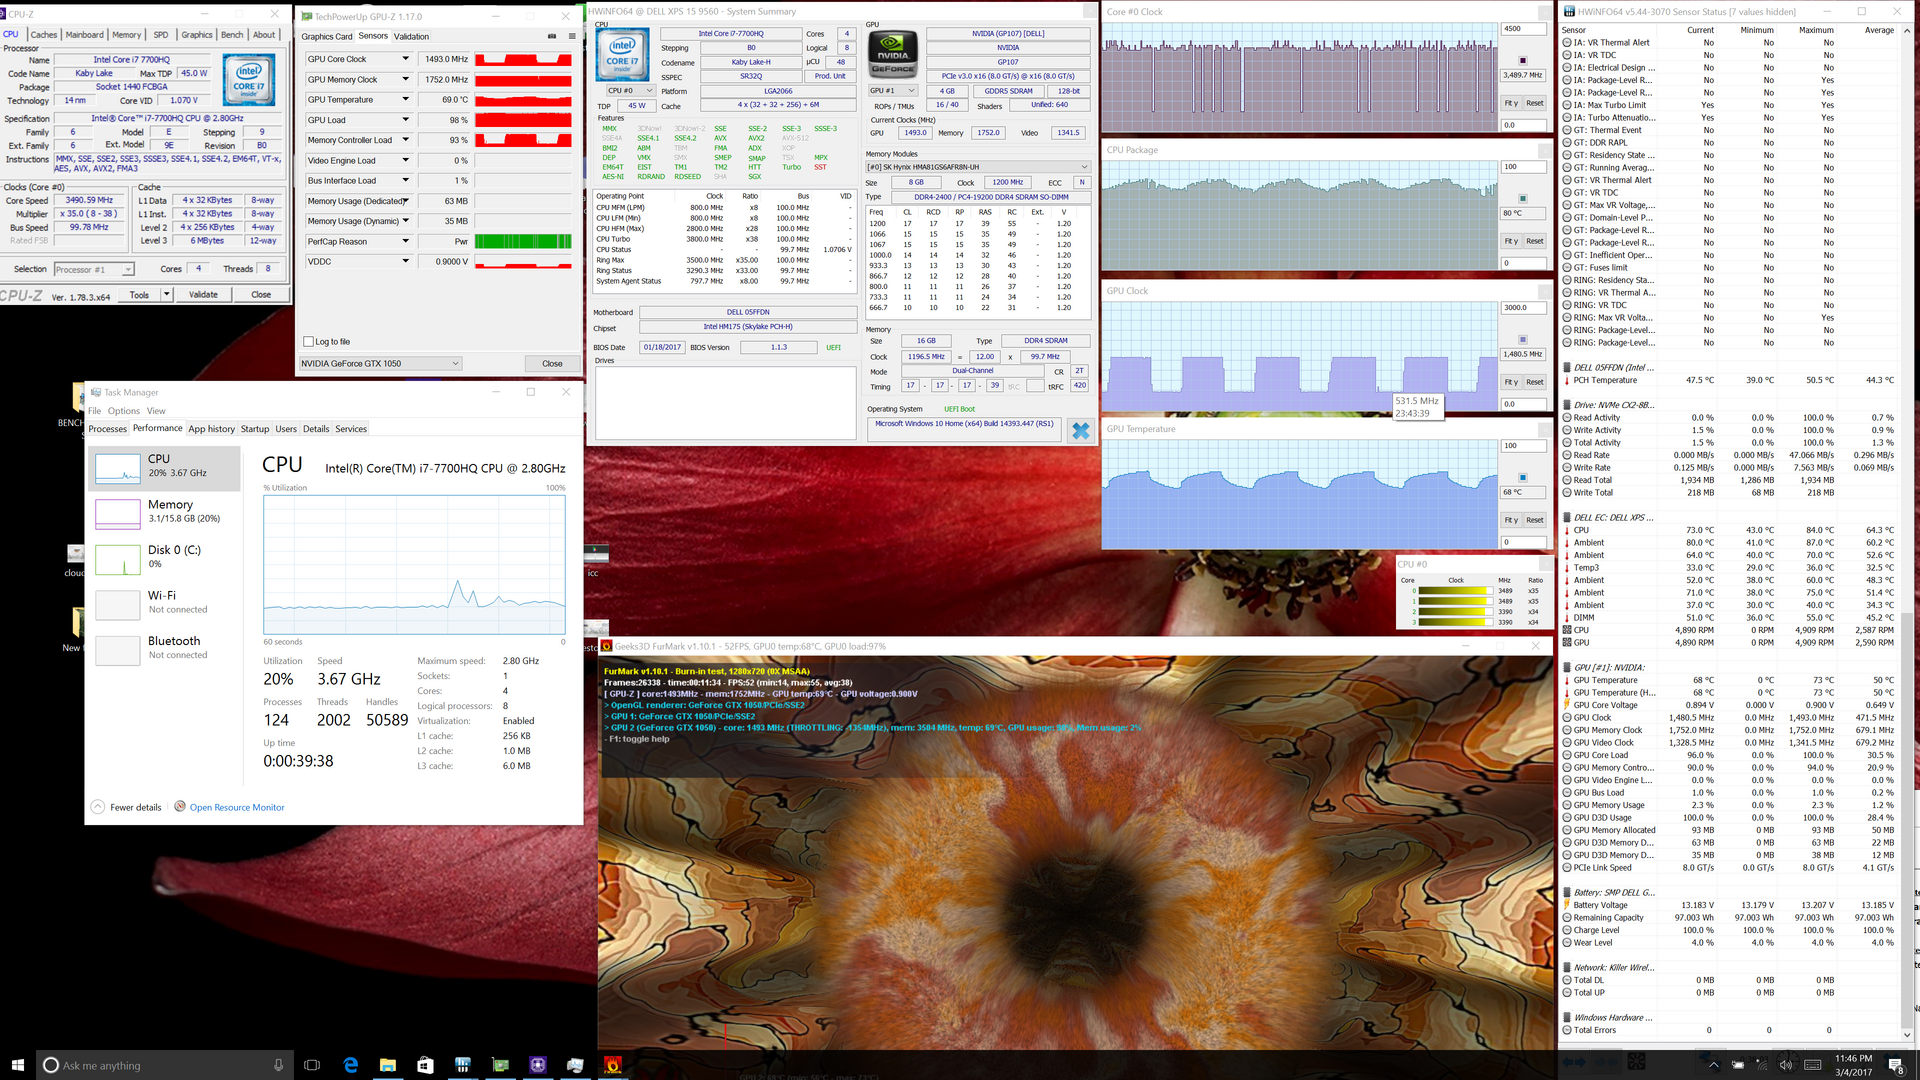
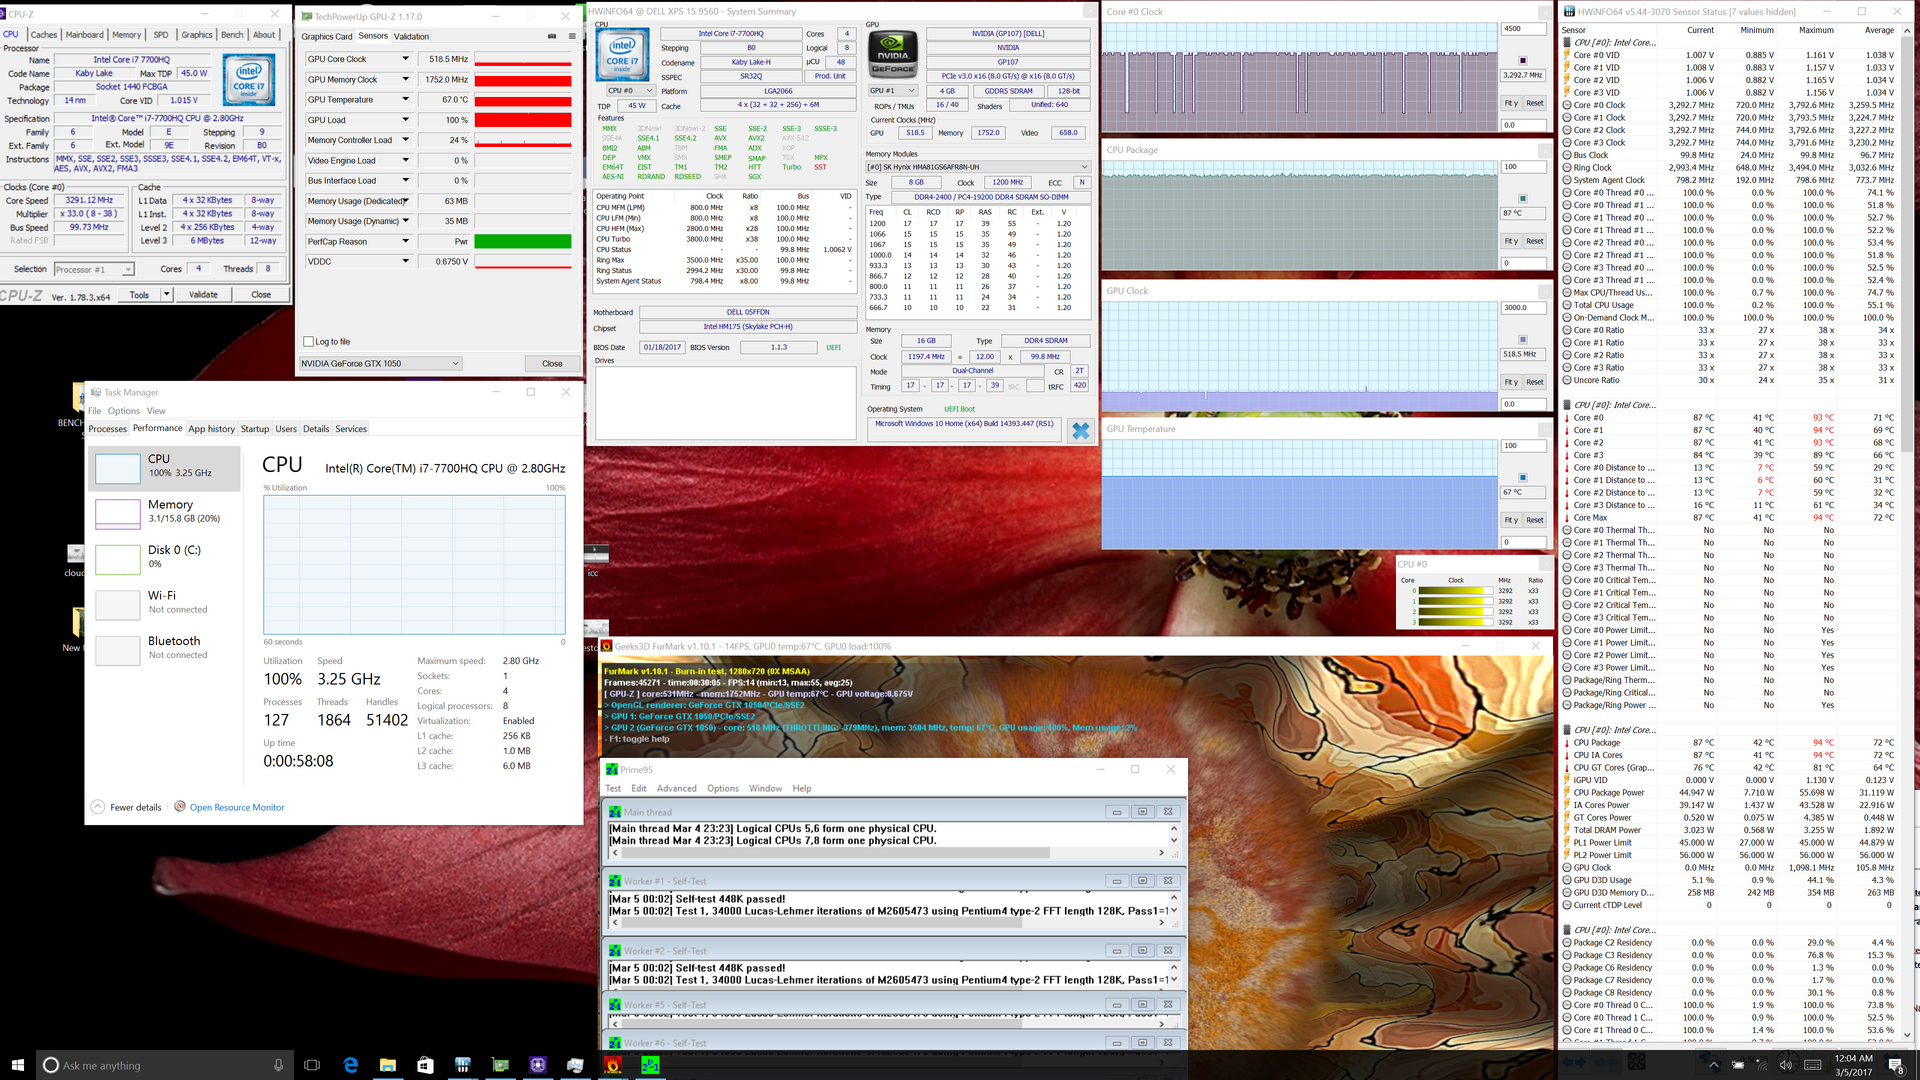
We stress the notebook to identify for any potential throttling or stability issues. When under Prime95 stress, the system is able to maintain a Boost clock rate of 3.1 GHz or 300 MHz above its base clock rate and at a steady core temperature of 74 C. Running FurMark will cause the Nvidia GPU to cycle between ~532 MHz and ~1481 MHz. This appears to occur whenever GPU temperature reaches 73 C likely to avoid damaging adjacent components. Dedicated gaming notebooks may run warmer as the GTX 1060 GPU in the Asus FX502VM can reach higher temperatures closer to the 80 C range when under similar conditions.
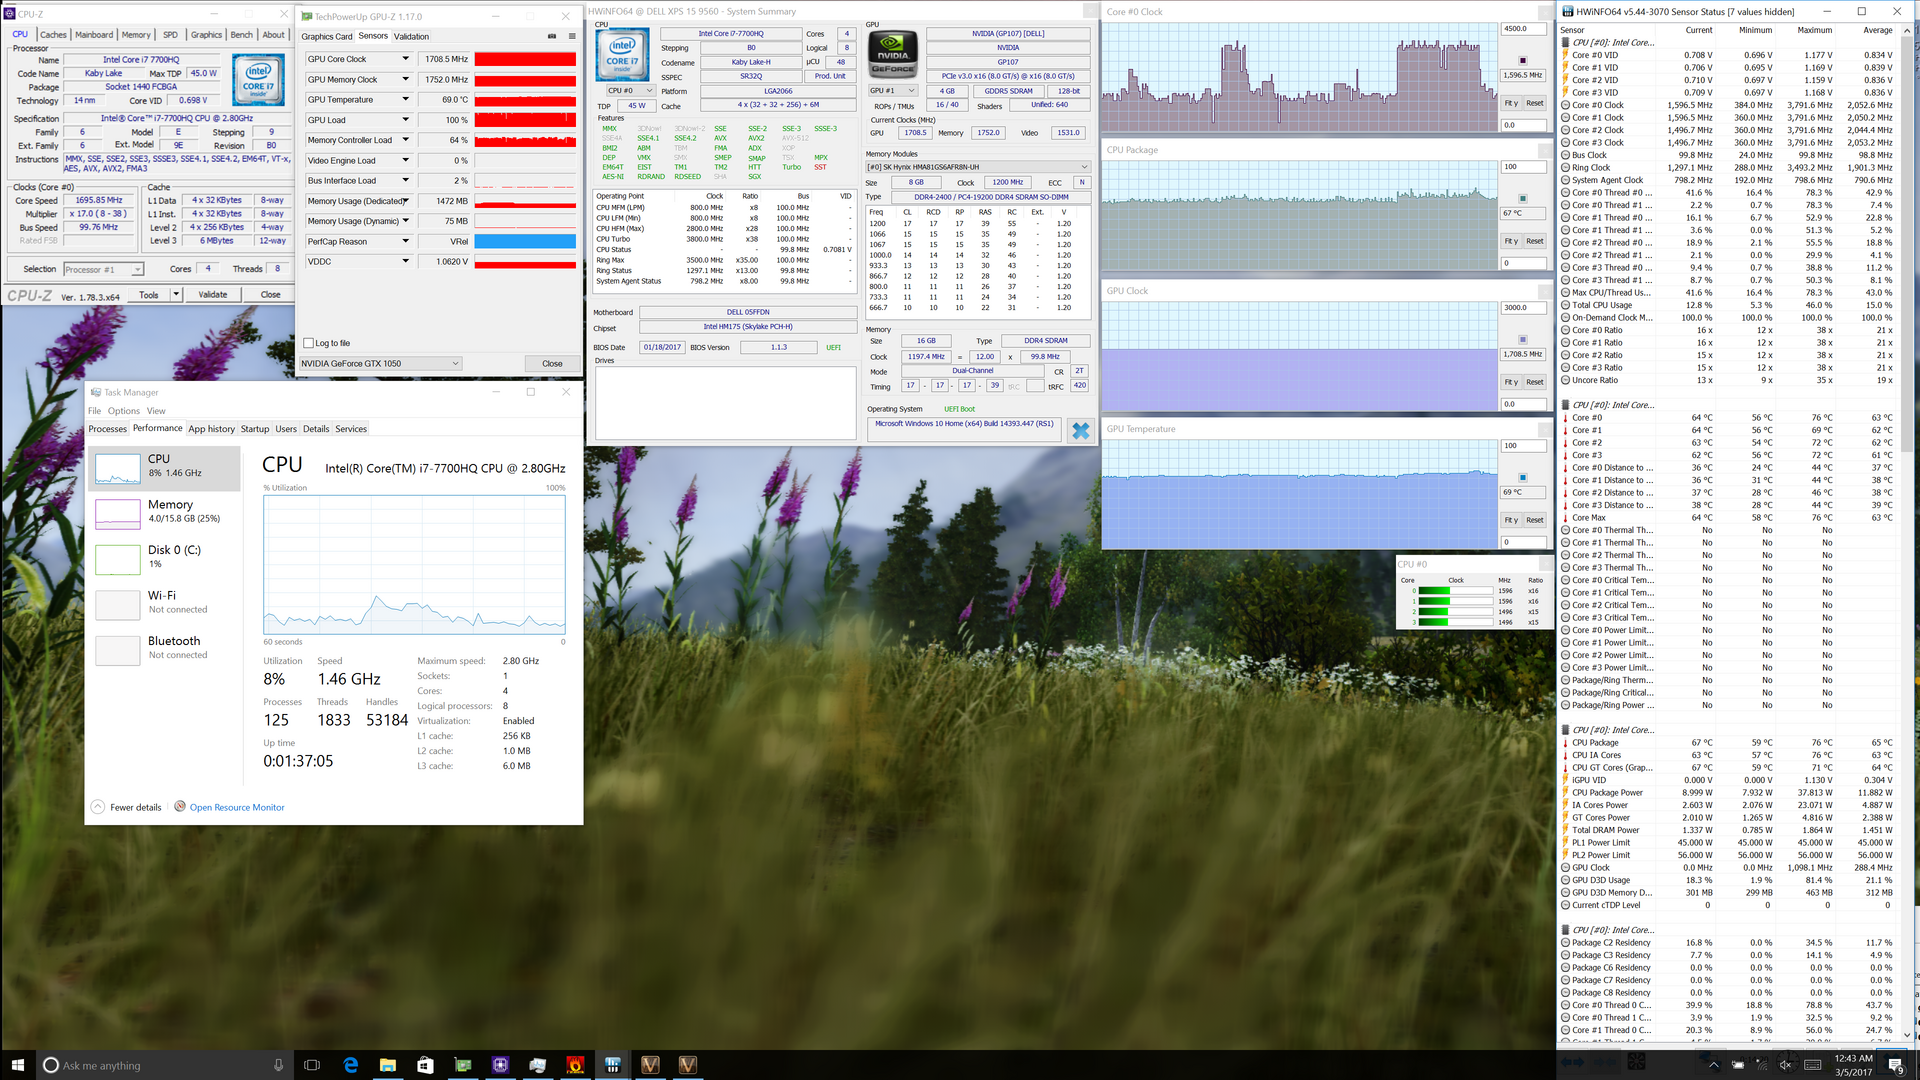
Running both Prime95 and FurMark simultaneously will throttle to GPU down to just 519 MHz while the CPU runs unabated at a higher 3.3 GHz. CPU temperature plateaus at a higher 87 C as a direct result. Running Unigine Valley to better represent real-world GPU stress will have the dGPU operating at a steady 1709 MHz, though core temperature plateaus at 69 C - a bit too close to 73 C for our liking. The notebook may be sensitive to throttling if working in higher ambient temperatures.
| CPU Clock (GHz) | GPU Clock (MHz) | Average CPU Temperature (°C) | Average GPU Temperature (°C) | |
| Prime95 Stress | 3.1 | -- | 74 | 56 |
| FurMark Stress | -- | 532 - 1481 | 75 - 80 | 65 - 73 |
| Prime95 + FurMark Stress | 3.3 | 519 | 87 | 67 |
| Unigine Valley Stress | 1.5+ | 1709 | 67 | 69 |
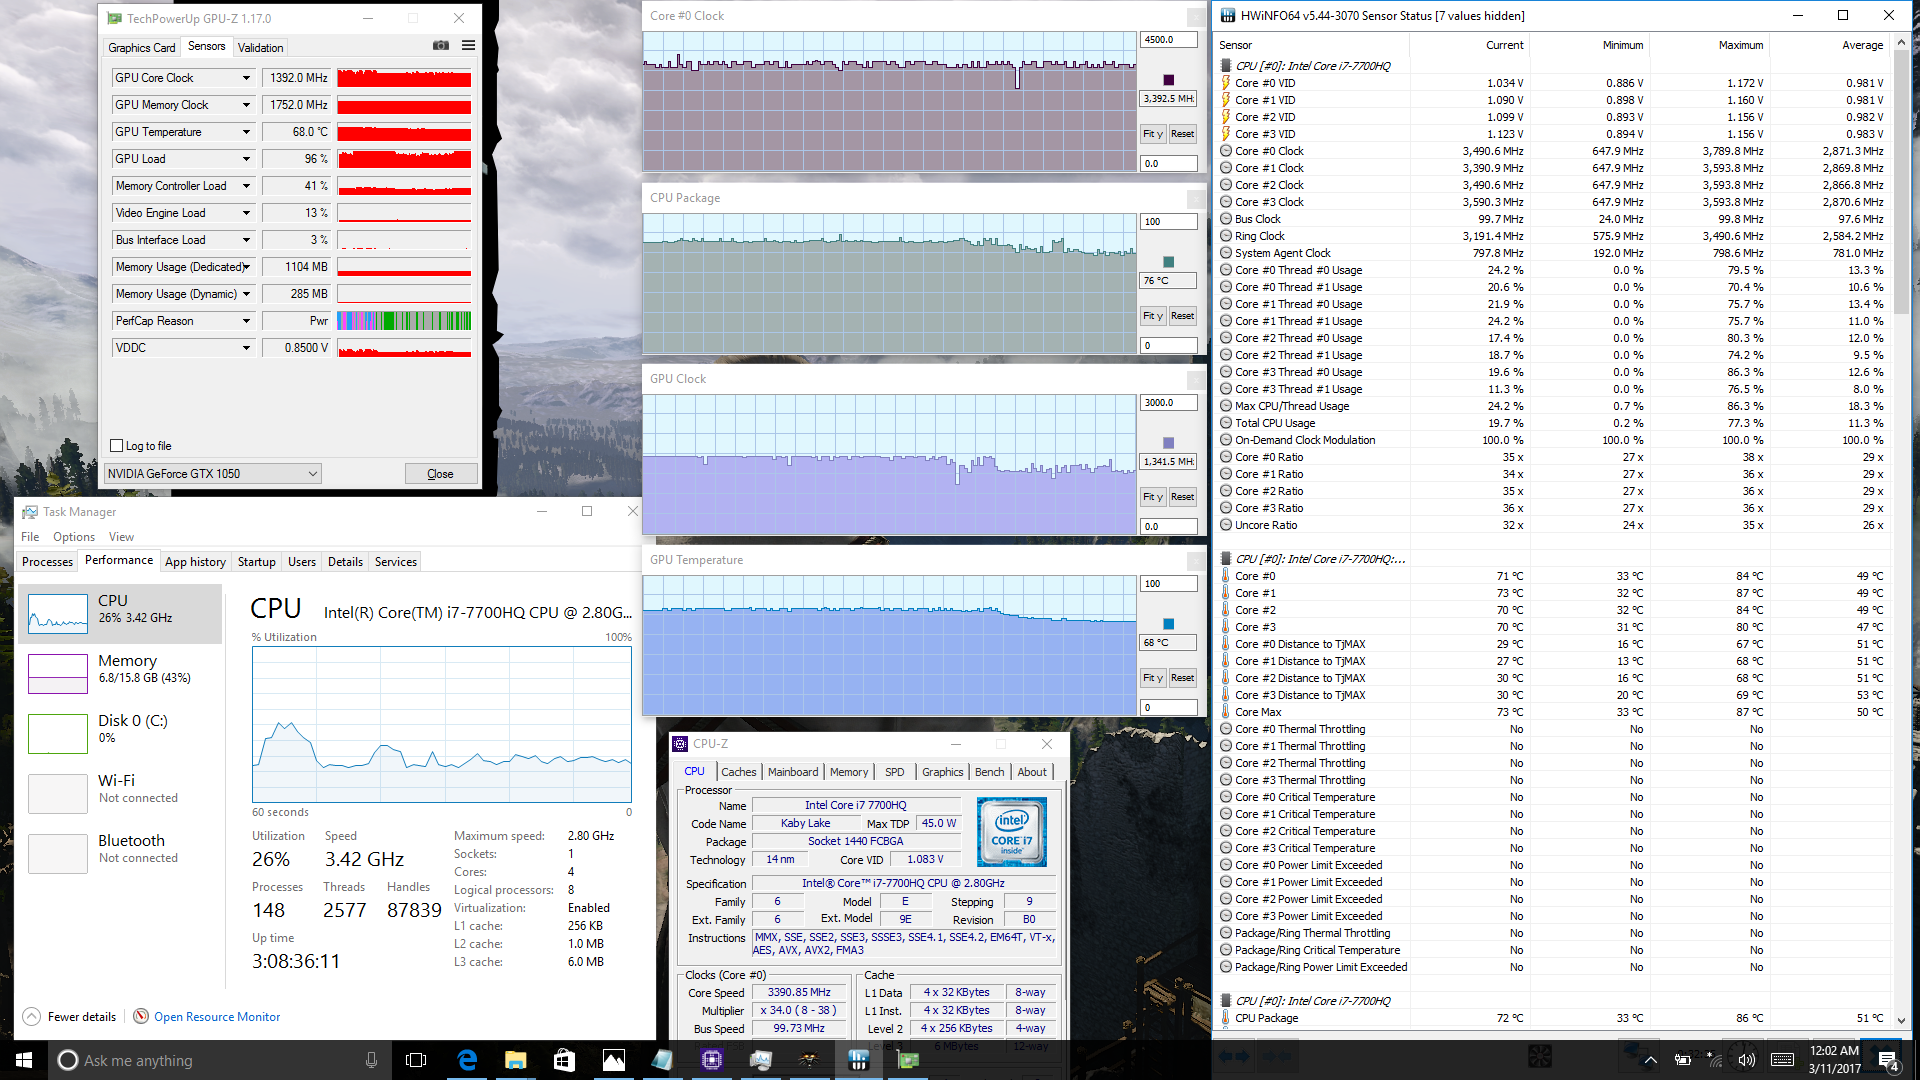
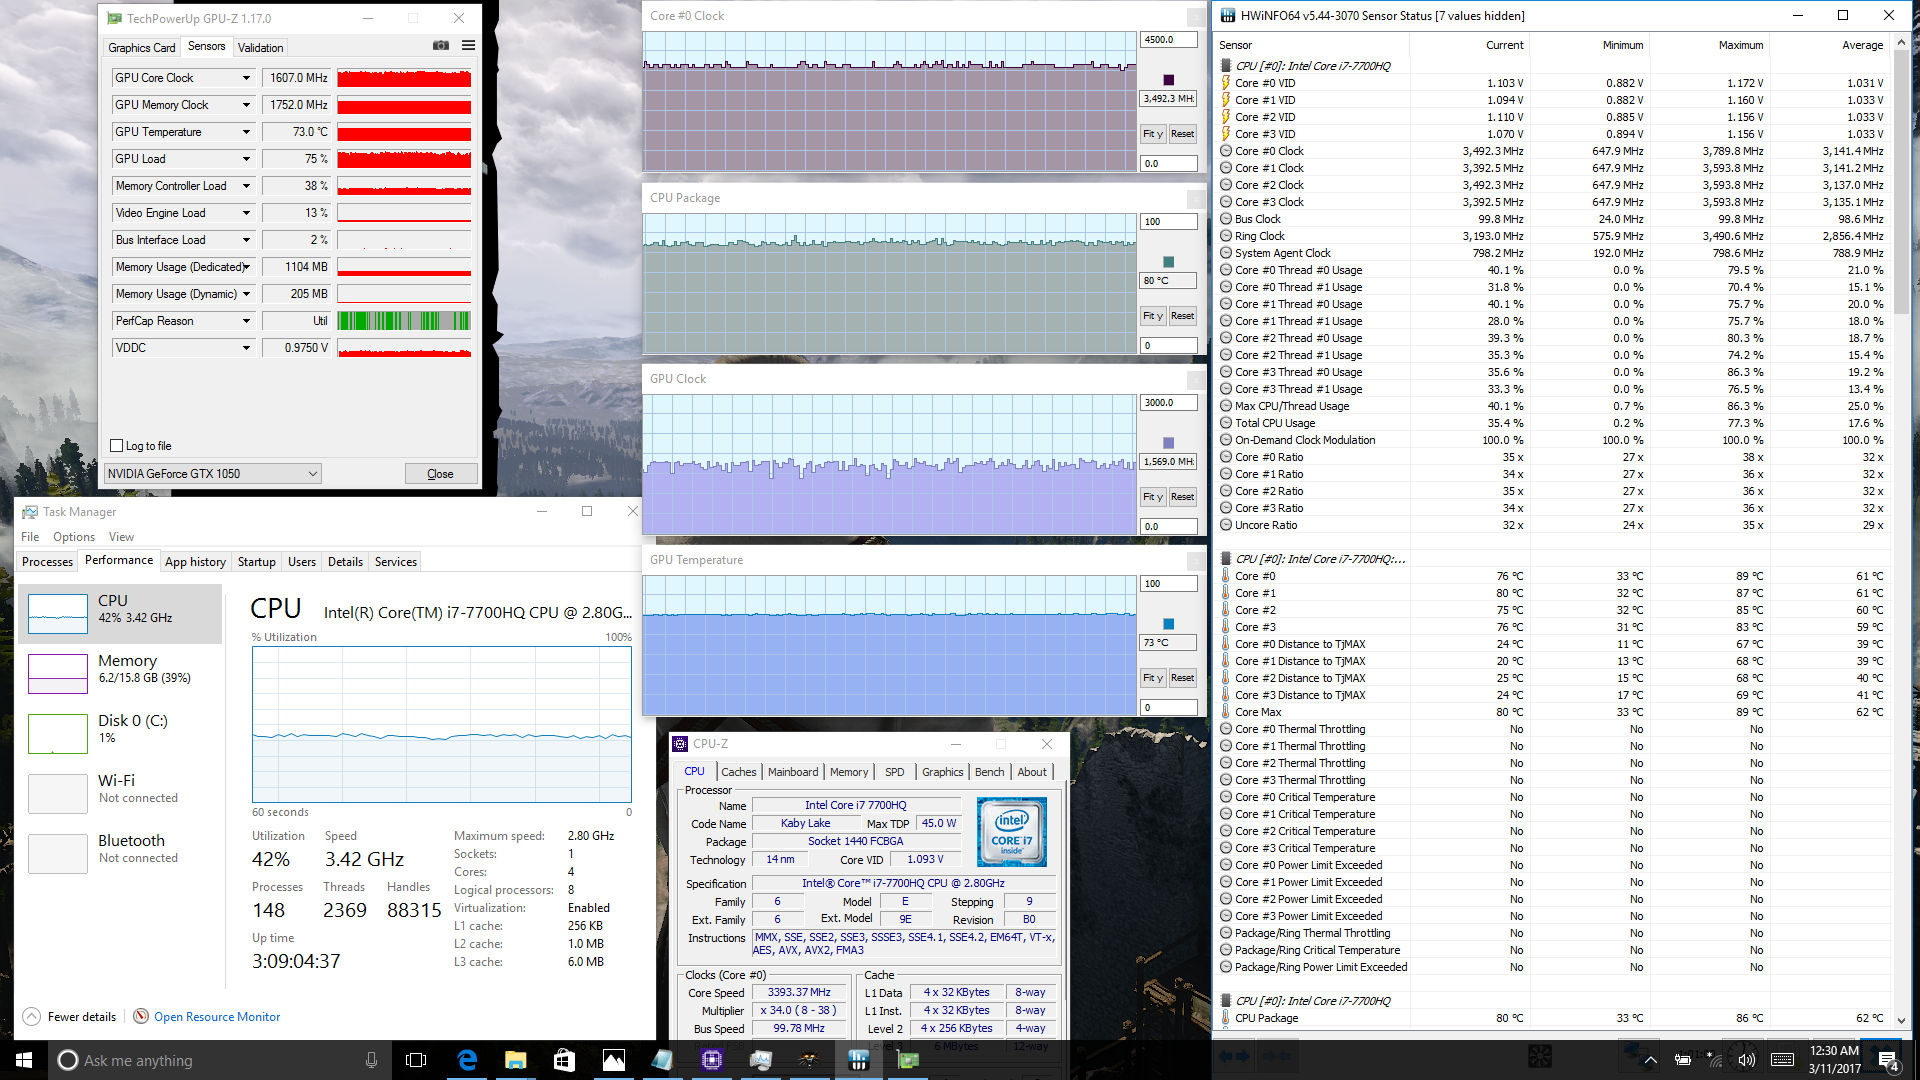
In addition to the conditions above, we also tested the notebook under Witcher 3 stress. The CPU can be observed maintaining a steady Turbo Boost clock rate in the 3.3 to 3.5 GHz range throughout the hour-long test. The Nvidia GPU, however, will initially run at a steady 1695 MHz for the first few minutes until core temperature inevitably reaches 77 C or 78 C. Afterwards, clock rates settle at a more variable ~1350 - 1600 MHz range. This range is still above the base 1354 MHz core clock of the GPU, so heavy throttling is not observed. GPU-Z indicates performance limitations due to GPU utilization and power limits.
Both the CPU and GPU stabilize at 80 C and 73 C, respectively, after a full hour of running Witcher 3 on 1080p Ultra settings. The system maintained frame rates in the 18 to 20 FPS range as shown by the chart below for no major performance dips. Variable GPU clock rates above the base clock rate are common on gaming notebooks when running the latest titles.
Emissions
System Noise
The dual system fans remain idle during the first few minutes of boot up and use. Any sort of prolonged video playback or light-moderate web browsing, however, will bump fan noise to a low but audible 32 dB(A). This is fortunately still a quiet range, but we recommend running on the Power Saver profile and with the iGPU active if complete silence is desired. The fans are active more often than not.
Launch a gaming application and the fans will slowly begin to speed up until settling at a steady 47 dB(A) or even up to 52 dB(A) as is the case when running Witcher 3. This is very loud for a multimedia notebook and not unlike what we observed on the lesser i5-7300HQ XPS 13 SKU. In fact, fan behavior on the XPS 15 is more akin to thin gaming notebooks like the Asus GL502VM than something like the HP Envy or Lenovo IdeaPad. The small chassis dimensions and powerful GPU come at the very tangible cost of higher fan noise.
We can notice coil whining on our test unit when placing our ears close to the keyboard. It's just barely audible even when in a silent room, so users will be very unlikely to notice during day-to-day use.
Noise level
| Idle |
| 29 / 29 / 32.2 dB(A) |
| Load |
| 47.1 / 47.1 dB(A) |
 | ||
30 dB silent 40 dB(A) audible 50 dB(A) loud |
||
min: | ||
| Dell XPS 15 9560 (i7-7700HQ, UHD) | Asus FX502VM-AS73 | Apple MacBook Pro 15 2016 (2.9 GHz, 460) | Dell XPS 15 2017 9560 (7300HQ, Full-HD) | Dell XPS 15 9550 i7 FHD | |
|---|---|---|---|---|---|
| Noise | -3% | 4% | -5% | 6% | |
| off / environment * (dB) | 28.4 | 28.7 -1% | 29 -2% | 30.3 -7% | |
| Idle Minimum * (dB) | 29 | 30.6 -6% | 30.3 -4% | 31.6 -9% | 29.2 -1% |
| Idle Average * (dB) | 29 | 30.6 -6% | 30.3 -4% | 31.6 -9% | 29.3 -1% |
| Idle Maximum * (dB) | 32.2 | 31 4% | 30.3 6% | 33.4 -4% | 29.5 8% |
| Load Average * (dB) | 47.1 | 46.2 2% | 35.1 25% | 47.8 -1% | 36.5 23% |
| Witcher 3 ultra * (dB) | 52 | ||||
| Load Maximum * (dB) | 47.1 | 52.3 -11% | 46 2% | 47.8 -1% | 47.7 -1% |
* ... smaller is better
Temperature
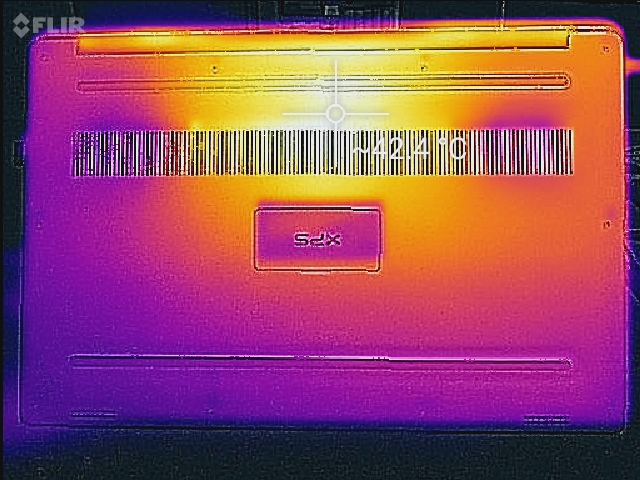
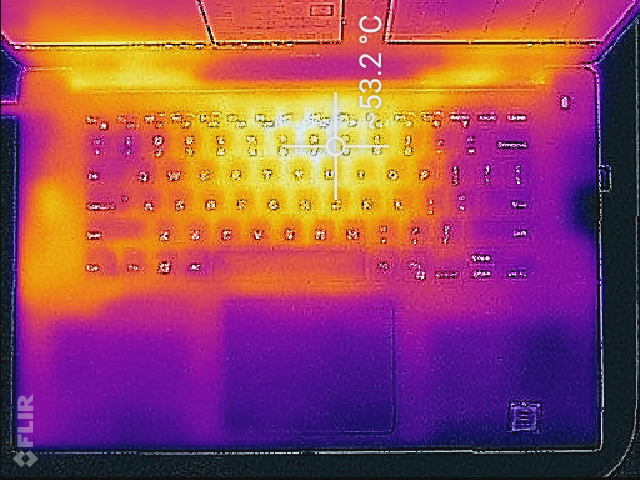
The symmetrical temperature gradient is a direct result of the symmetrical internal cooling solution. The hot spot near the upper center of the keyboard looks almost like a point source as surface temperatures steadily decline as you move farther away from this area. At worst, we can record a surface temperature of almost 49 C nearest the "6" and "7" keys compared to 47 C and 44 C on the less powerful HP Spectre x360 15 and graphically inferior MacBook Pro 15, respectively. The Dell never becomes uncomfortable to use despite the scary numbers since the palm rests experience almost no temperature changes. Of course, a XPS 15 SKU with an active secondary mechanical drive may cause the right palm rest to be noticeably warmer than what is shown here.
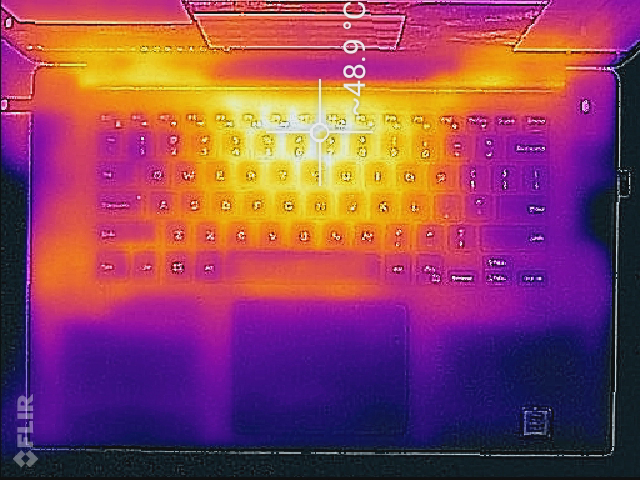
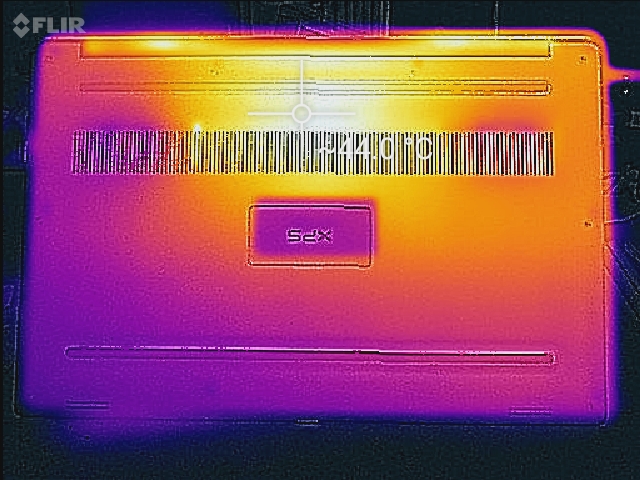
(-) The maximum temperature on the upper side is 48.8 °C / 120 F, compared to the average of 36.8 °C / 98 F, ranging from 21 to 71 °C for the class Multimedia.
(±) The bottom heats up to a maximum of 42.6 °C / 109 F, compared to the average of 39.1 °C / 102 F
(+) In idle usage, the average temperature for the upper side is 24.6 °C / 76 F, compared to the device average of 31.3 °C / 88 F.
(±) Playing The Witcher 3, the average temperature for the upper side is 36.8 °C / 98 F, compared to the device average of 31.3 °C / 88 F.
(+) The palmrests and touchpad are cooler than skin temperature with a maximum of 30.2 °C / 86.4 F and are therefore cool to the touch.
(±) The average temperature of the palmrest area of similar devices was 28.7 °C / 83.7 F (-1.5 °C / -2.7 F).
Speakers
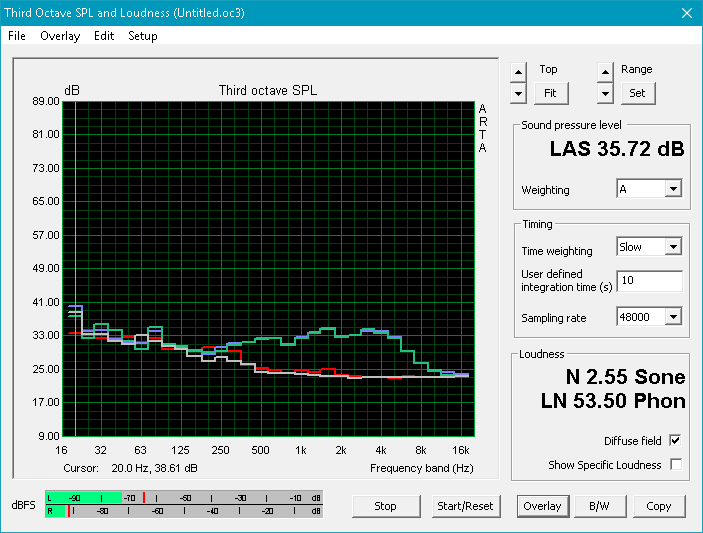
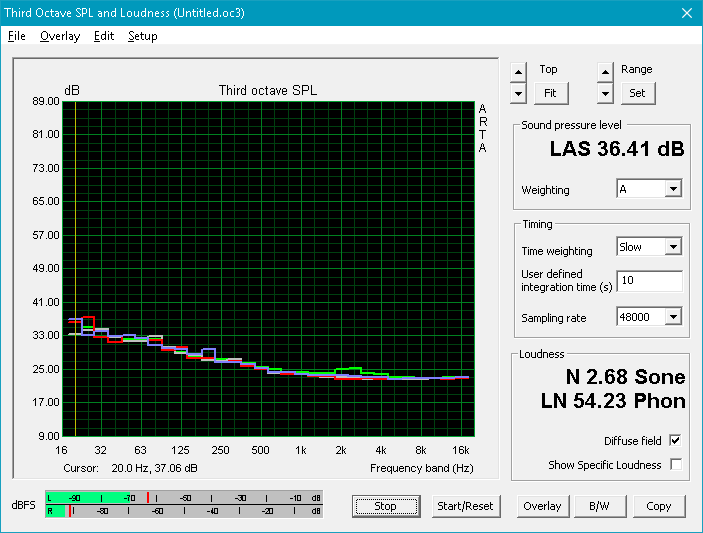
The stereo speakers are unimpressive on their default settings. The speakers on the Spectre x360 15 are noticeably louder and are better able to reproduce lower frequencies than the XPS 15. Our microphone measurements show a steep drop off at the 500 Hz range on the Dell compared to the 250 Hz range on the HP.
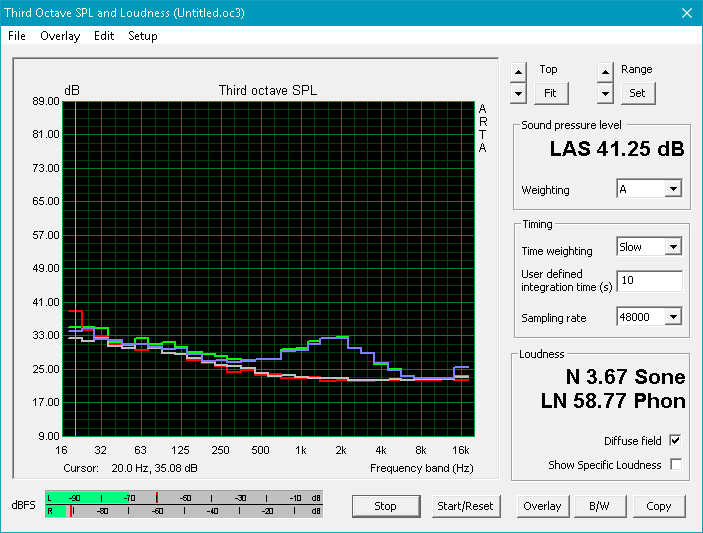
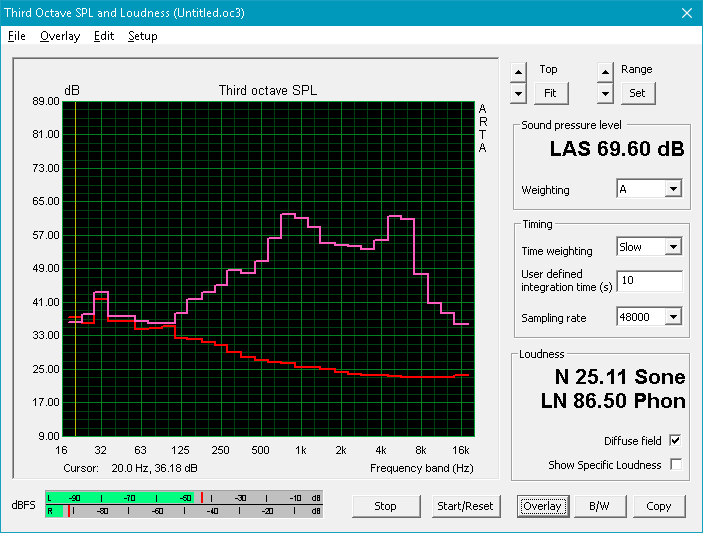
We retested the speakers with the MaxxAudio Pro equalizer enabled and this greatly increased both the frequency range and maximum volume of the internal speakers as shown below. This puts the Dell more in line with the Spectre if not slightly better at frequencies below 250 Hz. We recommend fiddling with the audio software as the default speaker settings are average out of the box. Maximum volume will reverberate the chassis just slightly when the equalizer is active.
The 3.5 mm audio jack expressed no issues; Plugging in external speakers will unnecessarily prompt a pop-up menu from the pre-installed MaxxAudioPro software asking the user to identify what type of speakers have been connected (earbuds, earphones, 2.1, etc.).


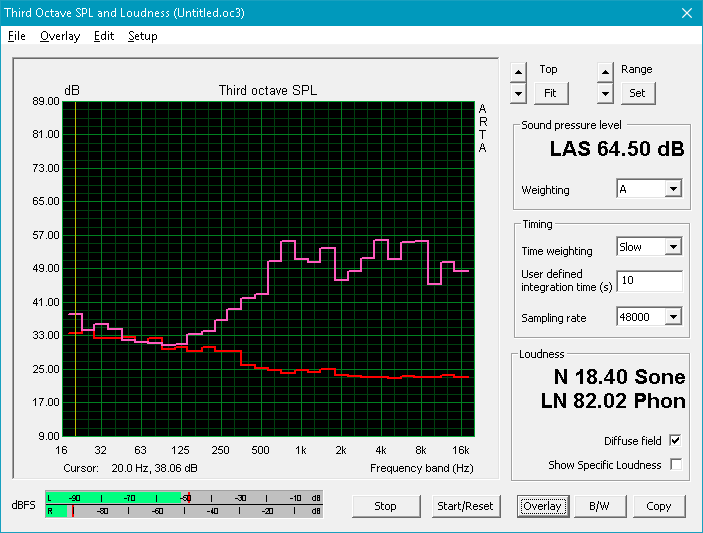
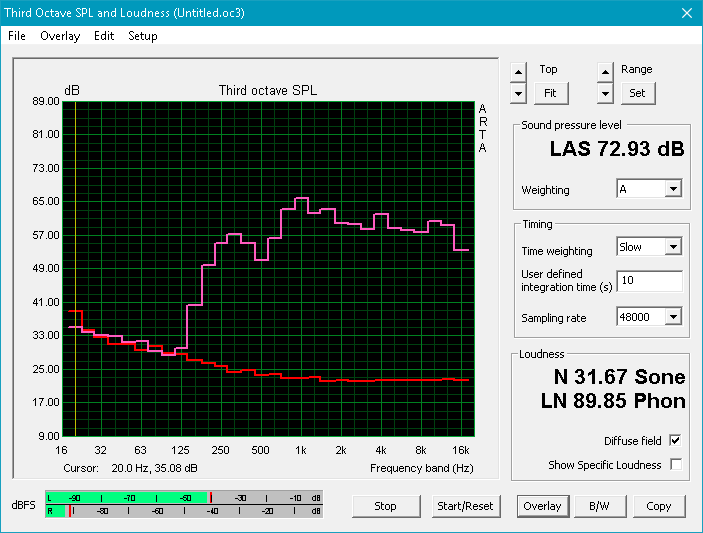
Dell XPS 15 9560 (i7-7700HQ, UHD) audio analysis
(-) | not very loud speakers (70.9 dB)
Bass 100 - 315 Hz
(±) | reduced bass - on average 12.9% lower than median
(±) | linearity of bass is average (14.3% delta to prev. frequency)
Mids 400 - 2000 Hz
(+) | balanced mids - only 3.5% away from median
(±) | linearity of mids is average (8.9% delta to prev. frequency)
Highs 2 - 16 kHz
(+) | balanced highs - only 2.3% away from median
(±) | linearity of highs is average (7.3% delta to prev. frequency)
Overall 100 - 16.000 Hz
(±) | linearity of overall sound is average (16.2% difference to median)
Compared to same class
» 41% of all tested devices in this class were better, 7% similar, 51% worse
» The best had a delta of 5%, average was 17%, worst was 45%
Compared to all devices tested
» 26% of all tested devices were better, 6% similar, 68% worse
» The best had a delta of 4%, average was 23%, worst was 134%
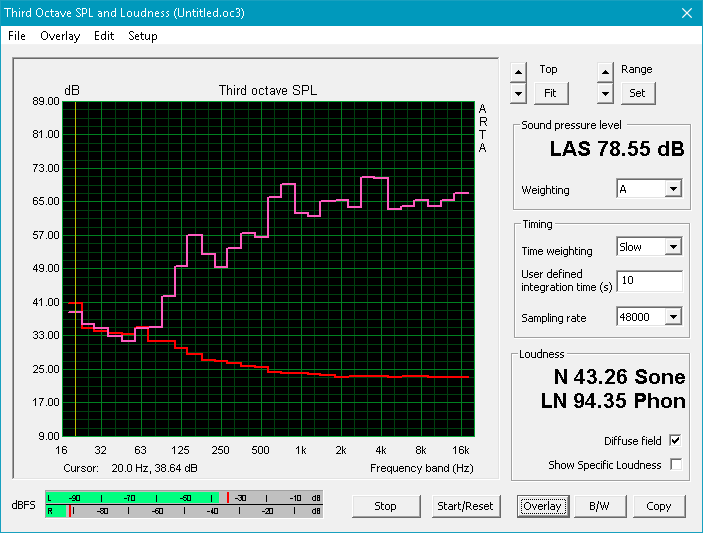
Apple MacBook 12 (Early 2016) 1.1 GHz audio analysis
(+) | speakers can play relatively loud (83.6 dB)
Bass 100 - 315 Hz
(±) | reduced bass - on average 11.3% lower than median
(±) | linearity of bass is average (14.2% delta to prev. frequency)
Mids 400 - 2000 Hz
(+) | balanced mids - only 2.4% away from median
(+) | mids are linear (5.5% delta to prev. frequency)
Highs 2 - 16 kHz
(+) | balanced highs - only 2% away from median
(+) | highs are linear (4.5% delta to prev. frequency)
Overall 100 - 16.000 Hz
(+) | overall sound is linear (10.2% difference to median)
Compared to same class
» 7% of all tested devices in this class were better, 2% similar, 90% worse
» The best had a delta of 5%, average was 18%, worst was 53%
Compared to all devices tested
» 5% of all tested devices were better, 1% similar, 94% worse
» The best had a delta of 4%, average was 23%, worst was 134%
Frequency Comparison (Checkbox selectable!)
Graph 1: Pink Noise 100% Vol.; Graph 2: Audio off
Energy Management
Power Consumption
Our more powerful 7700HQ/UHD XPS SKU consumes measurably more energy than our previous 7300HQ/FHD SKU both when idling on desktop and when under 3DMark loads. Maximum load with both Prime95 and FurMark will demand 122 W against a power adapter (~14 x 6.4 x 2.25 cm) rated for 130 W, which is a bit too close to the safety ceiling than we would like. Gaming systems like the Asus FX502VM with the same CPU but faster GPU will still consume more power than our XPS unit by about 10 W to 30 W depending on the gaming load.
| Off / Standby | |
| Idle | |
| Load |
|
Key:
min: | |
| Dell XPS 15 9560 (i7-7700HQ, UHD) i7-7700HQ, GeForce GTX 1050 Mobile, Lite-On CX2-8B512-Q11, IGZO IPS, 3840x2160, 15.6" | Asus FX502VM-AS73 i7-7700HQ, GeForce GTX 1060 Mobile, SK Hynix HFS256G39TND-N210A, TN LED, 1920x1080, 15.6" | Apple MacBook Pro 15 2016 (2.9 GHz, 460) 6920HQ, Radeon Pro 460, Apple SSD SM1024L, IPS, 2880x1800, 15.4" | HP Spectre x360 15-bl002xx i7-7500U, GeForce 940MX, Toshiba XG4 NVMe (THNSN5512GPUK), IPS, 3840x2160, 15.6" | Dell XPS 15 2017 9560 (7300HQ, Full-HD) i5-7300HQ, GeForce GTX 1050 Mobile, WDC WD10SPCX-75KHST0 + SanDisk Z400s M.2 2242 32 GB Cache, LED IGZO IPS InfinityEdge, 1920x1080, 15.6" | |
|---|---|---|---|---|---|
| Power Consumption | -7% | 39% | 38% | 28% | |
| Idle Minimum * (Watt) | 11.9 | 14.9 -25% | 3 75% | 8.14 32% | 6.6 45% |
| Idle Average * (Watt) | 17.1 | 15.1 12% | 9.9 42% | 10.91 36% | 9 47% |
| Idle Maximum * (Watt) | 17.3 | 15.2 12% | 12.5 28% | 12.26 29% | 10.7 38% |
| Load Average * (Watt) | 94.7 | 105.8 -12% | 70.6 25% | 45.67 52% | 77.5 18% |
| Witcher 3 ultra * (Watt) | 104.8 | ||||
| Load Maximum * (Watt) | 122 | 148.8 -22% | 90.8 26% | 74.94 39% | 130 -7% |
* ... smaller is better
Battery Life
Similar to the 15-inch Asus UX501 series and older XPS 15 models, the XPS 15 9560 ships with either two internal storage bays and a 56 Wh battery or just one internal storage bay in favor of a larger 97 Wh battery. Our US test model is the latter and runtimes are indeed significantly longer than our first test unit despite the fact that this configuration includes a higher resolution display and faster CPU. Users can expect about 7 hours of real-world WLAN use compared to 5 hours on the SKU with the smaller battery pack. The latest HP Spectre x360 15 with its more power-efficient ULV Kaby Lake and older GeForce Maxwell GPU can outlast the Dell for even longer runtimes.
Charging with the included adapter is quite slow at about 3 hours from near empty to full capacity. Most notebooks take 2 to 2.5 hours, although most competing models tend to carry smaller batteries compared to our XPS configuration. While the battery pack itself is rated for 97 Wh, BatteryEater is reporting a slightly lower charge capacity of 93 Wh.
| Dell XPS 15 9560 (i7-7700HQ, UHD) i7-7700HQ, GeForce GTX 1050 Mobile, 97 Wh | Asus FX502VM-AS73 i7-7700HQ, GeForce GTX 1060 Mobile, 64 Wh | Apple MacBook Pro 15 2016 (2.9 GHz, 460) 6920HQ, Radeon Pro 460, 76 Wh | HP Spectre x360 15-bl002xx i7-7500U, GeForce 940MX, 79.2 Wh | Dell XPS 15 2017 9560 (7300HQ, Full-HD) i5-7300HQ, GeForce GTX 1050 Mobile, 56 Wh | |
|---|---|---|---|---|---|
| Battery runtime | -42% | -2% | 25% | -24% | |
| Reader / Idle (h) | 13.9 | 6.1 -56% | 14.4 4% | 9.4 -32% | |
| WiFi v1.3 (h) | 7.2 | 4.6 -36% | 10.3 43% | 8.9 24% | 5.6 -22% |
| Load (h) | 1.7 | 1.1 -35% | 0.9 -47% | 2.5 47% | 1.4 -18% |
Pros
Cons
Verdict
In our review of the Kaby Lake XPS 9360, we mentioned that the performance and battery life advantages over the Skylake XPS 9350 are so minuscule that users may want to consider saving a few hundred Dollars by purchasing the older model instead. The same applies here to the XPS 9560 as the i7-7700HQ offers very few tangible benefits over the i7-6700HQ in the XPS 9550 when compared to the price differences between them.
One major curveball to consider is the GTX 1050 GPU in this latest iteration of the XPS 15. Graphics performance is a significant boost over the GTX 960M in the XPS 15 9550 and it may even be considered overkill for users who simply want to use the notebook for word processing and media streaming. For these users who are drawn more by the quality and design of the notebook rather than its performance, the entry-level $999 USD SKU without the dGPU is actually very appealing. Casual gamers looking for a versatile Windows machine for both office and gaming will find the XPS 9560 to be much more capable than what the XPS 15 9550, Radeon-equipped MacBook Pro 15, or other competitors have to offer in this particular category at the moment. The major drawback in this case will be fan noise as the more powerful Dell system will run very loudly under heavy loads. Cheaper alternatives exist such as the Pavilion 15 UHD with GTX 1050, but build quality are worlds apart.
The defining characteristic of the XPS 15 9560 compared to the XPS 15 9550 is the massive jump in GPU power. If the extra graphics performance isn't needed, then the entry-level 9560 SKU or even an older 9550 will be easier on the wallet.
Dell XPS 15 9560 (i7-7700HQ, UHD)
- 03/15/2017 v6 (old)
Allen Ngo
Price comparison
