Dell Precision 3510 Workstation Review
For the original German review, see here.
Dell is one of the first manufacturers that come to mind when you want to buy a new mobile workstation. As with other manufacturers, this is obviously not a small investment. Mobile workstations are powerful business devices with a special focus on support, warranty and maintainability as well as a comprehensive port selection. You can also customize the devices very comprehensively to adjust perfectly to your own requirements.
The Dell Precision 3510 is one of the cheapest ways to get such a modern mobile workstation. Our review unit is equipped with an Intel Core i7-6700HQ quad-core CPU, 16 GB of DDR4-RAM, AMD's FirePro W5130M GPU, a 256 GB NVMe-SSD and a matte TN-HD display. The price as of this writing is around 1900 Euros (~$2086; excl. VAT) in Dell's online shop, but there are already configurations for around 1400 Euros (~$1537). Street prices at retailers start at around 1300 Euros (~$1427).
Case
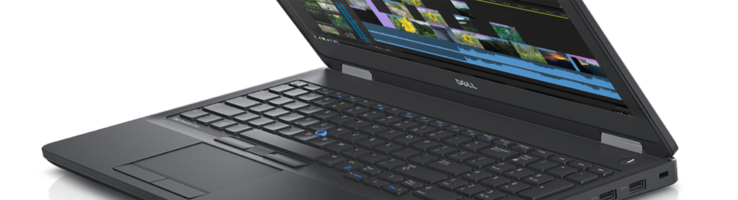
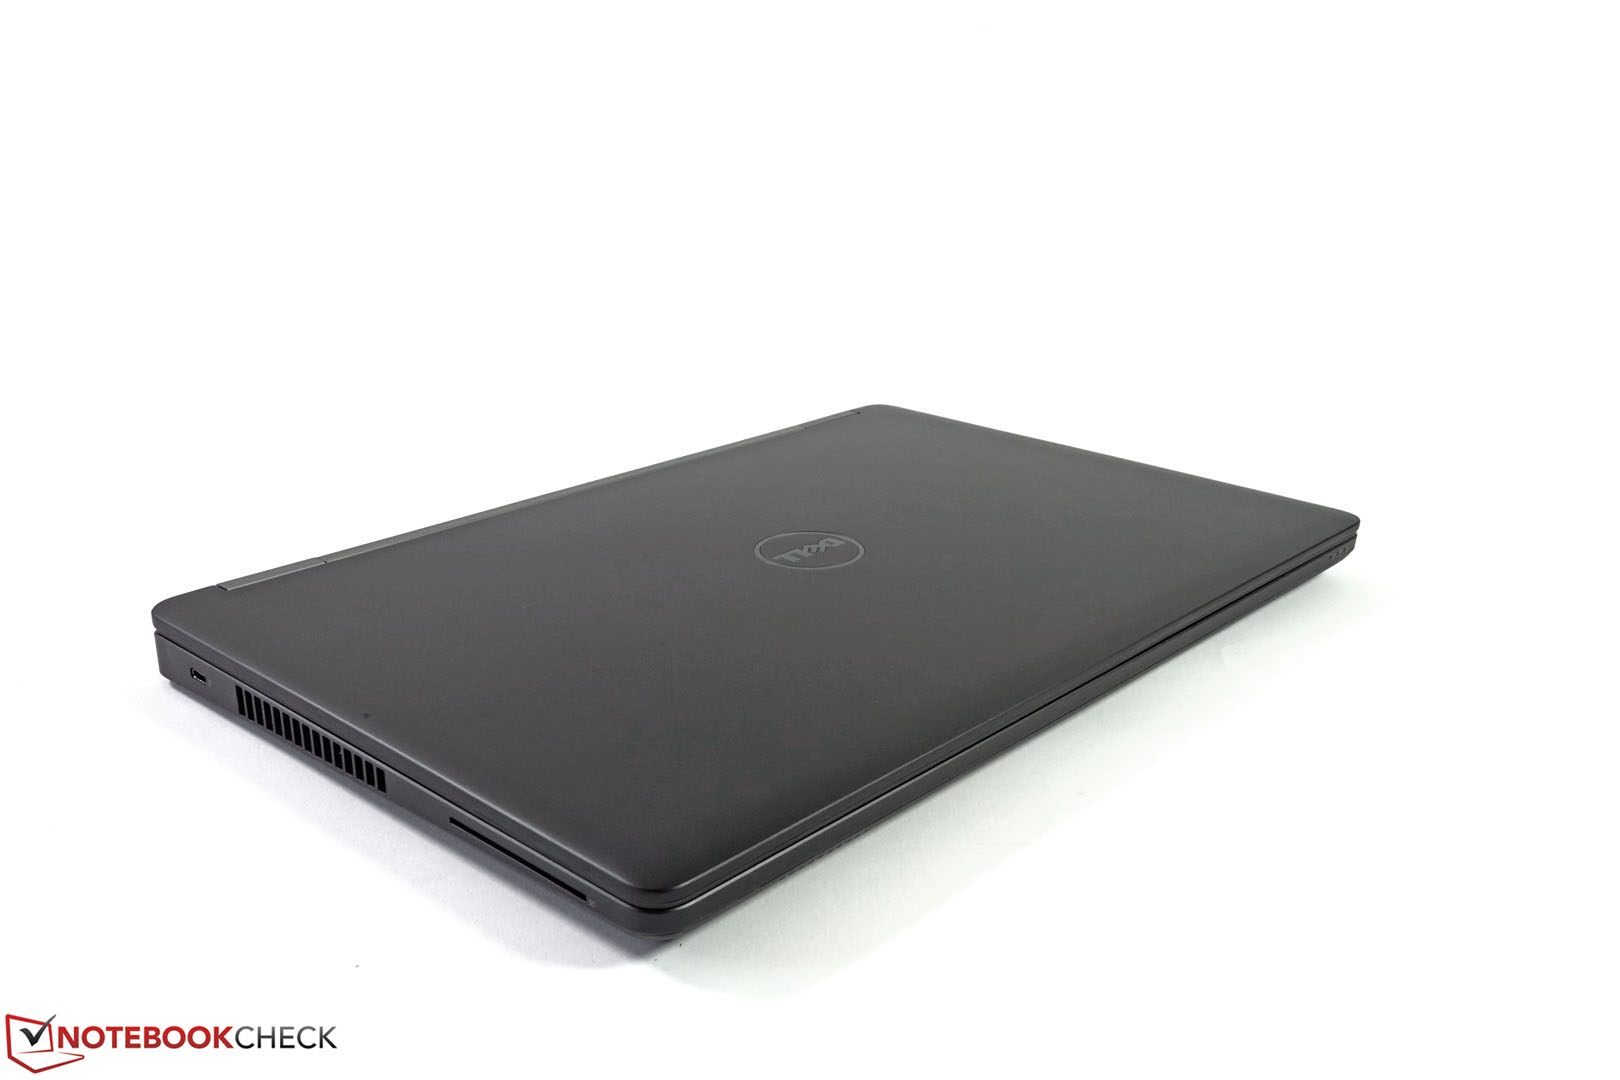
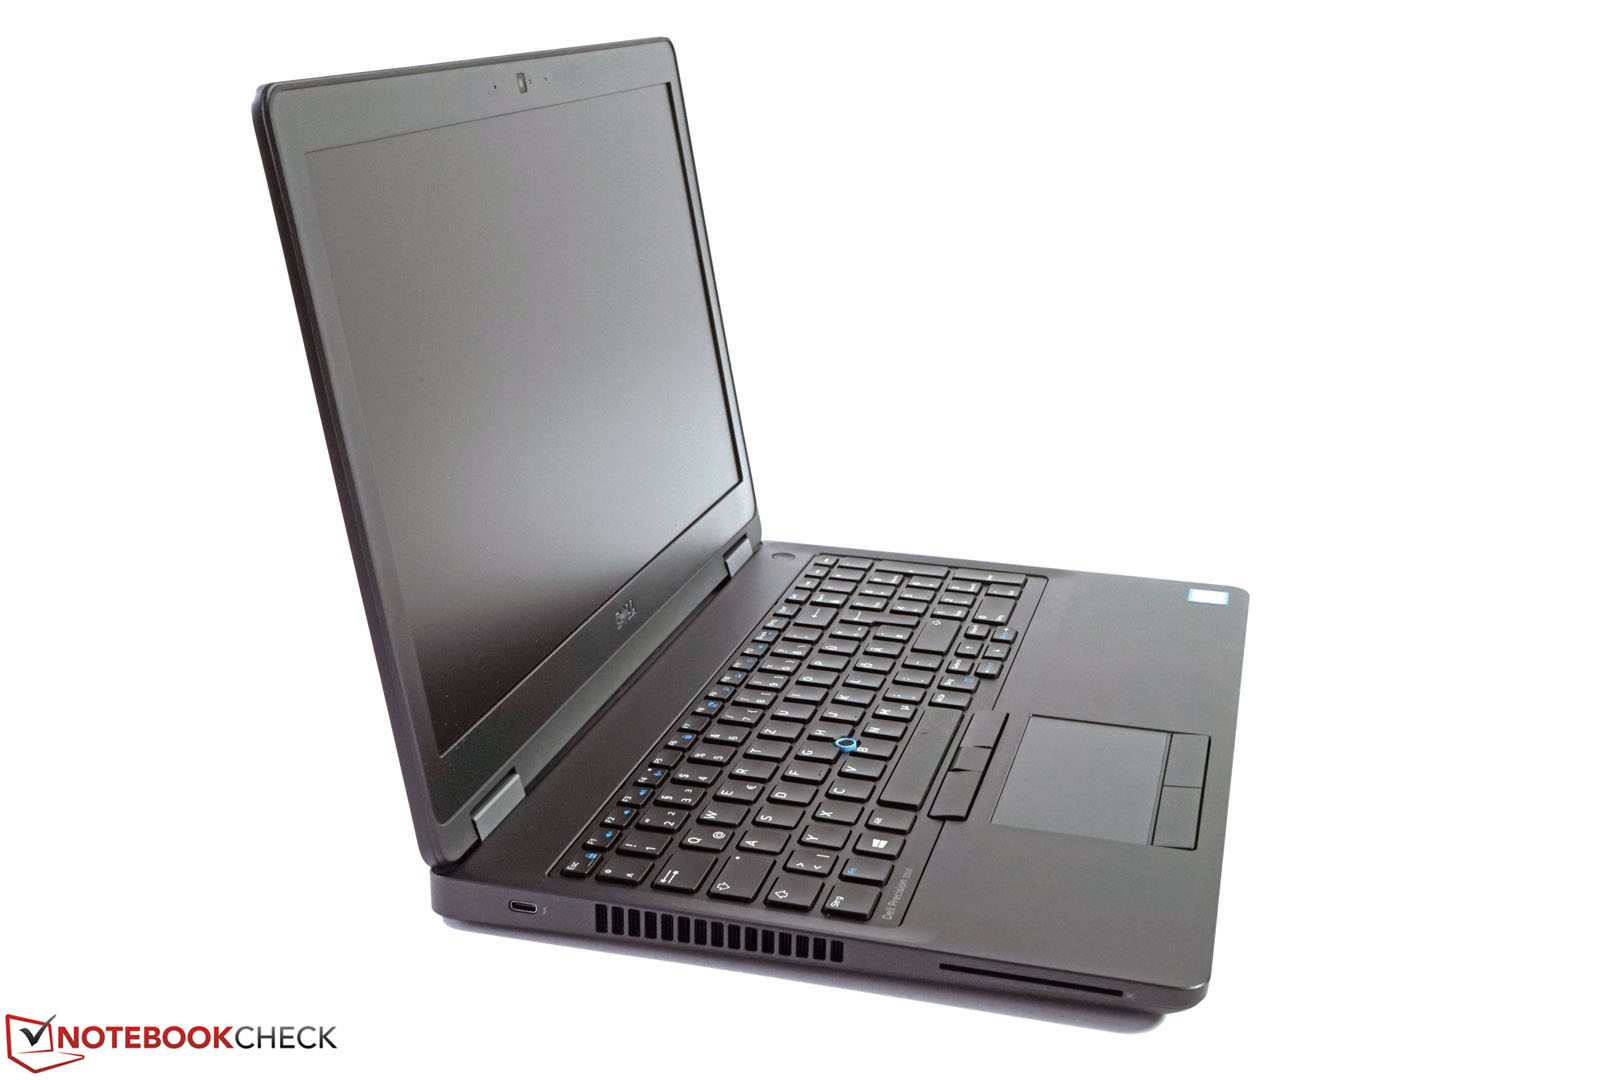
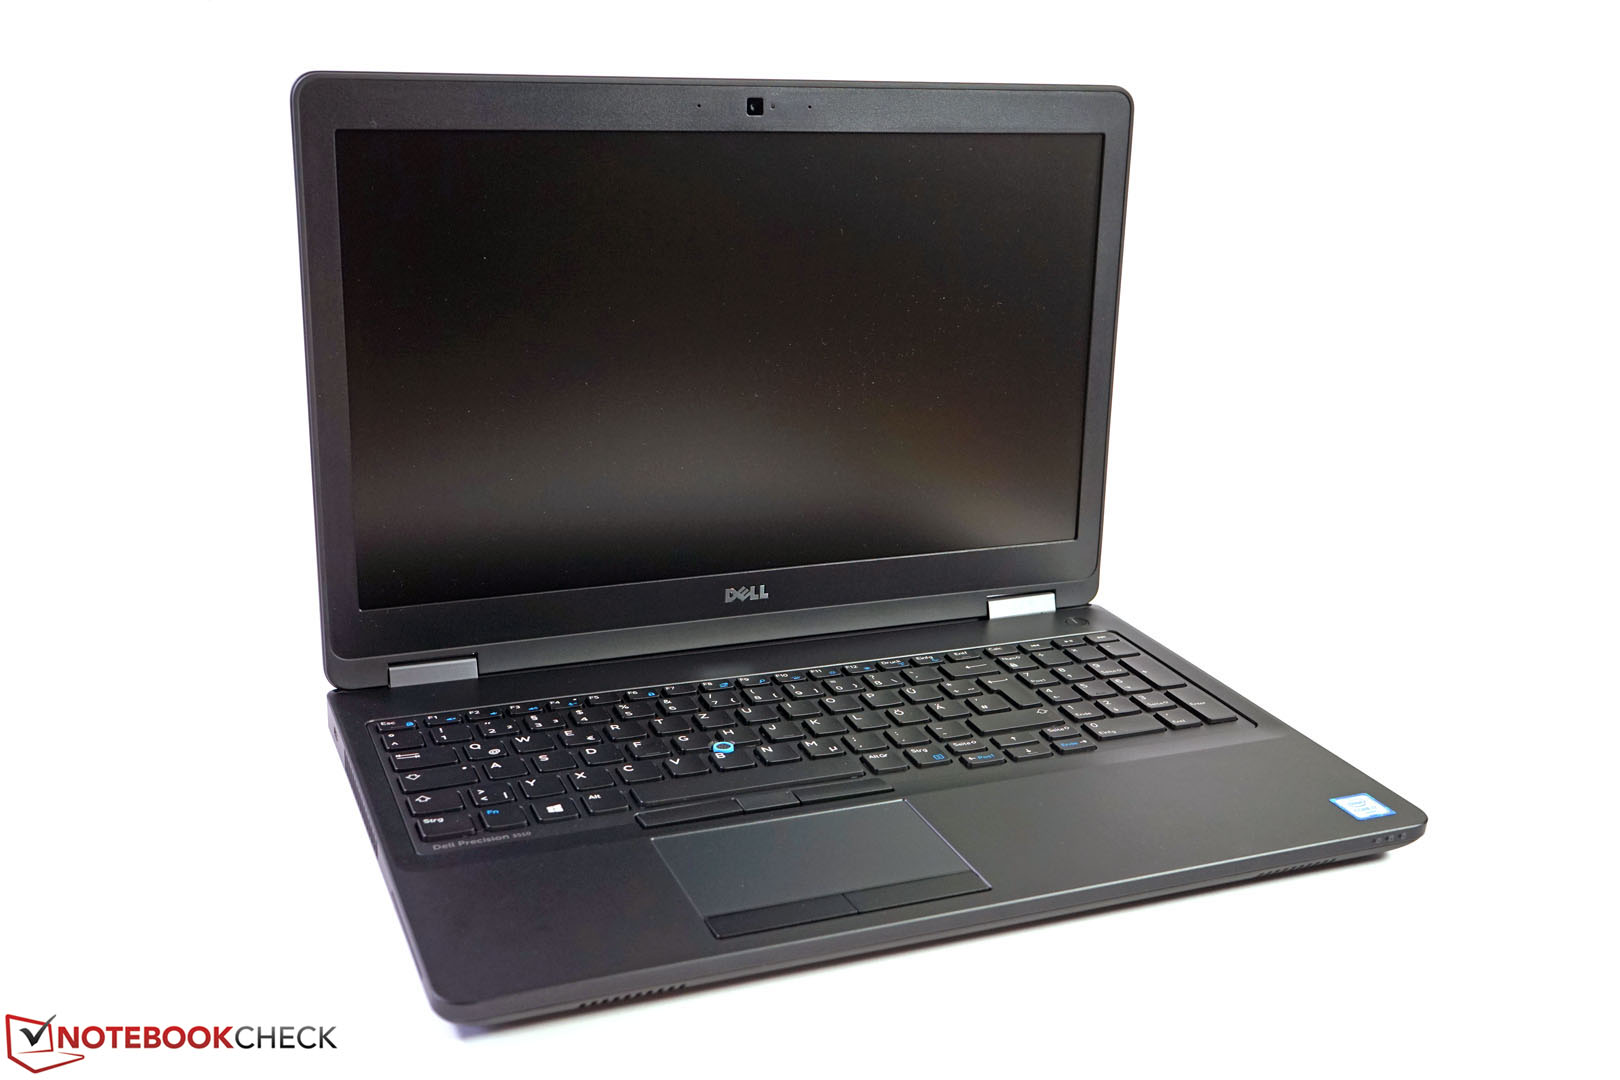
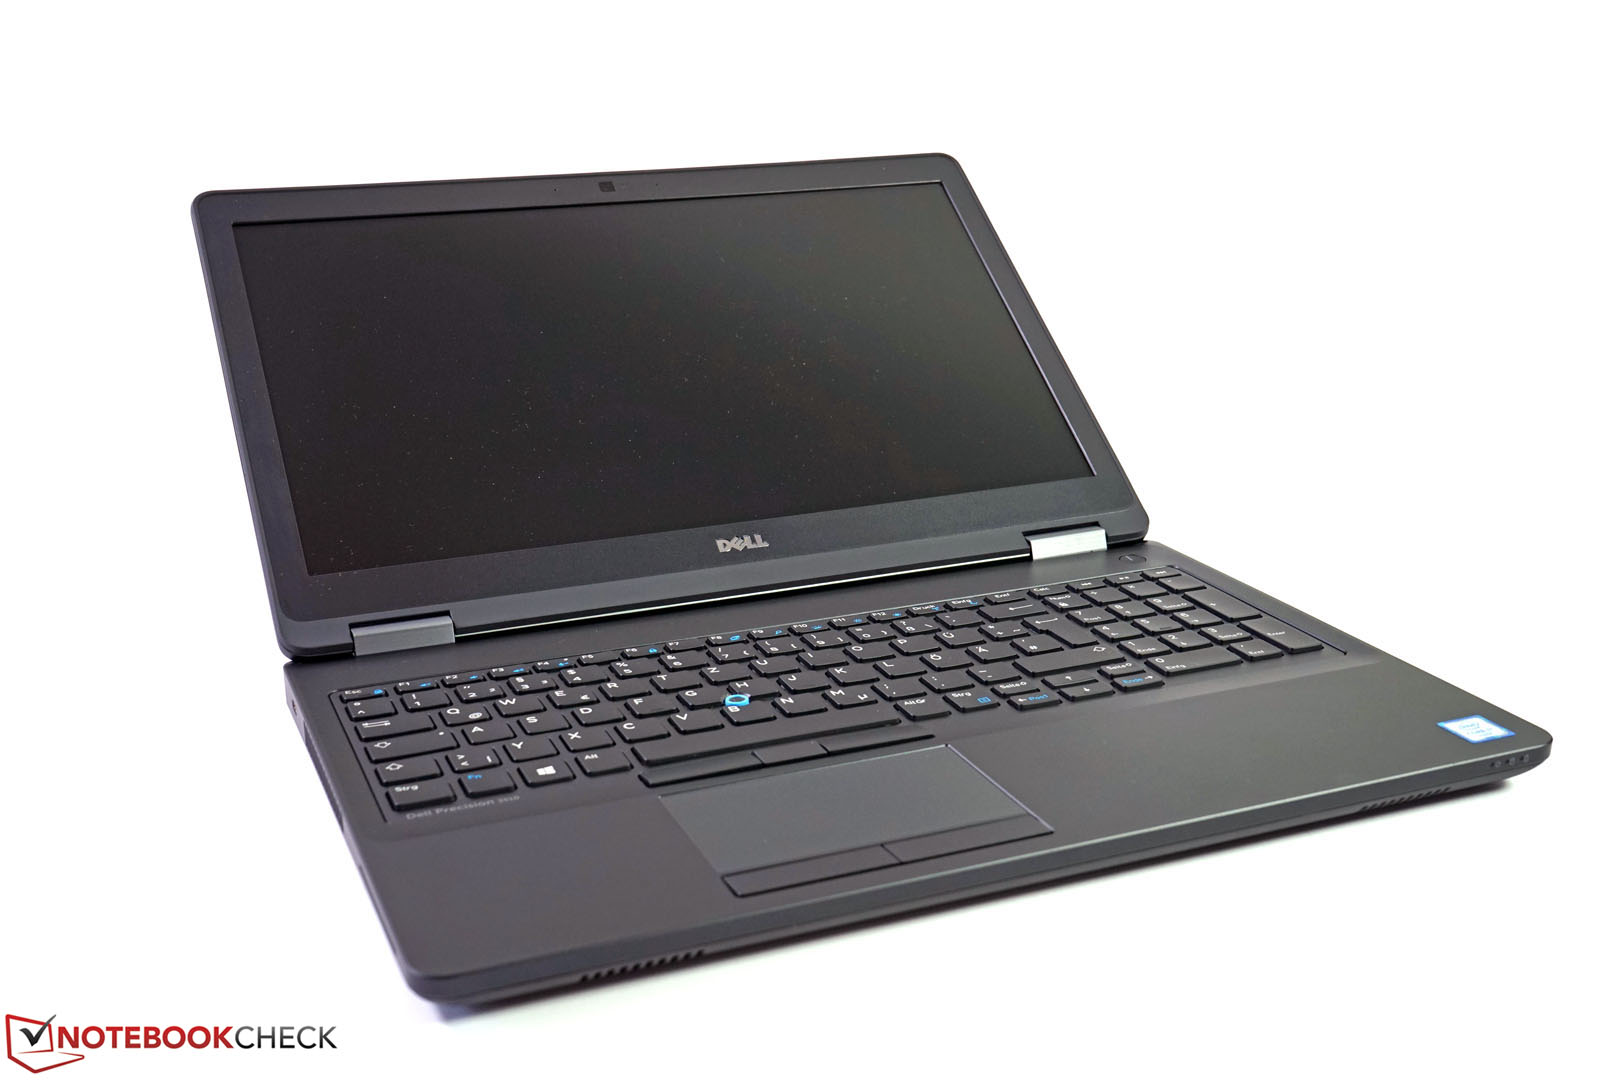
The case of the Dell Precision 3510 Workstation is similar to that of the current Latitude 5000-series and therefore offers excellent business features. Black and gray colors create the restrained design many business customers want, so you can fully concentrate on the next project.
The base unit is quite torsion resistant, the palm rest is firm, and the display hinges keep the screen firmly in position. The stability of the lid is above average, because you can just slightly twist it with moderate pressure. At 2420 grams (~5.3 lb), the weight is pretty moderate and thanks to the long battery runtimes, you do not have to carry the power adapter (610 grams/~11 oz) around all the time.
Connectivity
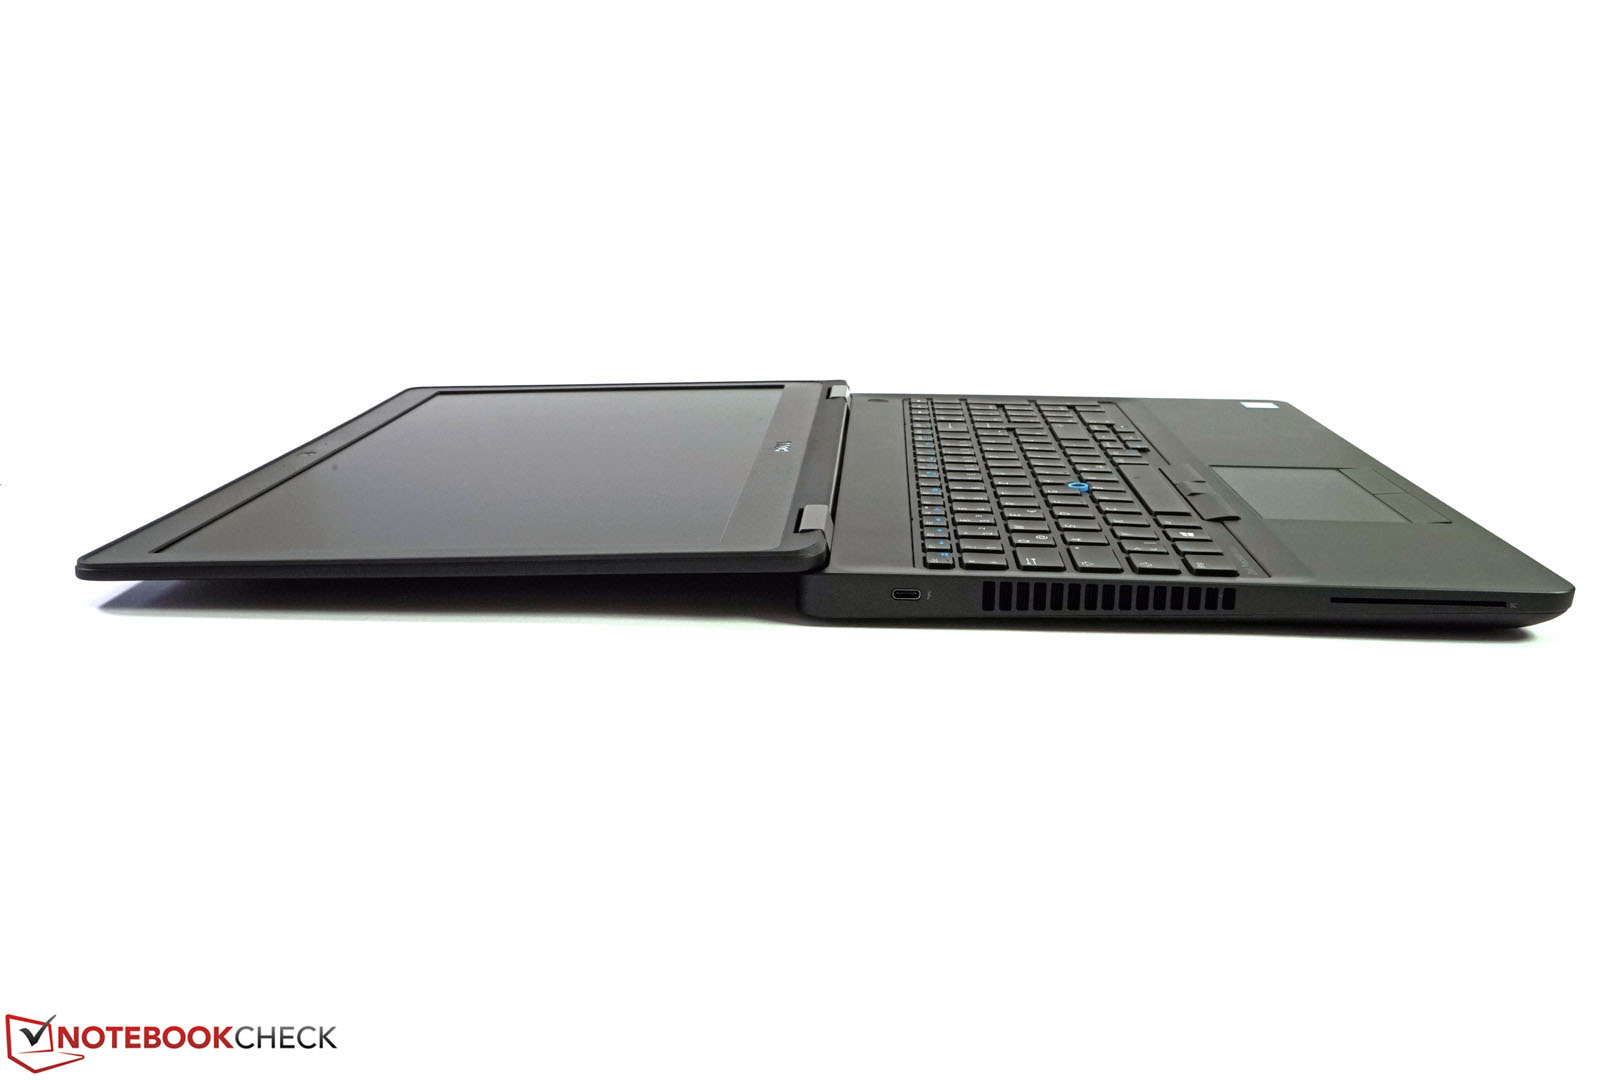
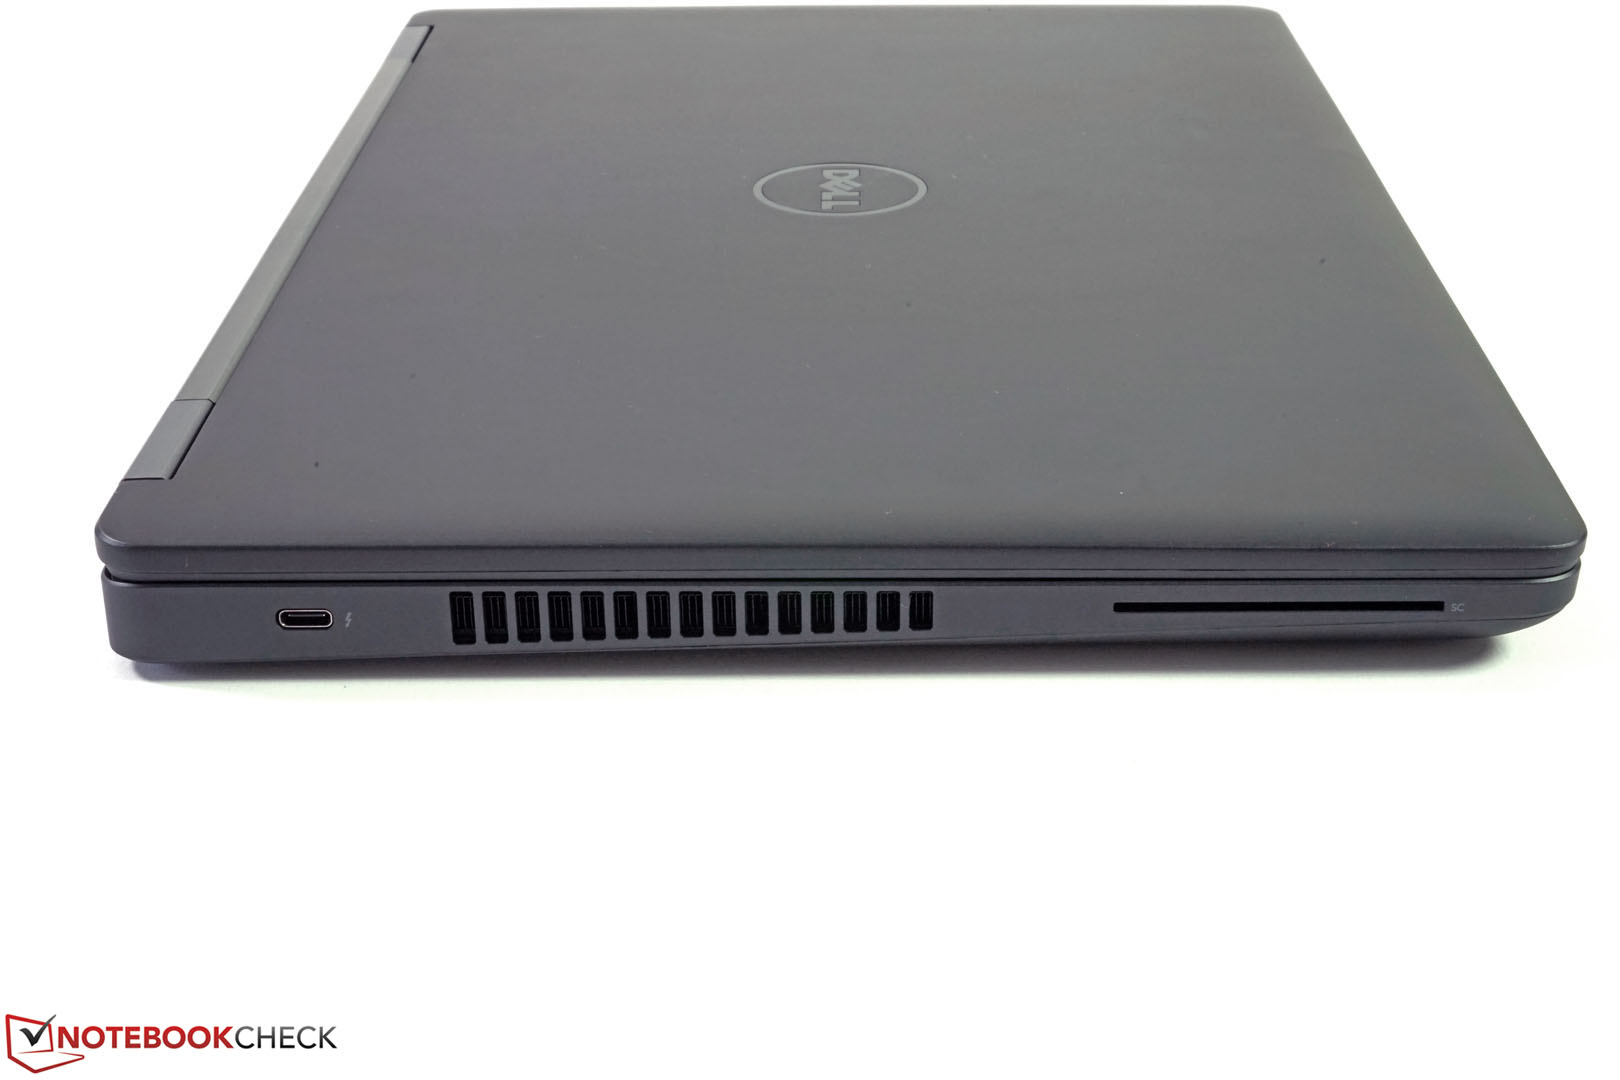
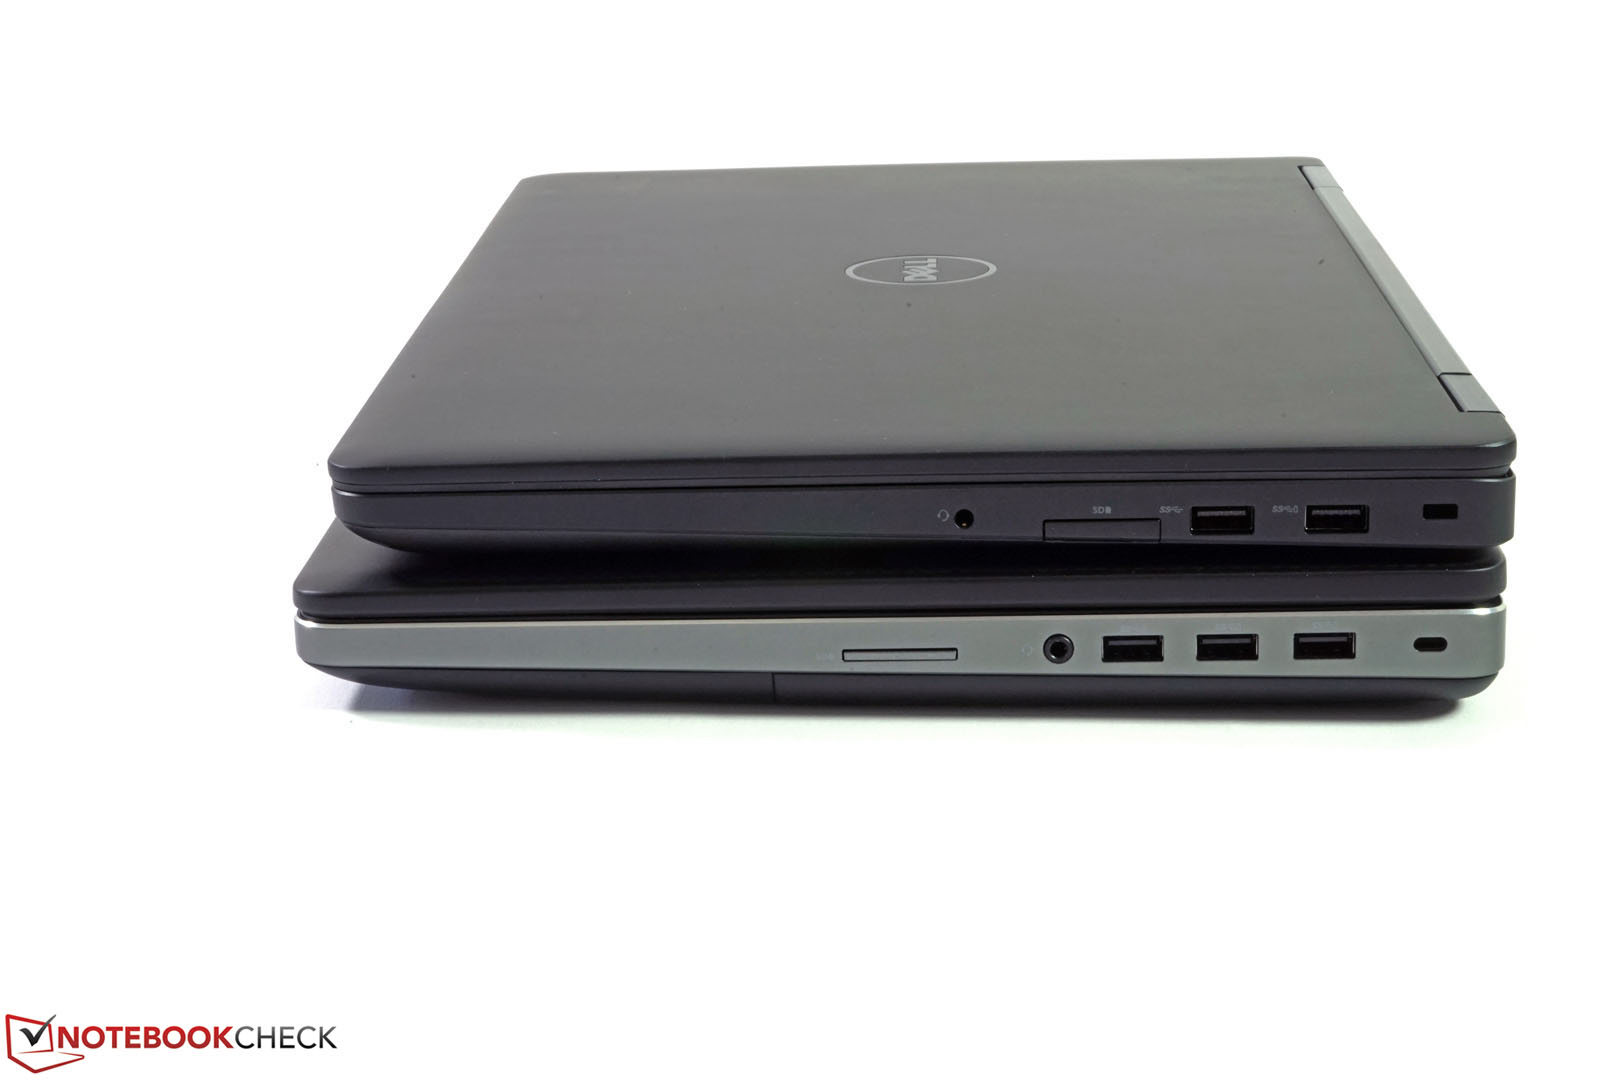
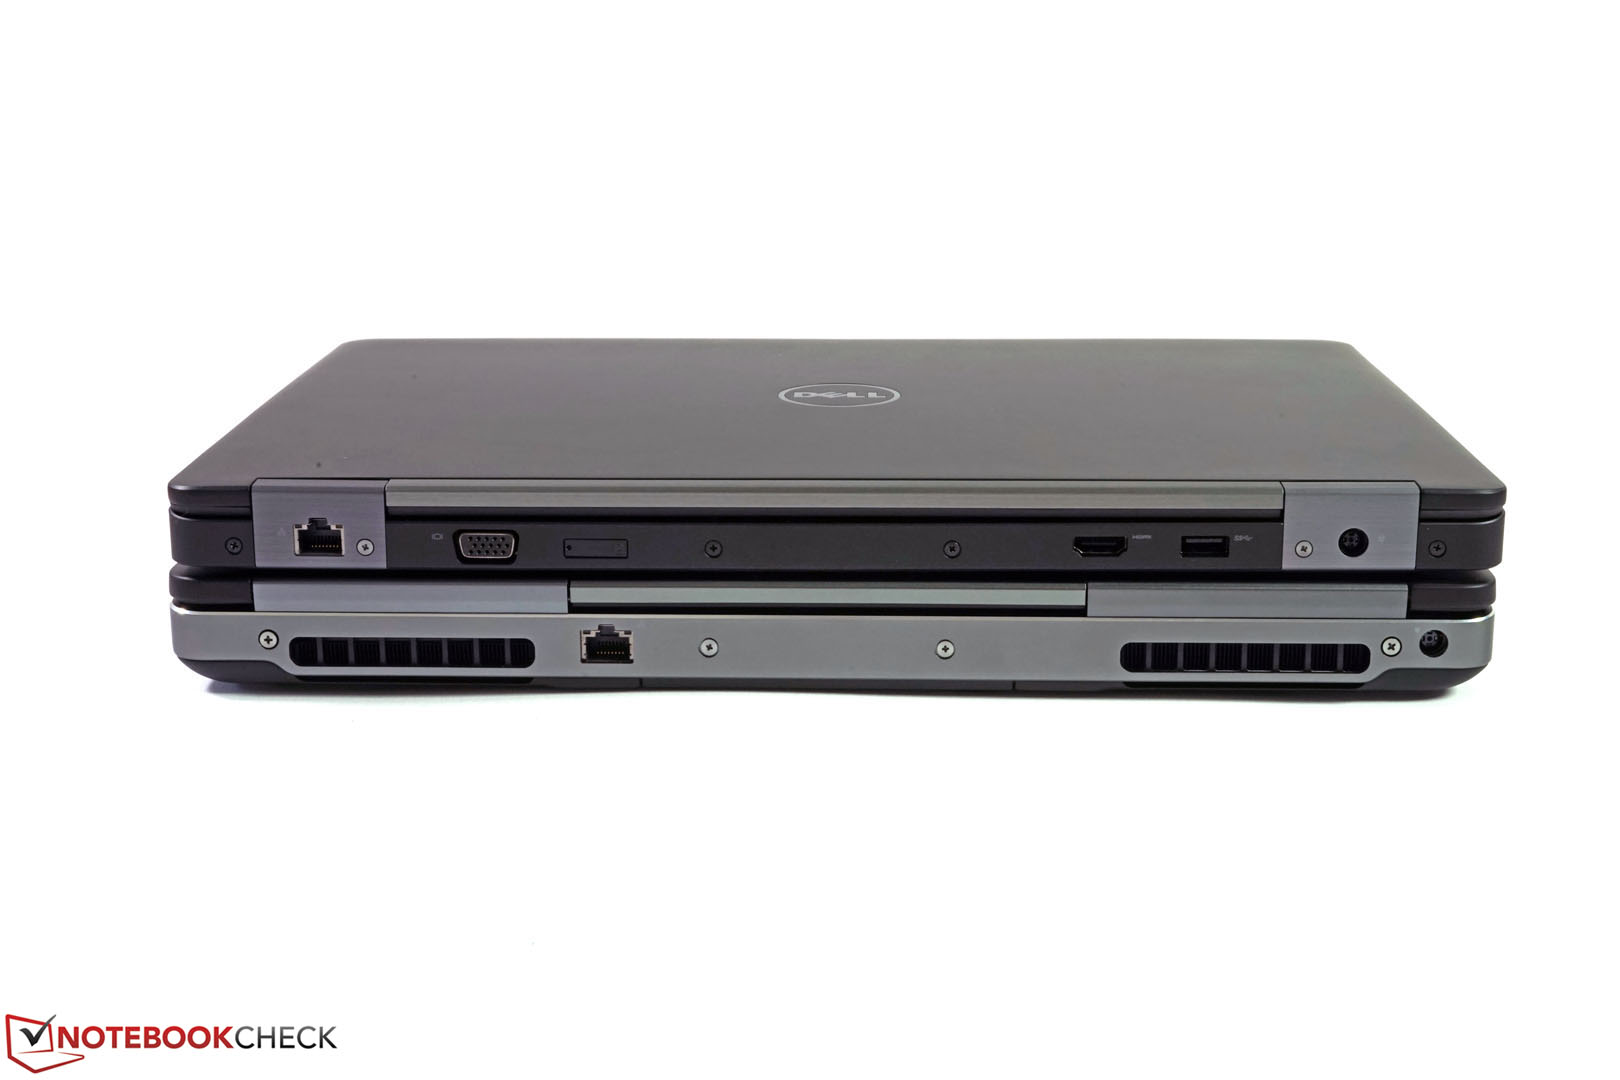
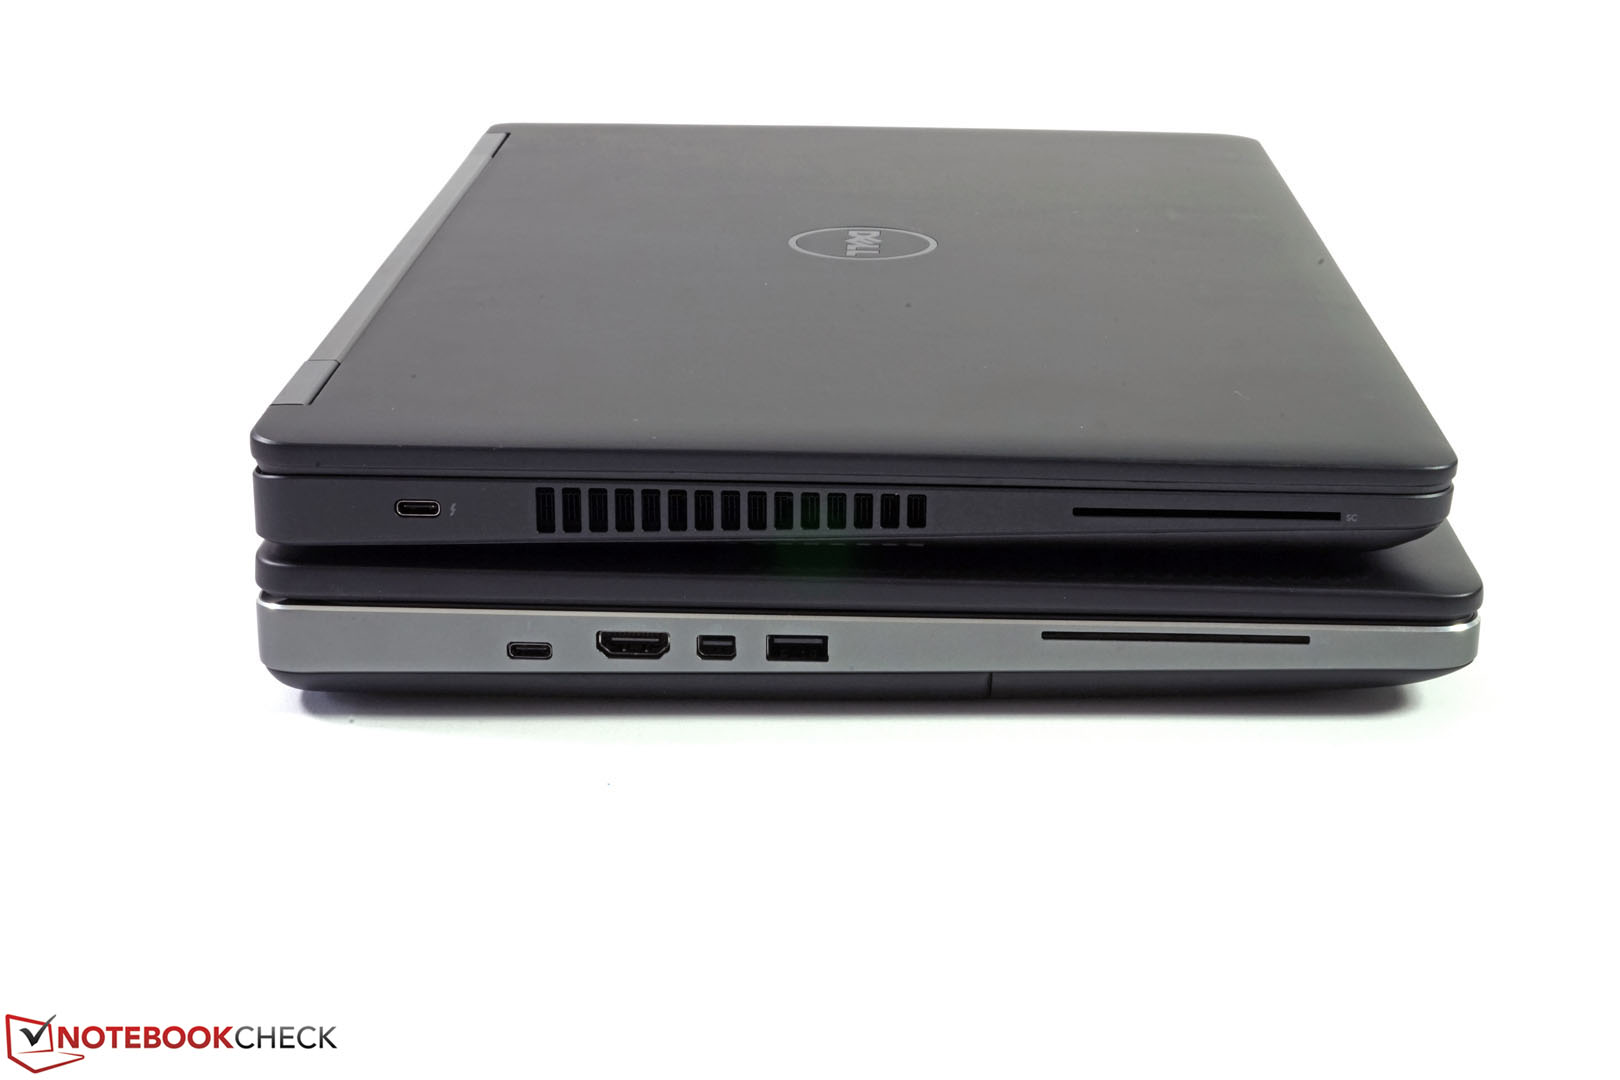
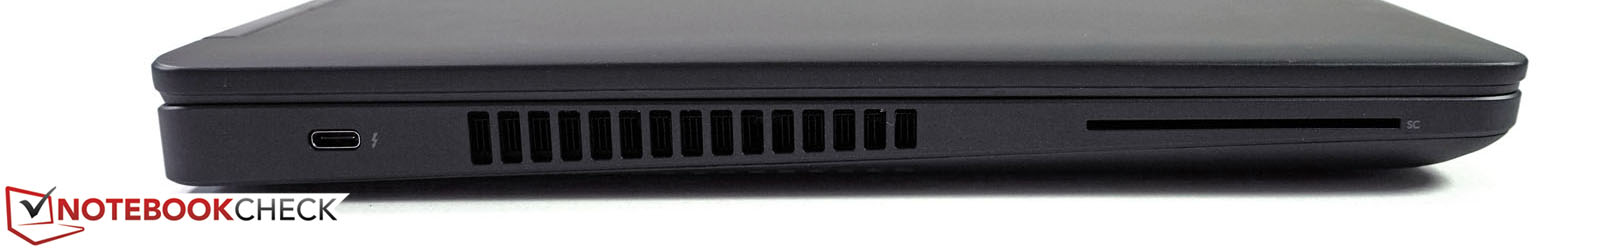
One highlight in this price range is certainly the full-fledged Thunderbolt 3 port. However, currently it is not available in combination with i5 processors which is an unnecessary limitation for some users. You can attach fast Thunderbolt 3 drives with up to 40 GB/s at this port, as well as USB 3.1 drives with up to 10 GB/s. External 4K monitors can be driven at 60 Hz in their native resolution.
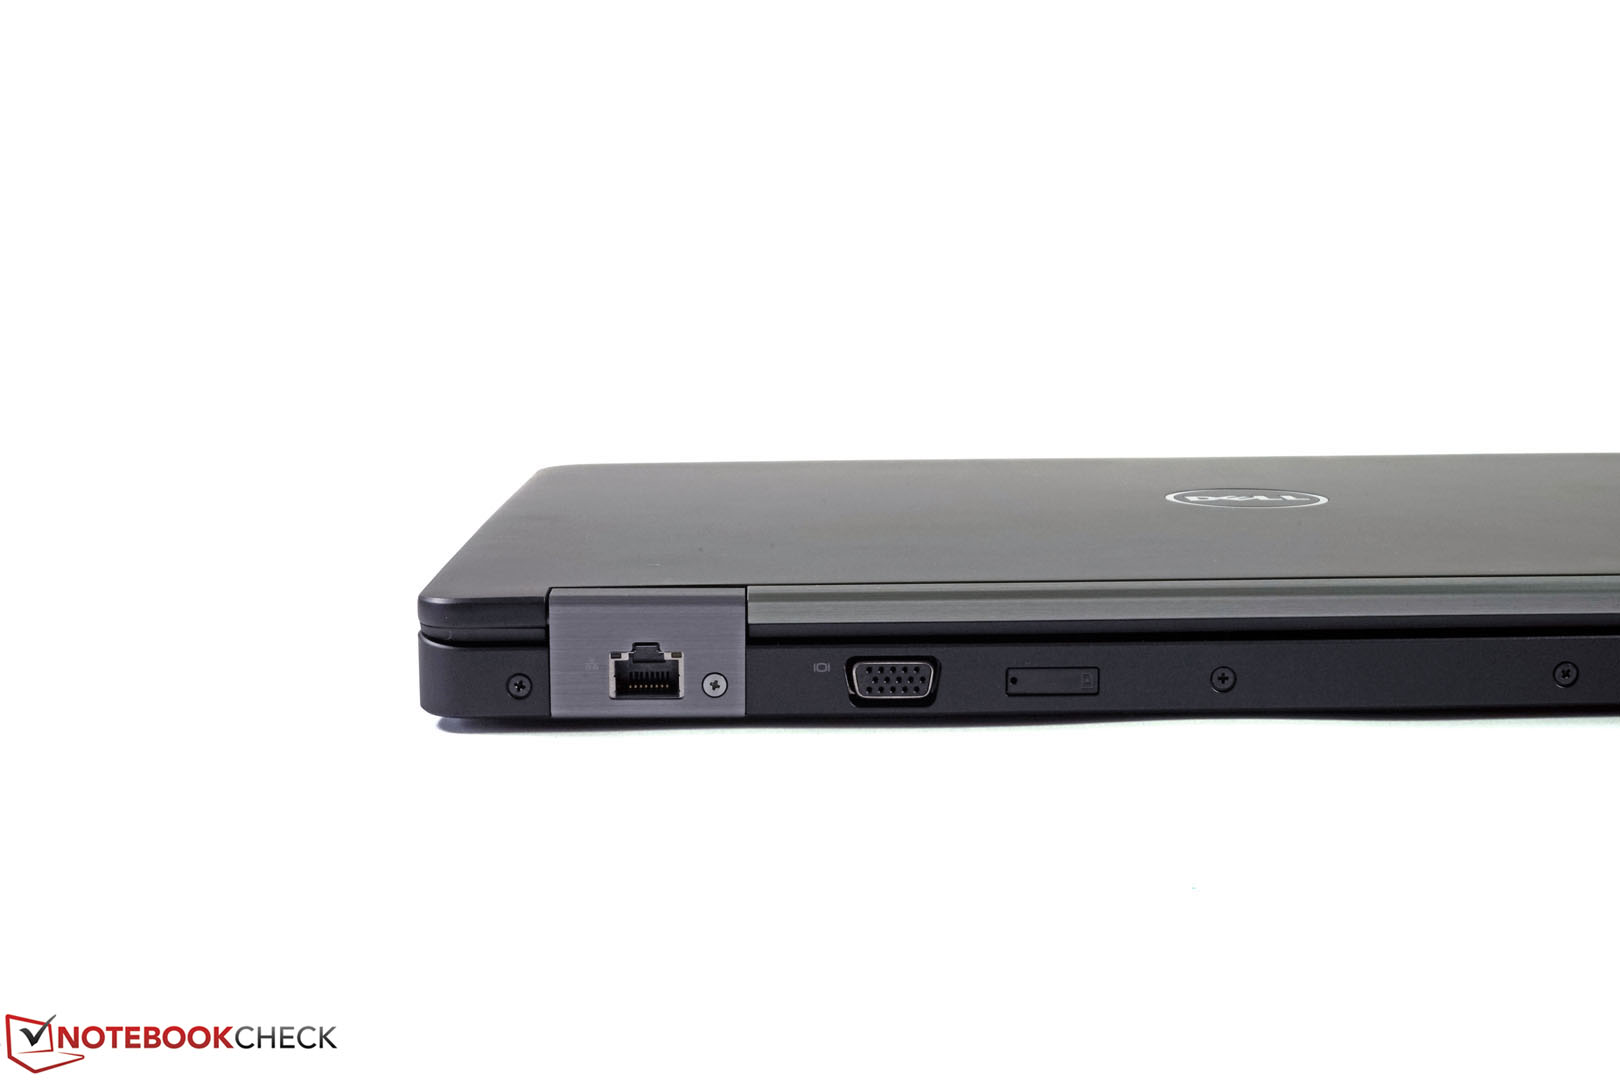
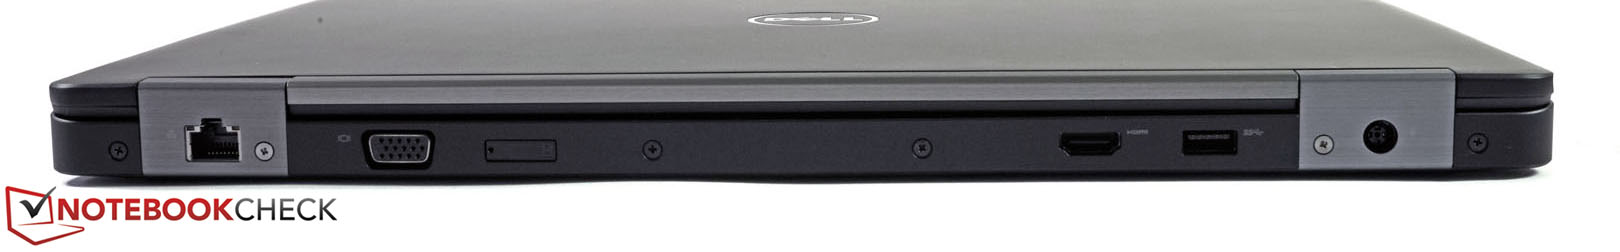
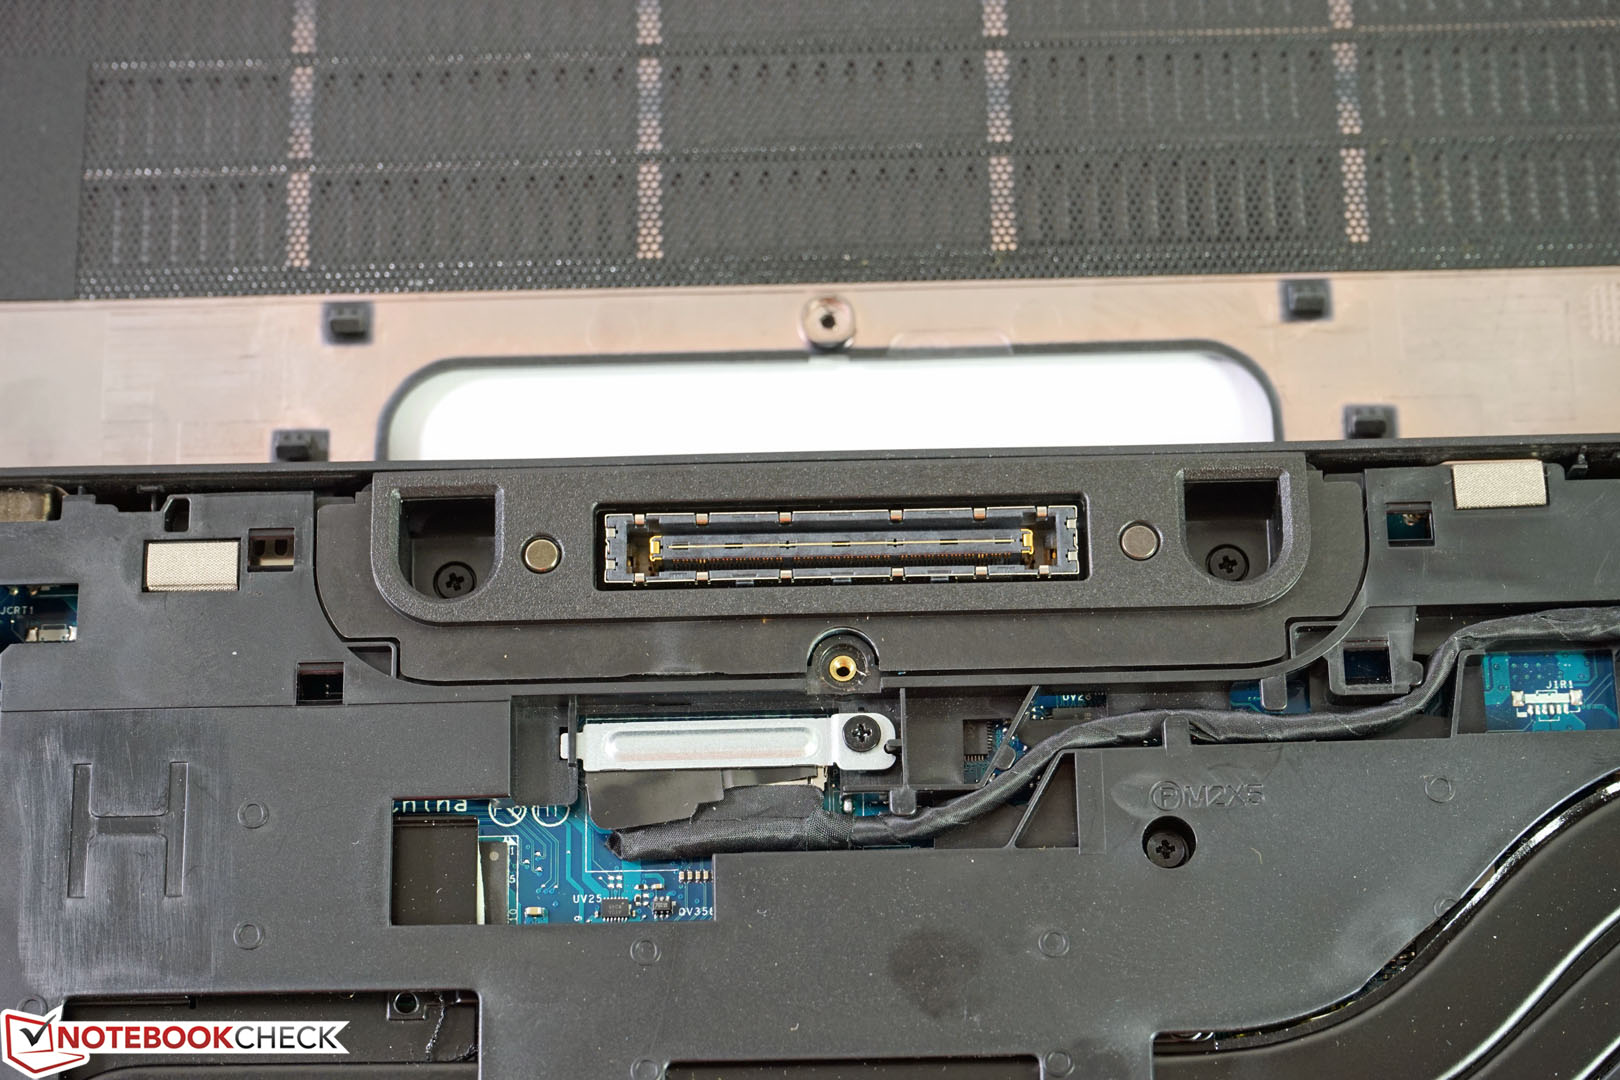
Dell's new Thunderbolt docks obviously work with the device as well, and these docks will probably replace the traditional proprietary docking stations (which can still be attached at the bottom) in the future. Otherwise, you still get a VGA port and HDMI, which is very popular for consumer devices.
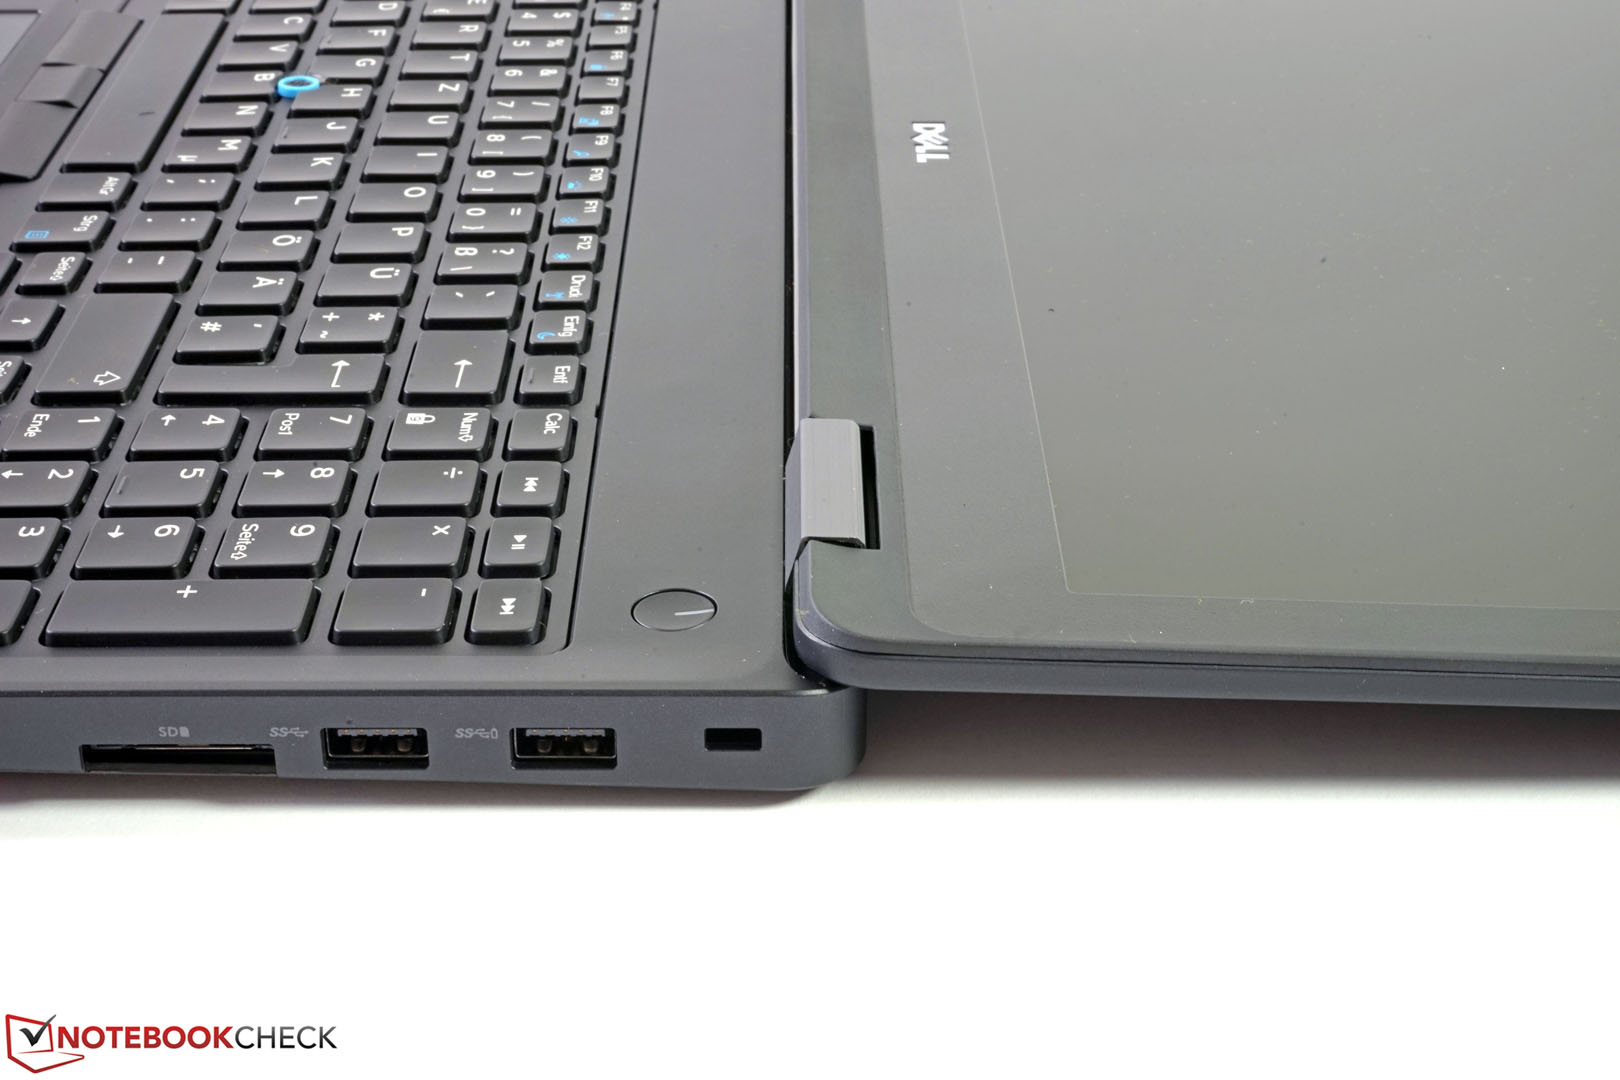
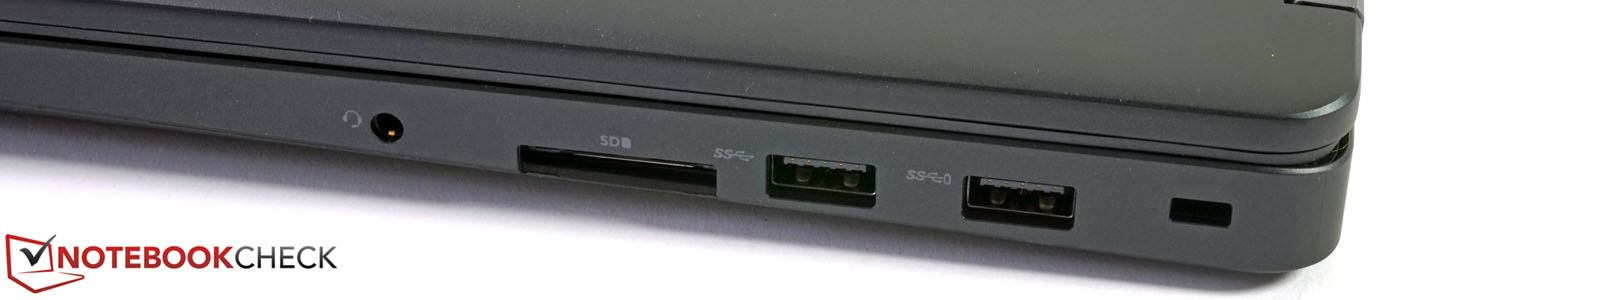
The comprehensive and well-positioned port selection is complemented by three USB 3.0 ports, one UHS-II card reader and the combined 3.5 mm stereo jack.
SD Card Reader
Realtek provides the UHS-II card reader, which is attached via the PCIe interface. We can determine very good results in combination with our memory card from Toshiba. At more than 200 MB/s read and 122 MB/s write, the theoretical performance of the Toshiba Exceria Pro UHS-II 64 GB is utilized very well.
| SD Card Reader | |
| average JPG Copy Test (av. of 3 runs) | |
| Dell Precision 3510 | |
| HP ZBook 15 G3 | |
| Lenovo ThinkPad P50 | |
| maximum AS SSD Seq Read Test (1GB) | |
| HP ZBook 15 G3 | |
| Dell Precision 3510 | |
| Lenovo ThinkPad P50 | |
Communication
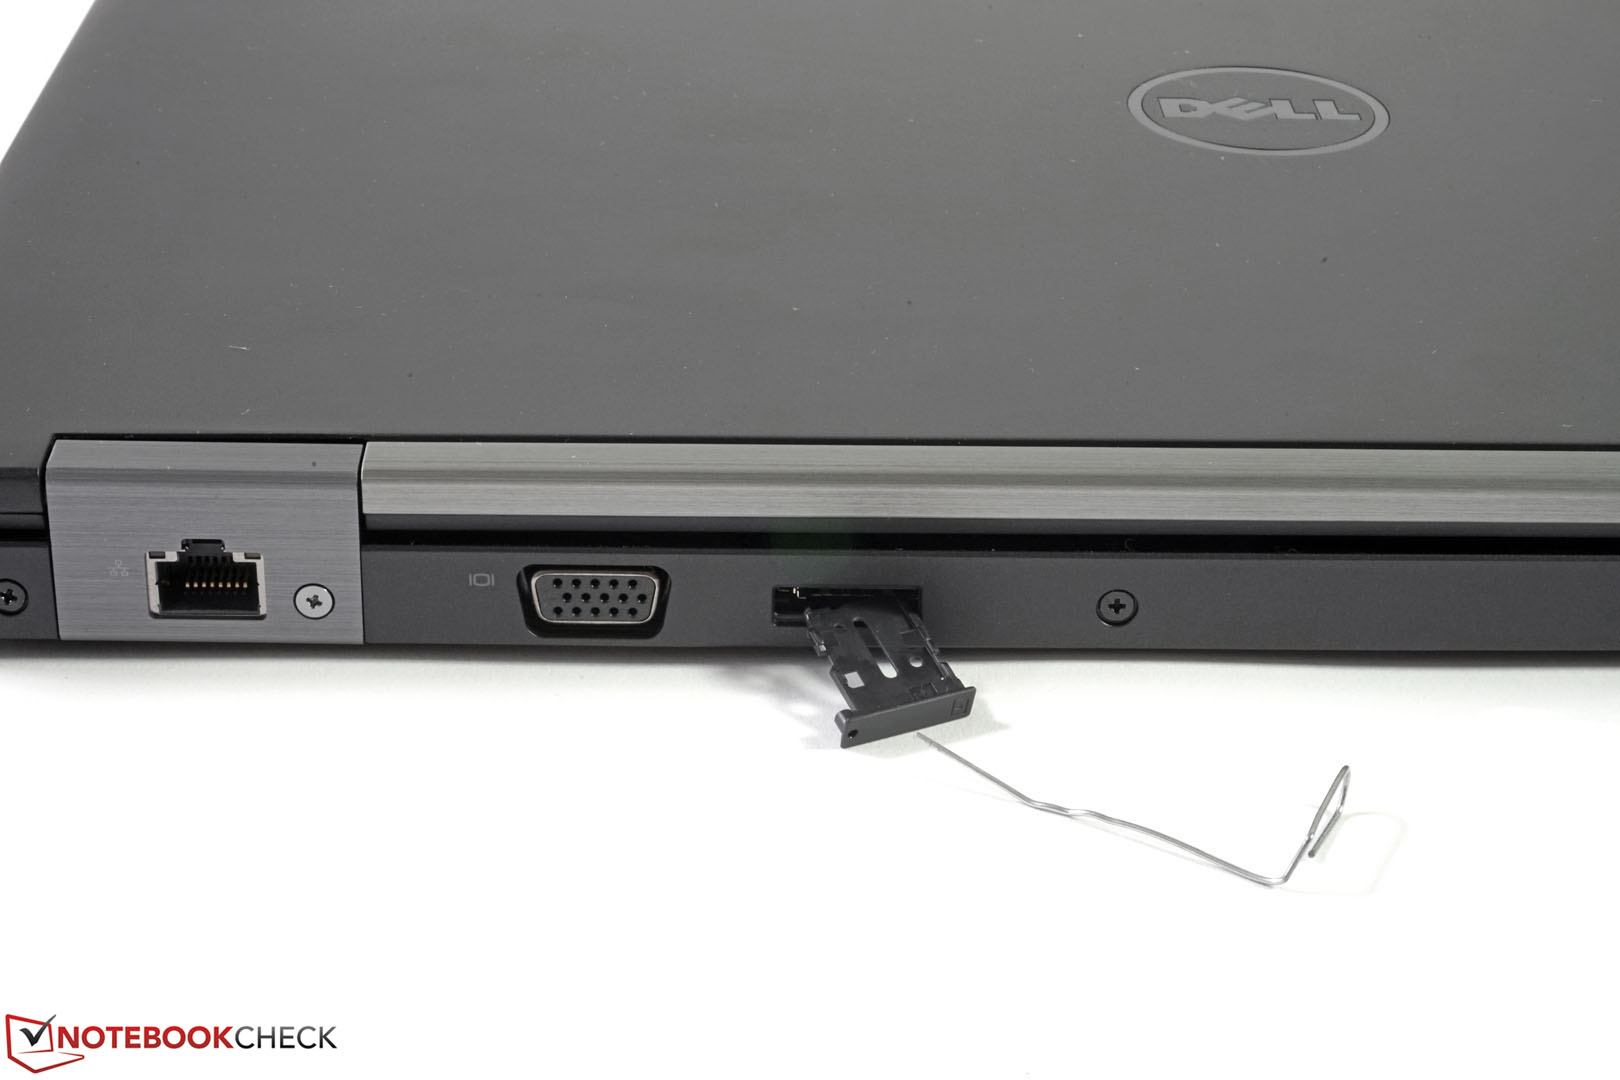
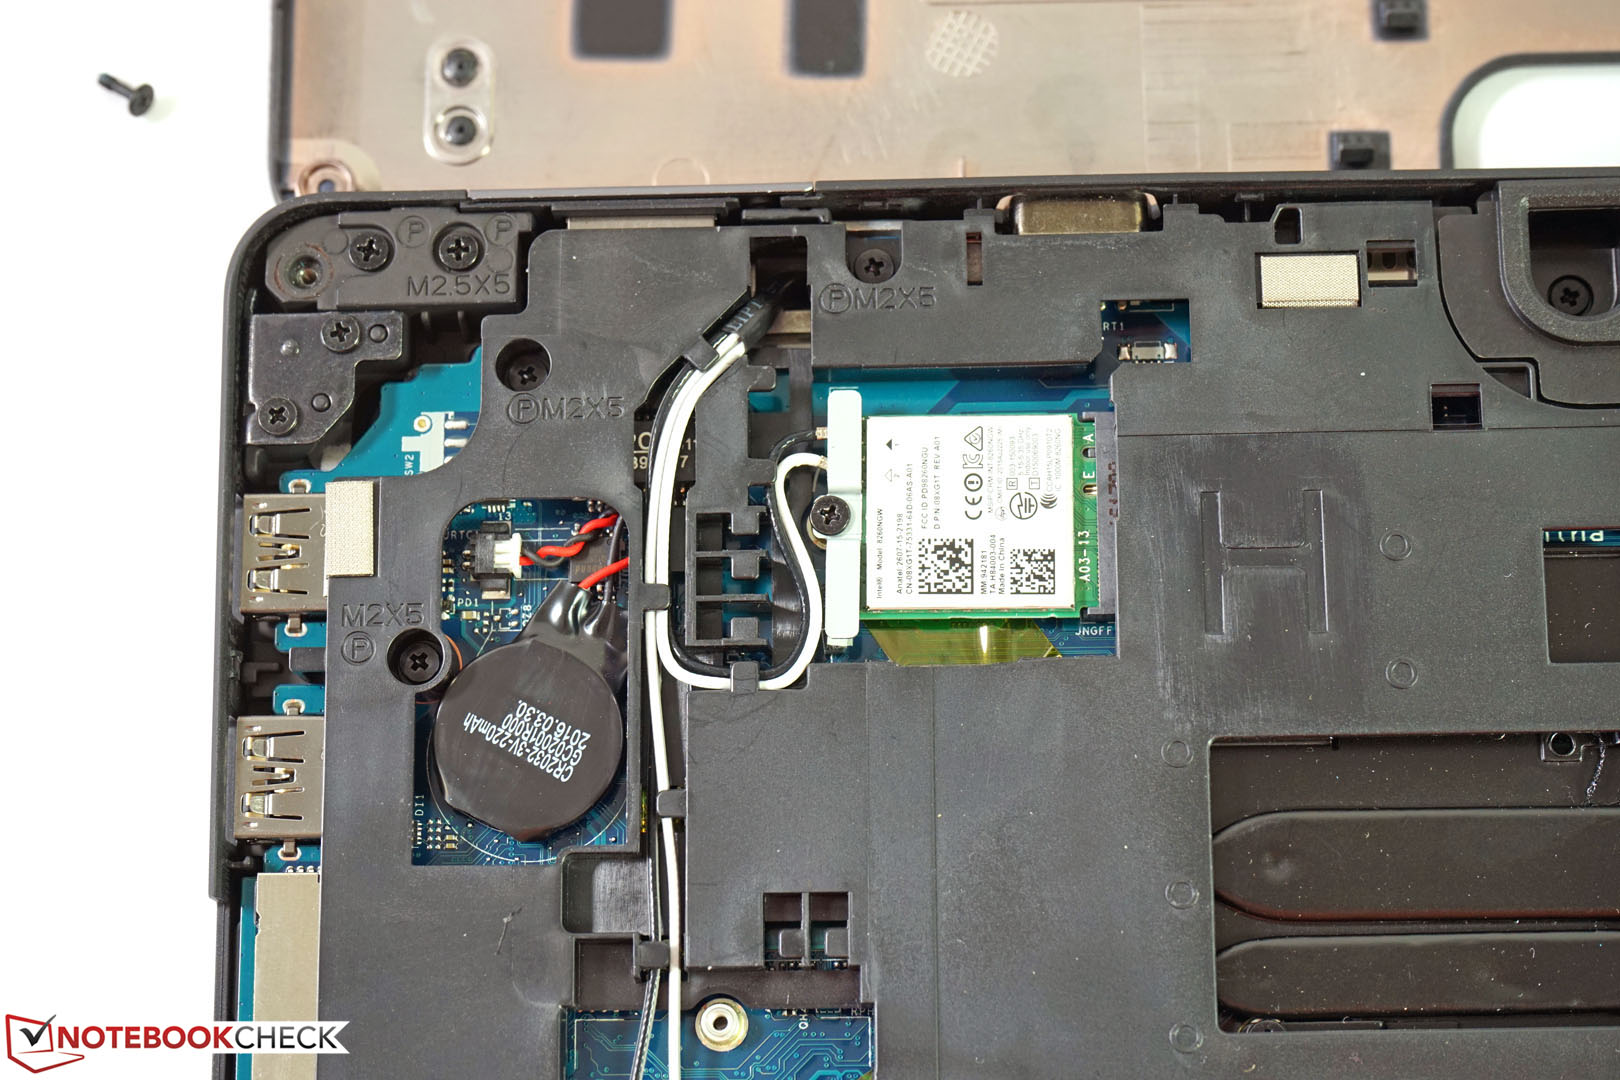
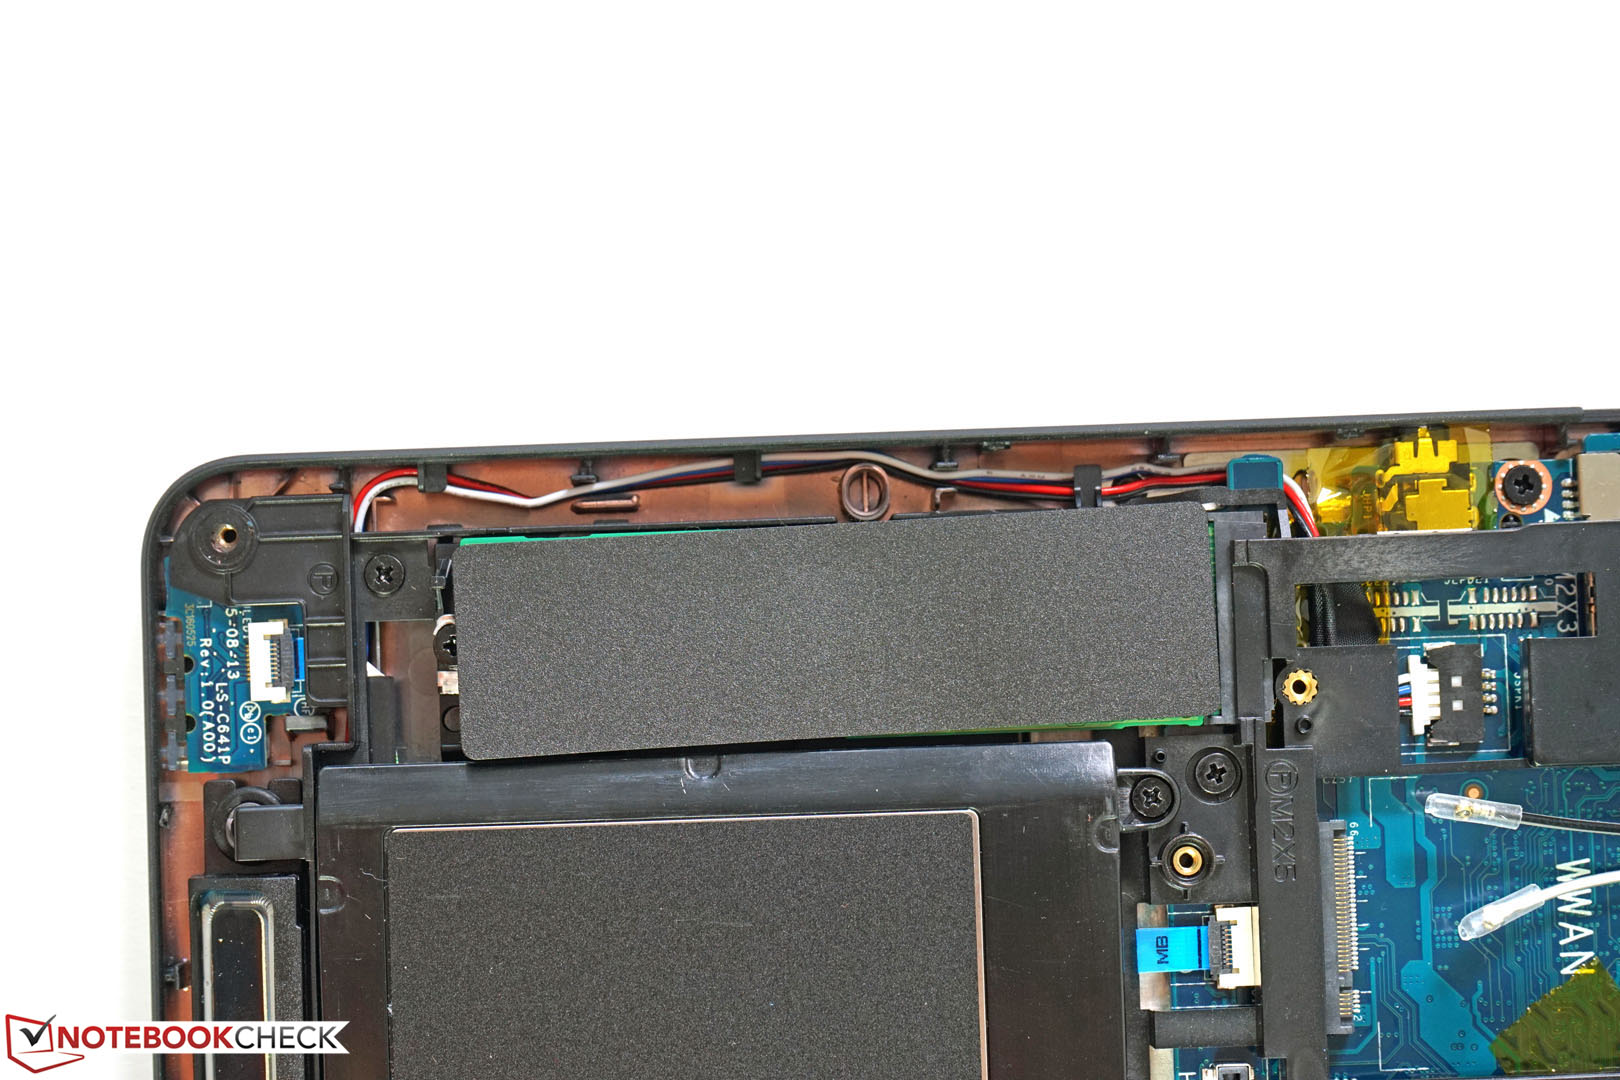
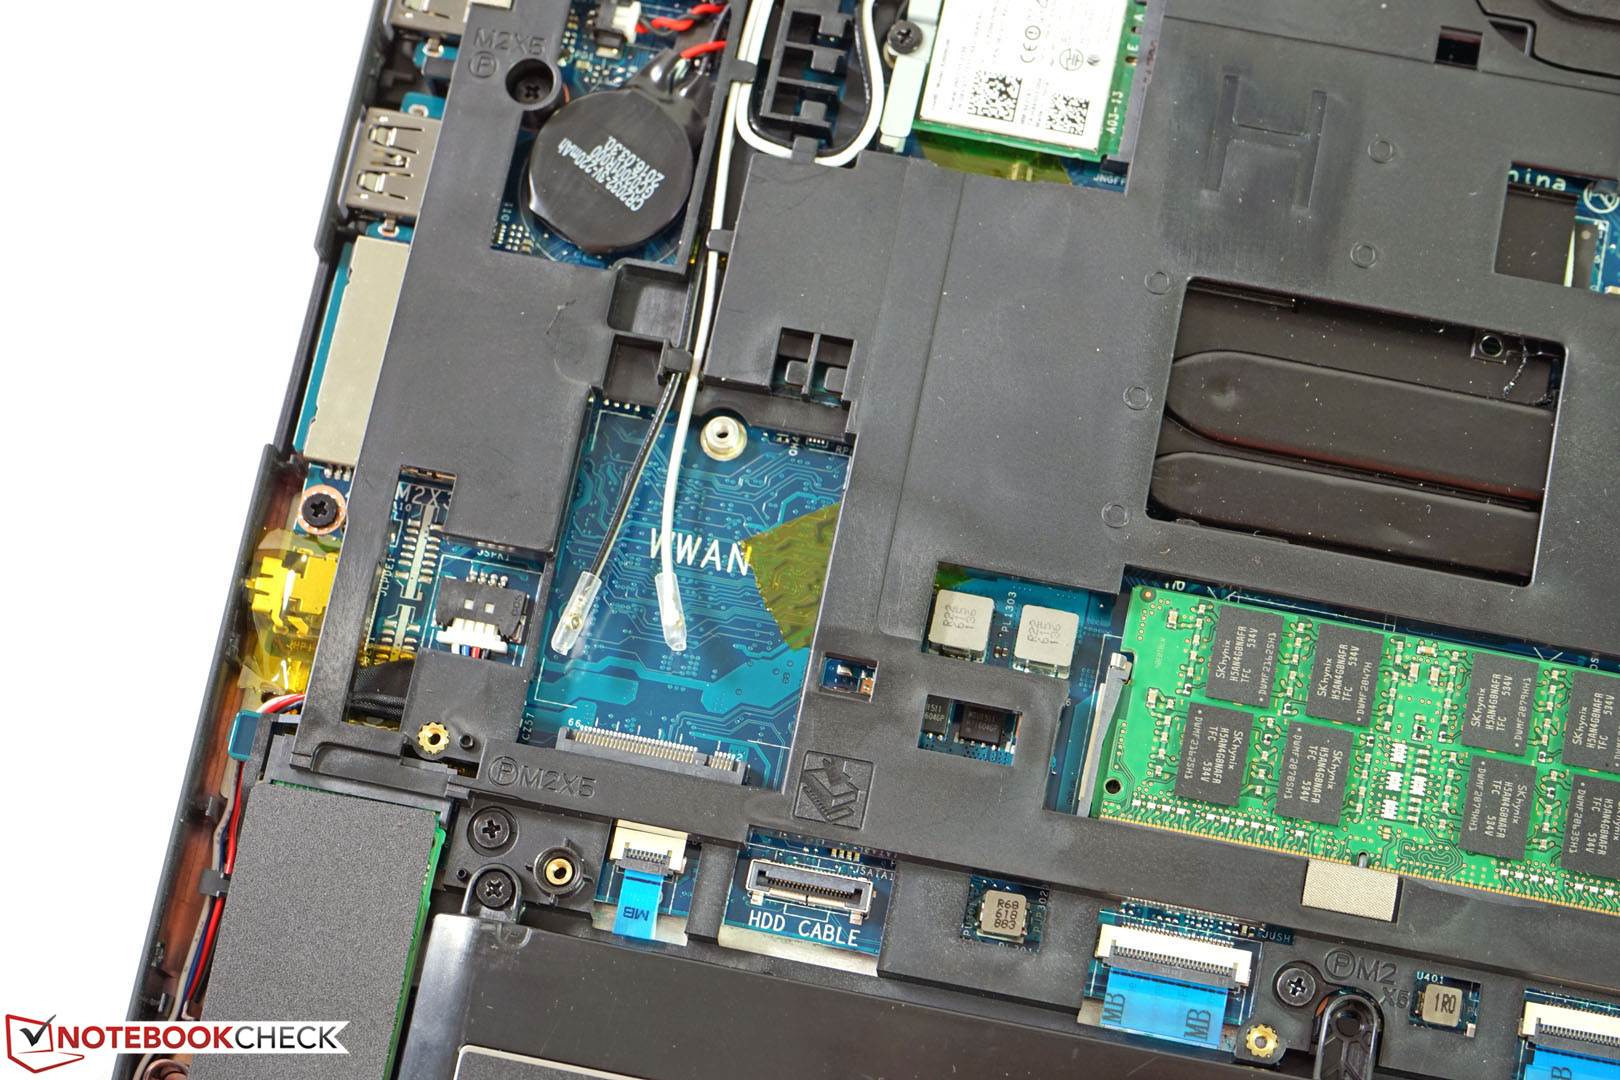
The wireless connectivity of the test device includes dual-band WLAN including the ac standard as well as Bluetooth 4.2. Both left a good impression in our review; the transfer rates were fast and inconspicuous. During the configuration process, you can also equip the device with a WWAN module (around 115 Euros/~$126 gross) for mobile Internet connections, but you can also upgrade such a module afterwards. The antennas are already installed and ready at the free M.2 slot, and the SIM-card tray can be accessed quite easily at the rear of the device.
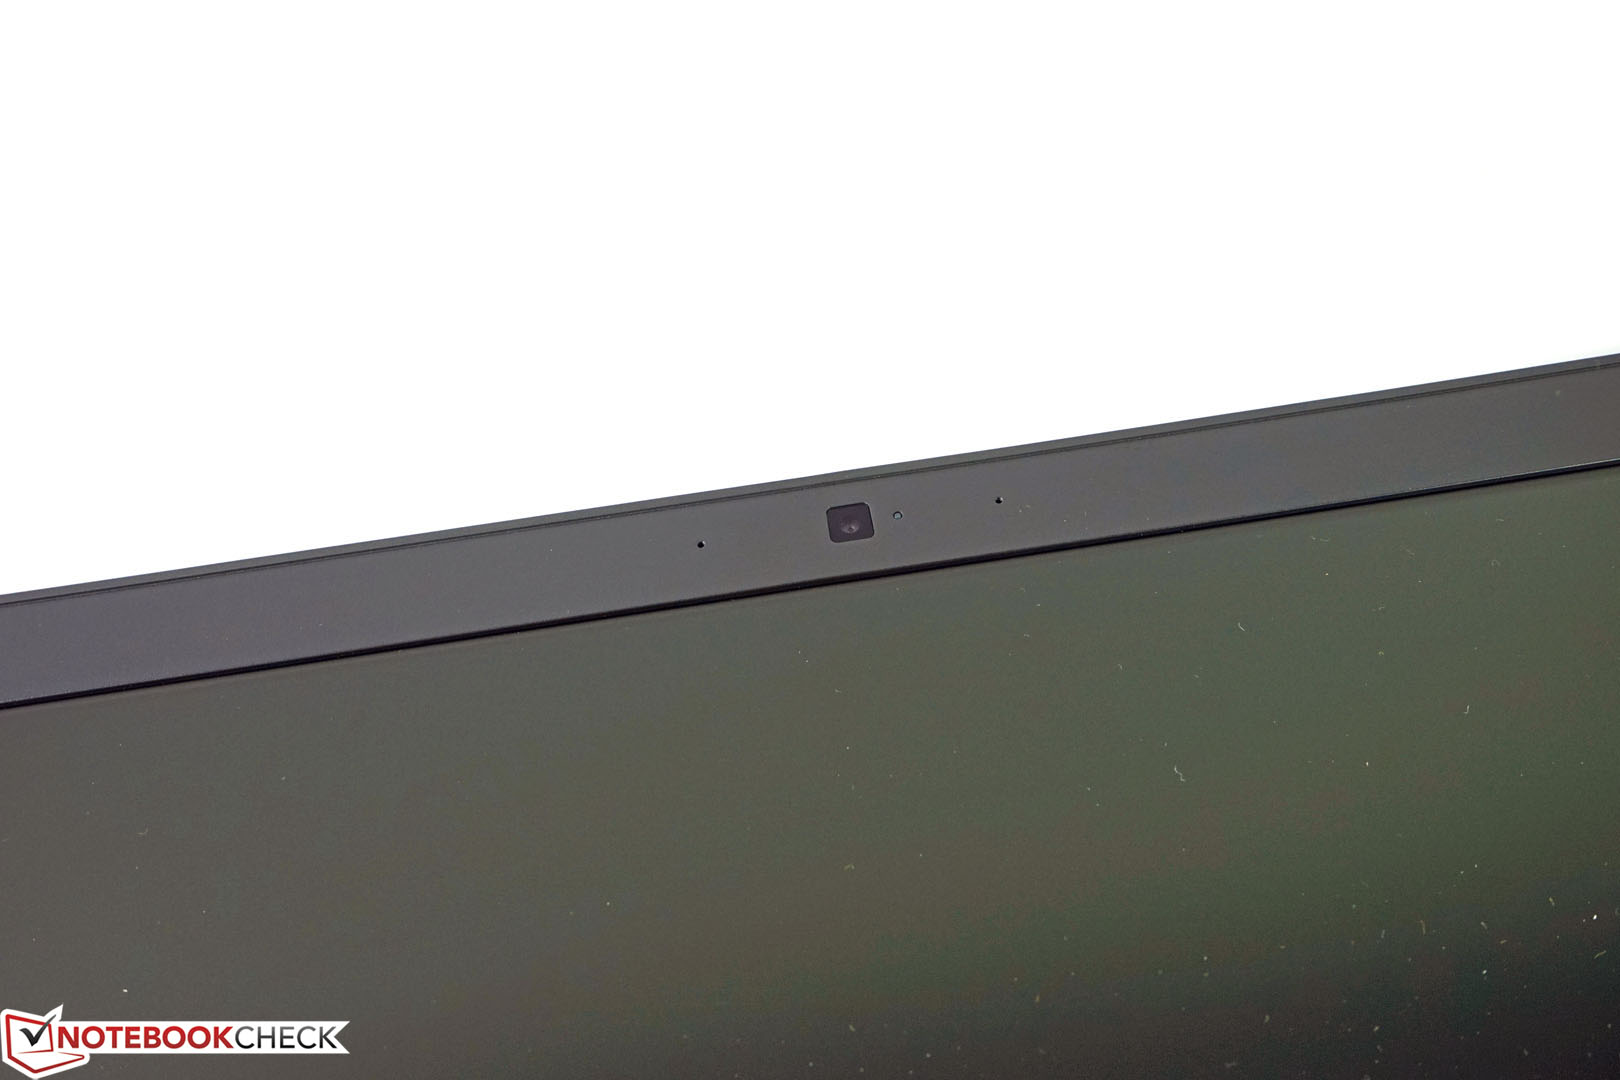
Otherwise, you will find the mandatory Gigabit Ethernet port for wired network environments. Webcam and dual-array microphone are sufficient for the usual video chats. The picture quality of the camera is okay in good lighting conditions, but darker environments will quickly result in picture noise and paler colors.
| Networking | |
| Wi-Fi Client 1m | |
| Wi-Fi Server 1m |
Security
According to Dell's configuration list, it seems that you have to decide between the fingerprint scanner and the SmartCard reader in terms of security equipment. Apparently, it is not possible to have both at the same time in one device. This would also explain why our review model is not equipped with a fingerprint scanner, but a SmartCard reader.
Otherwise, the Dell Precision 3510 comes with a Trusted Platform Module 1.2 and the usual password protections for BIOS and the system. To safeguard the theft of the device itself, you can use a Kensington Lock in combination with the corresponding slot at the right side of the notebook.
Accessories
As with the corresponding Latitude series, Dell offers a comprehensive lineup of accessories. A small battery, old proprietary and new Thunderbolt 3 docking stations as well as generic accessories, which not only can be used with Dell devices, but also other companies.
Maintenance
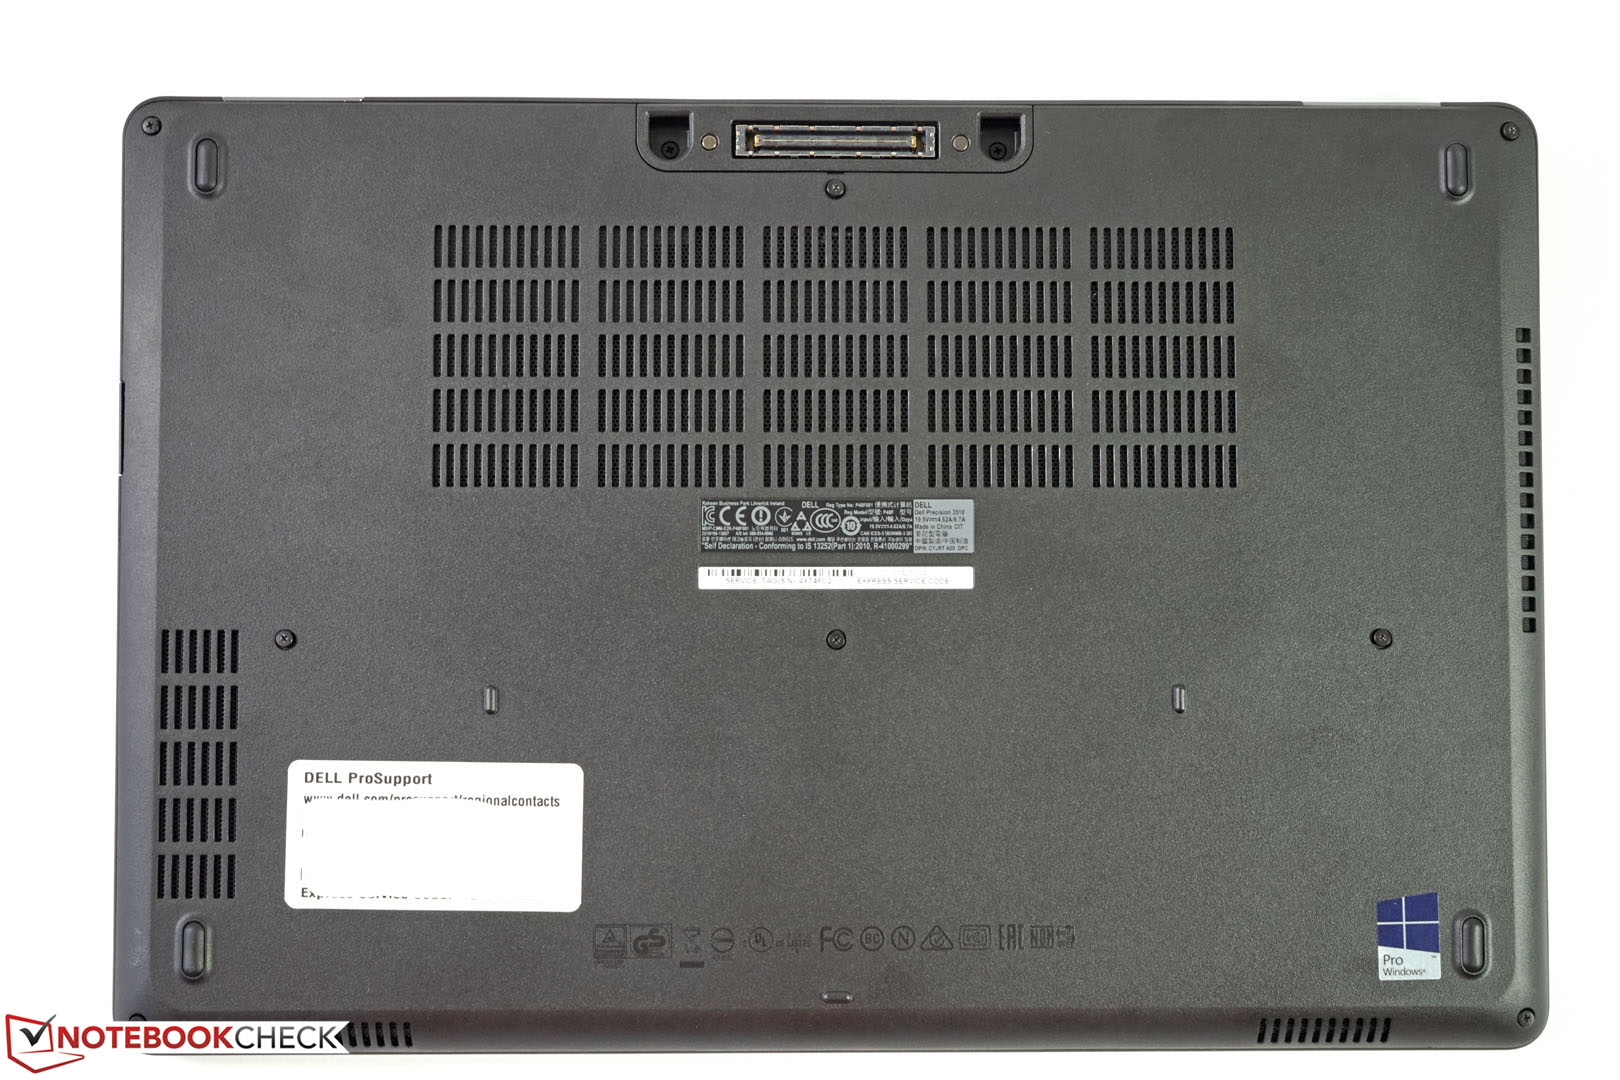
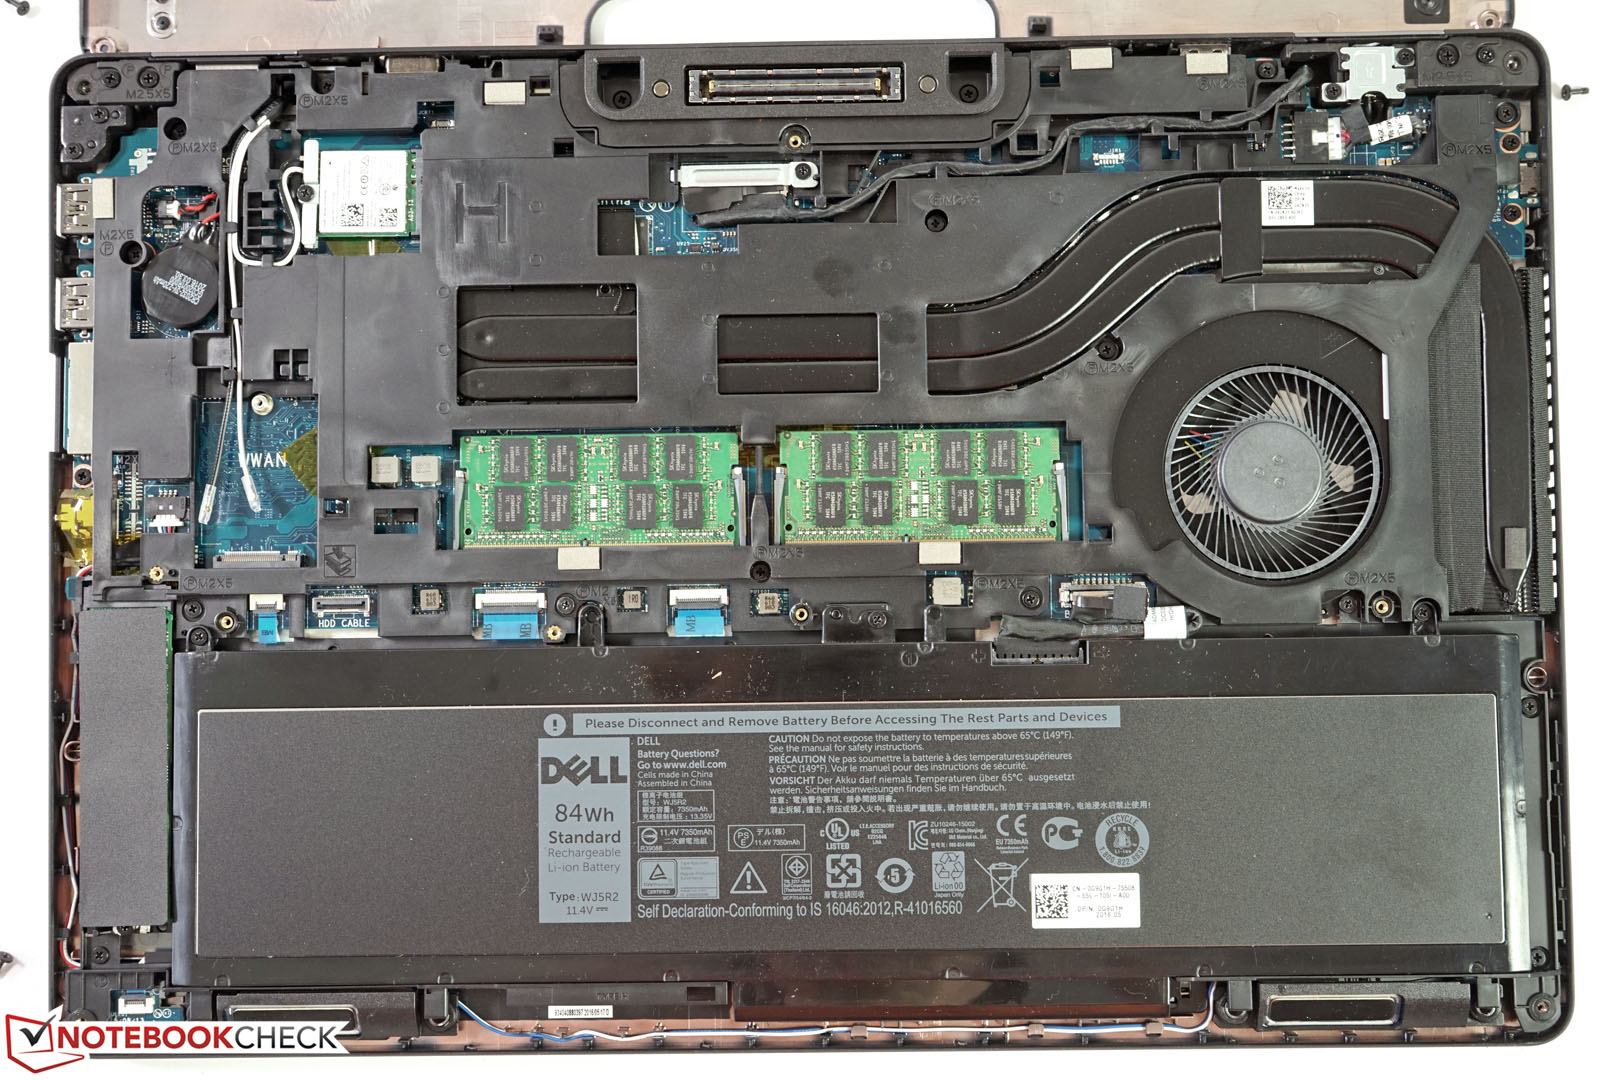
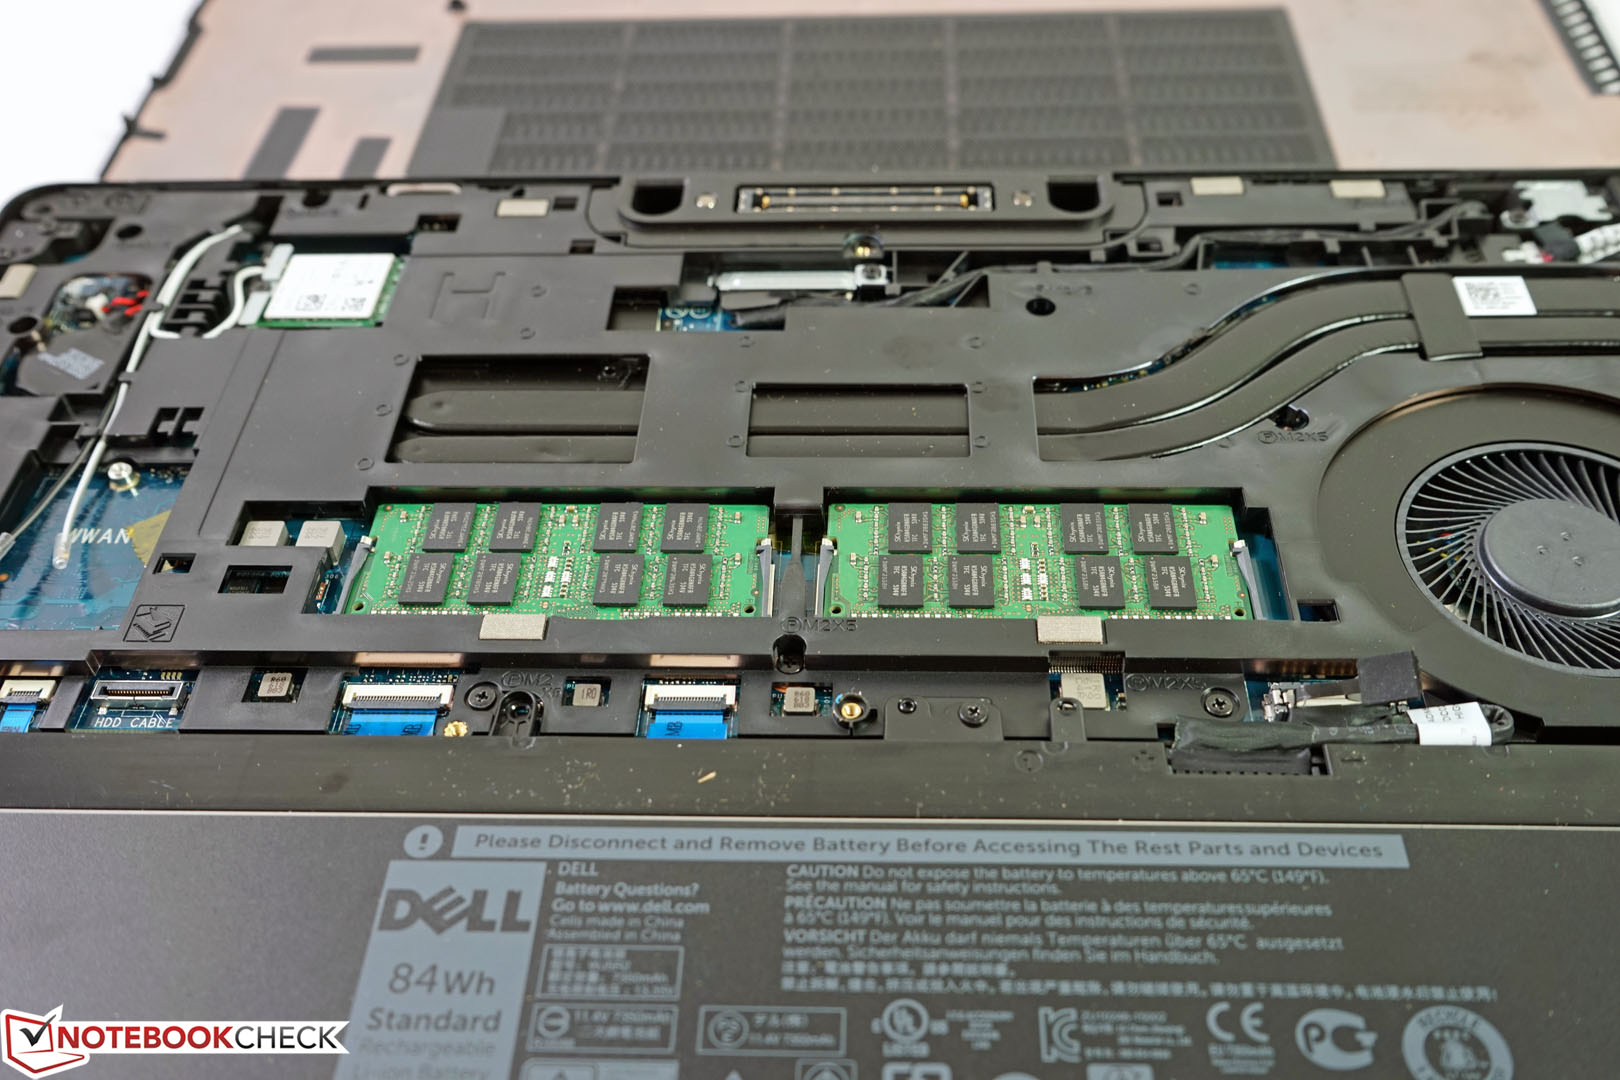
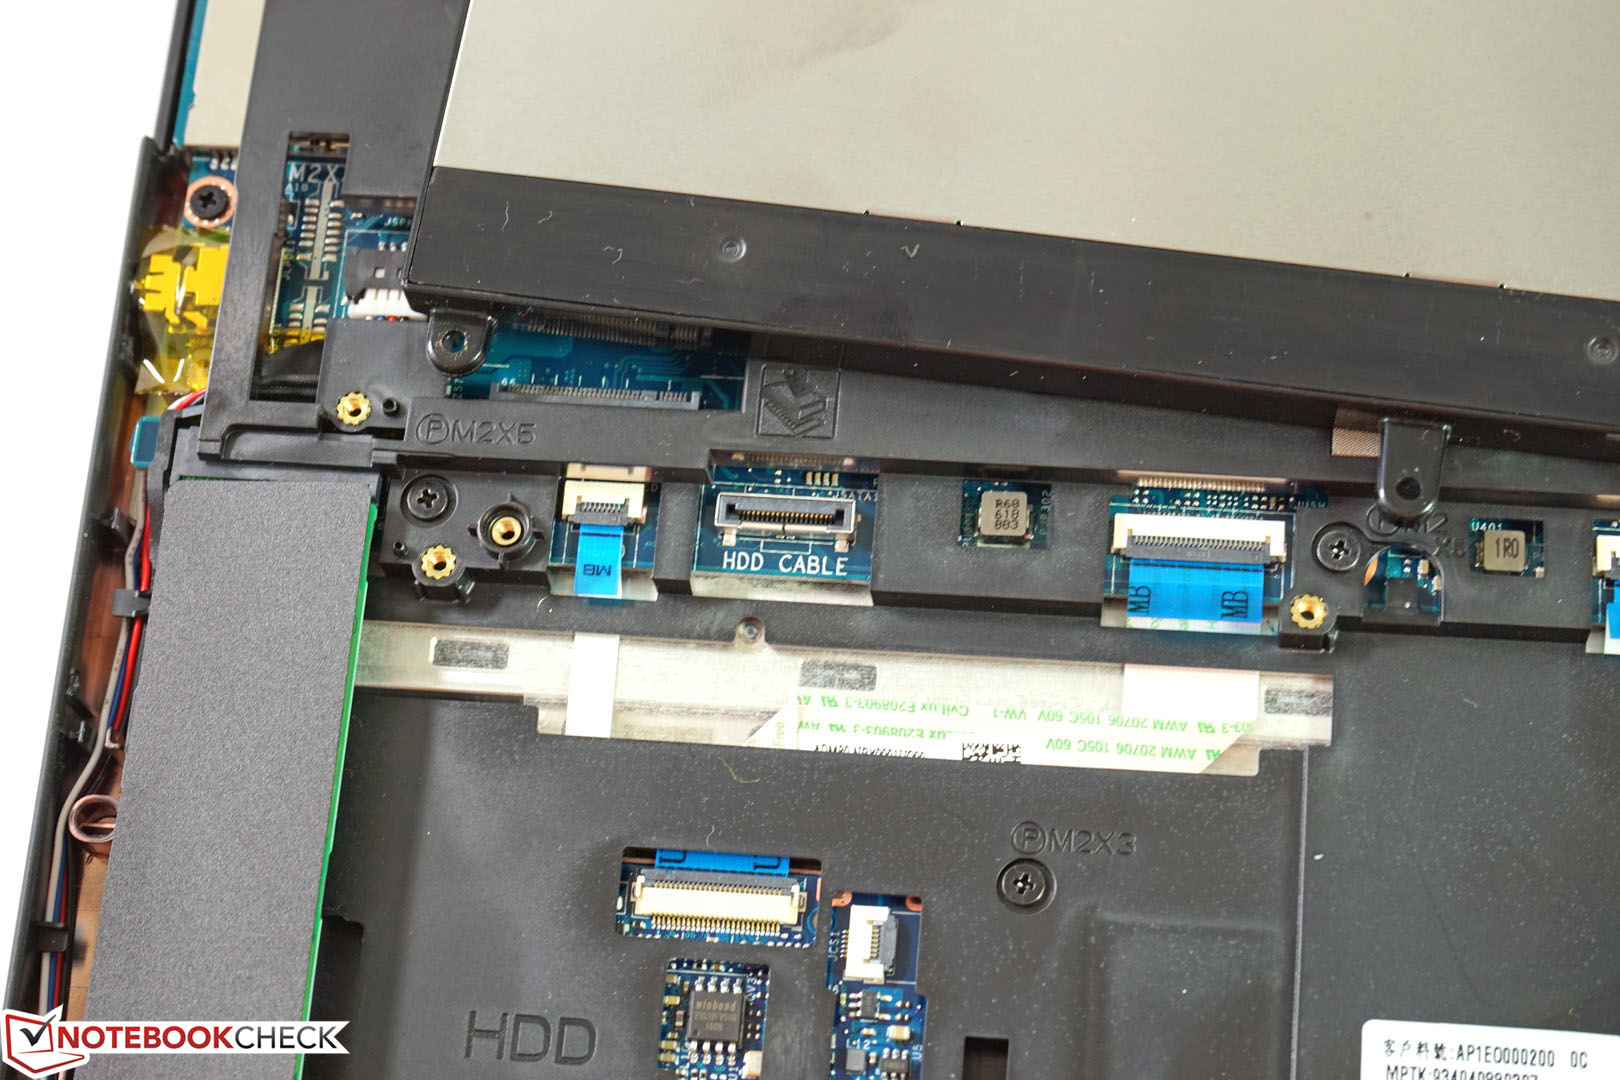
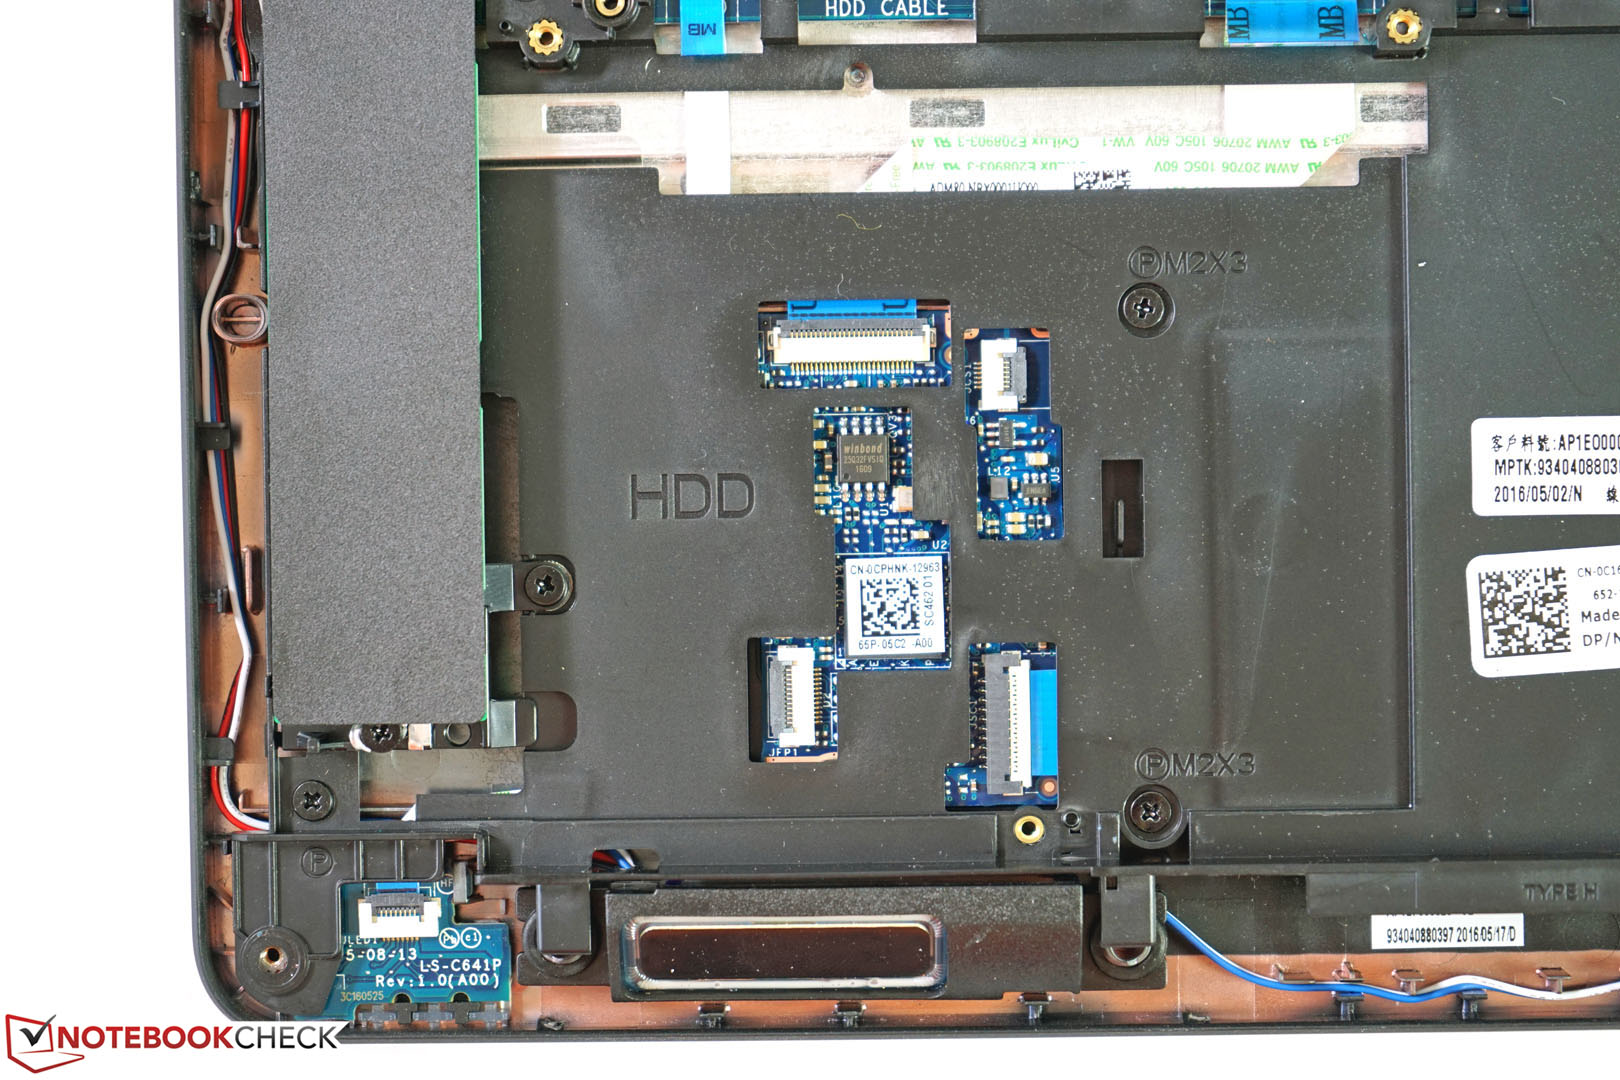
The bottom panel is screwed and can be easily removed by the user, but the maintainability and upgradeability of the test model are still not as good as those of the Dell Precision 7510, for example. A quick look inside shows why Dell's online configurator cannot combine the big 84-Wh battery with a 2.5-inch drive or a 2.5-inch drive with an M.2 drive. The designated spaces are overlapping and simply exclude each other due to the limited space.
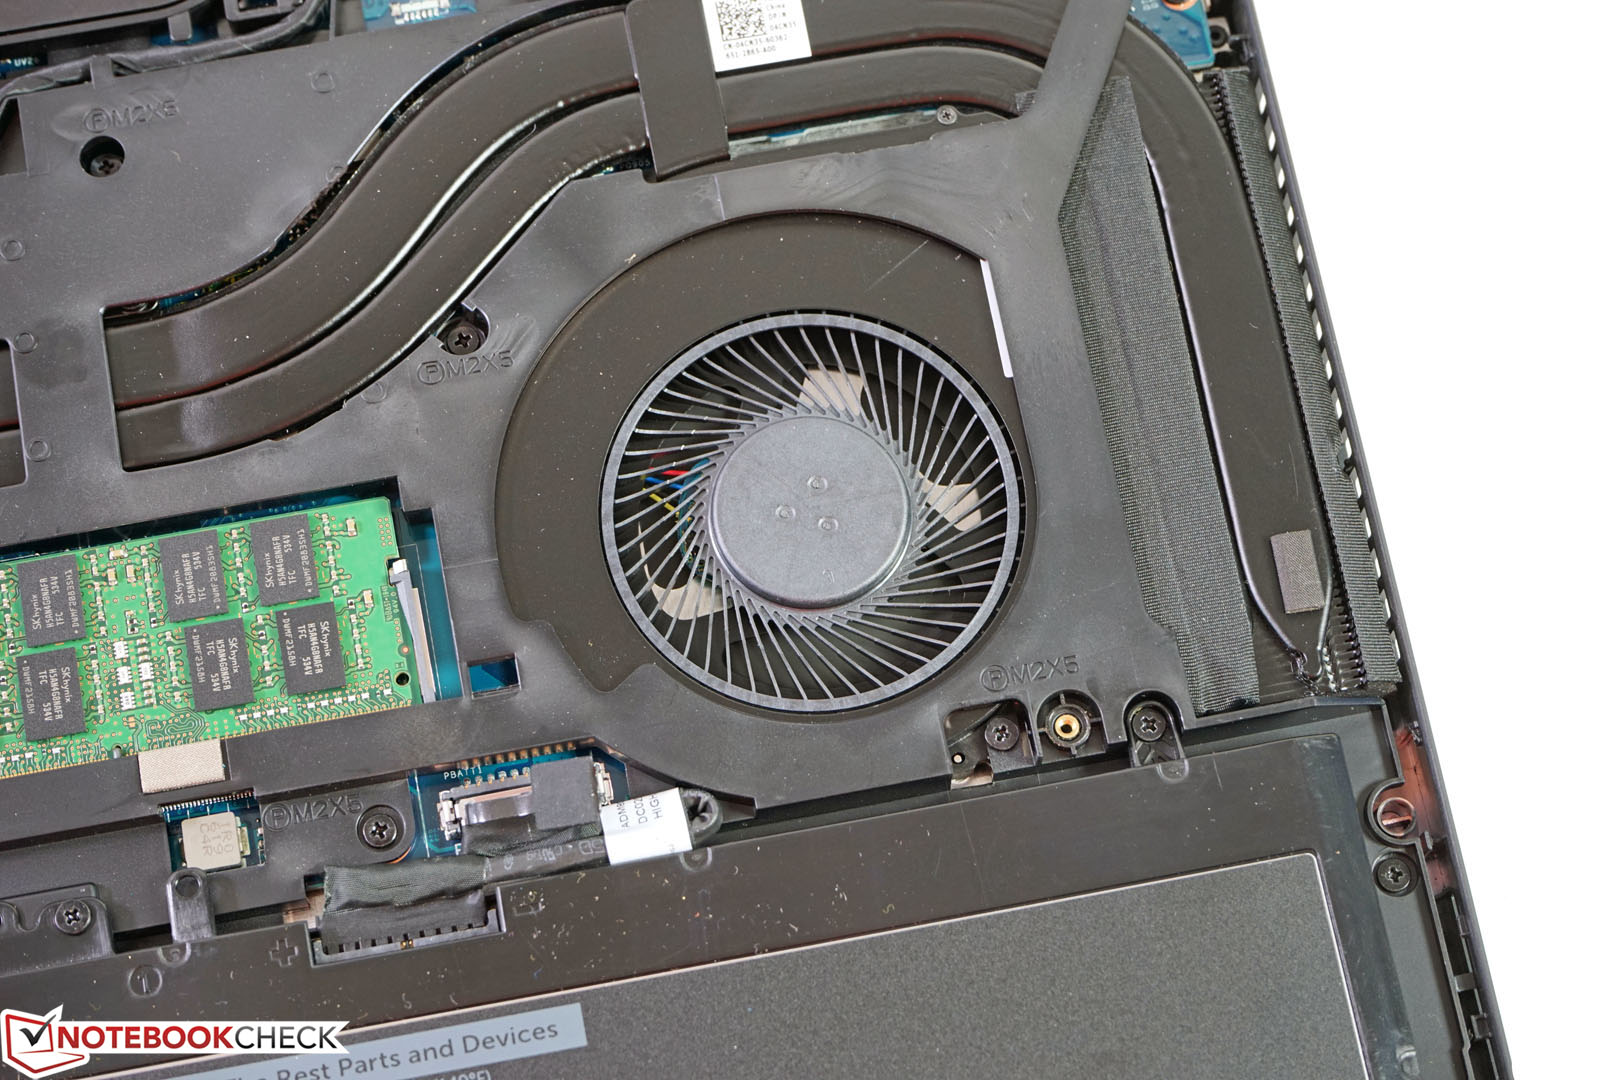
Otherwise, the components are easy to access, the battery is secured by screws, and the fans can also be cleaned if necessary. The maximum memory equipment of the Precision 3510 is 32 GB, because not even the quad-core models get a third or fourth SODIMM slot. Dell's Owner’s Manual for the Precision 3510 shows how to reach and remove the individual components.
Warranty
As it is usual in this segment, the warranty period is 36 months (Basic Support) by default and can be expanded if necessary. An extension to a 4-year ProSupport with On-Site service, for example, is available for around 330 Euros (~$362).
Input Devices
Keyboard
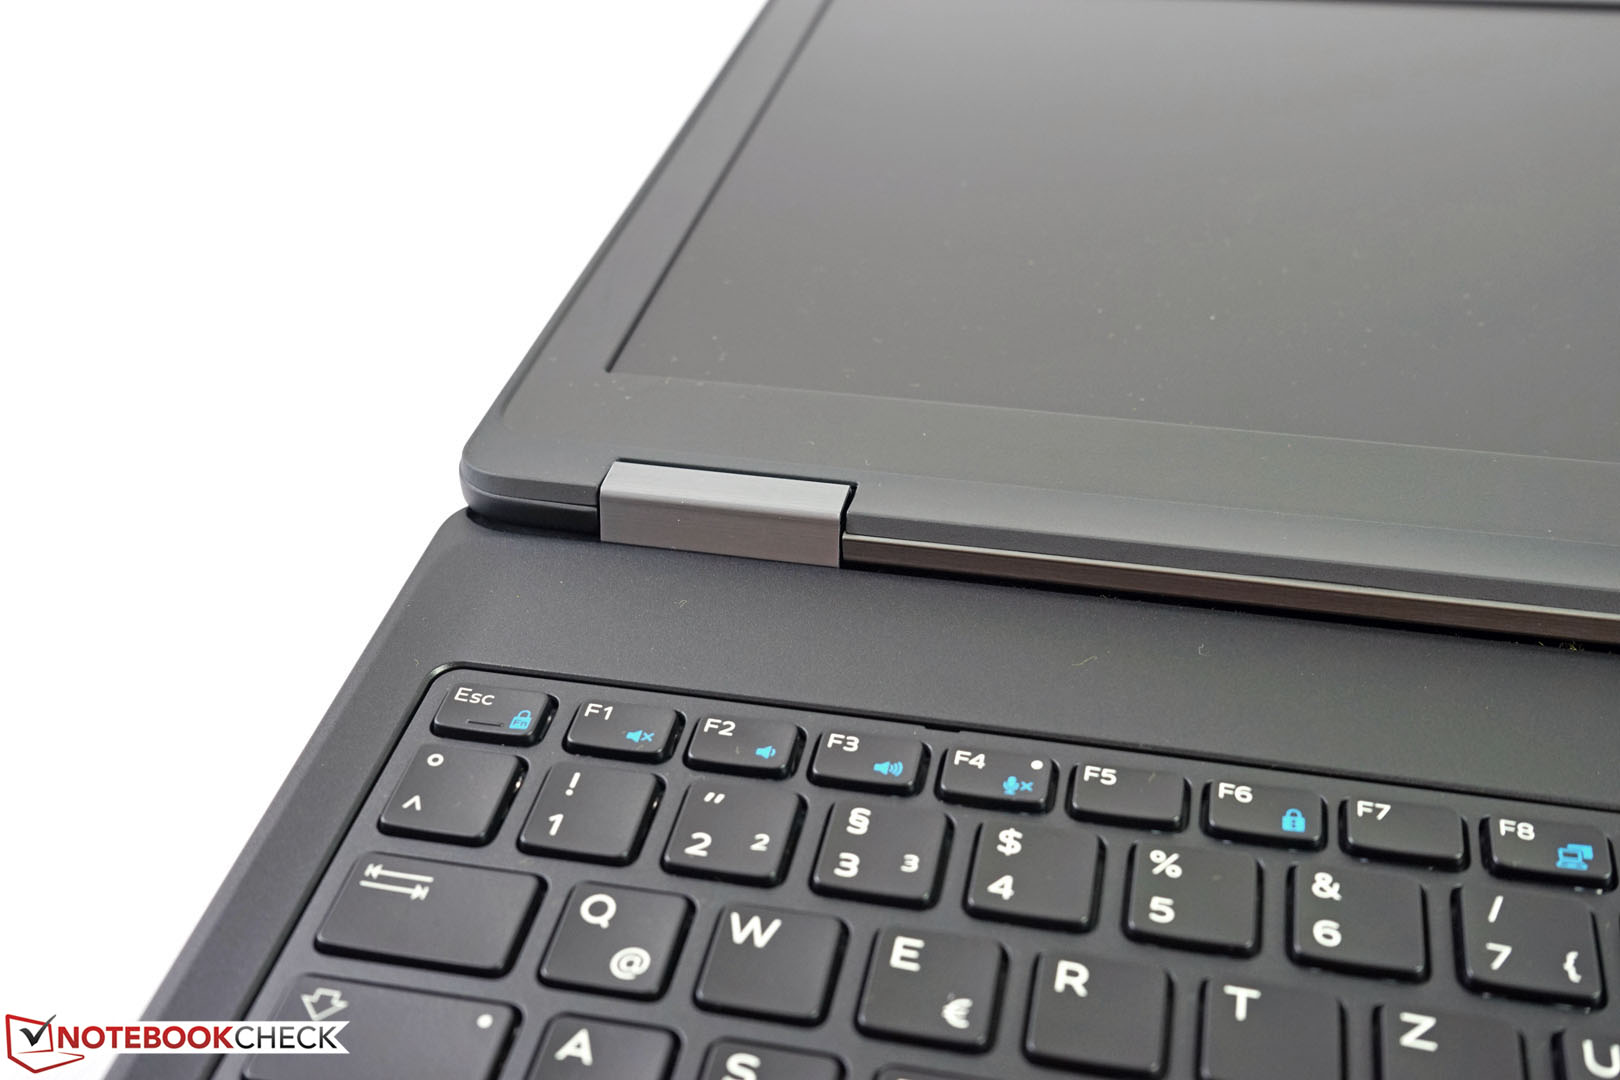
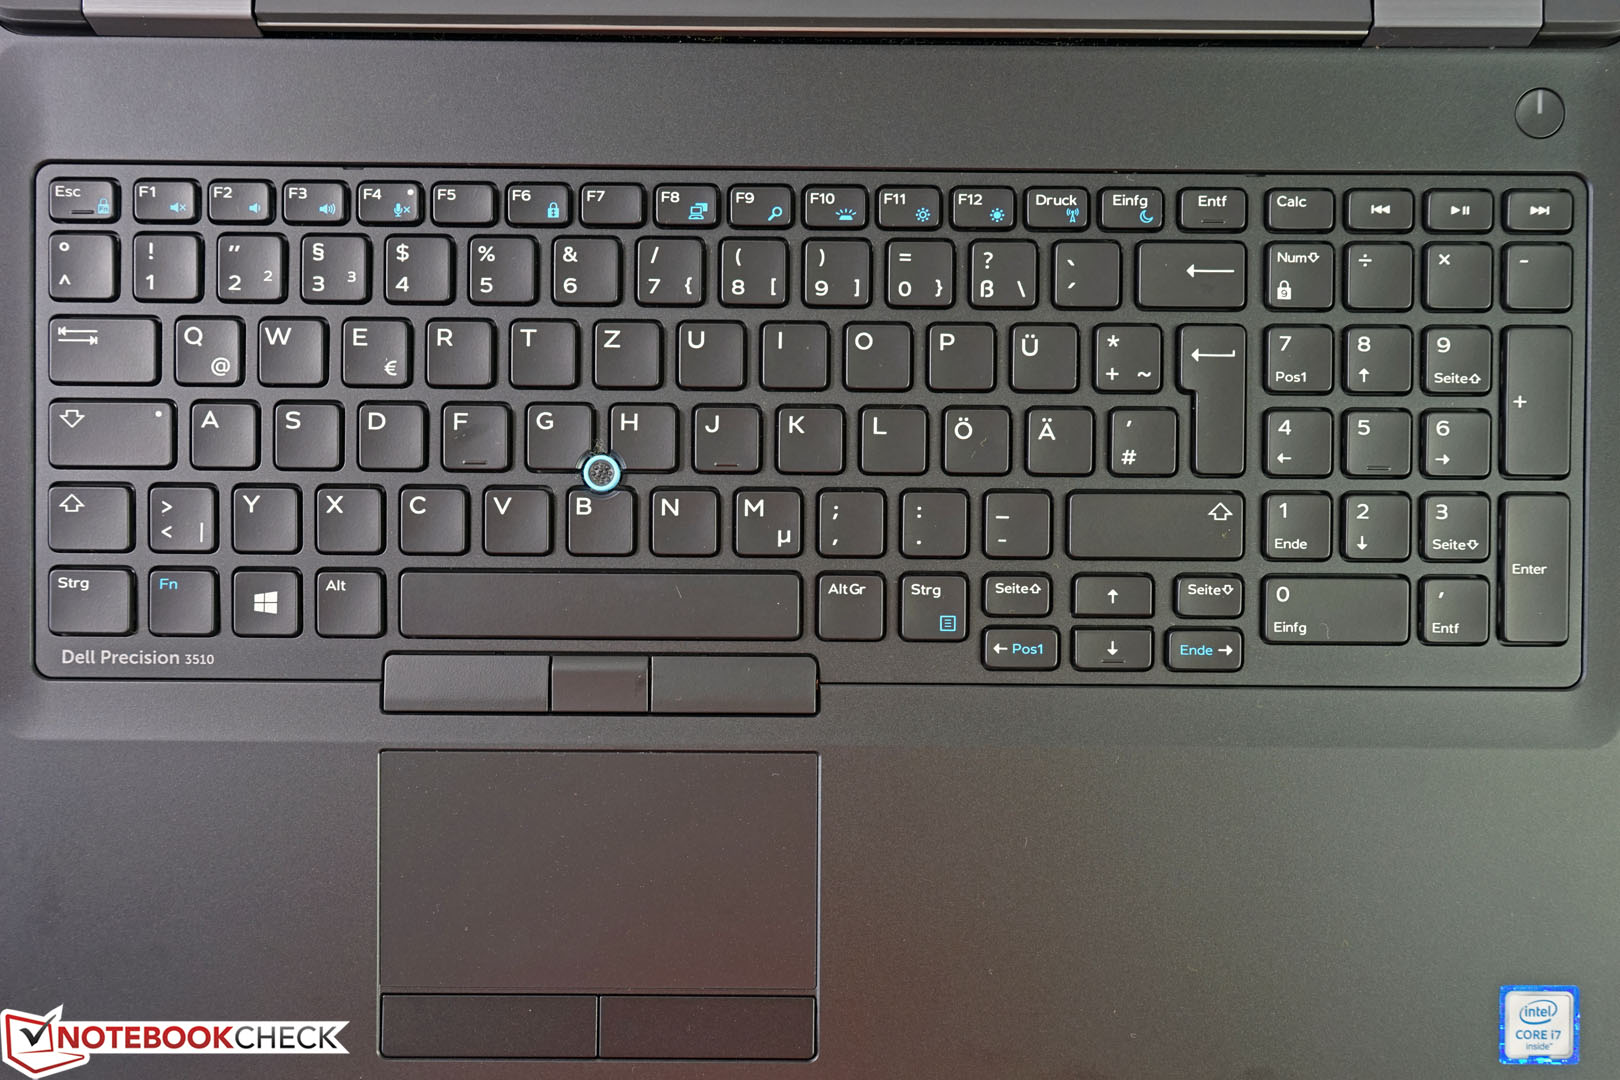
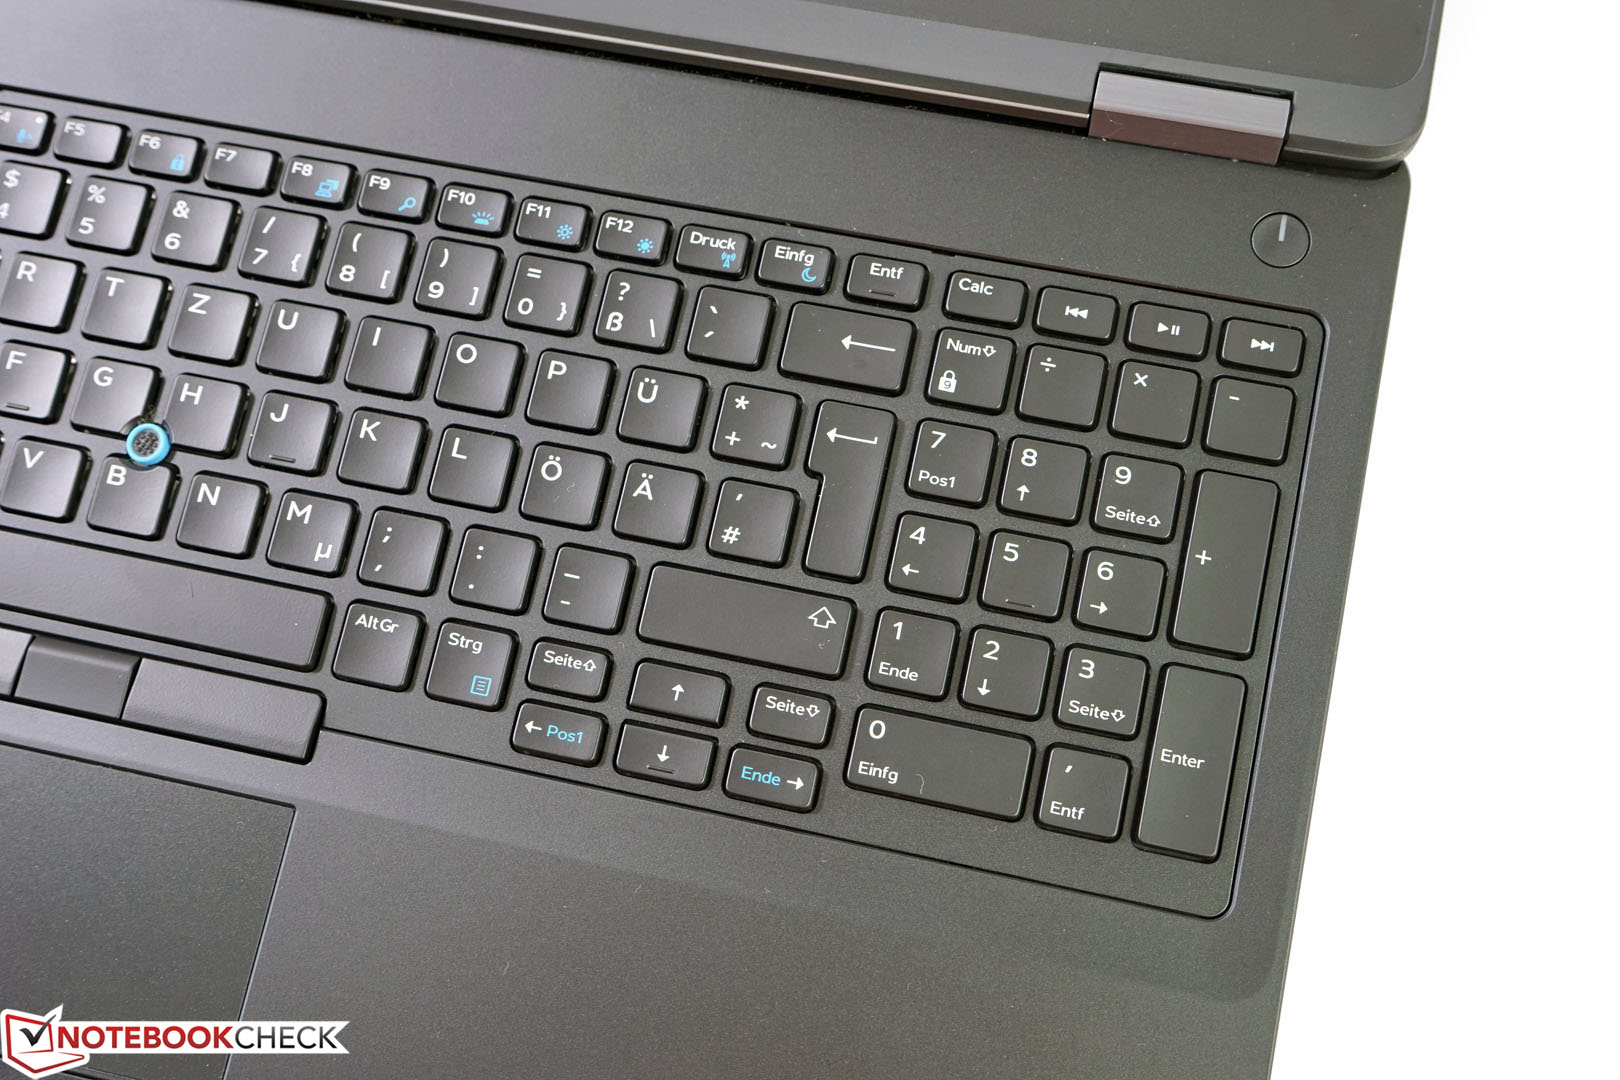
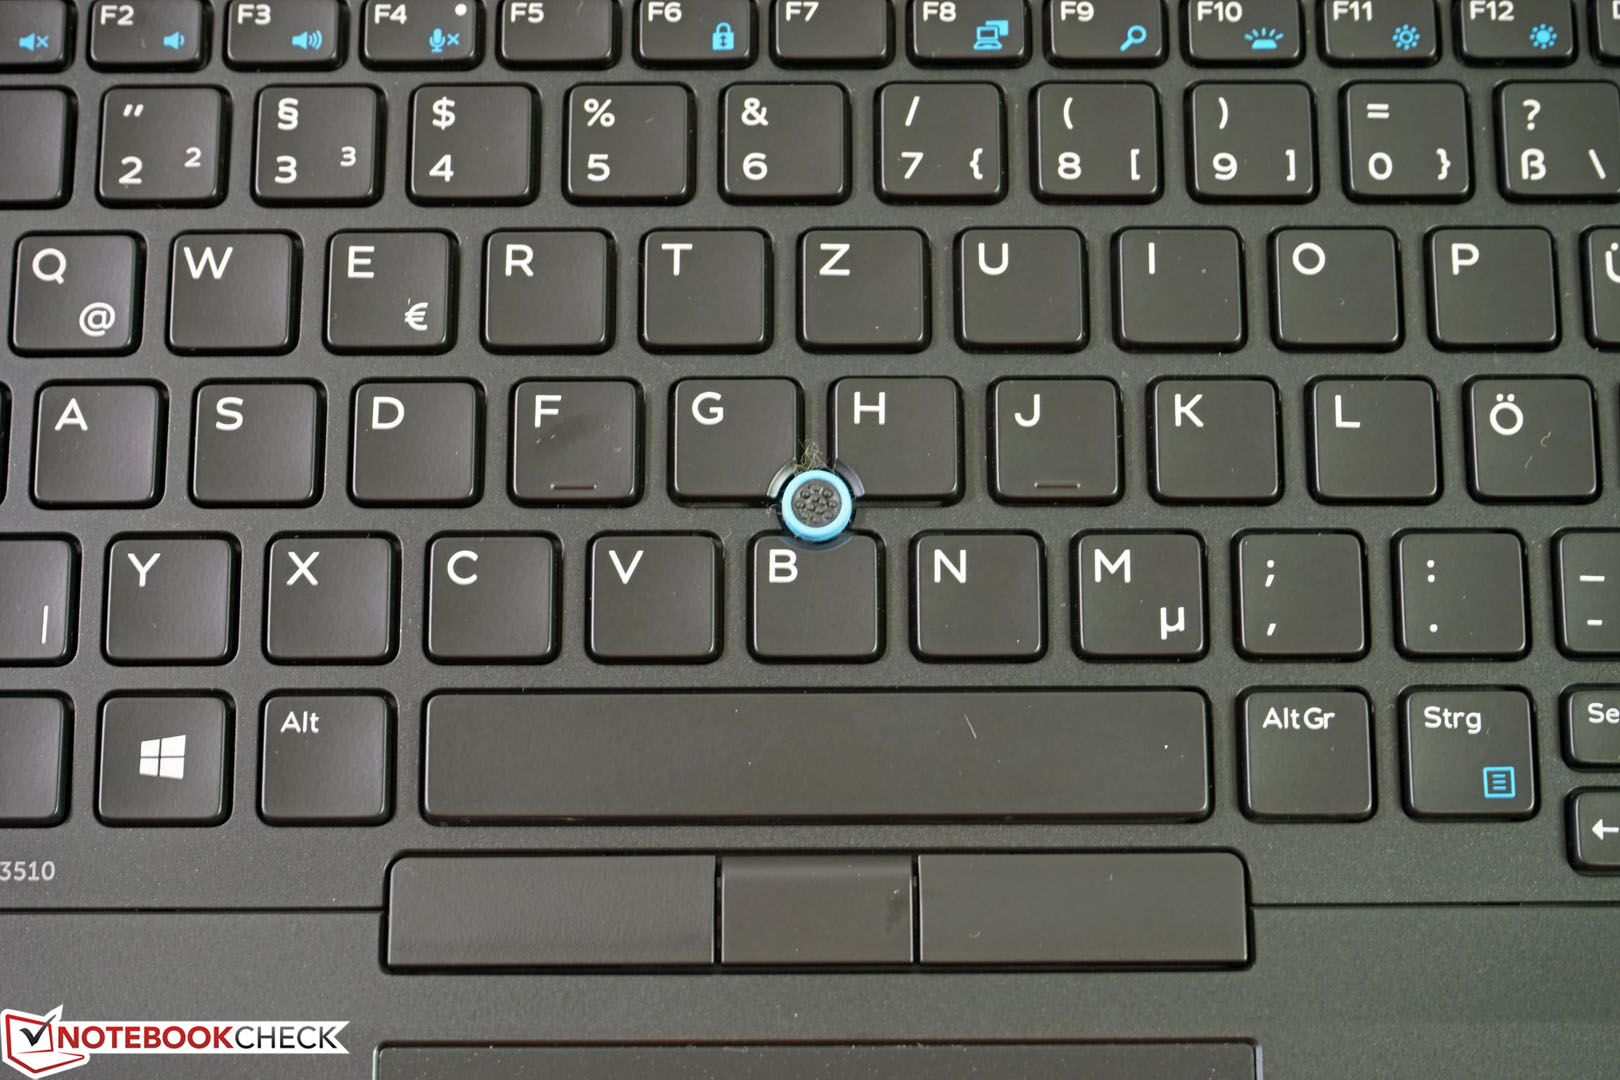
The keyboard of the Dell Precision 3510 is suitable for prolific writers and has large keys (19 mm/~0.75 in) as well as a separate numeric keypad. The matte keyboard is very firm, does not bounce and provides good feedback with a well-defined pressure point. The lettering is easy to see and is conveniently supported by the 2-stage keyboard illumination.
Touchpad
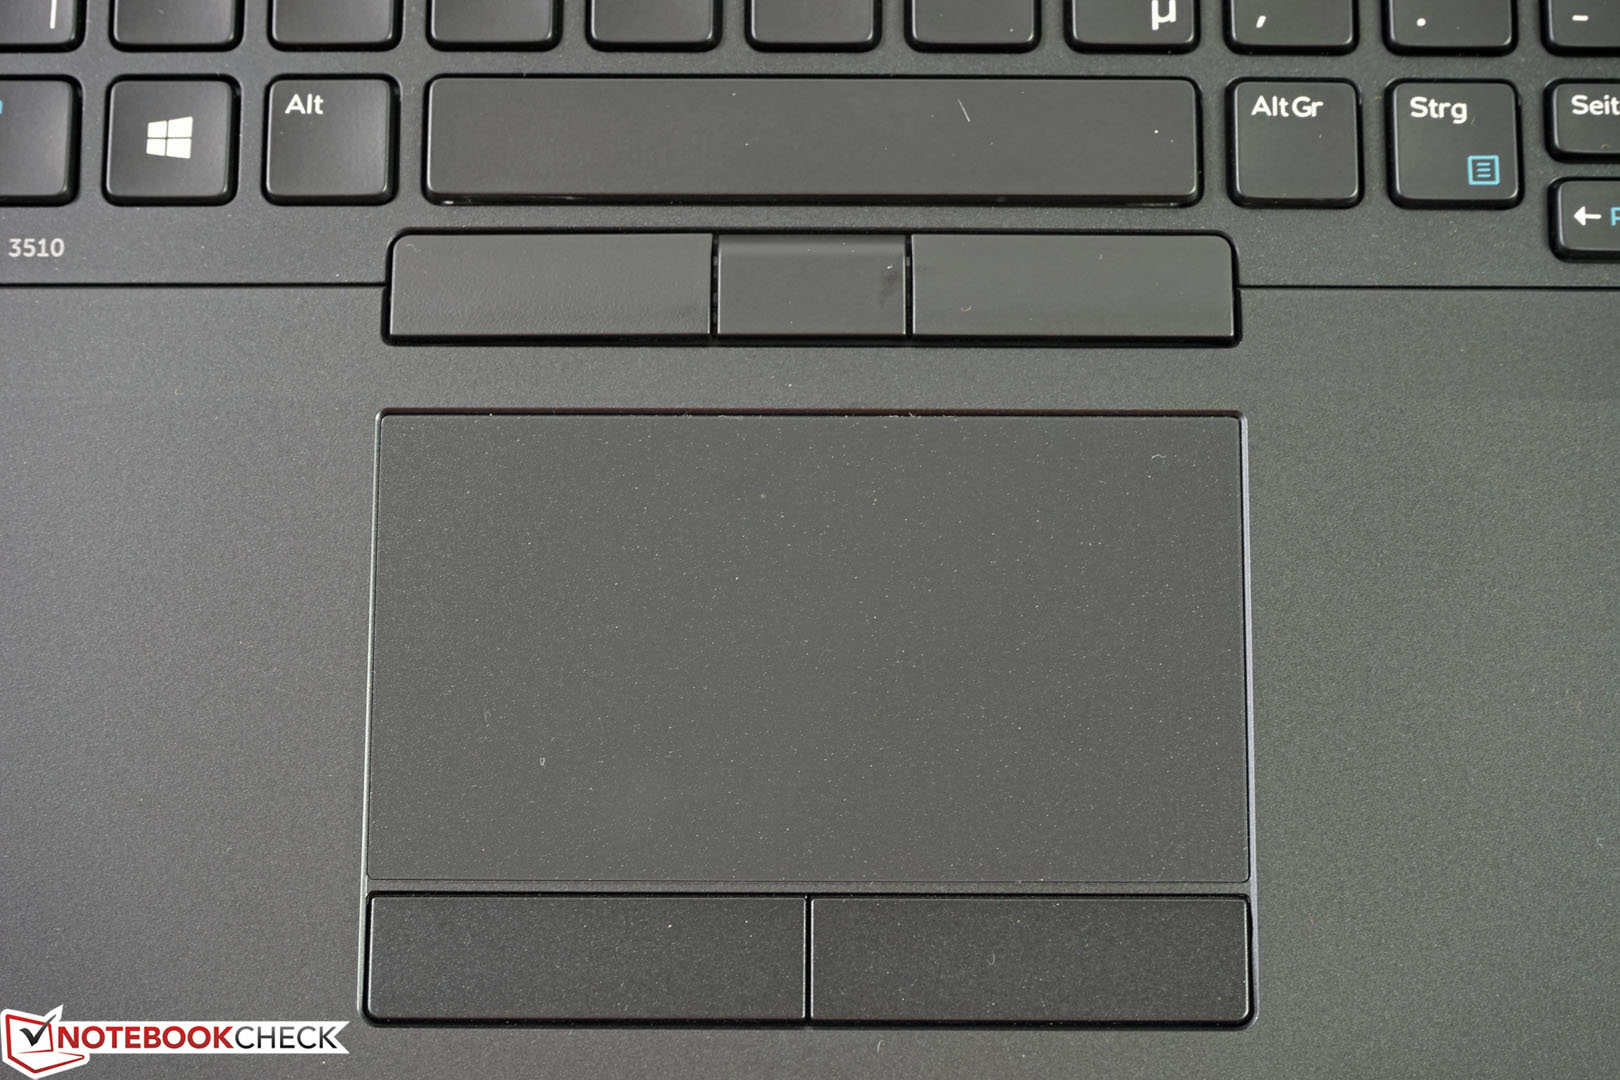
The touchpad provides very good gliding capabilities and recognizes inputs quite reliably. The dedicated touchpad buttons are smooth and quiet when you press them. The usual multi-touch gestures are supported and you can unlock additional or deactivate unnecessary features in the touchpad driver.
Business devices are often equipped with a TrackPoint as an additional mouse replacement. This is the case here and there are also separate buttons above the touchpad. The comfort of the solution, however, is not quite on ThinkPad level, because the concave surface hardly sticks out from the surrounding keys and is therefore rather tricky to use.
Display
You should be able to expect a display with a decent quality when you pay almost 2000 Euros (~$2196) for a notebook – especially when you buy a mobile workstation. Unfortunately, this is not the case for the test model. Dell only implements a TN panel from LG Philips, which can easily be found in the cheapest entry-level notebooks for less than 500 Euros (~$549). The biggest problem is not even the low resolution of just 1366x768 pixels, but all the characteristics together, which are clearly below the average.
| |||||||||||||||||||||||||
Brightness Distribution: 83 %
Center on Battery: 199 cd/m²
Contrast: 498:1 (Black: 0.4 cd/m²)
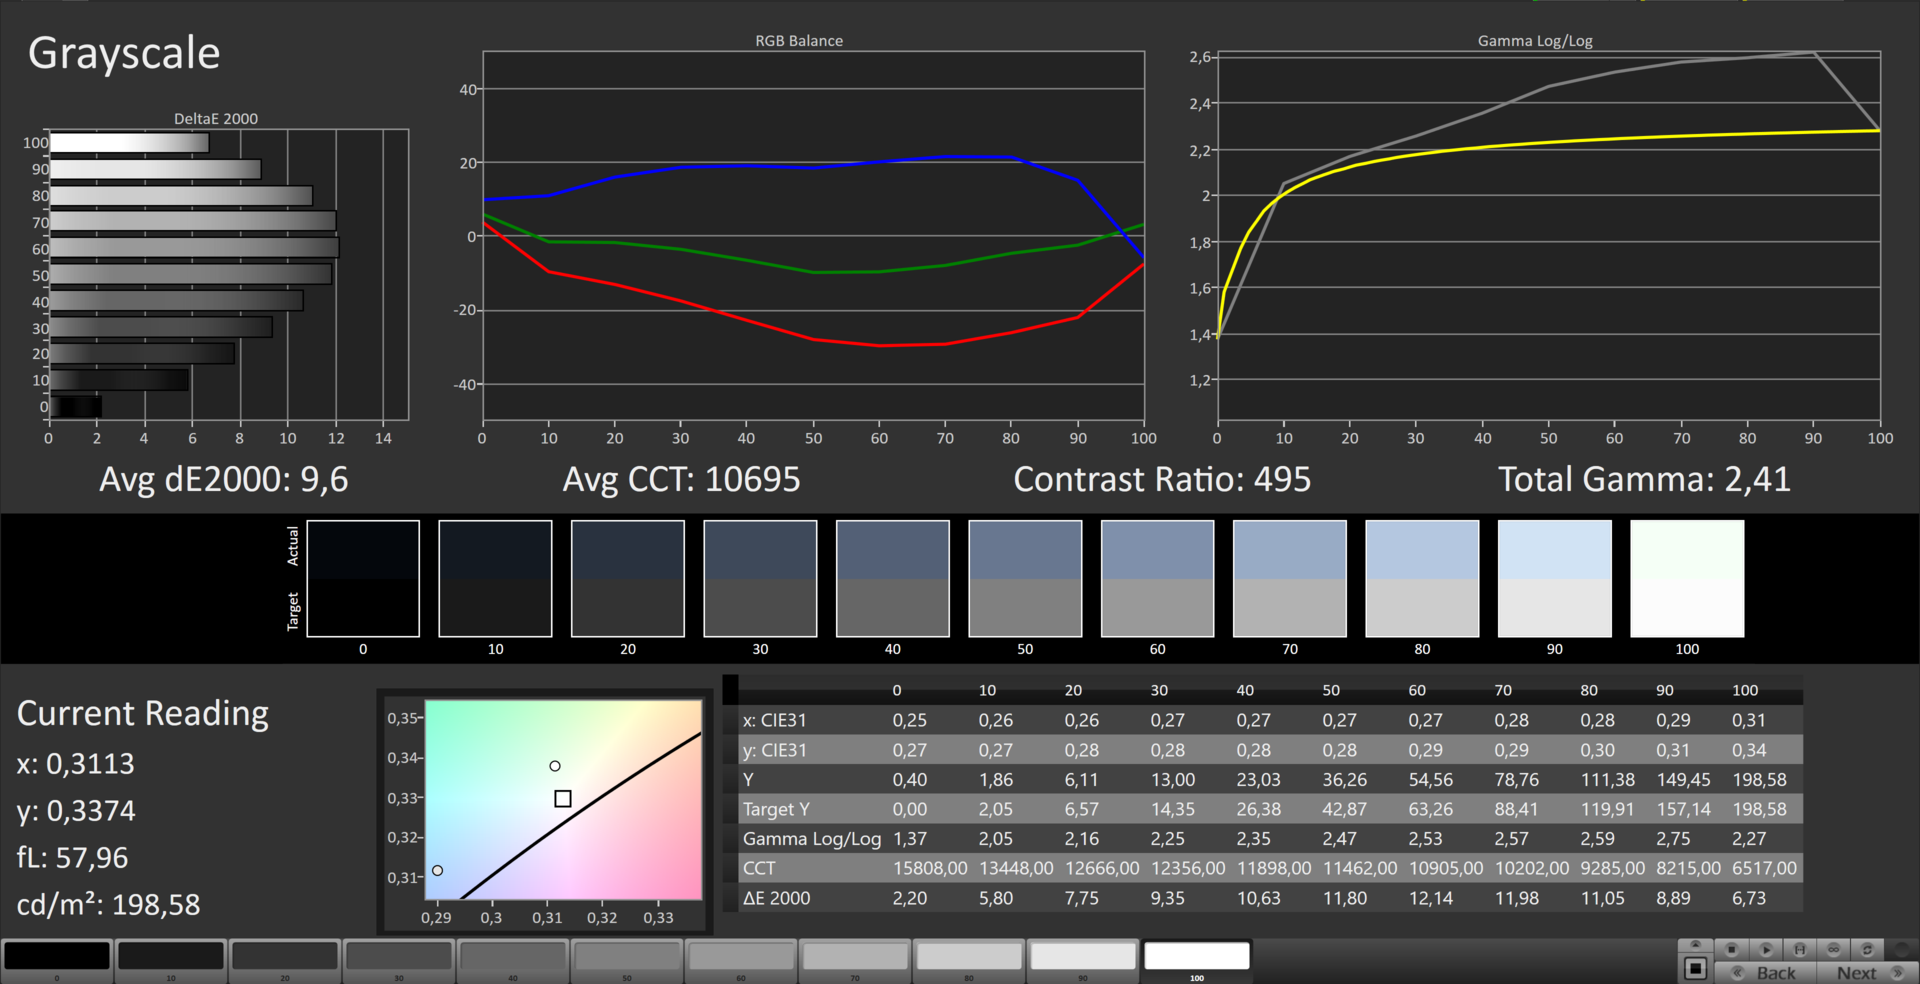
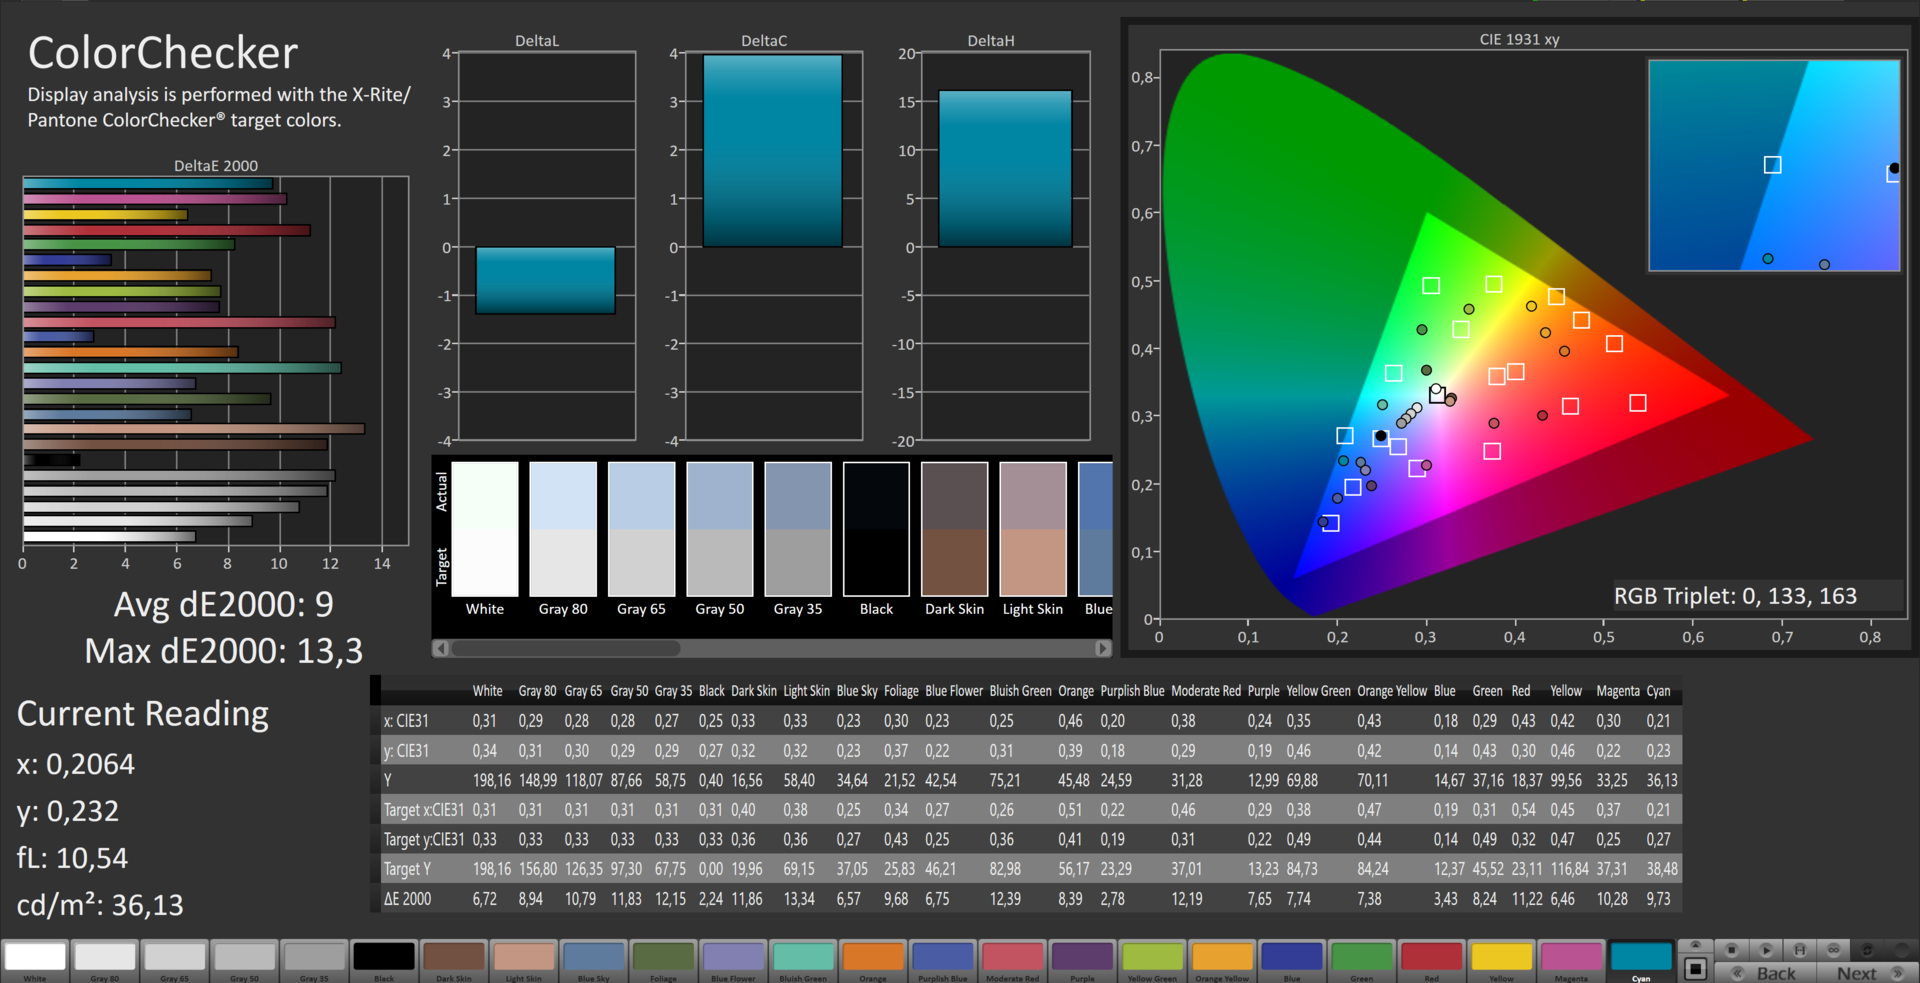
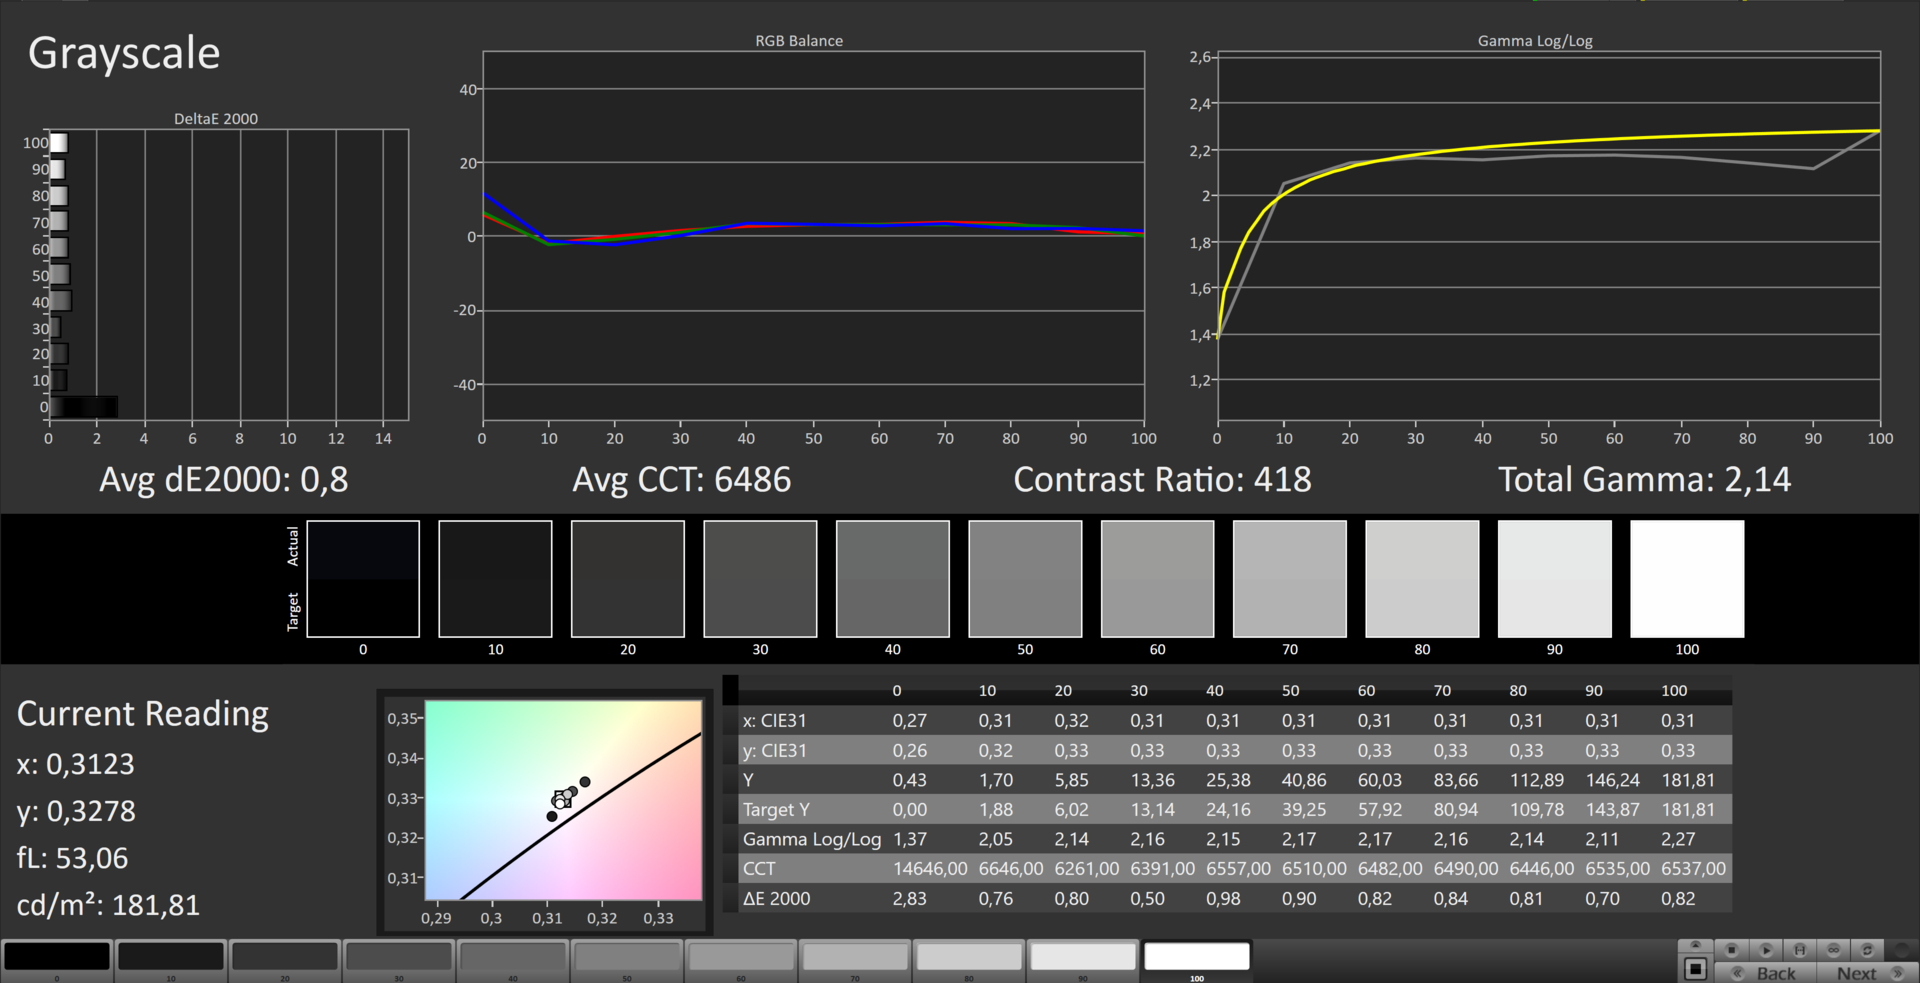
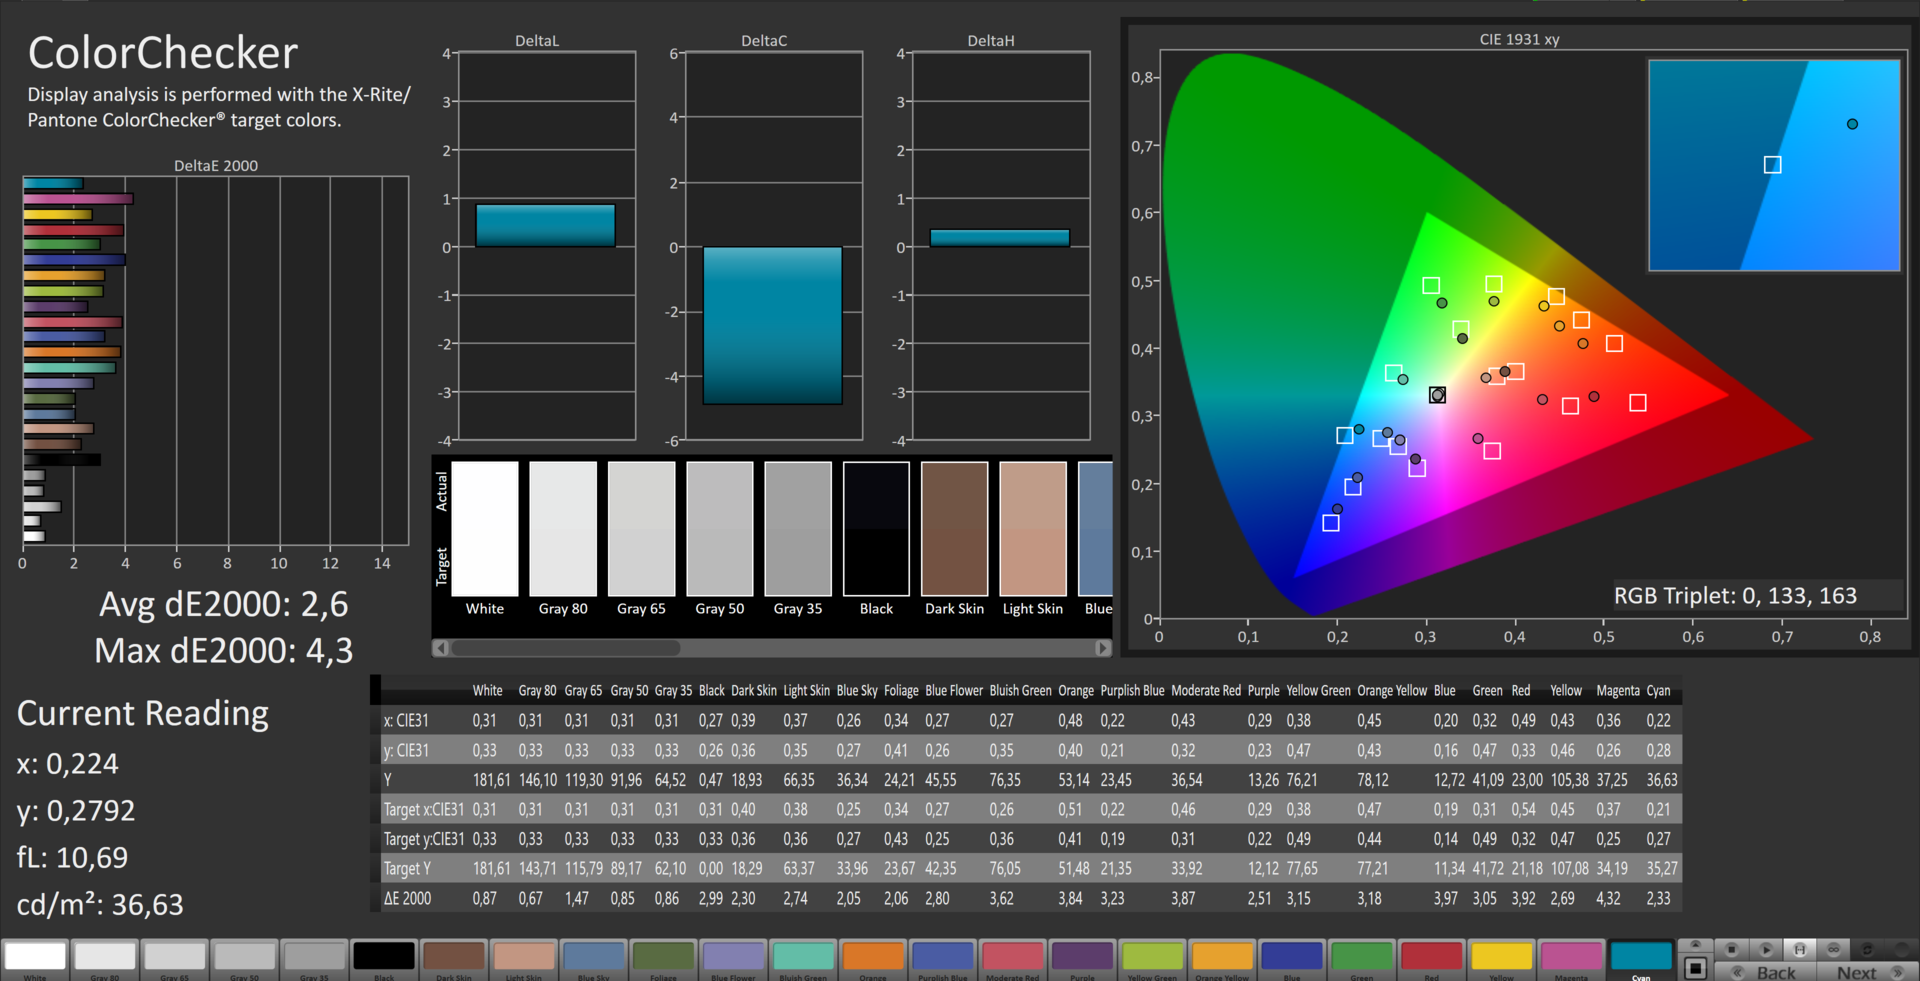
ΔE ColorChecker Calman: 9 | ∀{0.5-29.43 Ø4.71}
ΔE Greyscale Calman: 9.6 | ∀{0.09-98 Ø4.96}
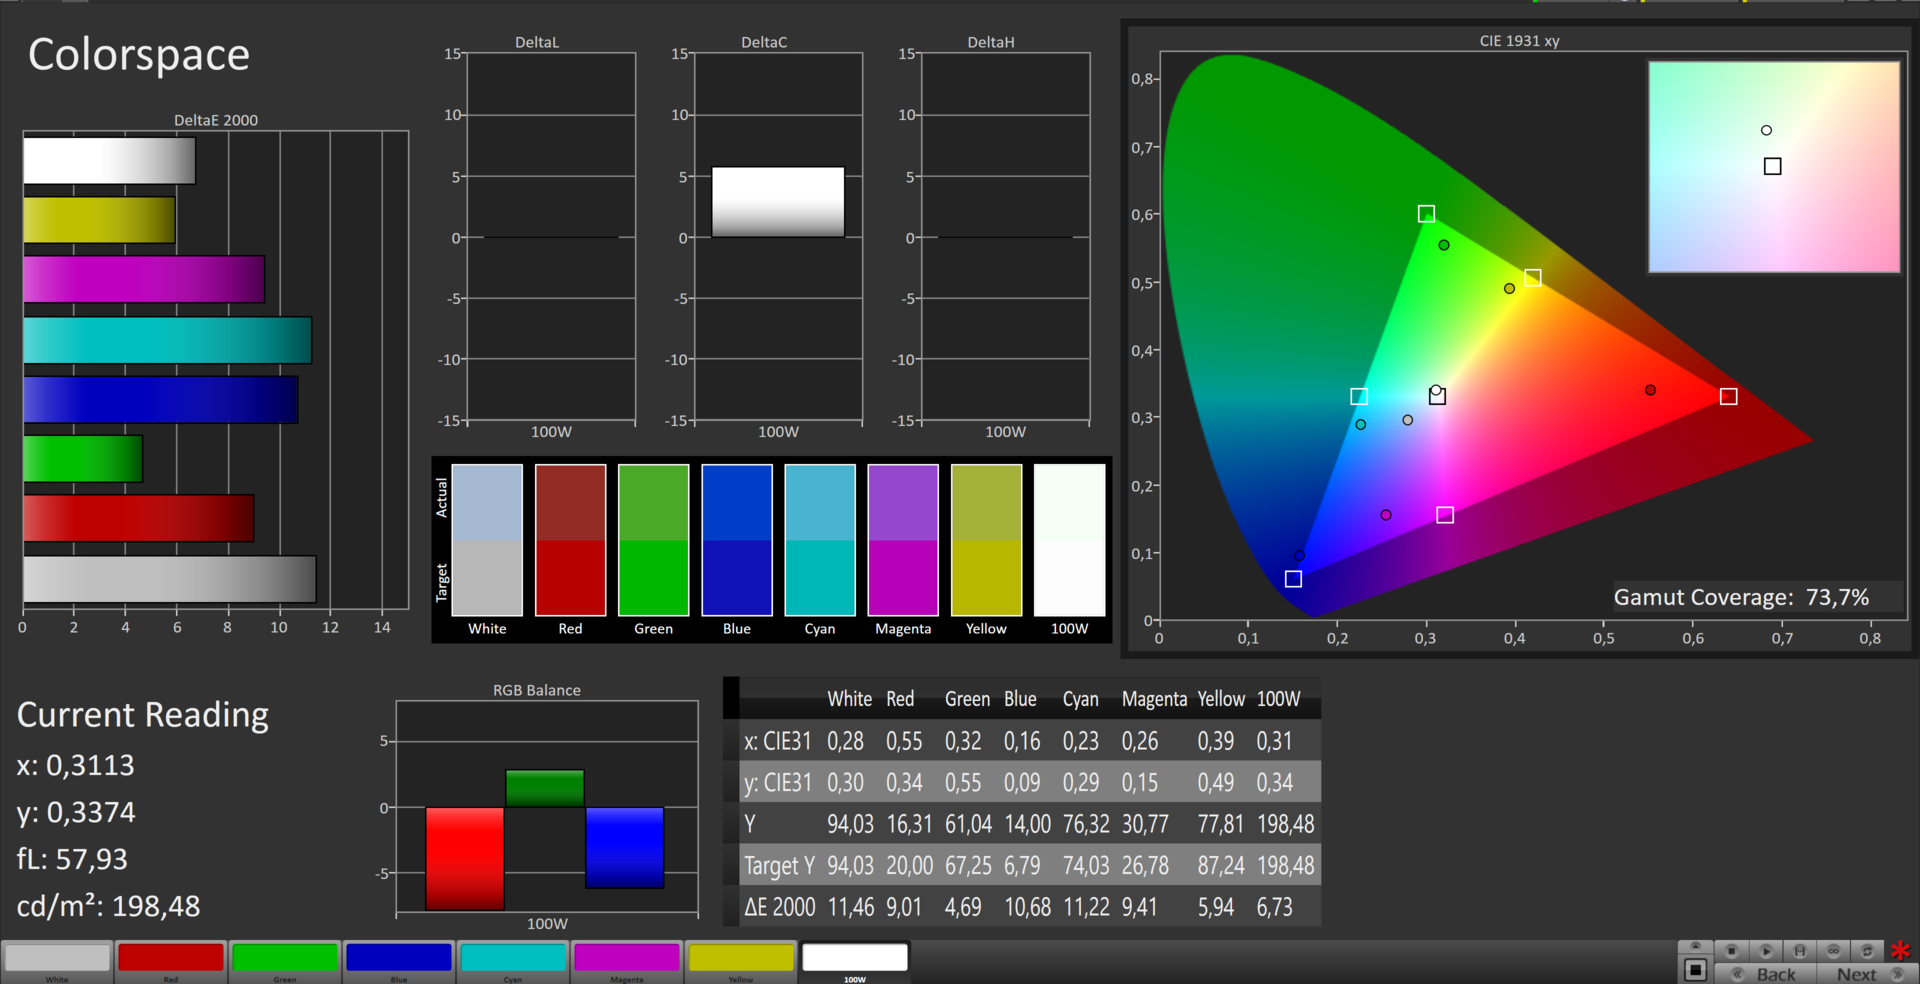
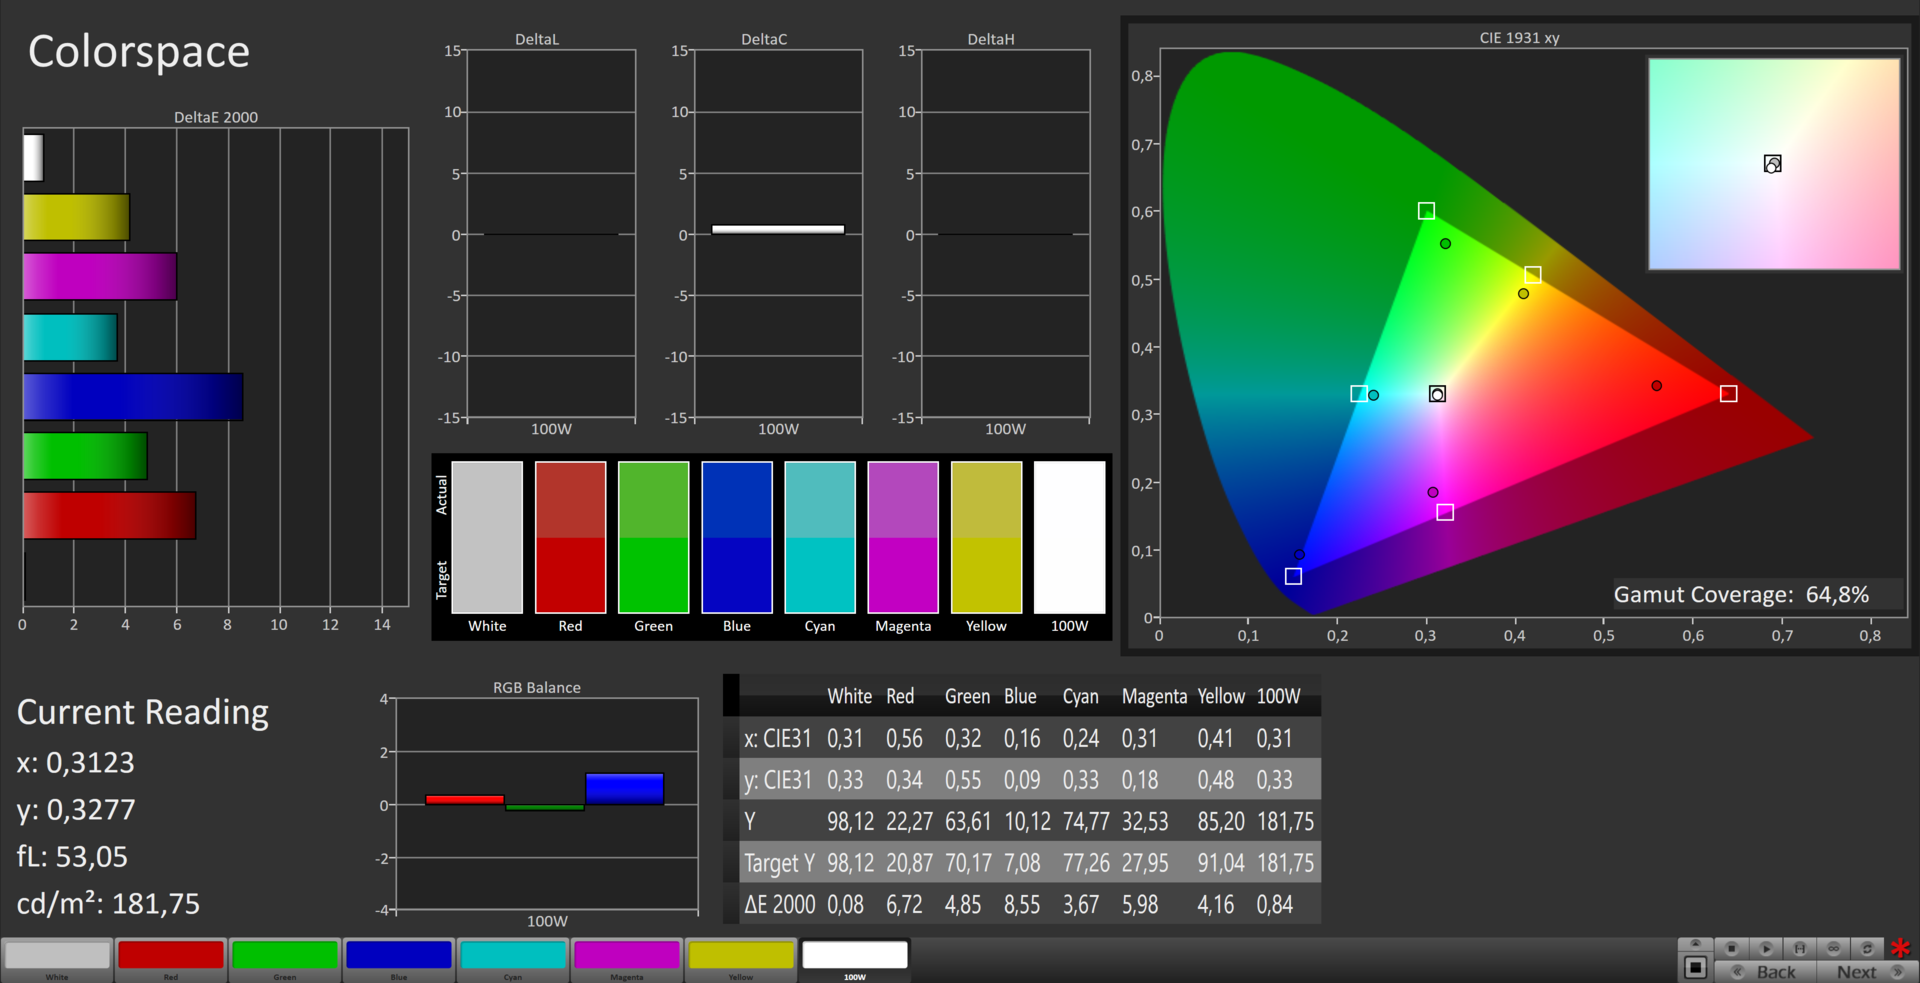
73.7% sRGB (Calman 2D)
62.4% sRGB (Argyll 1.6.3 3D)
39.6% AdobeRGB 1998 (Argyll 1.6.3 3D)
42.86% AdobeRGB 1998 (Argyll 3D)
62.4% sRGB (Argyll 3D)
41.48% Display P3 (Argyll 3D)
Gamma: 2.41
CCT: 10695 K
| Dell Precision 3510 LGD04AF, K96D2_156WHU, , 1366x768, 15.6" | Dell Precision 3510 52452051.2 LG Display LGD049B / 156WF6, Dell P/N: F7HH2, , 1920x1080, 15.6" | Dell Precision 7510 (4K IGZO) Sharp LQ156D1, , 3840x2160, 15.6" | Dell Precision 5510 SHP143E, 7PHPT_LQ156D1, , 3840x2160, 15.6" | Lenovo ThinkPad P50 LQ156D1JW05, , 3840x2160, 15.6" | HP ZBook 15 G3 Samsung SDC5344, , 1920x1080, 15.6" | |
|---|---|---|---|---|---|---|
| Display | 54% | 100% | 102% | 98% | 58% | |
| Display P3 Coverage (%) | 41.48 | 68.9 66% | 86.2 108% | 88.4 113% | 85.8 107% | 66.8 61% |
| sRGB Coverage (%) | 62.4 | 88.9 42% | 99.7 60% | 100 60% | 98.6 58% | 95.5 53% |
| AdobeRGB 1998 Coverage (%) | 42.86 | 65.4 53% | 99 131% | 99.5 132% | 98.2 129% | 69 61% |
| Response Times | 15% | -11% | 26% | -12% | ||
| Response Time Grey 50% / Grey 80% * (ms) | 56 ? | 40.4 ? 28% | 56.4 ? -1% | 39.2 ? 30% | 54 ? 4% | |
| Response Time Black / White * (ms) | 28 ? | 27.6 ? 1% | 34 ? -21% | 22 ? 21% | 35.6 ? -27% | |
| PWM Frequency (Hz) | 198.4 ? | 217 | 198 ? | |||
| Screen | 47% | 57% | 65% | 42% | 40% | |
| Brightness middle (cd/m²) | 199 | 364.6 83% | 279.2 40% | 391 96% | 250 26% | 306 54% |
| Brightness (cd/m²) | 201 | 335 67% | 271 35% | 361 80% | 250 24% | 289 44% |
| Brightness Distribution (%) | 83 | 83 0% | 83 0% | 87 5% | 86 4% | 85 2% |
| Black Level * (cd/m²) | 0.4 | 0.4 -0% | 0.266 33% | 0.4 -0% | 0.31 23% | 0.34 15% |
| Contrast (:1) | 498 | 912 83% | 1050 111% | 978 96% | 806 62% | 900 81% |
| Colorchecker dE 2000 * | 9 | 4.14 54% | 4.85 46% | 4.5 50% | 5.1 43% | |
| Colorchecker dE 2000 max. * | 13.3 | 6.56 51% | 9.3 30% | 9.9 26% | ||
| Greyscale dE 2000 * | 9.6 | 3.26 66% | 4.01 58% | 7.2 25% | 7.4 23% | |
| Gamma | 2.41 91% | 2.19 100% | 2.18 101% | 2.31 95% | 2.37 93% | |
| CCT | 10695 61% | 6375 102% | 7340 89% | 6399 102% | 7263 89% | |
| Color Space (Percent of AdobeRGB 1998) (%) | 39.6 | 85.68 116% | 96 142% | 85 115% | 63 59% | |
| Color Space (Percent of sRGB) (%) | 62.4 | 99.72 60% | 100 60% | 98.6 58% | 95 52% | |
| Total Average (Program / Settings) | 51% /
49% | 57% /
60% | 52% /
62% | 55% /
51% | 29% /
37% |
* ... smaller is better
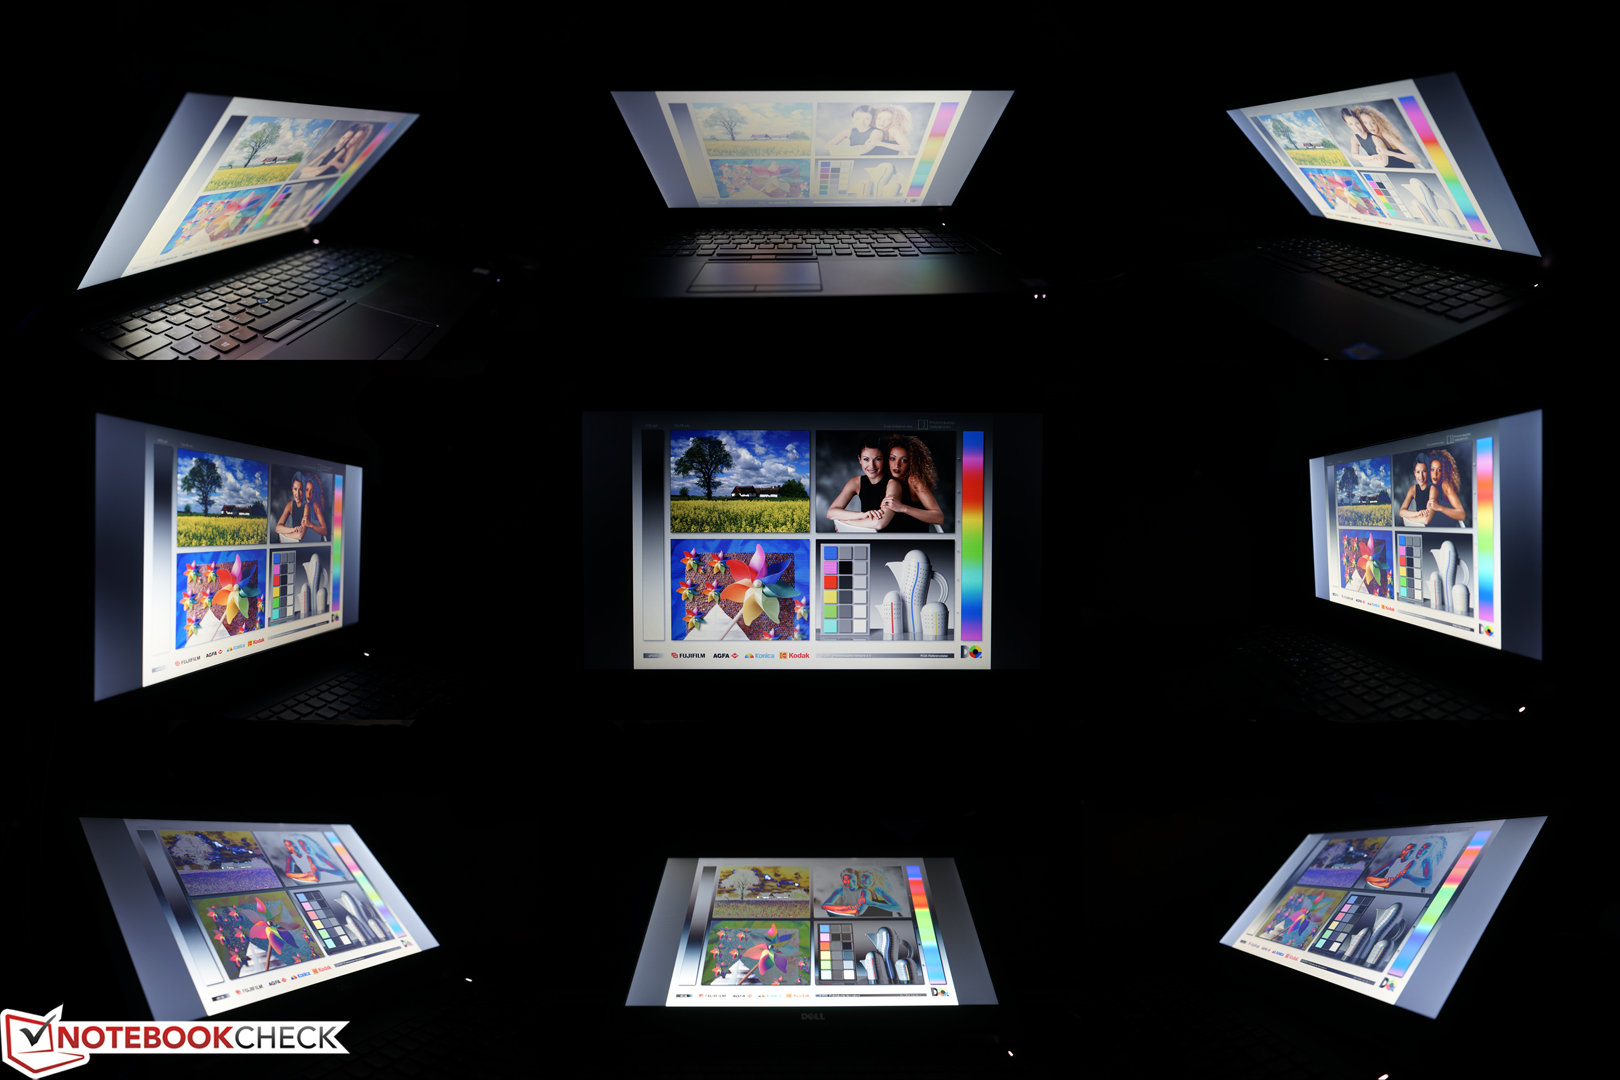
The maximum brightness at the left side of the display is 223 cd/m² and drops to just 185 cd/m² in the upper right corner. These results in an acceptable brightness distribution of 83% and you can only see some clouding on plain pictures. The maximum luminance is steady on battery power and you can even use the notebook outdoors at some spots thanks to the matte surface.
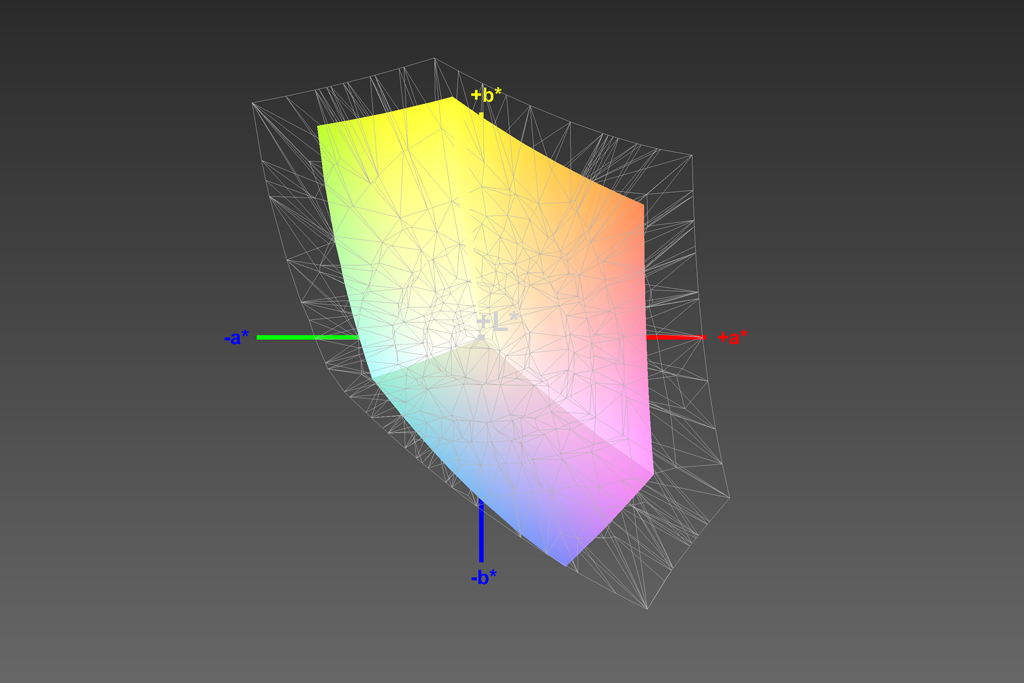
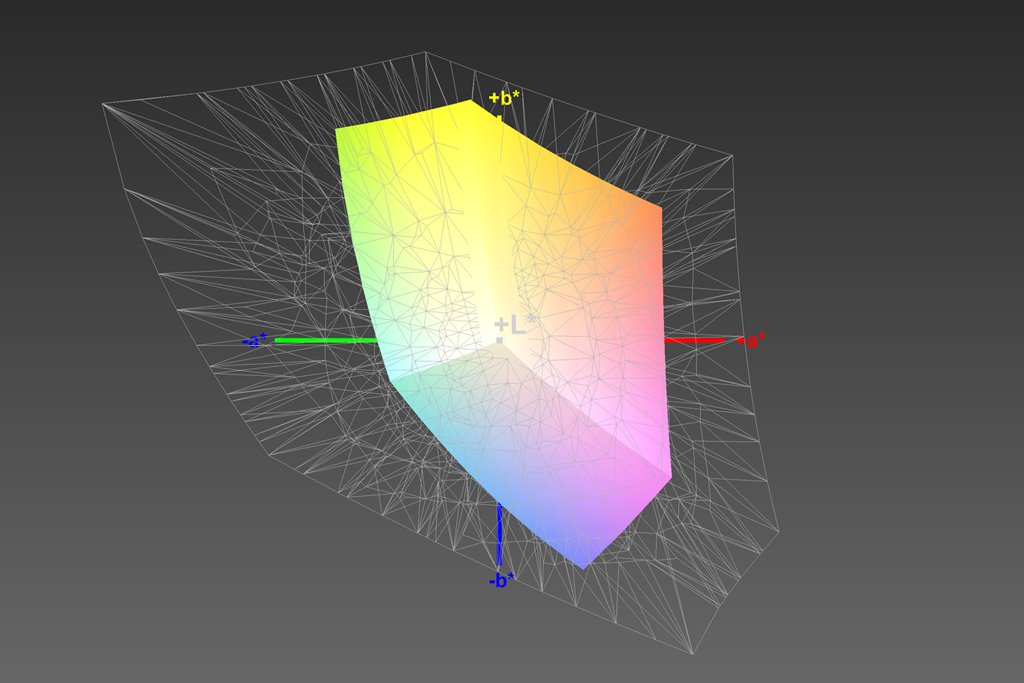
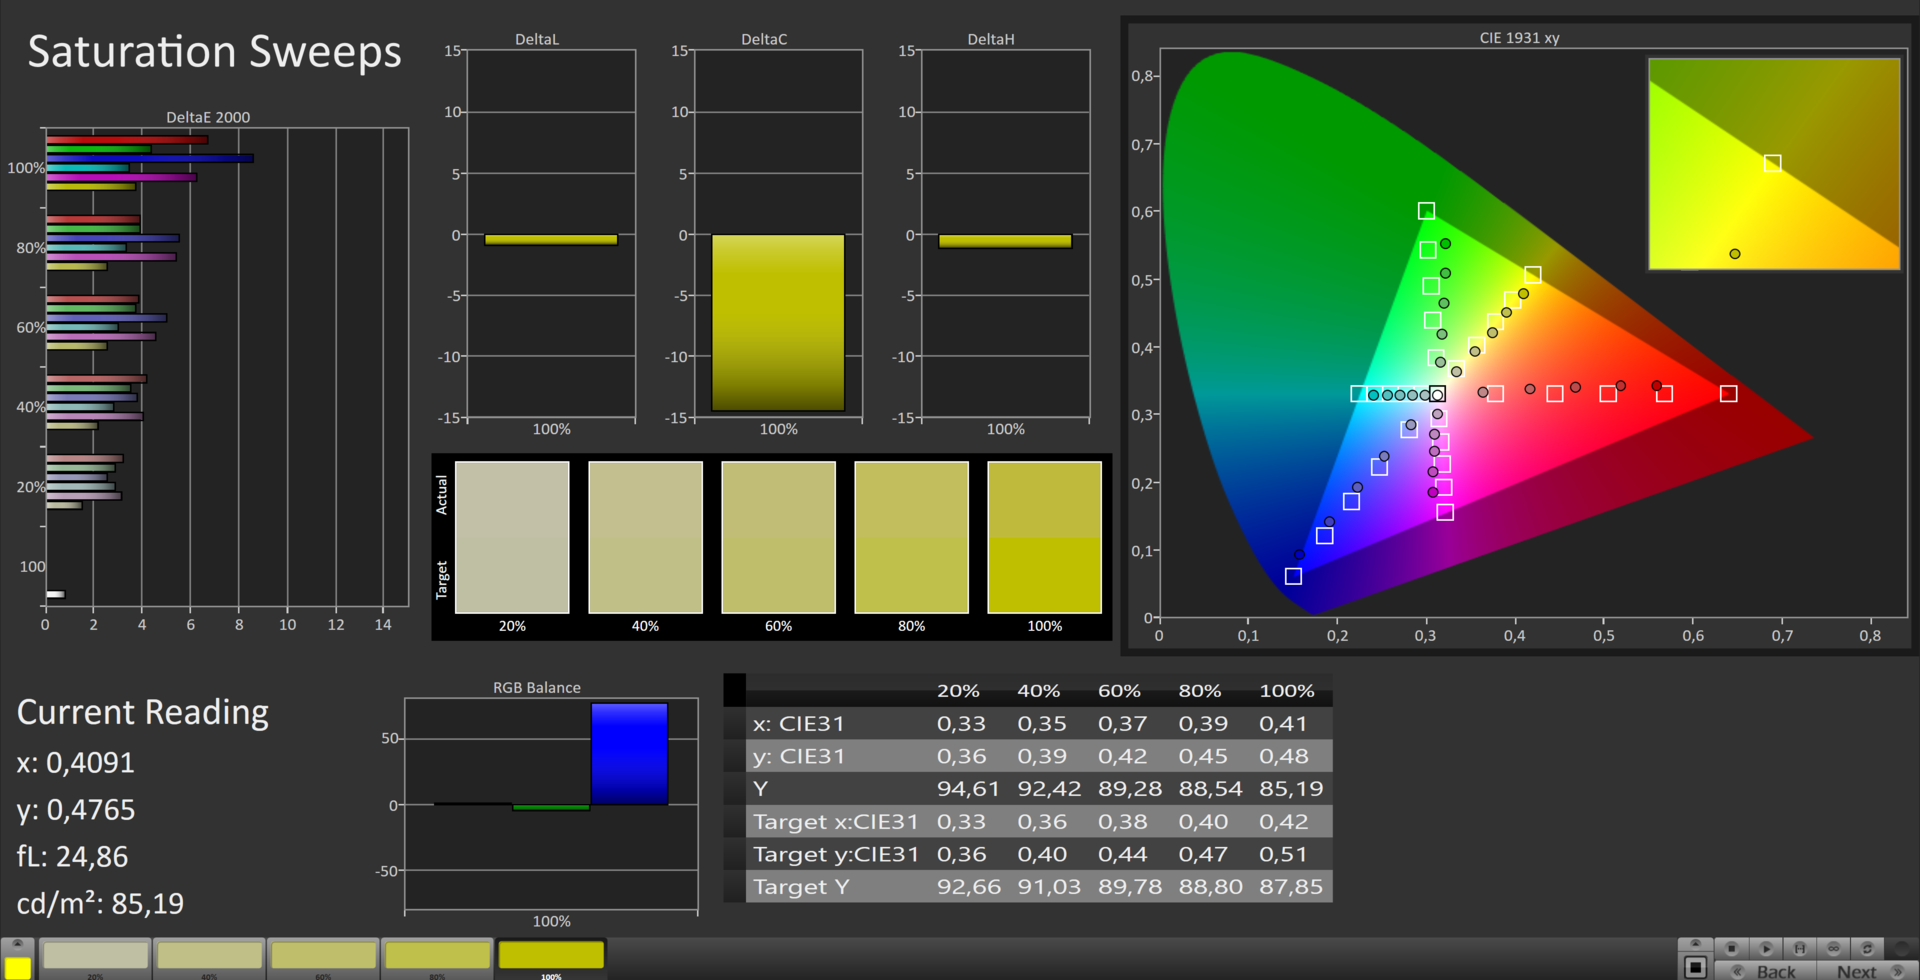
However, working with the screen is not an enjoyable experience since neither the contrast (498:1) nor the color gamut (62% sRGB) can meet today's standards. Depending on the viewing angle, you cannot see slightly different color shades on websites, but they just disappear into one color. The color accuracy is not good, either. While the average deviations in the ColorChecker can be reduced with calibration, there are still high DeltaE 2000 results of up to 8.5 for primary colors such as blue.
Display Response Times
| ↔ Response Time Black to White | ||
|---|---|---|
| 28 ms ... rise ↗ and fall ↘ combined | ↗ 11 ms rise | |
| ↘ 17 ms fall | ||
| The screen shows relatively slow response rates in our tests and may be too slow for gamers. In comparison, all tested devices range from 0.1 (minimum) to 240 (maximum) ms. » 71 % of all devices are better. This means that the measured response time is worse than the average of all tested devices (19.8 ms). | ||
| ↔ Response Time 50% Grey to 80% Grey | ||
| 56 ms ... rise ↗ and fall ↘ combined | ↗ 27 ms rise | |
| ↘ 29 ms fall | ||
| The screen shows slow response rates in our tests and will be unsatisfactory for gamers. In comparison, all tested devices range from 0.165 (minimum) to 636 (maximum) ms. » 93 % of all devices are better. This means that the measured response time is worse than the average of all tested devices (30.9 ms). | ||
Screen Flickering / PWM (Pulse-Width Modulation)
| Screen flickering / PWM not detected | ||
In comparison: 52 % of all tested devices do not use PWM to dim the display. If PWM was detected, an average of 7748 (minimum: 5 - maximum: 343500) Hz was measured. | ||
But even this value only applies to a small angle in front of the screen. Small deviations from the ideal position directly in front of the center will result in picture distortions. Brightness, contrast and colors get worse and can even wash out or invert depending on the display angle.
All things considered, this display is not up to date anymore. You do not even want to have such a panel in a cheap entry-level device nowadays. Dell does offer this panel as an inexpensive entry-level solution, but we do not think the characteristics meet the requirements of the targeted group of professional users.
Performance
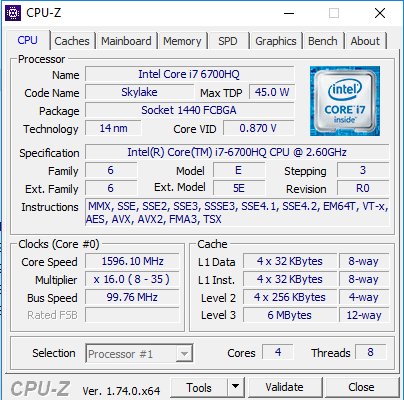
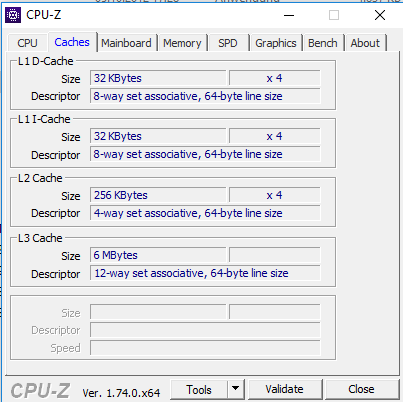
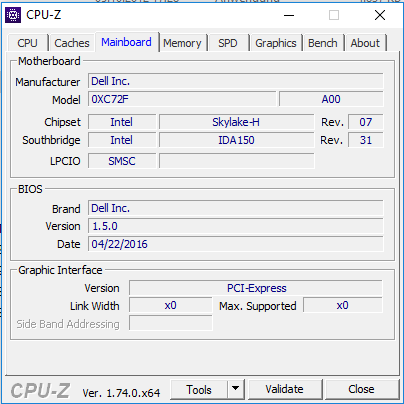
Our review configuration of the Dell Precision 3510 is suitably equipped. A powerful Intel Core i7-6700HQ CPU, 16 GB of RAM and fast M.2 NVMe-SSD storage should be sufficient for many users. We can see a clear distinction between the Dell Precision 3510 and the more powerful Precision 7510 Workstation in terms of GPU. There is actually no choice here; all models come with AMD's FirePro W5130M.
Processor


The Intel Core i7-6700HQ is a powerful quad-core processor, which supports Hyperthreading as well as Turbo Boost and can therefore provide the best performance for different usage scenarios. Single thread applications benefit from the high clocks of up to 3.5 GHz, and multithread software can utilize up to eight cores simultaneously.
Our benchmarks position the processor slightly behind the Intel Xeon E3-1505 CPU, which is also available for the Precision 3510. Performance differences of between 20 and 9% are still moderate. There are also other reasons for such a Xeon processor, such as improved performance under sustained load and the support of ECC-RAM. The latter promises better stability and accuracy in demanding and memory-intensive tasks thanks to improved error correction. Whether the small performance gains of the Xeon CPU can be utilized with the Dell Precision 3510, however, is not clear at this point.
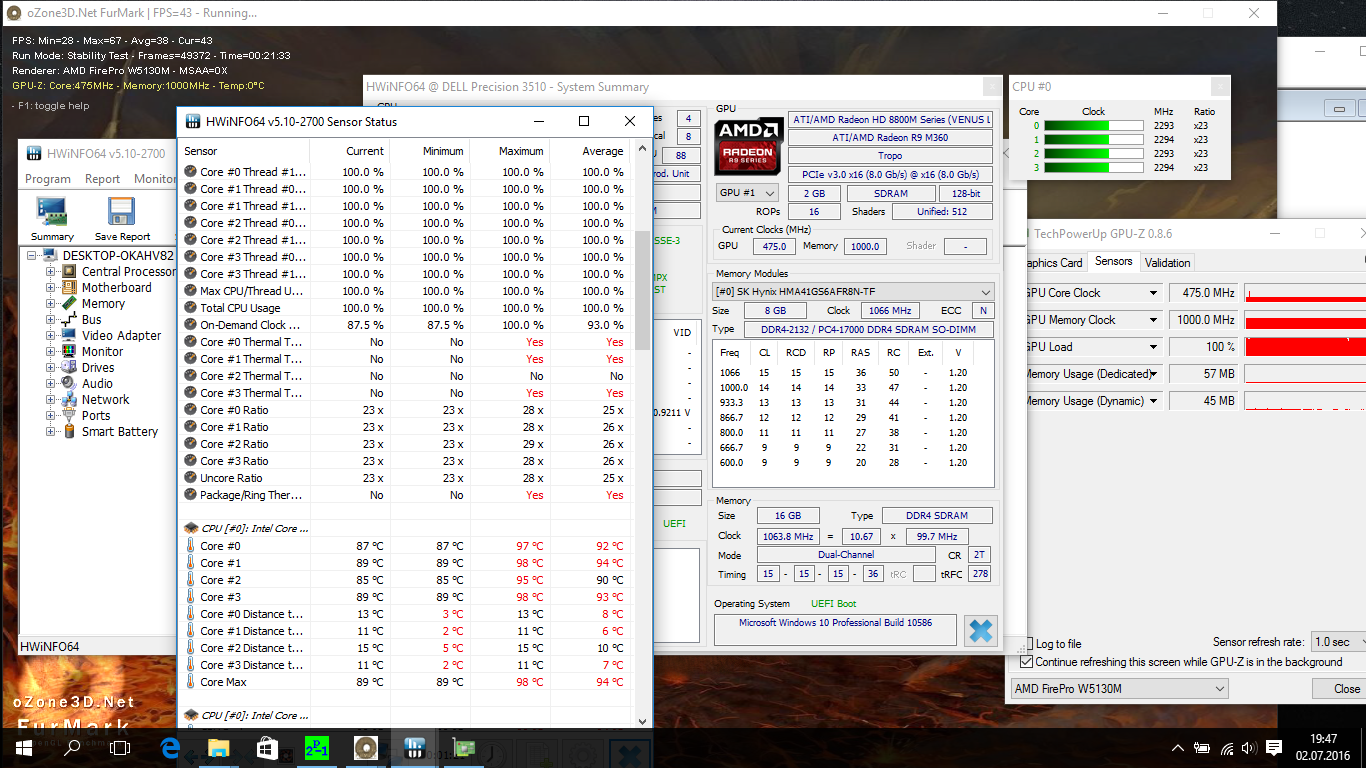
Our stress test shows that the processor clock of the Intel Core i7-6700HQ drops to 2300 MHz after one hour of our stress test, and therefore below the base clock of 2600 MHz. HWiNFO shows core temperatures of up to 99 °C (~210 °F), so it is doubtful whether the Precision offers cooling headroom for a more powerful CPU. The performance of the AMD FirePro W5130M is also reduced in this scenario, because according to GPU-Z the chip runs at only 475 MHz.
System Performance
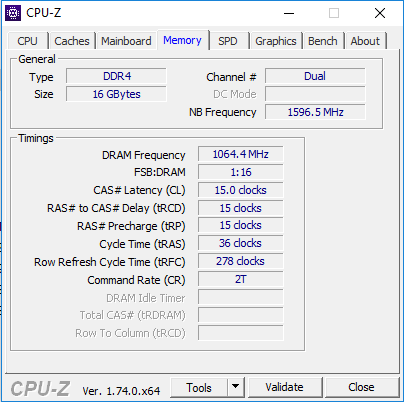
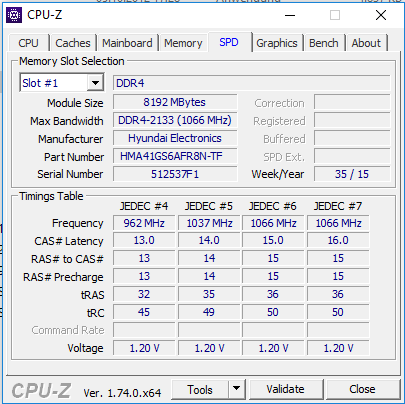
The system performance of the review unit benefits from the balanced components. There are no bottlenecks in terms of the processor and graphics card. 16 GB of DDR4-RAM is provided by two memory modules in a dual-channel configuration.
Particularly fast response times are ensured by the fast solid-state drive. However, the capacity could have been larger since you cannot integrate a secondary drive. Overall, the benchmark scores are high enough to beat the established rivals. 5258 points in PCMark 8 Work is a very good result.
| PCMark 8 | |
| Home Score Accelerated v2 | |
| Dell Precision 3510 | |
| Lenovo ThinkPad P50 | |
| Dell Precision 7510 (4K IGZO) | |
| HP ZBook 15u G3 | |
| HP ZBook 15 G3 | |
| Dell Precision 5510 | |
| Work Score Accelerated v2 | |
| Dell Precision 3510 | |
| HP ZBook 15 G3 | |
| Dell Precision 5510 | |
| HP ZBook 15u G3 | |
| Lenovo ThinkPad P50 | |
| Dell Precision 7510 (4K IGZO) | |
| PCMark 8 Home Score Accelerated v2 | 4405 points | |
| PCMark 8 Creative Score Accelerated v2 | 5244 points | |
| PCMark 8 Work Score Accelerated v2 | 5258 points | |
Help | ||
Storage Devices
Besides the fixed graphics card, the storage equipment is another important point where the Dell Precision 3510 differs from other alternatives. Even though there is a slot for an M.2 drive and space for a 2.5-inch drive, you cannot use both options at the same time. Because of the limited space inside the chassis, the two areas are overlapping, so you have to decide between one or the other. If you want to increase the storage capacity at any point, you either have to replace the existing drive or switch to external solutions.
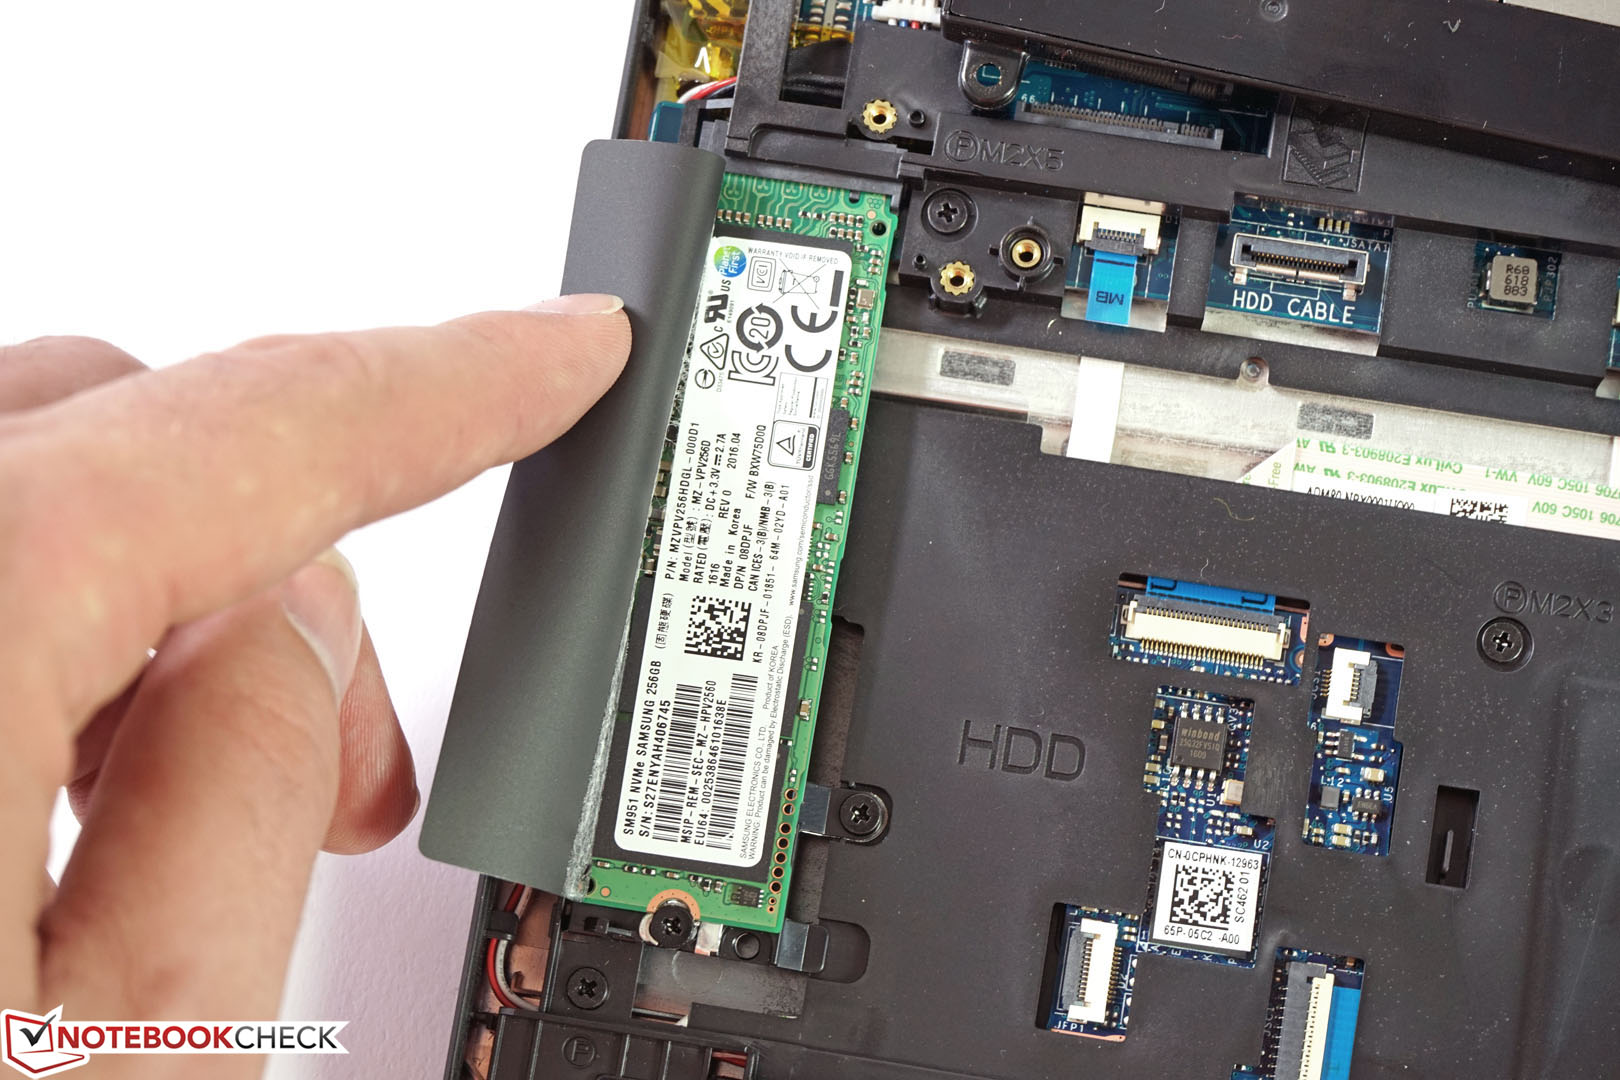
Our review unit is equipped with the Samsung SM951, which supports the NVMe protocol and is attached via PCIe. Transfer rates of almost 1900 MB/s and short response time ensure an excellent subjective performance impression with quick application launches, and fast moving of folders or copying of files.
More comparisons are available in our comprehensive HDD/SSD benchmark list.
| Dell Precision 3510 Samsung SM951 MZVPV256HDGL m.2 PCI-e | Dell Precision 5510 SK hynix SC920 512 GB | Dell Precision 7510 (4K IGZO) Samsung SSD SM951a 512GB M.2 PCIe 3.0 x4 NVMe (MZVKV512) | Lenovo ThinkPad P50 Samsung SM951 MZVPV256HDGL m.2 PCI-e | HP ZBook 15u G3 Samsung SM951 MZVPV256HDGL m.2 PCI-e | HP ZBook 15 G3 Samsung SM951 MZVPV512HDGL m.2 PCI-e | |
|---|---|---|---|---|---|---|
| AS SSD | -58% | 18% | 16% | 13% | 13% | |
| Seq Write (MB/s) | 1093 | 389 -64% | 1484 36% | 1252 15% | 1106 1% | 1181 8% |
| Seq Read (MB/s) | 1897 | 474 -75% | 1953 3% | 1930 2% | 1859 -2% | 1841 -3% |
| 4K-64 Write (MB/s) | 294.1 | 257 -13% | 375.7 28% | 340.7 16% | 335.6 14% | 257 -13% |
| 4K-64 Read (MB/s) | 1114 | 327 -71% | 1067 -4% | 1077 -3% | 1781 60% | 1066 -4% |
| 4K Write (MB/s) | 121.7 | 82.2 -32% | 145.1 19% | 212.2 74% | 126.2 4% | 173.1 42% |
| 4K Read (MB/s) | 46.76 | 17.95 -62% | 49.22 5% | 54.2 16% | 48.7 4% | 52.5 12% |
| Access Time Read * (ms) | 0.059 | 0.111 -88% | 0.036 39% | 0.062 -5% | 0.053 10% | 0.031 47% |
* ... smaller is better

GPU Performance
In addition to the integrated Intel HD Graphics 530 processor, all configurations of the mobile workstation are equipped with a dedicated professional graphics card. These chips clearly differ from the consumer Radeon GPUs by special BIOS versions, certified drivers and optimized hardware.
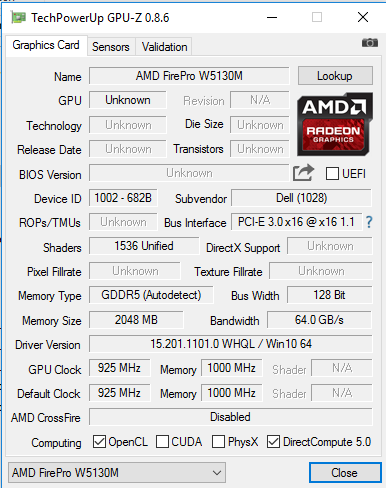
AMD's FirePro W5130M is a mainstream professional GPU and primarily competes with the Quadro M1000M from Nvidia. According to the specification sheet, the GPU can reach a core clock of up to 925 MHz and has 2 GB of GDDR5 video memory. The latter is attached via 128-bit interface and runs at up to 1000 MHz.
We check the performance of professional GPUs with the benchmarks SPECviewperf 11 and SPECviewperf 12. They mainly cover the CAD, CAM, geology and medical MRI application ranges. Most sequences use OpenGL optimizations that benefit from the special professional drivers. Professional GPUs can usually clearly beat their consumer counterparts (Radeon and GeForce) in these scenarios. We also included the Nvidia GeForce GTX 960M in the diagrams for a better comparison.
Within the professional group, the results show that the AMD FirePro W5130M in the Dell Precision 3510 is clearly beaten by the Nvidia Quadro M1000M in all test sequences. Nvidia took a big step with the switch to the Maxwell architecture and increased the performance, but the AMD FirePro in the Dell Precision 3510 often cannot utilize its full potential, either.
The clocks we see under load are often far from the maximum at 925 MHz. The clock will drop to 625 within a few seconds during our stress test, before it is further reduced to just 475 MHz. Even this precaution only keeps the temperatures in check for about one hour before the CPU clock will also drop below its base clock of 2600 MHz.
It seems Dell has implemented some safety limits for the quite slim Latitude chassis to keep the thermals and therefore also the noise development under control. The performance is still sufficient to beat the AMD FirePro W4190M in the HP ZBook 15u G3, but Nvidia's Quadro M1000M is often twice as fast in SPECviewperf 12.
| SPECviewperf 11 | |
| 1920x1080 Siemens NX | |
| Lenovo ThinkPad P50 | |
| HP ZBook 15 G3 | |
| Dell Precision 5510 | |
| Dell Precision 3510 | |
| Asus GL552VW-DK725T | |
| 1920x1080 Tcvis | |
| HP ZBook 15 G3 | |
| Lenovo ThinkPad P50 | |
| Dell Precision 5510 | |
| Dell Precision 3510 | |
| Asus GL552VW-DK725T | |
| 1920x1080 SolidWorks | |
| Lenovo ThinkPad P50 | |
| Dell Precision 5510 | |
| HP ZBook 15 G3 | |
| Dell Precision 3510 | |
| Asus GL552VW-DK725T | |
| 1920x1080 Pro/ENGINEER | |
| HP ZBook 15 G3 | |
| Lenovo ThinkPad P50 | |
| Dell Precision 5510 | |
| Dell Precision 3510 | |
| Asus GL552VW-DK725T | |
| 1920x1080 Maya | |
| HP ZBook 15 G3 | |
| Lenovo ThinkPad P50 | |
| Dell Precision 5510 | |
| Dell Precision 3510 | |
| Asus GL552VW-DK725T | |
| 1920x1080 Lightwave | |
| Lenovo ThinkPad P50 | |
| Dell Precision 5510 | |
| HP ZBook 15 G3 | |
| Dell Precision 3510 | |
| Asus GL552VW-DK725T | |
| 1920x1080 Ensight | |
| HP ZBook 15 G3 | |
| Lenovo ThinkPad P50 | |
| Dell Precision 5510 | |
| Asus GL552VW-DK725T | |
| Dell Precision 3510 | |
| 1920x1080 Catia | |
| Lenovo ThinkPad P50 | |
| Dell Precision 5510 | |
| HP ZBook 15 G3 | |
| Asus GL552VW-DK725T | |
| Dell Precision 3510 | |
Besides OpenGL-optimized applications, the main usage scenario also includes DirectX software, where the picture is similar to the professional tests. The performance clearly falls behind the competition from Nvidia. Depending on the test sequence, we determined between 15 to 60% less performance. 3DMark Cloud Gate, for example, determines only 14502 points, while Nvidia's Quadro M1000M in the slim Dell Precision 5510 manages 23777 points.
| 3DMark 11 - 1280x720 Performance GPU | |
| Lenovo ThinkPad P50 | |
| Dell Precision 7510 (4K IGZO) | |
| HP ZBook 15 G3 | |
| Dell Precision 5510 | |
| HP ZBook 15u G3 | |
| 3DMark | |
| 1280x720 Cloud Gate Standard Graphics | |
| HP ZBook 15 G3 | |
| Dell Precision 7510 (4K IGZO) | |
| Lenovo ThinkPad P50 | |
| Dell Precision 5510 | |
| Dell Precision 3510 | |
| HP ZBook 15u G3 | |
| 1920x1080 Fire Strike Graphics | |
| Dell Precision 7510 (4K IGZO) | |
| HP ZBook 15 G3 | |
| Lenovo ThinkPad P50 | |
| Dell Precision 5510 | |
| Dell Precision 3510 | |
| HP ZBook 15u G3 | |
| 3DMark 06 Standard Score | 15680 points | |
| 3DMark Cloud Gate Standard Score | 11740 points | |
| 3DMark Fire Strike Score | 2001 points | |
Help | ||
Gaming Performance
Even though the AMD FirePro W5130M is definitely not a gaming GPU, the performance is actually sufficient for some occasional gaming between meetings. The screen of our test model only has 1366x768 pixels, so it might be possible to increase the settings slightly. Otherwise, the performance of the professional GPU is sufficient for medium and in some cases high quality settings. We performed the Full HD tests with an external monitor.
More benchmark results for the AMD FirePro W5130M and Nvidia Quadro M1000M are available in our gaming benchmark list.
| low | med. | high | ultra | |
|---|---|---|---|---|
| Tomb Raider (2013) | 158 | 75 | 58 | 25 |
| BioShock Infinite (2013) | 137 | 66 | 57 | 22 |
| Total War: Rome II (2013) | 106 | 80 | 66 | 23 |
| Middle-earth: Shadow of Mordor (2014) | 66 | 41 | 23 | 21 |
| Dirt Rally (2015) | 216 | 71 | 47 | 19 |
| The Witcher 3 (2015) | 31 | 21 | 10 |
Emissions
System Noise
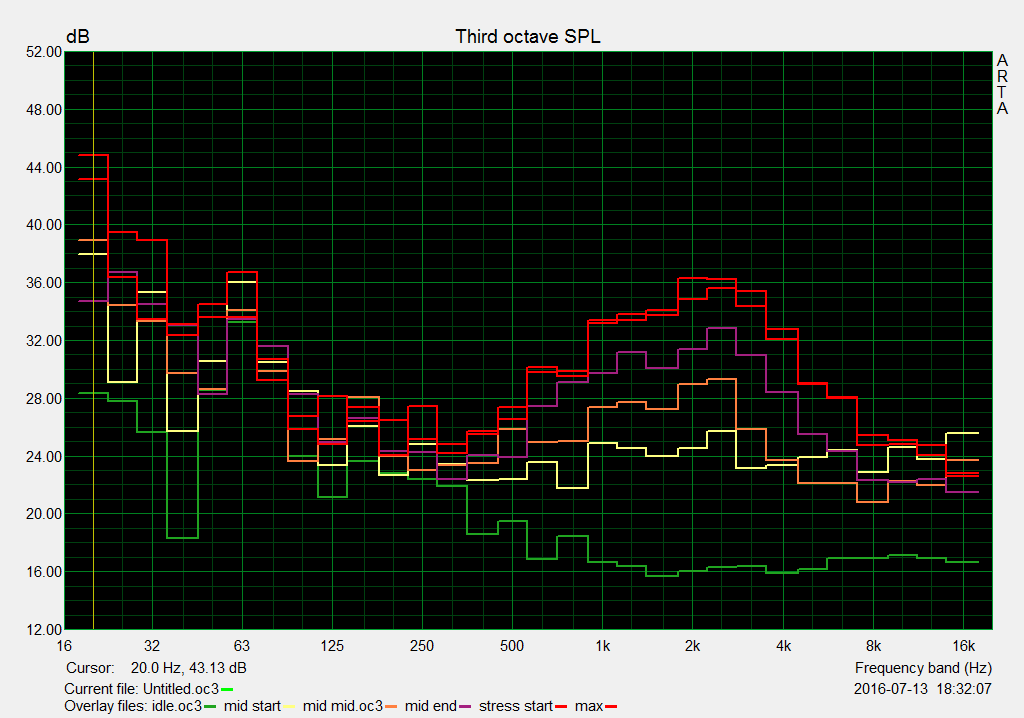
The Dell Precision 3510 is a silent or very quiet device in many scenarios. Medium workloads will result in 38.1 dB(A), which is clearly audible. A positive aspect is that this noise level is only reached after a few minutes, and short load periods usually do not trigger the fan at all. However, the RPM level of the fan is quickly reduced after the load period, so the fan does not bother the user unnecessarily.
We checked the maximum noise level under full load for the CPU and GPU and measured up to 44.4 dB(A), which can already be annoying for prolonged periods. As with other load scenarios, the noise characteristics are inconspicuous and we could not determine high-pitched noises or pulsating.
Noise level
| Idle |
| 30 / 30 / 30 dB(A) |
| Load |
| 38.1 / 44.4 dB(A) |
 | ||
30 dB silent 40 dB(A) audible 50 dB(A) loud |
||
min: | ||
Temperature
The bottom of the device stays quite cool under light workloads, where we can only measure up to 31.5 °C (~89 °F) in the center. The slim chassis can reach its limits at some spots under maximum load, because the maximum temperature will be up to 59.4 °C (~139 °F) at the bottom. We even measured 66.9 °C (~152 °F) directly at the fan exhaust. Besides the indicated CPU temperatures by HWiNFO, this is another indicator for reaching the thermal limits of the case and the cooling system. There does not seem to be any headroom for more powerful components.
(-) The maximum temperature on the upper side is 54.6 °C / 130 F, compared to the average of 38.2 °C / 101 F, ranging from 22.2 to 69.8 °C for the class Workstation.
(-) The bottom heats up to a maximum of 59.4 °C / 139 F, compared to the average of 41.1 °C / 106 F
(+) In idle usage, the average temperature for the upper side is 28 °C / 82 F, compared to the device average of 32 °C / 90 F.
(+) The palmrests and touchpad are cooler than skin temperature with a maximum of 31.5 °C / 88.7 F and are therefore cool to the touch.
(-) The average temperature of the palmrest area of similar devices was 27.8 °C / 82 F (-3.7 °C / -6.7 F).
Speakers
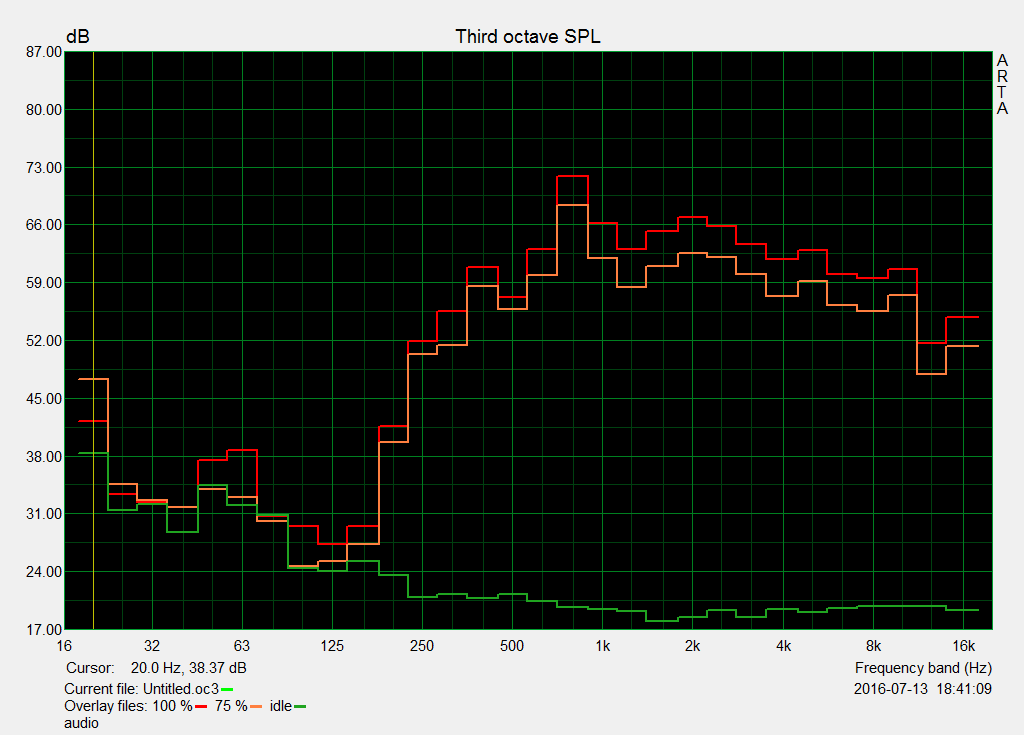
Dell has equipped the Precision 3510 with speakers that are located at the front. There is a clear emphasis on the high tones, while the medium tones and bass are hardly audible. The maximum volume is undistorted at 76 dB(A) and should be sufficient for small presentations. The 3.5 mm stereo jack combines the headphones output and the microphone input. Older headsets with separate connectors will require an adapter. External sound systems can be attached via USB or Bluetooth, for example.
Energy Management
Power Consumption
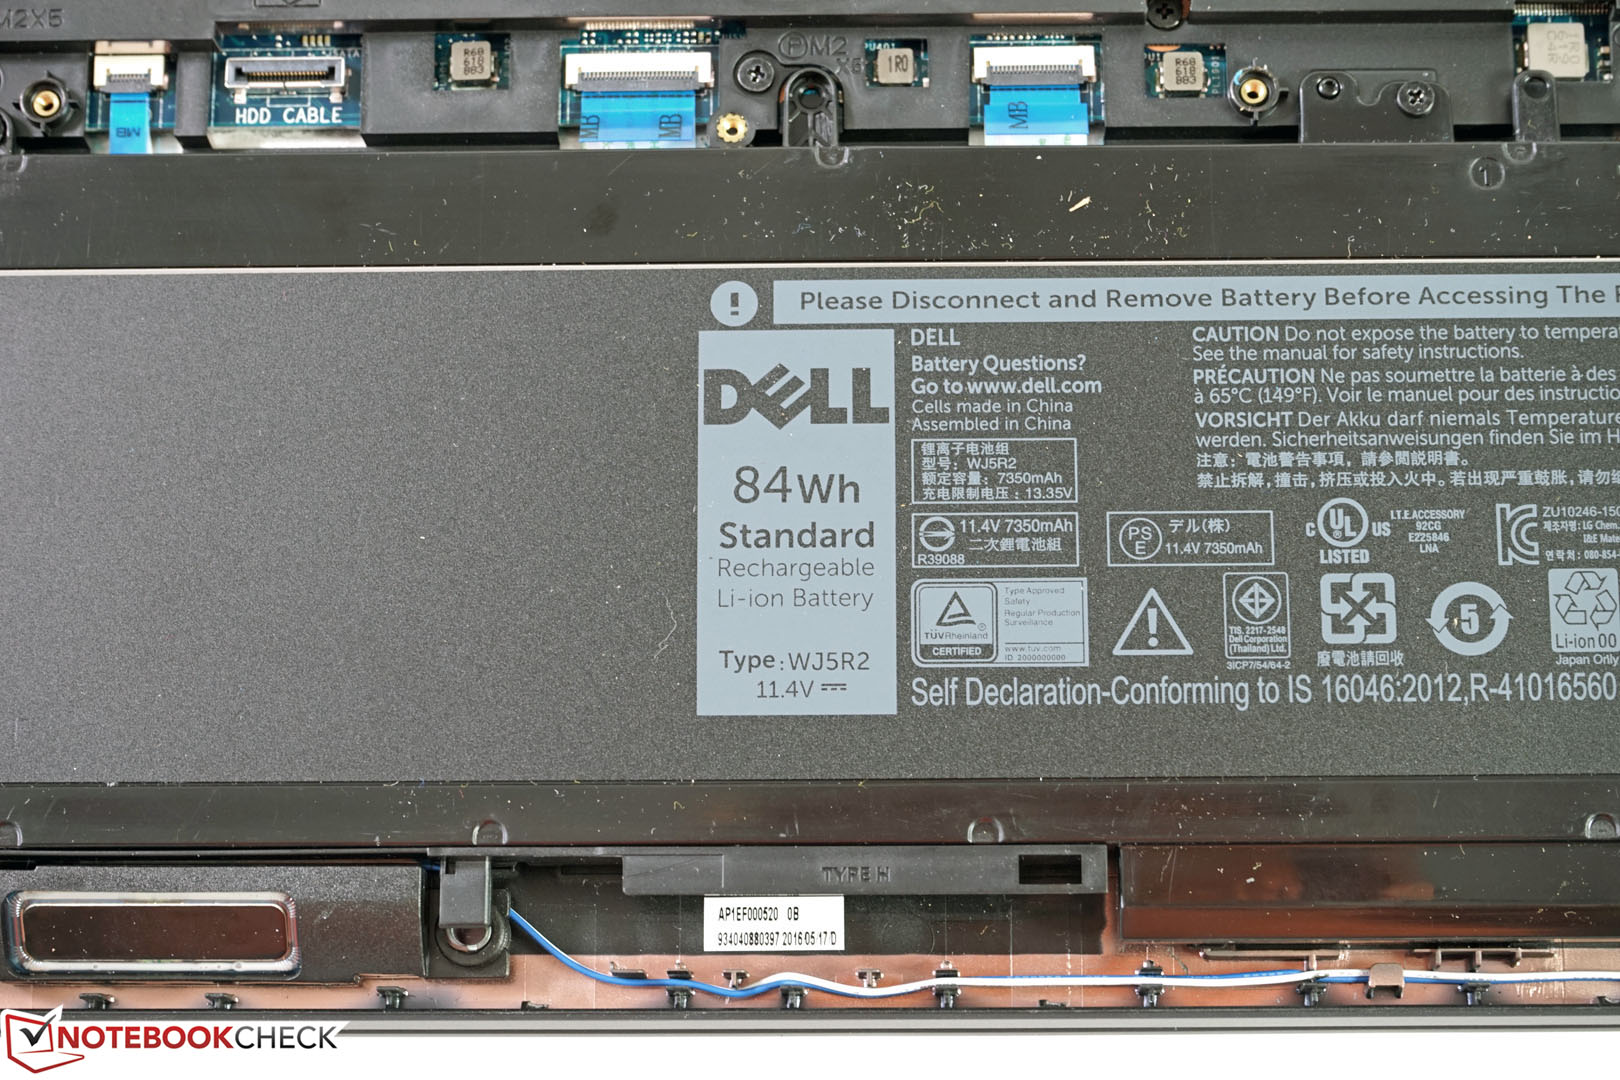
Our power measurements for the Dell Precision 3510 test model are between 4.2 and 92.2 watts. The minimum consumption, even drops to just 2.5 watts when we deactivate the display. The device is still pretty frugal in more practical scenarios (wireless on, luminance 150 nits, balanced power profile) at 8 watts. These figures suggest good battery runtimes in combination with the big 84-Wh battery. Dell also offers a smaller 62-Wh version, which is necessary to implement a 2.5-inch drive instead of the M.2-SSD.
| Off / Standby | |
| Idle | |
| Load |
|
Key:
min: | |
| Dell Precision 3510 6700HQ, FirePro W5130M, Samsung SM951 MZVPV256HDGL m.2 PCI-e, TN LED, 1366x768, 15.6" | Dell Precision 5510 E3-1505M v5, Quadro M1000M, SK hynix SC920 512 GB, IGZO LED, 3840x2160, 15.6" | Dell Precision 7510 (4K IGZO) E3-1535M v5, Quadro M2000M, Samsung SSD SM951a 512GB M.2 PCIe 3.0 x4 NVMe (MZVKV512), IGZO IPS, 3840x2160, 15.6" | Lenovo ThinkPad P50 E3-1505M v5, Quadro M2000M, Samsung SM951 MZVPV256HDGL m.2 PCI-e, IPS, 3840x2160, 15.6" | HP ZBook 15 G3 E3-1505M v5, Quadro M2000M, Samsung SM951 MZVPV512HDGL m.2 PCI-e, UWVA-IPS, 1920x1080, 15.6" | |
|---|---|---|---|---|---|
| Power Consumption | -89% | -247% | -102% | -52% | |
| Idle Minimum * (Watt) | 4.2 | 8.6 -105% | 23.9 -469% | 10.2 -143% | 5.7 -36% |
| Idle Average * (Watt) | 6.5 | 16.2 -149% | 28.9 -345% | 17.8 -174% | 12.2 -88% |
| Idle Maximum * (Watt) | 7.1 | 16.7 -135% | 30 -323% | 18.3 -158% | 12.6 -77% |
| Load Average * (Watt) | 74.6 | 82.6 -11% | 95.2 -28% | 76.9 -3% | 83.1 -11% |
| Load Maximum * (Watt) | 92.2 | 131.8 -43% | 157.1 -70% | 123.5 -34% | 138.2 -50% |
* ... smaller is better
Battery Runtime
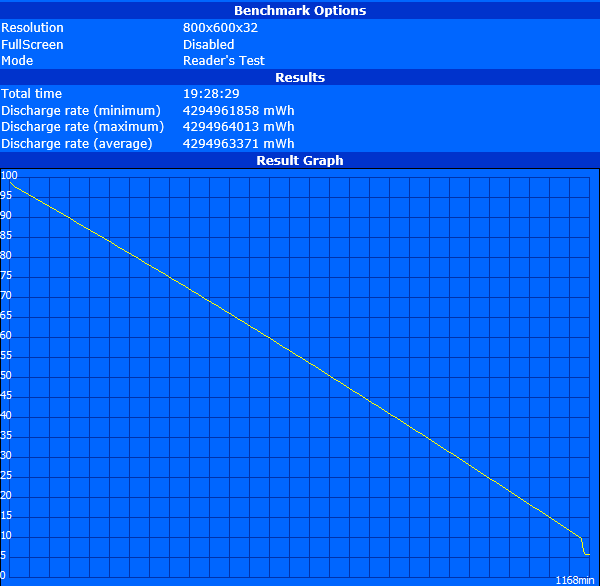
The determined battery runtimes are almost phenomenal for a mobile workstation. Besides well-balanced and frugal components, which are also throttled slightly under load, the large battery in particular has a positive effect on the runtimes.
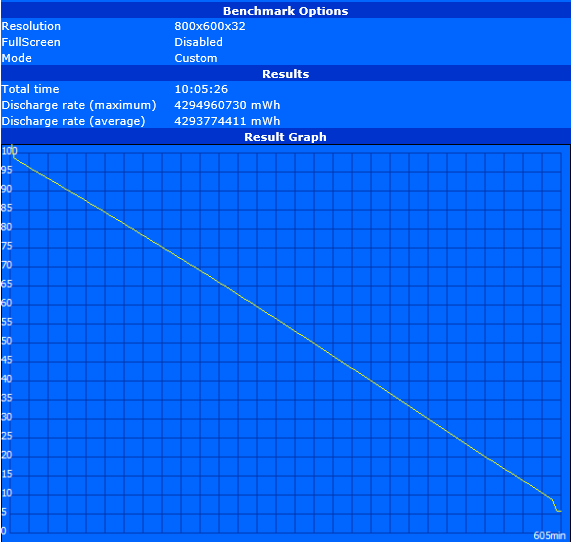
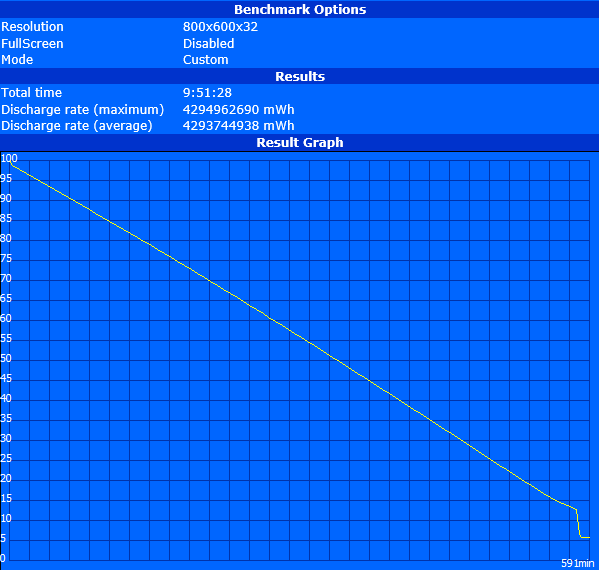
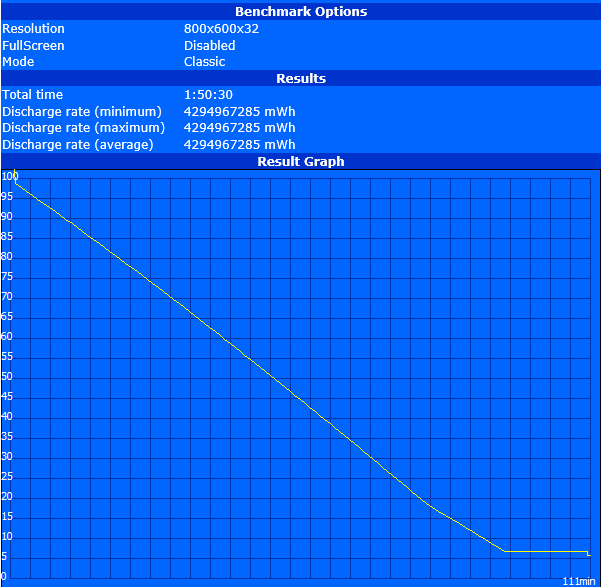
We can measure runtimes between 19 hours (reading mode at minimum luminance and wireless turned off) and almost 2 hours (Battery Eater Classic Test, maximum luminance, wireless on, High-Performance power profile). The usual settings (150 nits, balanced profile) will result in practical runtimes of about 9 to 10 hours.
Charging the battery up to 90% is pretty fast at 1:39 hours, but the last 10% need another 45 minutes.
| Dell Precision 3510 6700HQ, FirePro W5130M, 84 Wh | Dell Precision 5510 E3-1505M v5, Quadro M1000M, 56 Wh | Dell Precision 7510 (4K IGZO) E3-1535M v5, Quadro M2000M, 91 Wh | Lenovo ThinkPad P50 E3-1505M v5, Quadro M2000M, 90 Wh | HP ZBook 15 G3 E3-1505M v5, Quadro M2000M, 90 Wh | HP ZBook 15u G3 6600U, FirePro W4190M, 90 Wh | |
|---|---|---|---|---|---|---|
| Battery runtime | -47% | -58% | -42% | -24% | -19% | |
| Reader / Idle (h) | 19.5 | 7.1 -64% | 4.5 -77% | 9 -54% | 13.7 -30% | 12.6 -35% |
| H.264 (h) | 10.1 | 3.3 -67% | 5.5 -46% | 7.5 -26% | ||
| WiFi v1.3 (h) | 9.9 | 4.8 -52% | 4 -60% | 4.8 -52% | 6.4 -35% | 5.2 -47% |
| Load (h) | 1.9 | 1.8 -5% | 1.2 -37% | 1.6 -16% | 1.8 -5% | 2.4 26% |
| WiFi (h) | 5 |
Pros
Cons
Verdict
Dell's Precision 3510 is a professional device with a clear focus on mobility. Thanks to its slim build, long battery runtimes and a sturdy chassis, it is a really interesting option for field staff. Other advantages of this mobile workstation are the convenient port selection as well as the available warranty and support options.
The price of the series is also appealing and enables an inexpensive entry into the world of mobile workstations.
However, you will have to make some compromises in terms of the decisive core area, the performance drops noticeably under sustained workloads and the emissions will reach inconvenient levels in these scenarios. Another less than ideal point is the limited upgradeability and the CAD performance in general. Some rivals simply offer more.
While you might still be able to live with these aspects depending on the targeted usage scenario, the display of our review unit will not be a popular choice amongst the users. Considering the professional orientation of the device, none of the display characteristics (resolution, luminance, contrast, color gamut, brightness distribution, viewing angle stability) meet the requirements of the targeted user group.
Fortunately, Dell offers other display versions in its online shop, so this problem can be avoided completely and the device would leave a much better impression.
Dell Precision 3510
- 07/17/2016 v5.1 (old)
Tobias Winkler
Price comparison
