Lenovo ThinkPad P50 Workstation (Xeon, 4K) Review
For the original German review, see here.
The new workstation models from Lenovo's ThinkPad-P-series could already prove themselves in our reviews and left a very good impression, but the ThinkPad P50 still had to fight with some quirks. This included the processor Turbo utilization bugs and the comparatively bad Full HD screen, for example, which could not really meet the high expectations considering the high price.
Our review update today takes a look at the ThinkPad P50 20EN0008GE, which is currently the most expensive pre-configured model available at German retailers. Some shops already offer the device for 2850 Euros (~$3151; campus version: 2500 Euros/~$2764). On the other hand, you get a mobile Xeon processor, a Quadro GPU from Nvidia as well as a matte 4K panel, which is supposed to have a wider gamut compared to the FHD model in particular. Lenovo is not very generous in terms of memory, because although we do get a PCIe-SSD, it comes with a capacity of only 256 GB. 8 GB RAM is not a lot for such a workstation, either, but it is at least ECC-RAM.
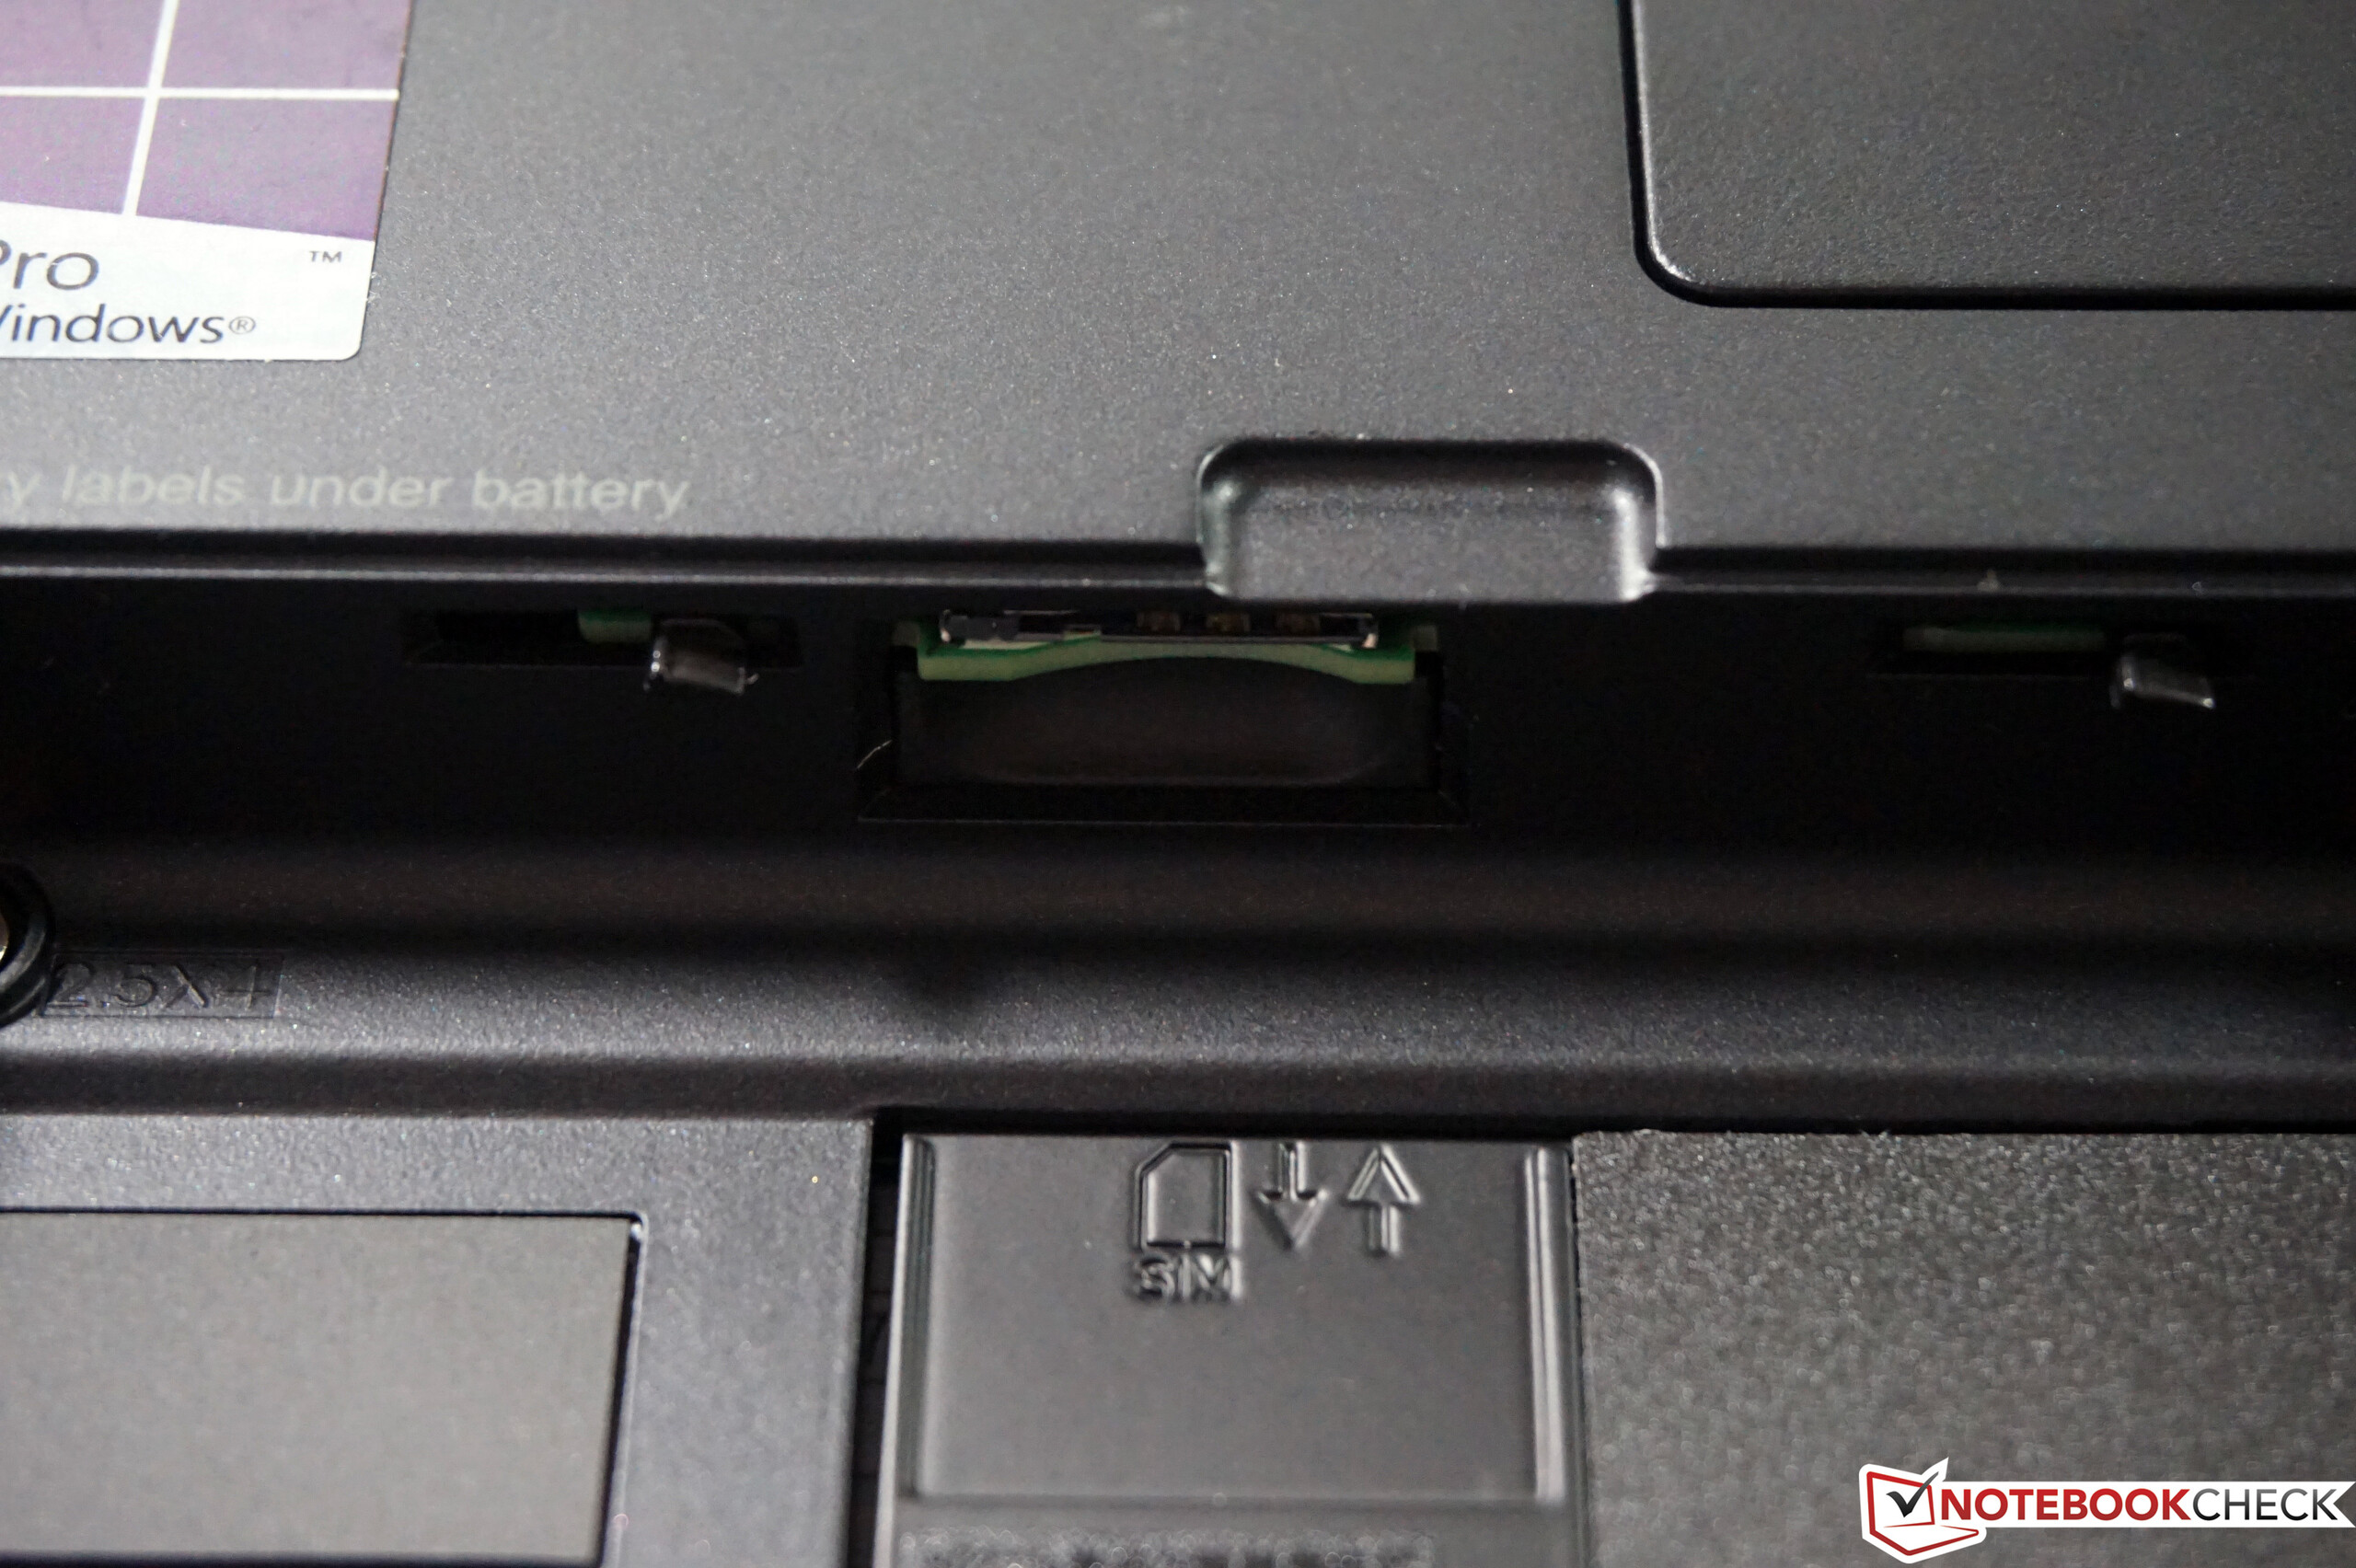
Another problem of the ThinkPad P50 was the WWAN support, because the first models were not WWAN-ready, despite the specifications from the manufacturer. This has changed in the meantime, and at least Lenovo' online shop lists corresponding models with the Qualcomm Snapdragon X7 LTE-A (+155 Euros/~$170). If you buy the device from a retailer, you should ask in advance or buy directly from Lenovo if you have any doubts.
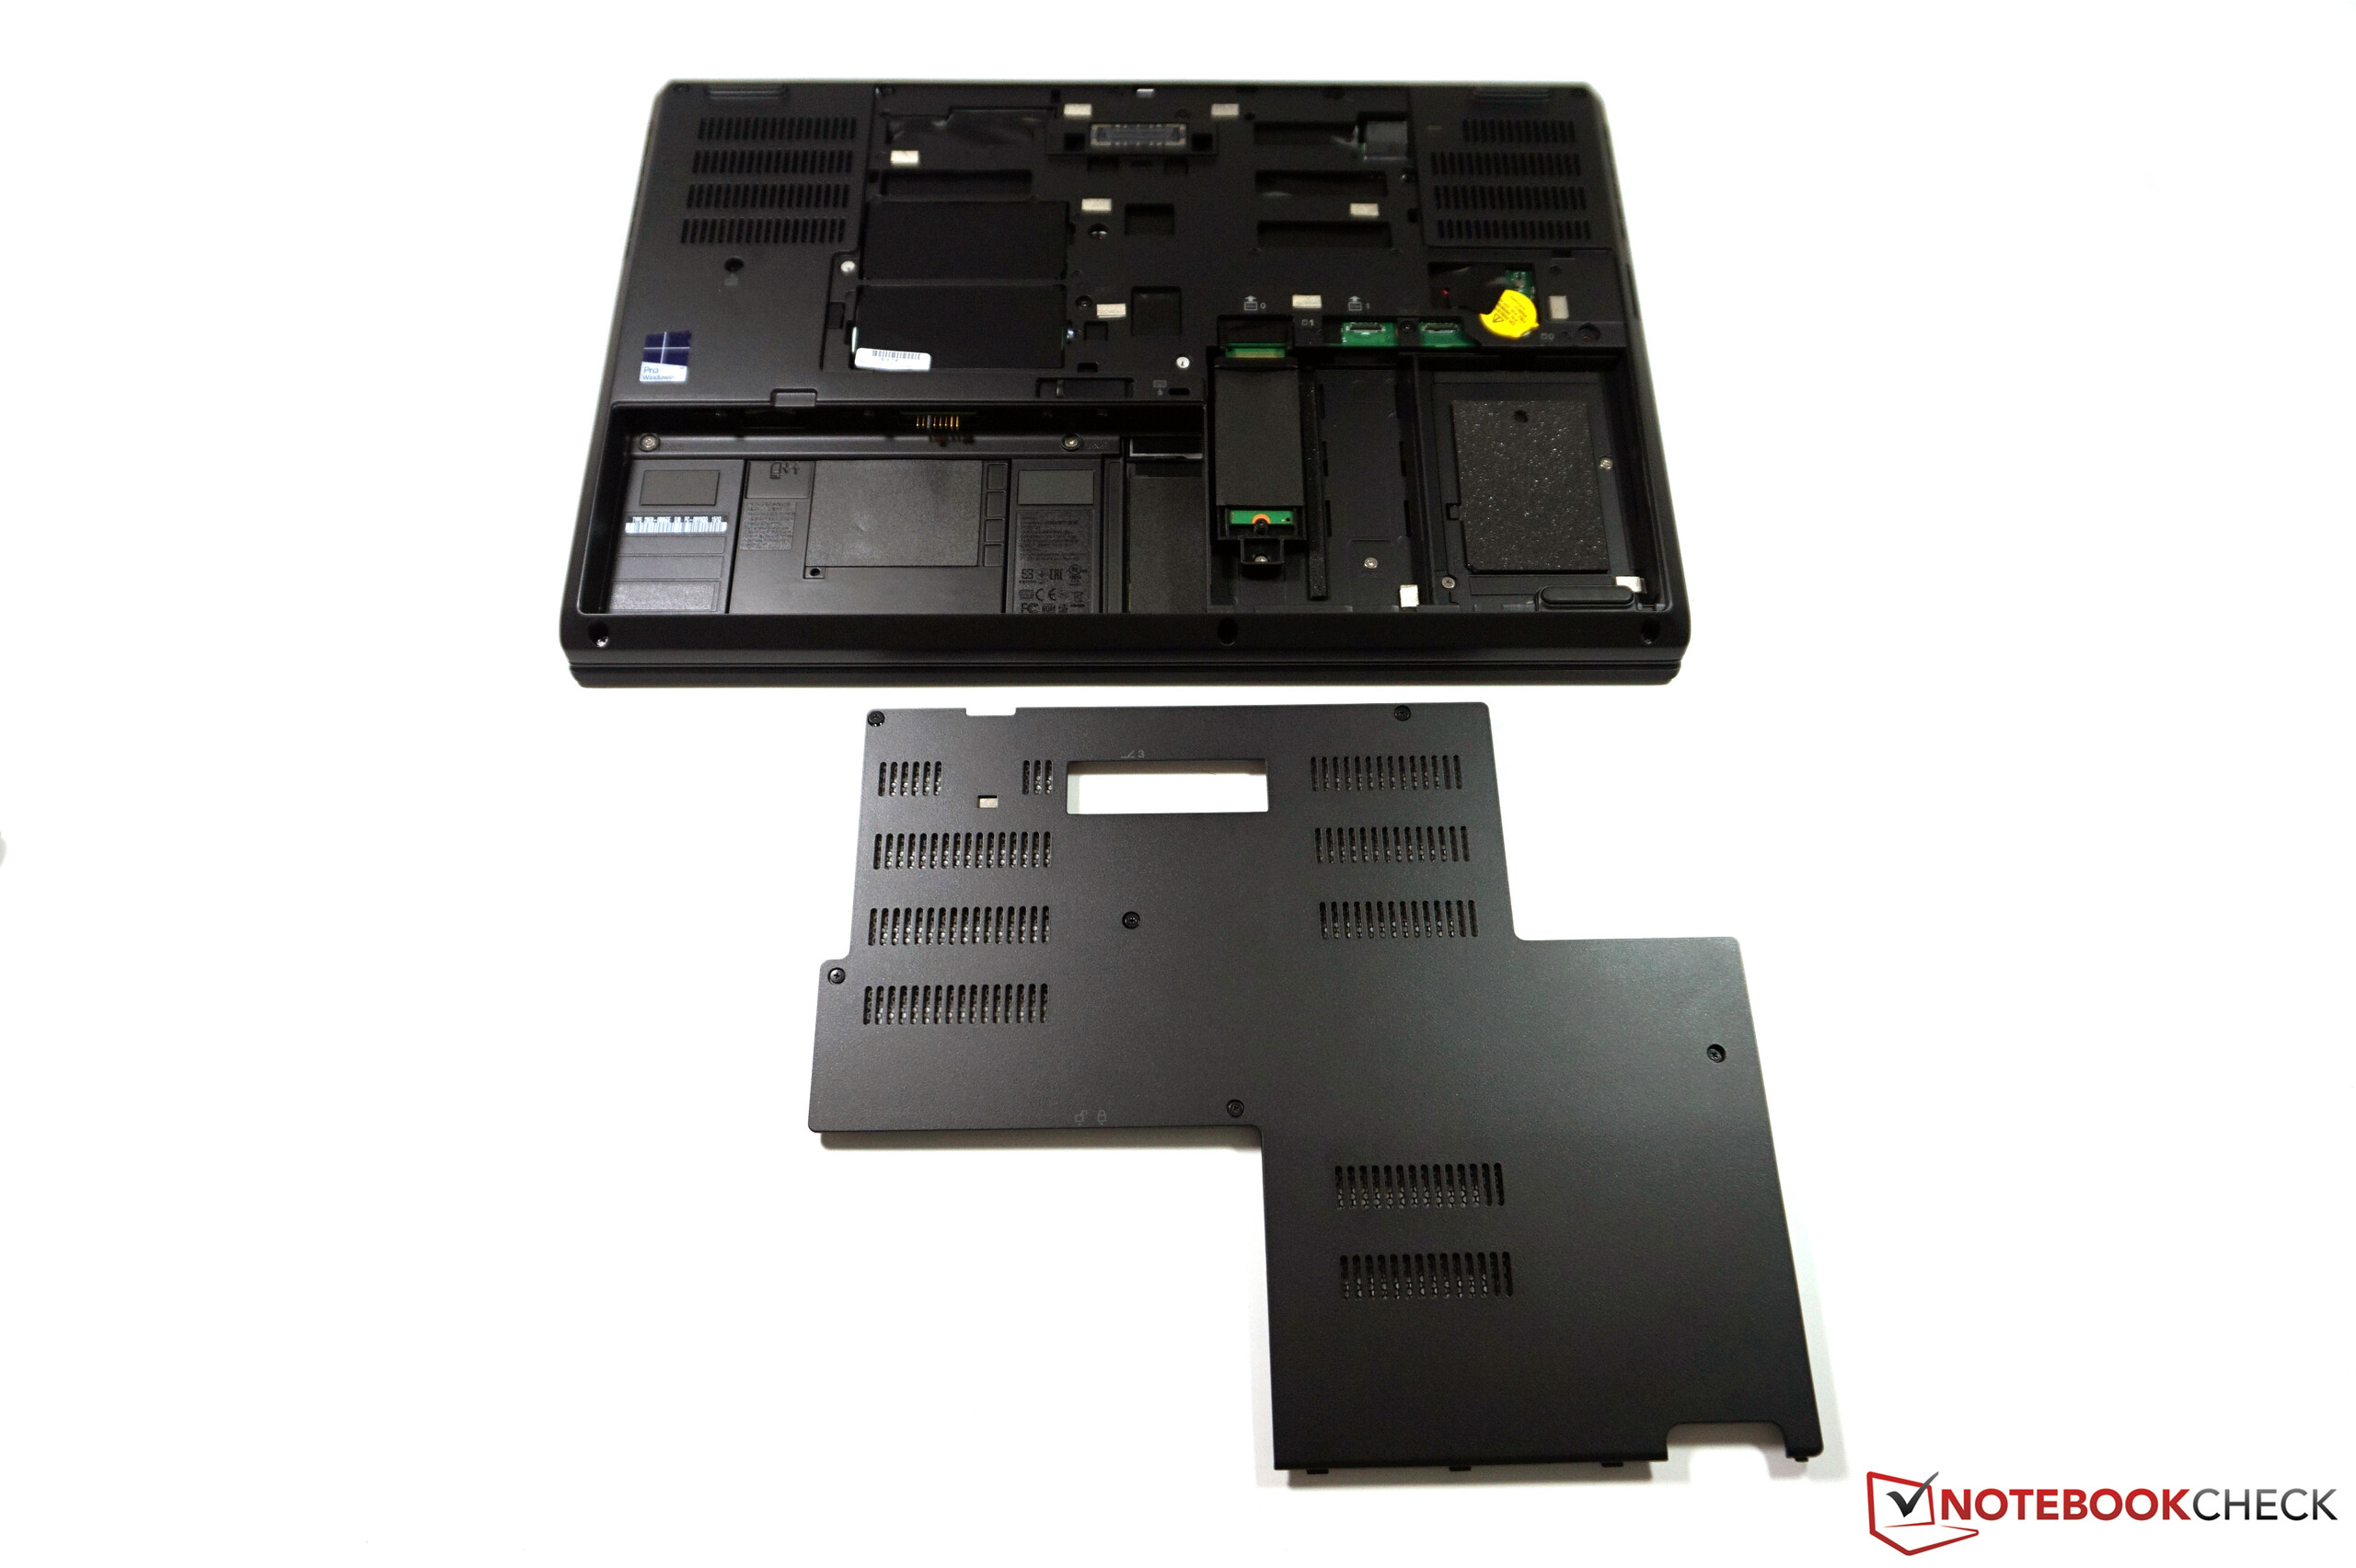
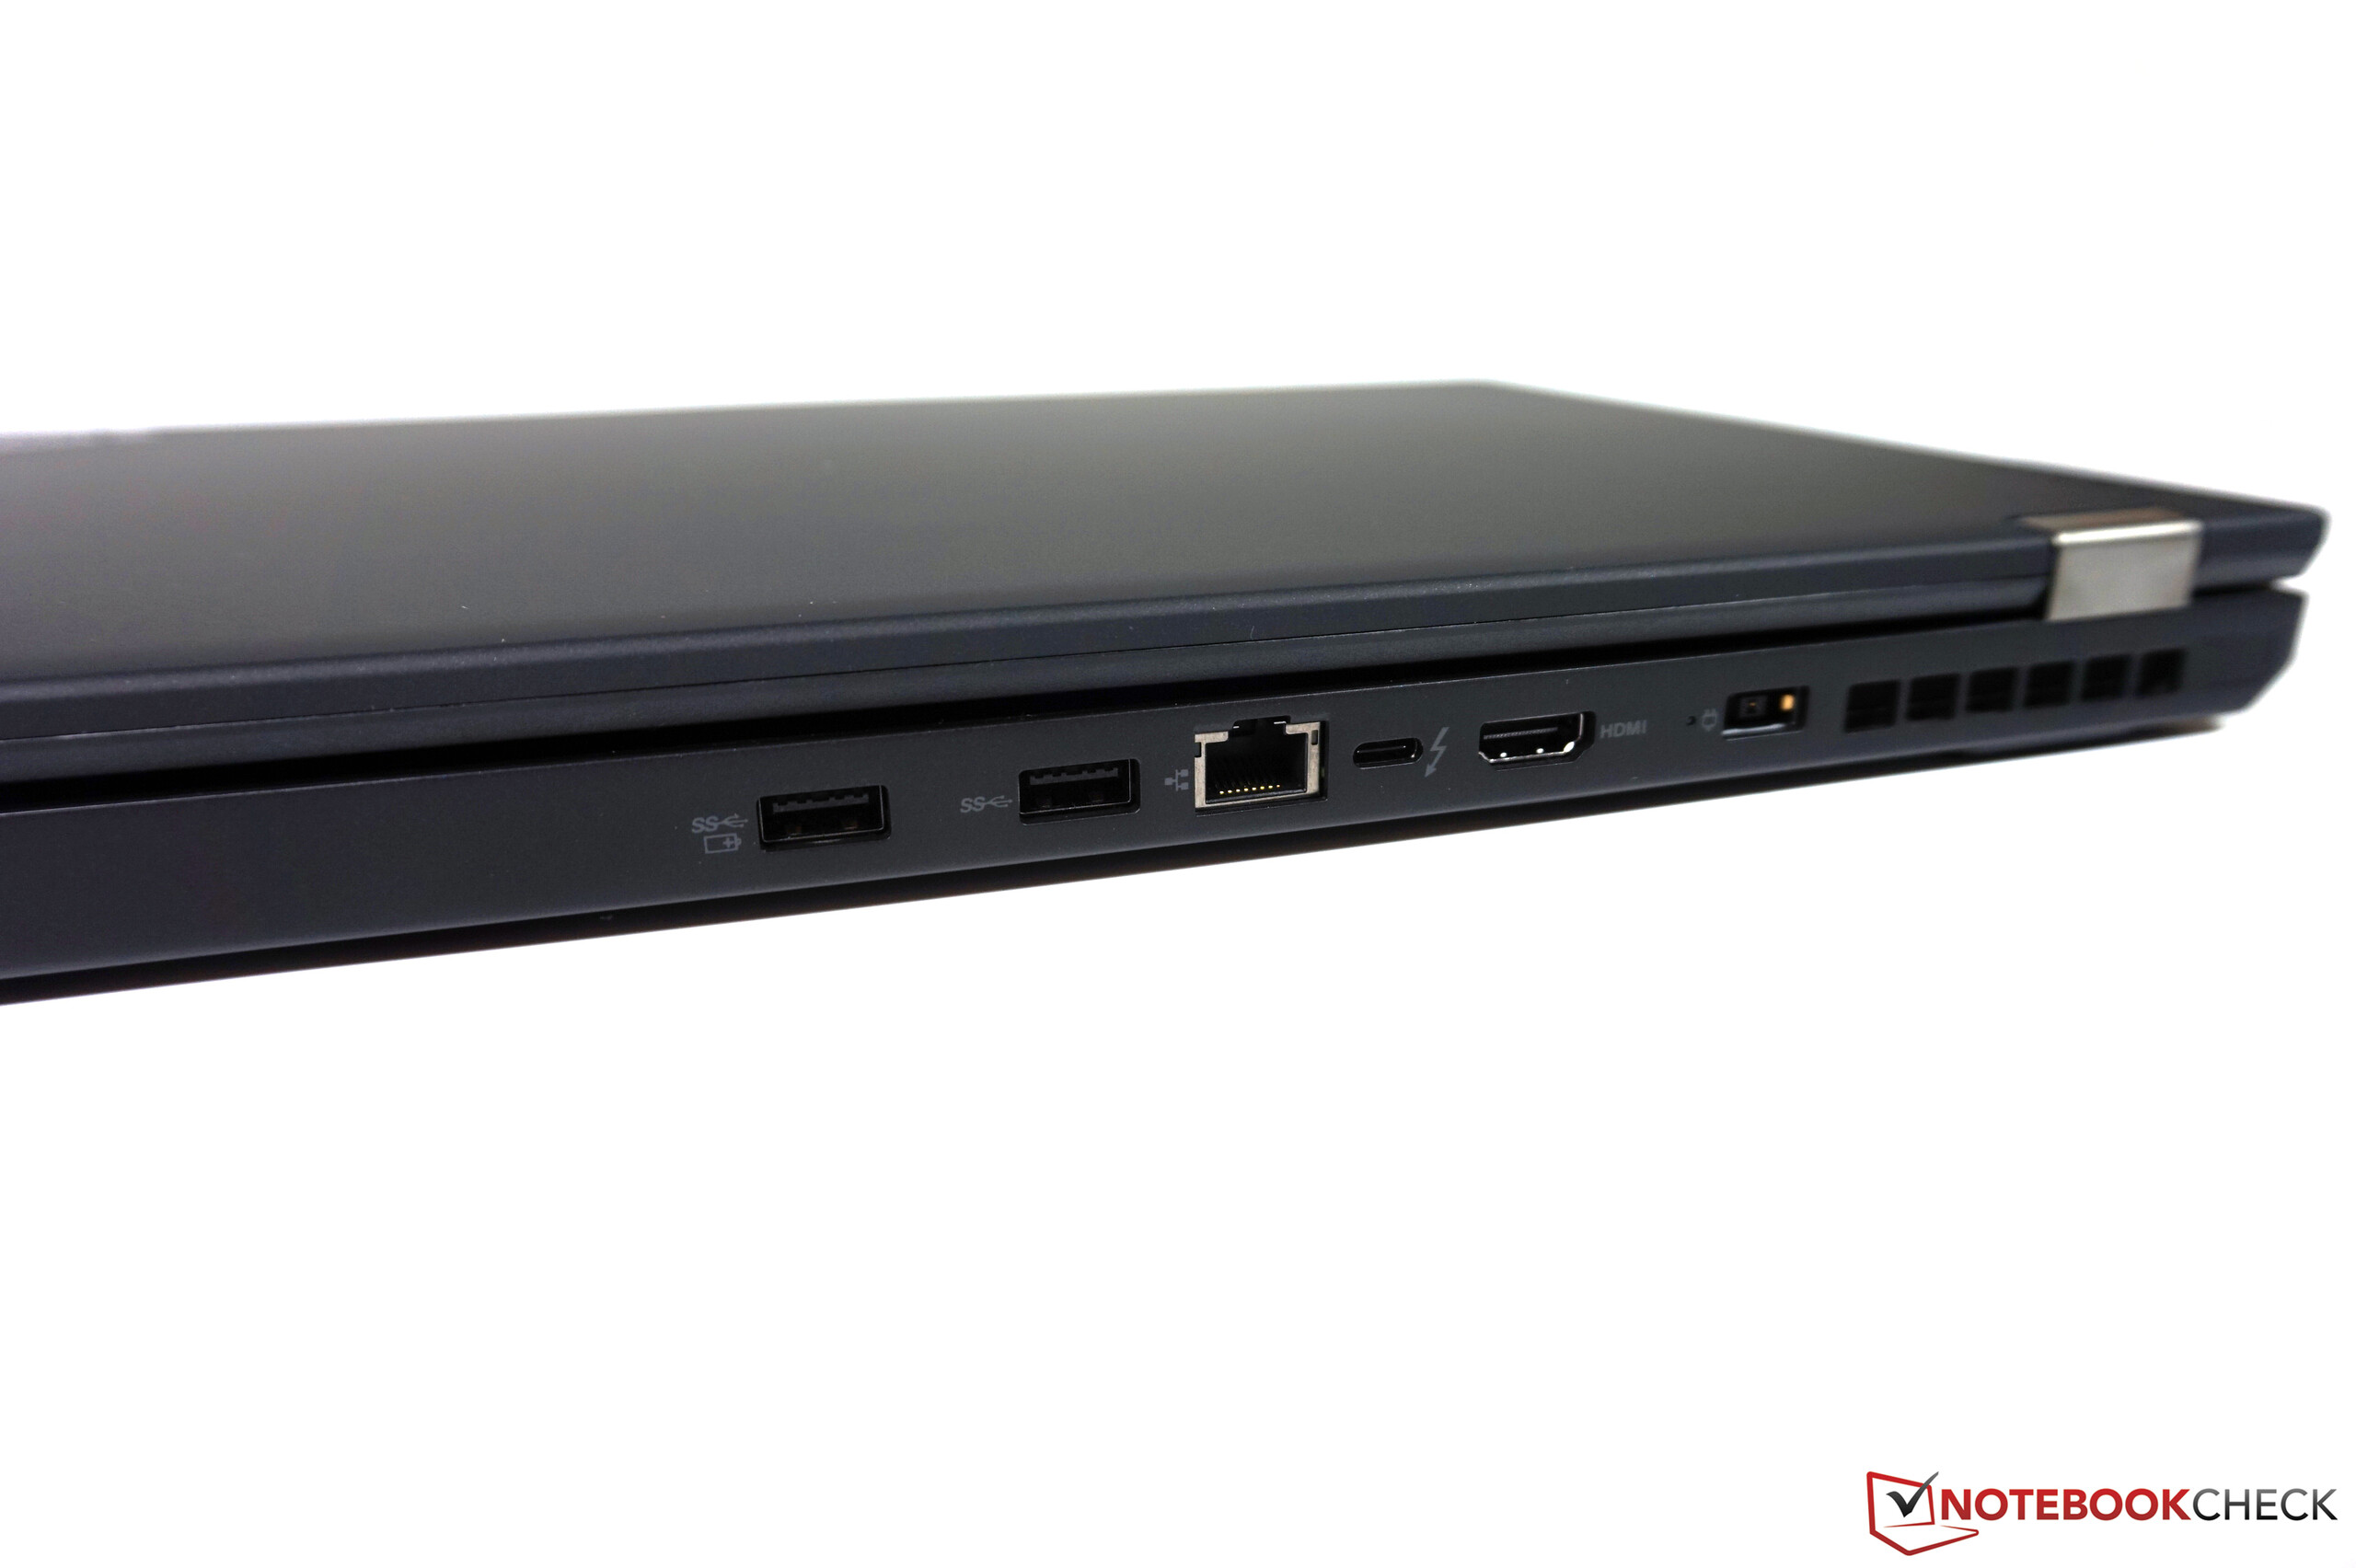
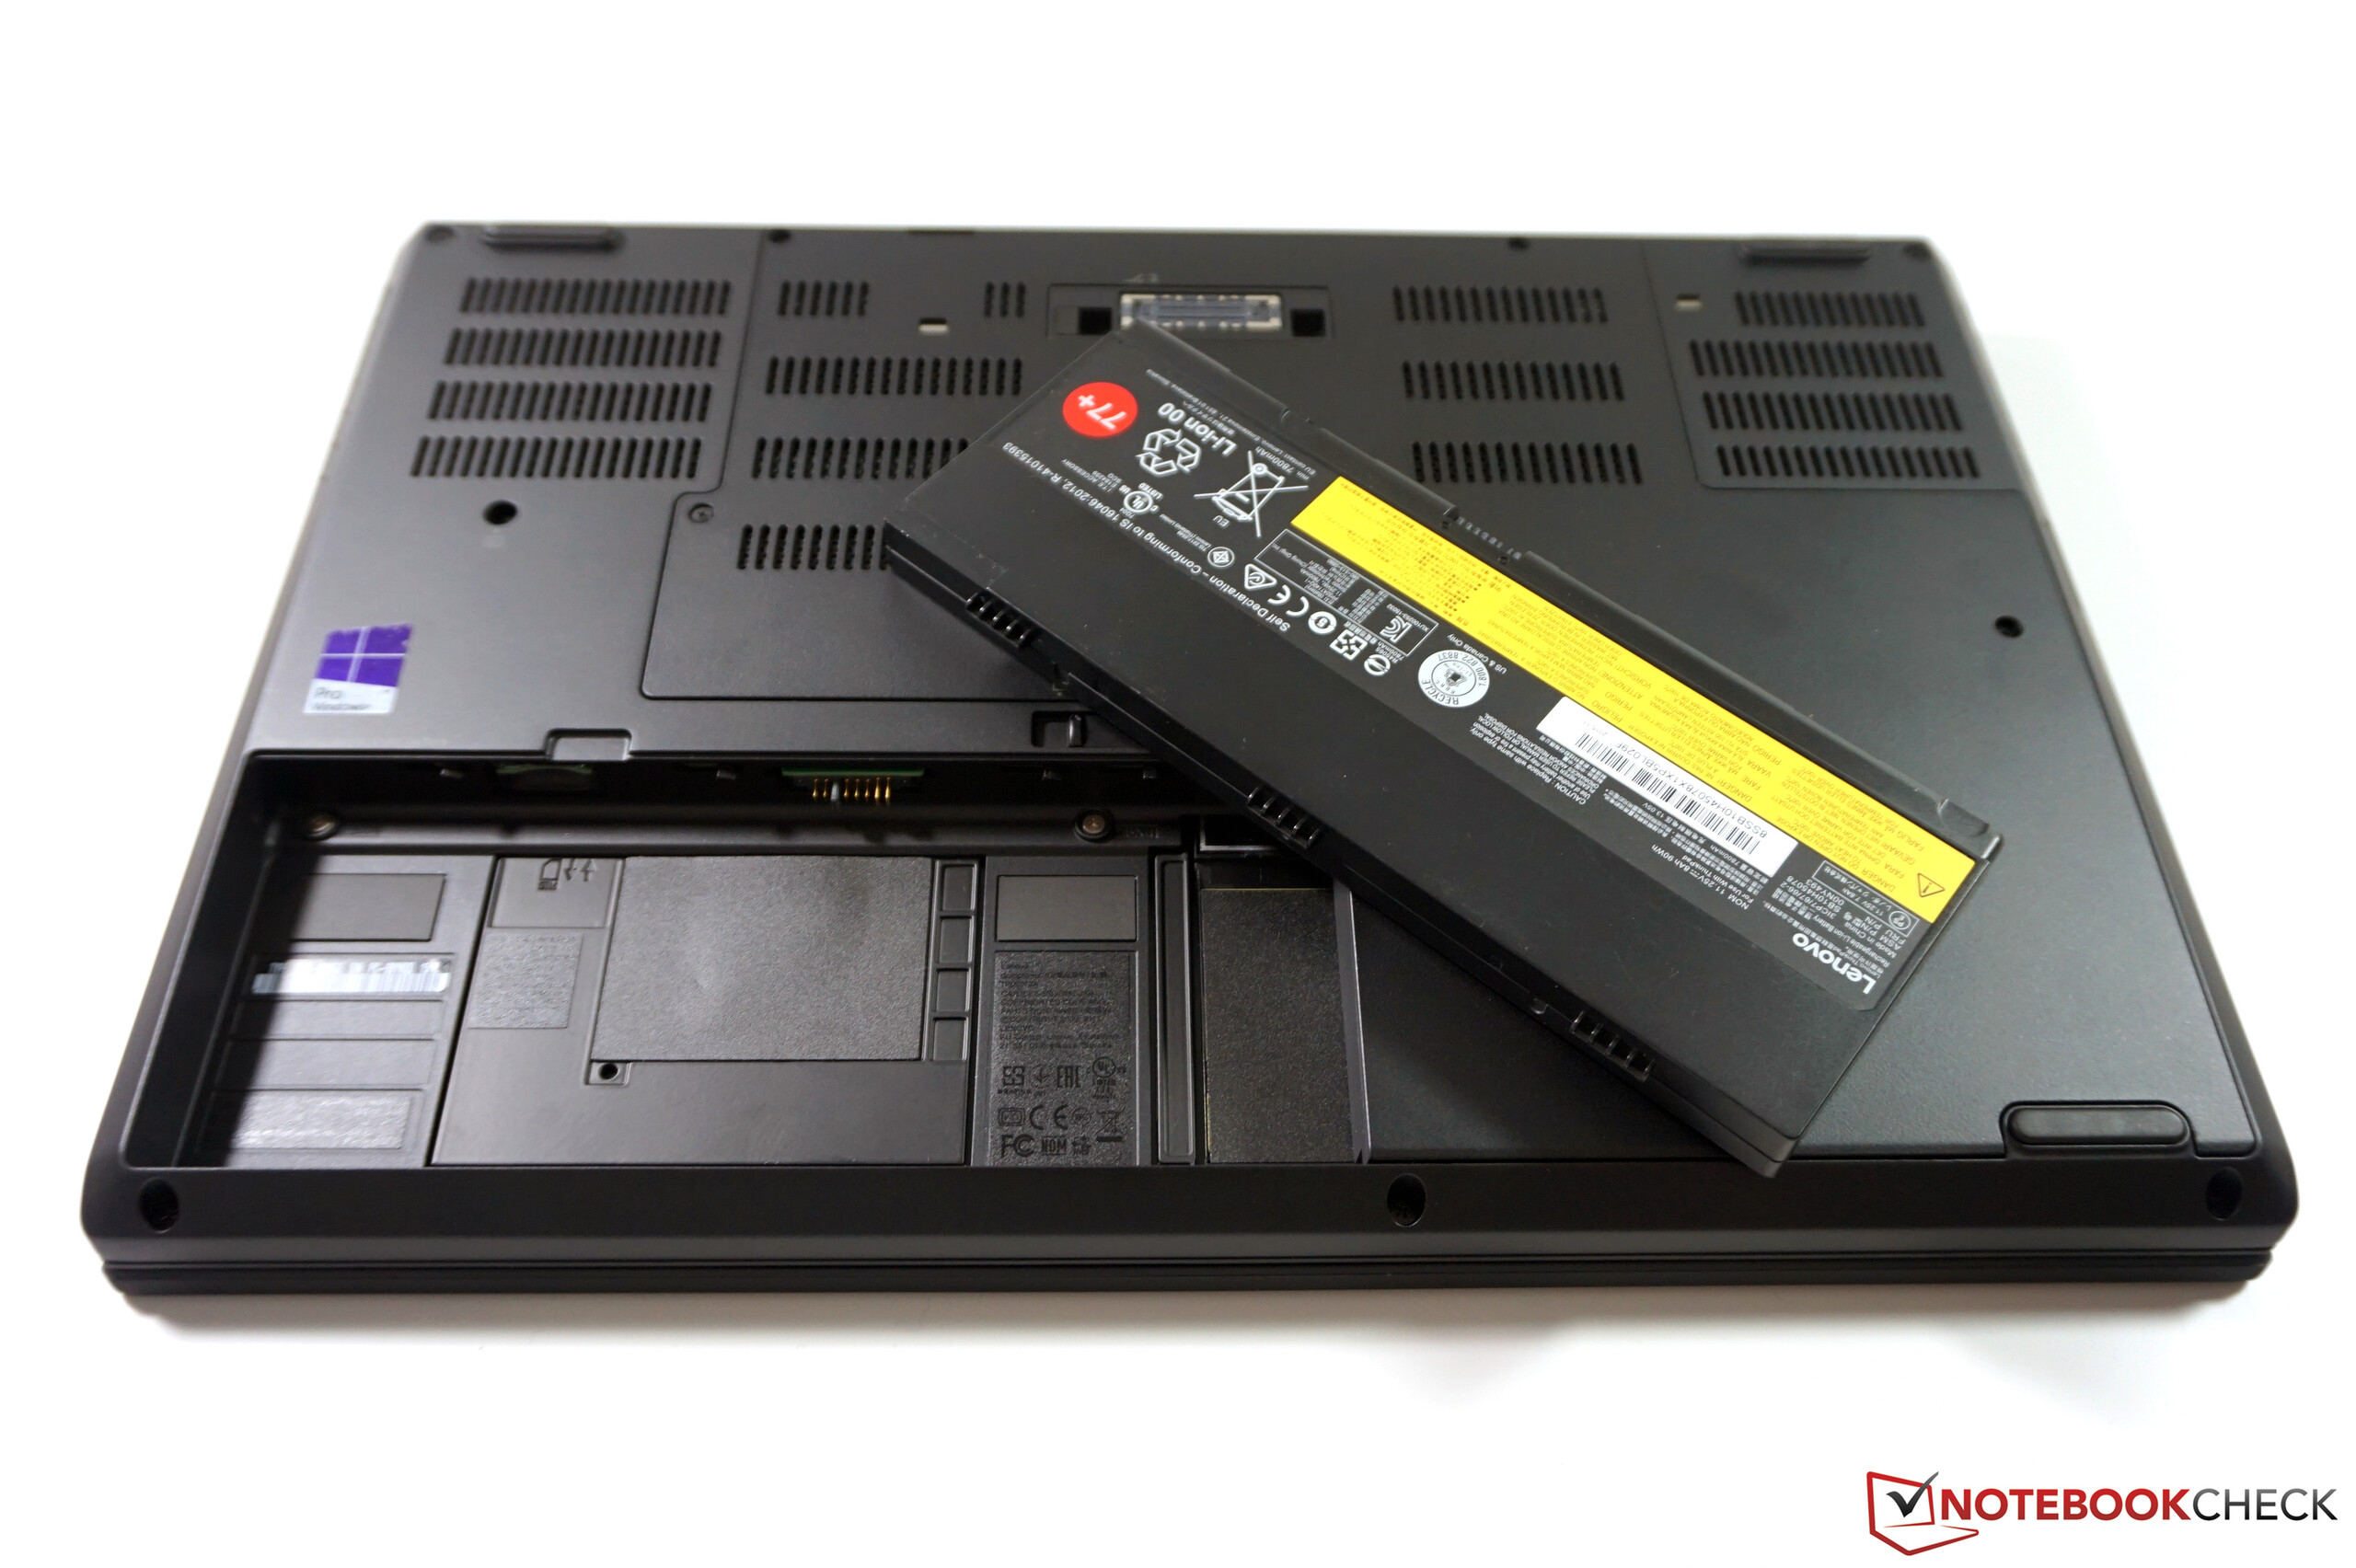
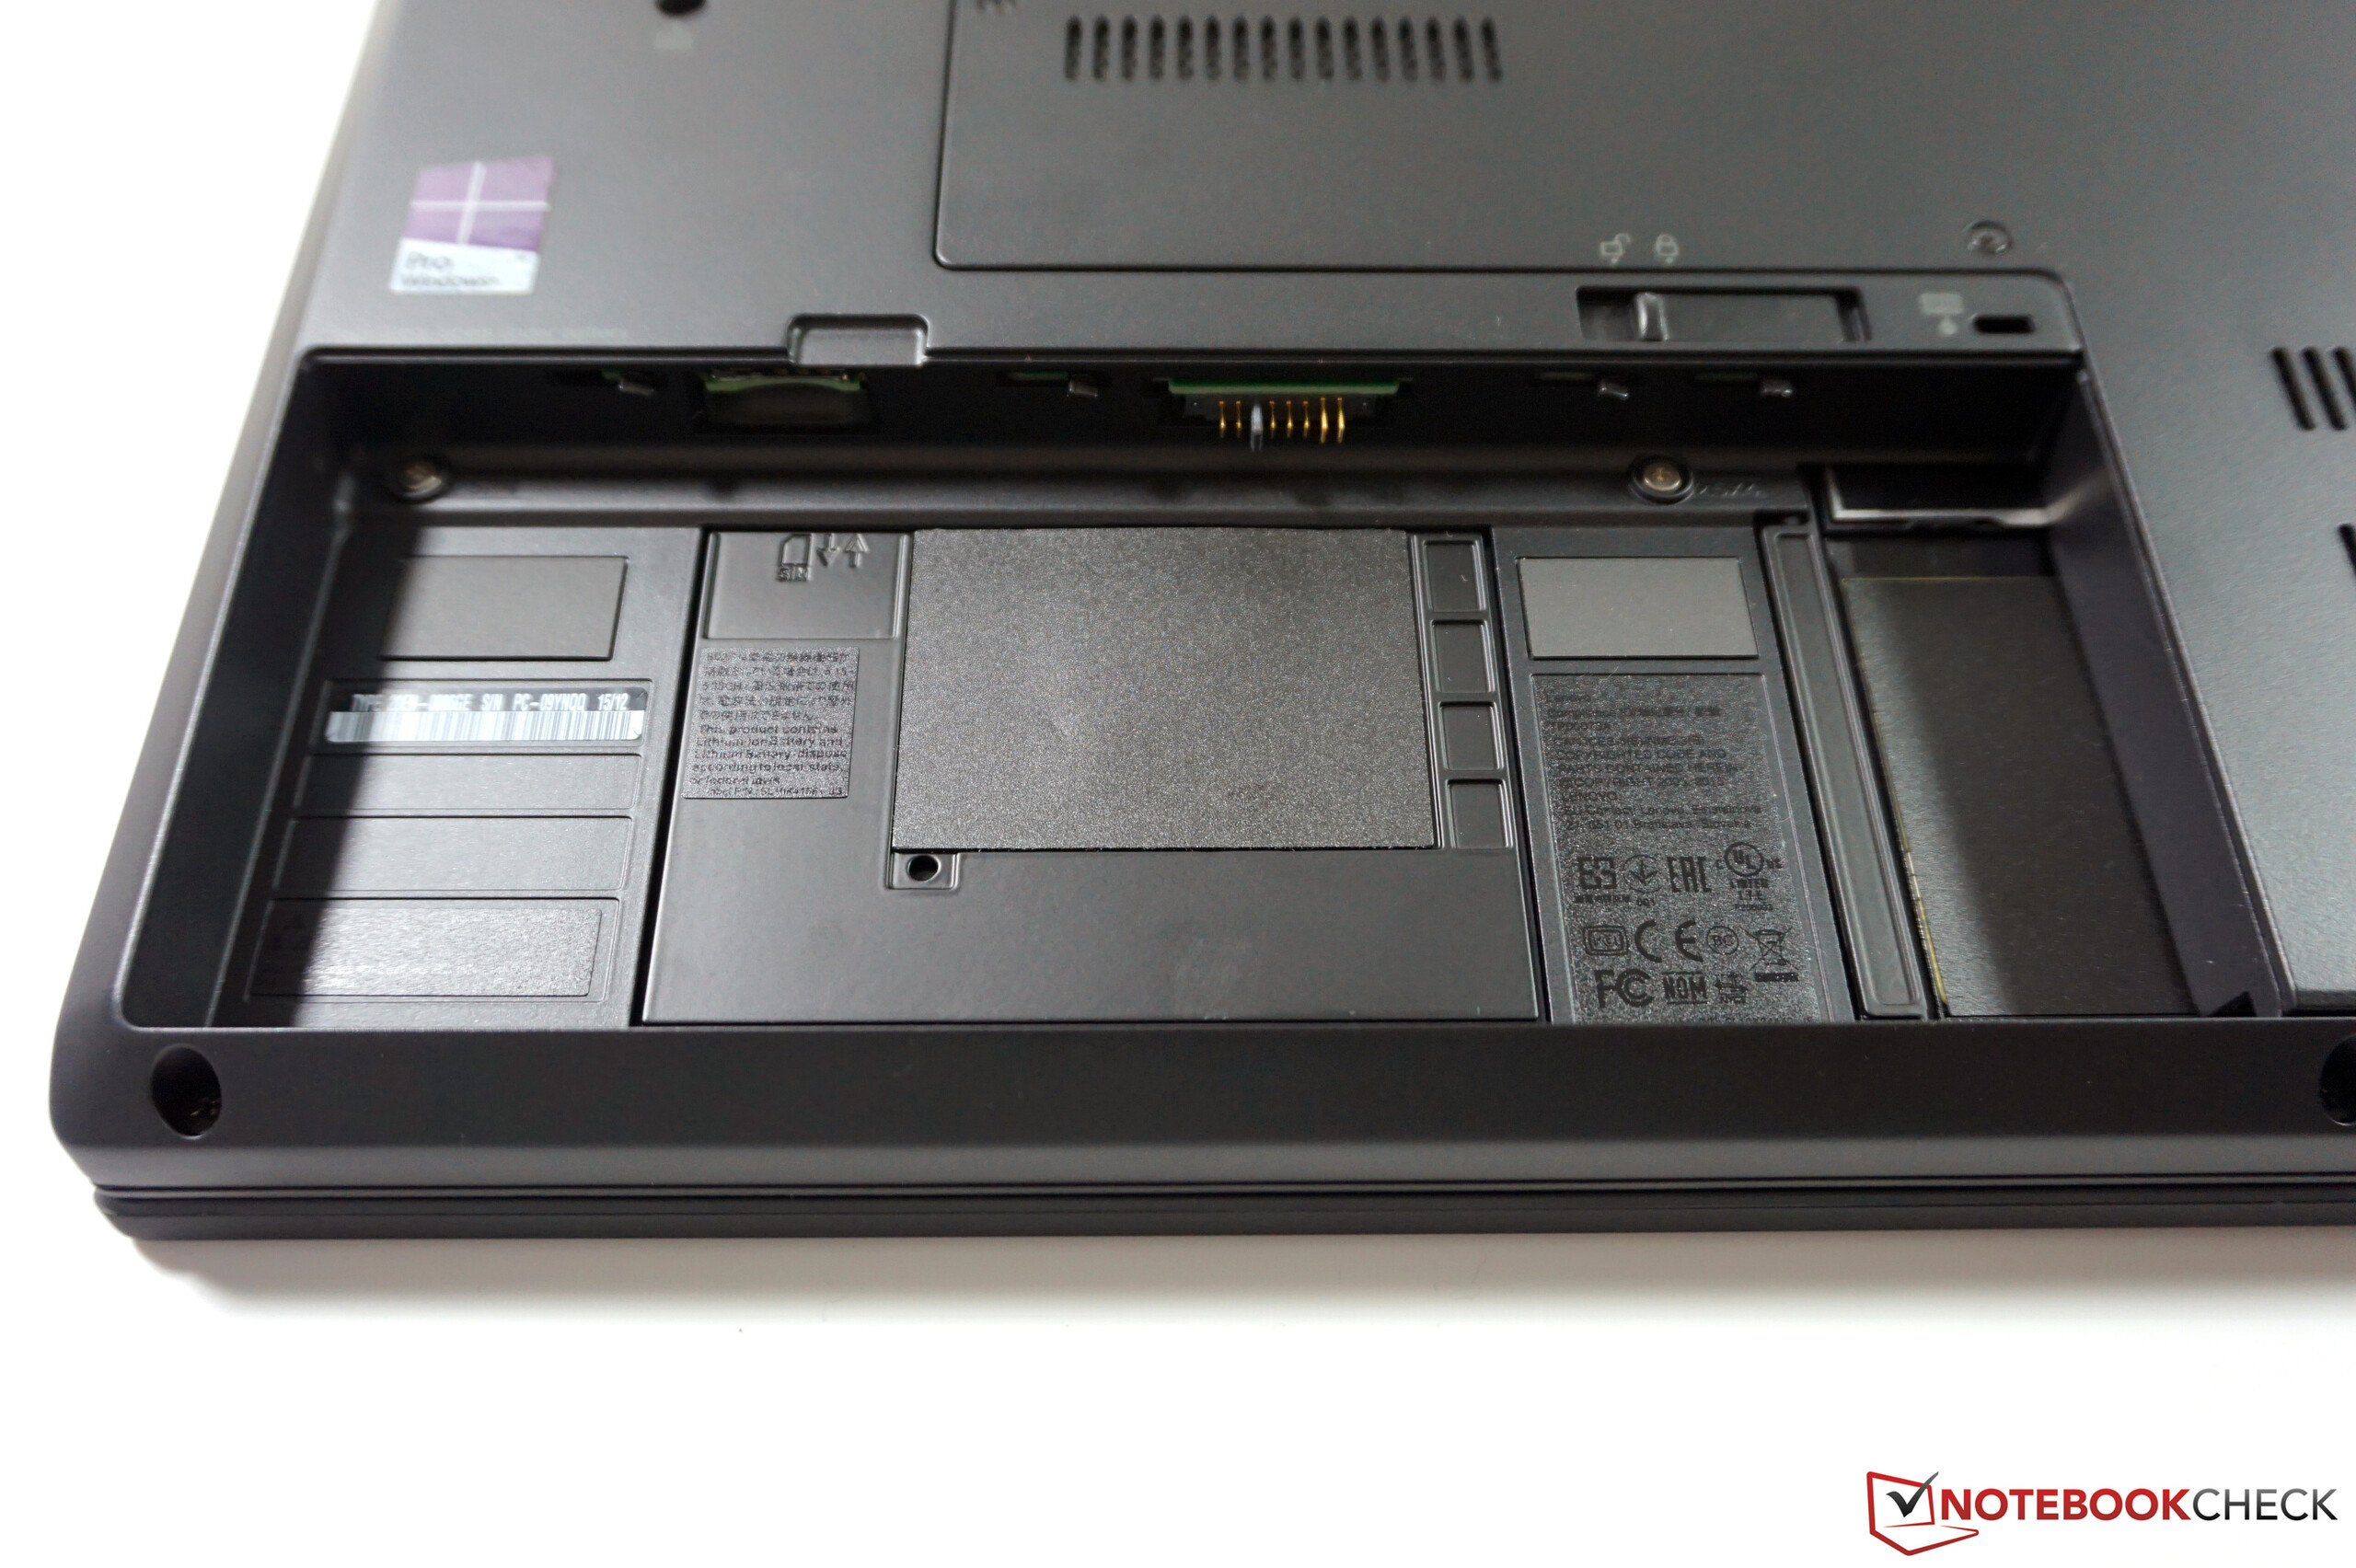
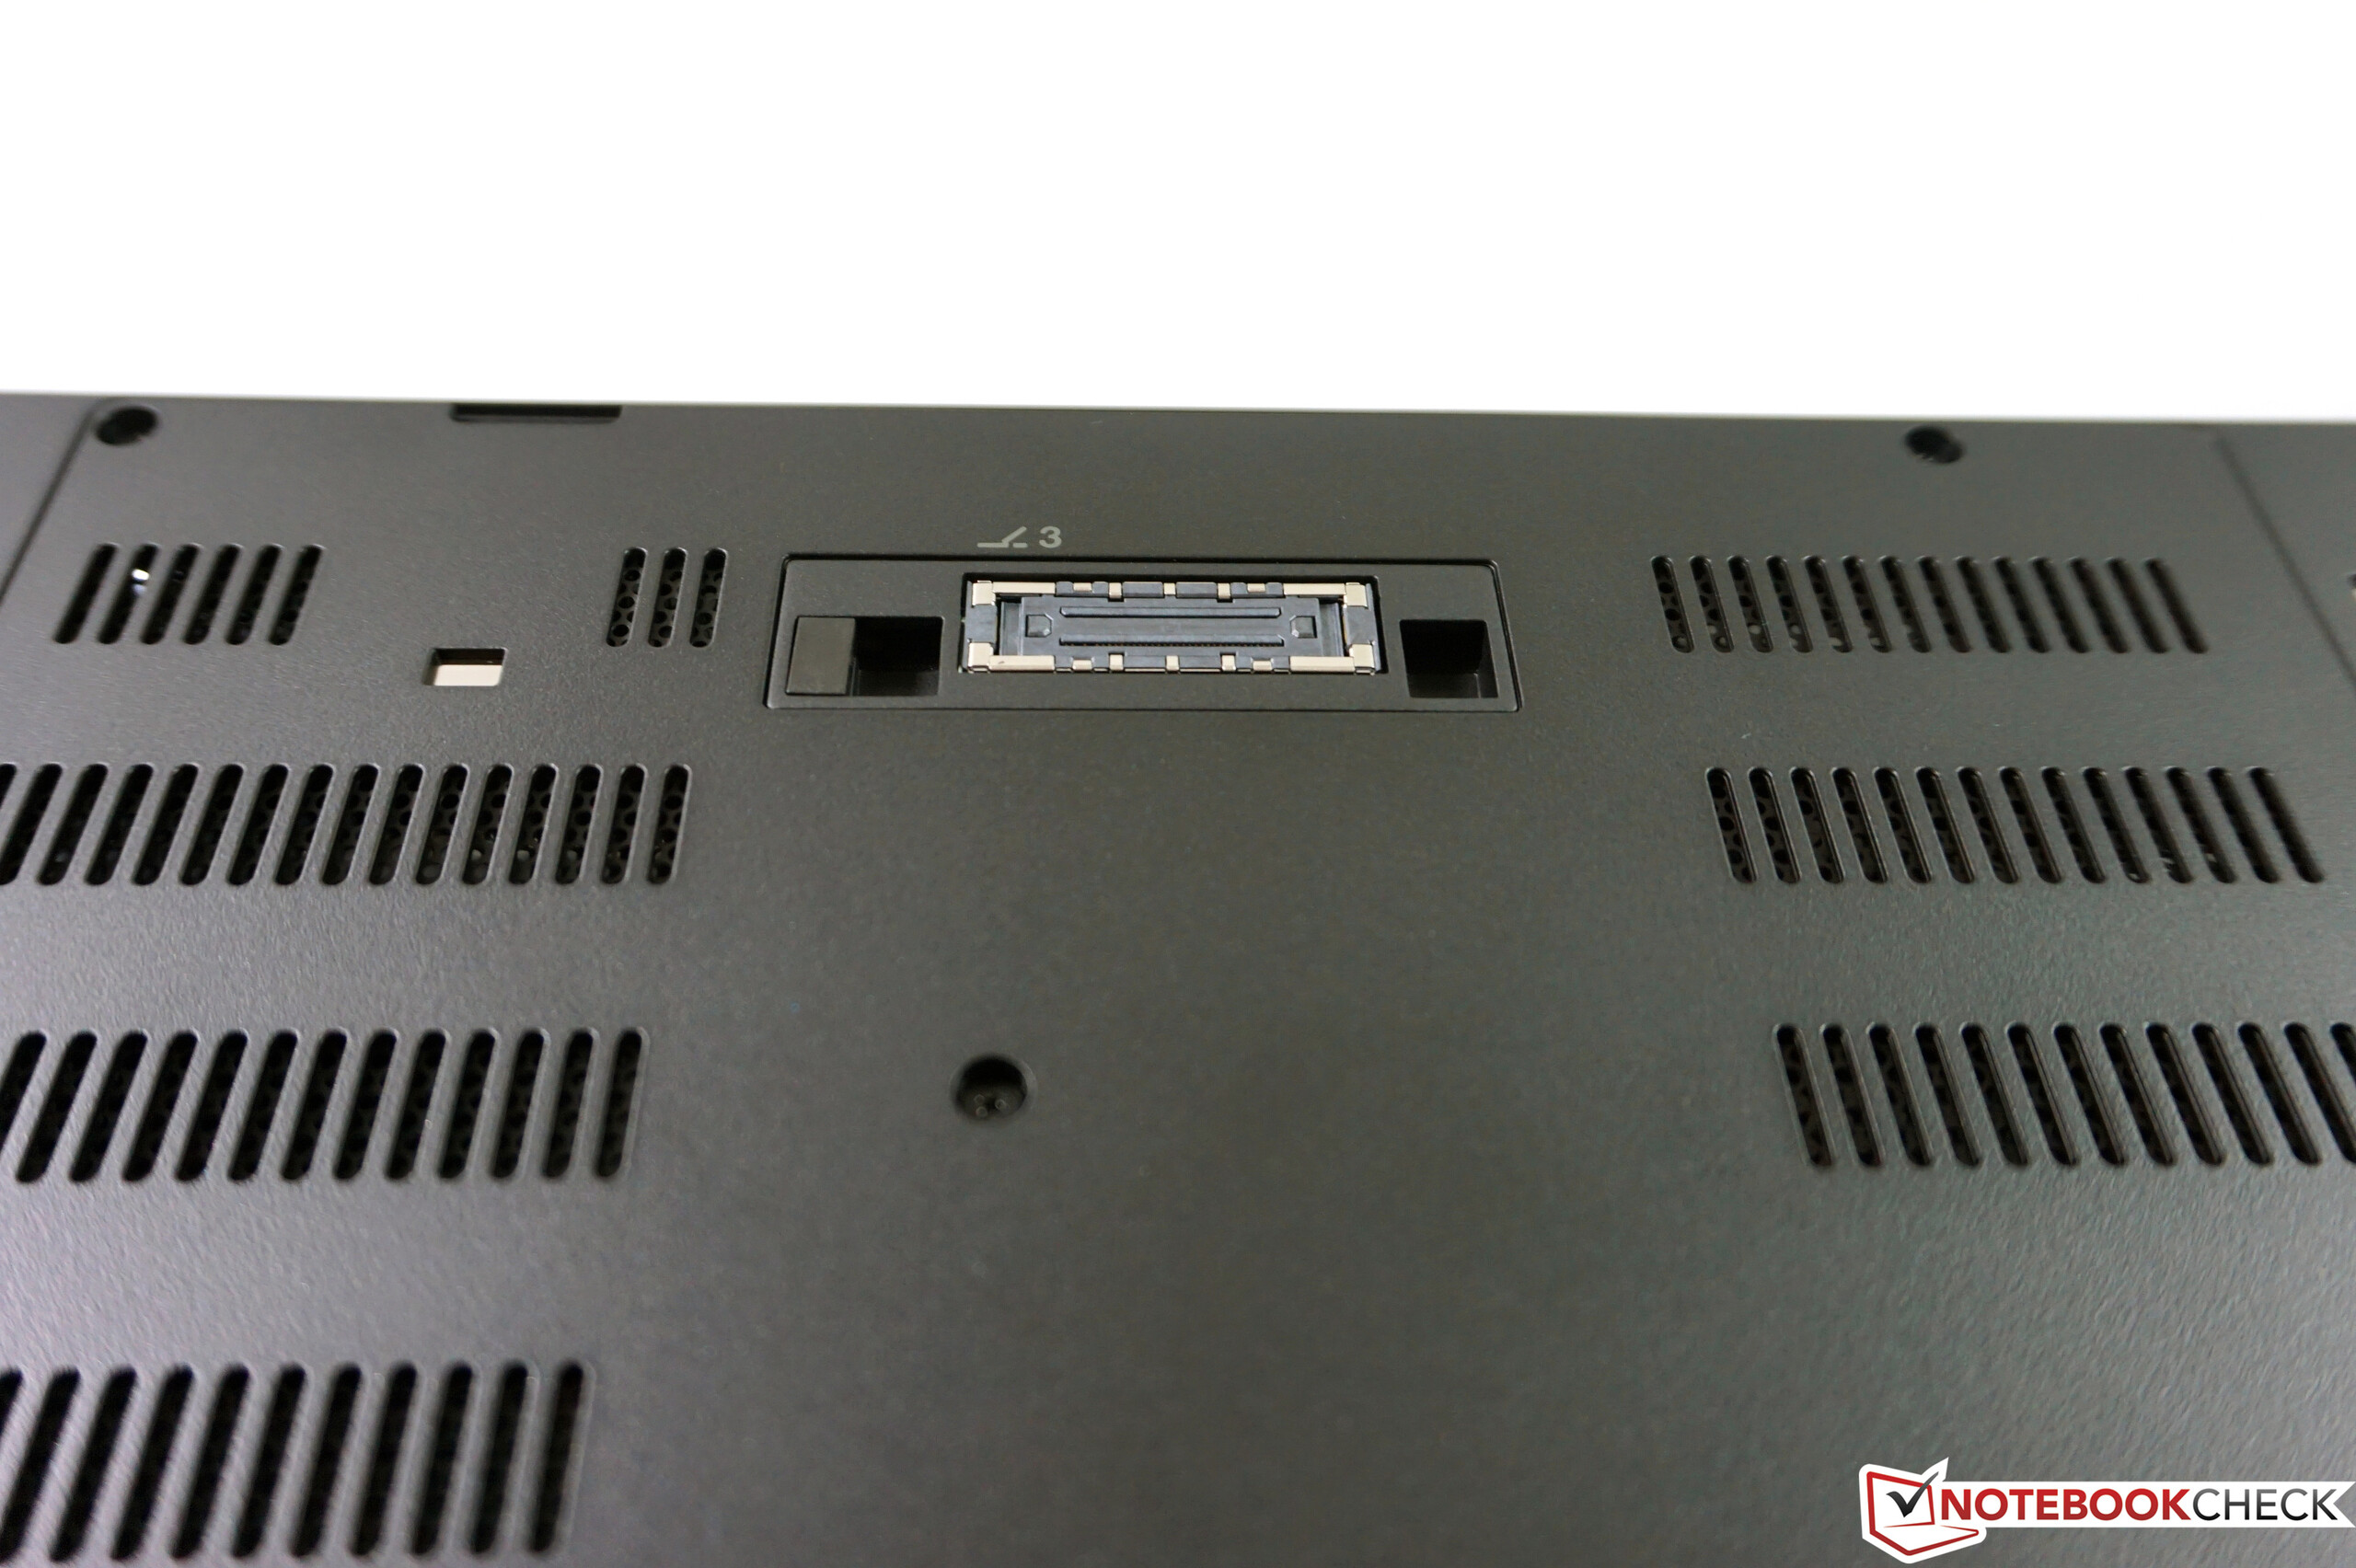
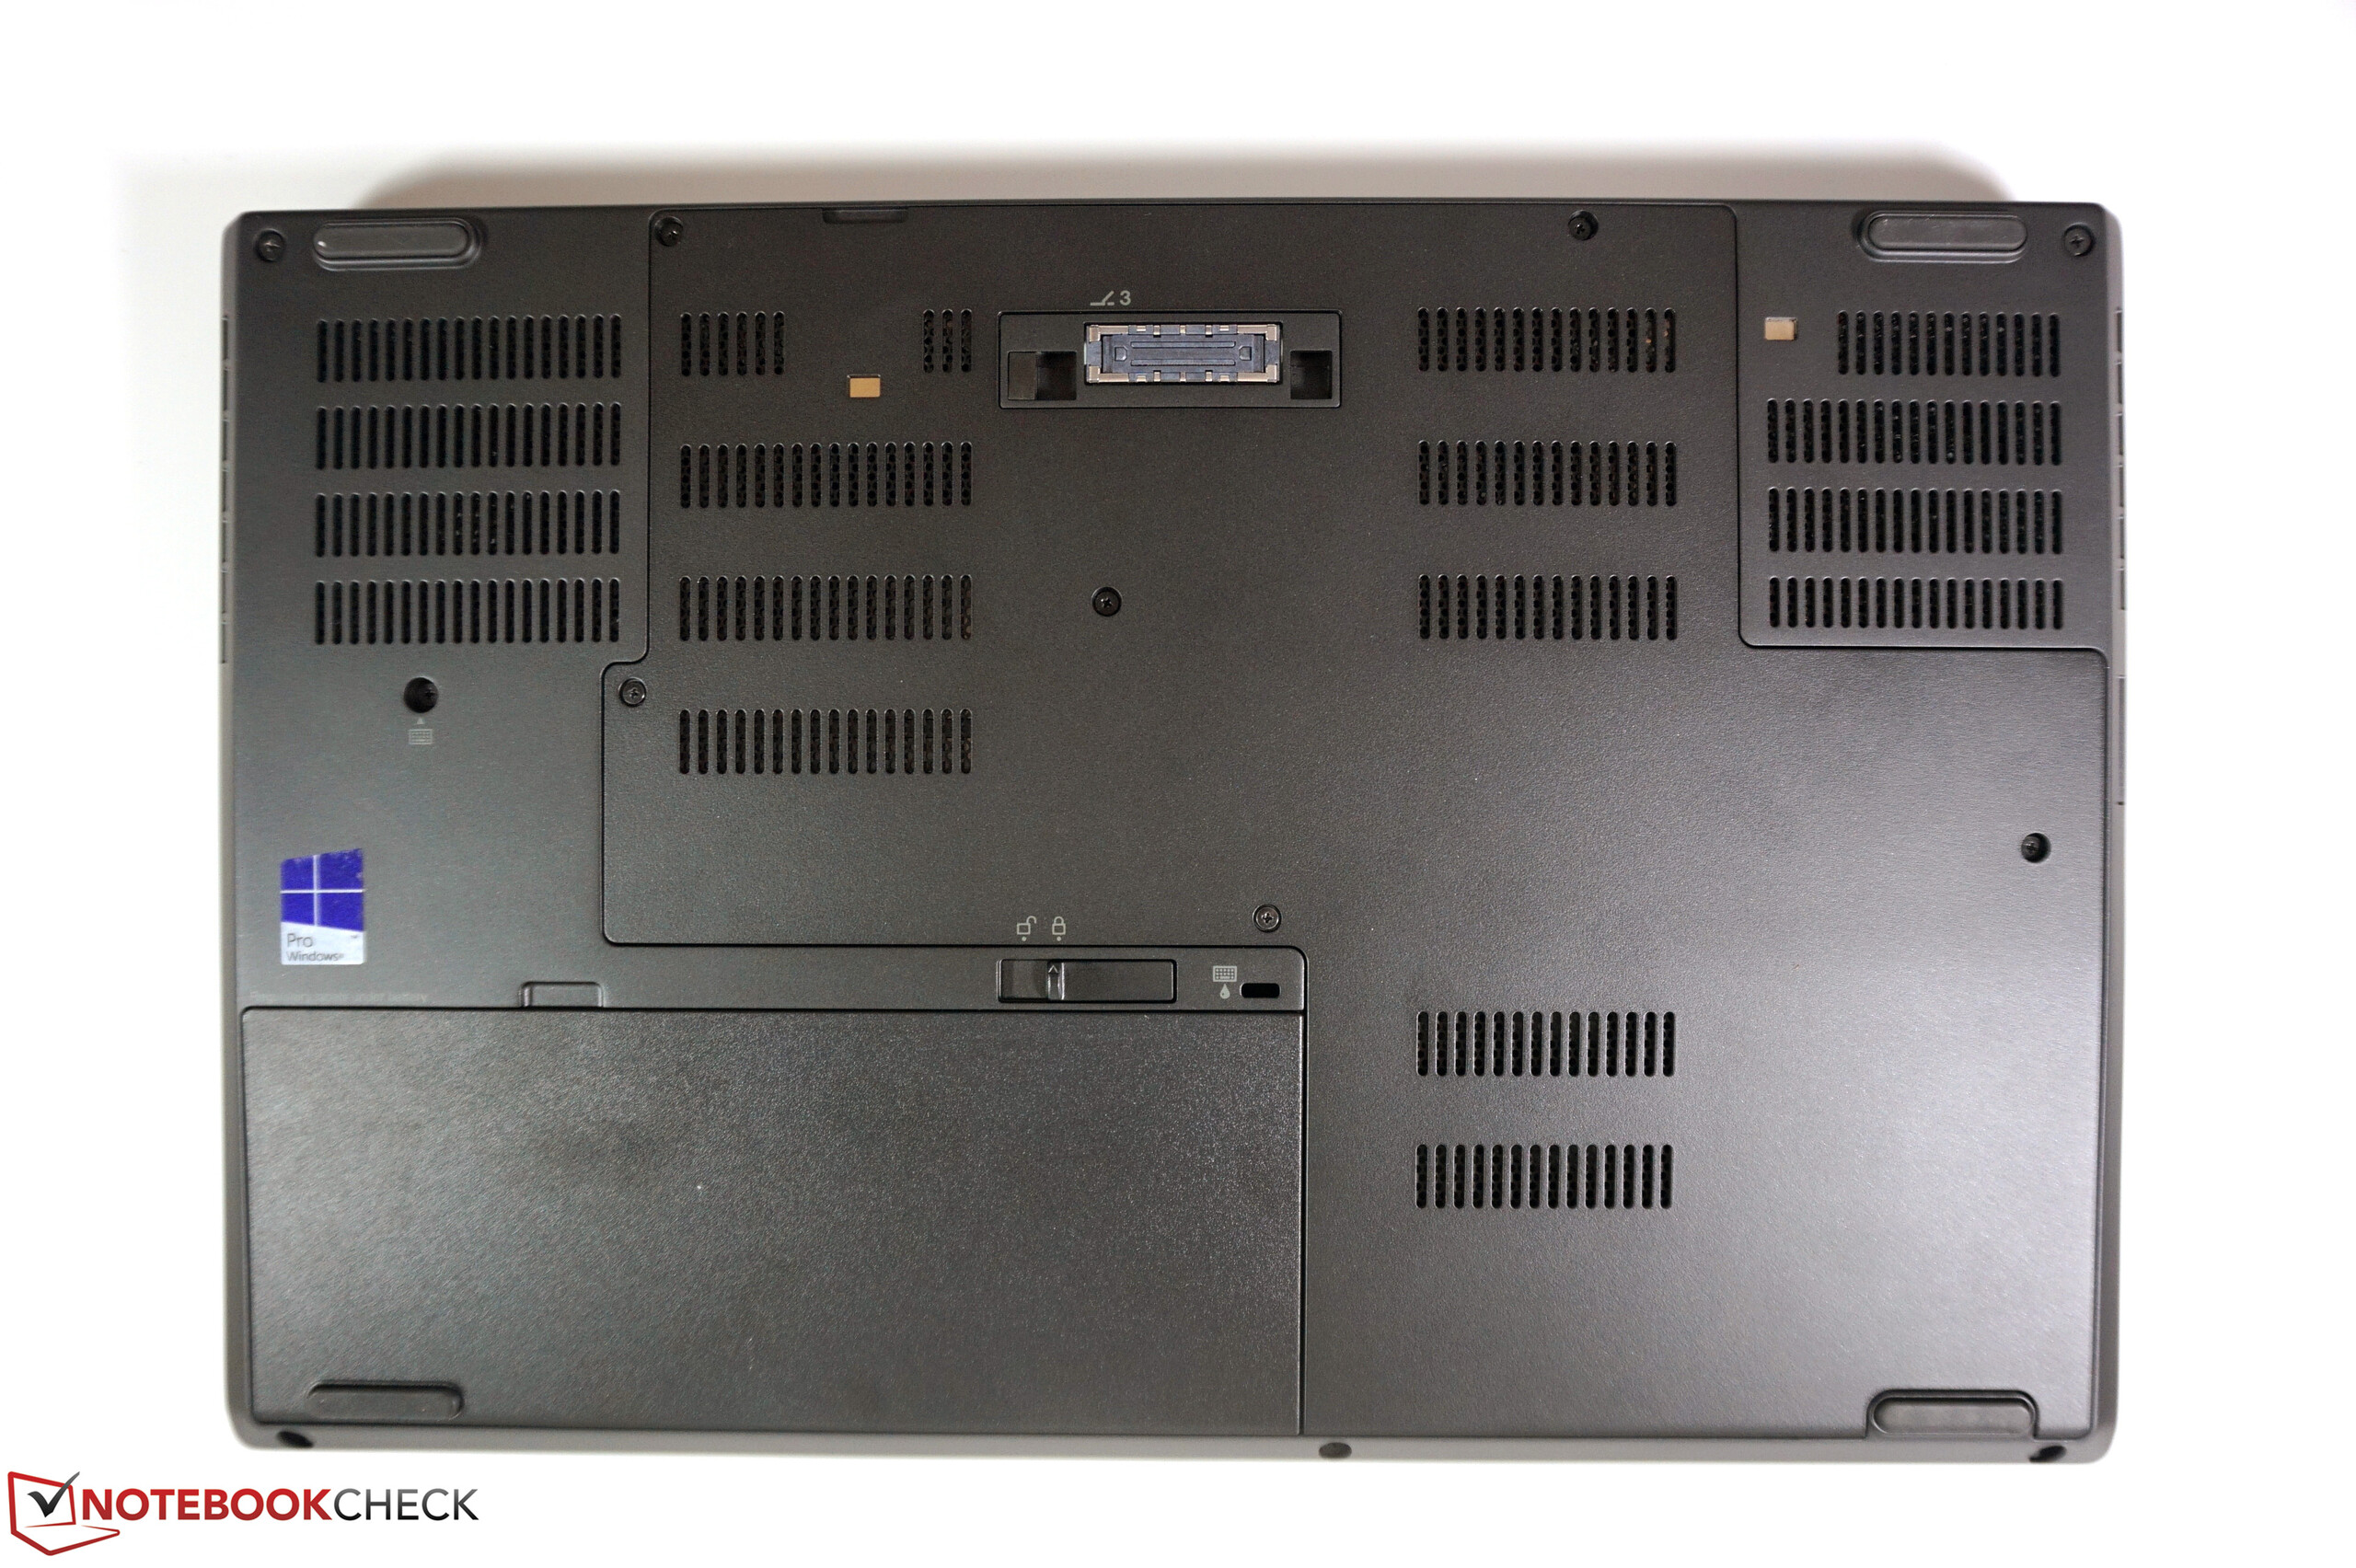
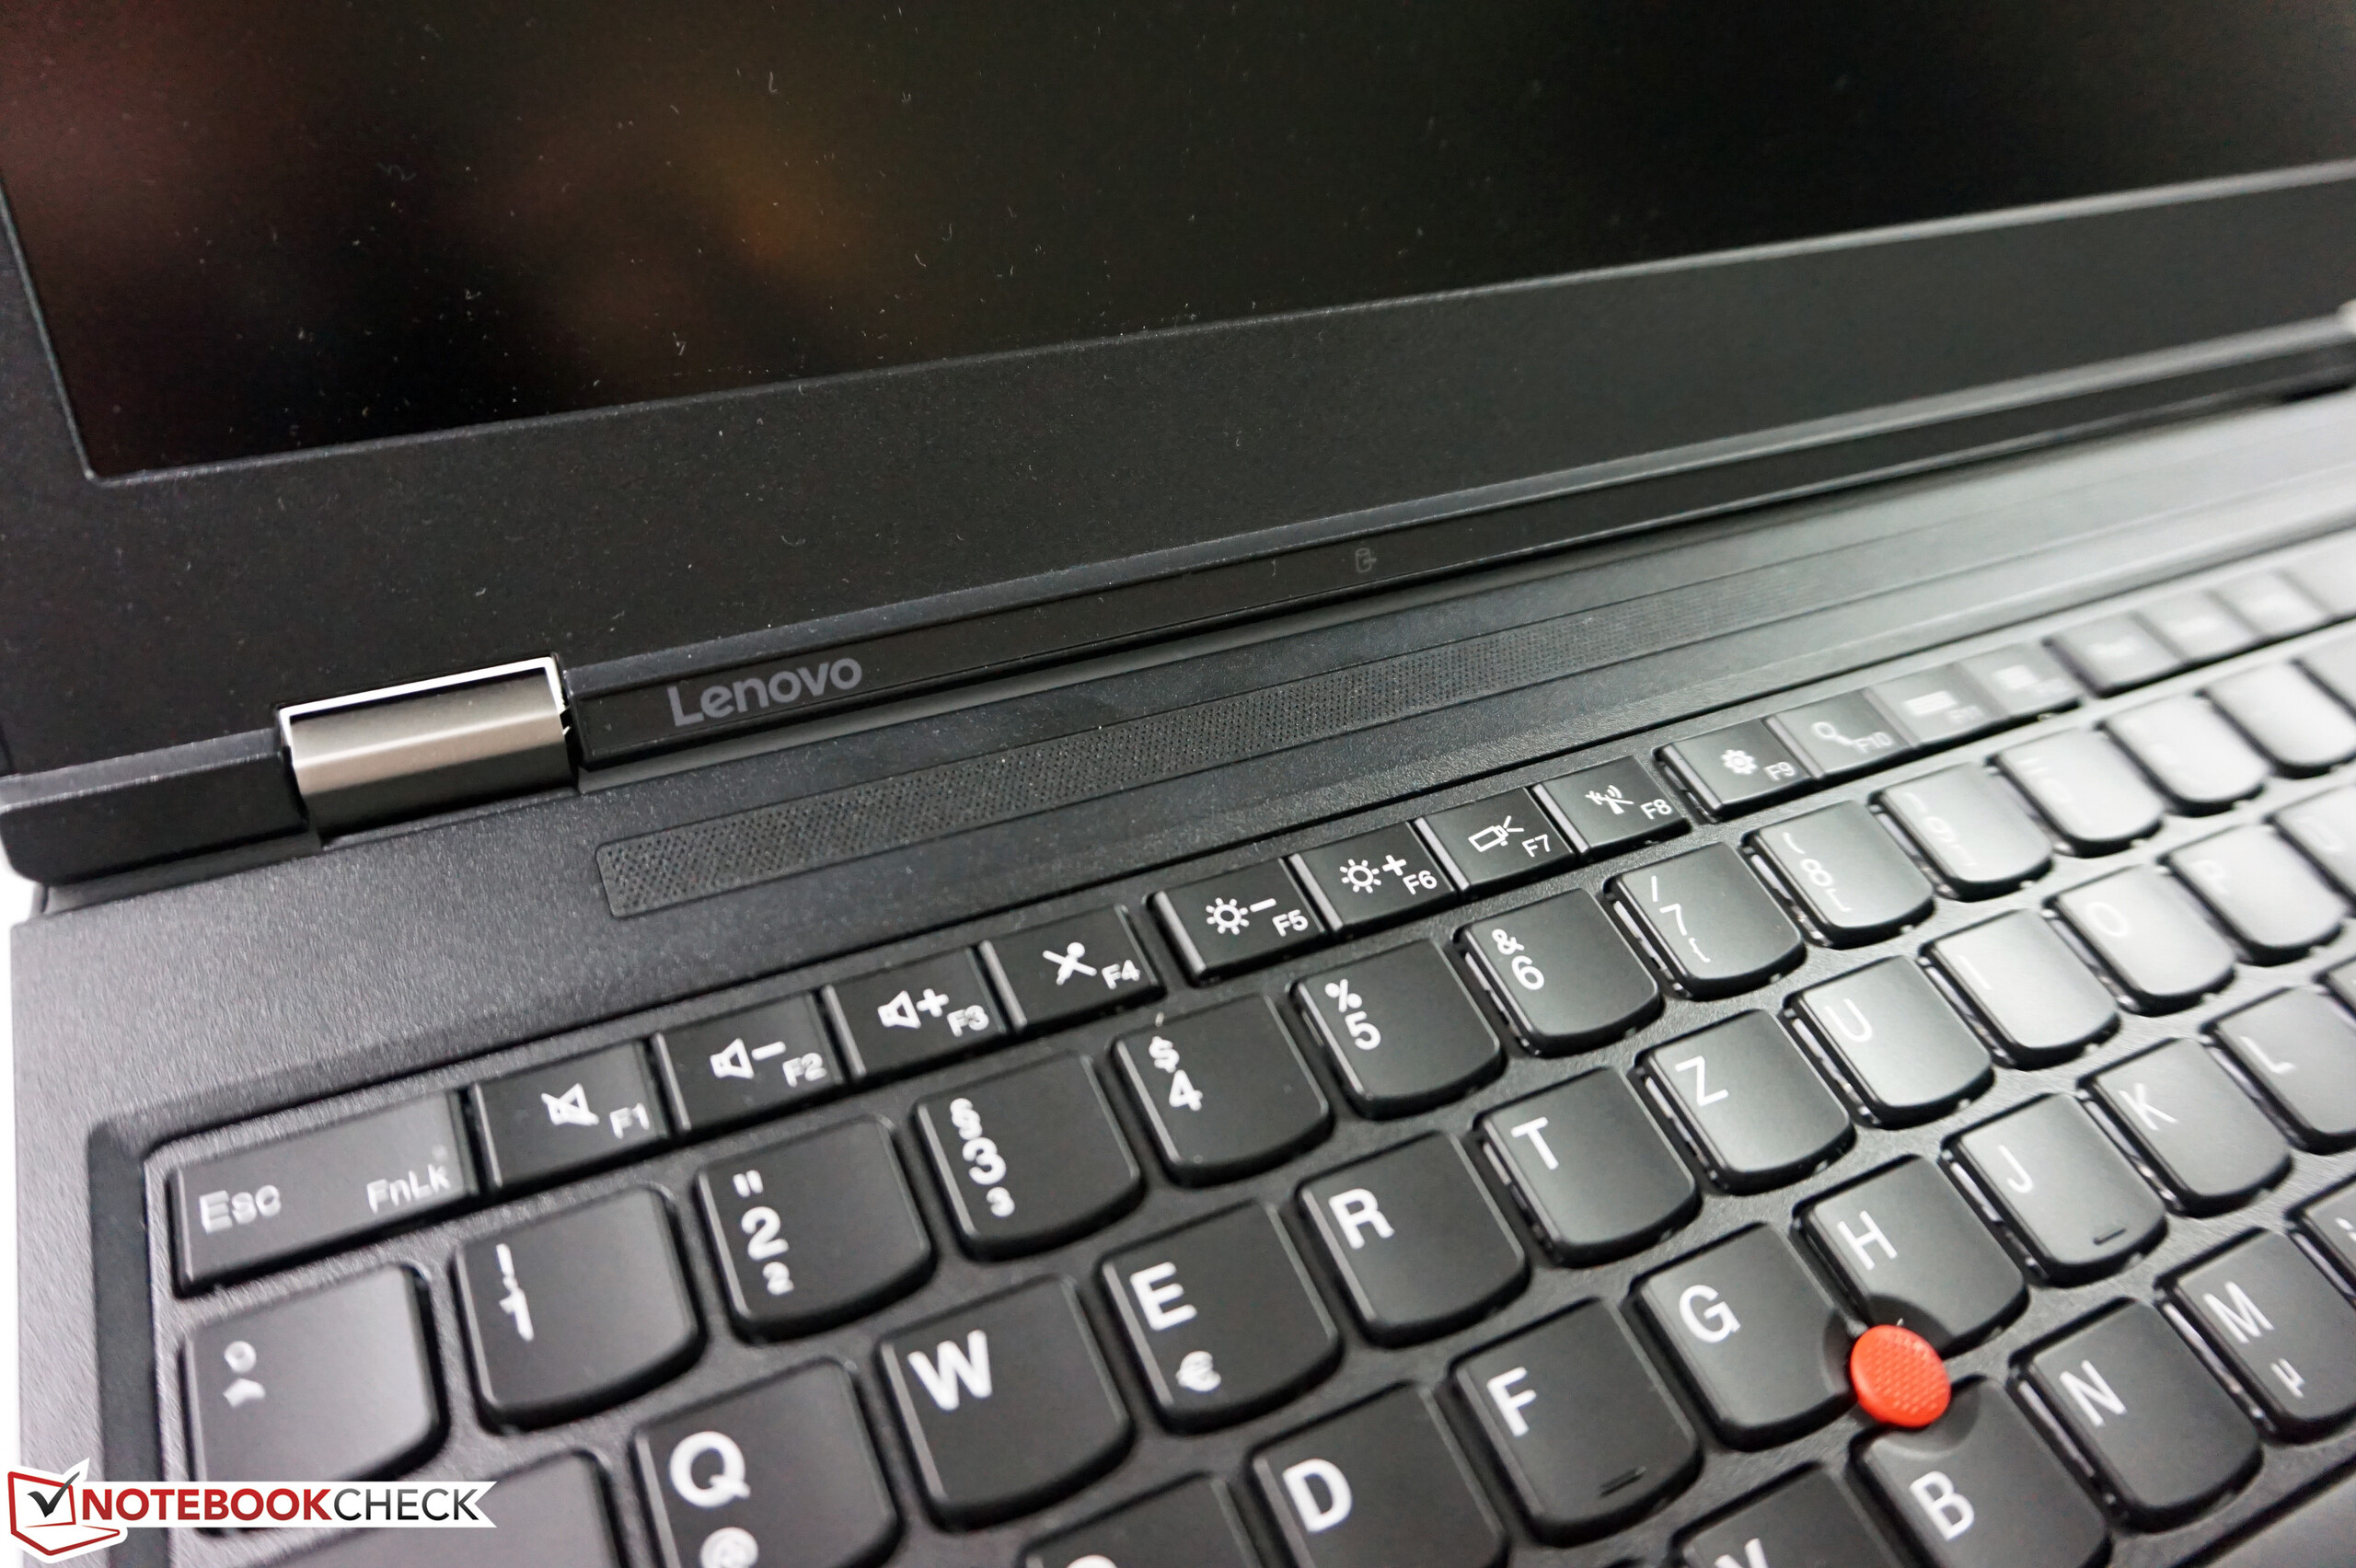
Our review unit is very similar to the previous model, so we will not cover the sections Case, Connectivity, Input Devices and Speakers in this article. The corresponding information is available in the review of the ThinkPad P50 with the Full HD display. The chassis pictures are from this device as well.
Display

We were obviously eager to try the matte 4K-IPS panel. The Full HD screen could not really impress us due to the comparatively low brightness and the small color gamut. At least the specifications of the 4K display are better: 300 nits, 1000:1 and full sRGB coverage. Our review unit is equipped with a LQ156D1JW05 panel from Sharp.
However, our initial measurements are rather sobering because while we can measure a decent maximum luminance of 276 cd/m², the average brightness is just 250 cd/m² due to the mediocre brightness distribution of 86%. This means that we are quite far from the manufacturer's claims. The contrast ratio of 801:1 (black value: 0.31 cd/m²) cannot meet the advertised value, either. So far, the 4K model is just slightly ahead of its Full HD counterpart.
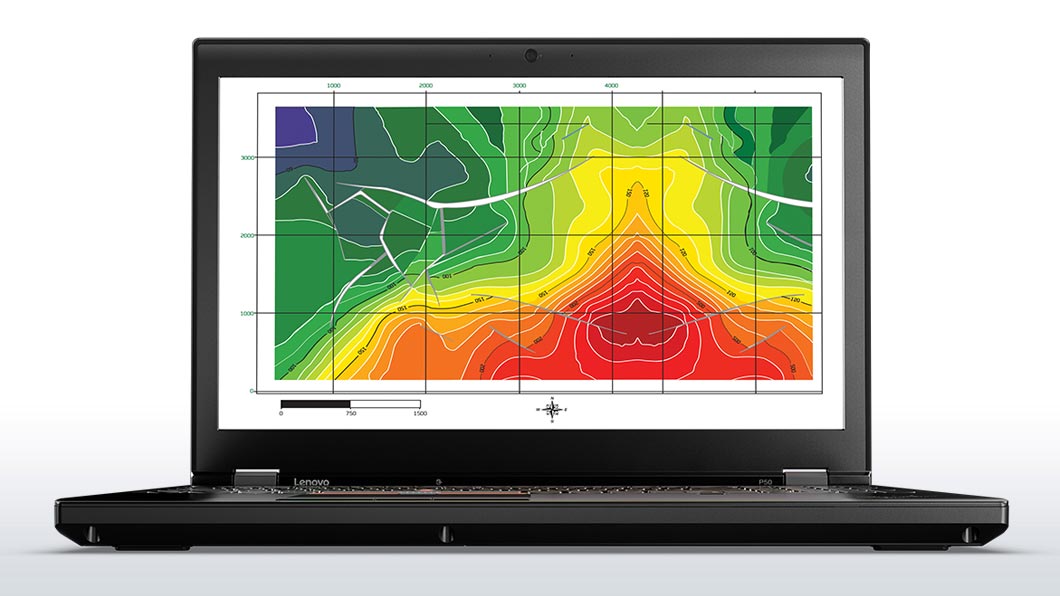
Subjectively, there is still not a whole lot to criticize. Thanks to the high resolution (282 PPI), the picture is very sharp, and the colors are also very vivid. The luminance was okay indoors, but you will want a brighter picture outdoors. Our review unit came with Windows 7 preloaded, where the maximum scaling factor is 150%. This size was still okay for us, but there are some scaling issues from time to time. Generally, we would recommend an upgrade to Windows 10 when you use the 4K panel. There is some screen bleeding at the top and the bottom, and you can also see a slight blue hue at the left edge.
Unlike the Full HD panel, the 4K screen uses PWM to control its brightness. This is the case for level 8/15 and lower at a pretty low frequency of 217 Hz, so there can be problems for sensitive users.
Screen Flickering / PWM (Pulse-Width Modulation)
| Screen flickering / PWM detected | 217 Hz | 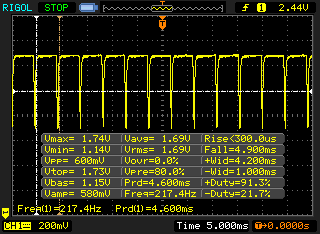 | |
The display backlight flickers at 217 Hz (worst case, e.g., utilizing PWM) . The frequency of 217 Hz is relatively low, so sensitive users will likely notice flickering and experience eyestrain at the stated brightness setting and below. In comparison: 52 % of all tested devices do not use PWM to dim the display. If PWM was detected, an average of 7784 (minimum: 5 - maximum: 343500) Hz was measured. | |||
| |||||||||||||||||||||||||
Brightness Distribution: 86 %
Center on Battery: 243 cd/m²
Contrast: 806:1 (Black: 0.31 cd/m²)
ΔE ColorChecker Calman: 4.5 | ∀{0.5-29.43 Ø4.73}
ΔE Greyscale Calman: 7.2 | ∀{0.09-98 Ø4.97}
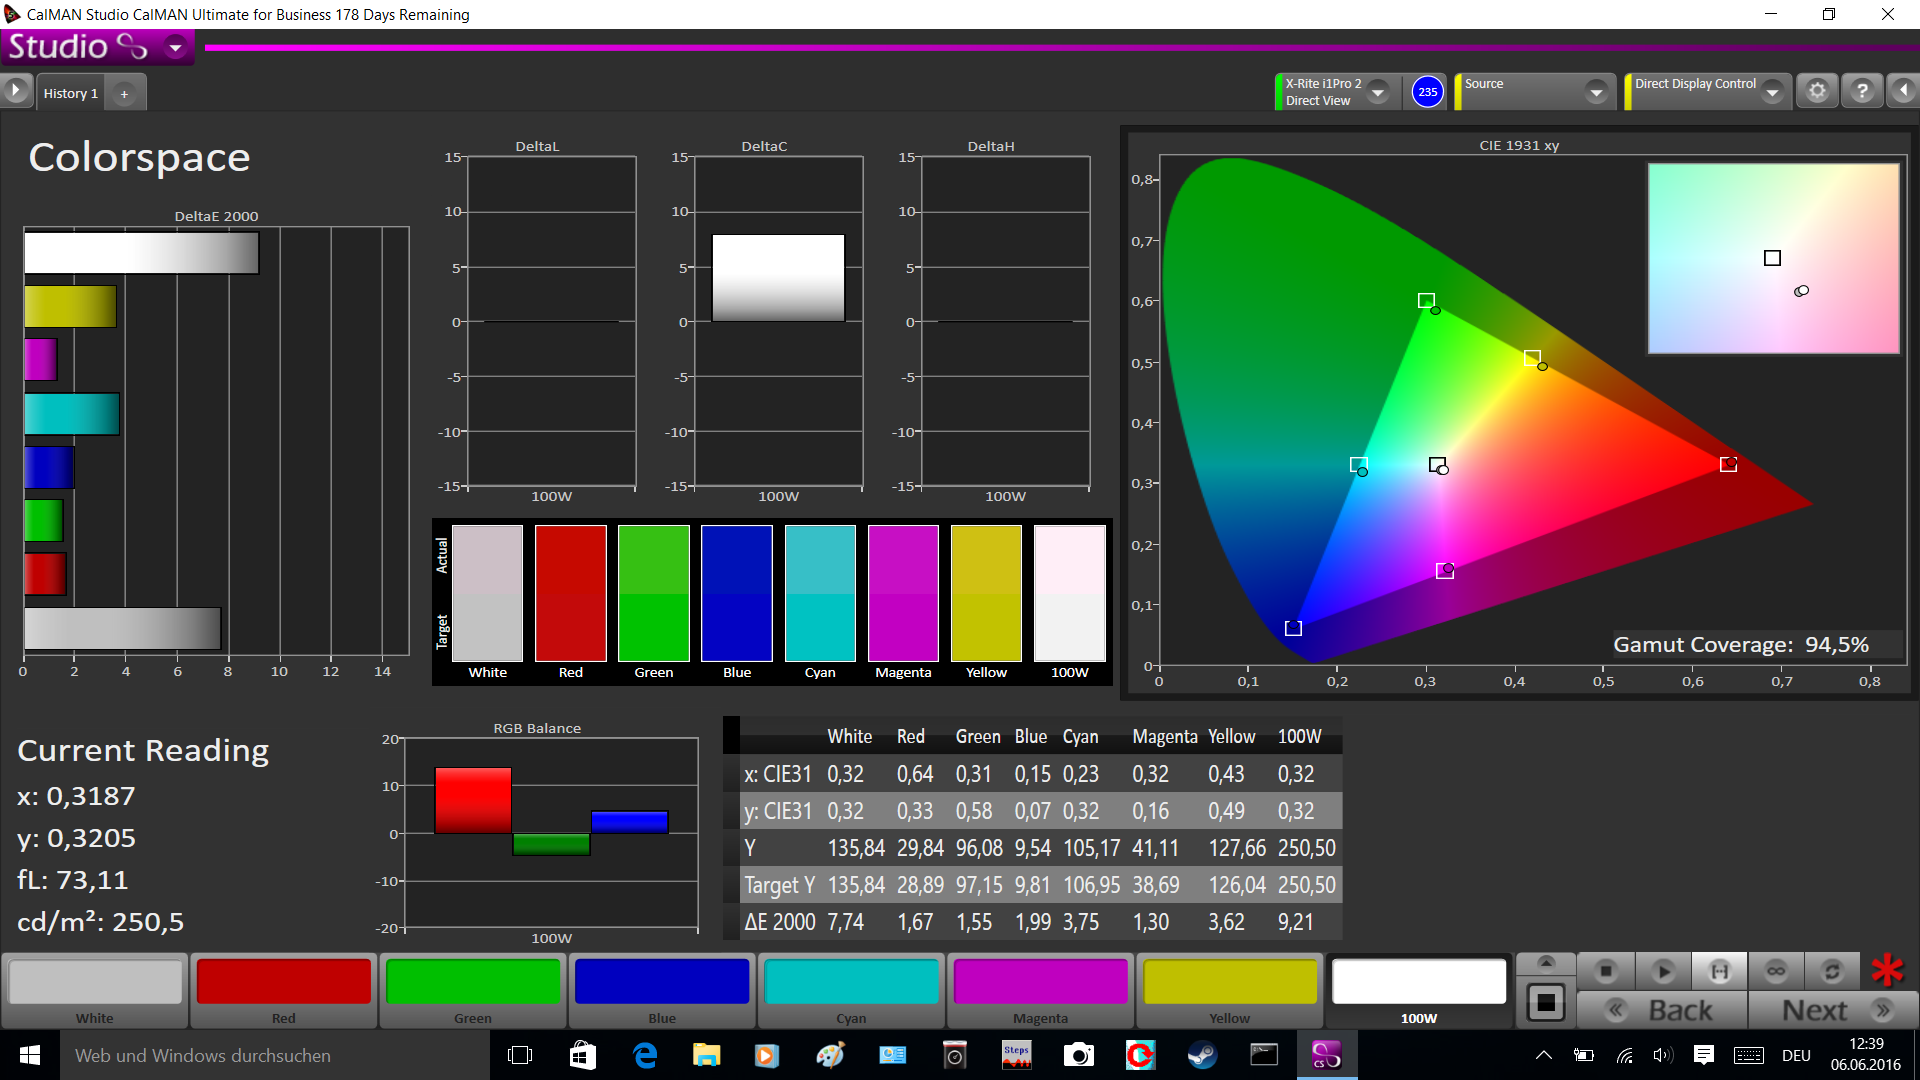
94.5% sRGB (Calman 2D)
98.6% sRGB (Argyll 1.6.3 3D)
85% AdobeRGB 1998 (Argyll 1.6.3 3D)
98.2% AdobeRGB 1998 (Argyll 3D)
98.6% sRGB (Argyll 3D)
85.8% Display P3 (Argyll 3D)
Gamma: 2.31
CCT: 6399 K
| Lenovo ThinkPad P50 3840x2160, IPS, LQ156D1JW05 | Lenovo ThinkPad P50 1920x1080, IPS, LP156WF6-SPK1 | HP ZBook 15 G3 1920x1080, UWVA-IPS, Samsung SDC5344 | Dell Precision 5510 3840x2160, IGZO LED, SHP143E, 7PHPT_LQ156D1 | Schenker W505 3840x2160, IPS, Sharp LQ156D1JW04 (SHP1436) | Lenovo ThinkPad W541 20EF000SGE 2880x1620, IPS LED, VVX16T028J00, LEN40B5 | |
|---|---|---|---|---|---|---|
| Display | -51% | -18% | 2% | -20% | -27% | |
| Display P3 Coverage (%) | 85.8 | 39.13 -54% | 66.8 -22% | 88.4 3% | 64.7 -25% | 62.5 -27% |
| sRGB Coverage (%) | 98.6 | 58.5 -41% | 95.5 -3% | 100 1% | 96.4 -2% | 86.1 -13% |
| AdobeRGB 1998 Coverage (%) | 98.2 | 40.45 -59% | 69 -30% | 99.5 1% | 66.8 -32% | 58.1 -41% |
| Response Times | -18% | -50% | -50% | |||
| Response Time Grey 50% / Grey 80% * (ms) | 39.2 ? | 46 ? -17% | 54 ? -38% | 56.4 ? -44% | ||
| Response Time Black / White * (ms) | 22 ? | 26 ? -18% | 35.6 ? -62% | 34 ? -55% | ||
| PWM Frequency (Hz) | 217 | 198 ? | ||||
| Screen | -2% | -1% | 16% | 11% | 3% | |
| Brightness middle (cd/m²) | 250 | 263 5% | 306 22% | 391 56% | 288 15% | 360 44% |
| Brightness (cd/m²) | 250 | 236 -6% | 289 16% | 361 44% | 293 17% | 330 32% |
| Brightness Distribution (%) | 86 | 78 -9% | 85 -1% | 87 1% | 93 8% | 87 1% |
| Black Level * (cd/m²) | 0.31 | 0.34 -10% | 0.34 -10% | 0.4 -29% | 0.27 13% | 0.57 -84% |
| Contrast (:1) | 806 | 774 -4% | 900 12% | 978 21% | 1067 32% | 632 -22% |
| Colorchecker dE 2000 * | 4.5 | 2.35 48% | 5.1 -13% | 4.85 -8% | 3.76 16% | 2.85 37% |
| Colorchecker dE 2000 max. * | 9.3 | 9.9 -6% | ||||
| Greyscale dE 2000 * | 7.2 | 3.33 54% | 7.4 -3% | 4.01 44% | 4.83 33% | 4.29 40% |
| Gamma | 2.31 95% | 2.38 92% | 2.37 93% | 2.18 101% | 2.39 92% | 2.32 95% |
| CCT | 6399 102% | 6917 94% | 7263 89% | 7340 89% | 7602 86% | 6310 103% |
| Color Space (Percent of AdobeRGB 1998) (%) | 85 | 37 -56% | 63 -26% | 96 13% | 61 -28% | 62 -27% |
| Color Space (Percent of sRGB) (%) | 98.6 | 58 -41% | 95 -4% | 100 1% | 96 -3% | |
| Total Average (Program / Settings) | -24% /
-15% | -23% /
-11% | -11% /
4% | -5% /
4% | -12% /
-5% |
* ... smaller is better
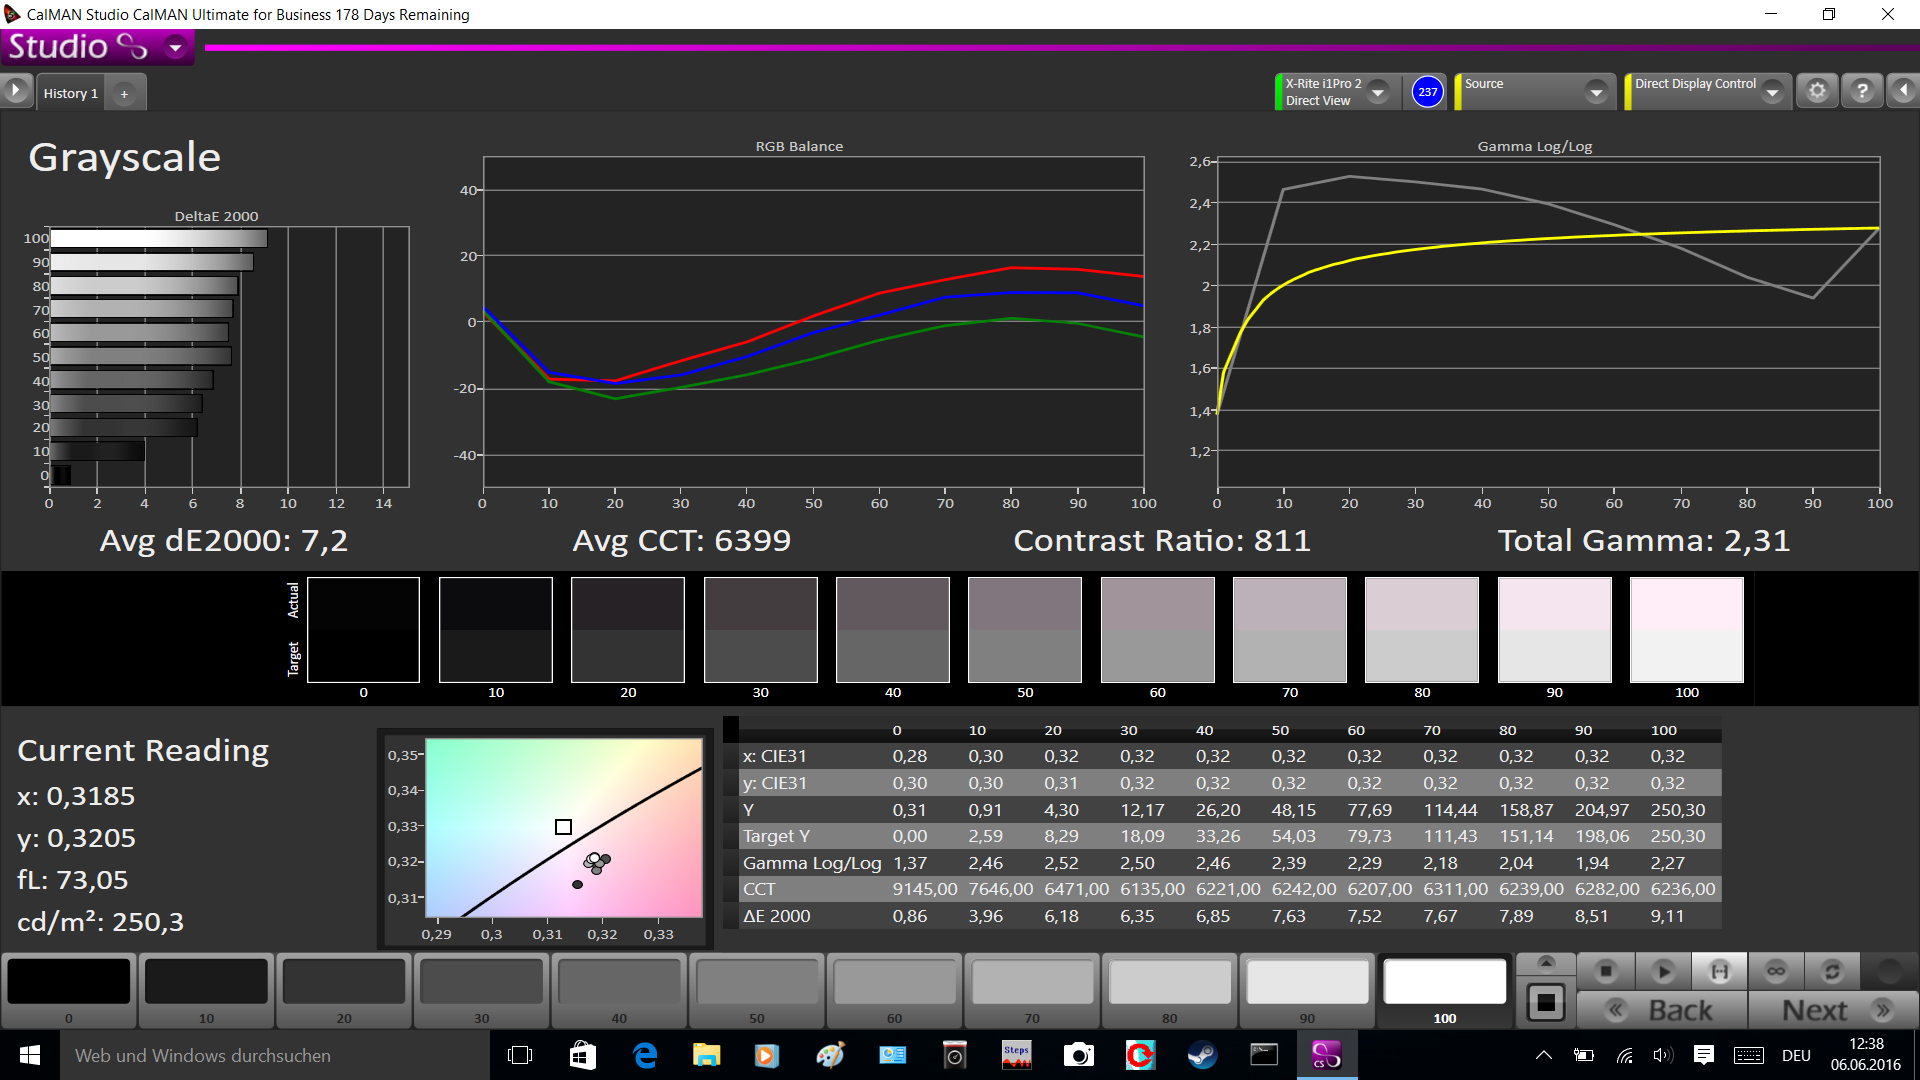
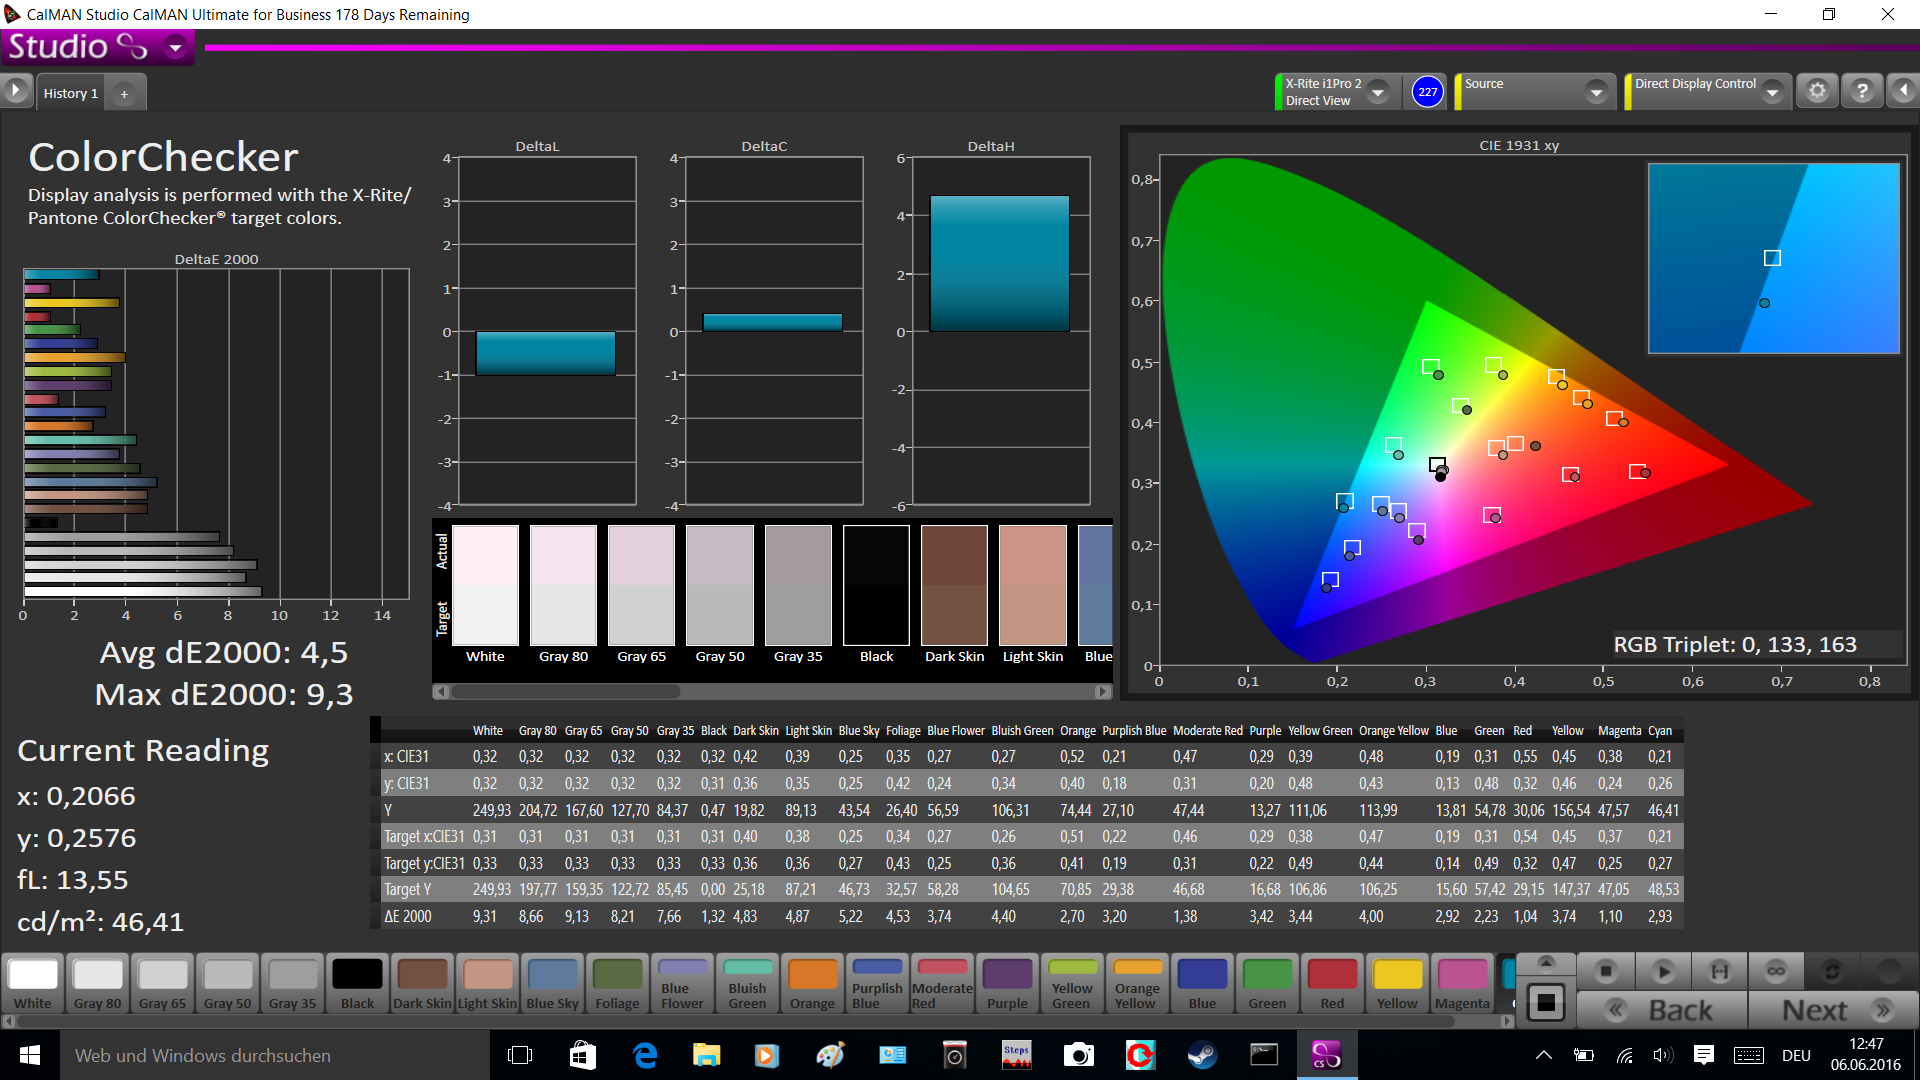
The ThinkPad P50 is once again equipped with an integrated Pantone colorimeter, so we use the calibrated results for our database. However, the performance in combination with the 4K screen is hardly convenient. The average DeltaE 2000 deviations compared to the sRGB reference are 7.2 for the grayscale and 4.5 for the colors, while the target values should be smaller than 3 in both cases. We can also notice a slight red cast.
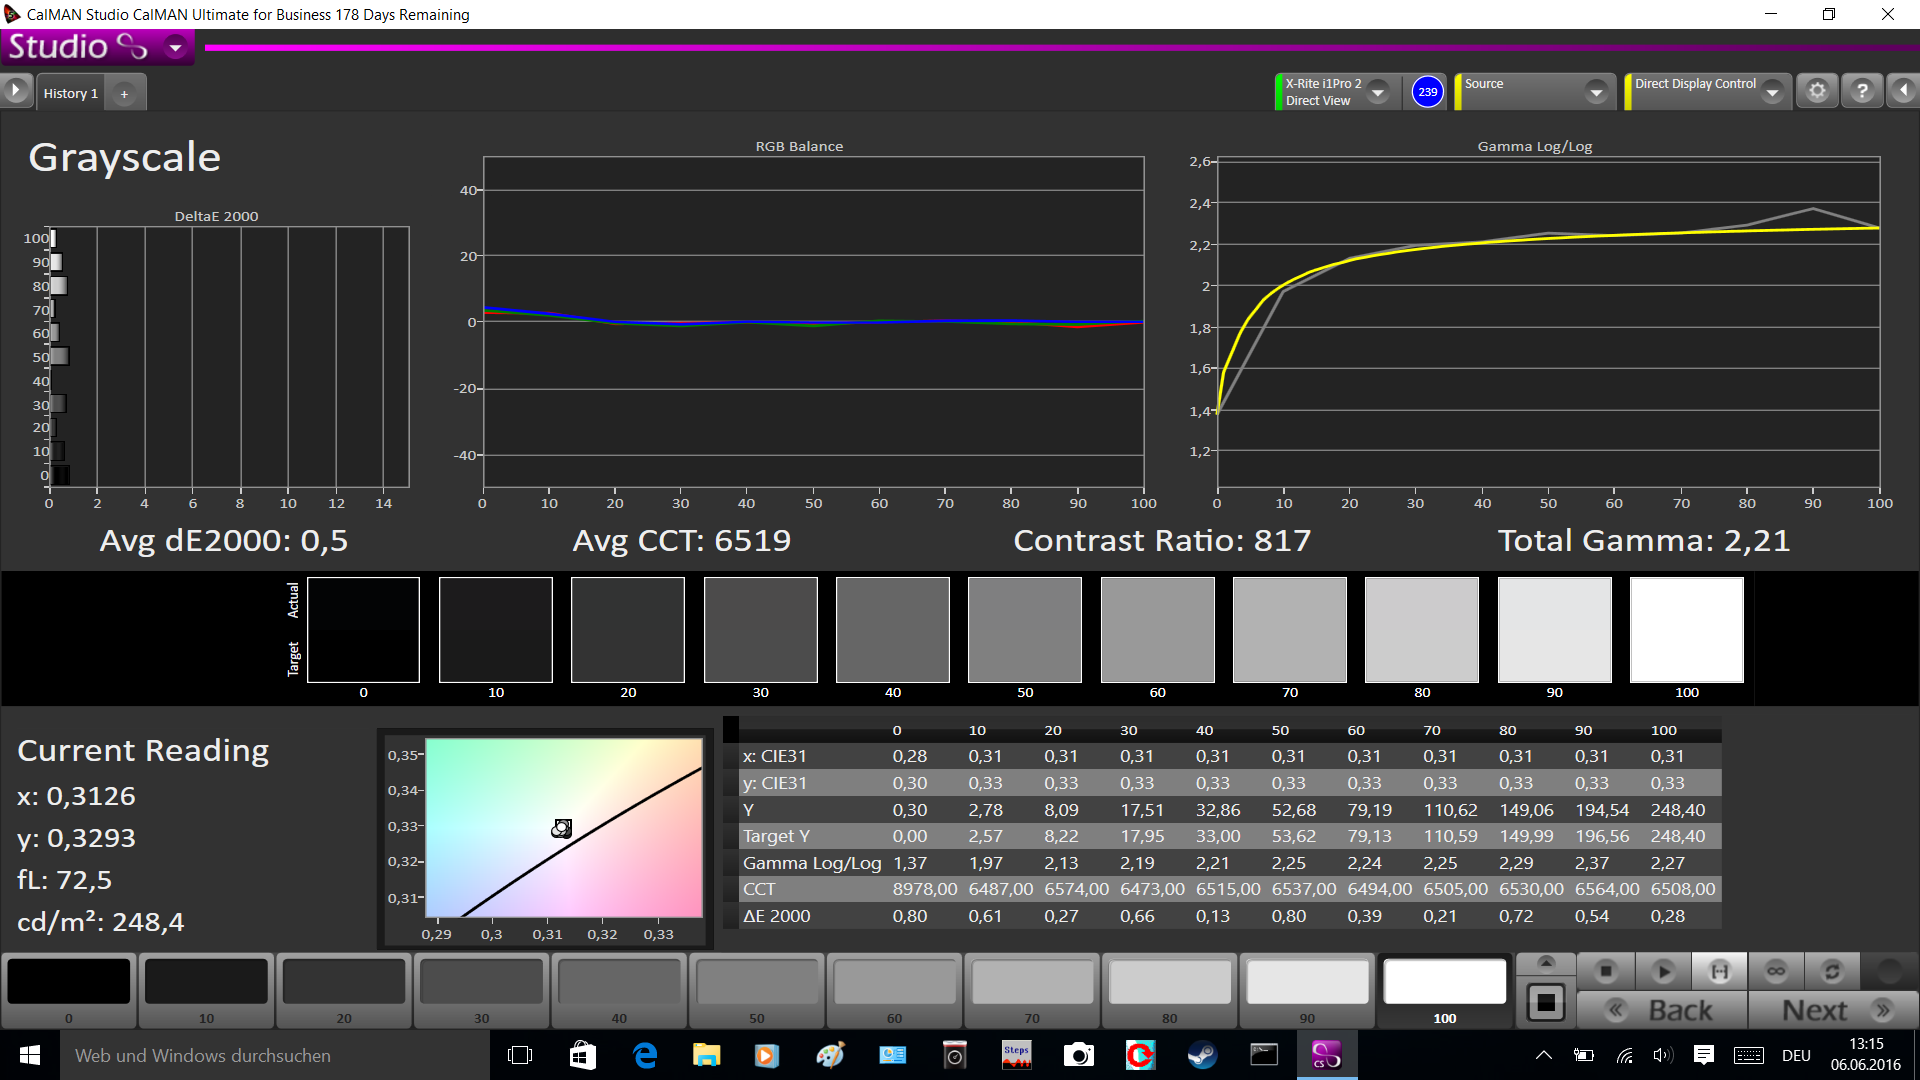
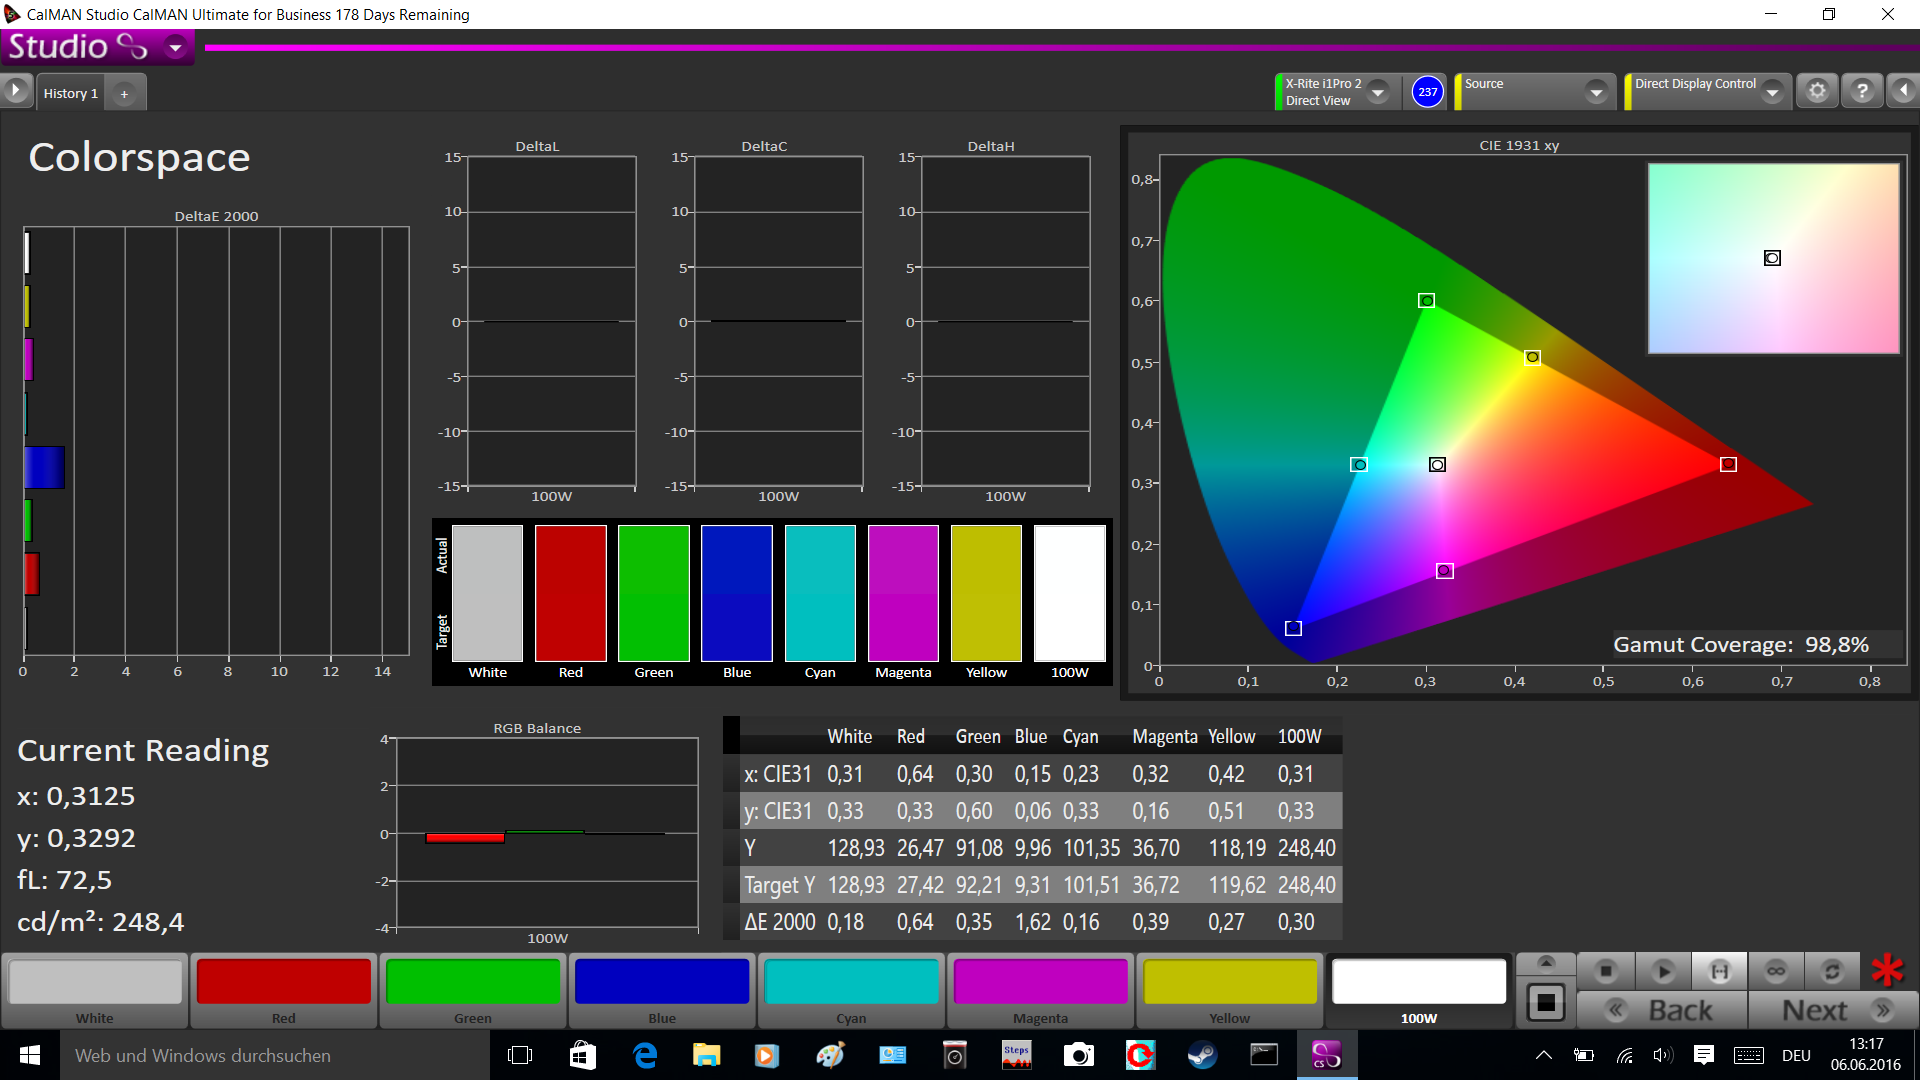
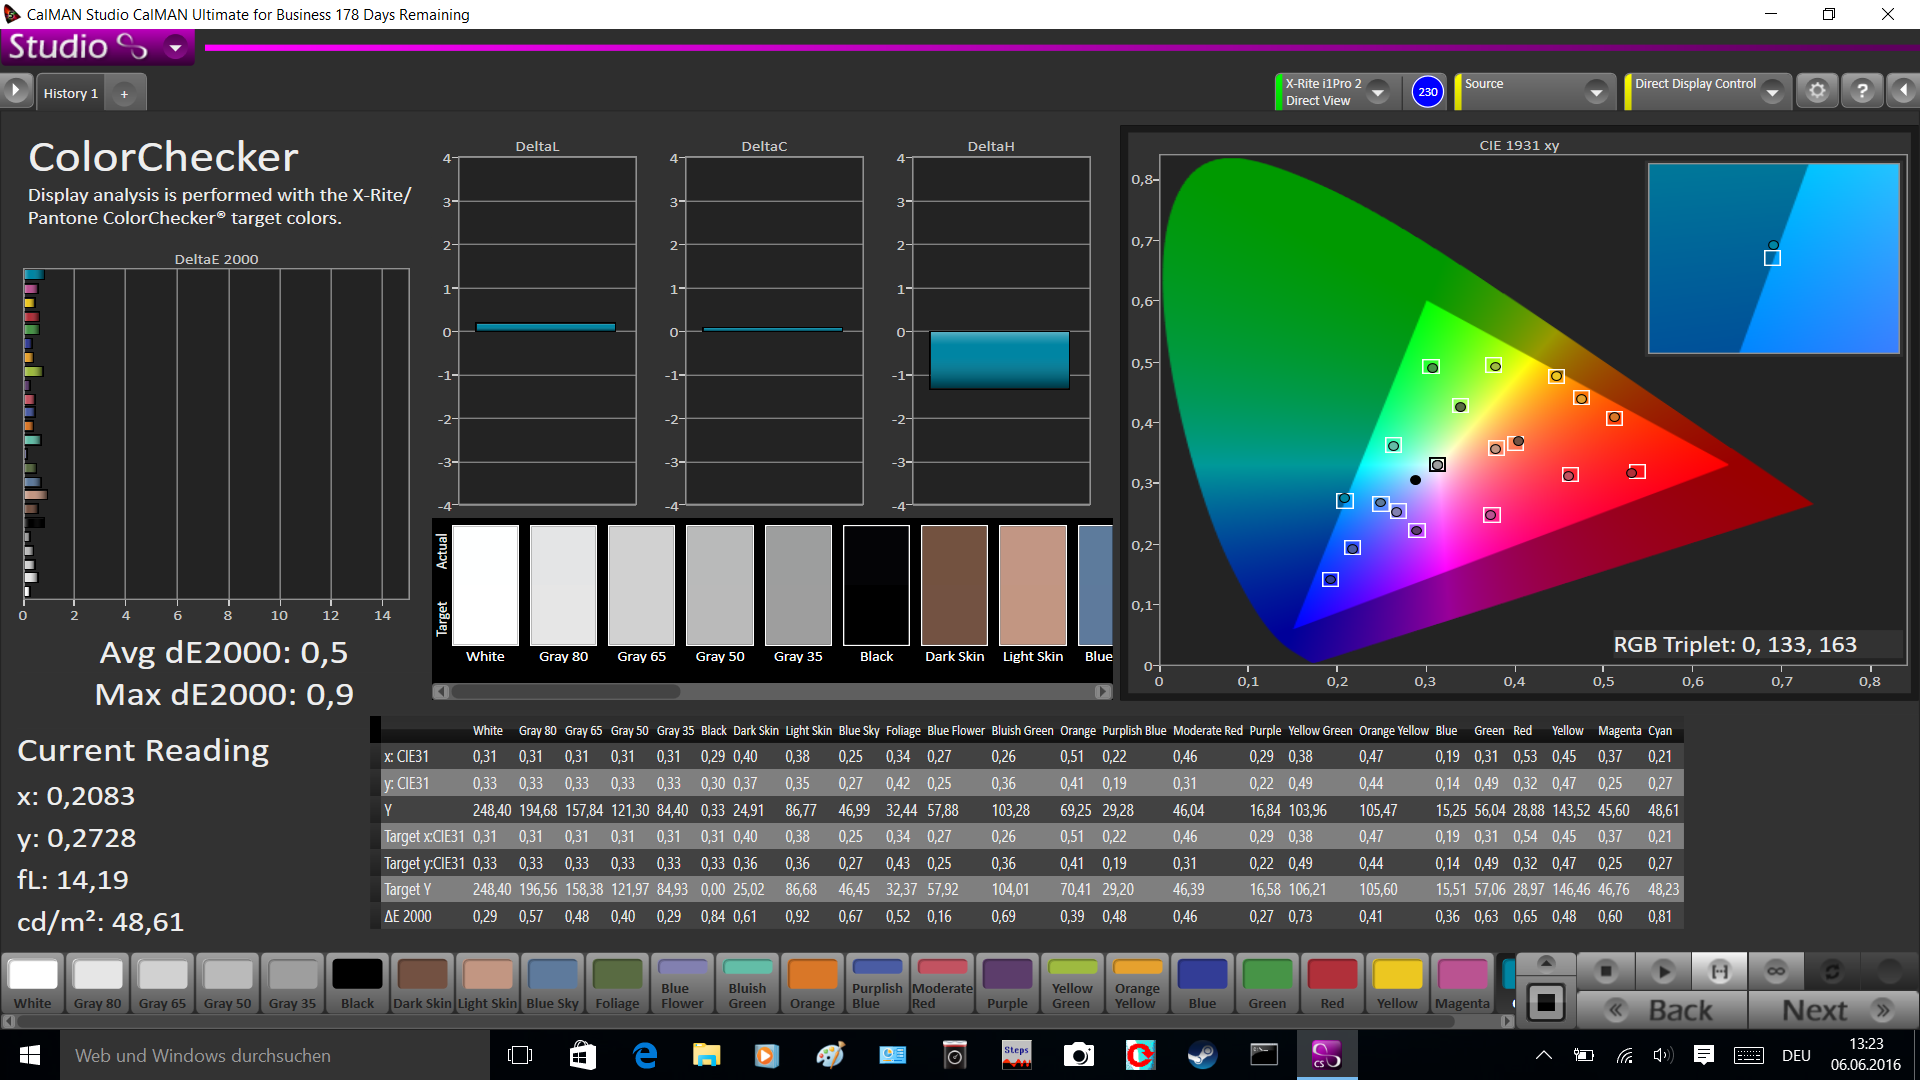
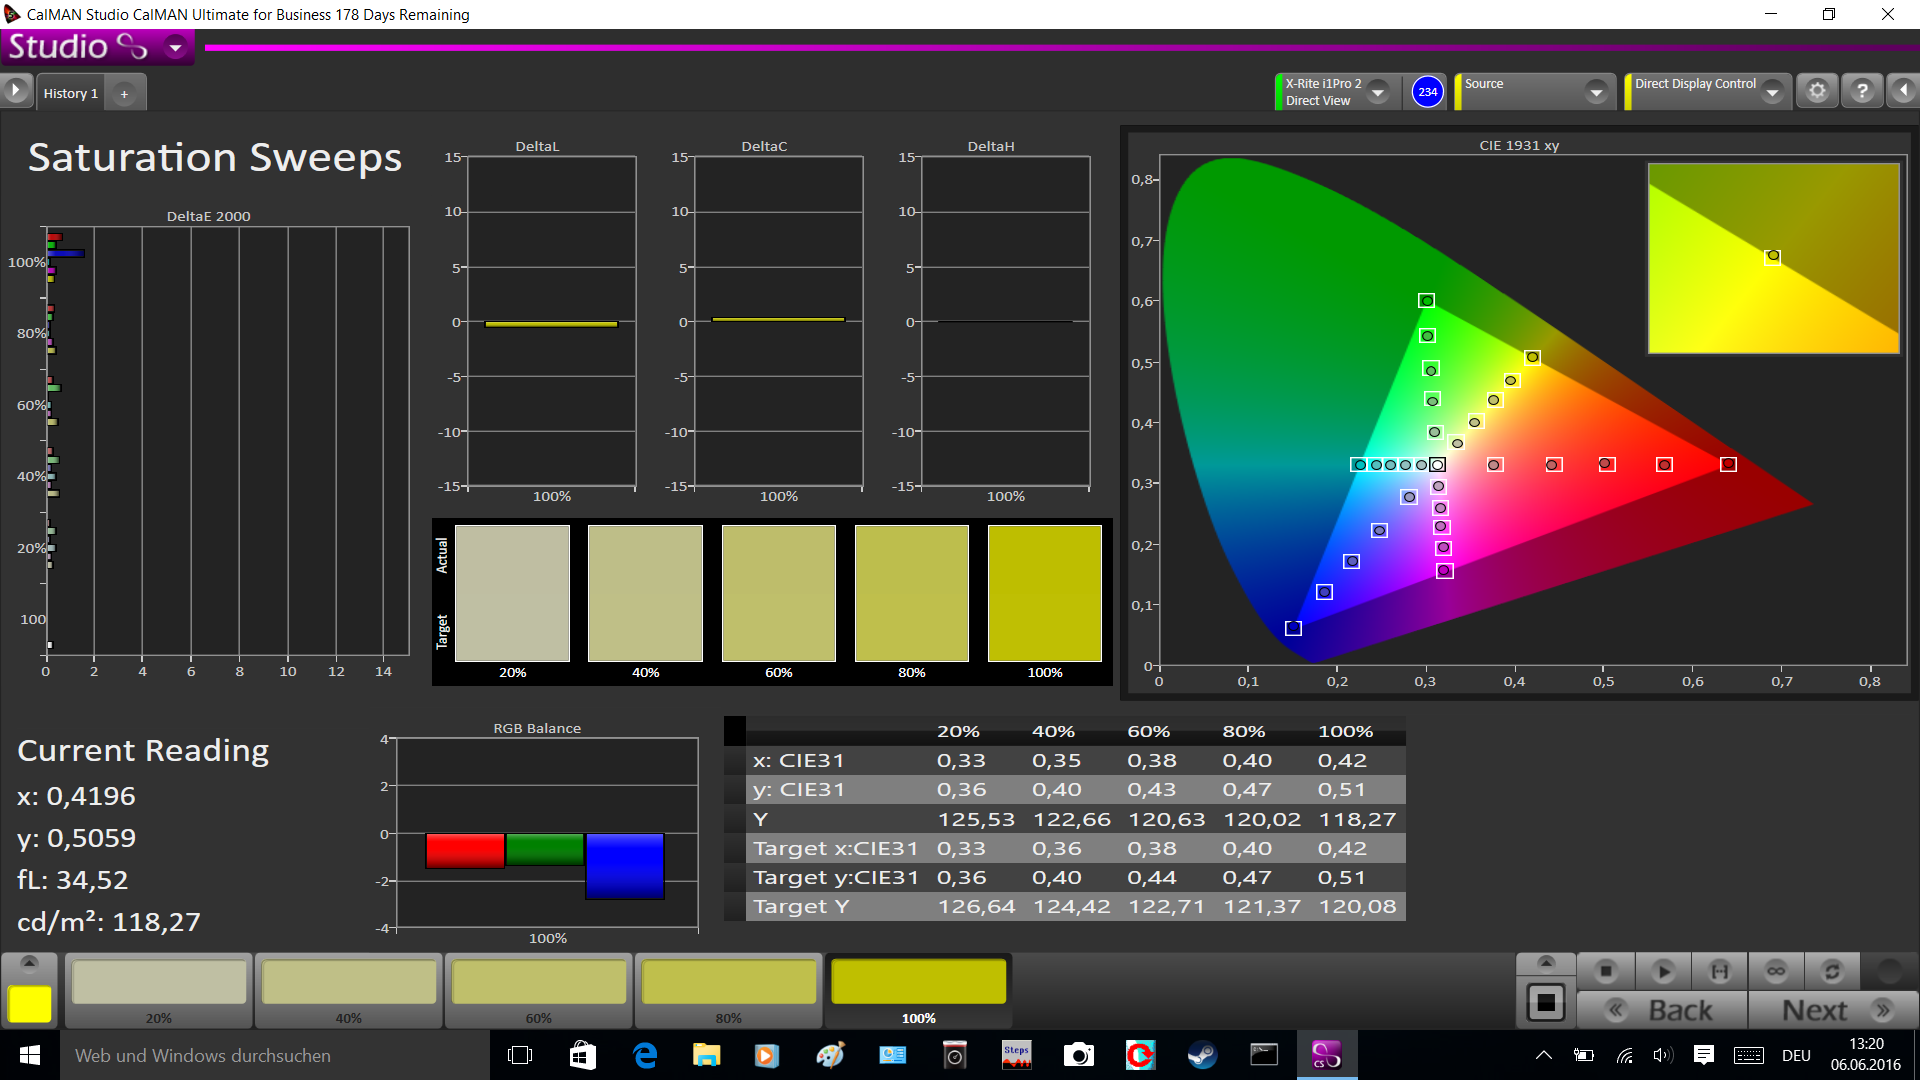
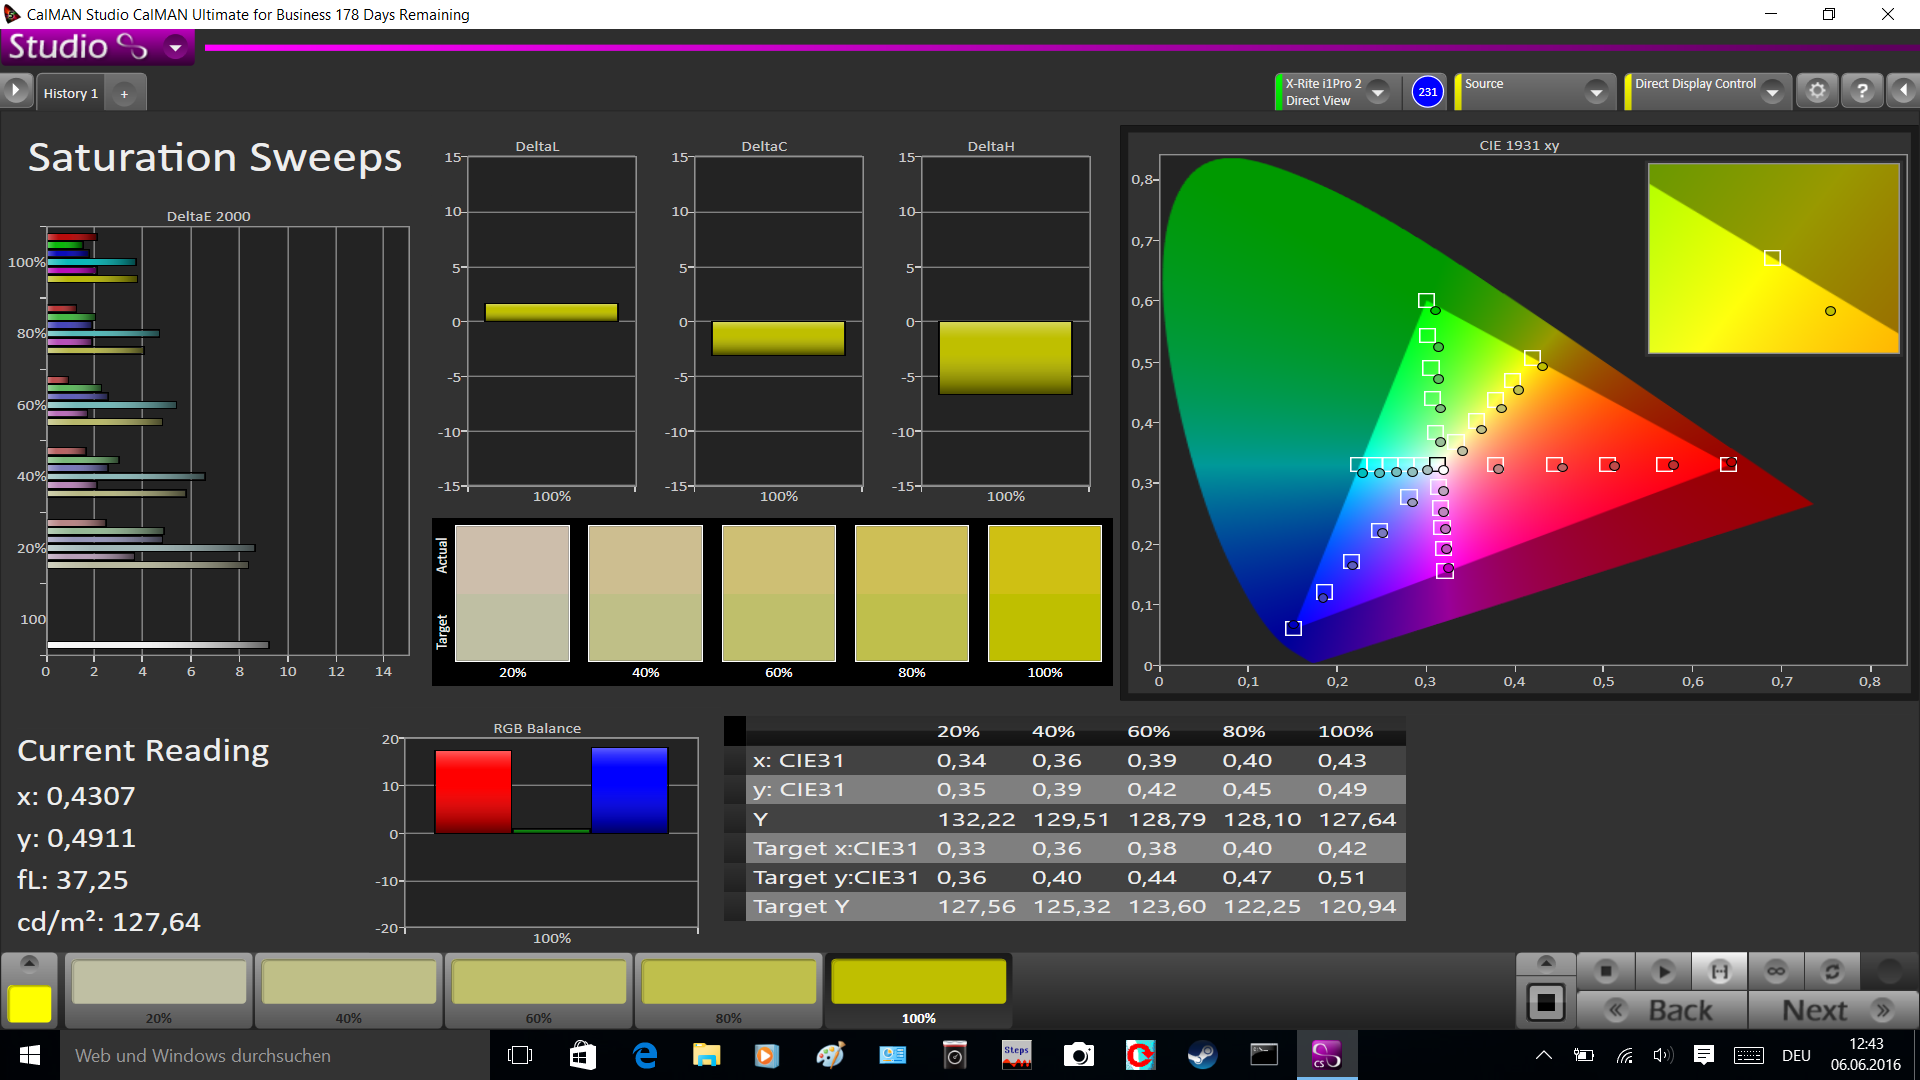
The full potential of the display is revealed by our calibration with the spectrophotometer X-Rite i1 Basic 2 and the software CalMAN. The deviations of the grayscale and the colors (0.5 each) are on a reference level, and the red cast is gone as well. Both the color temperature as well as the gamma value are close to their respective ideal values, too. However, this was also the case for the Full HD model.
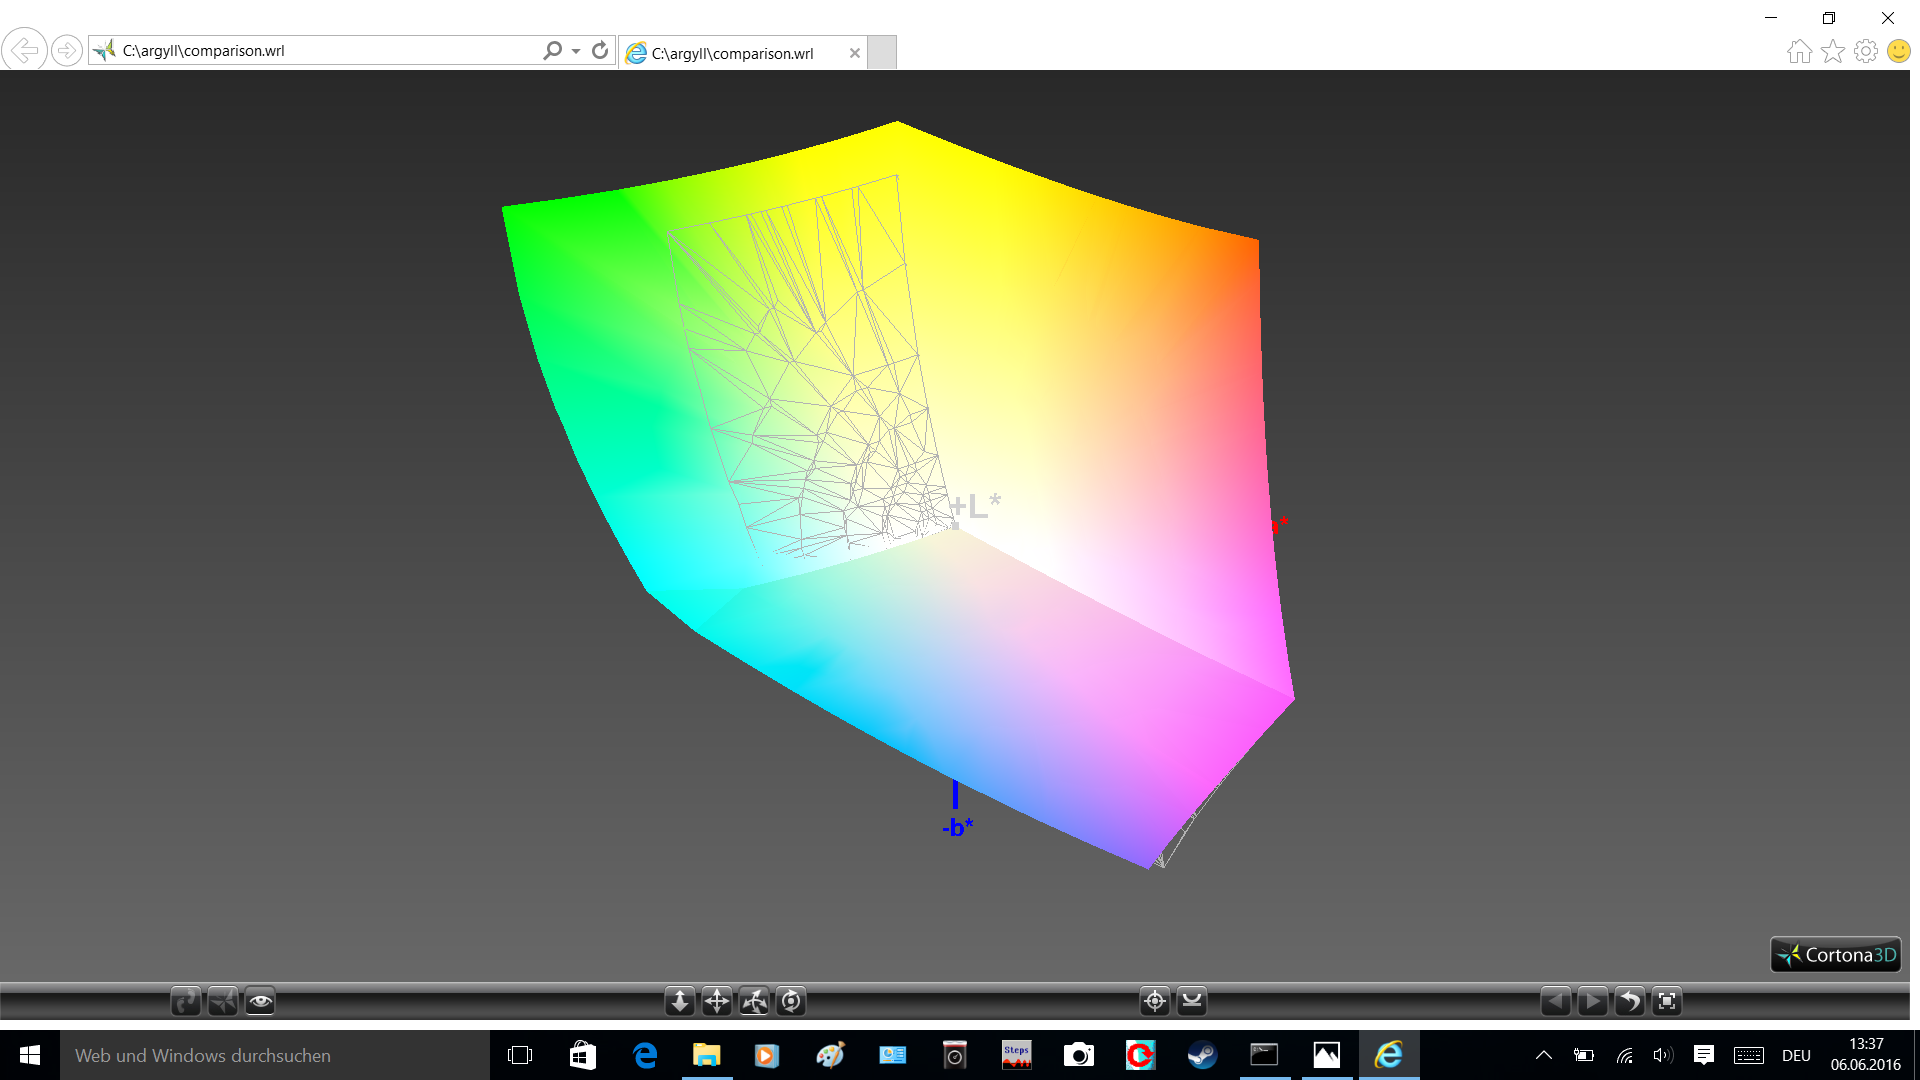
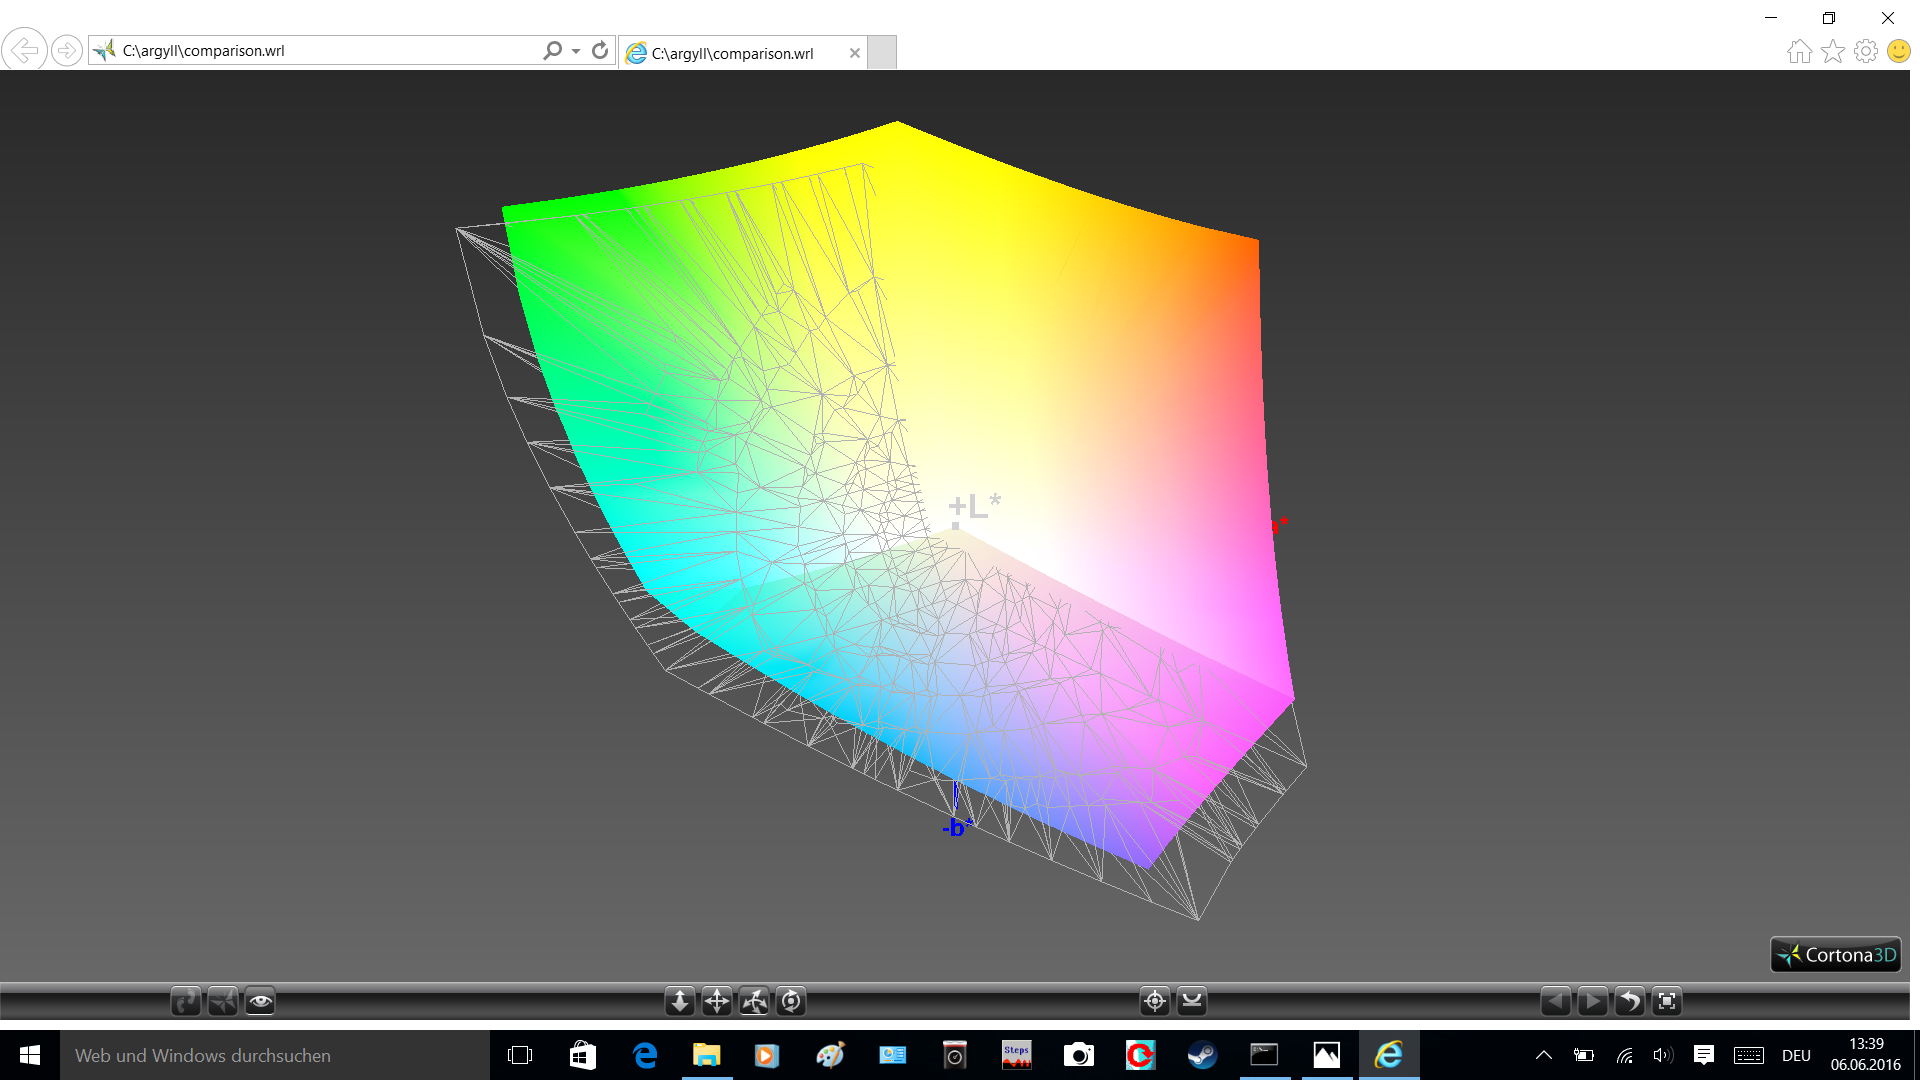
We can see a clear advantage for the 4K panel in terms of color gamut, because sRGB is covered almost completely and AdobeRGB still by 85%. The high-resolution screen is therefore clearly the better choice for professional tasks.
Display Response Times
| ↔ Response Time Black to White | ||
|---|---|---|
| 22 ms ... rise ↗ and fall ↘ combined | ↗ 7 ms rise | 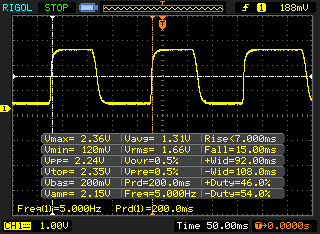 |
| ↘ 15 ms fall | ||
| The screen shows good response rates in our tests, but may be too slow for competitive gamers. In comparison, all tested devices range from 0.1 (minimum) to 240 (maximum) ms. » 48 % of all devices are better. This means that the measured response time is worse than the average of all tested devices (19.9 ms). | ||
| ↔ Response Time 50% Grey to 80% Grey | ||
| 39.2 ms ... rise ↗ and fall ↘ combined | ↗ 14.8 ms rise | 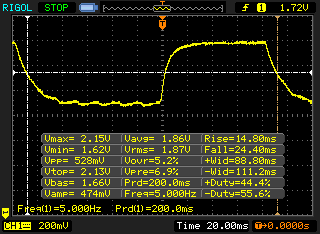 |
| ↘ 24.4 ms fall | ||
| The screen shows slow response rates in our tests and will be unsatisfactory for gamers. In comparison, all tested devices range from 0.165 (minimum) to 636 (maximum) ms. » 60 % of all devices are better. This means that the measured response time is worse than the average of all tested devices (31.1 ms). | ||
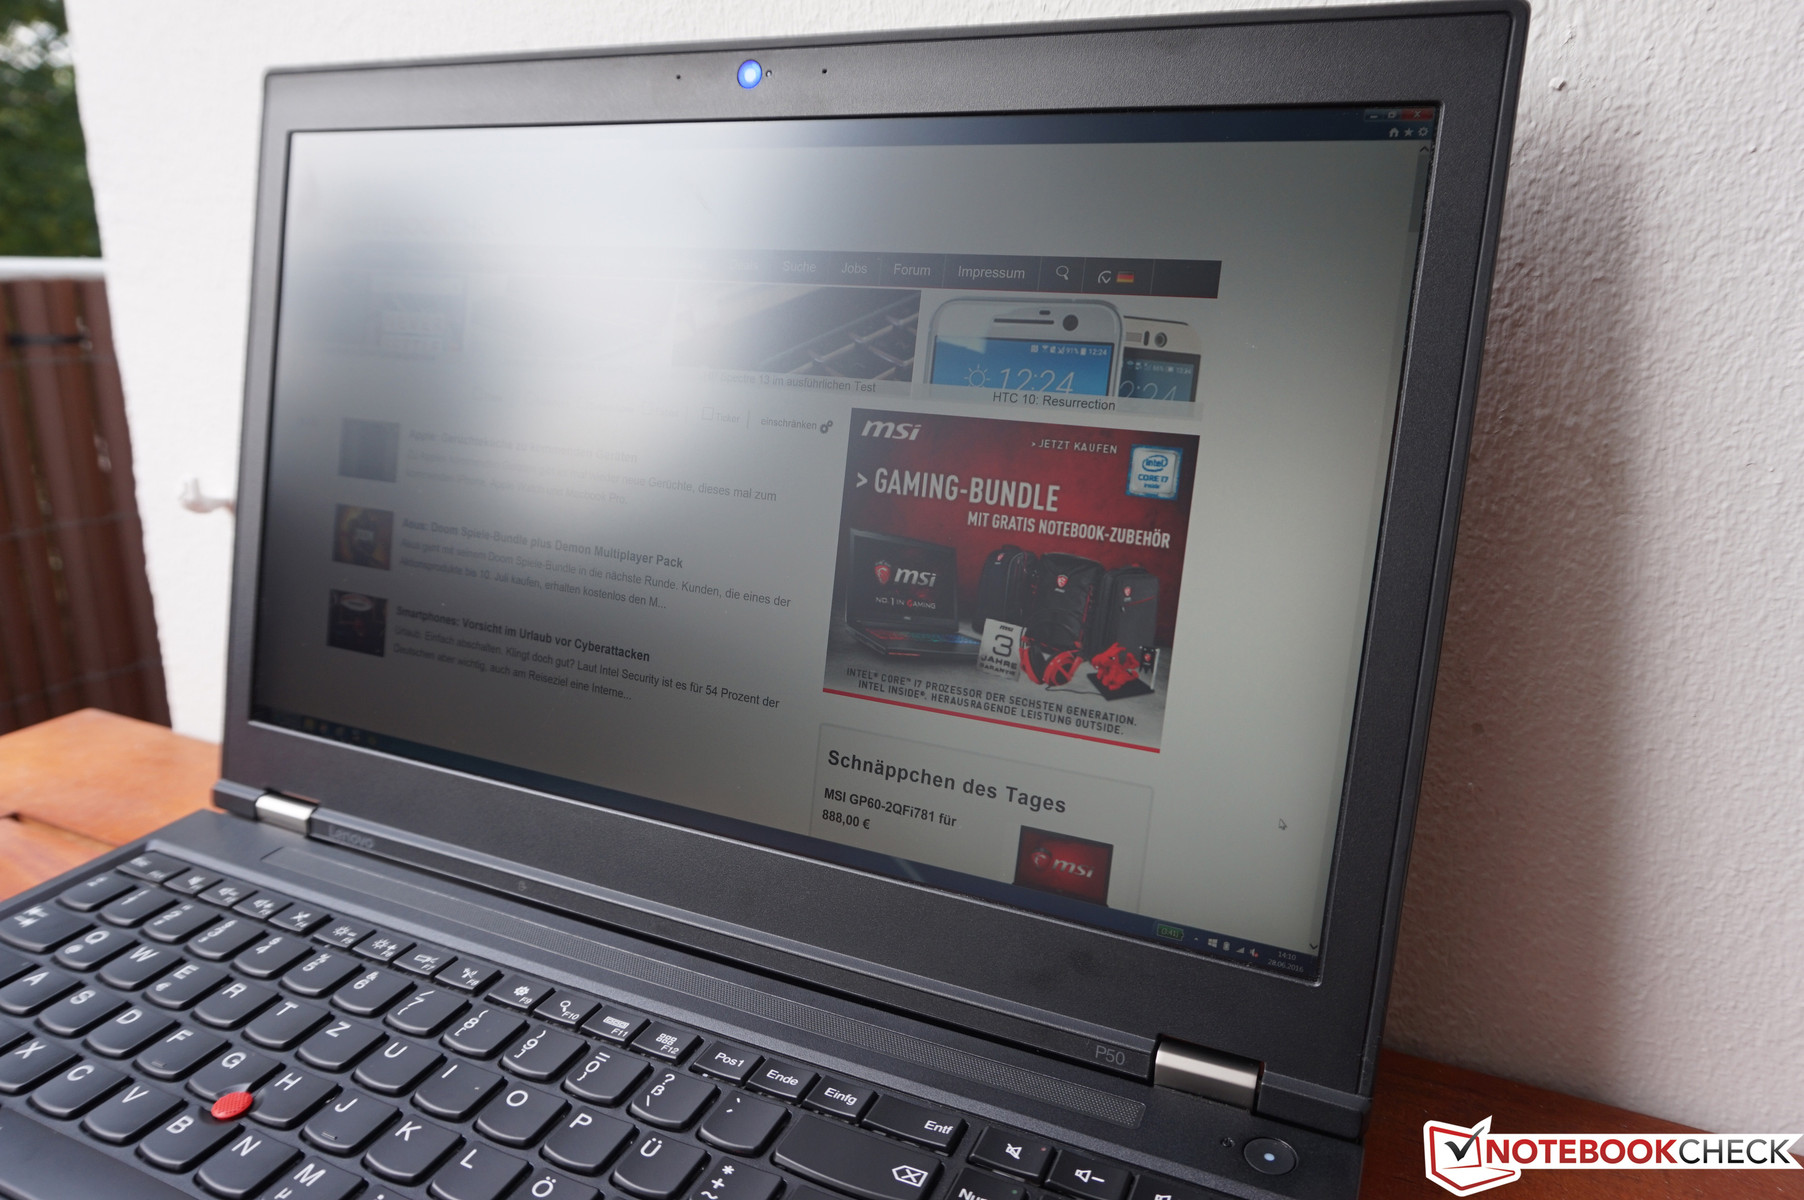
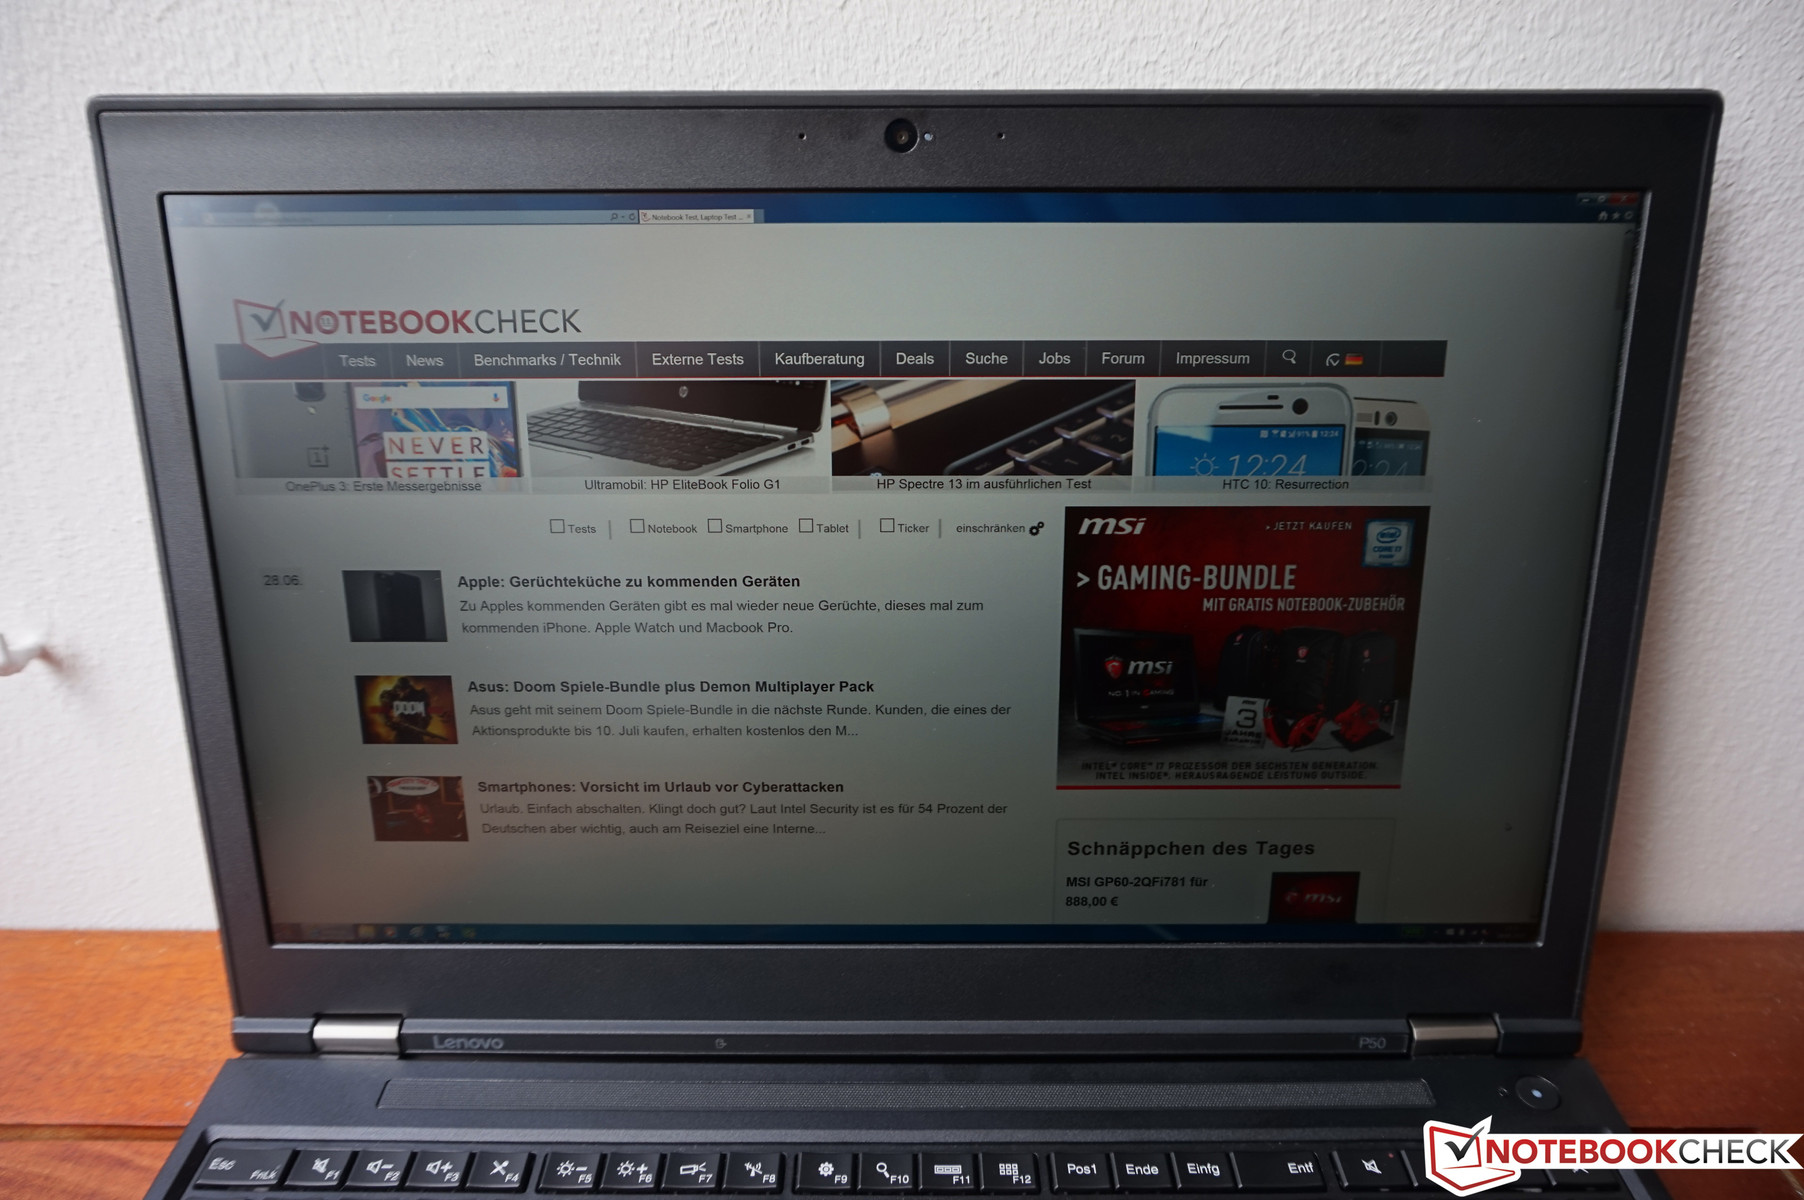
The ThinkPad P50 benefits from the matte screen surface outdoors, but we would still like to see a more powerful background illumination in brighter environments. You can still see the display content, but the eyes can become tired rather quickly.
As with the FHD model, the IPS technology ensures wide viewing angles, but once again we can see a comparatively quick brightness drop when we change the viewing angle. Our photo montage enhances the effect slightly. The colors, however, are stable even from flat angles.

Performance
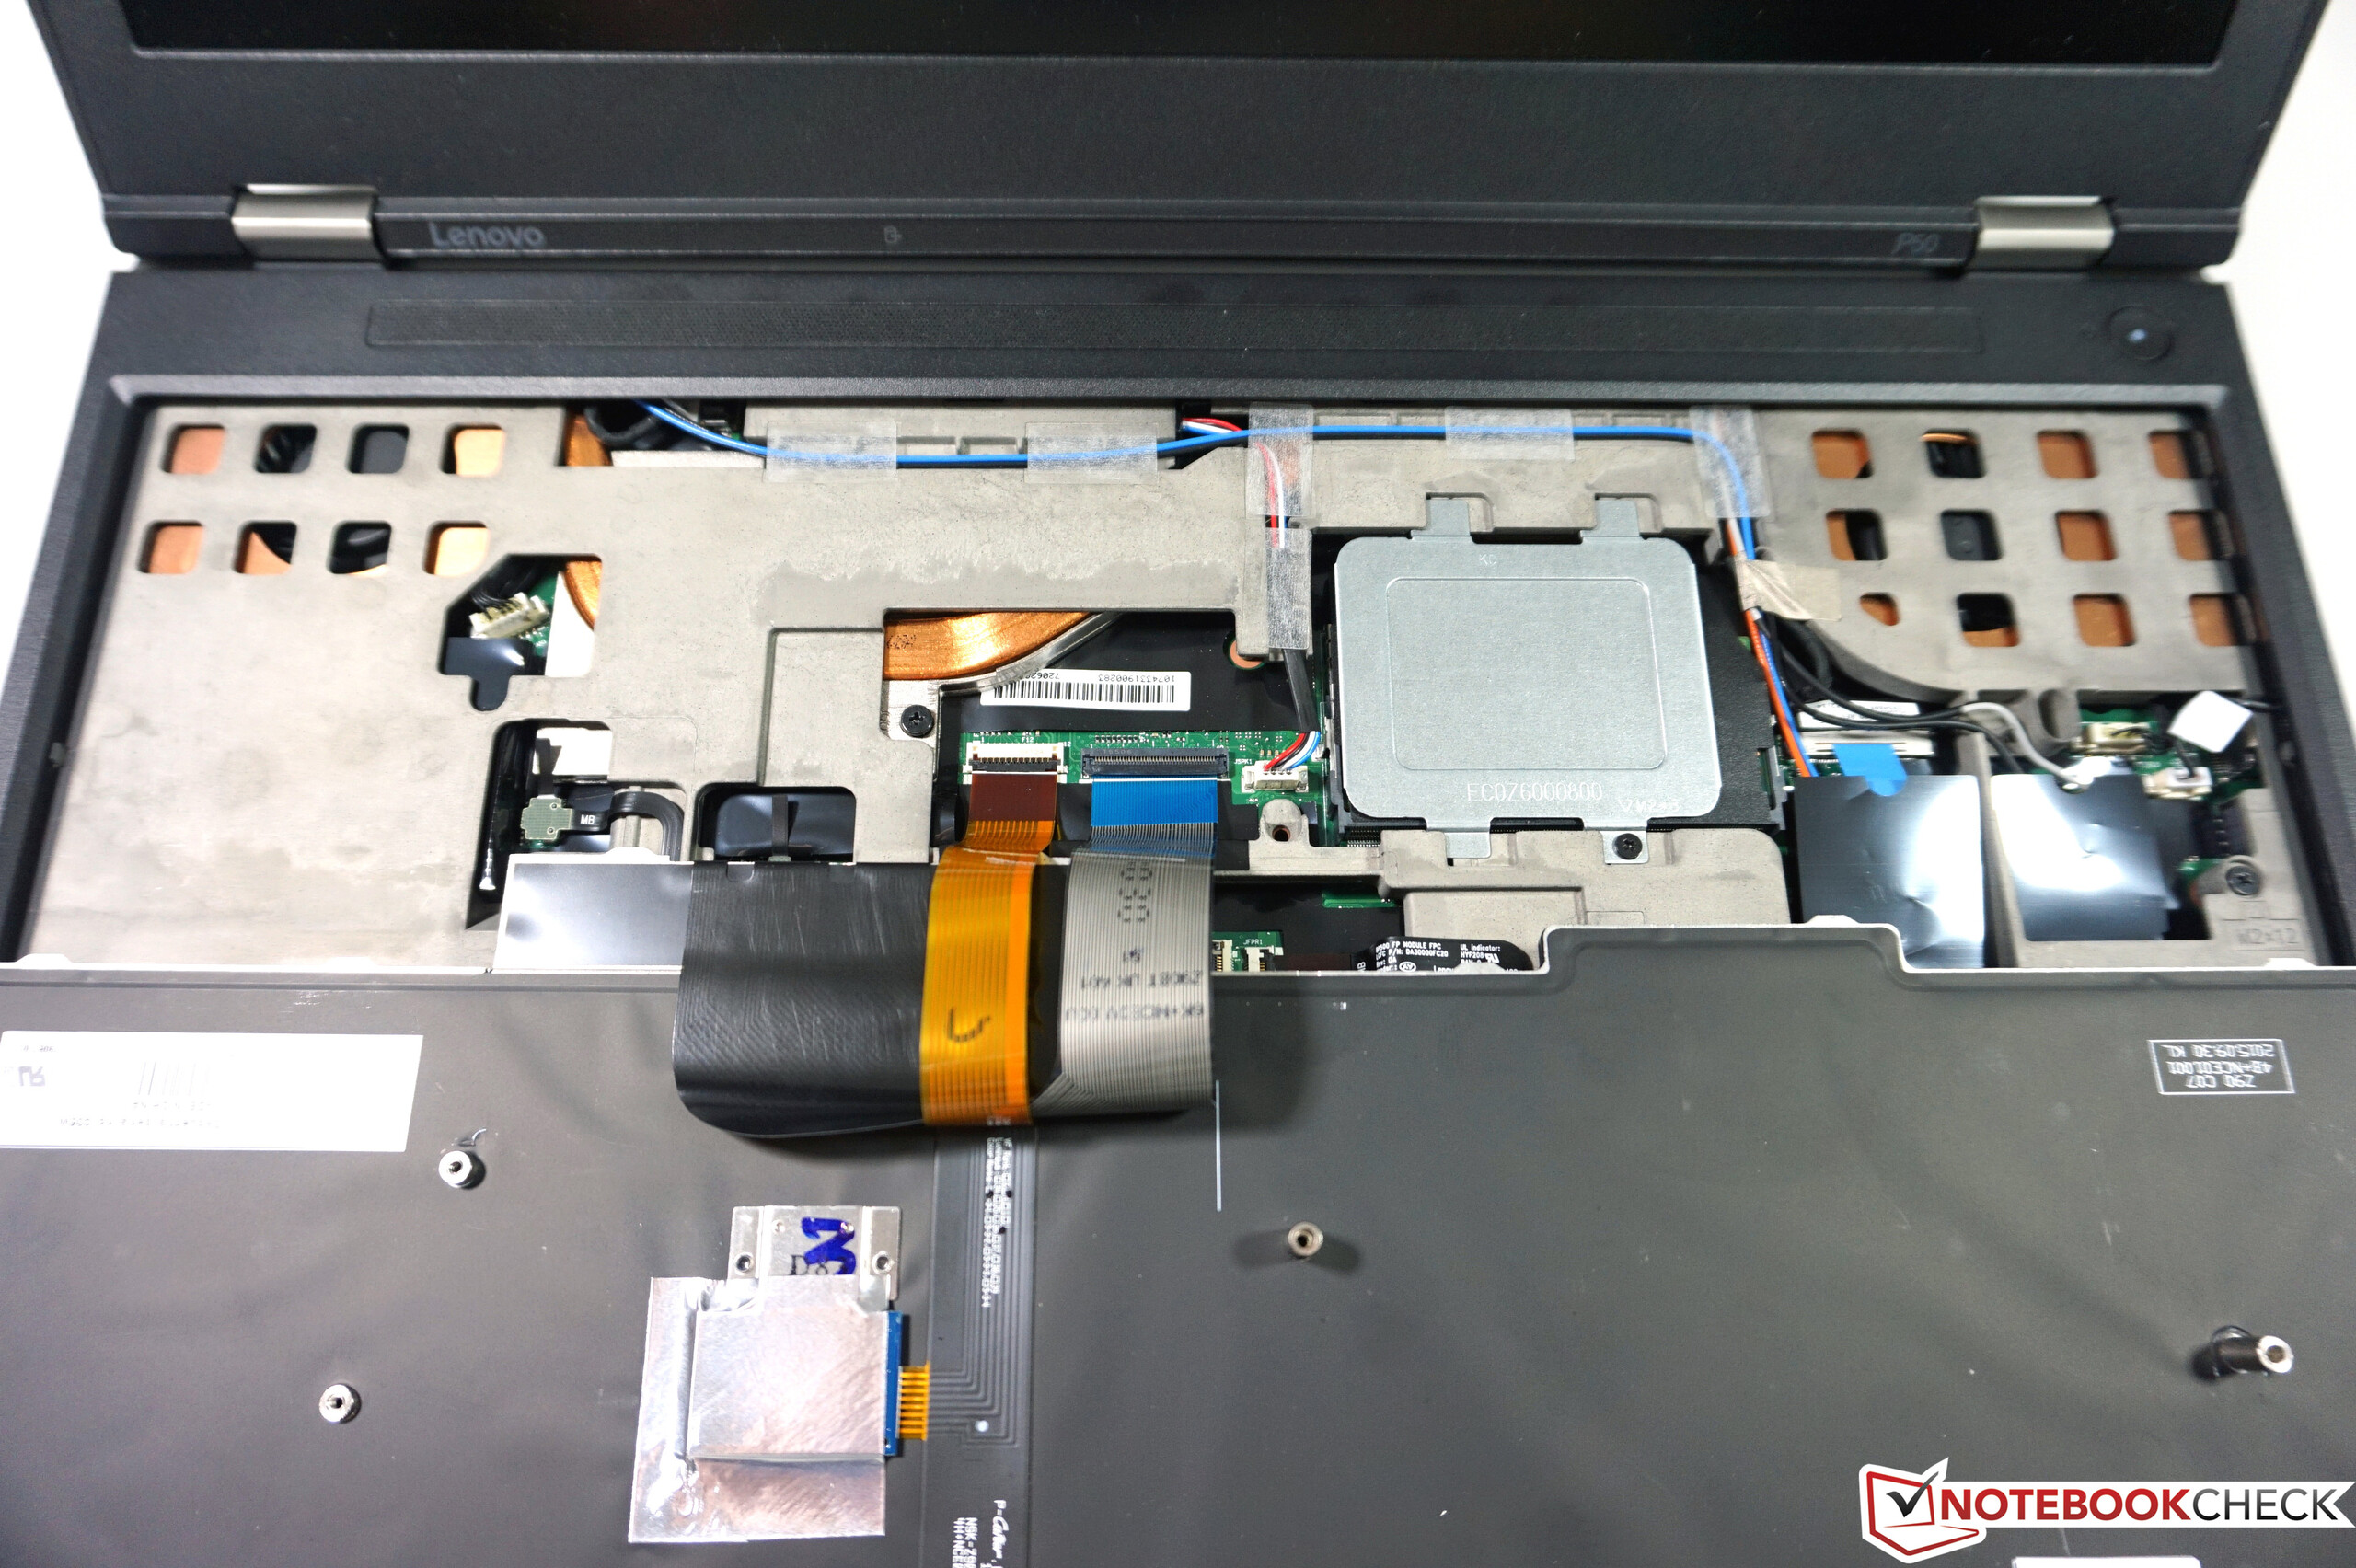
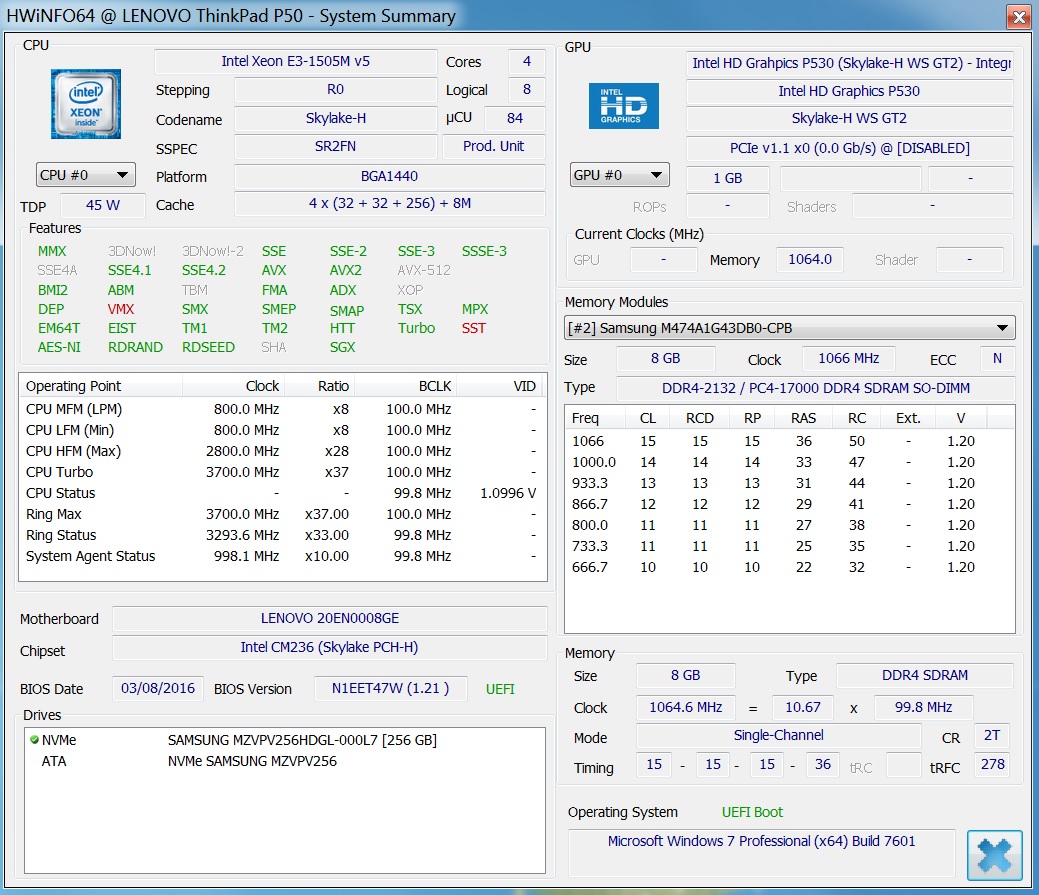
Our review configuration of the ThinkPad P50 is suitably equipped with an Intel Xeon processor, dedicated Quadro GPU from Nvidia as well as a PCIe-SSD from Samsung. One highlight is the memory, because we get ECC-RAM (Error-Correcting-Code) for improved error correction. However, we only get 1x 8 GB in a single-channel configuration, which is pretty meager when you consider the price. ECC-RAM is also much more expensive compared to standard DDR4-RAM. One 8 GB module currently costs around 90 Euros (~$99), which is twice as expensive as a standard DDR4 memory.
Our configuration is currently the most expensive retail unit, but you can also configure the device comprehensively in Lenovo's online shop. You can spend up to 5500 Euros (~$6081; Xeon, 64 GB ECC-RAM, 2x 512 GB PCIe-SSD, 4K).
Processor
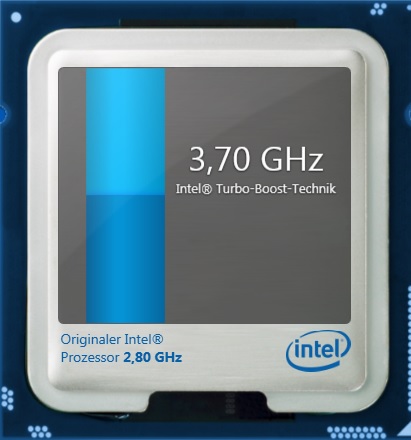
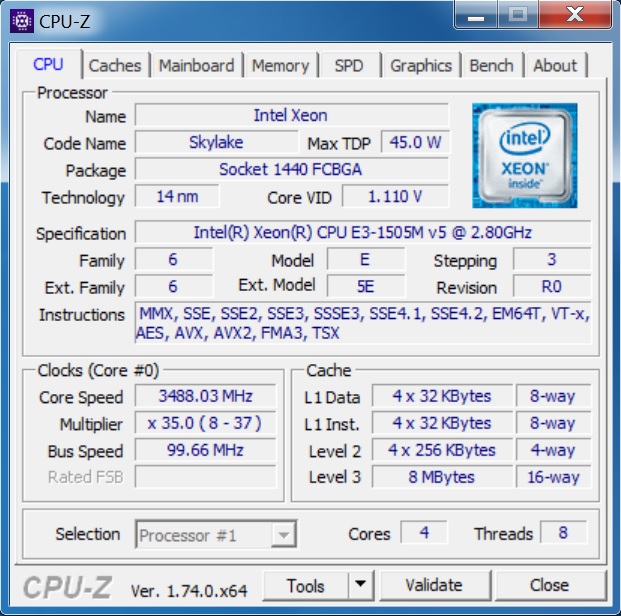
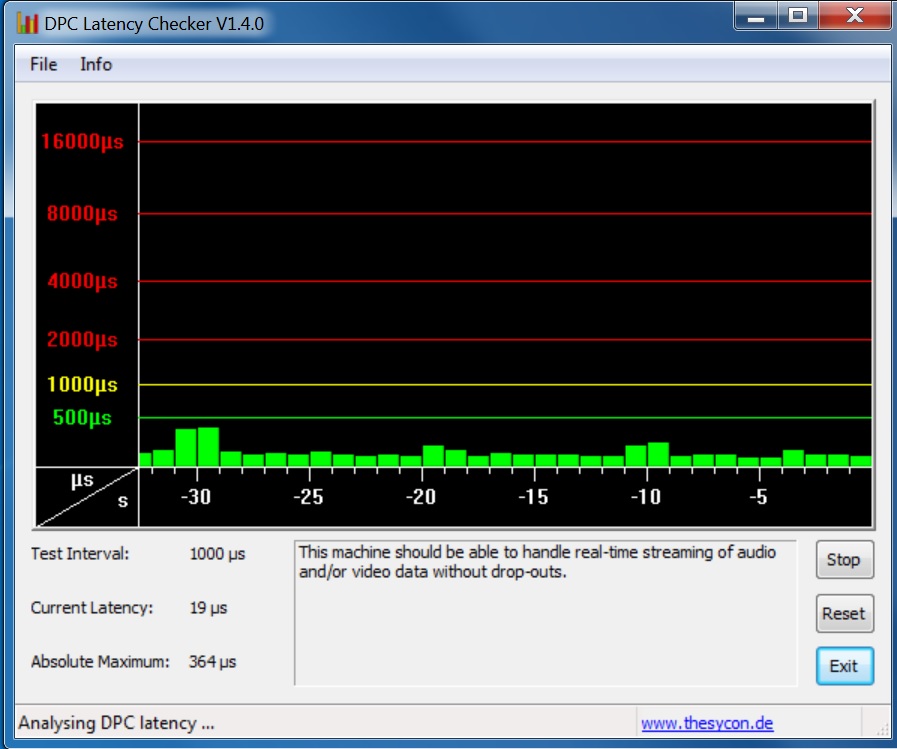
Intel's Xeon E3-1505M v5 is currently one of the fastest mobile processors. The Skylake chip has a TDP of 45 watts, and it can reach up to 3.7 GHz via Turbo Boost. Here we can also see an improvement over the previous test model with the Turbo Boost problems, because it works properly now. All the benchmarks were executed with the maximum clock.
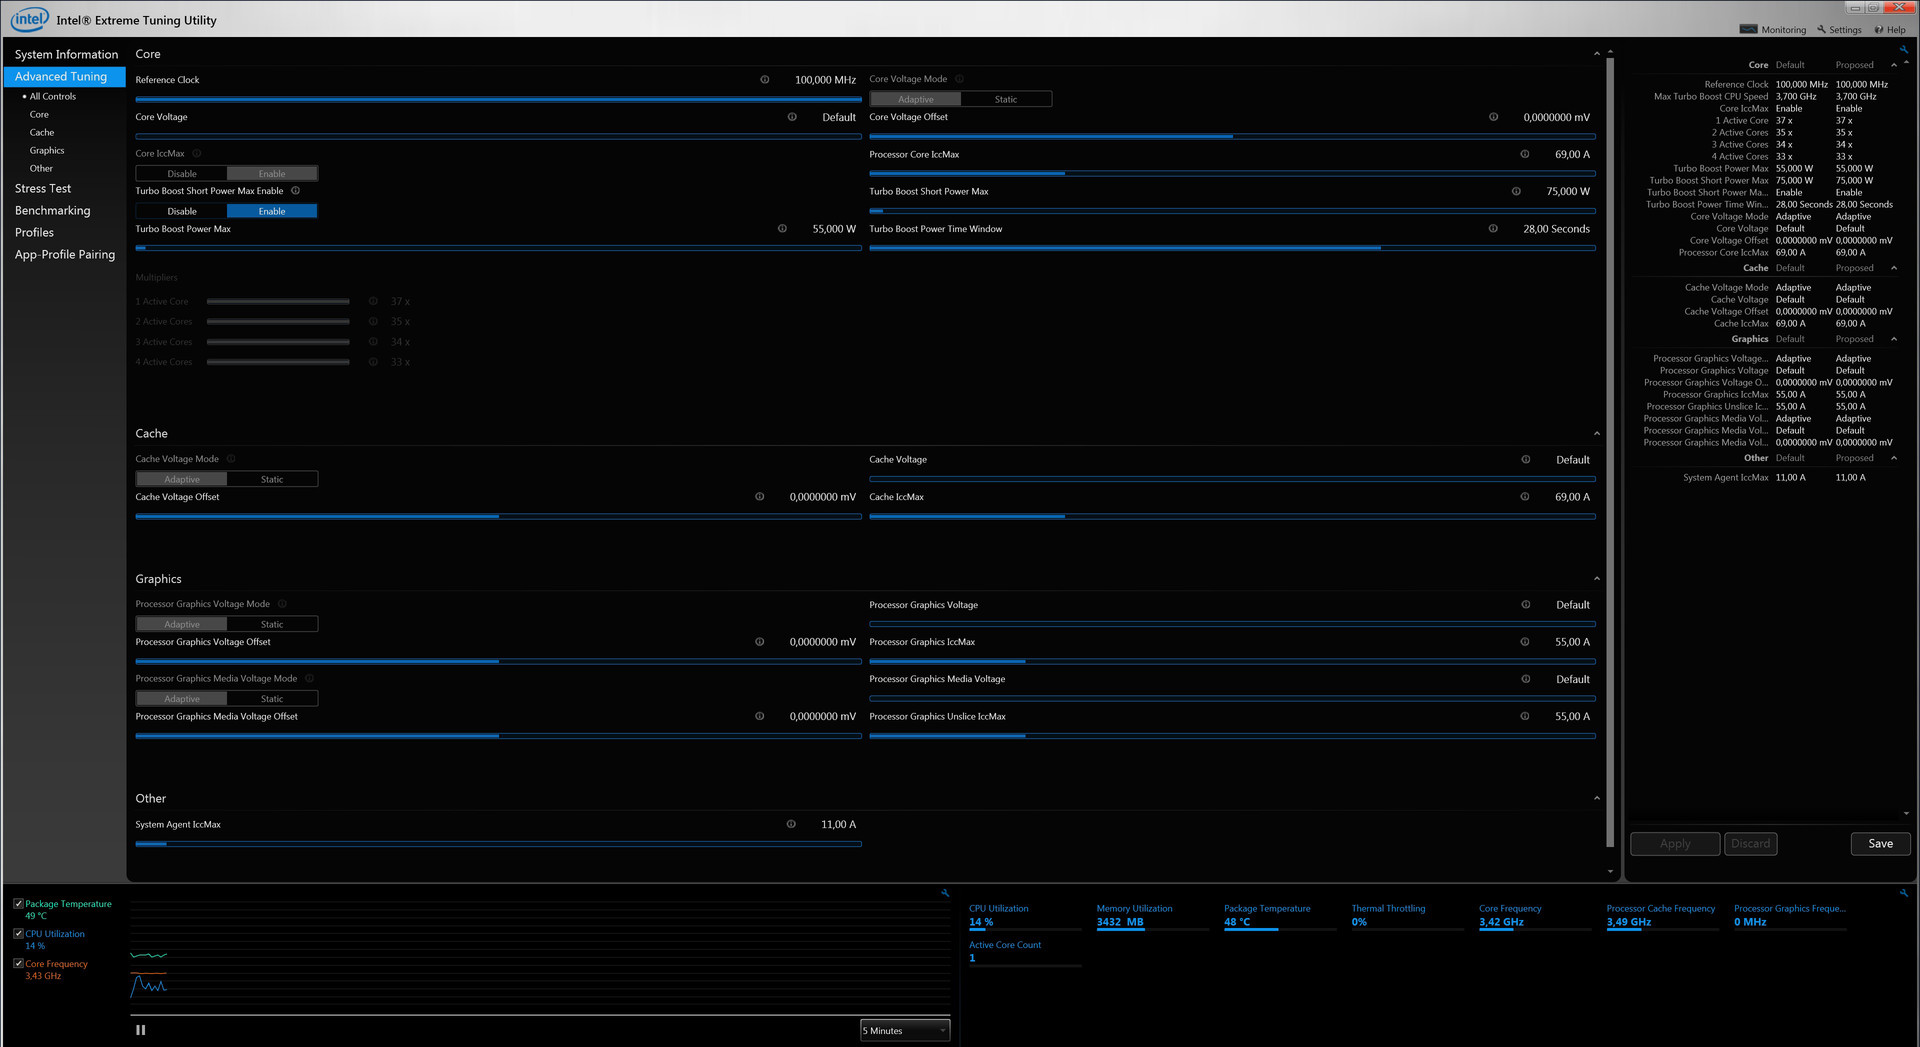
Lenovo even gives the processor more headroom, because it can continuously consume up to 55 watts and even up to 75 watts for a short period (28 seconds). Users will only benefit from this when they also use the integrated GPU though, because the processor itself does not even reach 45 watts. HWiNFO shows 41 to 42 watts in the Cinebench Multi test and ~43 watts in Prime95.
As expected, we cannot see any surprises in the benchmarks, and the Xeon inside the ThinkPad P50 is one of the fastest chips within the comparison group. The consumption of the processor is limited to 40 watts on battery power, so the performance takes a small hit (CB R15 Multi: 729 vs. 698 points).
More benchmarks with the Xeon E3-1505M v5 are available in our Tech section.
System Performance
Subjectively, there is no criticism for the system performance of the ThinkPad P50. Windows boots quickly and applications are quickly launched as well, thanks to the SSD. Basically, there are no annoying waiting times. Both configurations of the ThinkPad P50 perform similarly in the PCMarks, but it is interesting that the lower-end SKU is actually slightly ahead most of the time.
| PCMark 7 - Score | |
| Schenker W505 | |
| HP ZBook 15 G3 | |
| Dell Precision 5510 | |
| Lenovo ThinkPad W541 20EF000SGE | |
| Lenovo ThinkPad P50 | |
| Lenovo ThinkPad P50 | |
| PCMark 8 | |
| Home Score Accelerated v2 | |
| Lenovo ThinkPad P50 | |
| Lenovo ThinkPad P50 | |
| HP ZBook 15 G3 | |
| Dell Precision 5510 | |
| Lenovo ThinkPad W541 20EF000SGE | |
| Creative Score Accelerated v2 | |
| Dell Precision 5510 | |
| HP ZBook 15 G3 | |
| Lenovo ThinkPad P50 | |
| Work Score Accelerated v2 | |
| HP ZBook 15 G3 | |
| Dell Precision 5510 | |
| Lenovo ThinkPad P50 | |
| Lenovo ThinkPad P50 | |
| Lenovo ThinkPad W541 20EF000SGE | |
| PCMark 7 Score | 4979 points | |
| PCMark 8 Home Score Accelerated v2 | 4023 points | |
| PCMark 8 Creative Score Accelerated v2 | 4291 points | |
| PCMark 8 Work Score Accelerated v2 | 4372 points | |
Help | ||
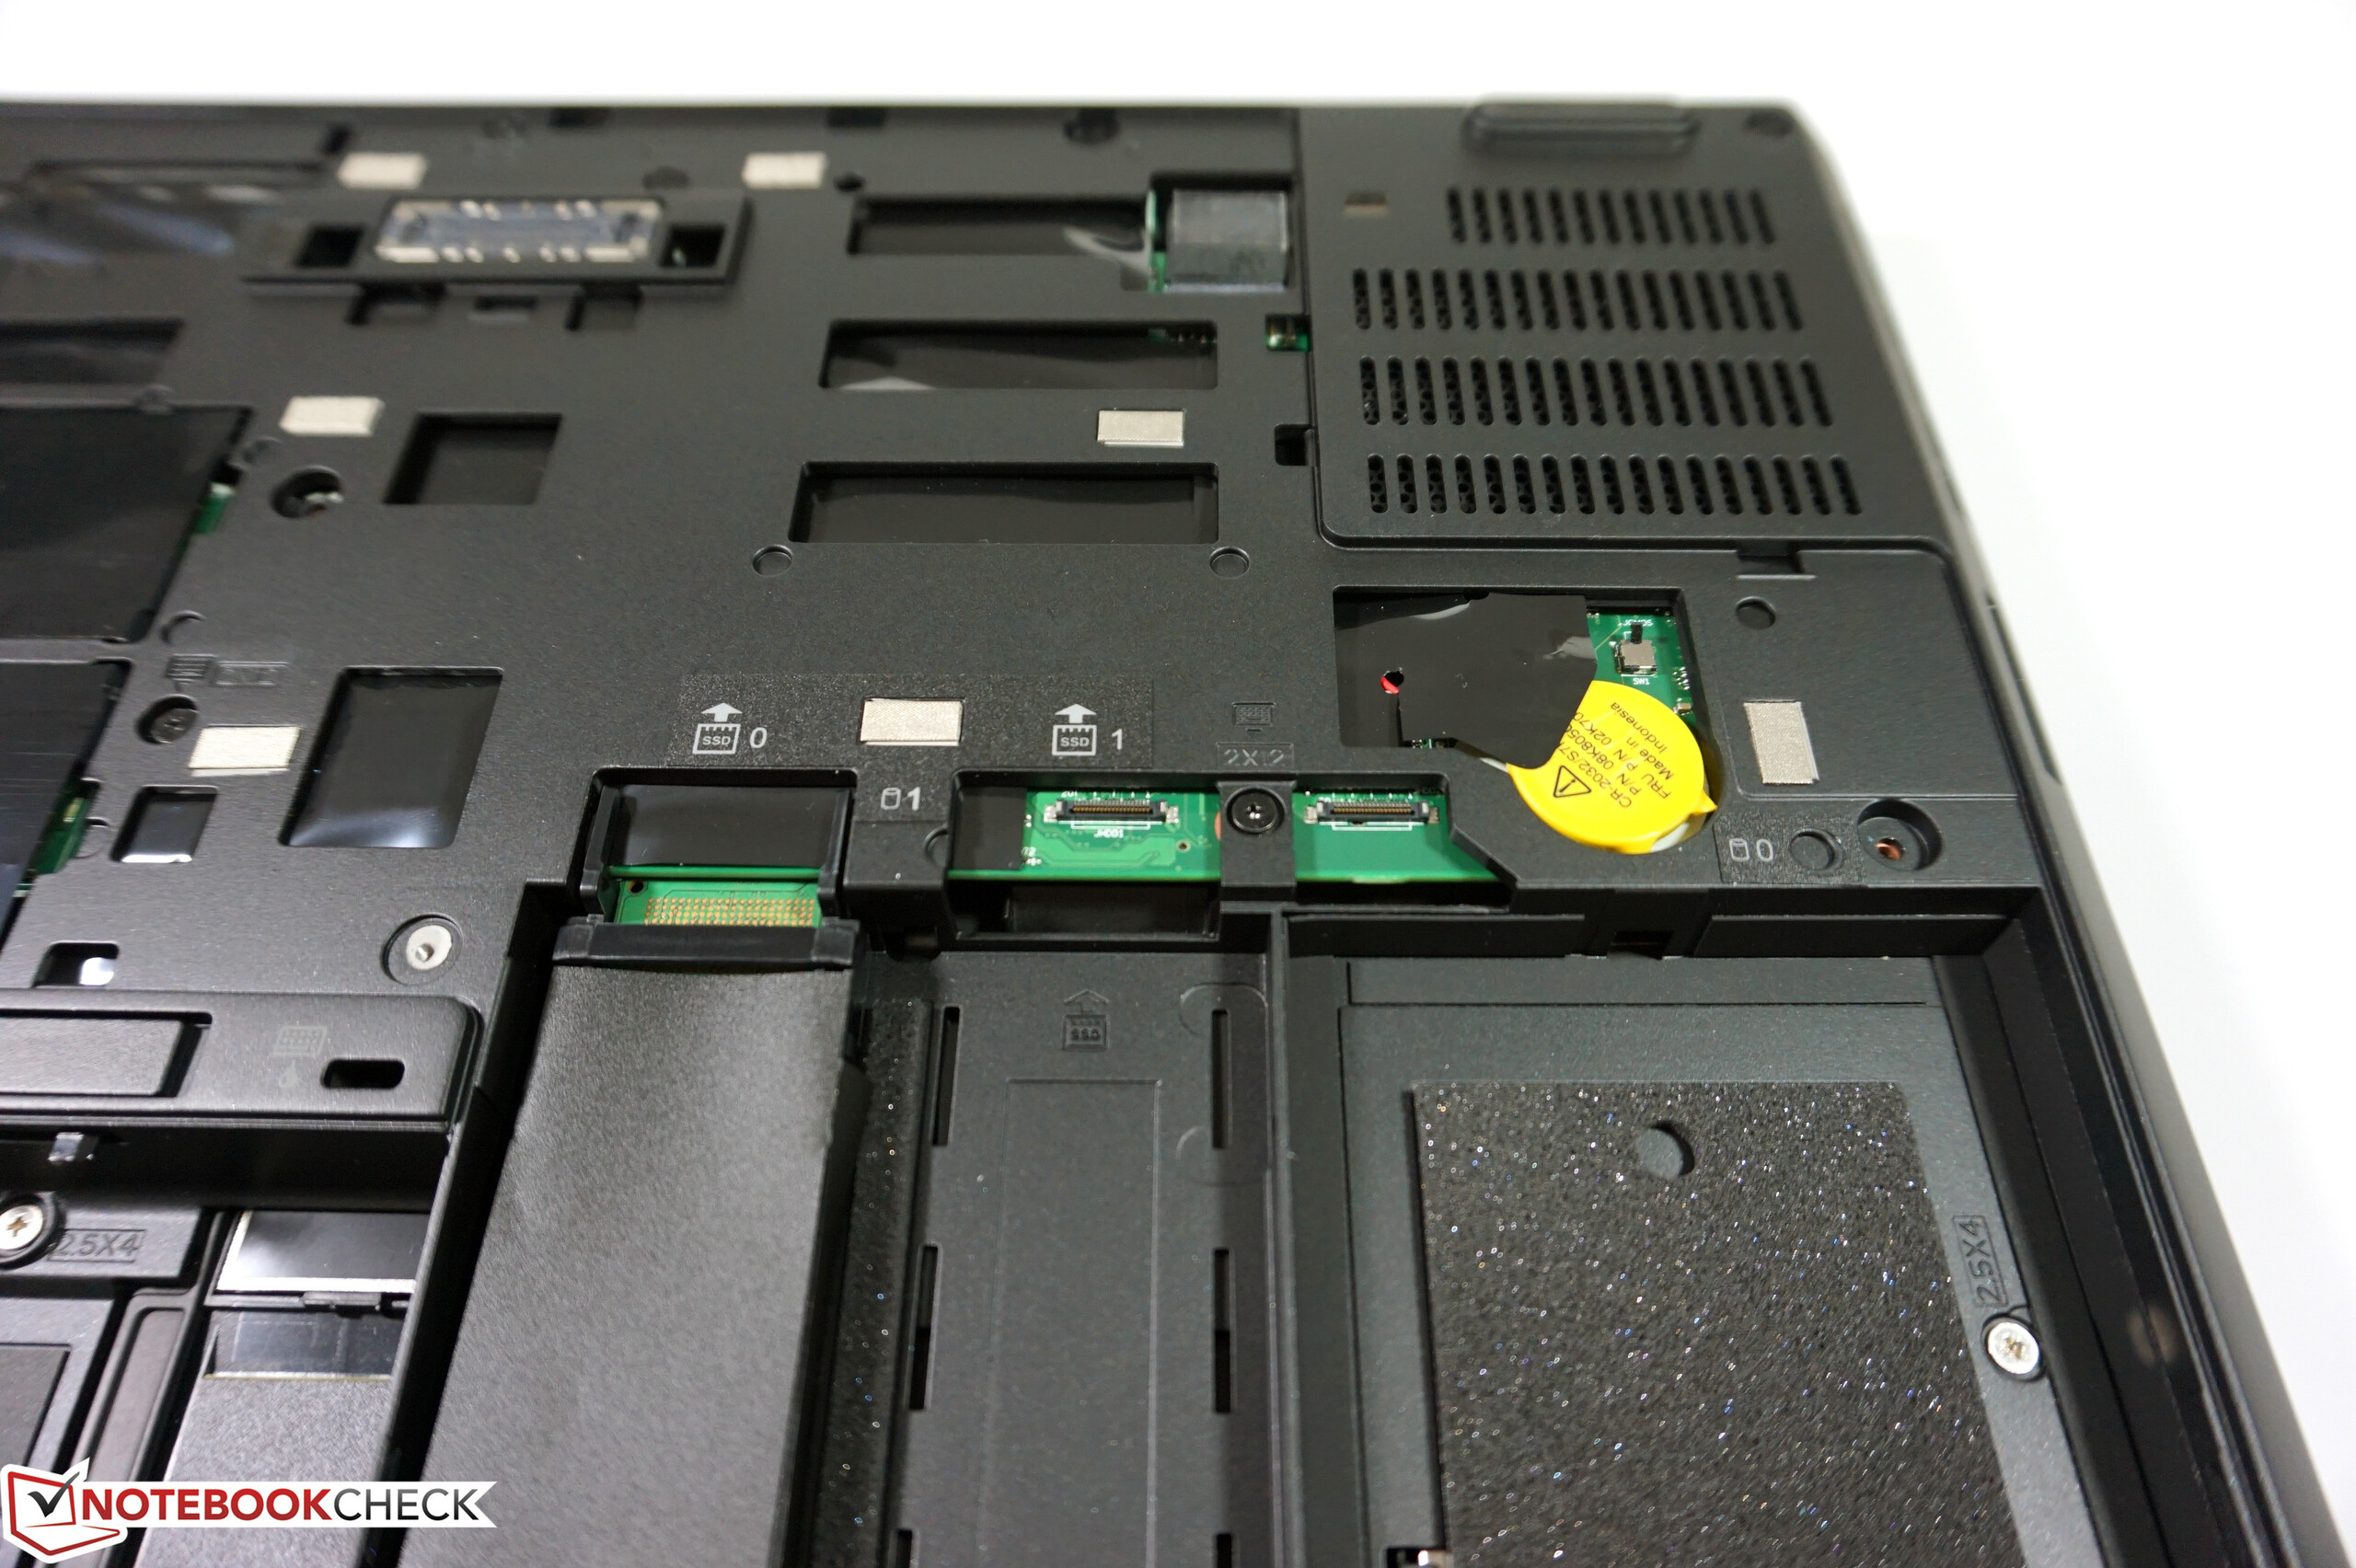
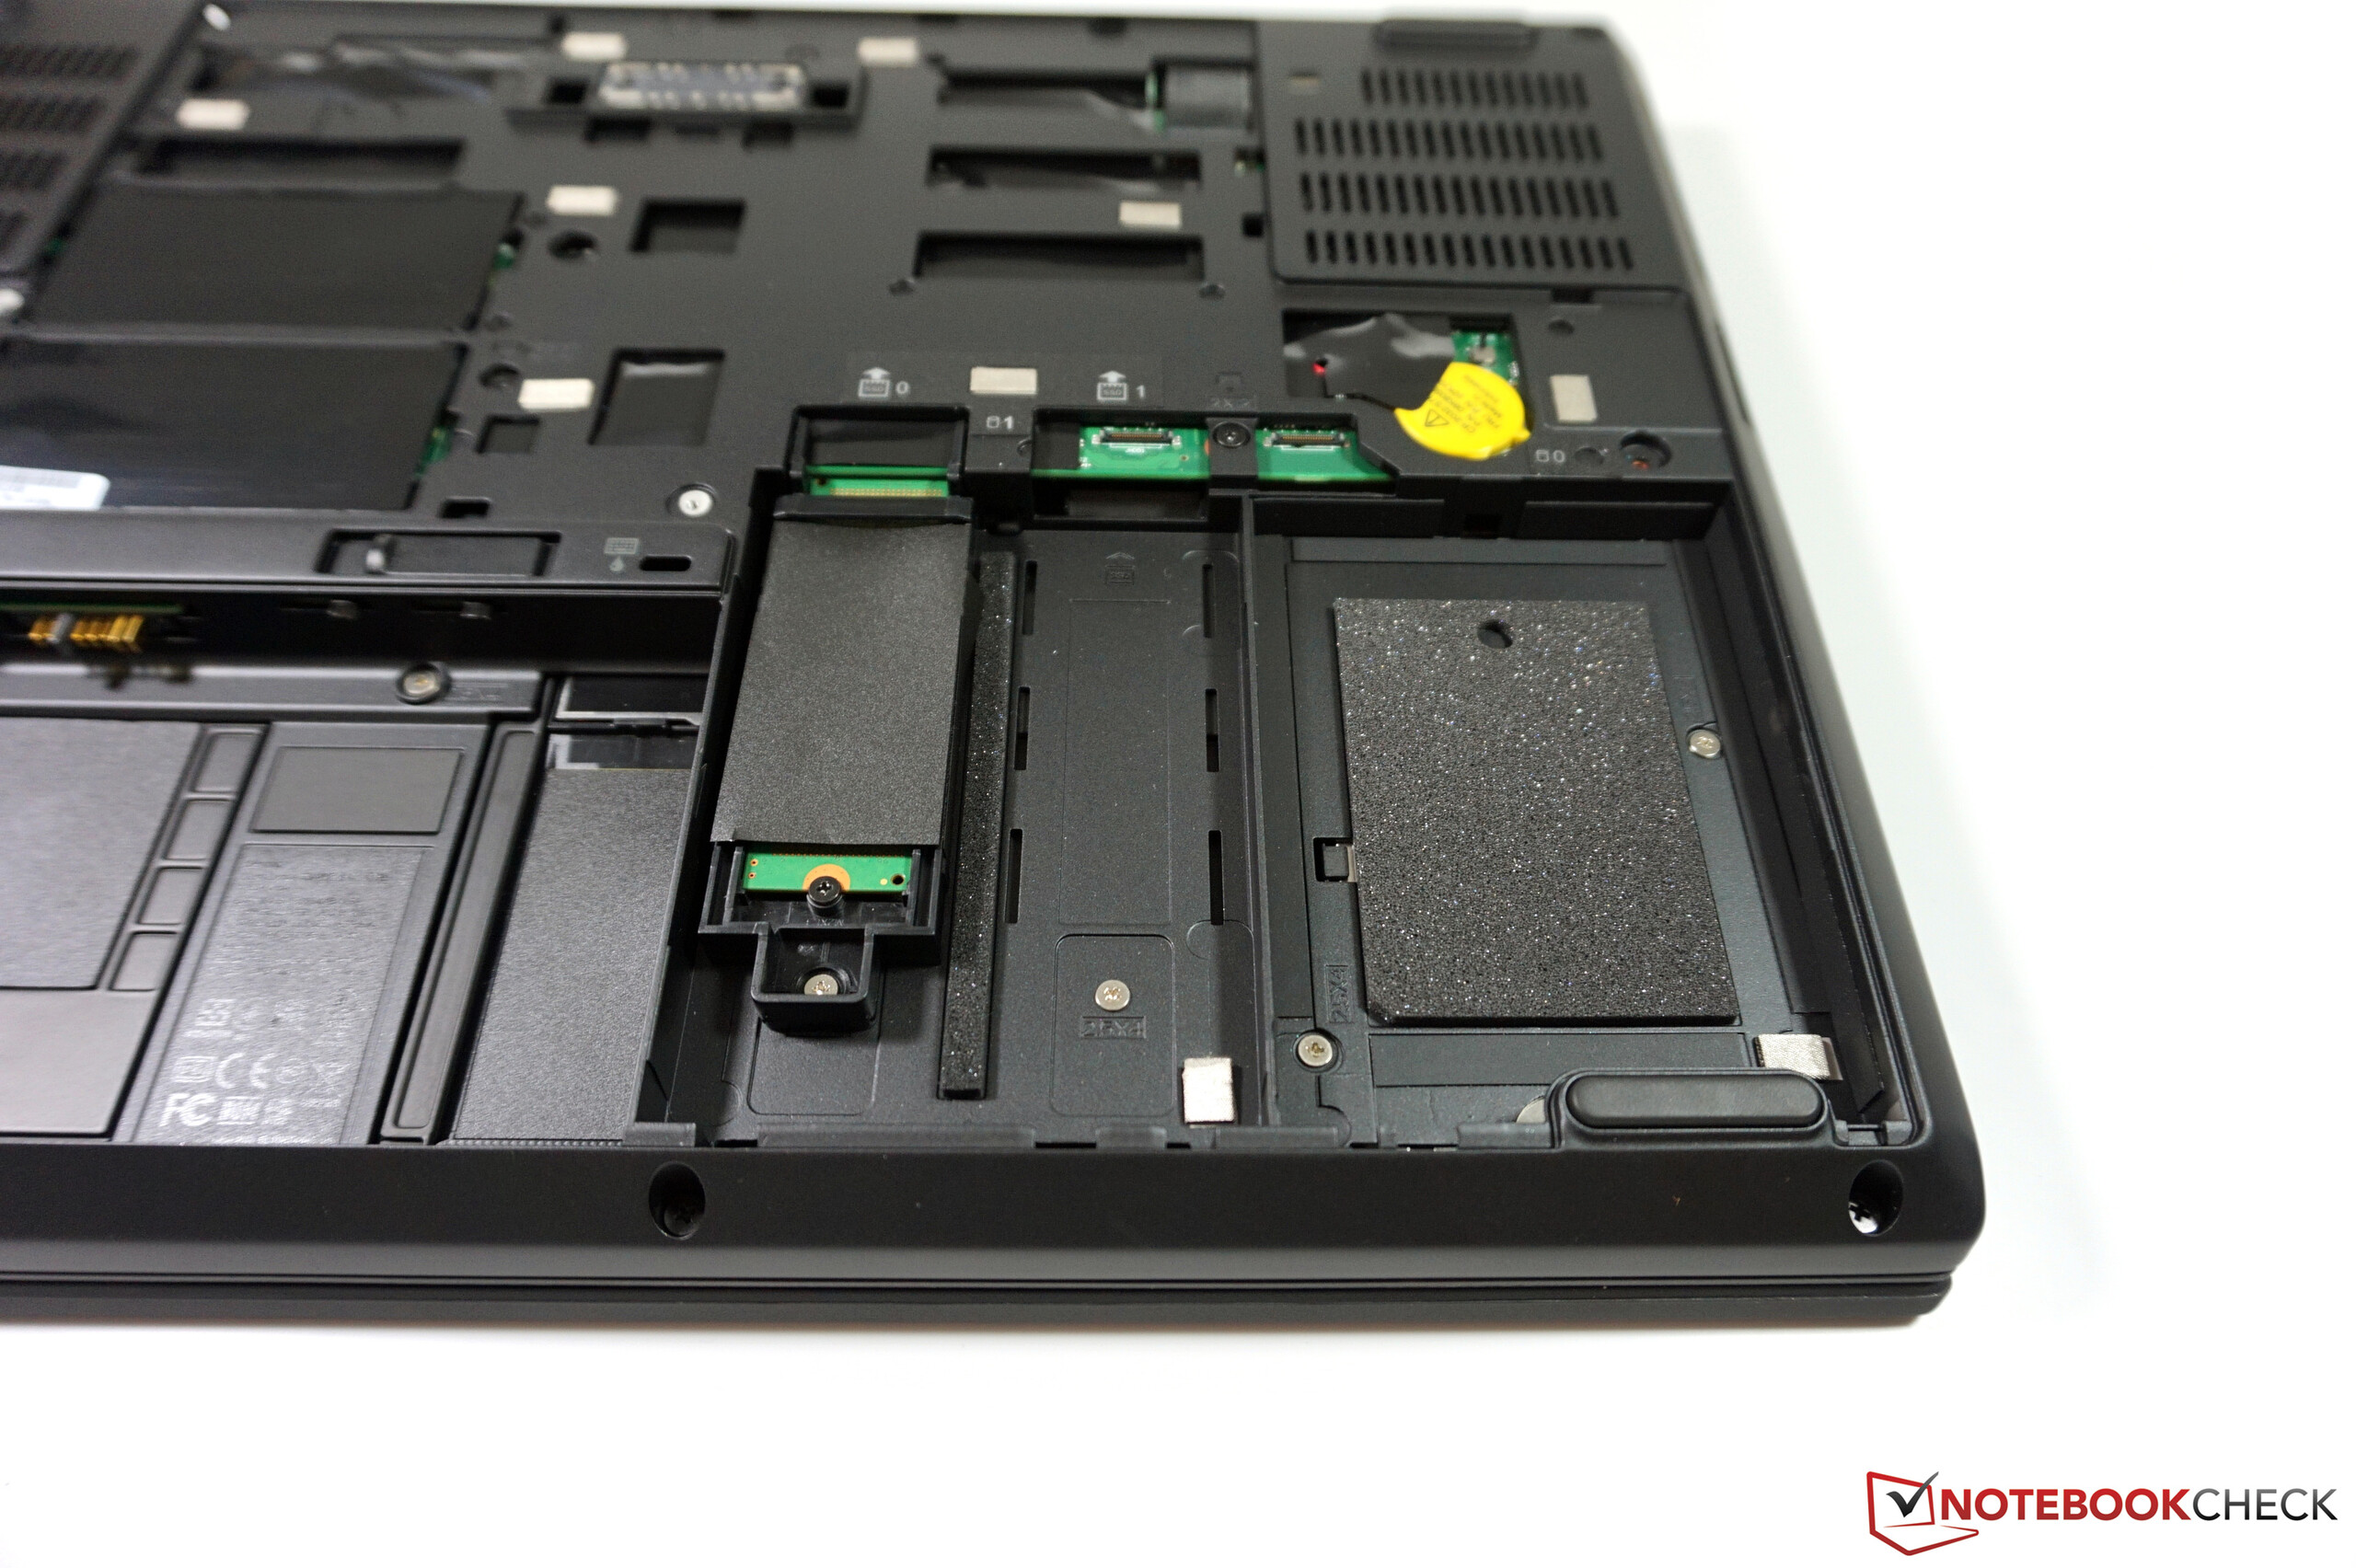
Storage Devices
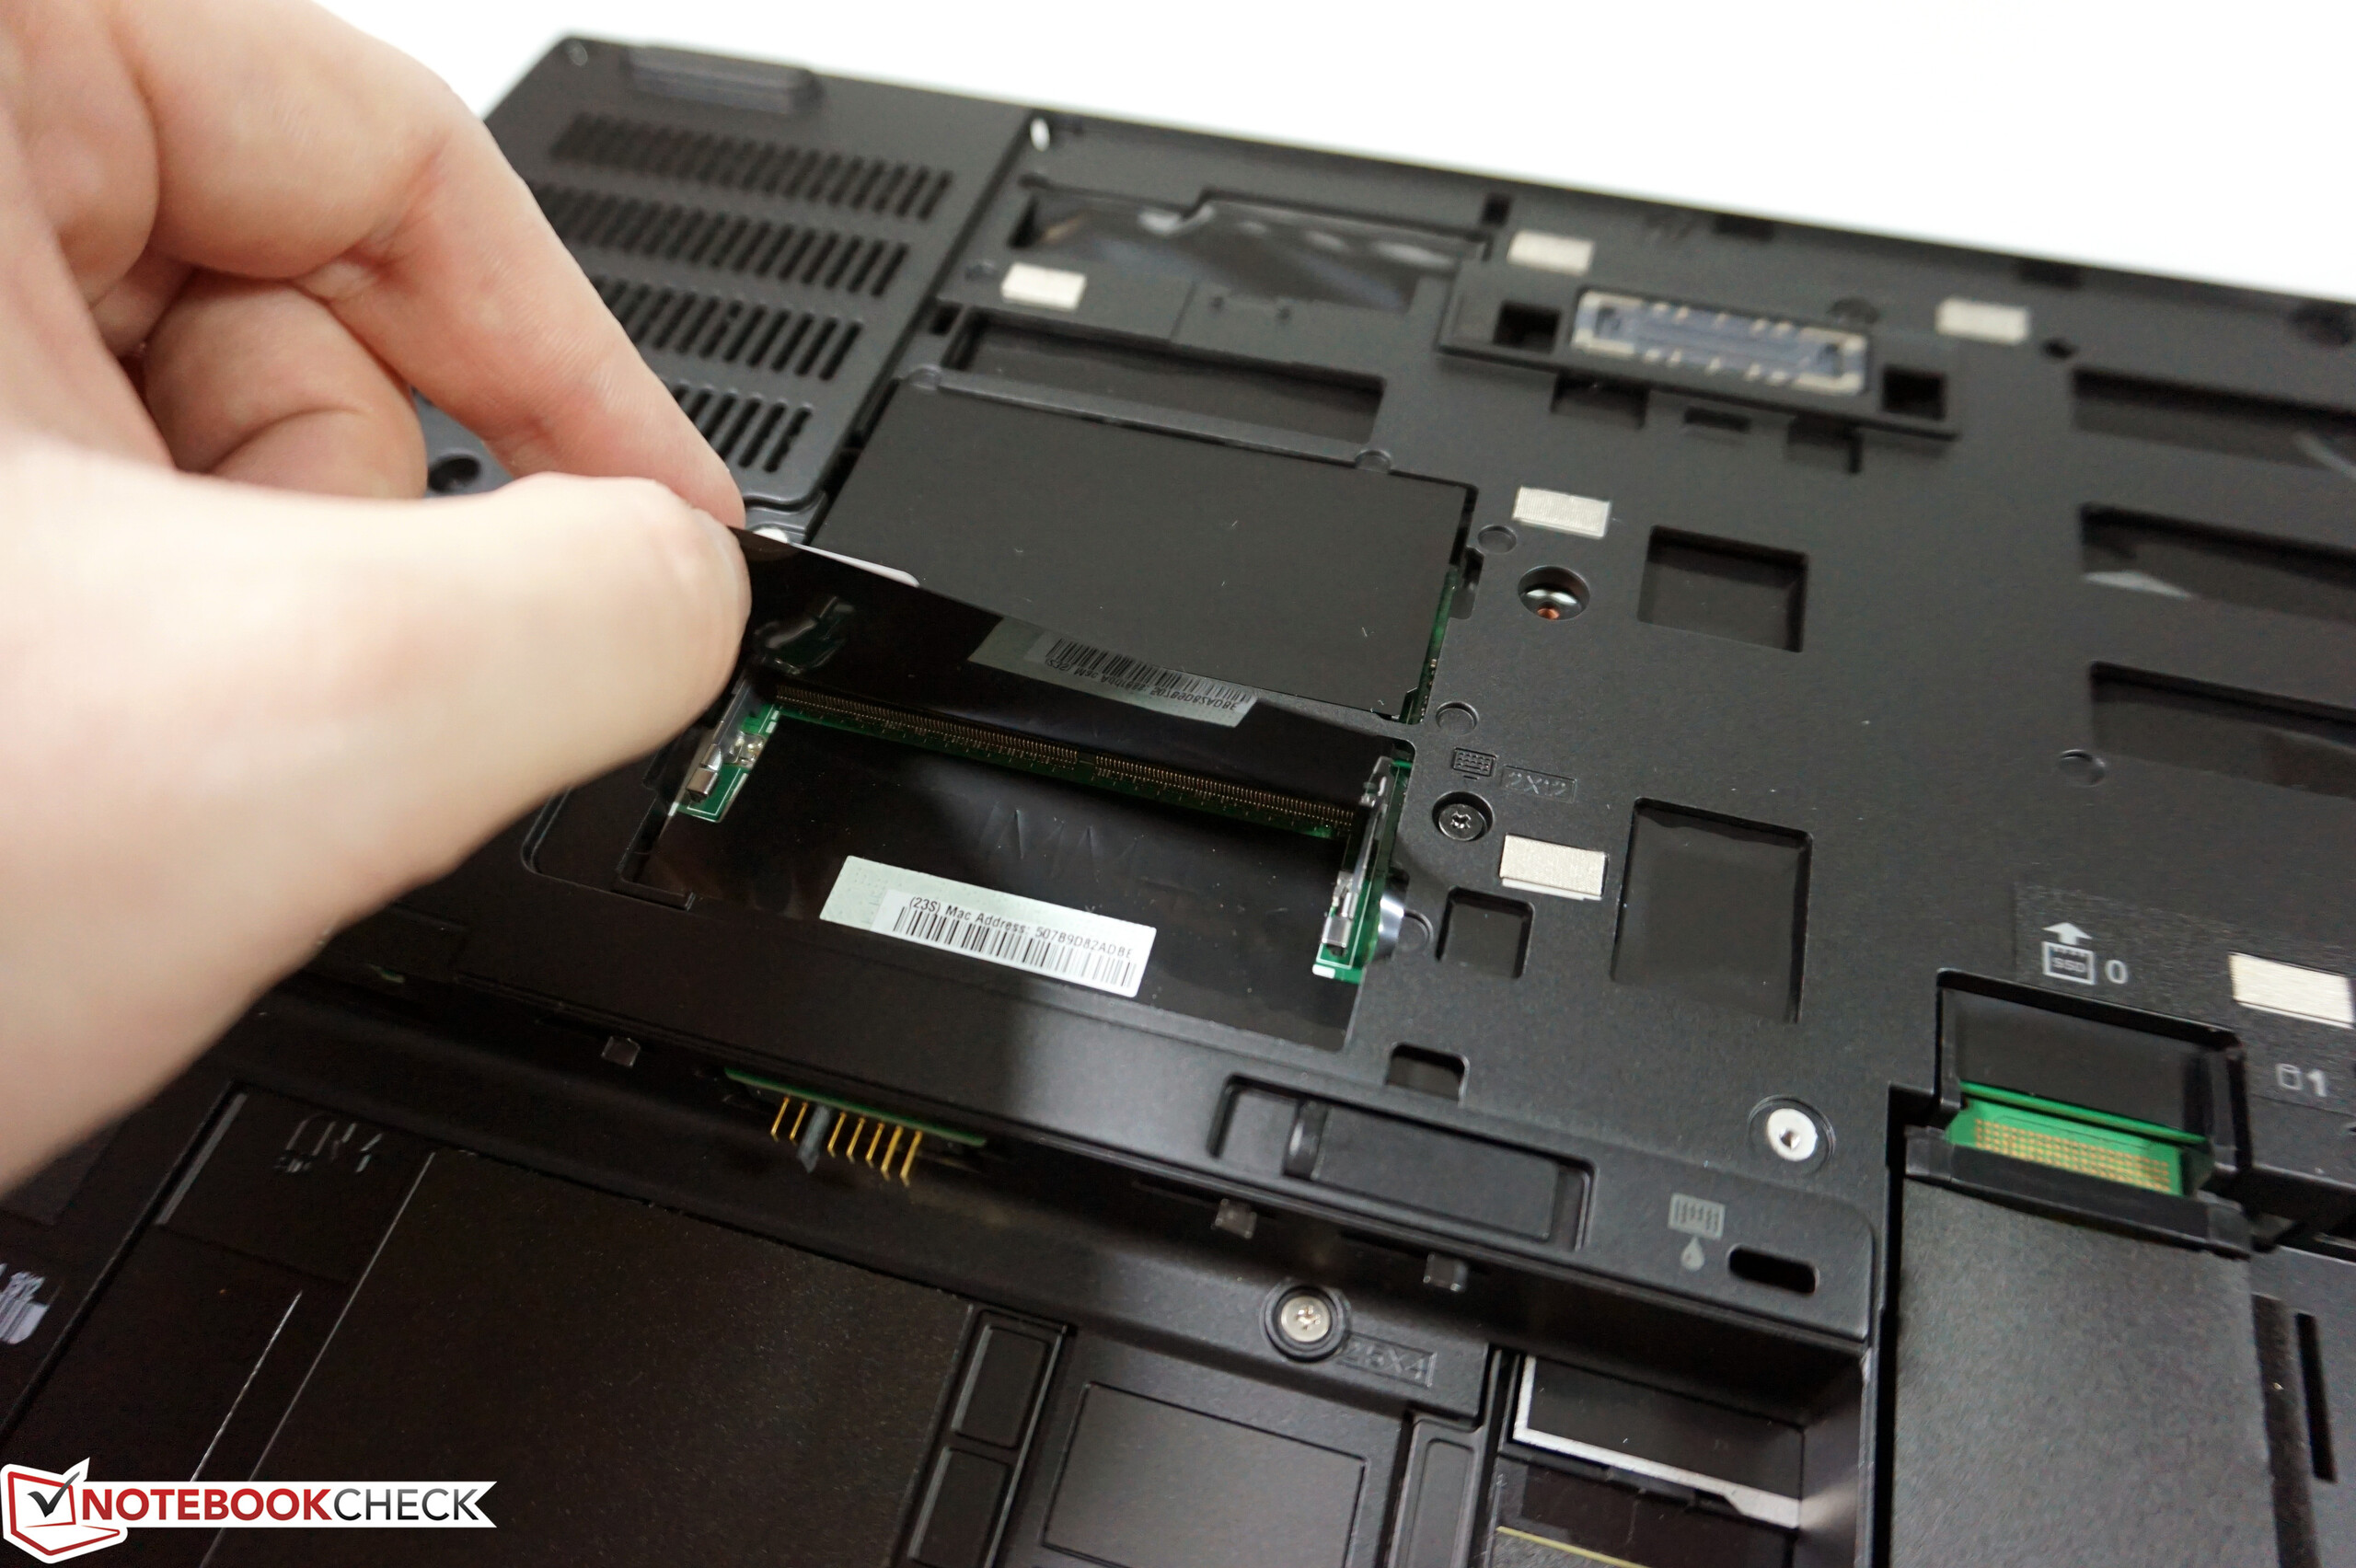
Data can be stored on a fast PCIe-SSD from Samsung. The SM951 has a storage capacity of 256 GB. We are happy about the fast drive, but would have expected at least another hard drive considering the price. However, it is possible to integrate more drives.
The drive performs very well in the benchmarks and can easily surpass the SATA-III SSD inside the FHD-P50. More benchmarks are available in our comprehensive SSD/HDD list.
| Lenovo ThinkPad P50 Samsung SM951 MZVPV256HDGL m.2 PCI-e | Lenovo ThinkPad P50 Samsung SSD PM871 MZNLN256HCHP | HP ZBook 15 G3 Samsung SM951 MZVPV512HDGL m.2 PCI-e | Schenker W505 Samsung SSD 850 EVO M.2 500GB | Lenovo ThinkPad W541 20EF000SGE Samsung SSD PM851 512 GB MZ7TE512HMHP | |
|---|---|---|---|---|---|
| CrystalDiskMark 3.0 | -59% | -5% | -51% | -57% | |
| Read Seq (MB/s) | 1771 | 526 -70% | 1502 -15% | 528 -70% | 524 -70% |
| Write Seq (MB/s) | 1304 | 302.4 -77% | 1538 18% | 512 -61% | 440.7 -66% |
| Read 512 (MB/s) | 1364 | 465.3 -66% | 1164 -15% | 468.2 -66% | 436.7 -68% |
| Write 512 (MB/s) | 1291 | 301.3 -77% | 1432 11% | 378.9 -71% | 406.3 -69% |
| Read 4k (MB/s) | 60.2 | 35.58 -41% | 59.1 -2% | 48.93 -19% | 33.03 -45% |
| Write 4k (MB/s) | 256.7 | 124 -52% | 207.3 -19% | 121.2 -53% | 85.8 -67% |
| Read 4k QD32 (MB/s) | 953 | 345.3 -64% | 798 -16% | 370.9 -61% | 390.5 -59% |
| Write 4k QD32 (MB/s) | 389.6 | 291.9 -25% | 393.8 1% | 350.3 -10% | 334.1 -14% |

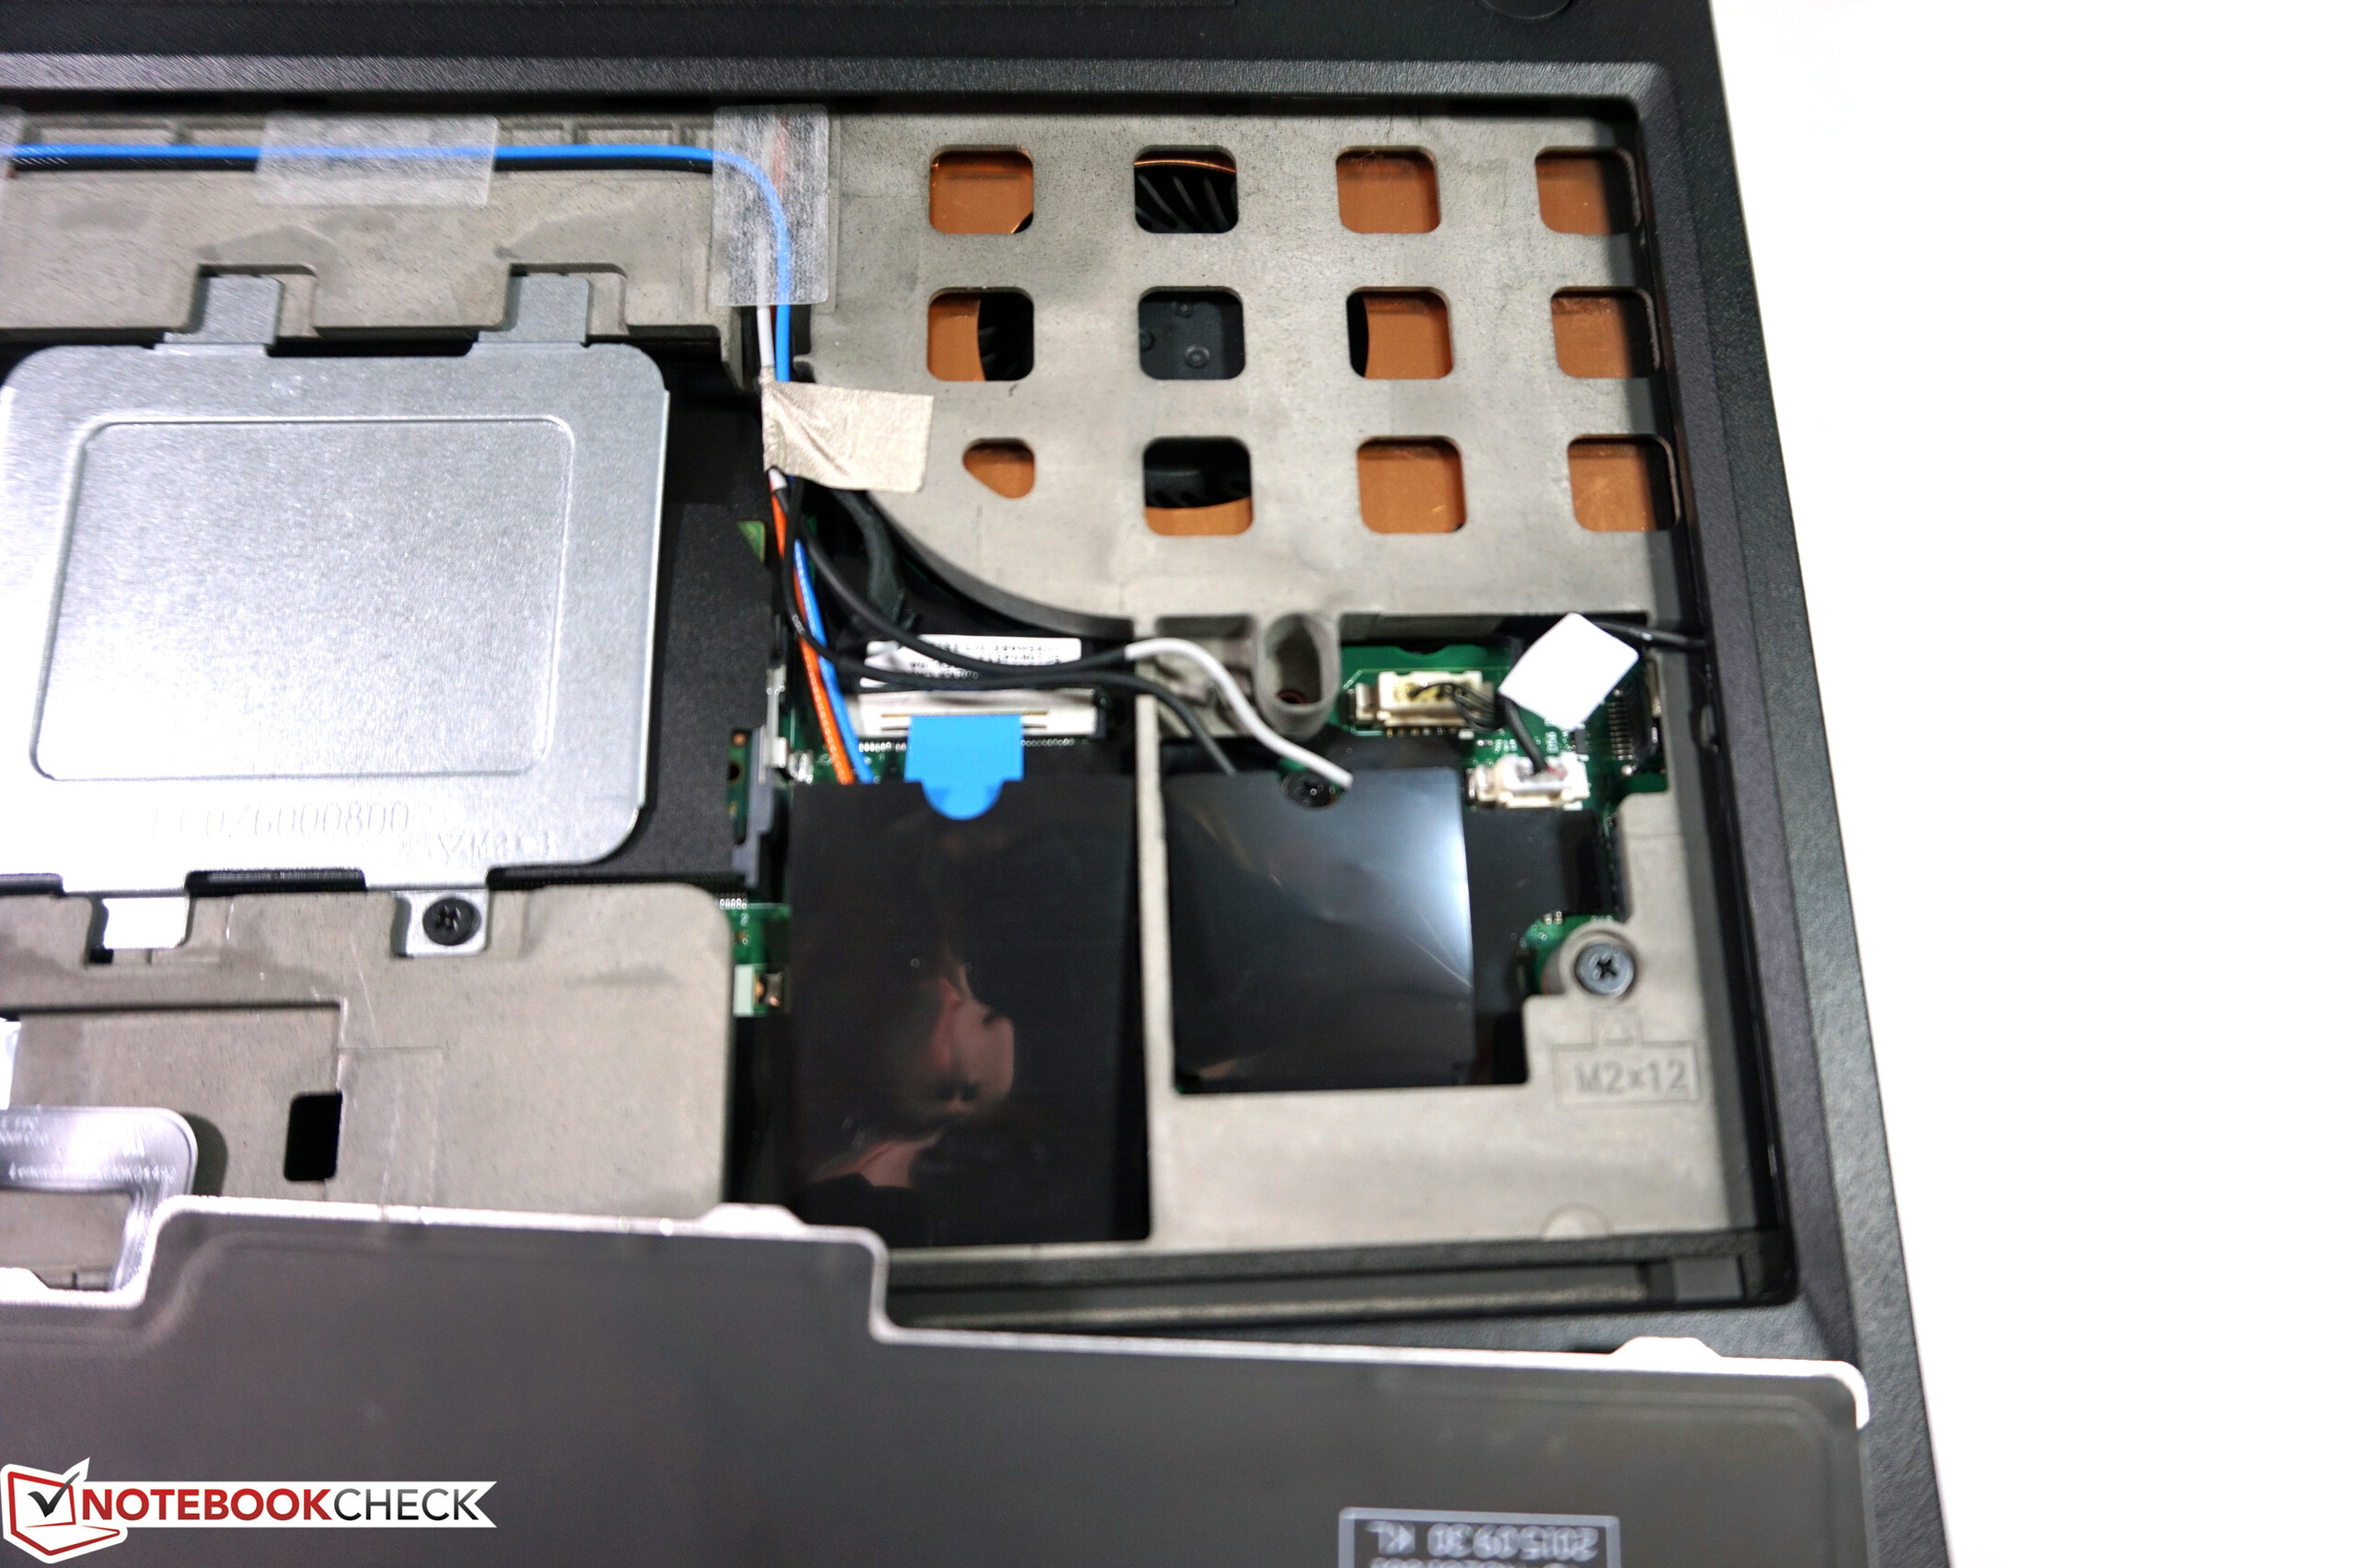
GPU Performance
The test model is once again equipped with the dedicated Quadro M2000M GPU from Nvidia, which is also the fastest GPU for the ThinkPad P50. More technical information about the chip is available in our previous review. Thanks to Nvidia's Optimus technology, the notebook can switch to the integrated processor graphics Intel HD Graphics P530 for simple tasks to save power.
However, we noticed some problems with the preloaded GPU driver 354.25. The GPU allocation did not always work properly, which was not completely fixed with an update to driver 368.39, either. The GPU allocation worked properly in the benchmarks, but “The Witcher 3”, for example, could not be launched at all and the system crashed repeatedly, which required a reboot. Only a switch from Hybrid to Discreet Graphics in the BIOS did help, which will completely deactivate the integrated GPU.
We downloaded the new driver directly from Nvidia. In addition, we also installed the latest driver from Lenovo. The latter installs ForceWare 354.88 – and the problems were actually solved. We can therefore recommend Lenovo's driver.
Usually, there are only small differences in the benchmarks. We can only see a bigger gap compared to the FHD model in terms of the OpenGL performance, but this is related to the newer driver version.
Unlike the FHD model, the performance of the Quadro M2000M is reduced by 14% on battery power (3DMark 11 Graphics: 5203 vs. 4493 points). More benchmarks with the Quadro M2000M are available here.
| SiSoft Sandra 2016 | |
| Image Processing | |
| HP ZBook 15 G3 | |
| Lenovo ThinkPad P50 | |
| Lenovo ThinkPad P50 | |
| Dell Precision 5510 | |
| GP Cryptography (Higher Security AES256+SHA2-512) | |
| Lenovo ThinkPad P50 | |
| HP ZBook 15 G3 | |
| Lenovo ThinkPad P50 | |
| Dell Precision 5510 | |
| GP Financial Analysis (FP High/Double Precision) | |
| HP ZBook 15 G3 | |
| Lenovo ThinkPad P50 | |
| Lenovo ThinkPad P50 | |
| Dell Precision 5510 | |
| Unigine Heaven 3.0 | |
| 1920x1080 OpenGL, Normal Tessellation, High Shaders AA:Off AF:Off | |
| HP ZBook 15 G3 | |
| Lenovo ThinkPad P50 | |
| Dell Precision 5510 | |
| Lenovo ThinkPad P50 | |
| 1920x1080 DX 11, Normal Tessellation, High Shaders AA:Off AF:Off | |
| Lenovo ThinkPad P50 | |
| Lenovo ThinkPad P50 | |
| HP ZBook 15 G3 | |
| Dell Precision 5510 | |
| Unigine Valley 1.0 | |
| 1920x1080 Extreme HD DirectX AA:x8 | |
| Lenovo ThinkPad P50 | |
| Lenovo ThinkPad P50 | |
| HP ZBook 15 G3 | |
| Dell Precision 5510 | |
| 1920x1080 Extreme HD Preset OpenGL AA:x8 | |
| HP ZBook 15 G3 | |
| Lenovo ThinkPad P50 | |
| Dell Precision 5510 | |
| Lenovo ThinkPad P50 | |
| 3DMark 06 Standard Score | 26643 points | |
| 3DMark 11 Performance | 5444 points | |
| 3DMark Ice Storm Standard Score | 91433 points | |
| 3DMark Cloud Gate Standard Score | 17219 points | |
| 3DMark Fire Strike Score | 3805 points | |
Help | ||
Gaming Performance
The performance of the Nvidia Quadro M2000M is roughly on par with the consumer GPU Nvidia GeForce GTX 960M, so many modern games can be played smoothly in Full HD and medium up to high settings. Gaming in the native 4K resolution on the other hand is only possible with simple games; complex games such as “The Witcher 3” or “Rise of the Tomb Raider” are not playable with our 4K preset. More gaming benchmarks are available in our Tech section.
| low | med. | high | ultra | 4K | |
|---|---|---|---|---|---|
| BioShock Infinite (2013) | 219 | 132.3 | 114.7 | 43.3 | |
| The Witcher 3 (2015) | 76.2 | 47.3 | 26.3 | 13.6 | 9.4 |
| Rise of the Tomb Raider (2016) | 72 | 45 | 25.5 | 21.6 | 9.2 |
Emissions
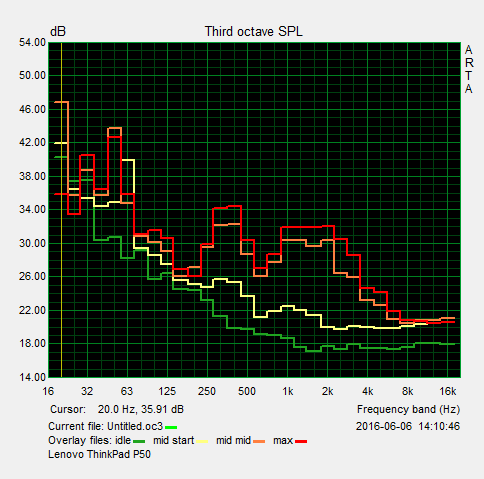
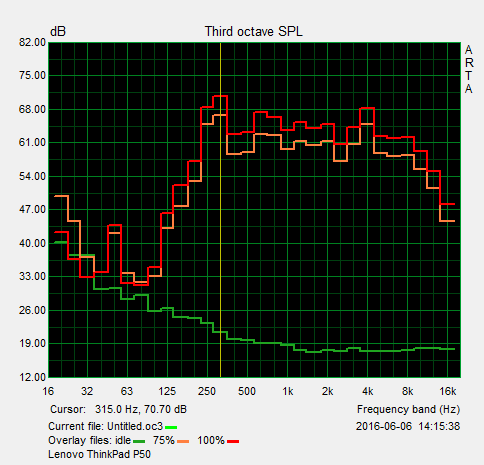
System Noise
The two test models do not differ much in this section. Both devices are usually silent while idling, but there can be some fan activities from time to time. The maximum noise under load is again similar at 42 dB(A), but we can already measure this value under medium loads. This is probably the result of the Turbo Boost working properly. The noise is increased stepwise (33.3/39.6/42.1 dB(A)). The fans do not run at their maximum speed all the time, even under maximum load, so the noise level is not always steady. We could not hear any annoying sounds.
Noise level
| Idle |
| 30 / 30 / 30 dB(A) |
| Load |
| 42.1 / 42.1 dB(A) |
 | ||
30 dB silent 40 dB(A) audible 50 dB(A) loud |
||
min: | ||
Temperature
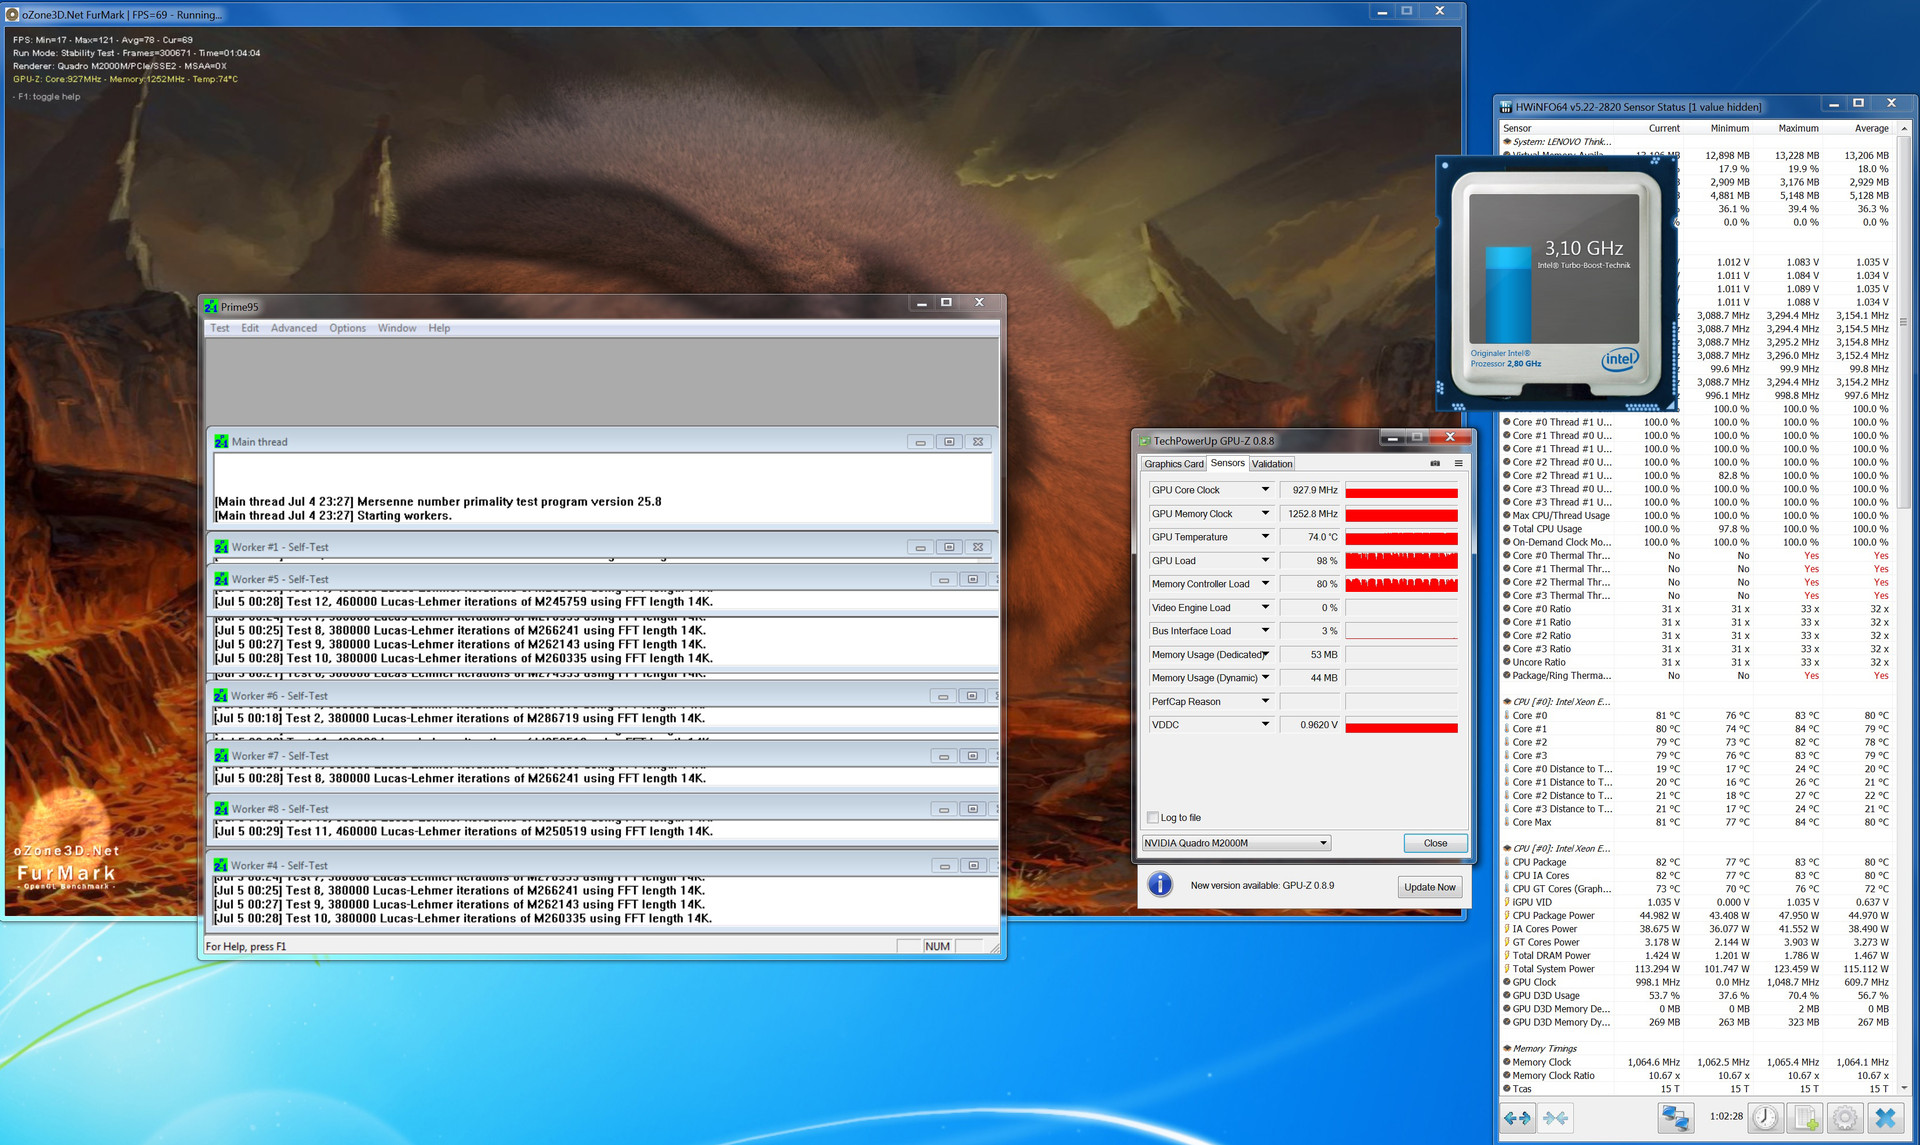
The 4K model with the more powerful Xeon processor gets warmer than the Full HD model with the Core i7. We can already measure a few degrees more while idling, and we can measure much higher temperatures of up to 52 °C (~126 °F) under load. You should not use the device on your lap in this scenario.
As with the FHD model, the performance under sustained load is affected slightly by the temperature limits implemented by Lenovo. The processor can only reach 85 °C (~185 °F), where the clock is reduced from 3.3 to 3.1-3.2 GHz in the stress test (Prime95 and FurMark). We had some problems with heavily fluctuating GPU loads, which also resulted in fluctuating power consumption. This behavior was fixed with the GPU driver from Lenovo. After the GPU reaches a core temperature of 75 °C (~167 °F), the GPU will fluctuate slightly (between 927 and the full 1136 MHz), so the consumption also fluctuates between 110 and 120 watts. A 3DMark 11 run immediately after the stress test did not determine a lower score.
(±) The maximum temperature on the upper side is 44 °C / 111 F, compared to the average of 38.2 °C / 101 F, ranging from 22.2 to 69.8 °C for the class Workstation.
(-) The bottom heats up to a maximum of 52.6 °C / 127 F, compared to the average of 41.1 °C / 106 F
(+) In idle usage, the average temperature for the upper side is 31 °C / 88 F, compared to the device average of 32 °C / 90 F.
(+) The palmrests and touchpad are reaching skin temperature as a maximum (34.2 °C / 93.6 F) and are therefore not hot.
(-) The average temperature of the palmrest area of similar devices was 27.8 °C / 82 F (-6.4 °C / -11.6 F).
Energy Management
Power Consumption
We can see the effect of the high-resolution 4K panel in the idle measurements. The device already consumes 10.2 watts at the lowest luminance, 3.4 watts of which is used by the display. The difference is even bigger in the other two idle scenarios at the highest luminance, because the panel does not use PWM in this range and the display is also slightly brighter compared to the FHD model.
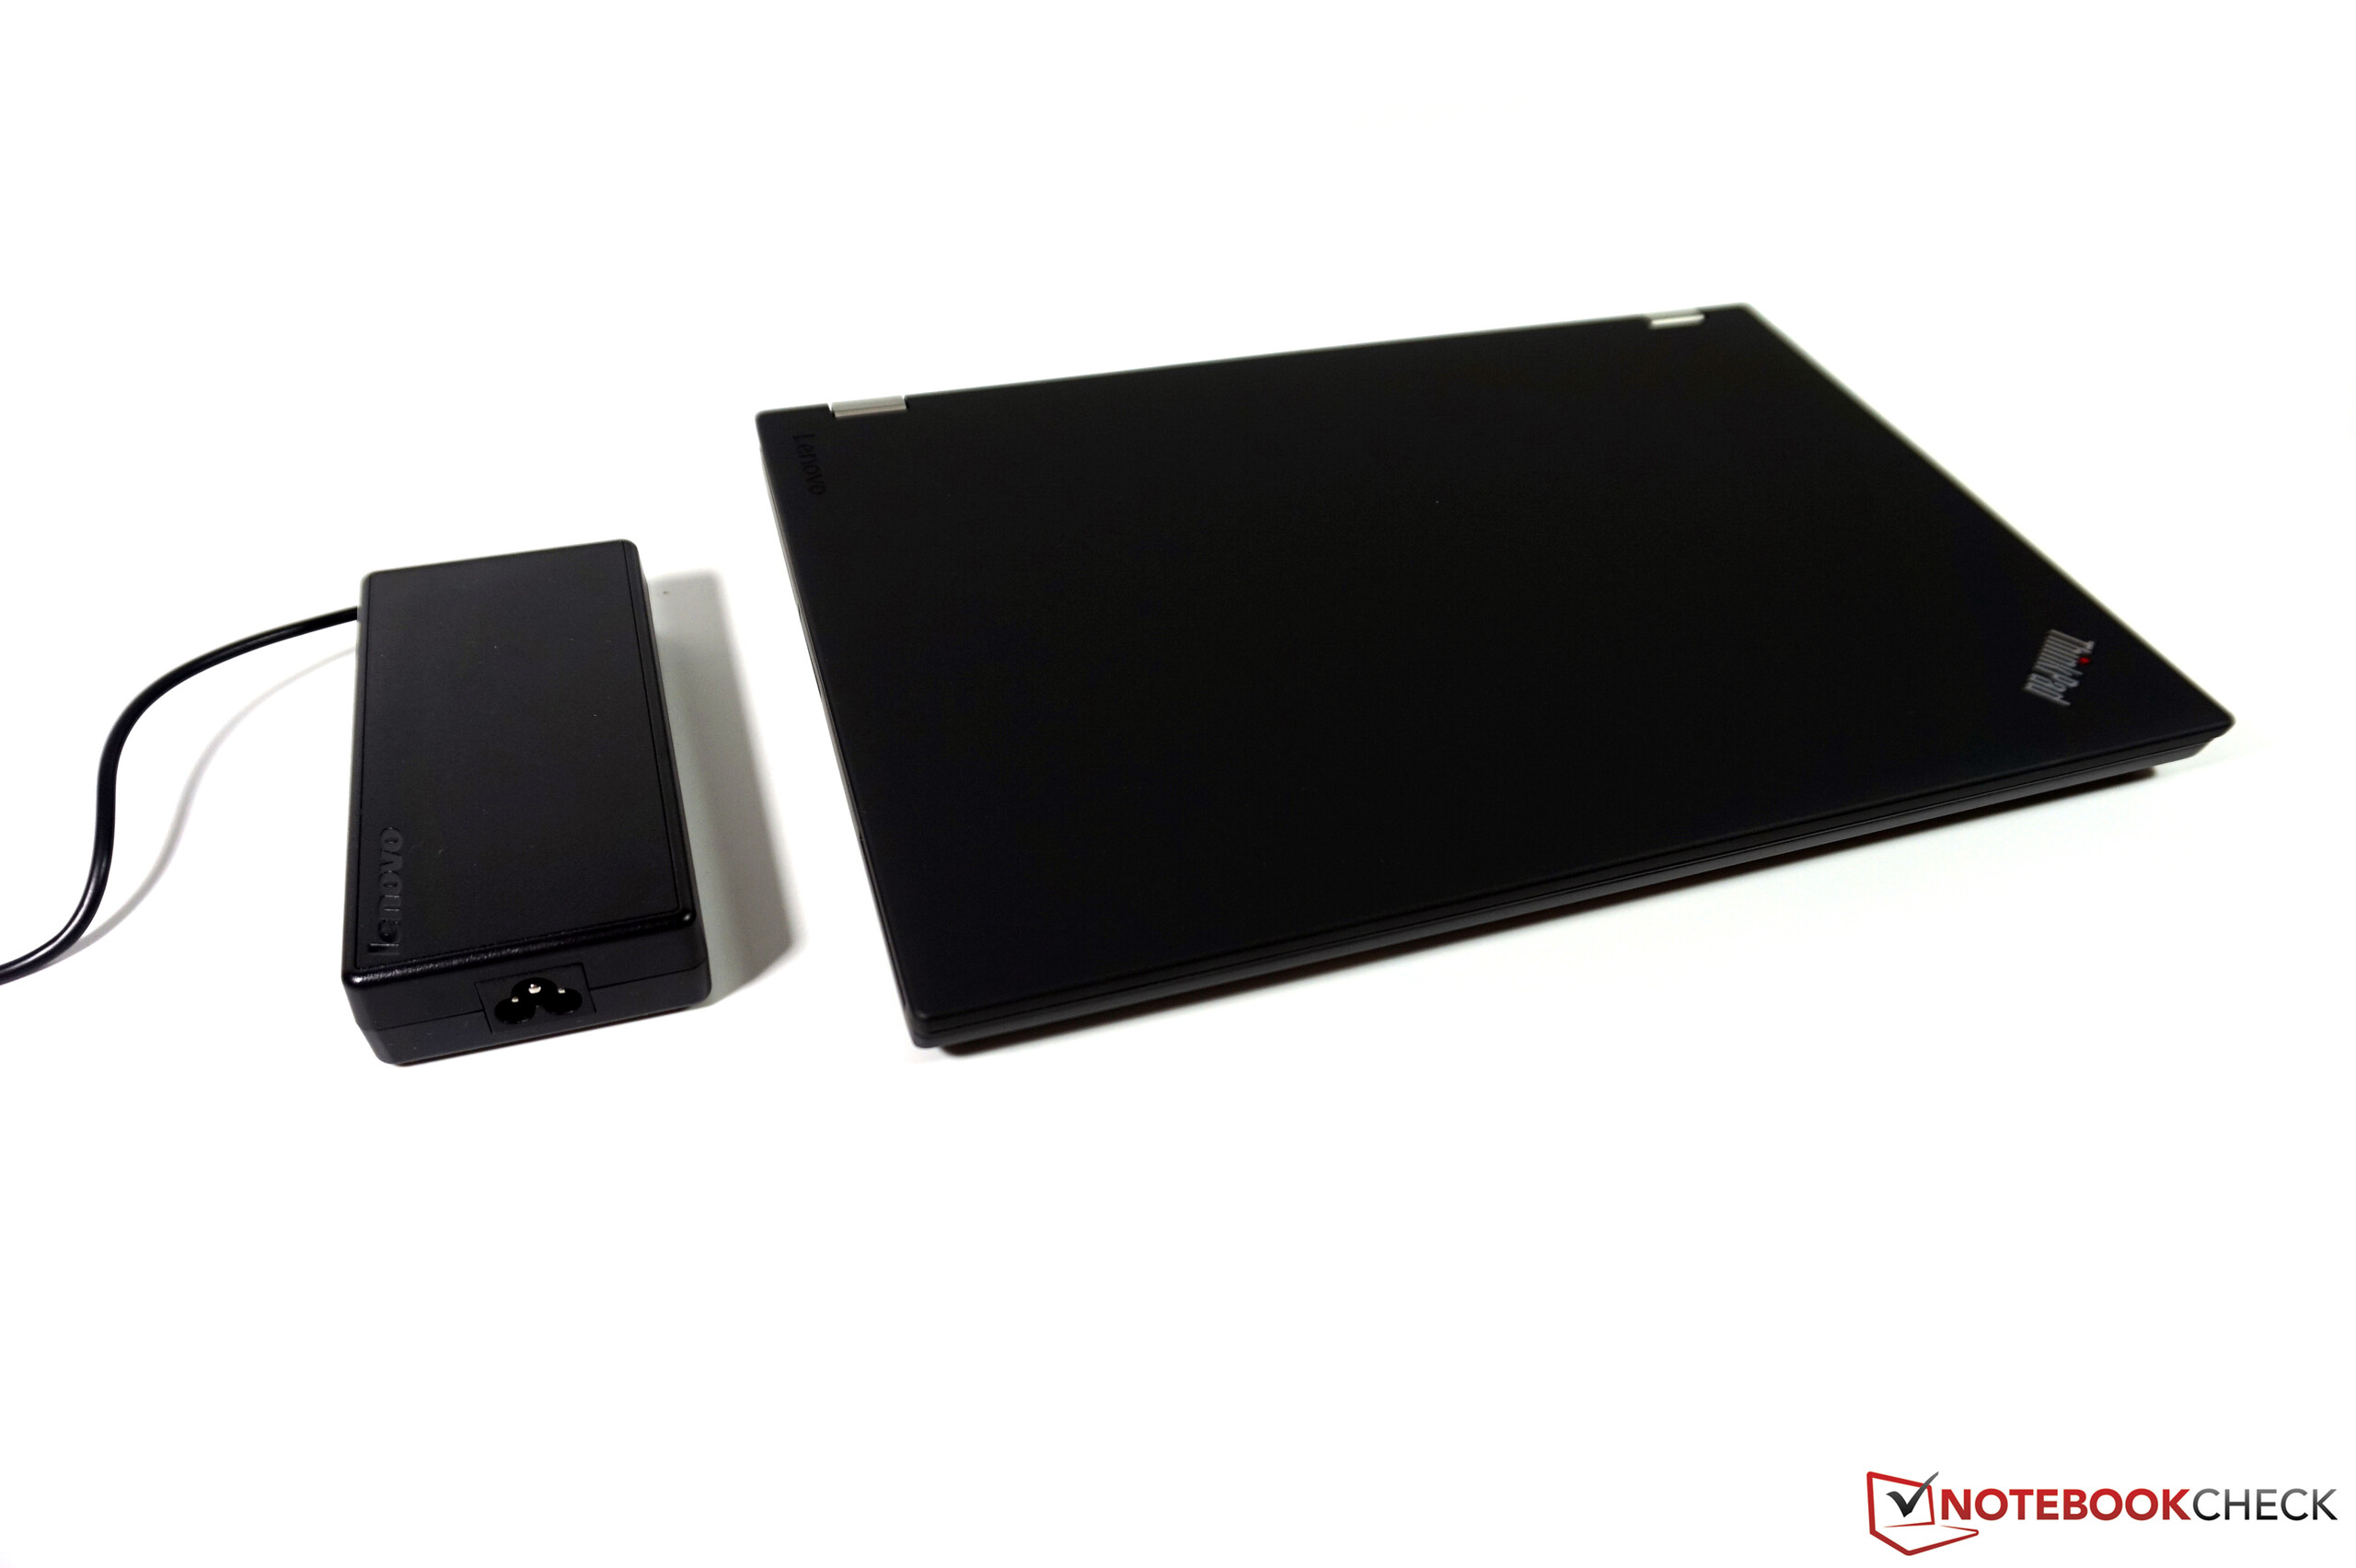
The ThinkPad P50 consumes up to ~123 watts under maximum load, so the consumption is rather higher than that of the Full-HD model (up to 105 watts). The 170-watt power adapter is more than sufficient for this consumption and needs around 2.5 hours to charge the battery.
| Off / Standby | |
| Idle | |
| Load |
|
Key:
min: | |
| Lenovo ThinkPad P50 Quadro M2000M, E3-1505M v5, Samsung SM951 MZVPV256HDGL m.2 PCI-e | Lenovo ThinkPad P50 Quadro M2000M, 6820HQ, Samsung SSD PM871 MZNLN256HCHP | HP ZBook 15 G3 Quadro M2000M, E3-1505M v5, Samsung SM951 MZVPV512HDGL m.2 PCI-e | Dell Precision 5510 Quadro M1000M, E3-1505M v5, SK hynix SC920 512 GB | Schenker W505 Quadro K5100M, E3-1231 v3, Samsung SSD 850 EVO M.2 500GB | Lenovo ThinkPad W541 20EF000SGE Quadro K2100M, 4910MQ, Samsung SSD PM851 512 GB MZ7TE512HMHP | |
|---|---|---|---|---|---|---|
| Power Consumption | 29% | 17% | 4% | -140% | -6% | |
| Idle Minimum * (Watt) | 10.2 | 5.6 45% | 5.7 44% | 8.6 16% | 36 -253% | 11.3 -11% |
| Idle Average * (Watt) | 17.8 | 8.6 52% | 12.2 31% | 16.2 9% | 41.2 -131% | 18.5 -4% |
| Idle Maximum * (Watt) | 18.3 | 9.3 49% | 12.6 31% | 16.7 9% | 47.4 -159% | 19.7 -8% |
| Load Average * (Watt) | 76.9 | 89.5 -16% | 83.1 -8% | 82.6 -7% | 126.6 -65% | 84 -9% |
| Load Maximum * (Watt) | 123.5 | 105 15% | 138.2 -12% | 131.8 -7% | 235.8 -91% | 121.9 1% |
* ... smaller is better
Battery Runtime
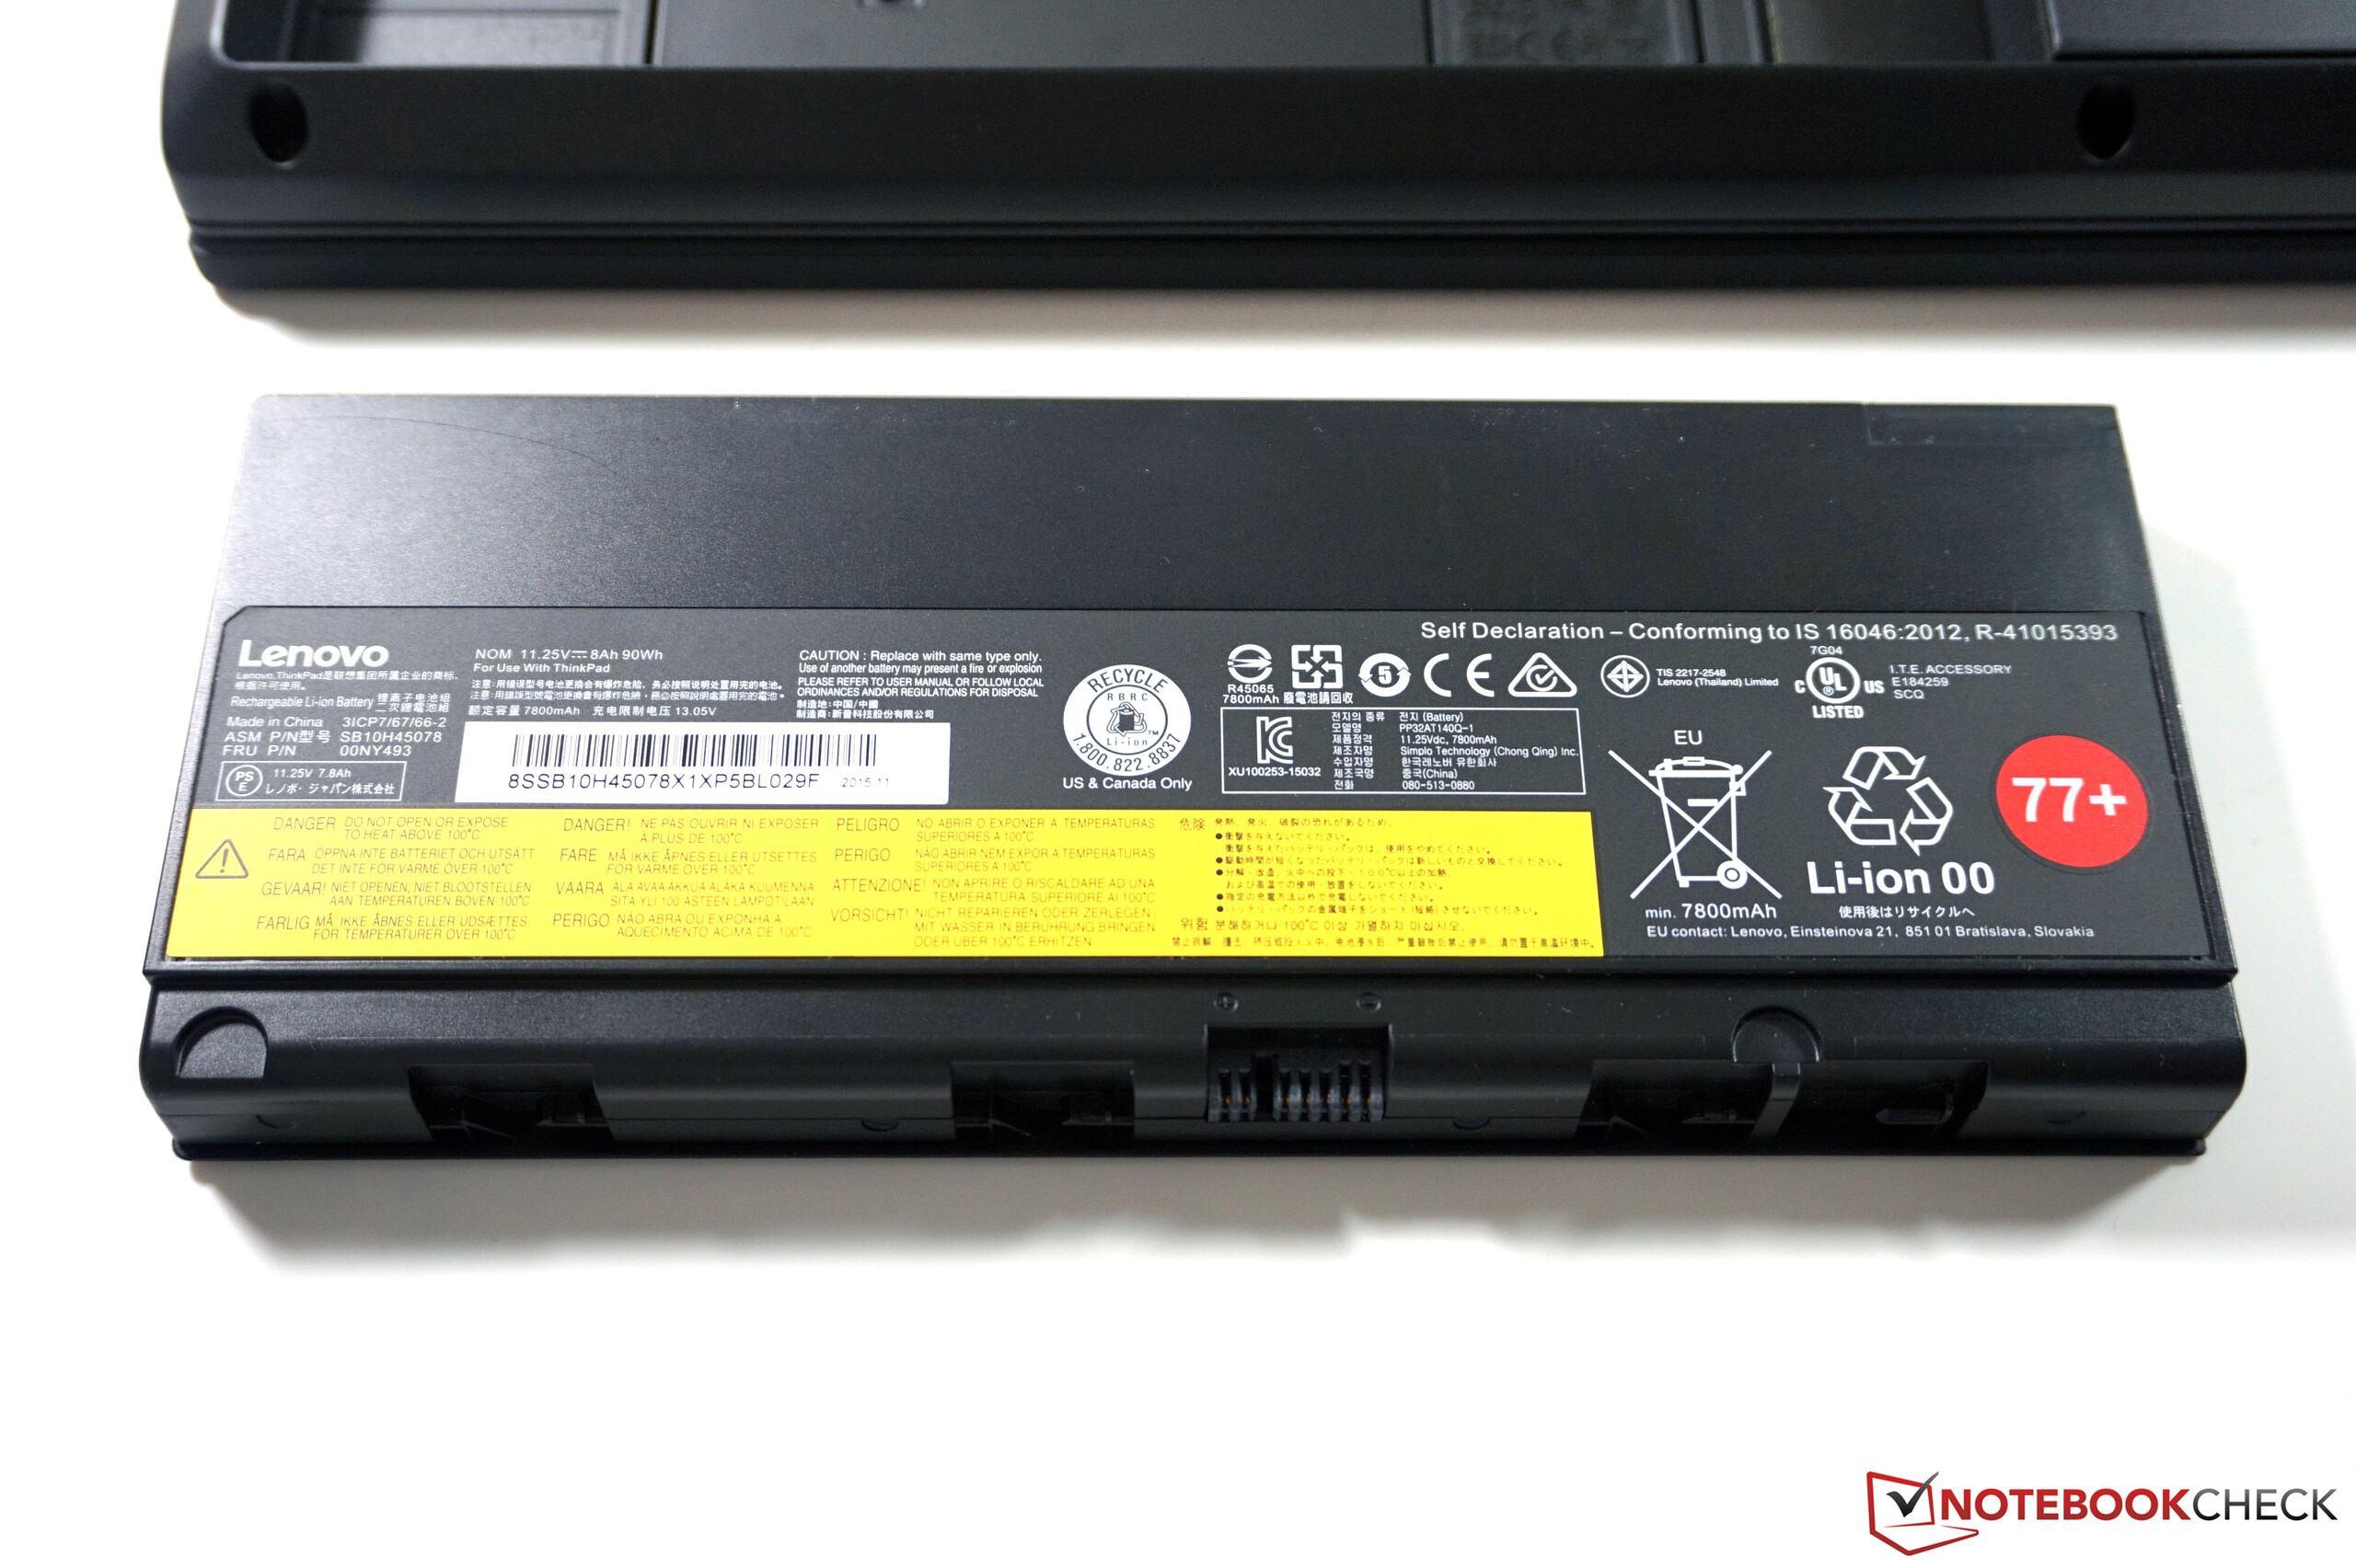
The battery (90 Wh) has not changed, so the increased power consumption does affect the battery runtimes. The minimum runtime is 81 minutes in a loop of the SPECviewperf 12 benchmark, while our usual Battery Eater Classic Test runs for 98 minutes. Compared to the Full HD model the two tests with an adjusted luminance of around 150 cd/m² (level 13: 137 cd/m²) are much worse. Compared to more than 8 (WLAN) and almost 9 hours (video), our review unit with the 4K panel only lasts for almost 5 and 5.5 hours, respectively.


| Lenovo ThinkPad P50 Quadro M2000M, E3-1505M v5, Samsung SM951 MZVPV256HDGL m.2 PCI-e | Lenovo ThinkPad P50 Quadro M2000M, 6820HQ, Samsung SSD PM871 MZNLN256HCHP | HP ZBook 15 G3 Quadro M2000M, E3-1505M v5, Samsung SM951 MZVPV512HDGL m.2 PCI-e | Dell Precision 5510 Quadro M1000M, E3-1505M v5, SK hynix SC920 512 GB | Schenker W505 Quadro K5100M, E3-1231 v3, Samsung SSD 850 EVO M.2 500GB | Lenovo ThinkPad W541 20EF000SGE Quadro K2100M, 4910MQ, Samsung SSD PM851 512 GB MZ7TE512HMHP | |
|---|---|---|---|---|---|---|
| Battery runtime | 53% | 34% | -12% | -46% | 11% | |
| Reader / Idle (h) | 9 | 14.3 59% | 13.7 52% | 7.1 -21% | 2.5 -72% | 10.8 20% |
| H.264 (h) | 5.5 | 8.9 62% | 7.5 36% | 3.3 -40% | ||
| WiFi v1.3 (h) | 4.8 | 8.3 73% | 6.4 33% | 4.8 0% | 5.7 19% | |
| Load (h) | 1.6 | 1.9 19% | 1.8 13% | 1.8 13% | 1.3 -19% | 1.5 -6% |
| WiFi (h) | 5 |
Pros
Cons
Verdict
The review update of the ThinkPad P50 is very interesting, but it does not really make it easier to choose the right model for potential buyers. We want to start with two positive aspects: The Turbo Boost problem, which affected the benchmark results of our Full HD model, seems to be fixed. This means that users can now utilize the full performance all the time. The crackling speakers were apparently fixed as well, because we could not notice any issues in this regard.
The situation is more complicated for the display. The Full HD screen was not very impressive in terms of luminance and color gamut, but the 4K panel has its problems as well. The advertised luminance of 300 nits is missed, and PWM is used to control the brightness. The contrast is not much better, either. The 4K panel does have a clear advantage in terms of the color gamut, so it is pretty much the only solution for serious picture editing. You should, however, calibrate the screen. The integrated colorimeter does not produce good results for our review unit. Other drawbacks are the much higher power consumption and therefore much shorter battery runtimes.
The fans are spinning a bit sooner under load, and the device gets warmer in general. You will have to decide: If you are often on the road, you will probably prefer the long battery runtimes of the Full HD model, while other users need the wider gamut. Unfortunately, the 4K panel– despite the slightly darker FHD screen – is not the better choice for all users. Because of the mentioned drawbacks, the 4K review unit also gets a slightly lower overall rating of 84%.
Lenovo ThinkPad P50
- 07/05/2016 v5.1 (old)
Andreas Osthoff
Price comparison

