Schenker W505 (Clevo P751ZM) Notebook Review

For the original German review, see here.
The manufacturer Schenker Technologies specializes with gaming notebooks, but it also offers workstations. Our review unit W505 is available with typical gaming GPUs (GeForce GTX 980M, GTX 970M & GTX 965M), but you can also choose GPUs for professional scenarios. While the Quadro K1100M is the entry-level solution, the Quadro K3100M for 400 Euros (~$442) is a mainstream chip. Our notebook uses the current top version Quadro K5100M, which costs an exorbitant 2,065 Euros (~$2283) and appears to be overpriced. Schenker does not offer the intermediate models K2100M and K4100M.
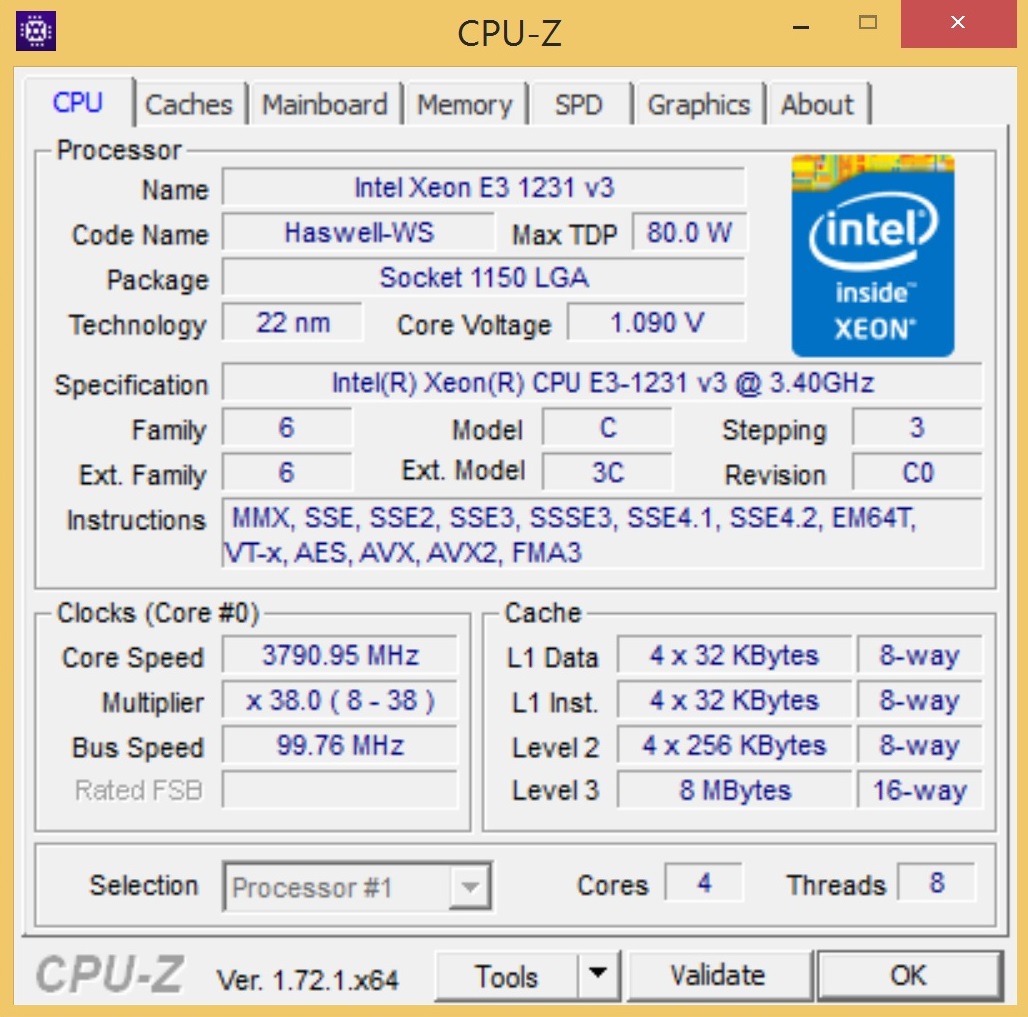
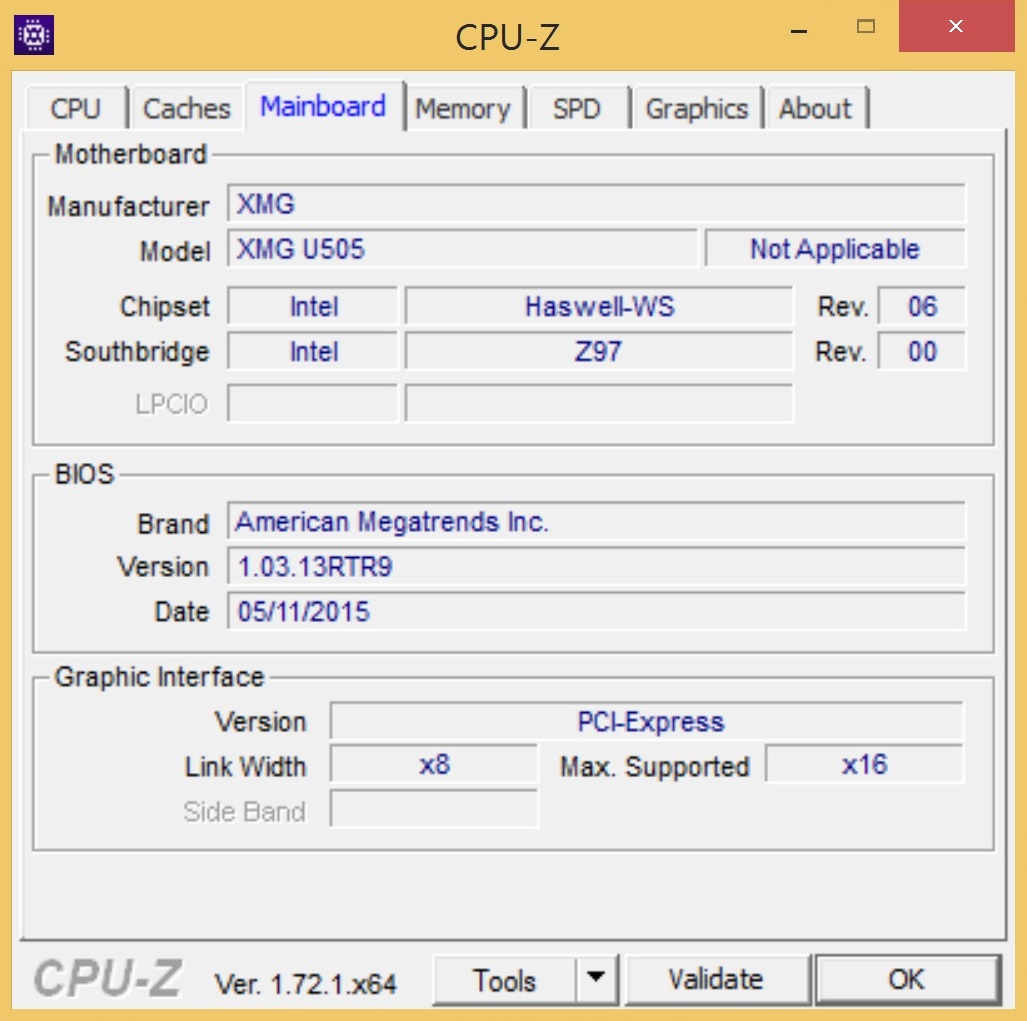
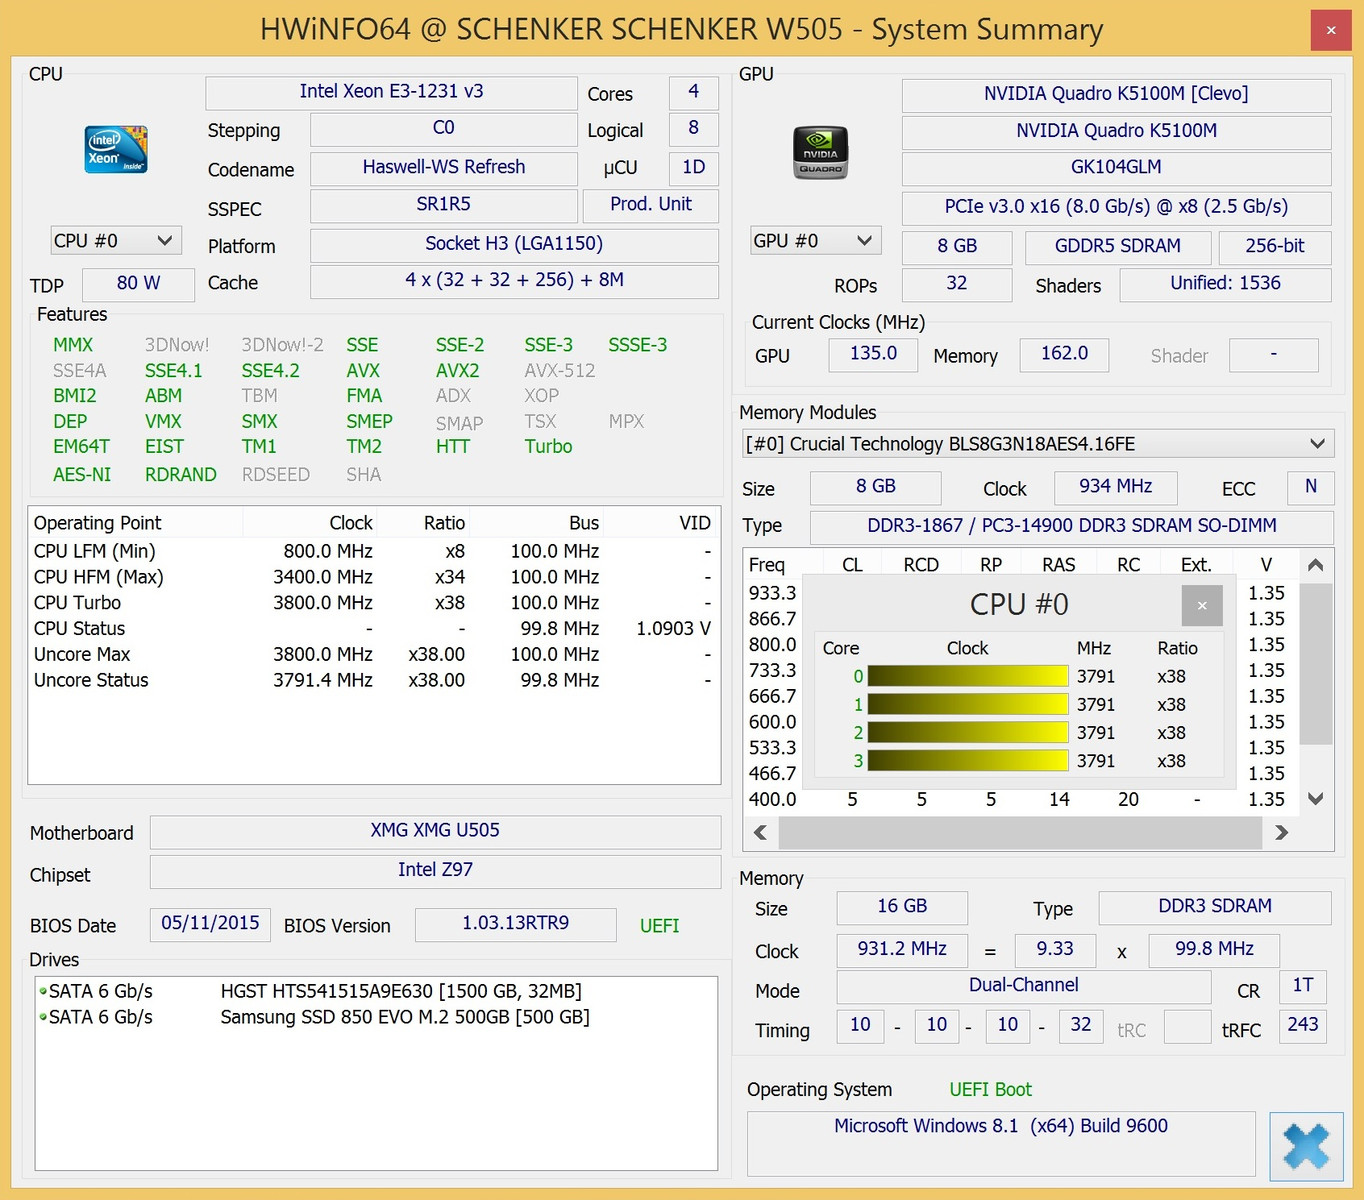
If you look at the other components, you can quickly see the similarities to the gaming sibling XMG U505, which got a rating of 88% in our review. Schenker does not use a notebook CPU but a desktop processor for the maximum amount of performance. The selection starts with a mainstream chip Core i5-4460S (4 cores, 4 threads, 88-Watt TDP) up to a Core i7-4790K (4 cores, 8 threads, 4.0-4.4 GHz, 88-Watt TDP), which is not too expensive for 196 Euros (~$216) more. We selected the server CPU Intel Xeon E3-1231 v3 (4 cores, 8 threads, 3.4-3.8 GHz, 80-Watt TDP) to work in combination with the professional GPU. Contrary to the Core ix models, the Xeon does not have a graphics chip, but this is not important because the Optimus technology is not supported.
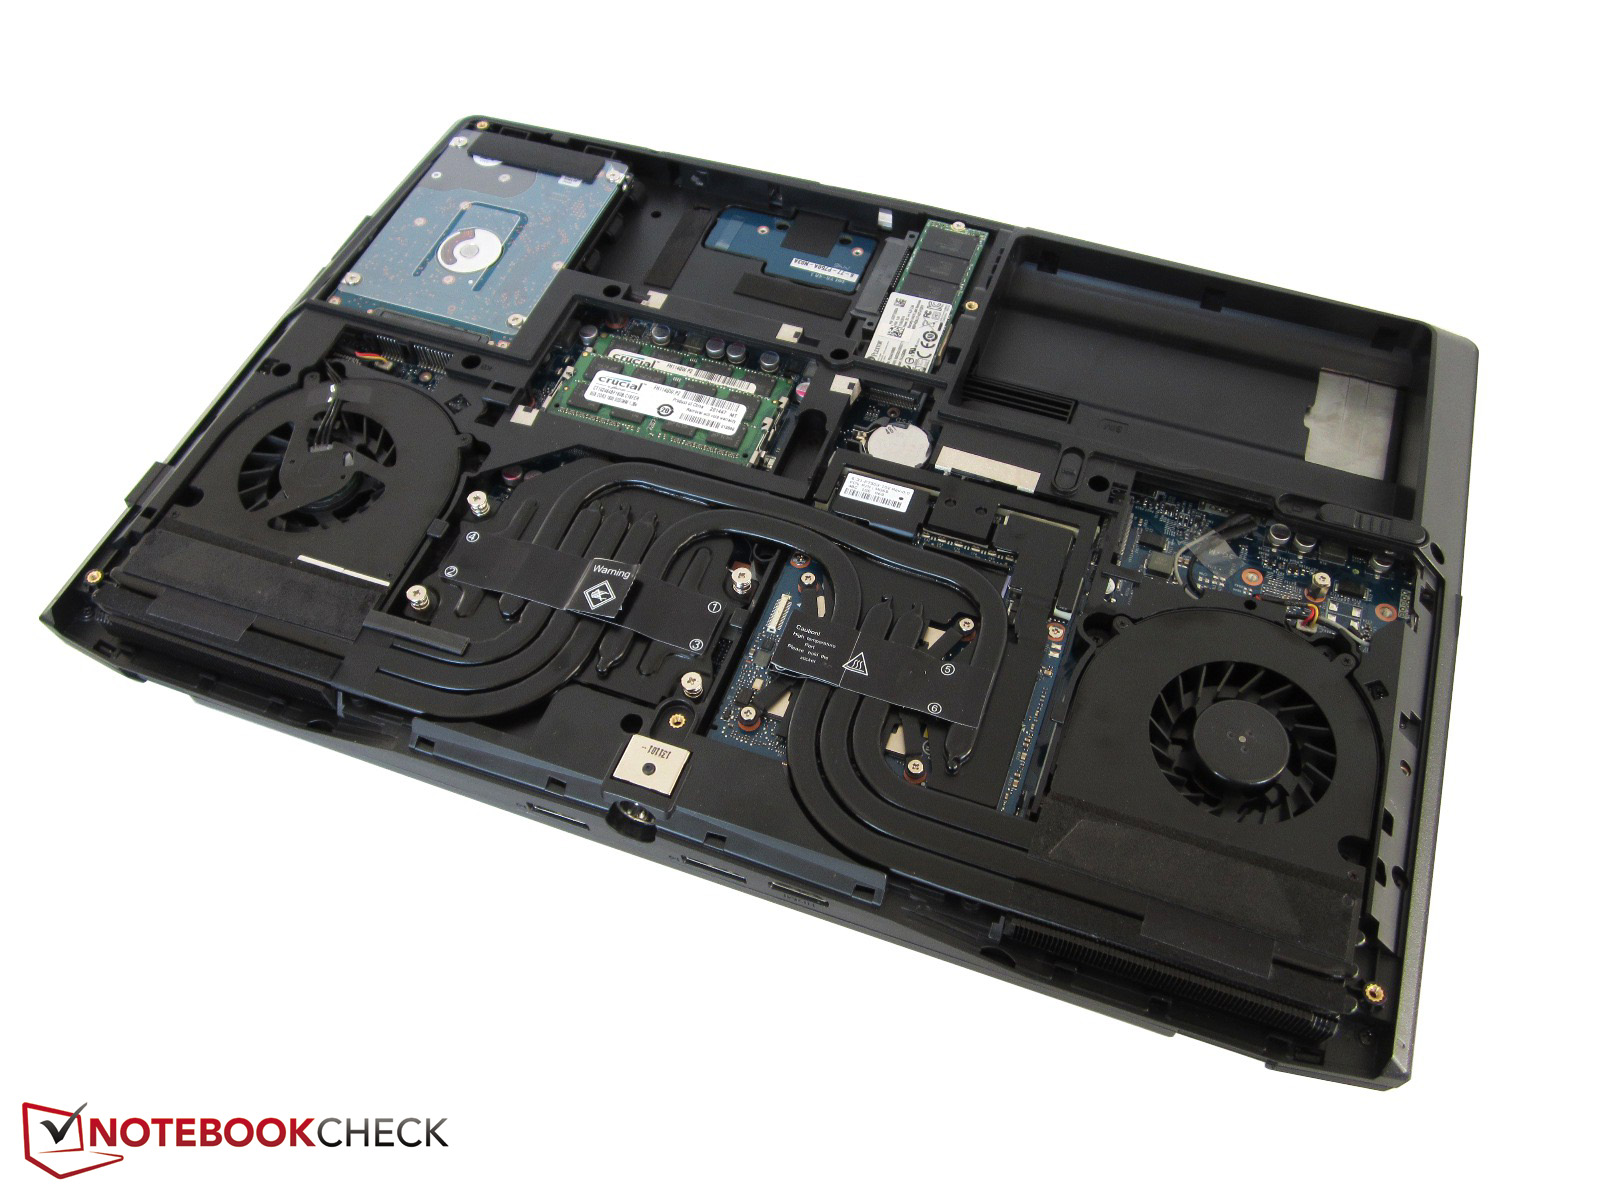
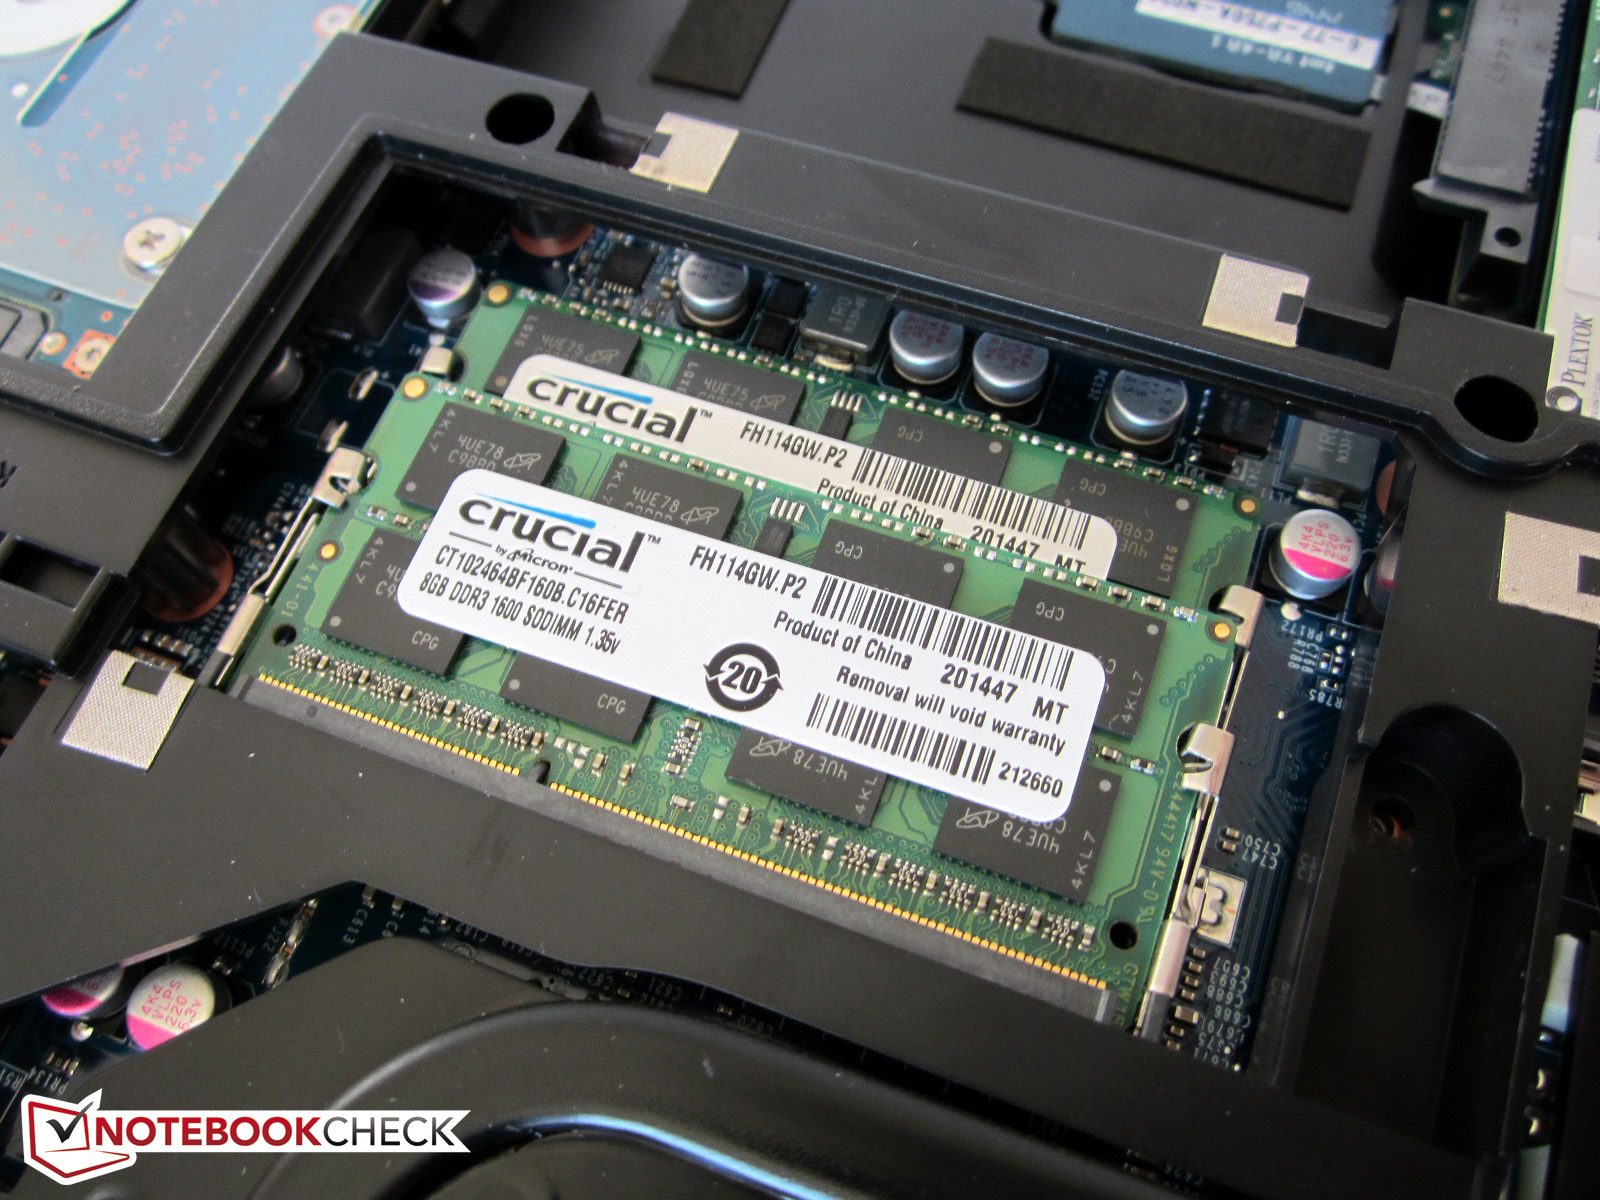
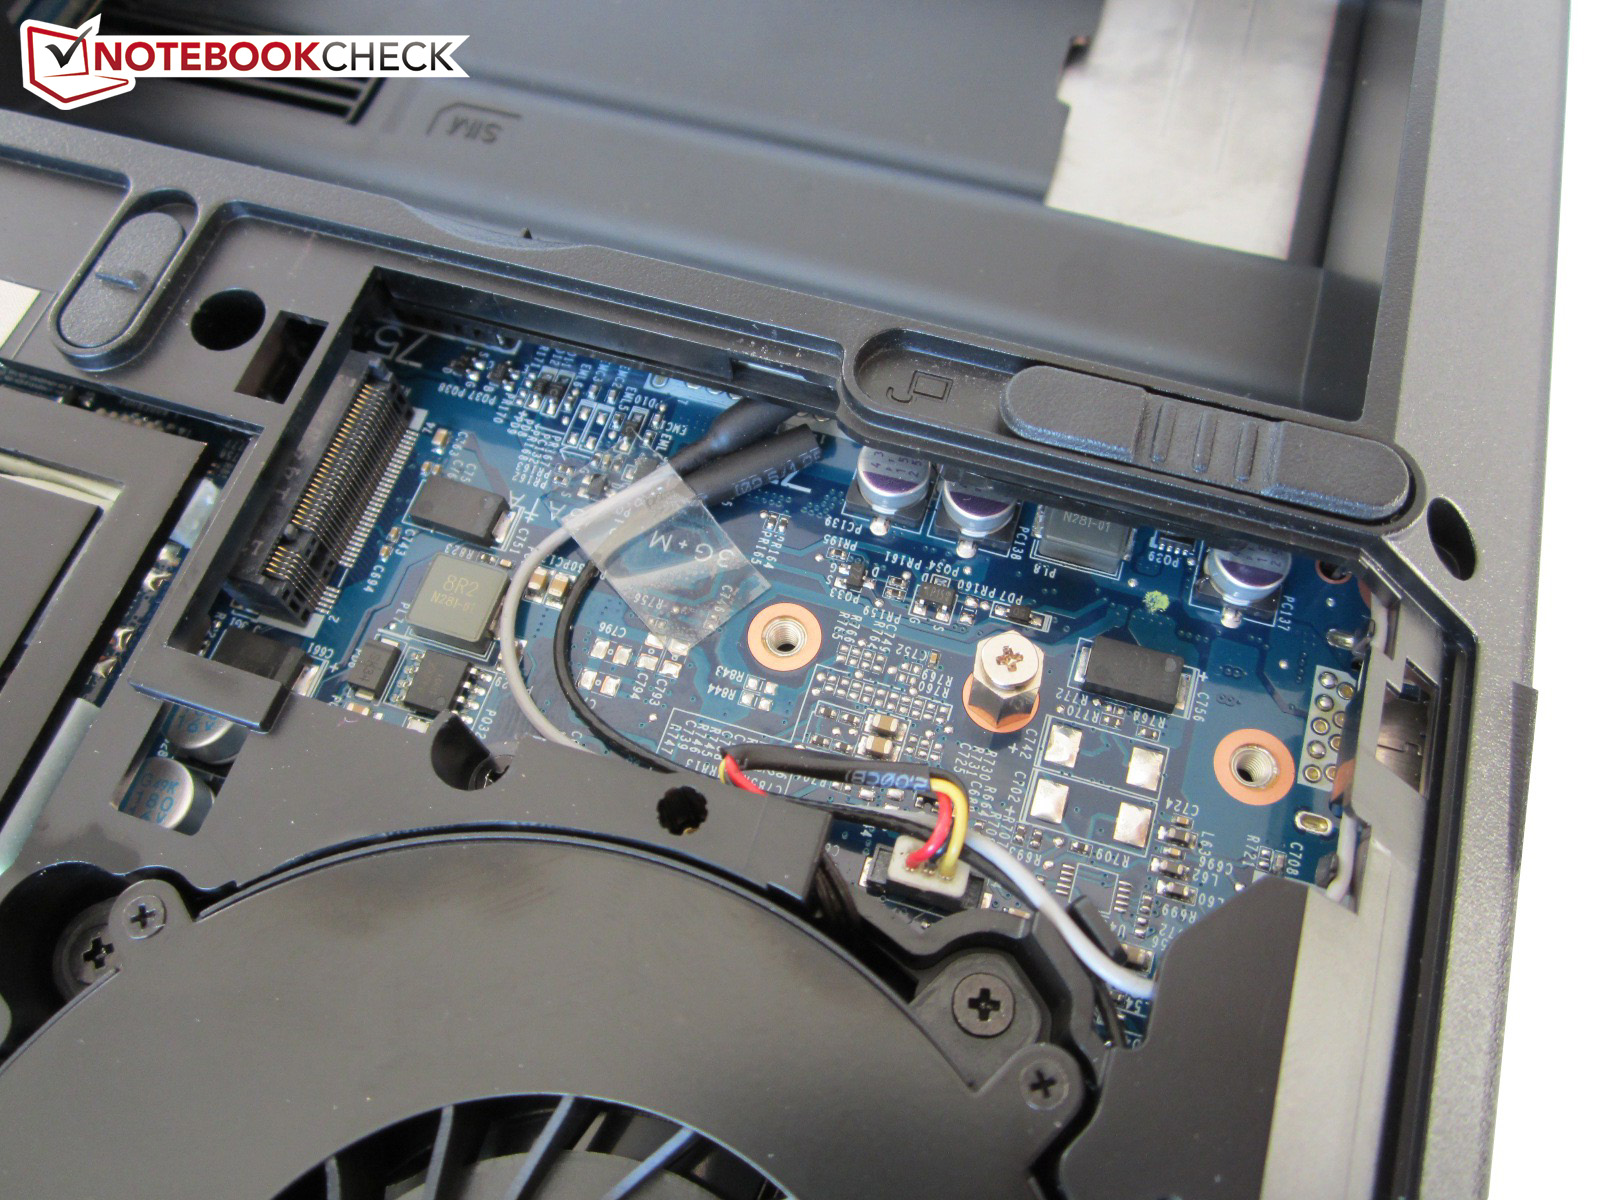
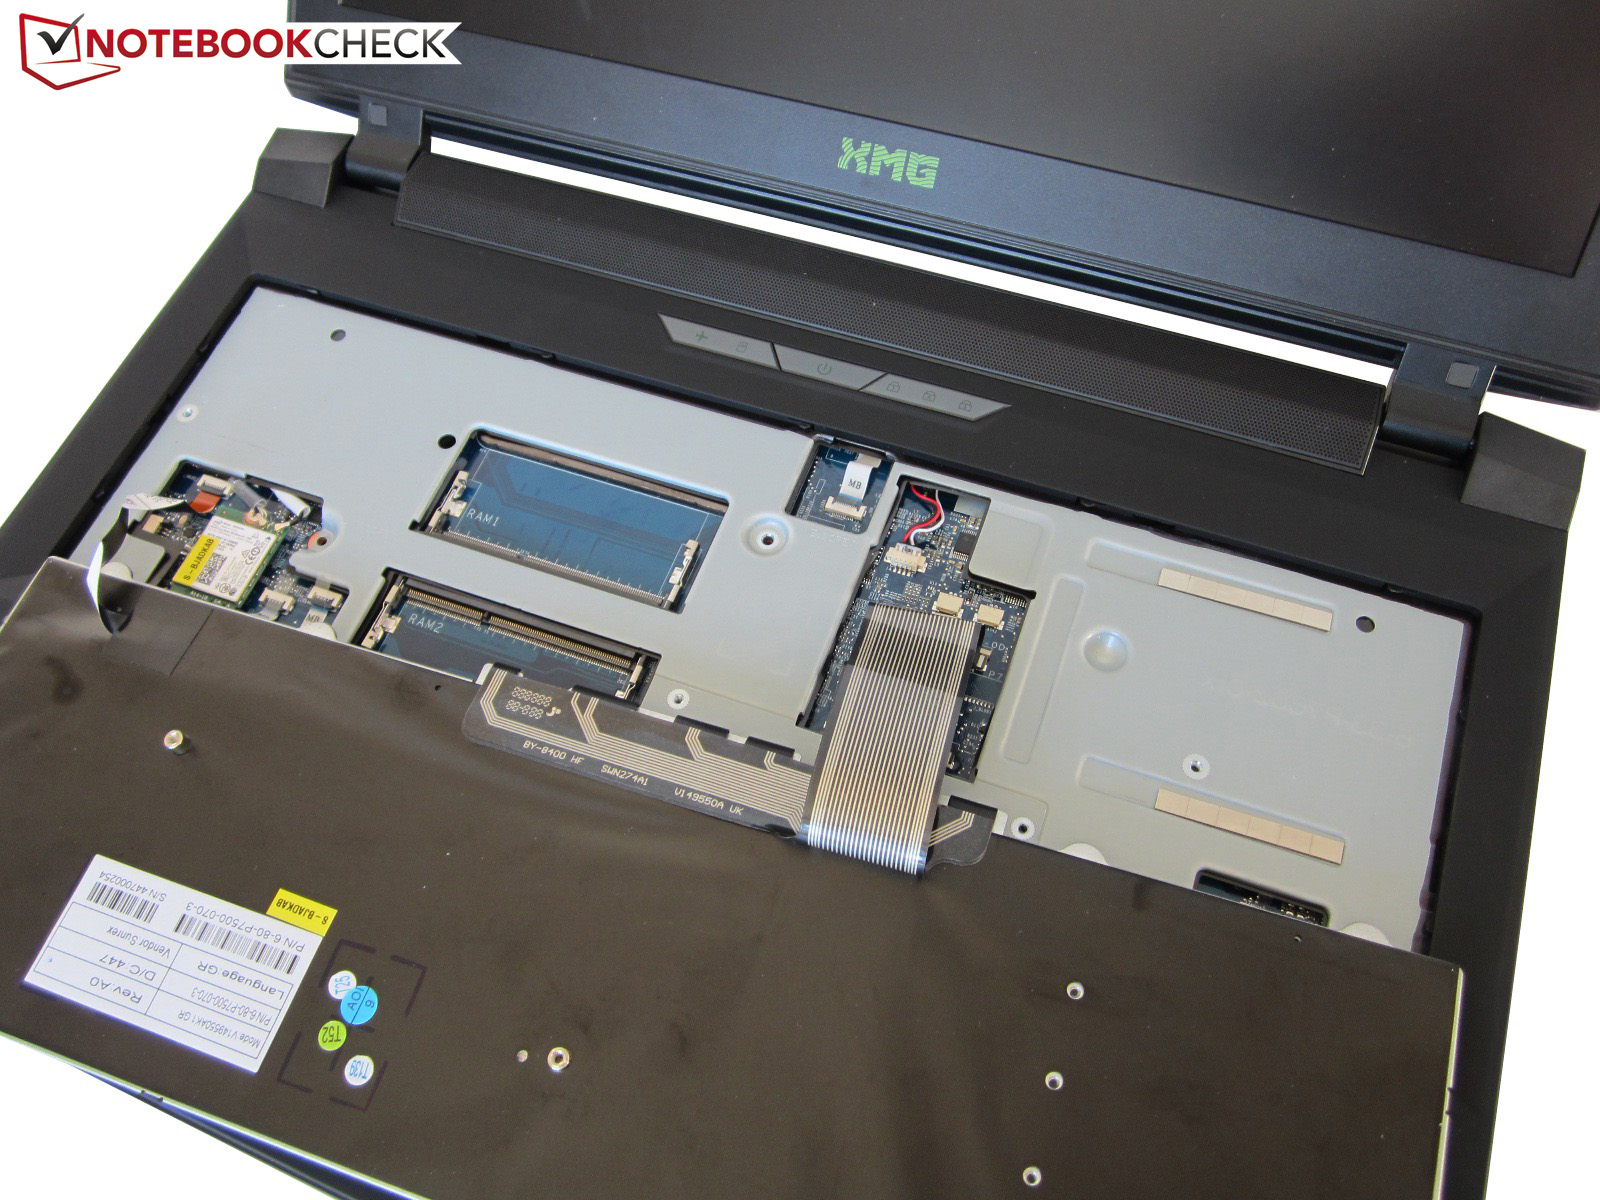
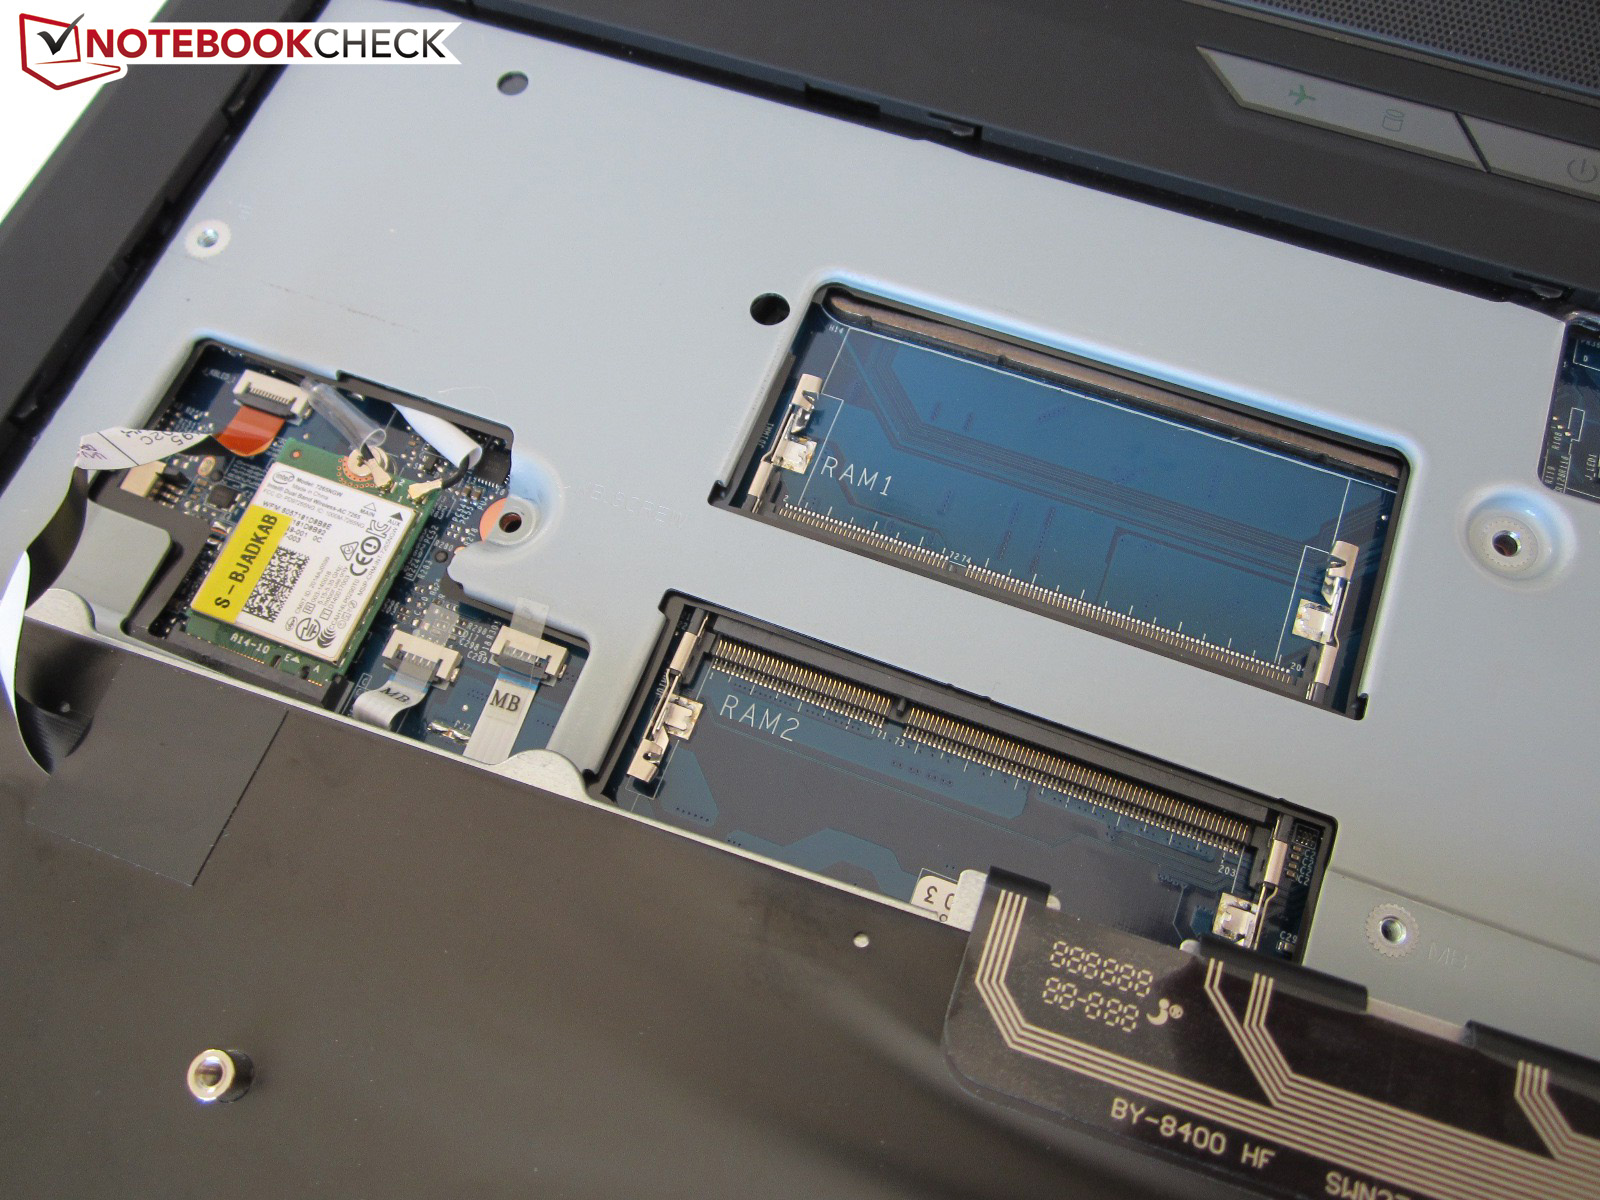
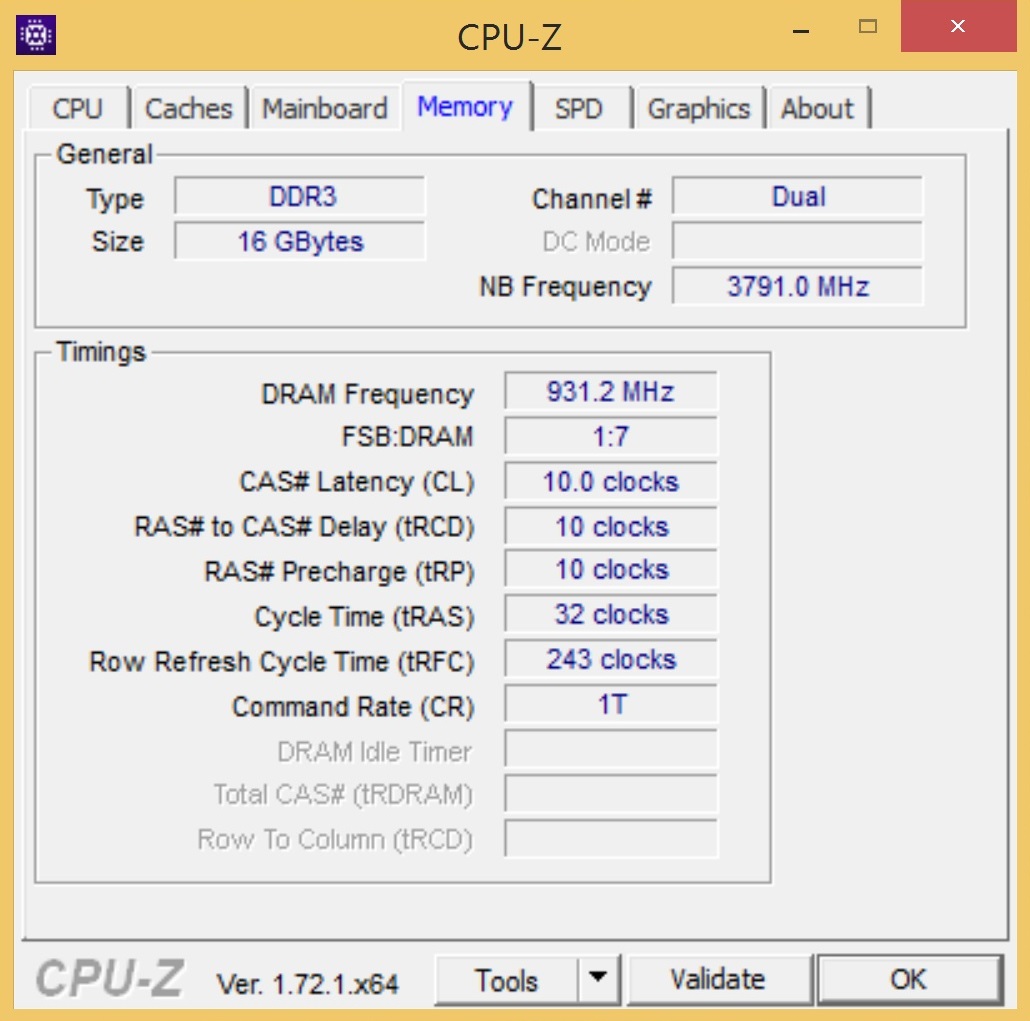
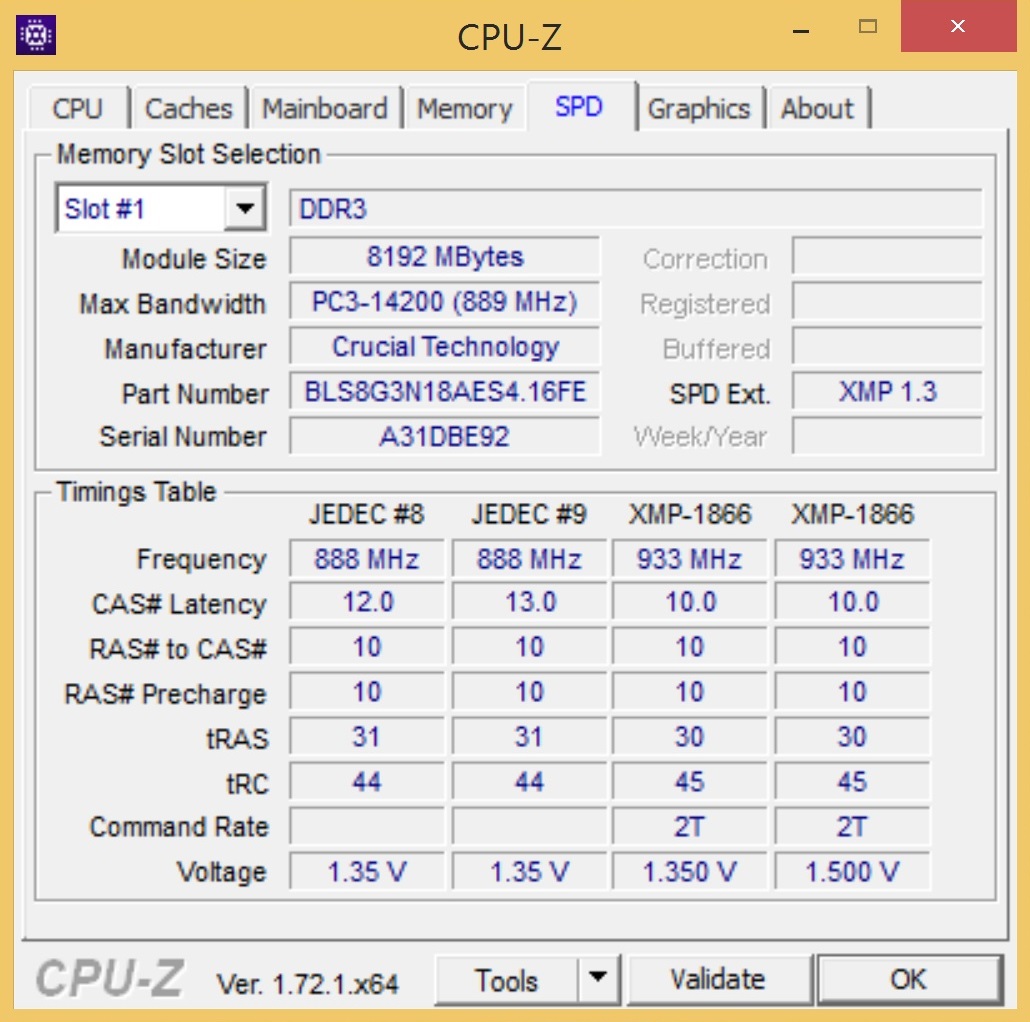
The Schenker W505 supports up to 32 GB DDR3 memory (1866 or 2133 MHz). Up to four storage drives (2x M.2, 2x 2.5-inch) are generous as well. Fans of high-resolution displays will be happy as well. The standard FHD display can be replaced by a 4K panel (3840x2160 instead of 1920x1080 pixels). Our review configuration with an operating system costs around 4,500 Euros (~$4975), which is similar to the HP ZBook 15 G2 and the MSI WT72-2OL32SR311BW. Place 3 and place 4 of the Workstation Top 10 are much cheaper. Both the Fujitsu Celsius H730 as well as the Dell Precision M2800 only cost around 2,000 Euros (~$2211). This is not surprising since the graphics chips are less powerful.
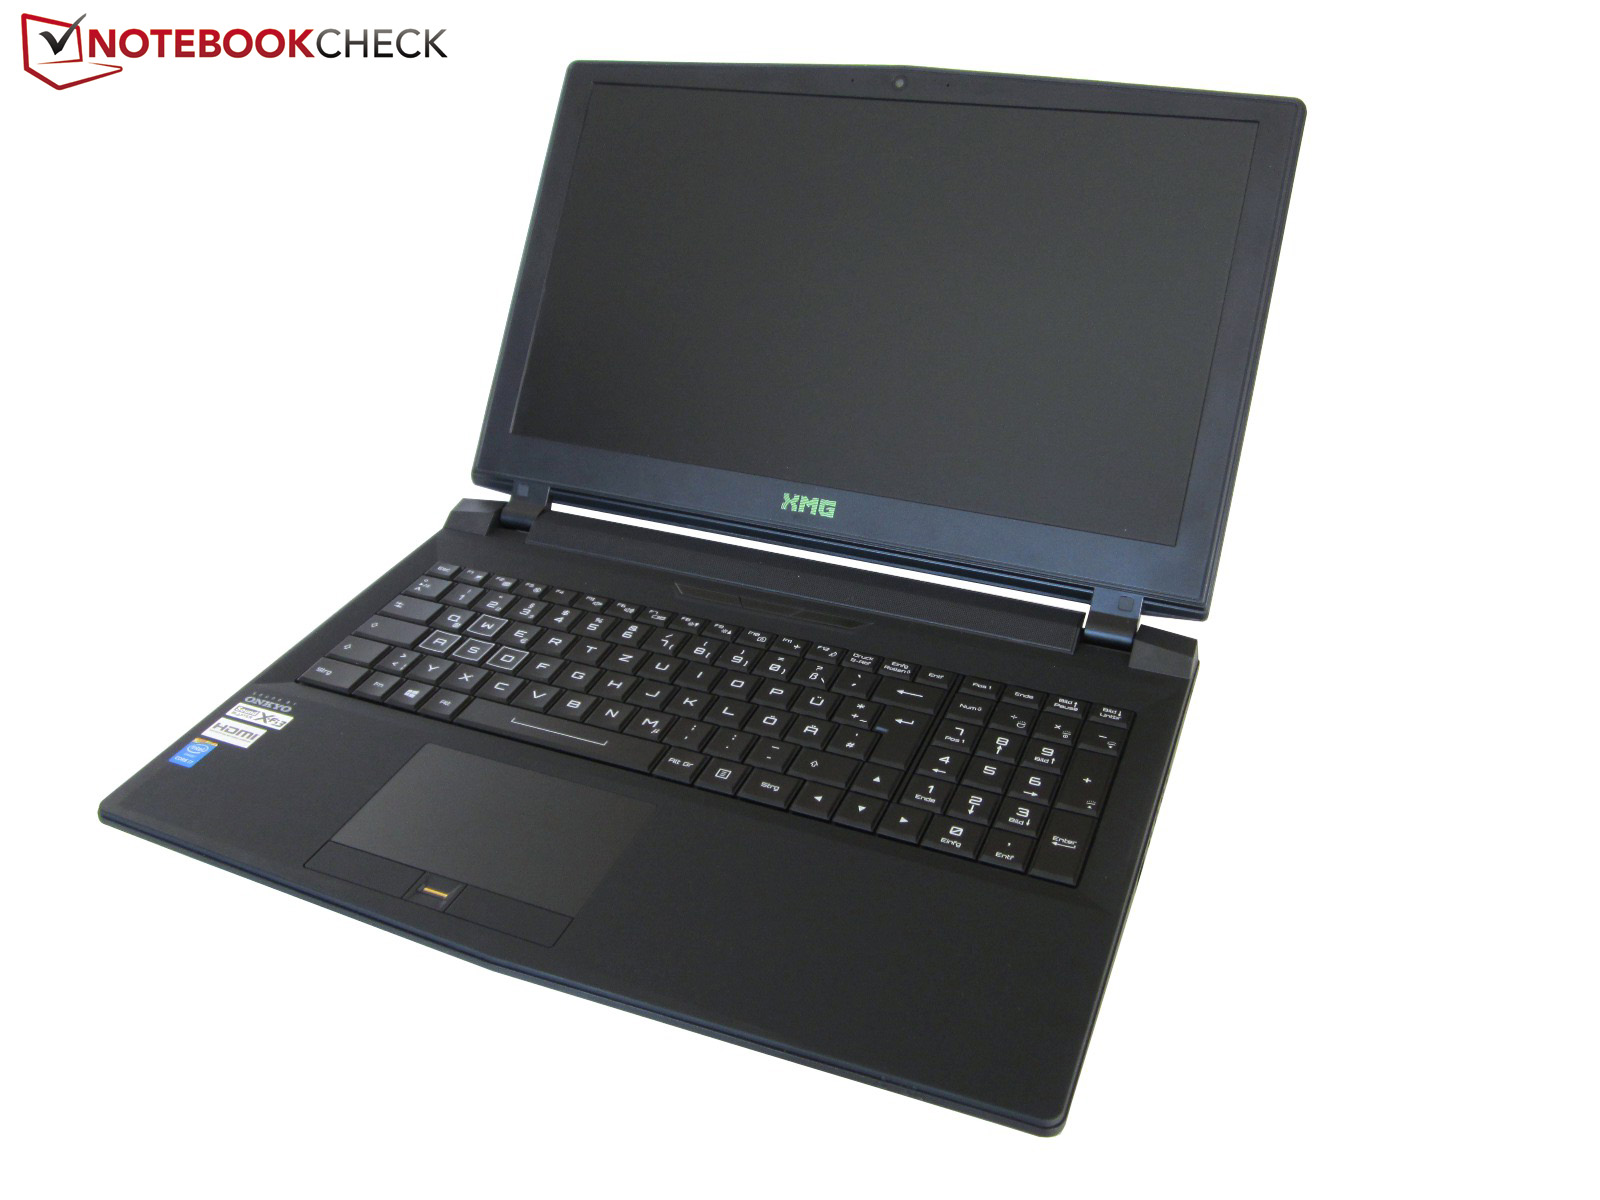
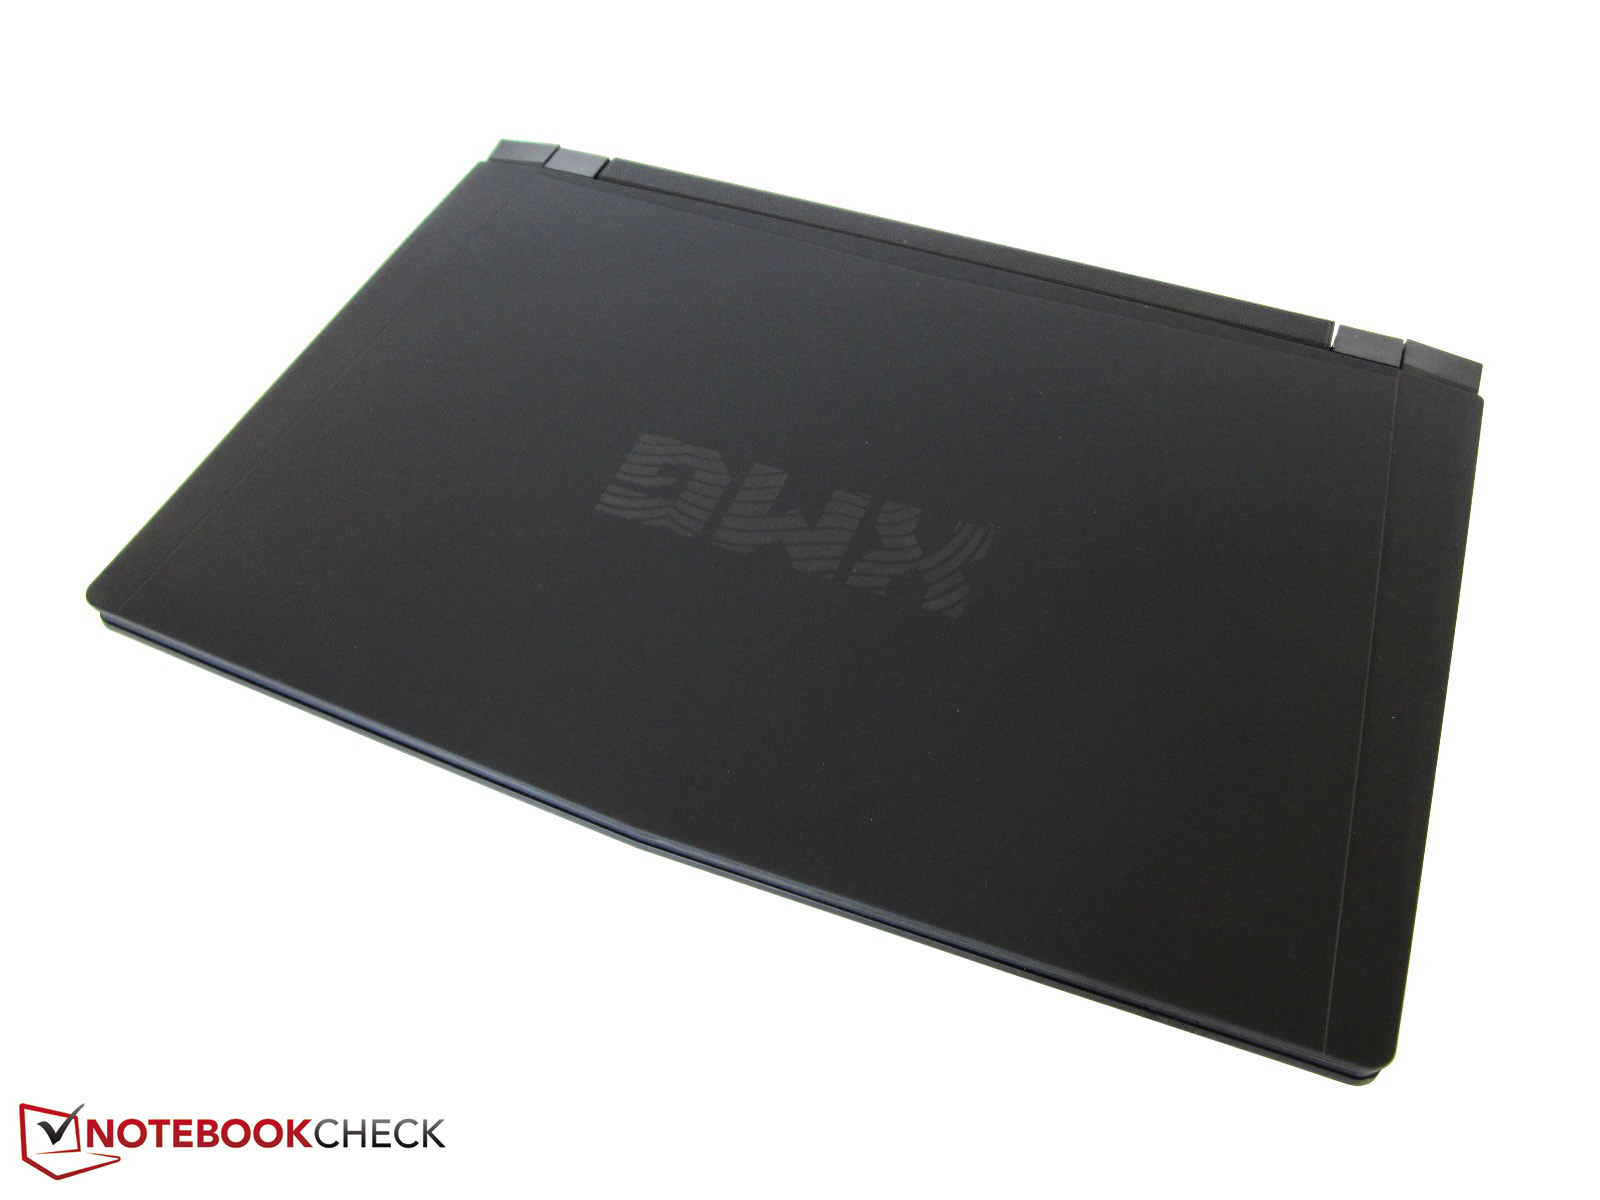
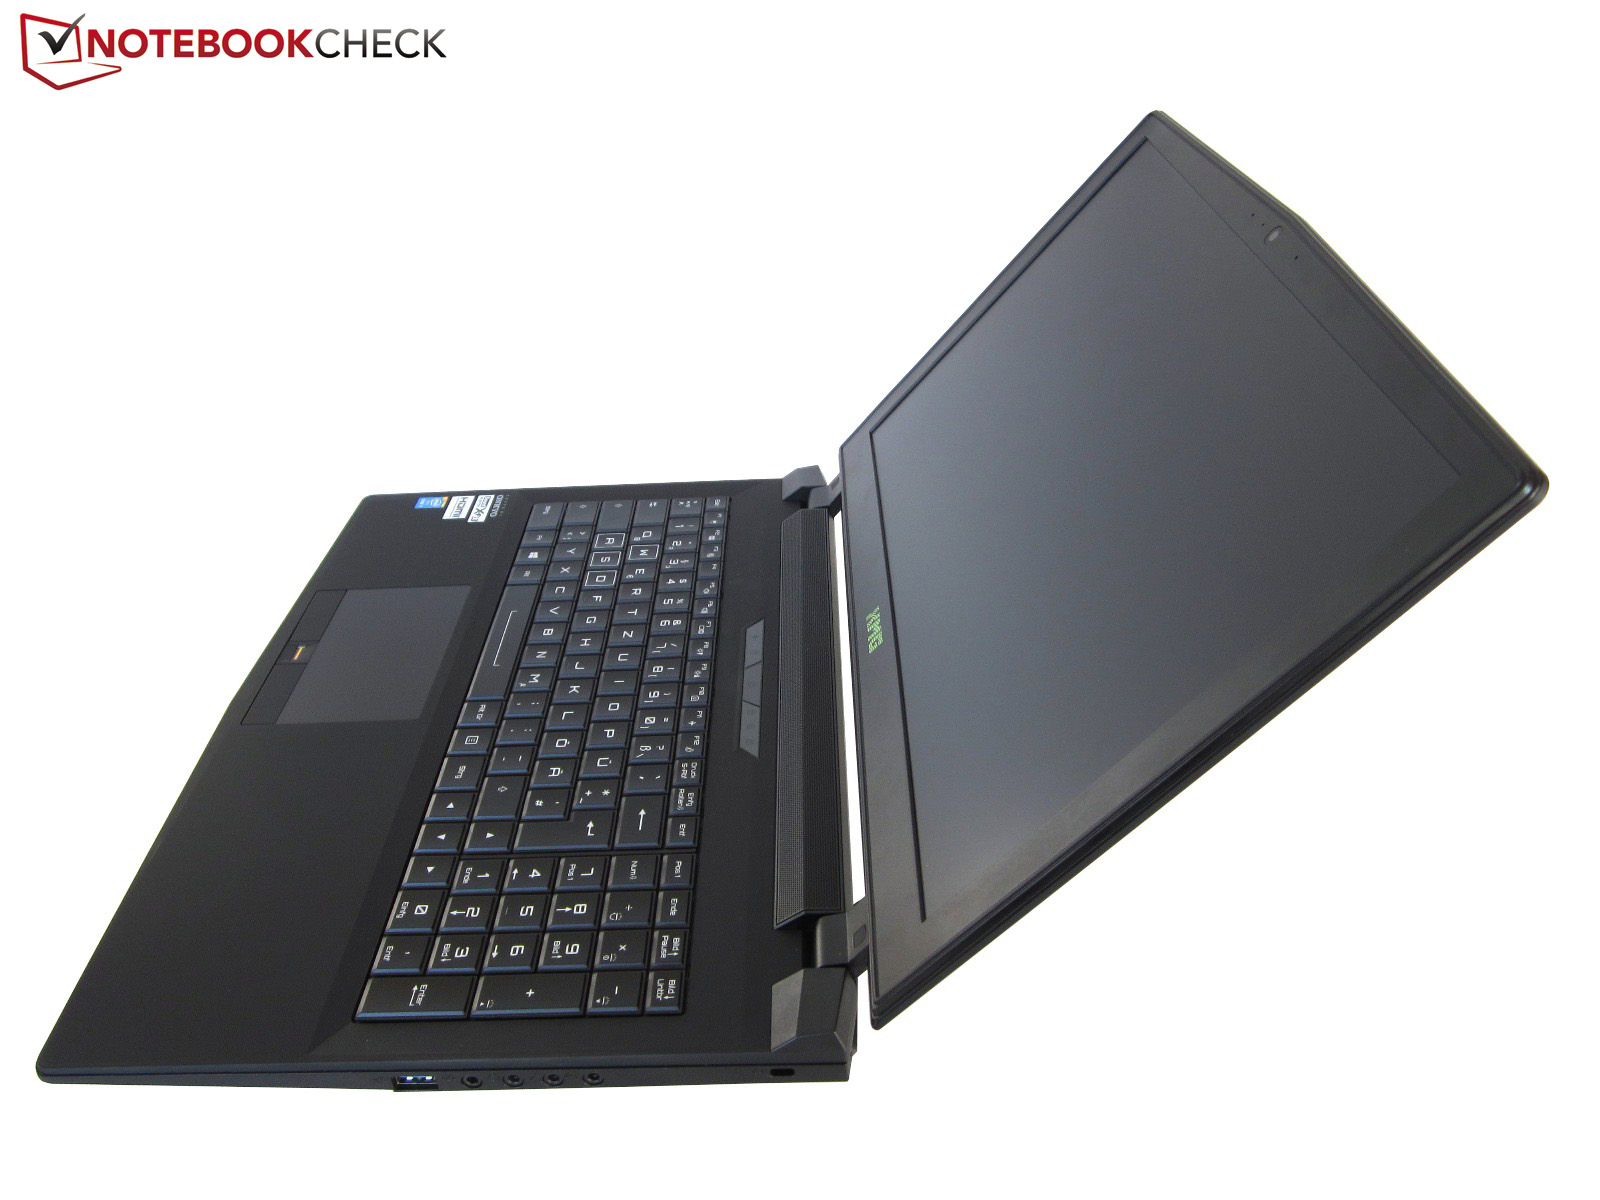
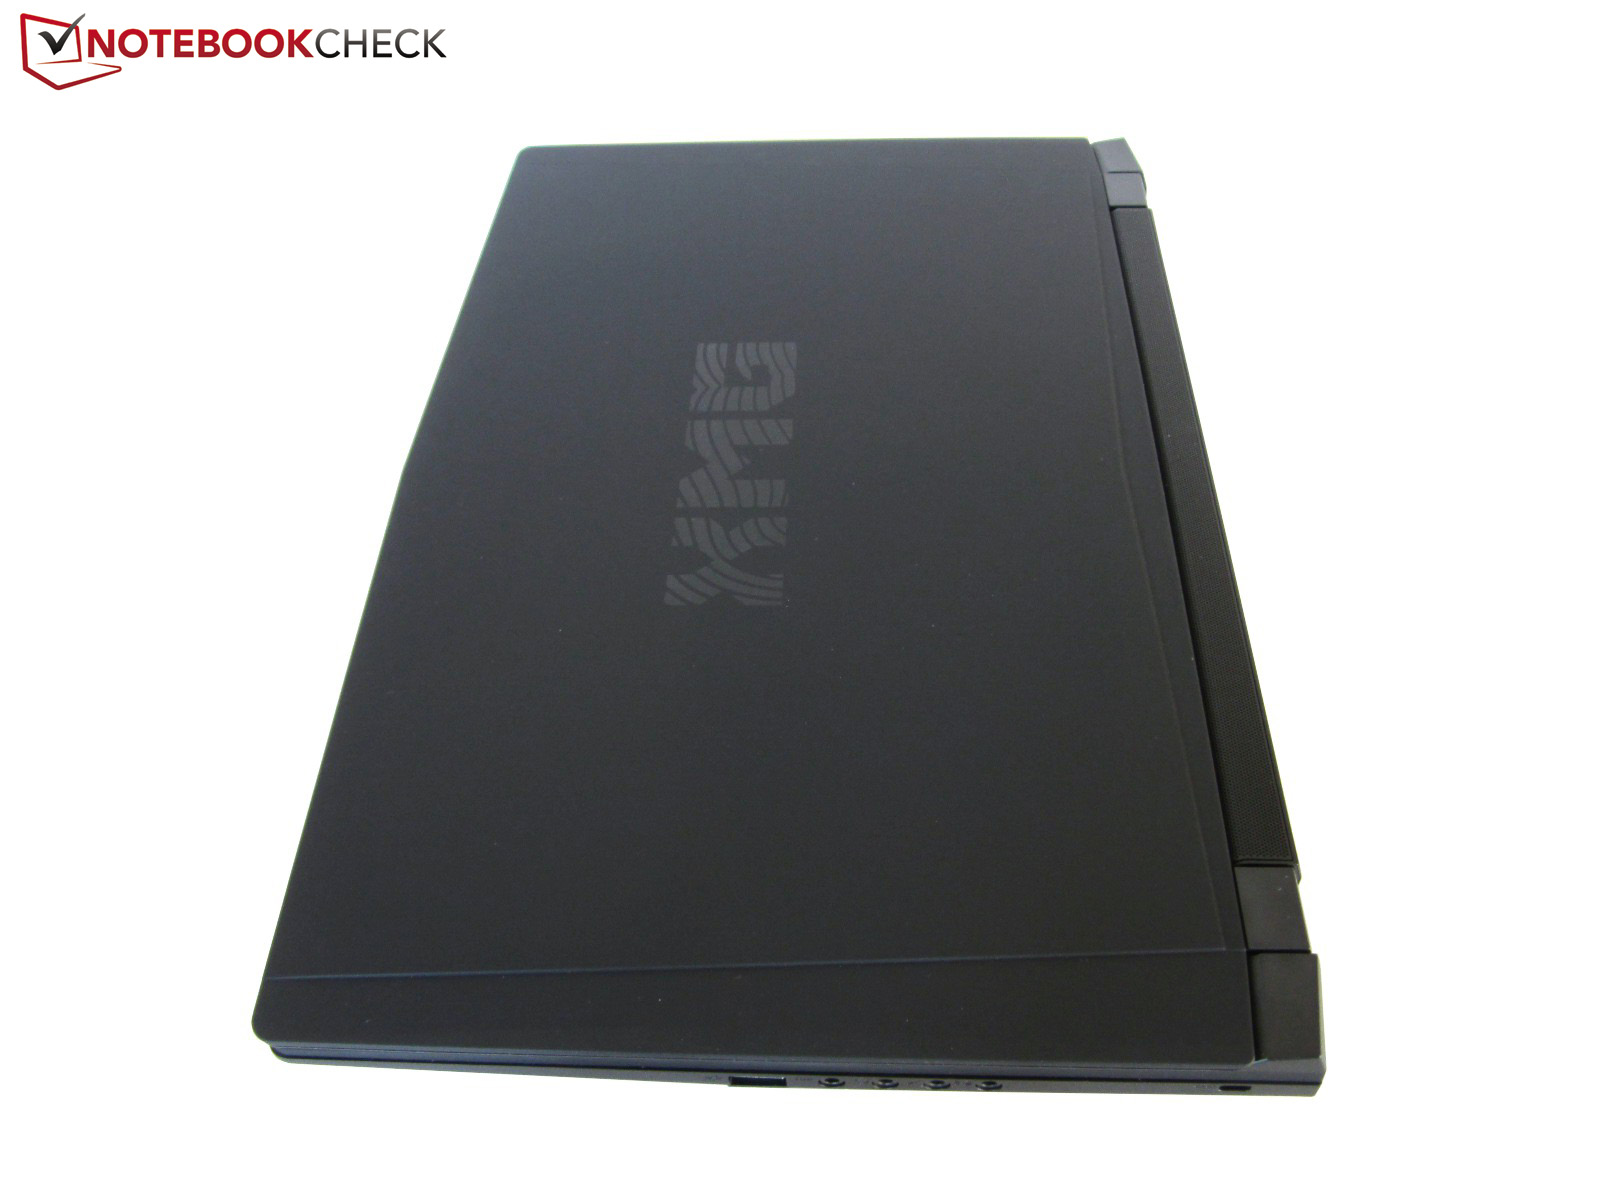
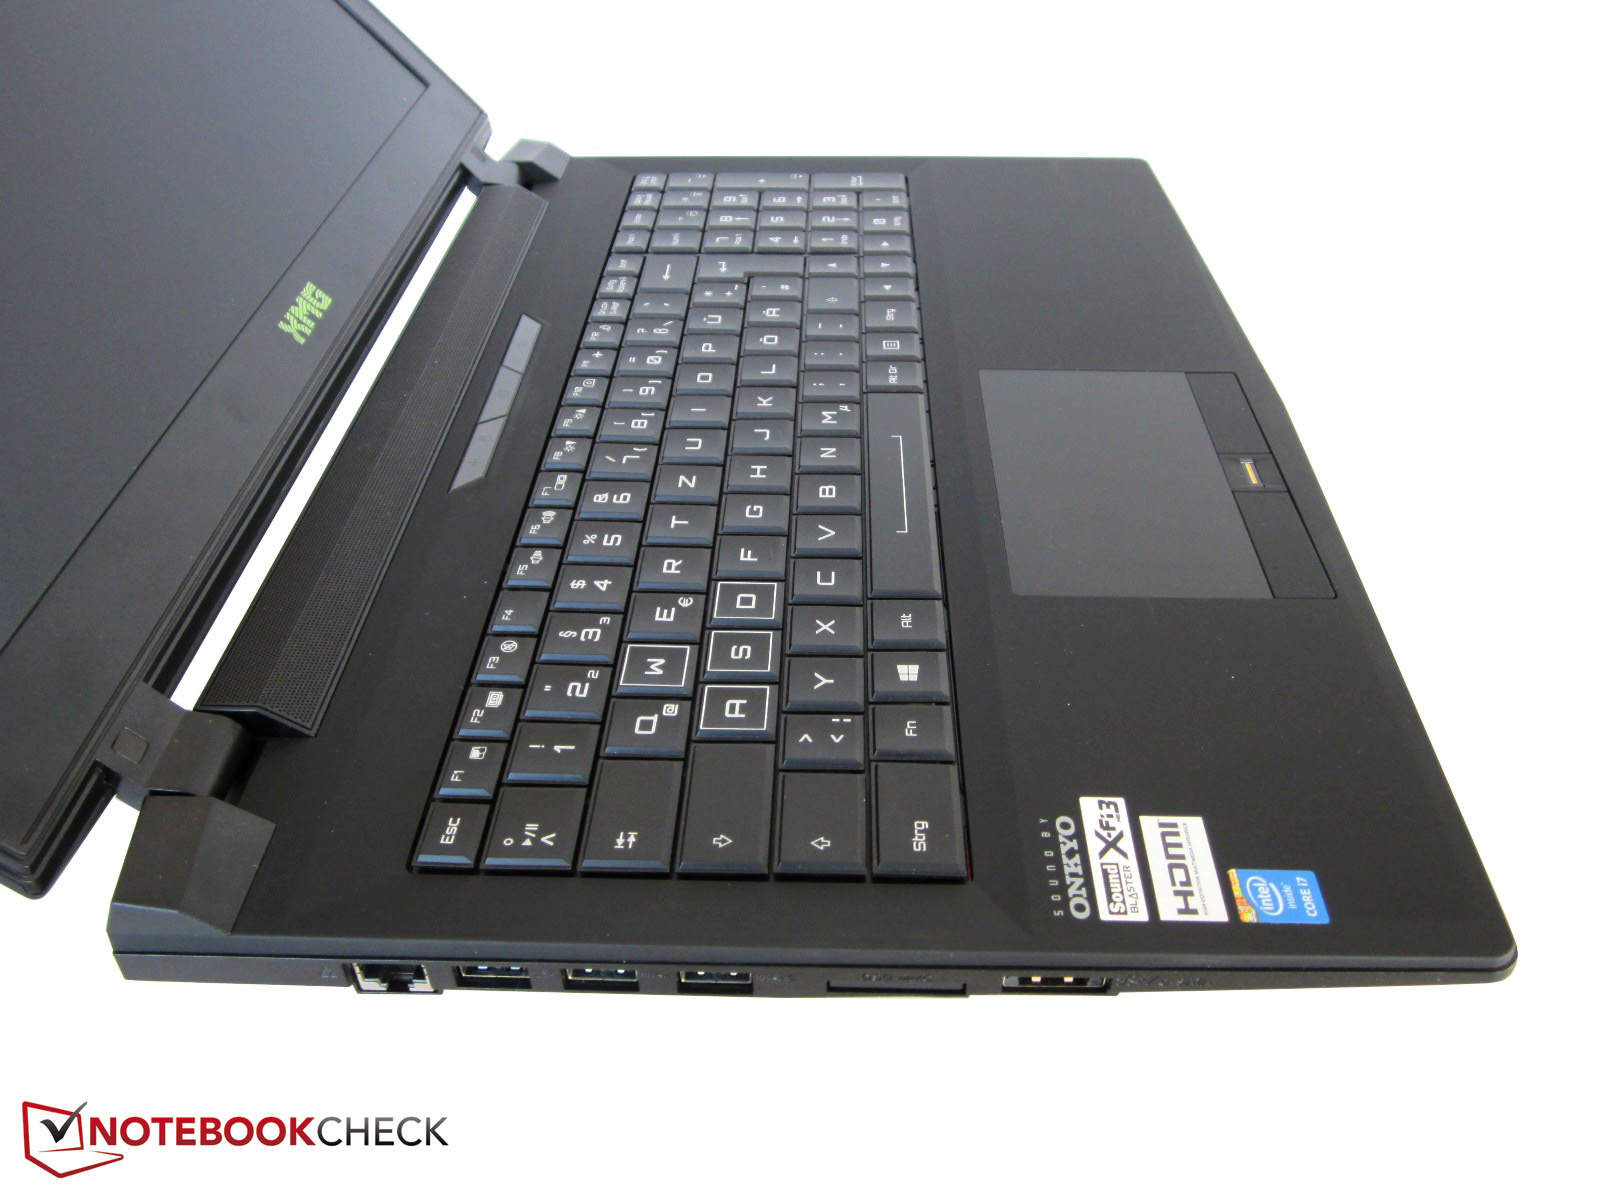
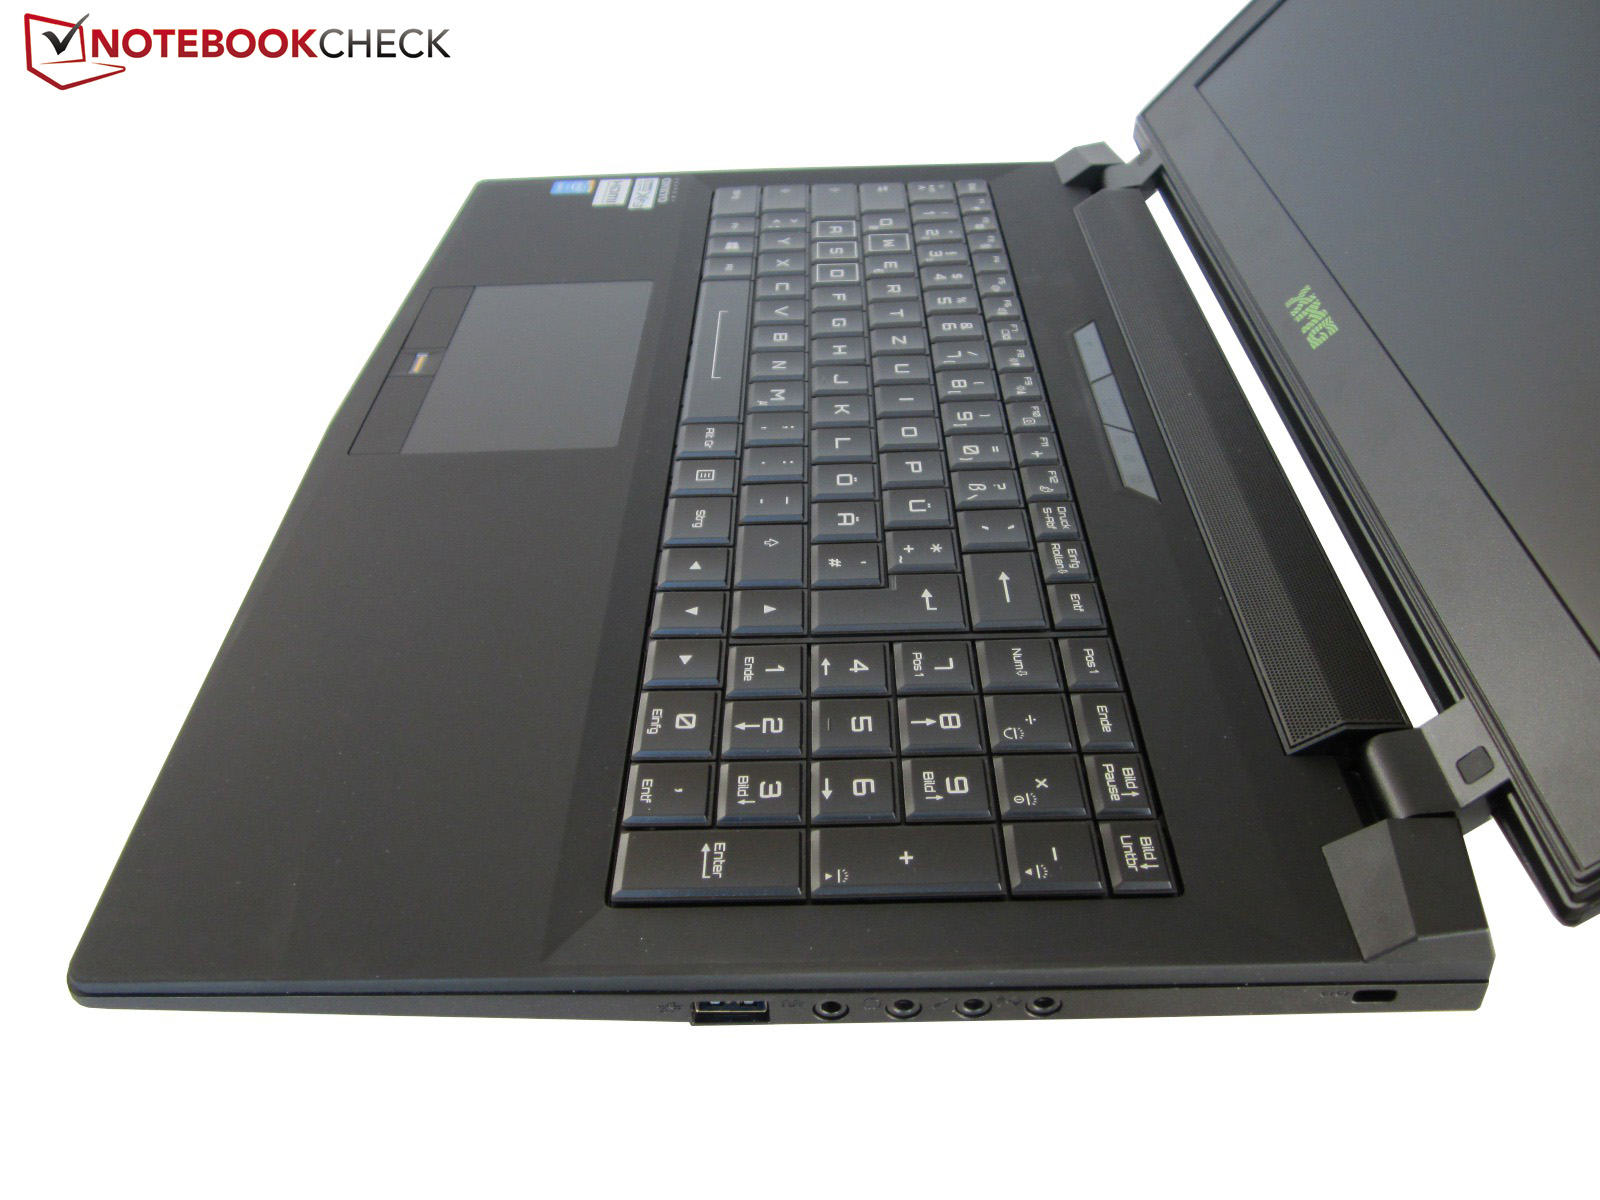
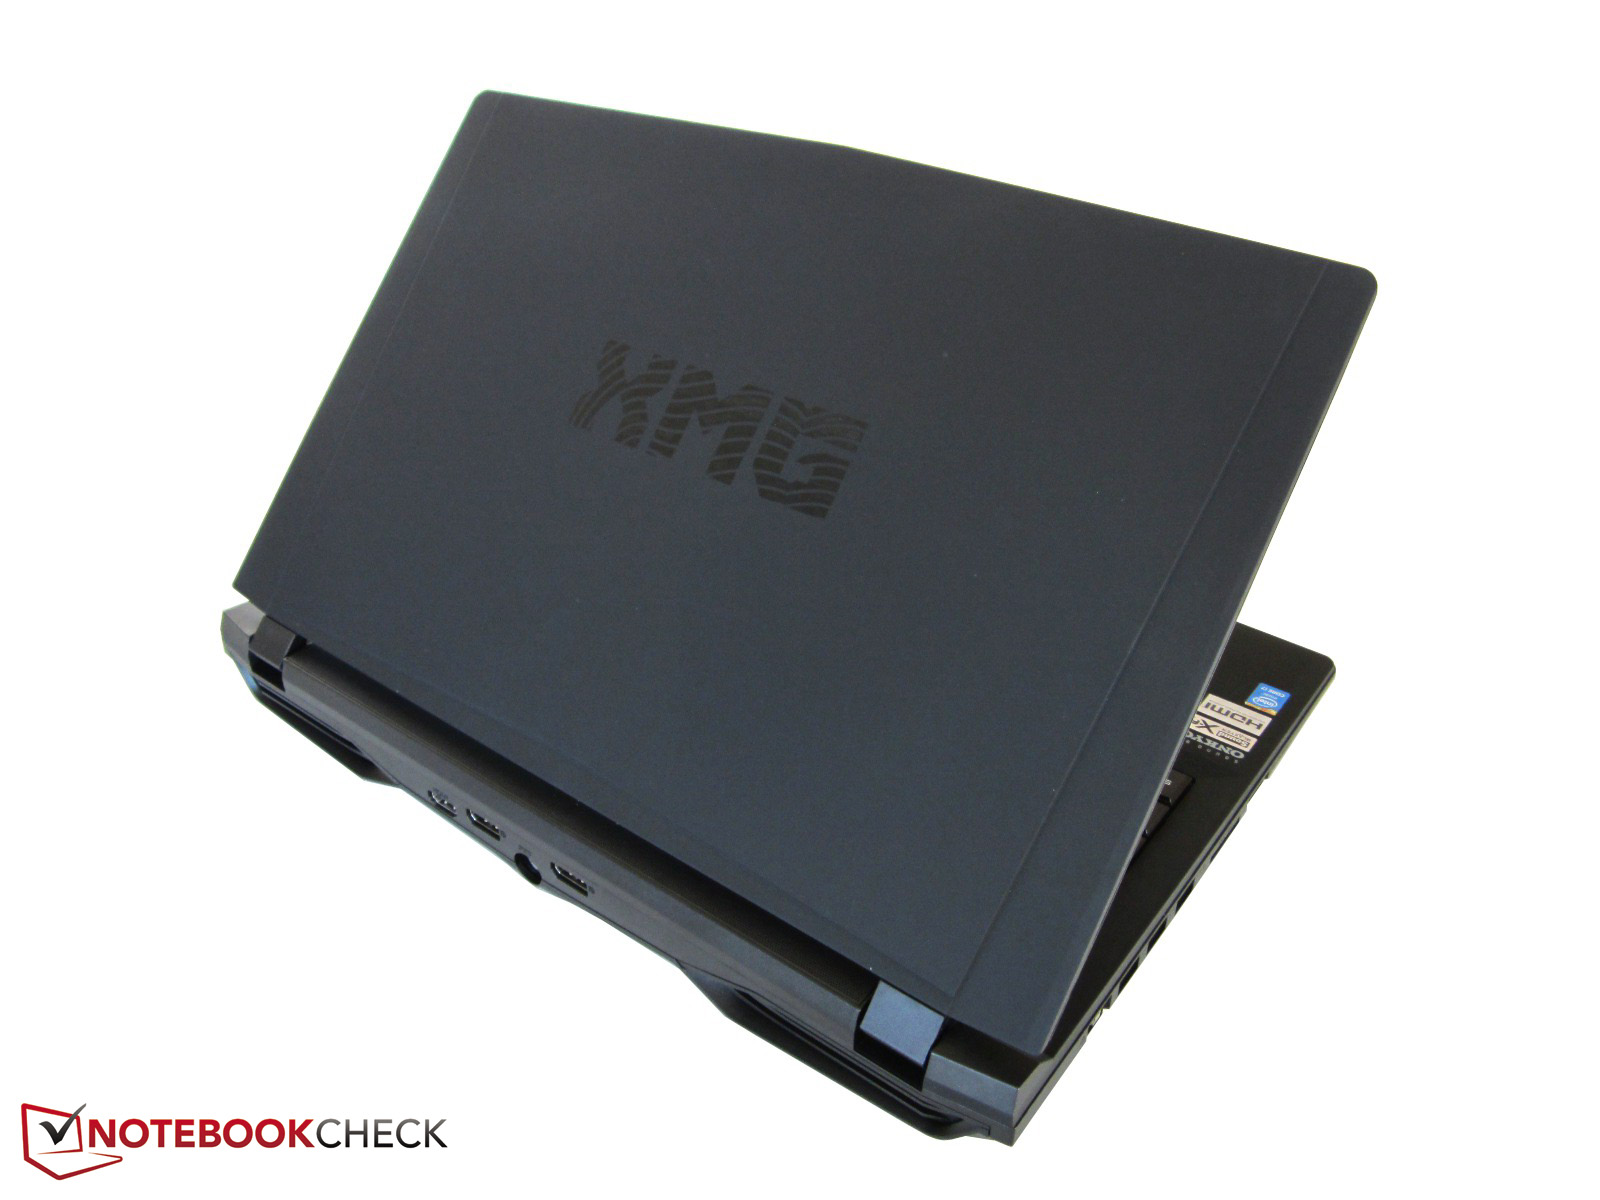
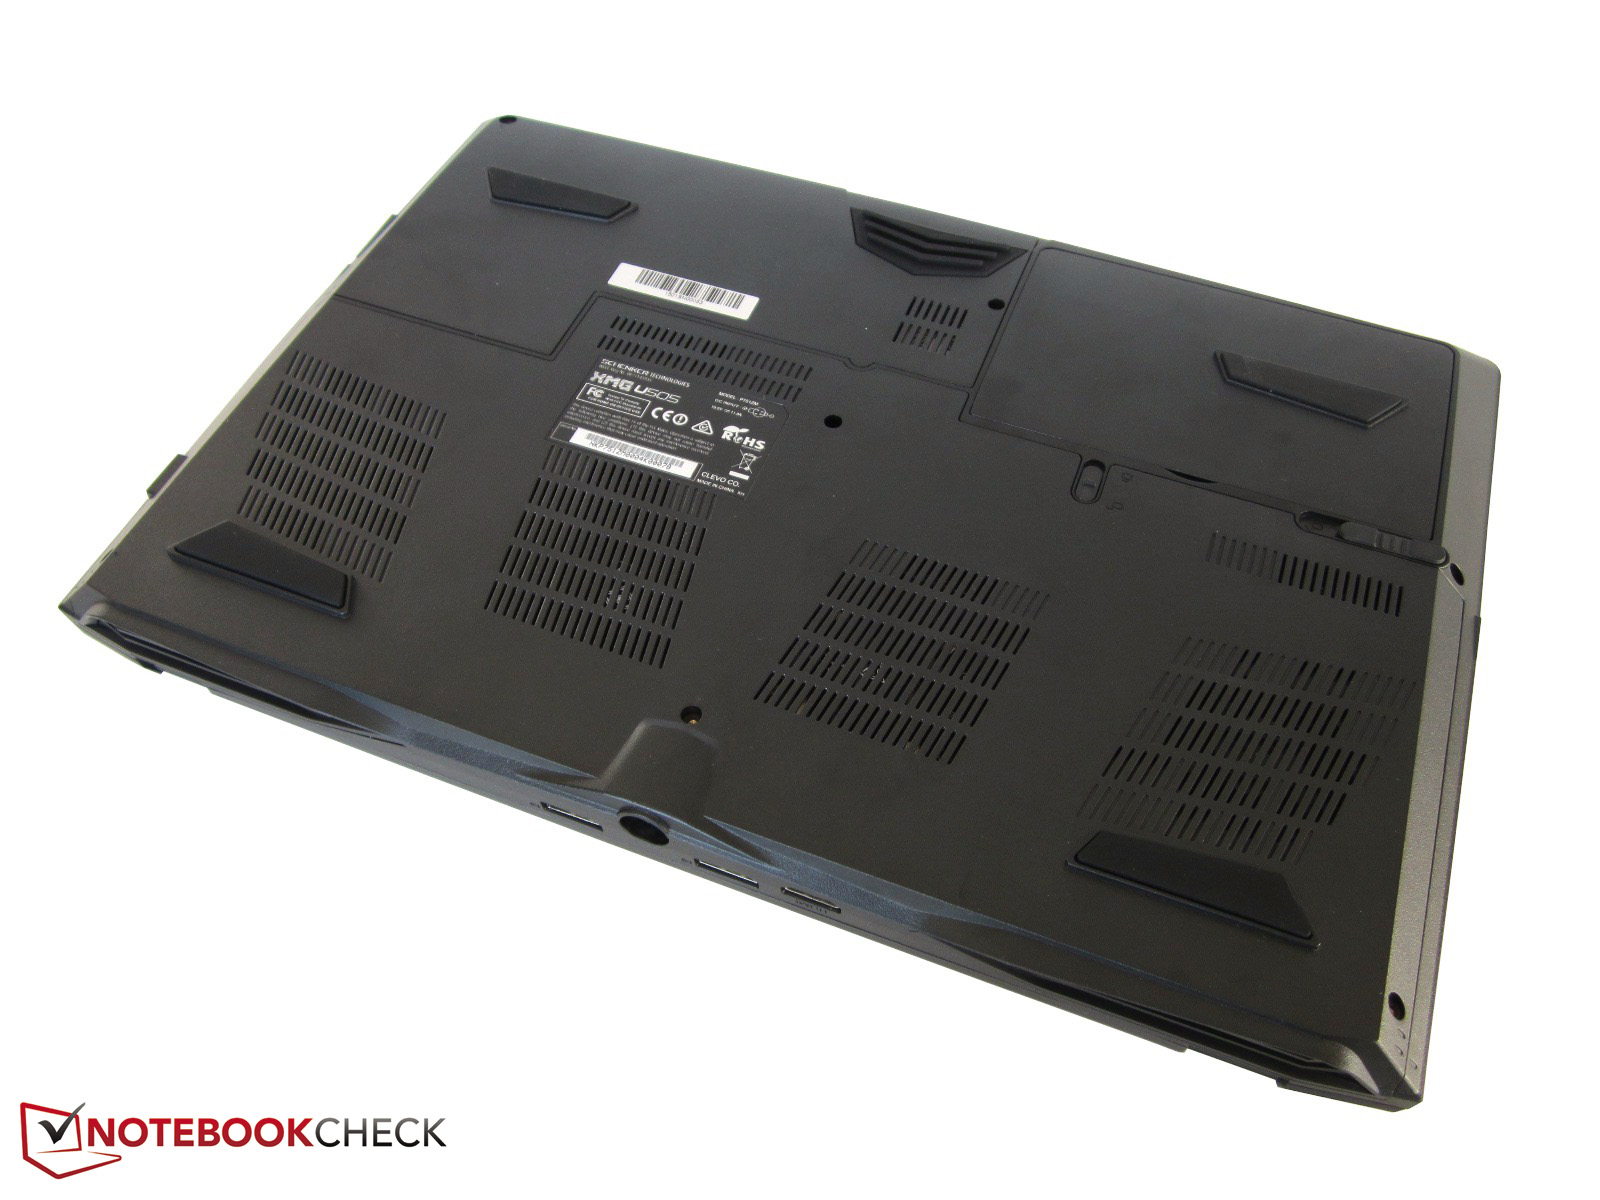
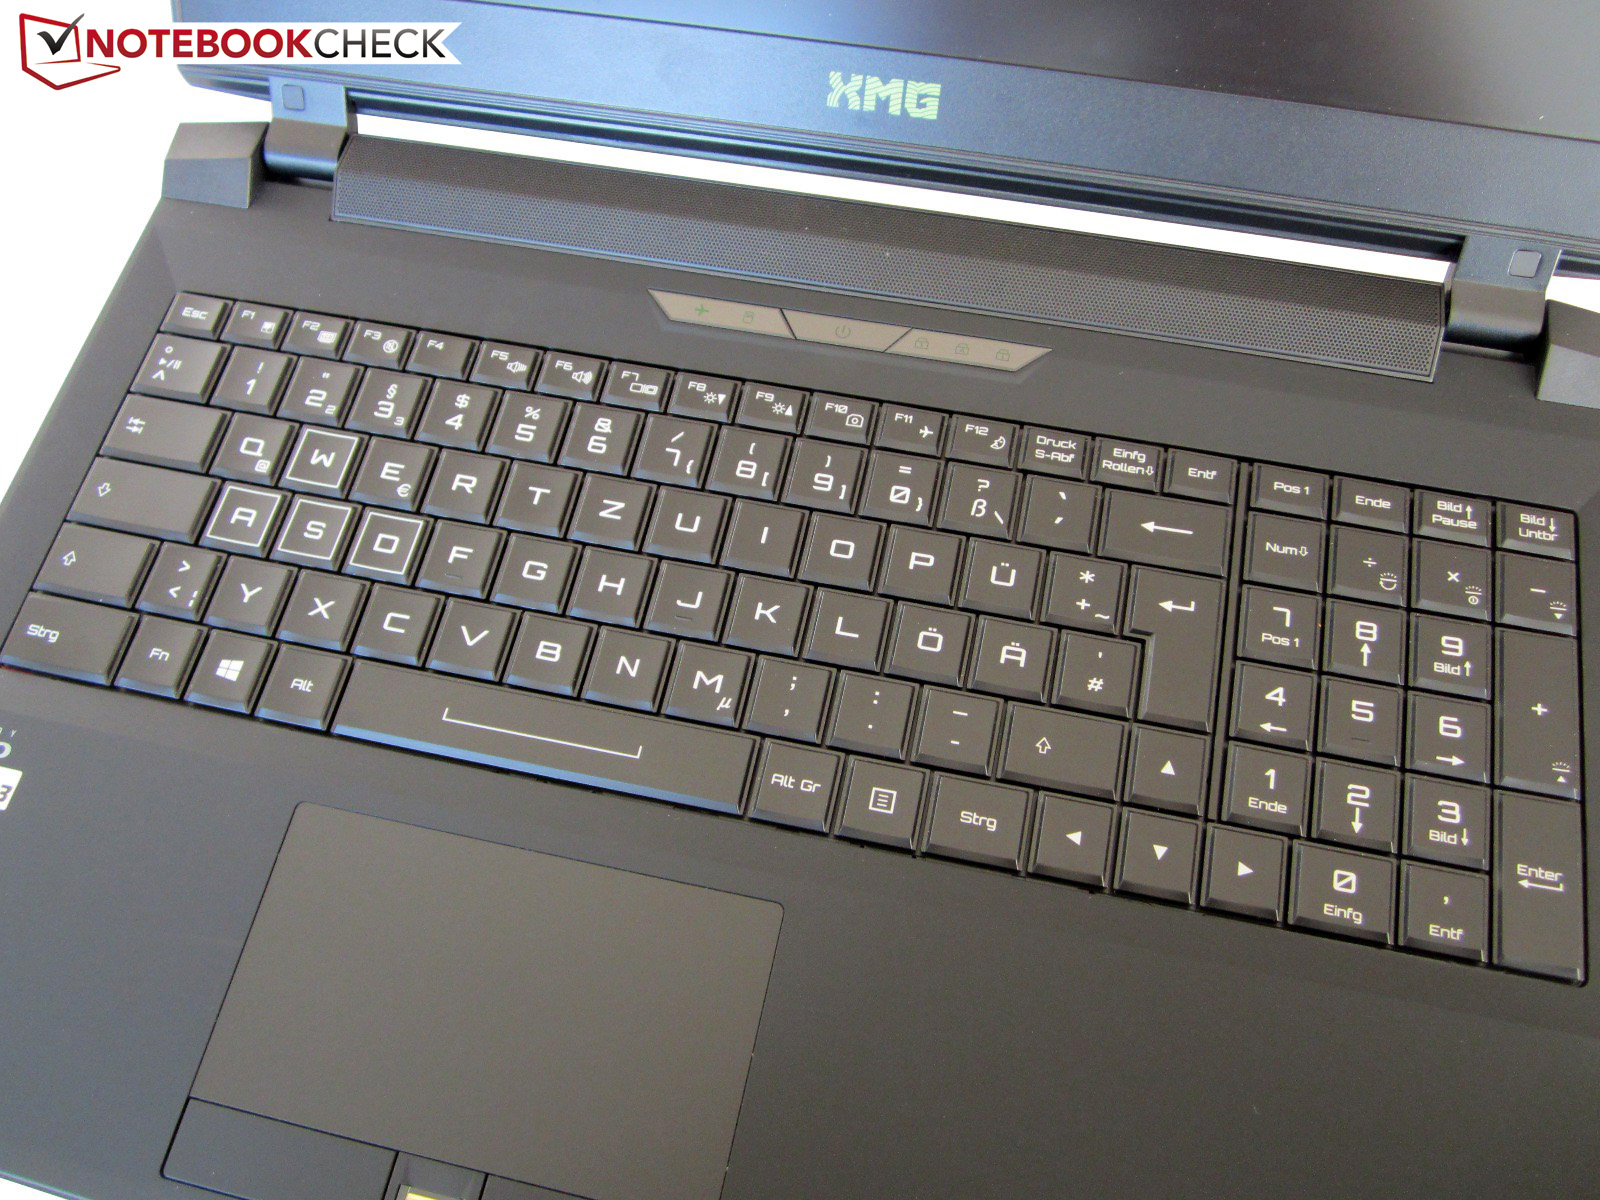
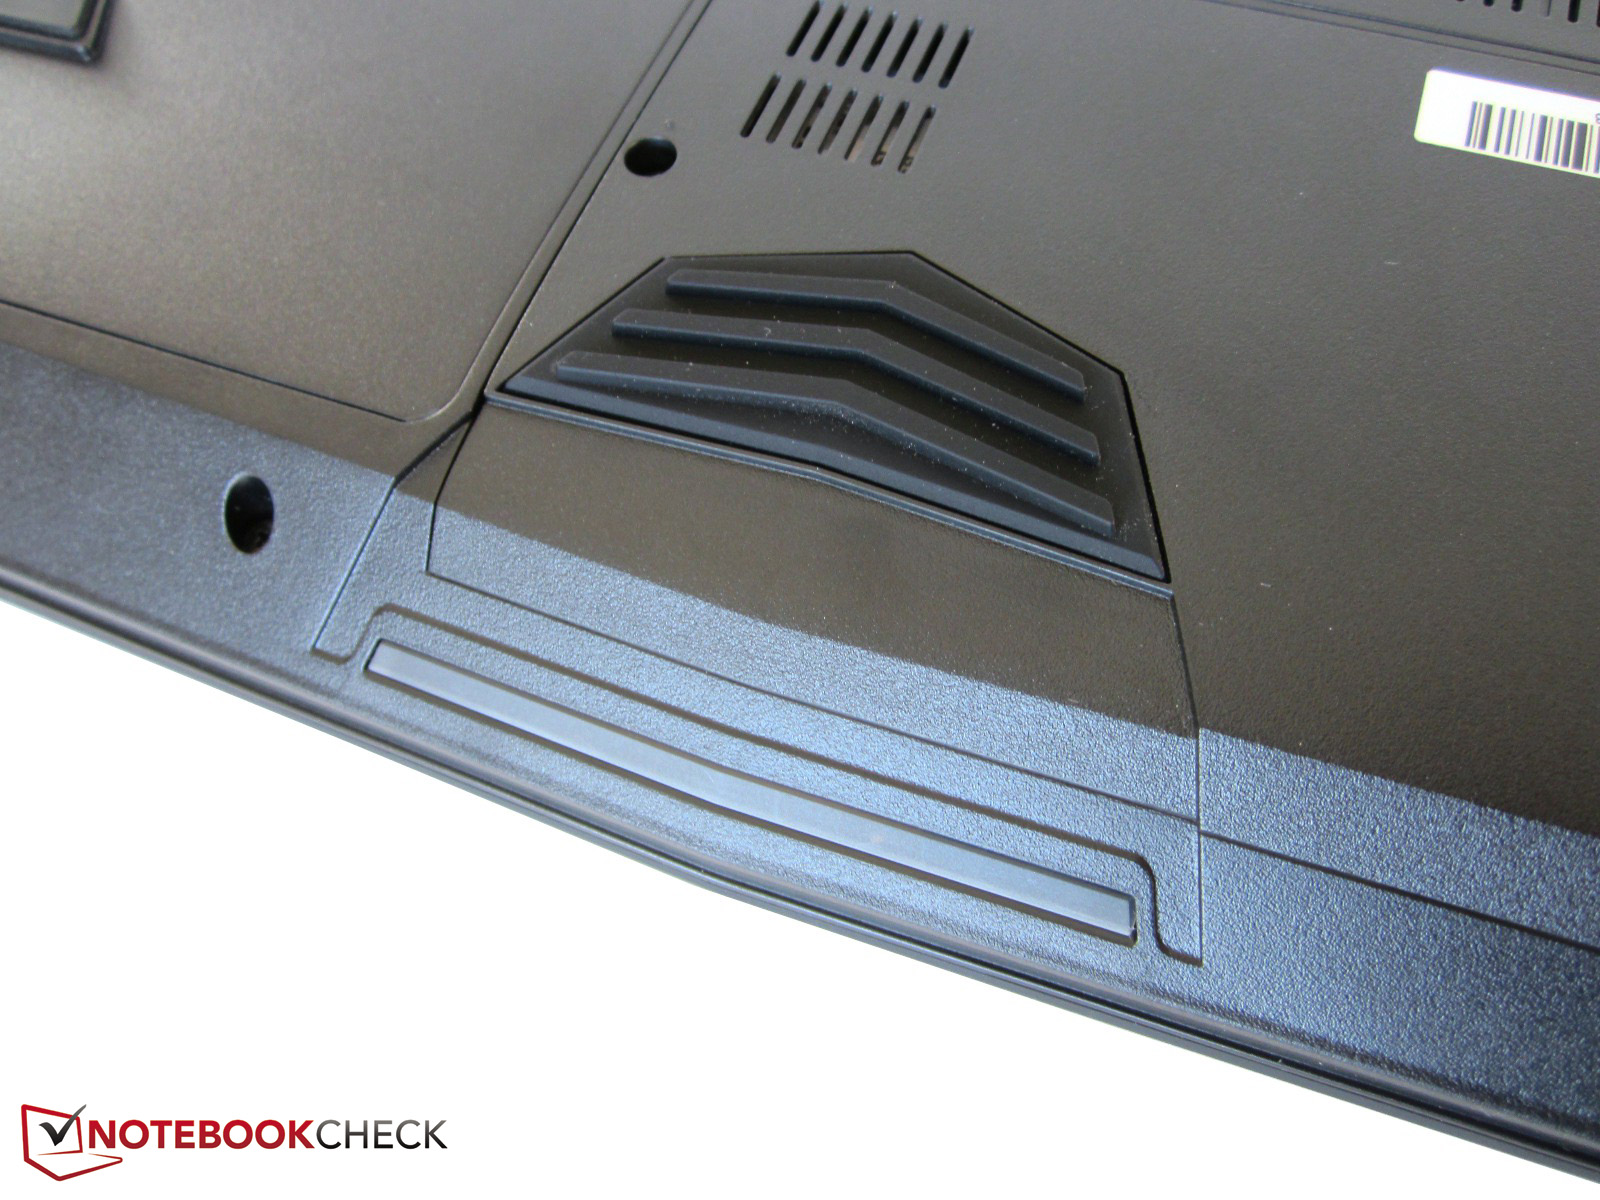
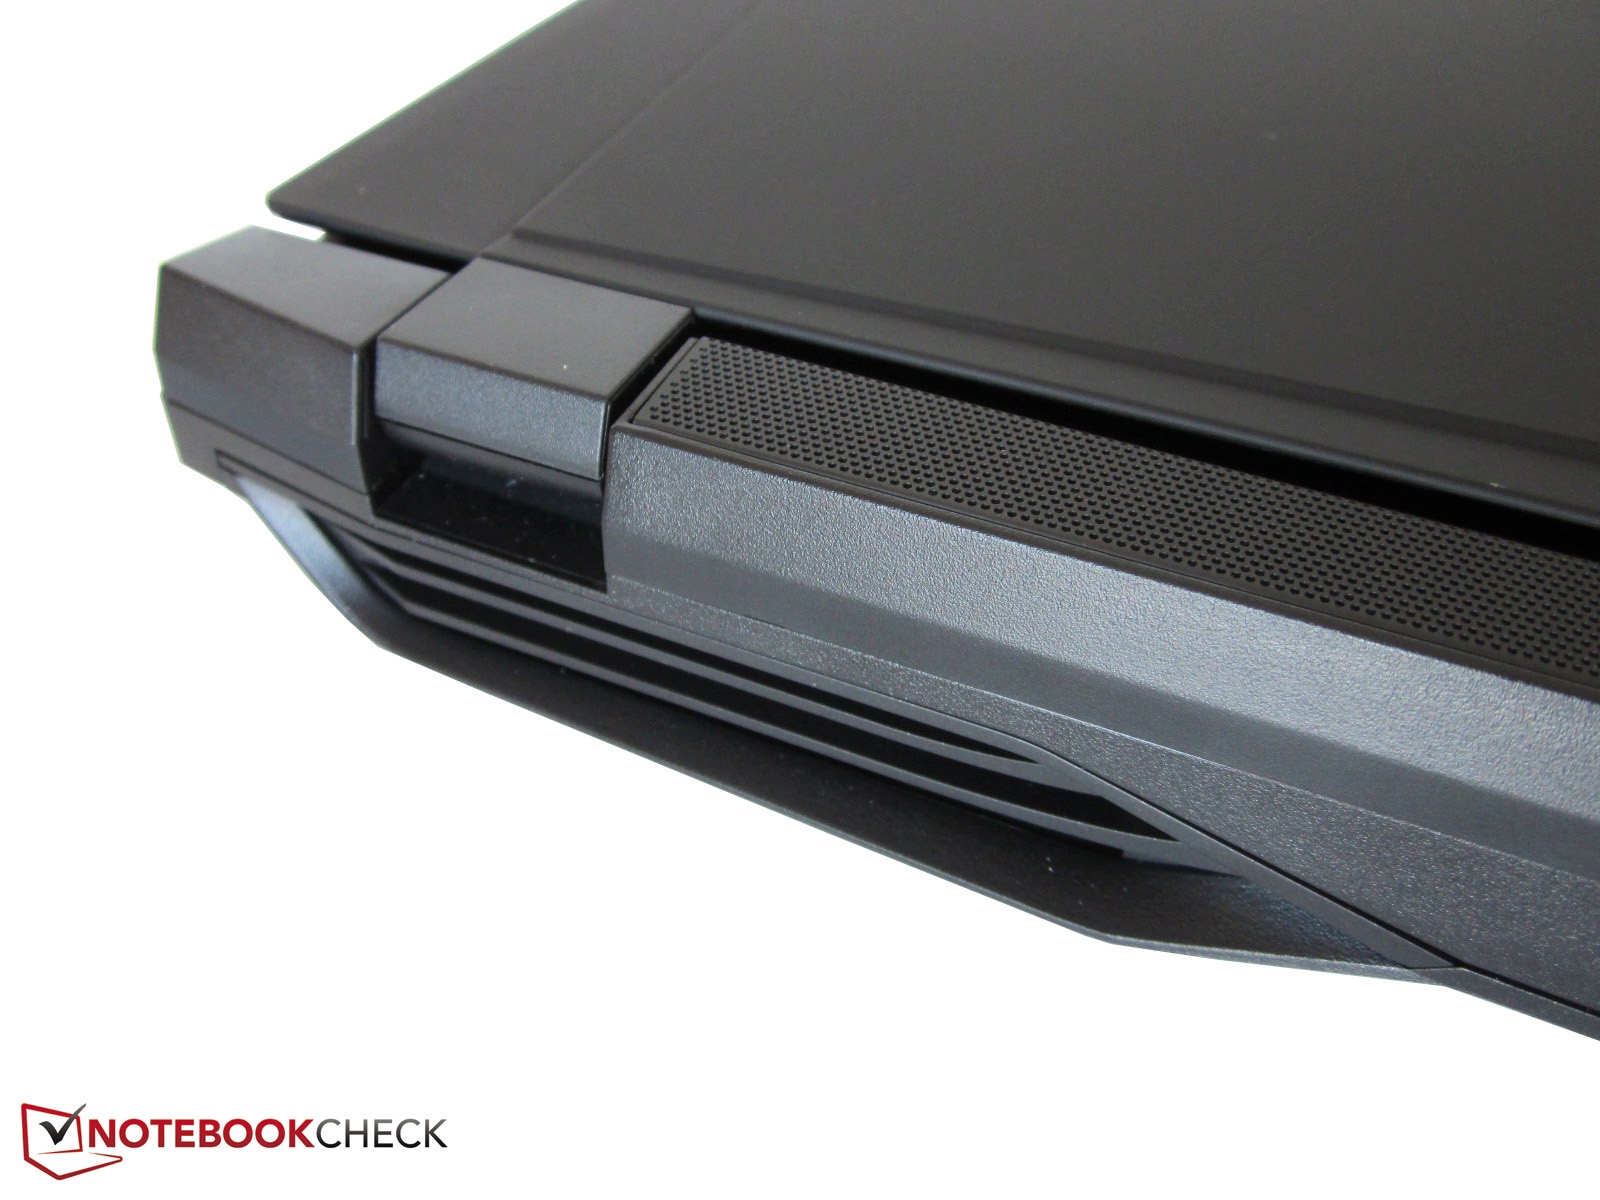
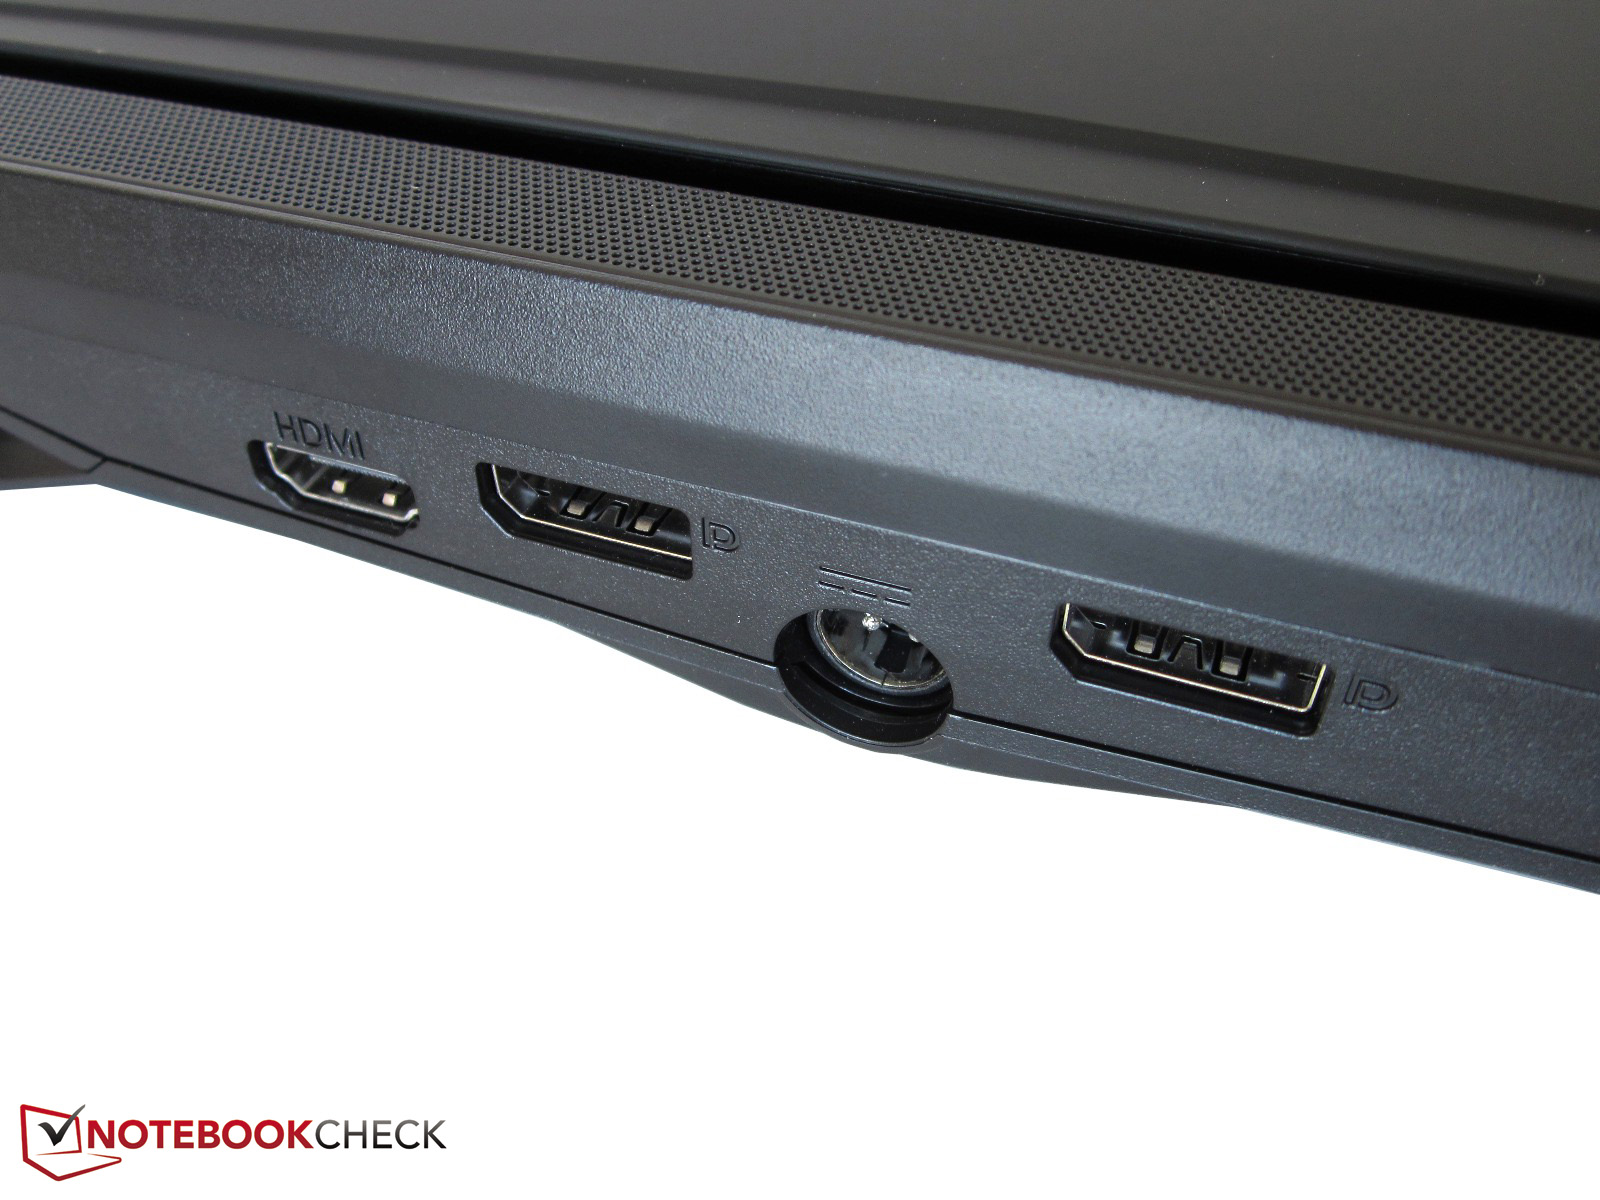
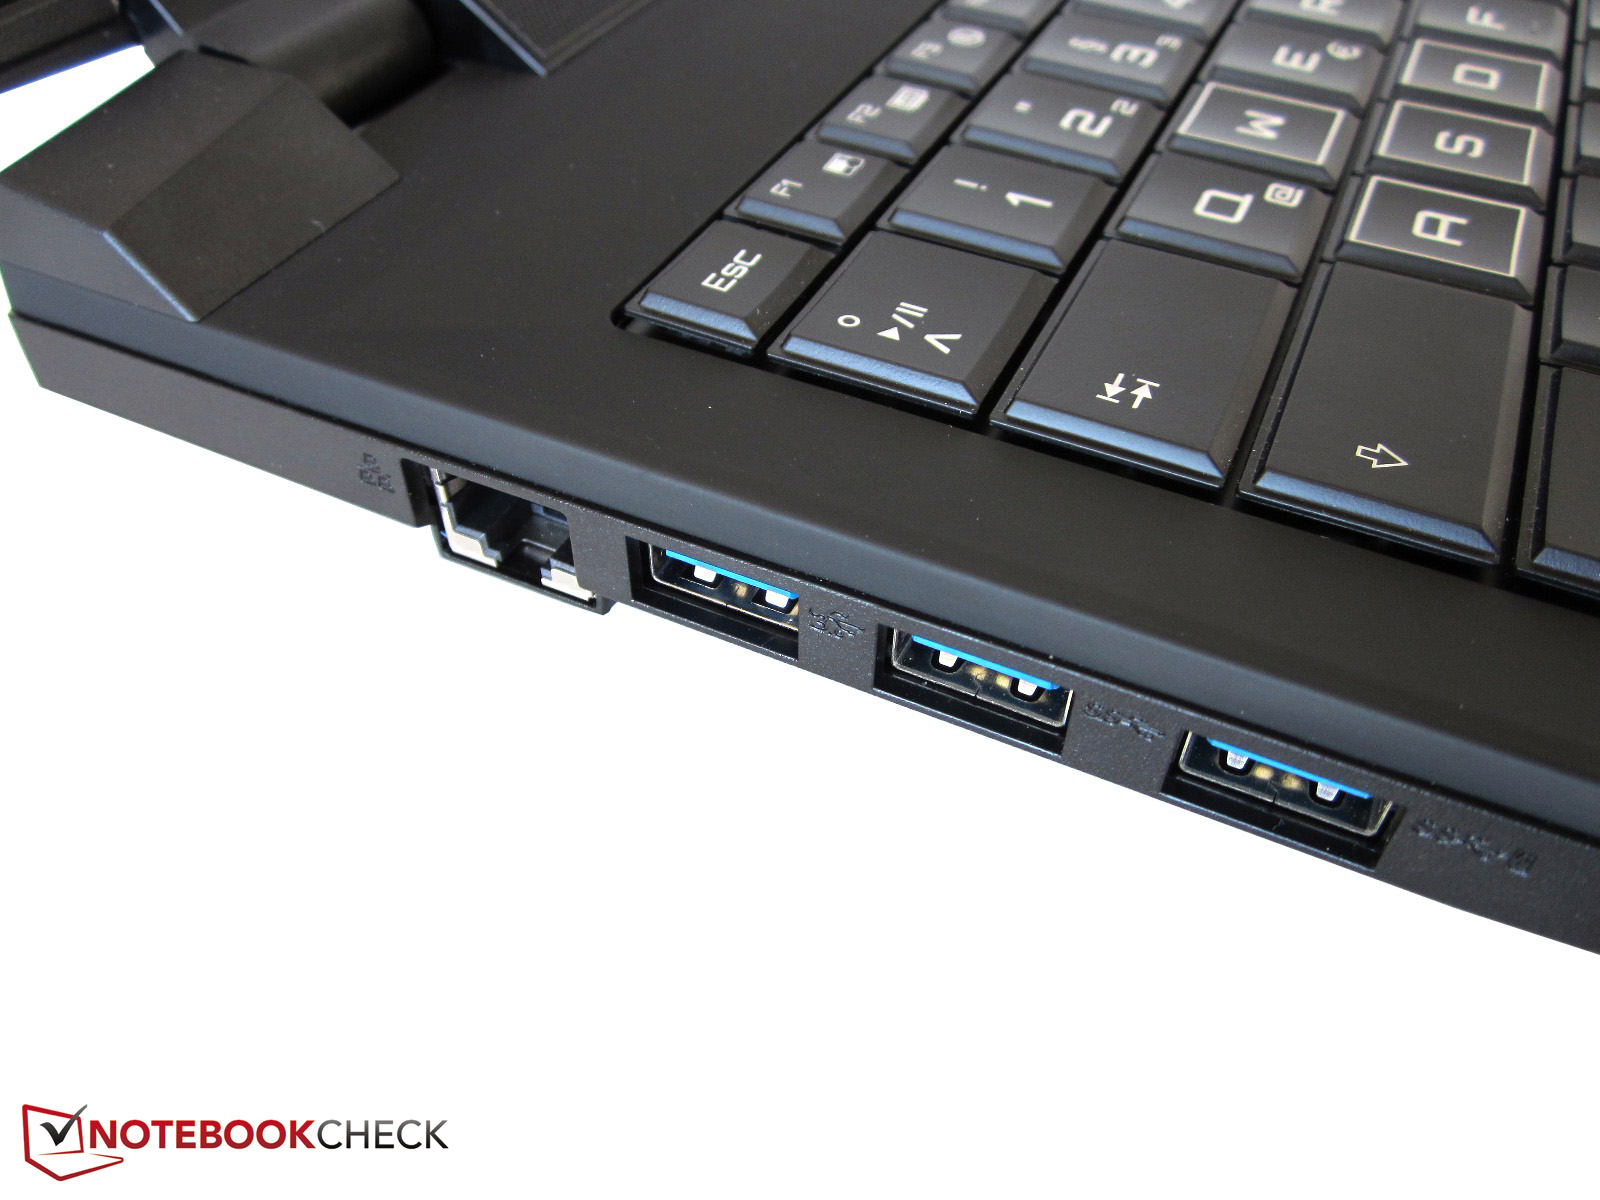
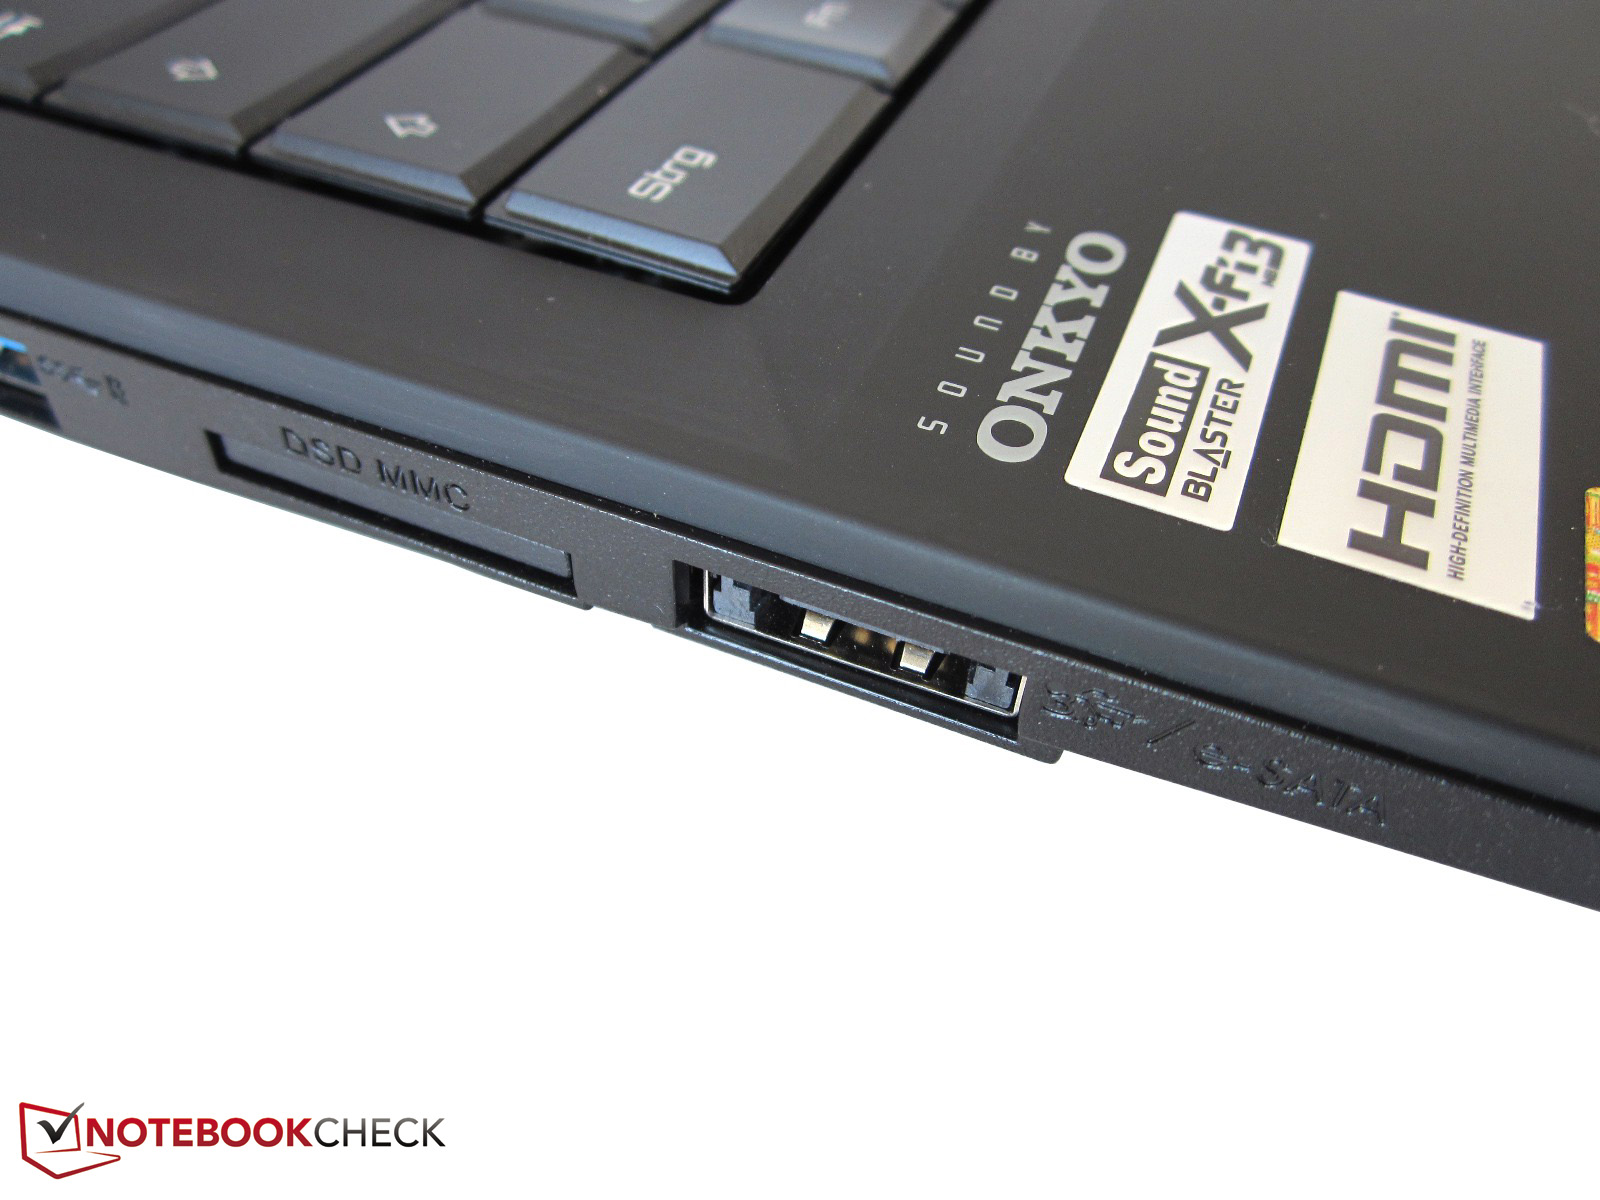
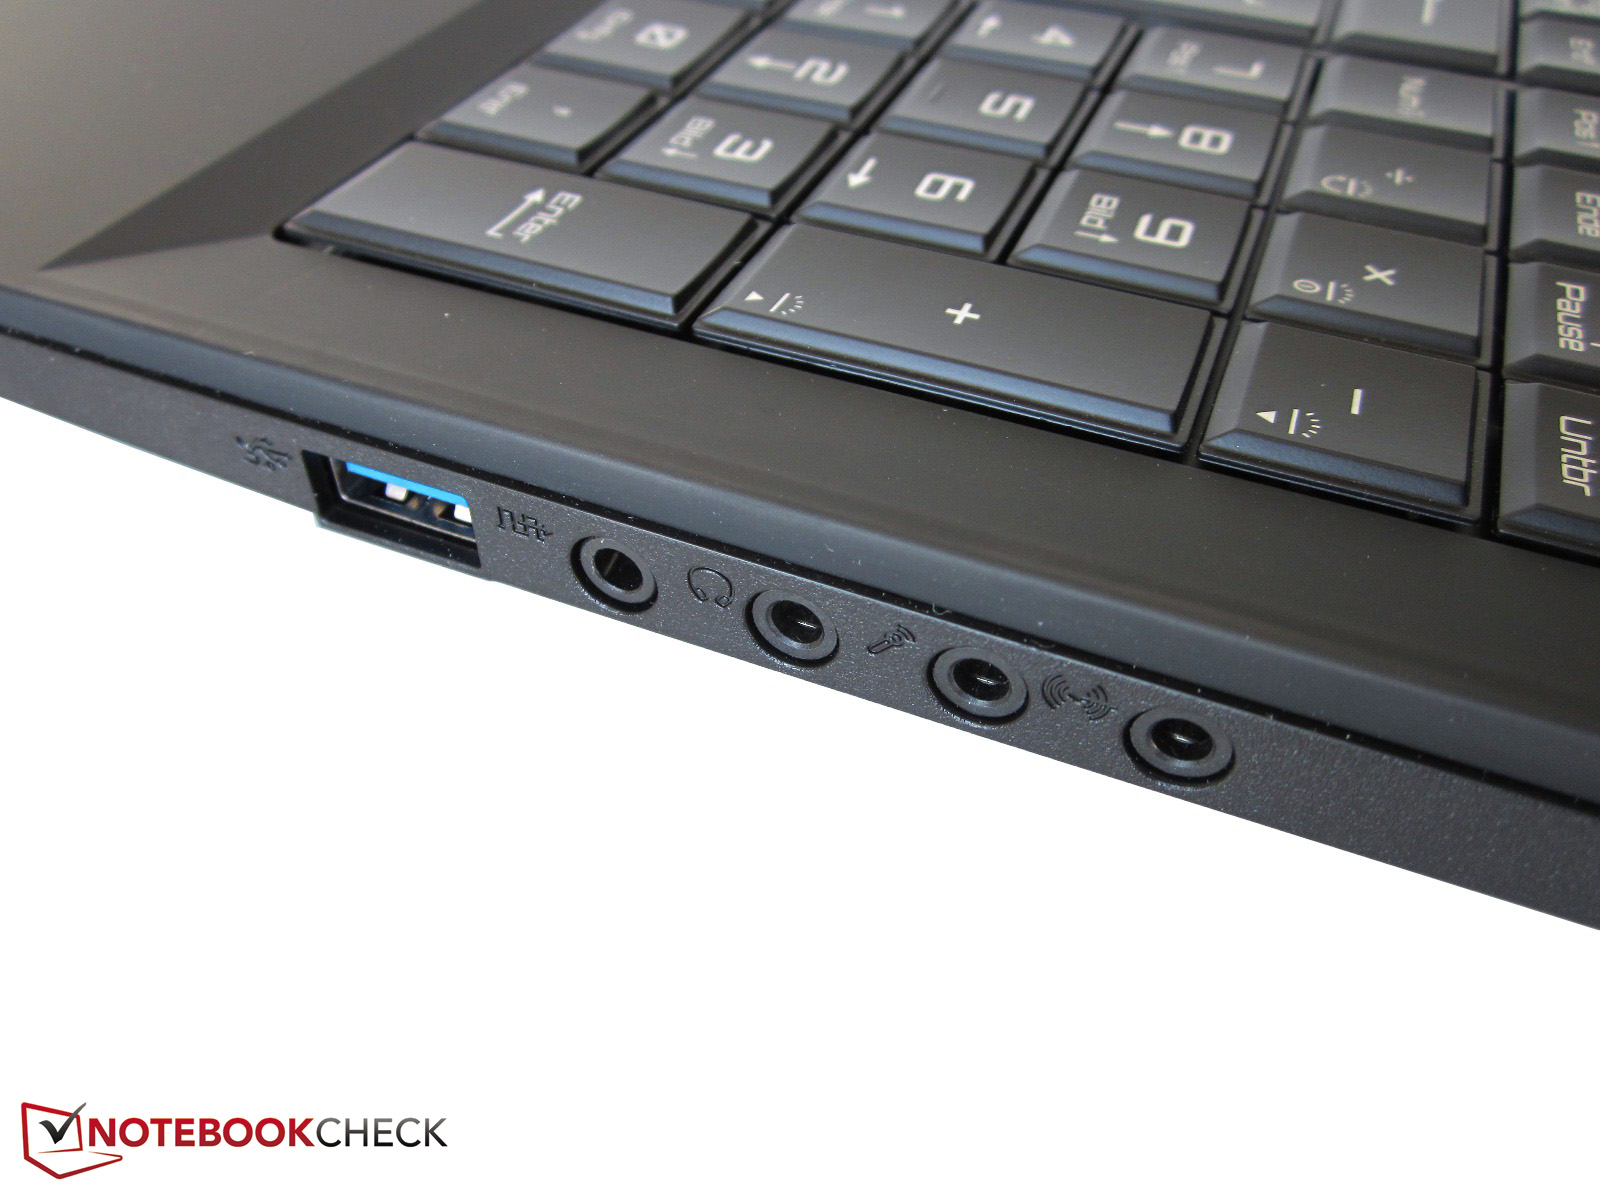
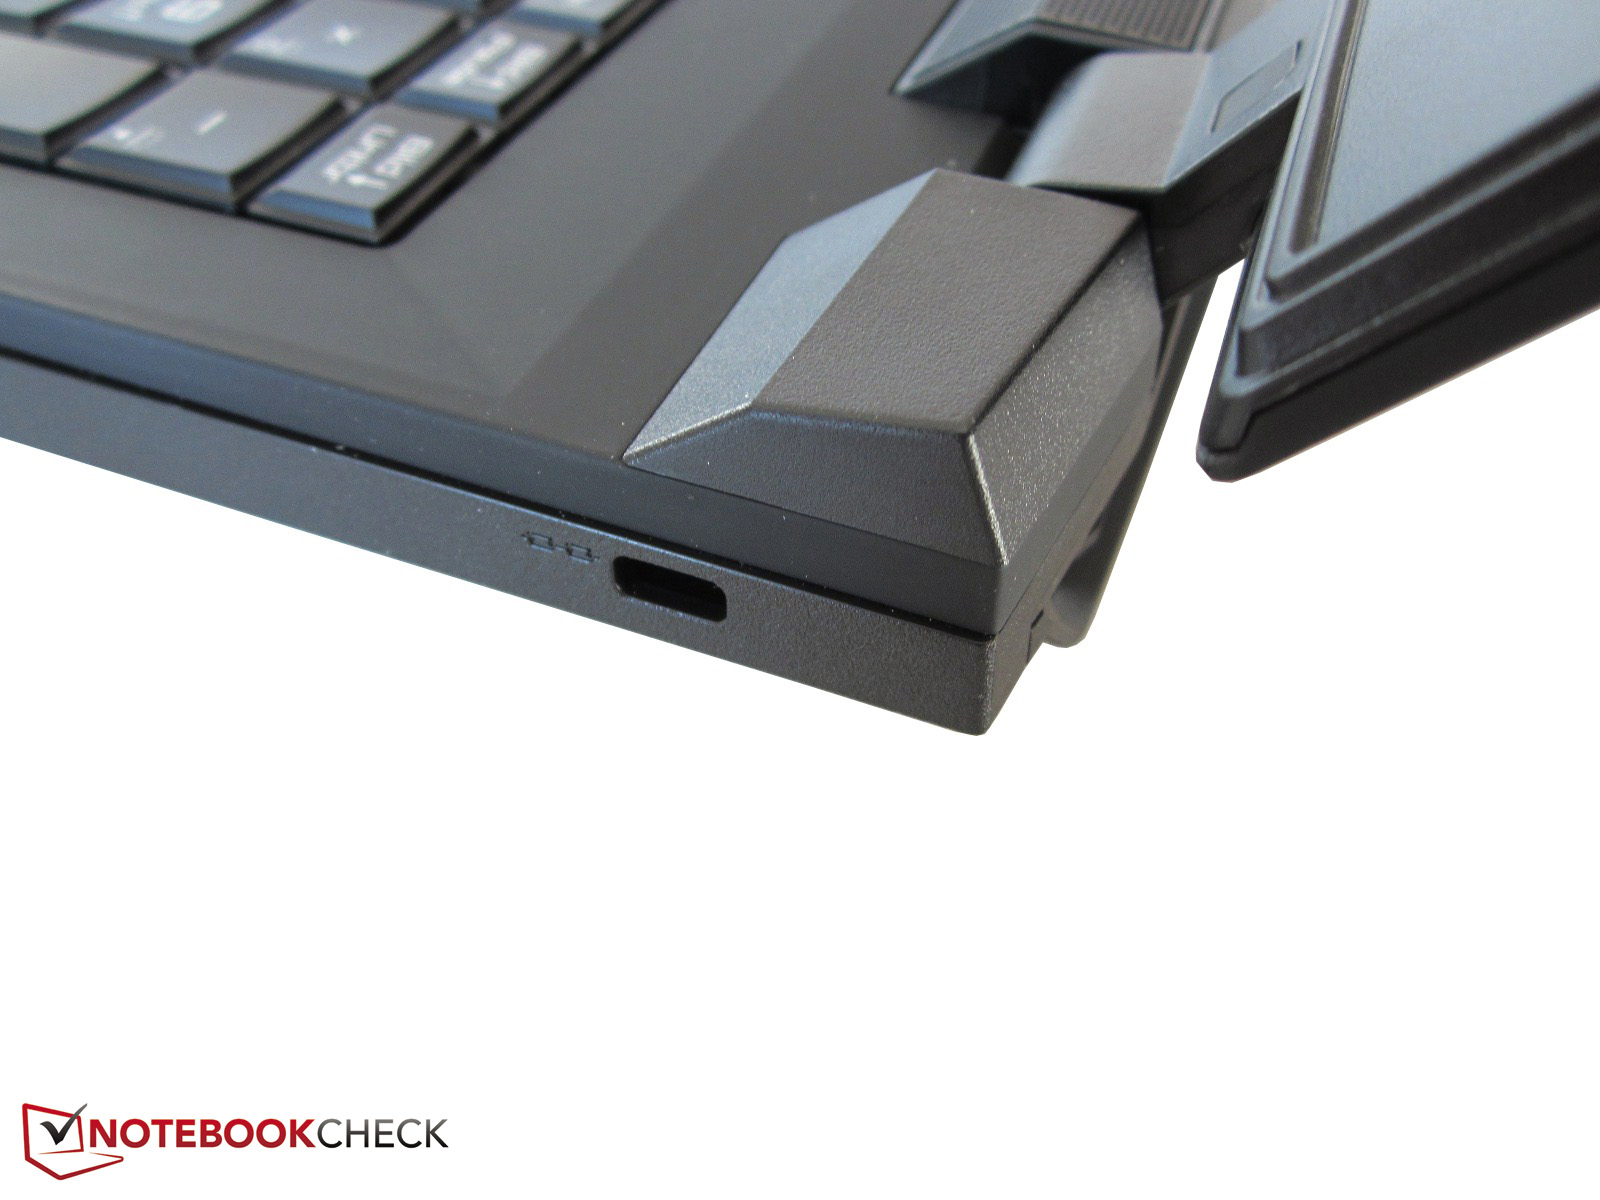
The chassis and the construction of the Schenker W505 are similar to the XMG U505 (Clevo P751ZM barebone), so we won’t cover the sections Case, Connectivity and Input Devices. All the information is available here. Except for the display pictures, all the pictures are from the gaming sibling.


Display
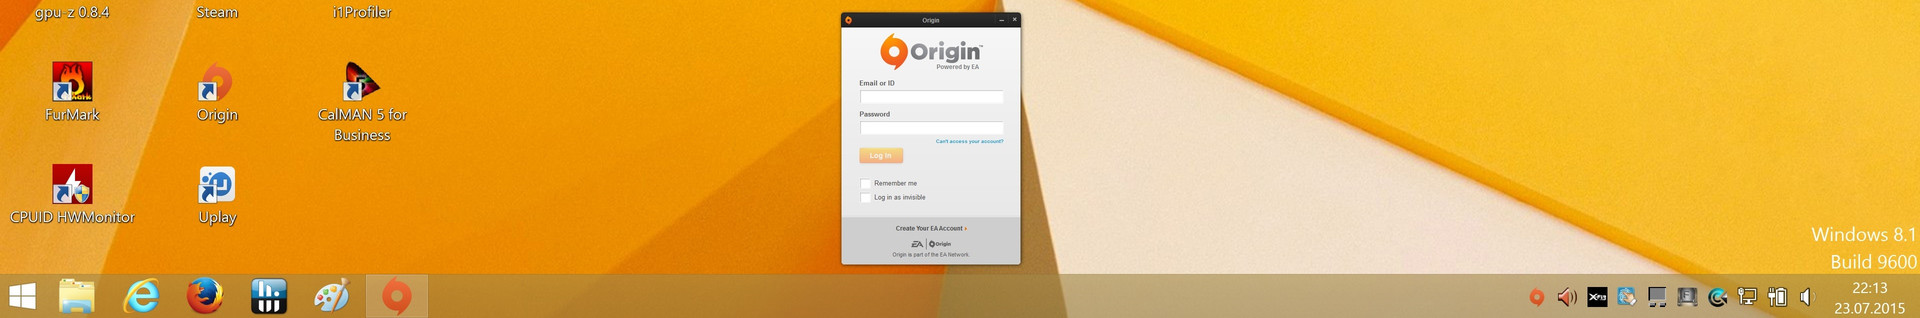
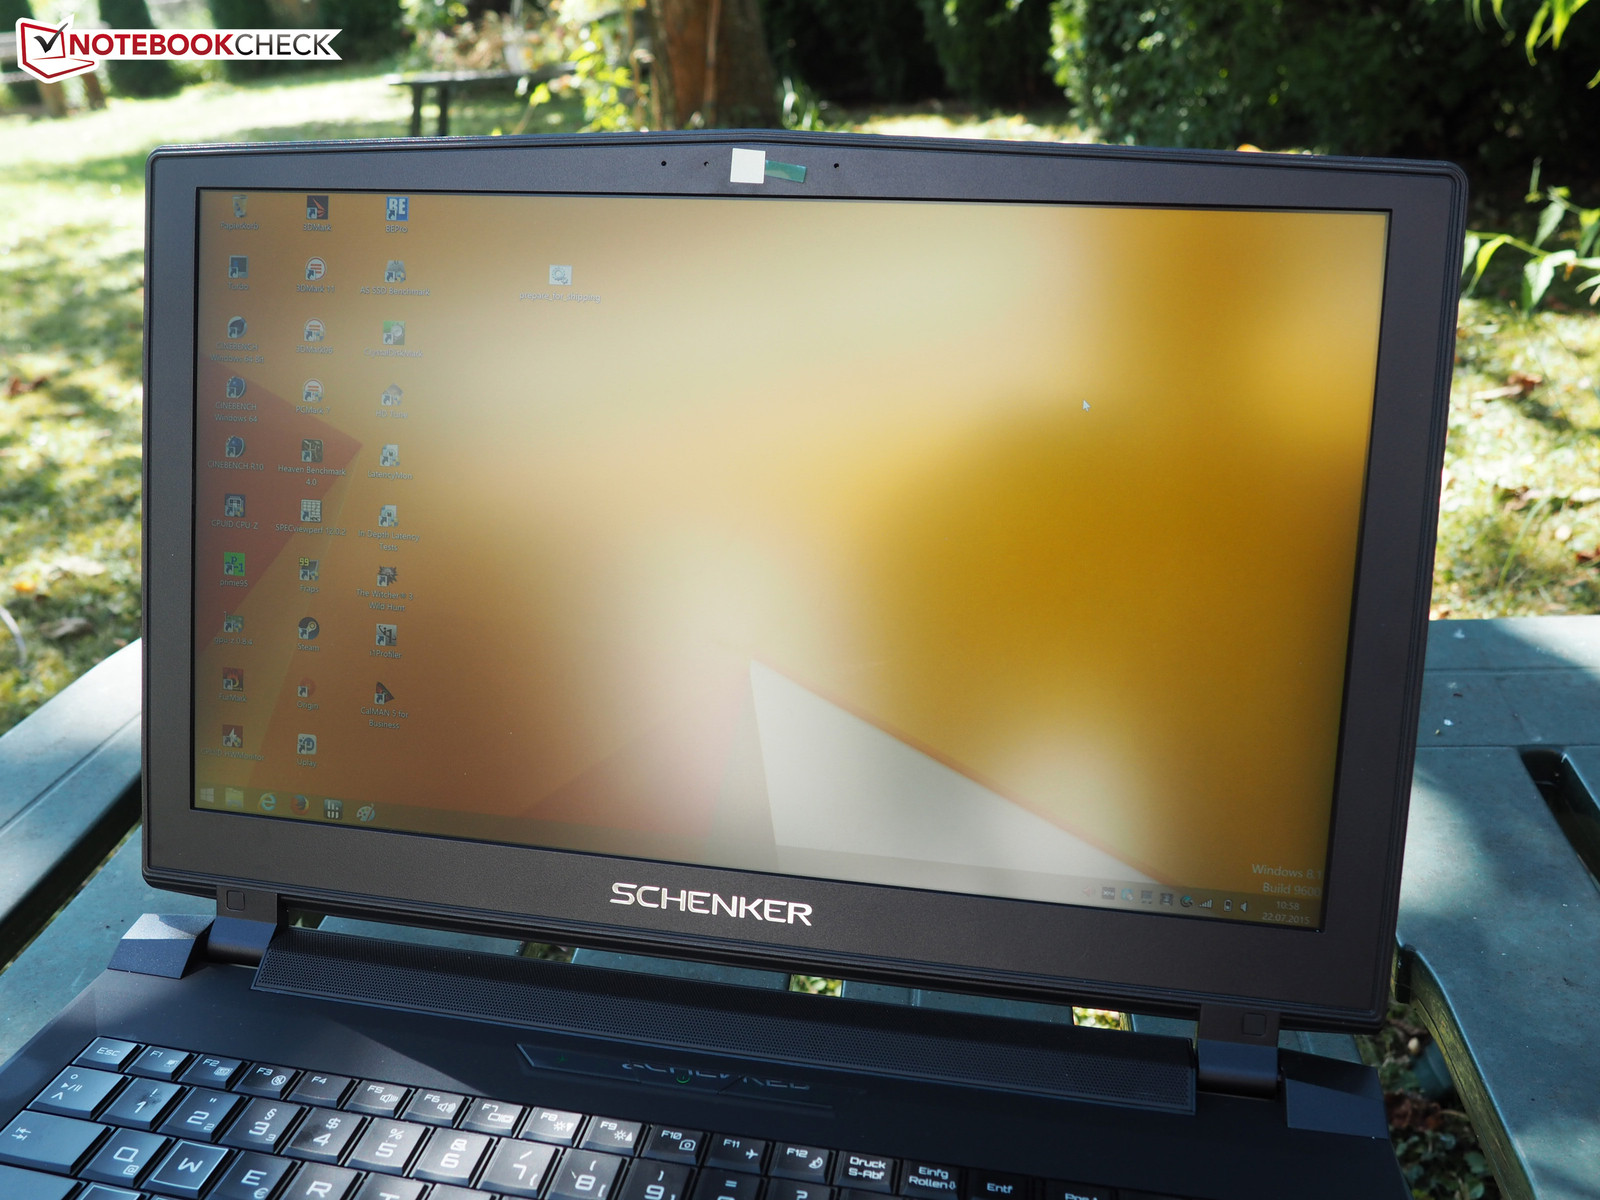
Whether you can work with a 4K panel depends on your individual impression. 3840x2160 pixels can currently still cause problems, because even Windows 8.1 does not work perfectly with such high resolutions. While the mouse cursor is often too big in games, fonts and windows are sometimes too small to read, but it also depends on the application. The best example is EA’s gaming platform Origin, which screams for a magnifier in 4K (see screenshot). It also requires a lot of performance and can easily bring high-end GPUs to their limits.
| |||||||||||||||||||||||||
Brightness Distribution: 93 %
Center on Battery: 288 cd/m²
Contrast: 1067:1 (Black: 0.27 cd/m²)
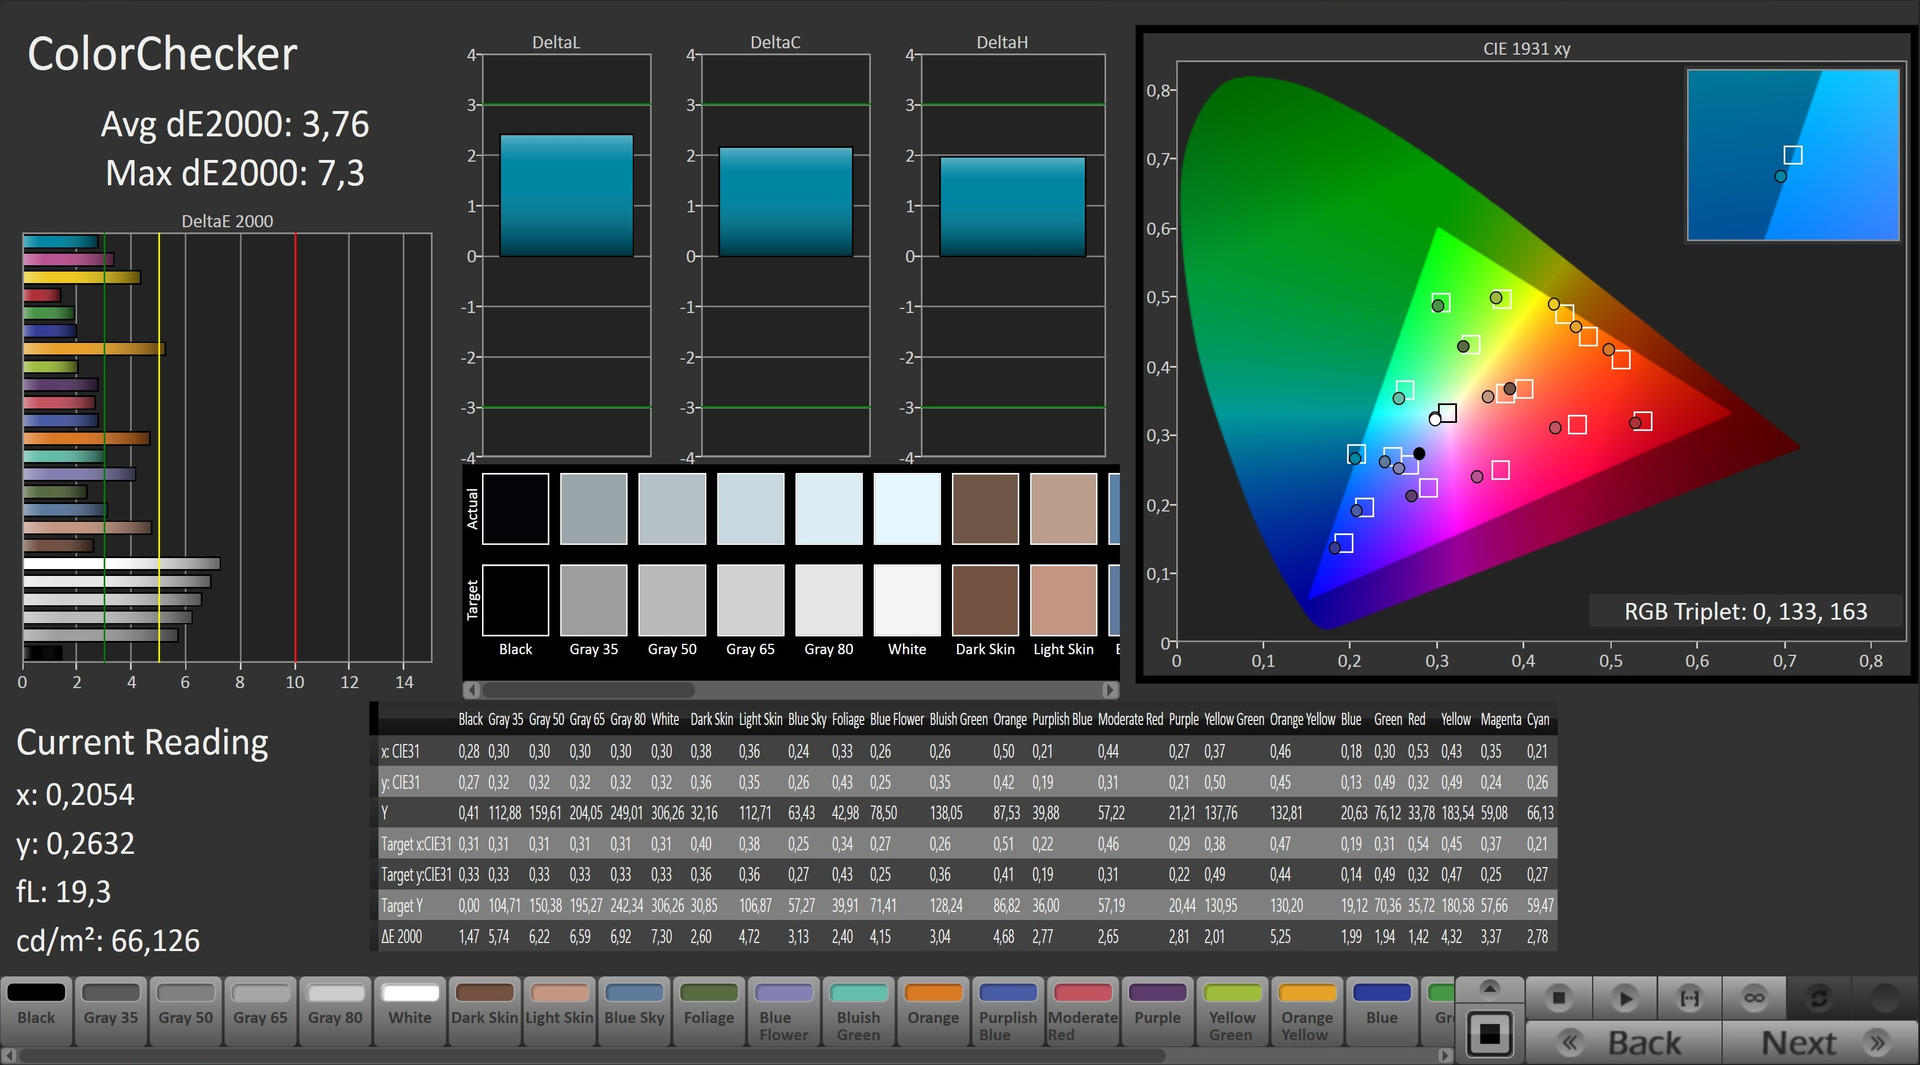
ΔE ColorChecker Calman: 3.76 | ∀{0.5-29.43 Ø4.71}
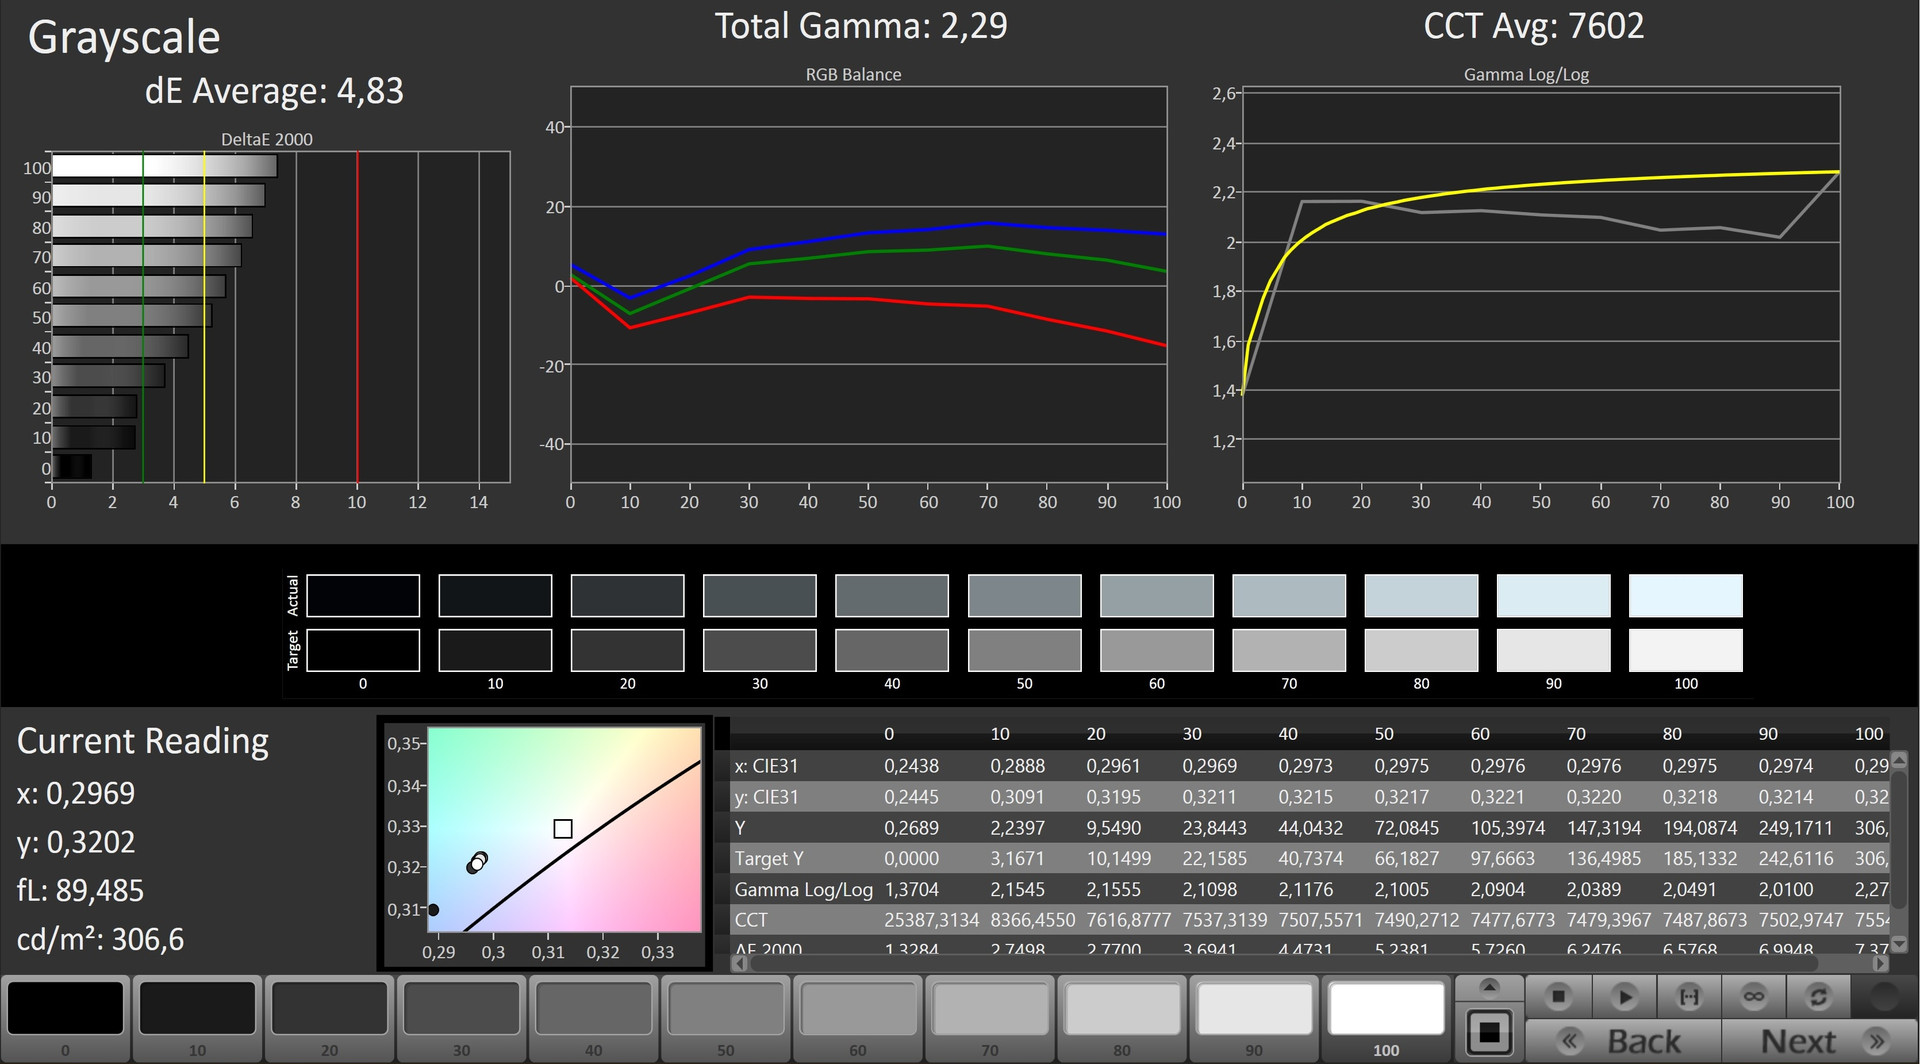
ΔE Greyscale Calman: 4.83 | ∀{0.09-98 Ø4.96}
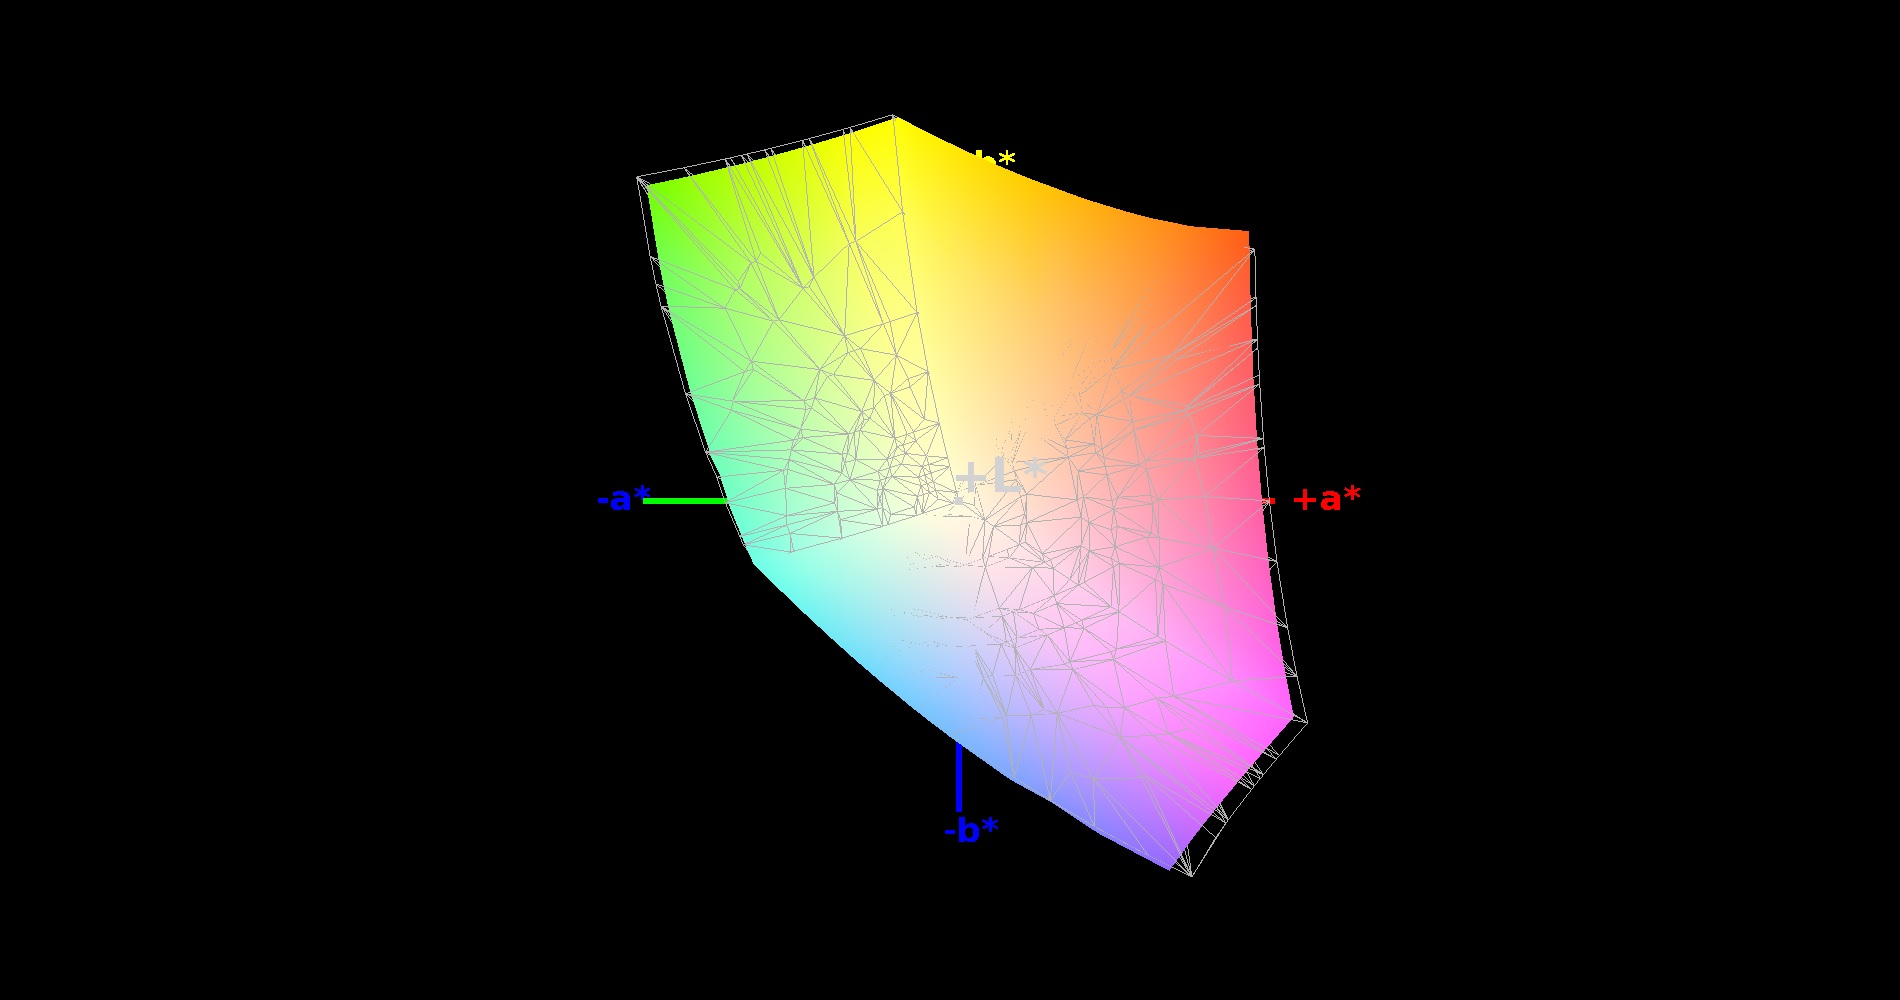
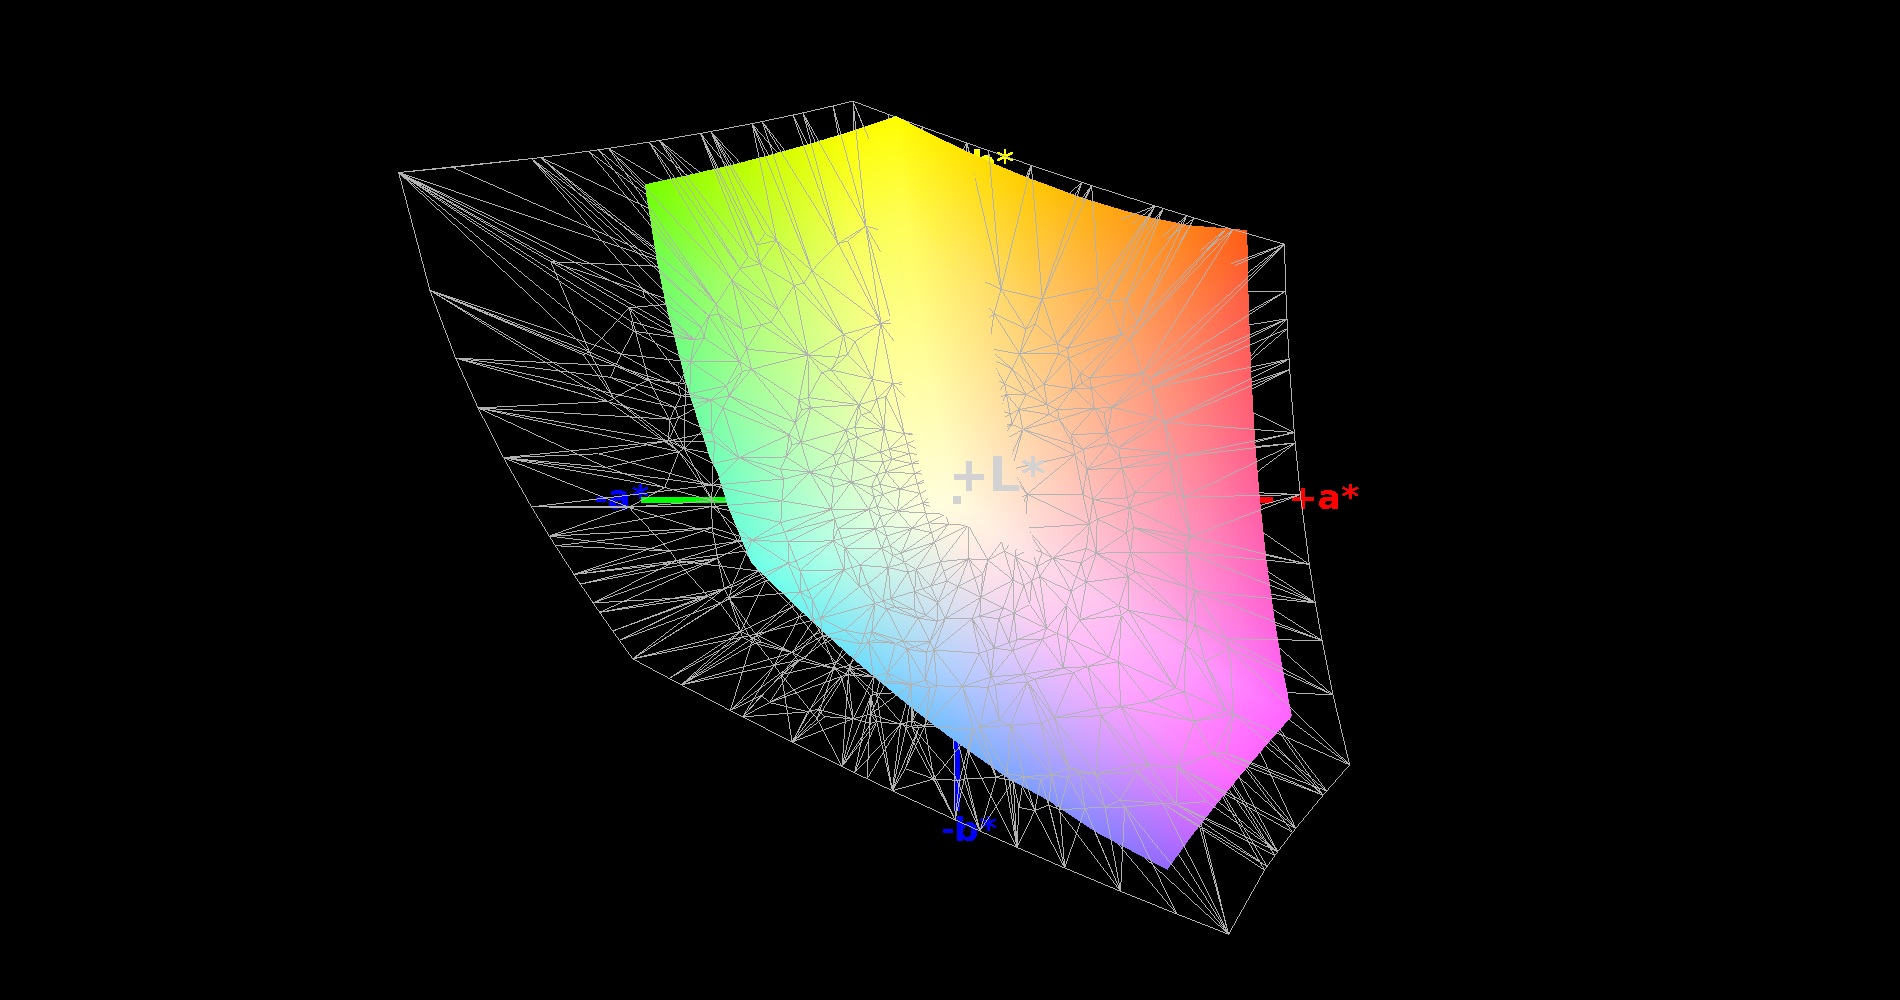
96% sRGB (Argyll 1.6.3 3D)
61% AdobeRGB 1998 (Argyll 1.6.3 3D)
66.8% AdobeRGB 1998 (Argyll 3D)
96.4% sRGB (Argyll 3D)
64.7% Display P3 (Argyll 3D)
Gamma: 2.39
CCT: 7602 K
Otherwise, we can hardly criticize the 4K panel of the W505. An average luminance of 293 cd/m² is not overly bright (it should be higher than 300 cd/m² for use outdoors), but there are no problems when you use it inside. We liked the contrast in particular. Thanks to a black value of 0.27 cd/m², the Sharp LQ156D1JW04 surpasses a contrast ratio of 1,000:1. If you don’t need the AdobeRGB color space, you should also be happy with the results. 96% sRGB is not beaten by many displays (61% AdobeRGB).
| Schenker W505 Sharp LQ156D1JW04 (SHP1436) | MSI WT72-2OL32SR311BW LP173WF4-SPF1 | HP ZBook 15 G2 Samsung SDC5344 | Dell Precision M2800 CMN15BA | Fujitsu Celsius H730 LP156WF4-SPH1 | |
|---|---|---|---|---|---|
| Display | -6% | 4% | -22% | -22% | |
| Display P3 Coverage (%) | 64.7 | 66.5 3% | 68.5 6% | 51.2 -21% | 51.1 -21% |
| sRGB Coverage (%) | 96.4 | 84.3 -13% | 97.3 1% | 72.9 -24% | 74.4 -23% |
| AdobeRGB 1998 Coverage (%) | 66.8 | 61.7 -8% | 70.7 6% | 52.4 -22% | 52.1 -22% |
| Screen | -12% | -17% | -45% | -11% | |
| Brightness middle (cd/m²) | 288 | 303 5% | 309 7% | 279 -3% | 267 -7% |
| Brightness (cd/m²) | 293 | 276 -6% | 289 -1% | 281 -4% | 281 -4% |
| Brightness Distribution (%) | 93 | 83 -11% | 84 -10% | 72 -23% | 77 -17% |
| Black Level * (cd/m²) | 0.27 | 0.34 -26% | 0.47 -74% | 0.311 -15% | 0.31 -15% |
| Contrast (:1) | 1067 | 891 -16% | 657 -38% | 897 -16% | 861 -19% |
| Colorchecker dE 2000 * | 3.76 | 5.57 -48% | 3.82 -2% | 9.95 -165% | 4.59 -22% |
| Greyscale dE 2000 * | 4.83 | 4.08 16% | 5.94 -23% | 11.25 -133% | 3.83 21% |
| Gamma | 2.39 92% | 2.19 100% | 2.16 102% | 3.45 64% | 2.21 100% |
| CCT | 7602 86% | 7362 88% | 6996 93% | 10110 64% | 6158 106% |
| Color Space (Percent of AdobeRGB 1998) (%) | 61 | 55.34 -9% | 63.8 5% | 59 -3% | 48 -21% |
| Color Space (Percent of sRGB) (%) | 96 | 84.21 -12% | |||
| Total Average (Program / Settings) | -9% /
-10% | -7% /
-11% | -34% /
-39% | -17% /
-14% |
* ... smaller is better
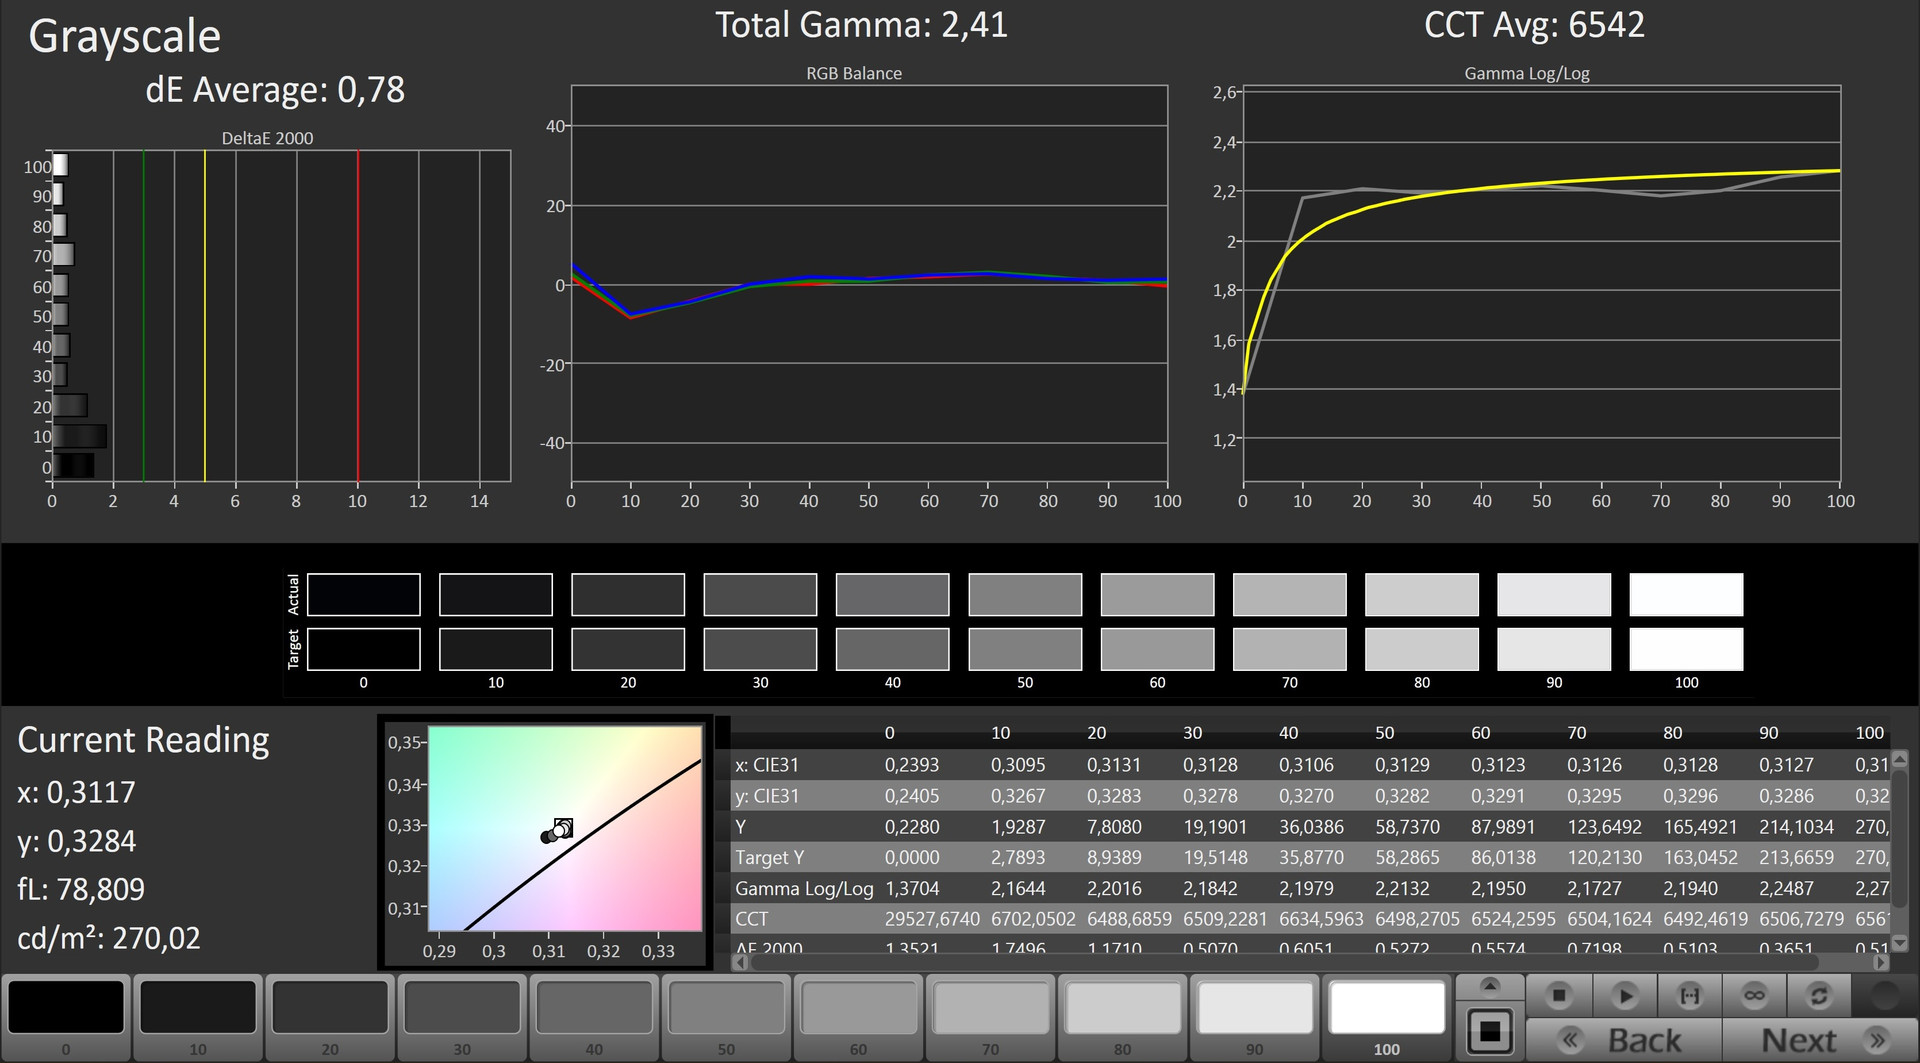
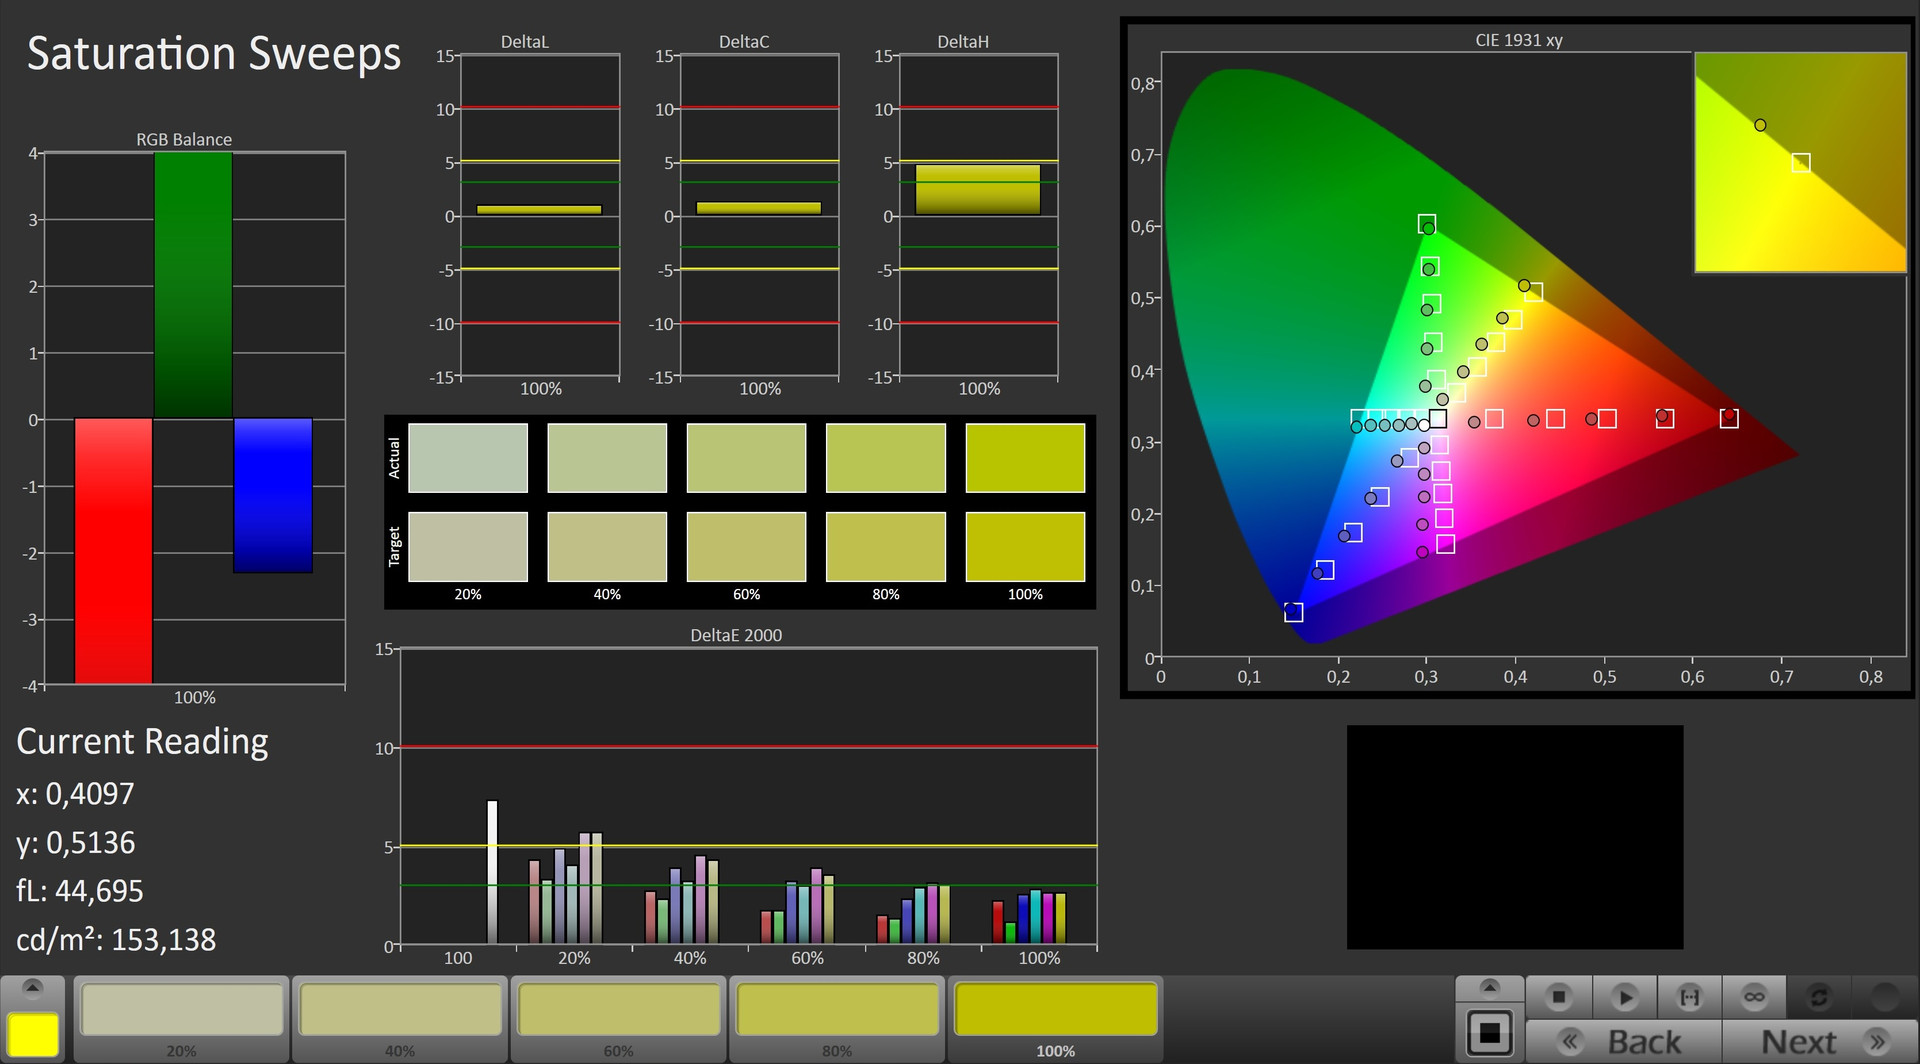
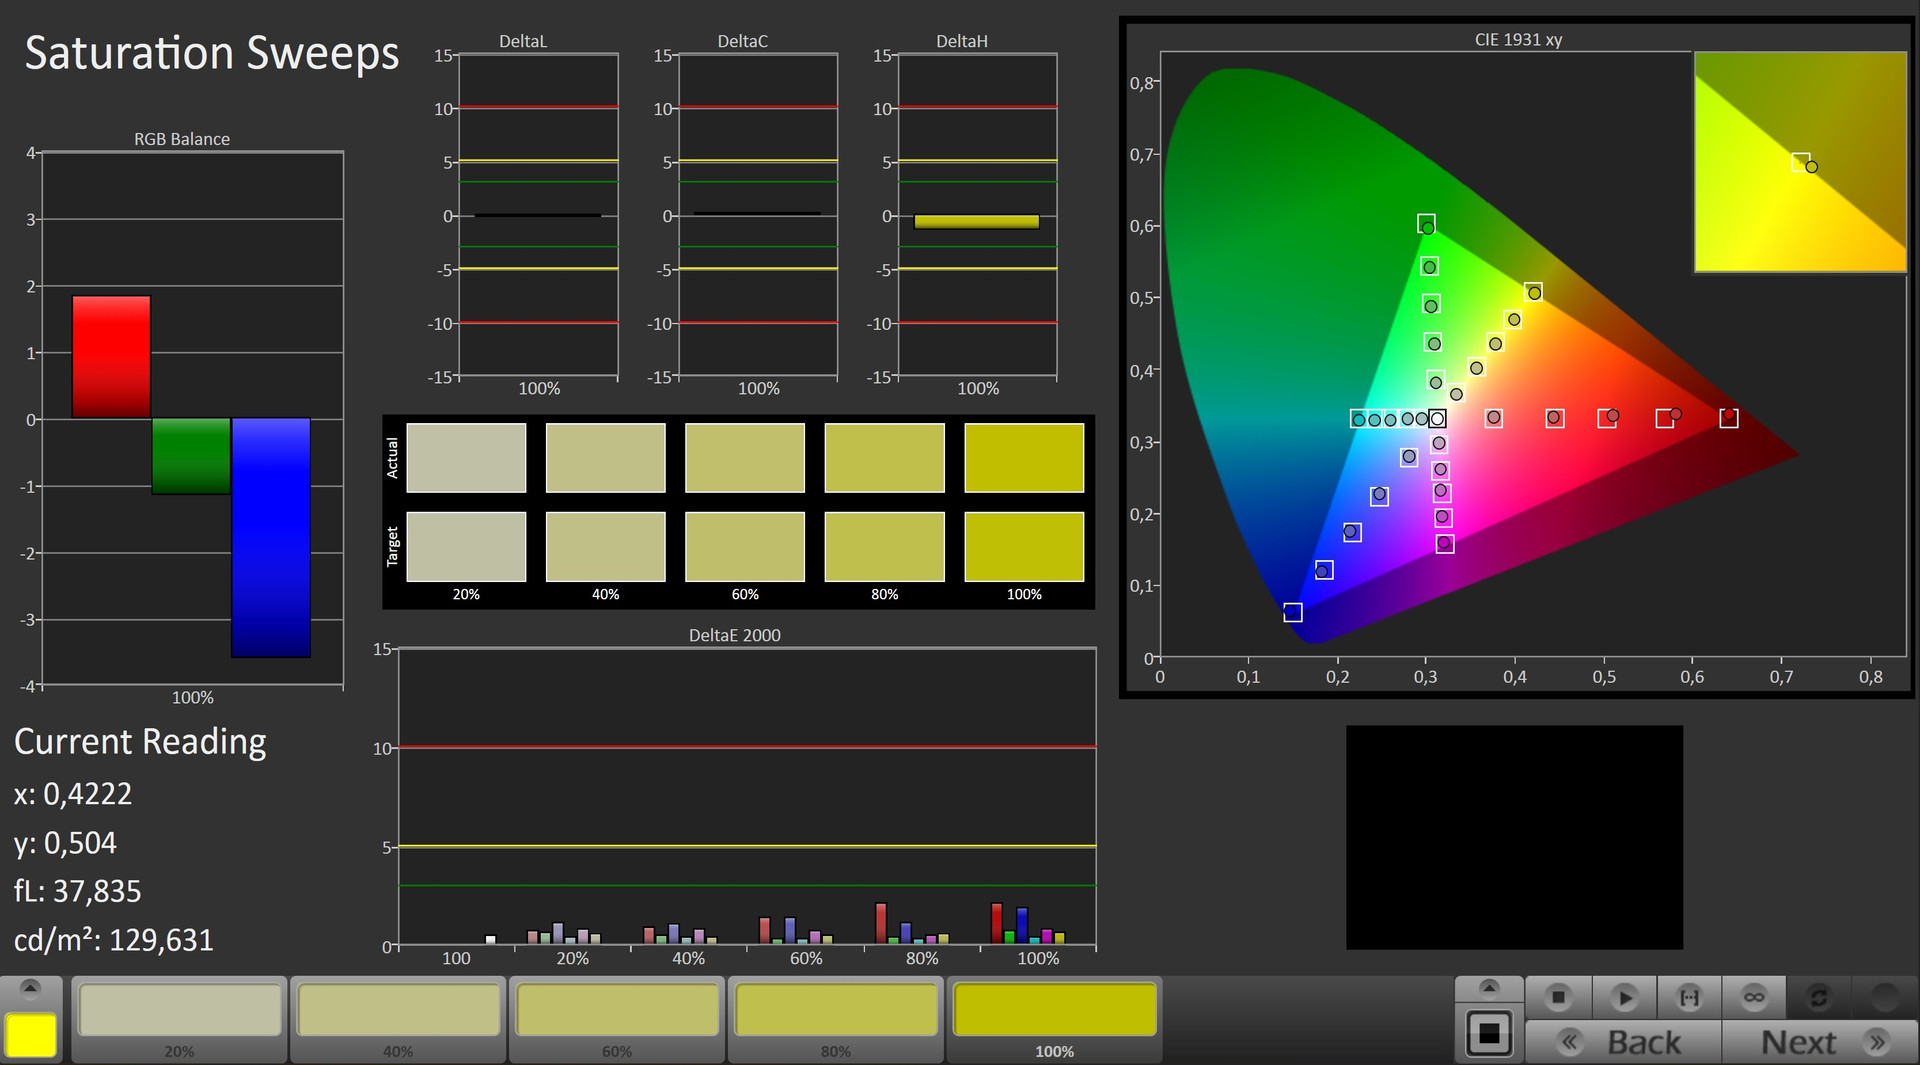
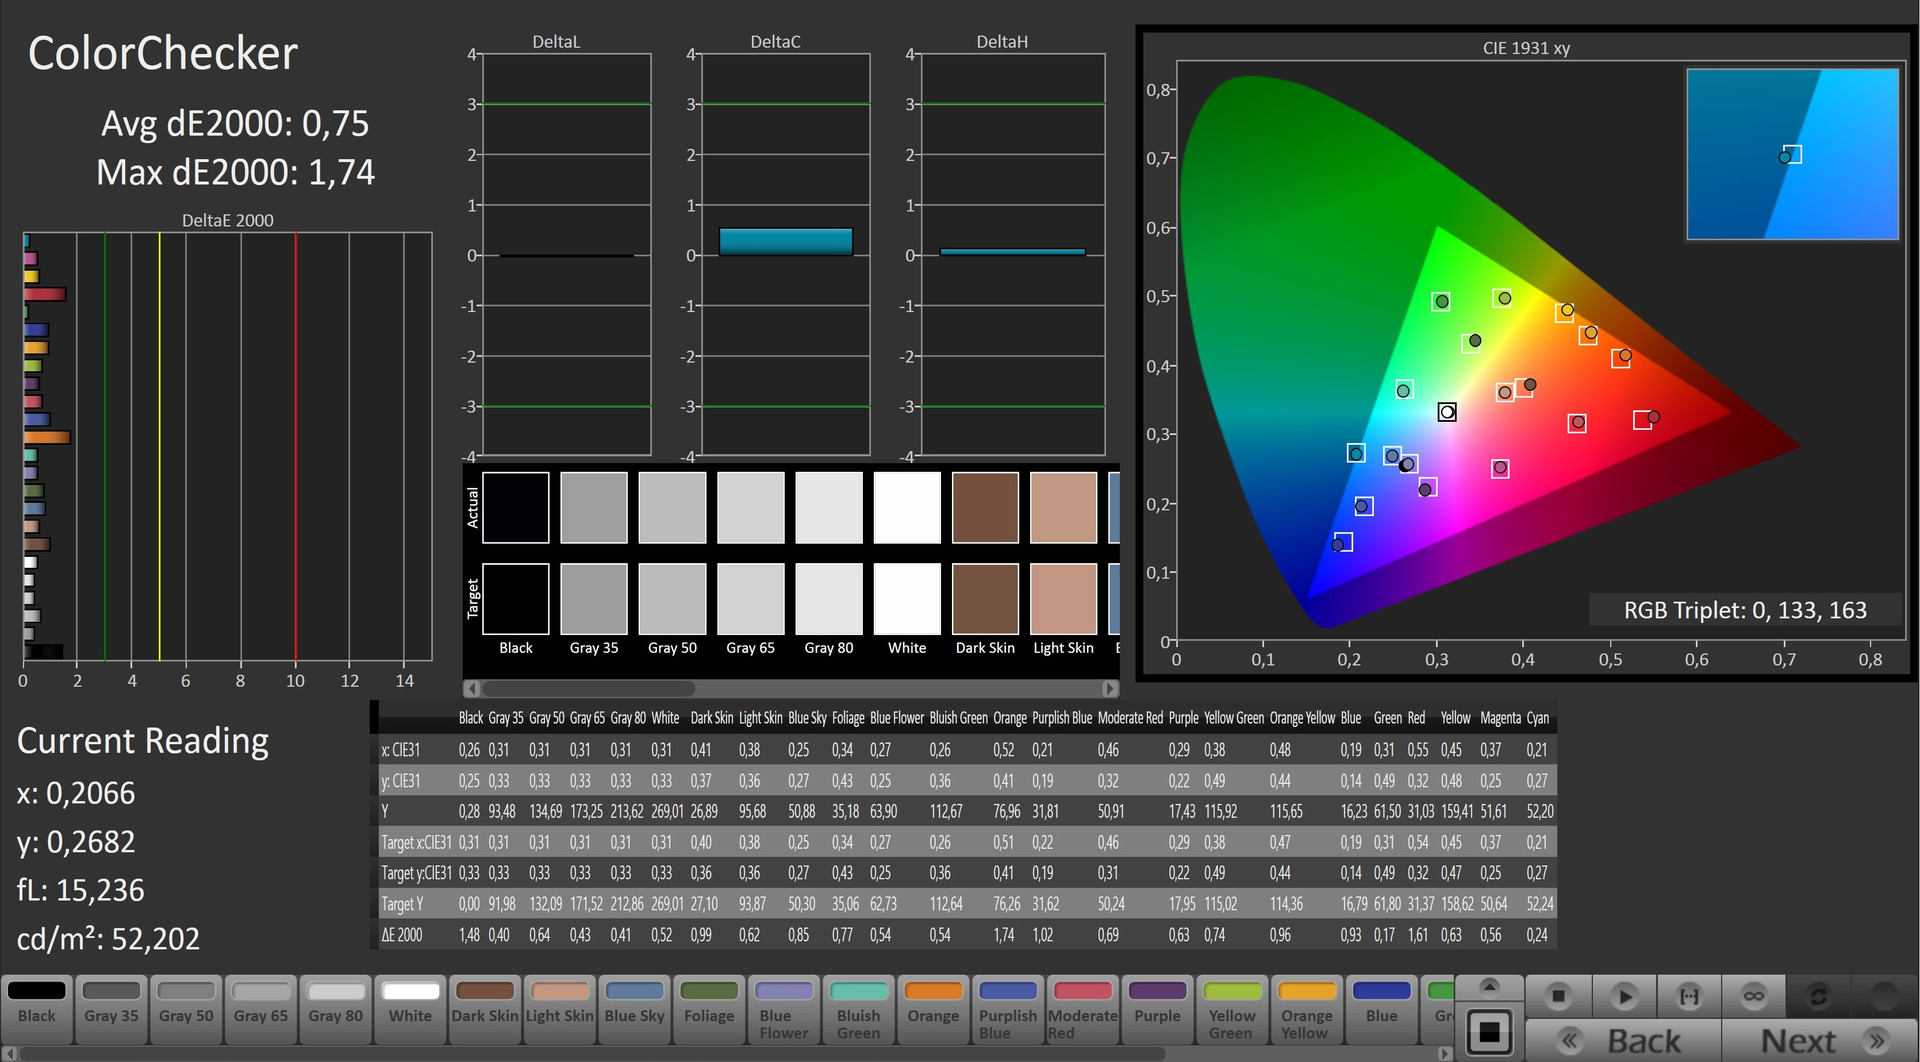
The 4K panel performs well in our test with the professional software CalMAN, although the grayscale performance, the saturation and the color accuracy are only really good after calibration. The display usually has a blue cast, which is common for many laptops, but the Sharp LQ156D1JW04 convinces with a good brightness distribution in return. 93% indicates a uniform picture, which is confirmed by our practical experiences (only minimal screen bleeding at the lower display frame).
The viewing angles are good, which is typical for an IPS display. There will only be deviations from extreme angles from above or below, which are rare in practice. Another word on the resolution: If you reduce it to 1920x1080 for a better performance, you do not have to live with a blurry picture. Lower resolutions appear pretty sharp.

Performance

Processor
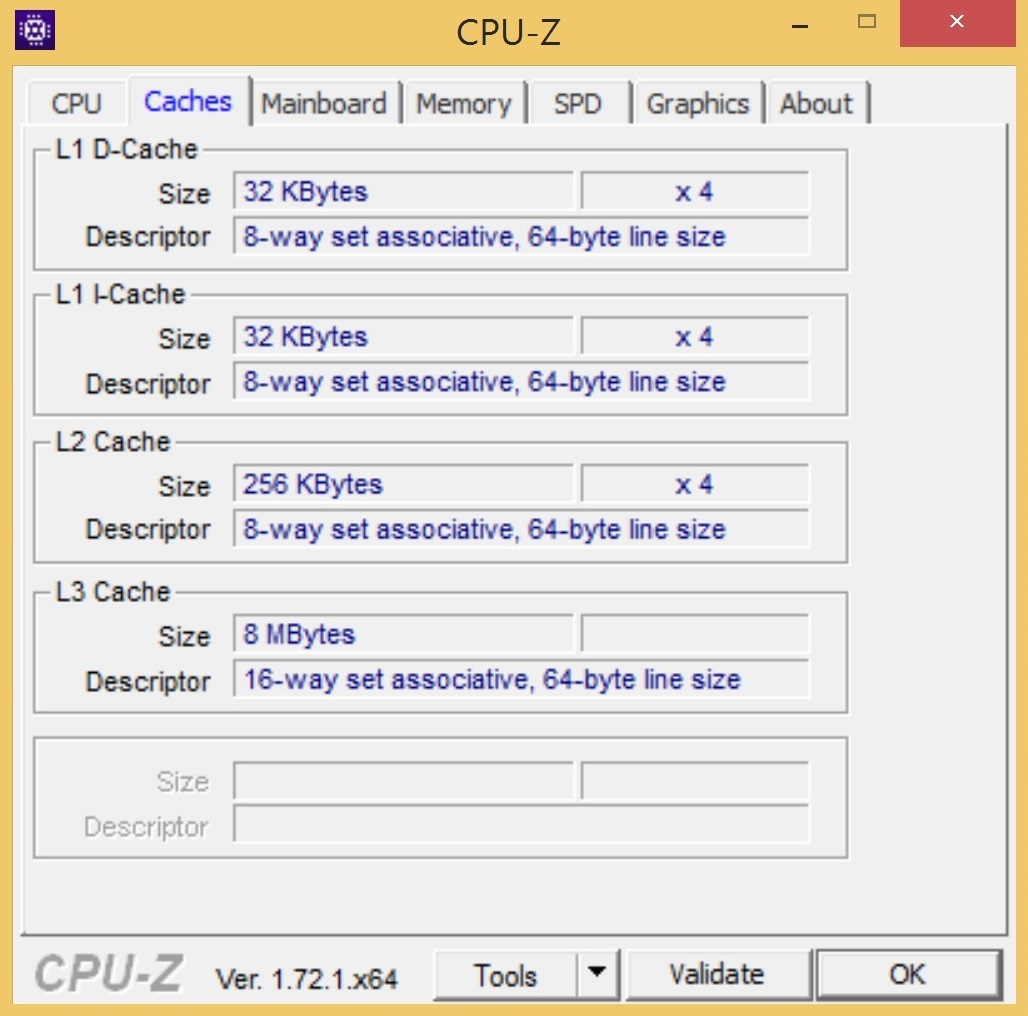
The effects of the processor selection are often limited. Thanks to the Haswell technology, all chips with a TDP of at least 45 Watts offer a respectable performance. Considering the 3.4-3.8 GHz, the Xeon E3-1231 v3 is roughly on par with the Core i7-4790S, which runs at 3.2-4.0 GHz under load and can execute up to eight threads simultaneously thanks to Hyper-Threading. The manufacturing process (22 nm) and the amount of L3 cache (8 MB) are identical as well.
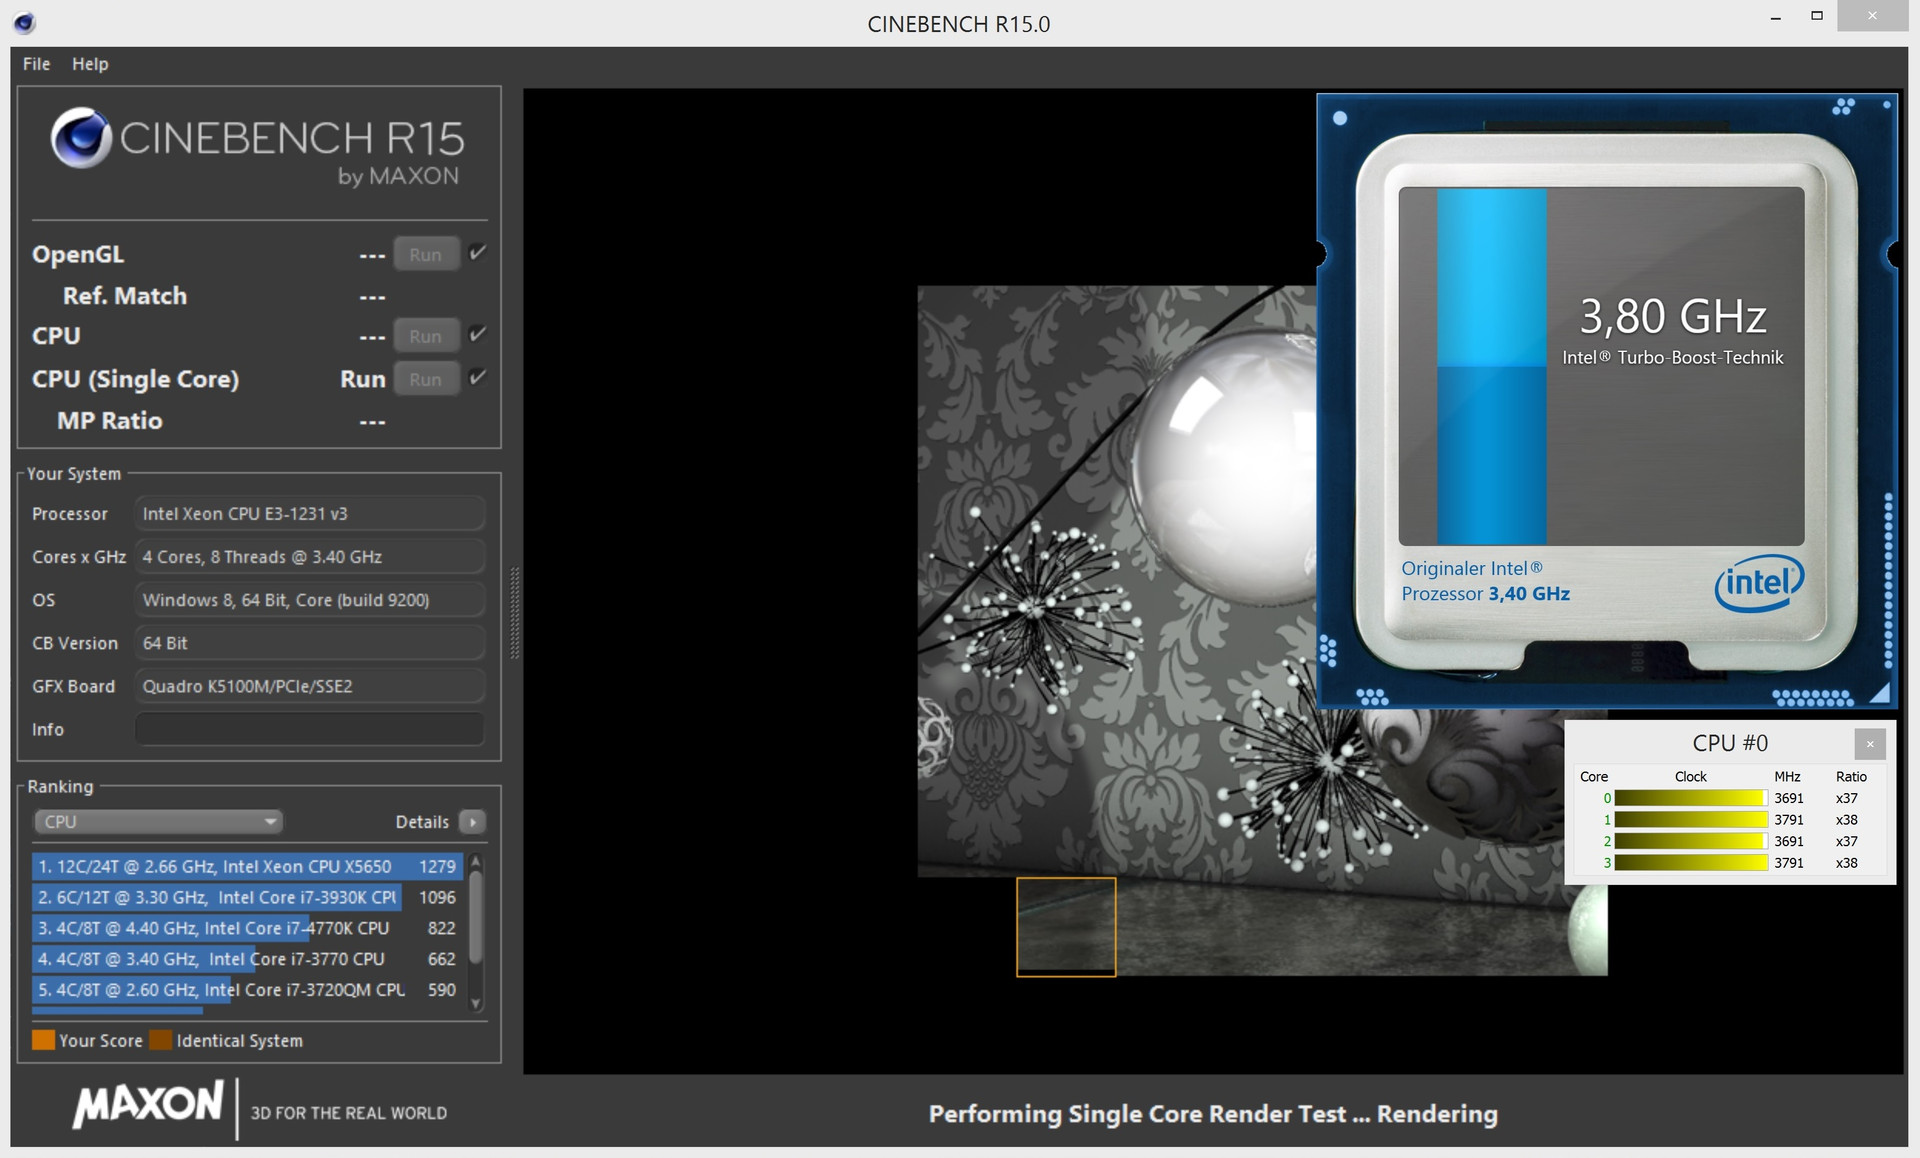
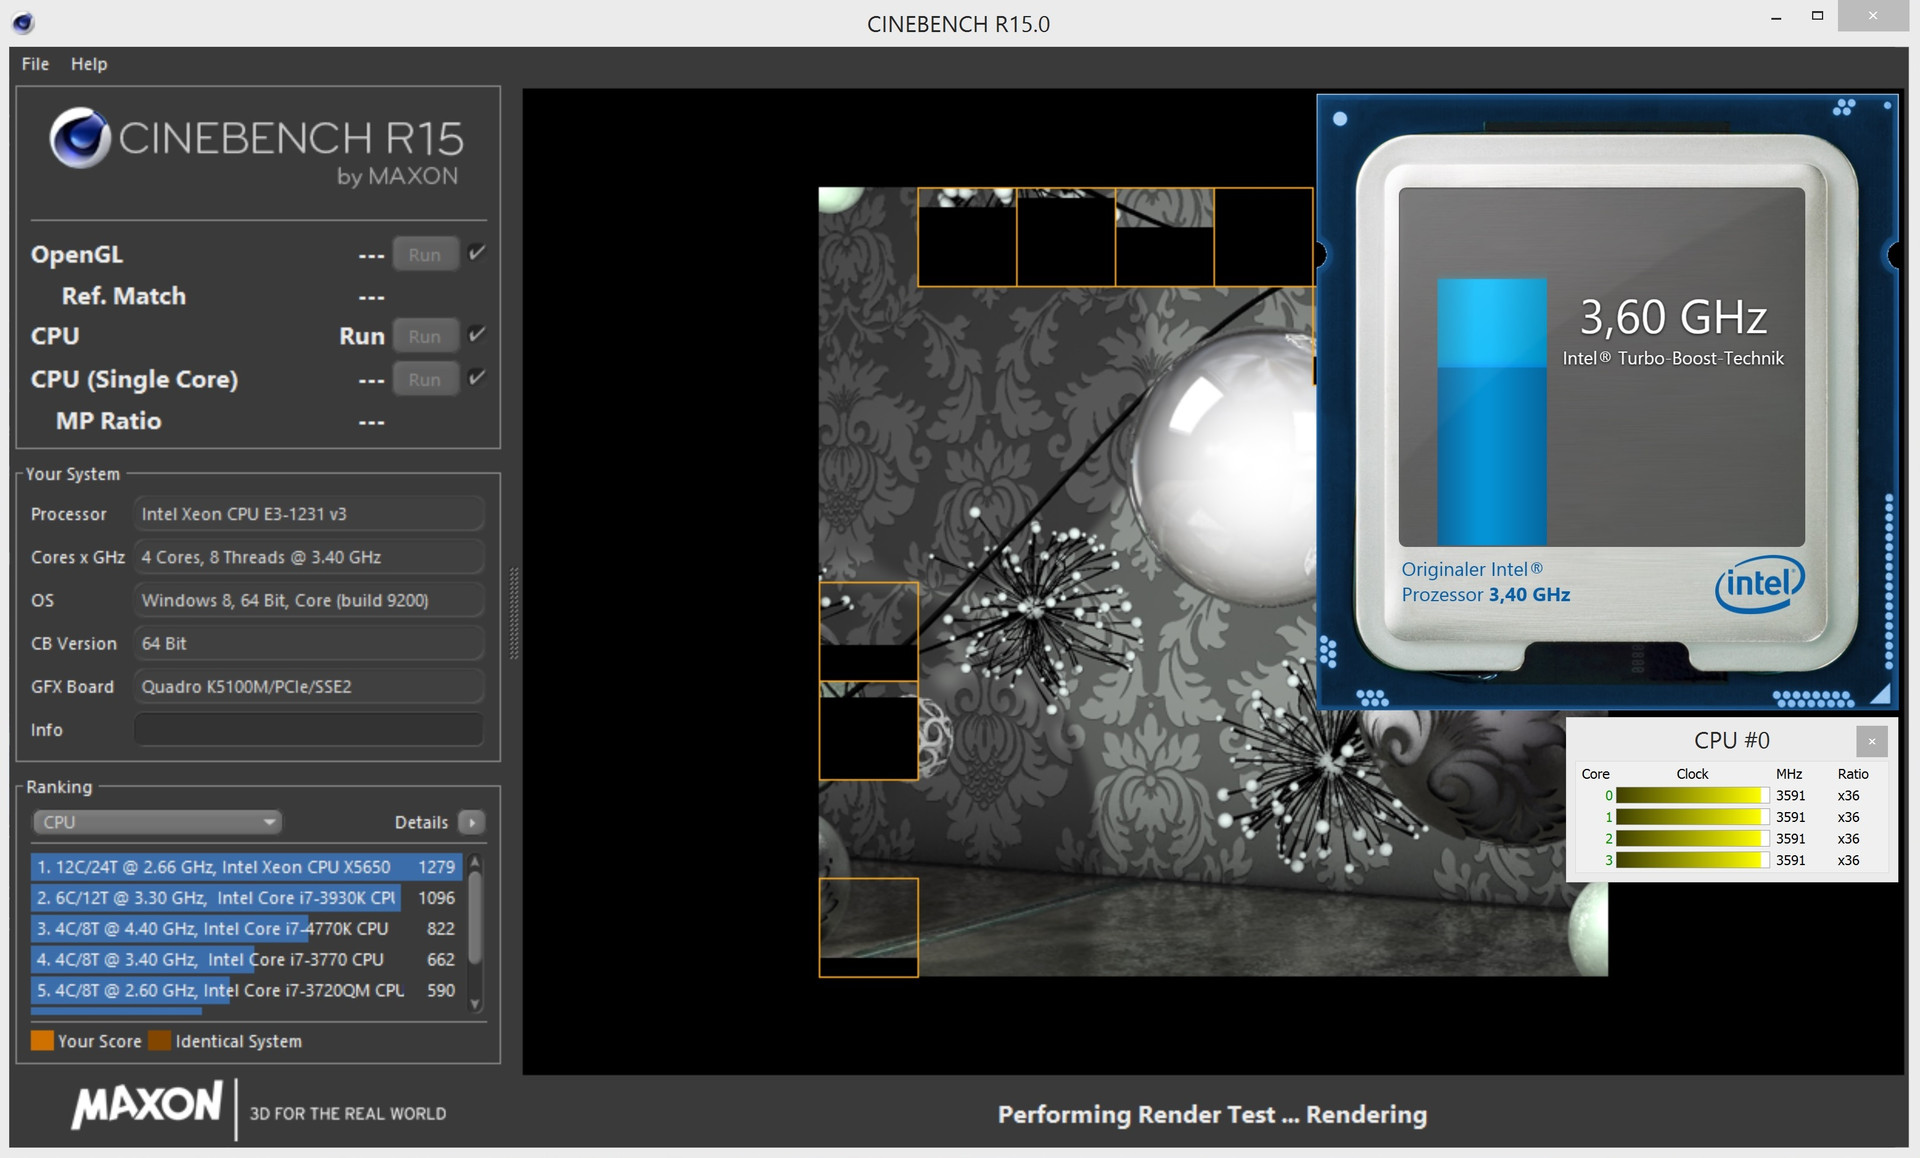
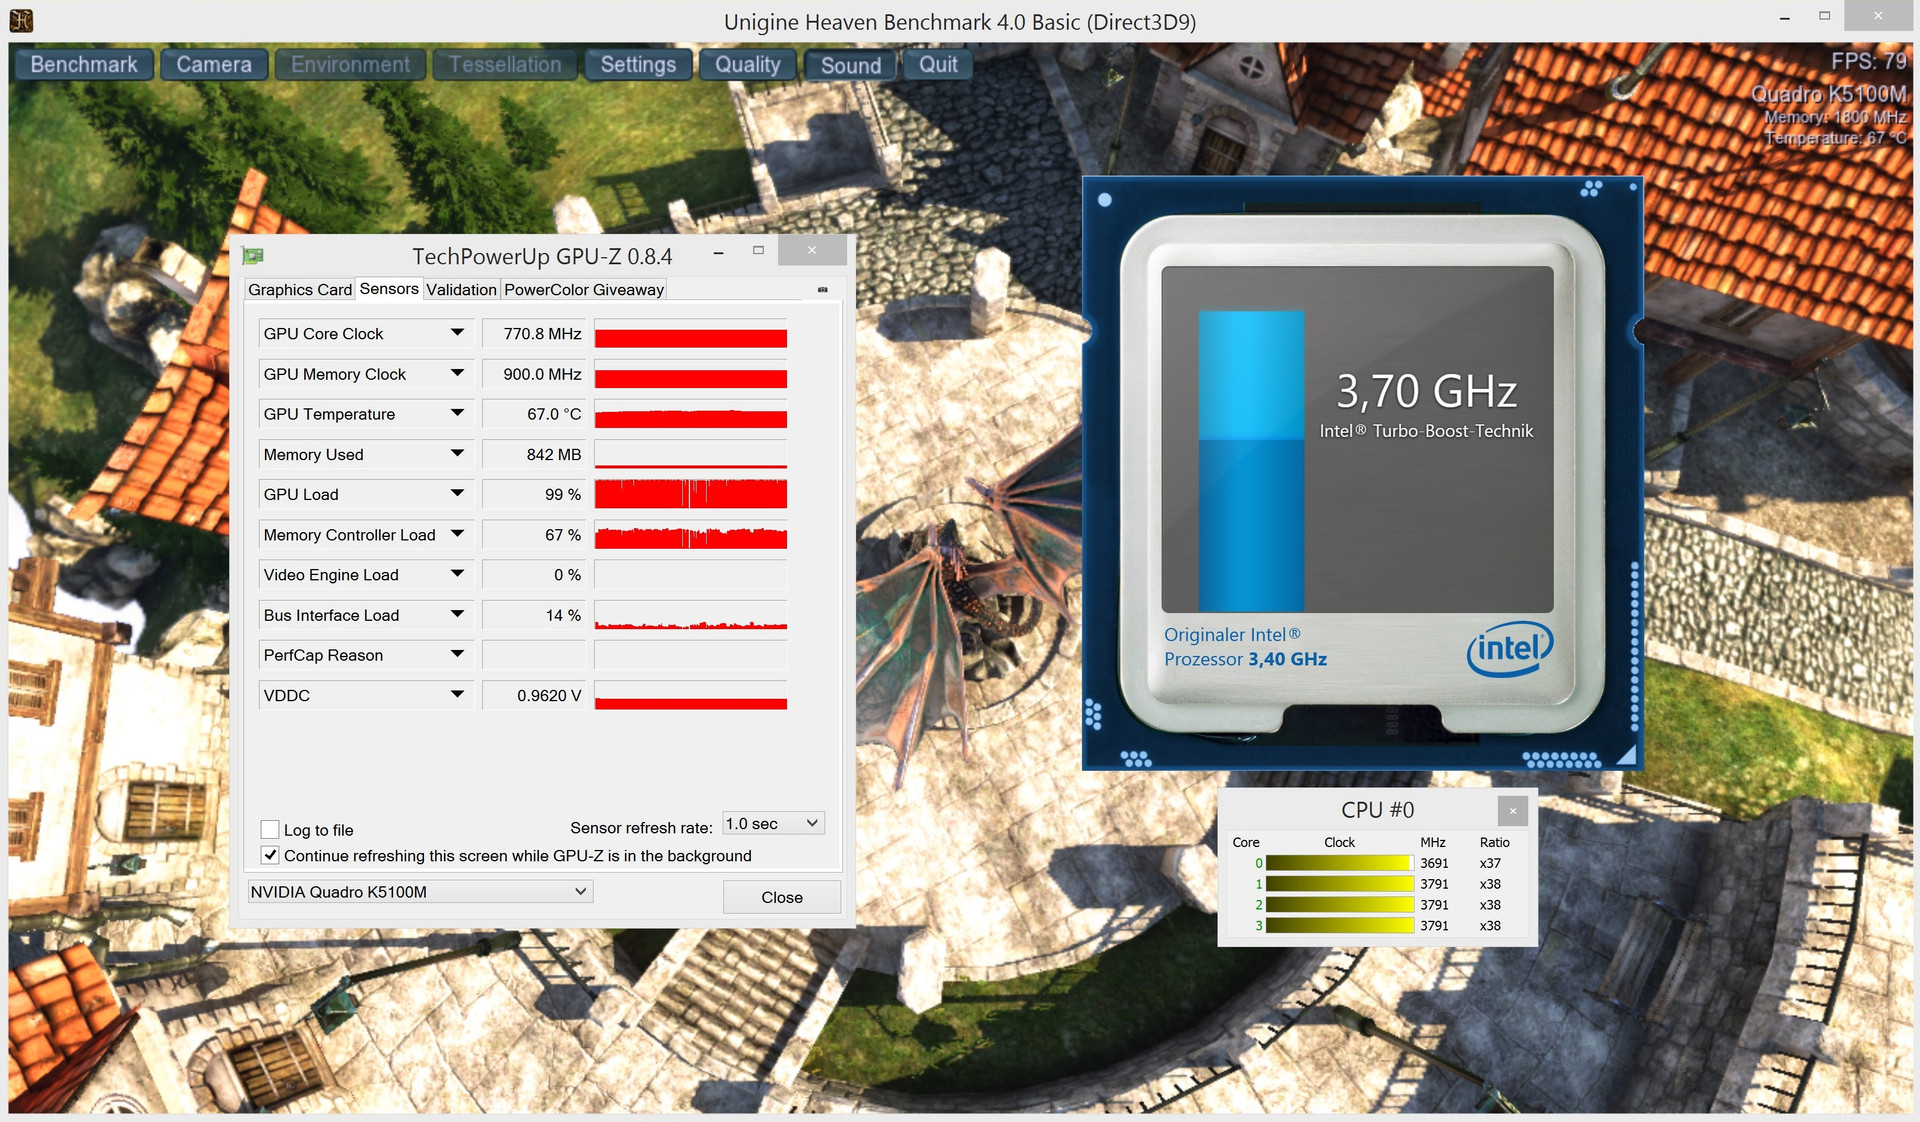
A look at the clocks of the Xeon E3-1231 v3 does not reveal any issues. Cinebench R15 and the Unigine Heaven benchmark were executed with 3.6 and 3.8 GHz by the workstation CPU, which corresponds with Intel’s specifications.
Compared to notebook chips, the desktop model performs very well. Neither the Core i7-4710MQ (600 points @ Fujitsu Celsius H730) nor the Core i7-4810MQ (648 points @Dell Precision M2800) or the Core i7-4910MQ (651 points @HP ZBook 15 G2) can keep up with a Cinebench R15 Multi score of 732 points. Only the Core i7-4980HQ (715 points @MSI WT72) can compete with the Xeon E3-1231 v3.
System Performance
The Schenker W505 is also at the top of the ranking in terms of system performance. The powerful hardware combination manages 6,052 points in PCMark 7 – an excellent result that is ahead of the rivals by multiple percent points. This is mainly a result of the weaker SSDs (the MSI WT72 is not in the table because it was tested with PCMark 8).
| PCMark 7 Score | 6052 points | |
Help | ||
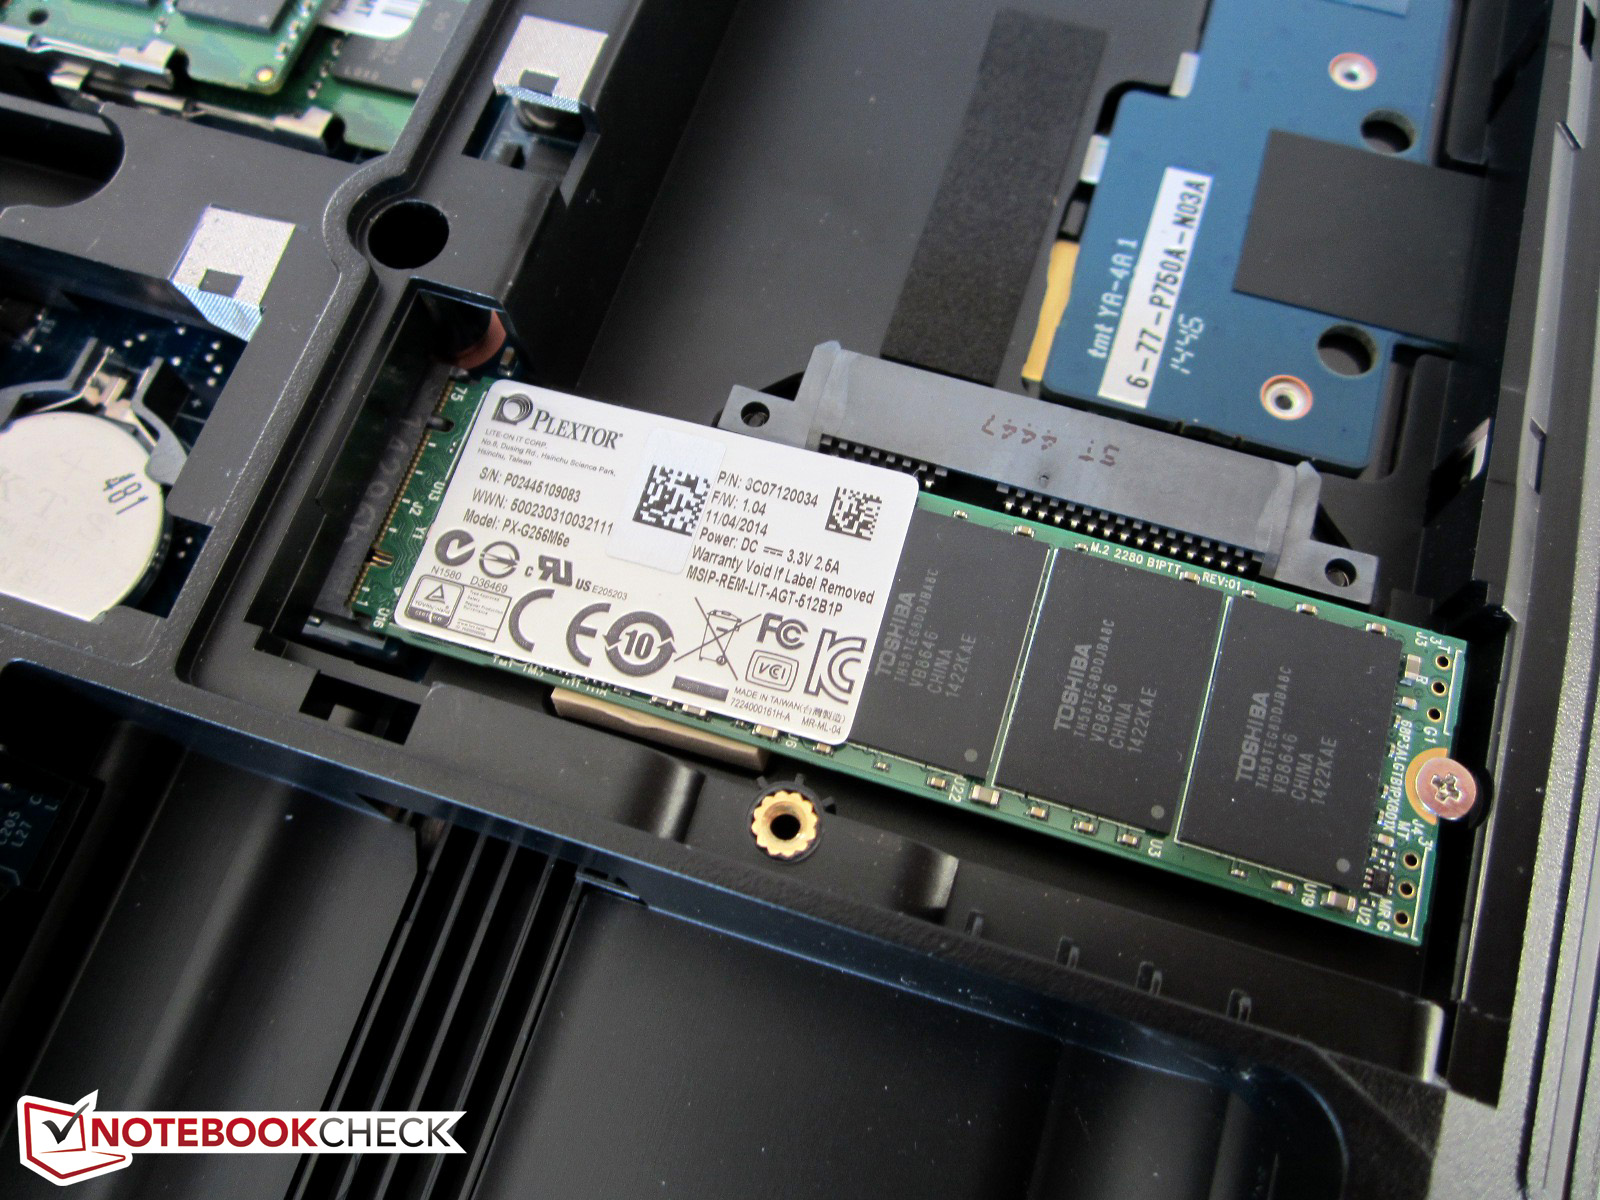
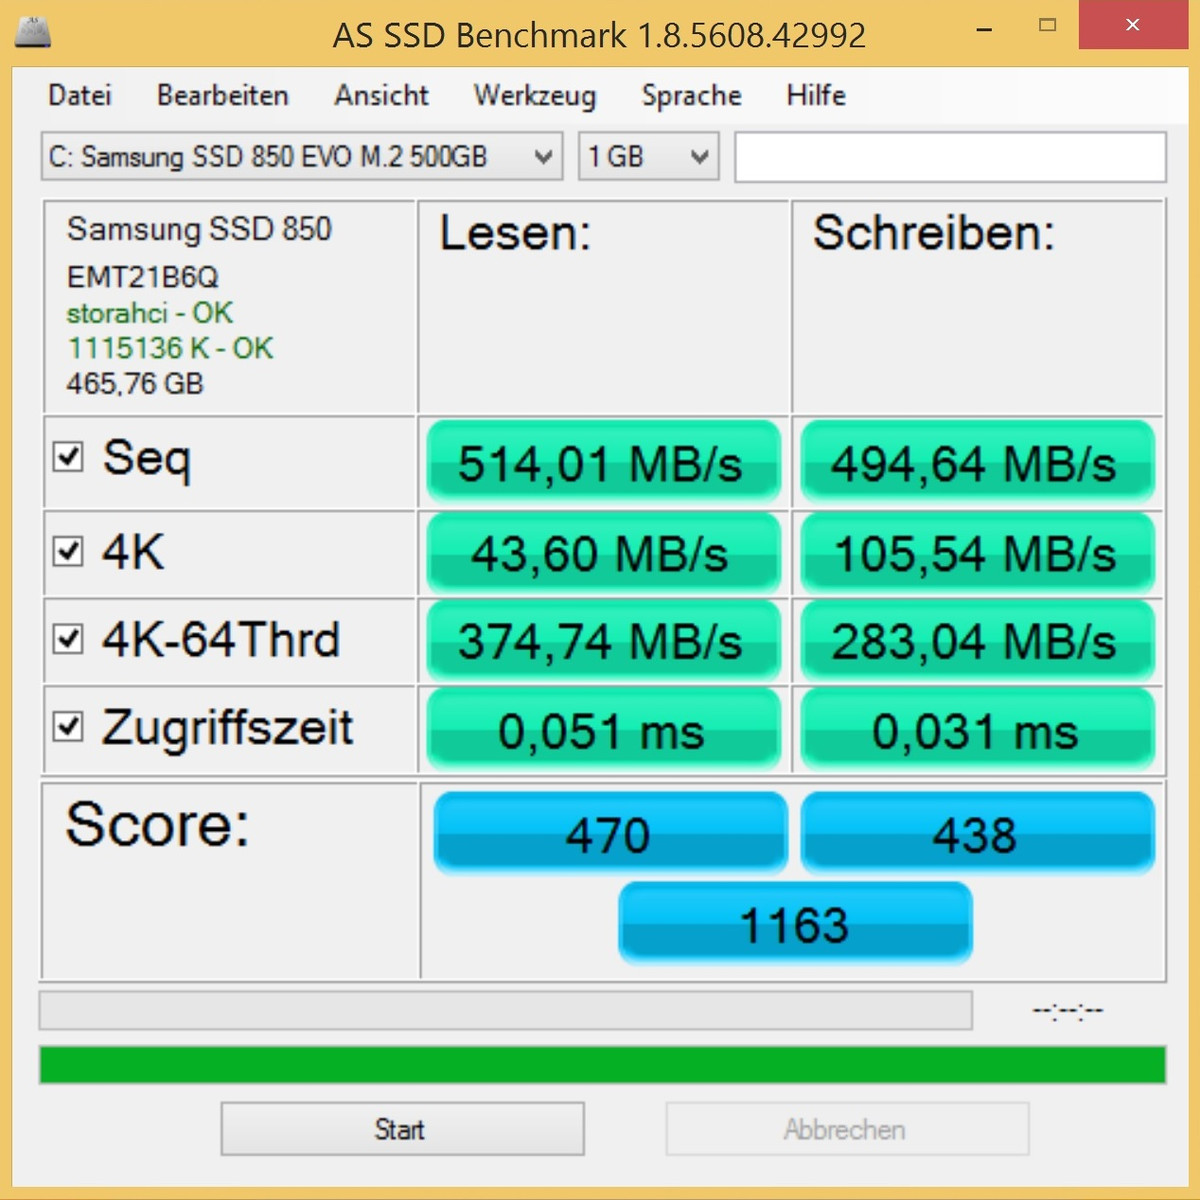
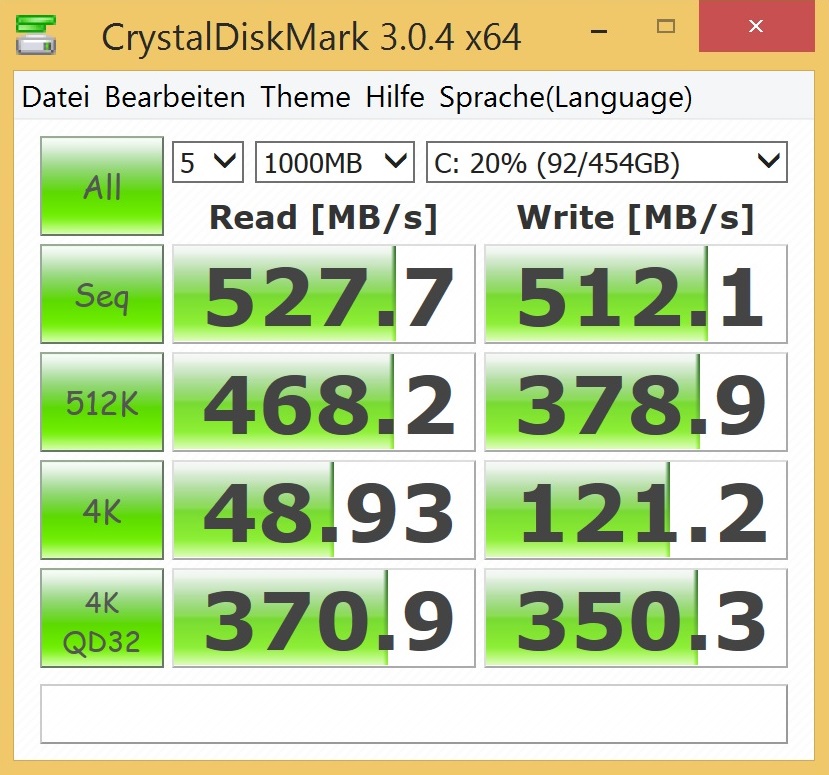
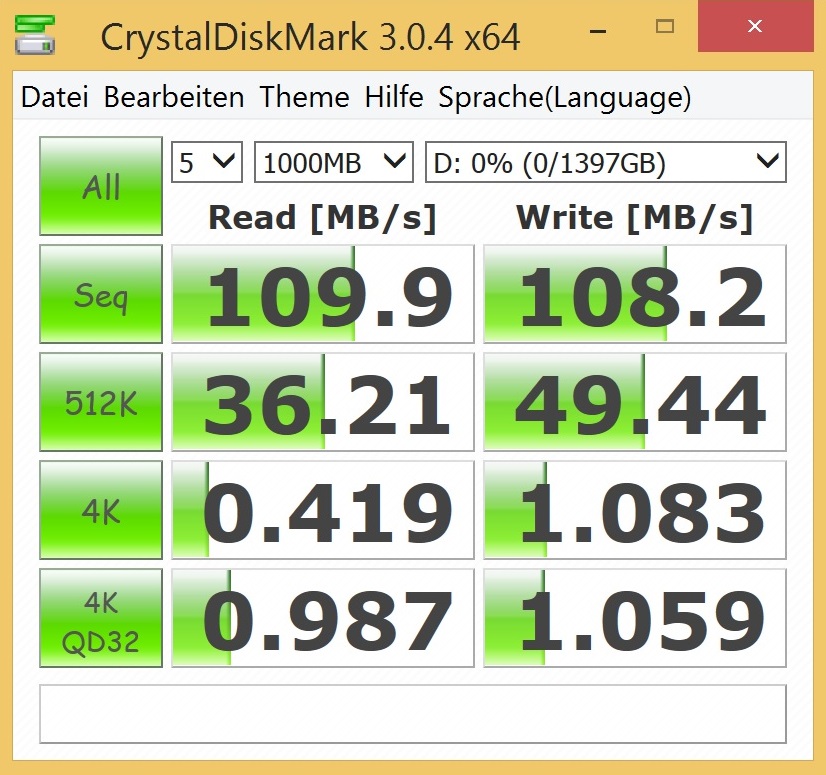
Storage Devices
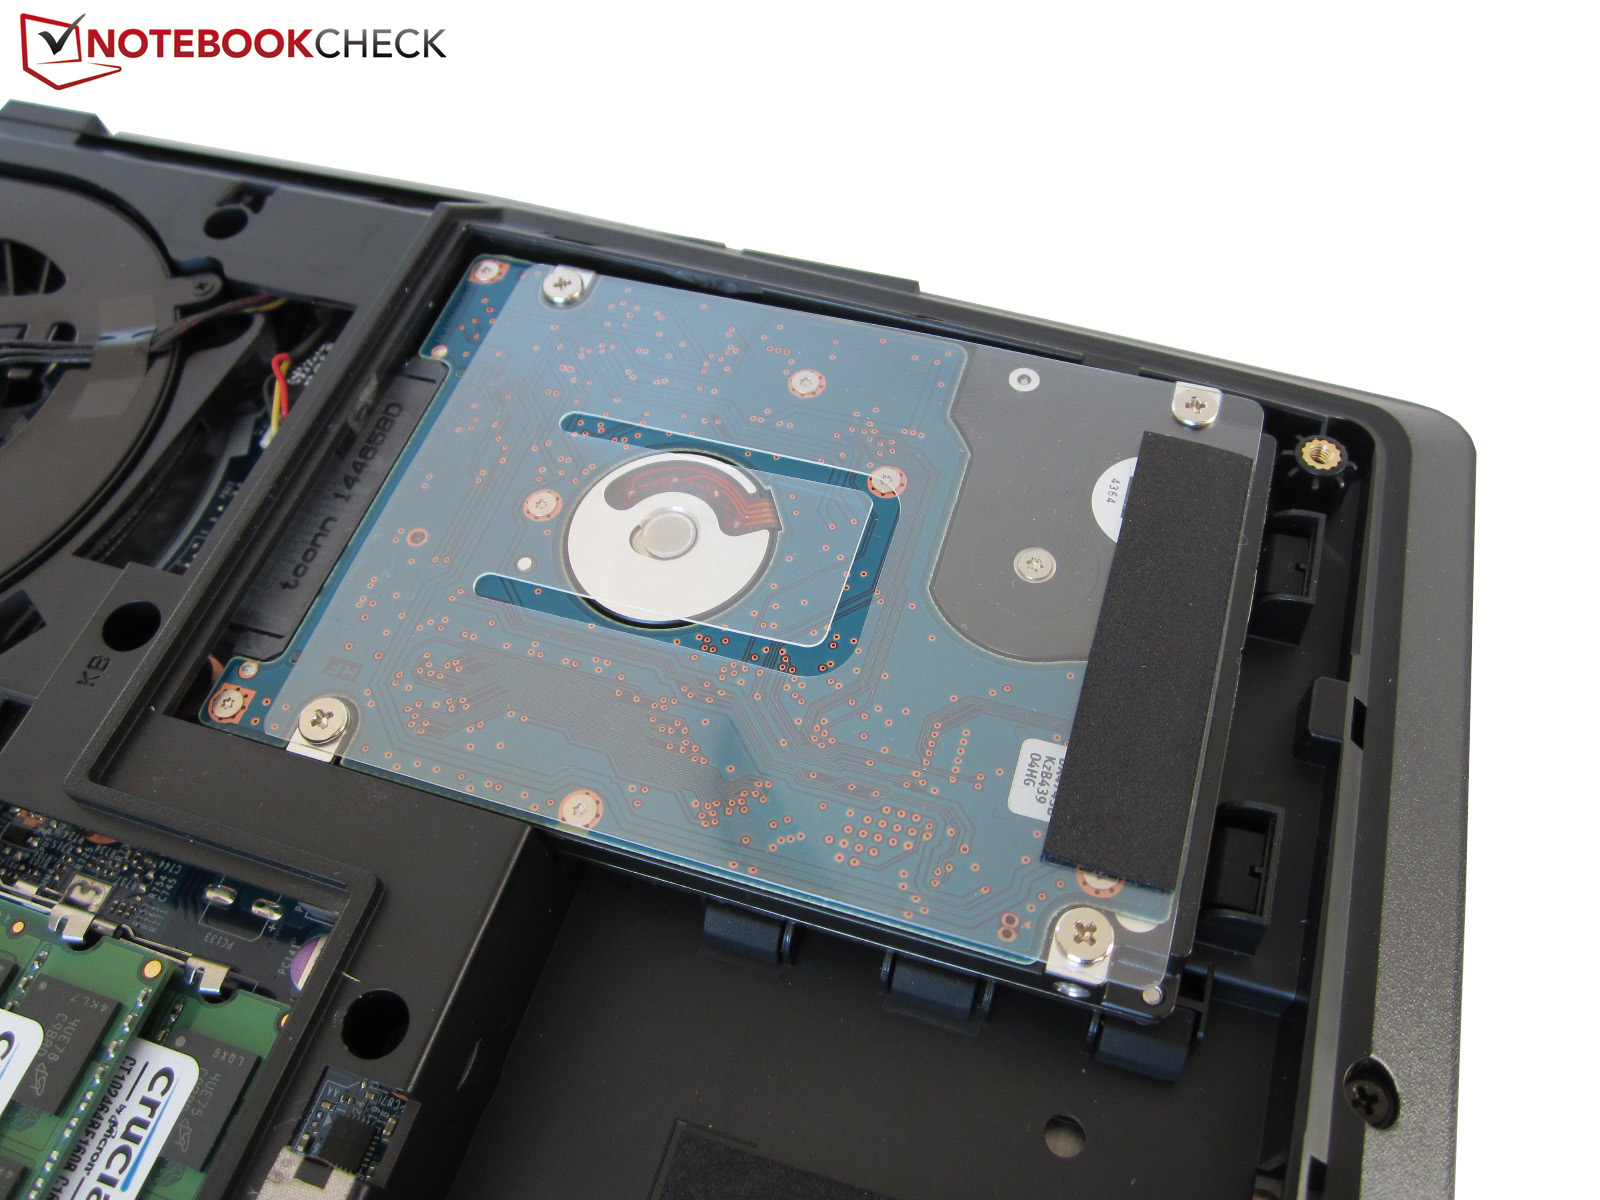
If you are looking at the price-performance ratio, the Samsung 850 EVO is one of the most interesting SSDs. It does not matter if you evaluate the performance of small files or the sequential transfer rates (read and write): The M.2 drive is always competitive. The results of the secondary storage drive (HGST Travelstar 5K1000) are available in the system screenshots further at the top.

GPU Performance
The technical specifications of the Quadro GPUs inside the Schenker W505 are not that overwhelming. Except for the video memory, which can be as high as 8 GB, the professional models cannot compete with their gaming siblings. The main reason is the outdated Kepler architecture that, despite the unchanged manufacturing process (28 nm), falls clearly behind its Maxwell successor in terms of efficiency.
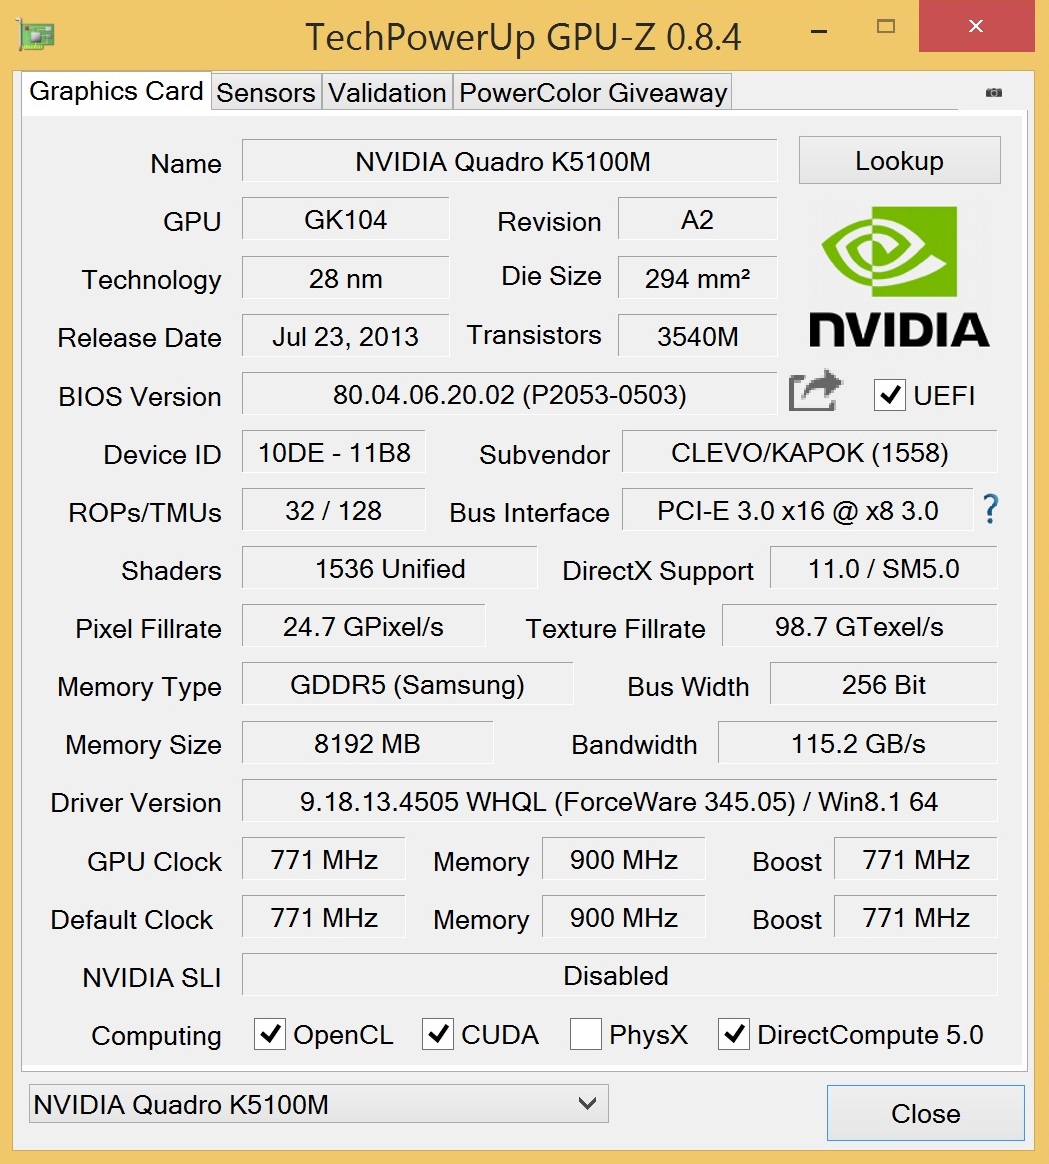
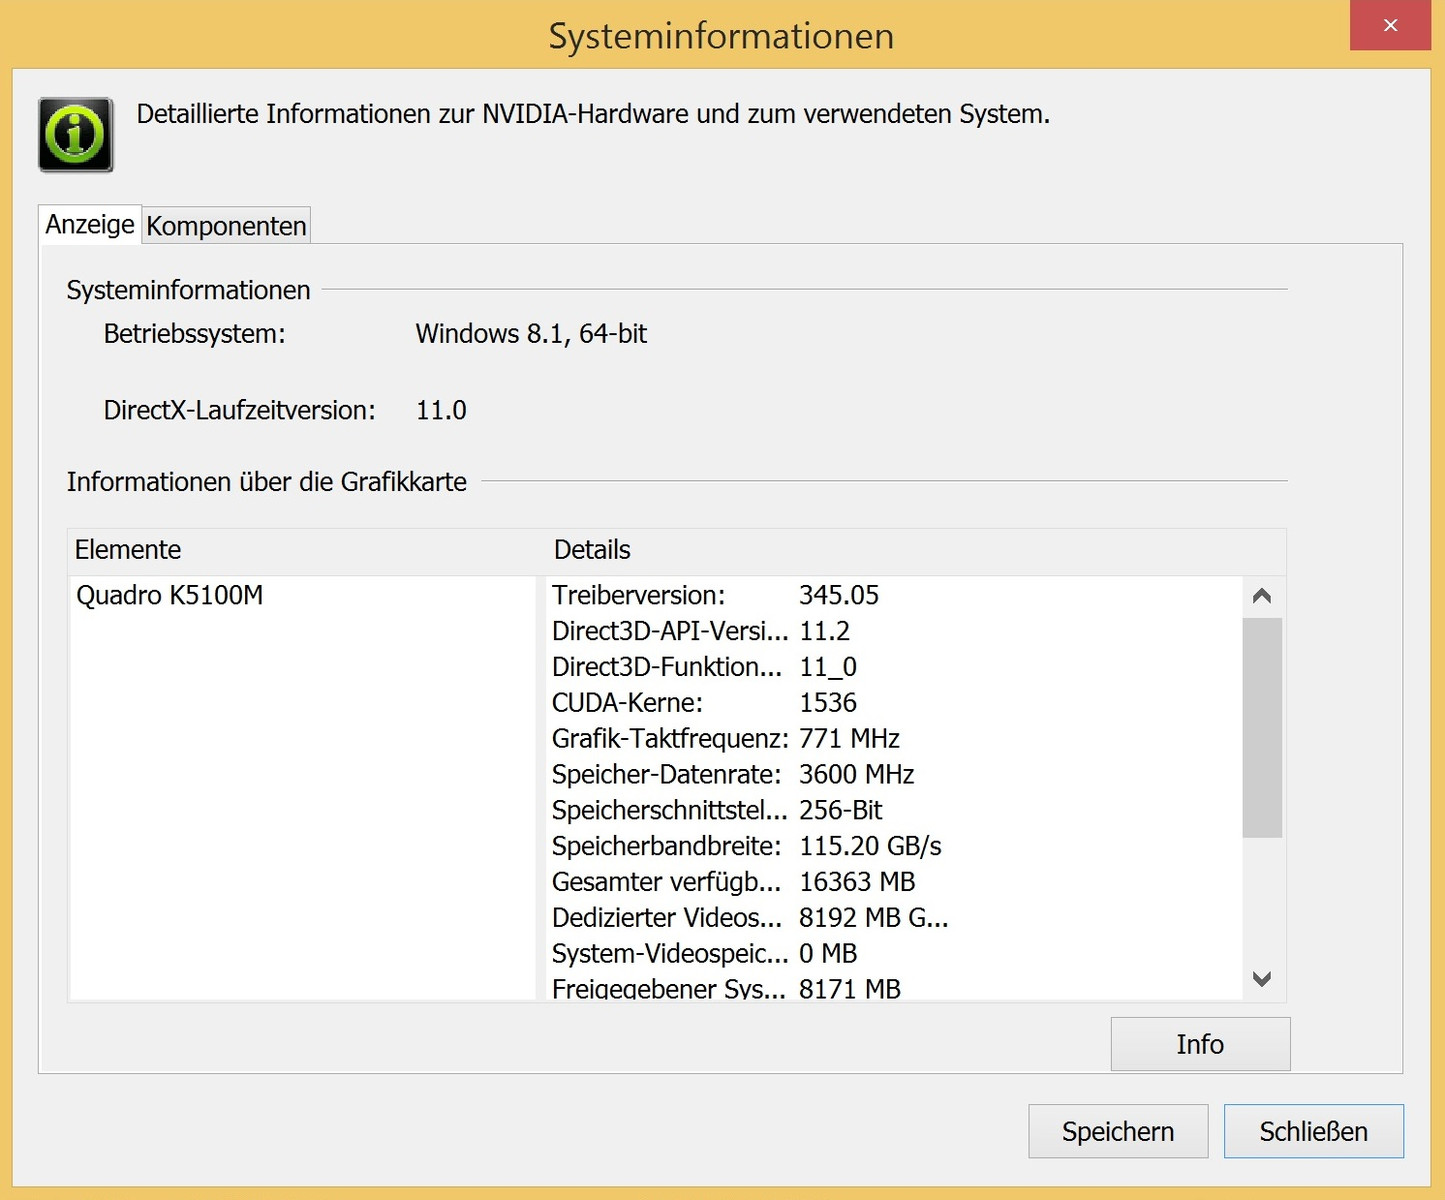
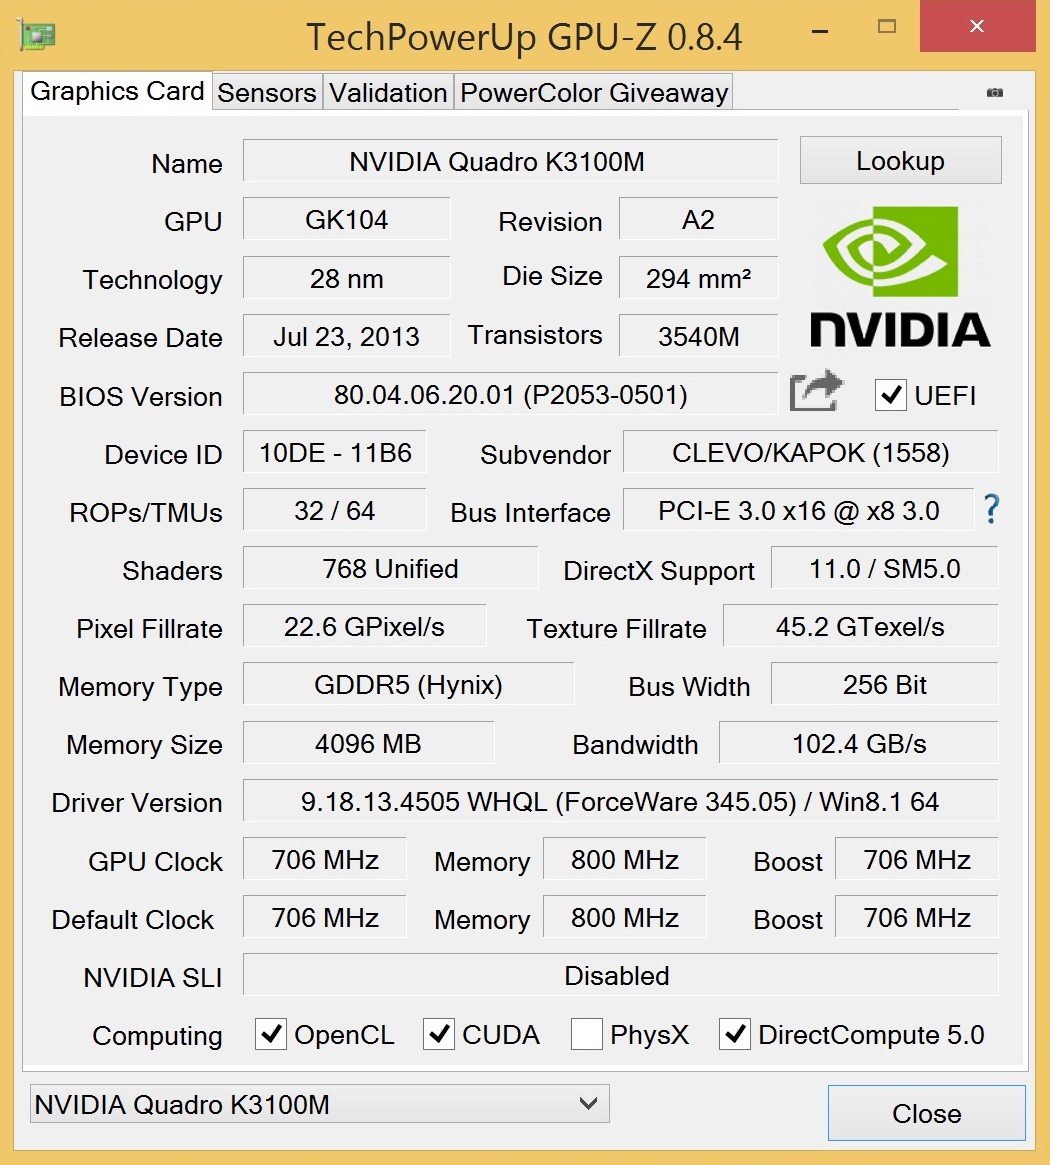
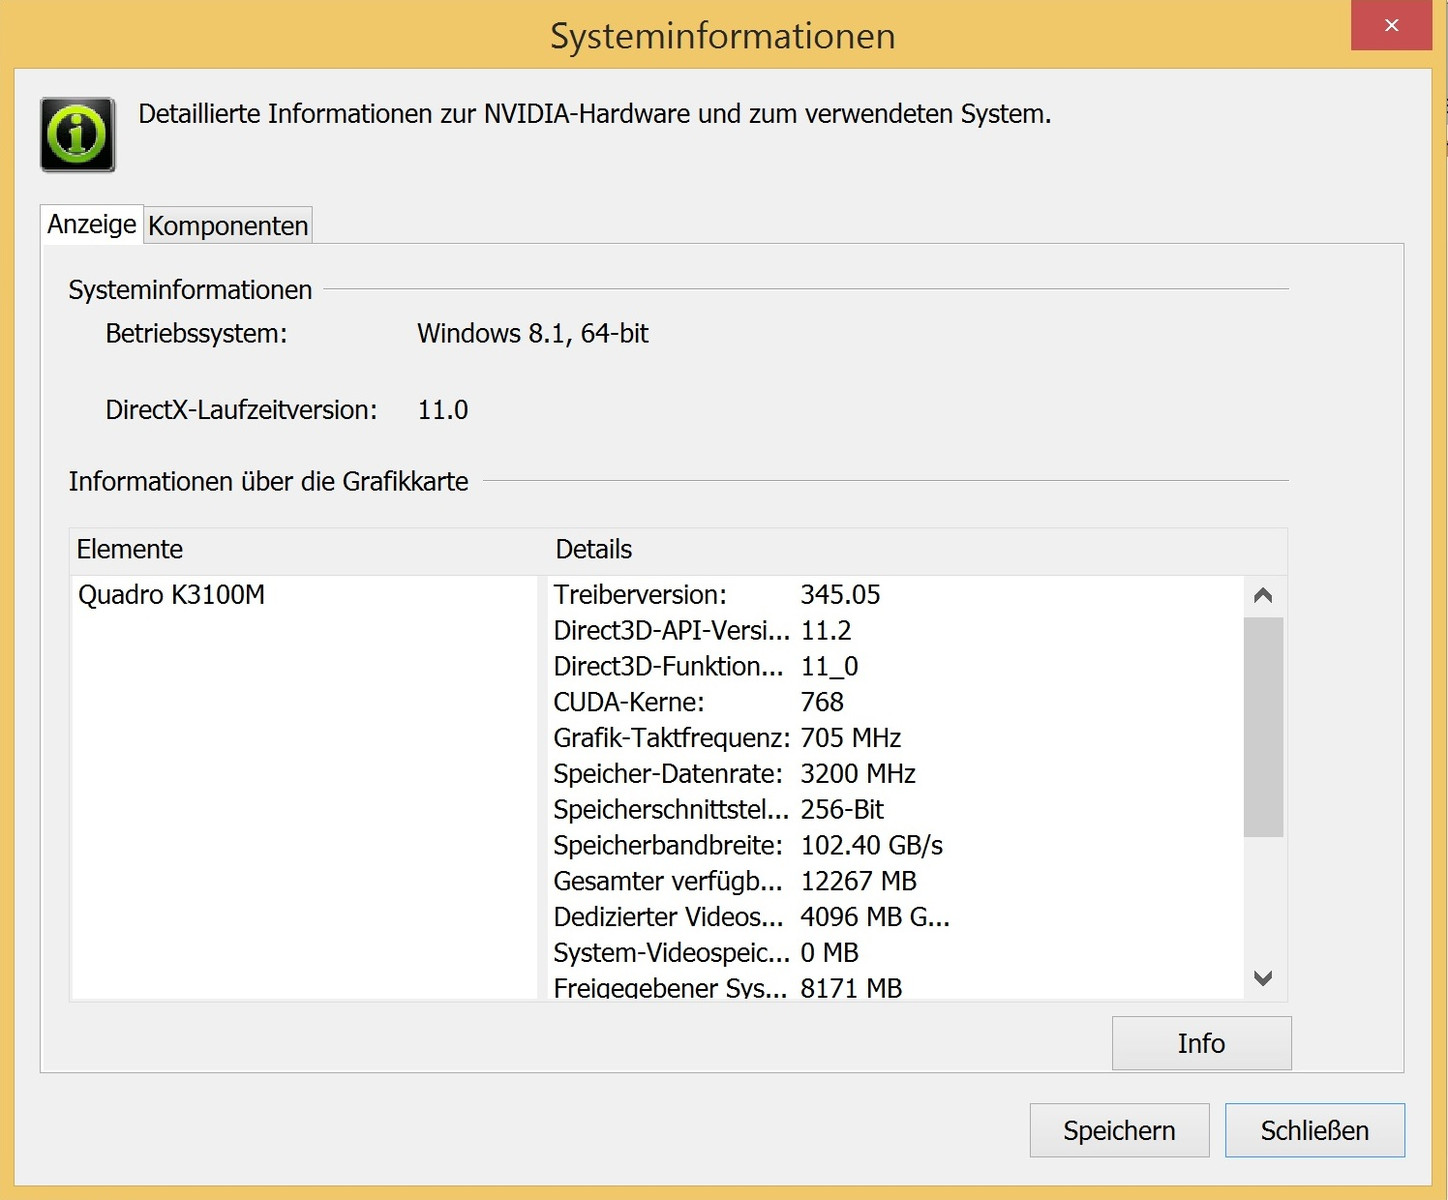
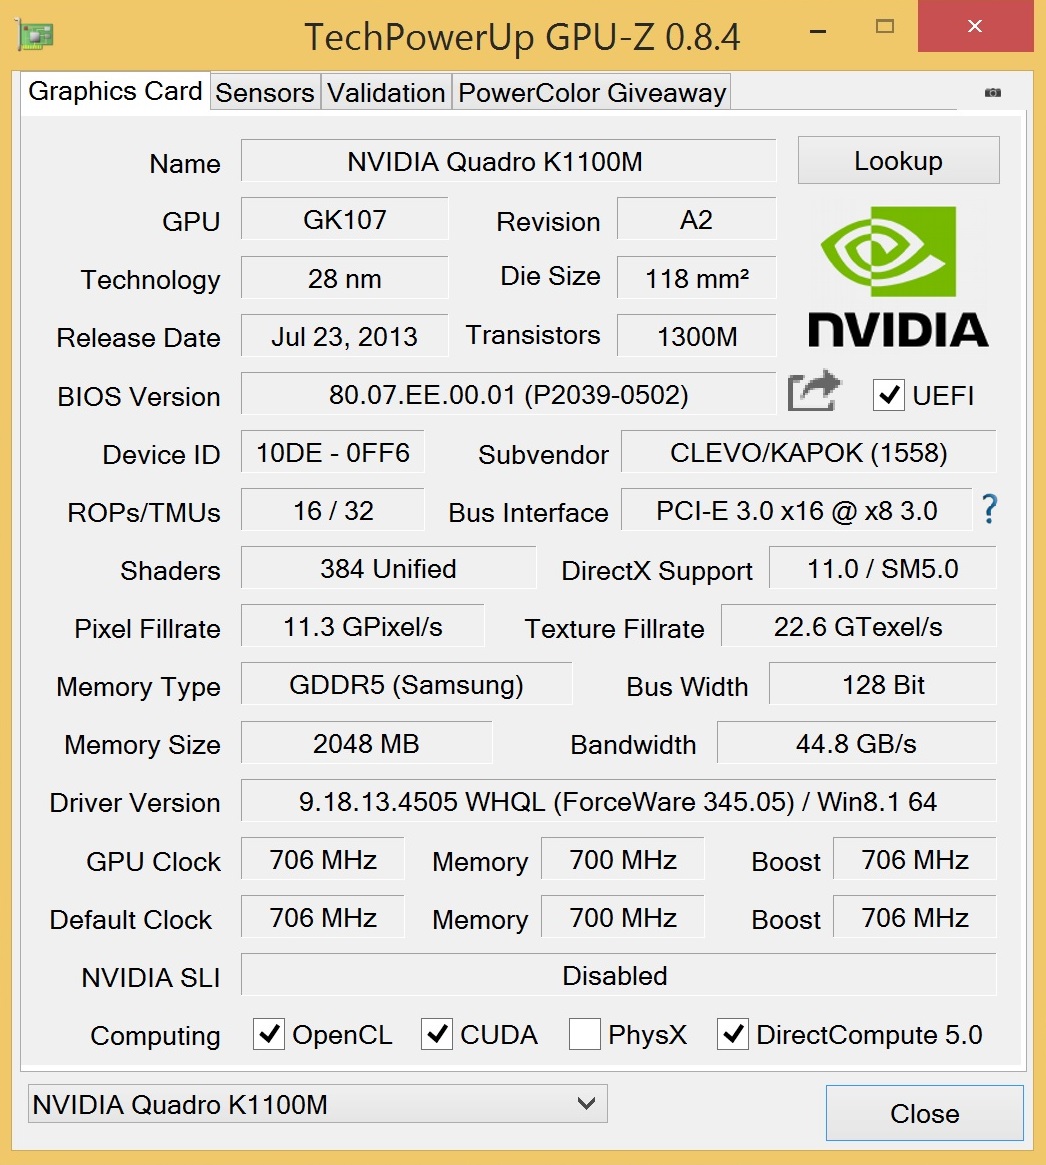

While the top model of the GeForce-series, the GTX 980M, runs at 1,038-1,127 MHz (core) and 2,500 MHz (memory), respectively, the Quadro K5100M only manages 771 and 1,800 MHz. The less expensive chips Quadro K3100M and K1100M mainly have a disadvantage in respect of the shader units. 768 and 384 CUDA cores (K5100M: 1,536) are not overwhelming in 2015. Especially the K1100M with 2 GB GDDR5 video memory and a small 128-bit memory interface falls behind, while the K3100M/K5100M at least have 256-bit interfaces.
| 3DMark 11 Performance | 6839 points | |
| 3DMark Ice Storm Standard Score | 105162 points | |
| 3DMark Cloud Gate Standard Score | 17381 points | |
| 3DMark Fire Strike Score | 4467 points | |
Help | ||
It is no surprise that the professional GPUs have a hard time in gaming-oriented benchmarks. The Quadro K5100M is only between the GeForce GTX 965M and GTX 960M in the current 3DMark Fire Strike test, for example. A GTX 970M is almost 50% faster, a GTX 980M even around 90%. The Quadro K3100M and Quadro K1100M follow at a big distance and are only in the lower high-end range.
| 3DMark | |
| 1920x1080 Fire Strike Score (sort by value) | |
| Schenker W505 | |
| Schenker W505 | |
| Schenker W505 | |
| Schenker XMG P505 PRO | |
| Gigabyte P55 V4 | |
| MSI GE62-2QEUi716H21BW | |
| Asus G501JW-CN168H | |
| 1920x1080 Fire Strike Graphics (sort by value) | |
| Schenker W505 | |
| Schenker W505 | |
| Schenker W505 | |
| Schenker XMG P505 PRO | |
| Gigabyte P55 V4 | |
| MSI GE62-2QEUi716H21BW | |
| Asus G501JW-CN168H | |
| 3DMark 11 | |
| 1280x720 Performance (sort by value) | |
| Schenker W505 | |
| Schenker W505 | |
| Schenker W505 | |
| Schenker XMG P505 PRO | |
| Gigabyte P55 V4 | |
| MSI GE62-2QEUi716H21BW | |
| Asus G501JW-CN168H | |
| 1280x720 Performance GPU (sort by value) | |
| Schenker W505 | |
| Schenker W505 | |
| Schenker W505 | |
| Schenker XMG P505 PRO | |
| Gigabyte P55 V4 | |
| MSI GE62-2QEUi716H21BW | |
| Asus G501JW-CN168H | |
Thanks to specially adjusted drivers, the professional GPUs have an advantage in other benchmarks. SPECviewperf 12, which tests multiple CAD and visualization applications (Catia, Maya, etc.), usually stutters with the majority of GeForce GPUs. The professional GPUs have a noticeable advantage, which is very big in the case of the Quadro K5100M in particular. Depending on the GPU, the four best workstations from our Top 10 ranking are between 20% (Quadro K4100M @MSI WT72) and 72% (Quadro K1100M @Fujitsu Celsius H730) slower. The AMD rivals are beaten as well: -58% for the FirePro M5100 of the HP ZBook 15 G2 and -64% for the FirePro W4170M inside the Dell Precision M2800. This makes it even more annoying that Nvidia hardly uses Maxwell for the professional GPUs so far. The Quadro K620M (Lenovo W550s) is one of the few exceptions.
| Schenker W505 Quadro K5100M | MSI WT72-2OL32SR311BW Quadro K4100M | HP ZBook 15 G2 FirePro M5100 | Dell Precision M2800 FirePro W4170M | Fujitsu Celsius H730 Quadro K1100M | |
|---|---|---|---|---|---|
| SPECviewperf 12 | -20% | -58% | -64% | -72% | |
| 1900x1060 Catia (catia-04) (fps) | 62.3 | 48 -23% | 23.62 -62% | 19.33 -69% | 16.6 -73% |
| 1900x1060 Creo (creo-01) (fps) | 48.29 | 38 -21% | 19.64 -59% | 18.8 -61% | 16.2 -66% |
| 1900x1060 Energy (energy-01) (fps) | 2.58 | 2.12 -18% | 0.44 -83% | 0.35 -86% | 0.33 -87% |
| 1900x1060 Maya (maya-04) (fps) | 47.94 | 39 -19% | 24.92 -48% | 22.75 -53% | 14.2 -70% |
| 1900x1060 Medical (medical-01) (fps) | 22.66 | 14 -38% | 7.82 -65% | 5.84 -74% | 4.9 -78% |
| 1900x1060 Showcase (showcase-01) (fps) | 27.73 | 23 -17% | 16.36 -41% | 12.75 -54% | 9.1 -67% |
| 1900x1060 Siemens NX (snx-02) (fps) | 56.9 | 45 -21% | 29.69 -48% | 23.52 -59% | 15.5 -73% |
| 1900x1060 Solidworks (sw-03) (fps) | 87 | 83 -5% | 39.72 -54% | 37.52 -57% | 32.9 -62% |
Gaming Performance
We already mentioned that the Quadros are not designed for gaming. Despite the fact that there are hardly any bigger bugs (good driver support from Nvidia), the results of the Quadros are not very good in the gaming benchmarks. The performance of the Quadro K5100M is similar to a GTX 870M (also still Kepler), while a Quadro K3100M is around 40% slower and the Quadro K1100M around 70% slower than the K5100M. You can, however, ignore this drawback when you only use professional applications.
| Batman: Arkham Knight | |
| 1920x1080 High / On AA:SM AF:16x (sort by value) | |
| Schenker W505 | |
| Schenker W505 | |
| Schenker W505 | |
| Schenker W504 | |
| Schenker W504 | |
| Schenker W504 | |
| Schenker W504 | |
| Schenker XMG A505 | |
| 1920x1080 High / On (Interactive Smoke & Paper Debris Off) AA:SM AF:8x (sort by value) | |
| Schenker W505 | |
| Schenker W505 | |
| Schenker W505 | |
| Schenker W504 | |
| Schenker W504 | |
| Schenker W504 | |
| Schenker W504 | |
| Schenker XMG A505 | |
| The Witcher 3 | |
| 1920x1080 Ultra Graphics & Postprocessing (HBAO+) (sort by value) | |
| Schenker W505 | |
| Schenker W505 | |
| Schenker W505 | |
| Schenker W504 | |
| Schenker W504 | |
| Schenker W504 | |
| Schenker W504 | |
| Schenker XMG A505 | |
| 1920x1080 High Graphics & Postprocessing (Nvidia HairWorks Off) (sort by value) | |
| Schenker W505 | |
| Schenker W505 | |
| Schenker W505 | |
| Schenker W504 | |
| Schenker W504 | |
| Schenker W504 | |
| Schenker W504 | |
| Schenker XMG A505 | |
| Dirt Rally | |
| 1920x1080 Ultra Preset AA:4x MS (sort by value) | |
| Schenker W505 | |
| Schenker W505 | |
| Schenker W504 | |
| Schenker W504 | |
| Schenker W504 | |
| Schenker W504 | |
| Schenker XMG A505 | |
| 1920x1080 High Preset (sort by value) | |
| Schenker W505 | |
| Schenker W505 | |
| Schenker W504 | |
| Schenker W504 | |
| Schenker W504 | |
| Schenker W504 | |
| Schenker XMG A505 | |
| Battlefield Hardline | |
| 1920x1080 Ultra Graphics Quality (DX11) AA:4x MS (sort by value) | |
| Schenker W505 | |
| Schenker W505 | |
| Schenker W505 | |
| Schenker W504 | |
| Schenker W504 | |
| Schenker W504 | |
| Schenker W504 | |
| 1920x1080 High Graphics Quality (DX11) (sort by value) | |
| Schenker W505 | |
| Schenker W505 | |
| Schenker W505 | |
| Schenker W504 | |
| Schenker W504 | |
| Schenker W504 | |
| Schenker W504 | |
| Evolve | |
| 1920x1080 Very High Graphics Quality AA:1TX SM (sort by value) | |
| Schenker W505 | |
| Schenker W505 | |
| Schenker W505 | |
| Schenker W504 | |
| Schenker W504 | |
| Schenker W504 | |
| Schenker W504 | |
| Schenker XMG A505 | |
| 1920x1080 High Graphics Quality AA:FX (sort by value) | |
| Schenker W505 | |
| Schenker W505 | |
| Schenker W505 | |
| Schenker W504 | |
| Schenker W504 | |
| Schenker W504 | |
| Schenker W504 | |
| Schenker XMG A505 | |
| Dragon Age: Inquisition | |
| 1920x1080 Ultra Graphics Quality AA:2x MS (sort by value) | |
| Schenker W505 | |
| Schenker W505 | |
| Schenker W505 | |
| Schenker XMG P505 PRO | |
| Alienware 15 | |
| Schenker W504 | |
| Schenker W504 | |
| Schenker XMG A505 | |
| 1920x1080 High Graphics Quality (sort by value) | |
| Schenker W505 | |
| Schenker W505 | |
| Schenker W505 | |
| Schenker XMG P505 PRO | |
| Alienware 15 | |
| Schenker W504 | |
| Schenker W504 | |
| Schenker XMG A505 | |
| Far Cry 4 | |
| 1920x1080 Ultra Graphics Quality AA:SM (sort by value) | |
| Schenker W505 | |
| Schenker W505 | |
| Schenker W505 | |
| Schenker XMG P505 PRO | |
| Alienware 15 | |
| Schenker W504 | |
| Schenker W504 | |
| Schenker XMG A505 | |
| 1920x1080 High Graphics Quality AA:SM (sort by value) | |
| Schenker W505 | |
| Schenker W505 | |
| Schenker W505 | |
| Schenker XMG P505 PRO | |
| Alienware 15 | |
| Schenker W504 | |
| Schenker W504 | |
| Schenker XMG A505 | |
| Assassin's Creed Unity | |
| 1920x1080 Ultra High Graphics Quality AA:4x MS (sort by value) | |
| Schenker W505 | |
| Schenker W505 | |
| Schenker W505 | |
| Schenker XMG P505 PRO | |
| Alienware 15 | |
| Schenker W504 | |
| Schenker W504 | |
| Schenker XMG A505 | |
| 1920x1080 High Graphics Quality AA:2x MS (sort by value) | |
| Schenker W505 | |
| Schenker W505 | |
| Schenker W505 | |
| Alienware 15 | |
| Schenker W504 | |
| Schenker W504 | |
| Schenker XMG A505 | |
| Call of Duty: Advanced Warfare | |
| 1920x1080 Extra / On (Cache Shadow Maps Off), 2x Supersampling AA:2x SM (sort by value) | |
| Schenker W505 | |
| Schenker W505 | |
| Schenker W505 | |
| Schenker XMG P505 PRO | |
| Alienware 15 | |
| Schenker W504 | |
| Schenker W504 | |
| Schenker XMG A505 | |
| 1920x1080 High / On (Cache Shadow Maps Off) AA:FX (sort by value) | |
| Schenker W505 | |
| Schenker W505 | |
| Schenker W505 | |
| Schenker XMG P505 PRO | |
| Alienware 15 | |
| Schenker W504 | |
| Schenker W504 | |
| Schenker XMG A505 | |
| F1 2014 | |
| 1920x1080 Ultra Preset AA:4x MS (sort by value) | |
| Schenker W505 | |
| Schenker W505 | |
| MSI GT72-2QE32SR311BW | |
| Schenker W504 | |
| Schenker W504 | |
| Schenker XMG A505 | |
| 1920x1080 High Preset (sort by value) | |
| Schenker W505 | |
| Schenker W505 | |
| MSI GT72-2QE32SR311BW | |
| Schenker W504 | |
| Schenker W504 | |
| Schenker XMG A505 | |
| Ryse: Son of Rome | |
| 1920x1080 Very High Texture Res. + High Graphics Quality (Motion Blur & Temporal AA On, Rest Off/Disabled) AF:8x (sort by value) | |
| Schenker W505 | |
| Schenker W505 | |
| Schenker W505 | |
| MSI GT72-2QE32SR311BW | |
| Alienware 15 | |
| Schenker XMG P505 | |
| Schenker W504 | |
| Schenker W504 | |
| Schenker XMG A505 | |
| 1920x1080 High Texture Res. + High Graphics Quality (Rest Off/Disabled) AF:8x (sort by value) | |
| Schenker W505 | |
| Schenker W505 | |
| Schenker W505 | |
| MSI GT72-2QE32SR311BW | |
| Alienware 15 | |
| Schenker XMG P505 | |
| Schenker W504 | |
| Schenker W504 | |
| Schenker XMG A505 | |
| Alien: Isolation | |
| 1920x1080 Ultra, On, Shadow Map 2048, HDAO AA:2x SM AF:16x (sort by value) | |
| Schenker W505 | |
| Schenker W505 | |
| Schenker W505 | |
| MSI GT72-2QE32SR311BW | |
| Schenker XMG P505 | |
| Schenker W504 | |
| Schenker W504 | |
| Schenker XMG A505 | |
| 1920x1080 High, On, Shadow Map 1536, Standard SSAO AA:FX AF:8x (sort by value) | |
| Schenker W505 | |
| Schenker W505 | |
| Schenker W505 | |
| MSI GT72-2QE32SR311BW | |
| Schenker XMG P505 | |
| Schenker W504 | |
| Schenker W504 | |
| Schenker XMG A505 | |
| Middle-earth: Shadow of Mordor | |
| 1920x1080 Ultra Preset (HD Package) (sort by value) | |
| Schenker W505 | |
| Schenker W505 | |
| Schenker W505 | |
| Schenker XMG P505 PRO | |
| MSI GT72-2QE32SR311BW | |
| Schenker XMG P505 | |
| Schenker W504 | |
| Schenker W504 | |
| Schenker XMG A505 | |
| 1920x1080 High Preset (sort by value) | |
| Schenker W505 | |
| Schenker W505 | |
| Schenker W505 | |
| Schenker XMG P505 PRO | |
| MSI GT72-2QE32SR311BW | |
| Schenker XMG P505 | |
| Schenker W504 | |
| Schenker W504 | |
| Schenker XMG A505 | |
| Fifa 15 - 1920x1080 High Preset AA:4x MS (sort by value) | |
| Schenker W505 | |
| Schenker W505 | |
| Schenker W505 | |
| MSI GT72-2QE32SR311BW | |
| Schenker XMG P505 | |
| Schenker W504 | |
| Schenker W504 | |
| Schenker XMG A505 | |
| Sims 4 | |
| 1920x1080 Ultra Preset (sort by value) | |
| Schenker W505 | |
| Schenker W505 | |
| Schenker W505 | |
| MSI GT72-2QE32SR311BW | |
| Alienware 15 | |
| Schenker XMG P505 | |
| Schenker W504 | |
| Schenker W504 | |
| Schenker XMG A505 | |
| 1920x1080 High Preset (sort by value) | |
| Schenker W505 | |
| Schenker W505 | |
| Schenker W505 | |
| MSI GT72-2QE32SR311BW | |
| Alienware 15 | |
| Schenker XMG P505 | |
| Schenker W504 | |
| Schenker W504 | |
| Schenker XMG A505 | |
| GRID: Autosport | |
| 1920x1080 Ultra Preset AA:4x MS (sort by value) | |
| Schenker W505 | |
| Schenker W505 | |
| MSI GT72-2QE32SR311BW | |
| Alienware 15 | |
| Schenker XMG P505 | |
| Schenker W504 | |
| Schenker W504 | |
| Schenker XMG A505 | |
| 1920x1080 High Preset (sort by value) | |
| Schenker W505 | |
| Schenker W505 | |
| MSI GT72-2QE32SR311BW | |
| Alienware 15 | |
| Schenker XMG P505 | |
| Schenker W504 | |
| Schenker W504 | |
| Schenker XMG A505 | |
| Watch Dogs | |
| 1920x1080 Ultra Overall Quality, Ultra Textures AA:4x MS (sort by value) | |
| Schenker W505 | |
| Schenker W505 | |
| Schenker W505 | |
| MSI GT72-2QE32SR311BW | |
| Alienware 15 | |
| Schenker XMG P505 | |
| Schenker W504 | |
| Schenker W504 | |
| Schenker XMG A505 | |
| 1920x1080 High Overall Quality, High Textures AA:2x MS (sort by value) | |
| Schenker W505 | |
| Schenker W505 | |
| Schenker W505 | |
| MSI GT72-2QE32SR311BW | |
| Alienware 15 | |
| Schenker XMG P505 | |
| Schenker W504 | |
| Schenker W504 | |
| Schenker XMG A505 | |
| Crysis 3 - 1920x1080 Very High Preset AA:2xSM AF:16x (sort by value) | |
| Schenker W505 | |
| Schenker W505 | |
| Schenker W505 | |
| MSI GT72-2QE32SR311BW | |
| Schenker XMG P505 | |
| Schenker XMG A505 | |
| low | med. | high | ultra | 4K | |
|---|---|---|---|---|---|
| Crysis 3 (2013) | 136.1 | 92.1 | 63.4 | 25.8 | |
| Battlefield 4 (2013) | 19.8 | ||||
| Watch Dogs (2014) | 111.3 | 84.9 | 35.3 | 25.8 | |
| GRID: Autosport (2014) | 319.7 | 176.3 | 119.4 | 58.8 | |
| Sims 4 (2014) | 180 | 132.6 | 96.3 | 77.9 | |
| Fifa 15 (2014) | 299.7 | 213.2 | 153 | 77.4 | |
| Middle-earth: Shadow of Mordor (2014) | 125.9 | 84.2 | 45.7 | 35.8 | |
| Alien: Isolation (2014) | 205.1 | 143.4 | 79.8 | 54.8 | |
| Ryse: Son of Rome (2014) | 80.8 | 64.7 | 33.7 | 31.7 | |
| F1 2014 (2014) | 120 | 119 | 119 | 108 | |
| Call of Duty: Advanced Warfare (2014) | 112.8 | 75.9 | 46.9 | 28.3 | |
| Assassin's Creed Unity (2014) | 58.1 | 42.6 | 28.8 | 16.2 | |
| Far Cry 4 (2014) | 112.4 | 89.4 | 40.4 | 31 | |
| Dragon Age: Inquisition (2014) | 143.4 | 103.5 | 37.5 | 25.9 | |
| Evolve (2015) | 103.2 | 79.1 | 43.4 | 38.1 | |
| Battlefield Hardline (2015) | 184.5 | 145.5 | 58.9 | 37.7 | |
| Dirt Rally (2015) | 401.9 | 147.4 | 81.5 | 39 | 32.3 |
| The Witcher 3 (2015) | 70.8 | 44 | 25 | 13.5 | 9.6 |
| Batman: Arkham Knight (2015) | 65 | 54 | 33 | 23 | 11 |
Emissions
All the following measurements were performed with the Quadro K5100M.
System Noise
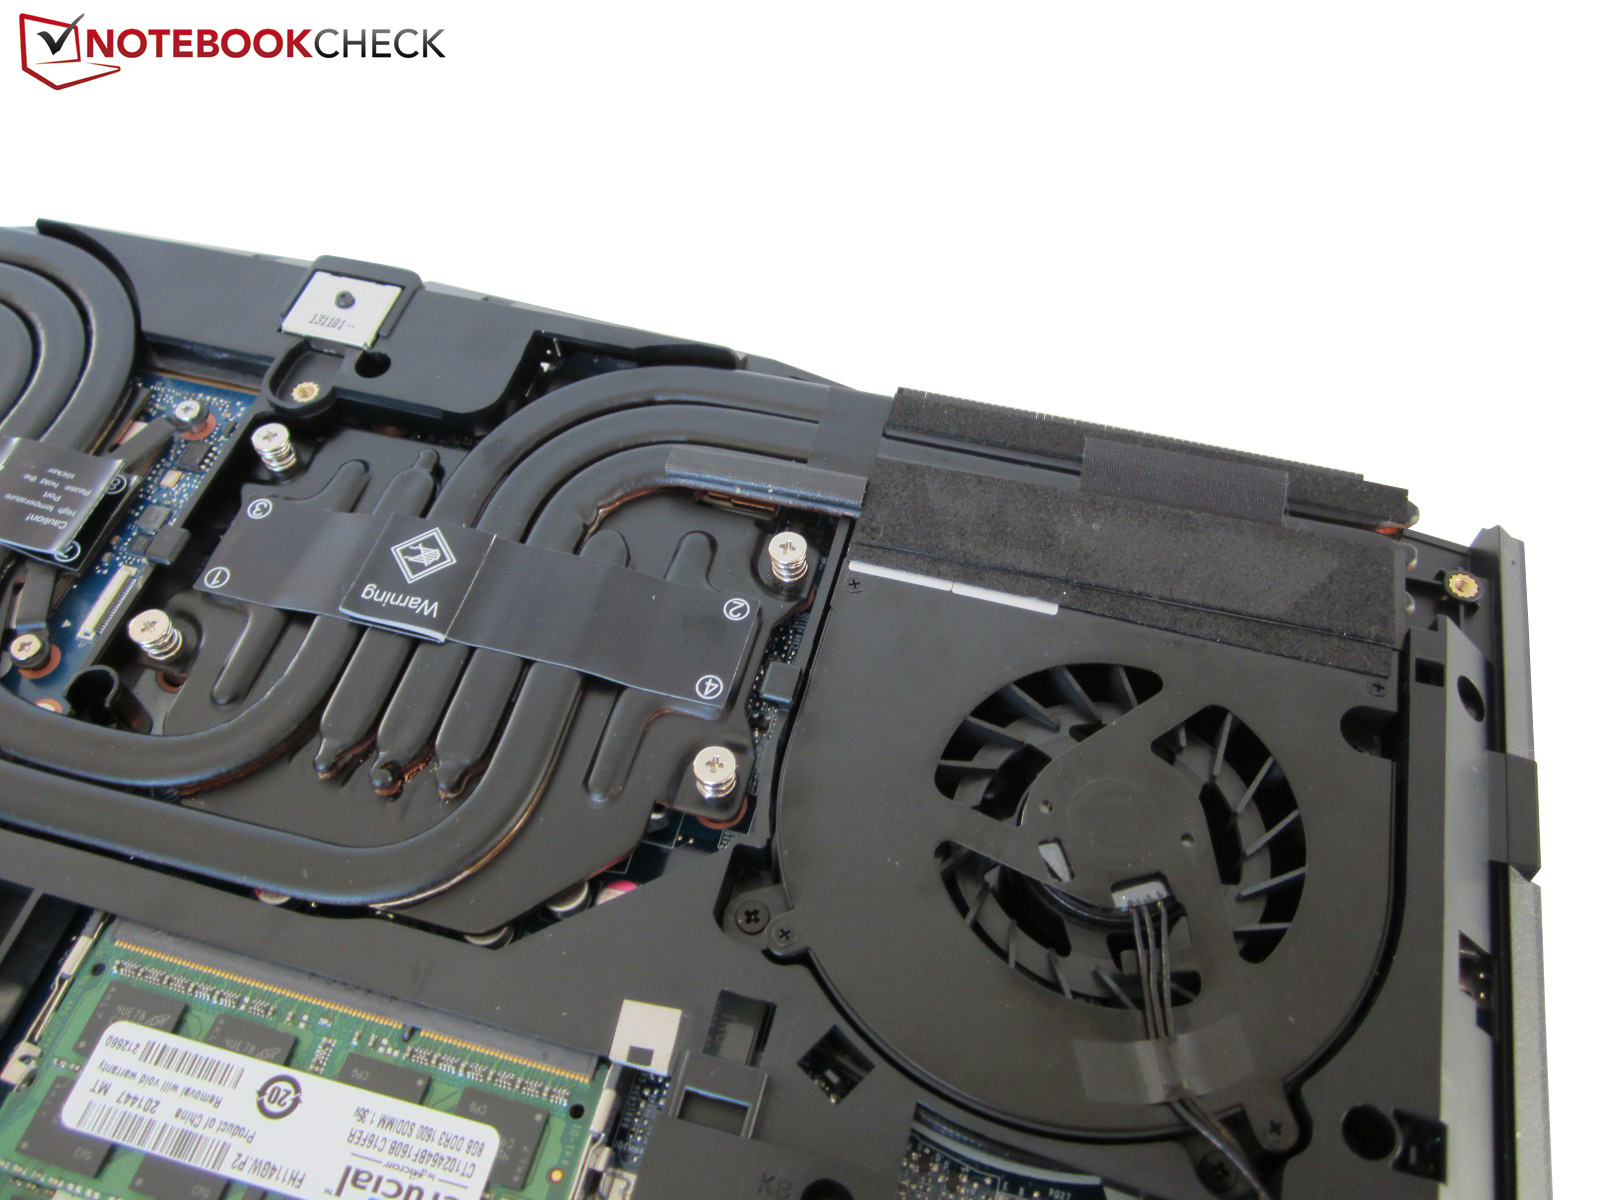
Despite the lower gaming performance, the P751ZM chassis is louder with the Quadro K5100M compared to the GeForce GTX 970M. We can measure 43.3 dB(A) on average for the Schenker W505 in 3DMark06, whereas the XMG U505 only reaches 42 dB(A). Both values are clearly audible but not really annoying yet. The dual-fan system only gets really loud under maximum load, where our measurement device indicated 48.4 instead of 45.2 dB(A). Not perfect: After longer periods of load, the cooling solution needs quite a while to turn the fan speed down again. The W505 leaves a mixed impression while idling. Calm periods, where the fans are very restrained (~30 dB(A)), are sometimes interrupted by unnecessary pulsating (more than 35 dB(A)).
Noise level
| Idle |
| 29.8 / 33.6 / 36 dB(A) |
| HDD |
| 32.2 dB(A) |
| Load |
| 43.4 / 48.4 dB(A) |
 | ||
30 dB silent 40 dB(A) audible 50 dB(A) loud |
||
min: | ||
| Schenker W505 Quadro K5100M, E3-1231 v3 | MSI WT72-2OL32SR311BW Quadro K4100M, 4980HQ | HP ZBook 15 G2 FirePro M5100, 4910MQ | Dell Precision M2800 FirePro W4170M, 4810MQ | Fujitsu Celsius H730 Quadro K1100M, 4710MQ | |
|---|---|---|---|---|---|
| Noise | 6% | 10% | 13% | 10% | |
| Idle Minimum * (dB) | 29.8 | 33.2 -11% | 30.6 -3% | 28 6% | 27 9% |
| Idle Average * (dB) | 33.6 | 33.2 1% | 30.6 9% | 28 17% | 27 20% |
| Idle Maximum * (dB) | 36 | 33.2 8% | 30.6 15% | 28 22% | 27 25% |
| Load Average * (dB) | 43.4 | 38.6 11% | 35.7 18% | 39.8 8% | 44.9 -3% |
| Load Maximum * (dB) | 48.4 | 38.6 20% | 43.2 11% | 43.2 11% | 48.4 -0% |
* ... smaller is better
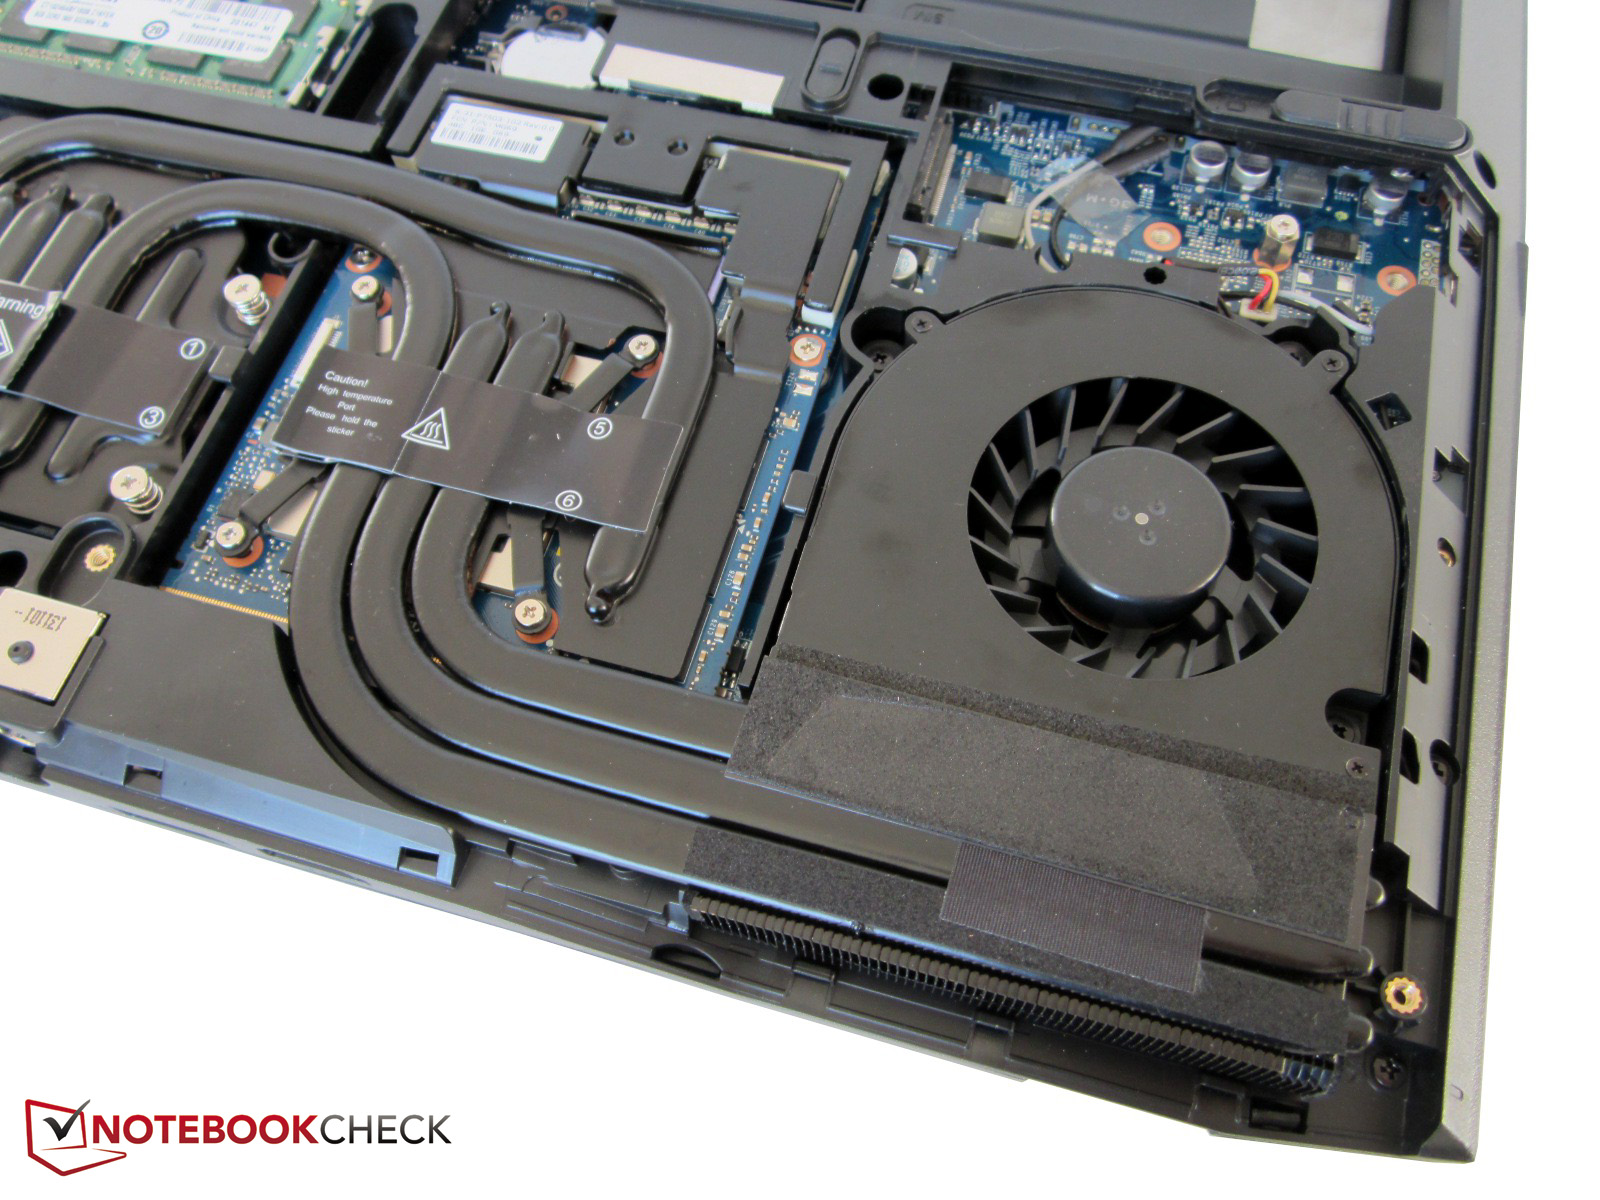
Temperature
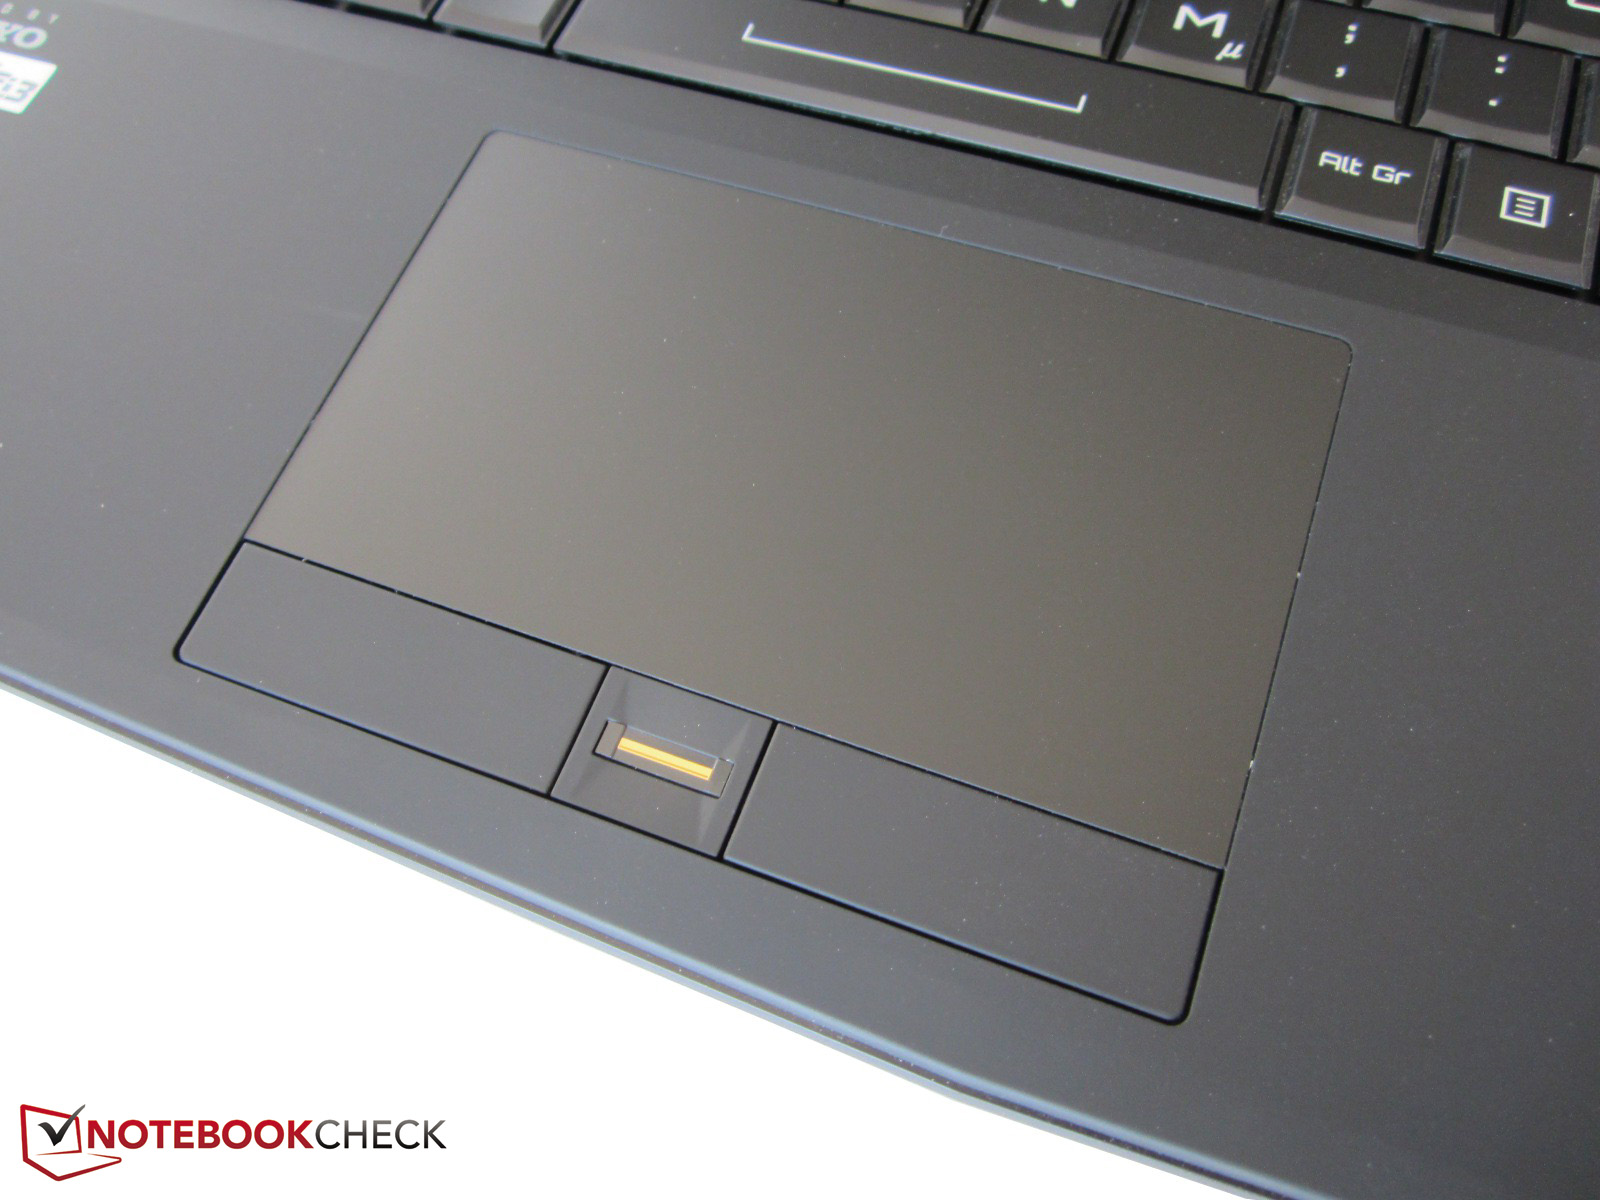
Our measurements of the Schenker W505 were performed on a very sultry summer day, so the temperatures cannot be directly compared to the workstation competition. The 15-inch device already gets pretty warm while idling, not least due to the missing Optimus technology. Both the top as well as the bottom surpassed 40 °C after our two-hour idle test. Almost all the other notebooks stay below 35 °C (see table). The stress test with the tools FurMark and Prime even resulted in a maximum value of 55.5 °C, which is at least concentrated to the rear of the notebook and not the palm rest. The latter warmed up to 43 °C after 60 minutes of maximum load.
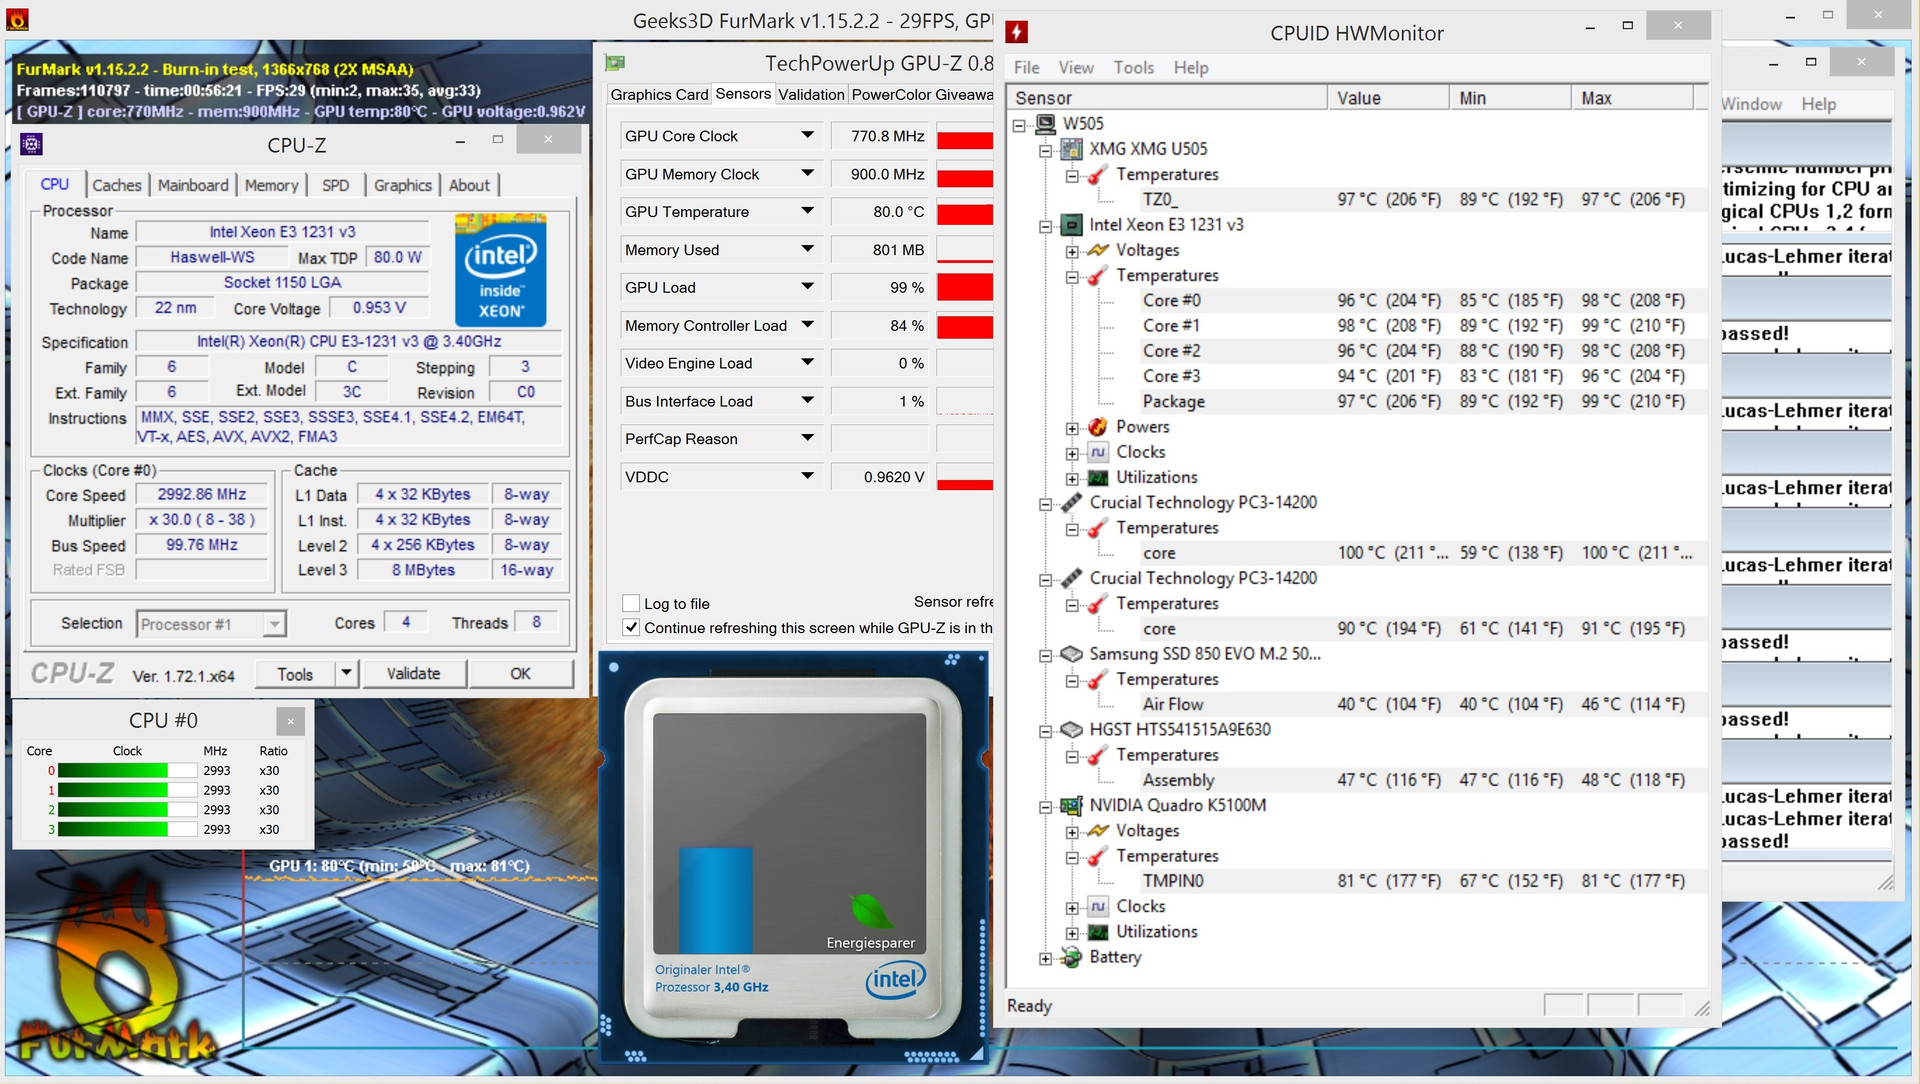
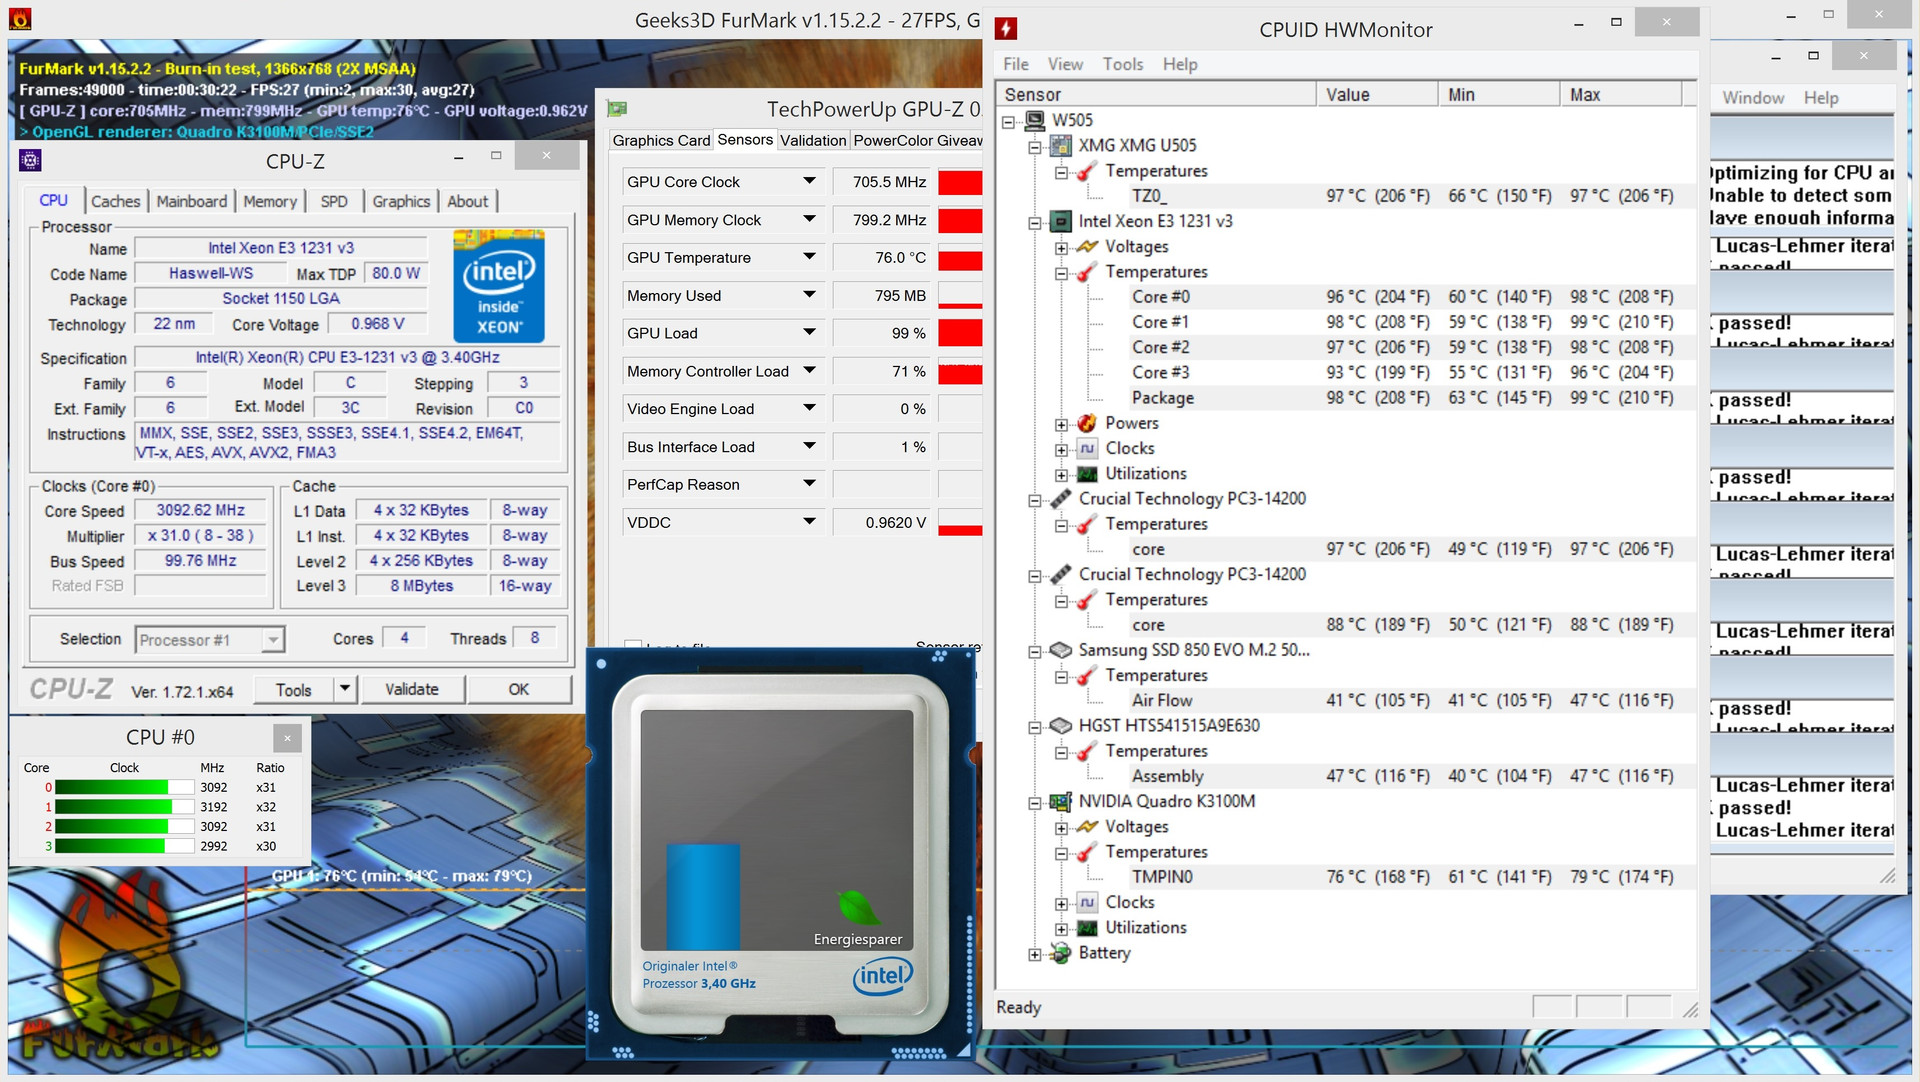
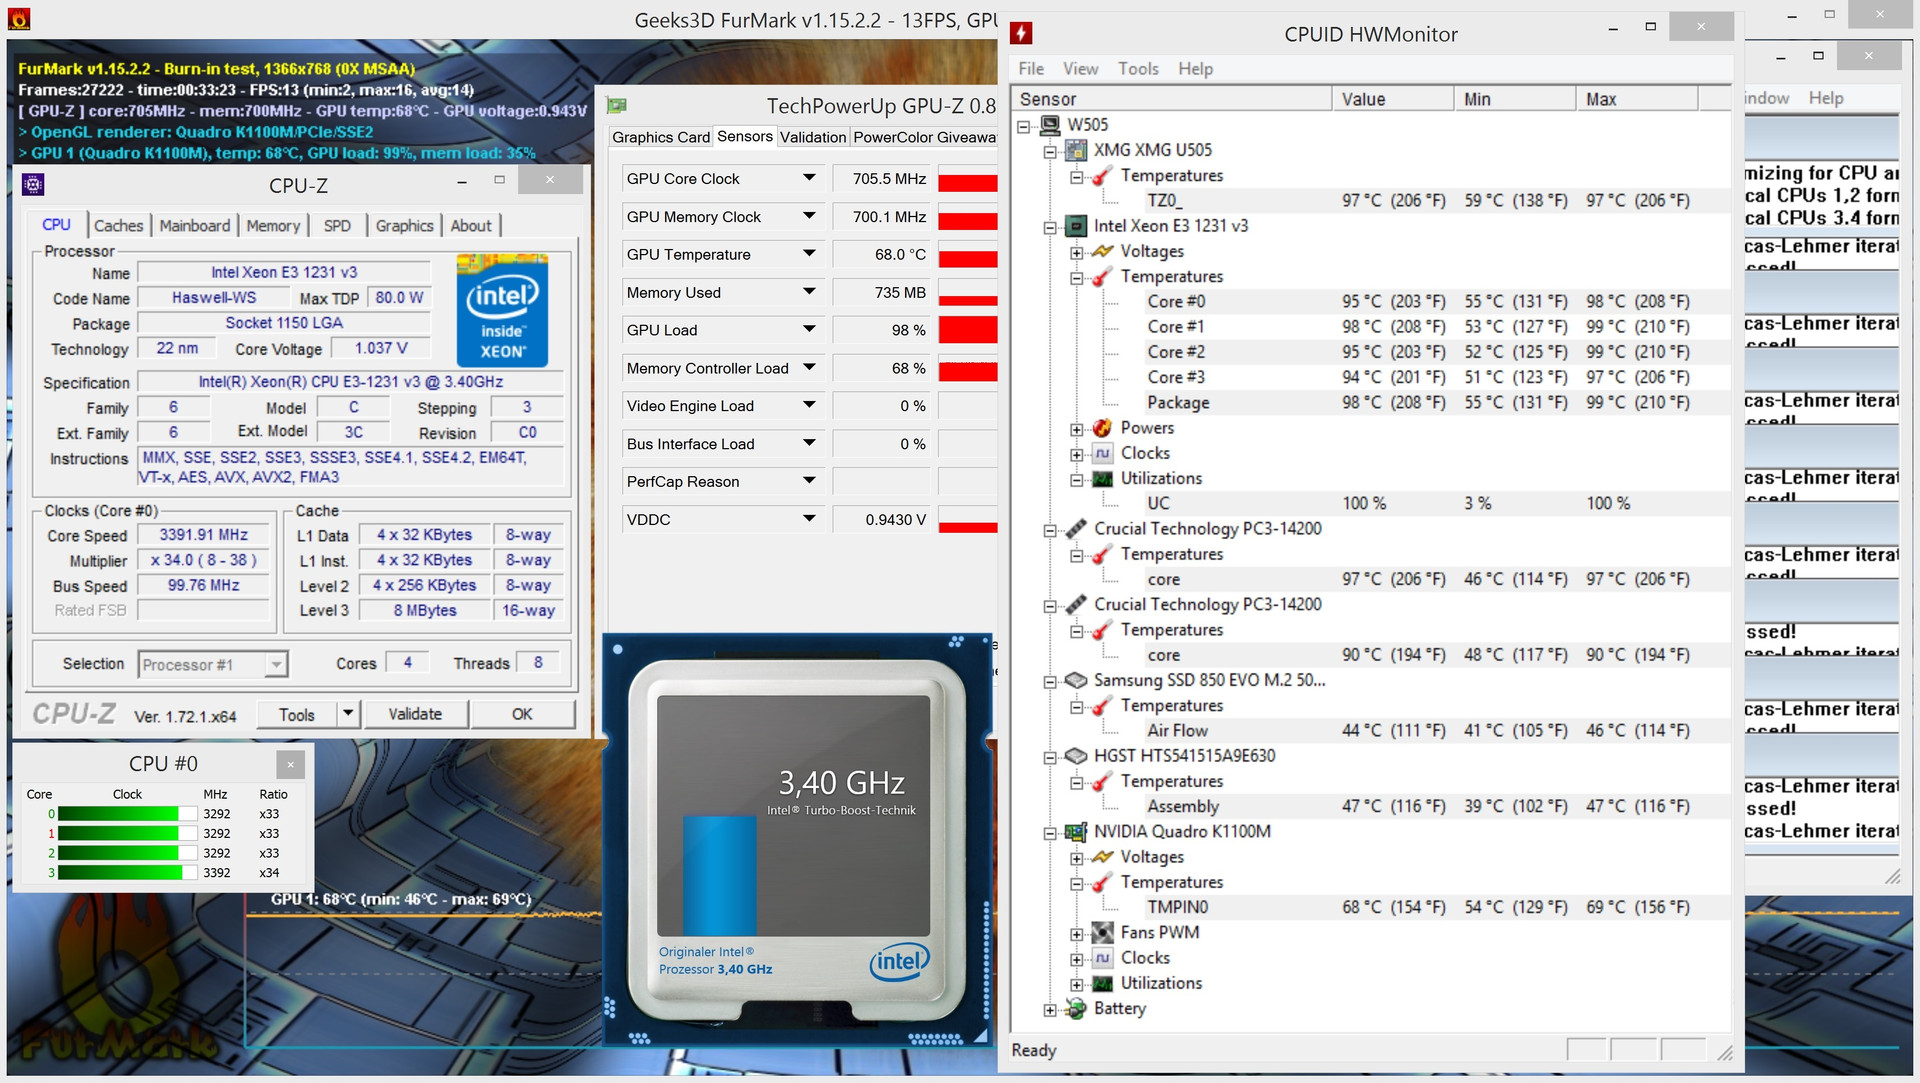
There is also criticism for the components. According to HWMonitor and the benchmark tool HD Tune, the hard drives reach around 60 °C while idling (the temperatures are lower under load due to higher fan activity). Up to 100 °C for the processor and the memory, which we could measure independent of the graphics card, is also very high. It is therefore not surprising that the processor deactivates its Turbo after a while under maximum load and slightly throttles – it does not matter if the device uses the K5100M, K3100M or K1100M. The graphics chips are, fortunately, not quite as hot. Even the K5100M only reached a maximum temperature of 81 °C.
(-) The maximum temperature on the upper side is 55.5 °C / 132 F, compared to the average of 38.2 °C / 101 F, ranging from 22.2 to 69.8 °C for the class Workstation.
(-) The bottom heats up to a maximum of 55.2 °C / 131 F, compared to the average of 41.1 °C / 106 F
(-) In idle usage, the average temperature for the upper side is 39.8 °C / 104 F, compared to the device average of 32 °C / 90 F.
(-) The palmrests and touchpad can get very hot to the touch with a maximum of 43.3 °C / 109.9 F.
(-) The average temperature of the palmrest area of similar devices was 27.8 °C / 82 F (-15.5 °C / -27.9 F).
| Schenker W505 Quadro K5100M, E3-1231 v3 | MSI WT72-2OL32SR311BW Quadro K4100M, 4980HQ | HP ZBook 15 G2 FirePro M5100, 4910MQ | Dell Precision M2800 FirePro W4170M, 4810MQ | Fujitsu Celsius H730 Quadro K1100M, 4710MQ | |
|---|---|---|---|---|---|
| Heat | 32% | 22% | 14% | 24% | |
| Maximum Upper Side * (°C) | 55.5 | 36.9 34% | 44.1 21% | 43.3 22% | 31.2 44% |
| Maximum Bottom * (°C) | 55.2 | 37.7 32% | 45.7 17% | 59.3 -7% | 43.2 22% |
| Idle Upper Side * (°C) | 42.8 | 28.9 32% | 29.6 31% | 31 28% | 33.7 21% |
| Idle Bottom * (°C) | 40.3 | 28.6 29% | 32.2 20% | 35.4 12% | 37 8% |
* ... smaller is better
Speakers
The sound quality is pleasantly good. More information about the 2.0 system is available in the review of the XMG U505.
Energy Management
Power Consumption
The 4K display, the desktop processor and the luxury GPU have a very big impact on the power consumption. While the rivals often use less than 20 Watts while idling, the review configuration of the Schenker W505 consumes at least 36-47 Watts. The situation is similar in 3D scenarios: 127 Watts on average in the first scene of 3DMark06 and up to 236 Watts in the stress test remind us of the values that we measured for the 17-inch barebone sibling P771ZM (One K73-5N).
| Off / Standby | |
| Idle | |
| Load |
|
Key:
min: | |
| Schenker W505 Quadro K5100M, E3-1231 v3 | MSI WT72-2OL32SR311BW Quadro K4100M, 4980HQ | HP ZBook 15 G2 FirePro M5100, 4910MQ | Dell Precision M2800 FirePro W4170M, 4810MQ | Fujitsu Celsius H730 Quadro K1100M, 4710MQ | |
|---|---|---|---|---|---|
| Power Consumption | 29% | 46% | 60% | 57% | |
| Idle Minimum * (Watt) | 36 | 19.5 46% | 17.1 52% | 7.8 78% | 13.5 62% |
| Idle Average * (Watt) | 41.2 | 24.8 40% | 21.9 47% | 9.9 76% | 16.7 59% |
| Idle Maximum * (Watt) | 47.4 | 34.3 28% | 23.2 51% | 10.5 78% | 17.9 62% |
| Load Average * (Watt) | 126.6 | 134.7 -6% | 86.6 32% | 101.8 20% | 65.5 48% |
| Load Maximum * (Watt) | 235.8 | 142.7 39% | 120.7 49% | 125.4 47% | 103.9 56% |
* ... smaller is better
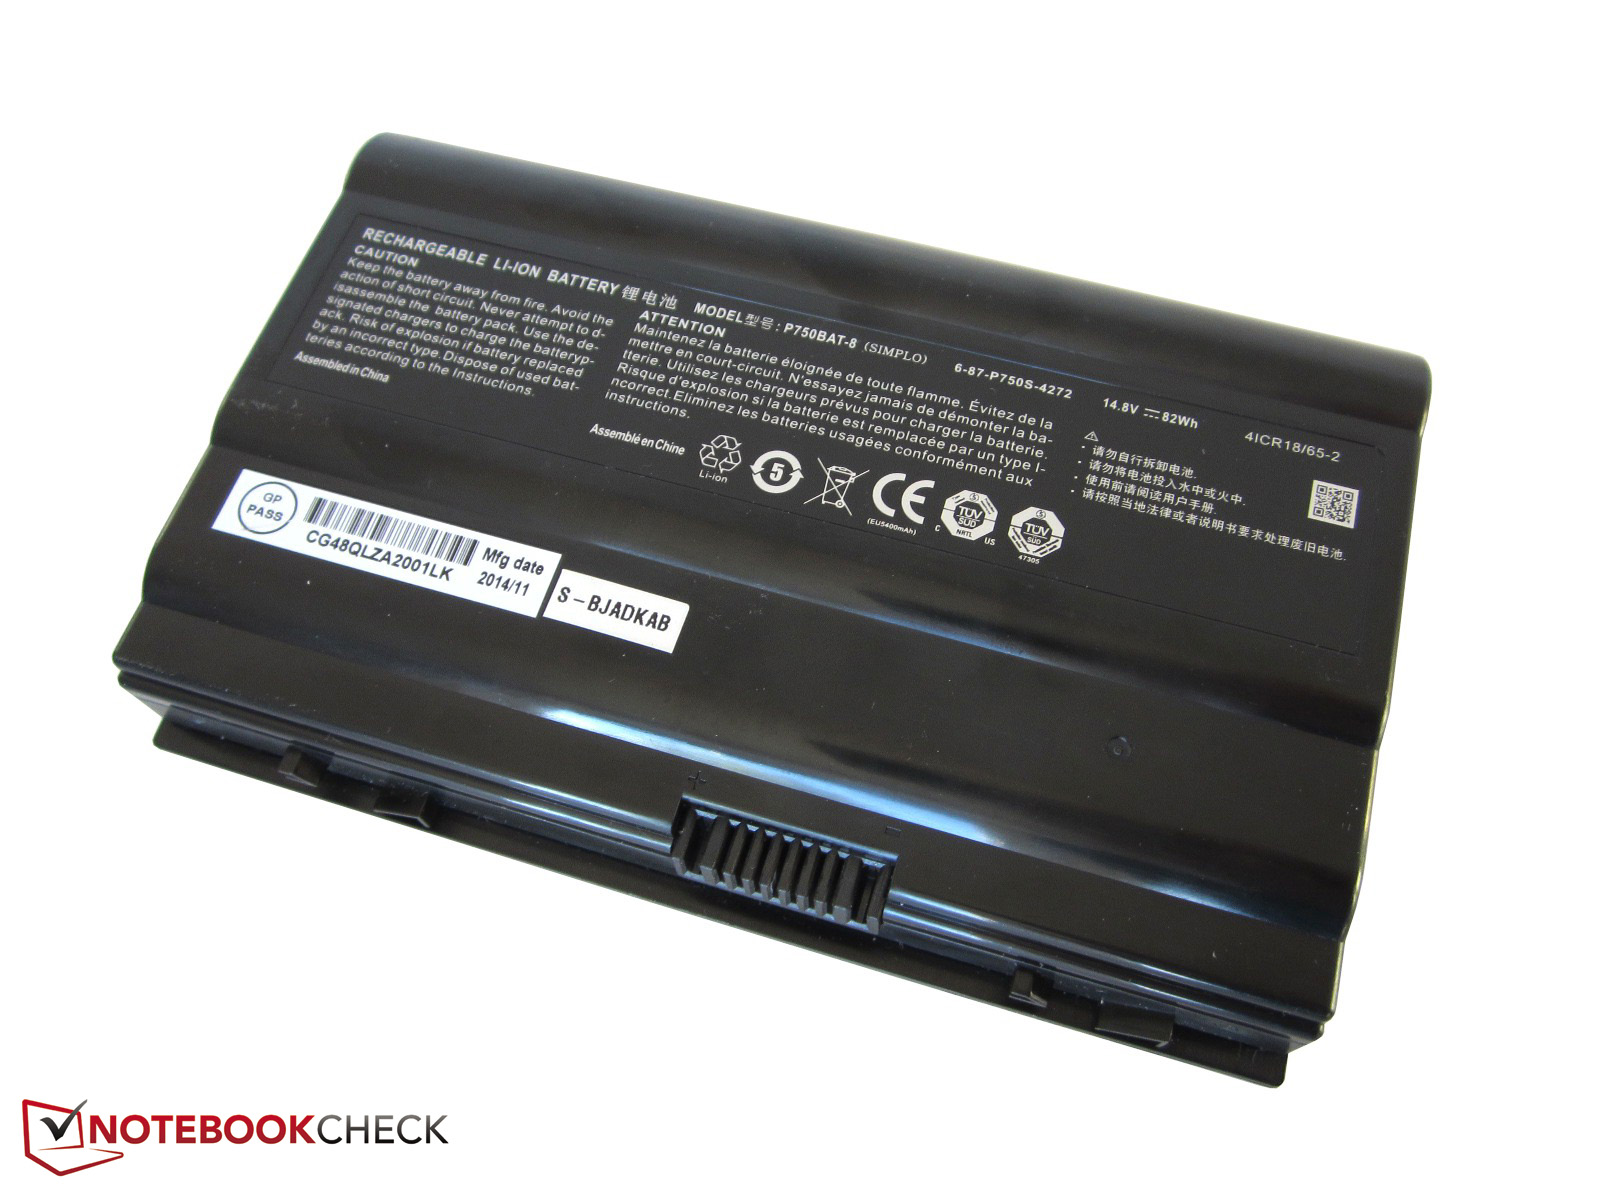
Battery Runtime
Replaceable 8-cell battery or not: No high-end notebook manages longer runtimes without switchable graphics. The Dell Precision M2800 (11.5 hours) can only last about 2.5 hours. The MSI WT72, the HP ZBook 15 G2 and the Fujitsu Celsius H730 manage 6-6.5 hours in perfect conditions. The runtimes of the W505 could be much better with weaker components. Note: The Xeon E3-1231 v3 only runs at 1.9 GHz on battery power.
| Schenker W505 Quadro K5100M, E3-1231 v3 | MSI WT72-2OL32SR311BW Quadro K4100M, 4980HQ | HP ZBook 15 G2 FirePro M5100, 4910MQ | Dell Precision M2800 FirePro W4170M, 4810MQ | Fujitsu Celsius H730 Quadro K1100M, 4710MQ | |
|---|---|---|---|---|---|
| Battery runtime | 69% | 59% | 184% | 105% | |
| Reader / Idle (h) | 2.5 | 6.5 160% | 6.2 148% | 11.5 360% | 6 140% |
| Load (h) | 1.3 | 1 -23% | 0.9 -31% | 1.4 8% | 2.2 69% |
Pros
Cons
Verdict

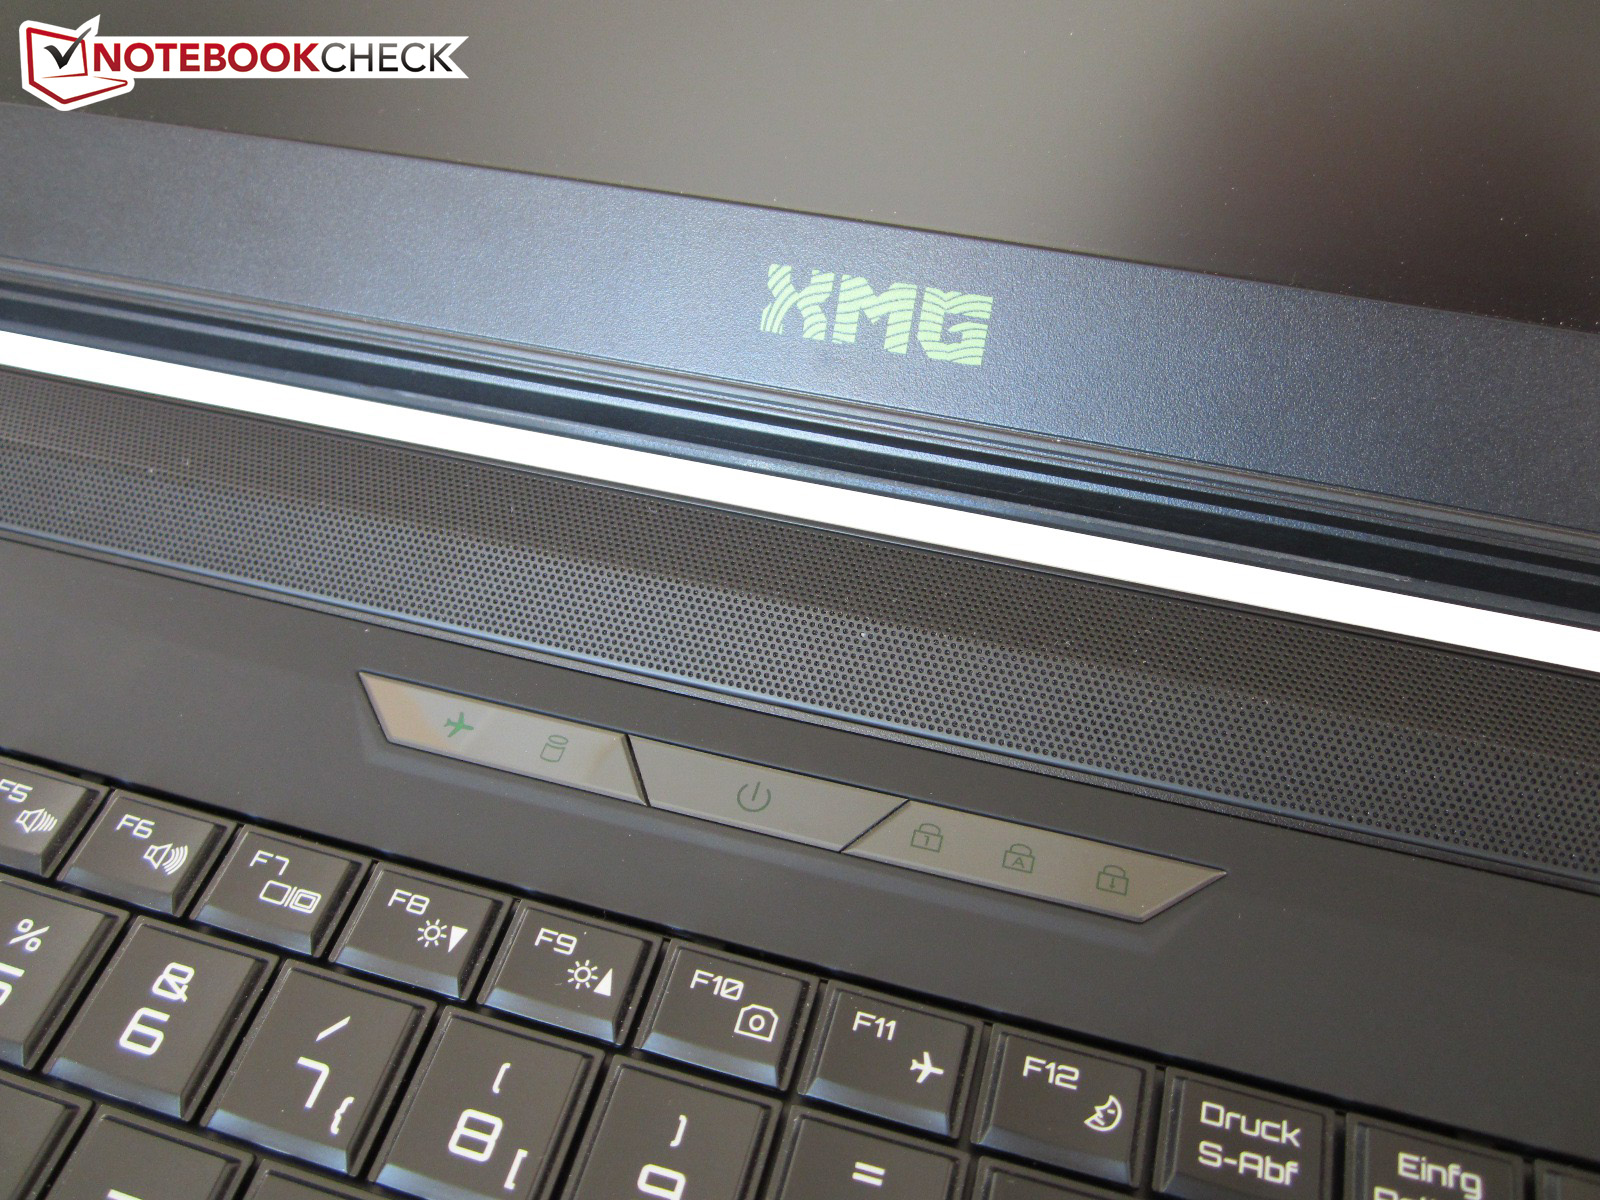
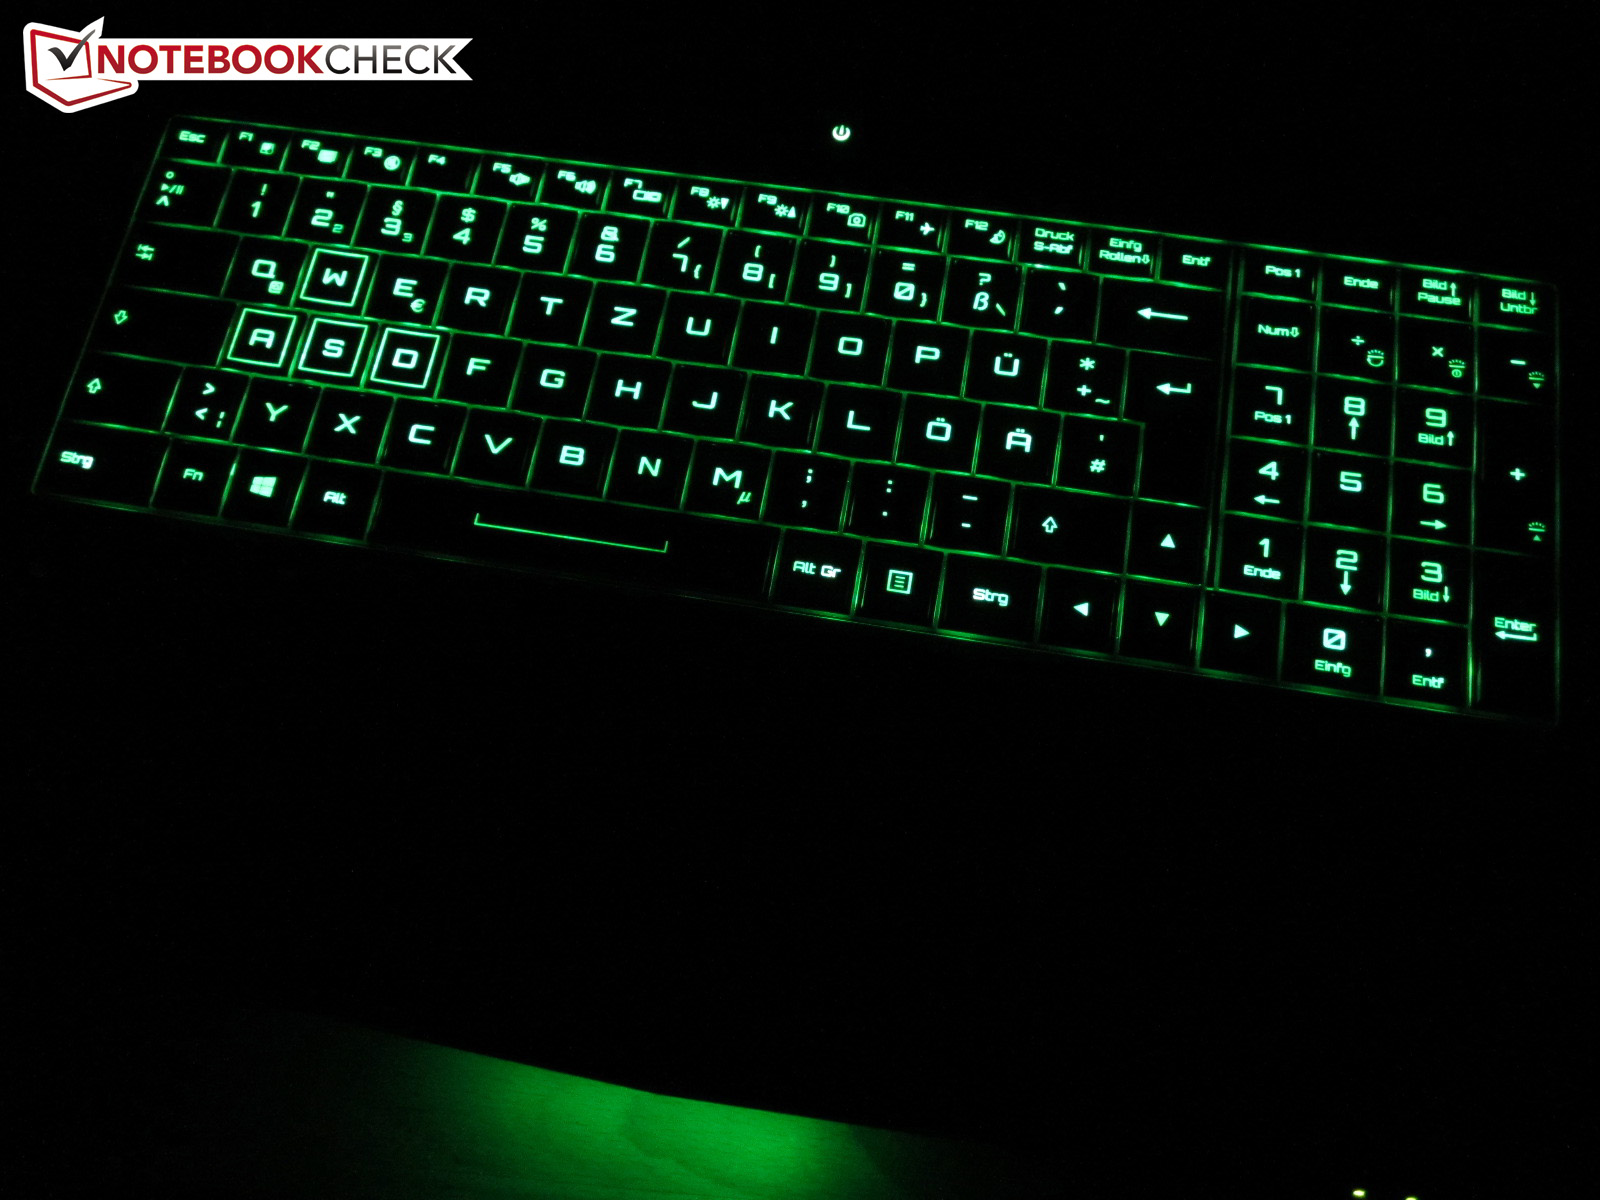
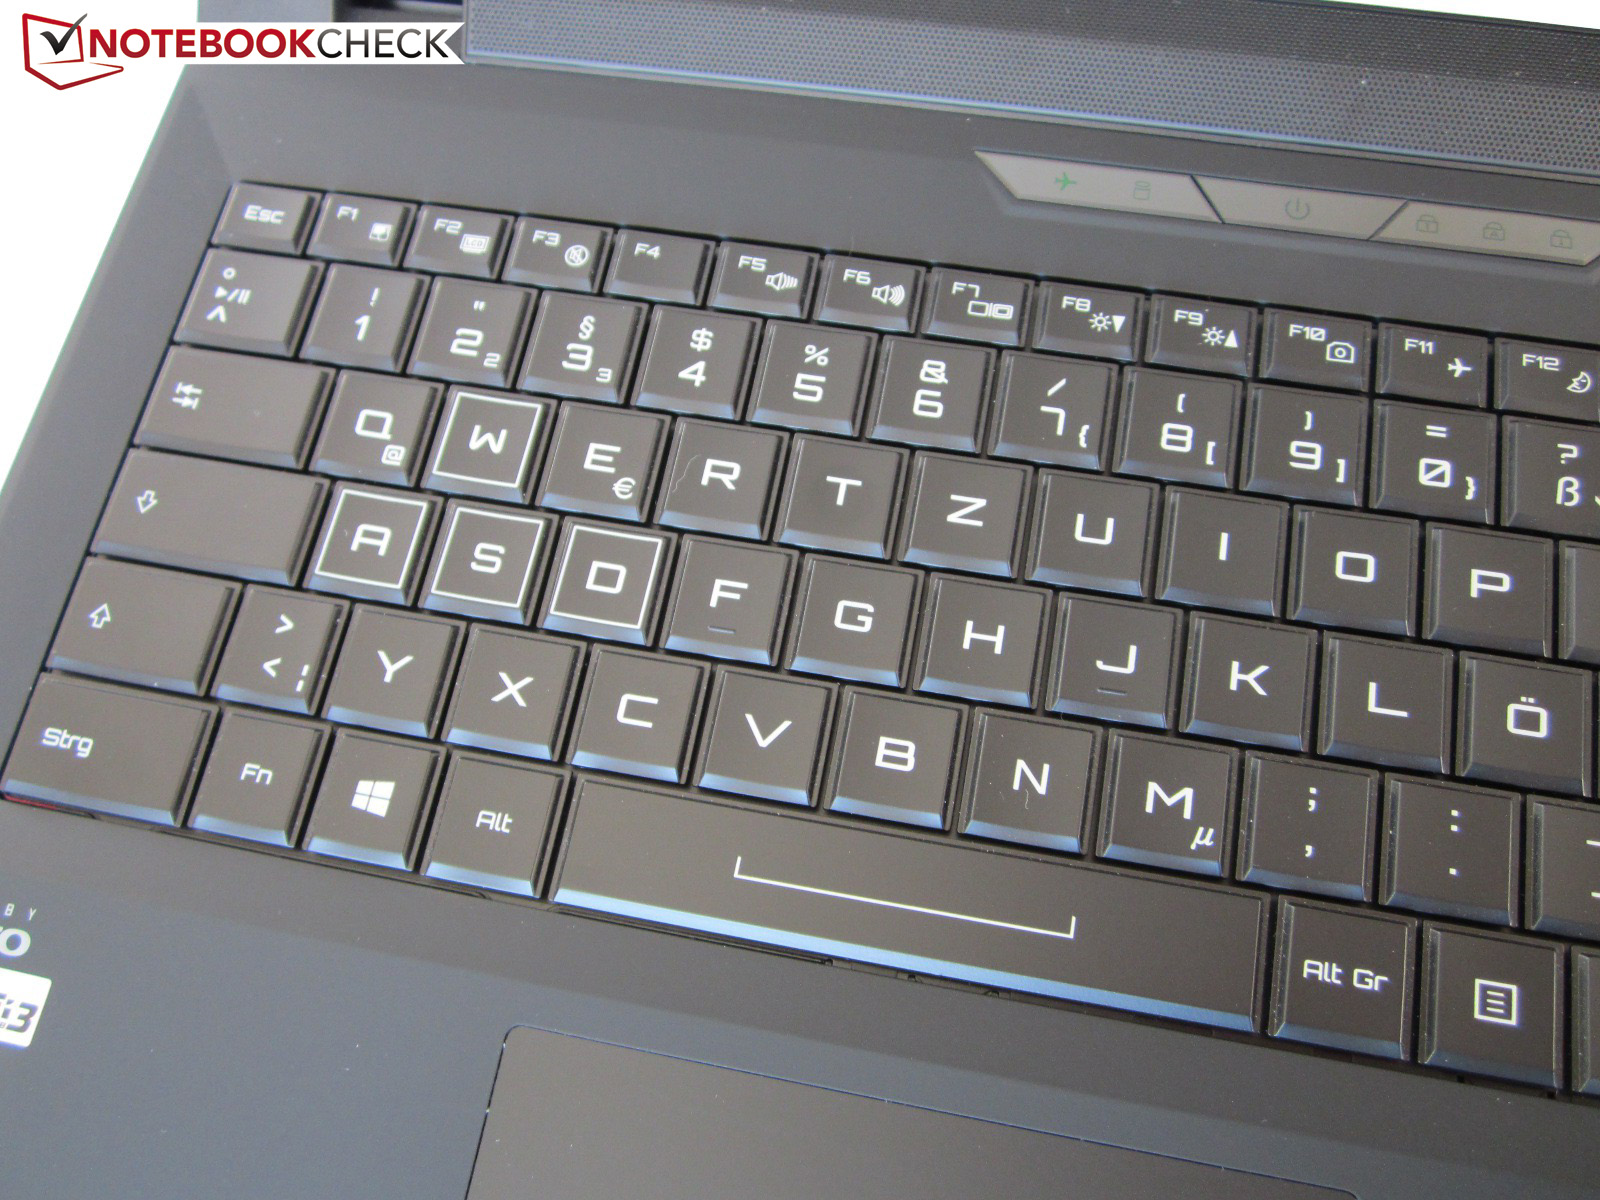
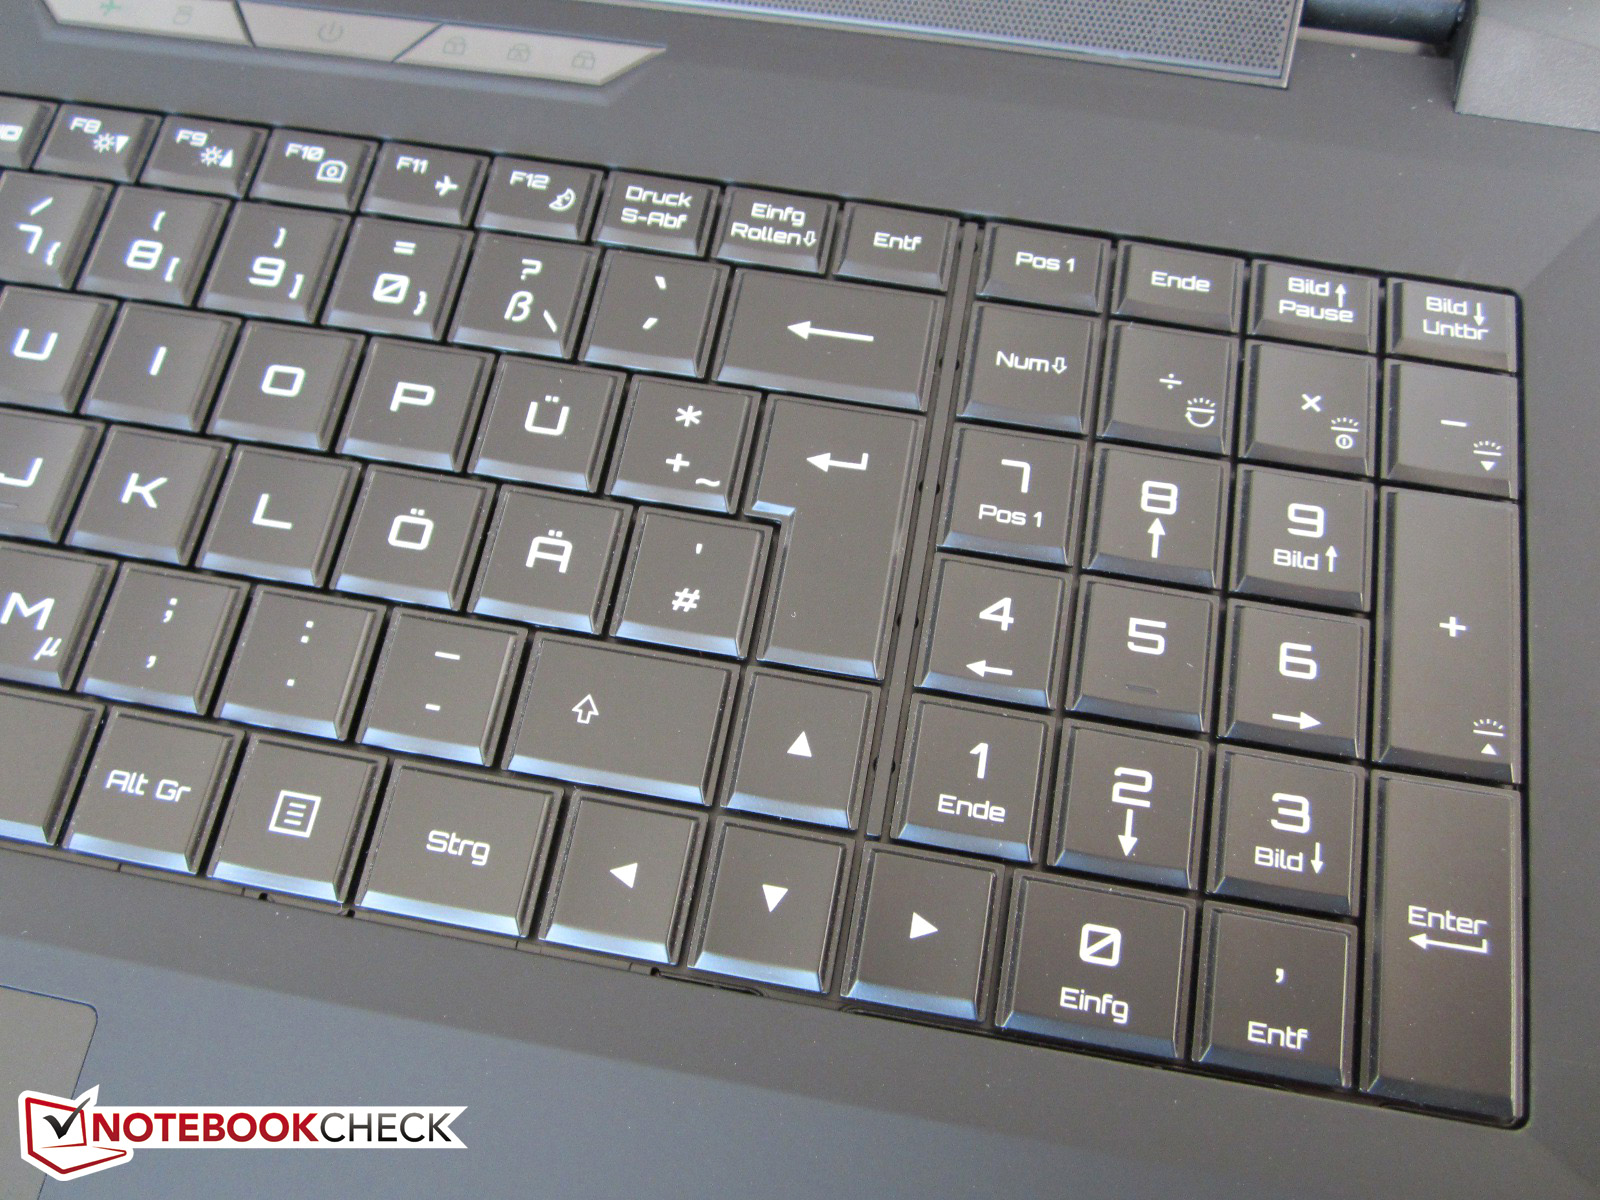
Even though the Schenker W505 has the most powerful GPU in this comparison group, it is only on the fifth spot of our Workstation Top 10 ranking (July 2015). Besides the enormous heat development and the short battery runtimes, another negative aspect is the gaming design. A futuristic keyboard lettering, green status lights and marked WASD keys are a bit out of place in the professional environment. It is also unfortunate that the Quadro chips are still based on the outdated Kepler architecture. The soft-touch surfaces are not perfect either because of the high susceptibility to dirt.
Otherwise, the notebook manufacturer does a good job: Powerful sound, illuminated keyboard or the comprehensive maintainability. Almost every component can be replaced or upgraded if necessary. Numerous ports, memory slots and storage bays transform the W505 into a full desktop replacement. The same applies for the IPS panel with wide viewing angles, which comes with a 4K (3840x2160 pixels) option. Other advantages are the recovery DVD as well as the clean Windows installation without bloatware.
Schenker W505
- 03/17/2016 v5 (old)
Florian Glaser
Price comparison

