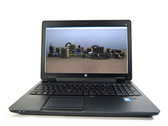
Notebookcheck Logo

AMD FirePro M5100

AMD FirePro M5100

The AMD FirePro M5100 is a middle-class graphics card for mobile workstations, which has been presented in mid-2013. Similar to the Nvidia Quadro series, the FirePro cards offer certified drivers for professional 3D-software like CAD. Due to optimizations and some unlocked features, the performance in these applications is much better compared to a consumer Radeon GPU. Except for the certified drivers, the M5100 is more or less identical to the Radeon HD 8870M.

Architecture

The FirePro M5100 integrates 10 Compute Units based on the GCN architecture. Overall, the chip has 640 stream processors, 40 TMUs and 16 ROPs. The memory of up to 2 GB GDDR5 is connected via an 128-bit interface. Just like the Radeon series, the FirePro M5100 offers features like Eyefinity, Enduro or PCIe 3.0. Presumably, AMD uses the Cape Verde graphics chip, but this has not yet been officially confirmed.

Performance

According to the clock rates of up to 775 MHz for the chip and 1125 MHz for the memory (4500 MHz effective, 72 GB/s), the 3D gaming performance will be slightly above the Nvidia Quadro K2100M or GeForce GT 750M with GDDR5 memory. Recent Games of 2014/2015 can thus be played fluently in medium to high details and a resolution of 1366 x 768 pixels.

Power Consumption

The FirePro M5100 features different energy saving techniques to reduce power consumption and prolong battery life. These include PowerPlay and PowerTune (for clocking the GPU), Zero Core (deactivates parts of the GPU when the display is off) and Enduro (dynamic GPU switching between the processor graphics and the dedicated Radeon GPU). The maximum power consumption under full load should be about 50 watts (estimate), making the card suitable for laptops 15 inches in size or greater.

FirePro M Series

FirePro M6100 compare 768 @ 1.1 GHz128 Bit @ 6000 MHz
FirePro M8900 compare 960 @ 0.68 GHz256 Bit @ 900 MHz
FirePro M6000 compare 640 @ 0.75 GHz128 Bit @ 4500 MHz
FirePro M5100 640 @ 0.73 - 0.78 GHz128 Bit @ 4500 MHz
FirePro M4000 compare 512 @ 0.6 GHz128 Bit @ 4500 MHz
FirePro M4100 compare 384 @ 0.67 GHz128 Bit @ 4000 MHz
FirePro M5950 compare 480 @ 0.73 GHz128 Bit @ 900 MHz
FirePro M2000 compare 480 @ 0.5 GHz64 Bit @ 3200 MHz
ArchitectureGCN
Pipelines640 - unified
Core Speed725 - 775 (Boost) MHz
Memory Speed4500 MHz
Memory Bus Width128 Bit
Memory TypeGDDR5
Max. Amount of Memory2048 MB
Shared Memoryno
APIDirectX 12 (FL 11_1), Shader 5.0, OpenGL 4.3
technology28 nm
FeaturesAMD Eyefinity multi-display technology, Up to 3 displays supported undocked, 5 displays docked, AMD App Acceleration, AMD PowerPlay power management technology, AMD PowerTune technology, AMD ZeroCore Power technology, AMD Enduro technology
Notebook Sizemedium sized
Date of Announcement01.10.2013
Link to Manufacturer Pagewww.amd.com

Benchmarks

Performance Rating - 3DMark 11 + Fire Strike + Time Spy
0.9 pt (3%)
Restrict / Search: Model: Max. age: years
3DMark - 3DMark Cloud Gate Score
min: 12526     avg: 12603     median: 12602.5 (12%)     max: 12679 Points
3DMark - 3DMark Cloud Gate Graphics
min: 16349     avg: 16785     median: 16784.5 (4%)     max: 17220 Points
3DMark - 3DMark Fire Strike Standard Score
min: 2197     avg: 2225     median: 2225 (3%)     max: 2253 Points
3DMark - 3DMark Fire Strike Standard Graphics
min: 2297     avg: 2328     median: 2327.5 (2%)     max: 2358 Points
3DMark - 3DMark Ice Storm Graphics
min: 100463     avg: 126754     median: 126754 (14%)     max: 153044 Points
3DMark 11 - 3DM11 Performance Score
3333 Points (4%)
3DMark 11 - 3DM11 Performance GPU
2967 Points (2%)
Restrict / Search: Model: Max. age: years
3DMark Vantage
3DM Vant. Perf. total +
3DMark Vantage - 3DM Vant. Perf. total
12308 Points (4%)
3DM Vant. Perf. GPU no PhysX +
3DMark Vantage - 3DM Vant. Perf. GPU no PhysX
10561 Points (6%)
Restrict / Search: Model: Max. age: years
3DMark 06 3DMark 06 - Standard 1280x1024 +
3DMark 06
min: 18065     avg: 18391     median: 18391 (24%)     max: 18717 Points
Unigine Heaven 3.0 - Unigine Heaven 3.0 DX 11
min: 27     avg: 27.5     median: 27.5 (9%)     max: 28 fps
Unigine Heaven 3.0 - Unigine Heaven 3.0 OpenGL
min: 22.9     avg: 23.3     median: 23.3 (10%)     max: 23.7 fps
Unigine Heaven 2.1 - Heaven 2.1 high
min: 38.3     avg: 39.1     median: 39.1 (7%)     max: 39.9 fps
Restrict / Search: Model: Max. age: years
SPECviewperf 11
specvp11 snx-01 +
SPECviewperf 11 - specvp11 snx-01
min: 26.63     avg: 27.1     median: 27.1 (16%)     max: 27.58 fps
specvp11 tcvis-02 +
SPECviewperf 11 - specvp11 tcvis-02
min: 21.43     avg: 21.6     median: 21.6 (12%)     max: 21.79 fps
specvp11 sw-02 +
SPECviewperf 11 - specvp11 sw-02
min: 54.2     avg: 55.2     median: 55.2 (42%)     max: 56.1 fps
specvp11 proe-05 +
SPECviewperf 11 - specvp11 proe-05
min: 10.38     avg: 10.5     median: 10.5 (12%)     max: 10.64 fps
specvp11 maya-03 +
SPECviewperf 11 - specvp11 maya-03
min: 60.3     avg: 67.8     median: 67.8 (51%)     max: 75.3 fps
specvp11 lightwave-01 +
SPECviewperf 11 - specvp11 lightwave-01
min: 75.8     avg: 76.7     median: 76.7 (82%)     max: 77.5 fps
specvp11 ensight-04 +
SPECviewperf 11 - specvp11 ensight-04
min: 24.67     avg: 24.9     median: 24.9 (12%)     max: 25.07 fps
specvp11 catia-03 +
SPECviewperf 11 - specvp11 catia-03
min: 35.61     avg: 36     median: 36 (19%)     max: 36.35 fps
SPECviewperf 12
specvp12 sw-03 +
SPECviewperf 12 - specvp12 sw-03
min: 39.72     avg: 39.8     median: 39.8 (10%)     max: 39.85 fps
specvp12 snx-02 +
SPECviewperf 12 - specvp12 snx-02
min: 28.9     avg: 29.3     median: 29.3 (4%)     max: 29.69 fps
specvp12 showcase-01 +
SPECviewperf 12 - specvp12 showcase-01
min: 15.47     avg: 15.9     median: 15.9 (3%)     max: 16.36 fps
specvp12 mediacal-01 +
SPECviewperf 12 - specvp12 mediacal-01
min: 7.81     avg: 7.8     median: 7.8 (2%)     max: 7.82 fps
specvp12 maya-04 +
SPECviewperf 12 - specvp12 maya-04
min: 24.92     avg: 25.2     median: 25.2 (7%)     max: 25.5 fps
specvp12 energy-01 +
SPECviewperf 12 - specvp12 energy-01
min: 0.43     avg: 0.4     median: 0.4 (0%)     max: 0.44 fps
specvp12 creo-01 +
SPECviewperf 12 - specvp12 creo-01
min: 19.64     avg: 20.7     median: 20.7 (8%)     max: 21.76 fps
specvp12 catia-04 +
SPECviewperf 12 - specvp12 catia-04
min: 23.03     avg: 23.3     median: 23.3 (4%)     max: 23.62 fps
Windows 7 Experience Index - Win7 Gaming graphics
6.9 Points (87%)
Windows 7 Experience Index - Win7 Graphics
6.9 Points (87%)
Cinebench R10 Cinebench R10 Shading (32bit) +
Cinebench R10 - Cinebench R10 Shading (32bit)
min: 9328     avg: 10516     median: 10516 (7%)     max: 11704 points
Cinebench R11.5 Cinebench R11.5 OpenGL 64 Bit +
Cinebench R11.5 - Cinebench R11.5 OpenGL 64 Bit
min: 58.3     avg: 64.2     median: 64.2 (21%)     max: 70 fps
Cinebench R15
Cinebench R15 OpenGL 64 Bit +
Cinebench R15 - Cinebench R15 OpenGL 64 Bit
min: 57.4     avg: 63.7     median: 63.7 (4%)     max: 70 fps
Cinebench R15 OpenGL Ref. Match 64 Bit +
Cinebench R15 - Cinebench R15 OpenGL Ref. Match 64 Bit
98 % (98%)
LuxMark v2.0 64Bit - LuxMark v2.0 Room GPU
min: 353     avg: 364     median: 364 (1%)     max: 375 Samples/s
LuxMark v2.0 64Bit - LuxMark v2.0 Sala GPU
min: 641     avg: 658     median: 658 (1%)     max: 675 Samples/s
ComputeMark v2.1 - ComputeMark v2.1 Result
2051 points (2%)
- Range of benchmark values
red legend - Average benchmark values
* Smaller numbers mean a higher performance

Game Benchmarks

The following benchmarks stem from our benchmarks of review laptops. The performance depends on the used graphics memory, clock rate, processor, system settings, drivers, and operating systems. So the results don't have to be representative for all laptops with this GPU. For detailed information on the benchmark results, click on the fps number.

low 1024x768
44  fps    + Compare
med. 1366x768
25  fps    + Compare
high 1920x1080
17  fps    + Compare
ultra 1920x1080
10  fps    + Compare
» With all tested laptops playable in detail settings low.
low 1024x768
213  fps    + Compare
med. 1366x768
101  fps    + Compare
high 1920x1080
44  fps    + Compare
ultra 1920x1080
26  fps    + Compare
» With all tested laptops playable in detail settings high.
Thief

Thief

2014
low 1024x768
33.4  fps    + Compare
med. 1366x768
23  fps    + Compare
high 1366x768
20  fps    + Compare
ultra 1920x1080
18  fps    + Compare
» The benchmarks indicate that the game is not playable in the tested settings.
low 1024x768
118  fps    + Compare
med. 1366x768
90  fps    + Compare
high 1366x768
76  fps    + Compare
ultra 1920x1080
12  fps    + Compare
» With all tested laptops playable in detail settings high.
low 1280x720
102  fps    + Compare
med. 1366x768
98  fps    + Compare
high 1366x768
42  fps    + Compare
ultra 1920x1080
25  fps    + Compare
» With all tested laptops playable in detail settings high.
low 1024x768
49  fps    + Compare
med. 1366x768
42  fps    + Compare
high 1366x768
24  fps    + Compare
ultra 1920x1080
9  fps    + Compare
» With all tested laptops playable in detail settings med..
GRID 2

GRID 2

2013
low 1024x768
162  fps    + Compare
med. 1366x768
115  fps    + Compare
high 1366x768
86  fps    + Compare
ultra 1920x1080
55  fps    + Compare
» With all tested laptops playable in detail settings ultra.
low 1024x768
85  fps    + Compare
med. 1366x768
61  fps    + Compare
high 1366x768
42  fps    + Compare
ultra 1920x1080
19.6  fps    + Compare
» With all tested laptops playable in detail settings high.
low 1280x720
80  fps    + Compare
med. 1366x768
73  fps    + Compare
high 1366x768
62  fps    + Compare
ultra 1920x1080
21  fps    + Compare
» With all tested laptops playable in detail settings high.
low 1024x768
172  fps    + Compare
med. 1366x768
82  fps    + Compare
high 1366x768
57  fps    + Compare
ultra 1920x1080
26  fps    + Compare
» With all tested laptops playable in detail settings high.
med. 1366x768
47  fps    + Compare
high 1366x768
44  fps    + Compare
ultra 1920x1080
19  fps    + Compare
» With all tested laptops playable in detail settings high.
low 1024x768
79  fps    + Compare
med. 1366x768
68  fps    + Compare
high 1366x768
34  fps    + Compare
ultra 1920x1080
16  fps    + Compare
» With all tested laptops playable in detail settings med..
F1 2012

F1 2012

2012
low 1024x768
182  fps    + Compare
med. 1366x768
149  fps    + Compare
high 1366x768
137  fps    + Compare
ultra 1920x1080
72  fps    + Compare
» With all tested laptops playable in detail settings ultra.
Torchlight 2

Torchlight 2

2012
low 1024x768
130  fps    + Compare
med. 1366x768
125  fps    + Compare
ultra 1920x1080
107  fps    + Compare
» With all tested laptops playable in detail settings ultra.
low 1024x768
143  fps    + Compare
med. 1366x768
108  fps    + Compare
high 1366x768
47  fps    + Compare
ultra 1920x1080
13  fps    + Compare
» With all tested laptops playable in detail settings high.
low 1024x768
107  fps    + Compare
med. 1366x768
94  fps    + Compare
high 1366x768
78  fps    + Compare
ultra 1920x1080
27  fps    + Compare
» With all tested laptops playable in detail settings high.
low 1024x768
195  fps    + Compare
med. 1366x768
134  fps    + Compare
high 1366x768
105  fps    + Compare
ultra 1920x1080
67  fps    + Compare
» With all tested laptops playable in detail settings ultra.
Alan Wake

Alan Wake

2012
low 1024x768
75  fps    + Compare
med. 1366x768
34  fps    + Compare
ultra 1920x1080
19  fps    + Compare
» With all tested laptops playable in detail settings low.
Anno 2070

Anno 2070

2011
low 1024x768
199  fps    + Compare
med. 1366x768
91  fps    + Compare
high 1366x768
54  fps    + Compare
ultra 1920x1080
25  fps    + Compare
» With all tested laptops playable in detail settings high.
low 1024x768
188  fps    + Compare
med. 1366x768
150  fps    + Compare
high 1366x768
72  fps    + Compare
ultra 1920x1080
35  fps    + Compare
» With all tested laptops playable in detail settings high.
World of Warcraft

World of Warcraft

2005
low 800x600
382  fps    + Compare
med. 1024x768
248  fps    + Compare
high 1280x1024
79  fps    + Compare
ultra 1920x1080
34  fps    + Compare
» With all tested laptops playable in detail settings high.
lowmed.highultraQHD4K
Ryse: Son of Rome44251710
GRID: Autosport2131014426
Thief33.4232018
Total War: Rome II118907612
Saints Row IV102984225
Company of Heroes 24942249
GRID 21621158655
Metro: Last Light85614219.6
BioShock Infinite80736221
Tomb Raider172825726
Assassin´s Creed III474419
Hitman: Absolution79683416
F1 201218214913772
Torchlight 2130125107
Sleeping Dogs1431084713
Dirt Showdown107947827
Diablo III19513410567
Alan Wake753419
Anno 2070199915425
Batman: Arkham City1881507235
World of Warcraft3822487934
lowmed.highultraQHD4K
< 30 fps
< 60 fps
< 120 fps
≥ 120 fps

3
7
10
2
3
11
5
3
8
7
1
15
3
3


For more games that might be playable and a list of all games and graphics cards visit our Gaming List

Add one or more devices and compare

In the following list you can select (and also search for) devices that should be added to the comparison. You can select more than one device.

search for model:
v1.33
log 02. 05:01:20

#0 ran 0s before starting gpusingle class +0s ... 0s

#1 no ids found in url (should be separated by "_") +0s ... 0s

#2 not redirecting to Ajax server +0s ... 0s

#3 did not recreate cache, as it is less than 5 days old! Created at Tue, 01 Jul 2025 05:34:46 +0200 +0.001s ... 0.001s

#4 composed specs +0.036s ... 0.037s

#5 did output specs +0s ... 0.037s

#6 start showIntegratedCPUs +0s ... 0.037s

#7 getting avg benchmarks for device 5058 +0.031s ... 0.068s

#8 got single benchmarks 5058 +0.01s ... 0.078s

#9 got avg benchmarks for devices +0s ... 0.078s

#10 min, max, avg, median took s +0.747s ... 0.825s

#11 before gaming benchmark output +0s ... 0.825s

#12 Got 96 rows for game benchmarks. +0.008s ... 0.832s

#13 composed SQL query for gamebenchmarks +0s ... 0.832s

#14 got data and put it in $dataArray +0.014s ... 0.846s

#15 benchmarks composed for output. +0.155s ... 1.001s

#16 return log +0.009s ... 1.01s

Please share our article, every link counts!
Mail Logo

» Comparison of GPUs
Detailed list of all laptop GPUs sorted by class and performance.

» Benchmark List
Sort and restrict laptop GPUs based on performance in synthetic benchmarks.

» Notebook Gaming List
Playable games for each graphics card and their average FPS results.

Class 1

Class 2

Radeon PRO W6600M *

Class 3

Arc Graphics 3-core (Arrow Lake) *
Arc Graphics 2-core (Arrow Lake) *
UHD Graphics 32EUs
UHD Graphics 750

Class 4

* Approximate position of the graphics adapter