Notebook reviews with NVIDIA GeForce 840M graphics card
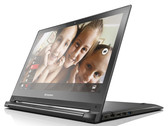
Lenovo Flex 2 Pro 15 Notebook Review
Flexible all-rounder. Lenovo's multi-mode, 15.6-inch Flex 2 Pro 15 does not exhibit any severe shortcomings and presents itself as a well-rounded, versatile device. However, its decent configuration (SSD, 16 GB RAM) forces up the price to almost 1000 Euros (~$1135).
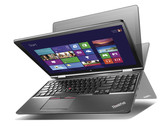
Intel Core i7-4510U, NVIDIA GeForce 840M, 15.6", 2.3 kgLenovo ThinkPad S5 Yoga 15 20DQ0038GE Convertible Review
Yoga goes standard. Will the Yoga concept be successful in a standard 15-inch work device? Can the Yoga reflect the classic virtues and bring new flexibility in equal measure? Disappointment is not far.
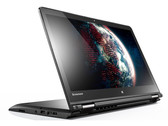
Intel Core i7-5500U, NVIDIA GeForce 840M, 15.6", 2.3 kgLenovo ThinkPad Yoga 14 Convertible Review
Luxury Yoga. Lenovo brings the flexible Yoga design to the desks of business people with its ThinkPad Yoga 14. In this report, we will discover whether the Ultrabook, based on a Broadwell processor and dedicated graphics card, is well equipped for office use.
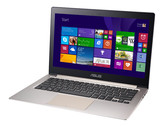
Intel Core i7-5500U, NVIDIA GeForce 840M, 14", 1.9 kgAsus Zenbook UX303LN Subnotebook Review
Sleek. The Zenbook is one of the few subnotebooks with a dedicated graphics card: powerful graphics performance in a compact form. In addition, the Zenbook has low noise and temperature emissions and good battery life.
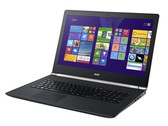
Intel Core i7-5500U, NVIDIA GeForce 840M, 13.3", 1.5 kgAcer Aspire V17 Nitro VN7-791G Notebook Review
Nitro light. The Aspire would like to replace the desktop PC at home when it is ready for retirement. An Acer laptop with a decent configuration costs about 700 Euros (~$741). However, the computer has a high energy demand.
Intel Core i5-4210H, NVIDIA GeForce 840M, 17.3", 3 kgAcer Aspire E5-771G-71PT: Intel Core i7-5500U, 17.30", 3 kg
Review » Acer Aspire E5-771G Notebook Review
Acer Aspire E5-571G-520X: Intel Core i5-5200U, 15.60", 2.5 kg
Review » Acer Aspire E5-571G Notebook Review Update
Lenovo ThinkPad Yoga 14: Intel Core i5-4210U, 14.00", 1.9 kg
Review » Lenovo ThinkPad Yoga 14 Convertible Review
Acer Travelmate P276-MG-56FU: Intel Core i5-4210U, 17.30", 3 kg
Review » Acer TravelMate P276-MG-56FU Notebook Review
Acer Aspire V3-572PG-604M: Intel Core i5-4200U, 15.60", 2.5 kg
Review » Acer Aspire V3-572PG-604M Notebook Review
Asus Zenbook UX303LN-R4141H: Intel Core i7-4510U, 13.30", 1.4 kg
Review » Asus Zenbook UX303LN-R4141H Subnotebook Review
Asus Transformer Book Flip TP500LN: Intel Core i5-4210U, 15.60", 2.3 kg
Review » Asus Transformer Book Flip TP500LN Convertible Review
Asus X555LN-XO112H: Intel Core i5-4210U, 15.60", 2.3 kg
Review » Asus X555LN-XO112H Notebook Review
HP Pavilion 15-p008ng: Intel Core i5-4210U, 15.60", 2.4 kg
Review » HP Pavilion 15-p008ng Notebook Review
Acer Aspire E5-571G-536E: Intel Core i5-4210U, 15.60", 2.4 kg
Review » Acer Aspire E5-571G-536E Notebook Review
Acer Aspire E5-771G-553Q: Intel Core i5-4210U, 17.30", 2.9 kg
Review » Acer Aspire E5-771G-553Q (i5, 840M) Notebook Review
Lenovo IdeaPad Z50-70 (59427656): Intel Core i7-4510U, 15.60", 2.3 kg
Review » Lenovo IdeaPad Z50-70 (59427656) Notebook Review
Lenovo Flex 2 14: Intel Core i3-4010U, 14.00", 1.9 kg
Review » Lenovo IdeaPad Flex 2 14 Notebook Review
Asus Zenbook UX32LN-R4029H: Intel Core i7-4500U, 13.30", 1.4 kg
Review » Asus Zenbook UX32LN-R4029H Ultrabook Review Update
Asus Pro B551LG-CN009G: Intel Core i7-4650U, 15.60", 2.5 kg
Review » Asus AsusPro B551LG-CN009G Notebook Review
MSI GP60-2PEi585: Intel Core i5-4200H, 15.60", 2.4 kg
Review » MSI GP60-2PEi585 Notebook Review
Asus UX32LN: Intel Core i5-4200U, 13.30", 1.4 kg
Review » Asus Zenbook UX32LN-R4053H Ultrabook Review
Asus F550LN-CN89H: Intel Core i7-4500U, 15.60", 2.3 kg
Review » Asus F550LN-CN89H Notebook Review
MSI GP70-2PEi545: Intel Core i5-4200H, 17.30", 2.9 kg
Review » MSI GP70 Leopard Notebook Review
Asus X750LN-TY012H: Intel Core i7-4500U, 17.30", 2.8 kg
Review » Review Asus X750LN-TY012H Notebook
HP Pavilion 15-P265Ur : Intel Core i7-5500U, 15.60", 2.3 kg
External Review » HP Pavilion 15-P265Ur
Lenovo Z70-80-FG006JBM: Intel Core i7-5500U, 17.30", 3 kg
External Review » Lenovo Z70-80-FG006JBM
Lenovo ThinkPad Yoga 15-20DQ003RGE: Intel Core i5-5200U, 15.60", 2.3 kg
External Review » Lenovo ThinkPad Yoga 15-20DQ003RGE
Acer Aspire V3-572G-543S: Intel Core i5-5200U, 15.60", 2.5 kg
External Review » Acer Aspire V3-572G-543S
HP Pavilion 15-p159nr: Intel Core i5-4210U, 15.60", 2.3 kg
External Review » HP Pavilion 15-p159nr
Asus F555LN-XO010D: Intel Core i7-4510U, 15.60", 2.3 kg
External Review » Asus F555LN-XO010D
Asus X555LN-DM473H: Intel Core i7-5500U, 15.60", 2.3 kg
External Review » Asus X555LN-DM473H
Dell Inspiron 15 3543-8208: Intel Core i5-5200U, 15.60", 2.2 kg
External Review » Dell Inspiron 15 3543-8208
Asus K555LN-DM091D: Intel Core i7-4510U, 15.60", 2.3 kg
External Review » Asus K555LN-DM091D
Asus ZenBook UX303LN-R4359H: Intel Core i5-5200U, 13.30", 1.5 kg
External Review » Asus ZenBook UX303LN-R4359H
Lenovo Z70-80-FG008LGE: Intel Core i5-5200U, 17.30", 3 kg
External Review » Lenovo Z70-80-FG008LGE
Asus ET2323I: Intel Core i7-5500U, 23.00", 9 kg
External Review » Asus ET2323I
Lenovo Z50-70-59427408: Intel Core i5-4210U, 15.60", 2.5 kg
External Review » Lenovo Z50-70-59427408
Asus Zenbook UX303LN-R4290P: Intel Core i7-5500U, 13.30", 1.5 kg
External Review » Asus Zenbook UX303LN-R4290P
Lenovo Ideapad Flex 2 Pro 15-80FL0019GE: Intel Core i7-4510U, 15.60", 2.6 kg
External Review » Lenovo Ideapad Flex 2 Pro 15-80FL0019GE
Asus UX303LN-DQ148P: Intel Core i7-4510U, 13.30", 1.5 kg
External Review » Asus UX303LN-DQ148P
Dell Inspiron 17-5749: Intel Core i7-5500U, 17.30", 3 kg
External Review » Dell Inspiron 17-5749
Acer Aspire VN7-571G-33J0: Intel Core i3-4030U, 15.60", 2.4 kg
External Review » Acer Aspire VN7-571G-33J0
Asus Transformer Book Flip TP500LN-CJ035H: Intel Core i7-4510U, 15.60", 2.3 kg
External Review » Asus Transformer Book Flip TP500LN-CJ035H
Asus X555LN-XO022D: Intel Core i3-4030U, 15.60", 2.3 kg
External Review » Asus X555LN-XO022D
Acer Aspire V 15 Nitro VN7-571G-56NX: Intel Core i5-4210U, 15.60", 2.2 kg
External Review » Acer Aspire V 15 Nitro VN7-571G-56NX
Lenovo Flex 2 14: Intel Core i3-4010U, 14.00", 1.9 kg
External Review » Lenovo Flex 2 14
Asus Transformer Book Flip TP500LN-DN051H: Intel Core i5-4210U, 15.60", 2.2 kg
External Review » Asus Transformer Book Flip TP500LN-DN051H
Asus X550LN-XX030H: Intel Core i7-4510U, 15.60", 2.3 kg
External Review » Asus X550LN-XX030H
Asus UX32LN: Intel Core i5-4200U, 13.30", 1.4 kg
External Review » Asus UX32LN
Asus Transformer Book Flip TP500LN: Intel Core i5-4210U, 15.60", 2.3 kg
External Review » Asus Transformer Book Flip TP500LN
Asus X555LN-XO112H: Intel Core i5-4210U, 15.60", 2.3 kg
External Review » Asus X555LN-XO112H
Lenovo IdeaPad Flex 2 14-59427350: Intel Core i3-4030U, 14.00", 2 kg
External Review » Lenovo IdeaPad Flex 2 14-59427350
Acer Aspire E5-572G-50FB: Intel Core i5-4210M, 15.60", 2.4 kg
External Review » Acer Aspire E5-572G-50FB
Lenovo IdeaCentre Horizon 27, Haswell: Intel Core i5-3210M, 27.00", 8.3 kg
External Review » Lenovo IdeaCentre Horizon 27, Haswell
Acer Aspire VN7-571G-55ZA: Intel Core i5-4210U, 15.00", 2.4 kg
External Review » Acer Aspire VN7-571G-55ZA
Asus Transformer Book Flip TP500LN-DN075H: Intel Core i7-4510U, 15.60", 2.3 kg
External Review » Asus Transformer Book Flip TP500LN-DN075H
Asus ZenBook UX303LN-R4215H: Intel Core i5-4210U, 13.30", 1.5 kg
External Review » Asus ZenBook UX303LN-R4215H
Lenovo ThinkPad Yoga 14: Intel Core i5-4210U, 14.00", 1.9 kg
External Review » Lenovo ThinkPad Yoga 14
Asus VivoBook S451LN: Intel Core i5-4200U, 14.00", 2.2 kg
External Review » Asus VivoBook S451LN
HP Envy 15-k050sr: Intel Core i5-4210U, 15.60", 2.8 kg
External Review » HP Envy 15-k050sr
Acer Aspire E5-571PG-624L: Intel Core i5-4210U, 15.60", 2.6 kg
External Review » Acer Aspire E5-571PG-624L
Asus X550LN-XX031H: Intel Core i5-4200U, 15.60"
External Review » Asus X550LN-XX031H
Acer Aspire E5-571G-520X: Intel Core i5-5200U, 15.60", 2.5 kg
External Review » Acer Aspire E5-571G-611H
Asus X555LN-XO113H: Intel Core i7-4510U, 15.60", 2.3 kg
External Review » Asus X555LN-XO113H
HP Pavilion 15-p006tx: Intel Core i7-4510U, 15.60", 2.7 kg
External Review » HP Pavilion 15-p006tx
Asus K551LN: Intel Core i5-4200U, 15.60", 2.2 kg
External Review » Asus K551LN
Acer Aspire E5-571G-536E: Intel Core i5-4210U, 15.60", 2.4 kg
External Review » Acer Aspire E5-571G-536E
Lenovo IdeaPad Z50-70: Intel Core i5-4210U, 15.60", 2.5 kg
External Review » Lenovo IdeaPad Z50-70
Asus UX303LN-DB71T: Intel Core i7-4510U, 13.30", 1.5 kg
External Review » Asus UX303LN-DB71T
MSI GP60 2PE-222UK: Intel Core i7-4710HQ, 15.60", 2.4 kg
External Review » MSI GP60 2PE-222UK
Acer Aspire E5-771G-71PT: Intel Core i7-5500U, 17.30", 3 kg
External Review » Acer Aspire E5-771G-51T2
Asus R453LN-WX085: Intel Core i3-4010U, 14.00", 2 kg
External Review » Asus R453LN-WX085
HP Pavilion 15-J6Z61EA: Intel Core i7-4510U, 15.60", 2.4 kg
External Review » HP Pavilion 15-J6Z61EA
MSI GP60 2PE-008RU: Intel Core i7-4700HQ, 15.60", 2.4 kg
External Review » MSI GP60 2PE-008RU
Asus R510LN: Intel Core i3-4010U, 15.60", 2.3 kg
External Review » Asus R510LN
MSI GP60-2PEi585: Intel Core i5-4200H, 15.60", 2.4 kg
External Review » MSI GP60-2PEi585
Asus ASUSPRO ADVANCED B551LG: Intel Core i7-4650U, 15.60", 2.5 kg
External Review » Asus ASUSPRO ADVANCED B551LG
Asus Zenbook UX32LN-R4029H: Intel Core i7-4500U, 13.30", 1.4 kg
External Review » Asus Zenbook UX32LN
Asus Zenbook UX32L: Intel Core i5-4200U, 13.30", 1.5 kg
External Review » Asus Zenbook UX32L