Notebook reviews with Intel HD Graphics 4000 graphics card
Vizio CT14-A0 Notebook Review
A good first step. The TV maker makes a good first effort in its foray into the notebook market. Find out what we liked and didn't like about this early Ultrabook from the fast-growing electronics company.
Intel Core i3-3217U, HD Graphics 4000, 14", 1.5 kgAcer Aspire E1-771-33114G50Mnii Notebook Review
Does it always have to be expensive? For about 500 Euro (~$680), Acer sells their Aspire E1-771. The 17.3-inch notebook with an Intel Core i-CPU competes as an office machine - but is the system with its killer price a worthwhile investment?
Intel Core i3-3110M, HD Graphics 4000, 17.3", 2.9 kgReview Asus P550CA-XO522G Notebook
Entry-level business. Asus puts not one but two operating systems (Windows 7 Pro (64-bit) + Windows 8 Pro (64-bit)) in the P550CA-XO522G's box. Dedicated Windows 7 fans can use the laptop right away. Windows 8 first has to be installed via the included recovery DVD.
Intel Core i3-3217U, HD Graphics 4000, 15.6", 2.3 kg
Review Acer Aspire E1-470P-6659 Notebook
Basically basic. Cramming as much computer as possible into a case for $400 is a challenging and often perilous task. With their Aspire E1-470P, Acer takes another swipe at low-cost leadership in the Windows touchscreen category of devices. Was it worth the effort?
Intel Core i3-3217U, HD Graphics 4000, 14", 1.9 kg
Review Panasonic Toughpad FZ-G1 Tablet
Ready for every situation. We already reviewed the smaller Android based Toughpad, and now it is time for the bigger brother. The Toughpad not only has a hard shell, but also powerful components. Does the fully-rugged tablet have any drawbacks? Find out in our in-depth review.
Intel Core i5-3437U, HD Graphics 4000, 10.1", 1 kgToshiba Portege Z10t: Intel Core i5-3339Y, 11.60", 1.4 kg
Review » Review Toshiba Portégé Z10t Convertible
Toshiba WT310: Intel Core i5-3339Y, 11.60", 0.8 kg
Review » Review Toshiba WT310 Tablet
Toshiba Satellite U840T-101: Intel Core i5-3337U, 14.00", 1.7 kg
Review » Review Toshiba Satellite U840T-101 Ultrabook
Samsung 740U3E-A01UB: Intel Core i5-3337U, 13.30", 1.6 kg
Review » Review Samsung ATIV Book 7 740U3E-A01UB Ultrabook
Fujitsu Lifebook E743-0M55A1DE: Intel Core i5-3230M, 14.00", 1.8 kg
Review » Review Fujitsu LifeBook E743-0M55A1DE Notebook
Fujitsu Lifebook E733-0MXP41DE: Intel Core i7-3632QM, 13.30", 1.7 kg
Review » Review Fujitsu LifeBook E733-0MXP41DE Premium Selection Notebook
Gigabyte S1185: Intel Core i5-3337U, 11.60", 1.4 kg
Review » Review Gigabyte Padbook S1185 Convertible
Fujitsu Lifebook E753 Premium Selection: Intel Core i7-3632QM, 15.60", 2 kg
Review » Review Fujitsu Lifebook E753 Premium Selection Notebook
HP ProBook 450-H0V92EA: Intel Core i3-3120M, 15.60", 2.4 kg
Review » Review HP ProBook 450-H0V92EA Notebook
HP EliteBook Revolve 810: Intel Core i5-3437U, 11.60", 1.4 kg
Review » Review HP EliteBook Revolve 810 Convertible
Samsung ATIV 540U4E-K01US: Intel Core i5-3337U, 14.00", 2 kg
Review » Review Samsung ATIV Book 5 540U4E-K01US Ultrabook
Panasonic Toughbook CF-AX2: Intel Core i5-3427U, 11.60", 1.1 kg
Review » Review Panasonic Toughbook CF-AX2 Convertible
HP Split x2: Intel Core i3-3229Y, 13.30", 2.3 kg
Review » Review HP Split x2 Convertible
Asus Transformer Book TX300CA: Intel Core i7-3537U, 13.30", 1.9 kg
Review » Review Asus Transformer Book TX300CA Convertible
Lenovo ThinkPad Edge E431: Intel Core i5-3230M, 14.00", 2.1 kg
Review » Review Lenovo ThinkPad Edge E431 Notebook
Asus VivoBook S500CA-CJ005H: Intel Core i5-3317U, 15.60", 2.1 kg
Review » Review Asus VivoBook S500CA-CJ005H Ultrabook
Acer Aspire P3-171-3322Y2G06as: Intel Core i3-3229Y, 11.60", 1.3 kg
Review » Review Acer Aspire P3-171-3322Y2G06as Convertible
Lenovo IdeaPad Yoga 11S: Intel Core i5-3339Y, 11.60", 1.4 kg
Review » Review Lenovo IdeaPad Yoga 11S Ultrabook
Lenovo ThinkPad Helix: Intel Core i5-3317U, 11.60", 1.7 kg
Review » Review Lenovo ThinkPad Helix 3G Convertible
Asus PU500CA-XO002X: Intel Core i5-3317U, 15.60", 2 kg
Review » Review Asus PU500CA-XO002X Notebook
HP ProBook 4340s H4R47EA: Intel Core i3-3120M, 13.30", 2 kg
Review » Review HP ProBook 4340s H4R47EA Notebook
MSI S30-i3U465 Slim: Intel Core i3-3217U, 13.30", 1.4 kg
Review » Review MSI S30-i3U465 Slim Notebook
Dell XPS 18: Intel Core i5-3337U, 18.40", 2.3 kg
Review » Review Dell XPS 18 AIO Tablet
Lenovo ThinkPad T431s: Intel Core i5-3437U, 14.00", 1.6 kg
Review » Review Lenovo ThinkPad T431s Ultrabook
MSI S20-i541 UltraSlider: Intel Core i5-3337U, 11.60", 1.2 kg
Review » Review MSI S20-i541 UltraSlider Ultrabook
Dell Latitude 6430u HD+: Intel Core i5-3437U, 14.00", 1.8 kg
Review » Review Update Dell Latitude 6430u HD+ Ultrabook
Asus VivoBook S500CA-DS51T: Intel Core i5-3317U, 15.60", 2.2 kg
Review » Review Asus VivoBook S500CA-DS51T Ultrabook
Toshiba Tecra R940-1FL: Intel Core i5-3320M, 14.00", 2.1 kg
Review » Review Toshiba Tecra R940-1FL Notebook
Asus Taichi 31-CX003H: Intel Core i5-3317U, 13.30", 1.6 kg
Review » Review Asus Taichi 31-CX003H Convertible Ultrabook
Lenovo B580-M94A5GE: Intel Core i5-3210M, 15.60", 2.5 kg
Review » Review Lenovo B580-M94A5GE Notebook
Asus Q500A-BHI7T05: Intel Core i5-3230M, 15.60", 2.5 kg
Review » Review Asus Q500A-BHI7T05 Notebook
Schenker XIRIOS B502 i7-3632QM: Intel Core i7-3632QM, 15.60", 2.2 kg
Review » Review Schenker XIRIOS B502 (Clevo W155EU) Notebook
Acer TravelMate P643-V-6424: Intel Core i5-3320M, 14.00", 2.3 kg
Review » Review Acer TravelMate P643-V-6424 Notebook
Lenovo ThinkPad Edge E130 NZUAXMB: Intel Core i3-3227U, 11.60", 1.6 kg
Review » Review Lenovo ThinkPad Edge E130 NZUAXMB Notebook
Lenovo ThinkPad X230T: Intel Core i5-3320M, 12.50", 1.8 kg
Review » Review Lenovo ThinkPad X230t (N2C2AGE) Convertible
Samsung Ativ Smart PC Pro XE700T1C A02: Intel Core i5-3317U, 11.60", 1.6 kg
Review » Review Samsung ATIV Smart PC Pro XE700T1C A02 Convertible
Sony SV-T14124CXS: Intel Core i3-3227U, 14.00", 2 kg
Review » Review Sony Vaio SV-T14124CXS Notebook
Acer W700-53334G12as: Intel Core i5-3337U, 11.60", 1 kg
Review » Review Acer Iconia W700-53334G12as Tablet
Google Chromebook Pixel: Intel Core i5-3427U, 12.90", 1.5 kg
Review » Review Google Chromebook Pixel Notebook
Asus VivoBook S300CA: Intel Core i3-3217U, 13.30", 1.8 kg
Review » Review Asus VivoBook S300CA Subnotebook
Microsoft Surface Pro: Intel Core i5-3317U, 10.60", 0.9 kg
Review » Review Microsoft Surface Pro Tablet
Acer Aspire M5-481PT-6644: Intel Core i5-3337U, 14.00", 2 kg
Review » Review Acer Aspire M5-481PT-6644 Notebook
Samsung 400B5C-H02DE: Intel Core i5-3210M, 15.60", 2.5 kg
Review » Review Samsung Series 4 400B5C-H02DE Notebook
Sony Vaio Tap 20 SVJ2021V1E: Intel Core i5-3317U, 20.00", 5.1 kg
Review » Review Sony Vaio Tap 20 SVJ2021V1E Tablet
Toshiba Satellite P845T-S4310: Intel Core i5-3317U, 14.00", 2.2 kg
Review » Review Toshiba Satellite P845T-S4310 Notebook
Lenovo ThinkPad X1 Carbon Touch N3NAQGE: Intel Core i7-3667U, 14.00", 1.5 kg
Review » Review Lenovo ThinkPad X1 Carbon Touch Ultrabook
Acer Aspire M3-481-53314G50Mass: Intel Core i5-3317U, 14.00", 2 kg
Review » Review Acer Aspire M3-481 Ultrabook
Sony Vaio SV-E14A3M2ES: Intel Core i3-3120M, 14.00", 2.3 kg
Review » Review Sony Vaio SV-E14A3M2ES Notebook
Dell XPS 13 L322X: Intel Core i5-3337U, 13.30", 1.4 kg
Review » Review Update Dell XPS 13 L322X Ultrabook
Sony Vaio SV-T1511M1E/S: Intel Core i5-3337U, 15.60", 2.2 kg
Review » Review Sony Vaio SV-T1511M1E/S Ultrabook
Acer Aspire V5-571P-6499: Intel Core i5-3317U, 15.60", 2.4 kg
Review » Review Acer Aspire V5-571P-6499 Notebook
Fujitsu Stylistic Q702: Intel Core i5-3427U, 11.60", 1.7 kg
Review » Review Fujitsu Stylistic Q702 Convertible
Lenovo ThinkPad X230i-NZC7PGE: Intel Core i3-3110M, 12.50", 1.6 kg
Review » Review Lenovo ThinkPad X230i Notebook
Lenovo B590 MBX2JGE: Intel Core i3-3110M, 15.60", 2.5 kg
Review » Review Lenovo B590 MBX2JGE Notebook
HP Spectre XT TouchSmart 15-4000eg: Intel Core i5-3317U, 15.60", 2.2 kg
Review » Review HP Spectre XT TouchSmart 15-4000eg Ultrabook
Schenker XIRIOS S402: Intel Core i7-3517U, 14.00", 1.7 kg
Review » Review Schenker XIRIOS S402 Ultrabook
Dell Latitude E6530: Intel Core i5-3360M, 15.60", 2.8 kg
Review » Review Dell Latitude E6530 Notebook
Toshiba Satellite U920t-100: Intel Core i5-3317U, 12.50", 1.5 kg
Review » Review Toshiba Satellite U920t-100 Ultrabook
Asus P55VA-XO011X: Intel Core i5-3210M, 15.60", 2.6 kg
Review » Review Asus P55VA Notebook
Asus Zenbook Prime UX31A-C4027H: Intel Core i7-3517U, 13.30", 1.5 kg
Review » Review Asus Zenbook Prime UX31A Touch Ultrabook
Dell Latitude 6430u: Intel Core i5-3427U, 14.00", 1.8 kg
Review » Review Dell Latitude 6430u Ultrabook
HP EliteBook Folio 9470m H4P04EA: Intel Core i5-3427U, 14.00", 1.6 kg
Review » Review HP EliteBook Folio 9470m Ultrabook
Fujitsu Lifebook T902: Intel Core i5-3320M, 13.30", 2 kg
Review » Review Fujitsu LifeBook T902 Convertible
MSI CR41-i587: Intel Core i5-3210M, 14.00", 2.4 kg
Review » Review MSI CR41-i587 Notebook
Toshiba Satellite U940-101: Intel Core i5-3317U, 14.00", 1.7 kg
Review » Review Toshiba Satellite U940-101 Ultrabook
Acer Aspire S7-191-73514G25ass: Intel Core i7-3517U, 11.60", 1.1 kg
Review » Review Acer Aspire S7-191 Ultrabook
Lenovo IdeaPad U510 MBM62GE: Intel Core i3-3217U, 15.60", 2.2 kg
Review » Review Lenovo IdeaPad U510 Ultrabook
Toshiba Portege Z930-105: Intel Core i5-3427U, 13.30", 1.1 kg
Review » Review Toshiba Portégé Z930-105 Ultrabook
Samsung 540U3C-A01DE: Intel Core i5-3317U, 13.30", 1.6 kg
Review » Review Samsung 540U3C Ultrabook
Dell XPS 13: Intel Core i7-3517U, 13.30", 1.4 kg
Review » Review Dell XPS 13 Ultrabook (Late 2012)
HP ProBook 6470b-B5W83AW: Intel Core i5-3320M, 14.00", 2.4 kg
Review » Review HP ProBook 6470b Notebook
HP Envy TouchSmart 4-1102sg: Intel Core i5-3317U, 14.00", 2.1 kg
Review » Review HP Envy TouchSmart 4-1102sg Ultrabook
Sony Vaio SV-T1312V1ES: Intel Core i5-3317U, 13.30", 1.6 kg
Review » Review Sony Vaio T13 SVT1312V1ES Ultrabook
Asus VivoBook S200E-CT182H: Intel Core i3-3217U, 11.60", 1.4 kg
Review » Review Asus VivoBook S200E Subnotebook
HP ProBook 4540s-C4Z27EA: Intel Core i3-3110M, 15.60", 2.4 kg
Review » Review HP ProBook 4540s Notebook
Lenovo ThinkPad Twist S230u-33474HU: Intel Core i5-3317U, 12.50", 1.5 kg
Review » Review Lenovo ThinkPad Twist Convertible Ultrabook
Asus Taichi 21-CW001H: Intel Core i7-3517U, 11.60", 1.3 kg
Review » Review Asus Taichi 21 Convertible Ultrabook
Lenovo Thinkpad X1 Carbon N3N34GE: Intel Core i5-3427U, 14.00", 1.3 kg
Review » Review Update Lenovo ThinkPad X1 Carbon Ultrabook
Nexoc B510: Intel Core i5-3360M, 15.60", 2.5 kg
Review » Review Clevo W255CEW Barebones Notebook
Sony Vaio Duo 11 SV-D1121X9EB: Intel Core i5-3317U, 11.60", 1.3 kg
Review » Review Sony Vaio Duo 11 SV-D1121X9EB Ultrabook
Apple MacBook Pro Retina 13 inch 2012-10: Intel Core i5-3210M, 13.30", 1.6 kg
Review » Review Apple MacBook Pro 13 Retina 2.5 GHz Late 2012
Dell Latitude E6430s: Intel Core i5-3360M, 14.00", 2.1 kg
Review » Review Dell Latitude E6430s Notebook
Asus VivoBook S400CA-CA006H: Intel Core i5-3317U, 14.00", 1.9 kg
Review » Review Asus VivoBook S400CA Ultrabook
Lenovo IdeaPad Yoga 13: Intel Core i5-3317U, 13.30", 1.6 kg
Review » Review Lenovo IdeaPad Yoga 13 Ultrabook
HP EliteBook 2170p-B6Q15EA: Intel Core i7-3667U, 11.60", 1.4 kg
Review » Review HP EliteBook 2170p Subnotebook
Asus UX21A-K1010V: Intel Core i7-3517U, 11.60", 1.1 kg
Review » Review Asus Zenbook Prime UX21A Ultrabook
Acer Aspire S7 391-73514G25aws: Intel Core i7-3517U, 13.30", 1.3 kg
Review » Review Acer Aspire S7 391 Ultrabook
Dell Latitude E6230: Intel Core i5-3320M, 12.50", 1.7 kg
Review » Review Dell Latitude E6230 Notebook
Lenovo ThinkPad T430s: Intel Core i7-3520M, 14.00", 1.8 kg
Review » Review Update Lenovo ThinkPad T430s Notebook
Dell Latitude E6330: Intel Core i5-3320M, 13.30", 2 kg
Review » Review Dell Latitude E6330 Notebook
Dell XPS 12: Intel Core i7-3667U, 12.50", 1.5 kg
Review » Review Dell XPS 12 Convertible
Fujitsu LifeBook S792: Intel Core i7-3612QM, 13.30", 1.6 kg
Review » Review Fujitsu LifeBook S792 Notebook
Lenovo IdeaPad S400-MAY8LGE: Intel Core i5-3317U, 14.00", 1.8 kg
Review » Review Lenovo IdeaPad S400 Notebook
Samsung 900X3C-A04DE: Intel Core i7-3517U, 13.30", 1.2 kg
Review » Review Update Samsung Series 9 900X3C-A04DE Subnotebook
Lenovo ThinkPad L430: Intel Core i5-3210M, 14.00", 2.3 kg
Review » Review Lenovo ThinkPad L430 Notebook
Acer Aspire S5-391-73514G25akk: Intel Core i7-3517U, 13.30", 1.2 kg
Review » Review Acer Aspire S5-391-73514G25akk Ultrabook
Acer Aspire V5-171-53314G50ass: Intel Core i5-3317U, 11.60", 1.3 kg
Review » Review Acer Aspire V5-171-53314G50ass Subnotebook
Acer TravelMate P453-M-53214G50Makk: Intel Core i5-3210M, 15.60", 2.6 kg
Review » Review Acer TravelMate P453-M-53214G50Makk Notebook
HP Elitebook 2570p-B6Q10EA: Intel Core i7-3520M, 12.50", 1.6 kg
Review » Review HP Elitebook 2570p-B6Q10EA Notebook
Dell Latitude E6430: Intel Core i5-3320M, 14.00", 2.1 kg
Review » Review Dell Latitude E6430 Notebook
HP Envy Spectre XT 13-2000eg: Intel Core i5-3317U, 13.30", 1.4 kg
Review » Review HP Envy Spectre XT 13-2000eg Ultrabook
Dell Latitude E5430: Intel Core i5-3360M, 14.00", 2.5 kg
Review » Review Dell Latitude E5430 Notebook
Sony Vaio SV-Z1311Z9EX: Intel Core i7-3612QM, 13.10", 1.2 kg
Review » Review Sony Vaio SV-Z1311Z9EX Notebook
Acer Aspire S3-391-53314G52add: Intel Core i5-3317U, 13.30", 1.4 kg
Review » Review Acer Aspire S3-391-53314G52add Ultrabook
Fujitsu LifeBook U772: Intel Core i5-3427U, 14.00", 1.4 kg
Review » Review Fujitsu LifeBook U772 Ultrabook
Fujitsu LifeBook AH552/SL: Intel Core i5-3210M, 15.60", 2.2 kg
Review » Review Fujitsu LifeBook AH552/SL Notebook
Fujitsu Lifebook E782: Intel Core i5-3360M, 15.60", 2.5 kg
Review » Review Fujitsu Lifebook E782 Notebook
Lenovo ThinkPad X1 Carbon: Intel Core i7-3667U, 14.00", 1.3 kg
Review » Review Lenovo ThinkPad X1 Carbon Ultrabook
Dell Latitude E5530: Intel Core i5-3360M, 15.60", 2.9 kg
Review » Review Dell Latitude E5530 Notebook
Apple MacBook Air 11 inch 2012-06 MD223D/A: Intel Core i5-3317U, 11.60", 1.1 kg
Review » Review Apple MacBook Air 11 Mid 2012 Subnotebook
Fujitsu LifeBook UH572: Intel Core i5-3317U, 13.30", 1.6 kg
Review » Review Fujitsu LifeBook UH572 Ultrabook
Asus Zenbook Prime UX31A: Intel Core i5-3317U, 13.30", 1.4 kg
Review » Review Asus Zenbook Prime UX31A Ultrabook
Apple MacBook Air 13 inch 2012-06 MD231LL/A: Intel Core i5-3427U, 13.30", 1.4 kg
Review » Review Apple MacBook Air 13 Mid 2012 Subnotebook
Fujitsu Lifebook P772: Intel Core i5-3320M, 12.10", 1.5 kg
Review » Review Fujitsu Lifebook P772 Subnotebook
Apple MacBook Pro 13 Mid 2012: Intel Core i5-3210M, 13.30", 2.1 kg
Review » Review Apple MacBook Pro 13 2.5 GHz Mid 2012 Notebook
Toshiba Satellite Z930-119: Intel Core i5-3317U, 13.30", 1.1 kg
Review » Review Update Toshiba Satellite Z930-119 Ultrabook
Lenovo Thinkpad L530 2479-3BG: Intel Core i5-3360M, 15.60", 2.6 kg
Review » Quick Review Lenovo Thinkpad L530 2479-3BG Notebook
Toshiba Satellite U840W: Intel Core i5-3317U, 14.40", 1.7 kg
Review » Review Toshiba Satellite U840W 21:9 Ultrabook
Samsung 900X4C-A04DE: Intel Core i5-3317U, 15.00", 1.7 kg
Review » Review Update Samsung 900X4C-A04DE Notebook
Samsung 530U3C-A01DE: Intel Core i5-3317U, 13.30", 1.5 kg
Review » Review Samsung Series 5 530U3C-A01DE Ultrabook
Lenovo IdeaPad U310: Intel Core i5-3317U, 13.30", 1.7 kg
Review » Lenovo IdeaPad U310 Laptop Review
Dell Vostro 3360: Intel Core i5-3317U, 13.30", 1.7 kg
Review » Review Dell Vostro 3360 Notebook
Lenovo ThinkPad X230: Intel Core i5-3320M, 12.50", 1.4 kg
Review » Lenovo ThinkPad X230 2306-2AU Laptop Review
One M73-2N: Intel Core i7-3820QM, 17.30", 3.8 kg
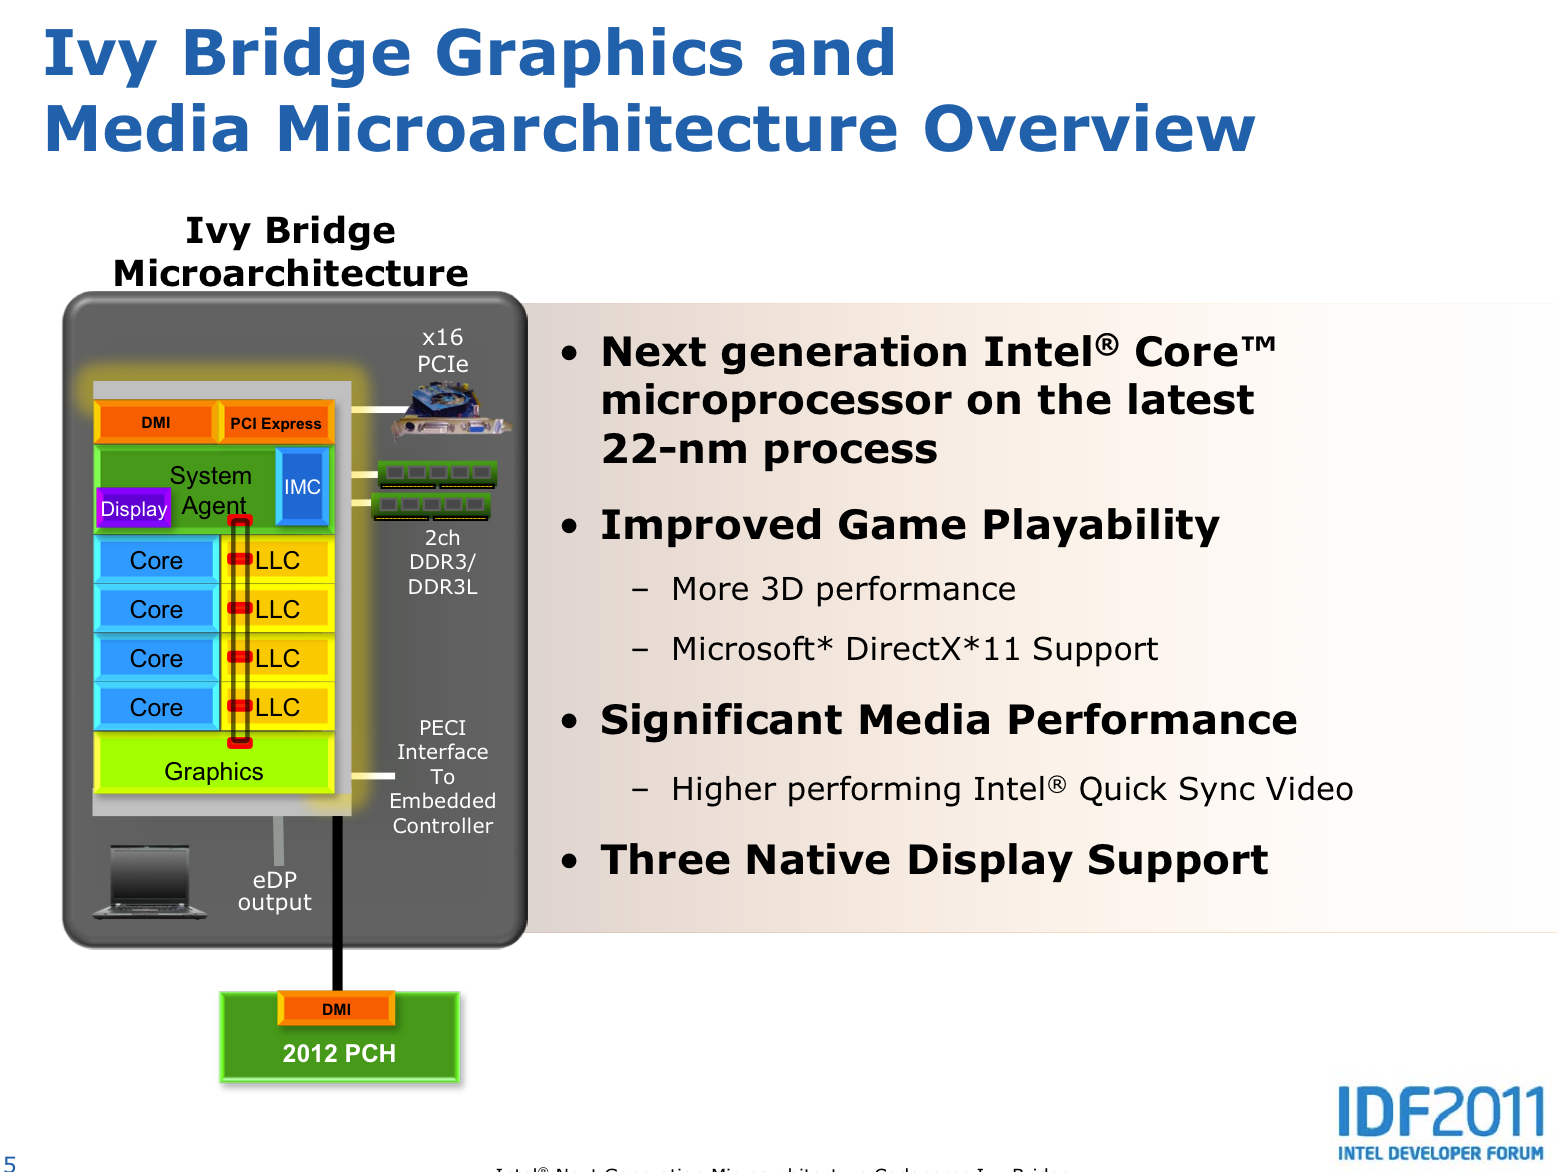
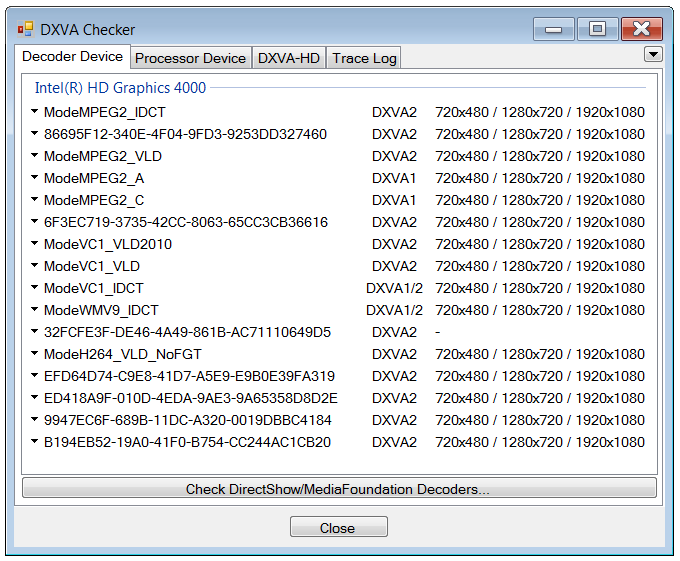
Review » Intel HD Graphics 4000 Benchmarked
HP ProBook 4340s-C5C86EA: Intel Core i3-3110M, 13.30", 2 kg
External Review » HP ProBook 4340s-C5C86EA
HP Pavilion g7-2373sd: Intel Core i5-3210M, 17.30", 3 kg
External Review » HP Pavilion g7-2373sd
Panasonic Toughpad FZ-G1-AAAFECE: Intel Core i5-3437U, 10.10", 1.1 kg
External Review » Panasonic Toughpad FZ-G1-AAAFECE
Toshiba Satellite C75-A-156: Intel Core i3-3110M, 17.30", 2.7 kg
External Review » Toshiba Satellite C75-A-156
Fujitsu Lifebook E743-0M55A1DE: Intel Core i5-3230M, 14.00", 1.8 kg
External Review » Fujitsu Lifebook E743-0M55A1DE
Toshiba Satellite C50-B-122: Intel Core i3-3217U, 15.60", 2.2 kg
External Review » Toshiba Satellite C50-B-122
HP Envy 4-1120SW: Intel Core i5-3317U, 14.00", 1.8 kg
External Review » HP Envy 4-1120SW
Asus ASUSPRO ESSENTIAL PU550CA: Intel Core i3-3217U, 15.60", 2.5 kg
External Review » Asus ASUSPRO ESSENTIAL PU550CA
Asus UX32LA-R3065H: Intel Core i7-4500U, 13.30", 1.5 kg
External Review » Asus UX32LA-R3065H
HP Elitebook Revolve 810 G1: Intel Core i5-3437U, 11.60", 1.4 kg
External Review » HP Elitebook Revolve 810 G1
Medion Akoya E6237-MD98476: Intel Core i3-3120M, 15.60", 2.4 kg
External Review » Medion Akoya E6237-MD98476
Panasonic Toughbook CF-195HAAXMG: Intel Core i5-3340M, 10.10", 2.3 kg
External Review » Panasonic Toughbook CF-195HAAXMG
HP 15-d090nr: Intel Core i3-3110M, 15.60", 2.2 kg
External Review » HP 15-d090nr
Lenovo IdeaPad S500-59392348: Intel Core i3-3217U, 15.60", 2.3 kg
External Review » Lenovo IdeaPad S500-59392348
Packard Bell EasyNote TE69: Intel Core i3-3217U, 15.60", 2.3 kg
External Review » Packard Bell EasyNote TE69
Asus Taichi 21-CW005H: Intel Core i5-3317U, 11.60", 1.3 kg
External Review » Asus Taichi 21-CW005H
Acer Travelmate X313-M-6824: Intel Core i3-3229Y, 11.60", 0.8 kg
External Review » Acer Travelmate X313-M-6824
Fujitsu Lifebook A532-0M45A1DE: Intel Core i5-3230M, 15.60", 2.3 kg
External Review » Fujitsu Lifebook A532-0M45A1DE
MSI S20-i541 UltraSlider: Intel Core i5-3337U, 11.60", 1.2 kg
External Review » MSI S20-i541 UltraSlider
Acer Iconia W701: Intel Core i5-3337U, 11.60", 1 kg
External Review » Acer Iconia W701
HP Compaq Presario CQ58-d11SG: Intel Core i3-3110M, 15.60", 2.5 kg
External Review » HP Compaq Presario CQ58-d11SG
Toshiba Portege Z10t-A-111: Intel Core i5-3339Y, 11.60", 1.5 kg
External Review » Toshiba Portege Z10t-A-111
Samsung ATIV Tab 7 XE700T1C-G01DE: Intel Core i5-3317U, 11.60", 0.9 kg
External Review » Samsung ATIV Tab 7 XE700T1C-G01DE
Acer TravelMate P253-M-33114G50Mnks: Intel Core i3-3110M, 15.60", 2.4 kg
External Review » Acer TravelMate P253-M-33114G50Mnks
Asus X550CA-XO153H: Intel Core i3-3217U, 15.60", 2.3 kg
External Review » Asus X550CA-XO153H
Acer Aspire E1-470P-6659: Intel Core i3-3217U, 14.00", 1.9 kg
External Review » Acer Aspire E1-470P-6659
Asus UX31A-C4037H: Intel Core i7-3537U, 13.30", 1.5 kg
External Review » Asus UX31A-C4037H
HP Split 13-m006tu x2: Intel Core i5-3339Y, 13.30", 1.1 kg
External Review » HP Split 13-m006tu x2
HP Pavilion 15-e003SM: Intel Core i3-3110M, 15.60", 2.4 kg
External Review » HP Pavilion 15-e003SM
Lenovo IdeaPad S500-59397130: Intel Core i3-3217U, 15.60", 2.4 kg
External Review » Lenovo IdeaPad S500-59397130
Acer Aspire P3-171-3322Y4G12AS: Intel Core i3-3229Y, 11.60", 1.4 kg
External Review » Acer Aspire P3-171-3322Y4G12AS
Sony Vaio SV-F15A1C5E: Intel Core i7-3537U, 15.60", 2.3 kg
External Review » Sony Vaio SV-F15A1C5E
Dell Inspiron 15R i15RM-7537sLV: Intel Core i7-3537U, 15.60", 2.3 kg
External Review » Dell Inspiron 15R i15RM-7537sLV
Toshiba Satellite U840T-109: Intel Core i3-3227U, 14.00", 1.8 kg
External Review » Toshiba Satellite U840T-109
Toshiba Portege Z10t-A-106: Intel Core i5-3439Y, 11.60", 1.5 kg
External Review » Toshiba Portege Z10t-A-106
Samsung 530U3C-A09UK: Intel Core i3-3217U, 13.30", 1.5 kg
External Review » Samsung 530U3C-A09UK
HP ProBook 470 G0-H0V07EA: Intel Core i5-3230M, 17.30", 2.9 kg
External Review » HP ProBook 470 G0-H0V07EA
Asus BU400A-W3101G: Intel Core i5-3317U, 14.00", 1.7 kg
External Review » Asus BU400A-W3101G
HP Split x2: Intel Core i3-3229Y, 13.30", 2.3 kg
External Review » HP Split x2
Acer Aspire E1-571-33114G50Mnks: Intel Core i3-3110M, 15.60", 2.5 kg
External Review » Acer Aspire E1-571-33114G50Mnks
Asus BU400A-CC107P: Intel Core i5-3317U, 14.00", 1.6 kg
External Review » Asus BU400A-CC107P
Asus VivoBook V500CA-CJ106H: Intel Core i7-3537U, 15.60", 2.2 kg
External Review » Asus VivoBook V500CA-CJ106H
Asus VivoBook V500CA-DB71T: Intel Core i7-3537U, 15.60", 2.2 kg
External Review » Asus VivoBook V500CA-DB71T
Toshiba Satellite C50-A-17R: Intel Core i3-3110M, 15.60", 2.3 kg
External Review » Toshiba Satellite C50-A-17R
Lenovo IdeaPad Yoga 11s-59377342: Intel Core i5-3339Y, 11.60", 1.3 kg
External Review » Lenovo IdeaPad Yoga 11s-59377342
Lenovo ThinkPad Edge E430-62712HG: Intel Core i3-3110M, 14.00", 2.1 kg
External Review » Lenovo ThinkPad Edge E430-62712HG
Lenovo ThinkPad L530-N2S4YPB: Intel Core i5-3230M, 15.60", 2.6 kg
External Review » Lenovo ThinkPad L530-N2S4YPB
Asus S46CA-WX077H: Intel Core i5-3317U, 14.00", 1.9 kg
External Review » Asus S46CA-WX077H
HP ProBook 4340s-C4Y10EA: Intel Core i3-3110M, 13.30", 2 kg
External Review » HP ProBook 4340s-C4Y10EA
Asus V550CA-CJ104H: Intel Core i3-2365M, 15.60", 2.3 kg
External Review » Asus V550CA-CJ104H
Samsung ATIV 450R5E-X01CZ: Intel Core i3-3120M, 15.60", 2 kg
External Review » Samsung ATIV 450R5E-X01CZ
Toshiba Satellite C55-A5246NR: Intel Core i3-3120M, 15.60", 2.4 kg
External Review » Toshiba Satellite C55-A5246NR
Lenovo IdeaPad S400-MAY9BGE: Intel Core i3-3227U, 14.00", 1.8 kg
External Review » Lenovo IdeaPad S400-MAY9BGE
Fujitsu Lifebook E753: Intel Core i5-3230M, 15.60", 2.1 kg
External Review » Fujitsu Lifebook E753
Toshiba Satellite C50-AI0110t: Intel Core i5-3210M, 14.00", 2 kg
External Review » Toshiba Satellite C50-AI0110t
Samsung ATIV 730U3E-K01HS: Intel Core i5-3337U, 13.30", 1.5 kg
External Review » Samsung ATIV 730U3E-K01HS
Samsung ATIV 540U4E-K01PL: Intel Core i5-3337U, 14.00", 1.8 kg
External Review » Samsung ATIV 540U4E-K01PL
Toshiba Tecra R940-1HR: Intel Core i7-3540M, 14.00", 2 kg
External Review » Toshiba Tecra R940-1HR
Lenovo ThinkPad L530-N2S3RGE: Intel Core i5-3210M, 15.60", 2.5 kg
External Review » Lenovo ThinkPad L530-N2S3RGE
Acer Aspire P3-171-6408: Intel Core i3-3229Y, 11.60", 1.4 kg
External Review » Acer Aspire P3-171-6408
Asus Transformer Book T300: Intel Core i5-4200U, 13.30", 1.2 kg
External Review » Asus Transformer Book T300
Toshiba Satellite C75-A-10P: Intel Core i3-3120M, 17.30", 2.7 kg
External Review » Toshiba Satellite C75-A-10P
Gigabyte S1185: Intel Core i5-3337U, 11.60", 1 kg
External Review » Gigabyte S1185
Dell Latitude E6430u: Intel Core i7-3667U, 14.00", 1.7 kg
External Review » Dell Latitude E6430u
Samsung 900X3E-A01UK: Intel Core i7-3517U, 13.30", 1.2 kg
External Review » Samsung 900X3E-A01UK
Sony Vaio SV-F1521C2E: Intel Core i3-3217U, 15.60", 2.5 kg
External Review » Sony Vaio SV-F1521C2E
Acer Aspire R7-571-53334G75ass: Intel Core i5-3337U, 15.60", 2.4 kg
External Review » Acer Aspire R7-571-53334G75ass
Asus Transformer Book TX300CA-C4006H: Intel Core i5-3317U, 13.30", 1.9 kg
External Review » Asus Transformer Book TX300CA-C4006H
Samsung 900X3E-A01PL: Intel Core i7-3537U, 13.30", 1.2 kg
External Review » Samsung 900X3E-A01PL
Asus VivoBook S400CA-CA006H: Intel Core i5-3317U, 14.00", 1.9 kg
External Review » Asus VivoBook S400CA-CA006H
Asus PU500CA-XO016X: Intel Core i3-3217U, 15.60", 2 kg
External Review » Asus PU500CA-XO016X
Fujitsu Lifebook E733: Intel Core i7-3632QM, 13.30", 1.7 kg
External Review » Fujitsu Lifebook E733
HP Pavilion 14-b003sa: Intel Core i3-3217U, 14.00", 1.8 kg
External Review » HP Pavilion 14-b003sa
Sony Vaio SV-F15212SNB: Intel Core i3-3227U, 15.60", 2.5 kg
External Review » Sony Vaio SV-F15212SNB
Toshiba Satellite P50-AI0010: Intel Core i3-3227U, 15.60", 2.5 kg
External Review » Toshiba Satellite P50-AI0010
Asus VivoBook S400CA-CA002H: Intel Core i3-3217U, 14.00", 1.8 kg
External Review » Asus VivoBook S400CA-CA002H
Sony Vaio SV-F1421L1EW: Intel Pentium 987, 14.00", 2.4 kg
External Review » Sony Vaio SV-F1421L1EW
Acer Aspire P3-171-5333Y4G12as: Intel Core i5-3339Y, 11.60", 0.8 kg
External Review » Acer Aspire P3-171-5333Y4G12as
Samsung ATIV 270E5E-K02PL: Intel Core i3-3120M, 15.60", 2.2 kg
External Review » Samsung ATIV 270E5E-K02PL
Lenovo ThinkPad Edge E130-NZU8CGE: Intel Core i3-3217U, 11.60", 1.5 kg
External Review » Lenovo ThinkPad Edge E130-NZU8CGE
HP EliteBook 2570p-B8S45AW: Intel Core i5-3360M, 12.50", 1.7 kg
External Review » HP EliteBook 2570p-B8S45AW
Lenovo ThinkPad X230-NZAEJPB: Intel Core i5-3210M, 12.50", 1.5 kg
External Review » Lenovo ThinkPad X230-NZAEJPB
Samsung ATIV 900X3E-K01US: Intel Core i7-3537U, 13.30", 1.2 kg
External Review » Samsung ATIV 900X3E-K01US
Acer Aspire R7-571-53336G50ass: Intel Core i5-3337U, 15.60", 2.4 kg
External Review » Acer Aspire R7-571-53336G50ass
Dell Latitude 6430u HD+: Intel Core i5-3437U, 14.00", 1.8 kg
External Review » Dell Latitude 6430u HD+
Asus VivoBook S400CA-CA028H: Intel Core i7-3517U, 14.00", 1.8 kg
External Review » Asus VivoBook S400CA-CA028H
Sony Vaio SV-F15212SN: Intel Core i3-3227U, 15.60", 2.5 kg
External Review » Sony Vaio SV-F15212SN
Asus Taichi 31-CX018H: Intel Core i7-3537U, 13.30", 1.6 kg
External Review » Asus Taichi 31-CX018H
Lenovo ThinkPad X230s: Intel Core i5-3337U, 12.50", 1.3 kg
External Review » Lenovo ThinkPad X230s
Samsung ATIV 540U4E-K01US: Intel Core i5-3337U, 14.00", 2 kg
External Review » Samsung ATIV 540U4E-K01US
Toshiba Satellite L55t-A5290: Intel Core i5-3337U, 15.60", 2.4 kg
External Review » Toshiba Satellite L55t-A5290
Toshiba Satellite P55t-A5202: Intel Core i5-4200U, 15.60", 2.4 kg
External Review » Toshiba Satellite P55t-A5202
Lenovo ThinkPad Edge E431: Intel Core i5-3230M, 14.00", 2.1 kg
External Review » Lenovo ThinkPad Edge E431
Asus S46CA-WX074H: Intel Core i3-3217U, 14.00", 2 kg
External Review » Asus S46CA-WX074H
Asus VivoBook S200 Graphite (Core i5): Intel Core i5-3317U, 11.60", 1.4 kg
External Review » Asus VivoBook S200 Graphite (Core i5)
Asus Transformer Book TX300CA-C4032P: Intel Core i5-3337U, 13.30", 1 kg
External Review » Asus Transformer Book TX300CA-C4032P
Samsung ATIV 740U3E-K01UB: Intel Core i5-3337U, 13.30", 1.6 kg
External Review » Samsung ATIV 740U3E-K01UB
Toshiba Portege R930-1CX: Intel Core i3-3120M, 13.30", 1.5 kg
External Review » Toshiba Portege R930-1CX
Lenovo IdeaPad U410-MAHC2GE: Intel Core i5-3317U, 14.00", 1.8 kg
External Review » Lenovo IdeaPad U410-MAHC2GE
Panasonic Toughbook CF-AX2: Intel Core i5-3427U, 11.60", 1.1 kg
External Review » Panasonic Toughbook CF-AX2
Lenovo IdeaPad U510-59358176: Intel Core i3-3217U, 15.60", 2.2 kg
External Review » Lenovo IdeaPad U510-59358176
HP Envy TouchSmart 4-1130sb: Intel Core i5-3317U, 14.00", 2.2 kg
External Review » HP Envy TouchSmart 4-1130sb
Acer Aspire P3-171-3322Y2G06as: Intel Core i3-3229Y, 11.60", 1.3 kg
External Review » Acer Aspire P3-171-3322Y2G06as
Lenovo ThinkPad S431: Intel Core i3-3227U, 14.00", 1.8 kg
External Review » Lenovo ThinkPad S431
Sony Vaio SVT1313S1E: Intel Core i5-3337U, 13.30", 1.7 kg
External Review » Sony Vaio SVT1313S1E
MSI S20-0M-009PL: Intel Core i5-3337U, 11.60", 1.2 kg
External Review » MSI S20-0M-009PL
Asus VivoBook S500CA-CJ008H: Intel Core i7-3517U, 15.60", 2.1 kg
External Review » Asus VivoBook S500CA-CJ008H
Asus P55VA-X0016X: Intel Core i3-3120M, 15.60", 2.6 kg
External Review » Asus P55VA-X0016X
Fujitsu LifeBook E743: Intel Core i5-3340M, 14.00", 1.8 kg
External Review » Fujitsu LifeBook E743
Samsung 400B5C-A04DE: Intel Core i5-3210M, 15.60", 2.5 kg
External Review » Samsung 400B5C-A04DE
Samsung 530U3C-A04PL: Intel Core i3-3217U, 13.30", 1.5 kg
External Review » Samsung 530U3C-A04PL
Panasonic ToughBook CF-C2: Intel Core i5-3427U, 12.50", 1.9 kg
External Review » Panasonic ToughBook CF-C2
Toshiba Satellite U920t-104: Intel Core i5-3317U, 12.50", 1.5 kg
External Review » Toshiba Satellite U920t-104
Dell Latitude E6330-3YNBD: Intel Core i5-3320M, 13.00", 2 kg
External Review » Dell Latitude E6330-3YNBD
Acer Iconia W700P-53334G12as: Intel Core i5-3317U, 11.60", 1 kg
External Review » Acer Iconia W700P-53334G12as
Toshiba Tecra R950-15E: Intel Core i3-3120M, 15.60", 2.5 kg
External Review » Toshiba Tecra R950-15E
Samsung 900X3D-A03PL: Intel Core i5-3317U, 13.30", 1.2 kg
External Review » Samsung 900X3D-A03PL
Dell XPS 13 L322X: Intel Core i5-3337U, 13.30", 1.4 kg
External Review » Dell XPS 13 L322X
Asus UX21A-K1004H: Intel Core i5-3317U, 11.60", 1.1 kg
External Review » Asus UX21A-K1004H
Toshiba Satellite U920t-102: Intel Core i3-3217U, 12.50", 1.5 kg
External Review » Toshiba Satellite U920t-102
Acer Aspire S3-391-53314G52add: Intel Core i5-3317U, 13.30", 1.4 kg
External Review » Acer Aspire S3-391-53314G52add
Samsung ATIV Smart PC Pro XE700T1C-A04PL: Intel Core i5-3317U, 15.60", 1.6 kg
External Review » Samsung ATIV Smart PC Pro XE700T1C-A04PL
Asus VivoBook S300CA-C1015H: Intel Core i5-3317U, 13.30", 1.8 kg
External Review » Asus VivoBook S300CA-C1015H
Samsung 530U3C-A05PL: Intel Core i5-3317U, 13.30", 1.5 kg
External Review » Samsung 530U3C-A05PL
Toshiba Portege Z930-131: Intel Core i5-3317U, 13.30", 1.1 kg
External Review » Toshiba Portege Z930-131
Asus S56CA-XO124H: Intel Core i5-3317U, 15.60", 2.2 kg
External Review » Asus S56CA-XO124H
Samsung ATIV 540U4E-K01U: Intel Core i5-3337U, 14.00", 2 kg
External Review » Samsung ATIV 540U4E-K01U
Asus Taichi 31-DH71: Intel Core i7-3517U, 13.30", 1.5 kg
External Review » Asus Taichi 31-DH71
Sony Vaio Tap 20-SVJ2022M1E: Intel Core i3-3227U, 20.00", 8 kg
External Review » Sony Vaio Tap 20-SVJ2022M1E
Toshiba Satellite U840W-10M: Intel Core i5-3317U, 14.40", 1.7 kg
External Review » Toshiba Satellite U840W-10M
Medion Akoya S4215: Intel Core i5-3337U, 14.00", 1.9 kg
External Review » Medion Akoya S4215
Lenovo IdeaPad U510 MBM62GE: Intel Core i3-3217U, 15.60", 2.2 kg
External Review » Lenovo IdeaPad U510 MBM62GE
Asus Taichi 31-CX010H: Intel Core i7-3517U, 13.30", 1.5 kg
External Review » Asus Taichi 31-CX010H
Acer W700-53334G12as: Intel Core i5-3337U, 11.60", 1 kg
External Review » Acer W700-53334G12as
Fujitsu Lifebook T902: Intel Core i5-3320M, 13.30", 2 kg
External Review » Fujitsu Lifebook T902
HP Pavilion Sleekbook 14-b000sg: Intel Core i3-3217U, 14.00", 1.8 kg
External Review » HP Pavilion Sleekbook 14-b000sg
Toshiba Satellite U920t-10H: Intel Core i5-3337U, 12.50", 1.5 kg
External Review » Toshiba Satellite U920t-10H
Asus Taichi 21-CW009H: Intel Core i7-3517U, 11.60", 1.3 kg
External Review » Asus Taichi 21-CW009H
Toshiba Portege Z930-D3S: Intel Core i5-3317U, 13.30", 1.1 kg
External Review » Toshiba Portege Z930-D3S
Samsung Ativ Smart PC Pro XE700T1C A02: Intel Core i5-3317U, 11.60", 1.6 kg
External Review » Samsung Ativ Smart PC Pro XE700T1C A02
Toshiba WT310: Intel Core i5-3339Y, 11.60", 0.8 kg
External Review » Toshiba WT310
Asus PU500CA-XO002X: Intel Core i5-3317U, 15.60", 2 kg
External Review » Asus PU500CA-XO002X
Samsung 900X3E-A01SE: Intel Core i5-3337U, 13.30", 1.2 kg
External Review » Samsung 900X3E-A01SE
Lenovo ThinkPad X230-2325-79G: Intel Core i5-3210M, 12.50", 1.8 kg
External Review » Lenovo ThinkPad X230-2325-79G
Lenovo ThinkPad T430-N1RLTPB: Intel Core i5-3210M, 14.00", 2.2 kg
External Review » Lenovo ThinkPad T430-N1RLTPB
HP Envy TouchSmart 4-1161er: Intel Core i5-3317U, 14.00", 2.2 kg
External Review » HP Envy TouchSmart 4-1161er
Lenovo ThinkPad Edge E530-NZQHLGE: Intel Core i5-3210M, 15.60", 2.4 kg
External Review » Lenovo ThinkPad Edge E530-NZQHLGE
Samsung 300E5C-A02US: Intel Core i5-3210M, 15.60", 2 kg
External Review » Samsung 300E5C-A02US
Samsung 900X3D-A01HU: Intel Core i5-3317U, 13.30", 1.2 kg
External Review » Samsung 900X3D-A01HU
Samsung 530U3C-A03HU: Intel Core i3-3217U, 13.30", 1.5 kg
External Review » Samsung 530U3C-A03HU
HP Spectre XT TouchSmart 15-4000EF: Intel Core i5-3317U, 15.60", 2.2 kg
External Review » HP Spectre XT TouchSmart 15-4000EF
Acer Aspire S7-191-53334G12ASS: Intel Core i5-3337U, 11.60", 1 kg
External Review » Acer Aspire S7-191-53334G12ASS
Samsung 740U3E-A01FR: Intel Core i5-3337U, 13.30", 1.7 kg
External Review » Samsung 740U3E-A01FR
HP Pavilion Sleekbook 15-b055sf: Intel Core i5-3317U, 15.60", 2.1 kg
External Review » HP Pavilion Sleekbook 15-b055sf
Toshiba Portege Z10t: Intel Core i5-3339Y, 11.60", 1.4 kg
External Review » Toshiba Portege Z10t
Sony Vaio SV-F15A15CXS: Intel Core i5-3337U, 15.60", 2.7 kg
External Review » Sony Vaio SV-F15A15CXS
Lenovo IdeaPad U310-59365023 Touch: Intel Core i5-3337U, 13.30", 1.7 kg
External Review » Lenovo IdeaPad U310-59365023 Touch
Dell Inspiron i15z-4801slv: Intel Core i7-3537U, 15.60", 2.2 kg
External Review » Dell Inspiron i15z-4801slv
Gigabyte U2142-CF1: Intel Core i5-3337U, 11.60", 1.4 kg
External Review » Gigabyte U2142-CF1
Samsung ATIV 900X3F-K01US: Intel Core i5-3337U, 13.30", 1.2 kg
External Review » Samsung ATIV 900X3F-K01US
Toshiba Satellite U940-117: Intel Core i5-3317U, 14.00", 1.7 kg
External Review » Toshiba Satellite U940-117
Clevo W550EU: Intel Core i7-3635QM, 15.60", 2.2 kg
External Review » Clevo W550EU
Dell XPS 18: Intel Core i5-3337U, 18.40", 2.3 kg
External Review » Dell XPS 18
HP EliteBook Revolve 810: Intel Core i5-3437U, 11.60", 1.4 kg
External Review » HP EliteBook Revolve 810
HP Envy TouchSmart Ultrabook 4t-1200: Intel Core i5-3337U, 14.00", 1.8 kg
External Review » HP Envy TouchSmart Ultrabook 4t-1200
Lenovo ThinkPad Helix: Intel Core i5-3427U, 11.60", 2.5 kg
External Review » Lenovo ThinkPad Helix
Asus Transformer Book TX300CA-C4005H: Intel Core i7-3517U, 13.30", 1.9 kg
External Review » Asus Transformer Book TX300CA-C4005H
Lenovo ThinkPad T431s: Intel Core i5-3437U, 14.00", 1.6 kg
External Review » Lenovo ThinkPad T431s
Schenker XIRIOS B502 i7-3632QM: Intel Core i7-3632QM, 15.60", 2.2 kg
External Review » Schenker XIRIOS B502 i7-3632QM
Acer Aspire S7-391-6413: Intel Core i5-3337U, 13.30", 1.3 kg
External Review » Acer Aspire S7-391-6413
Toshiba Satellite U940-11N: Intel Core i5-3337U, 14.00", 1.7 kg
External Review » Toshiba Satellite U940-11N
Samsung 540U3C-A02UK: Intel Core i3-3217U, 13.30", 1.7 kg
External Review » Samsung 540U3C-A02UK
Panasonic Toughpad FZ-G1: Intel Core i5-3437U, 10.10", 1 kg
External Review » Panasonic Toughpad FZ-G1
Acer Aspire P3-171-6820: Intel Core i5-3339Y, 11.60", 1.4 kg
External Review » Acer Aspire P3
Dell XPS 13 Developer Edition: Intel Core i7-3537U, 13.30", 1.3 kg
External Review » Dell XPS 13 Developer Edition
Acer Aspire R7-571-6858: Intel Core i5-3337U, 15.60", 2.4 kg
External Review » Acer Aspire R7
Toshiba Satellite P875-S7102: Intel Core i7-3630QM, 17.30", 3 kg
External Review » Toshiba Satellite P875-S7102
Asus S56CA-DH31: Intel Core i3-3217U, 15.60", 2.2 kg
External Review » Asus S56CA-DH31
Samsung 300E5E-A05CA: Intel Core i5-3230M, 15.60", 2.2 kg
External Review » Samsung 300E5E-A05CA
Acer Aspire V5-571P-6627: Intel Core i3-3217U, 15.60", 2.4 kg
External Review » Acer Aspire V5-571P-6627
Sony Vaio SV-F15217CXW: Intel Core i5-3337U, 15.60", 2.7 kg
External Review » Sony Vaio SV-F15217CXW
HP Elitebook 2570p-B6Q06ET: Intel Core i5-3210M, 12.50", 1.6 kg
External Review » HP Elitebook 2570p-B6Q06ET
Sony Vaio SV-F14A15CXB: Intel Core i5-3337U, 14.00", 1.9 kg
External Review » Sony Vaio SV-F14A15CXB
Fujitsu Lifebook E782: Intel Core i5-3360M, 15.60", 2.5 kg
External Review » Fujitsu Lifebook E782
Lenovo Thinkpad X1 Carbon N3N34GE: Intel Core i5-3427U, 14.00", 1.3 kg
External Review » Lenovo Thinkpad X1 Carbon N3N34GE
Toshiba Kirabook: Intel Core i7-3537U, 13.30", 1.2 kg
External Review » Toshiba Kirabook
Asus VivoBook S300CA-C1016H: Intel Core i3-3217U, 13.30", 1.8 kg
External Review » Asus VivoBook S300CA-C1016H
Gammatech Durabook U12Ci: Intel Core i5-3317U, 12.10", 2.5 kg
External Review » Gammatech Durabook U12Ci
Samsung 540U3C-A01CA: Intel Core i5-3317U, 13.30", 1.6 kg
External Review » Samsung 540U3C-A01CA
Asus VivoBook S550CA-DS51T: Intel Core i5-3317U, 15.60", 2.6 kg
External Review » Asus VivoBook S550CA-DS51T
Asus Taichi 31-CX003H: Intel Core i5-3317U, 13.30", 1.6 kg
External Review » Asus Taichi 31-CX003H
Medion Akoya E6232-MD99222: Intel Core i3-3120M, 11.60", 2.5 kg
External Review » Medion Akoya E6232-MD99222
HP ProBook 6470b-B6P73EA: Intel Core i5-3210M, 14.00", 2 kg
External Review » HP ProBook 6470b-B6P73EA
Sony Vaio SV-E14A3M2ES: Intel Core i3-3120M, 14.00", 2.3 kg
External Review » Sony Vaio SV-E14A3M2ES
Sony Vaio Duo 11 SV-D11215CGB: Intel Core i5-3317U, 11.60", 1.3 kg
External Review » Sony Vaio Duo 11 SV-D11215CGB
Samsung 550P5C-A02UB: Intel Core i3-3110M, 15.60", 2.5 kg
External Review » Samsung 550P5C-A02UB
Lenovo Essential G580-59354100: Intel Core i5-3210M, 15.60", 2.7 kg
External Review » Lenovo Essential G580-59354100
Lenovo IdeaPad Yoga 11S: Intel Core i5-3339Y, 11.60", 1.4 kg
External Review » Lenovo IdeaPad Yoga 11S
Sony Vaio SV-T13126CNS: Intel Core i5-3317U, 13.30", 1.6 kg
External Review » Sony Vaio SV-T13126CNS
Asus VivoBook F202E-CT148H: Intel Core i3-3217U, 11.60", 1.4 kg
External Review » Asus VivoBook F202E-CT148H
Toshiba Satellite P845T-101: Intel Core i5-3317U, 14.00", 2 kg
External Review » Toshiba Satellite P845T-101
Sony Vaio SV-T1313C5E: Intel Core i5-3317U, 13.30", 1.6 kg
External Review » Sony Vaio SV-T1313C5E
Samsung 740U3E-A01UB: Intel Core i5-3337U, 13.30", 1.6 kg
External Review » Samsung 740U3E-A01UB
Sony Vaio SV-T141290X: Intel Core i5-3337U, 14.00", 2.1 kg
External Review » Sony Vaio SV-T141290X
HP Pavilion Sleekbook 15t-b100: Intel Core i3-3227U, 15.60", 2.1 kg
External Review » HP Pavilion Sleekbook 15t-b100
Lenovo IdeaPad Z400-59362575: Intel Core i5-3230M, 14.00", 2 kg
External Review » Lenovo IdeaPad Z400-59362575
Toshiba Satellite P840T-ST4N02: Intel Core i7-3537U, 14.00", 1.9 kg
External Review » Toshiba Satellite P840T-ST4N02
Toshiba Satellite U845T-S4165: Intel Core i5-3337U, 14.00", 1.7 kg
External Review » Toshiba Satellite U845T-S4165
Samsung 540U3C-A01US: Intel Core i5-3317U, 13.30", 1.7 kg
External Review » Samsung 540U3C-A01US
Toshiba Tecra R940-1JG: Intel Core i5-3230M, 14.00", 2 kg
External Review » Toshiba Tecra R940-1JG
Asus P55VA-XO011X: Intel Core i5-3210M, 15.60", 2.6 kg
External Review » Asus P55VA-XO011X
Dell Inspiron 17-3721: Intel Core i3-3227U, 17.30", 2.6 kg
External Review » Dell Inspiron 17-3721
Acer Aspire M5-481PT-6644: Intel Core i5-3337U, 14.00", 2 kg
External Review » Acer Aspire M5-481PT-6644
Acer Aspire M5-581T-6405: Intel Core i5-3337U, 15.60", 2.3 kg
External Review » Acer Aspire M5-581T-6405
Acer Aspire S7-191-6859: Intel Core i5-3317U, 11.60", 1.1 kg
External Review » Acer Aspire S7-191-6859
Asus Taichi 21-DH51: Intel Core i5-3317U, 11.60", 1.3 kg
External Review » Asus Taichi 21-DH51
Asus UX31A-R4003H: Intel Core i7-3517U, 13.30", 1.3 kg
External Review » Asus UX31A-R4003H
Asus VivoBook S500CA-DS51T: Intel Core i5-3317U, 15.60", 2.2 kg
External Review » Asus VivoBook S500CA-DS51T
Toshiba Satellite U925T-S2120: Intel Core i5-3337U, 12.50", 1.5 kg
External Review » Toshiba Satellite U925T-S2120
Asus VivoBook Q200E-BSI3T08: Intel Core i3-3217U, 11.60", 1.4 kg
External Review » Asus VivoBook Q200E-BSI3T08
Sony Vaio Duo 11 SV-D11223CXB: Intel Core i5-3337U, 11.60", 1.3 kg
External Review » Sony Vaio Duo 11 SV-D11223CXB
LG Z360: Intel Core i7-3517U, 13.30", 1.2 kg
External Review » LG Z360
Fujitsu Stylistic Q702: Intel Core i5-3427U, 11.60", 1.7 kg
External Review » Fujitsu Stylistic Q702
Acer Aspire V5-571P-53316G50Mass: Intel Core i5-3317U, 15.60", 2.4 kg
External Review » Acer Aspire V5-571P-53316G50Mass
Sony Vaio SV-T15112CXS: Intel Core i5-3337U, 15.60", 2.2 kg
External Review » Sony Vaio SV-T15112CXS
HP Spectre XT TouchSmart 15-4010nr: Intel Core i7-3517U, 15.60", 2.2 kg
External Review » HP Spectre XT TouchSmart 15-4010nr
Asus X201E-KX003H: Intel Pentium 987, 11.60", 1.3 kg
External Review » Asus X201E-KX003H
Asus VivoBook S400E-CA038H: Intel Core i3-3217U, 14.00", 1.9 kg
External Review » Asus VivoBook S400E-CA038H
Dell Latitude 6430: Intel Core i5-3320M, 14.00", 2 kg
External Review » Dell Latitude 6430
Sony Vaio Duo 11 SV-D1121Q2EB: Intel Core i5-3317U, 11.60", 1.3 kg
External Review » Sony Vaio Duo 11 SV-D1121Q2EB
Acer Aspire M5-481PT-53314G52Mass: Intel Core i5-3317U, 14.00", 2 kg
External Review » Acer Aspire M5-481PT-53314G52Mass
Dell XPS 12 PREMIUM: Intel Core i7-3517U, 12.50", 1.5 kg
External Review » Dell XPS 12 PREMIUM
Toshiba Satellite U840W-10N: Intel Core i5-3317U, 14.40", 1.7 kg
External Review » Toshiba Satellite U840W-10N
Dell XPS 13 Gold: Intel Core i5-3317U, 13.30", 1.4 kg
External Review » Dell XPS 13 Gold
Acer Aspire S7-191-6640: Intel Core i5-3317U, 11.60", 1.1 kg
External Review » Acer Aspire S7-191-6640
Asus UX31A-BHI5T: Intel Core i5-3317U, 13.30", 1.3 kg
External Review » Asus UX31A-BHI5T
Asus VivoBook S400CA-CA012H: Intel Core i5-3317U, 14.00", 1.8 kg
External Review » Asus VivoBook S400CA-CA012H
Google Chromebook Pixel: Intel Core i5-3427U, 12.90", 1.5 kg
External Review » Google Chromebook Pixel
Sony Vaio SV-T1511M1E/S: Intel Core i5-3337U, 15.60", 2.2 kg
External Review » Sony Vaio SV-T1511M1E/S
Lenovo ThinkPad Twist S230u-33472GF: Intel Core i7-3517U, 12.50", 1.6 kg
External Review » Lenovo ThinkPad Twist S230u-33472GF
Schenker XIRIOS S402: Intel Core i7-3517U, 14.00", 1.7 kg
External Review » Schenker XIRIOS S402
HP Spectre XT TouchSmart 15-4000ea: Intel Core i5-3317U, 15.60", 2.2 kg
External Review » HP Spectre XT TouchSmart 15-4000ea
Lenovo IdeaPad G580-MAAQ9UK: Intel Core i3-3110M, 15.60", 2.7 kg
External Review » Lenovo IdeaPad G580-MAAQ9UK
Cyberpower Zeus M2: Intel Core i5-3317U, 14.10", 1.4 kg
External Review » Cyberpower Zeus M2
MSI Slidebook S20: Intel Core i5-3317U, 11.60", 1.2 kg
External Review » MSI Slidebook S20
HP Spectre XT 13-2100ea: Intel Core i5-3317U, 13.30", 1.4 kg
External Review » HP Spectre XT 13-2100ea
Asus Taichi 21-CW003H: Intel Core i5-3317U, 11.60", 1.3 kg
External Review » Asus Taichi 21-CW003H
Gigabyte X11-9WX110000: Intel Core i7-3517U, 11.60", 1 kg
External Review » Gigabyte X11-9WX110000
Sony Vaio SV-T15115CXS: Intel Core i7-3537U, 15.50", 2.3 kg
External Review » Sony Vaio SV-T15115CXS
Samsung 540U3C-A02UB: Intel Core i3-3217U, 13.30", 1.7 kg
External Review » Samsung 540U3C-A02UB
Acer Aspire M3-581PT: Intel Core i3-3217U, 15.60", 2.3 kg
External Review » Acer Aspire M3-581PT
Samsung 540U3C-A01UK: Intel Core i5-3317U, 13.30", 1.7 kg
External Review » Samsung 540U3C-A01UK
Dell XPS 13-L321X-MLK: Intel Core i5-3337U, 13.30", 1.4 kg
External Review » Dell XPS 13-L321X-MLK
Lenovo ThinkPad Twist S230u-33473EM: Intel Core i5-3317U, 12.50", 1.6 kg
External Review » Lenovo ThinkPad Twist S230u-33473EM
HP Spectre XT TouchSmart 15t-4000: Intel Core i7-3517U, 15.60", 2.2 kg
External Review » HP Spectre XT TouchSmart 15t-4000
Asus Taichi 21-DH71: Intel Core i7-3517U, 11.60", 1.3 kg
External Review » Asus Taichi 21-DH71
HP Elitebook 2570p-B6Q10EA: Intel Core i7-3520M, 12.50", 1.6 kg
External Review » HP Elitebook 2570p-B6Q10EA
Toshiba Satellite U940-101: Intel Core i5-3317U, 14.00", 1.7 kg
External Review » Toshiba Satellite U940-101
Toshiba Satellite P845T-102: Intel Core i3-3217U, 14.00", 2 kg
External Review » Toshiba Satellite P845T-102
Sony Vaio Duo 11 SV-D1121Z9EB: Intel Core i7-3517U, 11.60", 1.3 kg
External Review » Sony Vaio Duo 11 SV-D1121Z9EB
Asus VivoBook S400E-CA040H: Intel Core i7-3517U, 14.00", 1.8 kg
External Review » Asus VivoBook S400E-CA040H
HP Envy dv7-7250us: Intel Core i7-3630QM, 17.30", 3.2 kg
External Review » HP Envy dv7-7250us
Asus X75A-XH51: Intel Core i5-3210M, 17.30", 3 kg
External Review » Asus X75A-XH51
Sony Vaio Duo 11 SV-D11213CN: Intel Core i5-3317U, 11.60", 1.3 kg
External Review » Sony Vaio Duo 11 SV-D11213CN
Samsung 540U3C-A01DE: Intel Core i5-3317U, 13.30", 1.6 kg
External Review » Samsung 540U3C-A01DE
Sony Vaio Duo 11 SV-D1121X9EB: Intel Core i5-3317U, 11.60", 1.3 kg
External Review » Sony Vaio Duo 11 SV-D1121X9EB
Lenovo IdeaPad S300-MA14DGE: Intel Core i5-3317U, 13.30", 1.6 kg
External Review » Lenovo IdeaPad S300-MA14DGE
Toshiba Satellite U940-100: Intel Core i3-3217U, 14.00", 1.7 kg
External Review » Toshiba Satellite U940-100
Dell Latitude 6430u: Intel Core i5-3427U, 14.00", 1.8 kg
External Review » Dell Latitude 6430u
Sony Vaio SV-T1312Z9ES: Intel Core i7-3517U, 13.30", 1.7 kg
External Review » Sony Vaio SV-T1312Z9ES
Samsung ATIV Smart PC Pro XE700T1C-A01US: Intel Core i5-3317U, 11.60", 0.9 kg
External Review » Samsung ATIV Smart PC Pro XE700T1C-A01US
HP Spectre XT 13-2114TU: Intel Core i7-3517U, 13.30", 1.4 kg
External Review » HP Spectre XT 13-2114TU
Samsung 540U3C-A01HK: Intel Core i7-3517U, 13.30", 1.7 kg
External Review » Samsung 540U3C-A01HK
HP Envy 4-1100: Intel Core i5-3317U, 14.00", 1.8 kg
External Review » HP Envy 4-1100
Asus S56CA-XX024H: Intel Core i3-3217U, 15.60", 2.3 kg
External Review » Asus S56CA-XX024H
Microsoft Surface Pro: Intel Core i5-3317U, 10.60", 0.9 kg
External Review » Microsoft Surface Pro
Lenovo ThinkPad X1 Carbon Touch N3NAQGE: Intel Core i7-3667U, 14.00", 1.5 kg
External Review » Lenovo ThinkPad X1 Carbon Touch
HP Spectre XT TouchSmart 15-4000eg: Intel Core i5-3317U, 15.60", 2.2 kg
External Review » HP Spectre XT TouchSmart 15-4000eg
Asus VivoBook X202E-DH31T: Intel Core i3-3217U, 11.60", 1.3 kg
External Review » Asus VivoBook X202E-DH31T
Asus Zenbook Prime UX31A-C4027H: Intel Core i7-3517U, 13.30", 1.5 kg
External Review » Asus UX31A-C4027H
Toshiba Satellite C875-S7340: Intel Core i3-3110M, 17.30", 2.7 kg
External Review » Toshiba Satellite C875-S7340
Asus S46CA-XH51: Intel Core i5-3317U, 14.10", 2 kg
External Review » Asus S46CA-XH51
HP Envy dv7t-7200: Intel Core i5-3210M, 17.30", 3.1 kg
External Review » HP Envy dv7t-7200
HP Envy Spectre XT 14-2000er: Intel Core i5-3317U, 13.30", 1.4 kg
External Review » HP Envy Spectre XT 14-2000er
Acer Aspire S7-191-53314G12ass: Intel Core i5-3317U, 11.60", 1.3 kg
External Review » Acer Aspire S7-191-53314G12ass
Lenovo ThinkPad X230-NZC23HW: Intel Core i7-3520M, 12.50", 1.5 kg
External Review » Lenovo ThinkPad X230-NZC23HW
Dell Inspiron 5521: Intel Core i3-3217U, 15.60", 2.4 kg
External Review » Dell Inspiron 5521
Sony Vaio Duo 11 SV-D1121P2EB: Intel Core i3-3217U, 11.60", 1.3 kg
External Review » Sony Vaio Duo 11 SV-D1121P2EB
Sony Vaio SVT1312A4E/S: Intel Core i5-3317U, 13.30", 1.7 kg
External Review » Sony Vaio SVT1312A4E/S
HP Envy 4-1180SF: Intel Core i5-3317U, 14.00", 2.1 kg
External Review » HP Envy 4-1180SF
HP EliteBook Folio 9470m: Intel Core i5-3427U, 14.00", 1.6 kg
External Review » HP EliteBook Folio 9470m
Samsung 900X4C-A02SE: Intel Core i7-3517U, 15.00", 1.7 kg
External Review » Samsung 900X4C-A02SE
Asus Taichi 31: Intel Core i5-3317U, 13.30", 1.6 kg
External Review » Asus Taichi 31
Lenovo ThinkPad Edge E130: Intel Core i5-3317U, 11.60", 1.6 kg
External Review » Lenovo ThinkPad Edge E130
Panasonic Toughbook CF-53JSWZGFG: Intel Core i5-3320M, 14.00", 2.7 kg
External Review » Panasonic Toughbook CF-53JSWZGFG
Toshiba Satellite U945-S4380: Intel Core i3-3217U, 14.00", 1.9 kg
External Review » Toshiba Satellite U945-S4380
Toshiba Satellite S855-S5378: Intel Core i7-3630QM, 15.60", 2.5 kg
External Review » Toshiba Satellite S855-S5378
HP Envy TouchSmart 4-1102sg: Intel Core i5-3317U, 14.00", 2.1 kg
External Review » HP Envy TouchSmart 4-1102sg
Samsung 900X4D-A03DE: Intel Core i5-3317U, 15.60", 1.6 kg
External Review » Samsung 900X4D-A03DE
Sony Vaio SV-T13122CXS: Intel Core i3-3217U, 13.30", 1.6 kg
External Review » Sony Vaio SV-T13122CXS
Asus VivoBook S400CA-UH51: Intel Core i5-3317U, 14.00", 1.8 kg
External Review » Asus VivoBook S400CA-UH51
Sony Vaio SV-T14117CXS: Intel Core i7-3517U, 14.00", 1.9 kg
External Review » Sony Vaio SV-T14117CXS
HP Envy 4-1130us: Intel Core i5-3317U, 14.00", 1.7 kg
External Review » HP Envy 4-1130us
Asus VivoBook X202E: Intel Core i3-3217U, 11.60", 1.3 kg
External Review » Asus VivoBook X202E
Toshiba Portege Z930-102: Intel Core i7-3667U, 13.30", 1.1 kg
External Review » Toshiba Portege Z930-102
Toshiba Portege Z930-10T: Intel Core i5-3317U, 13.30", 1.1 kg
External Review » Toshiba Portege Z930-10T
Toshiba Satellite U920t-100: Intel Core i5-3317U, 12.50", 1.5 kg
External Review » Toshiba Satellite U920t-100
Asus VivoBook S200E-CT182H: Intel Core i3-3217U, 11.60", 1.4 kg
External Review » Asus VivoBook S200E-CT182H
Toshiba Satellite U945-S4390: Intel Core i5-3317U, 14.00", 2 kg
External Review » Toshiba Satellite U945-S4390
HP Envy 4-1150ec: Intel Core i5-3317U, 14.00", 1.8 kg
External Review » HP Envy 4-1150ec
Samsung 900X3C-A01RS: Intel Core i5-3317U, 13.30", 1.2 kg
External Review » Samsung 900X3C-A01RS
HP Envy 14-3100er Spectre: Intel Core i5-3317U, 14.00", 1.8 kg
External Review » HP Envy 14-3100er Spectre
Lenovo ThinkPad X230-NZA5NRT: Intel Core i7-3520M, 12.50", 1.5 kg
External Review » Lenovo ThinkPad X230-NZA5NRT
HP Envy 14-3100eg Spectre: Intel Core i5-3317U, 14.00", 1.8 kg
External Review » HP Envy 14-3100eg Spectre
Dell Inspiron 14Z (PUISSANCE): Intel Core i5-3317U, 14.00", 1.9 kg
External Review » Dell Inspiron 14Z (PUISSANCE)
Samsung 900X4C-A01FR: Intel Core i5-3317U, 15.00", 1.7 kg
External Review » Samsung 900X4C-A01FR
HP Spectre XT 13-2103ef: Intel Core i5-3317U, 13.30", 1.4 kg
External Review » HP Spectre XT 13-2103ef
HP Spectre XT 13-2000ea: Intel Core i5-3317U, 13.30", 1.4 kg
External Review » HP Spectre XT 13-2000ea
Dell XPS 12-9Q23-5550: Intel Core i5-3427U, 12.50", 1.5 kg
External Review » Dell XPS 12-9Q23-5550
Samsung 540U3C-A01UB: Intel Core i5-3317U, 13.30", 1.7 kg
External Review » Samsung 540U3C-A01UB
Acer Aspire S7 391-73514G25aws: Intel Core i7-3517U, 13.30", 1.3 kg
External Review » Acer Aspire S7 391-73514G25aws
Asus UX21A-K1010V: Intel Core i7-3517U, 11.60", 1.1 kg
External Review » Asus UX21A-K1010V
Toshiba Portege Z930-11C: Intel Core i5-3317U, 13.30", 1.1 kg
External Review » Toshiba Portege Z930-11C
Samsung 900X3C-A04DE: Intel Core i7-3517U, 13.30", 1.2 kg
External Review » Samsung 900X3C-A04DE
Acer Aspire S7-391-6810: Intel Core i5-3317U, 13.30", 1.3 kg
External Review » Acer Aspire S7-391-6810
Toshiba Tecra R940-1CW: Intel Core i5-3320M, 14.00", 2 kg
External Review » Toshiba Tecra R940-1CW
HP Envy 4-1104tu: Intel Core i5-3317U, 14.00", 1.8 kg
External Review » HP Envy 4-1104tu
Acer Aspire V5-571-6891: Intel Core i3-3217U, 15.60", 2.3 kg
External Review » Acer Aspire V5-571-6891
Asus VivoBook S400CA-040H: Intel Core i7-3517U, 14.10", 1.8 kg
External Review » Asus VivoBook S400CA-040H
Lenovo ThinkPad Twist S230u-33474HU: Intel Core i5-3317U, 12.50", 1.5 kg
External Review » Lenovo ThinkPad Twist
Cyberpower Zeus M3: Intel Core i5-3317U, 14.10", 1.8 kg
External Review » Cyberpower Zeus M3
Asus VivoBook S400CA-DH51T: Intel Core i5-3317U, 14.00", 1.8 kg
External Review » Asus VivoBook S400CA-DH51T
Acer Aspire V5-571P-6473: Intel Core i5-3317U, 15.60", 2.4 kg
External Review » Acer Aspire V5-571P-6473
Acer Aspire S7-391-53314G12aws: Intel Core i5-3317U, 13.30", 1.3 kg
External Review » Acer Aspire S7-391-53314G12aws
Medion Akoya S4216 MD 99080: Intel Core i3-3217U, 14.00", 1.9 kg
External Review » Medion Akoya S4216 MD 99080
Acer Aspire V5-571P-6642: Intel Core i5-3317U, 15.60", 2.4 kg
External Review » Acer Aspire V5-571P-6642
Toshiba Satellite U840-10V: Intel Core i5-3317U, 14.00", 1.6 kg
External Review » Toshiba Satellite U840-10V
Acer Aspire S7-391-9413: Intel Core i7-3517U, 13.30", 1.3 kg
External Review » Acer Aspire S7-391-9413
Asus Taichi 21-CW001H: Intel Core i7-3517U, 11.60", 1.3 kg
External Review » Asus Taichi 21-CW001H
Sony Vaio SV-T1312V1ES: Intel Core i5-3317U, 13.30", 1.6 kg
External Review » Sony Vaio SV-T1312V1ES
Toshiba Satellite P845T-S4310: Intel Core i5-3317U, 14.00", 2.2 kg
External Review » Toshiba Satellite P845T-S4310
Asus Taichi 21-CW002H: Intel Core i5-3317U, 11.60", 1.3 kg
External Review » Asus Taichi 21-CW002H
Medion Akoya S4216-MD99081: Intel Core i5-3317U, 14.00", 1.9 kg
External Review » Medion Akoya S4216-MD99081
Acer Aspire M5-481PT-6488: Intel Core i5-3317U, 14.00", 2.1 kg
External Review » Acer Aspire M5-481PT-6488
Acer Aspire V5-571P-6499: Intel Core i5-3317U, 15.60", 2.4 kg
External Review » Acer Aspire V5-571P-6499
Sony Vaio SV-T131290X: Intel Core i5-3317U, 13.30", 1.6 kg
External Review » Sony Vaio SV-T131290X
Acer Aspire S7-191-73514G25ass: Intel Core i7-3517U, 11.60", 1.1 kg
External Review » Acer Aspire S7-191-73514G25ass
Toshiba Portege Z930-105: Intel Core i5-3427U, 13.30", 1.1 kg
External Review » Toshiba Portege Z930-105
Asus VivoBook S200E-C158H: Intel Core i3-3217U, 11.60", 1.6 kg
External Review » Asus VivoBook S200E-C158H
Acer Aspire S7-391-9886: Intel Core i7-3517U, 13.30", 1.3 kg
External Review » Acer Aspire S7-391-9886
Asus S56CA-DH51: Intel Core i5-3317U, 15.60", 2.3 kg
External Review » Asus S56CA-DH51
Acer Aspire S7-391-73514G25aws: Intel Core i7-3517U, 13.30", 1.3 kg
External Review » Acer Aspire S7-391-73514G25aws
Toshiba Satellite S955-S5376: Intel Core i5-3317U, 15.60", 2.3 kg
External Review » Toshiba Satellite S955-S5376
Medion Akoya E6232-MD99070: Intel Core i3-3110M, 15.60", 2.8 kg
External Review » Medion Akoya E6232-MD99070
Dell Latitude E6430: Intel Core i5-3320M, 14.00", 2.1 kg
External Review » Dell Latitude E6430
Toshiba Satellite U920T-108: Intel Core i3-3217U, 12.50", 1.5 kg
External Review » Toshiba Satellite U920T-108
Toshiba Satellite S875-S7356: Intel Core i5-3210M, 17.30", 2.8 kg
External Review » Toshiba Satellite S875-S7356
HP ProBook 4340s-B8Z87PA: Intel Core i5-3210M, 13.30", 1.8 kg
External Review » HP ProBook 4340s-B8Z87PA
Lenovo IdeaPad S400-MAY8LGE: Intel Core i5-3317U, 14.00", 1.8 kg
External Review » Lenovo IdeaPad S400-MAY8LGE
Lenovo IdeaPad Z480-21484CU: Intel Core i5-3210M, 14.00", 2.3 kg
External Review » Lenovo IdeaPad Z480-21484CU
Toshiba Satellite L840-B335: Intel Core i5-3210M, 14.00", 2 kg
External Review » Toshiba Satellite L840-B335
HP ProBook 4440s: Intel Core i5-3210M, 14.00", 2.1 kg
External Review » HP ProBook 4440s
HP Envy TouchSmart Ultrabook 4t-1100: Intel Core i5-3317U, 14.00", 1.8 kg
External Review » HP Envy TouchSmart Ultrabook 4t-1100
Apple MacBook Pro Retina 13 inch 2012-10: Intel Core i5-3210M, 13.30", 1.6 kg
External Review » Apple MacBook Pro Retina 13 inch 2012-10
Dell XPS 12: Intel Core i7-3667U, 12.50", 1.5 kg
External Review » Dell XPS 12
Toshiba Satellite U925T-S2300: Intel Core i5-3317U, 12.50", 1.4 kg
External Review » Toshiba Satellite U925T-S2300
Acer Aspire S7-391-73514G12aws: Intel Core i7-3517U, 13.30", 1.3 kg
External Review » Acer Aspire S7-391-73514G12aws
Toshiba Satellite U845W-S430: Intel Core i5-3317U, 14.40", 1.6 kg
External Review » Toshiba Satellite U845W-S430
HP Envy 4-1020ea: Intel Core i5-3317U, 14.00", 2.7 kg
External Review » HP Envy 4-1020ea
Lenovo ThinkPad X1 Carbon-34442NM: Intel Core i5-3427U, 14.00", 1.4 kg
External Review » Lenovo ThinkPad X1 Carbon-34442NM
Acer TravelMate P243-M-6619: Intel Core i5-3210M, 14.00", 2.2 kg
External Review » Acer TravelMate P243-M-6619
Sony Vaio SV-T13114GXS: Intel Core i5-3317U, 13.30", 1.5 kg
External Review » Sony Vaio SV-T13114GXS
Sony Vaio Duo 11: Intel Core i5-3317U, 11.60", 1.3 kg
External Review » Sony Vaio Duo 11
Toshiba Satellite P845-S4200: Intel Core i5-3317U, 14.00", 1.9 kg
External Review » Toshiba Satellite P845-S4200
HP Envy 14-3100en Spectre: Intel Core i5-3317U, 14.00", 1.8 kg
External Review » HP Envy 14-3100en Spectre
Samsung 900X4C-A03US: Intel Core i7-3517U, 15.00", 1.7 kg
External Review » Samsung 900X4C-A03US
Toshiba Satellite U840W-10F: Intel Core i5-3317U, 14.40", 1.7 kg
External Review » Toshiba Satellite U840W-10F
Toshiba Portege R930-117: Intel Core i7-3520M, 13.30", 1.5 kg
External Review » Toshiba Portege R930-117
Dell Inspiron 17R-1316MRB: Intel Core i5-3210M, 17.30", 3.3 kg
External Review » Dell Inspiron 17R-1316MRB
Toshiba Portege R935-P322: Intel Core i5-3210M, 14.00", 2 kg
External Review » Toshiba Portege R935-P322
Toshiba Satellite R945-P440: Intel Core i5-3210M, 14.00", 1.9 kg
External Review » Toshiba Satellite R945-P440
Acer Iconia W700-6465: Intel Core i5-3317U, 11.60", 1 kg
External Review » Acer Iconia W700-6465
Dell Latitude E5530: Intel Core i5-3360M, 15.60", 2.9 kg
External Review » Dell Latitude E5530
Toshiba Portege R935-P332: Intel Core i5-3210M, 13.30", 1.4 kg
External Review » Toshiba Portege R935-P332
Acer TravelMate P653-M-6427: Intel Core i5-3210M, 15.60", 1.9 kg
External Review » Acer TravelMate P653-M-6427
Toshiba Satellite S875-S7242: Intel Core i7-3610QM, 17.30", 2.8 kg
External Review » Toshiba Satellite S875-S7242
Fujitsu LifeBook S792: Intel Core i7-3612QM, 13.30", 1.6 kg
External Review » Fujitsu LifeBook S792
Toshiba Satellite U940: unknown, 14.00", 1.8 kg
External Review » Toshiba Satellite U940
HP Envy Spectre XT 13-2003EF: Intel Core i5-3317U, 13.30", 1.4 kg
External Review » HP Envy Spectre XT 13-2003EF
Acer Aspire S7-191: Intel Core i7-3517U, 11.60", 1.1 kg
External Review » Acer Aspire S7-191
Lenovo ThinkPad X131e: Intel Core i5-3317U, 11.60", 1.8 kg
External Review » Lenovo ThinkPad X131e
Sony Vaio SVS1311F3EW: Intel Core i5-3210M, 13.30", 1.7 kg
External Review » Sony Vaio SVS1311F3EW
Acer Aspire S7: Intel Core i5-3317U, 13.30", 1.3 kg
External Review » Acer Aspire S7
HP EliteBook 2170p-B6Q15EA: Intel Core i7-3667U, 11.60", 1.4 kg
External Review » HP EliteBook 2170p-B6Q15EA
Toshiba Portege Z935-P300: Intel Core i5-3317U, 13.30", 1.2 kg
External Review » Toshiba Portege Z935-P300
Lenovo Thinkpad L530 2479-3BG: Intel Core i5-3360M, 15.60", 2.6 kg
External Review » Lenovo Thinkpad L530 2479-3BG
Lenovo ThinkPad L430: Intel Core i5-3210M, 14.00", 2.3 kg
External Review » Lenovo ThinkPad L430
Fujitsu LifeBook AH552/SL: Intel Core i5-3210M, 15.60", 2.2 kg
External Review » Fujitsu LifeBook AH552/SL
Sony Vaio SV-Z1311Z9EX: Intel Core i7-3612QM, 13.10", 1.2 kg
External Review » Sony Vaio SV-Z1311Z9EX
Toshiba Satellite Z930-119: Intel Core i5-3317U, 13.30", 1.1 kg
External Review » Toshiba Satellite Z930-119
HP Envy Spectre XT 13-2050nr: Intel Core i5-3317U, 13.30", 1.4 kg
External Review » HP Envy Spectre XT 13-2050nr
Acer Aspire V5-571-6869: Intel Core i5-3317U, 15.60", 2.3 kg
External Review » Acer Aspire V5-571-6869
Toshiba Portege R935-P330: Intel Core i5-3210M, 13.30", 1.4 kg
External Review » Toshiba Portege R935-P330
Sony Vaio SV-T13116FXS: Intel Core i7-3517U, 13.30", 1.5 kg
External Review » Sony Vaio SV-T13116FXS
Samsung 530U3C-A02US: Intel Core i5-3317U, 13.30", 1.5 kg
External Review » Samsung 530U3C-A02US
Acer Aspire S5-391-53314G12akk: Intel Core i5-3317U, 13.30", 1.2 kg
External Review » Acer Aspire S5-391-53314G12akk
Sony Vaio SV-S1311N9E: Intel Core i5-3210M, 13.30", 1.7 kg
External Review » Sony Vaio SV-S1311N9E
Panasonic ToughBook CF-19, Ivy Bridge: Intel Core i5-3320M, 10.10", 2.3 kg
External Review » Panasonic ToughBook CF-19, Ivy Bridge
Lenovo IdeaPad Z380-21293DU: Intel Core i5-3210M, 13.30", 2.1 kg
External Review » Lenovo IdeaPad Z380-21293DU
Fujitsu LifeBook U772: Intel Core i5-3427U, 14.00", 1.4 kg
External Review » Fujitsu LifeBook U772
Dell Inspiron 13z-5323: Intel Core i5-3317U, 13.30", 1.7 kg
External Review » Dell Inspiron 13z-5323
Fujitsu Lifebook U772-0M25R1DE: Intel Core i5-3317U, 14.00", 1.4 kg
External Review » Fujitsu Lifebook U772-0M25R1DE
Toshiba Satellite U840W-107: Intel Core i5-3317U, 14.40", 1.7 kg
External Review » Toshiba Satellite U840W-107
Toshiba Tecra R950-11F: Intel Core i5-3320M, 15.60", 2.5 kg
External Review » Toshiba Tecra R950-11F
Asus UX32A-DB51: Intel Core i5-3317U, 13.30", 1.4 kg
External Review » Asus UX32A-DB51
Acer Aspire S3-391-9606: Intel Core i7-3517U, 13.30", 1.4 kg
External Review » Acer Aspire S3-391-9606
Acer Aspire V5-571-6689: Intel Core i5-3317U, 15.60", 2.3 kg
External Review » Acer Aspire V5-571-6689
Dell Latitude E6530: Intel Core i7-3520M, 15.60", 2.4 kg
External Review » Dell Latitude E6530
Acer Aspire V5-171-6869: Intel Core i5-3317U, 11.60", 1.4 kg
External Review » Acer Aspire V5-171-6869
Acer Aspire V5-171-6867: Intel Core i5-3317U, 11.60", 1.4 kg
External Review » Acer Aspire V5-171-6867
Acer Aspire V5-171-6616: Intel Core i5-3317U, 11.60", 1.4 kg
External Review » Acer Aspire V5-171-6616
HP Envy 14t-3100 Spectre: Intel Core i7-3667U, 14.00", 1.8 kg
External Review » HP Envy 14t-3100 Spectre
Lenovo ThinkPad X230T: Intel Core i5-3320M, 12.50", 1.8 kg
External Review » Lenovo ThinkPad X230T
HP Envy 6-1051er: Intel Core i5-3317U, 13.30", 2.2 kg
External Review » HP Envy 6-1051er
Samsung 530U3C-A01US: Intel Core i5-3317U, 13.30", 1.5 kg
External Review » Samsung 530U3C-A01US
Lenovo ThinkPad X1 Carbon W7P64: Intel Core i5-3317U, 14.00", 1.4 kg
External Review » Lenovo ThinkPad X1 Carbon W7P64
HP Spectre XT Pro-B8W13AA: Intel Core i5-3317U, 13.00", 1.5 kg
External Review » HP Spectre XT Pro-B8W13AA
Toshiba Satellite Z930-10X: Intel Core i5-3317U, 13.30", 1.1 kg
External Review » Toshiba Satellite Z930-10X
Sony Vaio SV-T11113FGS: Intel Core i5-3317U, 11.60", 1.4 kg
External Review » Sony Vaio SV-T11113FGS
Acer Aspire M5-581T-6446: Intel Core i5-3317U, 15.60", 2.3 kg
External Review » Acer Aspire M5-581T-6446
Dell Latitude E6330: Intel Core i7-3520M, 13.30", 2.1 kg
External Review » Dell Latitude E6330
HP Envy Spectre XT 13-2011tu: Intel Core i7-3517U, 13.30", 1.4 kg
External Review » HP Envy Spectre XT 13-2011tu
Sony Vaio SV-T13116FGS: Intel Core i7-3517U, 13.30", 1.5 kg
External Review » Sony Vaio SV-T13116FGS
Toshiba Portege Z930-108: Intel Core i7-3667U, 13.30", 1.1 kg
External Review » Toshiba Portege Z930-108
HP Envy 6-1010sa: Intel Core i5-3317U, 15.60", 2.3 kg
External Review » HP Envy 6-1010sa
HP Envy m4: Intel Core i7-3520M, 14.00", 2.5 kg
External Review » HP Envy m4
HP Envy Spectre XT 13-2006tu: Intel Core i5-3317U, 13.30", 1.4 kg
External Review » HP Envy Spectre XT 13-2006tu
Dell Latitude E6230: Intel Core i5-3320M, 12.50", 1.7 kg
External Review » Dell Latitude E6230
HP Env 6-1010ea: Intel Core i5-3317U, 15.60", 2.3 kg
External Review » HP Env 6-1010ea
Samsung 530U3C-A01DE: Intel Core i5-3317U, 13.30", 1.5 kg
External Review » Samsung 530U3C-A01DE
Dell Latitude E6430: Intel Core i7-3520M, 14.10", 2.4 kg
External Review » Dell Latitude E6430
Lenovo IdeaPad Z580-215127U: Intel Core i5-3210M, 15.60", 2.3 kg
External Review » Lenovo IdeaPad Z580-215127U
Asus UX21A-K1009V: Intel Core i7-3517U, 11.60", 1.1 kg
External Review » Asus UX21A-K1009V
Dell Latitude E5430: Intel Core i5-3360M, 14.00", 2.5 kg
External Review » Dell Latitude E5430
Asus UX32A-R3007V: Intel Core i5-3317U, 13.30", 1.5 kg
External Review » Asus UX32A-R3007V
Samsung 900X4C-A02US: Intel Core i5-3317U, 15.00", 1.6 kg
External Review » Samsung 900X4C-A02US
Acer TravelMate P633-V-73528G50ikk: Intel Core i7-3520M, 13.30", 1.9 kg
External Review » Acer TravelMate P633-V-73528G50ikk
Sony Vaio SVT1111Z9RS: Intel Core i7-3517U, 11.60", 1.3 kg
External Review » Sony Vaio SVT1111Z9RS
Acer Aspire S5-391-53314G25akk: Intel Core i5-3317U, 13.30", 1.2 kg
External Review » Acer Aspire S5-391-53314G25akk
Sony Vaio SVT1311Z9RS: Intel Core i7-3517U, 13.30", 1.5 kg
External Review » Sony Vaio SVT1311Z9RS
Asus UX31E-RY029V: Intel Core i7-3517U, 13.30", 1.4 kg
External Review » Asus UX31E-RY029V
Asus UX31A-R4004V: Intel Core i7-3517U, 13.30", 1.4 kg
External Review » Asus UX31A-R4004V
Samsung 900X3C-A07DE: Intel Core i7-3517U, 13.30", 1.2 kg
External Review » Samsung 900X3C-A07DE
Toshiba Satellite U845W-S410: Intel Core i5-3317U, 14.40", 1.8 kg
External Review » Toshiba Satellite U845W-S410
Toshiba Satellite U845-S404: Intel Core i5-3317U, 14.00", 1.9 kg
External Review » Toshiba Satellite U845-S404
HP Envy Spectre XT 13-2000eg: Intel Core i5-3317U, 13.30", 1.4 kg
External Review » HP Envy Spectre XT 13-2000eg
Fujitsu LifeBook UH572: Intel Core i5-3317U, 13.30", 1.6 kg
External Review » Fujitsu LifeBook UH572
HP Envy 4-1030us: Intel Core i5-3317U, 14.00", 1.7 kg
External Review » HP Envy 4-1030us
Asus UX21A-1AK1: Intel Core i7-3517U, 11.60", 1.2 kg
External Review » Asus UX21A-1AK1
Toshiba Satellite U845-S406: Intel Core i5-3317U, 14.00", 1.8 kg
External Review » Toshiba Satellite U845-S406
Asus UX31A-R5102F: Intel Core i5-3317U, 13.30", 1.4 kg
External Review » Asus UX31A-R5102F
HP Envy 4-1043cl : Intel Core i5-3317U, 14.00", 1.7 kg
External Review » HP Envy 4-1043cl
Samsung 900X4C-A01UK: Intel Core i5-3317U, 15.00", 1.7 kg
External Review » Samsung 900X4C-A01UK
Sony Vaio SV-S13112FXW: Intel Core i5-3210M, 13.30", 1.7 kg
External Review » Sony Vaio SV-S13112FXW
Lenovo IdeaPad Z580: Intel Core i5-3210M, 15.60", 2.3 kg
External Review » Lenovo IdeaPad Z580
Sony Vaio SV-S13112FXB: Intel Core i5-3210M, 13.30", 1.7 kg
External Review » Sony Vaio SV-S13112FXB
Acer Aspire S5-391-9880: Intel Core i7-3517U, 13.30", 1.2 kg
External Review » Acer Aspire S5-391-9880
HP Pavilion dv7-7030us: Intel Core i7-3610QM, 17.30", 3.3 kg
External Review » HP Pavilion dv7-7030us
Lenovo ThinkPad Edge E430, Ivy Brigde: Intel Core i7-3612QM, 14.00", 2.2 kg
External Review » Lenovo ThinkPad Edge E430, Ivy Brigde
Fujitsu LifeBook SH76: Intel Core i5-3210M, 13.30", 1.2 kg
External Review » Fujitsu LifeBook SH76
Fujitsu LifeBook UH75: Intel Core i7-3667U, 14.00", 1.4 kg
External Review » Fujitsu LifeBook UH75
HP Envy Spectre XT 13t-2000: Intel Core i7-3667U, 13.30", 1.4 kg
External Review » HP Envy Spectre XT 13t-2000
Acer Aspire V3-571-6643: Intel Core i5-2450M, 15.60", 2.6 kg
External Review » Acer Aspire V3-571-6643
Dell Inspiron 15R-5520: Intel Core i5-3210M, 15.60", 2.7 kg
External Review » Dell Inspiron 15R-5520
Lenovo ThinkPad T430: Intel Core i5-3320M, 14.00", 2.1 kg
External Review » Lenovo ThinkPad T430
Fujitsu Lifebook U772: Intel Core i5-3427U, 14.00", 1.4 kg
External Review » Fujitsu Lifebook U772
Pioneer DreamBook U14: Intel Core i5-3317U, 14.00", 1.5 kg
External Review » Pioneer DreamBook U14
Asus UX31A-R4003V: Intel Core i7-3517U, 13.30", 1.3 kg
External Review » Asus UX31A-R4003V
Asus UX31A-R4005V: Intel Core i5-3317U, 13.30", 1.4 kg
External Review » Asus UX31A-R4005V
Lenovo ThinkPad X1 Carbon: Intel Core i7-3667U, 14.00", 1.3 kg
External Review » Lenovo ThinkPad X1 Carbon
Samsung 900X4C-A01IT: Intel Core i5-3317U, 15.00", 1.2 kg
External Review » Samsung 900X4C-A01IT
Samsung 900X3C-A01NL: Intel Core i5-3317U, 13.30", 1.2 kg
External Review » Samsung 900X3C-A01NL
Acer Aspire S3-391-73514G12add: Intel Core i7-3517U, 13.30", 1.4 kg
External Review » Acer Aspire S3-391-73514G12add
Samsung 900X3C-A01FR: Intel Core i5-3317U, 13.30", 1.2 kg
External Review » Samsung 900X3C-A01FR
Acer Aspire S5-391-73514G25akk: Intel Core i7-3517U, 13.30", 1.2 kg
External Review » Acer Aspire S5-391-73514G25akk
Fujitsu LifeBook A552: Intel Core i5-3320M, 15.60", 2.2 kg
External Review » Fujitsu LifeBook A552
Samsung 900X3C-A01AU: Intel Core i5-3317U, 13.30", 1.2 kg
External Review » Samsung 900X3C-A01AU
Samsung 900X4C-A01US: Intel Core i5-3317U, 15.00", 1.6 kg
External Review » Samsung 900X4C-A01US
Toshiba Satellite L850-ST2N02: Intel Core i7-3610QM, 15.60", 2.5 kg
External Review » Toshiba Satellite L850-ST2N02
Dell Vostro 3360: Intel Core i5-3317U, 13.30", 1.7 kg
External Review » Dell Vostro 3360
Apple MacBook Pro 13 Mid 2012: Intel Core i5-3210M, 13.30", 2.1 kg
External Review » Apple MacBook Pro 13 inch 2012-06 MD101LL/A
Samsung 900X3C-A02DE: Intel Core i5-3317U, 13.30", 1.2 kg
External Review » Samsung 900X3C-A02DE
Apple MacBook Air 11 inch 2012-06 MD223D/A: Intel Core i5-3317U, 11.60", 1.1 kg
External Review » Apple MacBook Air 11 inch 2012-06 MD223LL/A
Toshiba Portege Z930-S9301: Intel Core i5-3427U, 13.30", 1.2 kg
External Review » Toshiba Portege Z930-S9301
Fujitsu Lifebook LH532: Intel Core i3-2350M, 14.00", 2.1 kg
External Review » Fujitsu Lifebook LH532
Sony Vaio SV-Z13114GXX: Intel Core i7-3612QM, 13.10", 1.2 kg
External Review » Sony Vaio SV-Z13114GXX
Apple MacBook Air 13 inch 2012-06 MD231LL/A: Intel Core i5-3427U, 13.30", 1.4 kg
External Review » Apple MacBook Air 13 inch 2012-06 MD231LL/A
Toshiba Satellite U840W: Intel Core i5-3317U, 14.40", 1.7 kg
External Review » Toshiba Satellite U840W
Asus UX31A-DB71: Intel Core i7-3517U, 13.30", 1.3 kg
External Review » Asus UX31A-DB71
Lenovo Z380-212938U: Intel Core i5-2450M, 13.30", 2 kg
External Review » Lenovo Z380-212938U
Samsung 900X4C: Intel Core i5-3427U, 15.00", 1.7 kg
External Review » Samsung 900X4C
Asus K55A: Intel Core i7-3610QM, 15.60", 2.5 kg
External Review » Asus K55A
Samsung 900X3C-A01AT: Intel Core i5-3317U, 13.30", 1.2 kg
External Review » Samsung 900X3C-A01AT
Sony Vaio SV-E15116FXS: Intel Core i5-3210M, 15.50", 2.4 kg
External Review » Sony Vaio SV-E15116FXS
Dell Latitude E6430s: Intel Core i5-3360M, 14.00", 2.1 kg
External Review » Dell Latitude E6430s
Gigabyte X11: Intel Core i5-3317U, 11.60", 1 kg
External Review » Gigabyte X11
Asus Zenbook Prime UX31A-DB51: Intel Core i5-3317U, 13.30", 1.3 kg
External Review » Asus Zenbook Prime UX31A-DB51
Lenovo ThinkPad X230: Intel Core i5-3320M, 12.50", 1.4 kg
External Review » Lenovo ThinkPad X230
Sony Vaio SV-T13112FXS: Intel Core i5-3317U, 13.30", 1.5 kg
External Review » Sony Vaio T13112FXS
Sony Vaio SV-T1311W1ES: Intel Core i5-3317U, 13.30", 1.5 kg
External Review » Sony Vaio SVT1311W1ES
Samsung 900X4C-A04DE: Intel Core i5-3317U, 15.00", 1.7 kg
External Review » Samsung 900X4C-A04DE
Asus Zenbook Prime UX21A-DB5x: unknown, 11.60", 1.1 kg
External Review » Asus Zenbook Prime UX21A-DB5x
Lenovo IdeaPad Yoga 13: Intel Core i5-3317U, 13.30", 1.6 kg
External Review » Lenovo IdeaPad Yoga
Lenovo IdeaPad U310: Intel Core i5-3317U, 13.30", 1.7 kg
External Review » Lenovo IdeaPad U310
Lenovo ThinkPad T430-N1RLTPB: Intel Core i5-3210M, 14.00", 2.2 kg
» Modder liberates ThinkPad T430 from Intel's secret backdoor