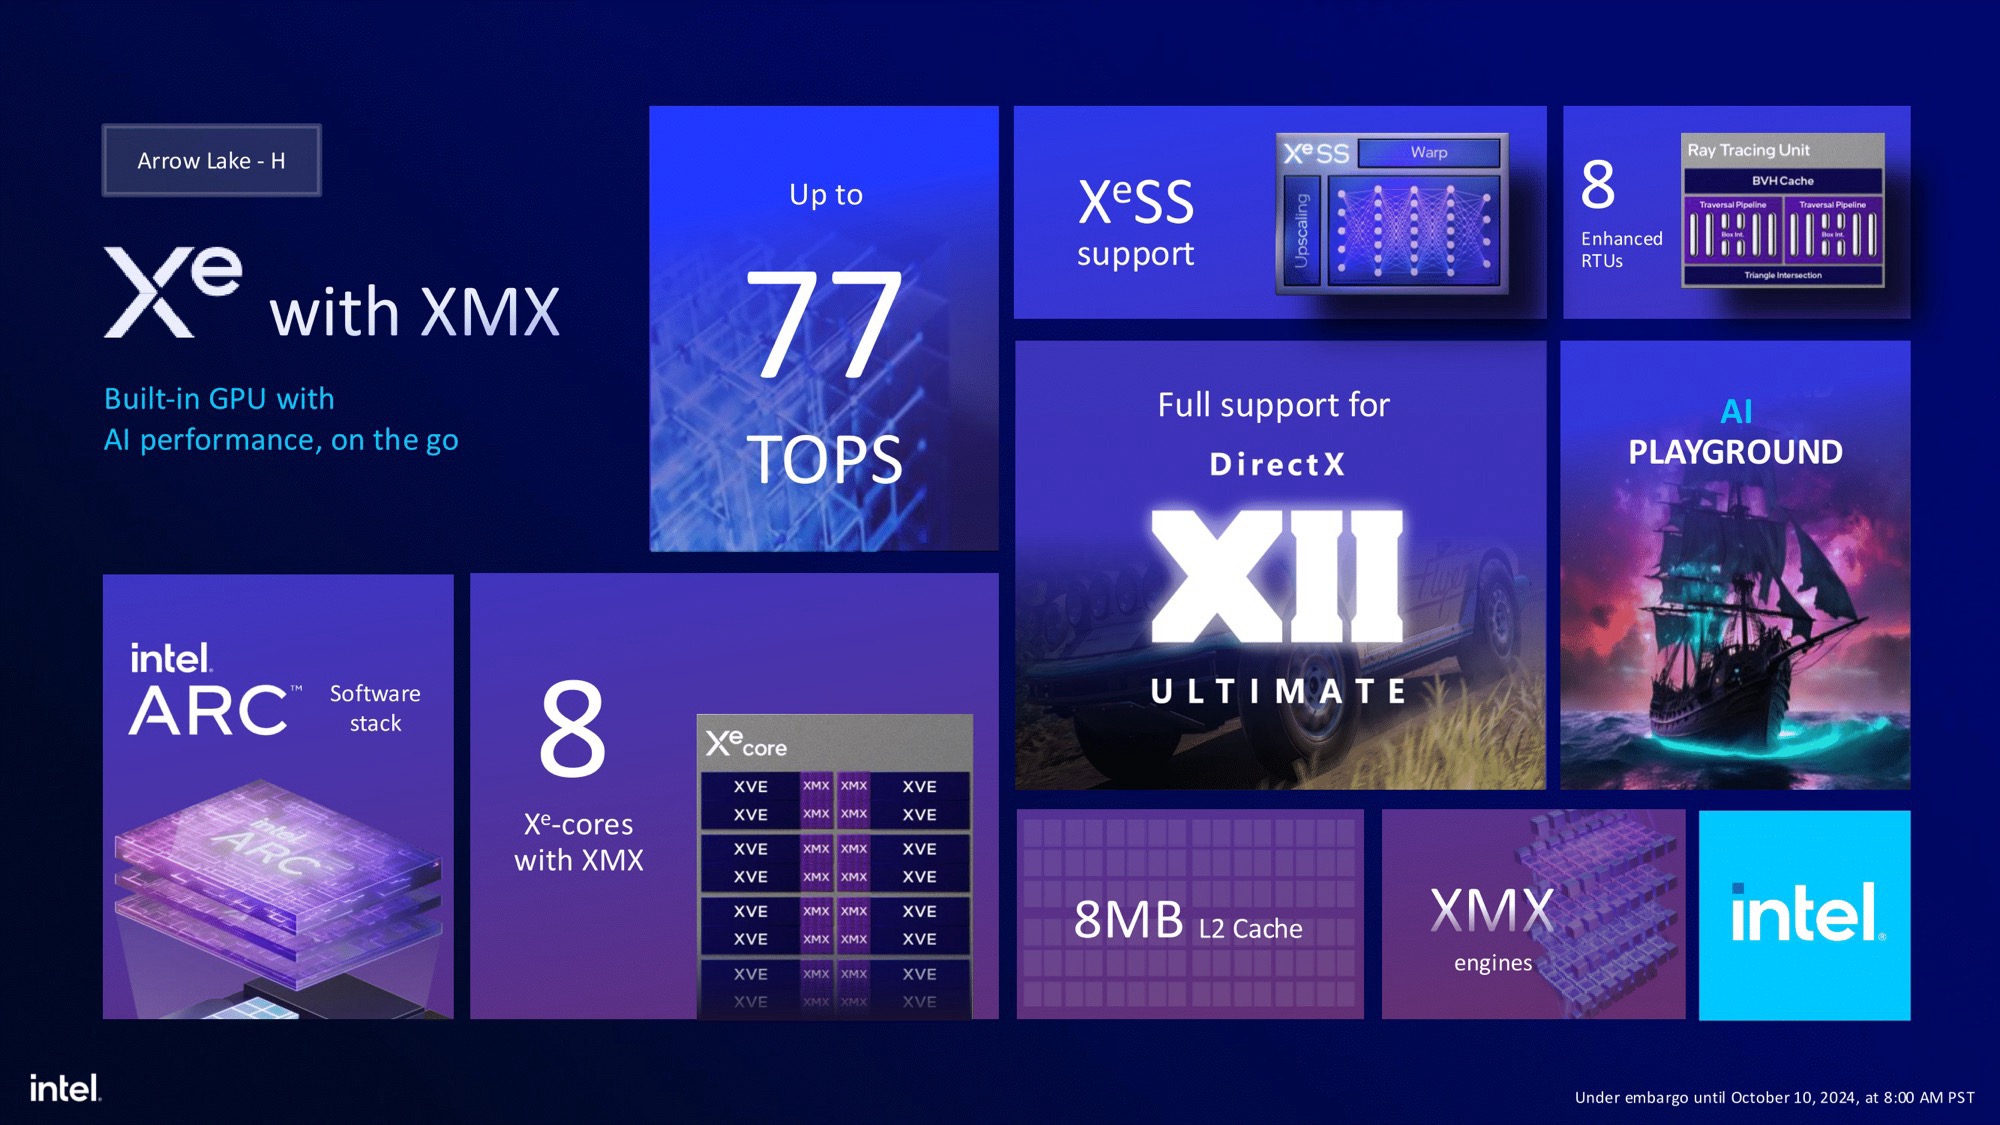
Notebook reviews with Intel Arc Graphics 140T graphics card
MSI Venture 16 AI A2HMTG laptop review: Basic, budget, business
The lesser-known Venture 16 AI skips the all the fancy features of the costlier Prestige or Summit models for office users who just want a basic laptop powered by Intel Core H.
Intel Core Ultra 7 255H, Arc 140T, 16", 2.1 kgXMG Evo 15 (M25) laptop review - A good Windows alternative to the MacBook Air 15?
The XMG Evo 15 is a slim 15-inch laptop featuring Intel Arrow Lake, a bright matte IPS display, and solid overall features. It is a capable all-rounder with no major weaknesses and is available with either an Intel or an AMD processor. Update: SSD & SD-Express performance
Intel Core Ultra 7 255H, Arc 140T, 15.3", 1.8 kgAsus NUC 15 Pro+ review: High-end performance with Intel Core Ultra 9 285H in a mini PC
With the Asus NUC 15 Pro+, Asus wants to show just how much performance can fit into a mini-sized case today. Compact dimensions and modern technology make the mini PC particularly interesting. But does the little powerhouse deliver what the performance data promises in everyday use? In our test, we find out whether the NUC 15 Pro+ really is a serious alternative to the classic desktop.
Intel Core Ultra 9 285H, Arc 140T, 690 gBeelink GTI15 Ultra review: One of the most fully-featured mini PCs for the size
The GTI15 Ultra is even faster than before with Arrow Lake-H and 10 Gbps RJ-45 LAN ports. However, the speakers still haven't improved since the GTI13 Ultra days.
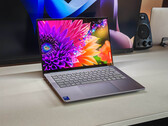
Intel Core Ultra 9 285H, Arc 140T, 1.3 kgLenovo Yoga Pro 7i Gen 10 Aura Edition review - Multimedia laptop with a great OLED touchscreen
With the Intel Core Ultra 9 285H, the Yoga Pro 14 G10 offers a fast processor and the new 3K OLED touchscreen with 120 Hz provides excellent image quality. However, the high power limit also leads to problems.
Intel Core Ultra 9 285H, Arc 140T, 14.5", 1.6 kgHP ZBook 8 G1i 14: Intel Core Ultra 7 255H, 14.00", 1.7 kg
Review » The Firefly successor that bets on Intel ARC: HP ZBook 8 G1i 14 laptop review
Asus ZenBook 14 OLED UX3405CA, Ultra 7 255H: Intel Core Ultra 7 255H, 14.00", 1.3 kg
Review » Intel subnotebook regains ground — Asus ZenBook 14 OLED UX3405CA review
Eurocom Blitz Ultra 2 14: Intel Core Ultra 7 255H, 14.00", 1.6 kg
Review » Eurocom Blitz Ultra 2 14 laptop review: Strong serviceability at the cost of weight
Dell 14 Premium: Intel Core Ultra 7 255H, 14.50", 1.7 kg
Review » Dell 14 Premium laptop review: An XPS 14 in all but name
Honor MagicBook Art 14 2025: Intel Core Ultra 7 255H, 14.60", 1 kg
Review » 1 kg Ultrabook with Arrow Lake and excellent input devices - Honor MagicBook Art 14 2025 Review
GMK EVO-T1: Intel Core Ultra 9 285H, 0.9 kg
Review » High-end mini PC – GMKtec EVO-T1 review with Intel Core Ultra 9 285H, 80W TDP, 64 GB RAM, and eGPU option
Lenovo ThinkPad E14 G7-21SYS00H00: Intel Core Ultra 7 255H, 14.00", 1.4 kg
Review » Lenovo ThinkPad E14 G7 review - The affordable office laptop stands out from the competition with its 120 Hz display
Geekom Mini IT15, Ultra 9 285H: Intel Core Ultra 9 285H, 0.6 kg
Review » 2025 Mini PC review: Geekom Mini IT15, a mini-workstation with Intel Core Ultra for professionals and creatives, reviewed
Lenovo ThinkBook 14 Gen 8 21SJ007SGE: Intel Core Ultra 7 255H, 14.00", 1.5 kg
Review » This affordable Lenovo laptop is more upgradeable than most ThinkPads: ThinkBook 14 Gen 8 IAL review
Lenovo Yoga Book 9 14IAH10: Intel Core Ultra 7 255H, 14.00", 1.2 kg
Review » Lenovo Yoga Book 9 14IAH10 convertible review: Double the screen without double the weight
Xiaomi RedmiBook Pro 14 2025: Intel Core Ultra 7 255H, 14.00", 1.4 kg
Review » Xiaomi RedmiBook Pro 14 2025 review - Now with Arrow Lake and 16 hours of battery life
Asus ZenBook Duo OLED UX8406CA: Intel Core Ultra 9 285H, 14.00", 1.8 kg
Review » Intel Arc Graphics 140T analysis – Arrow Lake-H iGPU gains frame generation support
MSI Prestige 16 AI Evo B2HMG: Intel Core Ultra 9 285H, 16.00", 1.6 kg
Review » Intel Arc Graphics 140T analysis – Arrow Lake-H iGPU gains frame generation support
Asus ZenBook Duo OLED UX8406CA: Intel Core Ultra 9 285H, 14.00", 1.8 kg
Review » Intel Arrow Lake-H CPU analysis: Core Ultra 200H makes Lunar Lake almost redundant
MSI Prestige 16 AI Evo B2HMG: Intel Core Ultra 9 285H, 16.00", 1.6 kg
Review » Intel Arrow Lake-H CPU analysis: Core Ultra 200H makes Lunar Lake almost redundant
Asus ZenBook Duo OLED UX8406CA: Intel Core Ultra 9 285H, 14.00", 1.8 kg
Review » Asus Zenbook Duo OLED review - The multi-screen convertible now with Intel Arrow Lake
MSI Prestige 16 AI Evo B2HMG: Intel Core Ultra 9 285H, 16.00", 1.6 kg
Review » MSI Prestige 16 AI Evo review - The multimedia laptop with a speedy Arrow Lake CPU and impressive runtimes
Lenovo ThinkPad E14 G7-21SYS00H00: Intel Core Ultra 7 255H, 14.00", 1.4 kg
External Review » Lenovo ThinkPad E14 G7-21SYS00H00
MSI Modern 15 H AI C2HMG: Intel Core Ultra 9 285H, 15.60", 1.9 kg
External Review » MSI Modern 15 H AI C2HMG
Asus Expertbook B5405: Intel Core Ultra 7 255H, 14.00", 1.4 kg
External Review » Asus Expertbook B5405
Honor MagicBook Art 14 2025: Intel Core Ultra 7 255H, 14.60", 1 kg
External Review » Honor MagicBook Art 14 2025
Dell 14 Premium: Intel Core Ultra 7 255H, 14.50", 1.7 kg
External Review » Dell 14 Premium
Acer Aspire Vero 16 AV16-71P: Intel Core Ultra 7 255H, 16.00", 1.8 kg
External Review » Acer Aspire Vero 16 AV16-71P
Asus Vivobook S16 S3607CA: Intel Core Ultra 7 255H, 16.00", 1.7 kg
External Review » Asus Vivobook S16 S3607CA
Acer Swift Go 16 OLED SFG16-73: Intel Core Ultra 9 285H, 16.00", 1.5 kg
External Review » Acer Swift Go 16 OLED SFG16-73
LG gram Pro 16Z90TP: Intel Core Ultra 7 255H, 16.00", 1.2 kg
External Review » LG gram Pro 16Z90TP
Lenovo Yoga Pro 7 14IAH10: Intel Core Ultra 9 285H, 14.50", 1.6 kg
External Review » Lenovo Yoga Pro 7 14IAH10
Asus Vivobook S14 S3407CA: Intel Core Ultra 7 255H, 14.00", 1.4 kg
External Review » Asus Vivobook S14 S3407CA
Lenovo Yoga Book 9 14IAH10: Intel Core Ultra 7 255H, 14.00", 1.2 kg
External Review » Lenovo Yoga Book 9 14IAH10
Asus VivoBook S16 OLED S5606CA: Intel Core Ultra 7 255H, 16.00", 1.5 kg
External Review » Asus VivoBook S16 OLED S5606CA
Asus Zenbook 14 OLED UX3405CA: Intel Core Ultra 7 255H, 14.00", 1.3 kg
External Review » Asus Zenbook 14 OLED UX3405CA
Honor MagicBook Pro 14 (2025): Intel Core Ultra 9 285, 14.60", 1.4 kg
External Review » Honor MagicBook Pro 14 (2025)
Asus Zenbook 14 OLED UX3405CA, Ultra 9 285H: Intel Core Ultra 9 285H, 14.00", 1.2 kg
External Review » Asus Zenbook 14 OLED UX3405CA, Ultra 9 285H
LG gram Pro 2-in-1 16T90TP: Intel Core Ultra 7 255H, 16.00", 1.4 kg
External Review » LG gram Pro 2-in-1 16T90TP
MSI Prestige 16 AI Evo B2HMG: Intel Core Ultra 9 285H, 16.00", 1.6 kg
External Review » MSI Prestige 16 AI Evo B2HMG
Asus ZenBook Duo OLED UX8406CA: Intel Core Ultra 9 285H, 14.00", 1.8 kg
External Review » Asus ZenBook Duo OLED UX8406CA
Asus ZenBook 14 OLED UX3405CA, Ultra 7 255H: Intel Core Ultra 7 255H, 14.00", 1.3 kg
» Asus Zenbook 14 OLED with Core Ultra 7 255H drops below $700 at Best Buy
MSI Venture 16 AI A2HMTG: Intel Core Ultra 7 255H, 16.00", 2.1 kg
» MSI Venture 16 is surprisingly fast for a budget office laptop
» Lesser-known MSI Venture 16 office laptop offers only the bare minimum features
Beelink GTI15 Ultra: Intel Core Ultra 9 285H, 1.3 kg
» Beelink GTI15 Ultra quad mics are great for voice activation, but the speakers are mid
» Beellnk GTI15 Ultra PC launches for almost twice the original price of the GTI13 Ultra
Lenovo Yoga Pro 7 14IAH10: Intel Core Ultra 9 285H, 14.50", 1.6 kg
» Lenovo’s Yoga Pro 7 with Intel’s Core Ultra 9 shows the problem with high power limits
» Lenovo favors Intel with a better screen & SD-card reader on the Yoga Pro 7 14
HP ZBook 8 G1i 14: Intel Core Ultra 7 255H, 14.00", 1.7 kg
» The return of an old standard: HP brings back the RJ45-Ethernet port to many business models
Asus ZenBook 14 OLED UX3405CA, Ultra 7 255H: Intel Core Ultra 7 255H, 14.00", 1.3 kg
» Intel ZenBook 14 OLED features Wi-Fi 7 — but the AMD version delivers faster transfer speeds
» Is the ZenBook 14 better with Intel or AMD this year?
Eurocom Blitz Ultra 2 14: Intel Core Ultra 7 255H, 14.00", 1.6 kg
» Eurocom Blitz Ultra 2 comes standard with features that most other 14-inch laptops omit
Honor MagicBook Art 14 2025: Intel Core Ultra 7 255H, 14.60", 1 kg
» Honor advertises a peak brightness of up to 1600 nits for the MagicBook Art 14 2025, but we only measure 740 nits
Dell 14 Premium: Intel Core Ultra 7 255H, 14.50", 1.7 kg
» The XPS 14 lives on through the Dell 14 Premium with very few changes
» Dell 14 Premium costs as much as the lighter and more powerful Razer Blade 14
Honor MagicBook Art 14 2025: Intel Core Ultra 7 255H, 14.60", 1 kg
» Honor's new MagicBook Art 14 2025 has a better keyboard than modern ThinkPads
GMK EVO-T1: Intel Core Ultra 9 285H, 0.9 kg
» GMKtec EVO-T1 review: Mini PC with Intel Core Ultra 9 for AI models, LLMs and gaming via OCuLink
Lenovo ThinkPad E14 G7-21SYS00H00: Intel Core Ultra 7 255H, 14.00", 1.4 kg
» Lenovo ThinkPad E14 & ThinkBook 14 - Business vs. prosumer in comparison
» Lenovo finally offers a better 120 Hz display for the affordable ThinkPad E14
» 14-inch office laptop with great maintenance options: ThinkPad E14 G7 offers 2 SSD and 2 RAM slots
Lenovo ThinkBook 14 Gen 8 21SJ007SGE: Intel Core Ultra 7 255H, 14.00", 1.5 kg
» This Lenovo ThinkBook laptop is an upgradeability dream - and it is affordable
Lenovo ThinkPad E16 G3-21SSS00E00: Intel Core Ultra 7 255H
» Is the Core Ultra 7 255H worth it in the ThinkPad E16 G3? We tested it
Khadas Mind 2s: Intel Core Ultra 7 255H, 0.4 kg
» Modular Khadas Mind 2s mini PC reviewed: Portable desktop replacement can fit into pockets
Lenovo Yoga Book 9 14IAH10: Intel Core Ultra 7 255H, 14.00", 1.2 kg
» Lenovo Yoga Book 9 14 Arrow Lake CPU throttling is a bit steeper than we would like
» Latest Lenovo Yoga Book 9 14 weighs even less than the smaller 13-inch version while offering larger displays