Verdict - Evo 15 is a solid all-rounder
With the Evo 15, XMG once again delivers a solid all-rounder that addresses several criticisms of its predecessor. Wi-Fi 7 is now included, and the sluggish USB 2.0 port has been removed. The Arrow Lake processor provides very high and consistent performance, and the maintenance options are also very good.
The matte IPS panel is well suited for productive tasks as well as gaming (fast response times and 240 Hz), but its main drawback remains the elevated black level and the resulting relatively low contrast. In addition, battery life is somewhat weaker than before, and competing models simply offer greater endurance.
Pros
Cons
Price and availability
The XMG Evo 15 M25 can be configured at Bestware starting at €1,329.
Translator’s note: XMG laptops are not officially available in North America.
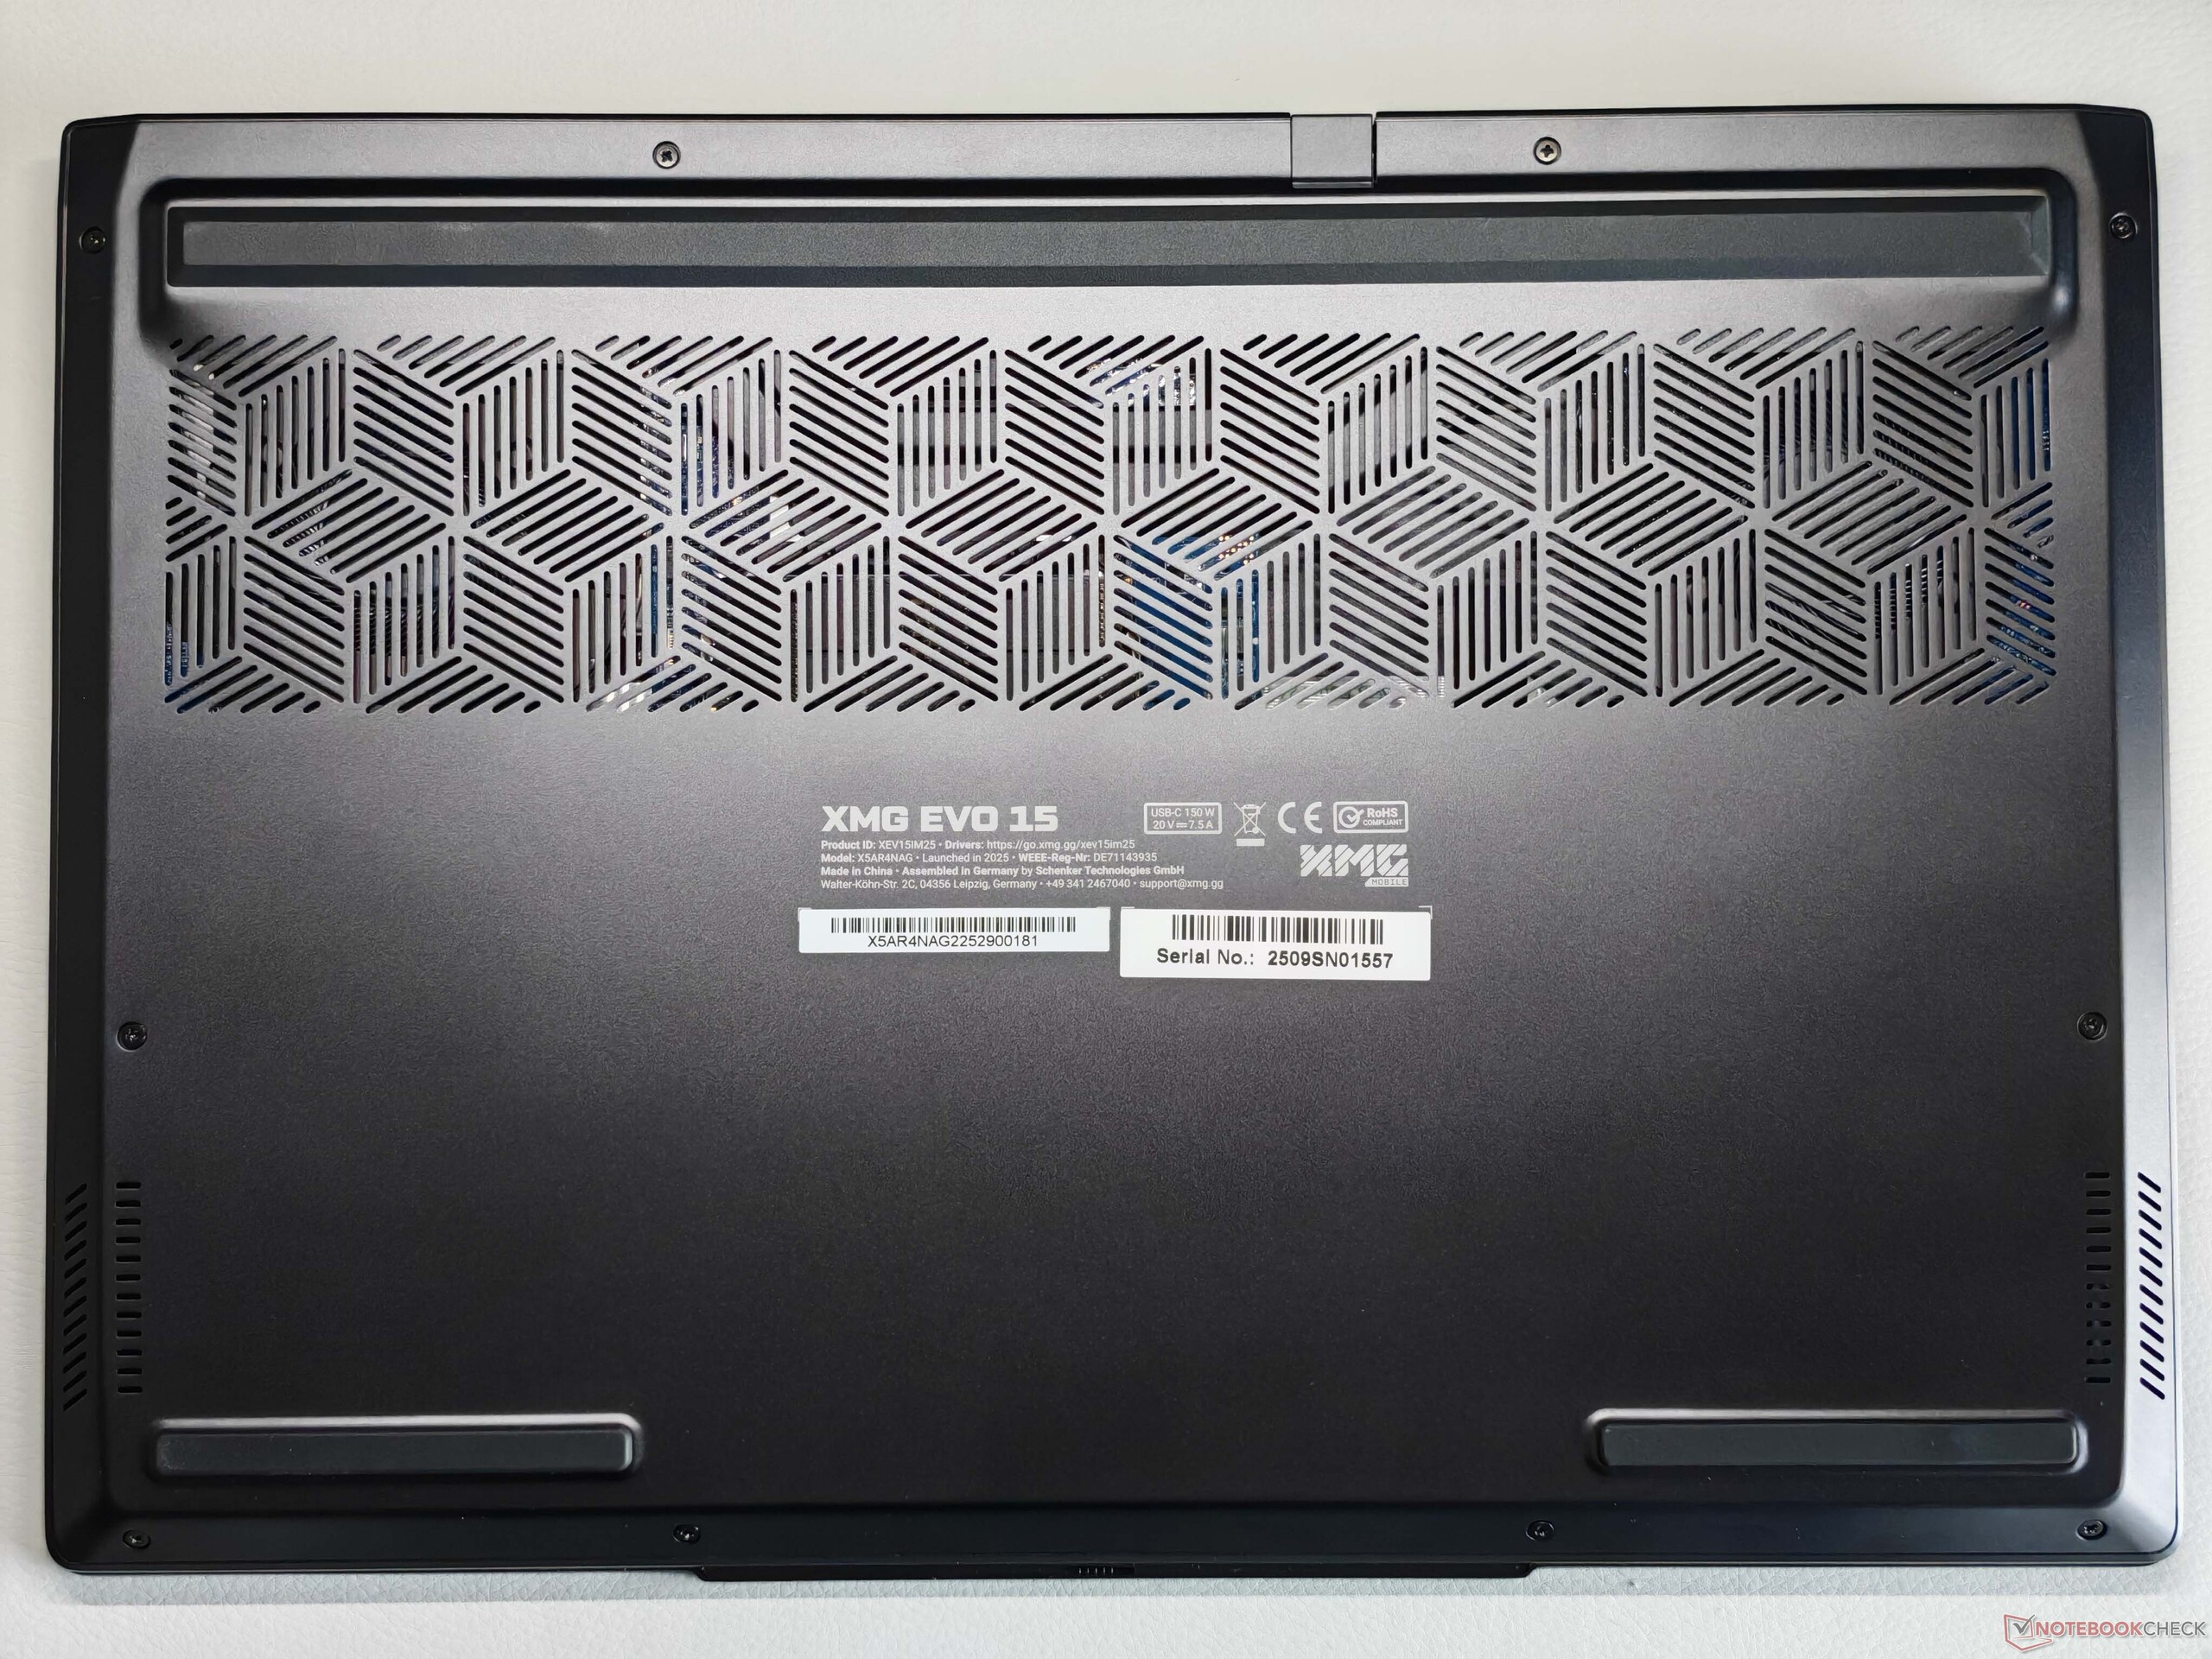
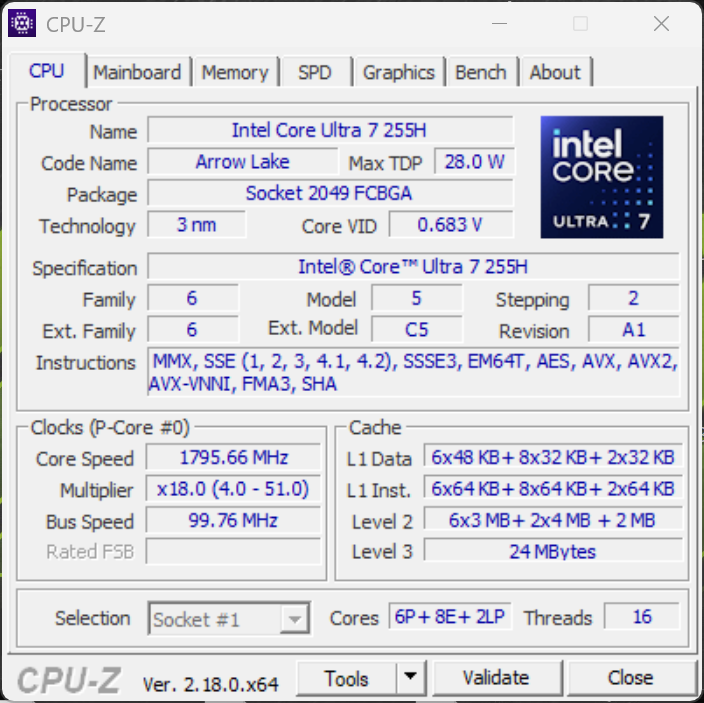
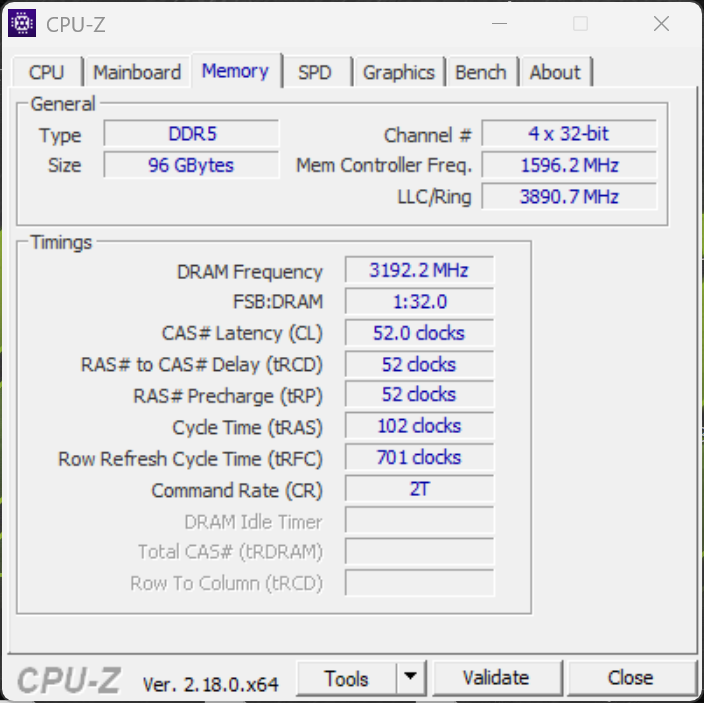
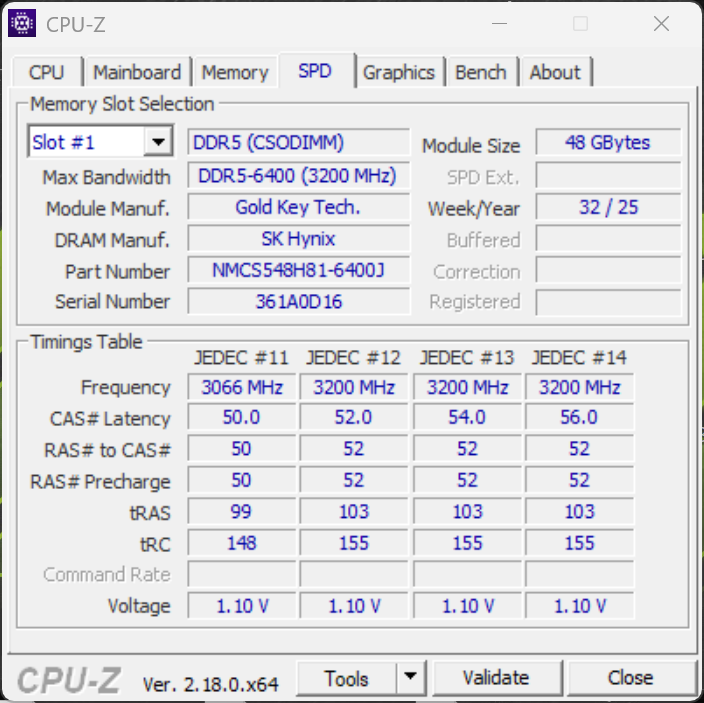
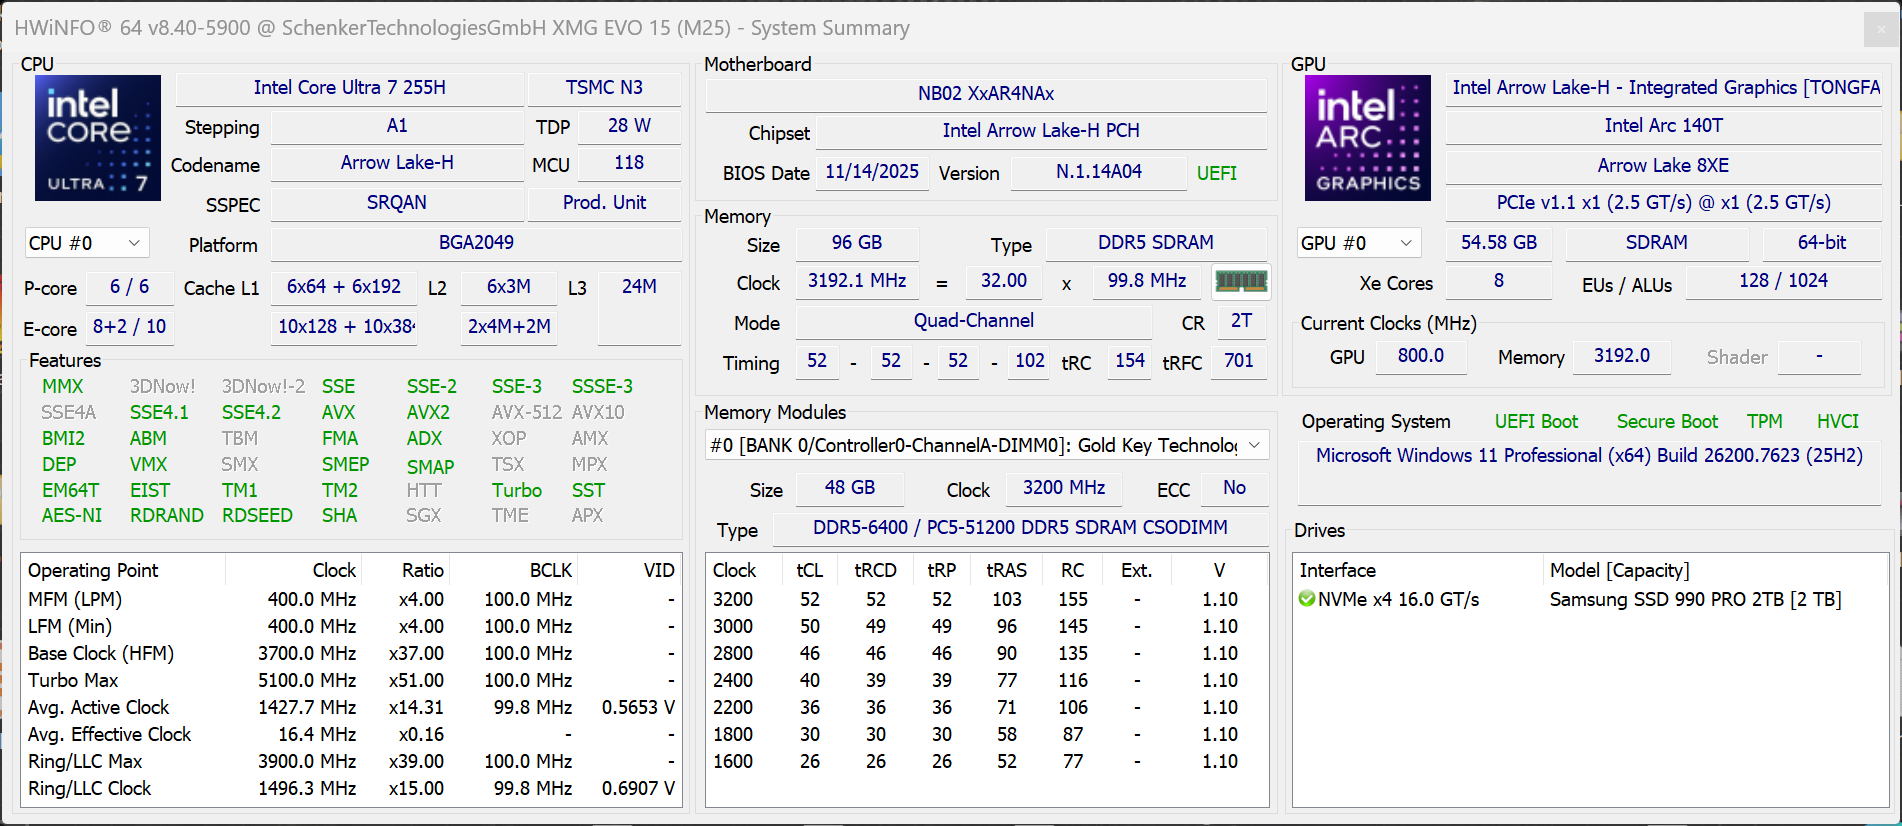
XMG has updated its slim 15-inch Evo 15 notebook and once again offers customers the choice between an AMD Ryzen AI 9 HX370 and the Intel Core Ultra 7 255H. Our test configuration costs €2,365 due to the generous memory configuration (the upgrade to 96 GB of RAM alone currently costs €810).
Specifications
Case & equipment
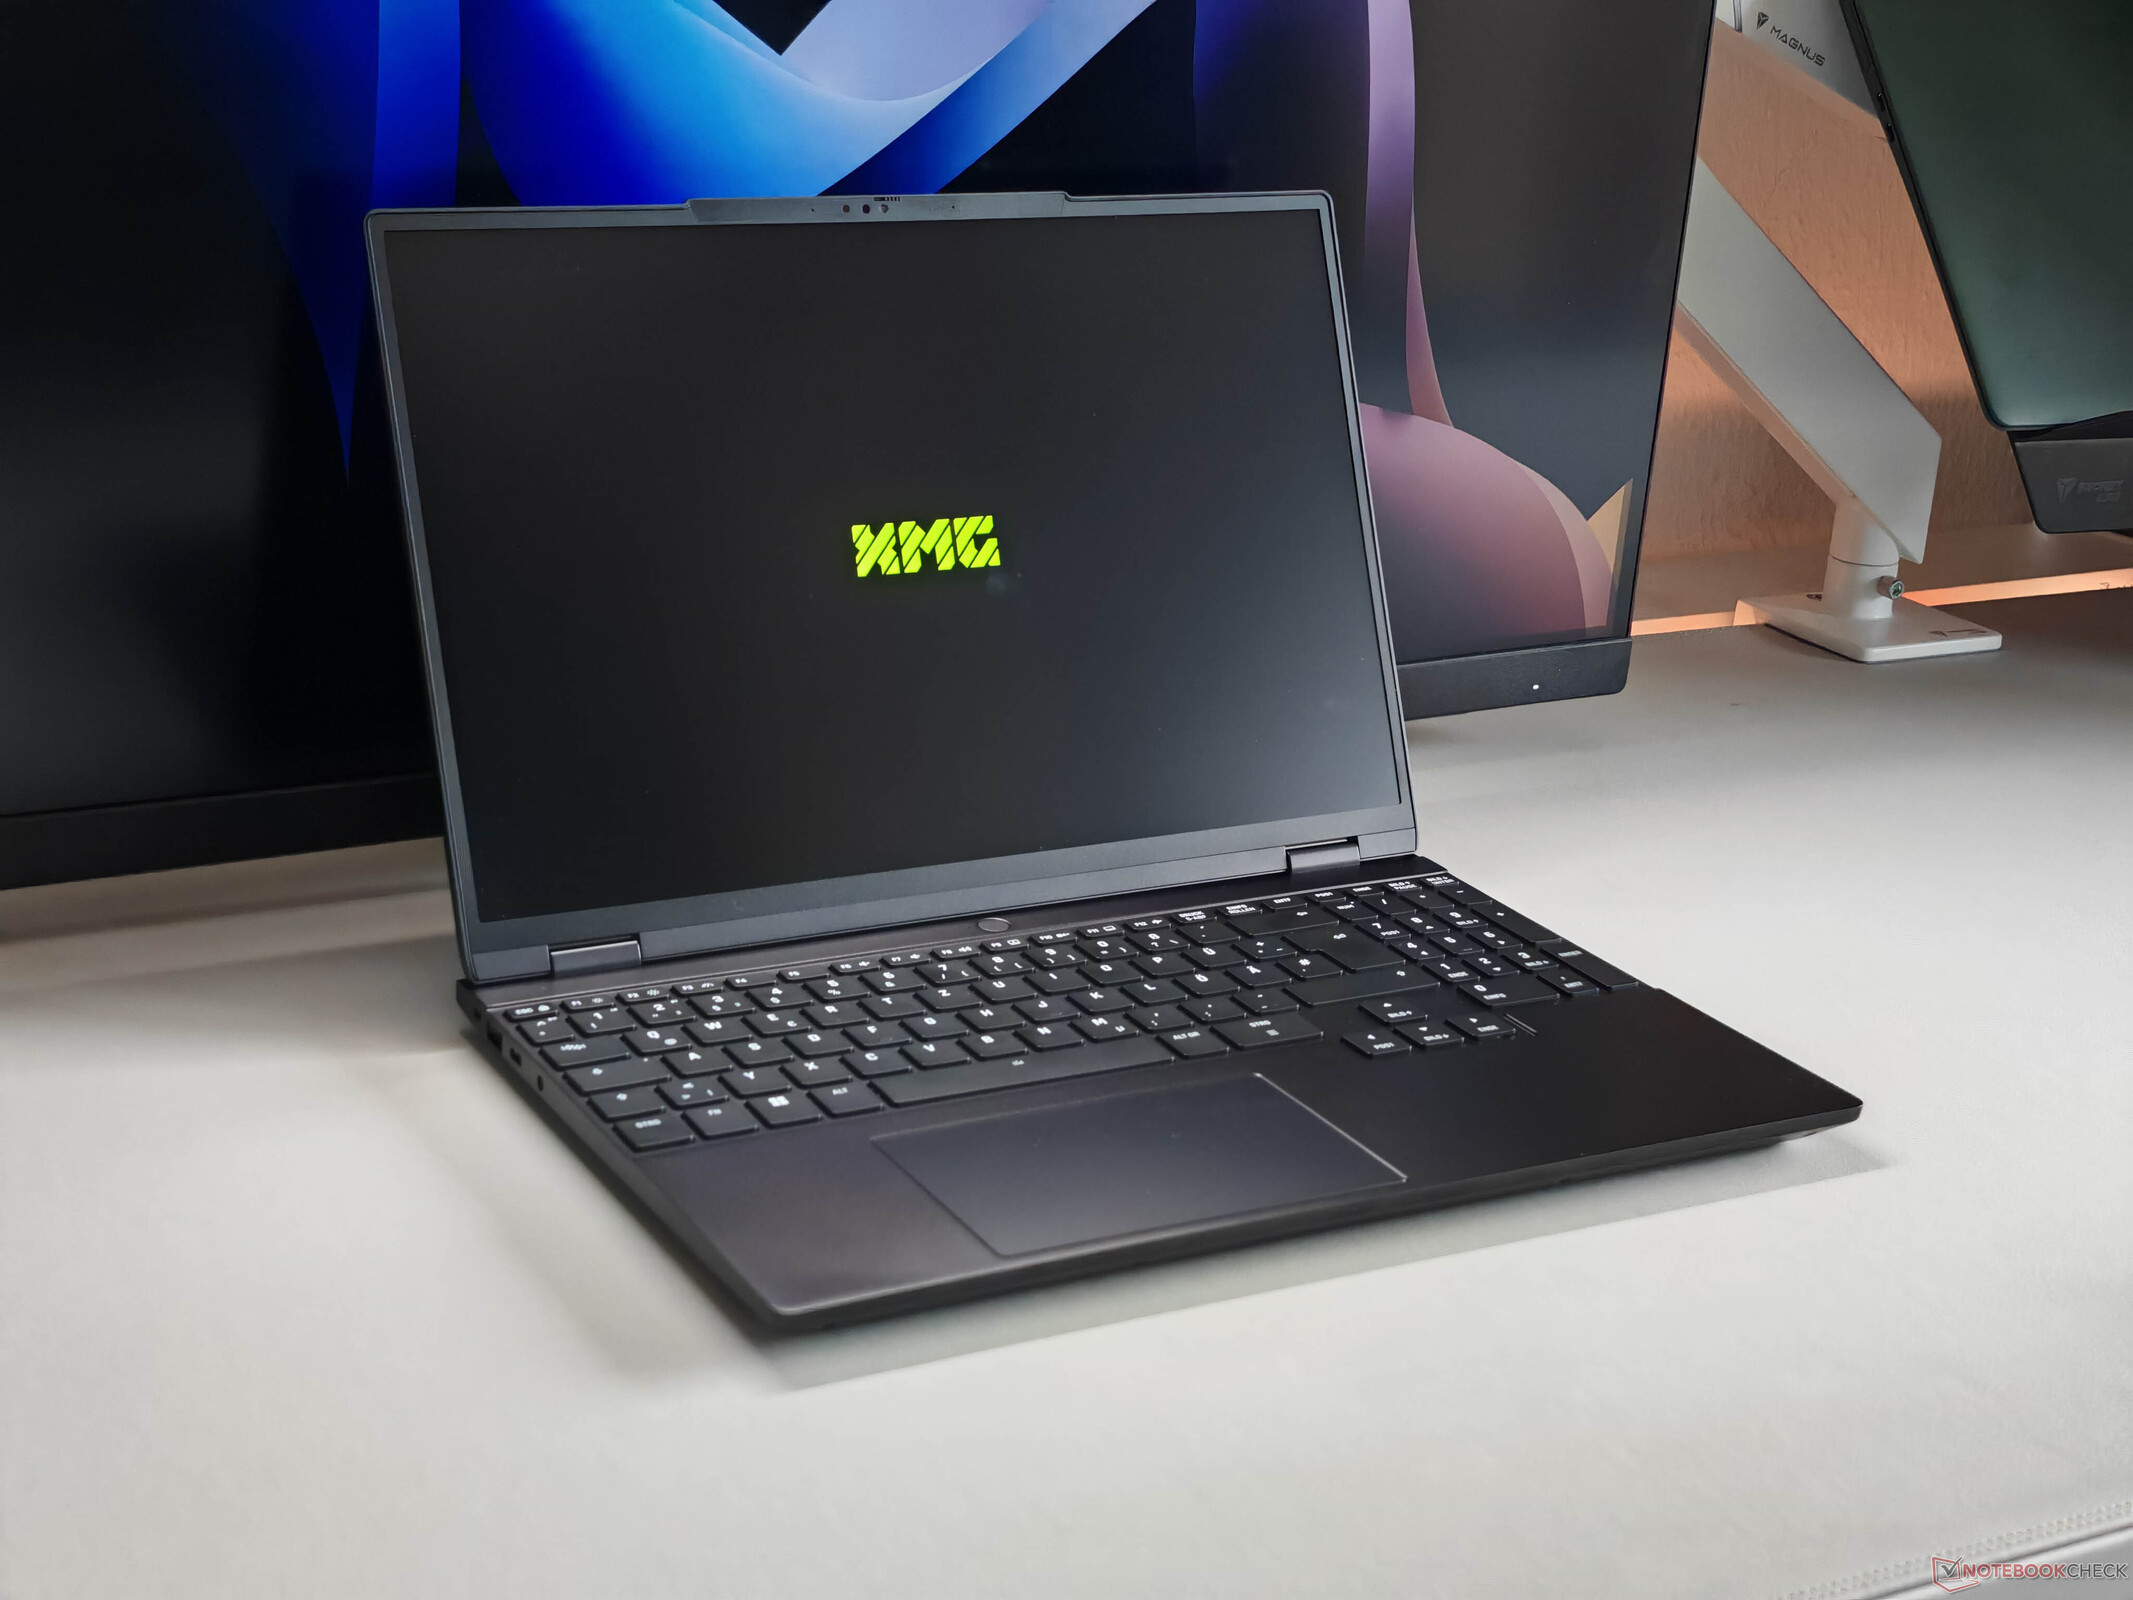
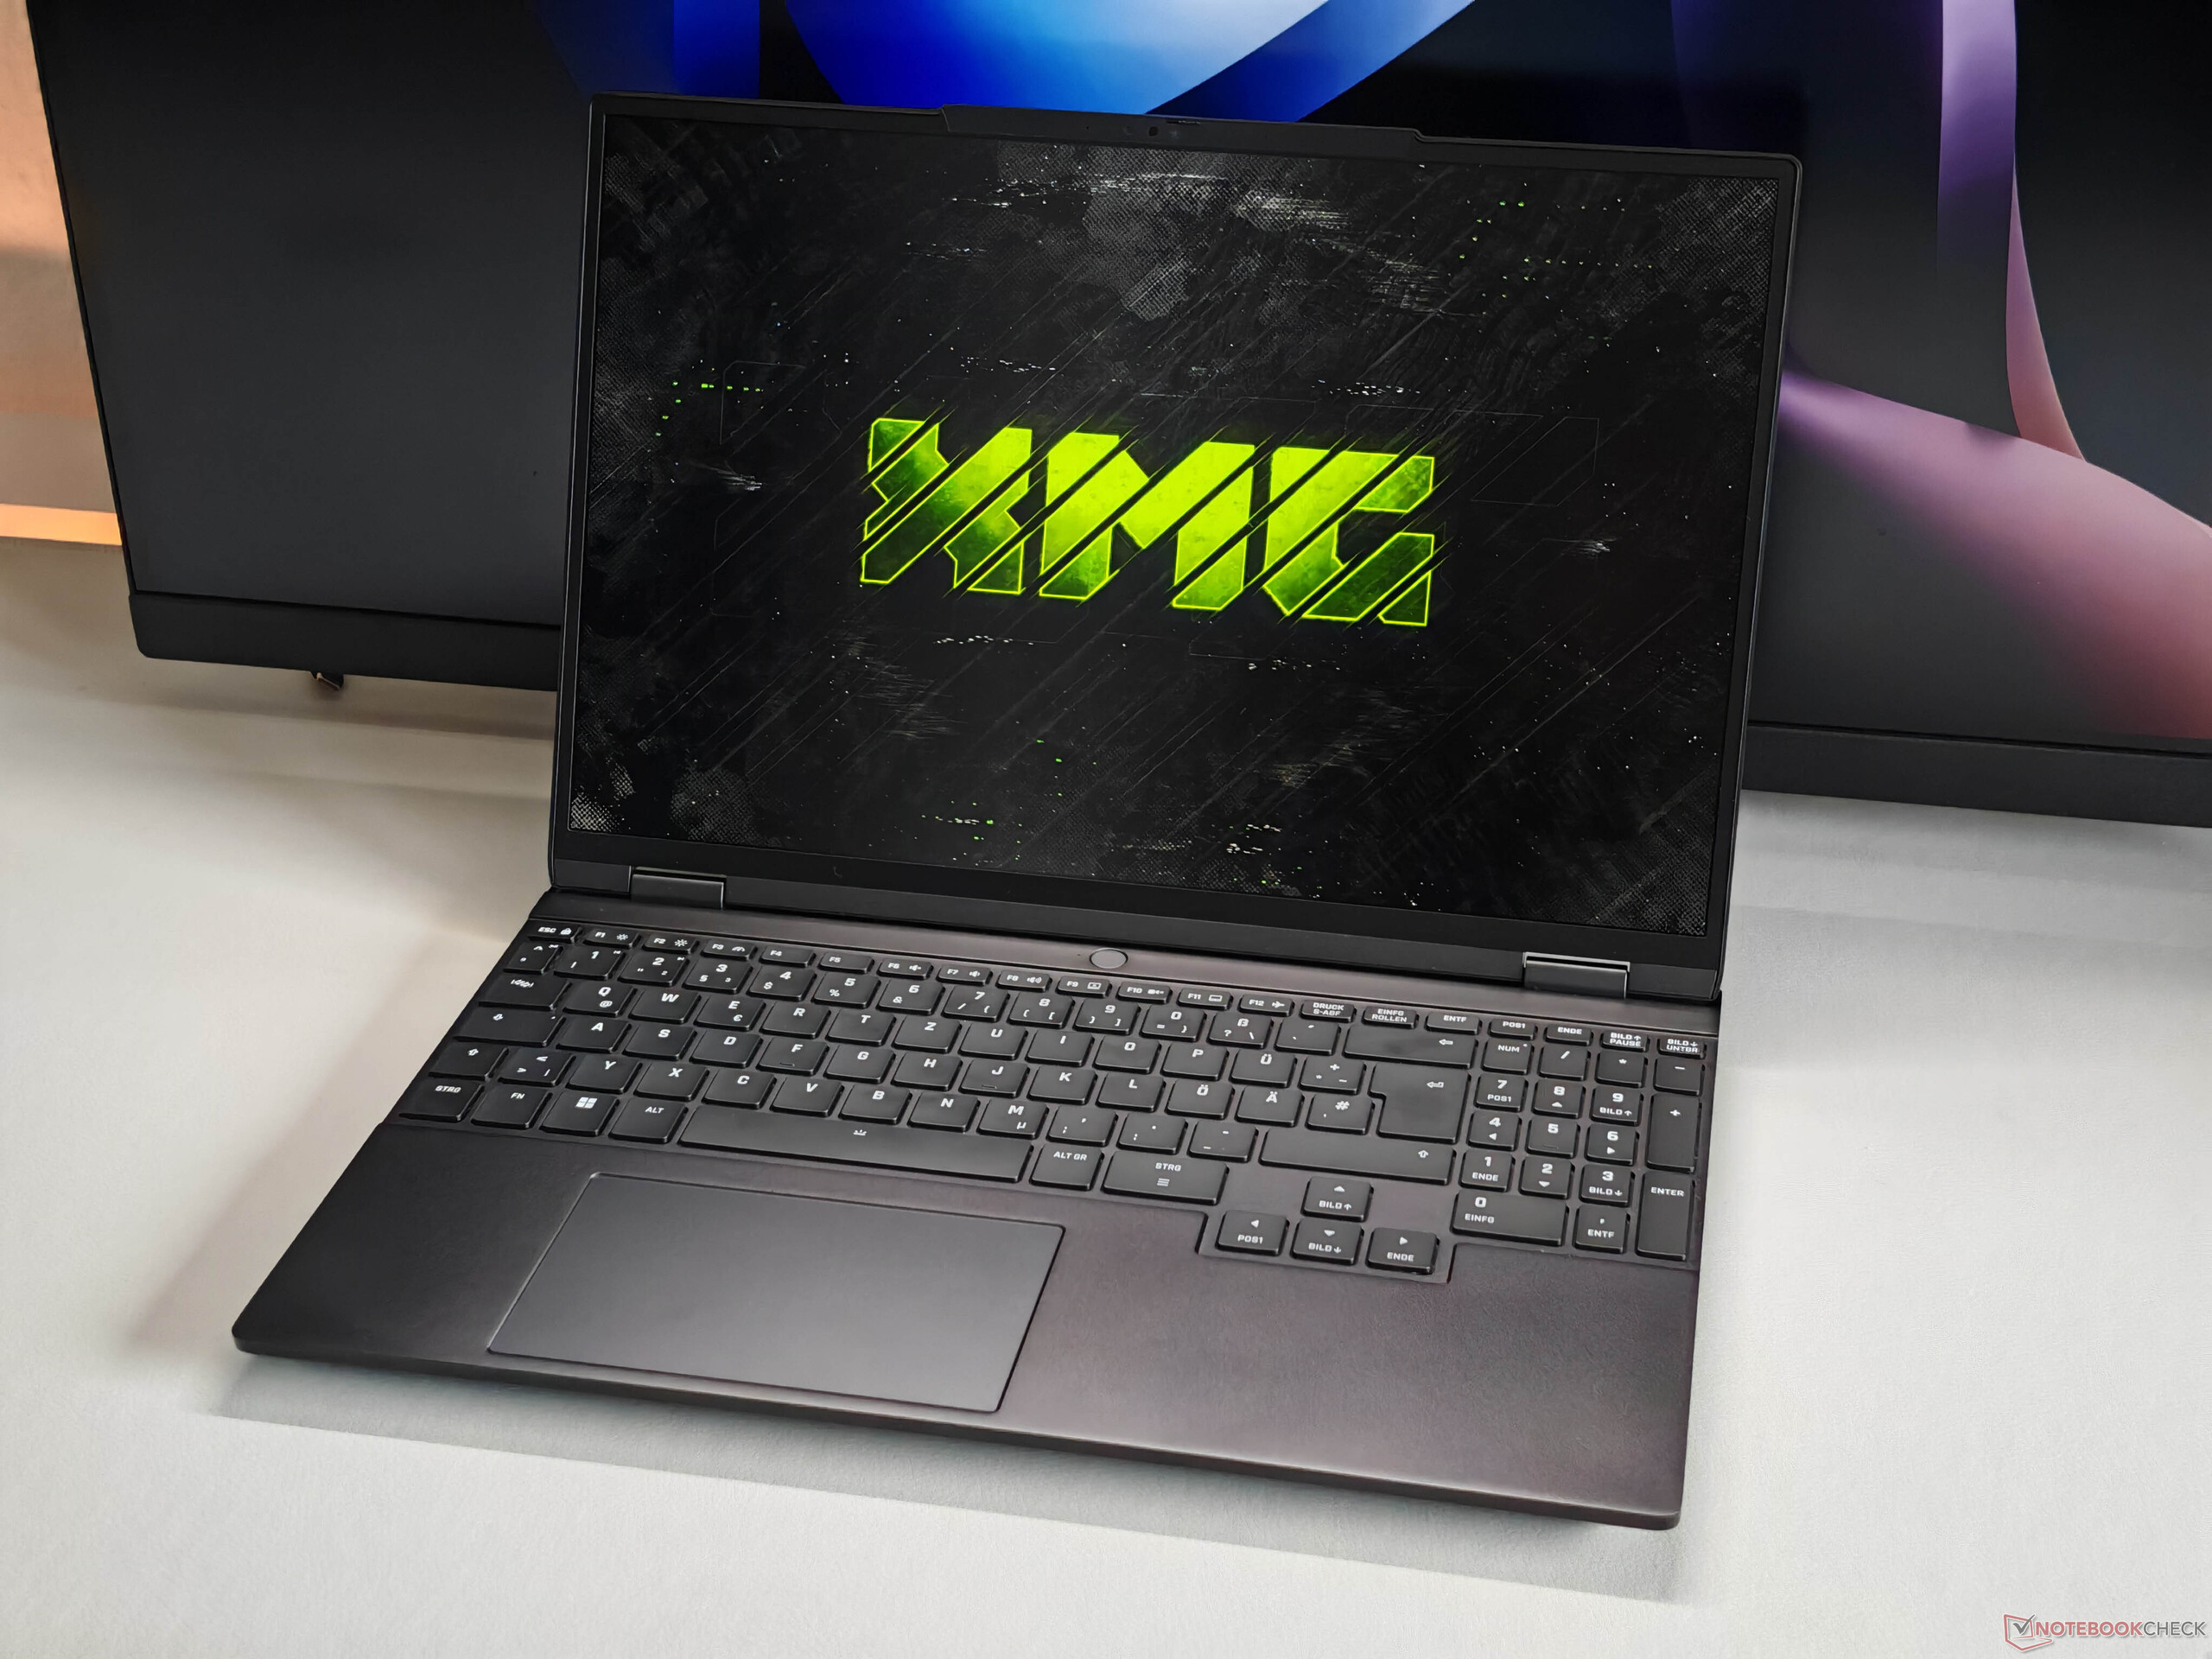
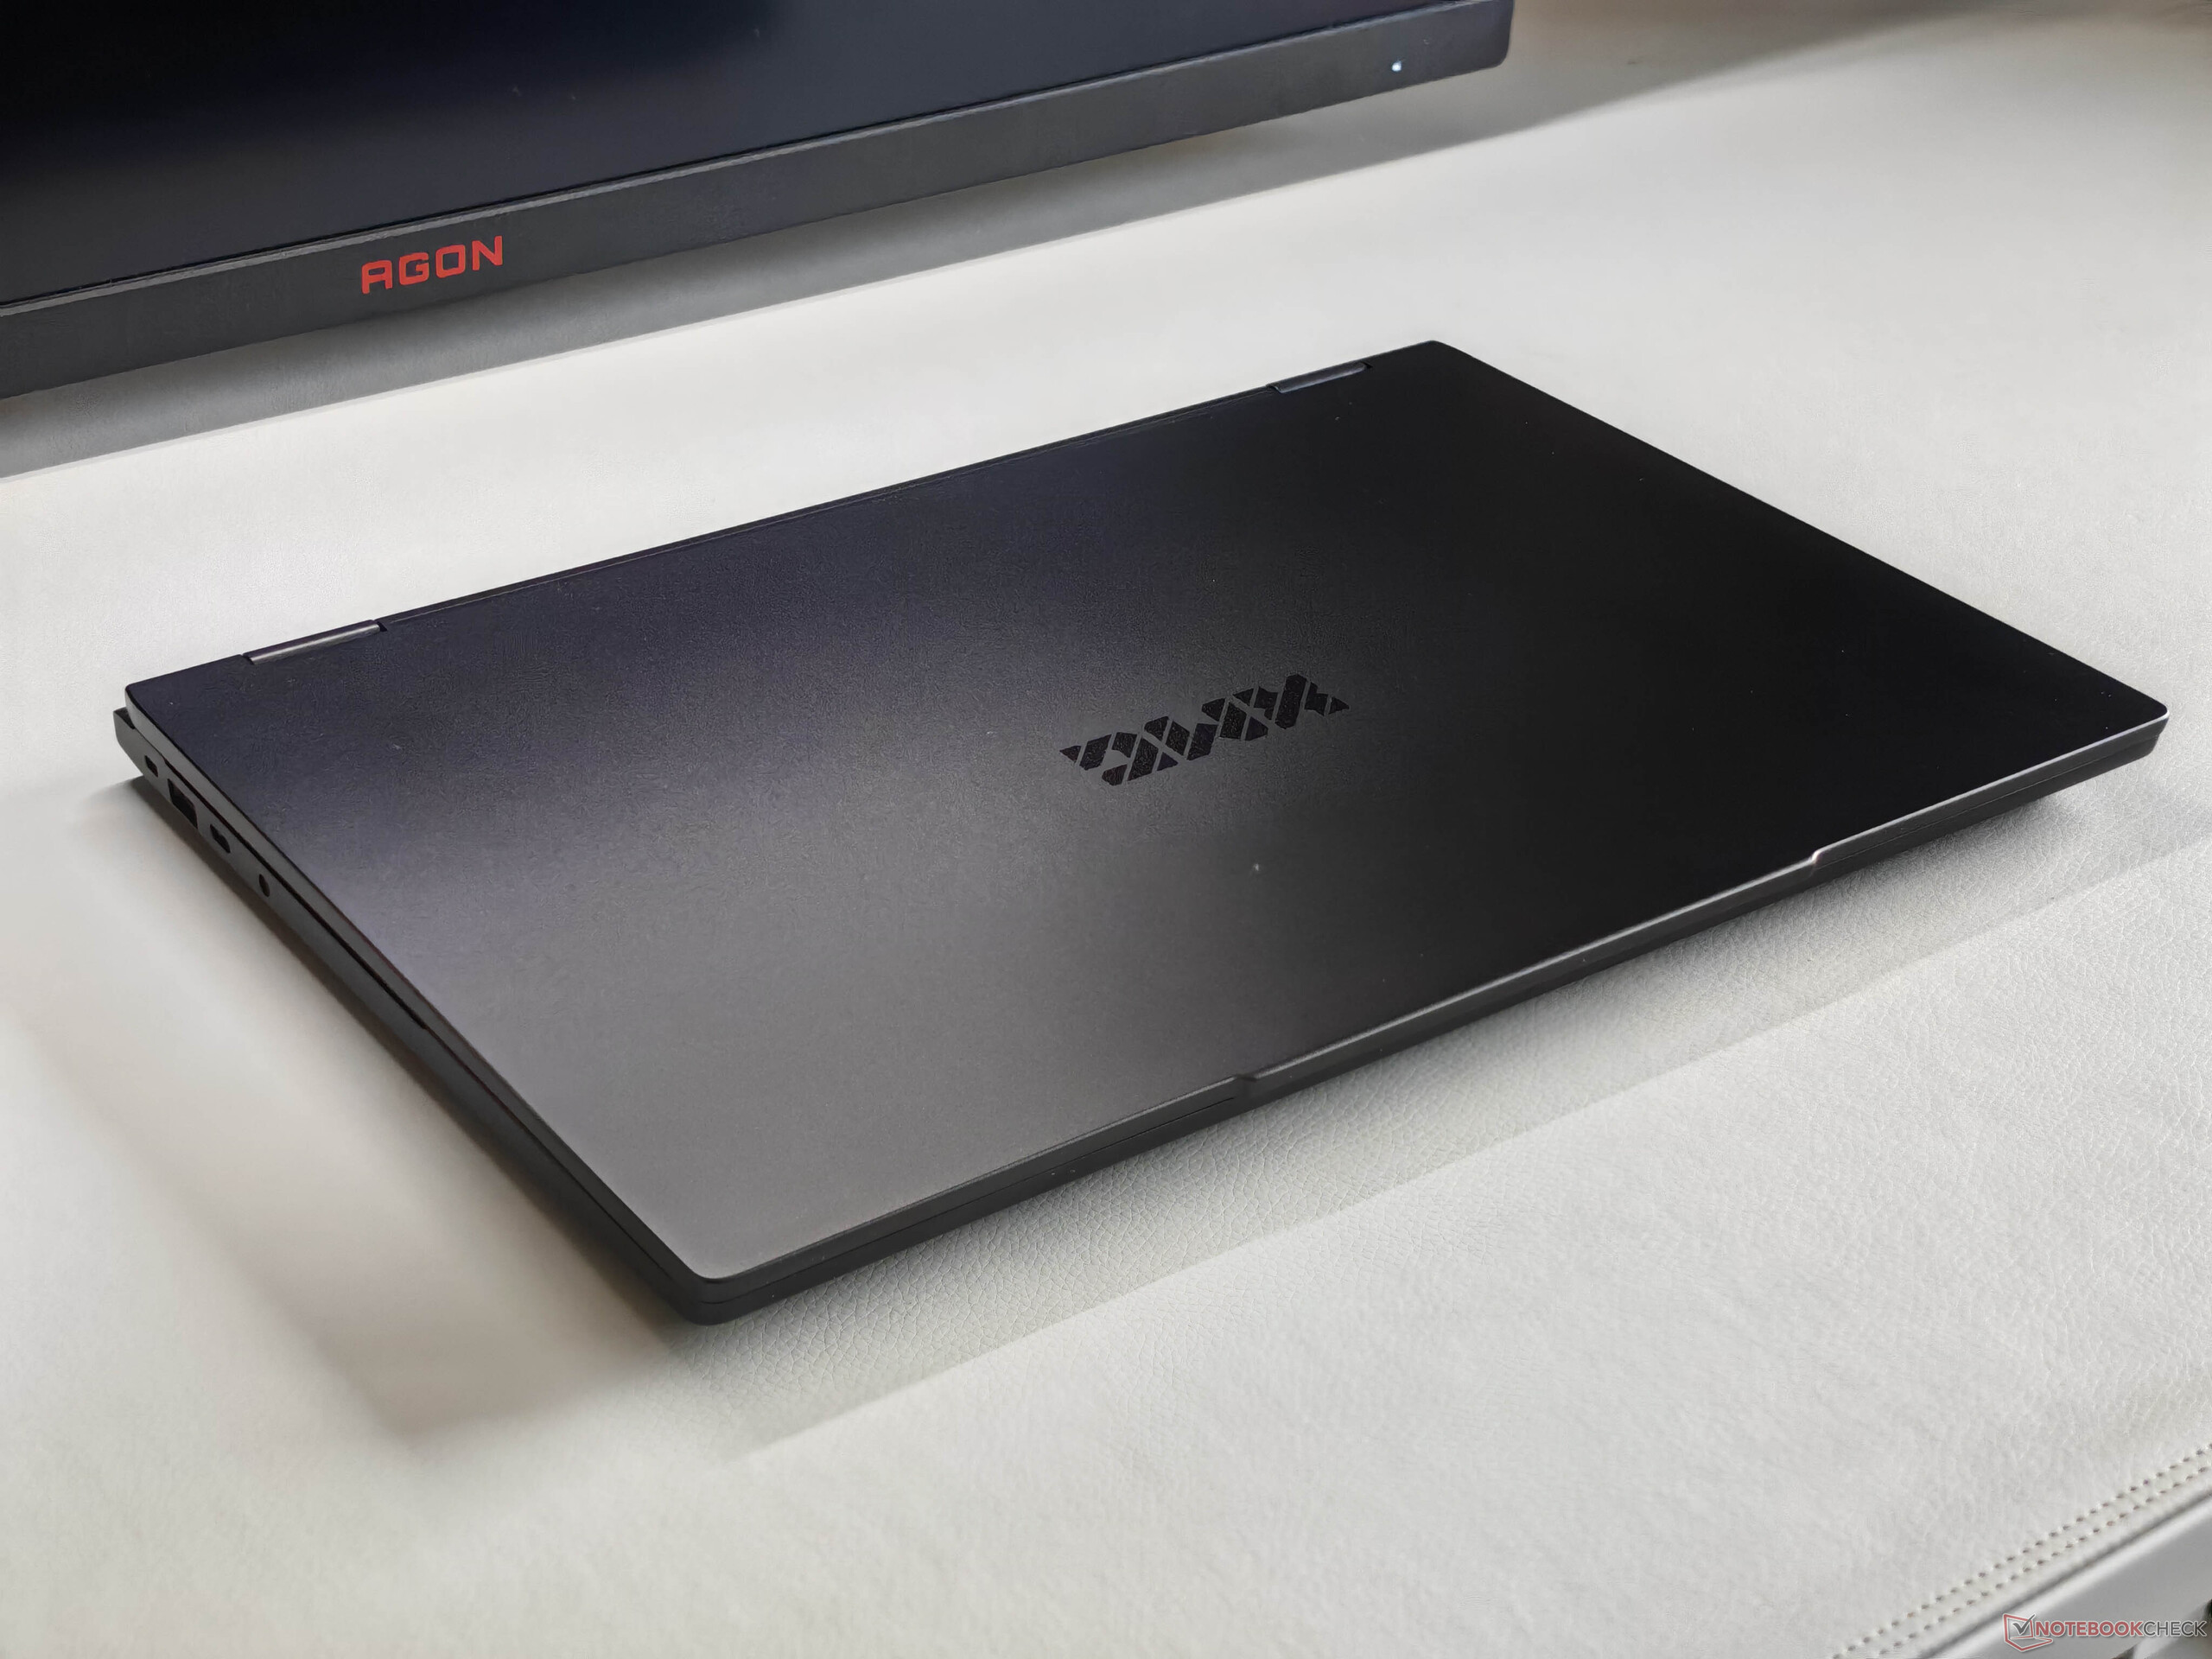
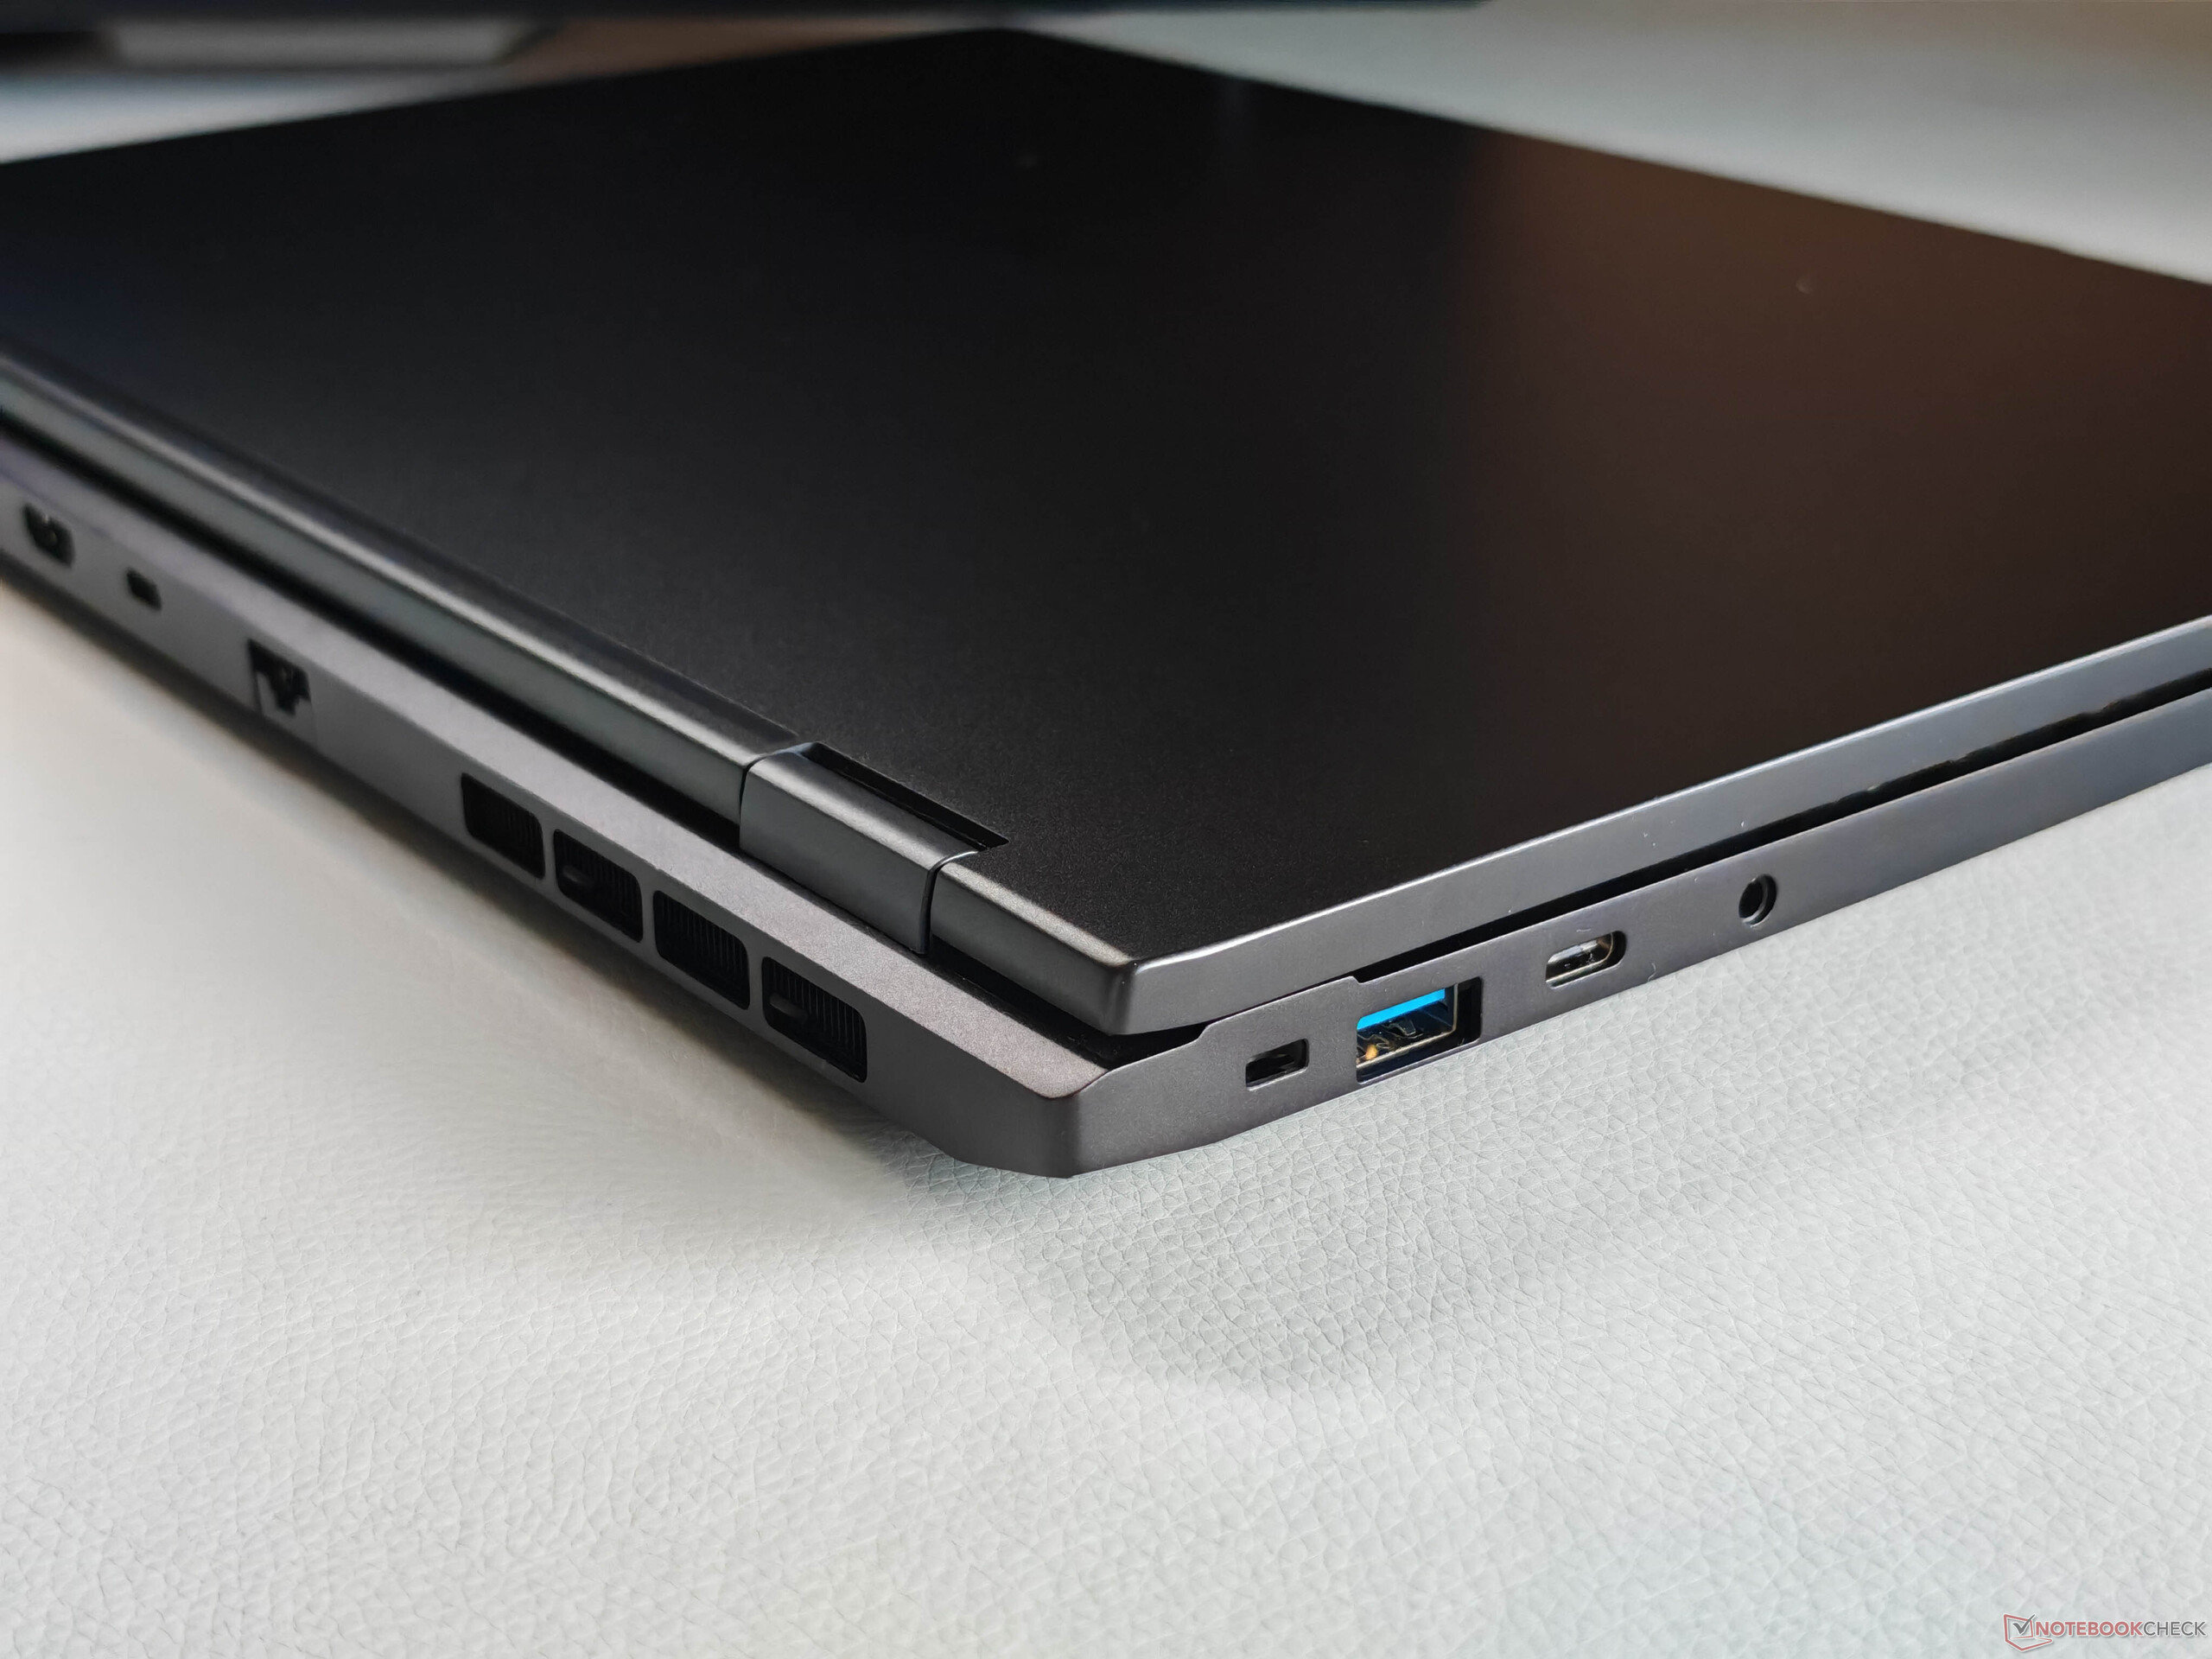
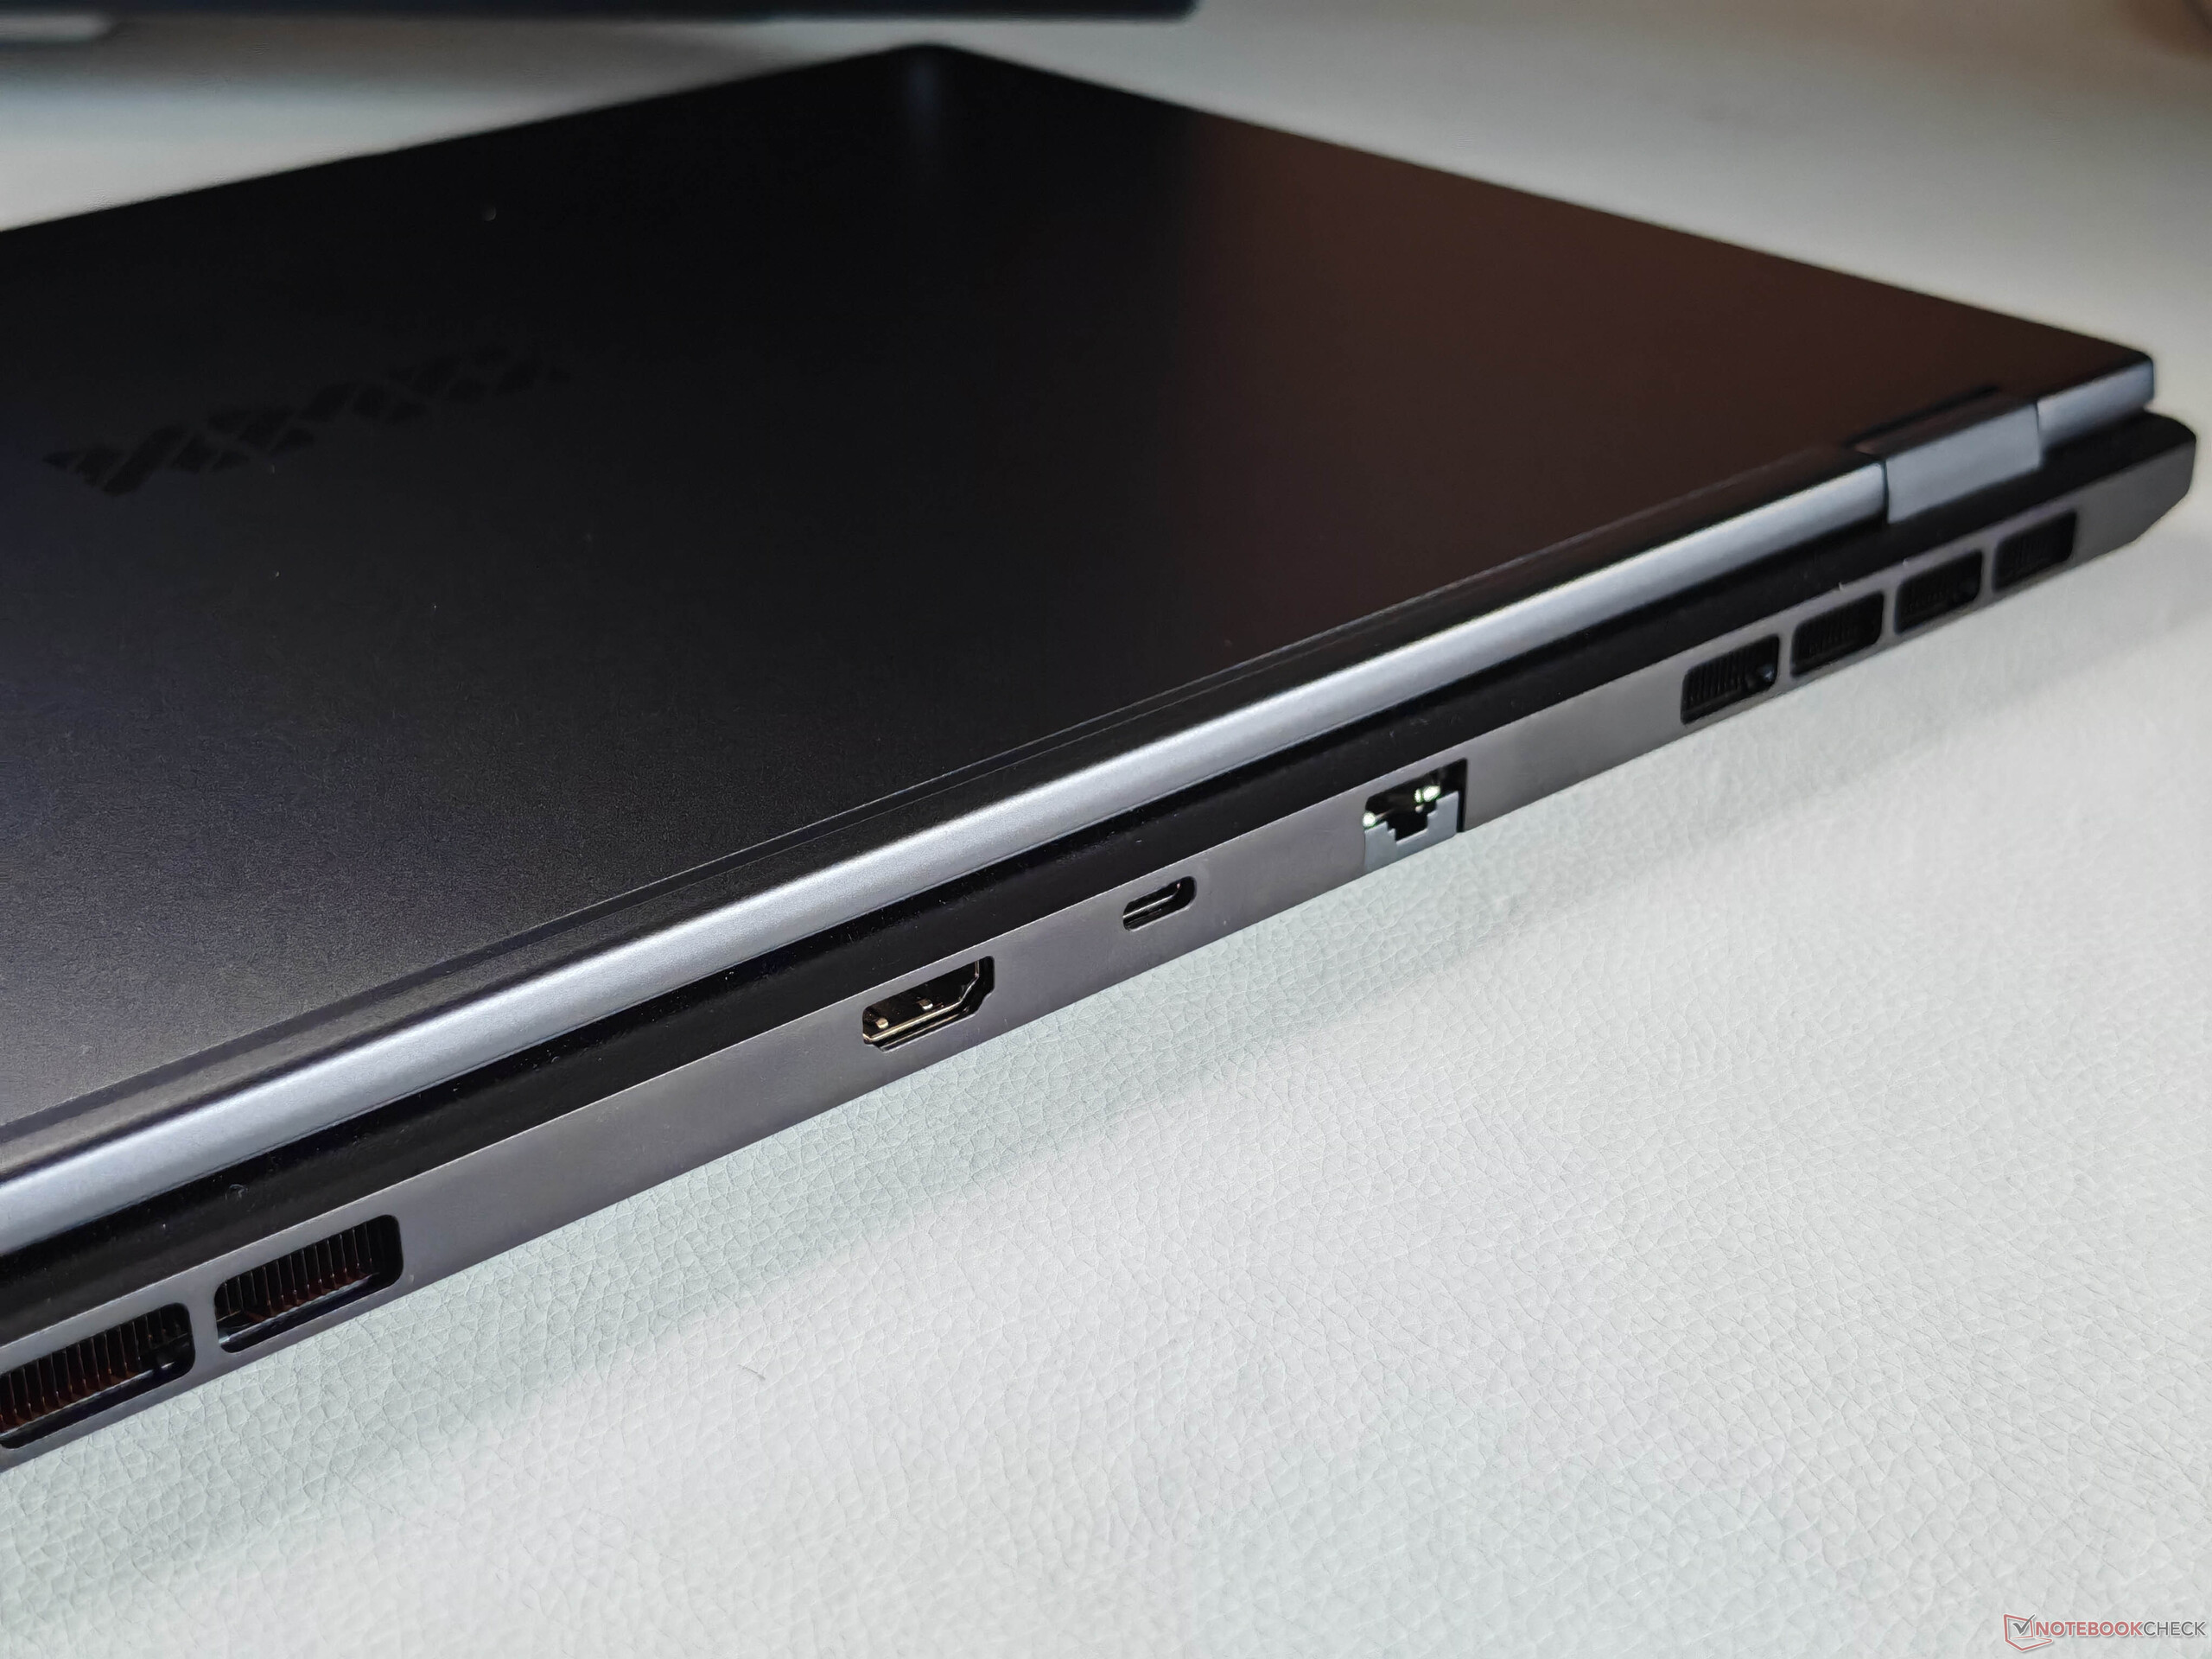
There are no changes to the chassis compared to last year's model, and the Evo 15 remains a very slim and high-quality laptop. The black aluminum casing is very well built and sturdy, although fingerprints become visible quickly. The hinges (maximum opening angle) are also well tuned, with only minimal wobble.
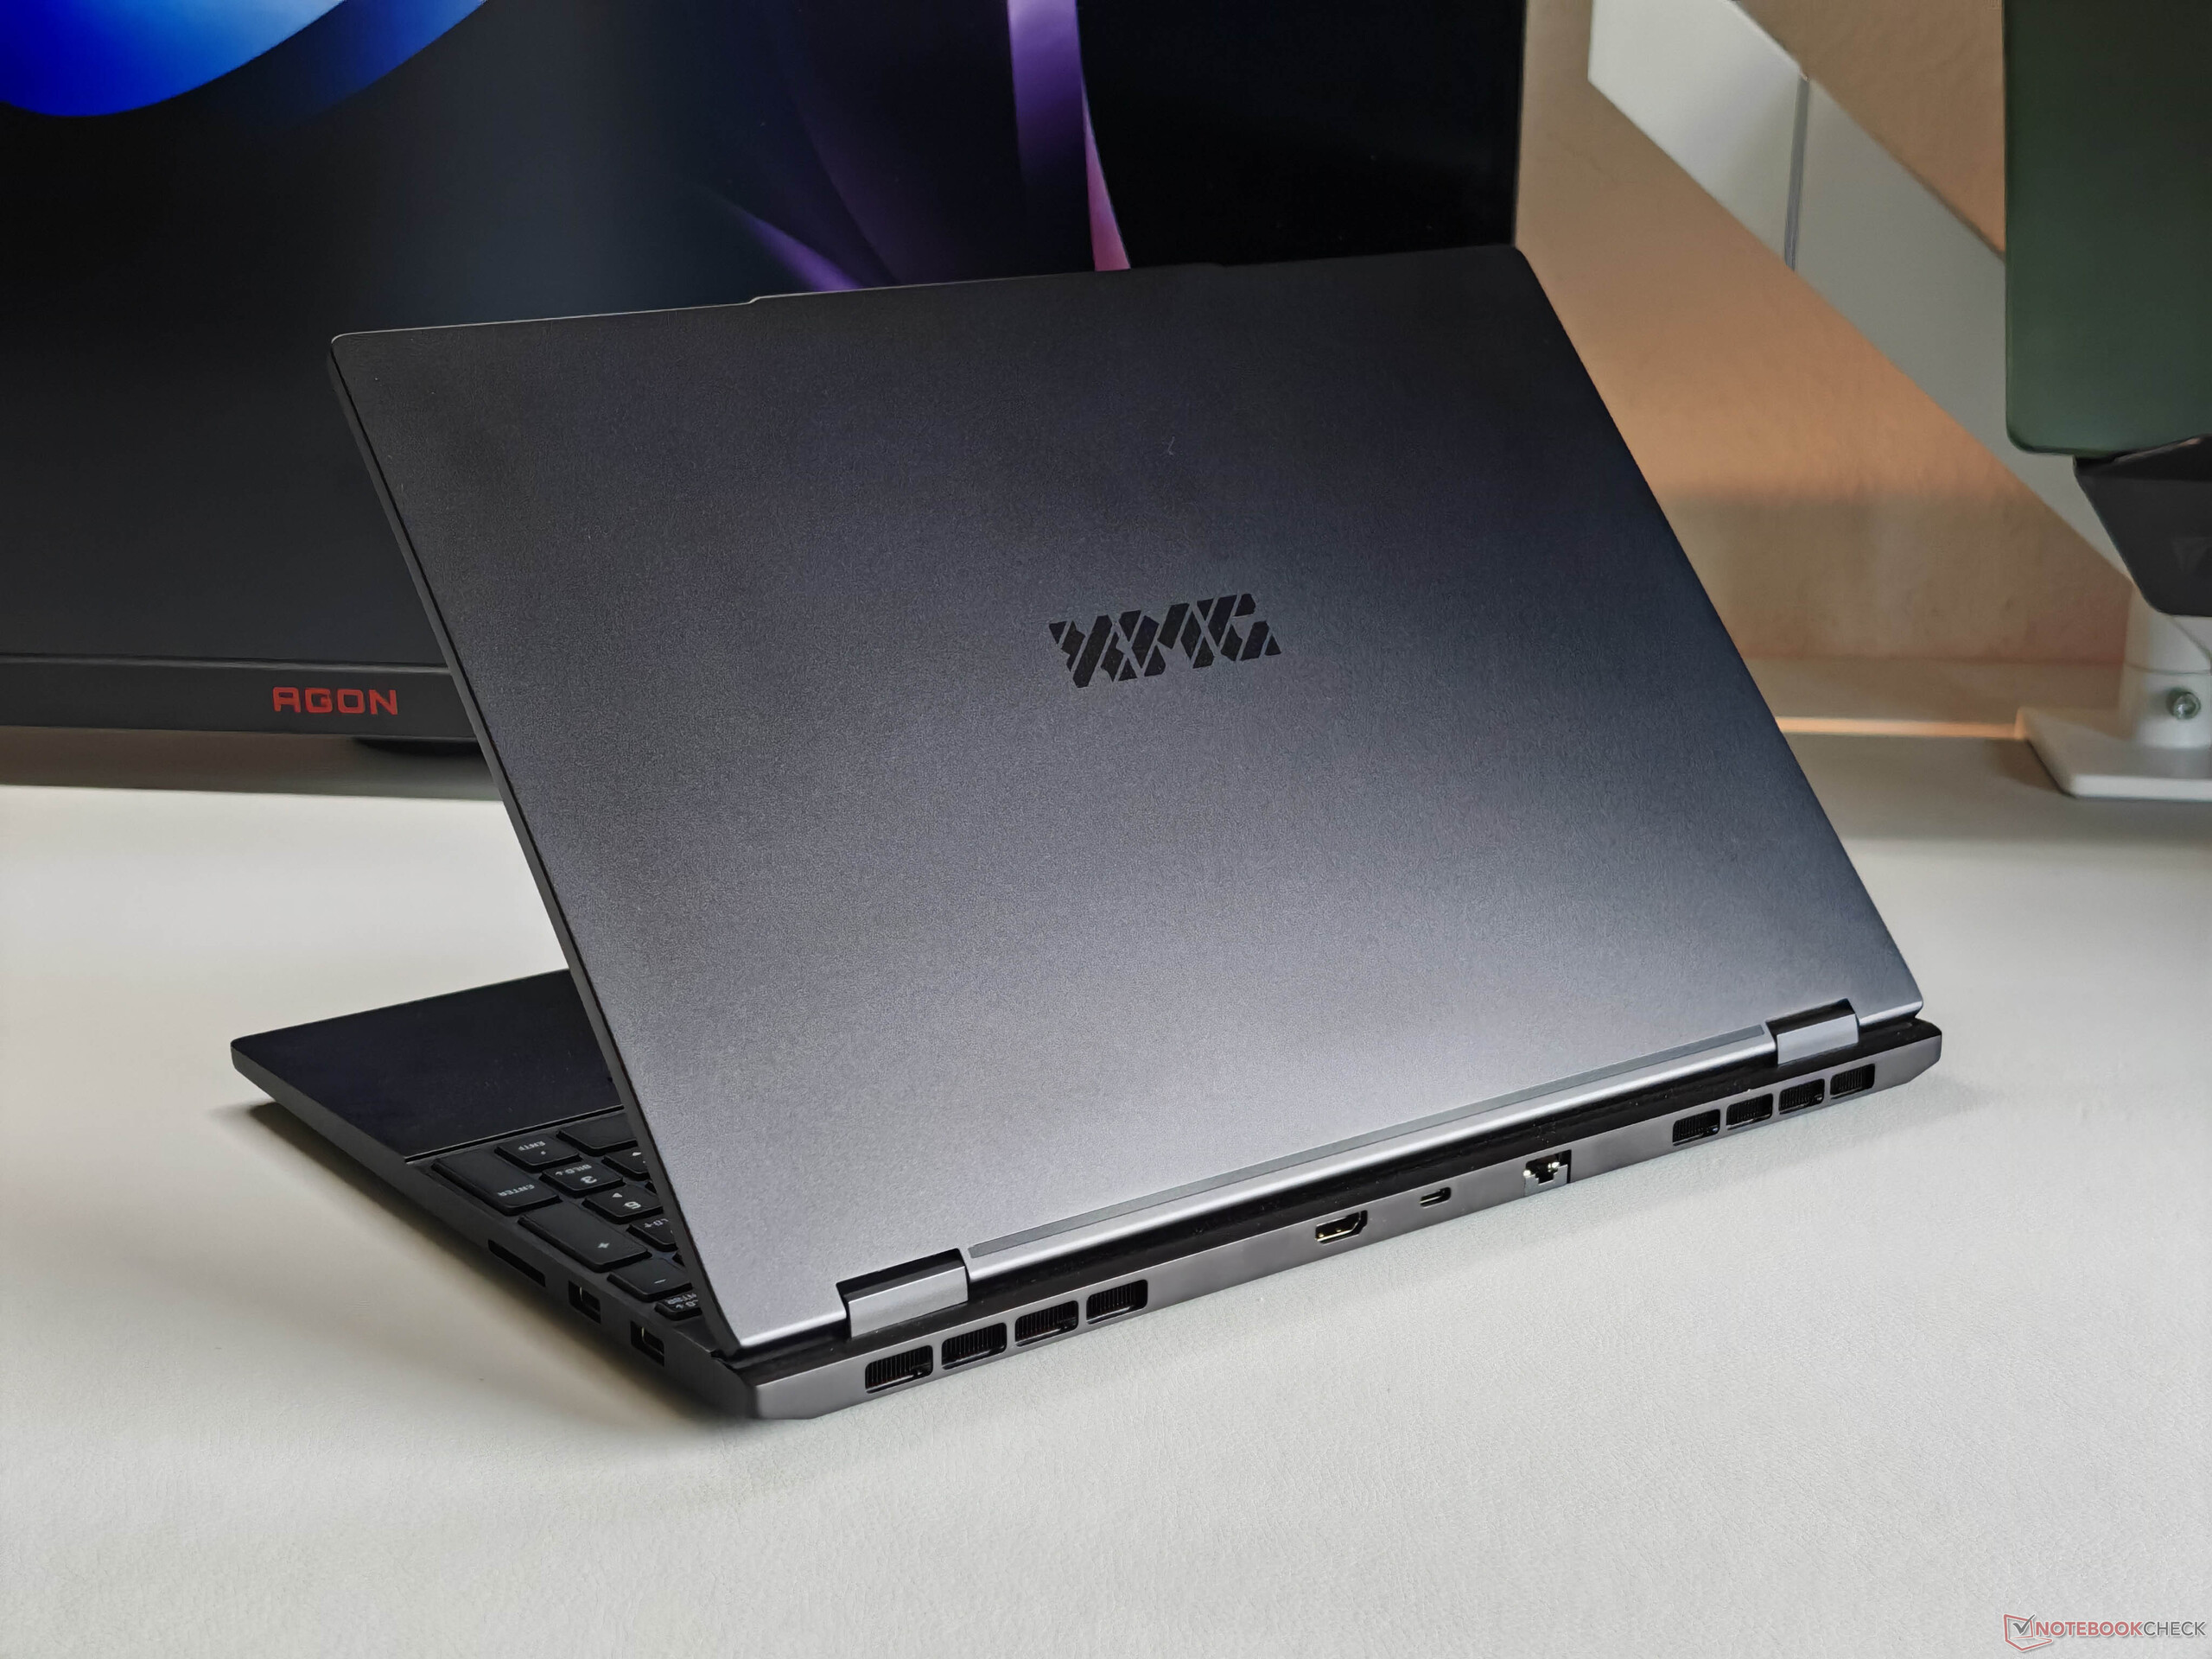
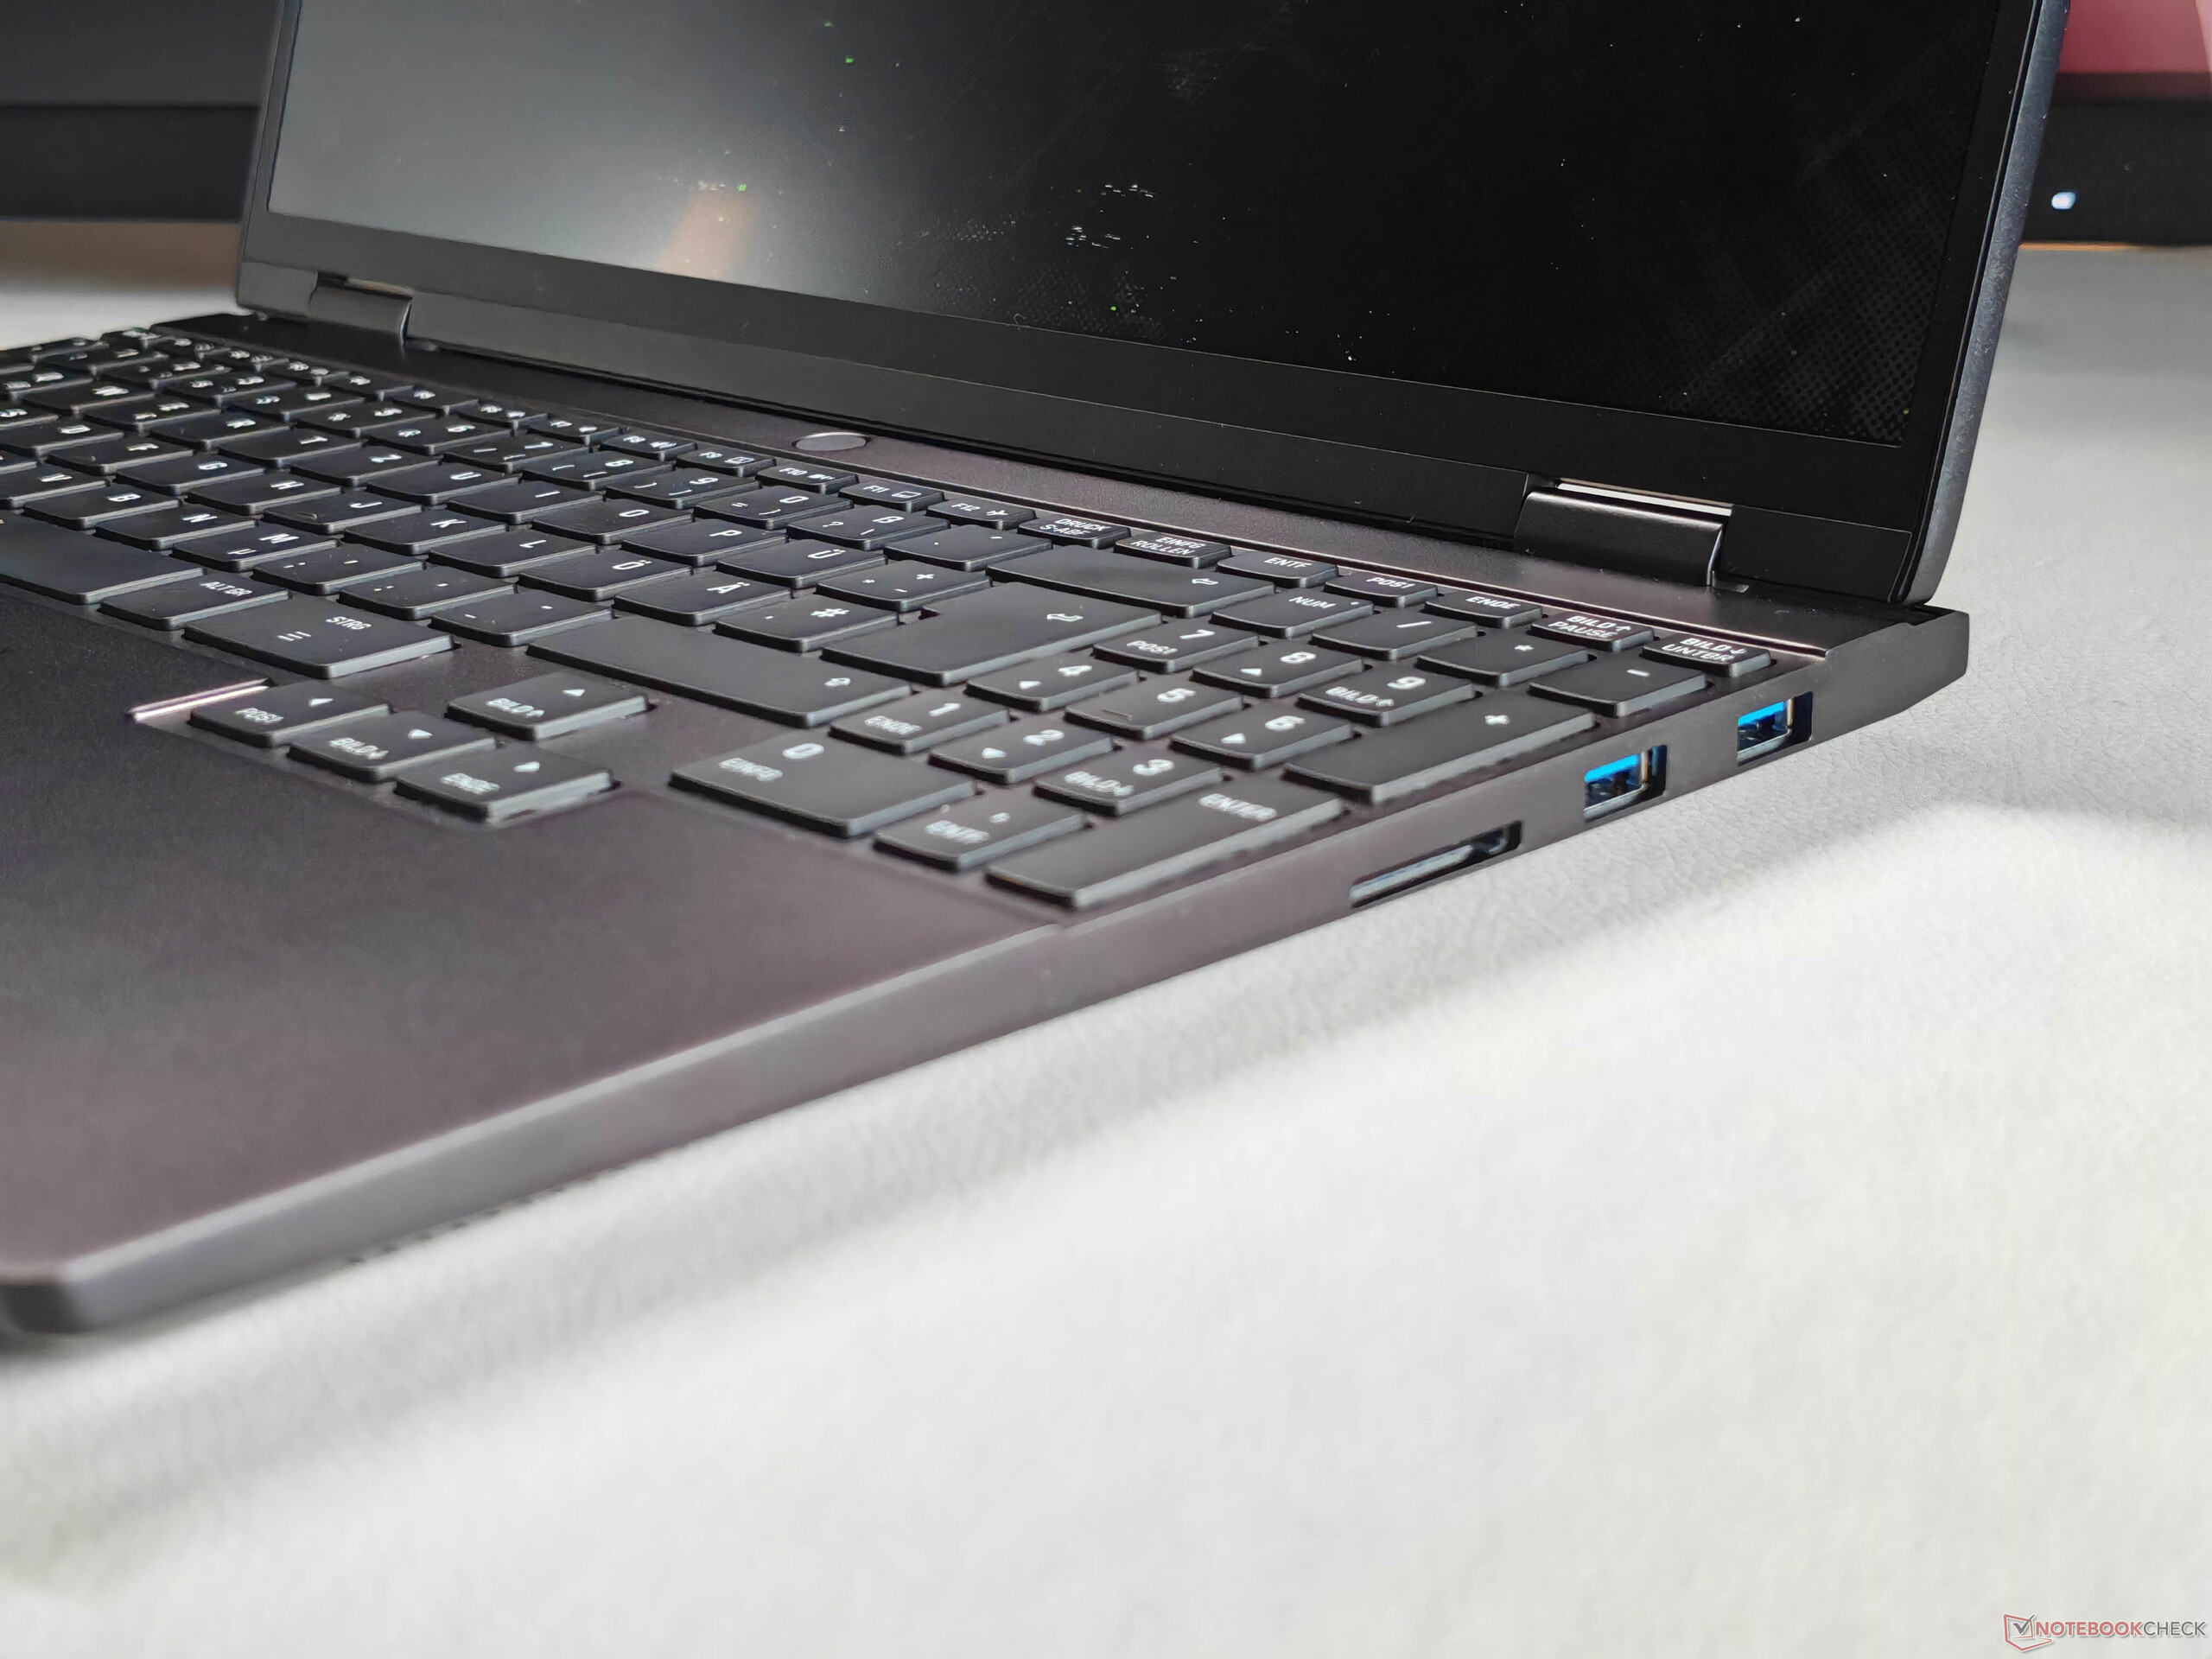
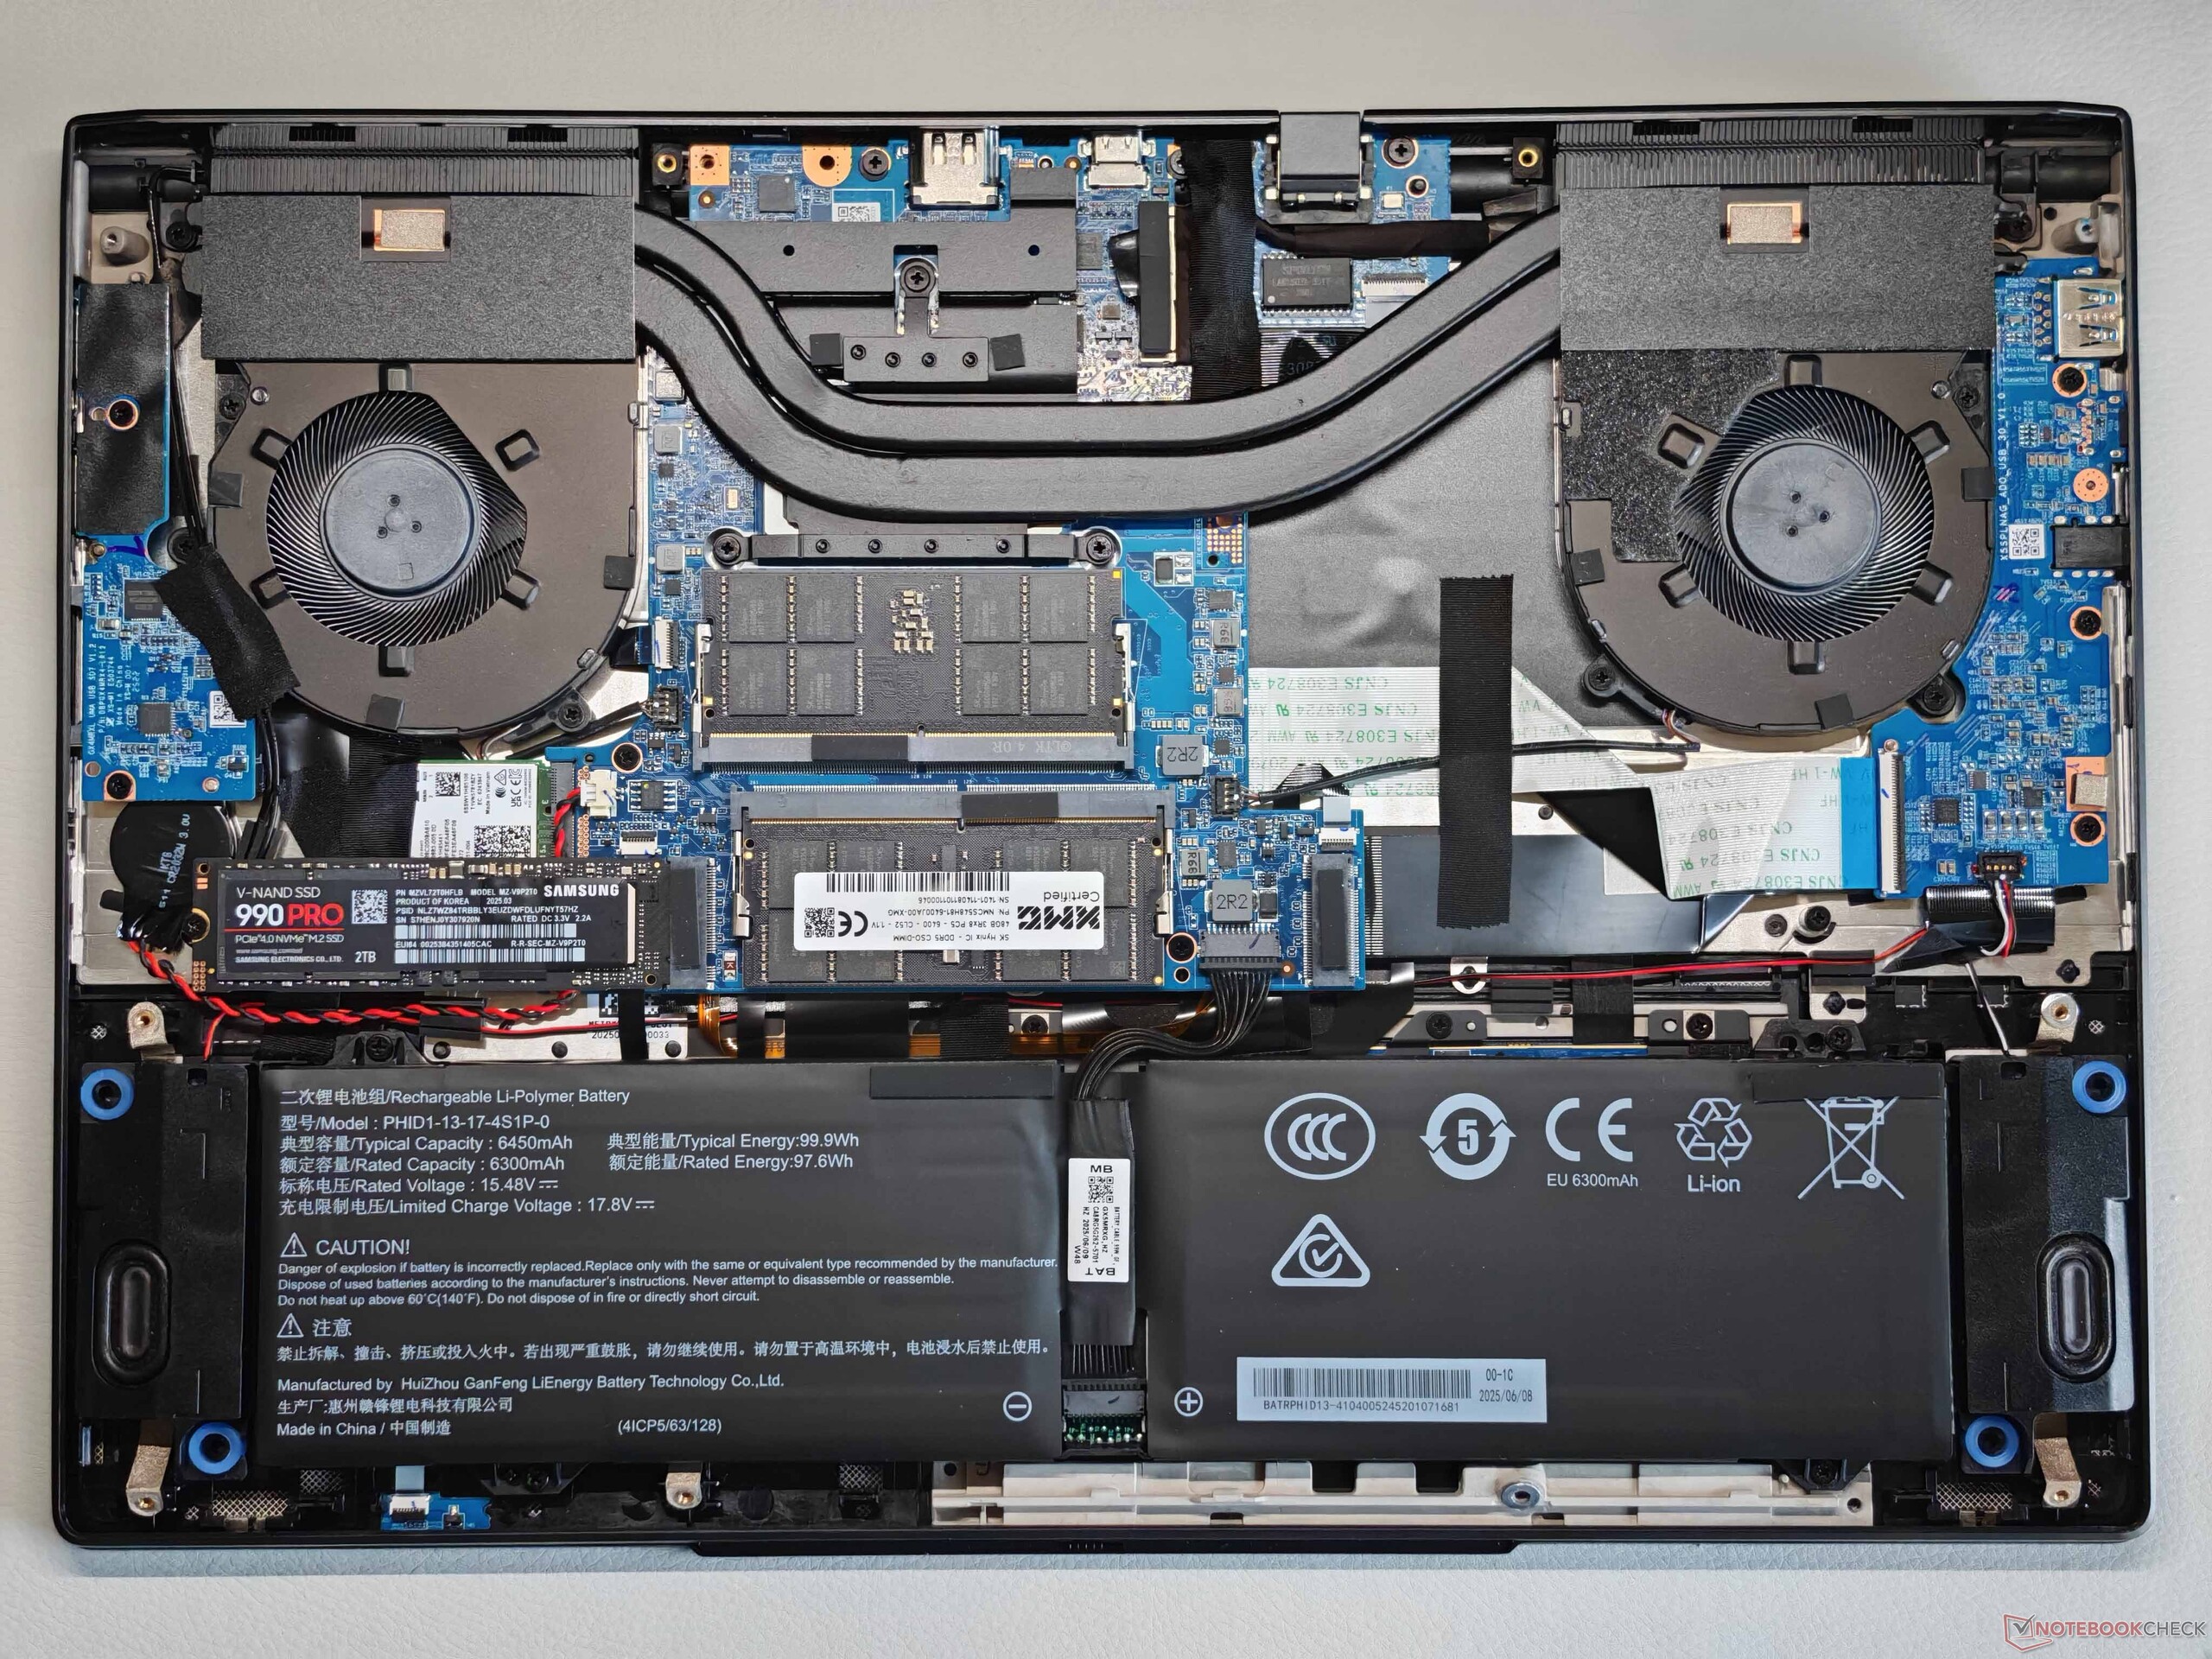
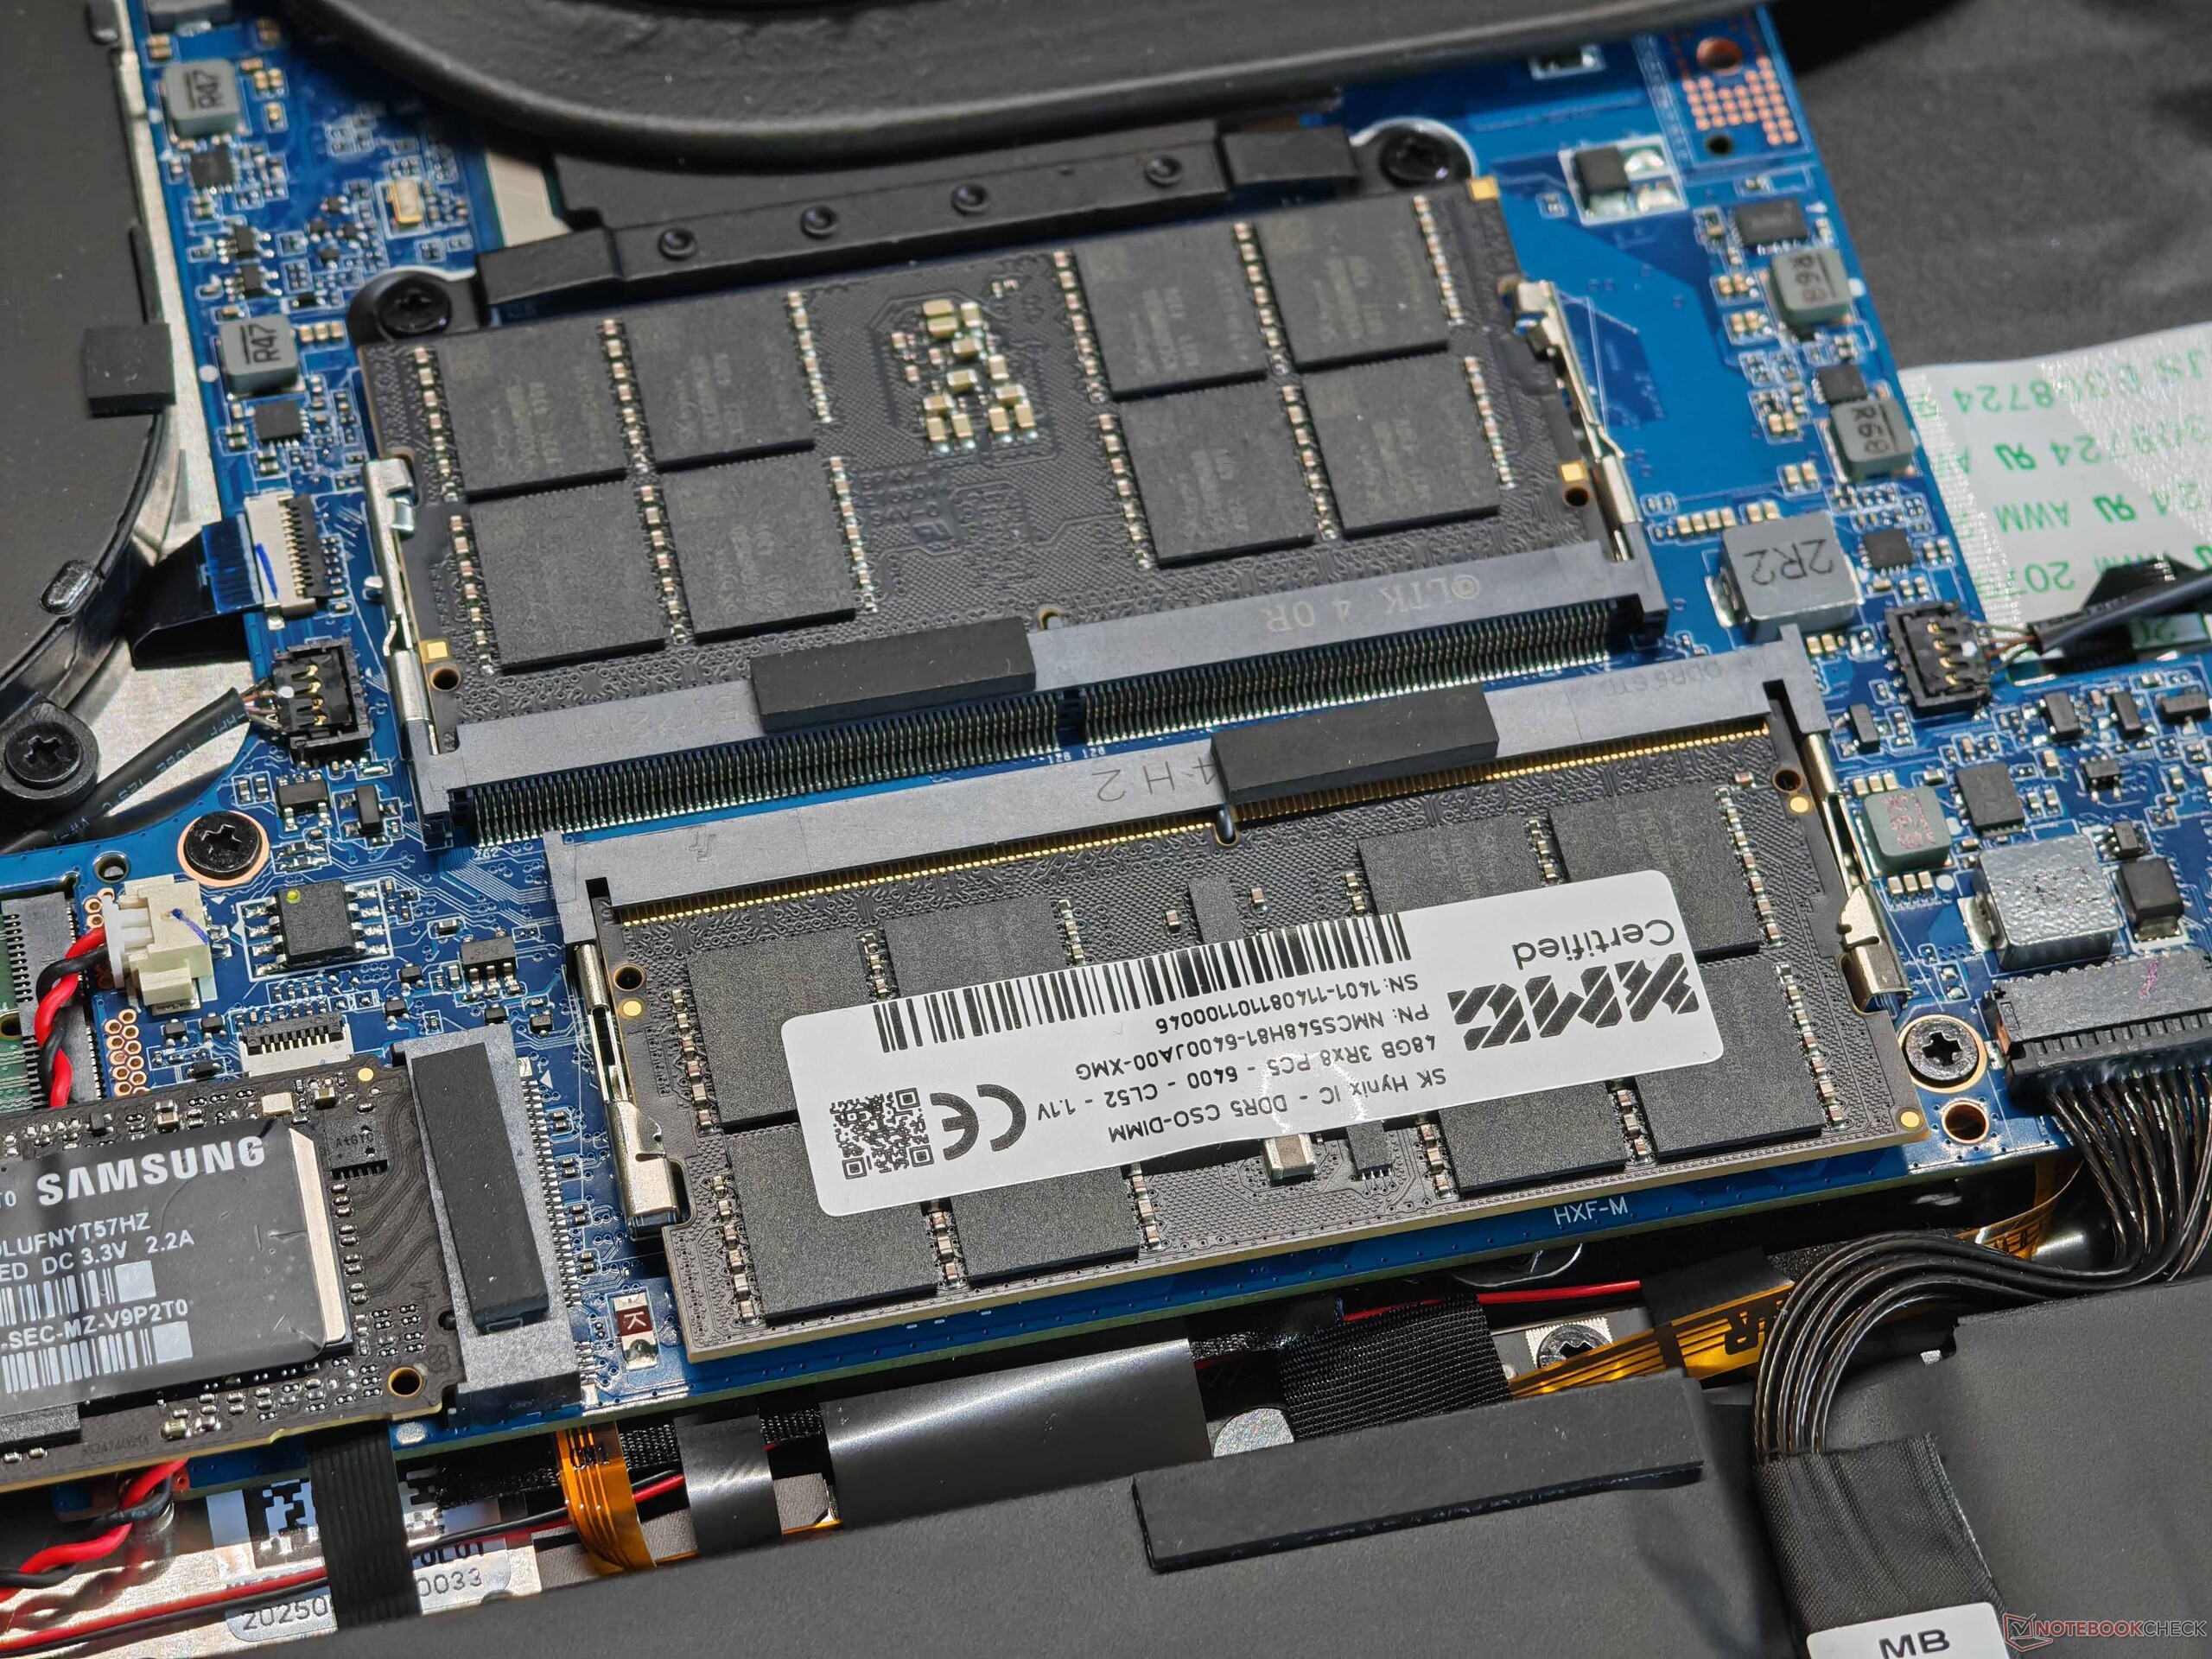
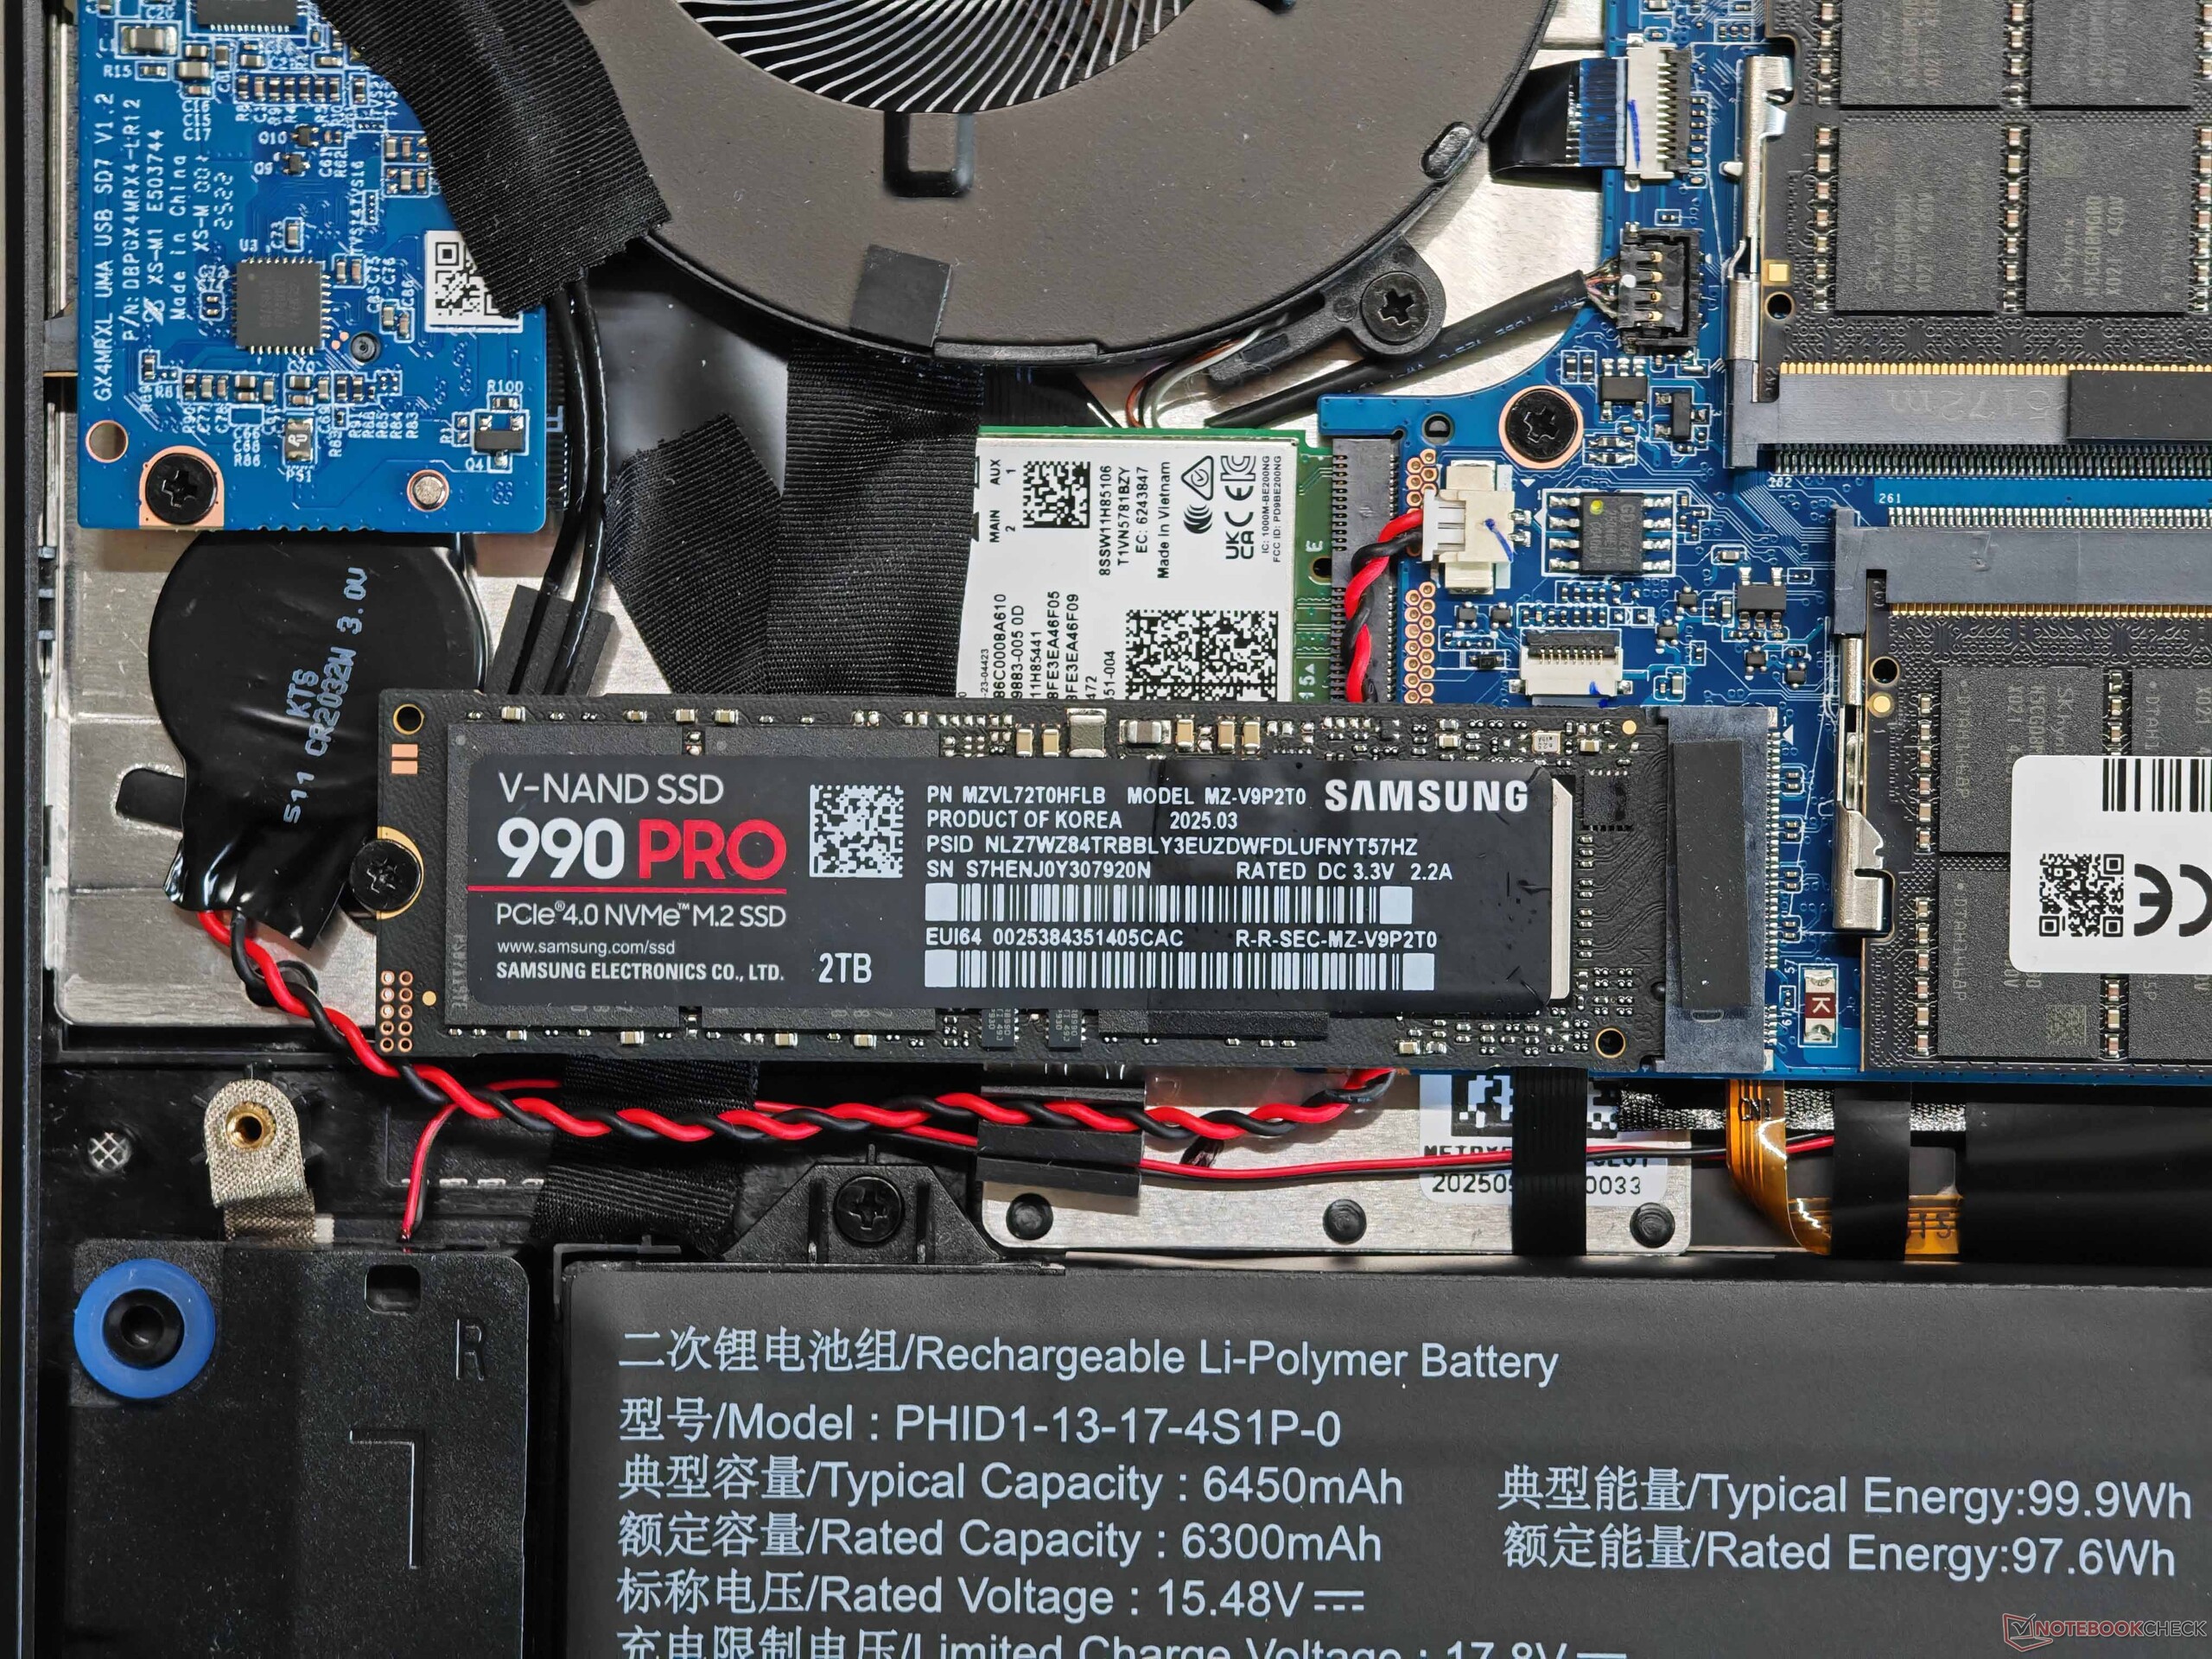
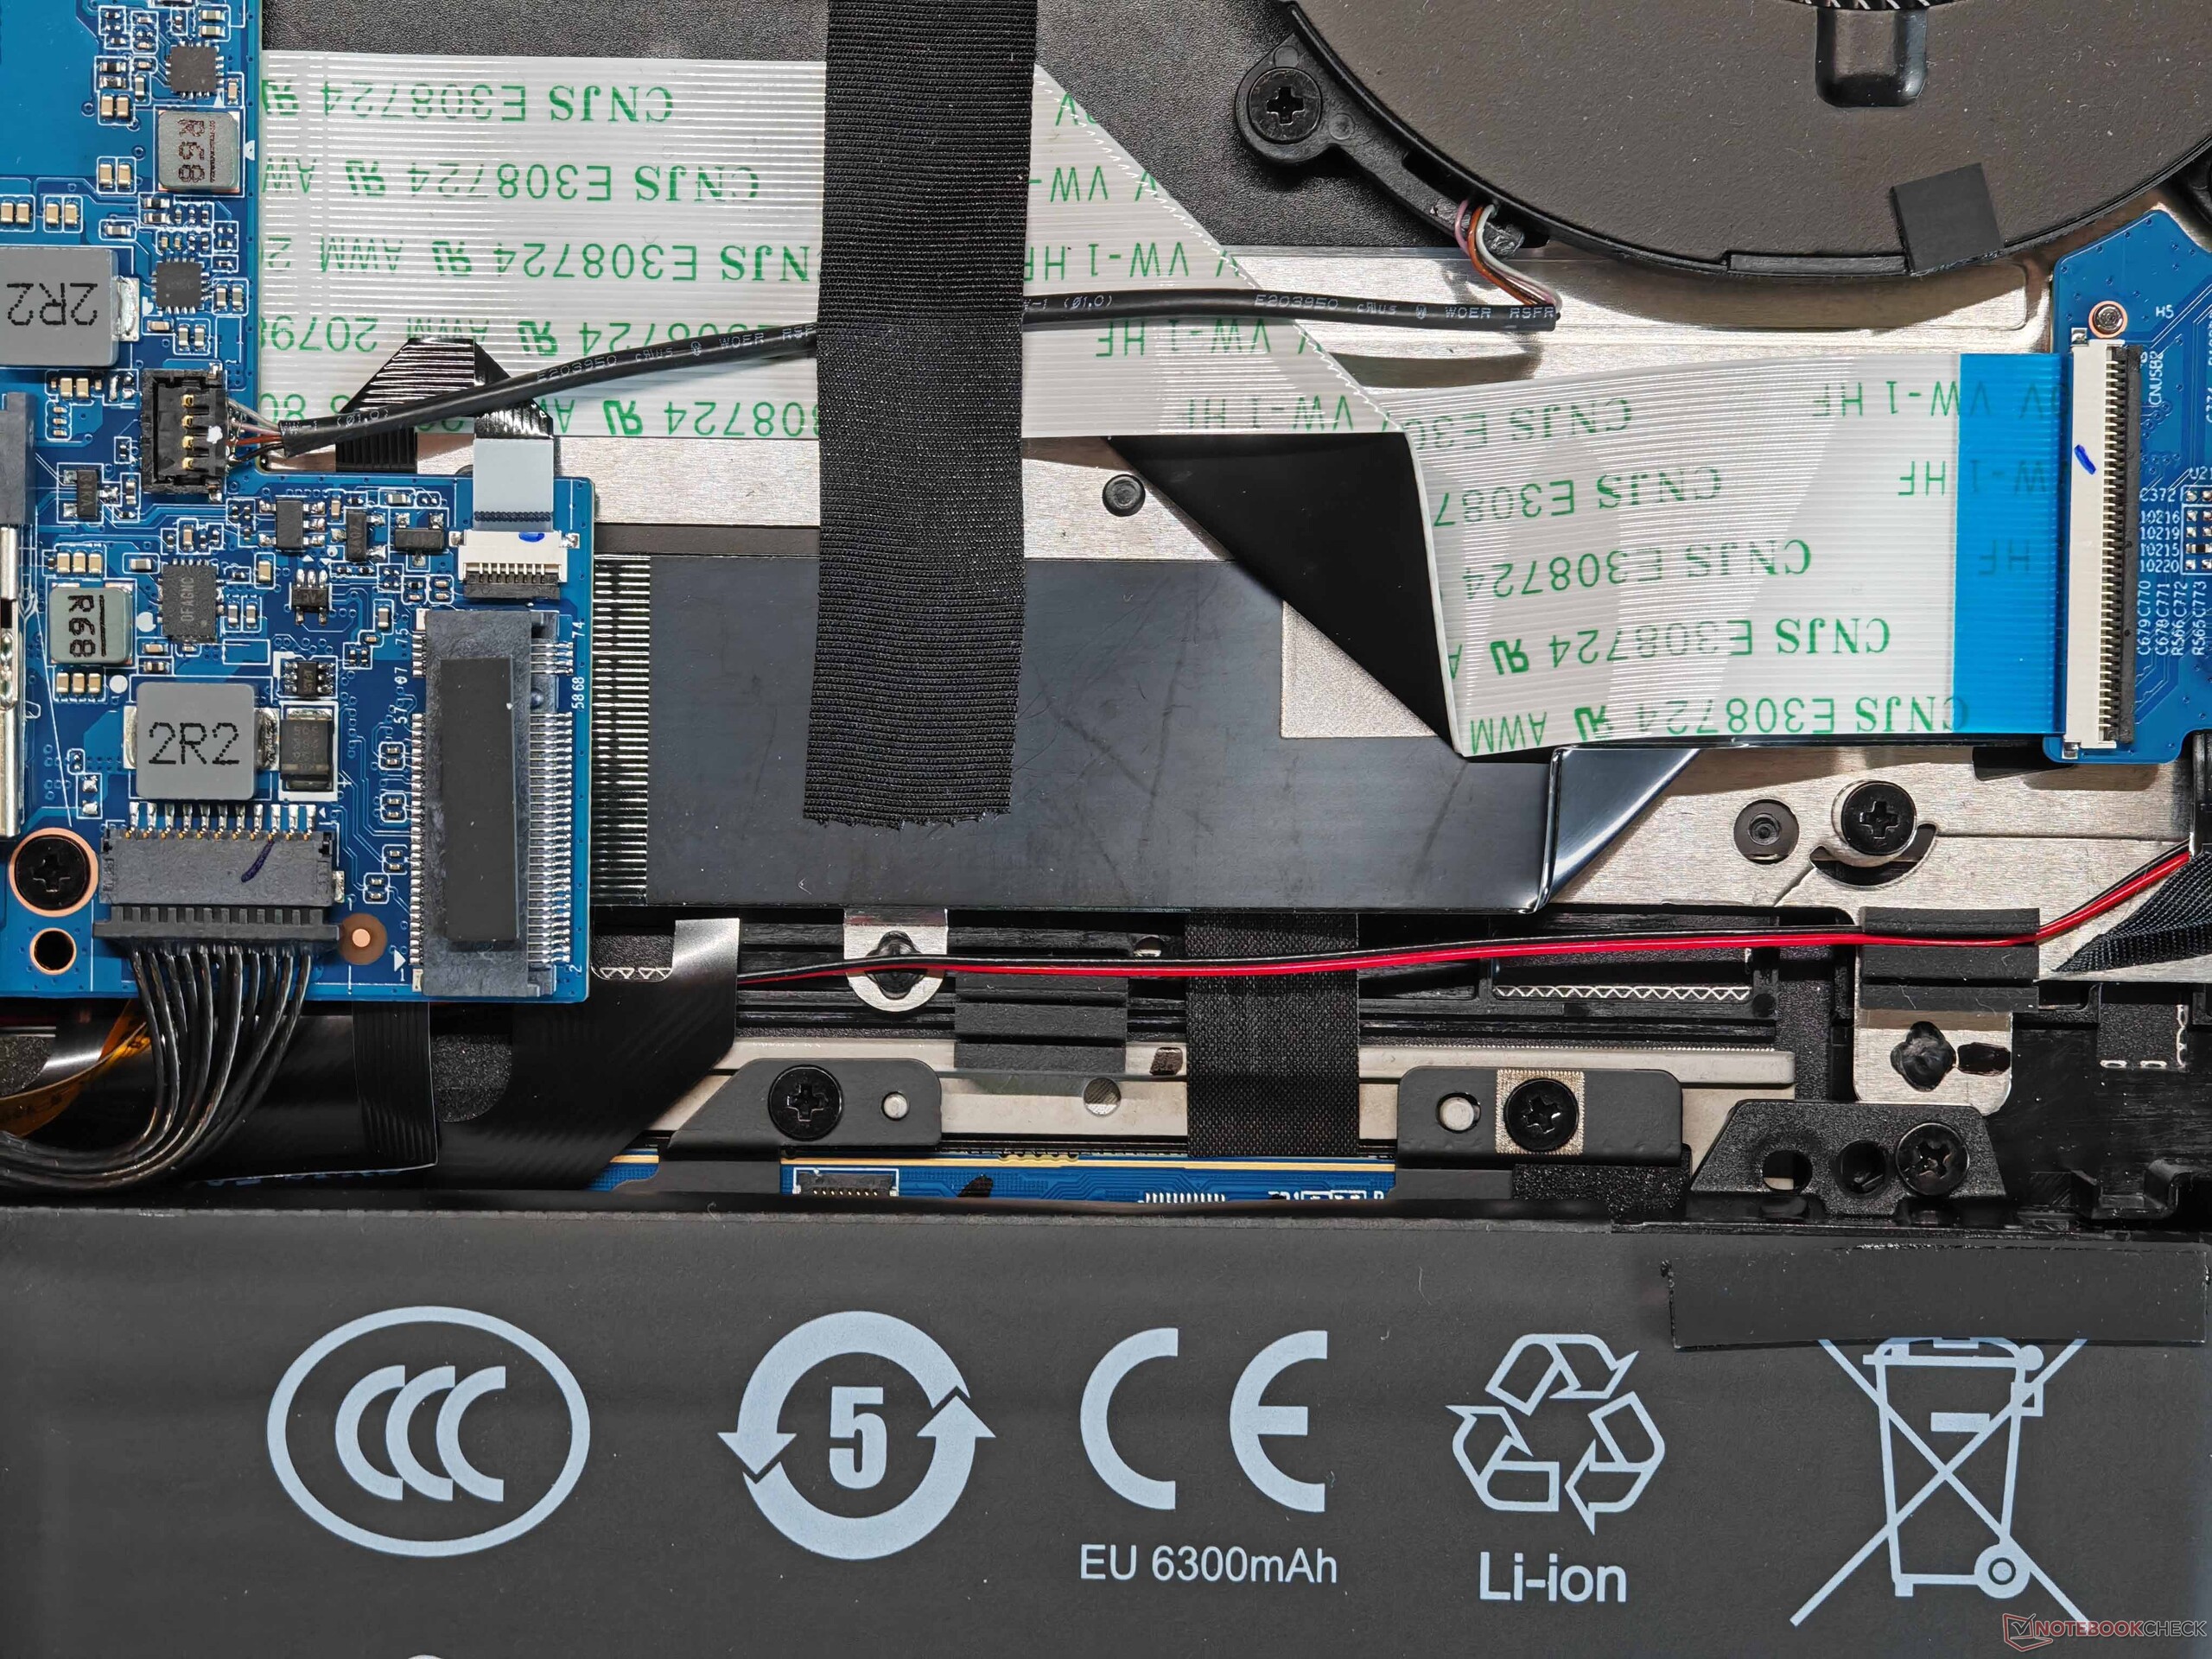
Maintenance options are very good, with support for two SO-DIMM slots, two SSDs, and a replaceable WLAN module; a Wi-Fi 7 module is also available. We encountered no issues with transfer rates during our testing. The Evo 15 offers a wide range of ports, including Thunderbolt 4, HDMI, and a full-sized card reader. The 1080p webcam (including a privacy shutter and IR module) is adequate for its intended purpose.


SD Card Reader - Update
In addition to our standard UHS-II card, we have also tested the performance with an SD-Express card (ADATA SD8.0 Express), where the card reader should reach up to 900/500MB/s (read/write) according to XMG. We determine transfer rates of up to 406 MB/s and 349 MB/s when we copy image files . This is much faster compared to regular cards, but still quite a bit slower than advertised.
| SD Card Reader | |
| average JPG Copy Test (av. of 3 runs) | |
| Schenker XMG Evo 15 (M25) (ADATA SD80. Express 512 GB) | |
| Schenker XMG Evo 15 (M25) (Angelbird AV Pro V60) | |
| Average of class Multimedia (23 - 531, n=40, last 2 years) | |
| Microsoft Surface Laptop 7 15 Lunar Lake (Angelbird AV Pro V60) | |
| maximum AS SSD Seq Read Test (1GB) | |
| Schenker XMG Evo 15 (M25) (ADATA SD80. Express 512 GB) | |
| Schenker XMG Evo 15 (M25) (Angelbird AV Pro V60) | |
| Average of class Multimedia (37.3 - 1455, n=39, last 2 years) | |
| Microsoft Surface Laptop 7 15 Lunar Lake (Angelbird AV Pro V60) | |
| Networking | |
| Schenker XMG Evo 15 (M25) | |
| iperf3 transmit AXE11000 | |
| iperf3 receive AXE11000 | |
| Microsoft Surface Laptop 7 15 Lunar Lake | |
| iperf3 transmit AXE11000 | |
| iperf3 receive AXE11000 | |
| Apple MacBook Air 15 M4 | |
| iperf3 transmit AXE11000 | |
| iperf3 receive AXE11000 | |
| Lenovo ThinkPad X9-15 Aura Edition | |
| iperf3 transmit AXE11000 | |
| iperf3 receive AXE11000 | |
| Lenovo Yoga Slim 7 15ILL9 Aura | |
| iperf3 transmit AXE11000 | |
| iperf3 receive AXE11000 | |
| iperf3 transmit AXE11000 6GHz | |
| iperf3 receive AXE11000 6GHz | |

 Arc 140T, Ultra 7 255H, Samsung 990 Pro 2 TB MZVL72T0HDLB")
 Arc 140T, Ultra 7 255H, Samsung 990 Pro 2 TB MZVL72T0HDLB")
Input devices
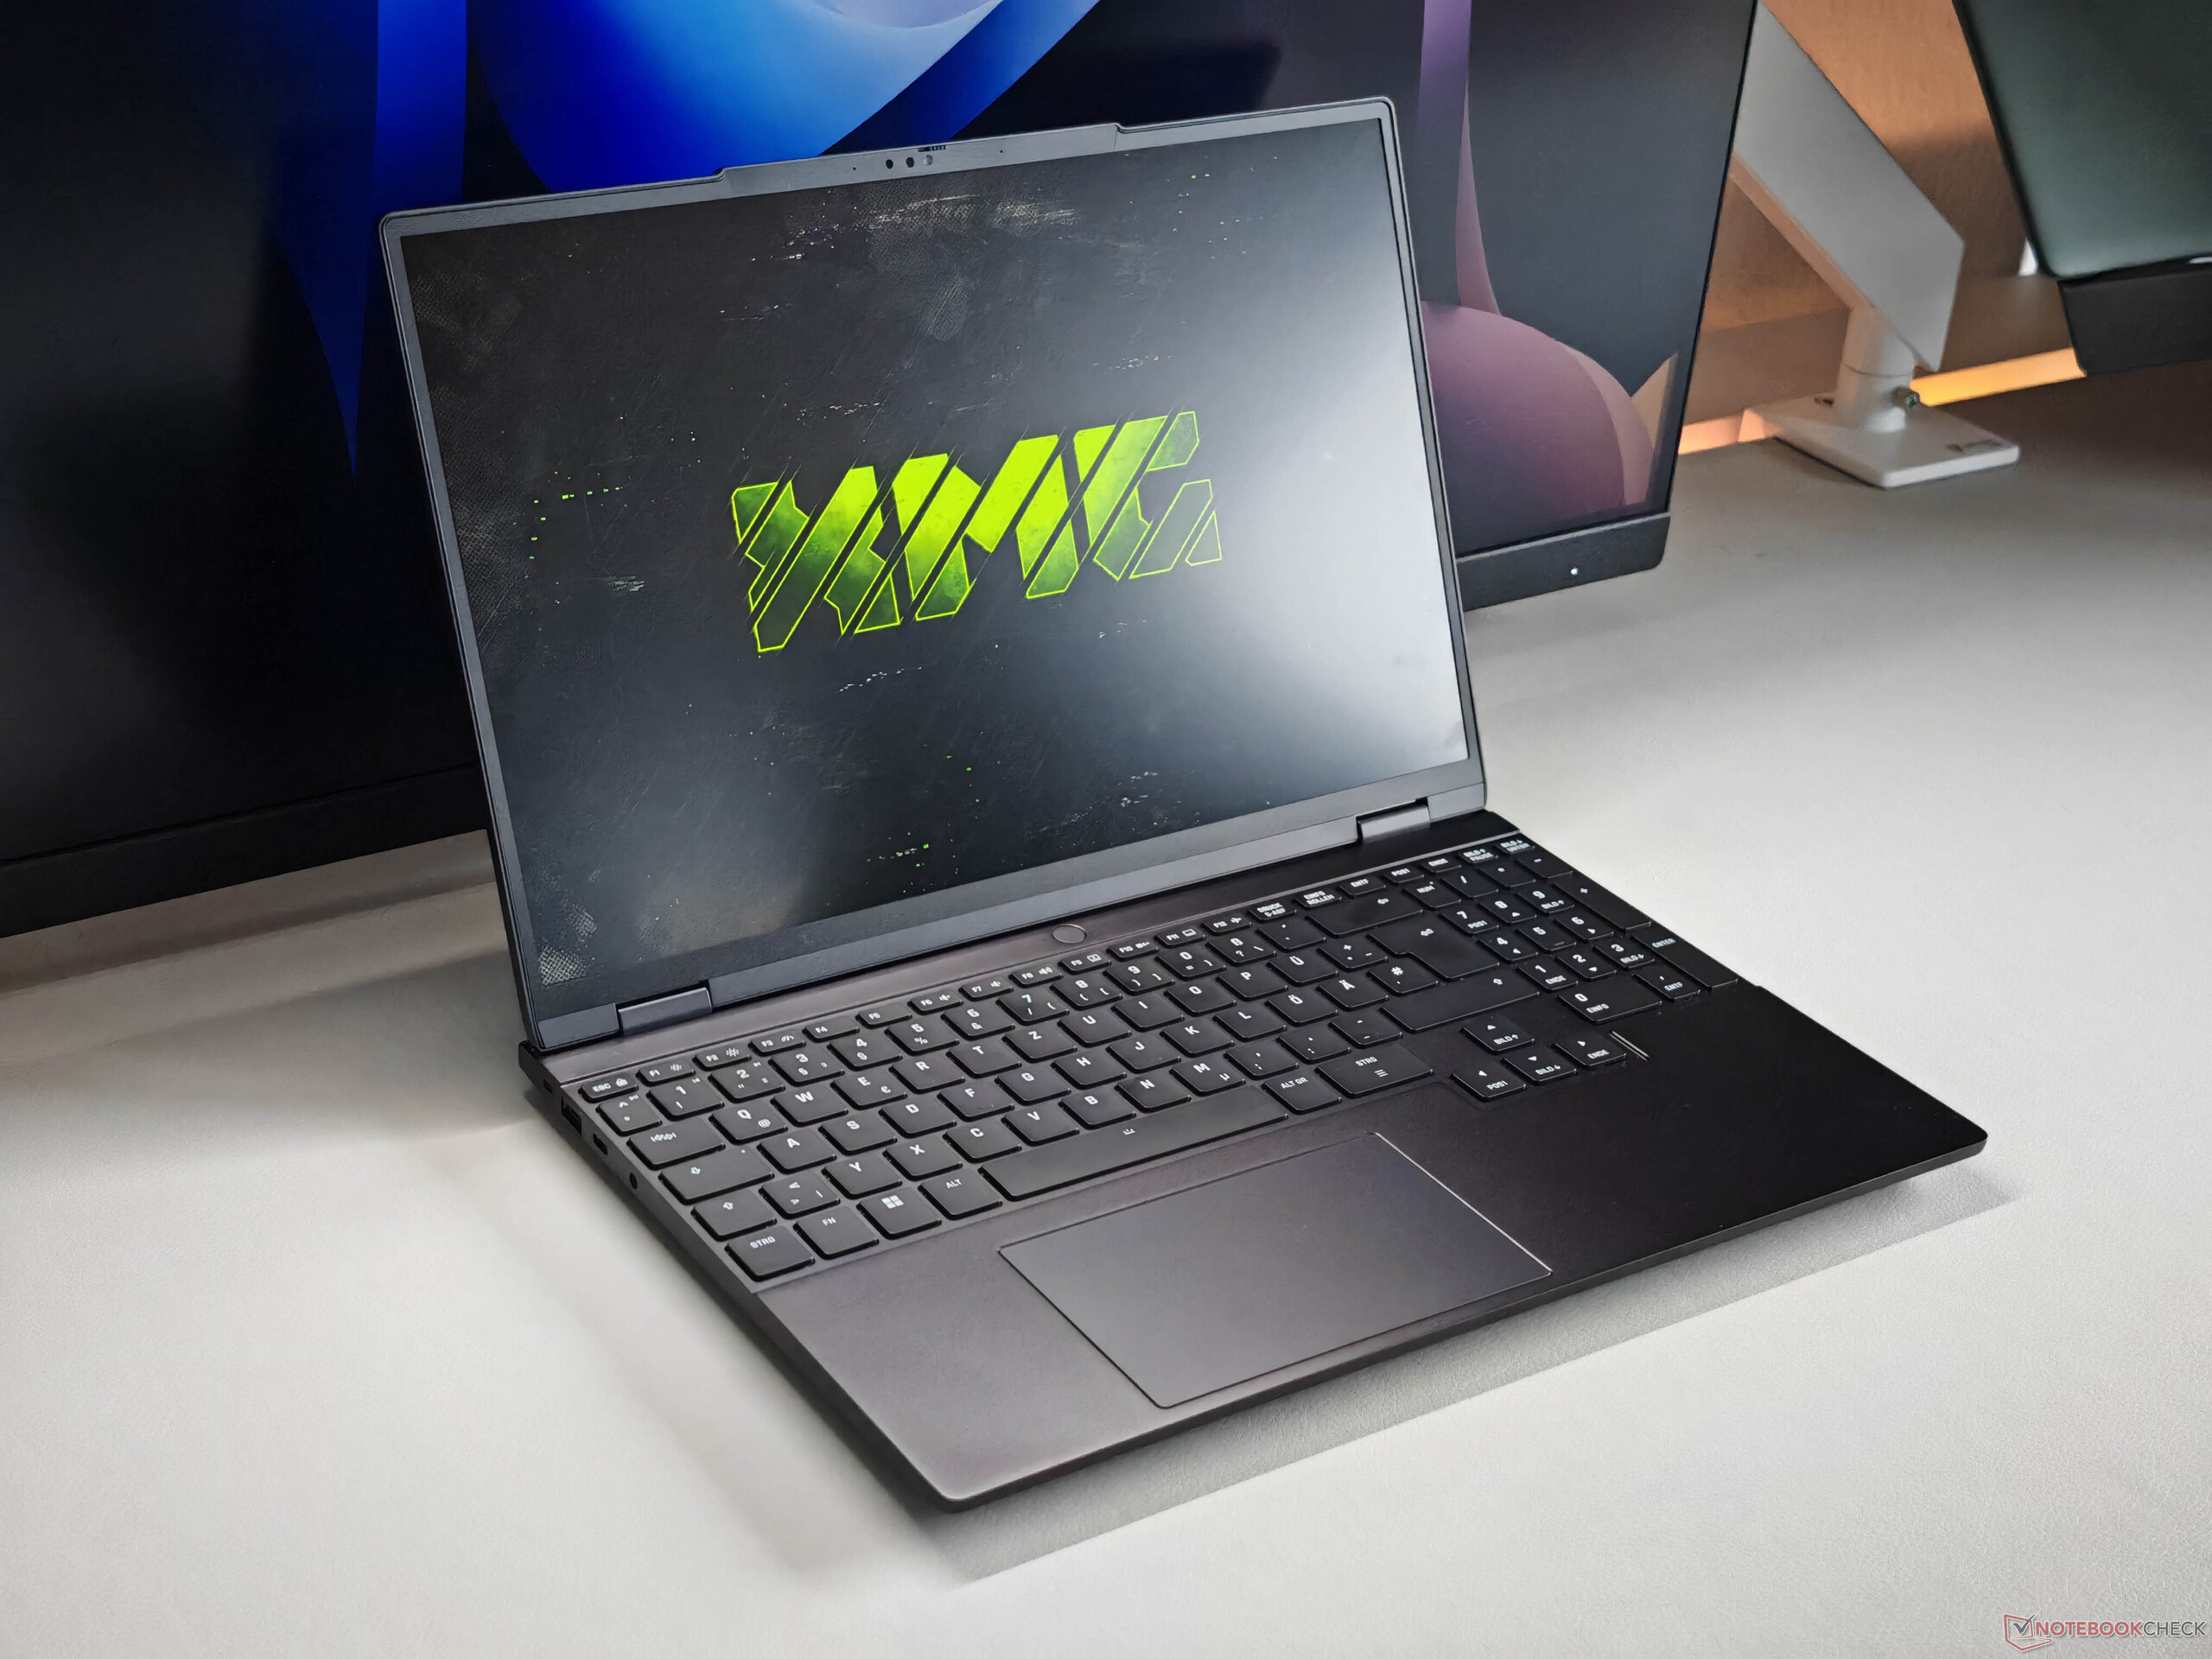
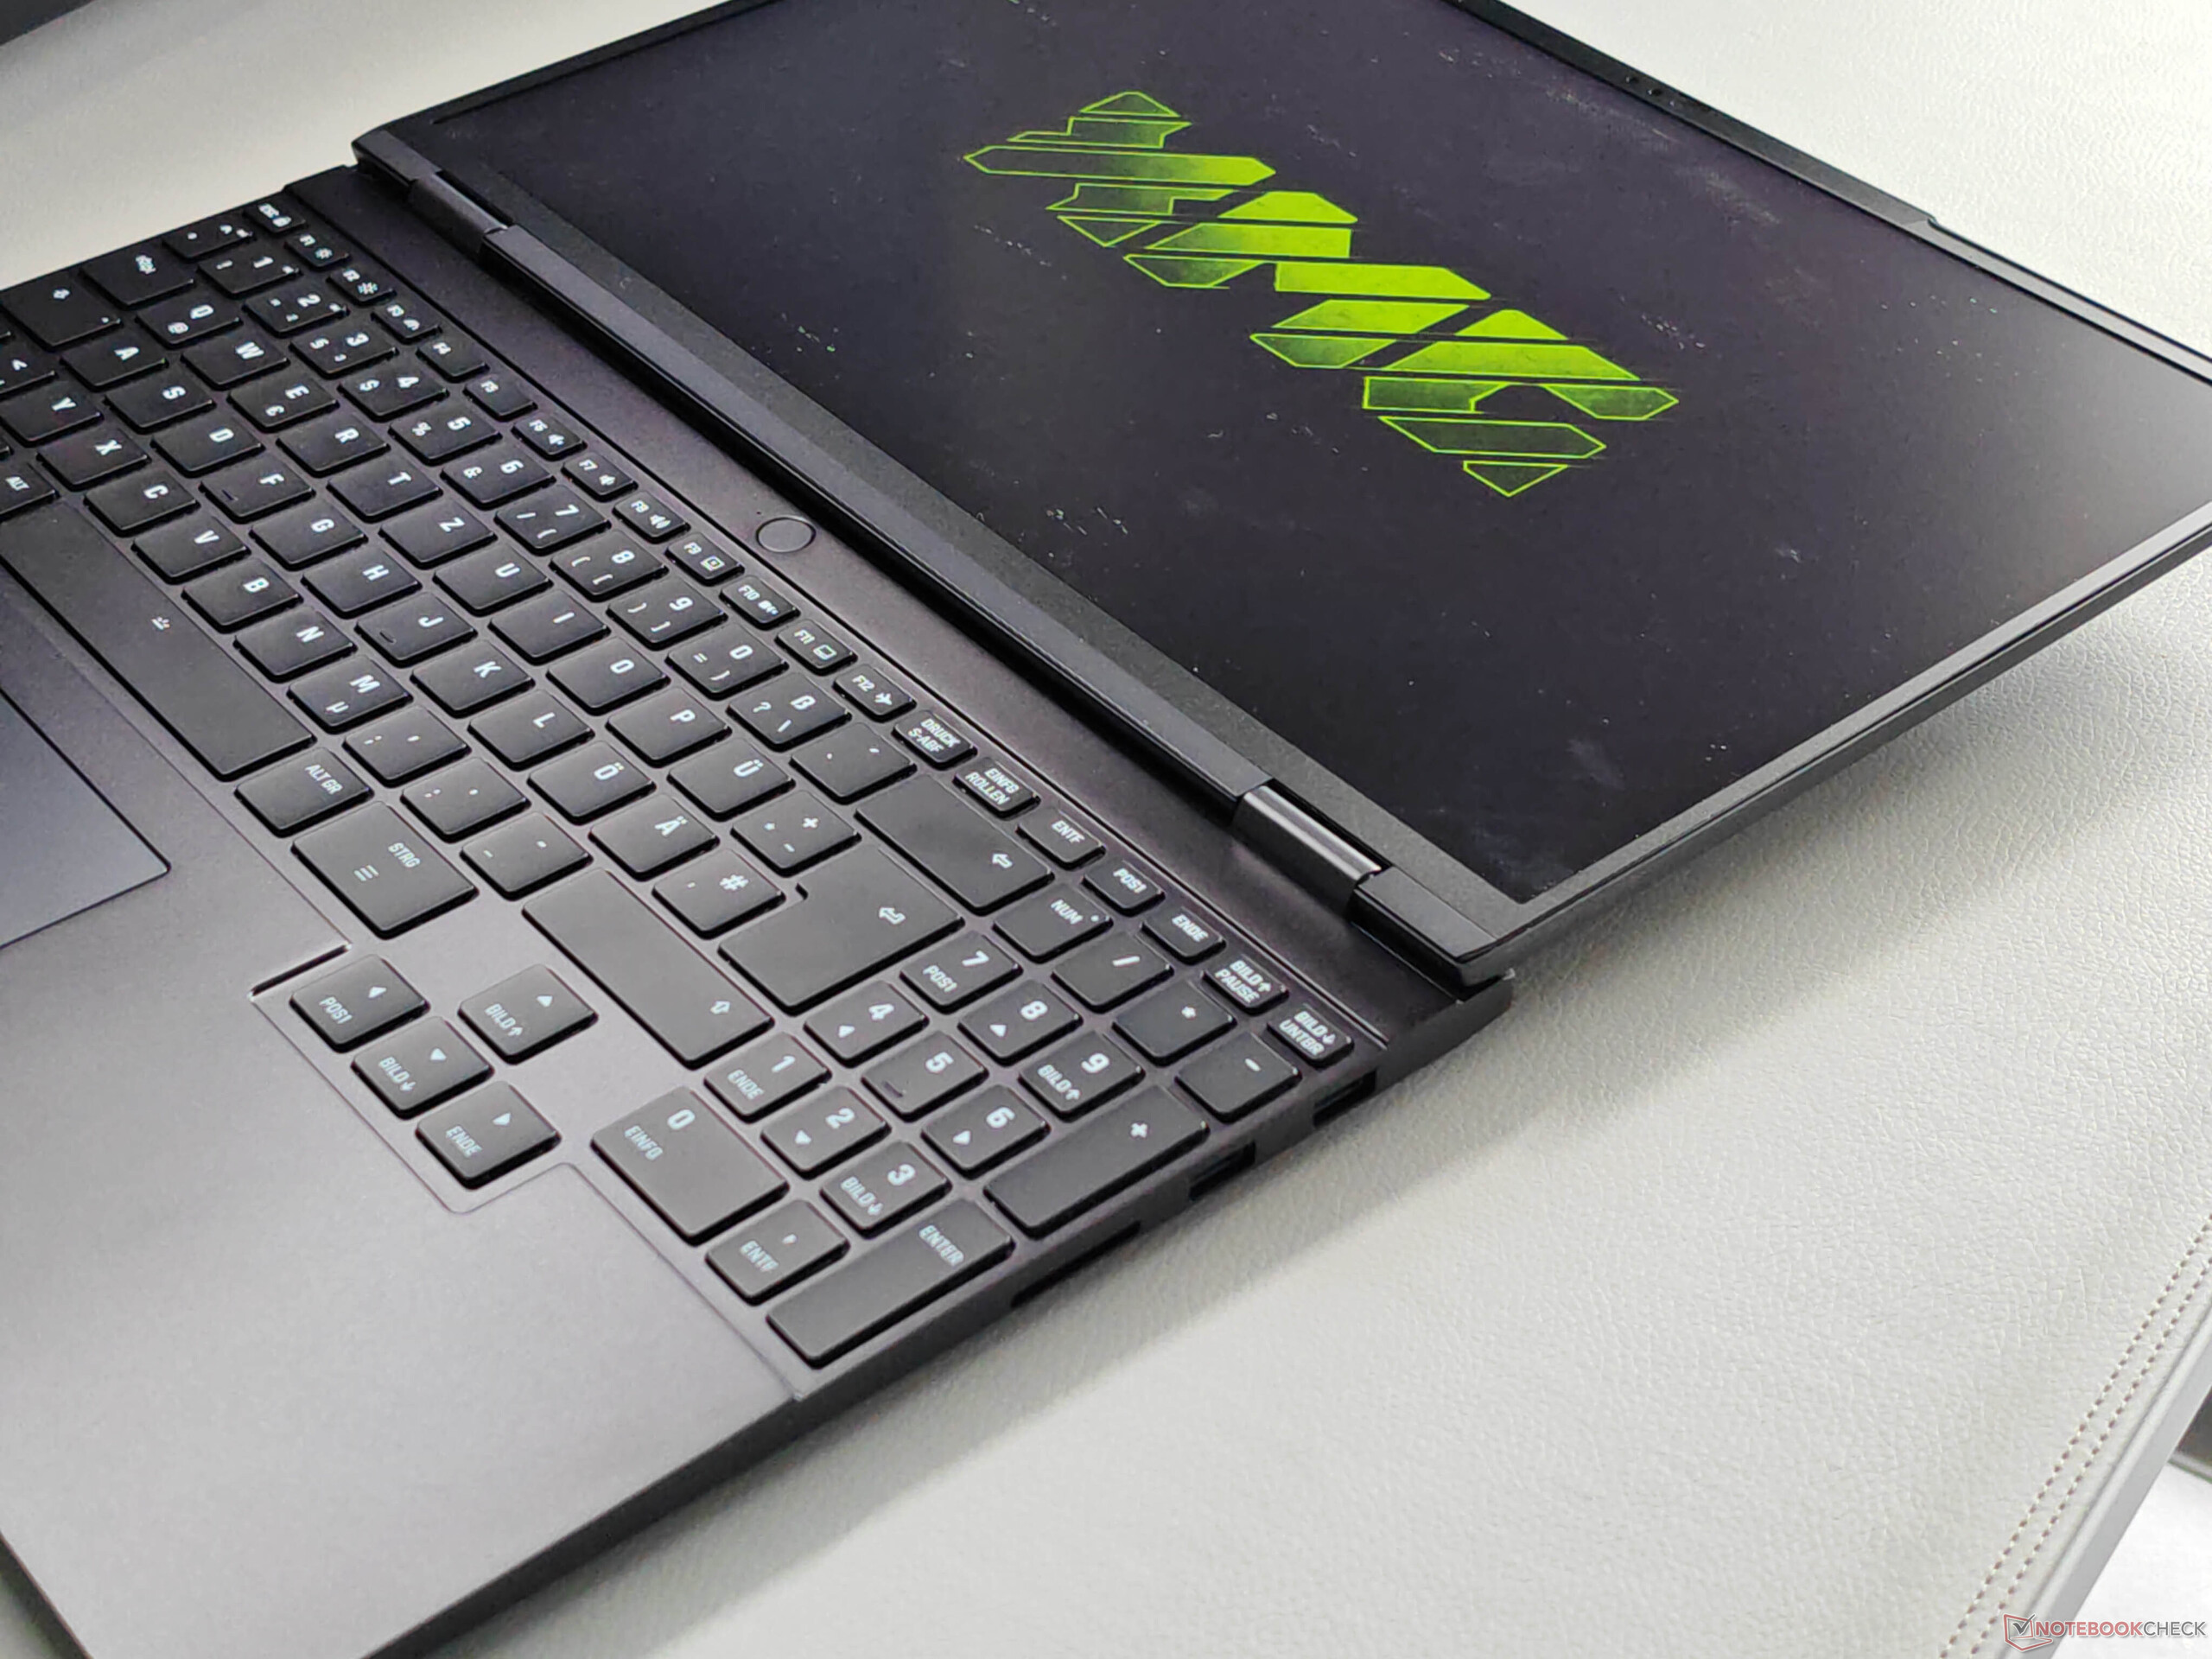
The keyboard spans the entire width of the chassis and includes a dedicated number pad as well as large arrow keys. Overall, typing comfort is very good, and long texts can be typed without issue; only the larger keys are slightly louder. The white backlighting offers four brightness levels.
The clickpad is slightly offset to the left and provides good gliding properties, but the mechanical clicks in the lower area are somewhat loud.


Display - IPS with 240 Hz

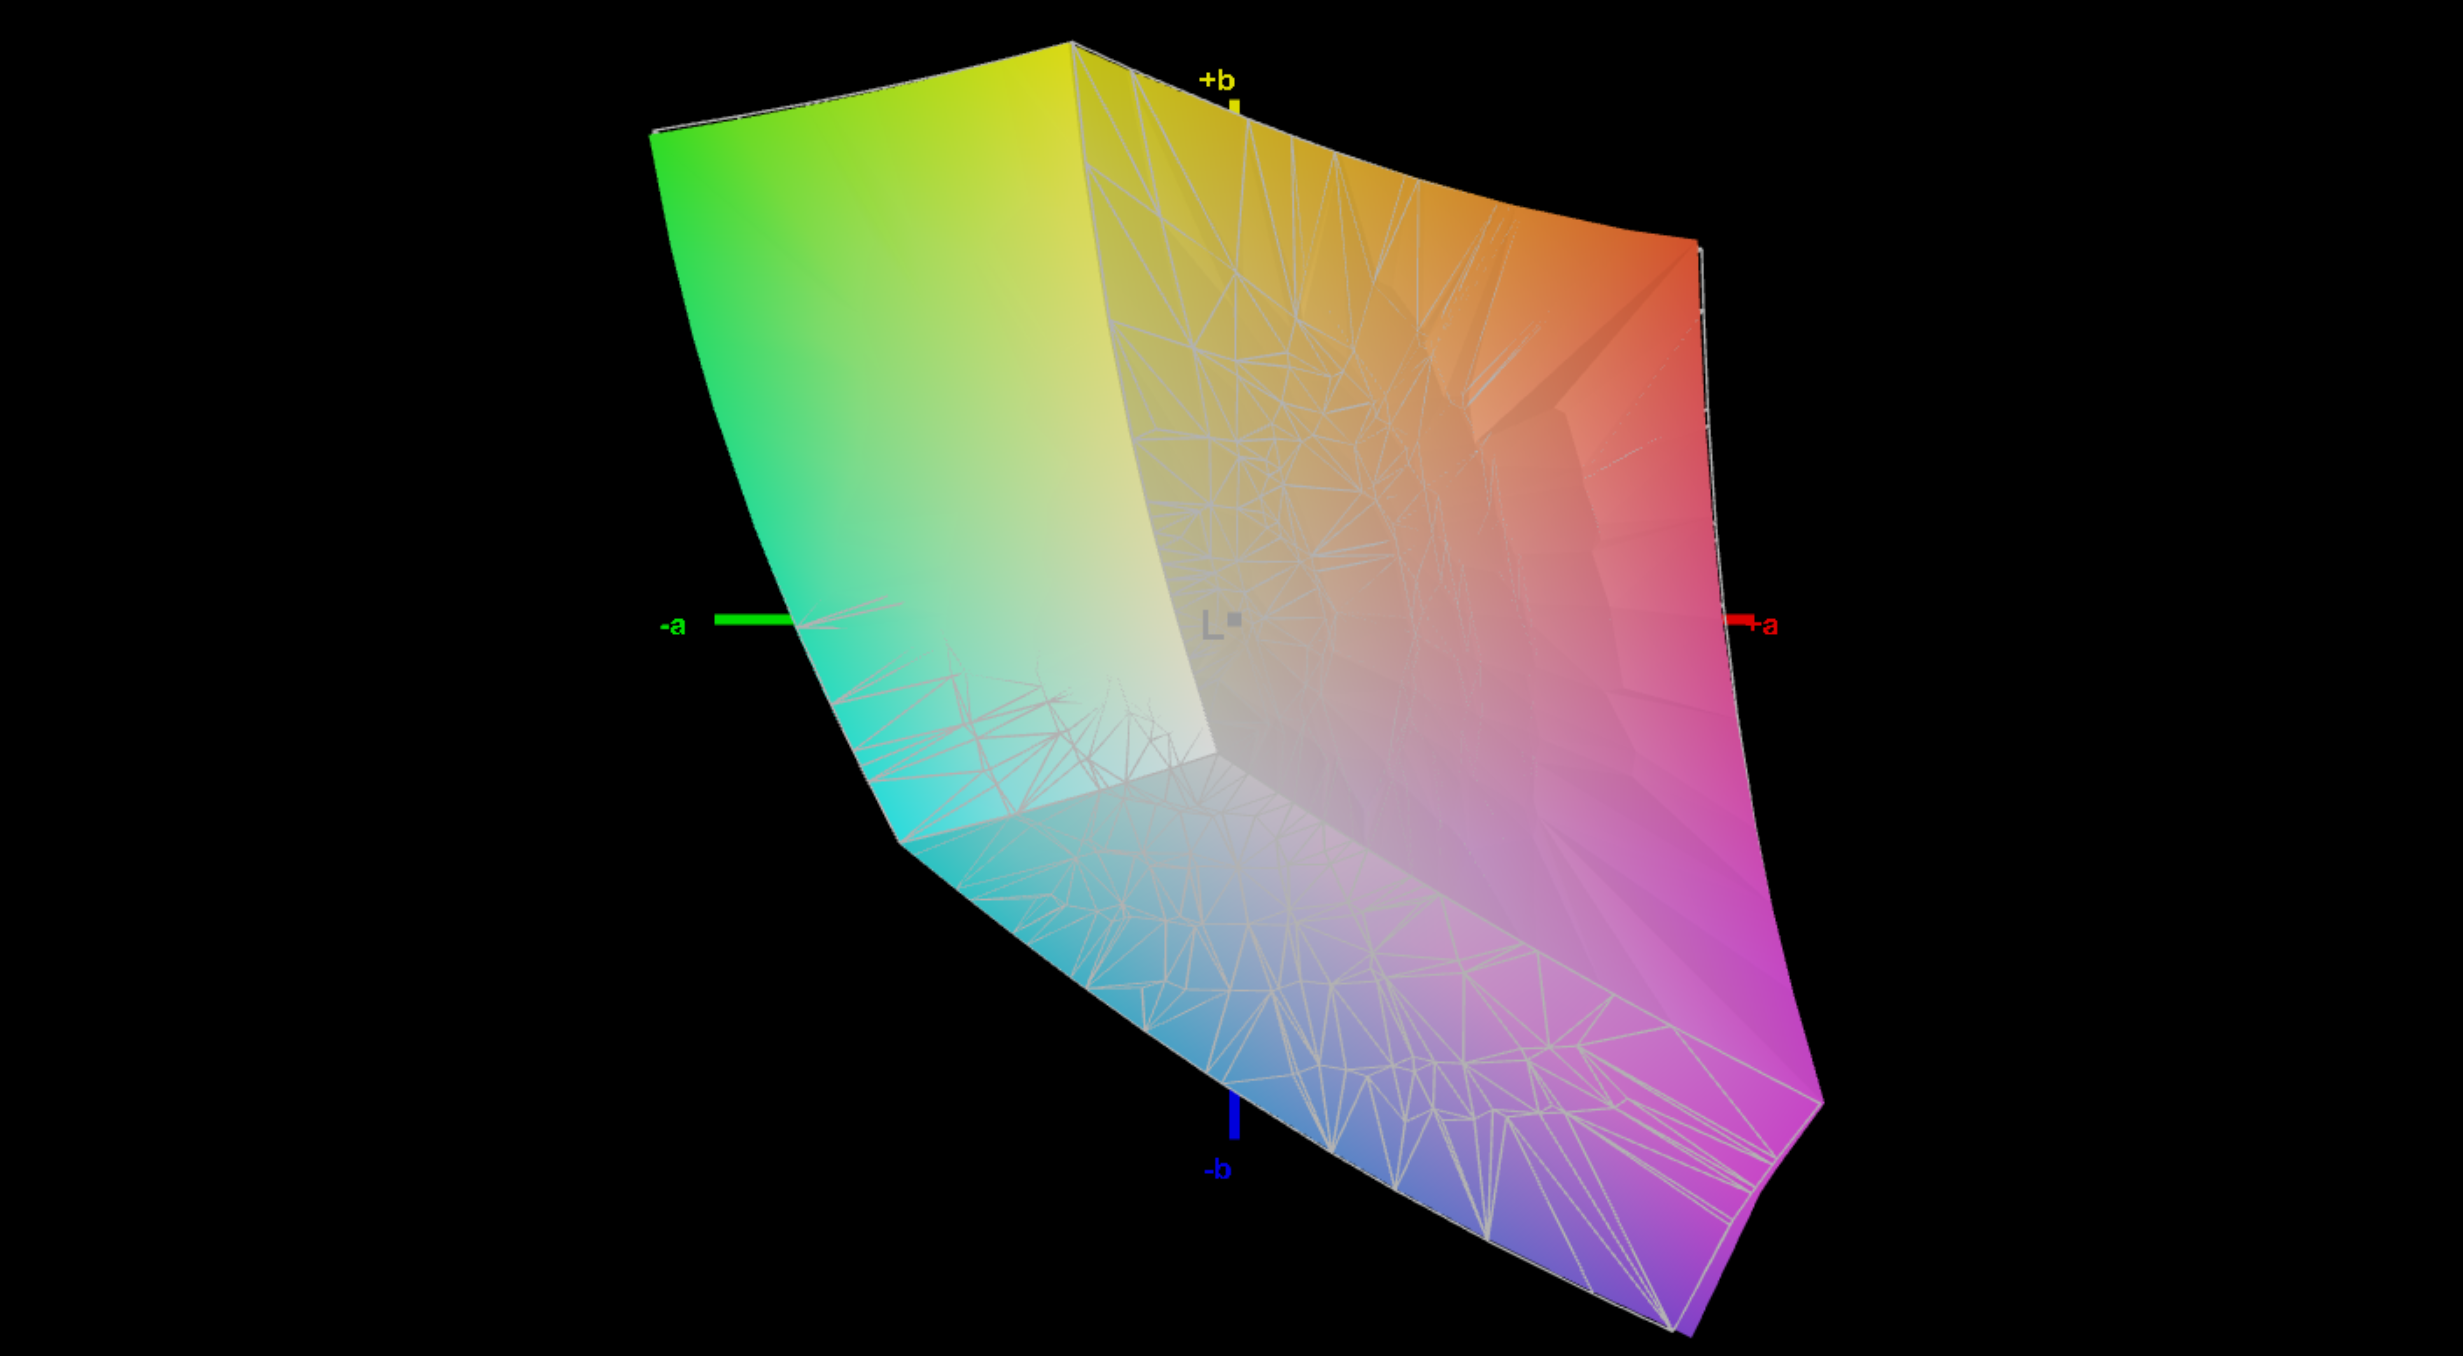
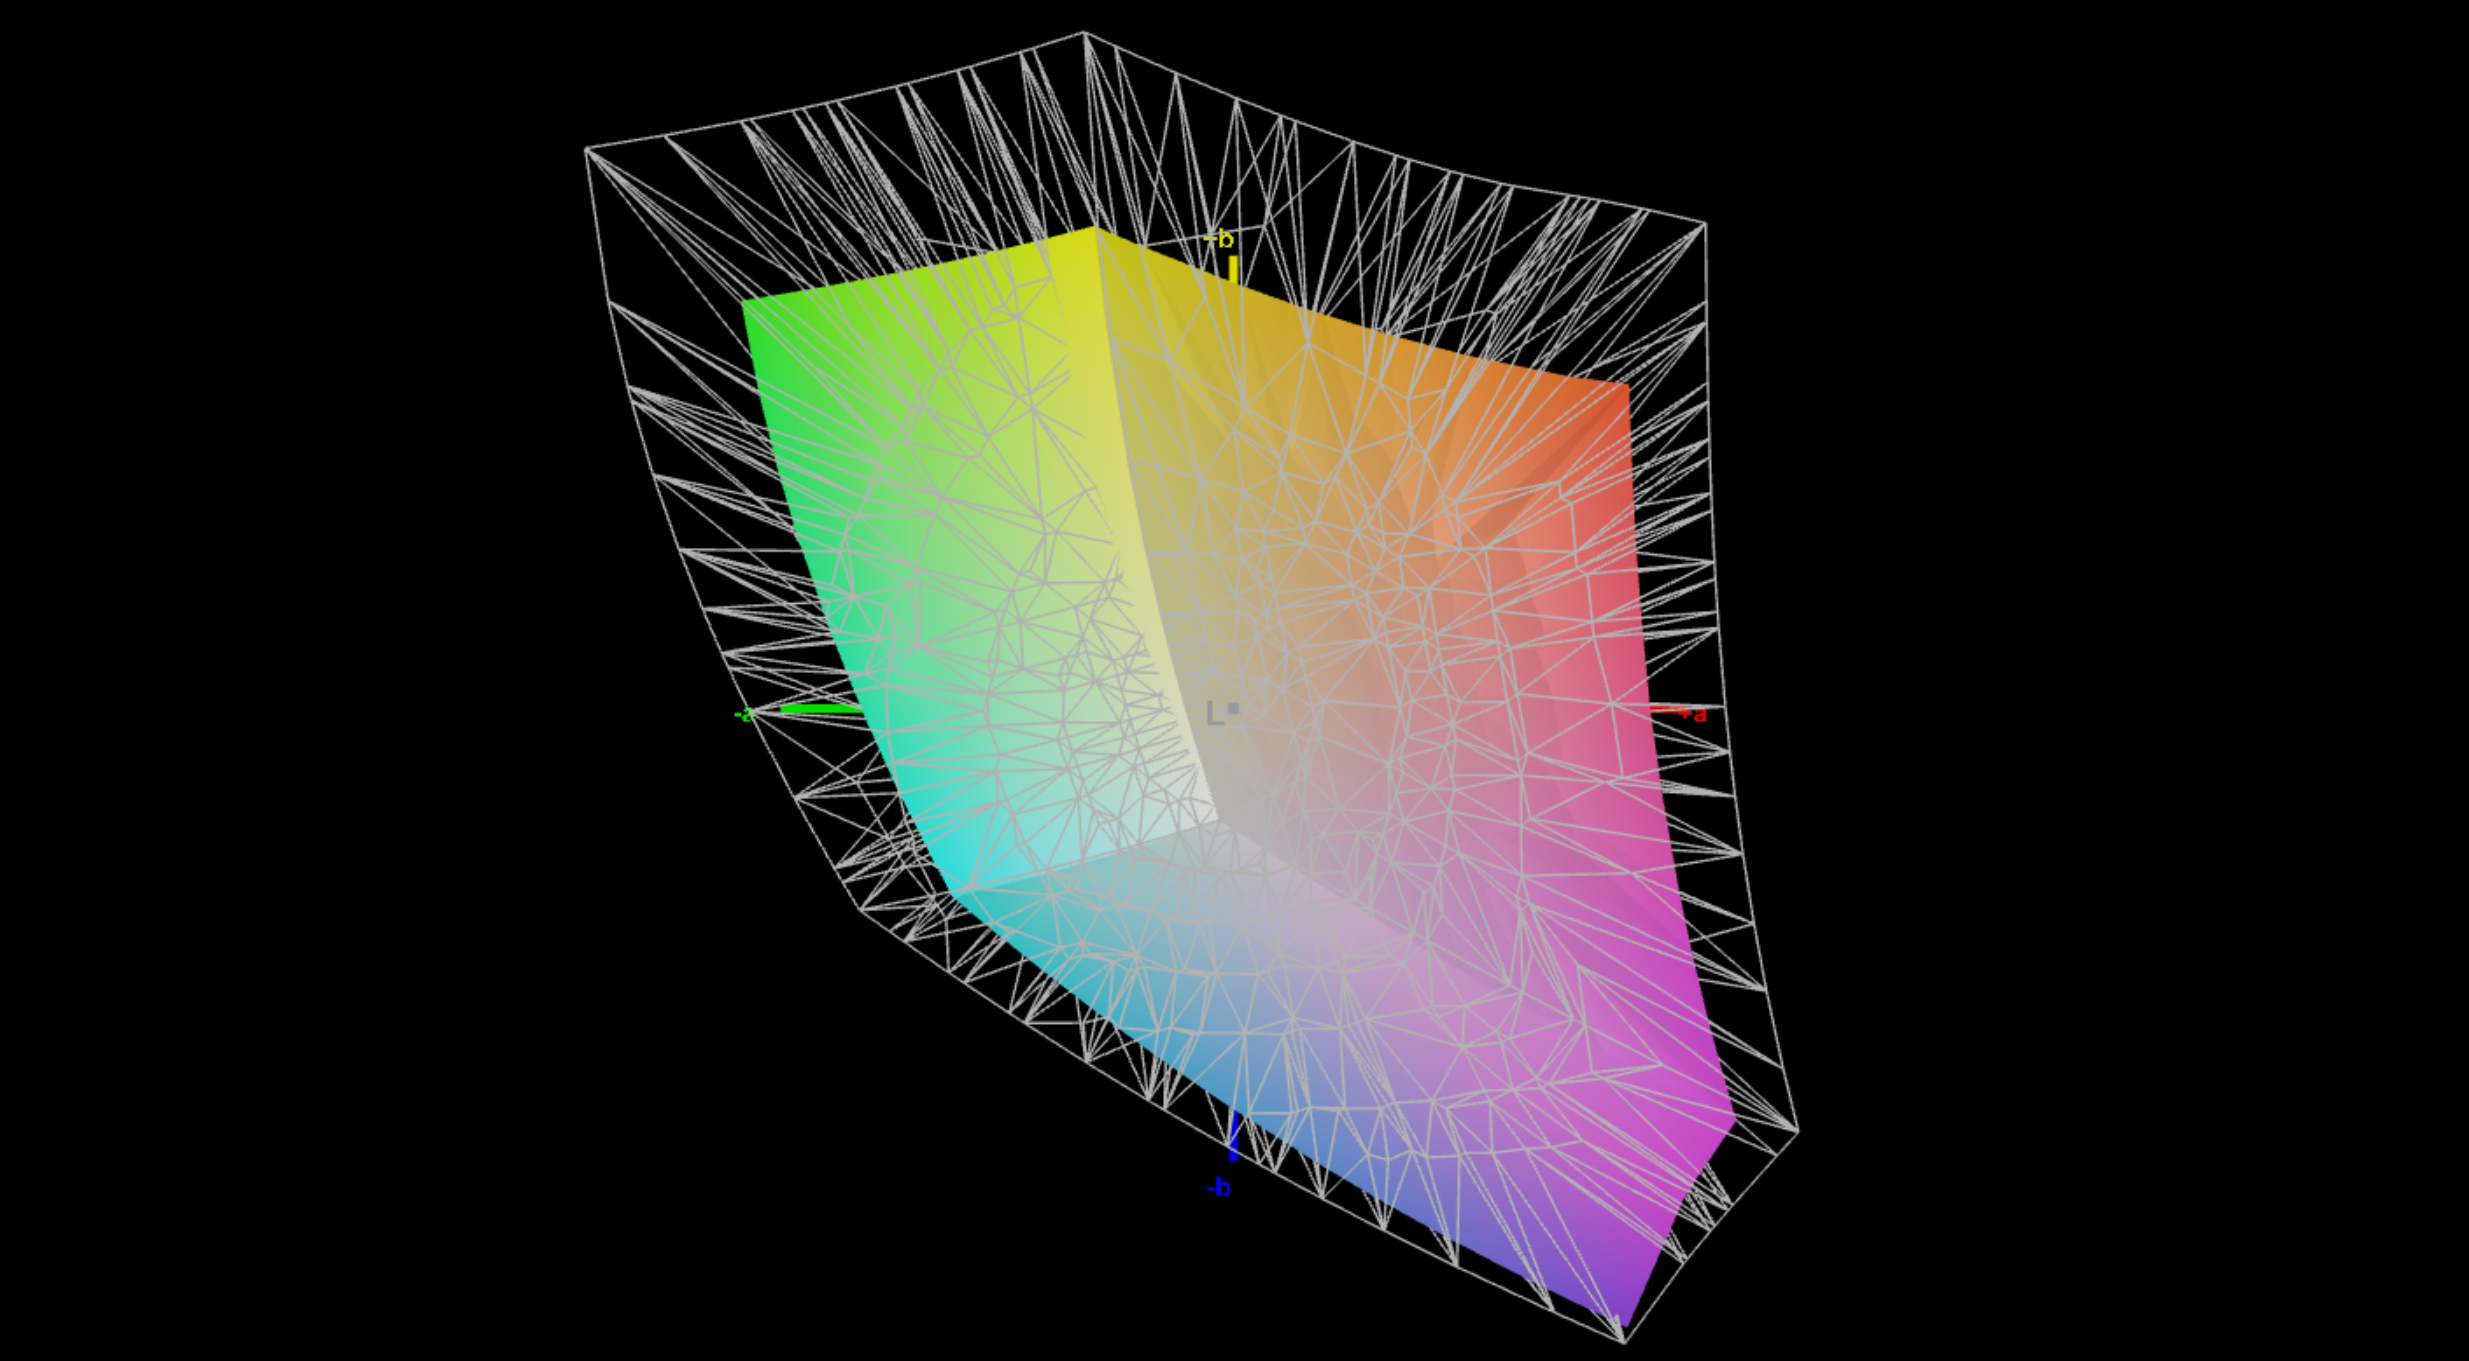
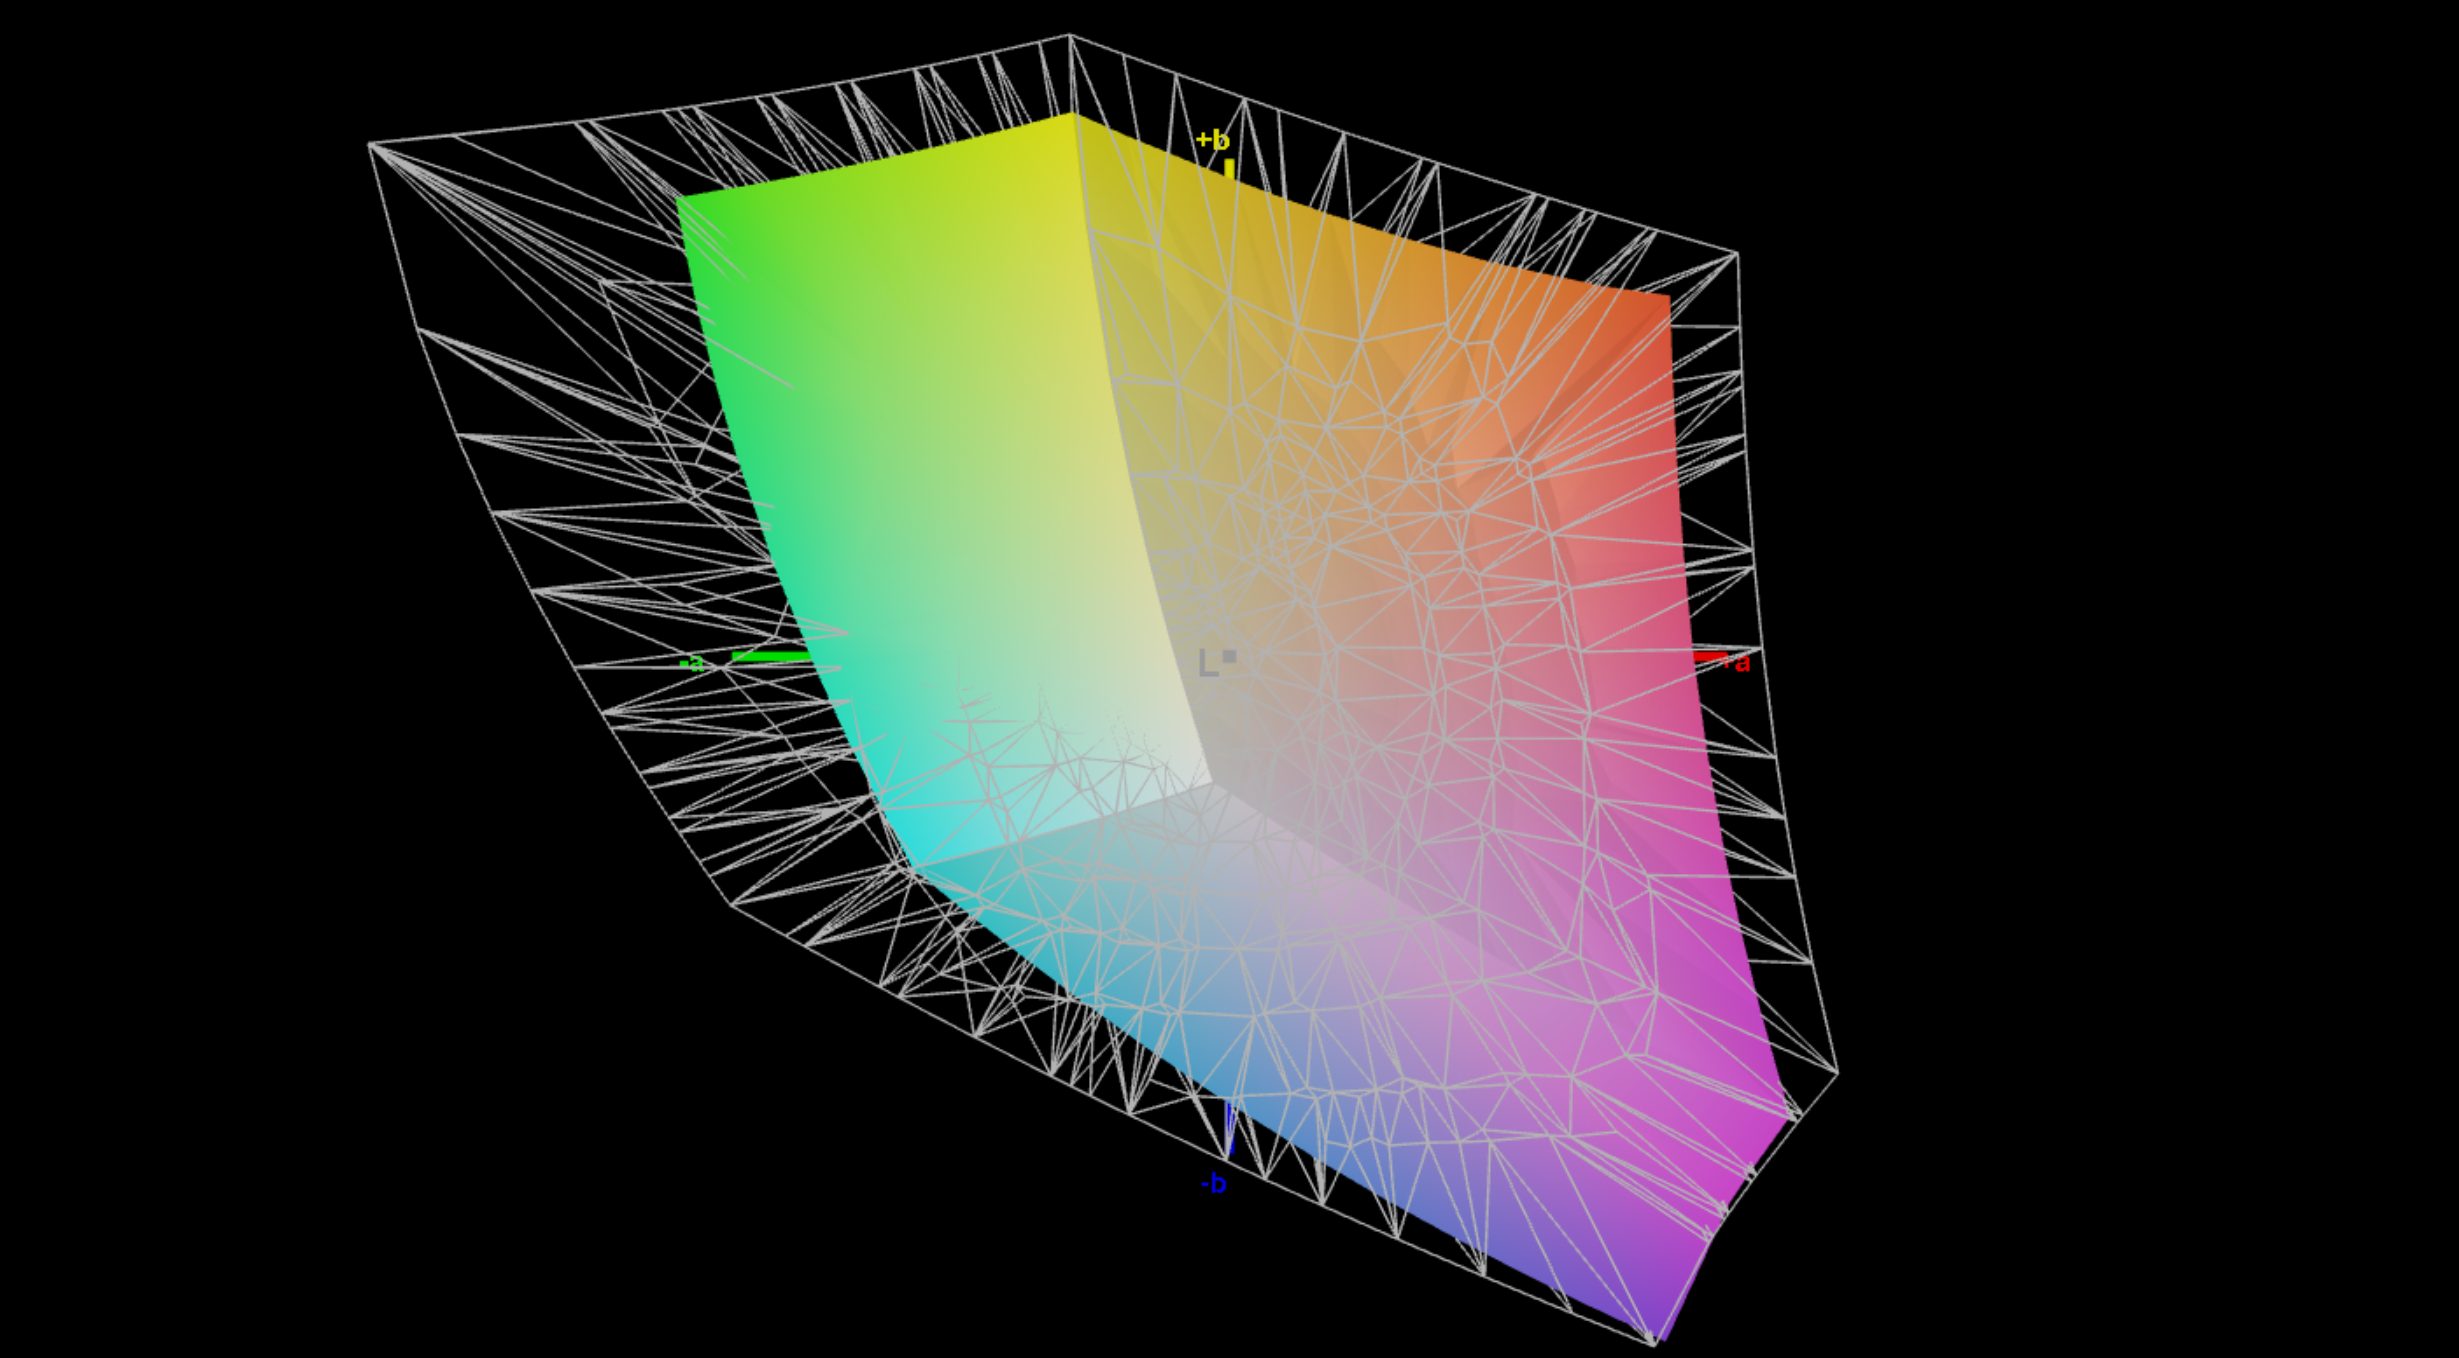
The technical specifications of the matte IPS panel (2,560 × 1,600 pixels, 16:10) with a 240 Hz refresh rate have not changed, although the panel ID is different. Subjective image quality remains very good, and even bright areas do not appear grainy. The sRGB color space is fully covered, but the vivid colors of glossy OLED panels should not be expected here. On the other hand, there are no issues with PWM, and even halo effects are virtually absent.
The specified brightness of 500 cd/m² is once again clearly exceeded, but the only remaining drawback is the elevated black level (0.51 cd/m²), which results in a relatively low maximum contrast ratio of around 1,100:1. Factory calibration is already very good, and we were unable to achieve any further improvement with our own calibration.
| |||||||||||||||||||||||||
Brightness Distribution: 89 %
Center on Battery: 555 cd/m²
Contrast: 1088:1 (Black: 0.51 cd/m²)
ΔE ColorChecker Calman: 1.4 | ∀{0.5-29.43 Ø4.71}
ΔE Greyscale Calman: 2 | ∀{0.09-98 Ø4.96}
68.5% AdobeRGB 1998 (Argyll 3D)
99.5% sRGB (Argyll 3D)
66.6% Display P3 (Argyll 3D)
Gamma: 2.27
CCT: 6864 K
| Schenker XMG Evo 15 (M25) NE153QDM-NZ2, IPS, 2560x1600, 15.3", 240 Hz | Microsoft Surface Laptop 7 15 Lunar Lake LQ150P1JX61, IPS, 2496x1664, 15", 120 Hz | Apple MacBook Air 15 M4 IPS, 2880x1864, 15.3", 60 Hz | Lenovo ThinkPad X9-15 Aura Edition ATNA53JB01-0, OLED, 2880x1800, 15.3", 120 Hz | Lenovo Yoga Slim 7 15ILL9 Aura CSOT T3 MNF307ZB1-1, IPS, 2880x1800, 15.3", 120 Hz | Schenker XMG Evo 15 (M24) NE153QDM-NZ1, IPS, 2560x1600, 15.3", 240 Hz | |
|---|---|---|---|---|---|---|
| Display | 25% | 26% | 30% | 26% | 7% | |
| Display P3 Coverage (%) | 66.6 | 98.1 47% | 98.7 48% | 100 50% | 98.8 48% | 73.6 11% |
| sRGB Coverage (%) | 99.5 | 100 1% | 100 1% | 100 1% | 100 1% | 100 1% |
| AdobeRGB 1998 Coverage (%) | 68.5 | 87.2 27% | 88.3 29% | 94.6 38% | 87.5 28% | 74.2 8% |
| Response Times | -224% | -173% | 88% | -226% | 7% | |
| Response Time Grey 50% / Grey 80% * (ms) | 10 ? | 33.4 ? -234% | 23.2 ? -132% | 1.46 ? 85% | 27 ? -170% | 4.6 ? 54% |
| Response Time Black / White * (ms) | 4.7 ? | 14.7 ? -213% | 14.7 ? -213% | 0.44 ? 91% | 17.9 ? -281% | 6.6 ? -40% |
| PWM Frequency (Hz) | 1200 ? | |||||
| PWM Amplitude * (%) | 22 | |||||
| Screen | 35% | -4% | 590% | -8% | -19% | |
| Brightness middle (cd/m²) | 555 | 599 8% | 525 -5% | 509 -8% | 509 -8% | 608 10% |
| Brightness (cd/m²) | 545 | 590 8% | 513 -6% | 508 -7% | 479 -12% | 585 7% |
| Brightness Distribution (%) | 89 | 93 4% | 87 -2% | 97 9% | 90 1% | 93 4% |
| Black Level * (cd/m²) | 0.51 | 0.4 22% | 0.32 37% | 0.01 98% | 0.32 37% | 0.61 -20% |
| Contrast (:1) | 1088 | 1498 38% | 1641 51% | 50900 4578% | 1591 46% | 997 -8% |
| Colorchecker dE 2000 * | 1.4 | 0.5 64% | 1.7 -21% | 1.1 21% | 2.47 -76% | 2.1 -50% |
| Colorchecker dE 2000 max. * | 2.7 | 0.9 67% | 4 -48% | 2.5 7% | 4.73 -75% | 4.3 -59% |
| Greyscale dE 2000 * | 2 | 0.6 70% | 2.7 -35% | 1.5 25% | 1.5 25% | 2.7 -35% |
| Gamma | 2.27 97% | 2.16 102% | 2.2 100% | 2.28 96% | 2.19 100% | 2.2 100% |
| CCT | 6864 95% | 6543 99% | 7010 93% | 6294 103% | 6790 96% | 6168 105% |
| Colorchecker dE 2000 calibrated * | 1.06 | 1.2 | ||||
| Total Average (Program / Settings) | -55% /
-7% | -50% /
-23% | 236% /
384% | -69% /
-34% | -2% /
-9% |
* ... smaller is better


Display Response Times
| ↔ Response Time Black to White | ||
|---|---|---|
| 4.7 ms ... rise ↗ and fall ↘ combined | ↗ 1.3 ms rise | 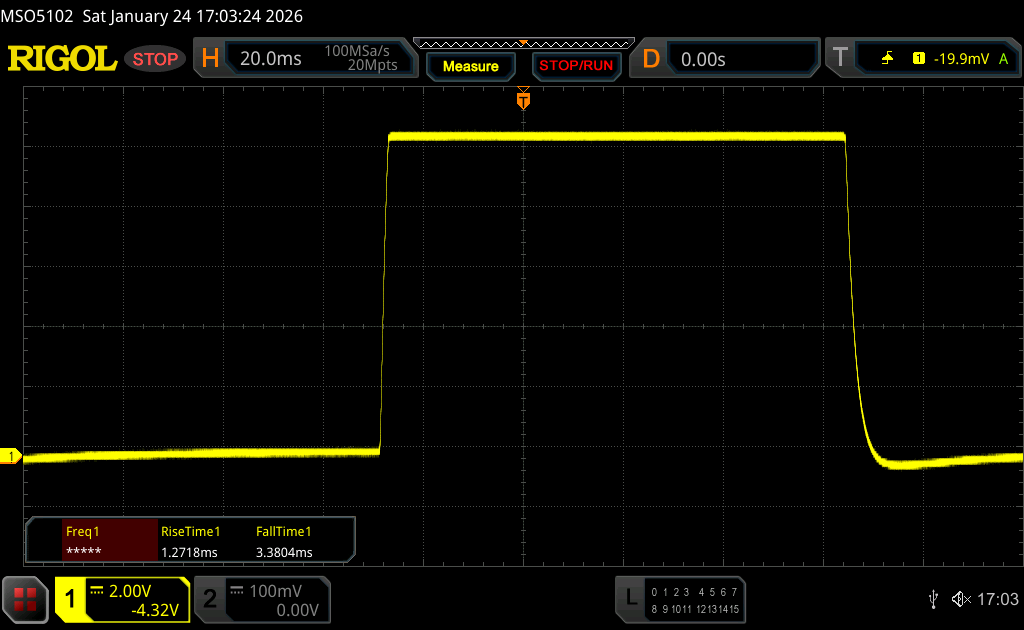 |
| ↘ 3.4 ms fall | ||
| The screen shows very fast response rates in our tests and should be very well suited for fast-paced gaming. In comparison, all tested devices range from 0.1 (minimum) to 240 (maximum) ms. » 17 % of all devices are better. This means that the measured response time is better than the average of all tested devices (19.8 ms). | ||
| ↔ Response Time 50% Grey to 80% Grey | ||
| 10 ms ... rise ↗ and fall ↘ combined | ↗ 3.5 ms rise | 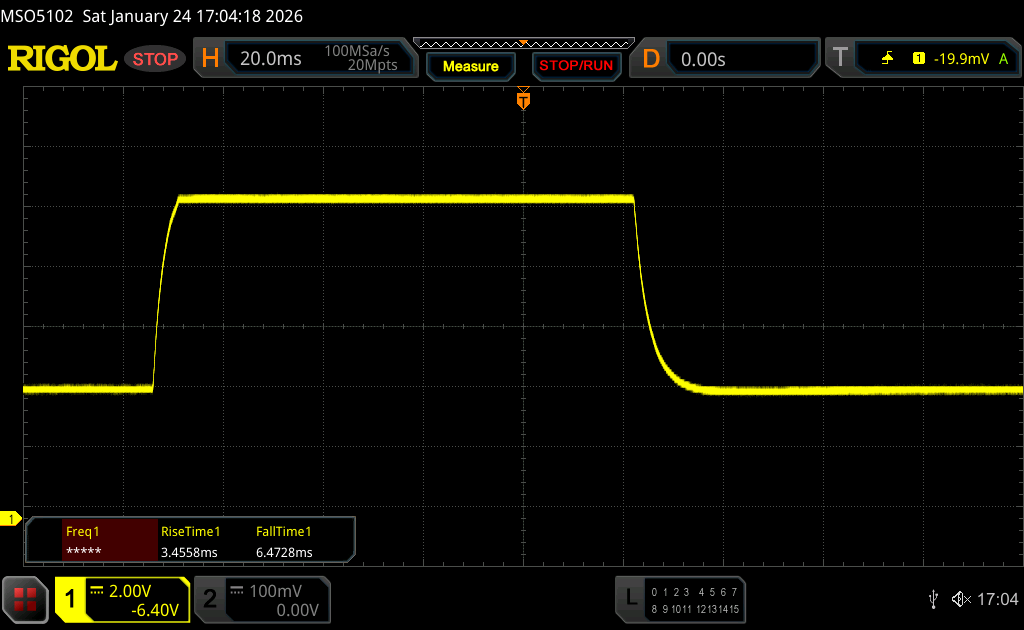 |
| ↘ 6.5 ms fall | ||
| The screen shows good response rates in our tests, but may be too slow for competitive gamers. In comparison, all tested devices range from 0.165 (minimum) to 636 (maximum) ms. » 23 % of all devices are better. This means that the measured response time is better than the average of all tested devices (31 ms). | ||
Screen Flickering / PWM (Pulse-Width Modulation)
| Screen flickering / PWM not detected |  | ||
In comparison: 52 % of all tested devices do not use PWM to dim the display. If PWM was detected, an average of 7747 (minimum: 5 - maximum: 343500) Hz was measured. | |||


Performance - Evo 15 with up to 128 GB RAM
Test conditions
We conducted the benchmarks in Overboost mode (90 W). In everyday use, however, the two less powerful modes, Balanced (35 W) and Enthusiast (45 W), also perform very well, while the fans remain noticeably quieter. Note: To access full performance, the power adapter must be connected to the rear USB-C port; otherwise, the processor’s power draw is limited to 70 watts.
Processor
The Core Ultra 7 255H (Arrow Lake) can sustain a power draw of 90 watts, delivering very good and stable performance. Apple's M4 SoC is clearly superior in single-core scenarios, but the 255H holds a clear advantage under multi-core loads. In battery mode, several power thresholds apply: the CPU is generally allowed to consume 40 watts, reduced to 25 watts once the battery level drops below 70 percent, and to just 20 watts below 30 percent.
Cinebench R15 Multi endurance test
Cinebench 2024: CPU Multi Core | CPU Single Core
Cinebench R23: Multi Core | Single Core
Cinebench R20: CPU (Multi Core) | CPU (Single Core)
Cinebench R15: CPU Multi 64Bit | CPU Single 64Bit
Blender: v2.79 BMW27 CPU
7-Zip 18.03: 7z b 4 | 7z b 4 -mmt1
Geekbench 6.7: Multi-Core | Single-Core
Geekbench 5.5: Multi-Core | Single-Core
HWBOT x265 Benchmark v2.2: 4k Preset
LibreOffice : 20 Documents To PDF
R Benchmark 2.5: Overall mean
| CPU Performance rating | |
| Apple MacBook Air 15 M4 -12! | |
| Schenker XMG Evo 15 (M25) | |
| Average Intel Core Ultra 7 255H | |
| Average of class Multimedia | |
| Schenker XMG Evo 15 (M24) | |
| Microsoft Surface Laptop 7 15 Lunar Lake | |
| Lenovo ThinkPad X9-15 Aura Edition | |
| Lenovo Yoga Slim 7 15ILL9 Aura -2! | |
| Cinebench 2024 / CPU Multi Core | |
| Schenker XMG Evo 15 (M25) | |
| Average of class Multimedia (327 - 2437, n=75, last 2 years) | |
| Average Intel Core Ultra 7 255H (750 - 1201, n=13) | |
| Schenker XMG Evo 15 (M24) | |
| Apple MacBook Air 15 M4 | |
| Lenovo Yoga Slim 7 15ILL9 Aura | |
| Microsoft Surface Laptop 7 15 Lunar Lake | |
| Lenovo ThinkPad X9-15 Aura Edition | |
| Cinebench 2024 / CPU Single Core | |
| Apple MacBook Air 15 M4 | |
| Average of class Multimedia (72.5 - 201, n=60, last 2 years) | |
| Schenker XMG Evo 15 (M25) | |
| Average Intel Core Ultra 7 255H (119 - 128.1, n=15) | |
| Microsoft Surface Laptop 7 15 Lunar Lake | |
| Lenovo Yoga Slim 7 15ILL9 Aura | |
| Lenovo ThinkPad X9-15 Aura Edition | |
| Schenker XMG Evo 15 (M24) | |
| Cinebench R23 / Multi Core | |
| Schenker XMG Evo 15 (M25) | |
| Average Intel Core Ultra 7 255H (16105 - 22578, n=20) | |
| Average of class Multimedia (4861 - 33362, n=76, last 2 years) | |
| Schenker XMG Evo 15 (M24) | |
| Apple MacBook Air 15 M4 | |
| Lenovo Yoga Slim 7 15ILL9 Aura | |
| Microsoft Surface Laptop 7 15 Lunar Lake | |
| Lenovo ThinkPad X9-15 Aura Edition | |
| Cinebench R23 / Single Core | |
| Apple MacBook Air 15 M4 | |
| Average Intel Core Ultra 7 255H (1874 - 2152, n=20) | |
| Schenker XMG Evo 15 (M25) | |
| Average of class Multimedia (1128 - 2459, n=68, last 2 years) | |
| Microsoft Surface Laptop 7 15 Lunar Lake | |
| Lenovo Yoga Slim 7 15ILL9 Aura | |
| Lenovo ThinkPad X9-15 Aura Edition | |
| Schenker XMG Evo 15 (M24) | |
| Cinebench R20 / CPU (Multi Core) | |
| Schenker XMG Evo 15 (M25) | |
| Average Intel Core Ultra 7 255H (6356 - 8860, n=19) | |
| Average of class Multimedia (1887 - 12912, n=59, last 2 years) | |
| Schenker XMG Evo 15 (M24) | |
| Lenovo Yoga Slim 7 15ILL9 Aura | |
| Microsoft Surface Laptop 7 15 Lunar Lake | |
| Lenovo ThinkPad X9-15 Aura Edition | |
| Cinebench R20 / CPU (Single Core) | |
| Average Intel Core Ultra 7 255H (743 - 826, n=19) | |
| Schenker XMG Evo 15 (M25) | |
| Microsoft Surface Laptop 7 15 Lunar Lake | |
| Average of class Multimedia (425 - 853, n=59, last 2 years) | |
| Lenovo Yoga Slim 7 15ILL9 Aura | |
| Lenovo ThinkPad X9-15 Aura Edition | |
| Schenker XMG Evo 15 (M24) | |
| Cinebench R15 / CPU Multi 64Bit | |
| Schenker XMG Evo 15 (M25) | |
| Average Intel Core Ultra 7 255H (2414 - 3444, n=19) | |
| Average of class Multimedia (856 - 5224, n=63, last 2 years) | |
| Schenker XMG Evo 15 (M24) | |
| Microsoft Surface Laptop 7 15 Lunar Lake | |
| Lenovo ThinkPad X9-15 Aura Edition | |
| Cinebench R15 / CPU Single 64Bit | |
| Average Intel Core Ultra 7 255H (258 - 322, n=20) | |
| Schenker XMG Evo 15 (M25) | |
| Lenovo ThinkPad X9-15 Aura Edition | |
| Microsoft Surface Laptop 7 15 Lunar Lake | |
| Average of class Multimedia (184.8 - 326, n=61, last 2 years) | |
| Schenker XMG Evo 15 (M24) | |
| Blender / v2.79 BMW27 CPU | |
| Lenovo ThinkPad X9-15 Aura Edition | |
| Microsoft Surface Laptop 7 15 Lunar Lake | |
| Lenovo Yoga Slim 7 15ILL9 Aura | |
| Average of class Multimedia (100 - 557, n=60, last 2 years) | |
| Schenker XMG Evo 15 (M24) | |
| Average Intel Core Ultra 7 255H (156 - 293, n=19) | |
| Schenker XMG Evo 15 (M25) | |
| 7-Zip 18.03 / 7z b 4 | |
| Schenker XMG Evo 15 (M25) | |
| Schenker XMG Evo 15 (M24) | |
| Average Intel Core Ultra 7 255H (42155 - 70397, n=20) | |
| Average of class Multimedia (26062 - 130368, n=57, last 2 years) | |
| Lenovo Yoga Slim 7 15ILL9 Aura | |
| Microsoft Surface Laptop 7 15 Lunar Lake | |
| Lenovo ThinkPad X9-15 Aura Edition | |
| 7-Zip 18.03 / 7z b 4 -mmt1 | |
| Schenker XMG Evo 15 (M25) | |
| Microsoft Surface Laptop 7 15 Lunar Lake | |
| Average of class Multimedia (3666 - 7545, n=58, last 2 years) | |
| Average Intel Core Ultra 7 255H (4589 - 6385, n=20) | |
| Lenovo ThinkPad X9-15 Aura Edition | |
| Schenker XMG Evo 15 (M24) | |
| Lenovo Yoga Slim 7 15ILL9 Aura | |
| Geekbench 6.7 / Multi-Core | |
| Schenker XMG Evo 15 (M25) | |
| Average Intel Core Ultra 7 255H (11979 - 17489, n=20) | |
| Average of class Multimedia (4983 - 29415, n=71, last 2 years) | |
| Apple MacBook Air 15 M4 | |
| Schenker XMG Evo 15 (M24) | |
| Microsoft Surface Laptop 7 15 Lunar Lake | |
| Lenovo ThinkPad X9-15 Aura Edition | |
| Lenovo Yoga Slim 7 15ILL9 Aura | |
| Geekbench 6.7 / Single-Core | |
| Apple MacBook Air 15 M4 | |
| Schenker XMG Evo 15 (M25) | |
| Average of class Multimedia (1534 - 4335, n=70, last 2 years) | |
| Microsoft Surface Laptop 7 15 Lunar Lake | |
| Average Intel Core Ultra 7 255H (2712 - 2939, n=20) | |
| Lenovo ThinkPad X9-15 Aura Edition | |
| Lenovo Yoga Slim 7 15ILL9 Aura | |
| Schenker XMG Evo 15 (M24) | |
| Geekbench 5.5 / Multi-Core | |
| Schenker XMG Evo 15 (M25) | |
| Average Intel Core Ultra 7 255H (11348 - 17218, n=19) | |
| Average of class Multimedia (4652 - 20422, n=58, last 2 years) | |
| Schenker XMG Evo 15 (M24) | |
| Microsoft Surface Laptop 7 15 Lunar Lake | |
| Lenovo ThinkPad X9-15 Aura Edition | |
| Lenovo Yoga Slim 7 15ILL9 Aura | |
| Geekbench 5.5 / Single-Core | |
| Schenker XMG Evo 15 (M25) | |
| Microsoft Surface Laptop 7 15 Lunar Lake | |
| Average Intel Core Ultra 7 255H (1938 - 2121, n=19) | |
| Lenovo ThinkPad X9-15 Aura Edition | |
| Lenovo Yoga Slim 7 15ILL9 Aura | |
| Average of class Multimedia (805 - 2974, n=58, last 2 years) | |
| Schenker XMG Evo 15 (M24) | |
| HWBOT x265 Benchmark v2.2 / 4k Preset | |
| Schenker XMG Evo 15 (M25) | |
| Average Intel Core Ultra 7 255H (13.7 - 26.5, n=19) | |
| Average of class Multimedia (5.26 - 36.1, n=58, last 2 years) | |
| Schenker XMG Evo 15 (M24) | |
| Lenovo Yoga Slim 7 15ILL9 Aura | |
| Microsoft Surface Laptop 7 15 Lunar Lake | |
| Lenovo ThinkPad X9-15 Aura Edition | |
| LibreOffice / 20 Documents To PDF | |
| Lenovo Yoga Slim 7 15ILL9 Aura | |
| Average of class Multimedia (23.9 - 146.7, n=59, last 2 years) | |
| Microsoft Surface Laptop 7 15 Lunar Lake | |
| Average Intel Core Ultra 7 255H (41.1 - 61.6, n=19) | |
| Lenovo ThinkPad X9-15 Aura Edition | |
| Schenker XMG Evo 15 (M24) | |
| Schenker XMG Evo 15 (M25) | |
| R Benchmark 2.5 / Overall mean | |
| Lenovo ThinkPad X9-15 Aura Edition | |
| Lenovo Yoga Slim 7 15ILL9 Aura | |
| Average of class Multimedia (0.3604 - 0.947, n=58, last 2 years) | |
| Microsoft Surface Laptop 7 15 Lunar Lake | |
| Average Intel Core Ultra 7 255H (0.4233 - 0.515, n=19) | |
| Schenker XMG Evo 15 (M24) | |
| Schenker XMG Evo 15 (M25) | |
* ... smaller is better
AIDA64: FP32 Ray-Trace | FPU Julia | CPU SHA3 | CPU Queen | FPU SinJulia | FPU Mandel | CPU AES | CPU ZLib | FP64 Ray-Trace | CPU PhotoWorxx
| Performance rating | |
| Schenker XMG Evo 15 (M25) | |
| Average Intel Core Ultra 7 255H | |
| Average of class Multimedia | |
| Schenker XMG Evo 15 (M24) | |
| Lenovo Yoga Slim 7 15ILL9 Aura | |
| Lenovo ThinkPad X9-15 Aura Edition | |
| Microsoft Surface Laptop 7 15 Lunar Lake | |
| AIDA64 / FP32 Ray-Trace | |
| Schenker XMG Evo 15 (M25) | |
| Average Intel Core Ultra 7 255H (13863 - 24741, n=17) | |
| Average of class Multimedia (2214 - 50388, n=55, last 2 years) | |
| Schenker XMG Evo 15 (M24) | |
| Lenovo Yoga Slim 7 15ILL9 Aura | |
| Lenovo ThinkPad X9-15 Aura Edition | |
| Lenovo ThinkPad X9-15 Aura Edition | |
| Lenovo ThinkPad X9-15 Aura Edition | |
| Microsoft Surface Laptop 7 15 Lunar Lake | |
| AIDA64 / FPU Julia | |
| Schenker XMG Evo 15 (M25) | |
| Average Intel Core Ultra 7 255H (71030 - 119222, n=17) | |
| Average of class Multimedia (12867 - 201874, n=56, last 2 years) | |
| Schenker XMG Evo 15 (M24) | |
| Lenovo Yoga Slim 7 15ILL9 Aura | |
| Lenovo ThinkPad X9-15 Aura Edition | |
| Lenovo ThinkPad X9-15 Aura Edition | |
| Lenovo ThinkPad X9-15 Aura Edition | |
| Microsoft Surface Laptop 7 15 Lunar Lake | |
| AIDA64 / CPU SHA3 | |
| Schenker XMG Evo 15 (M25) | |
| Average Intel Core Ultra 7 255H (3408 - 5548, n=17) | |
| Average of class Multimedia (626 - 8623, n=56, last 2 years) | |
| Schenker XMG Evo 15 (M24) | |
| Lenovo Yoga Slim 7 15ILL9 Aura | |
| Lenovo ThinkPad X9-15 Aura Edition | |
| Lenovo ThinkPad X9-15 Aura Edition | |
| Lenovo ThinkPad X9-15 Aura Edition | |
| Microsoft Surface Laptop 7 15 Lunar Lake | |
| AIDA64 / CPU Queen | |
| Schenker XMG Evo 15 (M24) | |
| Average of class Multimedia (13483 - 181505, n=43, last 2 years) | |
| Schenker XMG Evo 15 (M25) | |
| Average Intel Core Ultra 7 255H (59098 - 68460, n=16) | |
| Lenovo Yoga Slim 7 15ILL9 Aura | |
| Lenovo ThinkPad X9-15 Aura Edition | |
| Lenovo ThinkPad X9-15 Aura Edition | |
| Microsoft Surface Laptop 7 15 Lunar Lake | |
| AIDA64 / FPU SinJulia | |
| Schenker XMG Evo 15 (M24) | |
| Schenker XMG Evo 15 (M25) | |
| Average of class Multimedia (886 - 28794, n=56, last 2 years) | |
| Average Intel Core Ultra 7 255H (6716 - 9006, n=17) | |
| Lenovo ThinkPad X9-15 Aura Edition | |
| Lenovo ThinkPad X9-15 Aura Edition | |
| Lenovo ThinkPad X9-15 Aura Edition | |
| Microsoft Surface Laptop 7 15 Lunar Lake | |
| Lenovo Yoga Slim 7 15ILL9 Aura | |
| AIDA64 / FPU Mandel | |
| Schenker XMG Evo 15 (M25) | |
| Average Intel Core Ultra 7 255H (37031 - 63347, n=17) | |
| Average of class Multimedia (6395 - 105740, n=55, last 2 years) | |
| Schenker XMG Evo 15 (M24) | |
| Lenovo Yoga Slim 7 15ILL9 Aura | |
| Lenovo ThinkPad X9-15 Aura Edition | |
| Lenovo ThinkPad X9-15 Aura Edition | |
| Lenovo ThinkPad X9-15 Aura Edition | |
| Microsoft Surface Laptop 7 15 Lunar Lake | |
| AIDA64 / CPU AES | |
| Schenker XMG Evo 15 (M24) | |
| Schenker XMG Evo 15 (M25) | |
| Average Intel Core Ultra 7 255H (58402 - 83568, n=17) | |
| Average of class Multimedia (8171 - 126790, n=56, last 2 years) | |
| Lenovo Yoga Slim 7 15ILL9 Aura | |
| Lenovo ThinkPad X9-15 Aura Edition | |
| Lenovo ThinkPad X9-15 Aura Edition | |
| Lenovo ThinkPad X9-15 Aura Edition | |
| Microsoft Surface Laptop 7 15 Lunar Lake | |
| AIDA64 / CPU ZLib | |
| Schenker XMG Evo 15 (M25) | |
| Average Intel Core Ultra 7 255H (822 - 1316, n=17) | |
| Average of class Multimedia (143.8 - 2022, n=56, last 2 years) | |
| Schenker XMG Evo 15 (M24) | |
| Lenovo Yoga Slim 7 15ILL9 Aura | |
| Lenovo ThinkPad X9-15 Aura Edition | |
| Lenovo ThinkPad X9-15 Aura Edition | |
| Lenovo ThinkPad X9-15 Aura Edition | |
| Microsoft Surface Laptop 7 15 Lunar Lake | |
| AIDA64 / FP64 Ray-Trace | |
| Schenker XMG Evo 15 (M25) | |
| Average Intel Core Ultra 7 255H (7384 - 13231, n=17) | |
| Average of class Multimedia (1014 - 26875, n=56, last 2 years) | |
| Schenker XMG Evo 15 (M24) | |
| Lenovo Yoga Slim 7 15ILL9 Aura | |
| Lenovo ThinkPad X9-15 Aura Edition | |
| Lenovo ThinkPad X9-15 Aura Edition | |
| Lenovo ThinkPad X9-15 Aura Edition | |
| Microsoft Surface Laptop 7 15 Lunar Lake | |
| AIDA64 / CPU PhotoWorxx | |
| Schenker XMG Evo 15 (M25) | |
| Lenovo ThinkPad X9-15 Aura Edition | |
| Lenovo ThinkPad X9-15 Aura Edition | |
| Lenovo ThinkPad X9-15 Aura Edition | |
| Average Intel Core Ultra 7 255H (23836 - 65787, n=17) | |
| Microsoft Surface Laptop 7 15 Lunar Lake | |
| Lenovo Yoga Slim 7 15ILL9 Aura | |
| Average of class Multimedia (8187 - 88154, n=56, last 2 years) | |
| Schenker XMG Evo 15 (M24) | |
System performance
The system performance of the Evo 15 is excellent, and the laptop is extremely responsive in everyday use.
PCMark 10: Score | Essentials | Productivity | Digital Content Creation
CrossMark: Overall | Productivity | Creativity | Responsiveness
WebXPRT 3: Overall
WebXPRT 4: Overall
Mozilla Kraken 1.1: Total
| Performance rating | |
| Apple MacBook Air 15 M4 -4! | |
| Schenker XMG Evo 15 (M25) | |
| Average of class Multimedia | |
| Average Intel Core Ultra 7 255H, Intel Arc Graphics 140T | |
| Schenker XMG Evo 15 (M24) | |
| Microsoft Surface Laptop 7 15 Lunar Lake | |
| Lenovo ThinkPad X9-15 Aura Edition | |
| Lenovo Yoga Slim 7 15ILL9 Aura | |
| PCMark 10 / Score | |
| Schenker XMG Evo 15 (M25) | |
| Average of class Multimedia (4325 - 10386, n=54, last 2 years) | |
| Average Intel Core Ultra 7 255H, Intel Arc Graphics 140T (6878 - 9156, n=13) | |
| Schenker XMG Evo 15 (M24) | |
| Microsoft Surface Laptop 7 15 Lunar Lake | |
| Lenovo ThinkPad X9-15 Aura Edition | |
| Lenovo Yoga Slim 7 15ILL9 Aura | |
| PCMark 10 / Essentials | |
| Schenker XMG Evo 15 (M25) | |
| Schenker XMG Evo 15 (M24) | |
| Average Intel Core Ultra 7 255H, Intel Arc Graphics 140T (10637 - 11556, n=13) | |
| Microsoft Surface Laptop 7 15 Lunar Lake | |
| Lenovo ThinkPad X9-15 Aura Edition | |
| Average of class Multimedia (8025 - 11664, n=53, last 2 years) | |
| Lenovo Yoga Slim 7 15ILL9 Aura | |
| PCMark 10 / Productivity | |
| Schenker XMG Evo 15 (M25) | |
| Average of class Multimedia (7323 - 18233, n=53, last 2 years) | |
| Average Intel Core Ultra 7 255H, Intel Arc Graphics 140T (7598 - 15694, n=13) | |
| Microsoft Surface Laptop 7 15 Lunar Lake | |
| Lenovo ThinkPad X9-15 Aura Edition | |
| Lenovo Yoga Slim 7 15ILL9 Aura | |
| Schenker XMG Evo 15 (M24) | |
| PCMark 10 / Digital Content Creation | |
| Schenker XMG Evo 15 (M25) | |
| Average Intel Core Ultra 7 255H, Intel Arc Graphics 140T (10461 - 12552, n=13) | |
| Schenker XMG Evo 15 (M24) | |
| Average of class Multimedia (3651 - 16240, n=53, last 2 years) | |
| Microsoft Surface Laptop 7 15 Lunar Lake | |
| Lenovo ThinkPad X9-15 Aura Edition | |
| Lenovo Yoga Slim 7 15ILL9 Aura | |
| CrossMark / Overall | |
| Apple MacBook Air 15 M4 | |
| Schenker XMG Evo 15 (M25) | |
| Average Intel Core Ultra 7 255H, Intel Arc Graphics 140T (1610 - 2018, n=13) | |
| Average of class Multimedia (866 - 2728, n=62, last 2 years) | |
| Schenker XMG Evo 15 (M24) | |
| Lenovo ThinkPad X9-15 Aura Edition | |
| Microsoft Surface Laptop 7 15 Lunar Lake | |
| Lenovo Yoga Slim 7 15ILL9 Aura | |
| CrossMark / Productivity | |
| Apple MacBook Air 15 M4 | |
| Schenker XMG Evo 15 (M25) | |
| Schenker XMG Evo 15 (M24) | |
| Average Intel Core Ultra 7 255H, Intel Arc Graphics 140T (1566 - 1908, n=13) | |
| Average of class Multimedia (931 - 2489, n=62, last 2 years) | |
| Lenovo ThinkPad X9-15 Aura Edition | |
| Microsoft Surface Laptop 7 15 Lunar Lake | |
| Lenovo Yoga Slim 7 15ILL9 Aura | |
| CrossMark / Creativity | |
| Apple MacBook Air 15 M4 | |
| Schenker XMG Evo 15 (M25) | |
| Average of class Multimedia (907 - 3465, n=62, last 2 years) | |
| Average Intel Core Ultra 7 255H, Intel Arc Graphics 140T (1827 - 2396, n=13) | |
| Lenovo ThinkPad X9-15 Aura Edition | |
| Microsoft Surface Laptop 7 15 Lunar Lake | |
| Schenker XMG Evo 15 (M24) | |
| Lenovo Yoga Slim 7 15ILL9 Aura | |
| CrossMark / Responsiveness | |
| Schenker XMG Evo 15 (M24) | |
| Average of class Multimedia (605 - 2024, n=62, last 2 years) | |
| Average Intel Core Ultra 7 255H, Intel Arc Graphics 140T (1194 - 1781, n=13) | |
| Apple MacBook Air 15 M4 | |
| Schenker XMG Evo 15 (M25) | |
| Lenovo ThinkPad X9-15 Aura Edition | |
| Microsoft Surface Laptop 7 15 Lunar Lake | |
| Lenovo Yoga Slim 7 15ILL9 Aura | |
| WebXPRT 3 / Overall | |
| Apple MacBook Air 15 M4 | |
| Average of class Multimedia (136.4 - 596, n=65, last 2 years) | |
| Schenker XMG Evo 15 (M25) | |
| Average Intel Core Ultra 7 255H, Intel Arc Graphics 140T (273 - 327, n=13) | |
| Microsoft Surface Laptop 7 15 Lunar Lake | |
| Lenovo Yoga Slim 7 15ILL9 Aura | |
| Lenovo ThinkPad X9-15 Aura Edition | |
| Schenker XMG Evo 15 (M24) | |
| WebXPRT 4 / Overall | |
| Apple MacBook Air 15 M4 | |
| Schenker XMG Evo 15 (M25) | |
| Average Intel Core Ultra 7 255H, Intel Arc Graphics 140T (247 - 317, n=13) | |
| Average of class Multimedia (167.3 - 402, n=67, last 2 years) | |
| Microsoft Surface Laptop 7 15 Lunar Lake | |
| Lenovo Yoga Slim 7 15ILL9 Aura | |
| Lenovo ThinkPad X9-15 Aura Edition | |
| Schenker XMG Evo 15 (M24) | |
| Mozilla Kraken 1.1 / Total | |
| Schenker XMG Evo 15 (M24) | |
| Microsoft Surface Laptop 7 15 Lunar Lake | |
| Lenovo Yoga Slim 7 15ILL9 Aura | |
| Lenovo ThinkPad X9-15 Aura Edition | |
| Schenker XMG Evo 15 (M25) | |
| Average Intel Core Ultra 7 255H, Intel Arc Graphics 140T (427 - 510, n=13) | |
| Average of class Multimedia (228 - 835, n=68, last 2 years) | |
| Apple MacBook Air 15 M4 | |
* ... smaller is better
| PCMark 10 Score | 9156 points | |
Help | ||
| AIDA64 / Memory Copy | |
| Lenovo ThinkPad X9-15 Aura Edition | |
| Microsoft Surface Laptop 7 15 Lunar Lake | |
| Lenovo Yoga Slim 7 15ILL9 Aura | |
| Schenker XMG Evo 15 (M25) | |
| Average Intel Core Ultra 7 255H (39188 - 110930, n=17) | |
| Average of class Multimedia (11299 - 132135, n=56, last 2 years) | |
| Schenker XMG Evo 15 (M24) | |
| AIDA64 / Memory Read | |
| Lenovo Yoga Slim 7 15ILL9 Aura | |
| Microsoft Surface Laptop 7 15 Lunar Lake | |
| Lenovo ThinkPad X9-15 Aura Edition | |
| Schenker XMG Evo 15 (M25) | |
| Average of class Multimedia (11624 - 174586, n=56, last 2 years) | |
| Average Intel Core Ultra 7 255H (43703 - 90552, n=17) | |
| Schenker XMG Evo 15 (M24) | |
| AIDA64 / Memory Write | |
| Lenovo Yoga Slim 7 15ILL9 Aura | |
| Microsoft Surface Laptop 7 15 Lunar Lake | |
| Lenovo ThinkPad X9-15 Aura Edition | |
| Schenker XMG Evo 15 (M25) | |
| Average of class Multimedia (11755 - 134998, n=56, last 2 years) | |
| Average Intel Core Ultra 7 255H (36438 - 87199, n=17) | |
| Schenker XMG Evo 15 (M24) | |
| AIDA64 / Memory Latency | |
| Schenker XMG Evo 15 (M24) | |
| Average Intel Core Ultra 7 255H (107.6 - 147.2, n=17) | |
| Average of class Multimedia (7 - 535, n=55, last 2 years) | |
| Schenker XMG Evo 15 (M25) | |
| Lenovo Yoga Slim 7 15ILL9 Aura | |
| Microsoft Surface Laptop 7 15 Lunar Lake | |
| Lenovo ThinkPad X9-15 Aura Edition | |
* ... smaller is better
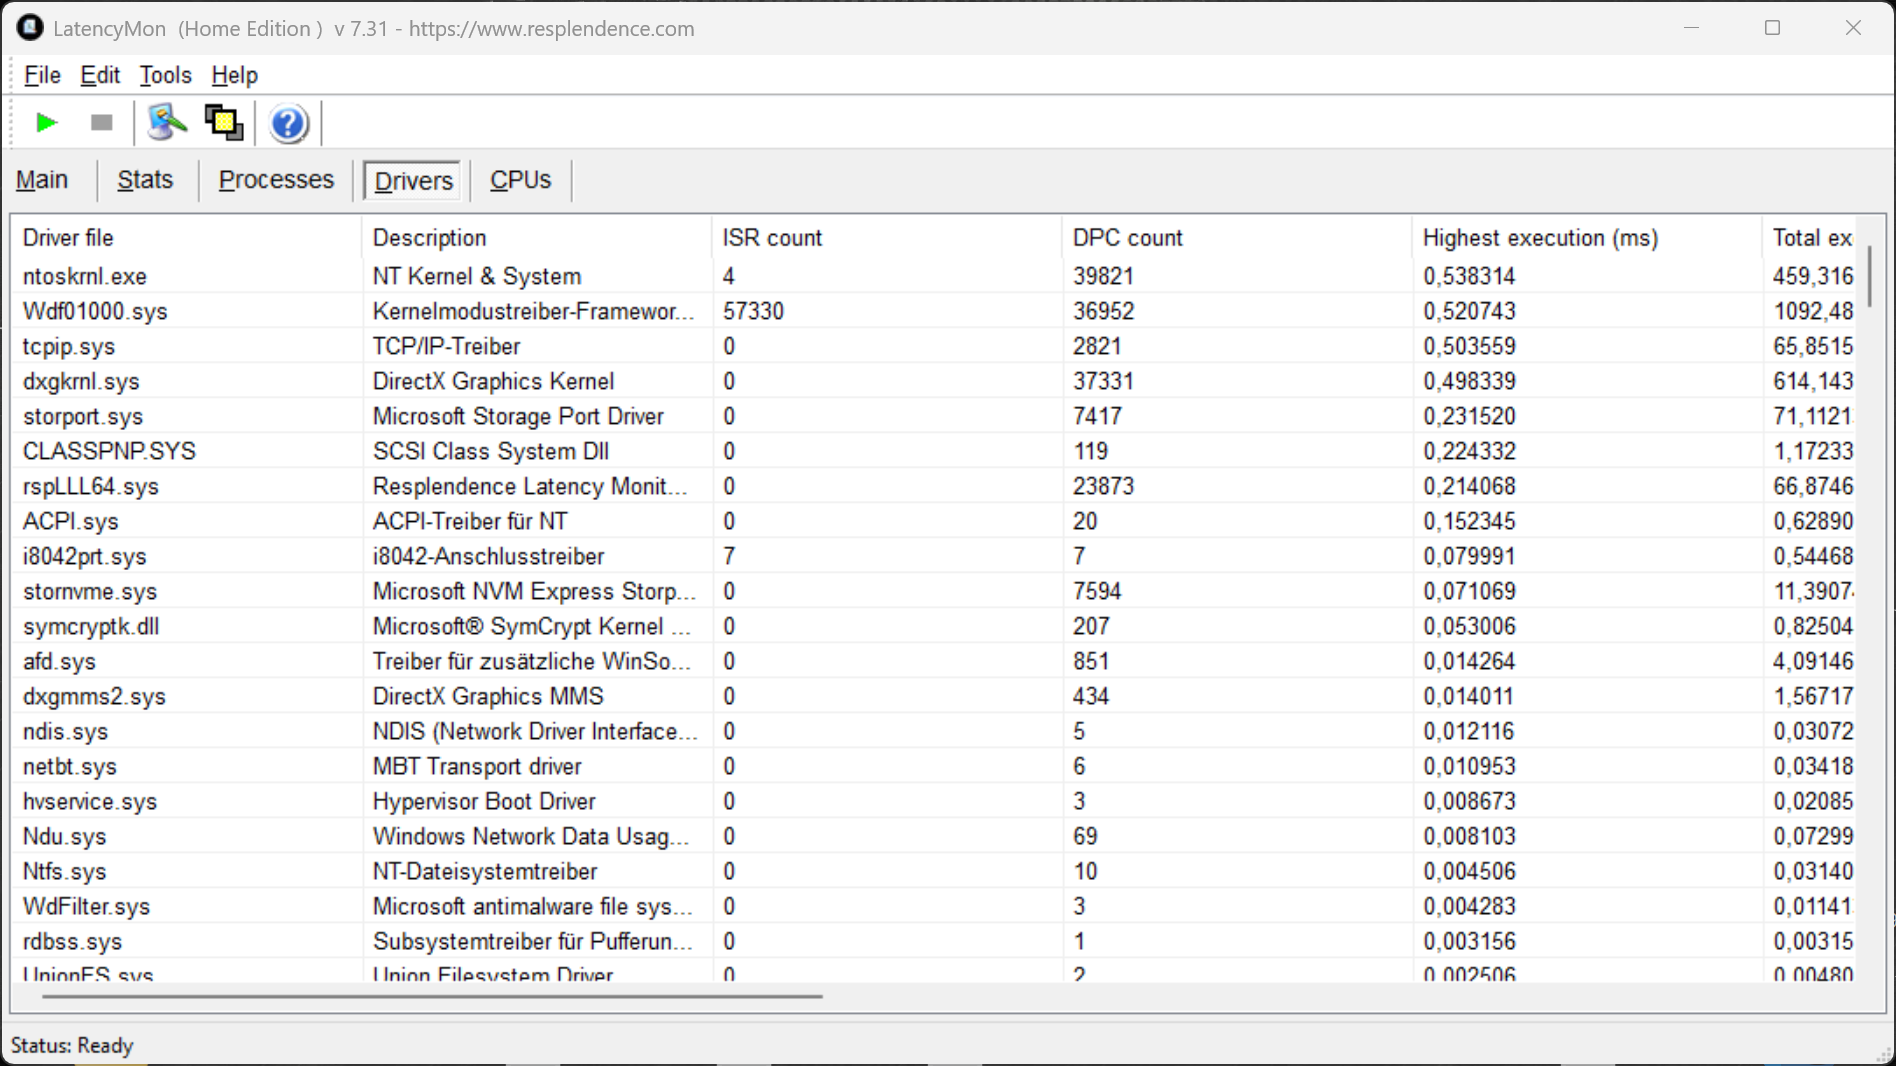
DPC latencies
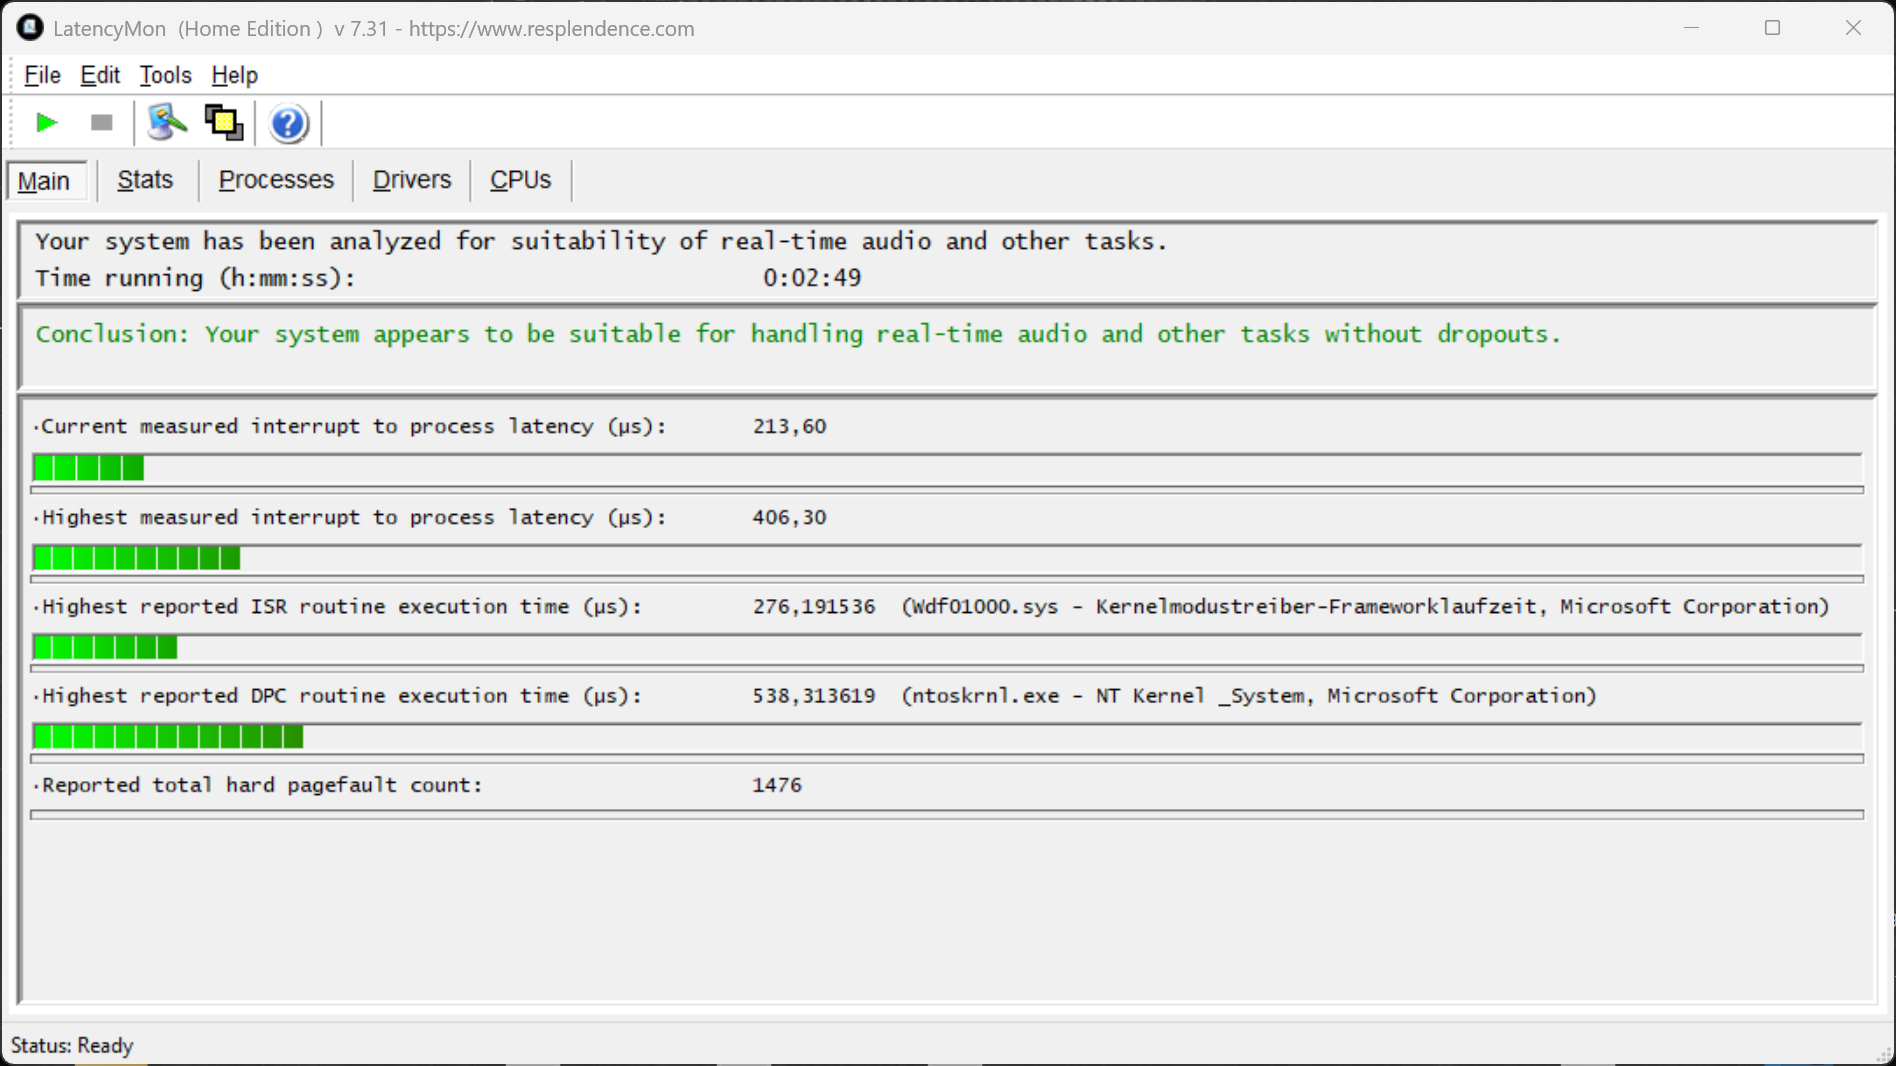
In our standardized latency test, the Evo 15 showed no limitations when running real-time audio applications with the current BIOS version.
| DPC Latencies / LatencyMon - interrupt to process latency (max), Web, Youtube, Prime95 | |
| Lenovo ThinkPad X9-15 Aura Edition | |
| Schenker XMG Evo 15 (M24) | |
| Microsoft Surface Laptop 7 15 Lunar Lake | |
| Schenker XMG Evo 15 (M25) | |
* ... smaller is better
Mass storage
There are two fully-fledged M.2 2280 slots available, which are connected via PCIe 4.0. In our test configuration, the 2 TB version (1.72 TB free) of the Samsung 990 Pro was installed, which achieves good transfer rates of up to 7 GB/s.
Update: Bitlocker encryption was active during our initial tests. The transfer rates are now better after we turned it off.

* ... smaller is better
Read continuous performance: DiskSpd Read Loop, Queue Depth 8
GPU performance
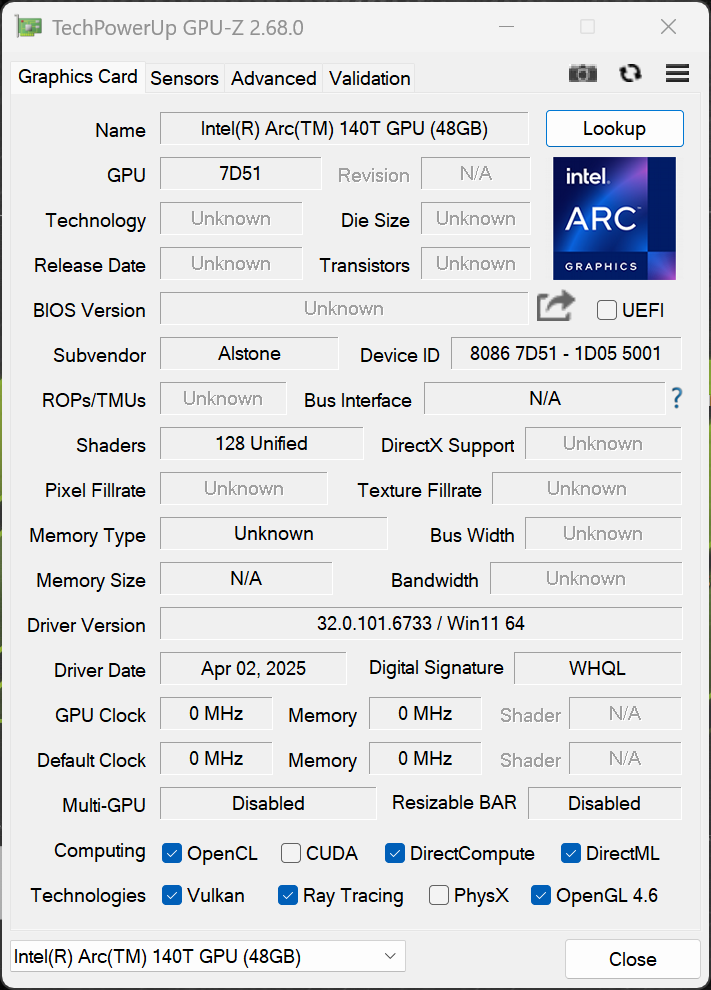
The performance of the Arc-140T GPU is at the expected level and remains completely stable even under sustained load. Some gaming is also possible on the Evo 15, although the games should not be too demanding.
| 3DMark 11 Performance | 13648 points | |
| 3DMark Fire Strike Score | 8561 points | |
| 3DMark Time Spy Score | 4472 points | |
| 3DMark Steel Nomad Score | 875 points | |
| 3DMark Steel Nomad Light Score | 3473 points | |
Help | ||
| Blender / v3.3 Classroom METAL | |
| Apple MacBook Air 15 M4 | |
| Average of class Multimedia (17.8 - 68, n=5, last 2 years) | |
| Blender / v3.3 Classroom CPU | |
| Lenovo ThinkPad X9-15 Aura Edition | |
| Microsoft Surface Laptop 7 15 Lunar Lake | |
| Lenovo Yoga Slim 7 15ILL9 Aura | |
| Apple MacBook Air 15 M4 | |
| Average of class Multimedia (134.5 - 1042, n=63, last 2 years) | |
| Schenker XMG Evo 15 (M24) | |
| Average Intel Arc Graphics 140T (254 - 492, n=20) | |
| Schenker XMG Evo 15 (M25) | |
| Blender / v3.3 Classroom oneAPI/Intel | |
| Average of class Multimedia (105 - 492, n=17, last 2 years) | |
| Lenovo Yoga Slim 7 15ILL9 Aura | |
| Average Intel Arc Graphics 140T (147 - 396, n=6) | |
* ... smaller is better
| Final Fantasy XV Benchmark - 1920x1080 High Quality | |
| Average of class Multimedia (7.61 - 144.4, n=60, last 2 years) | |
| Microsoft Surface Laptop 7 15 Lunar Lake | |
| Lenovo ThinkPad X9-15 Aura Edition | |
| Schenker XMG Evo 15 (M25) | |
| Schenker XMG Evo 15 (M24) | |
| Lenovo Yoga Slim 7 15ILL9 Aura | |
| Dota 2 Reborn - 1920x1080 ultra (3/3) best looking | |
| Average of class Multimedia (29 - 179.9, n=62, last 2 years) | |
| Schenker XMG Evo 15 (M25) | |
| Microsoft Surface Laptop 7 15 Lunar Lake | |
| Schenker XMG Evo 15 (M24) | |
| Lenovo Yoga Slim 7 15ILL9 Aura | |
| Lenovo ThinkPad X9-15 Aura Edition | |
Cyberpunk 2077 ultra FPS chart
| low | med. | high | ultra | QHD | |
|---|---|---|---|---|---|
| GTA V (2015) | 178.7 | 170 | 46.6 | 18.9 | |
| Dota 2 Reborn (2015) | 109.7 | 97.5 | 91.6 | 90.1 | |
| Final Fantasy XV Benchmark (2018) | 91.3 | 45.8 | 32.6 | ||
| X-Plane 11.11 (2018) | 61.8 | 48.5 | 42.4 | ||
| Strange Brigade (2018) | 202 | 82.8 | 69.6 | 58.2 | 41.3 |
| Baldur's Gate 3 (2023) | 40.7 | 32.8 | 28.1 | 27.3 | |
| Cyberpunk 2077 (2023) | 43 | 34.8 | 29.9 | 27.4 | |
| F1 24 (2024) | 93.4 | 85.7 | 64.9 | 20.8 | 13.7 |
Emissions & Energy
Noise

For everyday use, we recommend either Balanced or Enthusiast mode, as the fans remain significantly quieter in these settings. In Overboost mode, fan noise becomes clearly audible, reaching up to 47.9 dB(A) in the stress test and around 41 dB(A) during gaming; by comparison, the other modes remain noticeably quieter (Balanced: 32.9 dB(A), Enthusiast: 36.3 dB(A), battery: 34.8 dB(A)). No coil whine was observed on the test unit.
Noise level
| Idle |
| 24.5 / 24.5 / 26.9 dB(A) |
| Load |
| 33.9 / 47.9 dB(A) |
 | ||
30 dB silent 40 dB(A) audible 50 dB(A) loud |
||
min: | ||
| Schenker XMG Evo 15 (M25) Ultra 7 255H, Arc 140T | Microsoft Surface Laptop 7 15 Lunar Lake Core Ultra 7 268V, Arc 140V | Lenovo ThinkPad X9-15 Aura Edition Core Ultra 7 258V, Arc 140V | Lenovo Yoga Slim 7 15ILL9 Aura Core Ultra 7 256V, Arc 140V | Schenker XMG Evo 15 (M24) Ultra 7 155H, Arc 8-Core | |
|---|---|---|---|---|---|
| Noise | 6% | 2% | 7% | 2% | |
| off / environment * (dB) | 24.5 | 23.9 2% | 24.4 -0% | 23.2 5% | 24.7 -1% |
| Idle Minimum * (dB) | 24.5 | 23.9 2% | 24.4 -0% | 23.2 5% | 24.7 -1% |
| Idle Average * (dB) | 24.5 | 23.9 2% | 24.4 -0% | 23.2 5% | 24.7 -1% |
| Idle Maximum * (dB) | 26.9 | 23.9 11% | 24.4 9% | 26.1 3% | 28.9 -7% |
| Load Average * (dB) | 33.9 | 31.8 6% | 35.8 -6% | 30.9 9% | 32.7 4% |
| Cyberpunk 2077 ultra * (dB) | 41.3 | 38 8% | 39.4 5% | 34.1 17% | 40.4 2% |
| Load Maximum * (dB) | 47.9 | 41.9 13% | 45 6% | 44.3 8% | 40.4 16% |
* ... smaller is better
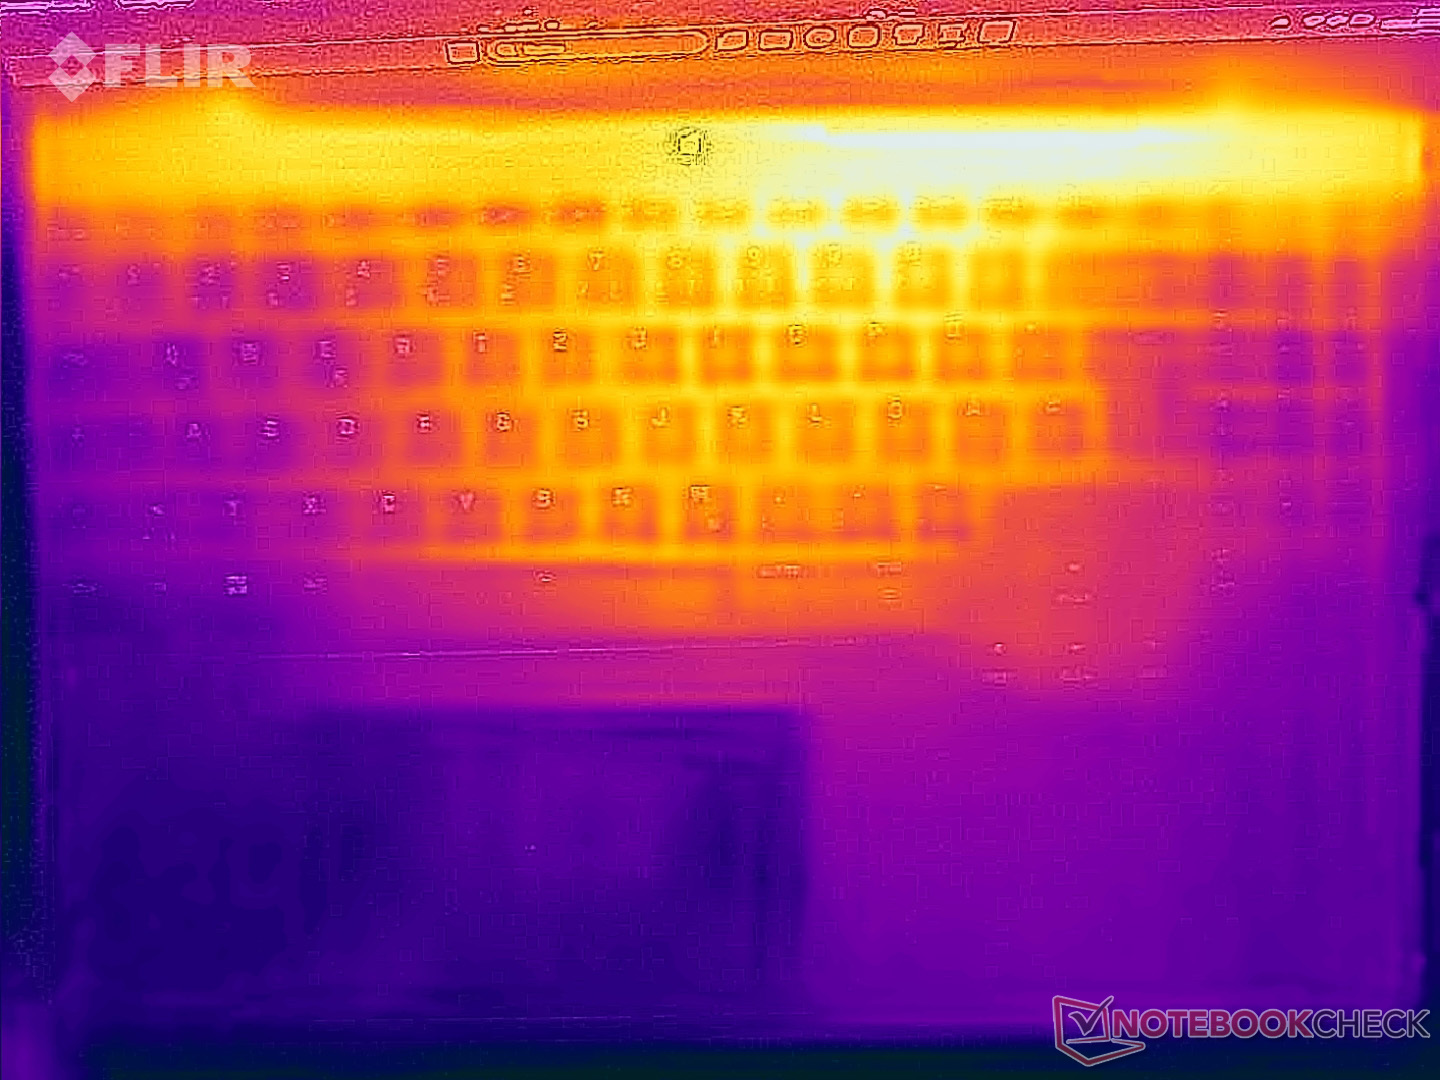
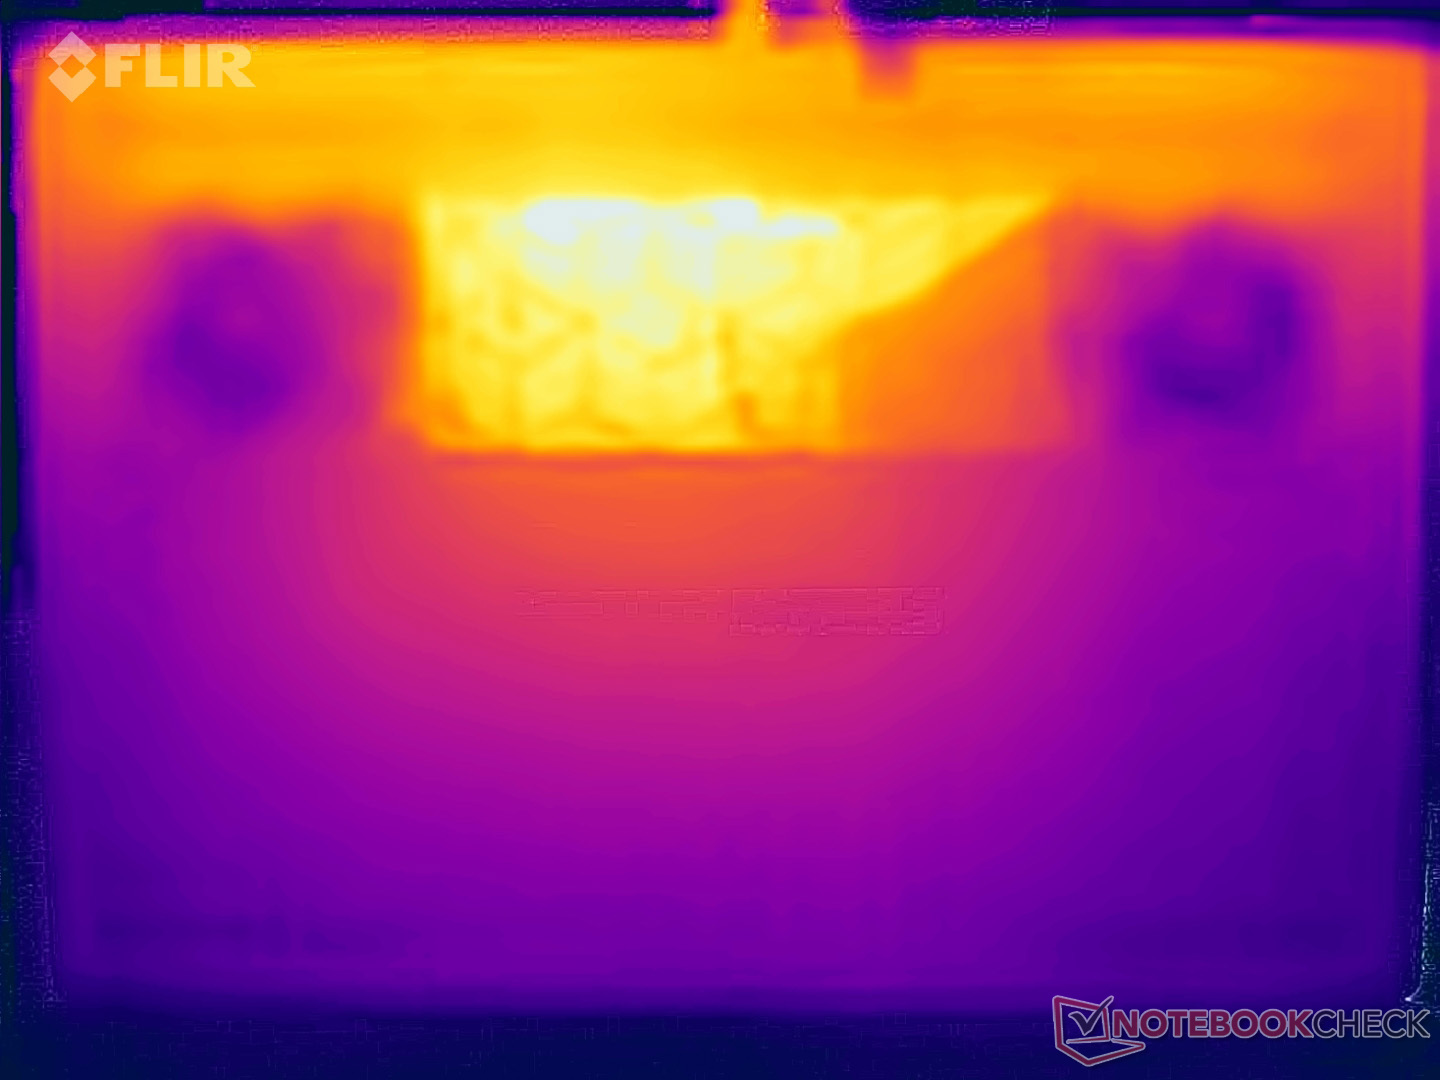
Temperature
When the laptop is fully stressed in Overboost mode, it should not be placed on your thighs, as we measured temperatures of more than 50 °C on the bottom. Otherwise, there are no temperature-related issues, and the processor maintains a constant power draw of around 90 watts during the stress test.

(±) The maximum temperature on the upper side is 42.3 °C / 108 F, compared to the average of 36.8 °C / 98 F, ranging from 21 to 71 °C for the class Multimedia.
(-) The bottom heats up to a maximum of 56 °C / 133 F, compared to the average of 39.1 °C / 102 F
(+) In idle usage, the average temperature for the upper side is 25.7 °C / 78 F, compared to the device average of 31.3 °C / 88 F.
(±) 3: The average temperature for the upper side is 32.8 °C / 91 F, compared to the average of 31.3 °C / 88 F for the class Multimedia.
(+) The palmrests and touchpad are cooler than skin temperature with a maximum of 28.2 °C / 82.8 F and are therefore cool to the touch.
(±) The average temperature of the palmrest area of similar devices was 28.7 °C / 83.7 F (+0.5 °C / 0.9 F).
| Schenker XMG Evo 15 (M25) Ultra 7 255H, Arc 140T | Microsoft Surface Laptop 7 15 Lunar Lake Core Ultra 7 268V, Arc 140V | Apple MacBook Air 15 M4 M4 10-Core, M4 10-Core GPU | Lenovo ThinkPad X9-15 Aura Edition Core Ultra 7 258V, Arc 140V | Lenovo Yoga Slim 7 15ILL9 Aura Core Ultra 7 256V, Arc 140V | Schenker XMG Evo 15 (M24) Ultra 7 155H, Arc 8-Core | |
|---|---|---|---|---|---|---|
| Heat | 13% | 14% | 15% | -4% | -3% | |
| Maximum Upper Side * (°C) | 42.3 | 45.7 -8% | 44.9 -6% | 42.1 -0% | 46.2 -9% | 41.7 1% |
| Maximum Bottom * (°C) | 56 | 42.9 23% | 43.9 22% | 39.5 29% | 41 27% | 49.6 11% |
| Idle Upper Side * (°C) | 27.4 | 23.6 14% | 23.4 15% | 24.5 11% | 34 -24% | 31.1 -14% |
| Idle Bottom * (°C) | 30.5 | 23.1 24% | 23.5 23% | 24.4 20% | 33.8 -11% | 33.1 -9% |
* ... smaller is better
Speakers
Schenker XMG Evo 15 (M25) audio analysis
(+) | speakers can play relatively loud (84.1 dB)
Bass 100 - 315 Hz
(-) | nearly no bass - on average 16.3% lower than median
(±) | linearity of bass is average (13.4% delta to prev. frequency)
Mids 400 - 2000 Hz
(±) | higher mids - on average 5.6% higher than median
(+) | mids are linear (5.9% delta to prev. frequency)
Highs 2 - 16 kHz
(+) | balanced highs - only 4.2% away from median
(+) | highs are linear (6.5% delta to prev. frequency)
Overall 100 - 16.000 Hz
(±) | linearity of overall sound is average (15.6% difference to median)
Compared to same class
» 39% of all tested devices in this class were better, 4% similar, 57% worse
» The best had a delta of 5%, average was 17%, worst was 45%
Compared to all devices tested
» 23% of all tested devices were better, 5% similar, 72% worse
» The best had a delta of 4%, average was 23%, worst was 134%
Microsoft Surface Laptop 7 15 Lunar Lake audio analysis
(±) | speaker loudness is average but good (78.8 dB)
Bass 100 - 315 Hz
(±) | reduced bass - on average 9.3% lower than median
(±) | linearity of bass is average (8.4% delta to prev. frequency)
Mids 400 - 2000 Hz
(+) | balanced mids - only 4.4% away from median
(+) | mids are linear (3% delta to prev. frequency)
Highs 2 - 16 kHz
(+) | balanced highs - only 2.4% away from median
(+) | highs are linear (4.1% delta to prev. frequency)
Overall 100 - 16.000 Hz
(+) | overall sound is linear (11.4% difference to median)
Compared to same class
» 3% of all tested devices in this class were better, 2% similar, 95% worse
» The best had a delta of 7%, average was 21%, worst was 53%
Compared to all devices tested
» 7% of all tested devices were better, 2% similar, 90% worse
» The best had a delta of 4%, average was 23%, worst was 134%
Apple MacBook Air 15 M4 audio analysis
(+) | speakers can play relatively loud (85.8 dB)
Bass 100 - 315 Hz
(±) | reduced bass - on average 8.2% lower than median
(±) | linearity of bass is average (9.4% delta to prev. frequency)
Mids 400 - 2000 Hz
(+) | balanced mids - only 1.6% away from median
(+) | mids are linear (2.4% delta to prev. frequency)
Highs 2 - 16 kHz
(+) | balanced highs - only 4.2% away from median
(+) | highs are linear (4.3% delta to prev. frequency)
Overall 100 - 16.000 Hz
(+) | overall sound is linear (8% difference to median)
Compared to same class
» 2% of all tested devices in this class were better, 1% similar, 97% worse
» The best had a delta of 5%, average was 18%, worst was 53%
Compared to all devices tested
» 2% of all tested devices were better, 1% similar, 98% worse
» The best had a delta of 4%, average was 23%, worst was 134%
Lenovo ThinkPad X9-15 Aura Edition audio analysis
(+) | speakers can play relatively loud (87.5 dB)
Bass 100 - 315 Hz
(±) | reduced bass - on average 12.5% lower than median
(+) | bass is linear (6.8% delta to prev. frequency)
Mids 400 - 2000 Hz
(+) | balanced mids - only 3.1% away from median
(+) | mids are linear (5.3% delta to prev. frequency)
Highs 2 - 16 kHz
(+) | balanced highs - only 2.4% away from median
(+) | highs are linear (3.3% delta to prev. frequency)
Overall 100 - 16.000 Hz
(+) | overall sound is linear (9.5% difference to median)
Compared to same class
» 1% of all tested devices in this class were better, 0% similar, 99% worse
» The best had a delta of 7%, average was 21%, worst was 53%
Compared to all devices tested
» 4% of all tested devices were better, 1% similar, 95% worse
» The best had a delta of 4%, average was 23%, worst was 134%
Lenovo Yoga Slim 7 15ILL9 Aura audio analysis
(+) | speakers can play relatively loud (83.5 dB)
Bass 100 - 315 Hz
(+) | good bass - only 4.1% away from median
(+) | bass is linear (5.5% delta to prev. frequency)
Mids 400 - 2000 Hz
(+) | balanced mids - only 1.7% away from median
(+) | mids are linear (1.6% delta to prev. frequency)
Highs 2 - 16 kHz
(+) | balanced highs - only 2.4% away from median
(+) | highs are linear (4.9% delta to prev. frequency)
Overall 100 - 16.000 Hz
(+) | overall sound is linear (5.3% difference to median)
Compared to same class
» 1% of all tested devices in this class were better, 1% similar, 98% worse
» The best had a delta of 5%, average was 17%, worst was 45%
Compared to all devices tested
» 0% of all tested devices were better, 0% similar, 100% worse
» The best had a delta of 4%, average was 23%, worst was 134%
Power consumption

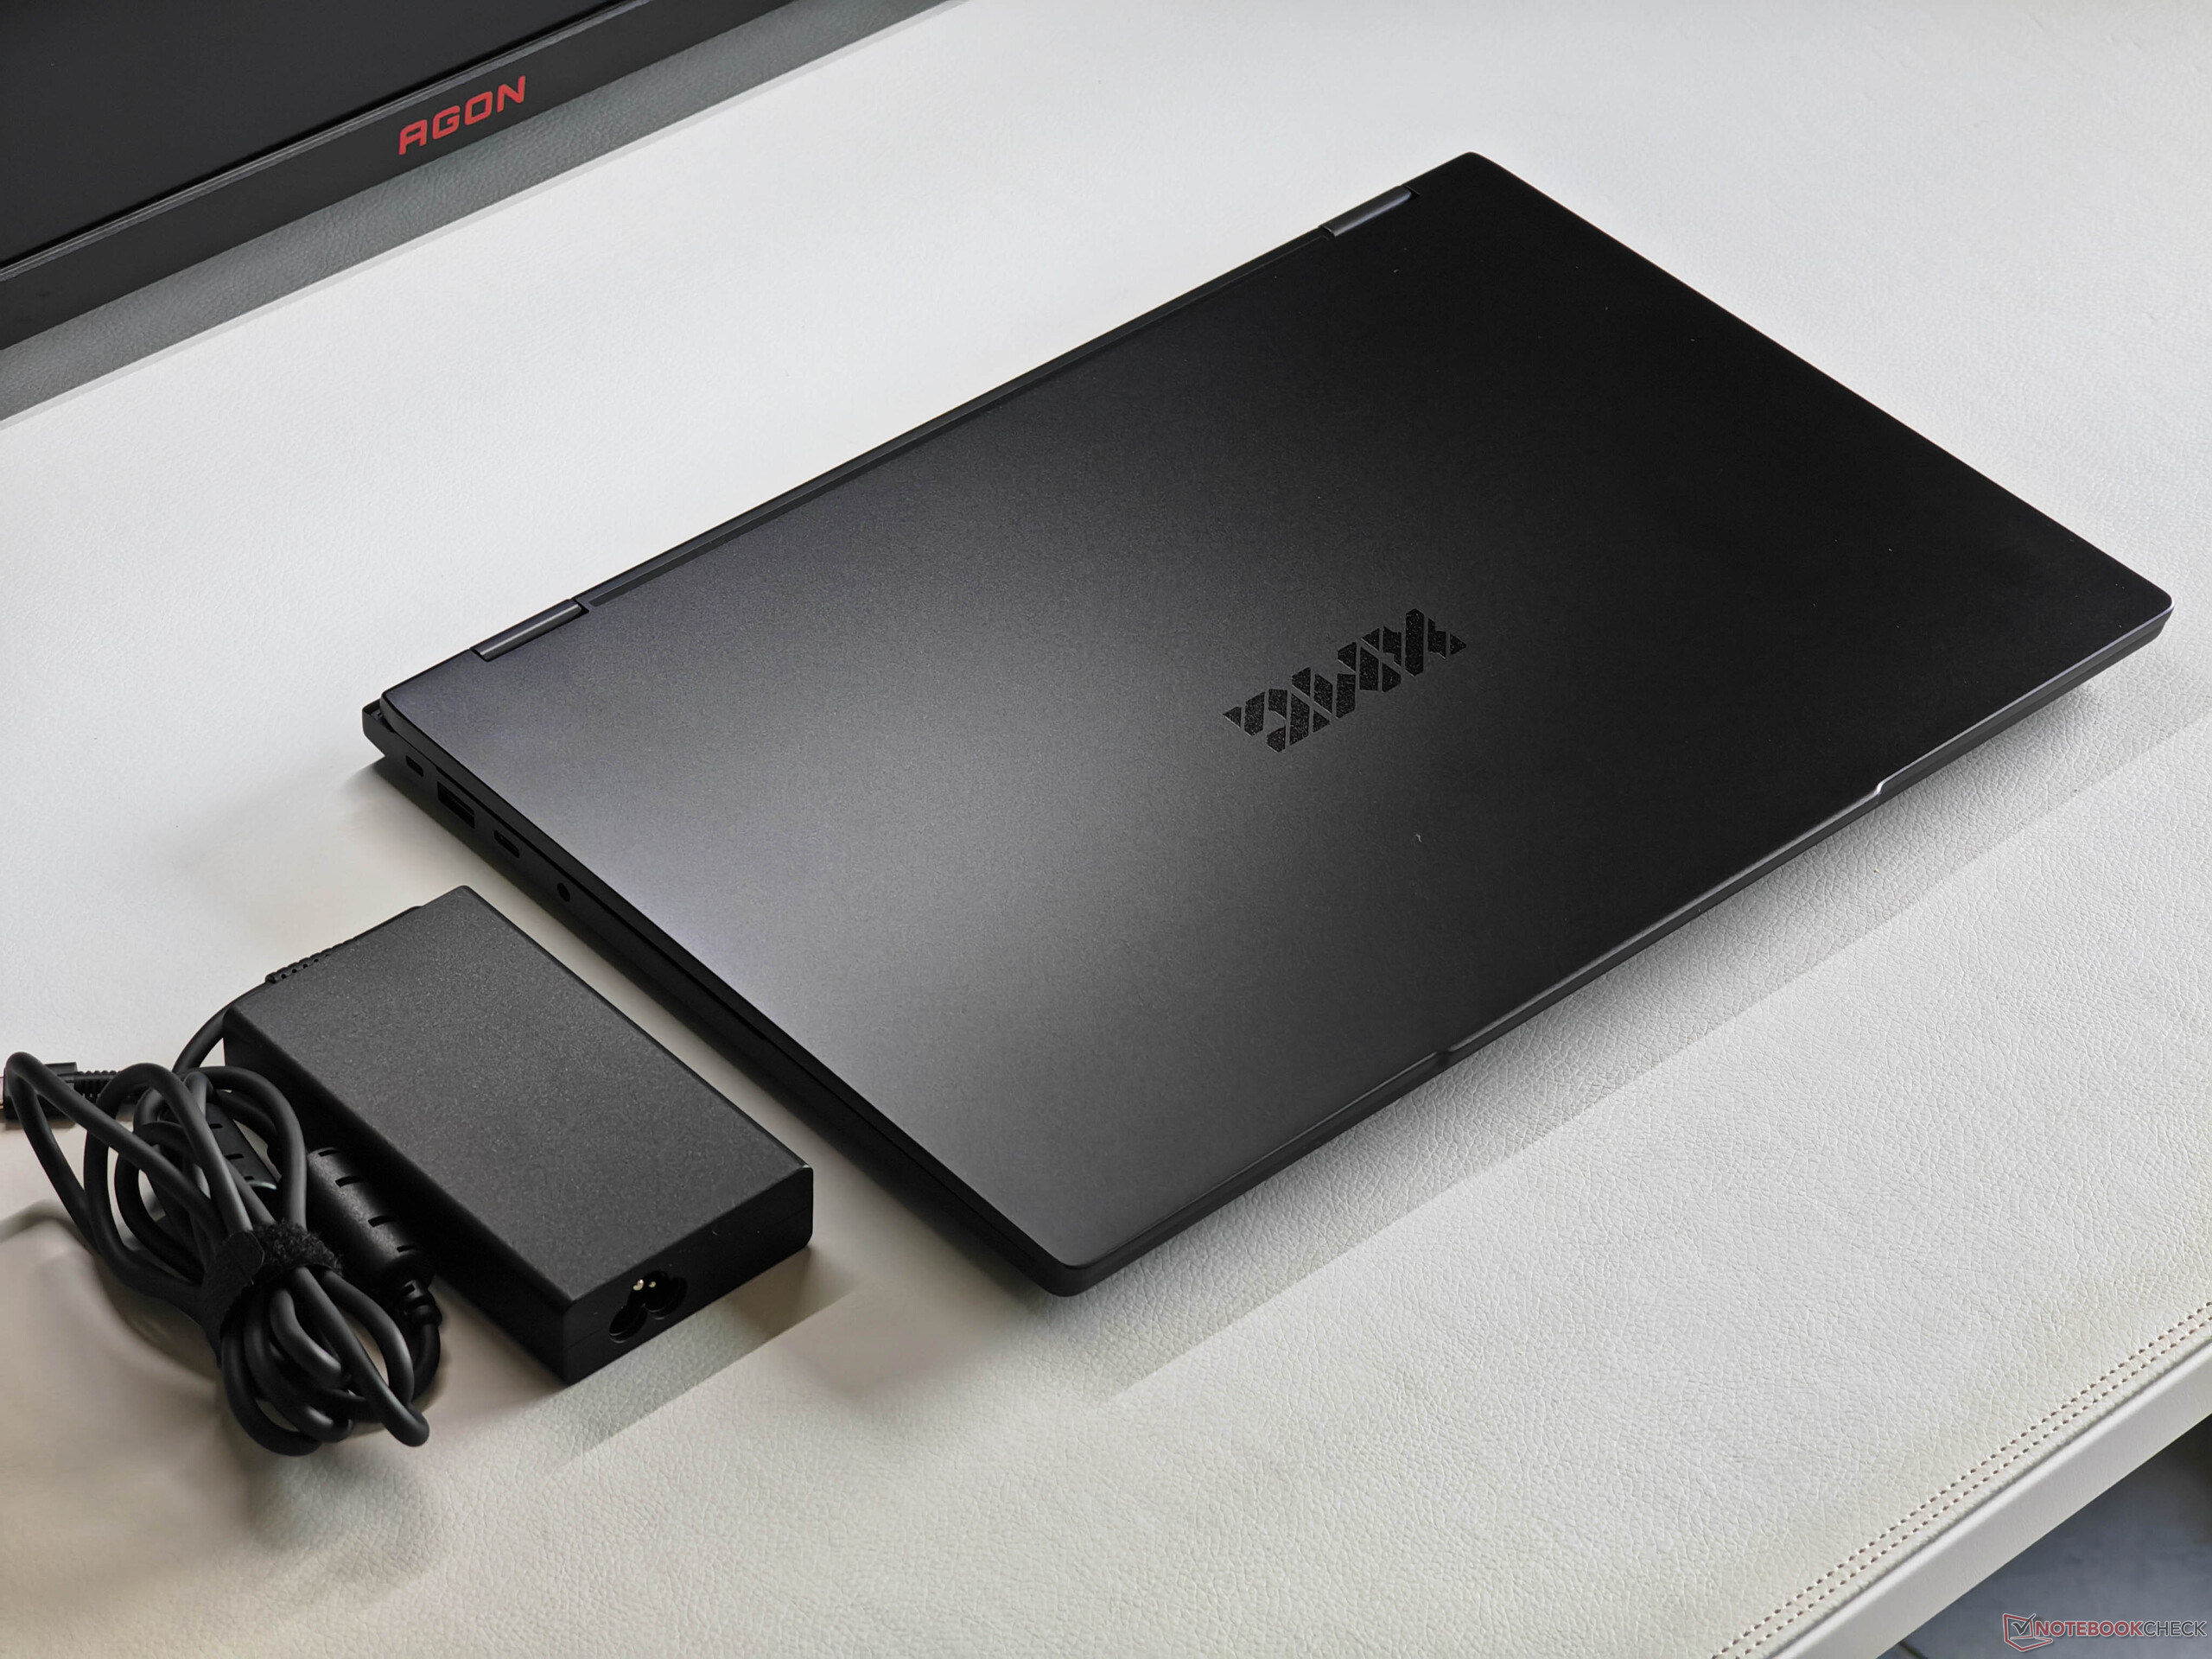
Maximum idle power consumption has increased by around 2 watts compared to the previous model. In the stress test, we measured a peak of 132.9 watts, and by the end of the test it was still around 125 watts. The included 150-watt power adapter is therefore sufficient.
| Off / Standby | |
| Idle | |
| Load |
|
Key:
min: | |
| Schenker XMG Evo 15 (M25) Ultra 7 255H, Arc 140T, Samsung 990 Pro 2 TB MZVL72T0HDLB, IPS, 2560x1600, 15.3" | Microsoft Surface Laptop 7 15 Lunar Lake Core Ultra 7 268V, Arc 140V, Samsung PM9C1a MZ9L81T0HDLB, IPS, 2496x1664, 15" | Apple MacBook Air 15 M4 M4 10-Core, M4 10-Core GPU, Apple SSD AP1024Z, IPS, 2880x1864, 15.3" | Lenovo ThinkPad X9-15 Aura Edition Core Ultra 7 258V, Arc 140V, WD PC SN740 SDDQMQD-1T00, OLED, 2880x1800, 15.3" | Lenovo Yoga Slim 7 15ILL9 Aura Core Ultra 7 256V, Arc 140V, , IPS, 2880x1800, 15.3" | Schenker XMG Evo 15 (M24) Ultra 7 155H, Arc 8-Core, Samsung 990 Pro 1 TB, IPS, 2560x1600, 15.3" | Average Intel Arc Graphics 140T | Average of class Multimedia | |
|---|---|---|---|---|---|---|---|---|
| Power Consumption | 46% | 56% | 59% | 46% | 15% | 29% | 24% | |
| Idle Minimum * (Watt) | 9.3 | 3.2 66% | 2.2 76% | 2.4 74% | 3.4 63% | 7.7 17% | 6.59 ? 29% | 5.72 ? 38% |
| Idle Average * (Watt) | 15.1 | 8.7 42% | 11.5 24% | 3.9 74% | 8.8 42% | 13.2 13% | 9.52 ? 37% | 10.2 ? 32% |
| Idle Maximum * (Watt) | 15.6 | 9 42% | 11.6 26% | 5.1 67% | 9.3 40% | 13.7 12% | 12.9 ? 17% | 12.4 ? 21% |
| Load Average * (Watt) | 77.5 | 44.7 42% | 34.5 55% | 42.5 45% | 45.4 41% | 76.2 2% | 57.7 ? 26% | 65.5 ? 15% |
| Cyberpunk 2077 ultra external monitor * (Watt) | 80.9 | 49.3 39% | 26.2 68% | 40.2 50% | 44.8 45% | 72.7 10% | ||
| Cyberpunk 2077 ultra * (Watt) | 86.9 | 51.1 41% | 24.4 72% | 43.5 50% | 49.4 43% | 76.7 12% | ||
| Load Maximum * (Watt) | 132.7 | 64.6 51% | 37.5 72% | 64.4 51% | 66.3 50% | 78.1 41% | 87.9 ? 34% | 114 ? 14% |
* ... smaller is better
energy consumption Cyberpunk / Stress test
energy consumption with external monitor
Battery life
In line with the increased idle power consumption, battery runtimes are also somewhat shorter than before. In the WLAN test, we now measured just over 9 hours at 150 cd/m² and around 7 hours at full brightness.

Notebookcheck overall rating
Schenker XMG Evo 15 (M25)
- 01/27/2026 v8
Andreas Osthoff
 Total Sustainability Score:
 Possible alternatives in comparison
Image | Model / Review | Price | Weight | Height | Display |
|---|---|---|---|---|---|
1. 85.2%  | Schenker XMG Evo 15 (M25) Intel Core Ultra 7 255H ⎘ Intel Arc Graphics 140T ⎘ 32 GB Memory, 2048 GB SSD | Amazon: | 1.8 kg | 22 mm | 15.30" 2560x1600 197 PPI IPS |
2. 87.4%  | Microsoft Surface Laptop 7 15 Lunar Lake Intel Core Ultra 7 268V ⎘ Intel Arc Graphics 140V ⎘ 32 GB Memory, 1024 GB SSD | Amazon: List Price: 2760€ | 1.7 kg | 18.3 mm | 15.00" 2496x1664 200 PPI IPS |
3. 91.2%  | Apple MacBook Air 15 M4 Apple M4 10-Core ⎘ Apple M4 10-core GPU ⎘ 16 GB Memory, 1024 GB SSD | Amazon: List Price: 1999€ | 1.5 kg | 11.5 mm | 15.30" 2880x1864 224 PPI IPS |
4. 90.1%  | Lenovo ThinkPad X9-15 Aura Edition Intel Core Ultra 7 258V ⎘ Intel Arc Graphics 140V ⎘ 32 GB Memory, 1024 GB SSD | Amazon: List Price: 1989€ | 1.4 kg | 17.7 mm | 15.30" 2880x1800 222 PPI OLED |
5. 84.3%  | Lenovo Yoga Slim 7 15ILL9 Aura Intel Core Ultra 7 256V ⎘ Intel Arc Graphics 140V ⎘ 16 GB Memory | Amazon: List Price: 1380 USD | 1.5 kg | 13.9 mm | 15.30" 2880x1800 222 PPI IPS |
Transparency
The selection of devices to be reviewed is made by our editorial team. The test sample was provided to the author as a loan by the manufacturer or retailer for the purpose of this review. The lender had no influence on this review, nor did the manufacturer receive a copy of this review before publication. There was no obligation to publish this review. As an independent media company, Notebookcheck is not subjected to the authority of manufacturers, retailers or publishers.
This is how Notebookcheck is testing
Every year, Notebookcheck independently reviews hundreds of laptops and smartphones using standardized procedures to ensure that all results are comparable. We have continuously developed our test methods for around 20 years and set industry standards in the process. In our test labs, high-quality measuring equipment is utilized by experienced technicians and editors. These tests involve a multi-stage validation process. Our complex rating system is based on hundreds of well-founded measurements and benchmarks, which maintains objectivity. Further information on our test methods can be found here.

