Apple MacBook Air 15 M4 review - The fanless M4 SoC is years ahead of the competition
More power, lower price.
Apple has given its MacBook Air 15 the lightning-fast M4 SoC, which is still cooled passively. It also features a new 12 MP webcam and a new colorway. However, its 60 Hz display remains unchanged and there is no matte option—but the Air is now $100 cheaper.Andreas Osthoff, 👁 Andreas Osthoff (translated by Daisy Dickson) Published 🇩🇪 🇫🇷 ...
Verdict - The MacBook Air 15 M4 offers more power for less money
Even with the new M4 processor, the MacBook Air 15 is still a very good overall package for everyday use, and its high CPU performance in combination with its passive cooling is particularly impressive. Even under constant load, the processor is still faster than Intel's Lunar Lake chips, for example, and in terms of single-core performance, the M4 generation is at least two generations ahead of the competition. There is simply no other device in the Windows world that is nearly as fast without a fan.
Other new features include Thunderbolt 4 support, including the use of two external displays, and an improved 12 MP webcam with Center Stage. Apple has also lowered its entry-level price by $100, but the high surcharges for RAM and SSD storage remain unchanged—as do the lack of available maintenance options.
Nothing has changed about its display either, which will likely disappoint some customers. If you want a matte screen or 120 Hz, you'll still have to switch to the bulkier and more expensive MacBook Pro. Even so, its IPS display still delivers excellent image quality without PWM. The IPS screen needs quite a lot of power—especially at high brightness levels—and overall, the laptop's battery life is still as good as ever. However, some competitors such as the ThinkPad X9 now have the upper hand in terms of both image quality and battery life.
The MacBook Air could certainly be even better, but you also have to consider its position in the lineup, as it is Apple's most affordable series. Plus, a MacBook Air 15 with a matte display and 120 Hz would naturally affect the sales figures of the MacBook Pro 14 M4.
Pros
Cons
Price and availability
You can order the new MacBook Air 15 M4 directly from Apple, with prices for the 15-inch model starting at $1,199. It's also available to purchase from other major online retailers such as Amazon.
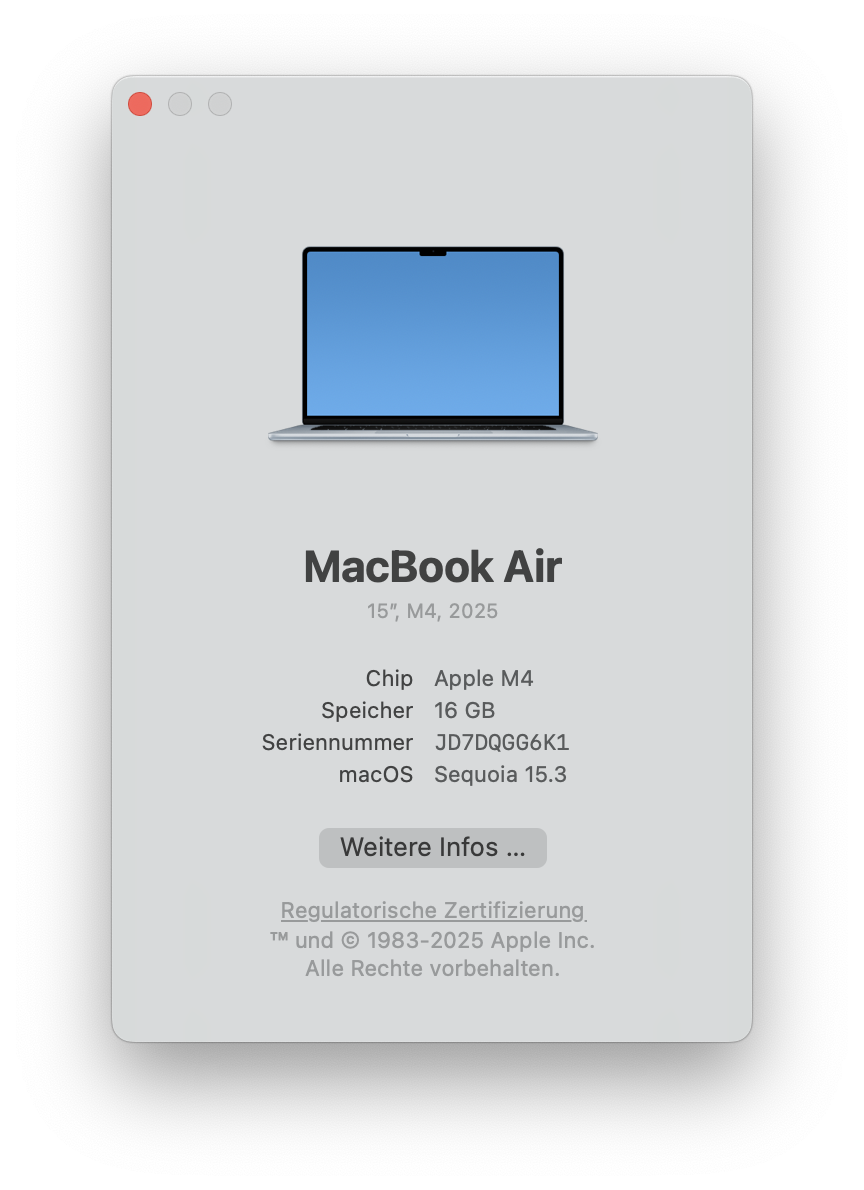
Apple has updated its MacBook Air lineup, now installing M4 processors into its laptops. The old M3 generation's RAM was already increased to at least 16 GB last year, but the M4 MacBook Air is now available with up to 32 GB RAM. Somewhat surprisingly, Apple has lowered the entry-level prices for both variants by $100 each; with 16 GB RAM and a 256-GB SSD, the MacBook Air 15 now starts at $1,199. Our test device with a 1 TB SSD and 16 GB RAM has an MRSP of $1,599.
Specifications
Case & connectivity
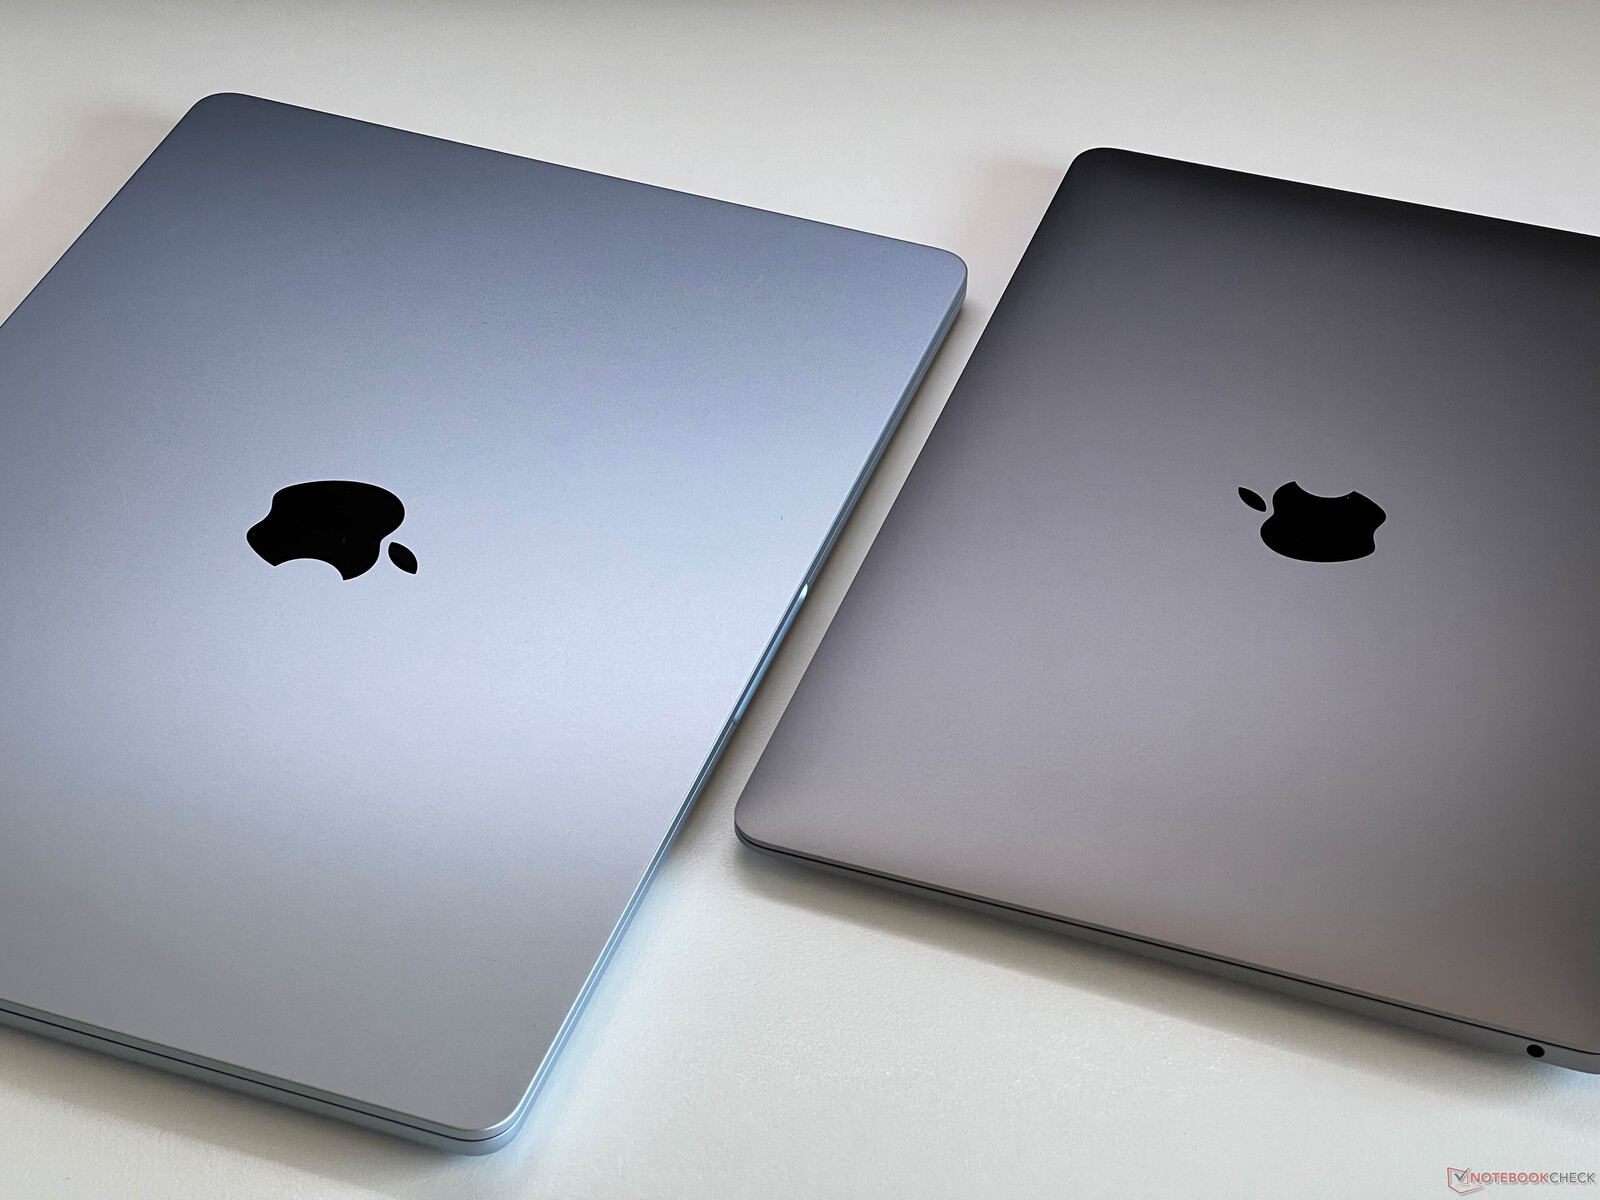
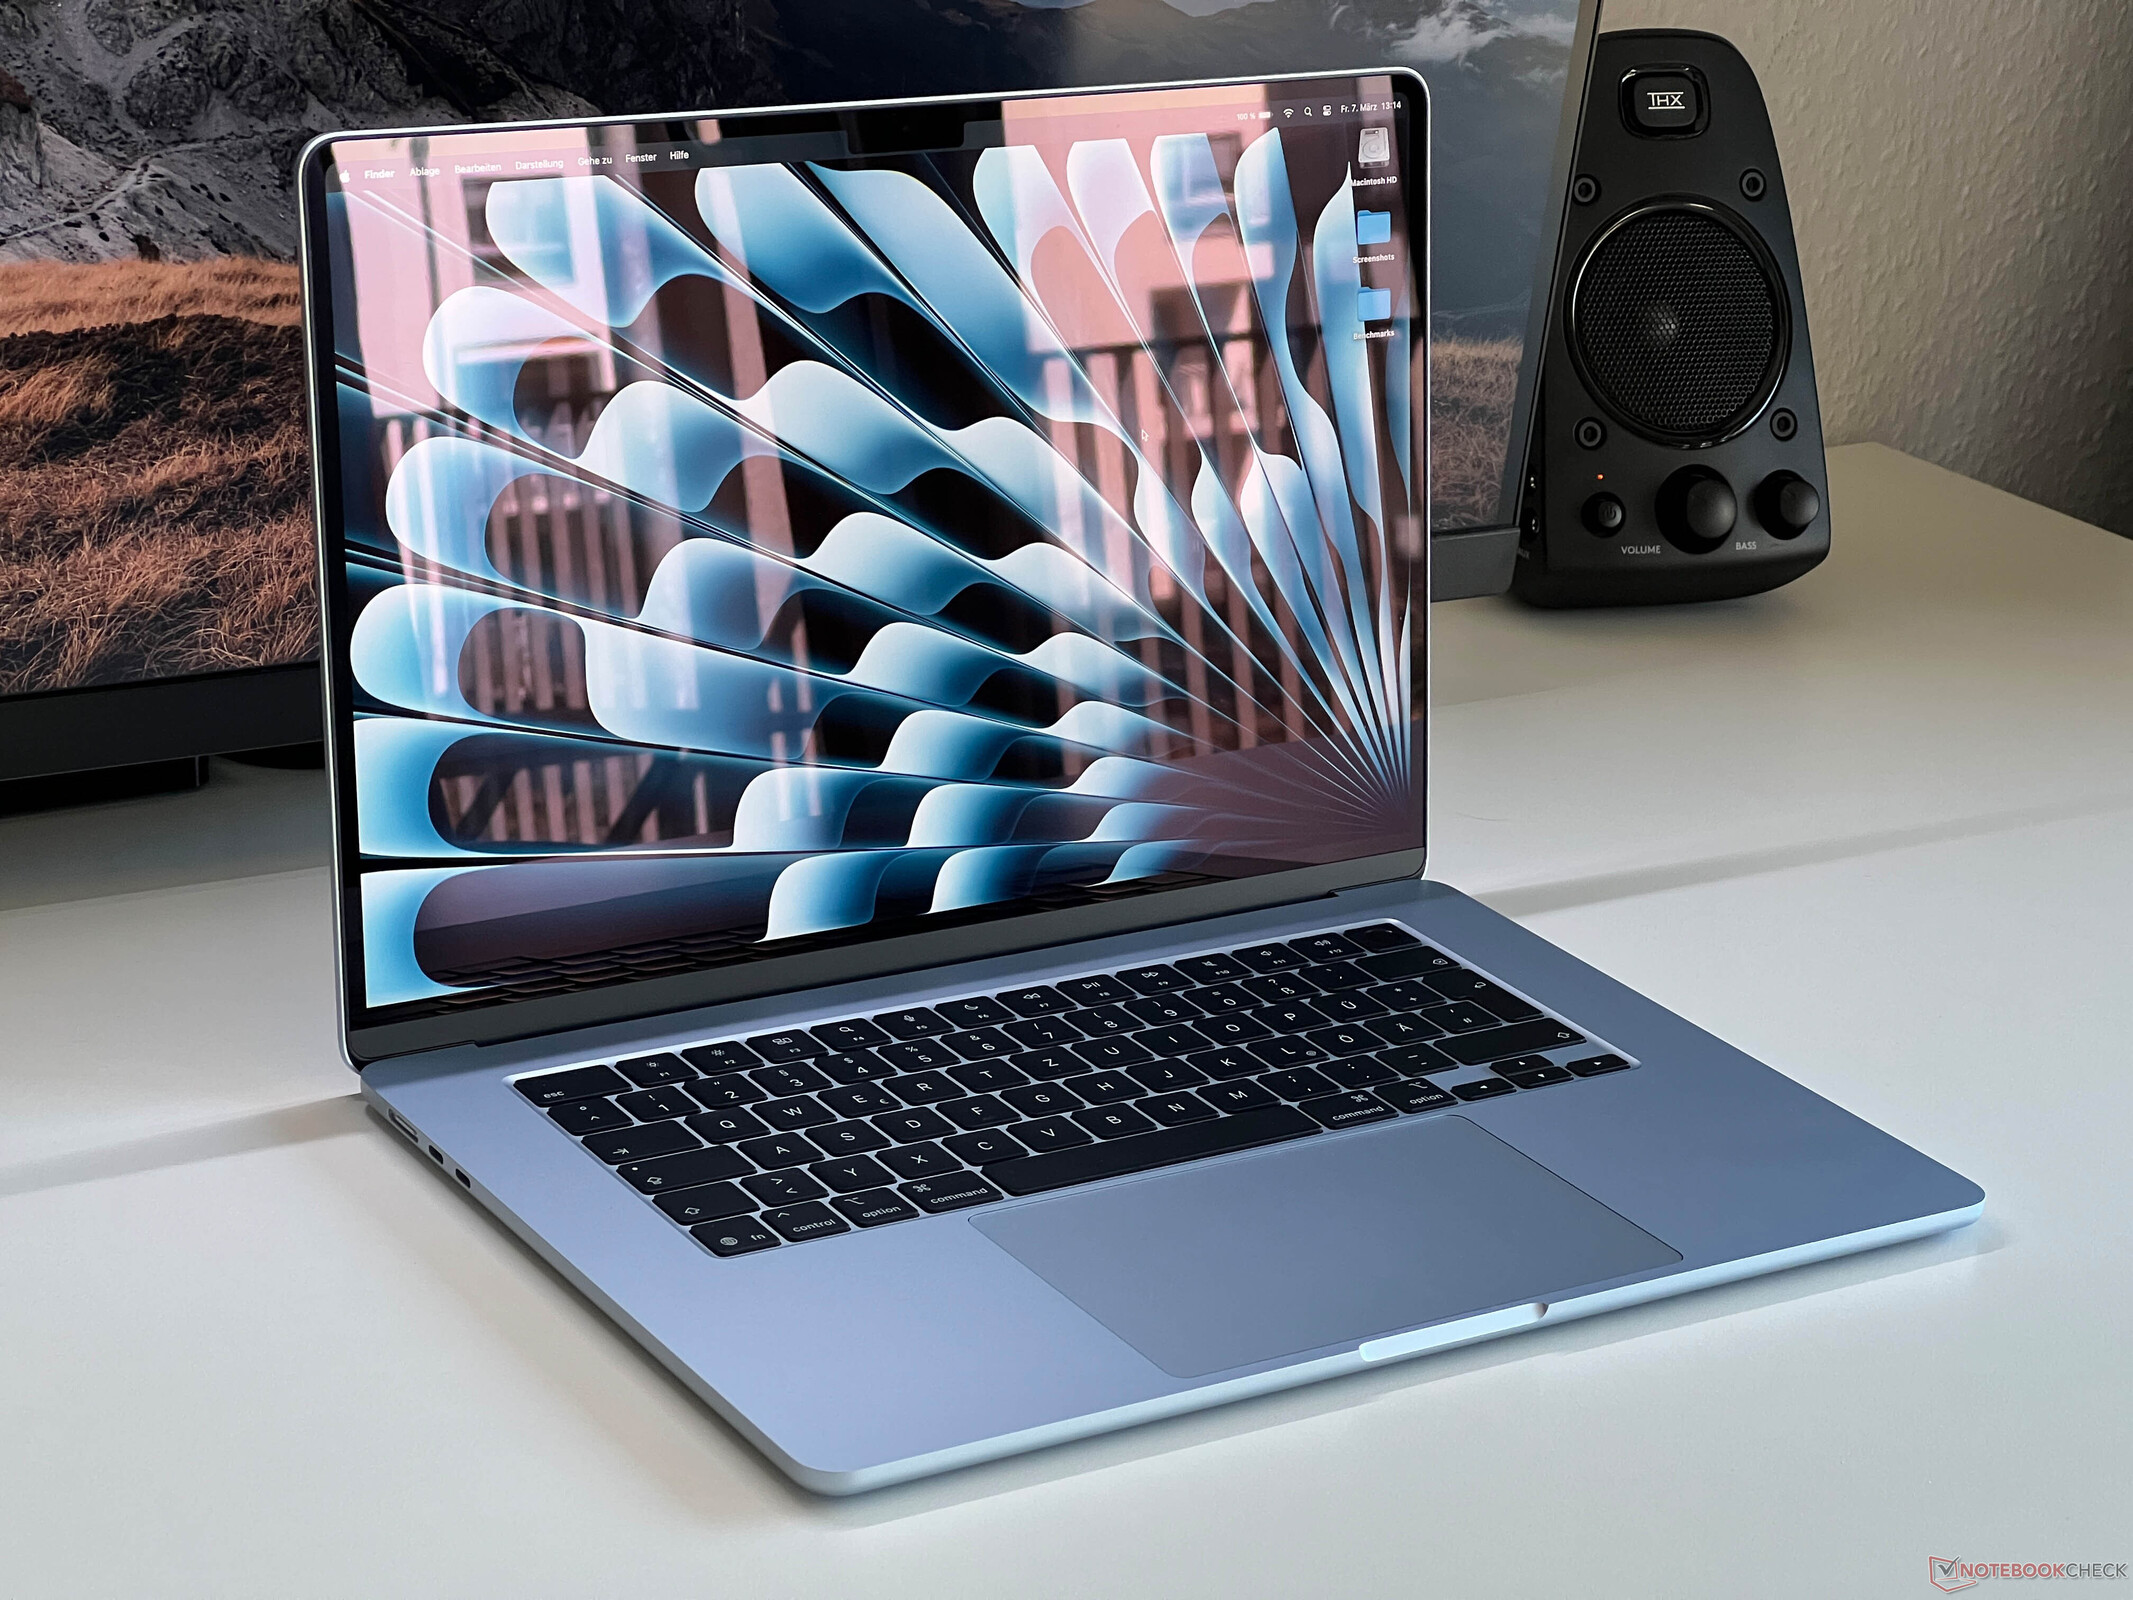
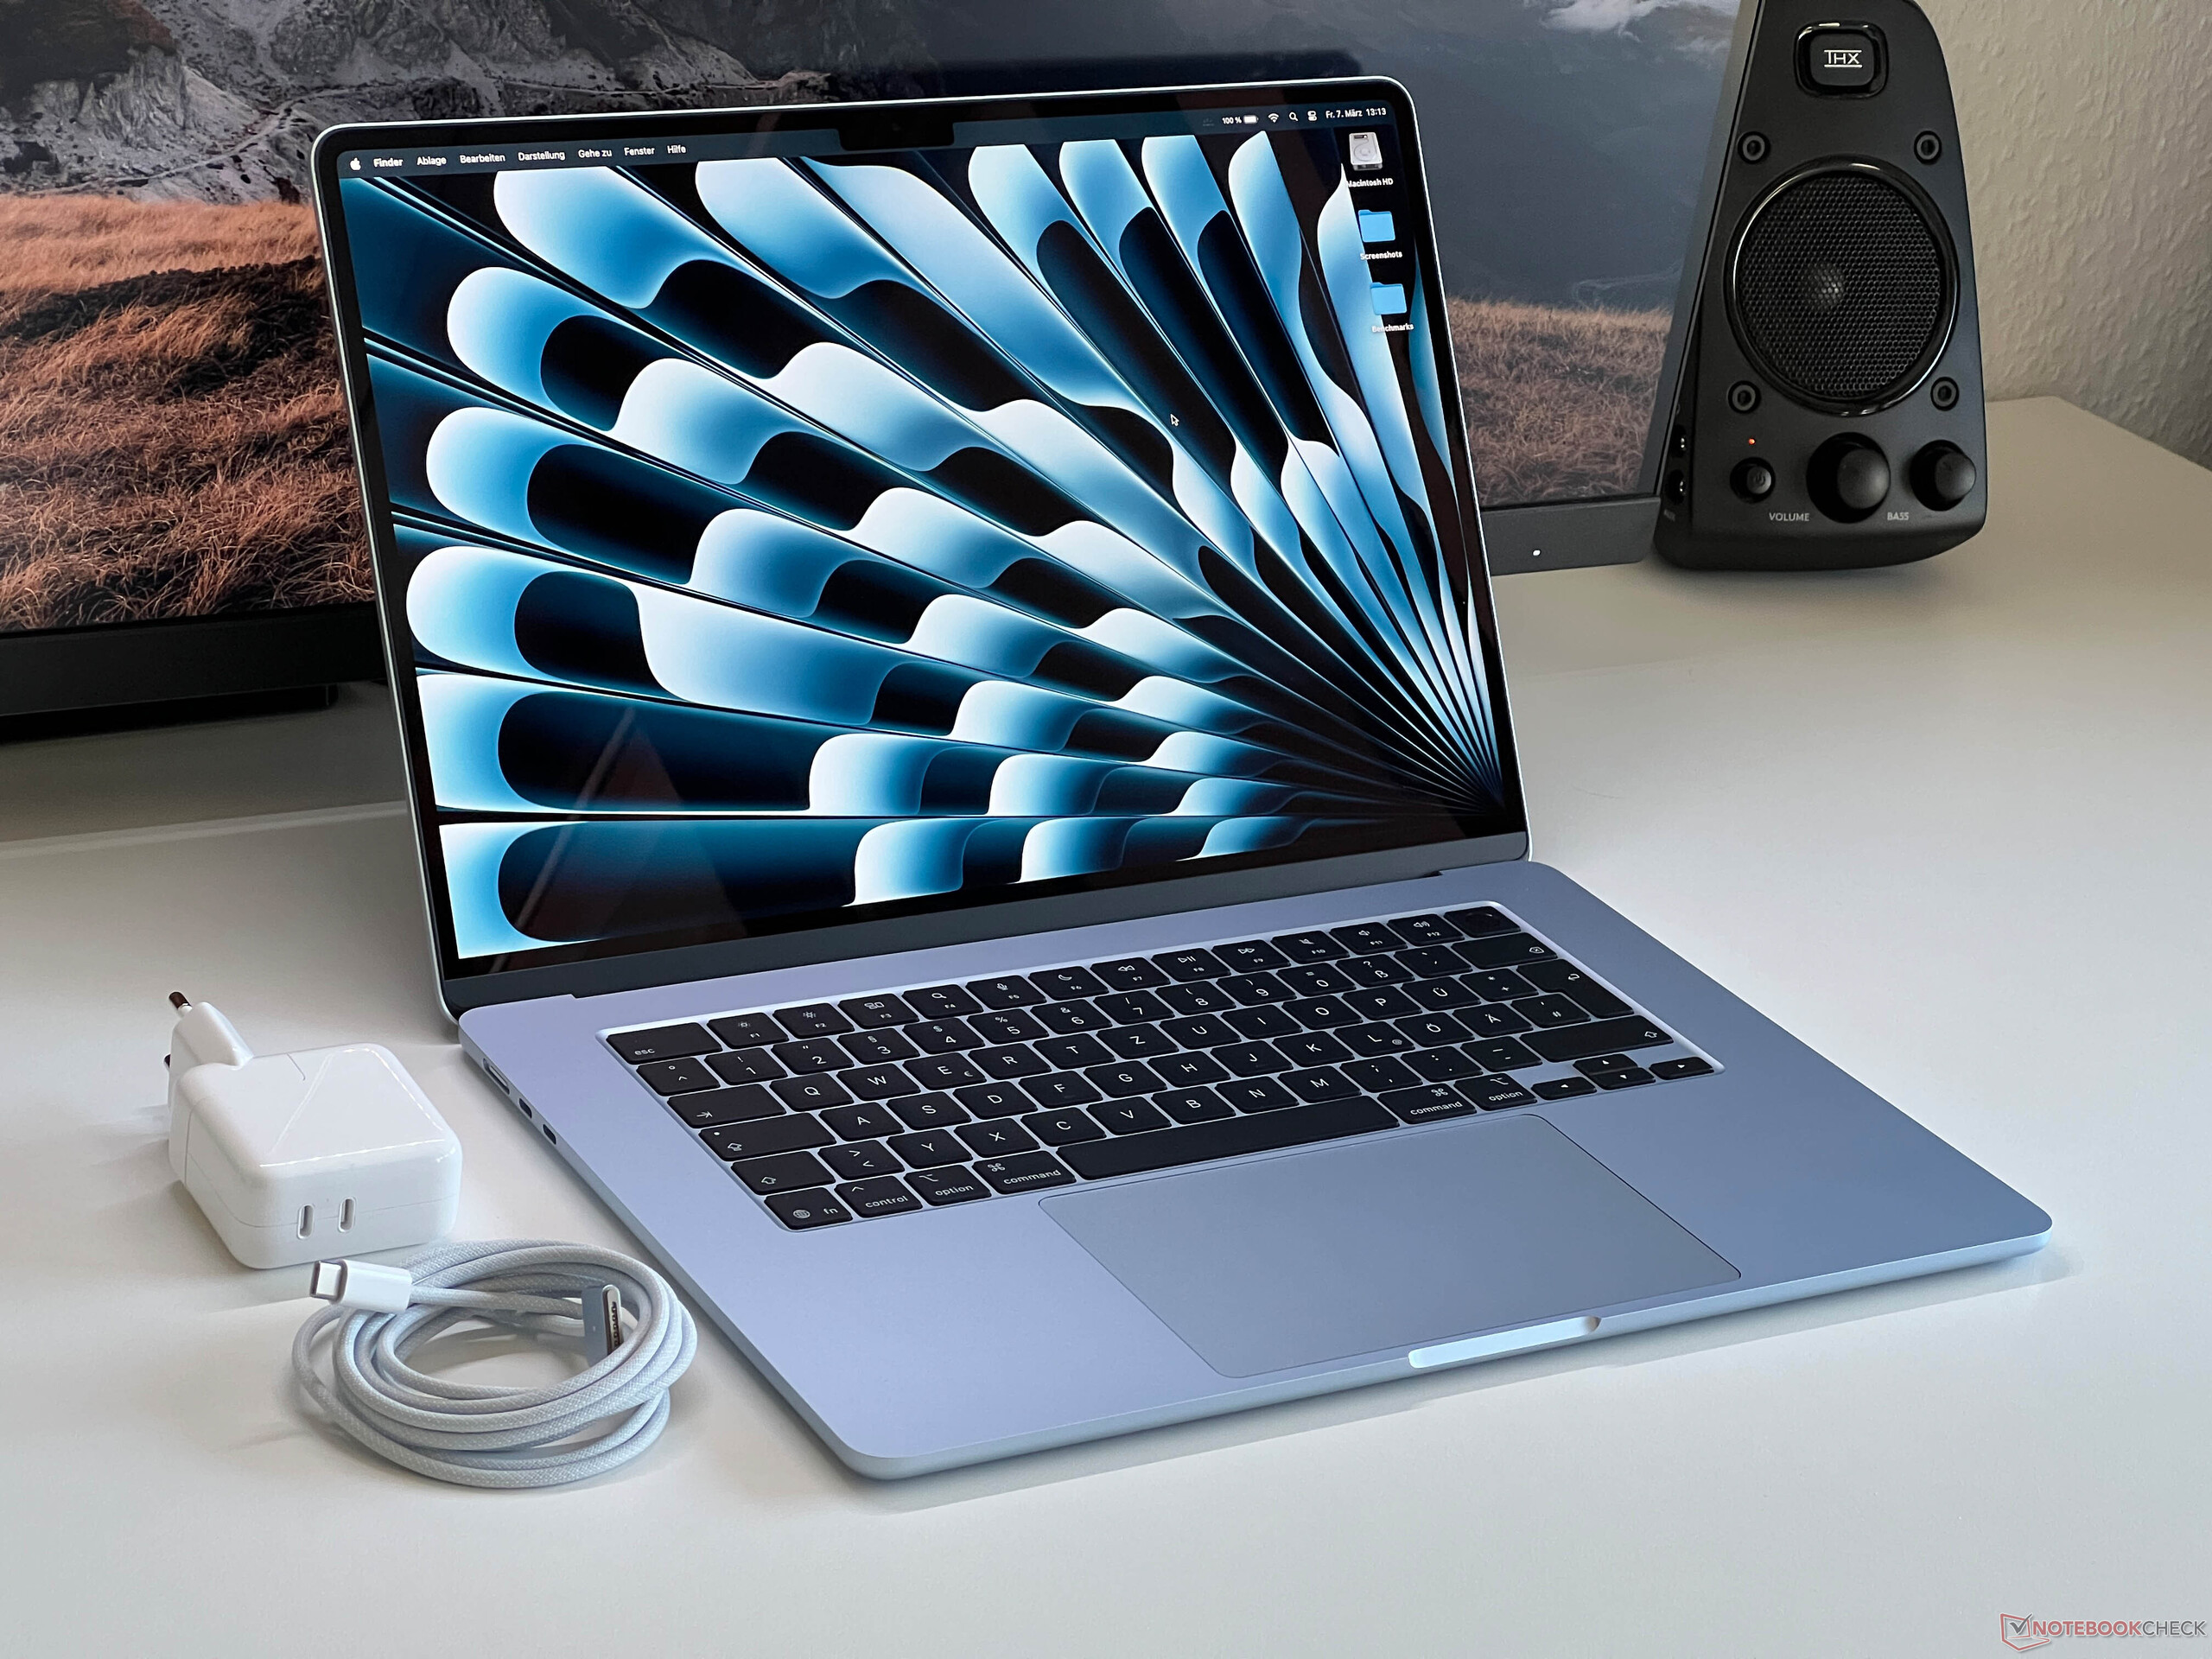
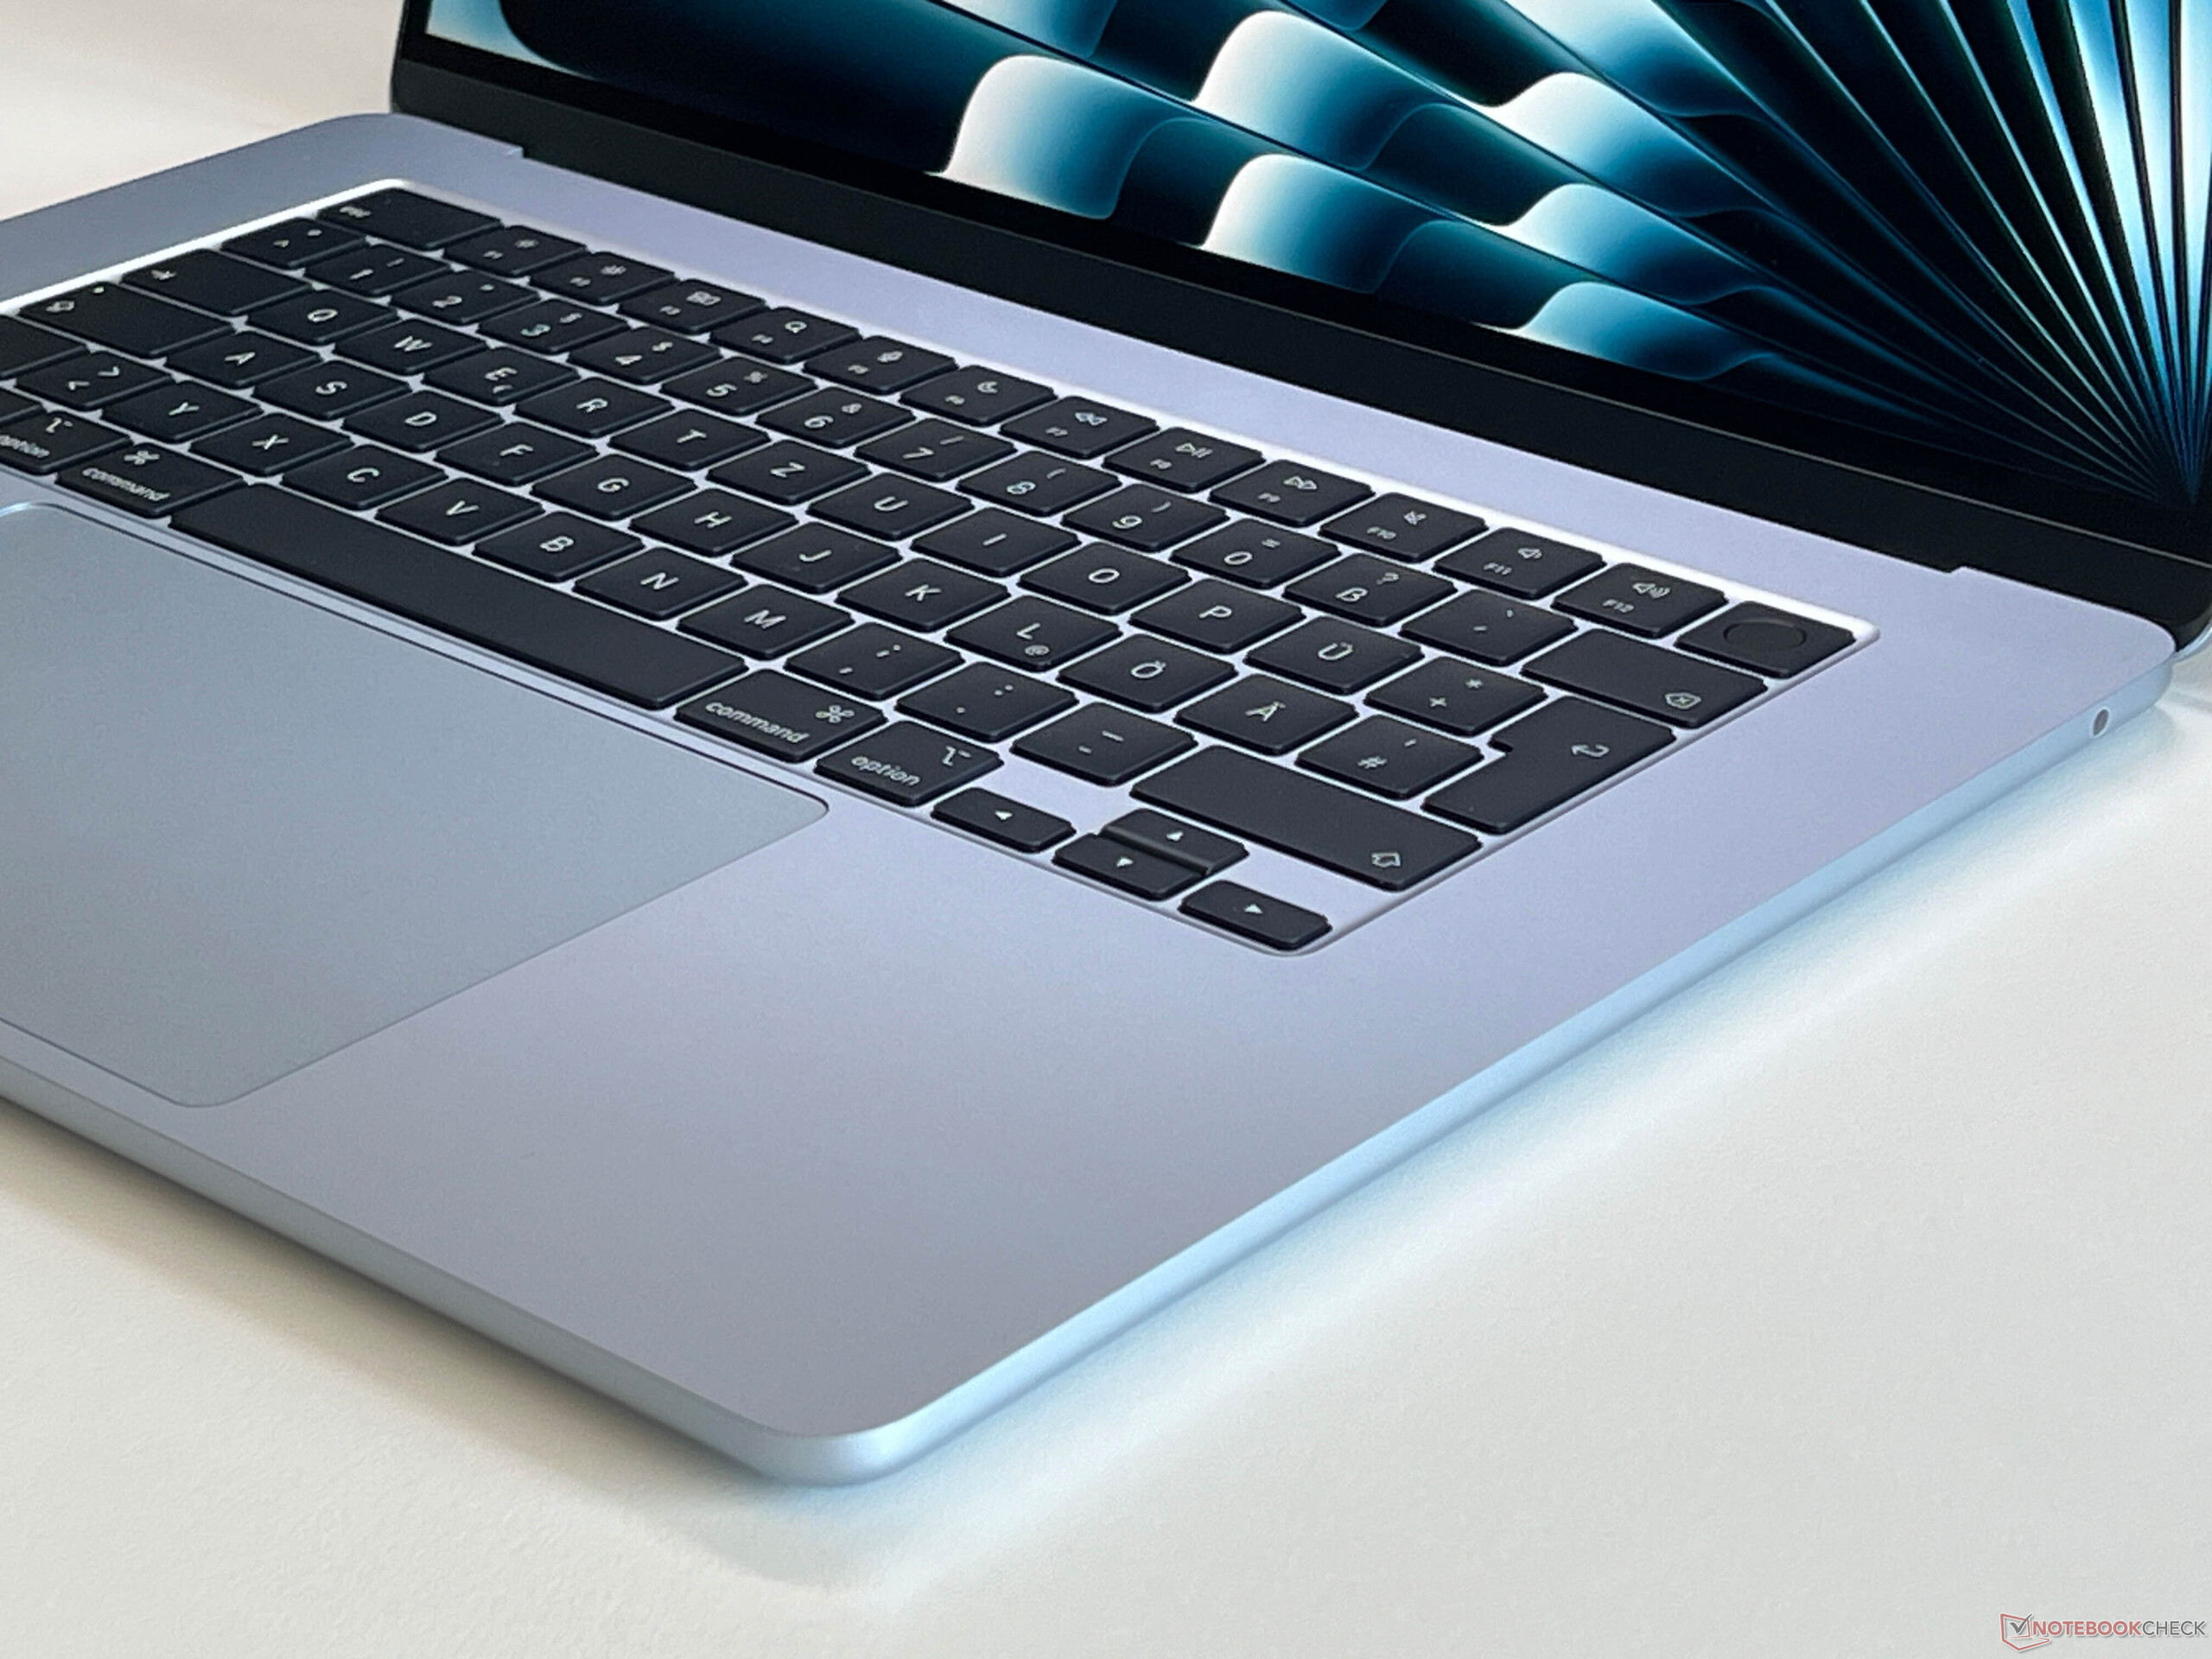
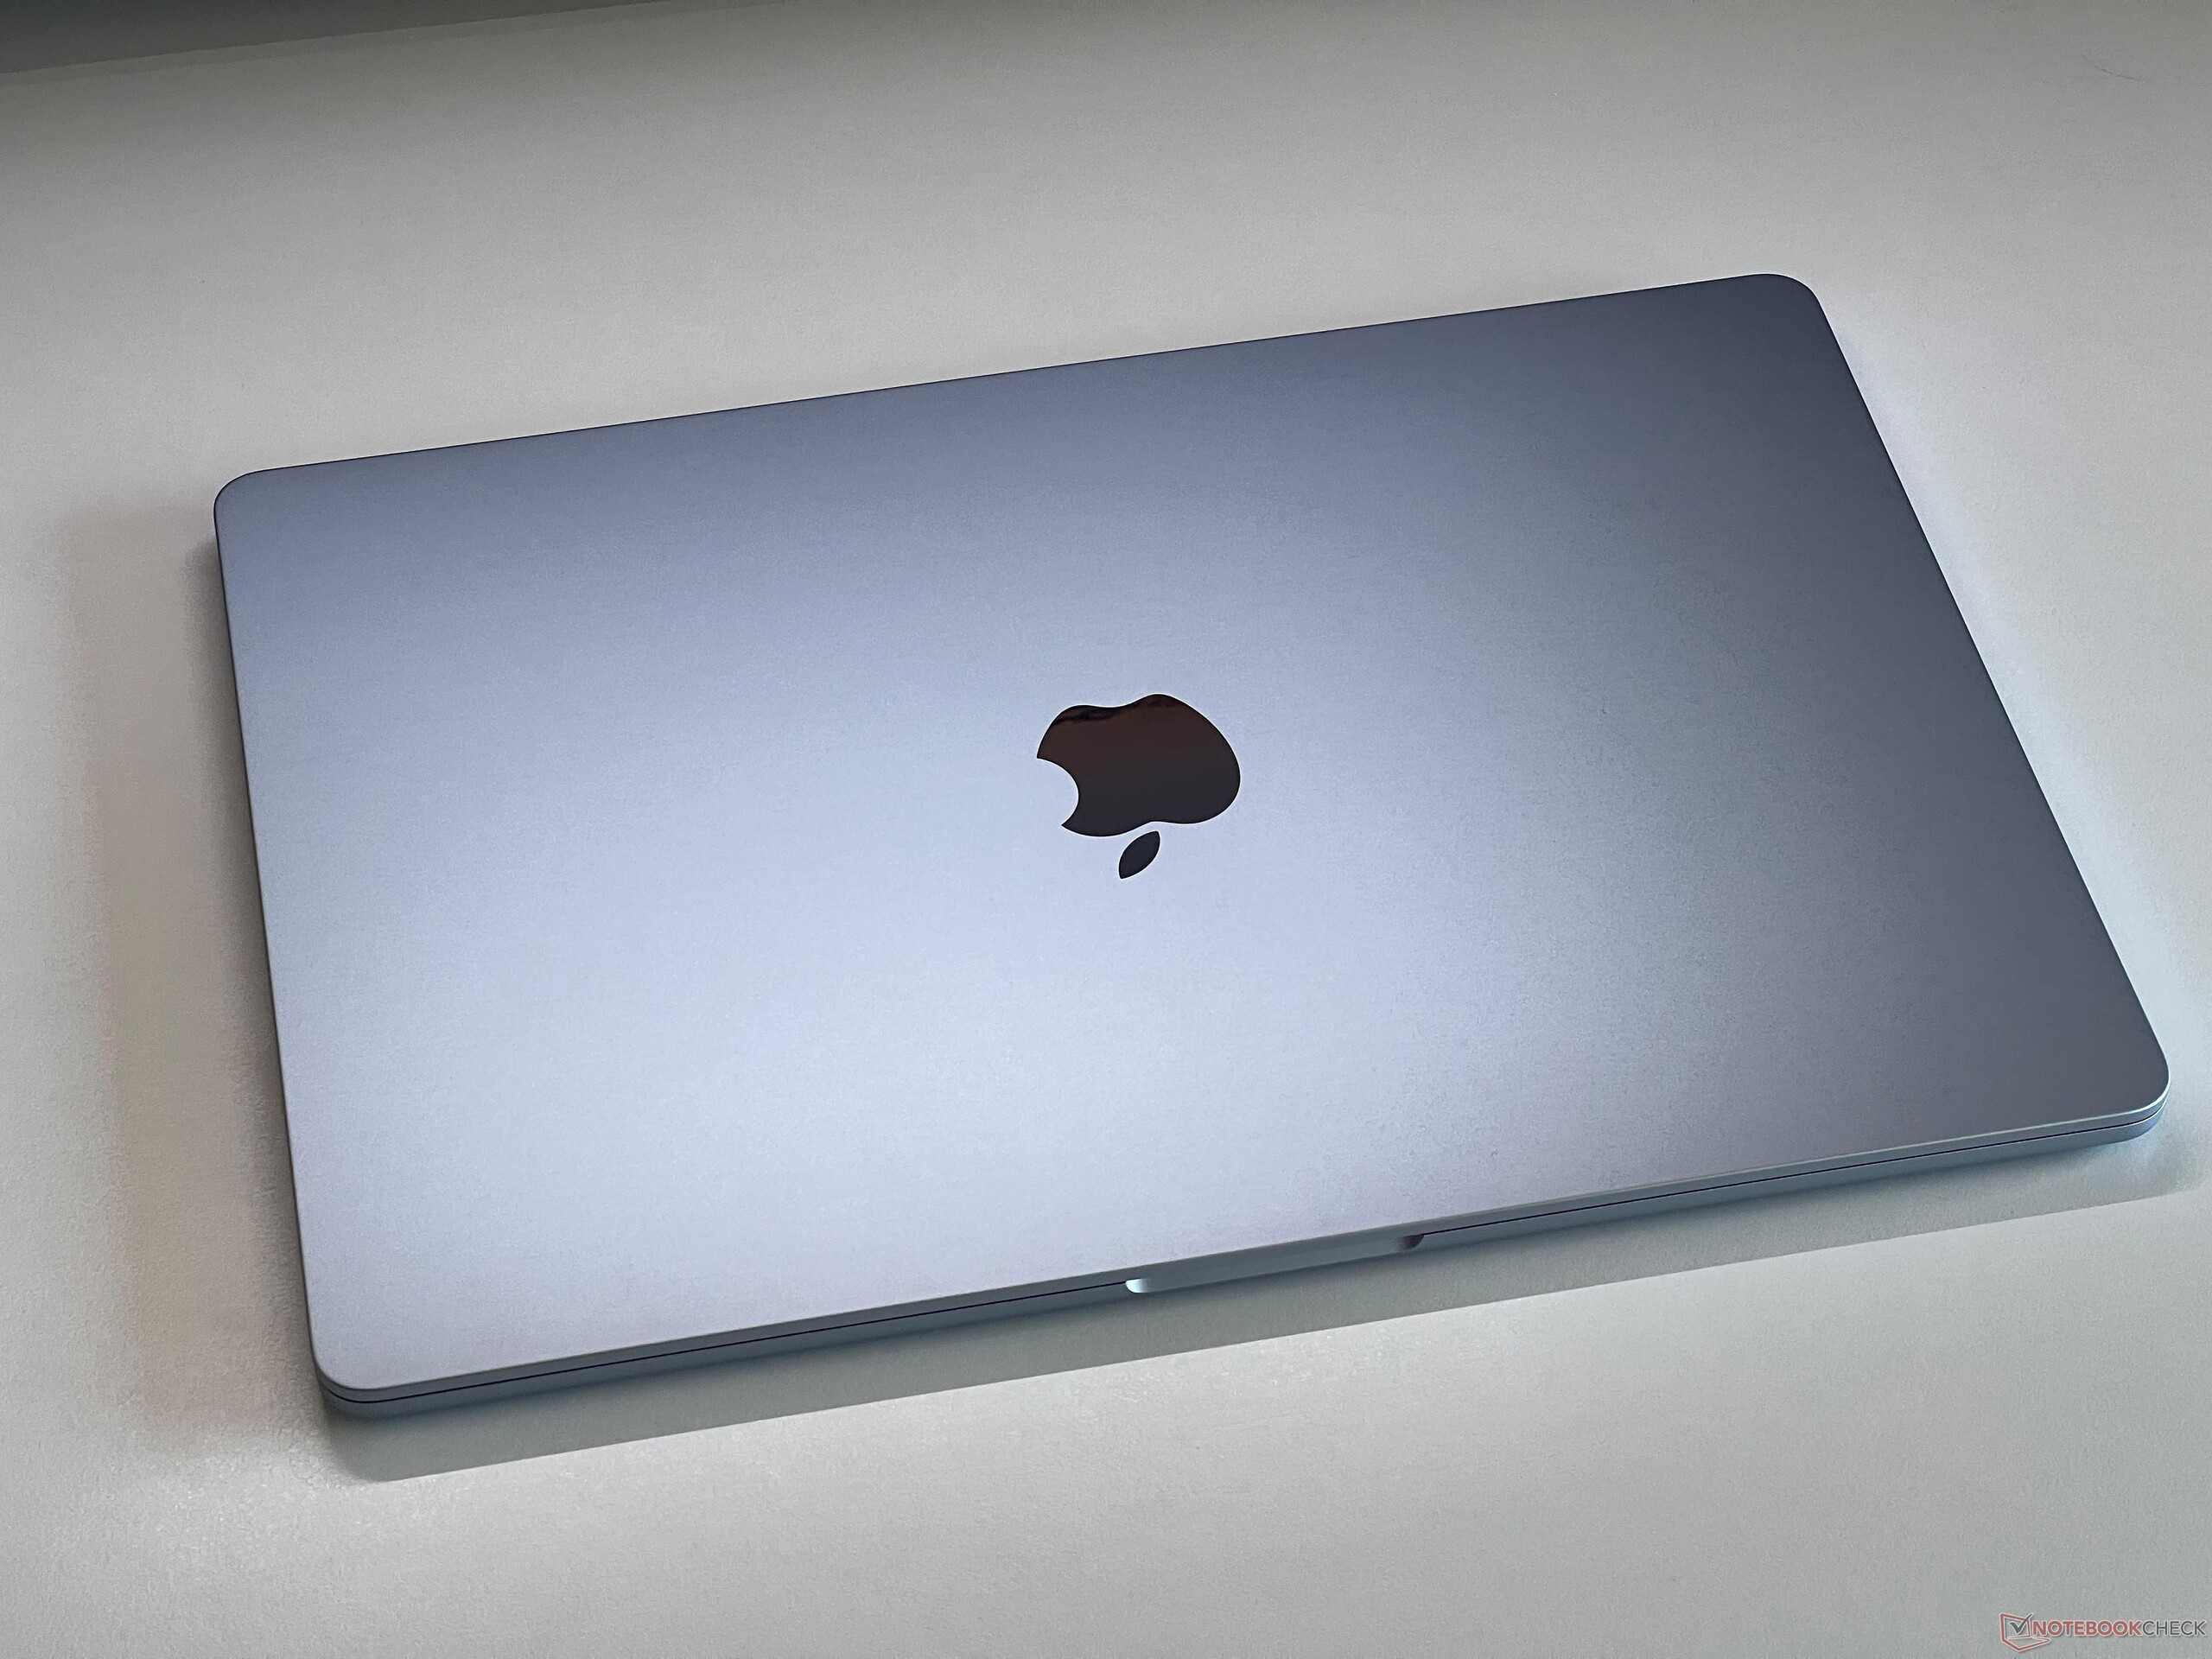
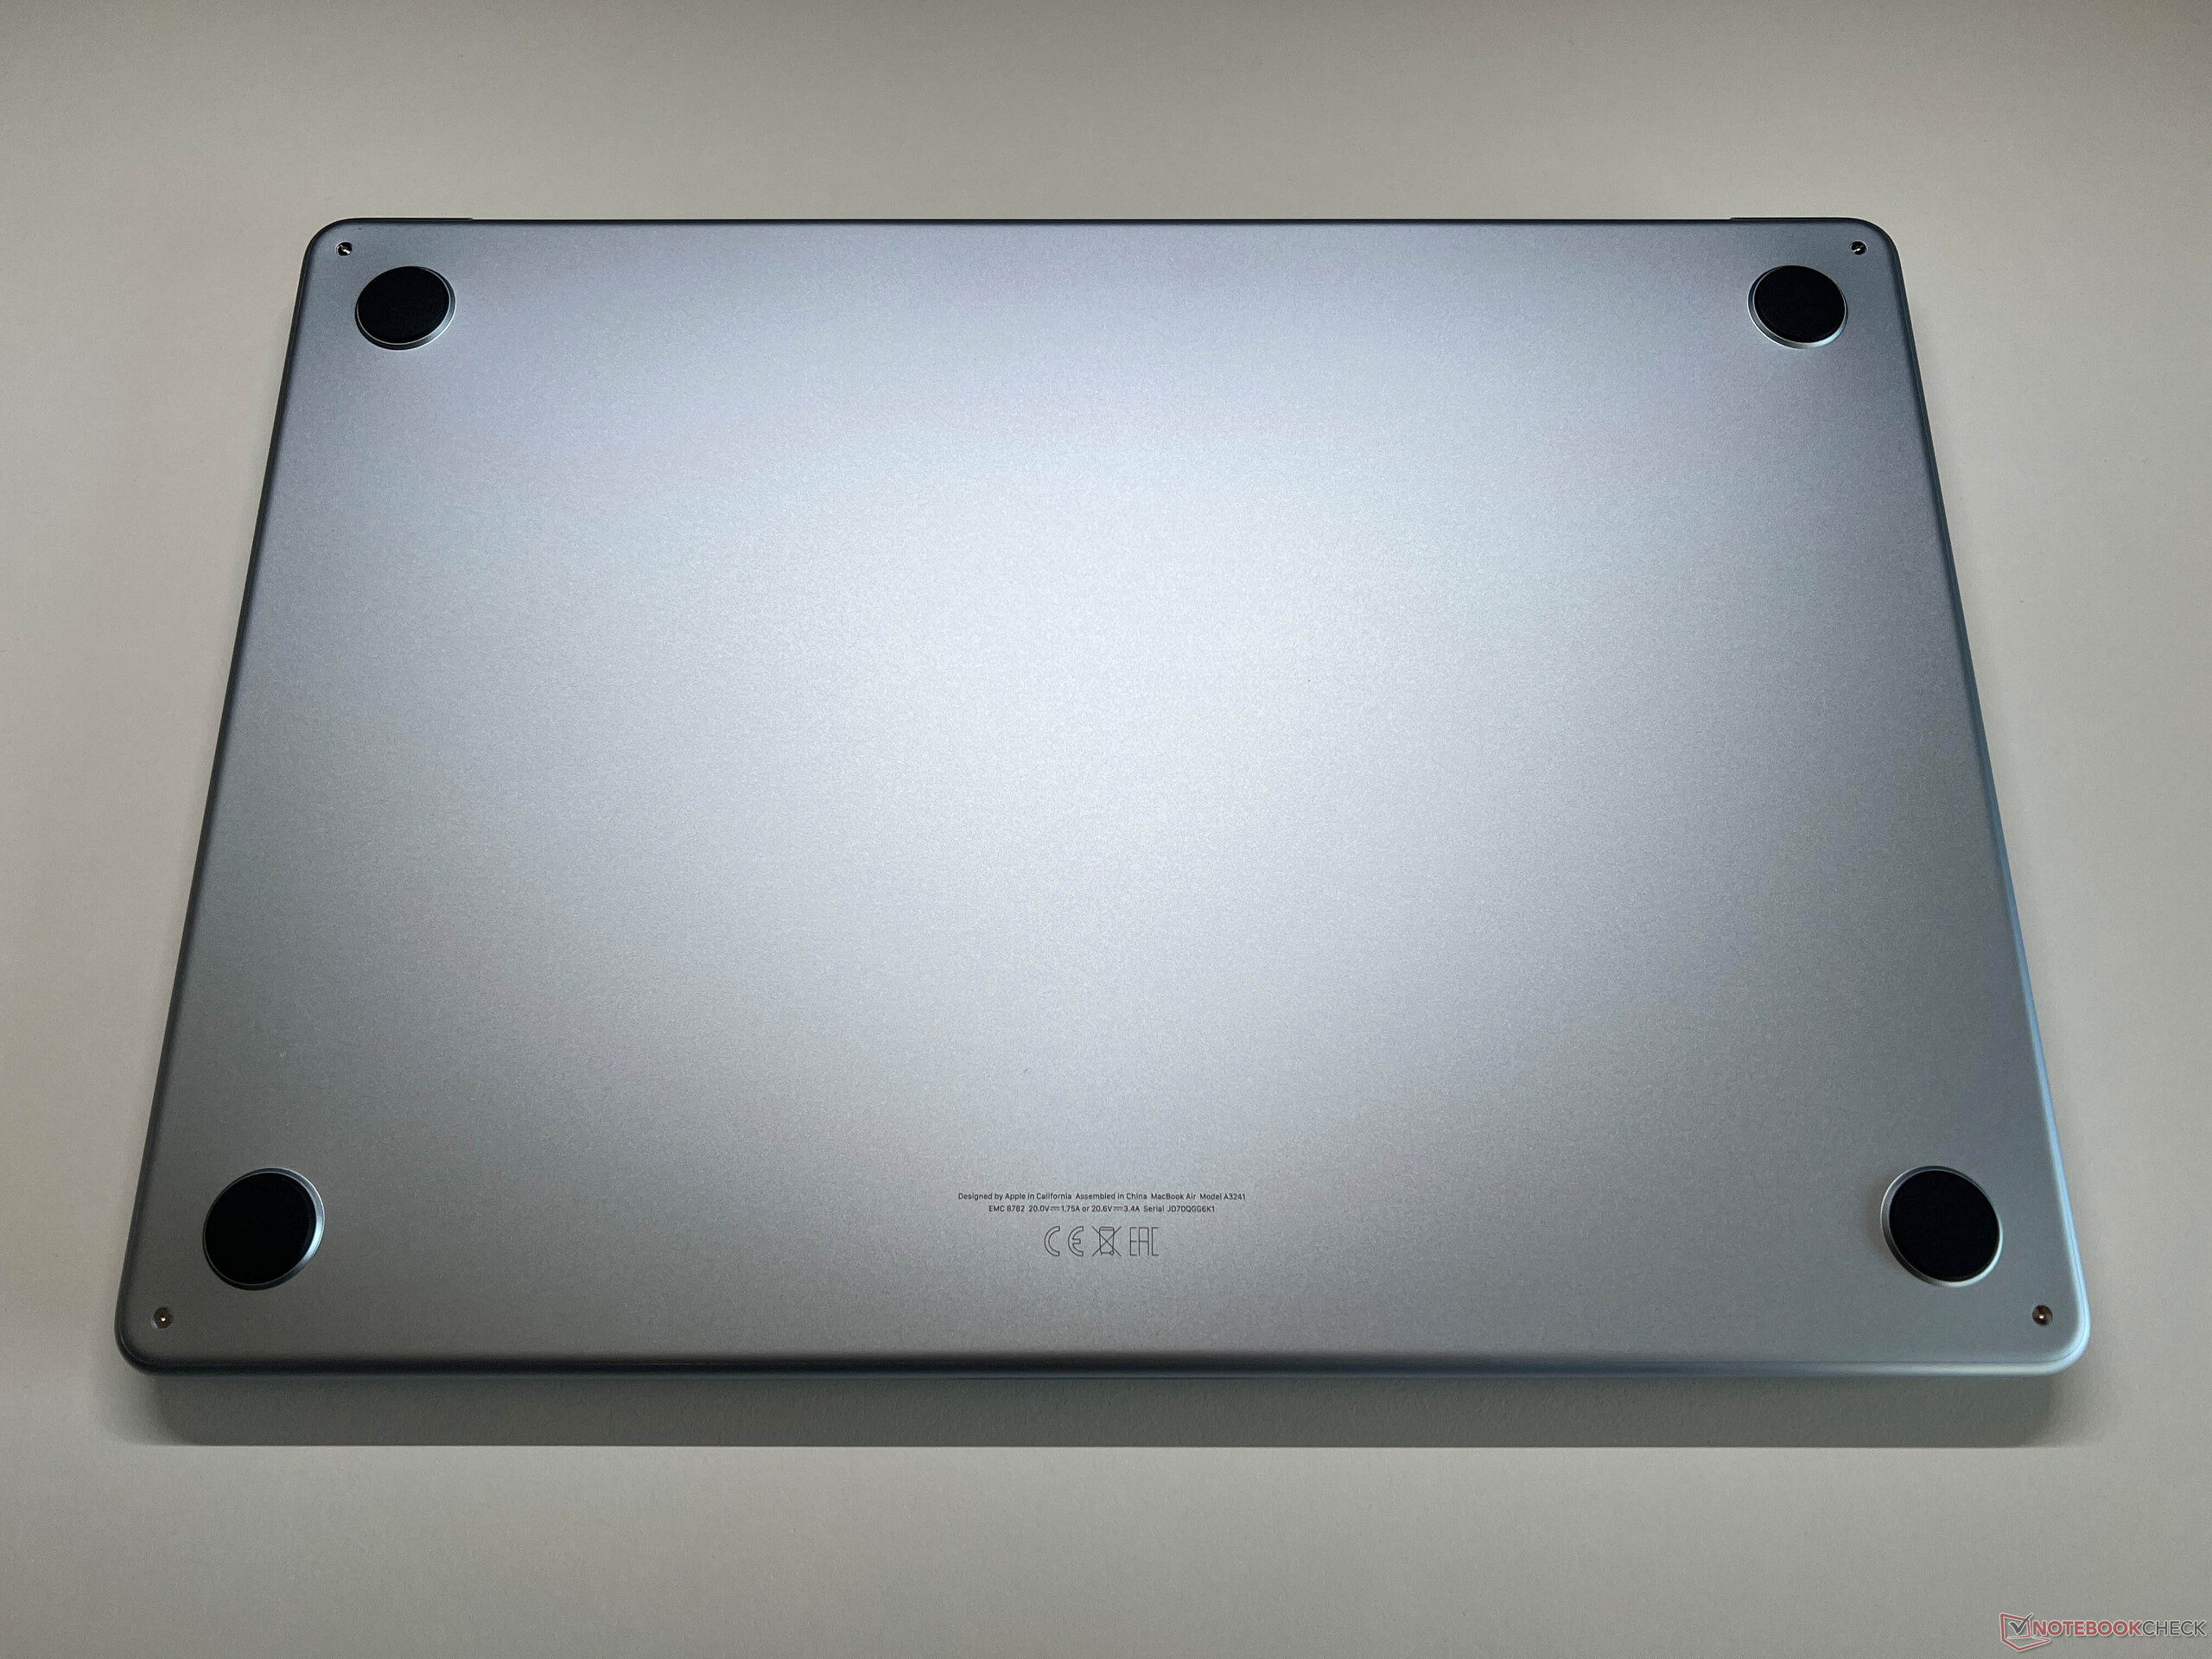
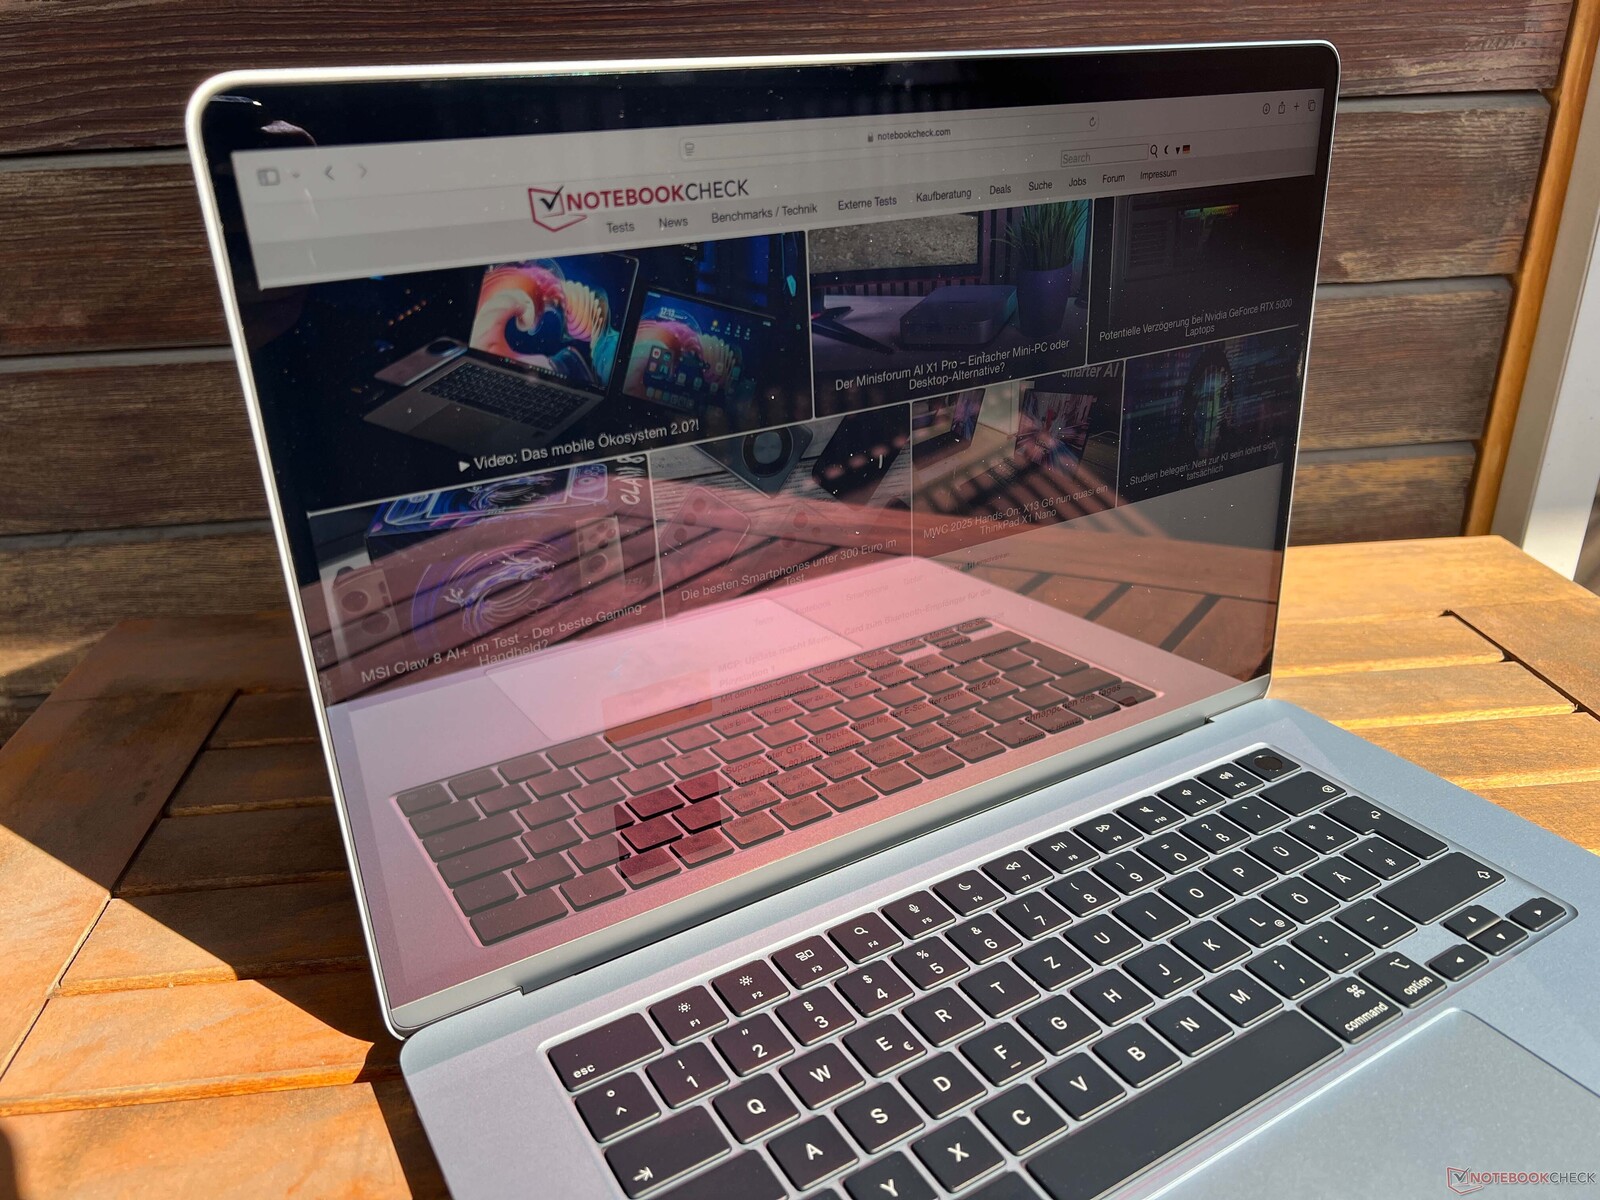
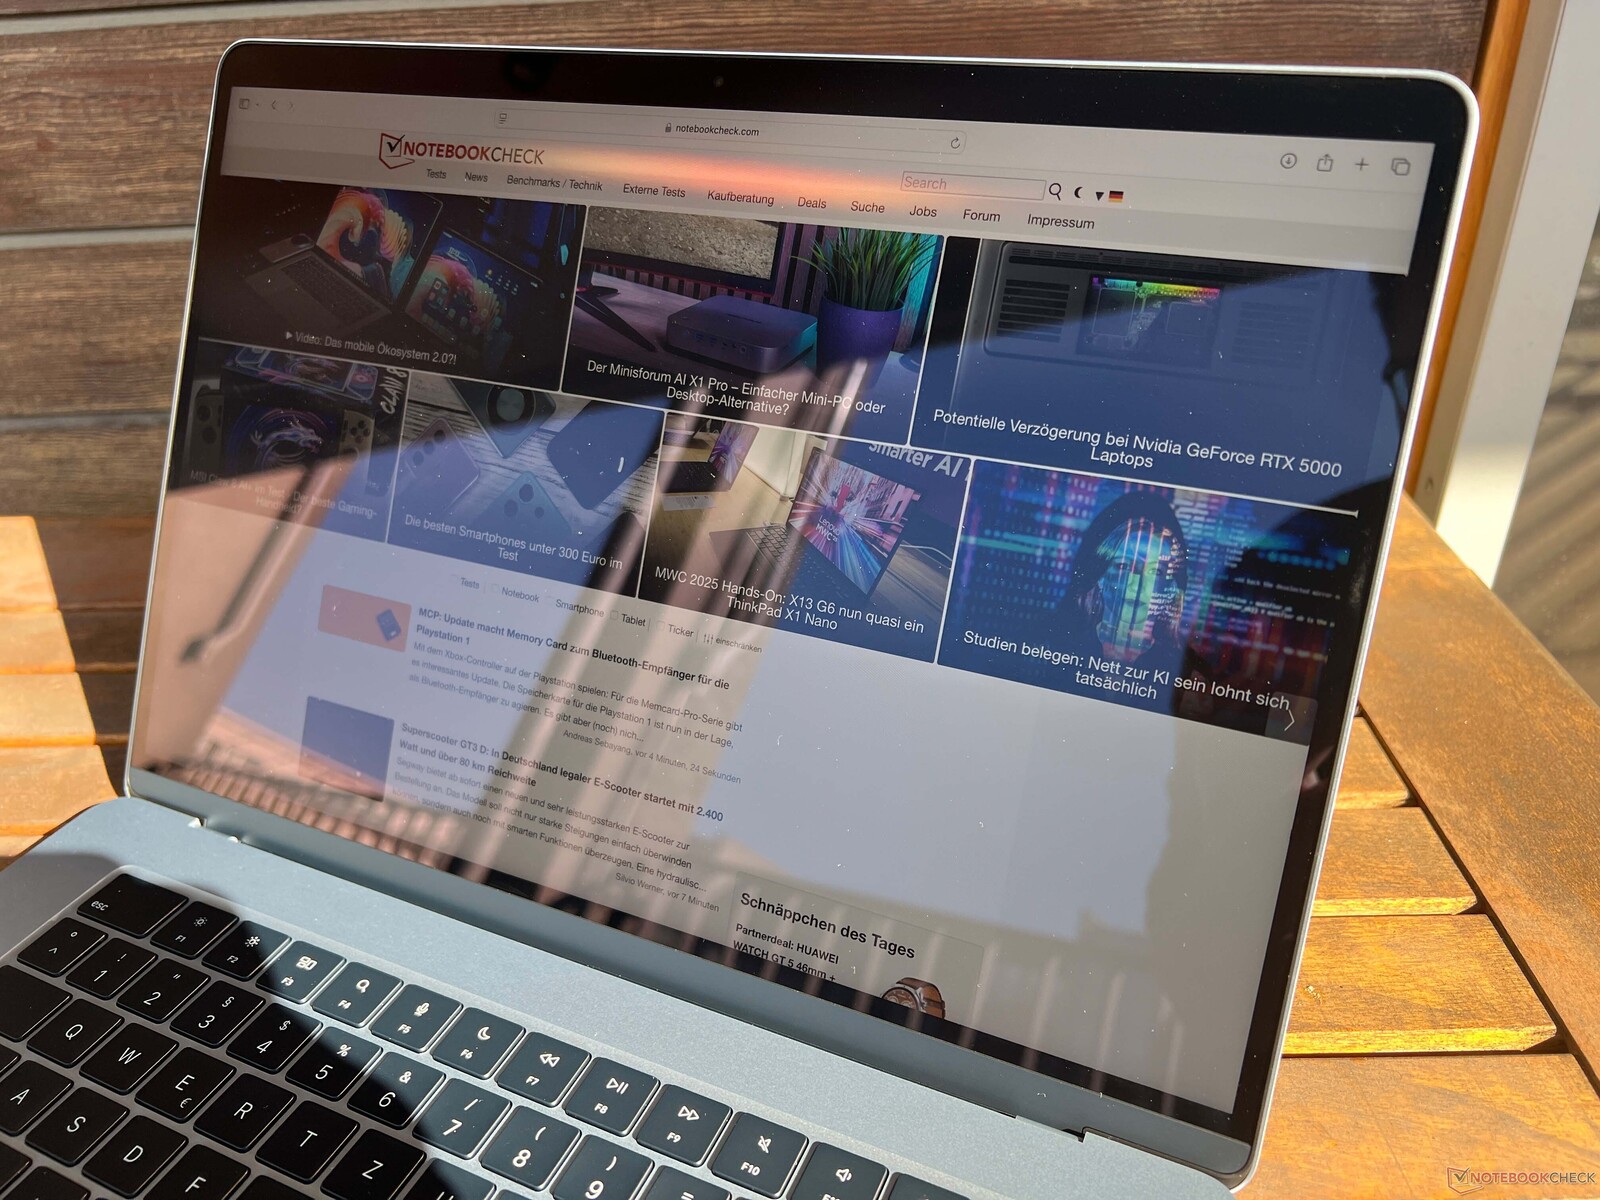
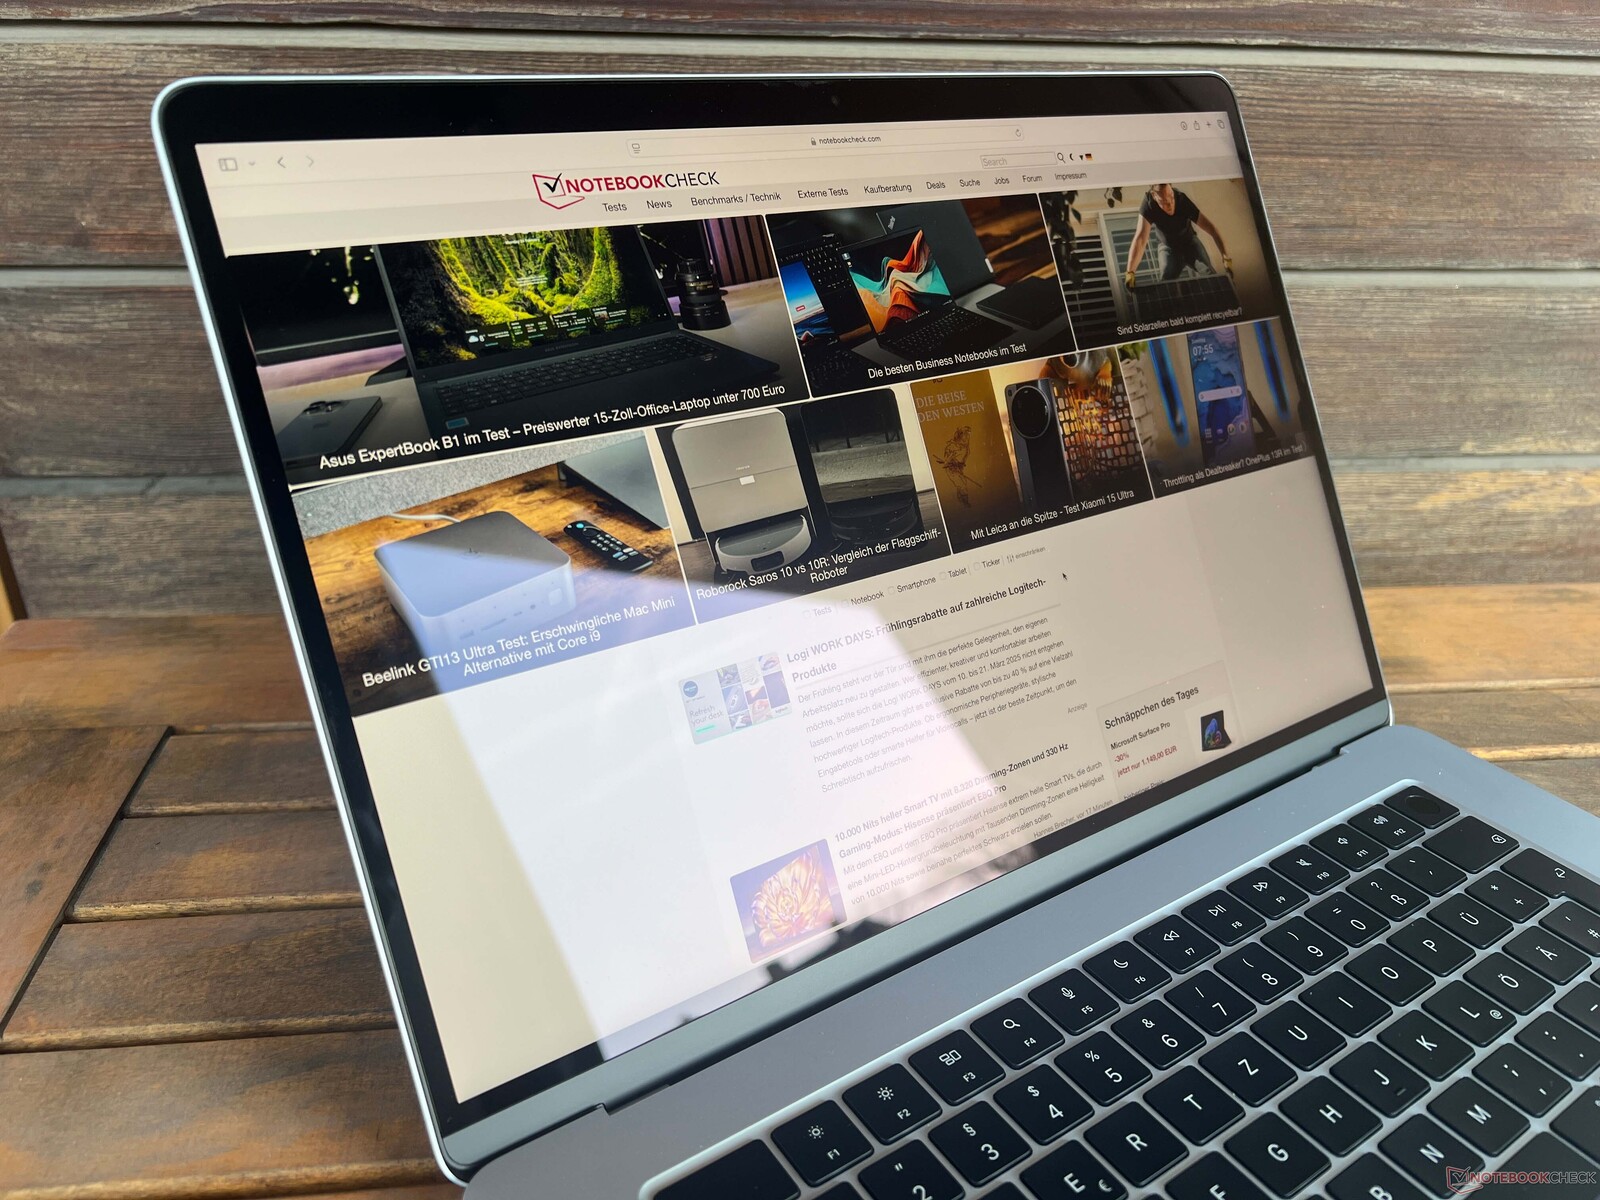
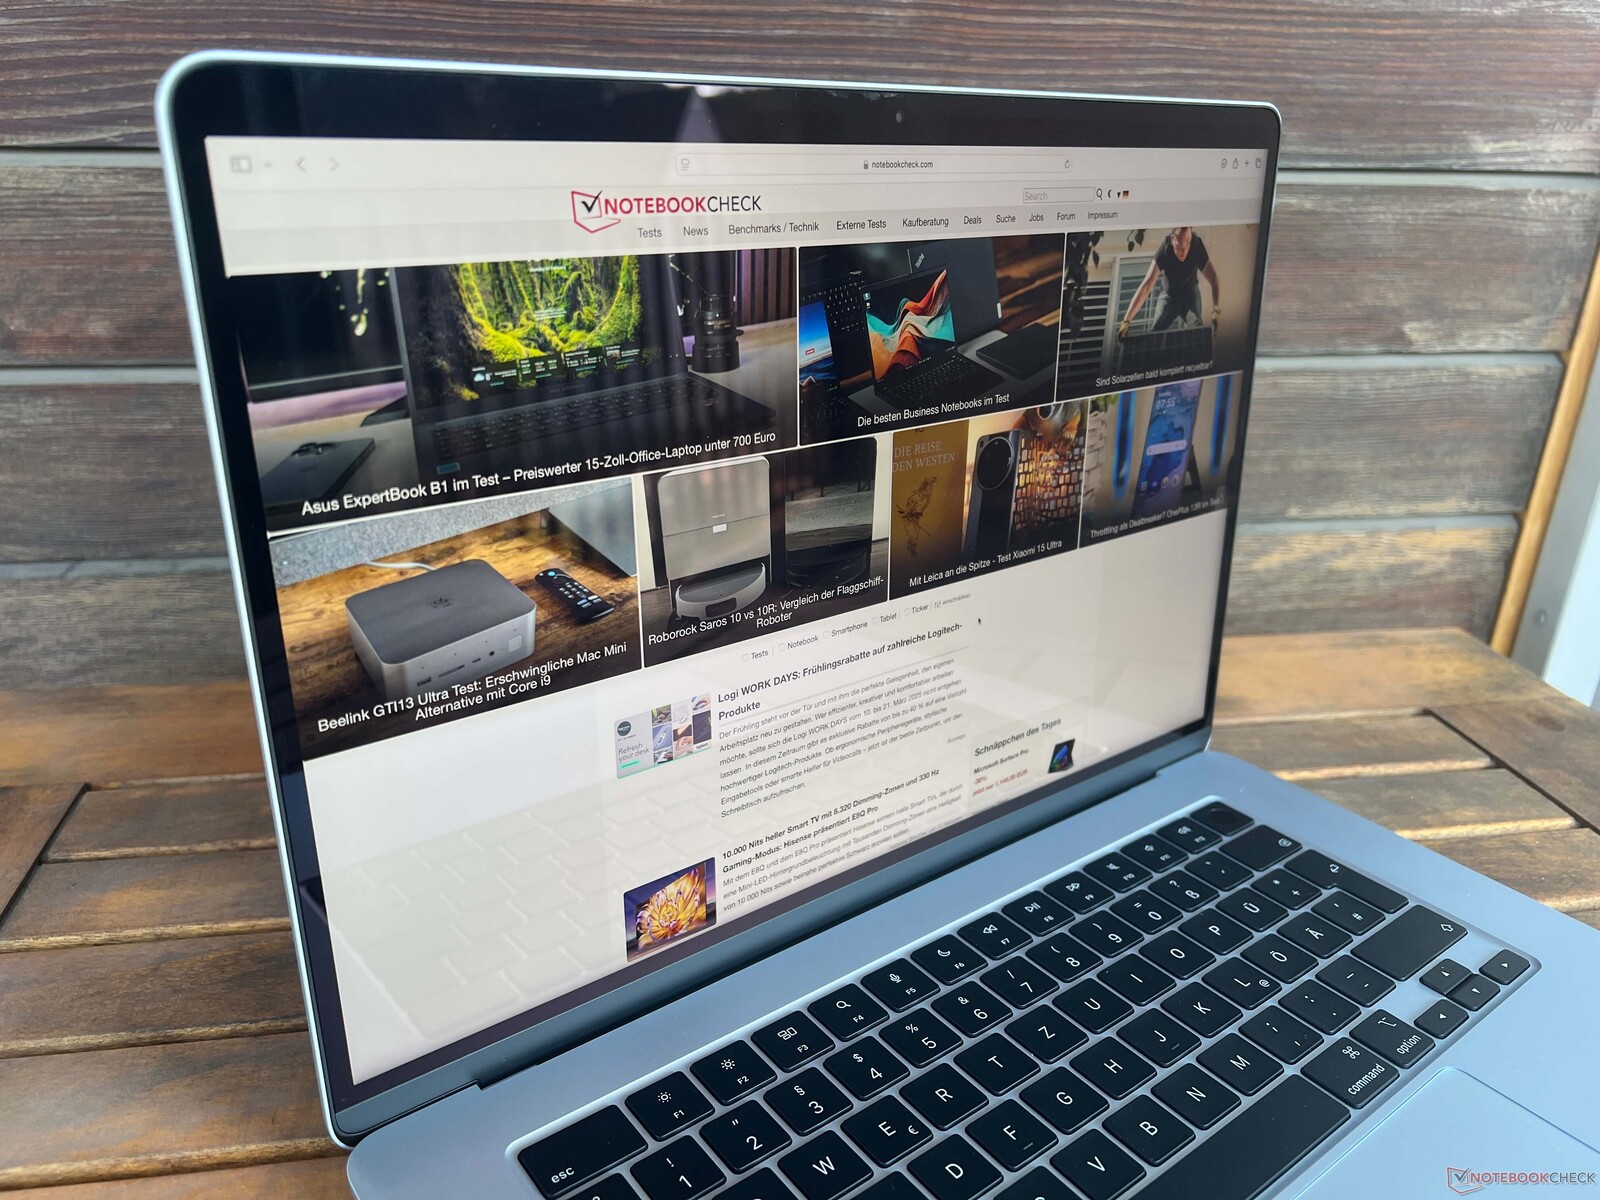
Apple hasn't changed anything about the MacBook's case design and its slim, 11.5-mm design is still particularly impressive when it comes to how it feels to hold. The quality of its aluminum unibody case is still great, but at 1.52 kg, the Air 15 is no lightweight either. There has been a change in the available colors, as Space Gray has been dropped and replaced by Sky Blue.
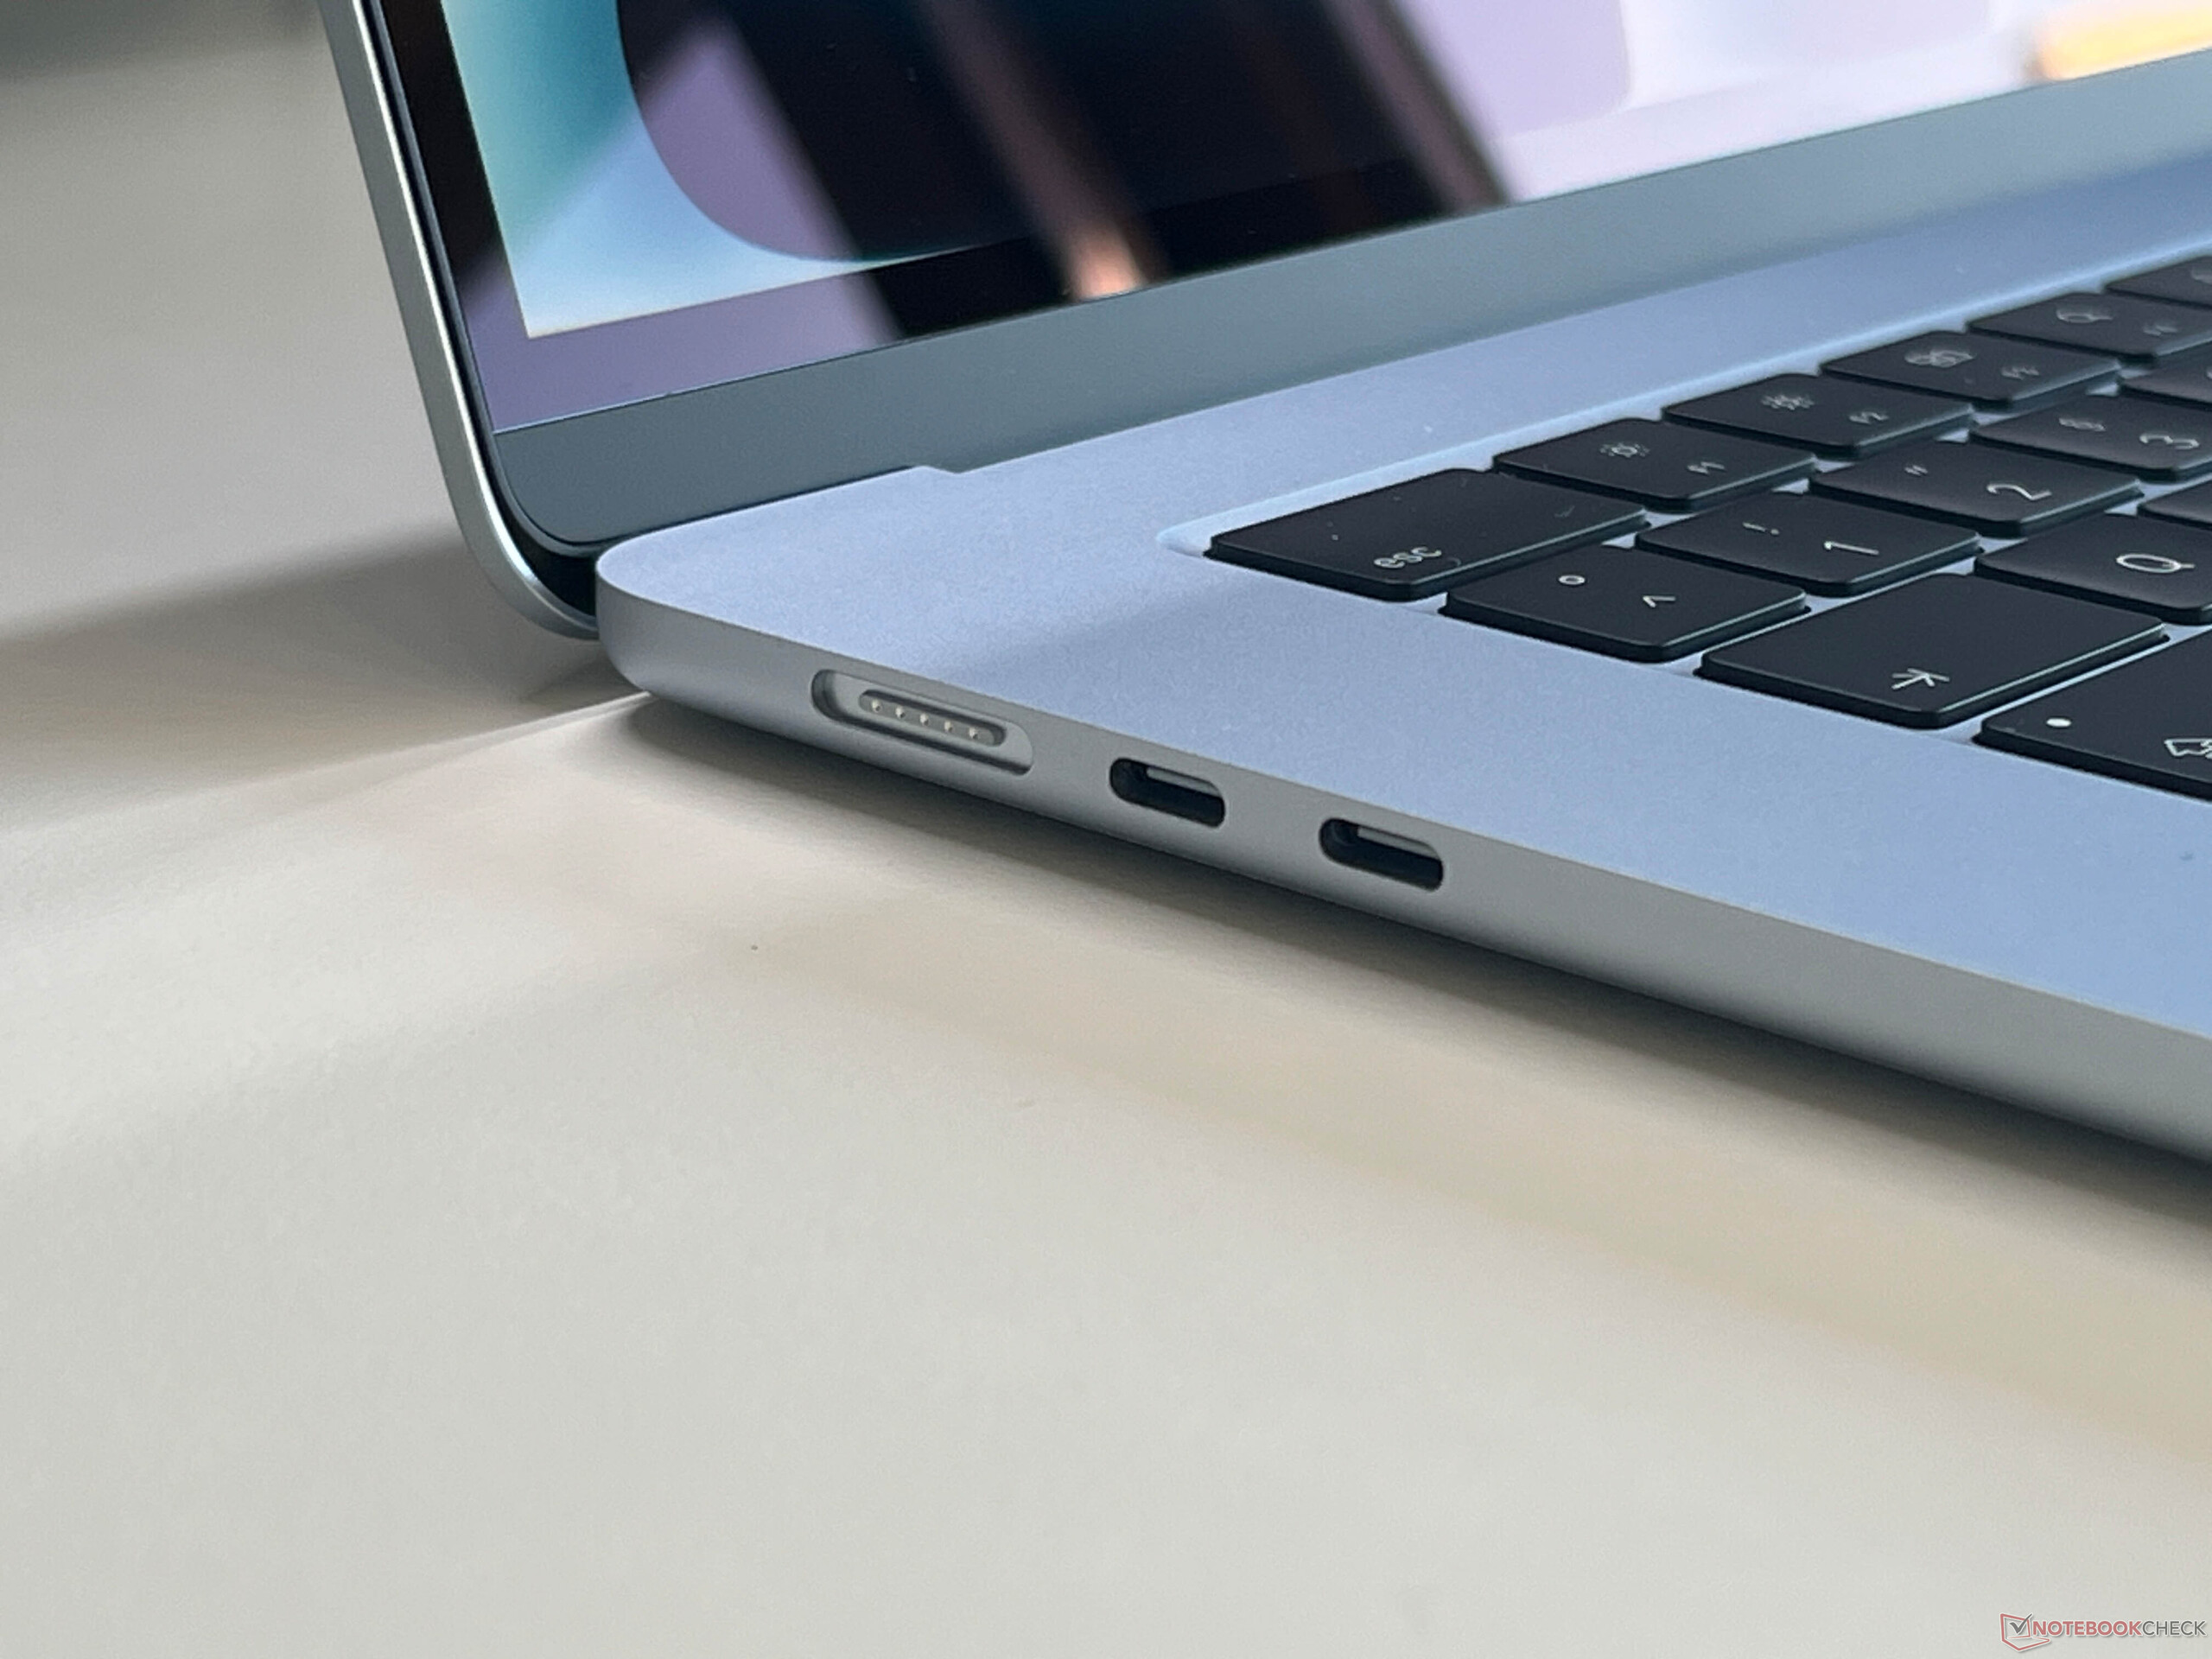
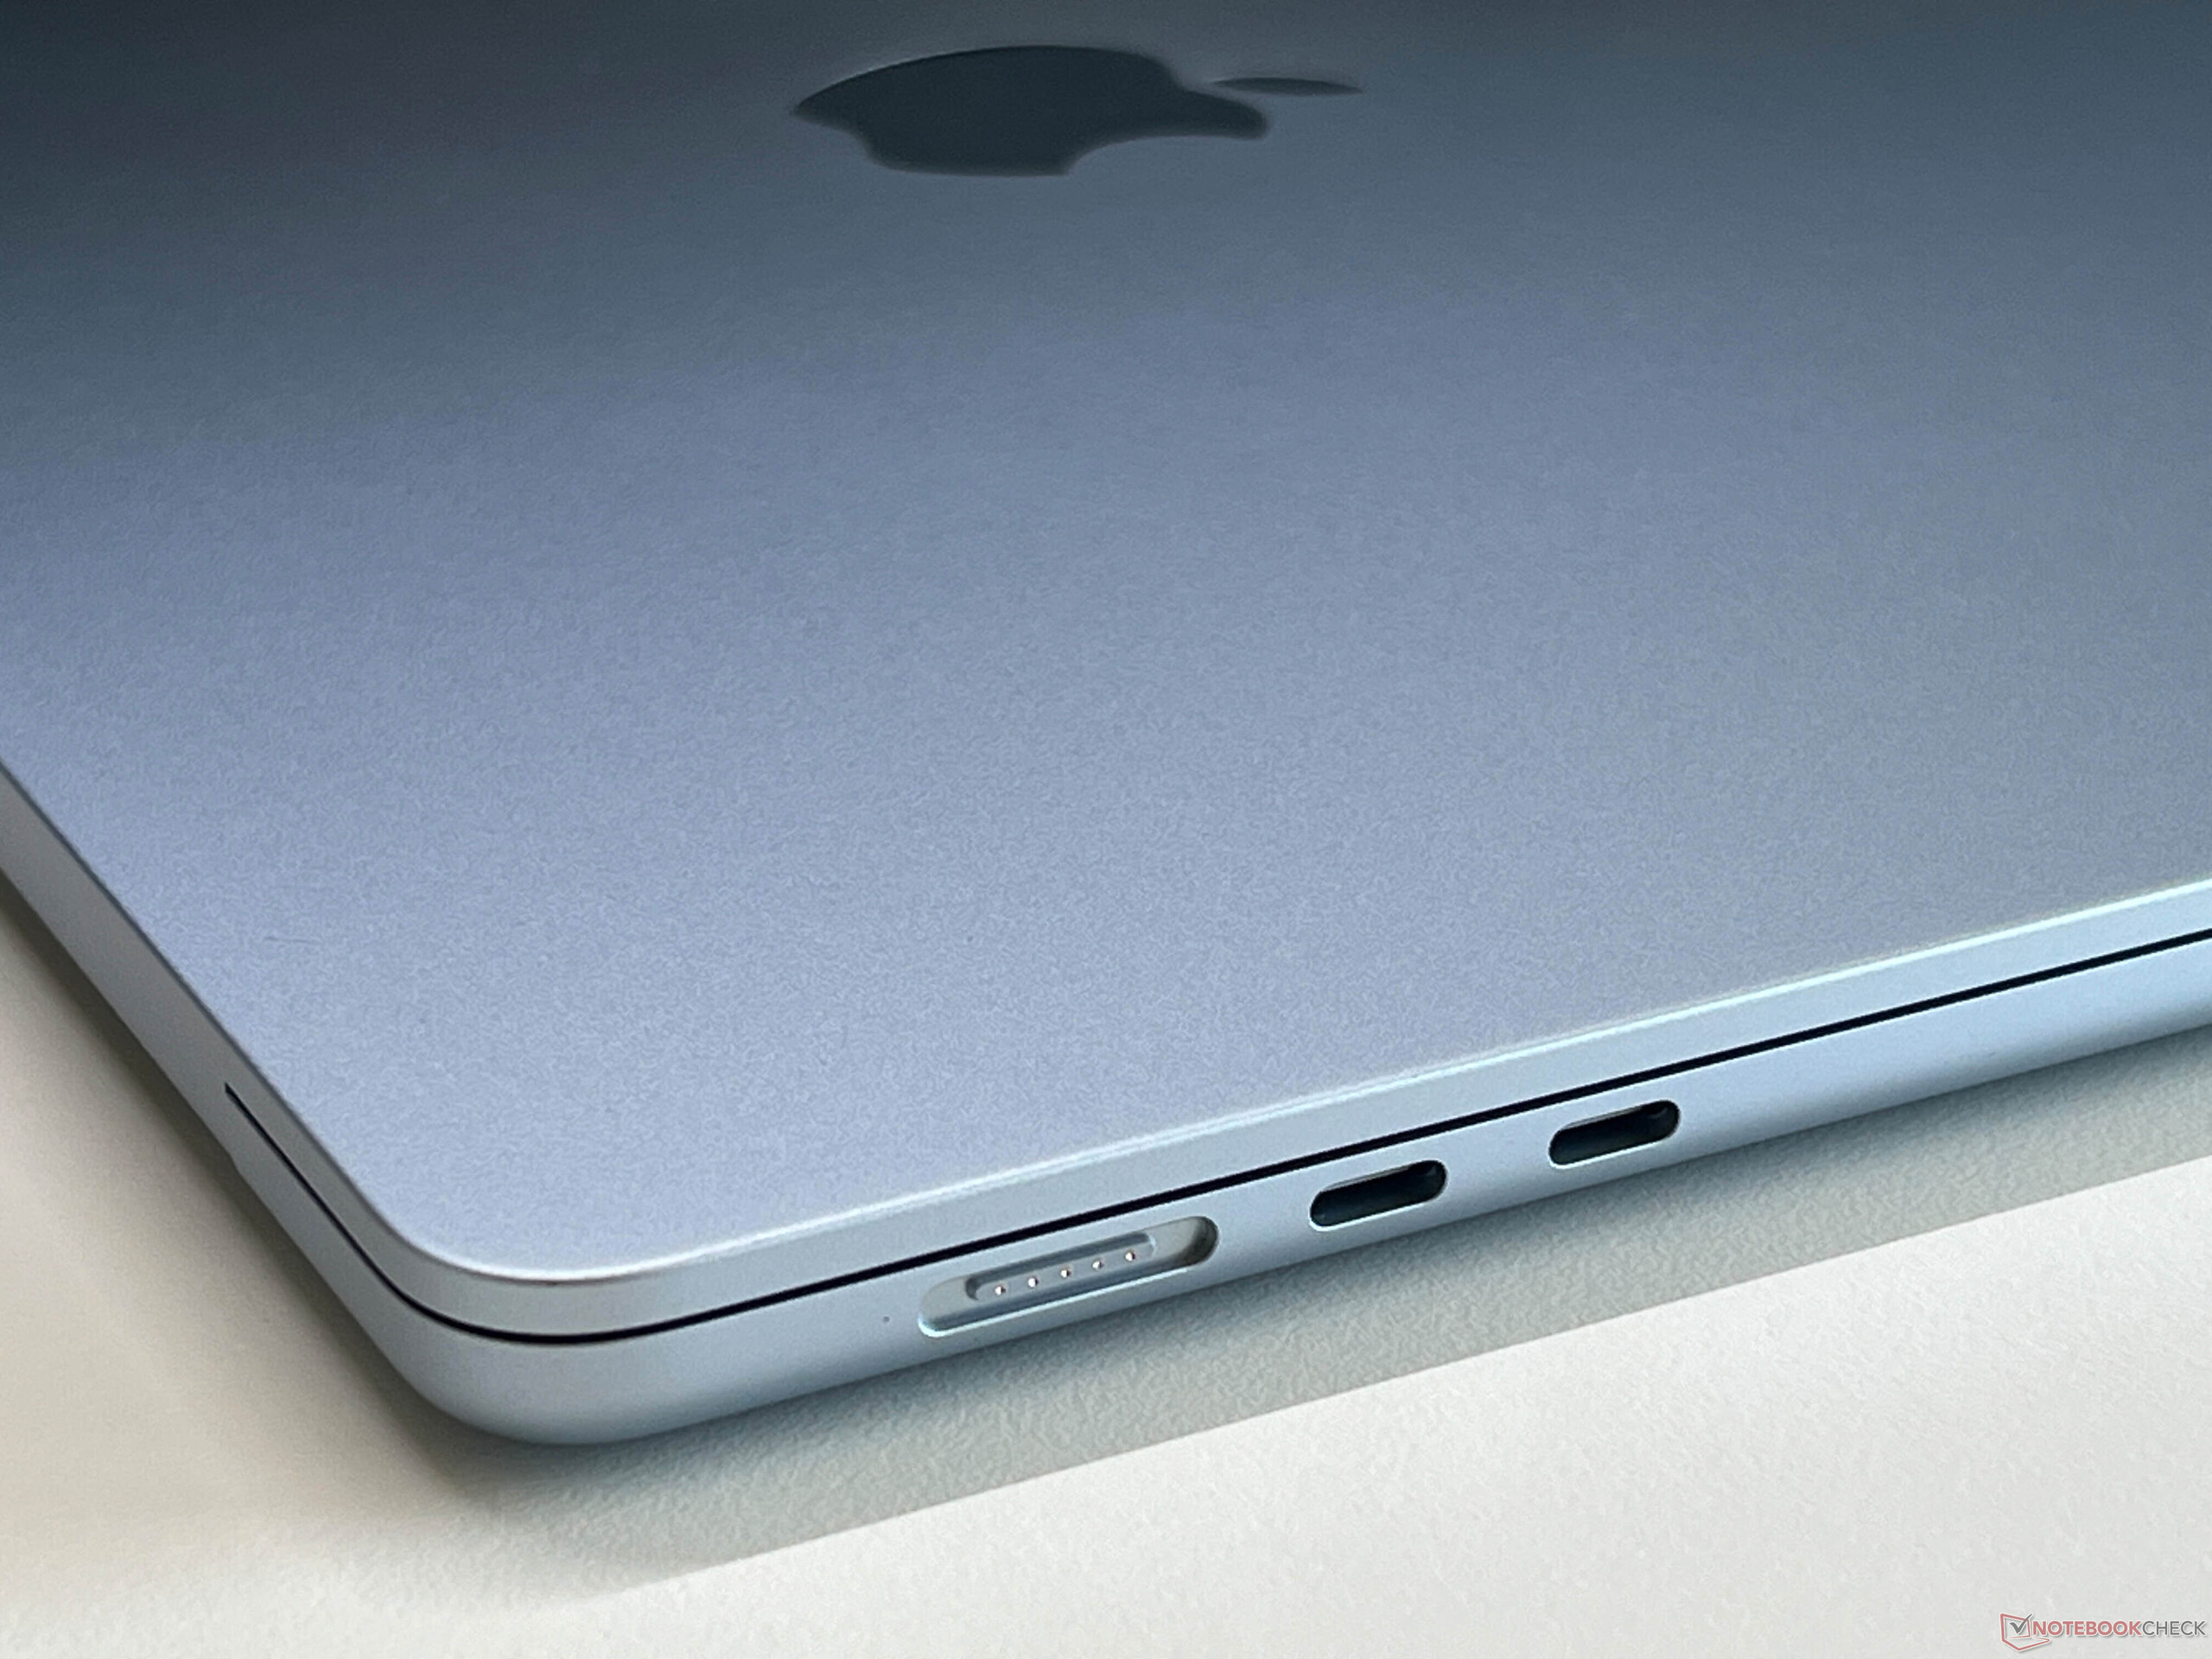
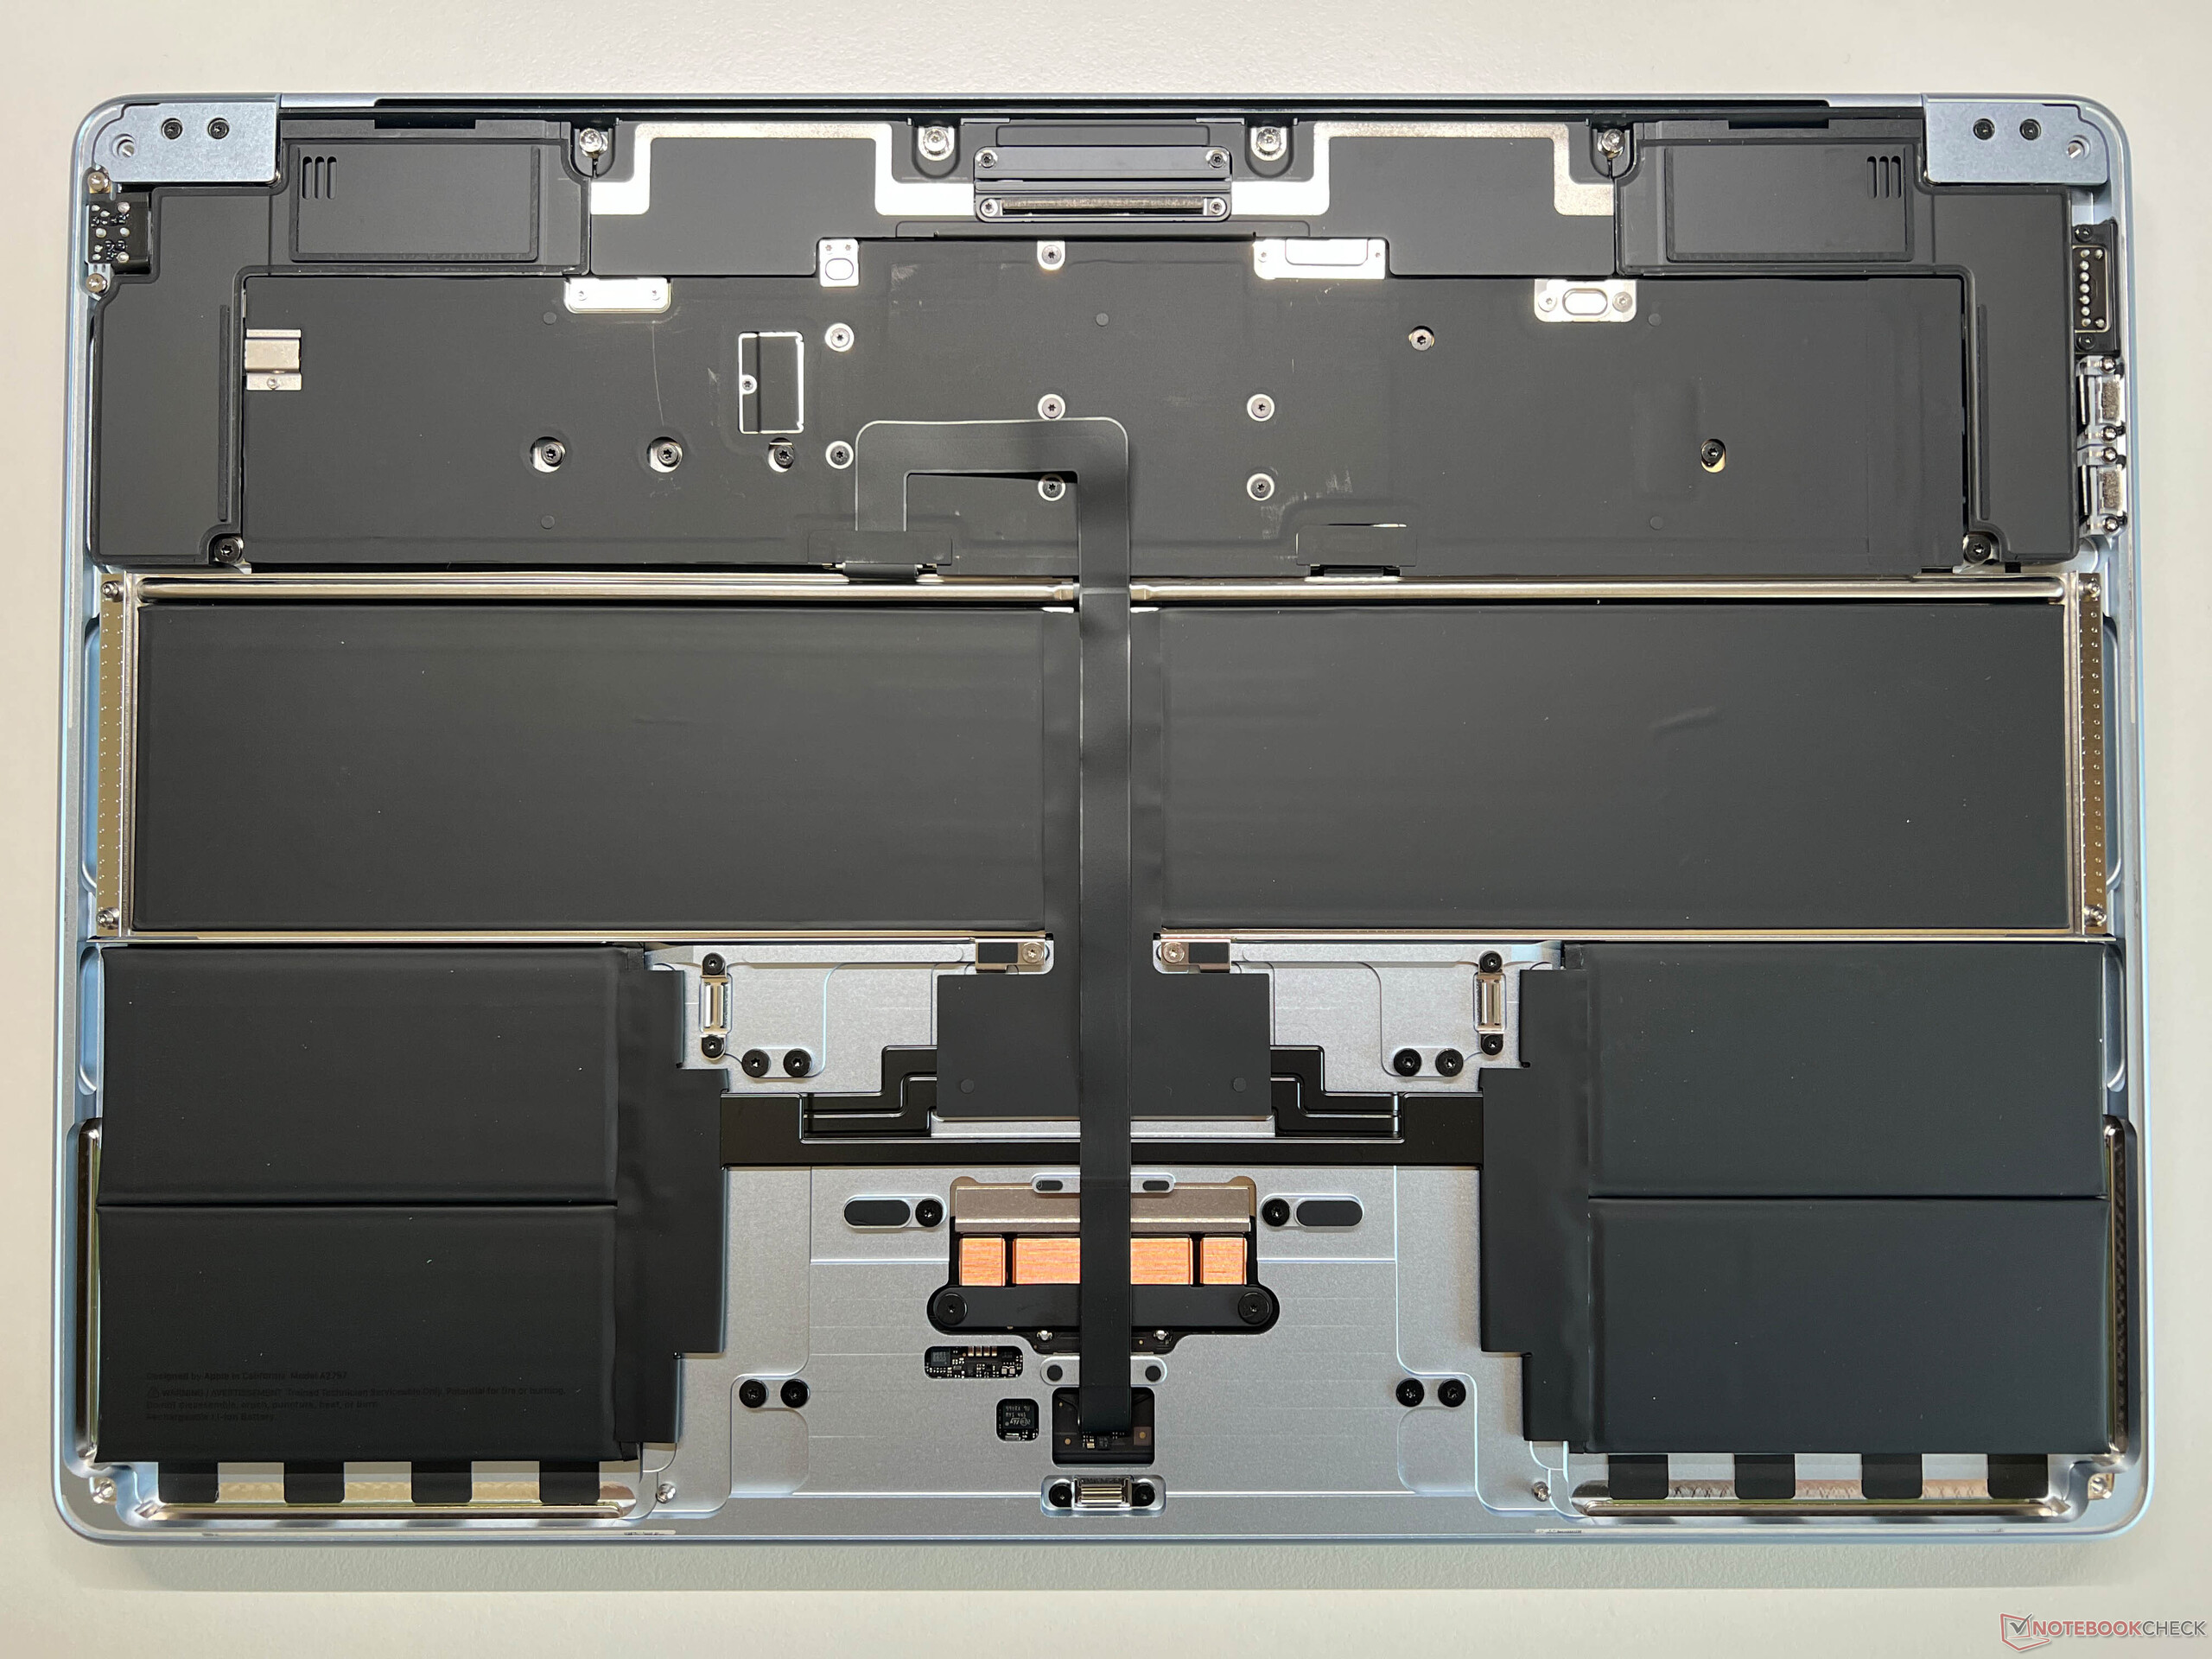
We still have nothing to complain about its build quality and stability, but its connectivity situation remains limited to MagSafe and 2x USB-C. Thankfully, however, these now support Thunderbolt 4 and the M4 SoC can control two external displays in addition to the internal panel. Maintenance options are not available.
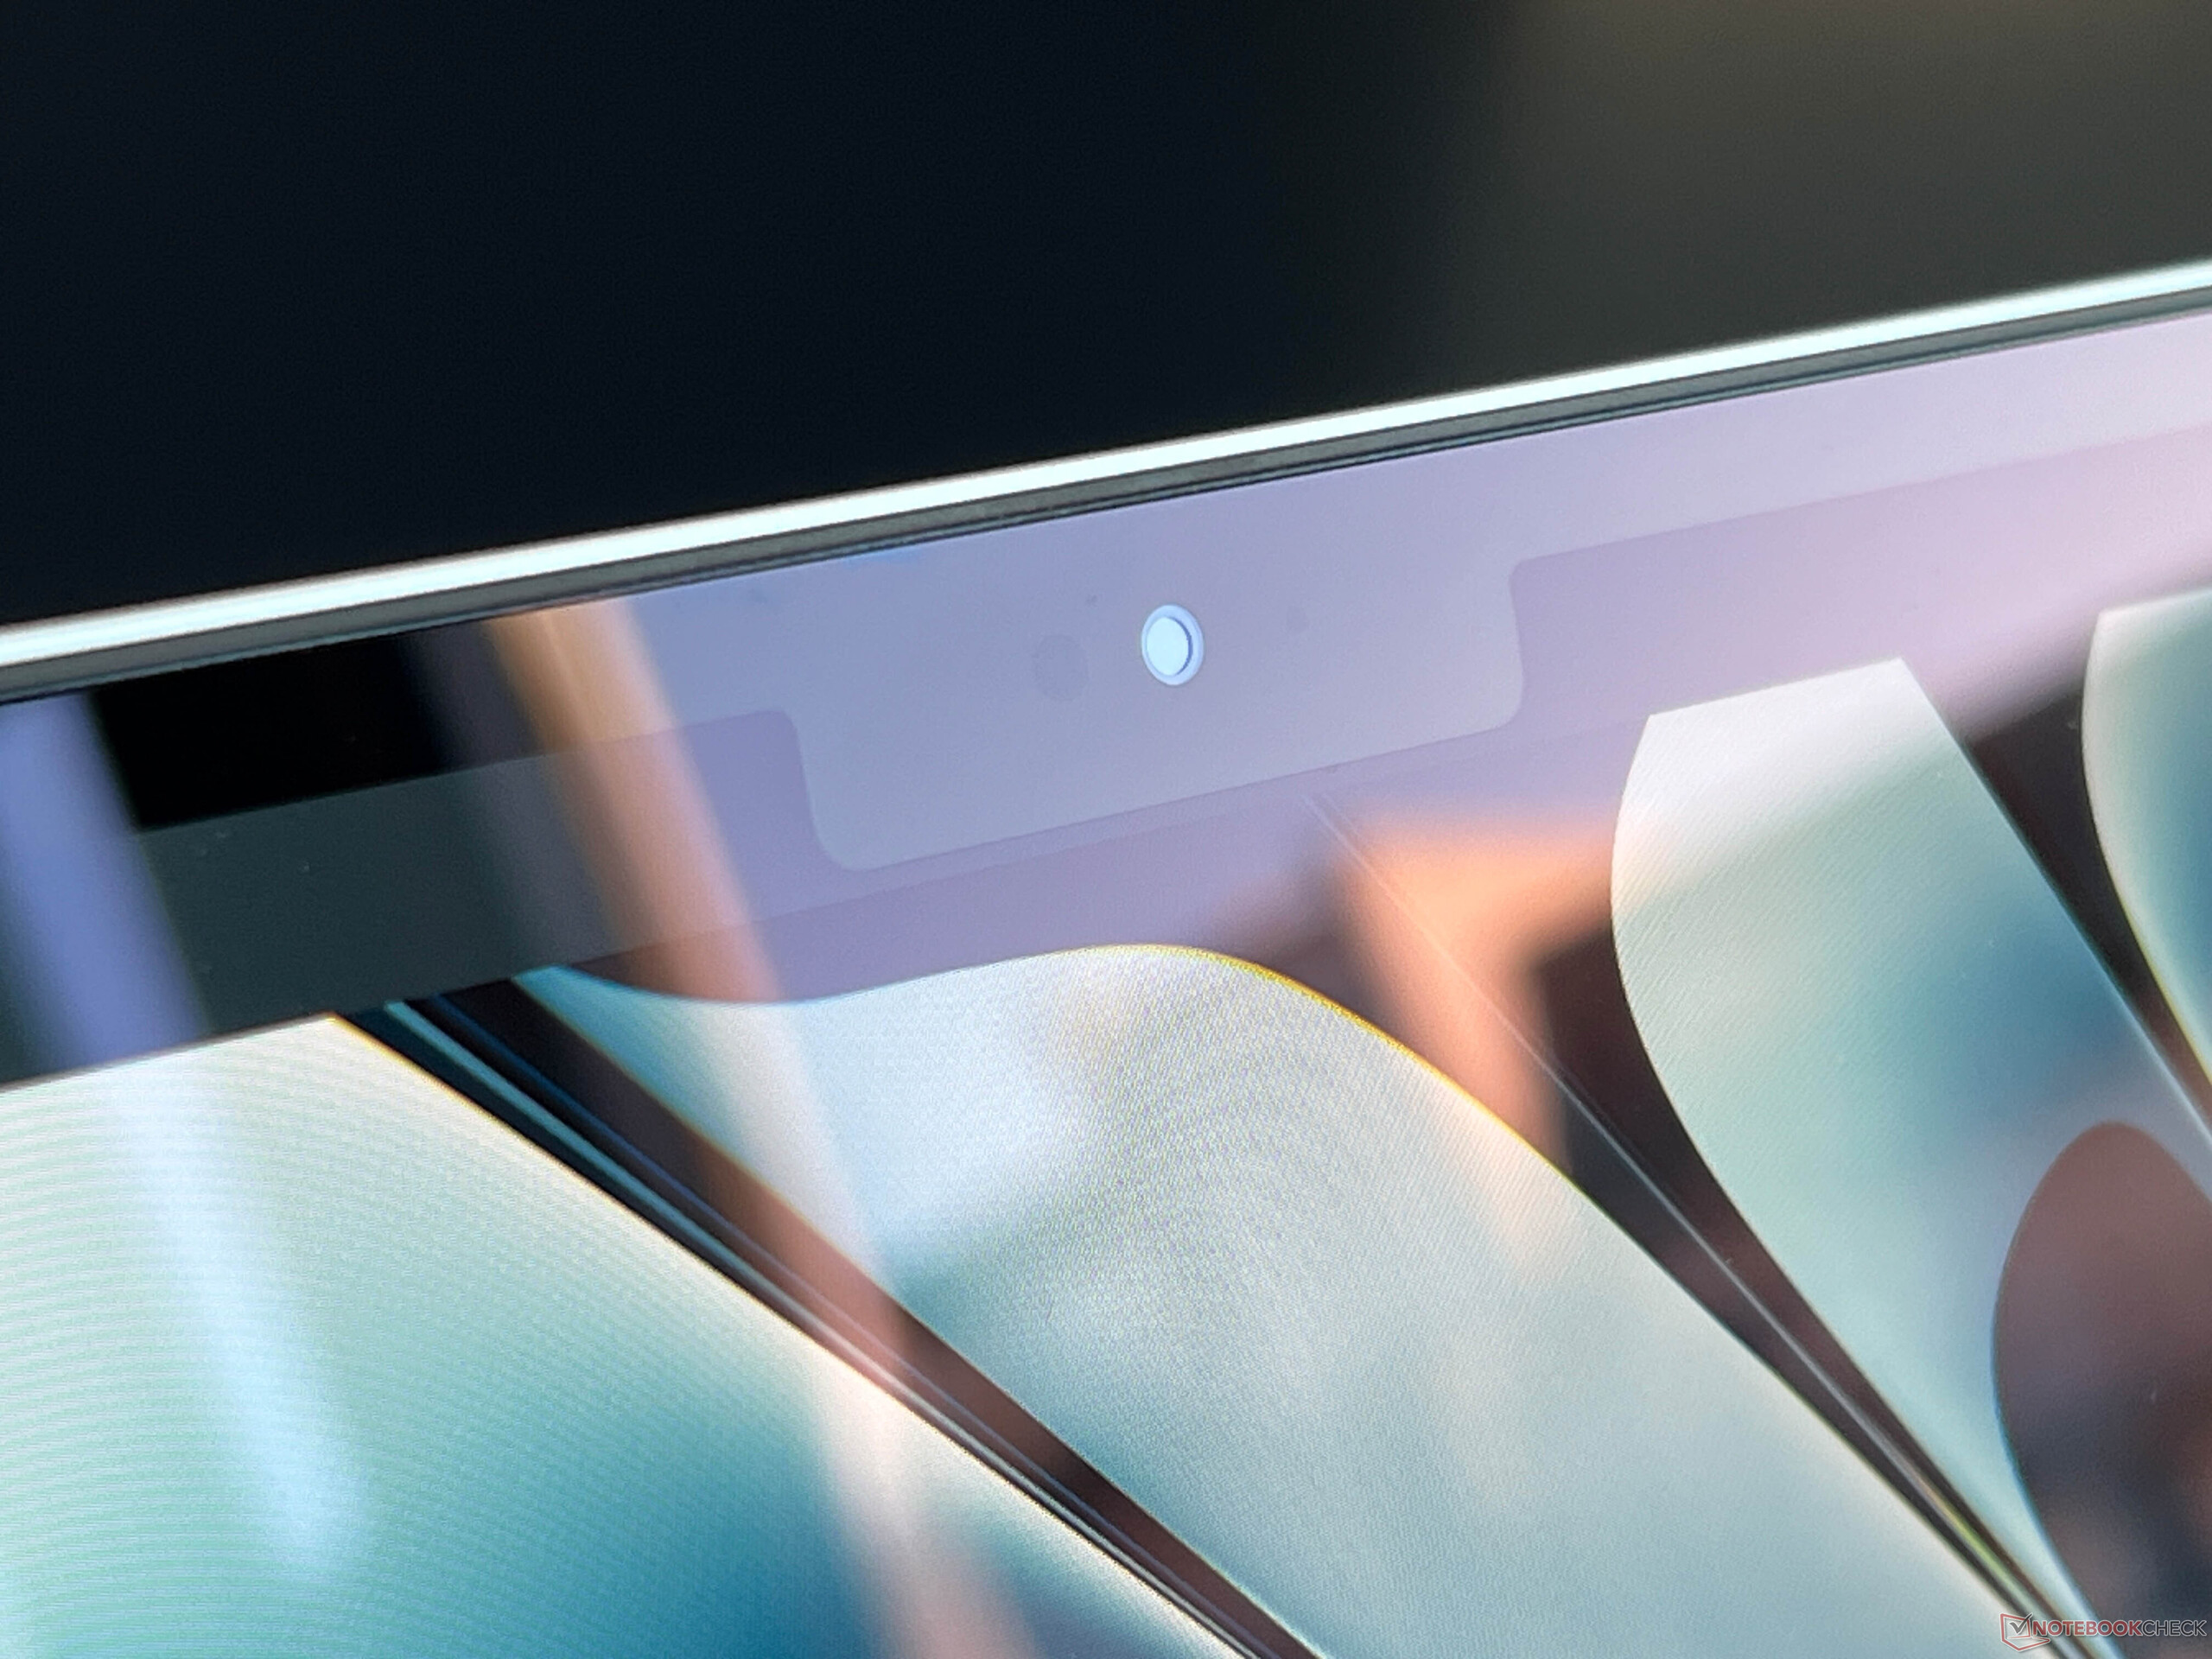
The Mac's Wi-Fi module still supports Wi-Fi 6E including Bluetooth 5.3 and its transfer rates were very stable during our test using our reference router from Asus. There has been a significant upgrade to its webcam, as a 12 MP sensor is now installed, which supports a desktop view in addition to image tracking (Center Stage).


| Networking | |
| Apple MacBook Air 15 M4 | |
| iperf3 transmit AXE11000 | |
| iperf3 receive AXE11000 | |
| Lenovo ThinkPad X9-15 Aura Edition | |
| iperf3 transmit AXE11000 | |
| iperf3 receive AXE11000 | |
| Microsoft Surface Laptop 15 Snapdragon X Elite | |
| iperf3 transmit AXE11000 | |
| iperf3 receive AXE11000 | |
| iperf3 transmit AXE11000 6GHz | |
| iperf3 receive AXE11000 6GHz | |
| Lenovo Yoga Slim 7 15ILL9 Aura | |
| iperf3 transmit AXE11000 | |
| iperf3 receive AXE11000 | |
| iperf3 transmit AXE11000 6GHz | |
| iperf3 receive AXE11000 6GHz | |
| Asus Vivobook S 15 OLED Snapdragon | |
| iperf3 transmit AXE11000 | |
| iperf3 receive AXE11000 | |
| Apple MacBook Air 15 M3 | |
| iperf3 transmit AXE11000 | |
| iperf3 receive AXE11000 | |


Sustainability
Apple provides a detailed environmental report on its website. The device consists of 55% recycled materials.
Input devices
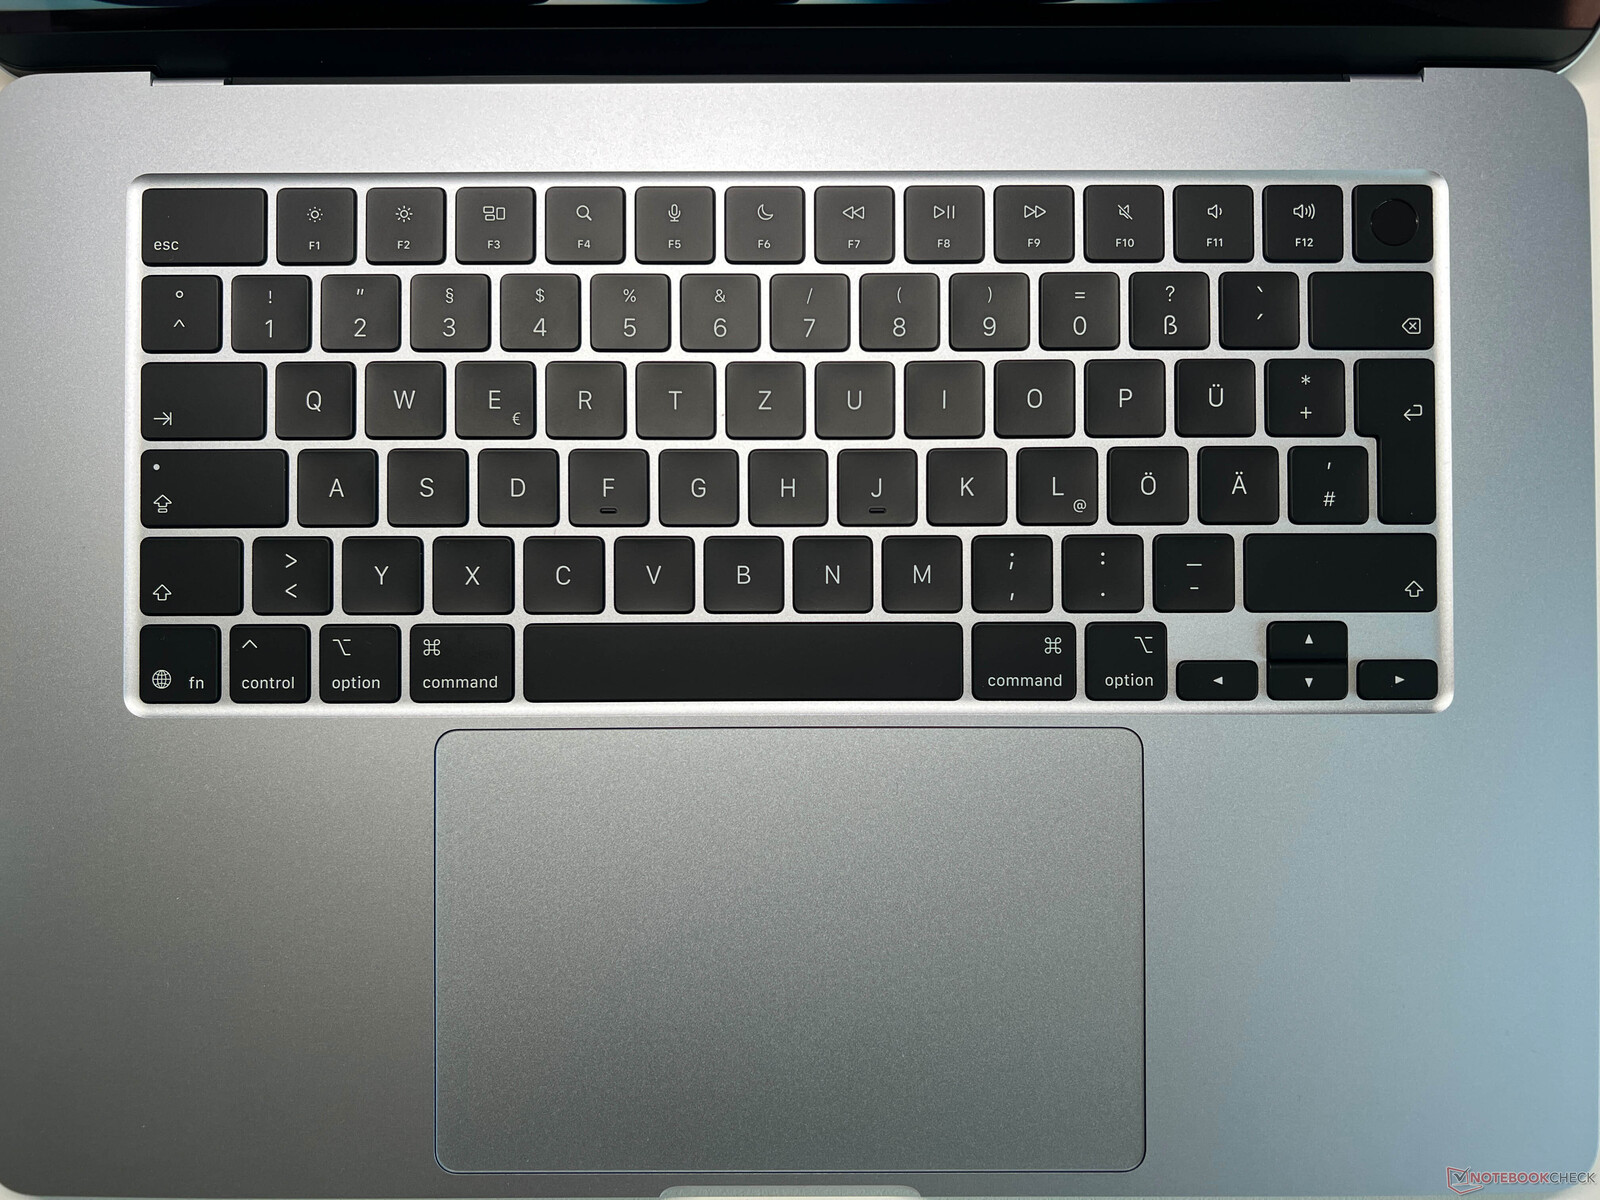
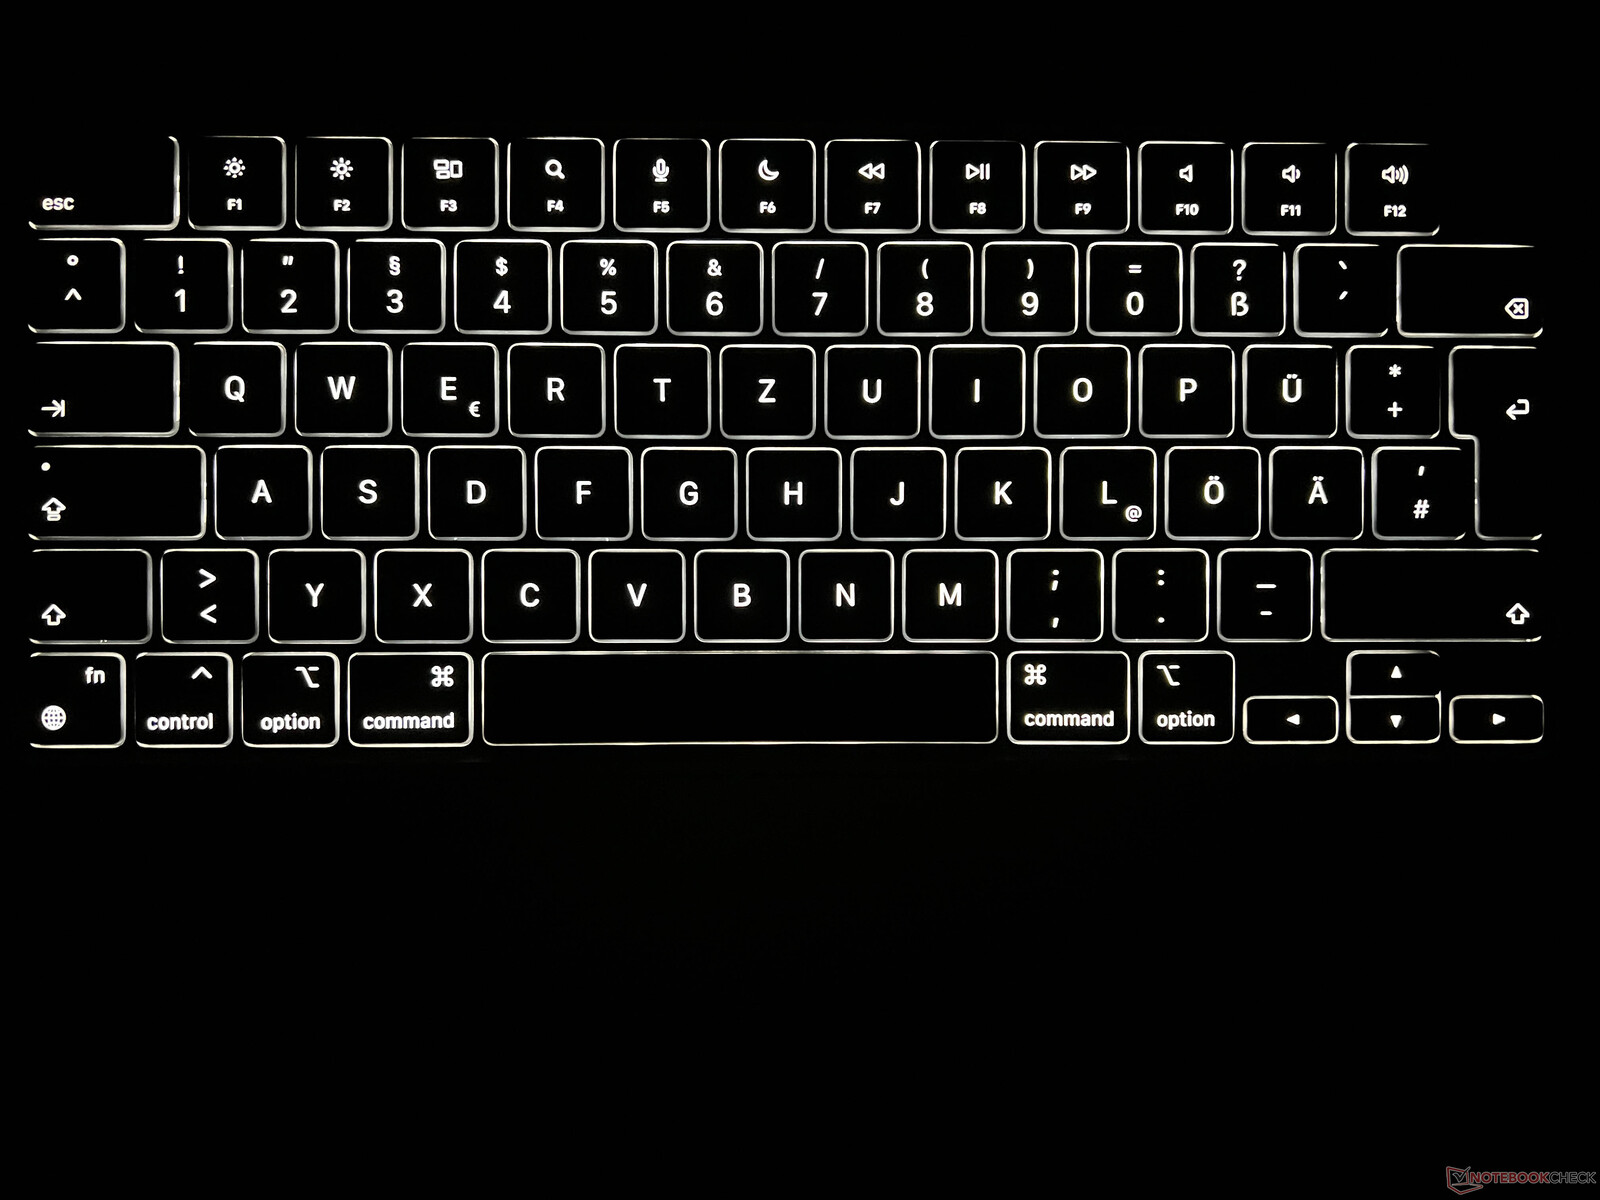
There are no changes to its input devices compared to the previous model. The laptop's keyboard is comfortable, but could benefit from a little more travel. The ThinkPad X9, for example, has a clear advantage in this respect. The haptic touchpad continues to work excellently, but competitors from Honor or Huawei are following suit and offer additional gestures at the edges, for example, which are supported by vibration motors. So Apple no longer has an advantage here.
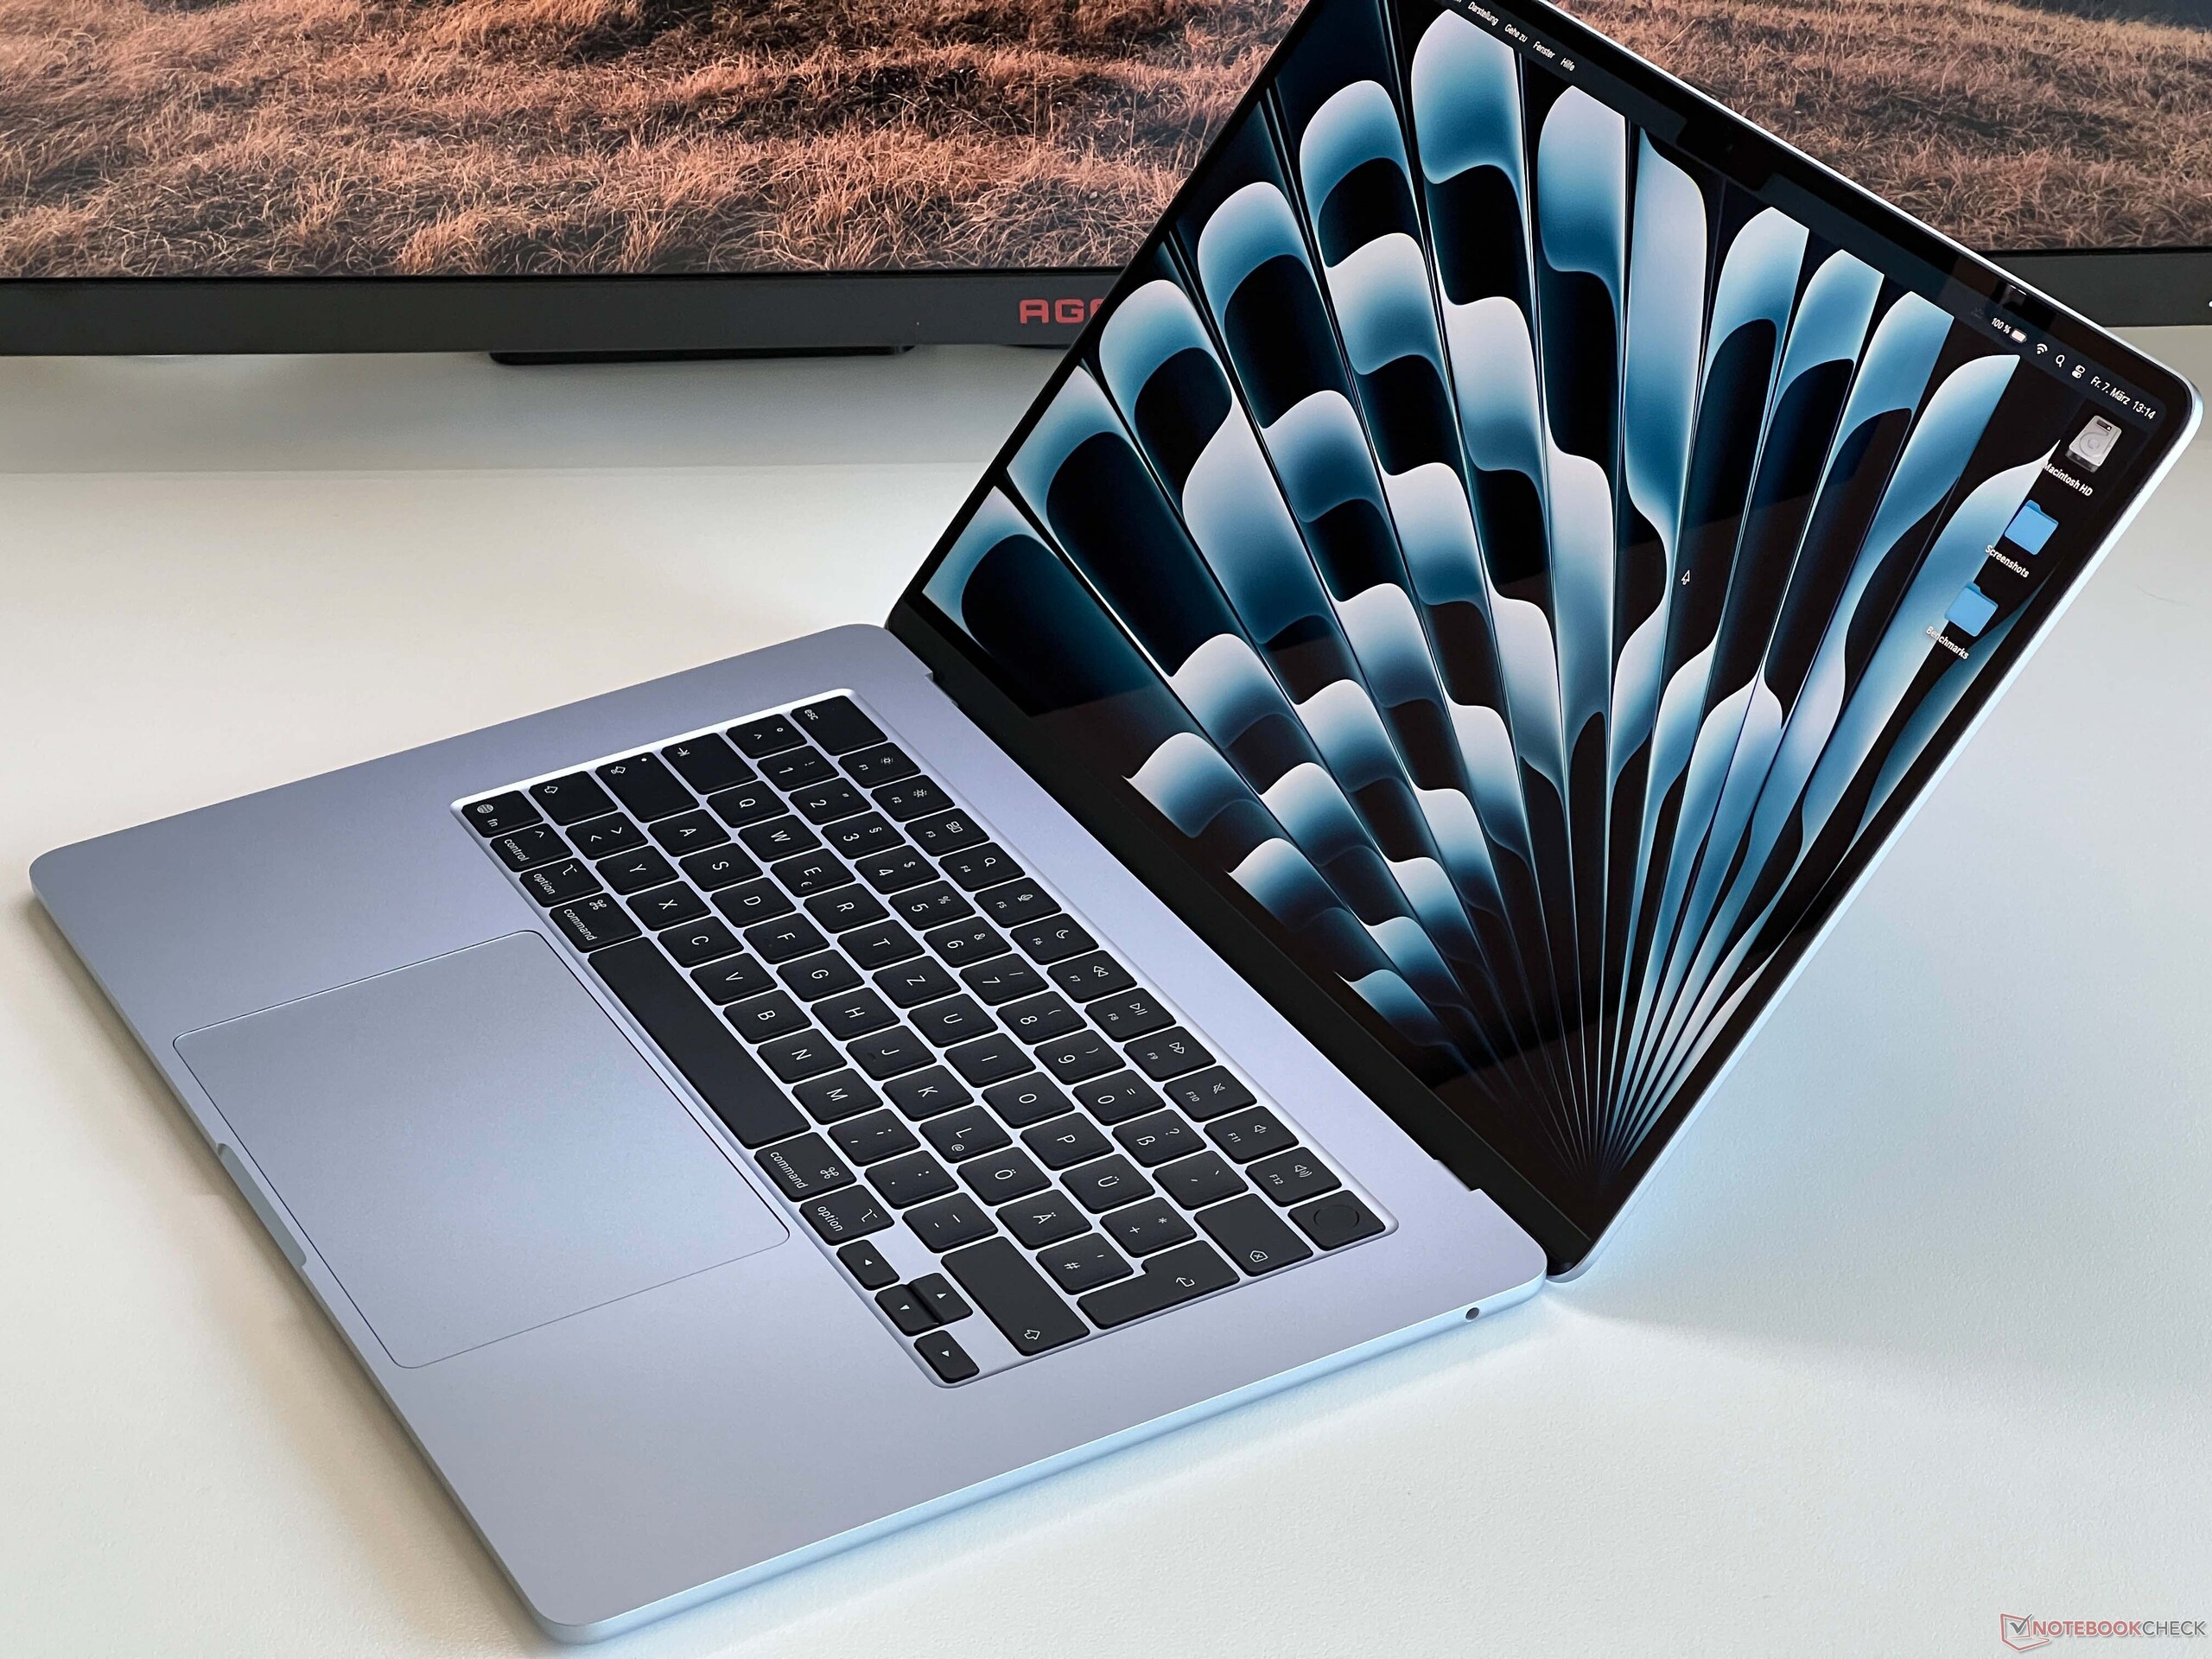
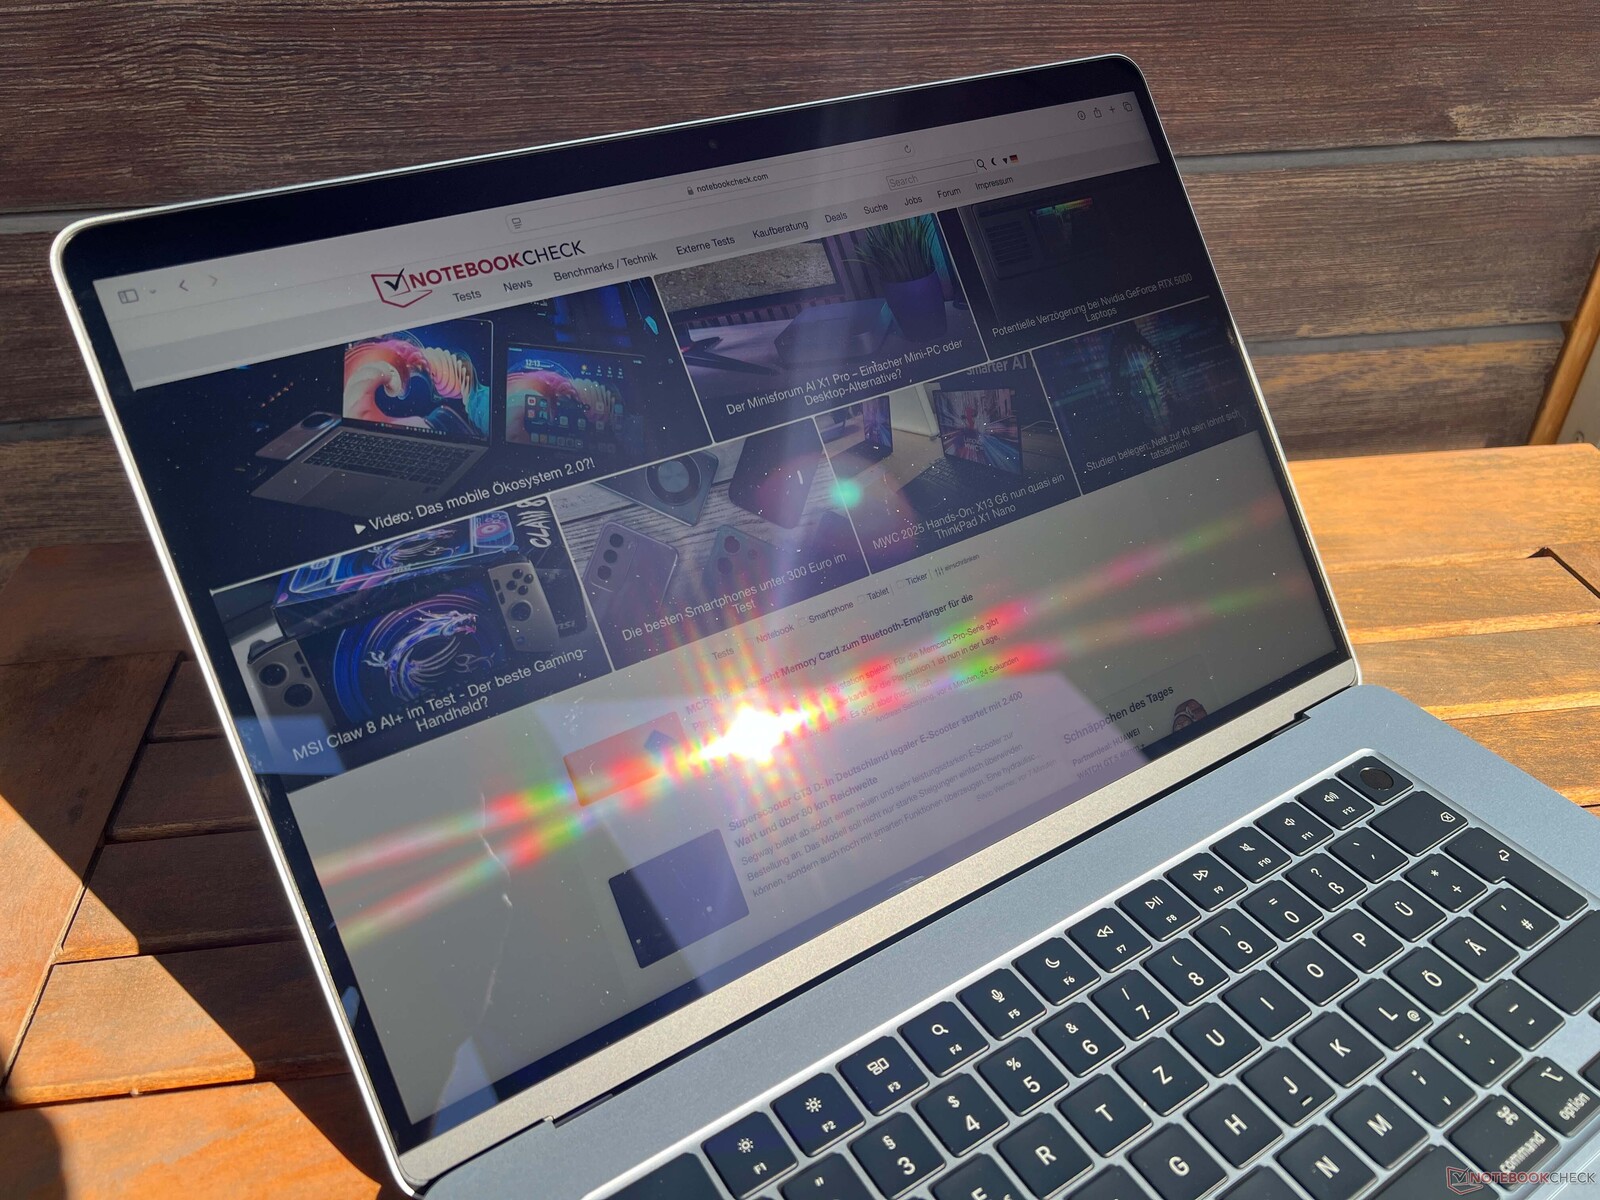
Display - IPS at 60 Hz
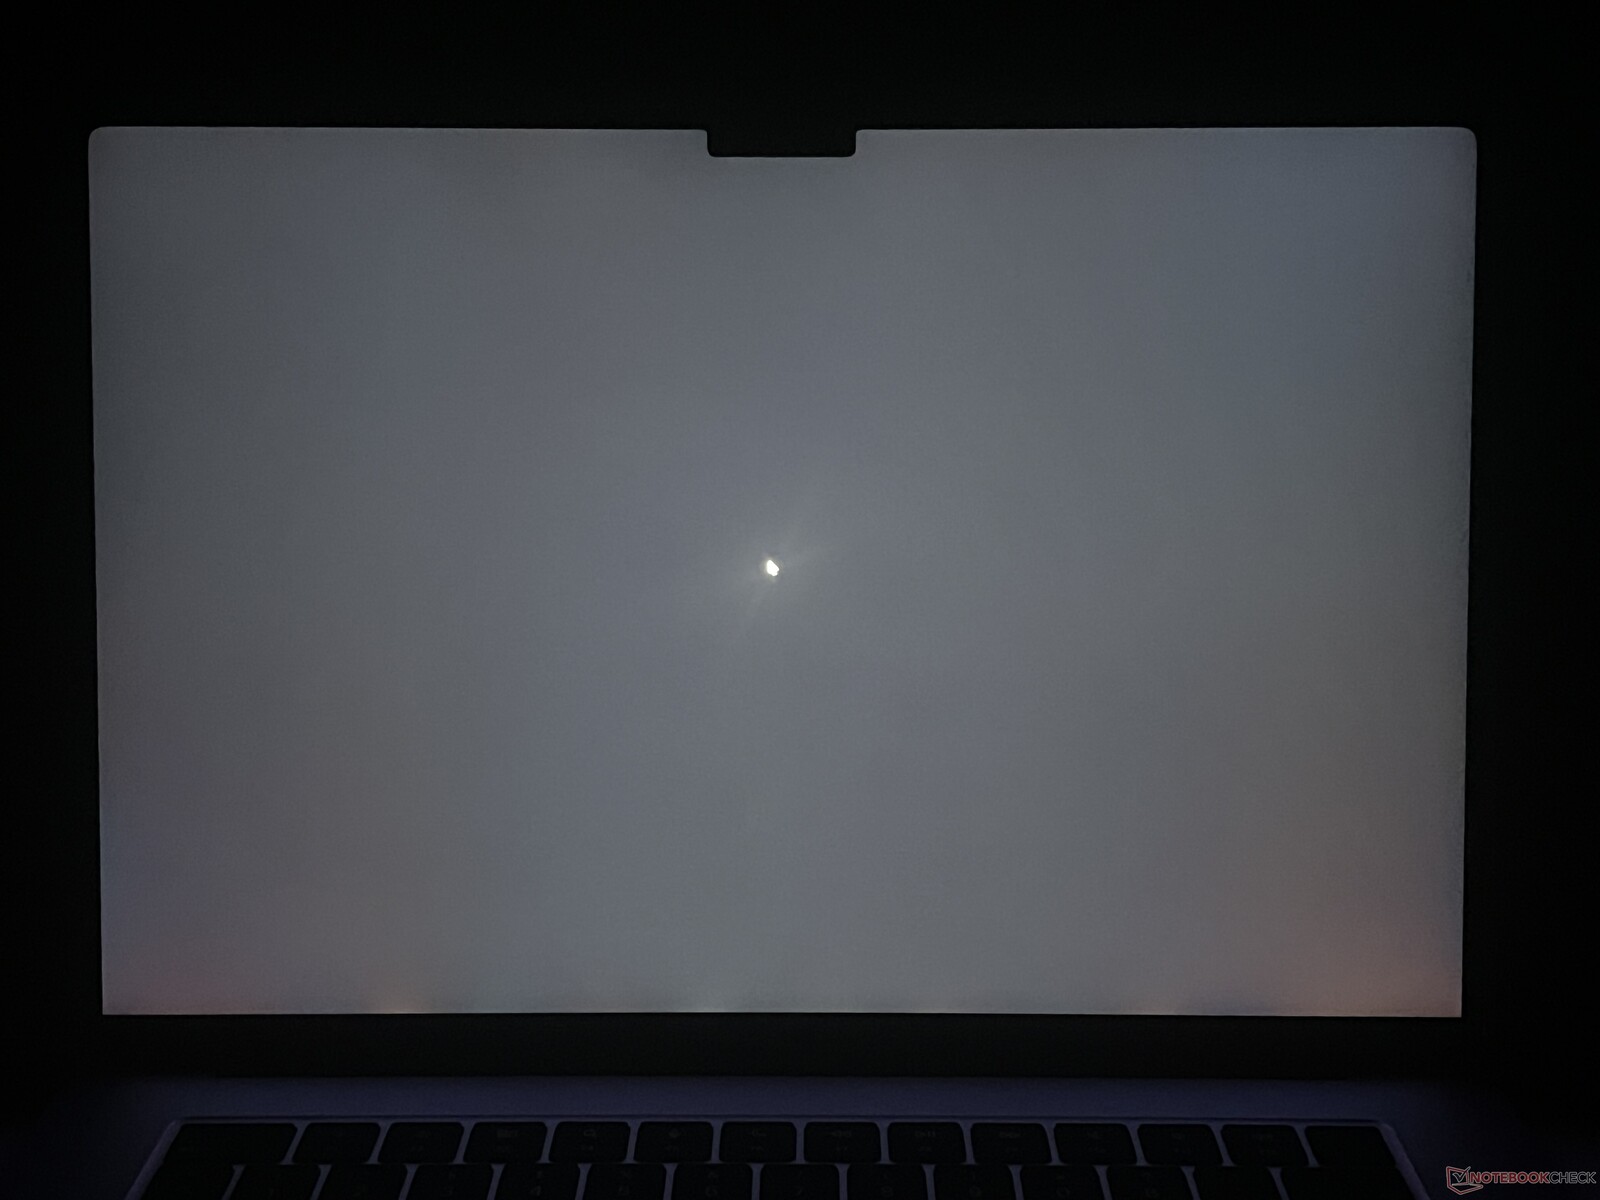
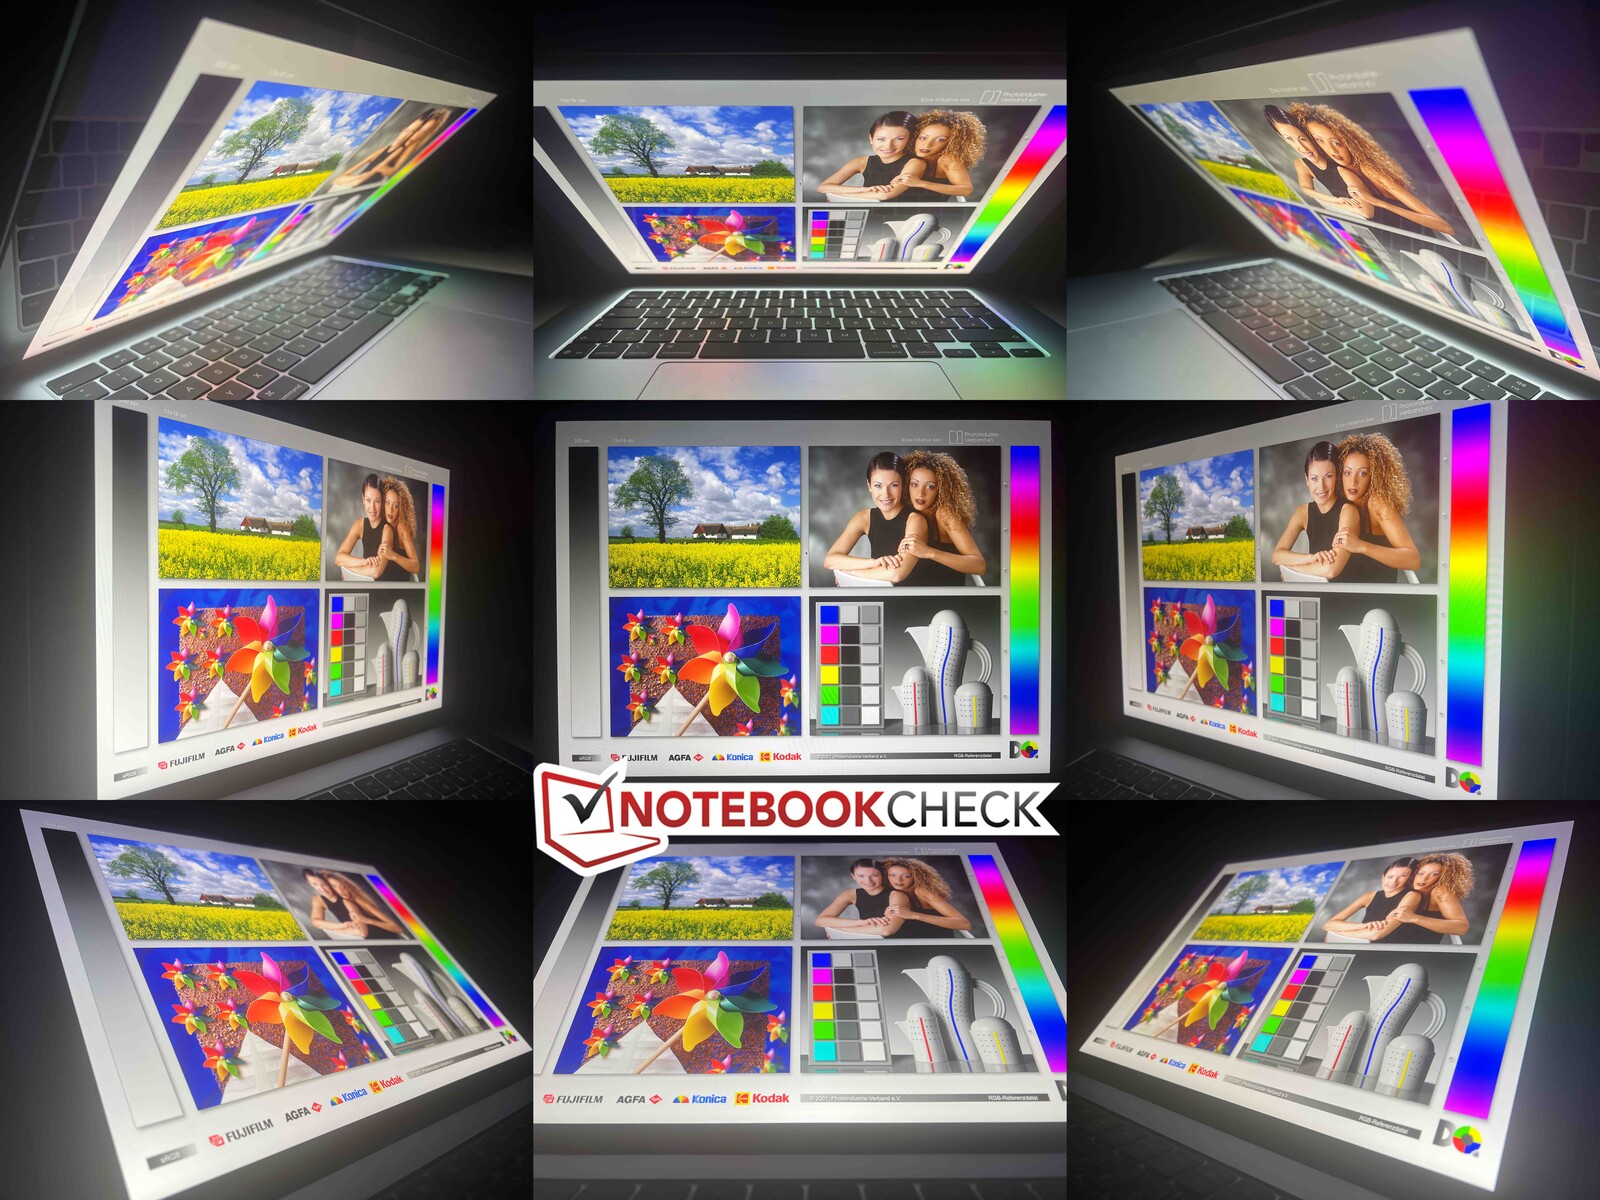
Now that the MacBook Pro is available with a matte display, lots of users will certainly have been hoping for an update to the MacBook Air—but this is unfortunately not the case. It still uses a familiar IPS screen and continues to offer very good picture quality without any PWM flickering. Both its brightness and color temperature can be adjusted automatically. Its frequency is also still the same at 60 Hz, which makes itself noticeable during movements. Some of the competitors are better positioned in this aspect.
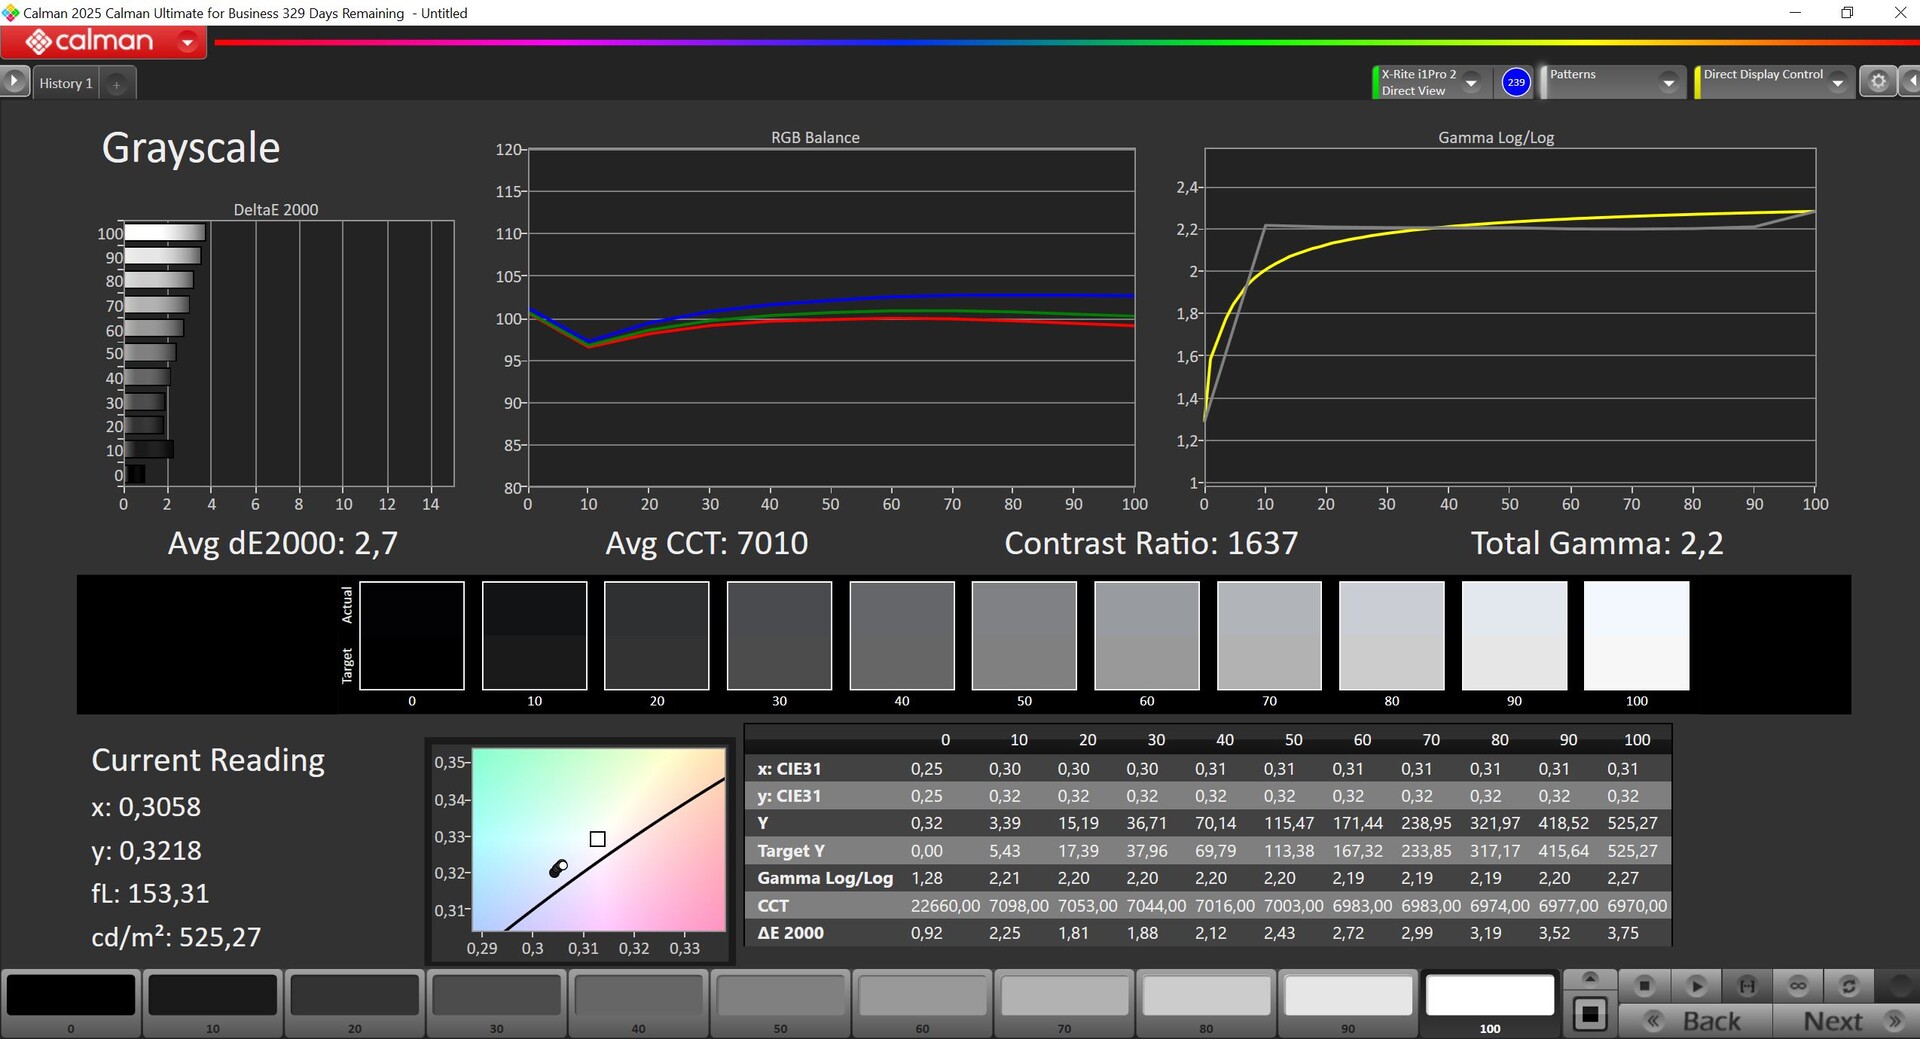
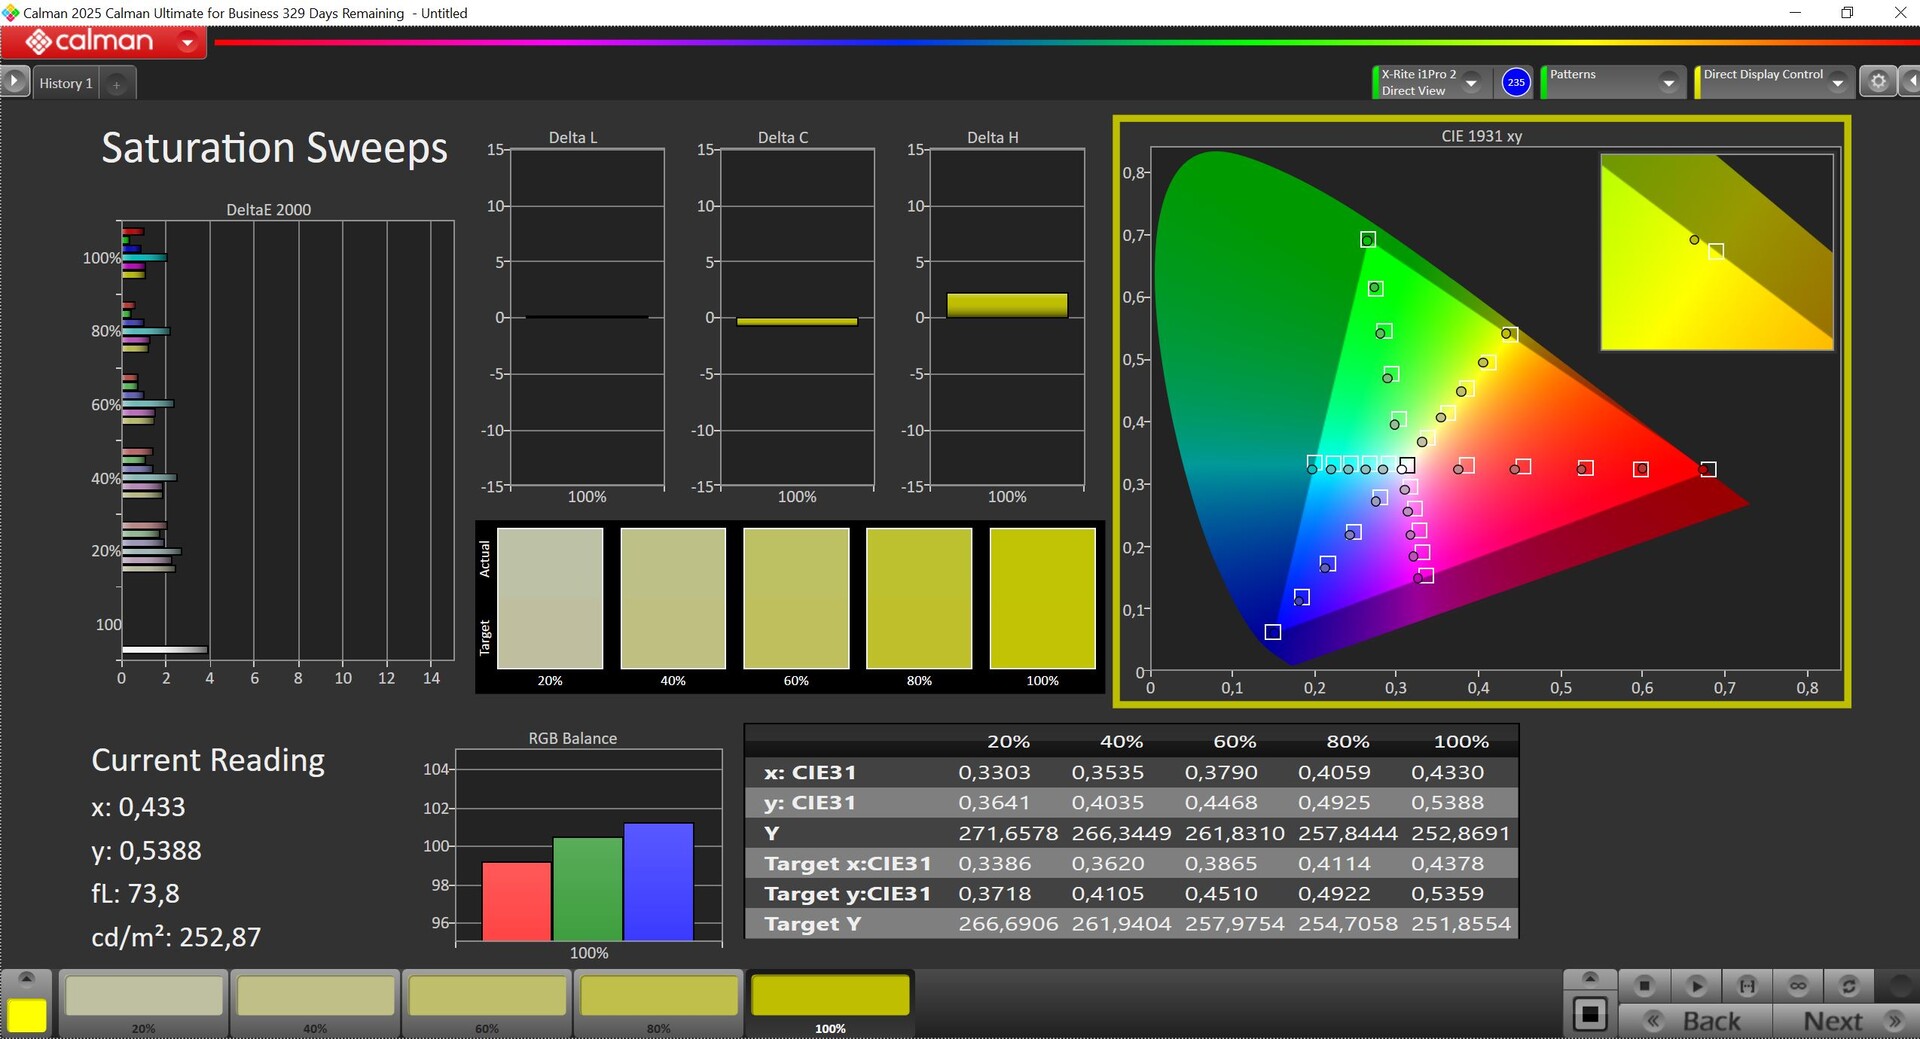
Its brightness is over 500 cd/m² and we don't have much to criticize about its black level or contrast. Its factory calibration is very good and the P3 color space is fully covered. There is practically no backlight bleeding, even at maximum brightness, and its response times are fine.
| |||||||||||||||||||||||||
Brightness Distribution: 87 %
Center on Battery: 525 cd/m²
Contrast: 1641:1 (Black: 0.32 cd/m²)
ΔE ColorChecker Calman: 1.7 | ∀{0.5-29.43 Ø4.71}
ΔE Greyscale Calman: 2.7 | ∀{0.09-98 Ø4.96}
88.3% AdobeRGB 1998 (Argyll 3D)
100% sRGB (Argyll 3D)
98.7% Display P3 (Argyll 3D)
Gamma: 2.2
CCT: 7010 K
| Apple MacBook Air 15 M4 IPS, 2880x1864, 15.3", 60 Hz | Apple MacBook Air 15 M3 IPS, 2880x1864, 15.3", 60 Hz | Lenovo ThinkPad X9-15 Aura Edition ATNA53JB01-0, OLED, 2880x1800, 15.3", 120 Hz | Microsoft Surface Laptop 15 Snapdragon X Elite Sharp LQ150P1JX61, IPS, 2496x1664, 15", 120 Hz | Lenovo Yoga Slim 7 15ILL9 Aura CSOT T3 MNF307ZB1-1, IPS, 2880x1800, 15.3", 120 Hz | Asus Vivobook S 15 OLED Snapdragon ATNA56AC03-0, OLED, 2880x1620, 15.6", 120 Hz | |
|---|---|---|---|---|---|---|
| Display | -0% | 3% | -0% | |||
| Display P3 Coverage (%) | 98.7 | 98.7 0% | 100 1% | 98.8 0% | ||
| sRGB Coverage (%) | 100 | 99.9 0% | 100 0% | 100 0% | ||
| AdobeRGB 1998 Coverage (%) | 88.3 | 87.8 -1% | 94.6 7% | 87.5 -1% | ||
| Response Times | -29% | 96% | -99% | -19% | 96% | |
| Response Time Grey 50% / Grey 80% * (ms) | 23.2 ? | 35.3 ? -52% | 1.46 ? 94% | 44.4 ? -91% | 27 ? -16% | 0.61 ? 97% |
| Response Time Black / White * (ms) | 14.7 ? | 15.6 ? -6% | 0.44 ? 97% | 30.3 ? -106% | 17.9 ? -22% | 0.67 ? 95% |
| PWM Frequency (Hz) | 1200 ? | 240 ? | ||||
| PWM Amplitude * (%) | 22 | |||||
| Screen | 8% | 403% | 20% | -4% | 155% | |
| Brightness middle (cd/m²) | 525 | 526 0% | 509 -3% | 579.9 10% | 509 -3% | 378 -28% |
| Brightness (cd/m²) | 513 | 506 -1% | 508 -1% | 576 12% | 479 -7% | 379 -26% |
| Brightness Distribution (%) | 87 | 92 6% | 97 11% | 92 6% | 90 3% | 98 13% |
| Black Level * (cd/m²) | 0.32 | 0.37 -16% | 0.01 97% | 0.34 -6% | 0.32 -0% | 0.02 94% |
| Contrast (:1) | 1641 | 1422 -13% | 50900 3002% | 1706 4% | 1591 -3% | 18900 1052% |
| Colorchecker dE 2000 * | 1.7 | 1.4 18% | 1.1 35% | 0.96 44% | 2.47 -45% | 1 41% |
| Colorchecker dE 2000 max. * | 4 | 2 50% | 2.5 37% | 2.39 40% | 4.73 -18% | 2.6 35% |
| Greyscale dE 2000 * | 2.7 | 2.1 22% | 1.5 44% | 1.4 48% | 1.5 44% | 1.2 56% |
| Gamma | 2.2 100% | 2.23 99% | 2.28 96% | 2.13 103% | 2.19 100% | 2.19 100% |
| CCT | 7010 93% | 6865 95% | 6294 103% | 6407 101% | 6790 96% | 6460 101% |
| Colorchecker dE 2000 calibrated * | 0.6 | 1.06 | ||||
| Total Average (Program / Settings) | -7% /
1% | 167% /
263% | -40% /
-4% | -8% /
-5% | 126% /
143% |
* ... smaller is better

Display Response Times
| ↔ Response Time Black to White | ||
|---|---|---|
| 14.7 ms ... rise ↗ and fall ↘ combined | ↗ 4.6 ms rise | 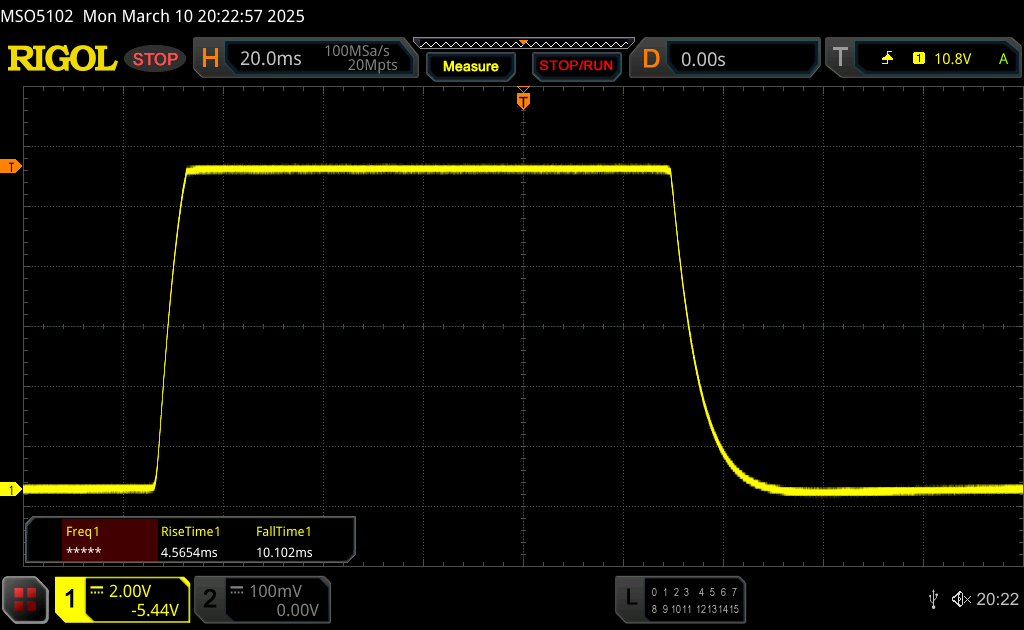 |
| ↘ 10.1 ms fall | ||
| The screen shows good response rates in our tests, but may be too slow for competitive gamers. In comparison, all tested devices range from 0.1 (minimum) to 240 (maximum) ms. » 36 % of all devices are better. This means that the measured response time is better than the average of all tested devices (19.8 ms). | ||
| ↔ Response Time 50% Grey to 80% Grey | ||
| 23.2 ms ... rise ↗ and fall ↘ combined | ↗ 10.5 ms rise | 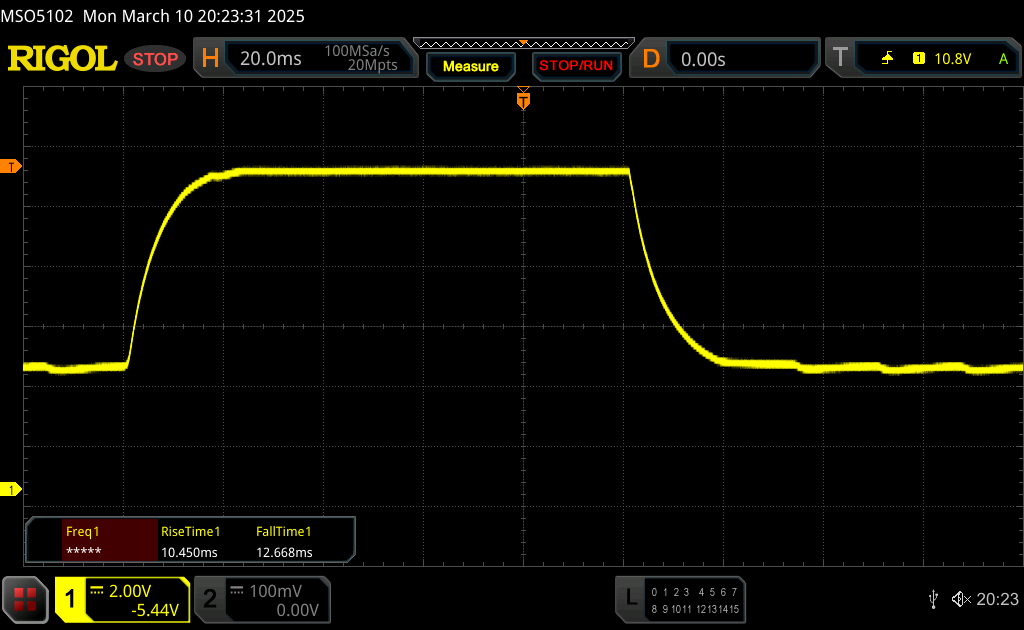 |
| ↘ 12.7 ms fall | ||
| The screen shows good response rates in our tests, but may be too slow for competitive gamers. In comparison, all tested devices range from 0.165 (minimum) to 636 (maximum) ms. » 34 % of all devices are better. This means that the measured response time is better than the average of all tested devices (31 ms). | ||
Screen Flickering / PWM (Pulse-Width Modulation)
| Screen flickering / PWM not detected | 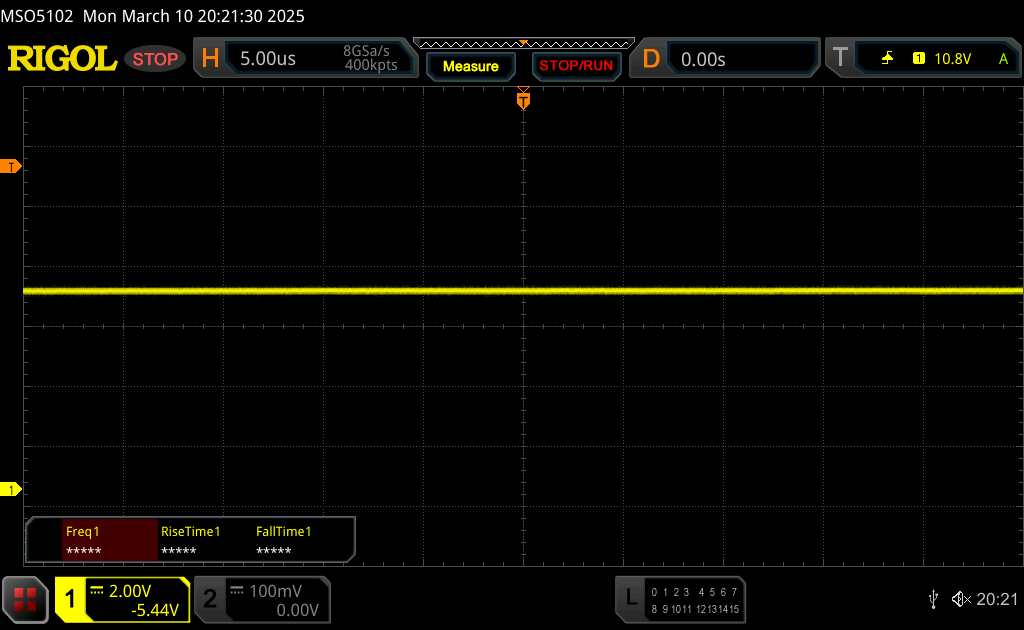 | ||
In comparison: 52 % of all tested devices do not use PWM to dim the display. If PWM was detected, an average of 7754 (minimum: 5 - maximum: 343500) Hz was measured. | |||
Performance - The MacBook Air now with up to 32 GB RAM
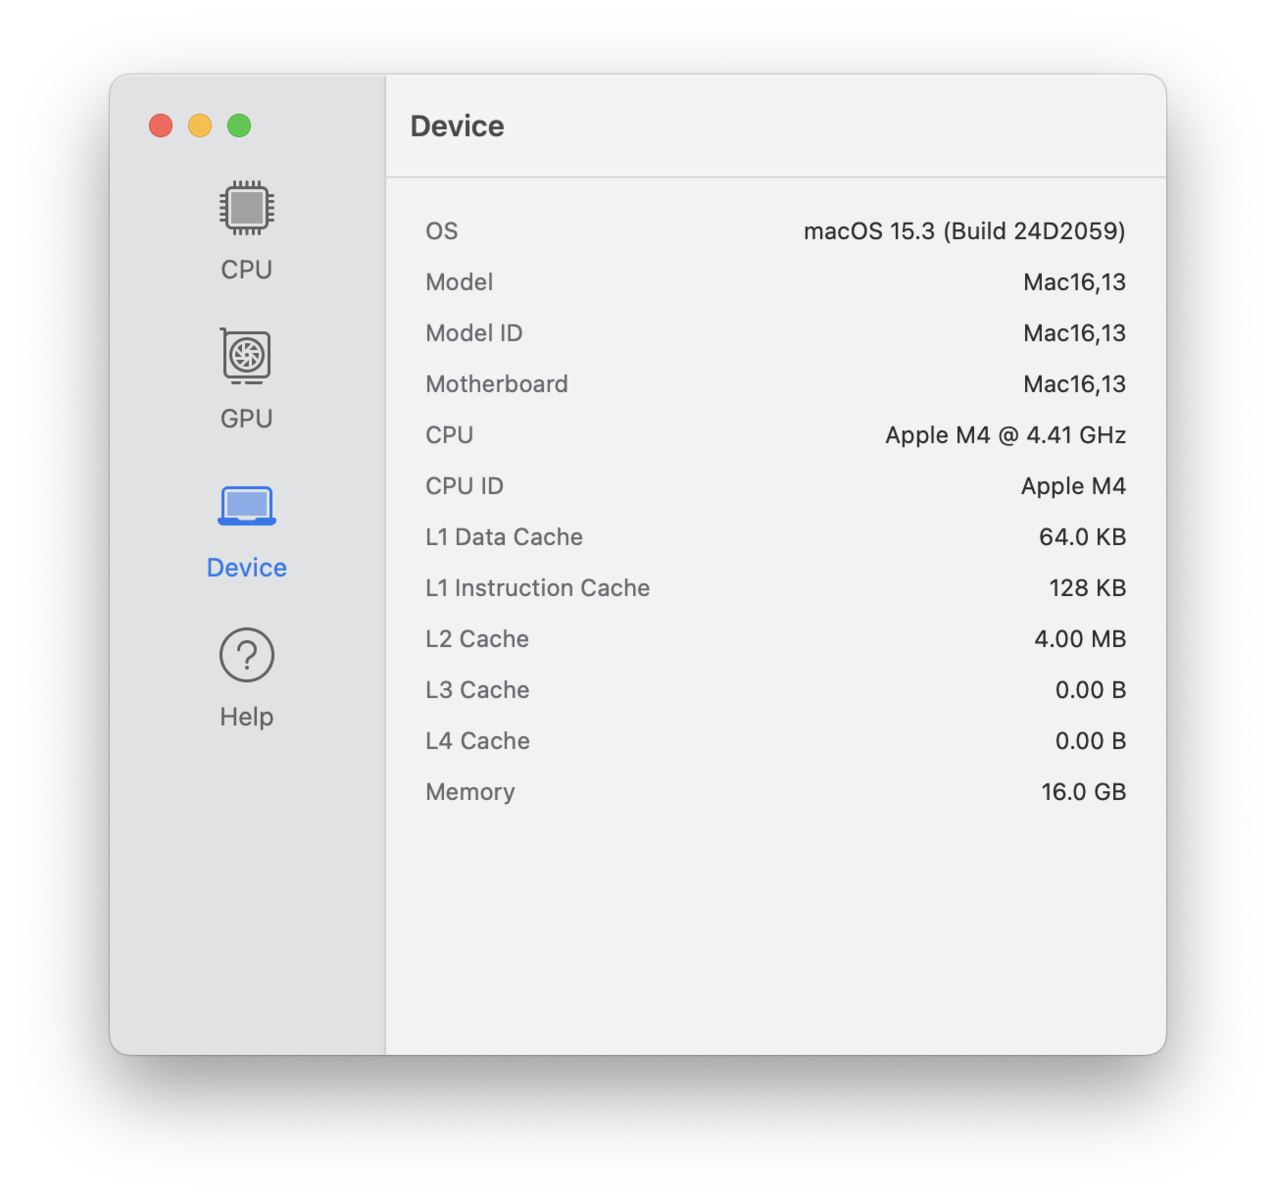
Processor - M4 SoC
We are already familiar with the M4 SoC from the current MacBook Pro 14, and its overall performance is once again very good. The M4 can consume a maximum of 20.5 watts inside our test device but during our test, this was quickly reduced and finally settled at 9 watts after 20 minutes of continuous load (~15.5 watts after 1 minute; 12 watts after 5 minutes). As a result, its multi-core performance was slightly lower than that of the MacBook Pro, but still very good overall, especially considering how long it ran the Cinebench 2024 multi-test (several minutes). After 30 minutes, its performance of 776 points was only 11% lower and therefore still better than the Lunar Lake competitors. Its performance was even better in the shorter Geekbench test.
The true highlight, however, is its enormous single-core performance, and the M4 doesn't have to hide from its larger siblings, the M4 Pro/Max. Depending on the benchmark, we are talking about an advantage of 30-45% over the current Lunar Lake or fast Snapdragon models with dual-core Turbo. As usual, its performance remains absolutely stable in battery mode.
Cinebench 2024: CPU Multi Core | CPU Single Core
Geekbench 6.7: Multi-Core | Single-Core
| Cinebench 2024 / CPU Multi Core | |
| Apple MacBook Pro 14 2024 M4 | |
| Asus Vivobook S 15 OLED Snapdragon | |
| Microsoft Surface Laptop 15 Snapdragon X Elite | |
| Average Apple M4 10-Core (815 - 986, n=5) | |
| Apple MacBook Air 15 M4 | |
| Lenovo Yoga Slim 7 15ILL9 Aura | |
| Apple MacBook Air 15 M3 | |
| Lenovo ThinkPad X9-15 Aura Edition | |
| Cinebench 2024 / CPU Single Core | |
| Average Apple M4 10-Core (173 - 177, n=5) | |
| Apple MacBook Pro 14 2024 M4 | |
| Apple MacBook Air 15 M4 | |
| Apple MacBook Air 15 M3 | |
| Microsoft Surface Laptop 15 Snapdragon X Elite | |
| Lenovo Yoga Slim 7 15ILL9 Aura | |
| Lenovo ThinkPad X9-15 Aura Edition | |
| Asus Vivobook S 15 OLED Snapdragon | |
System performance
The new MacBook Air 15 M4 is a very fast laptop and its results in the synthetic benchmarks were impressive. In the cross-platform CrossMark test, the MacBook outperformed the entire Windows competition. 16 GB RAM is installed as standard and a maximum of 32 GB RAM can now be selected ($400 surcharge).
WebXPRT 3: Overall
WebXPRT 4: Overall
Mozilla Kraken 1.1: Total
| CrossMark / Overall | |
| Average Apple M4 10-Core, Apple M4 10-core GPU (1944 - 2066, n=4) | |
| Apple MacBook Air 15 M4 | |
| Apple MacBook Air 15 M3 | |
| Lenovo ThinkPad X9-15 Aura Edition | |
| Average of class Subnotebook (365 - 2356, n=59, last 2 years) | |
| Lenovo Yoga Slim 7 15ILL9 Aura | |
| Microsoft Surface Laptop 15 Snapdragon X Elite | |
| Asus Vivobook S 15 OLED Snapdragon | |
| CrossMark / Productivity | |
| Average Apple M4 10-Core, Apple M4 10-core GPU (1797 - 1933, n=4) | |
| Apple MacBook Air 15 M4 | |
| Apple MacBook Air 15 M3 | |
| Lenovo ThinkPad X9-15 Aura Edition | |
| Lenovo Yoga Slim 7 15ILL9 Aura | |
| Average of class Subnotebook (364 - 2277, n=59, last 2 years) | |
| Microsoft Surface Laptop 15 Snapdragon X Elite | |
| Asus Vivobook S 15 OLED Snapdragon | |
| CrossMark / Creativity | |
| Average Apple M4 10-Core, Apple M4 10-core GPU (2298 - 2420, n=4) | |
| Apple MacBook Air 15 M4 | |
| Apple MacBook Air 15 M3 | |
| Lenovo ThinkPad X9-15 Aura Edition | |
| Average of class Subnotebook (372 - 2743, n=59, last 2 years) | |
| Lenovo Yoga Slim 7 15ILL9 Aura | |
| Microsoft Surface Laptop 15 Snapdragon X Elite | |
| Asus Vivobook S 15 OLED Snapdragon | |
| CrossMark / Responsiveness | |
| Average Apple M4 10-Core, Apple M4 10-core GPU (1393 - 1569, n=4) | |
| Apple MacBook Air 15 M4 | |
| Apple MacBook Air 15 M3 | |
| Average of class Subnotebook (312 - 1854, n=59, last 2 years) | |
| Lenovo ThinkPad X9-15 Aura Edition | |
| Microsoft Surface Laptop 15 Snapdragon X Elite | |
| Lenovo Yoga Slim 7 15ILL9 Aura | |
| Asus Vivobook S 15 OLED Snapdragon | |
| WebXPRT 3 / Overall | |
| Apple MacBook Air 15 M4 | |
| Average Apple M4 10-Core, Apple M4 10-core GPU (430 - 479, n=4) | |
| Apple MacBook Air 15 M3 | |
| Microsoft Surface Laptop 15 Snapdragon X Elite | |
| Asus Vivobook S 15 OLED Snapdragon | |
| Average of class Subnotebook (156 - 530, n=55, last 2 years) | |
| Lenovo Yoga Slim 7 15ILL9 Aura | |
| Lenovo ThinkPad X9-15 Aura Edition | |
| WebXPRT 4 / Overall | |
| Apple MacBook Air 15 M4 | |
| Average Apple M4 10-Core, Apple M4 10-core GPU (315 - 348, n=4) | |
| Apple MacBook Air 15 M3 | |
| Microsoft Surface Laptop 15 Snapdragon X Elite | |
| Asus Vivobook S 15 OLED Snapdragon | |
| Lenovo Yoga Slim 7 15ILL9 Aura | |
| Lenovo ThinkPad X9-15 Aura Edition | |
| Average of class Subnotebook (132 - 378, n=60, last 2 years) | |
| Mozilla Kraken 1.1 / Total | |
| Average of class Subnotebook (234 - 1104, n=60, last 2 years) | |
| Lenovo Yoga Slim 7 15ILL9 Aura | |
| Lenovo ThinkPad X9-15 Aura Edition | |
| Asus Vivobook S 15 OLED Snapdragon | |
| Microsoft Surface Laptop 15 Snapdragon X Elite | |
| Apple MacBook Air 15 M3 | |
| Average Apple M4 10-Core, Apple M4 10-core GPU (262 - 319, n=4) | |
| Apple MacBook Air 15 M4 | |
* ... smaller is better
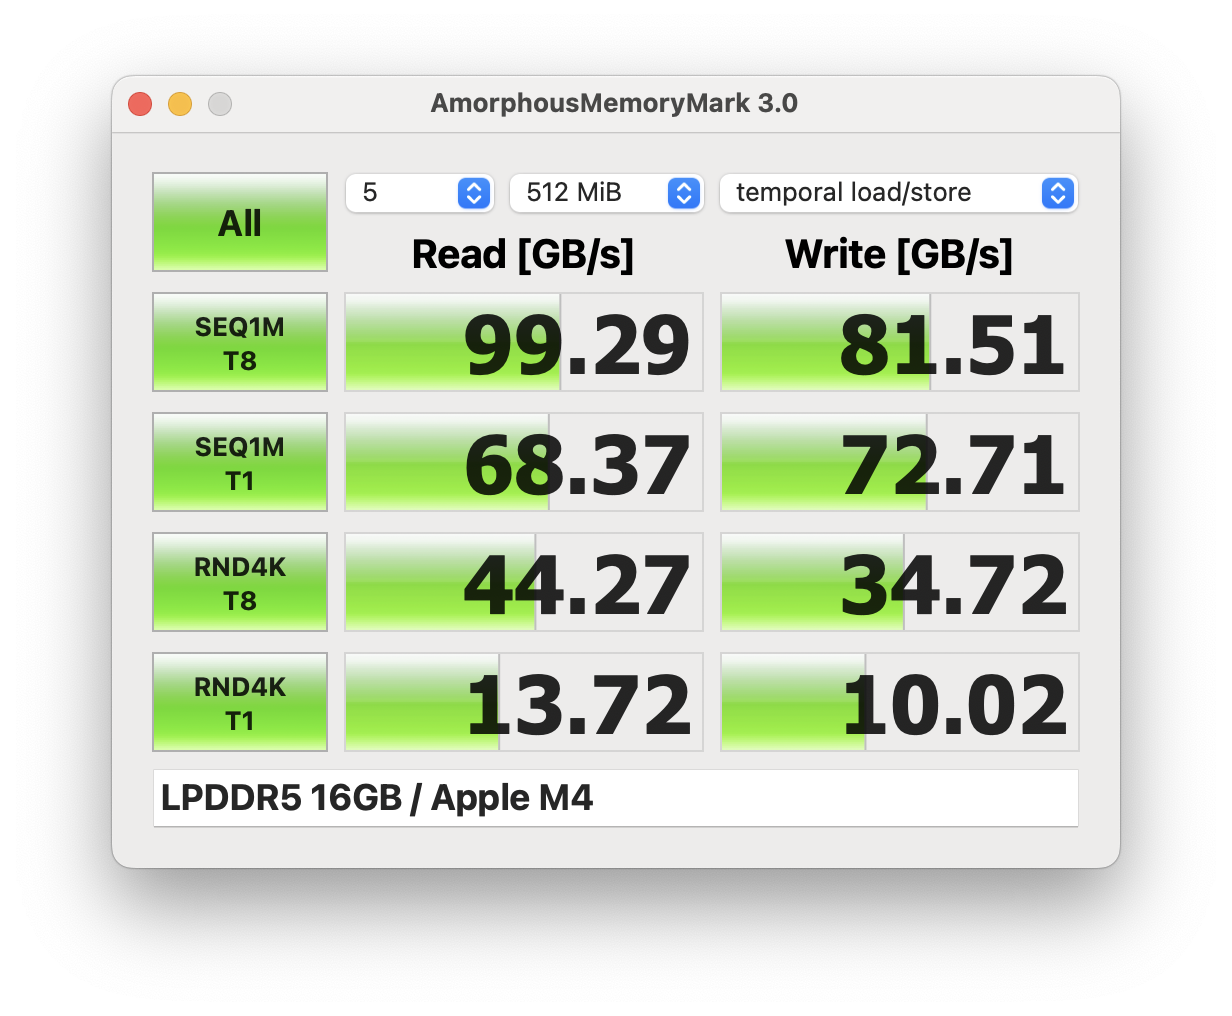
Storage device
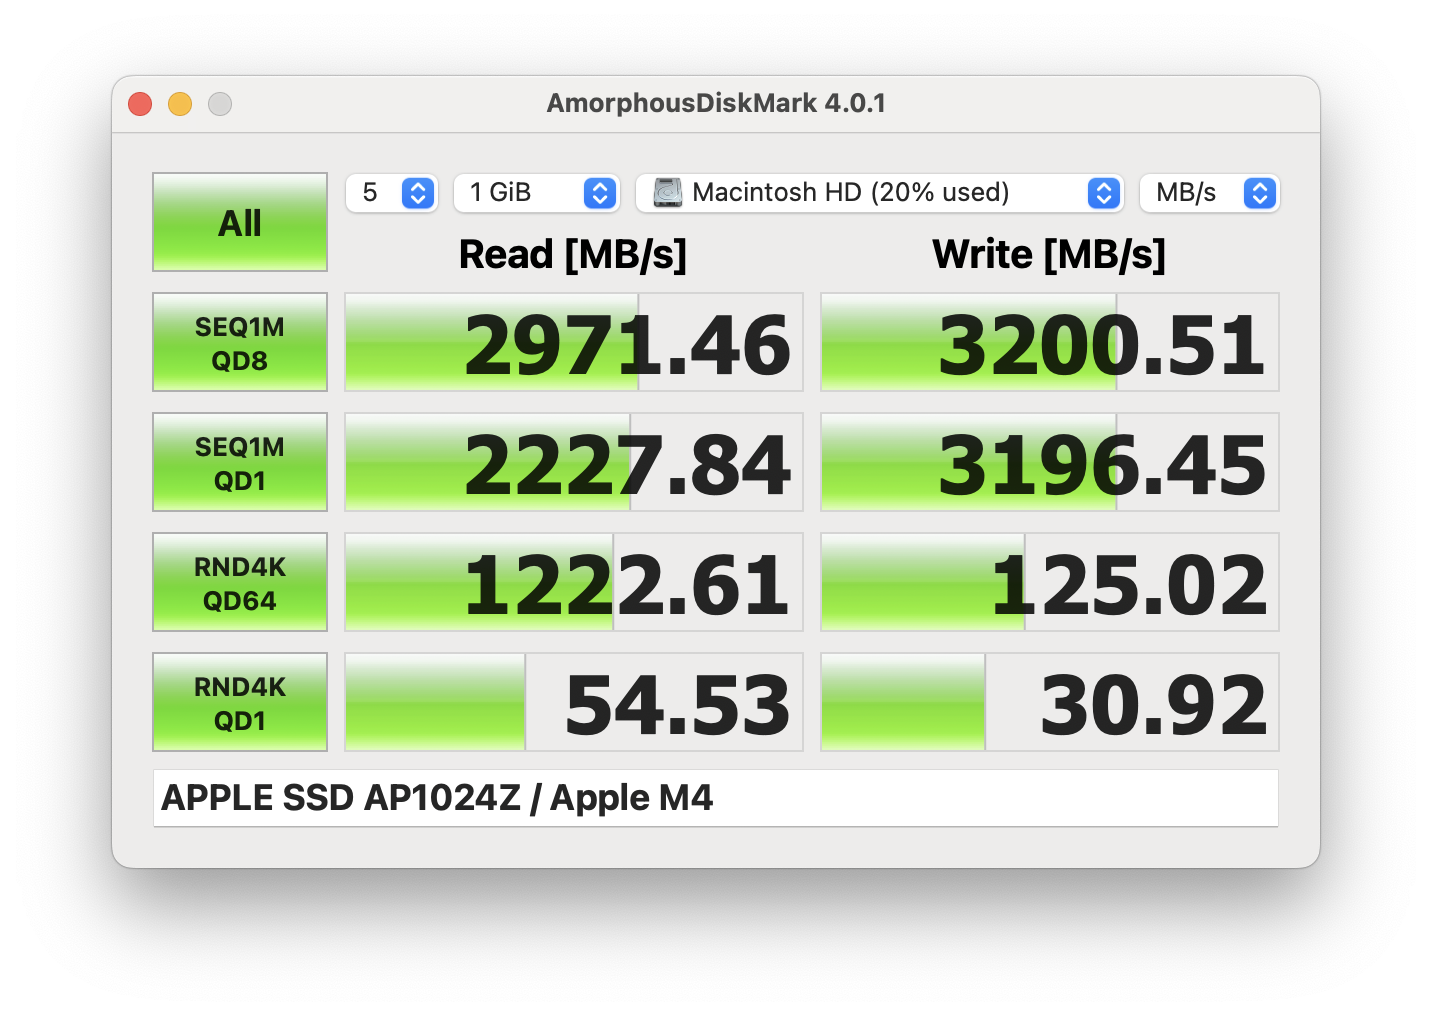
Its RAM is now at least 16 GB, but the MacBook's SSD capacity still starts at 256 GB. The 1-TB SSD (onboard) in our test device raises its total price by a whopping $600. Its transfer rates aren't particularly fast at a maximum of 3 GB/s, but this is good enough for everyday use. After first starting up the device, users have 955 GB at their disposal.
| Blackmagic Disk Speed Test / 5GB Read | |
| Apple MacBook Pro 16 2024 M4 Pro | |
| Apple MacBook Pro 14 2024 M4 Pro Entry | |
| Apple MacBook Pro 16 M4 Max | |
| Average of class Subnotebook (1592 - 6473, n=5, last 2 years) | |
| Average Apple SSD AP1024Z (2797 - 6752, n=9) | |
| Apple MacBook Pro 14 2024 M4 | |
| Apple MacBook Air 15 M3 | |
| Apple MacBook Air 15 M4 | |
| Apple Mac Mini M4 | |
| Blackmagic Disk Speed Test / 5GB Write | |
| Apple MacBook Pro 16 2024 M4 Pro | |
| Apple MacBook Pro 14 2024 M4 Pro Entry | |
| Apple MacBook Pro 16 M4 Max | |
| Average Apple SSD AP1024Z (2873 - 6431, n=9) | |
| Average of class Subnotebook (1541 - 6559, n=5, last 2 years) | |
| Apple MacBook Pro 14 2024 M4 | |
| Apple MacBook Air 15 M3 | |
| Apple MacBook Air 15 M4 | |
| Apple Mac Mini M4 | |
GPU performance
During our test, the performance of the M4 GPU with 10 cores was very good, especially in direct comparison with the Lunar Lake iGPU. Its performance was also comparable with the M4 MacBook Pro—at least during short benchmarks. Under longer load, the GPU's performance dropped by around 22%. Its gaming performance also proved to be quite good, although the availability of native titles (such as Baldur's Gate 3 in this case) is still the limiting factor here.
GFXBench: 3840x2160 4K Aztec Ruins High Tier Offscreen | 2560x1440 Aztec Ruins High Tier Offscreen
Geekbench 6.7: GPU Metal | GPU OpenCL
| 3DMark / Steel Nomad Light Score | |
| Apple MacBook Pro 14 2024 M4 | |
| Apple MacBook Air 15 M4 | |
| Average Apple M4 10-core GPU (3583 - 3989, n=5) | |
| Lenovo ThinkPad X9-15 Aura Edition | |
| Average of class Subnotebook (1034 - 5084, n=26, last 2 years) | |
| Asus Vivobook S 15 OLED Snapdragon | |
| 3DMark / Wild Life Extreme | |
| Apple MacBook Pro 14 2024 M4 | |
| Apple MacBook Air 15 M4 | |
| Average Apple M4 10-core GPU (7335 - 9162, n=4) | |
| Lenovo ThinkPad X9-15 Aura Edition | |
| Microsoft Surface Laptop 15 Snapdragon X Elite | |
| Average of class Subnotebook (659 - 11498, n=33, last 2 years) | |
| 3DMark / Wild Life Extreme Unlimited | |
| Apple MacBook Pro 14 2024 M4 | |
| Average Apple M4 10-core GPU (8457 - 9636, n=5) | |
| Apple MacBook Air 15 M4 | |
| Apple MacBook Air 15 M3 | |
| Lenovo ThinkPad X9-15 Aura Edition | |
| Asus Vivobook S 15 OLED Snapdragon | |
| Average of class Subnotebook (3225 - 9092, n=14, last 2 years) | |
| GFXBench / 4K Aztec Ruins High Tier Offscreen | |
| Apple MacBook Pro 14 2024 M4 | |
| Average Apple M4 10-core GPU (48.6 - 63.1, n=5) | |
| Apple MacBook Air 15 M4 | |
| Apple MacBook Air 15 M3 | |
| Asus Vivobook S 15 OLED Snapdragon | |
| Average of class Subnotebook (16.3 - 55.9, n=10, last 2 years) | |
| GFXBench / Aztec Ruins High Tier Offscreen | |
| Apple MacBook Pro 14 2024 M4 | |
| Average Apple M4 10-core GPU (105.4 - 144, n=5) | |
| Apple MacBook Air 15 M4 | |
| Apple MacBook Air 15 M3 | |
| Asus Vivobook S 15 OLED Snapdragon | |
| Average of class Subnotebook (37.4 - 123.3, n=10, last 2 years) | |
| Geekbench 6.7 / GPU Metal | |
| Apple MacBook Pro 14 2024 M4 | |
| Average Apple M4 10-core GPU (53465 - 57998, n=4) | |
| Average of class Subnotebook (31469 - 76530, n=5, last 2 years) | |
| Apple MacBook Air 15 M4 | |
| Apple MacBook Air 15 M3 | |
| 3DMark Steel Nomad Light Score | 3839 points | |
| 3DMark Steel Nomad Light Unlimited Score | 3851 points | |
Help | ||
| Blender / v3.3 Classroom METAL | |
| Apple MacBook Air 15 M3 | |
| Average of class Subnotebook (76.3 - 227, n=5, last 2 years) | |
| Apple MacBook Air 15 M4 | |
| Average Apple M4 10-core GPU (n=1) | |
| Blender / v3.3 Classroom CPU | |
| Microsoft Surface Laptop 15 Snapdragon X Elite | |
| Lenovo ThinkPad X9-15 Aura Edition | |
| Asus Vivobook S 15 OLED Snapdragon | |
| Lenovo Yoga Slim 7 15ILL9 Aura | |
| Average of class Subnotebook (241 - 861, n=59, last 2 years) | |
| Apple MacBook Air 15 M3 | |
| Apple MacBook Air 15 M4 | |
| Average Apple M4 10-core GPU (n=1) | |
| Blender / v3.3 Classroom oneAPI/Intel | |
| Average of class Subnotebook (105 - 396, n=11, last 2 years) | |
| Lenovo Yoga Slim 7 15ILL9 Aura | |
* ... smaller is better
| Total War Pharaoh - 1920x1080 Ultra Preset | |
| Apple MacBook Pro 14 2024 M4 Pro Entry | |
| Apple MacBook Pro 14 2024 M4 | |
| Average of class Subnotebook (14.9 - 71.1, n=9, last 2 years) | |
| Apple MacBook Air 15 M4 | |
| Apple MacBook Air 13 M3 10C GPU | |
| Shadow of the Tomb Raider - 1920x1080 Highest Preset AA:T | |
| Apple MacBook Pro 14 2024 M4 Pro Entry | |
| Apple MacBook Pro 14 2024 M4 | |
| Lenovo ThinkPad X9-15 Aura Edition | |
| Apple MacBook Air 15 M4 | |
| Average of class Subnotebook (17 - 42, n=6, last 2 years) | |
| Apple MacBook Air 13 M3 10C GPU | |
Cyberpunk 2077 ultra FPS diagram
| low | med. | high | ultra | |
|---|---|---|---|---|
| Shadow of the Tomb Raider (2018) | 106 | 43 | 39 | 34 |
| Baldur's Gate 3 (2023) | 44.7 | 34.2 | 29.8 | 27.9 |
| Cyberpunk 2077 (2023) | 32.5 | 26.1 | 21.9 | 18 |
| Total War Pharaoh (2023) | 51.1 | 45.7 | 44.5 | 35.2 |
Emissions & energy
Noise emissions
The MacBook Air 15 continues to be passively cooled and, as a result, is completely silent in every situation, which is simply a huge advantage over its Windows competitors.
| Apple MacBook Air 15 M4 M4 10-Core GPU, M4 10-Core, Apple SSD AP1024Z | Apple MacBook Air 15 M3 M3 10-Core GPU, M3, Apple SSD AP0512Z | Lenovo ThinkPad X9-15 Aura Edition Arc 140V, Core Ultra 7 258V, WD PC SN740 SDDQMQD-1T00 | Microsoft Surface Laptop 15 Snapdragon X Elite Adreno X1-85 3.8 TFLOPS, SD X Elite X1E-80-100, Samsung PM9B1 256GB MZ9L4256HCJQ | Lenovo Yoga Slim 7 15ILL9 Aura Arc 140V, Core Ultra 7 256V | Asus Vivobook S 15 OLED Snapdragon Adreno X1-85 3.8 TFLOPS, SD X Elite X1E-78-100, Micron 2400 MTFDKBA1T0QFM | |
|---|---|---|---|---|---|---|
| Noise | ||||||
| off / environment * (dB) | 24.4 | 23.3 | 23.2 | 24.3 | ||
| Idle Minimum * (dB) | 24.4 | 23.3 | 23.2 | 24.3 | ||
| Idle Average * (dB) | 24.4 | 23.3 | 23.2 | 24.3 | ||
| Idle Maximum * (dB) | 24.4 | 23.3 | 26.1 | 26.2 | ||
| Load Average * (dB) | 35.8 | 25.7 | 30.9 | 32.5 | ||
| Cyberpunk 2077 ultra * (dB) | 39.4 | 31.1 | 34.1 | 35.2 | ||
| Load Maximum * (dB) | 45 | 33.2 | 44.3 | 39.8 |
* ... smaller is better
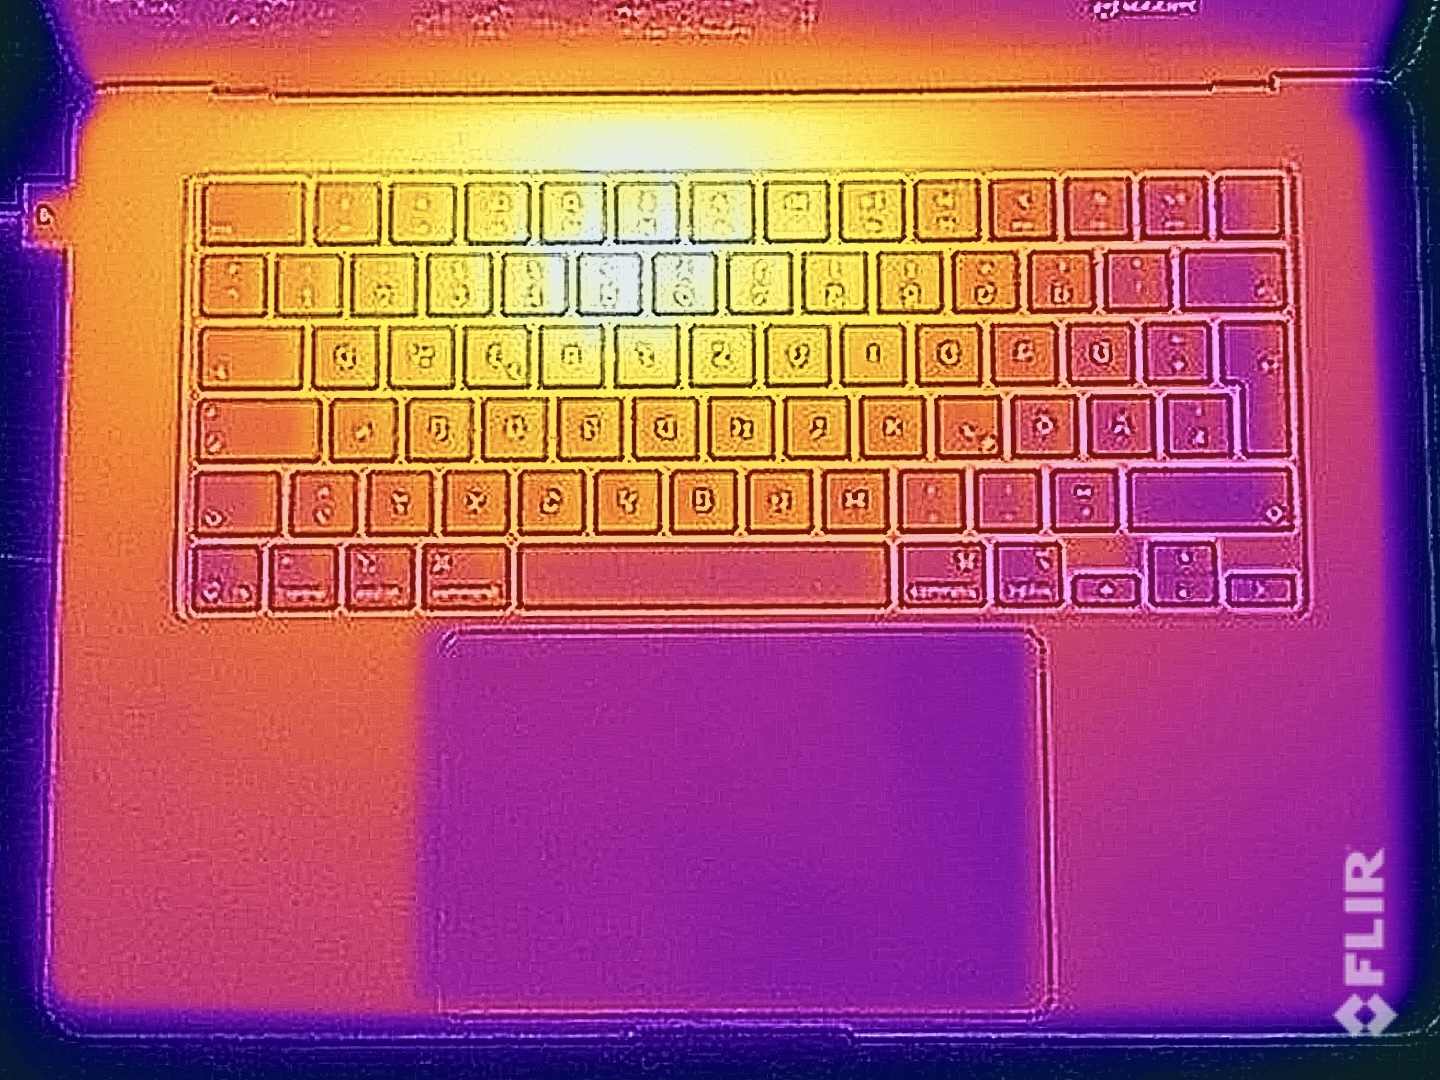
Temperature
Despite its passive cooling, the laptop's surface temperatures were uncritical during our test, with us measuring a maximum of 45 °C even under full load. So during normal everyday use, the MacBook Air will always stay very cool. Even its 35-watt power supply didn't get excessively warm at a maximum of 43 °C. During the stress test under combined CPU/GPU load, the SoC initially consumed 29 watts, but this quickly dropped to around 9 watts.
(±) The maximum temperature on the upper side is 44.9 °C / 113 F, compared to the average of 35.9 °C / 97 F, ranging from 21.4 to 59 °C for the class Subnotebook.
(±) The bottom heats up to a maximum of 43.9 °C / 111 F, compared to the average of 39.2 °C / 103 F
(+) In idle usage, the average temperature for the upper side is 23.1 °C / 74 F, compared to the device average of 30.8 °C / 87 F.
(±) 3: The average temperature for the upper side is 37.3 °C / 99 F, compared to the average of 30.8 °C / 87 F for the class Subnotebook.
(+) The palmrests and touchpad are reaching skin temperature as a maximum (35.5 °C / 95.9 F) and are therefore not hot.
(-) The average temperature of the palmrest area of similar devices was 28.2 °C / 82.8 F (-7.3 °C / -13.1 F).

| Apple MacBook Air 15 M4 Apple M4 10-Core, Apple M4 10-core GPU | Apple MacBook Air 15 M3 Apple M3, Apple M3 10-Core GPU | Lenovo ThinkPad X9-15 Aura Edition Intel Core Ultra 7 258V, Intel Arc Graphics 140V | Microsoft Surface Laptop 15 Snapdragon X Elite Qualcomm Snapdragon X Elite X1E-80-100, Qualcomm SD X Adreno X1-85 3.8 TFLOPS | Lenovo Yoga Slim 7 15ILL9 Aura Intel Core Ultra 7 256V, Intel Arc Graphics 140V | Asus Vivobook S 15 OLED Snapdragon Qualcomm Snapdragon X Elite X1E-78-100, Qualcomm SD X Adreno X1-85 3.8 TFLOPS | |
|---|---|---|---|---|---|---|
| Heat | 1% | 2% | 6% | -21% | -12% | |
| Maximum Upper Side * (°C) | 44.9 | 44.3 1% | 42.1 6% | 45.4 -1% | 46.2 -3% | 43.6 3% |
| Maximum Bottom * (°C) | 43.9 | 43.4 1% | 39.5 10% | 37.2 15% | 41 7% | 53.1 -21% |
| Idle Upper Side * (°C) | 23.4 | 23.1 1% | 24.5 -5% | 22.4 4% | 34 -45% | 26.7 -14% |
| Idle Bottom * (°C) | 23.5 | 23.3 1% | 24.4 -4% | 22 6% | 33.8 -44% | 27.2 -16% |
* ... smaller is better
Speakers
The Mac's sound system is unchanged, still consisting of 6 speakers whose overall quality is very good—but the competition has since caught up and is on a comparable level.
Apple MacBook Air 15 M4 audio analysis
(+) | speakers can play relatively loud (85.8 dB)
Bass 100 - 315 Hz
(±) | reduced bass - on average 8.2% lower than median
(±) | linearity of bass is average (9.4% delta to prev. frequency)
Mids 400 - 2000 Hz
(+) | balanced mids - only 1.6% away from median
(+) | mids are linear (2.4% delta to prev. frequency)
Highs 2 - 16 kHz
(+) | balanced highs - only 4.2% away from median
(+) | highs are linear (4.3% delta to prev. frequency)
Overall 100 - 16.000 Hz
(+) | overall sound is linear (8% difference to median)
Compared to same class
» 2% of all tested devices in this class were better, 1% similar, 97% worse
» The best had a delta of 5%, average was 18%, worst was 53%
Compared to all devices tested
» 2% of all tested devices were better, 1% similar, 98% worse
» The best had a delta of 4%, average was 23%, worst was 134%
Lenovo ThinkPad X9-15 Aura Edition audio analysis
(+) | speakers can play relatively loud (87.5 dB)
Bass 100 - 315 Hz
(±) | reduced bass - on average 12.5% lower than median
(+) | bass is linear (6.8% delta to prev. frequency)
Mids 400 - 2000 Hz
(+) | balanced mids - only 3.1% away from median
(+) | mids are linear (5.3% delta to prev. frequency)
Highs 2 - 16 kHz
(+) | balanced highs - only 2.4% away from median
(+) | highs are linear (3.3% delta to prev. frequency)
Overall 100 - 16.000 Hz
(+) | overall sound is linear (9.5% difference to median)
Compared to same class
» 1% of all tested devices in this class were better, 0% similar, 99% worse
» The best had a delta of 7%, average was 21%, worst was 53%
Compared to all devices tested
» 4% of all tested devices were better, 1% similar, 95% worse
» The best had a delta of 4%, average was 23%, worst was 134%
Microsoft Surface Laptop 15 Snapdragon X Elite audio analysis
(±) | speaker loudness is average but good (81 dB)
Bass 100 - 315 Hz
(±) | reduced bass - on average 11.7% lower than median
(±) | linearity of bass is average (9.1% delta to prev. frequency)
Mids 400 - 2000 Hz
(+) | balanced mids - only 3.3% away from median
(+) | mids are linear (3.2% delta to prev. frequency)
Highs 2 - 16 kHz
(+) | balanced highs - only 3.1% away from median
(+) | highs are linear (6.3% delta to prev. frequency)
Overall 100 - 16.000 Hz
(+) | overall sound is linear (11.4% difference to median)
Compared to same class
» 3% of all tested devices in this class were better, 2% similar, 95% worse
» The best had a delta of 7%, average was 21%, worst was 53%
Compared to all devices tested
» 7% of all tested devices were better, 2% similar, 90% worse
» The best had a delta of 4%, average was 23%, worst was 134%
Lenovo Yoga Slim 7 15ILL9 Aura audio analysis
(+) | speakers can play relatively loud (83.5 dB)
Bass 100 - 315 Hz
(+) | good bass - only 4.1% away from median
(+) | bass is linear (5.5% delta to prev. frequency)
Mids 400 - 2000 Hz
(+) | balanced mids - only 1.7% away from median
(+) | mids are linear (1.6% delta to prev. frequency)
Highs 2 - 16 kHz
(+) | balanced highs - only 2.4% away from median
(+) | highs are linear (4.9% delta to prev. frequency)
Overall 100 - 16.000 Hz
(+) | overall sound is linear (5.3% difference to median)
Compared to same class
» 1% of all tested devices in this class were better, 1% similar, 98% worse
» The best had a delta of 5%, average was 17%, worst was 45%
Compared to all devices tested
» 0% of all tested devices were better, 0% similar, 100% worse
» The best had a delta of 4%, average was 23%, worst was 134%
Asus Vivobook S 15 OLED Snapdragon audio analysis
(±) | speaker loudness is average but good (79.9 dB)
Bass 100 - 315 Hz
(±) | reduced bass - on average 8.2% lower than median
(±) | linearity of bass is average (11% delta to prev. frequency)
Mids 400 - 2000 Hz
(+) | balanced mids - only 2.7% away from median
(+) | mids are linear (4.5% delta to prev. frequency)
Highs 2 - 16 kHz
(+) | balanced highs - only 3% away from median
(+) | highs are linear (5.8% delta to prev. frequency)
Overall 100 - 16.000 Hz
(+) | overall sound is linear (9.8% difference to median)
Compared to same class
» 13% of all tested devices in this class were better, 2% similar, 85% worse
» The best had a delta of 5%, average was 17%, worst was 45%
Compared to all devices tested
» 4% of all tested devices were better, 1% similar, 95% worse
» The best had a delta of 4%, average was 23%, worst was 134%
Power consumption
Its consumption values are practically identical to those of the predecessor model. The IPS panel still requires a relatively high amount of power at full brightness, and the Air consumes more than its rivals. During the stress test, the 35-watt power supply was only the limiting factor for a few seconds and was sufficient in total—but there didn't seem to be much reserve for charging the battery at the same time. An optional 70-watt power supply can be selected at no extra charge.
| Off / Standby | |
| Idle | |
| Load |
|
Key:
min: | |
| Apple MacBook Air 15 M4 M4 10-Core, M4 10-Core GPU, Apple SSD AP1024Z, IPS, 2880x1864, 15.3" | Apple MacBook Air 15 M3 M3, M3 10-Core GPU, Apple SSD AP0512Z, IPS, 2880x1864, 15.3" | Lenovo ThinkPad X9-15 Aura Edition Core Ultra 7 258V, Arc 140V, WD PC SN740 SDDQMQD-1T00, OLED, 2880x1800, 15.3" | Microsoft Surface Laptop 15 Snapdragon X Elite SD X Elite X1E-80-100, Adreno X1-85 3.8 TFLOPS, Samsung PM9B1 256GB MZ9L4256HCJQ, IPS, 2496x1664, 15" | Lenovo Yoga Slim 7 15ILL9 Aura Core Ultra 7 256V, Arc 140V, , IPS, 2880x1800, 15.3" | Asus Vivobook S 15 OLED Snapdragon SD X Elite X1E-78-100, Adreno X1-85 3.8 TFLOPS, Micron 2400 MTFDKBA1T0QFM, OLED, 2880x1620, 15.6" | |
|---|---|---|---|---|---|---|
| Power Consumption | 1% | -16% | -28% | -42% | -30% | |
| Idle Minimum * (Watt) | 2.2 | 2.15 2% | 2.4 -9% | 3 -36% | 3.4 -55% | 4.4 -100% |
| Idle Average * (Watt) | 11.5 | 11.2 3% | 3.9 66% | 8.3 28% | 8.8 23% | 6.2 46% |
| Idle Maximum * (Watt) | 11.6 | 11.5 1% | 5.1 56% | 8.4 28% | 9.3 20% | 7.5 35% |
| Load Average * (Watt) | 34.5 | 35.8 -4% | 42.5 -23% | 34.3 1% | 45.4 -32% | 33.6 3% |
| Cyberpunk 2077 ultra * (Watt) | 24.4 | 43.5 -78% | 45.8 -88% | 49.4 -102% | 39 -60% | |
| Cyberpunk 2077 ultra external monitor * (Watt) | 26.2 | 40.2 -53% | 41 -56% | 44.8 -71% | 38.9 -48% | |
| Load Maximum * (Watt) | 37.5 | 37.2 1% | 64.4 -72% | 65.2 -74% | 66.3 -77% | 69.3 -85% |
| Witcher 3 ultra * (Watt) | 29.6 | 29.9 |
* ... smaller is better
Power consumption Cyberpunk / stress test
Power consumption with external monitor
Runtimes
There are only minimal changes to its battery life compared to the old model. During the WLAN test at 150 cd/m², we noted a runtime of 16.5 hours and at full brightness, it was only 6:45 hours—this matches its consumption values. The Air achieved almost 19 hours in the video test. Considering the battery's capacity, these are good results, but the ThinkPad X9 lasted longer during all scenarios (especially at maximum brightness). Its charging time using the 35-watt power supply is a long 02:44 hours.
| Apple MacBook Air 15 M4 M4 10-Core, M4 10-Core GPU, 66.5 Wh | Apple MacBook Air 15 M3 M3, M3 10-Core GPU, 66.5 Wh | Lenovo ThinkPad X9-15 Aura Edition Core Ultra 7 258V, Arc 140V, 80 Wh | Microsoft Surface Laptop 15 Snapdragon X Elite SD X Elite X1E-80-100, Adreno X1-85 3.8 TFLOPS, 64 Wh | Lenovo Yoga Slim 7 15ILL9 Aura Core Ultra 7 256V, Arc 140V, 70 Wh | Asus Vivobook S 15 OLED Snapdragon SD X Elite X1E-78-100, Adreno X1-85 3.8 TFLOPS, 70 Wh | Average of class Subnotebook | |
|---|---|---|---|---|---|---|---|
| Battery runtime | 0% | 14% | -10% | -5% | -22% | -17% | |
| H.264 (h) | 18.9 | 18.6 -2% | 23 22% | 16.3 -14% | 14.8 -22% | 15.3 ? -19% | |
| WiFi v1.3 (h) | 16.5 | 16.9 2% | 17.5 6% | 14.8 -10% | 17.1 4% | 13.1 -21% | 14 ? -15% |
Notebookcheck total rating
Apple MacBook Air 15 M4
- 03/11/2025 v8
Andreas Osthoff
 Total Sustainability Score:
 Possible alternatives compared
Image | Model / Review | Price | Weight | Height | Display |
|---|---|---|---|---|---|
1. 91.2%  | Apple MacBook Air 15 M4 Apple M4 10-Core ⎘ Apple M4 10-core GPU ⎘ 16 GB Memory, 1024 GB SSD | Amazon: List Price: 1999€ | 1.5 kg | 11.5 mm | 15.30" 2880x1864 224 PPI IPS |
2. 90.1% 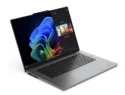 | Lenovo ThinkPad X9-15 Aura Edition Intel Core Ultra 7 258V ⎘ Intel Arc Graphics 140V ⎘ 32 GB Memory, 1024 GB SSD | Amazon: List Price: 1989€ | 1.4 kg | 17.7 mm | 15.30" 2880x1800 222 PPI OLED |
3. 84.3% 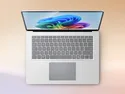 | Microsoft Surface Laptop 15 Snapdragon X Elite Qualcomm Snapdragon X Elite X1E-80-100 ⎘ Qualcomm SD X Adreno X1-85 3.8 TFLOPS ⎘ 16 GB Memory, 256 GB SSD | Amazon: List Price: 1100 USD | 1.7 kg | 18.29 mm | 15.00" 2496x1664 200 PPI IPS |
4. 84.3% 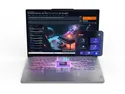 | Lenovo Yoga Slim 7 15ILL9 Aura Intel Core Ultra 7 256V ⎘ Intel Arc Graphics 140V ⎘ 16 GB Memory | Amazon: List Price: 1380 USD | 1.5 kg | 13.9 mm | 15.30" 2880x1800 222 PPI IPS |
5. 83.3% 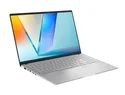 | Asus Vivobook S 15 OLED Snapdragon Qualcomm Snapdragon X Elite X1E-78-100 ⎘ Qualcomm SD X Adreno X1-85 3.8 TFLOPS ⎘ 16 GB Memory, 1024 GB SSD | Amazon: 1. $1,299.99 ASUS Vivobook S 16 AI Copilo... 2. $799.99 ASUS Vivobook S 15 OLED Lapt... 3. $699.99 ASUS VivoBook S 15 OLED Slim... List Price: 1299€ | 1.4 kg | 15.9 mm | 15.60" 2880x1620 212 PPI OLED |
6. 91.6% v7 (old)  | Apple MacBook Air 15 M3 Apple M3 ⎘ Apple M3 10-Core GPU ⎘ 16 GB Memory, 512 GB SSD | Amazon: List Price: 2059€ | 1.5 kg | 11.5 mm | 15.30" 2880x1864 IPS |
Transparency
The selection of devices to be reviewed is made by our editorial team. The test sample was provided to the author as a loan by the manufacturer or retailer for the purpose of this review. The lender had no influence on this review, nor did the manufacturer receive a copy of this review before publication. There was no obligation to publish this review. As an independent media company, Notebookcheck is not subjected to the authority of manufacturers, retailers or publishers.
This is how Notebookcheck is testing
Every year, Notebookcheck independently reviews hundreds of laptops and smartphones using standardized procedures to ensure that all results are comparable. We have continuously developed our test methods for around 20 years and set industry standards in the process. In our test labs, high-quality measuring equipment is utilized by experienced technicians and editors. These tests involve a multi-stage validation process. Our complex rating system is based on hundreds of well-founded measurements and benchmarks, which maintains objectivity. Further information on our test methods can be found here.

