Notebookcheck Logo

Total War Pharaoh review: Laptop and desktop benchmarks

Off to Egypt. The established Total War series has received a new spin-off: Pharao. Thanks to its integrated benchmark, the game is well-suited for our performance test. We have tested multiple laptop and desktop GPUs to see how well they can run the game.
Total War Pharaoh

Test laptops

XMG Neo 17 E23 (RTX 4090)
Schenker Key 17 Pro E23 (RTX 4080)
XMG Pro 15 E23 (RTX 4070 & RTX 4060)
XMG Focus 15 E23 (RTX 4050)
Asus ROG Strix Scar 17 (RTX 3080 Ti)
Asus ROG Zephyrus G14 (RX 6800S & 680M)

We currently run our gaming benchmarks with these laptops. Clicking on the photos will take you to the respective manufacturer's website. All other test systems (tower PCs, mini PCs, ...) are listed at the end of the article.

Tech

While Total War Pharaoh has been quite well received by the press so far, it has received rather mixed feedback from the community. Our benchmark article primarily focuses on the tech and speed of the new Total War off-shoot.

Total War Pharaoh
Total War Pharaoh
Total War Pharaoh
Total War Pharaoh
Total War Pharaoh
Total War Pharaoh

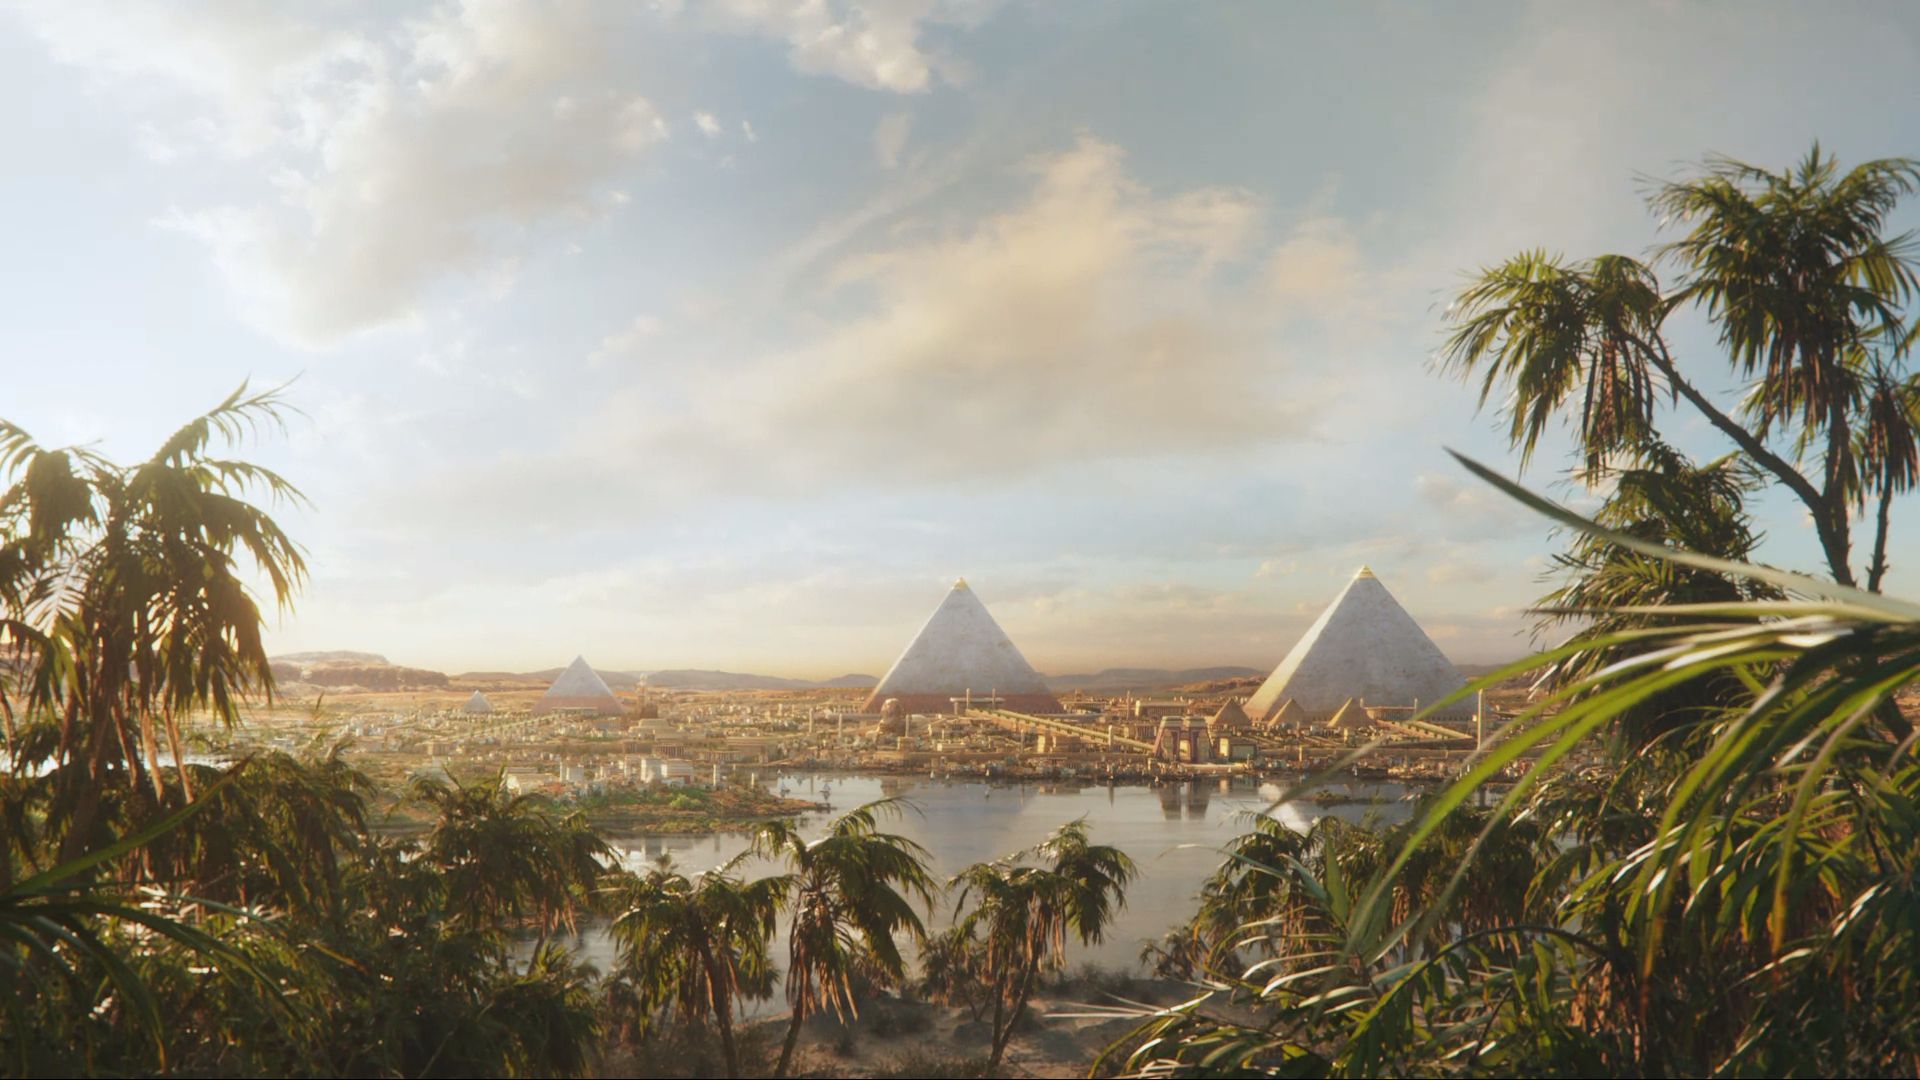
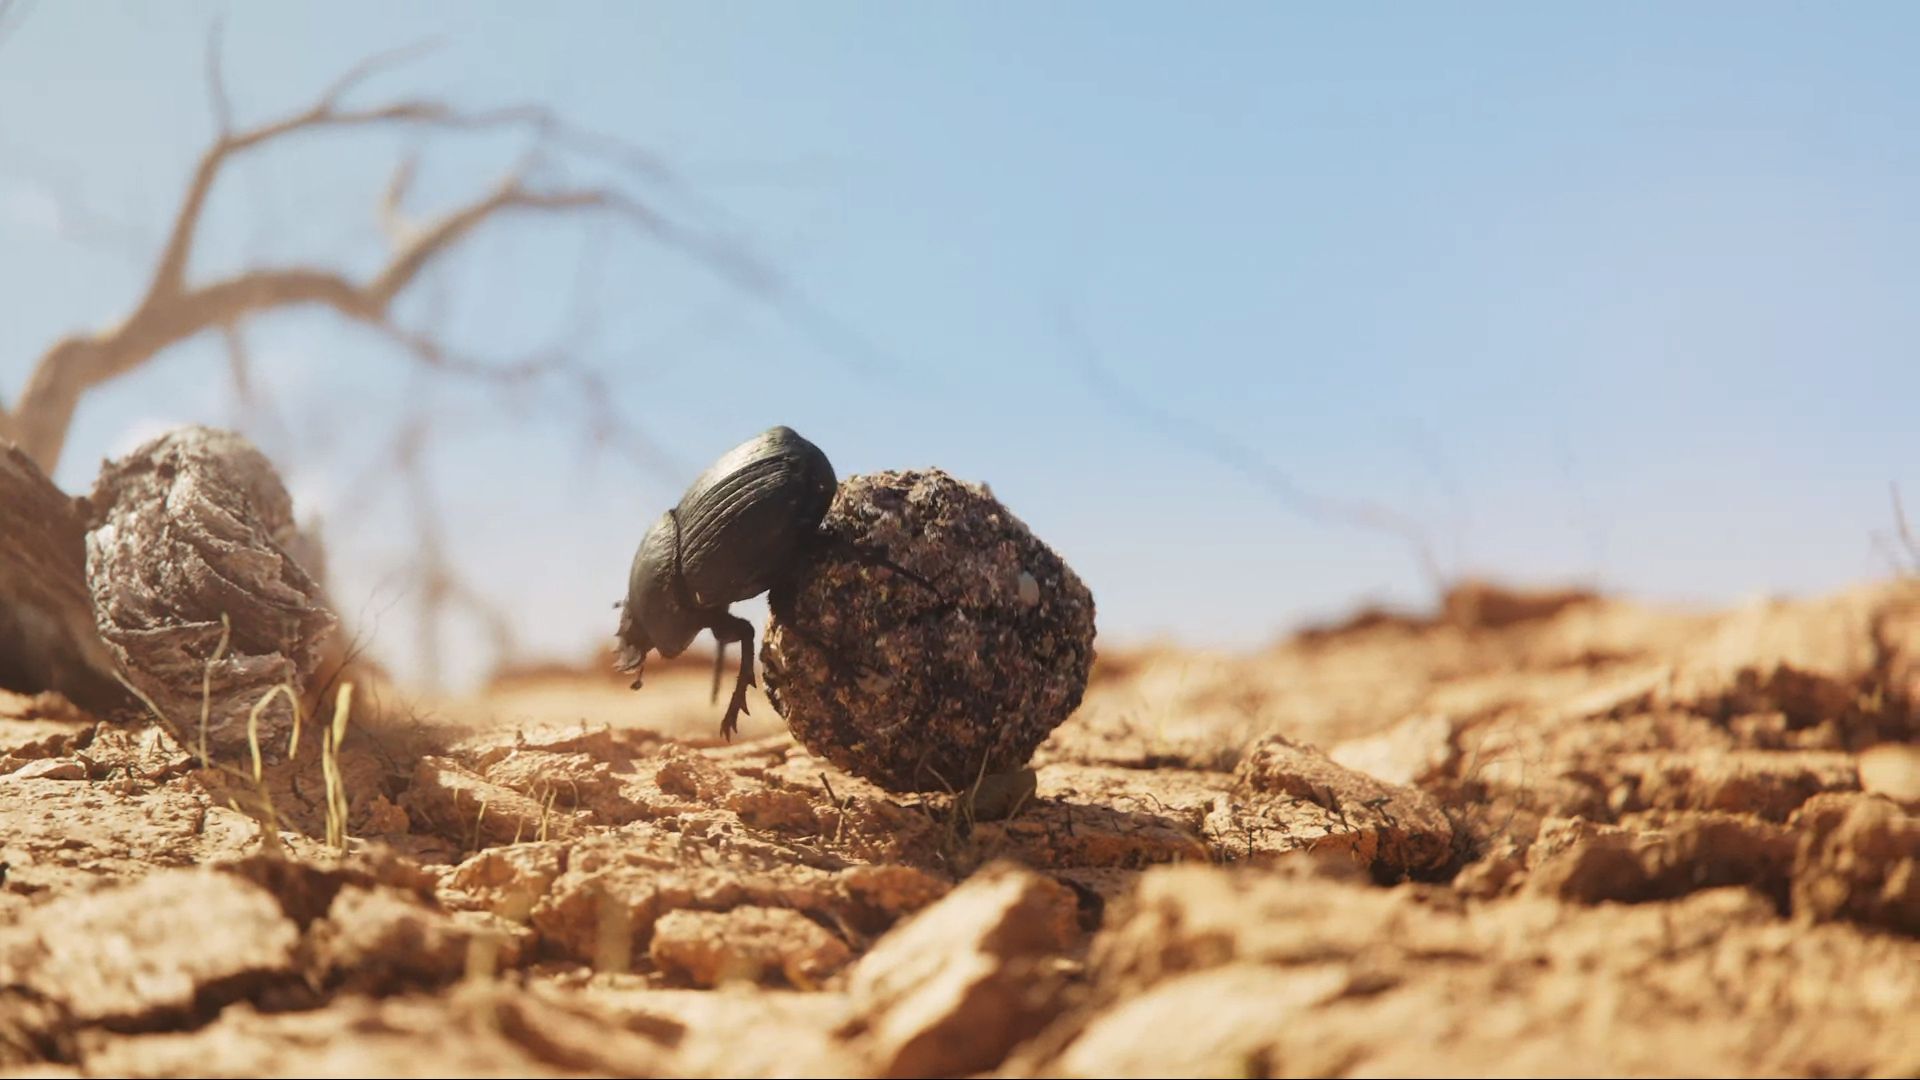
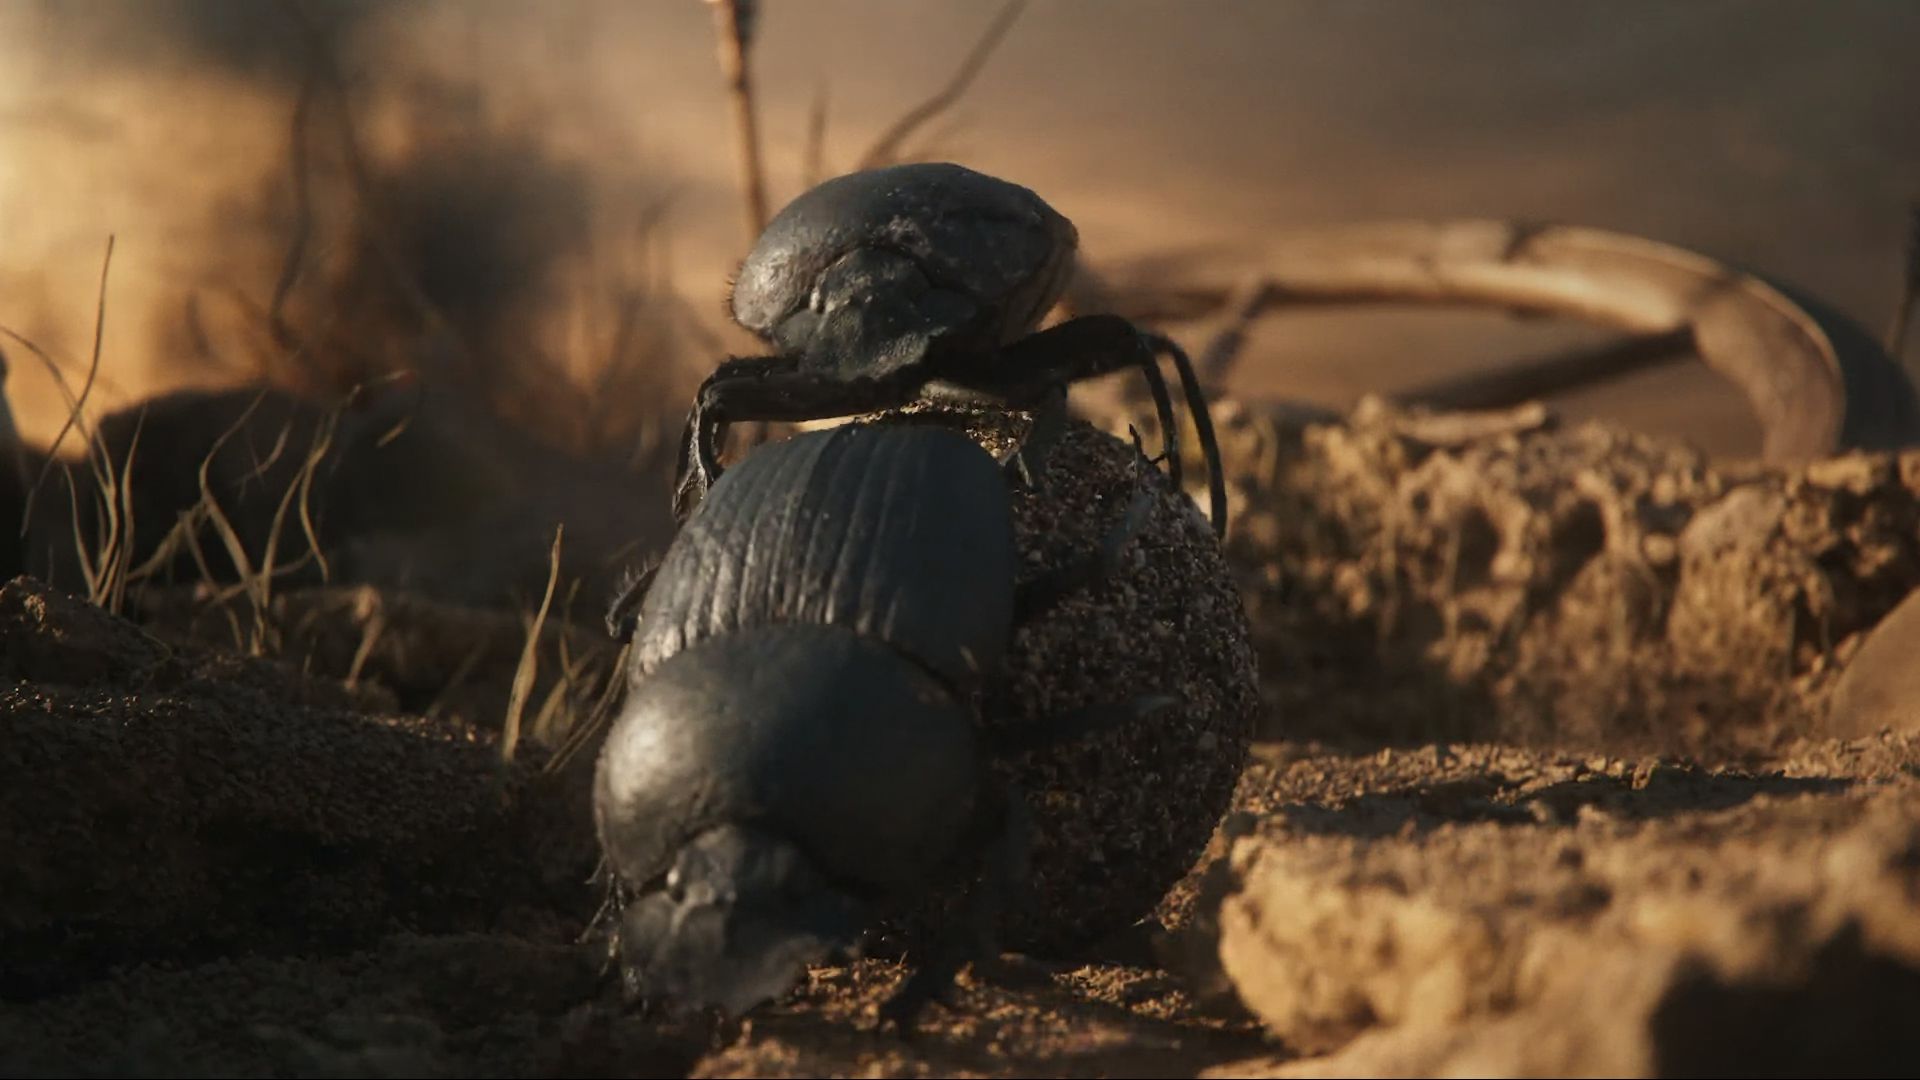
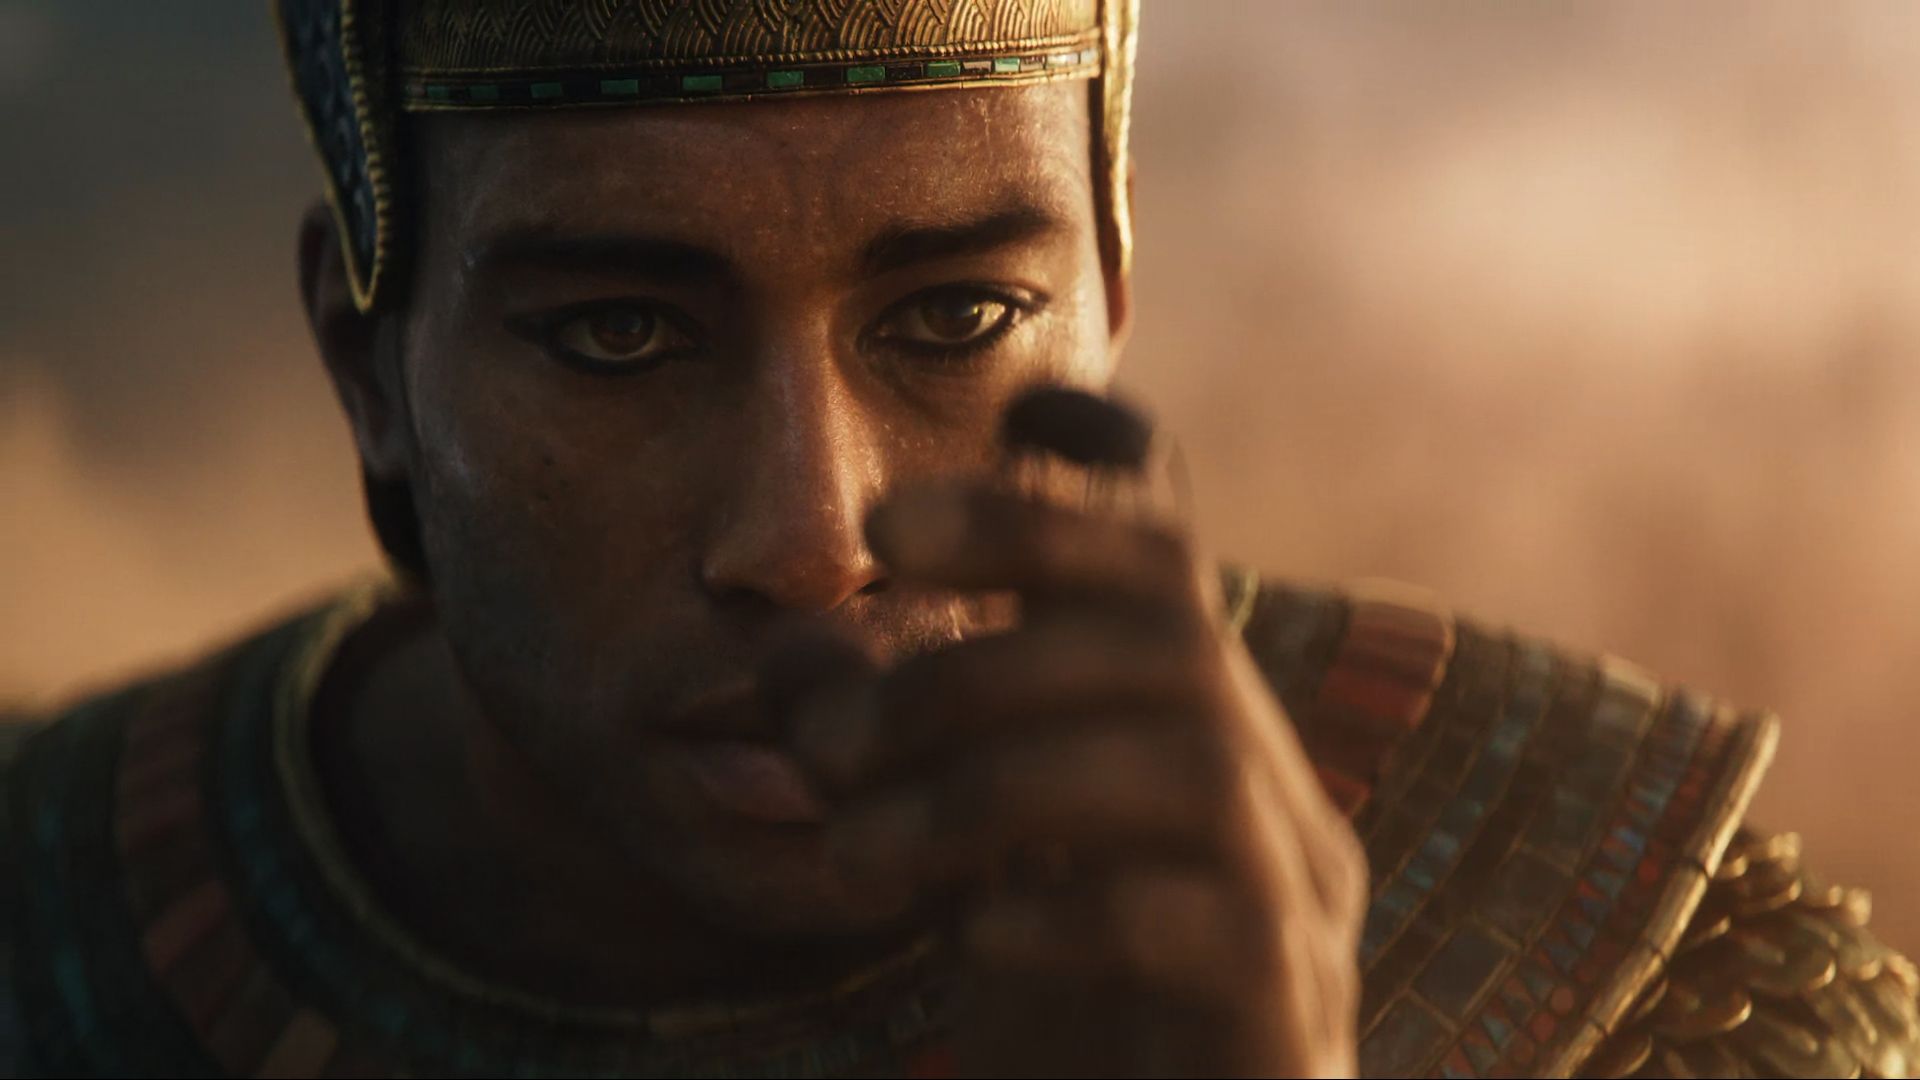
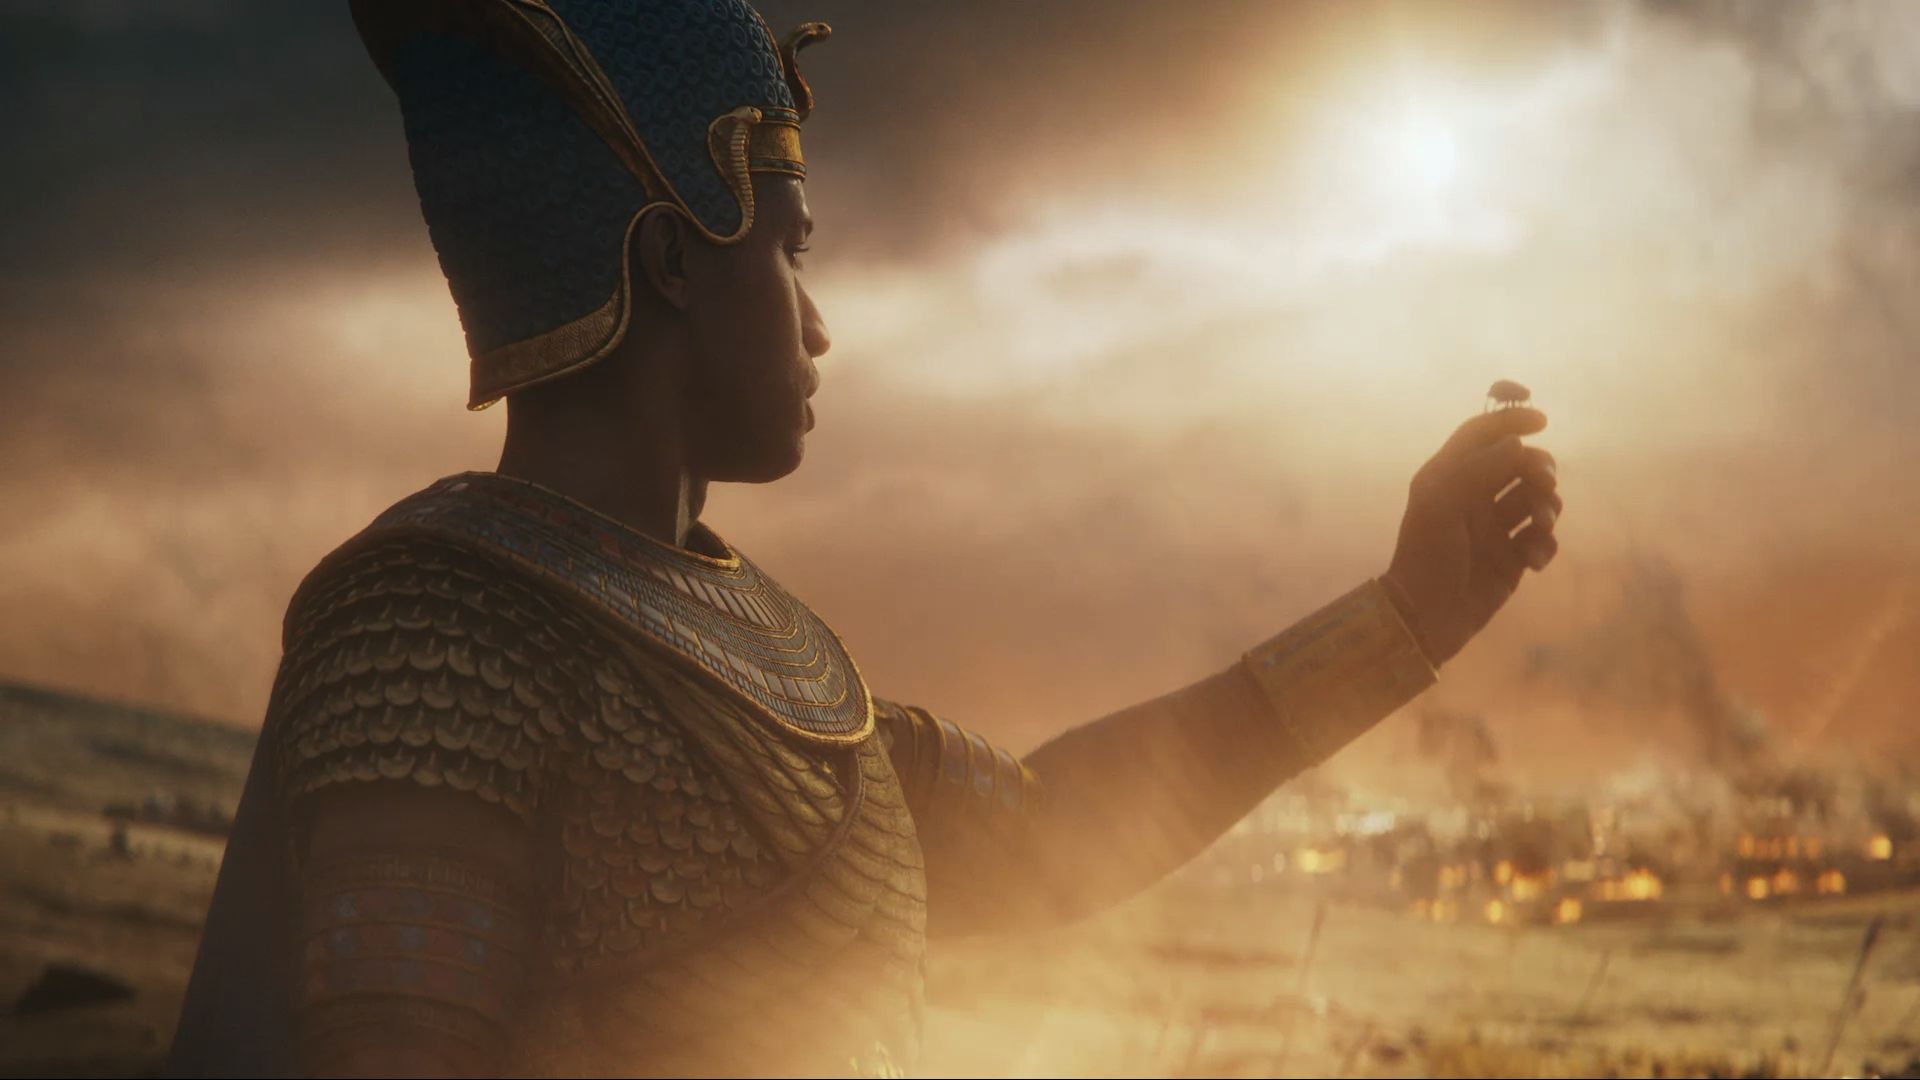
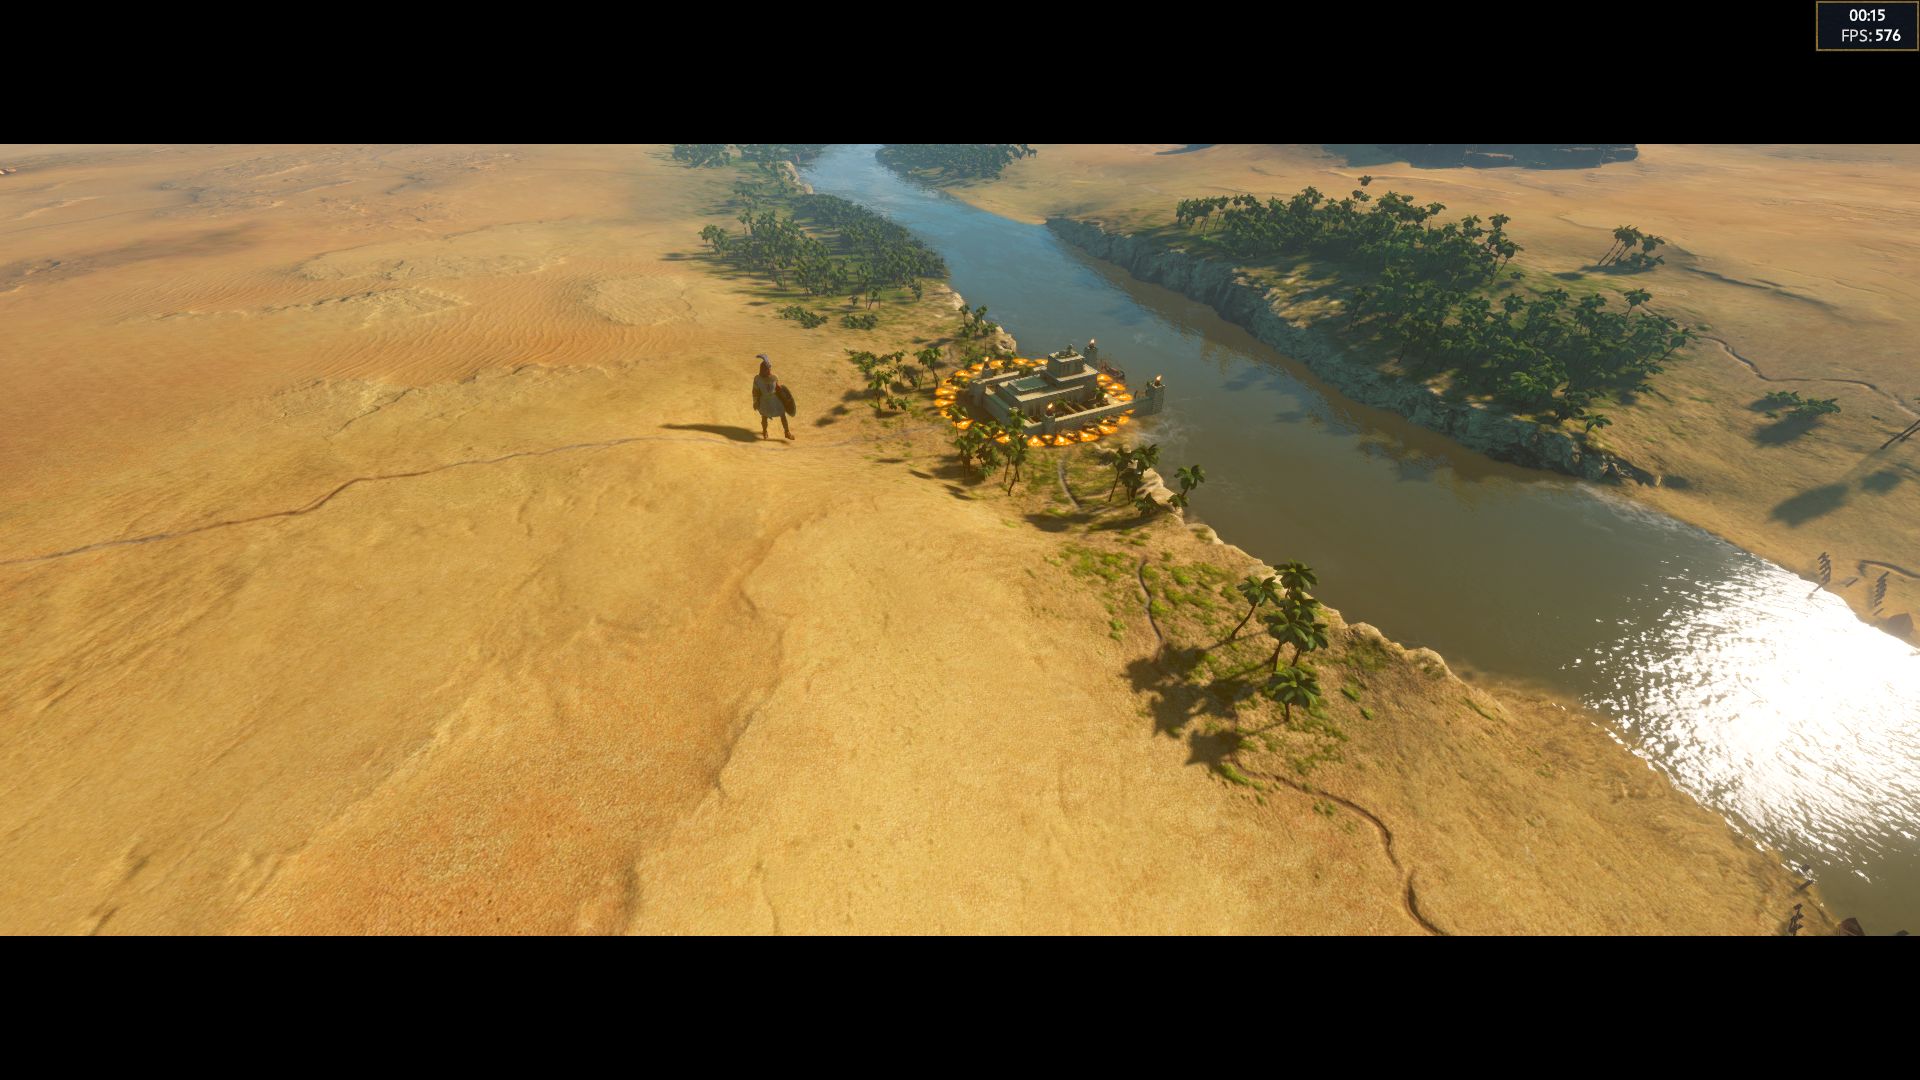
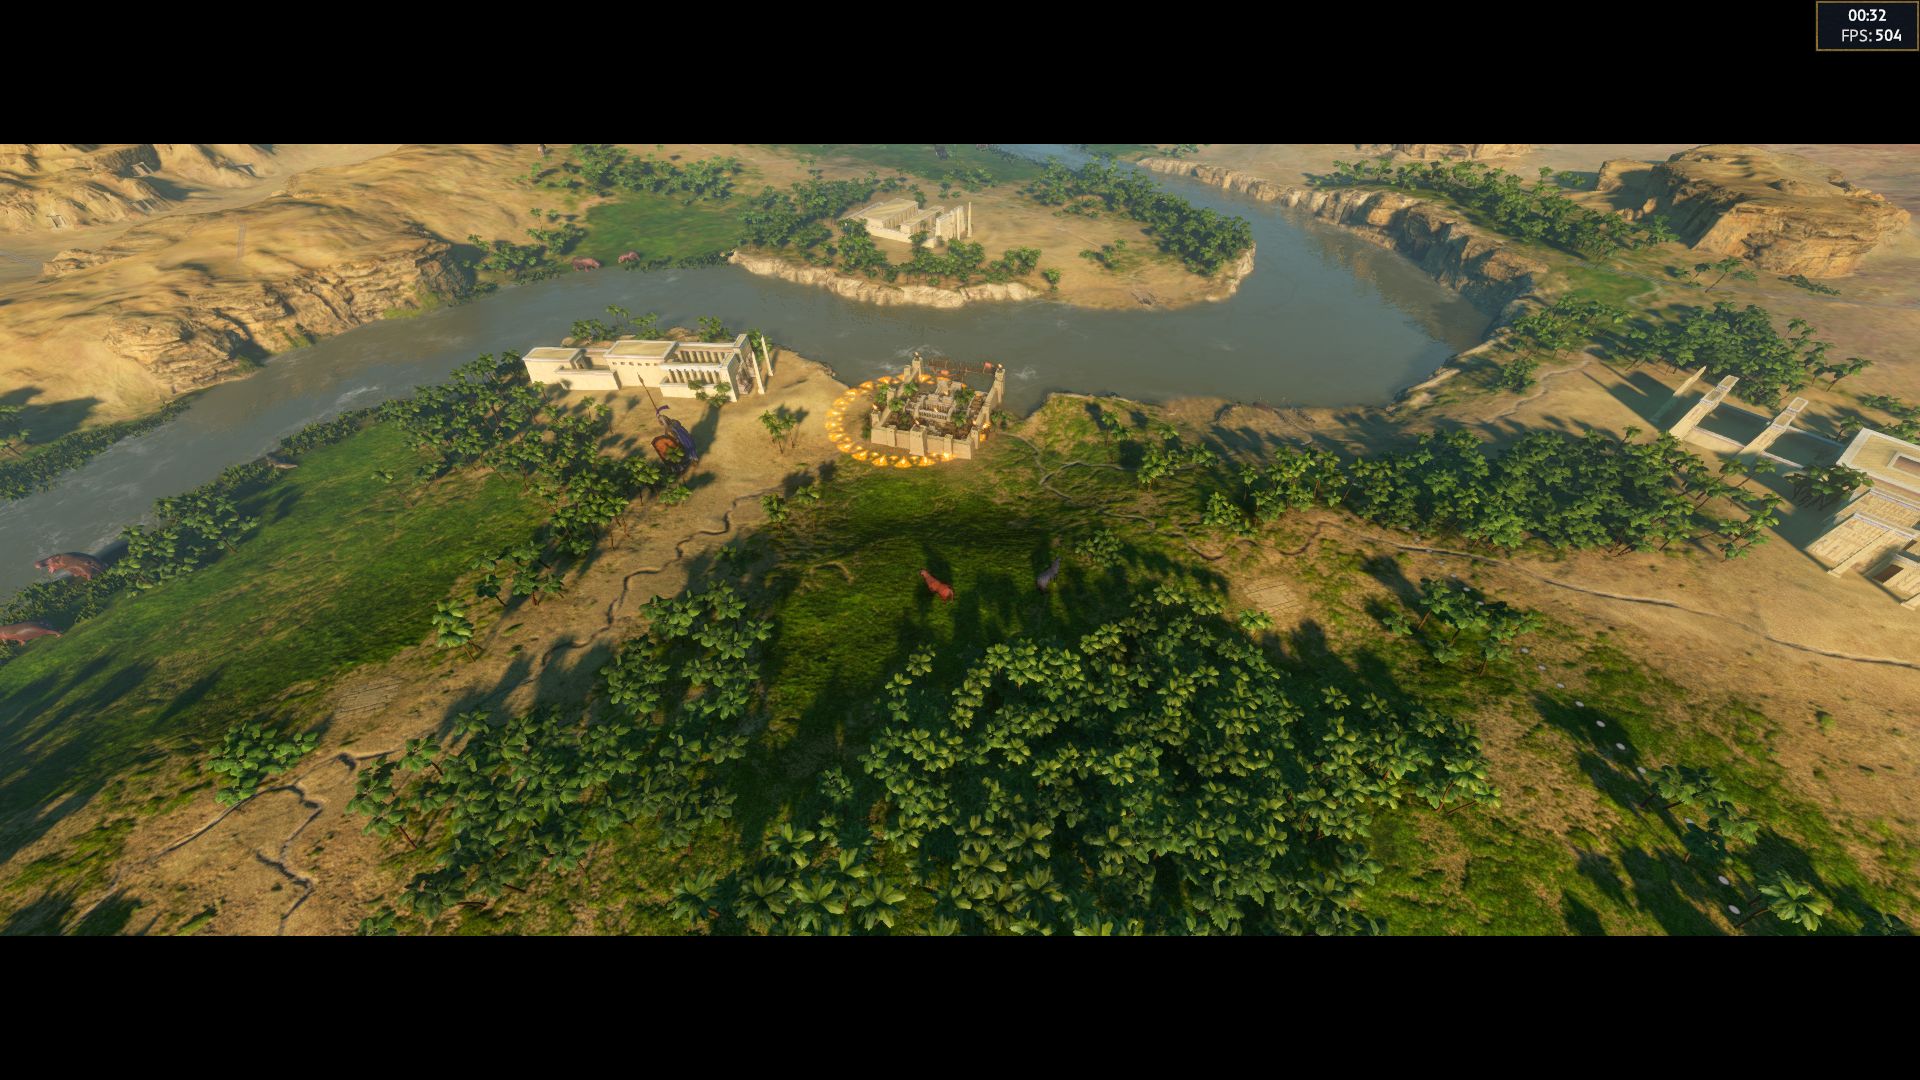
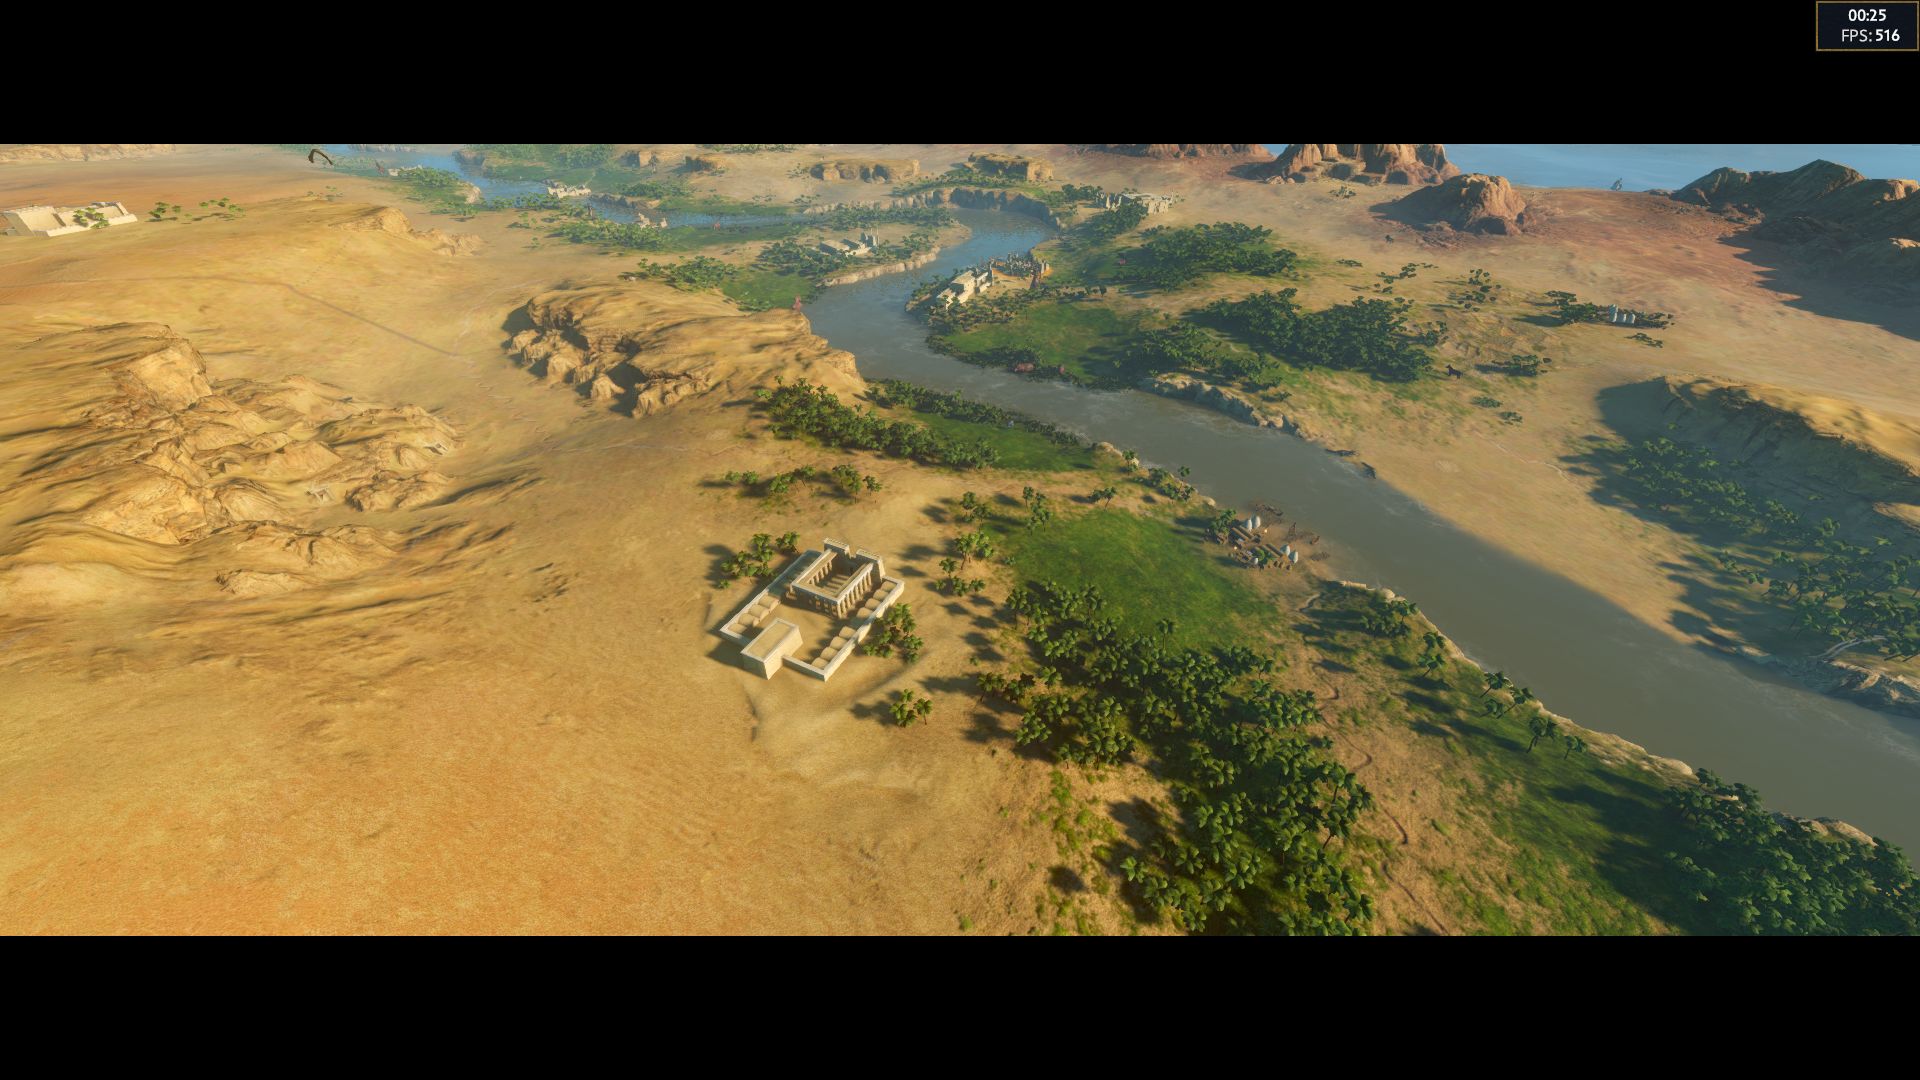
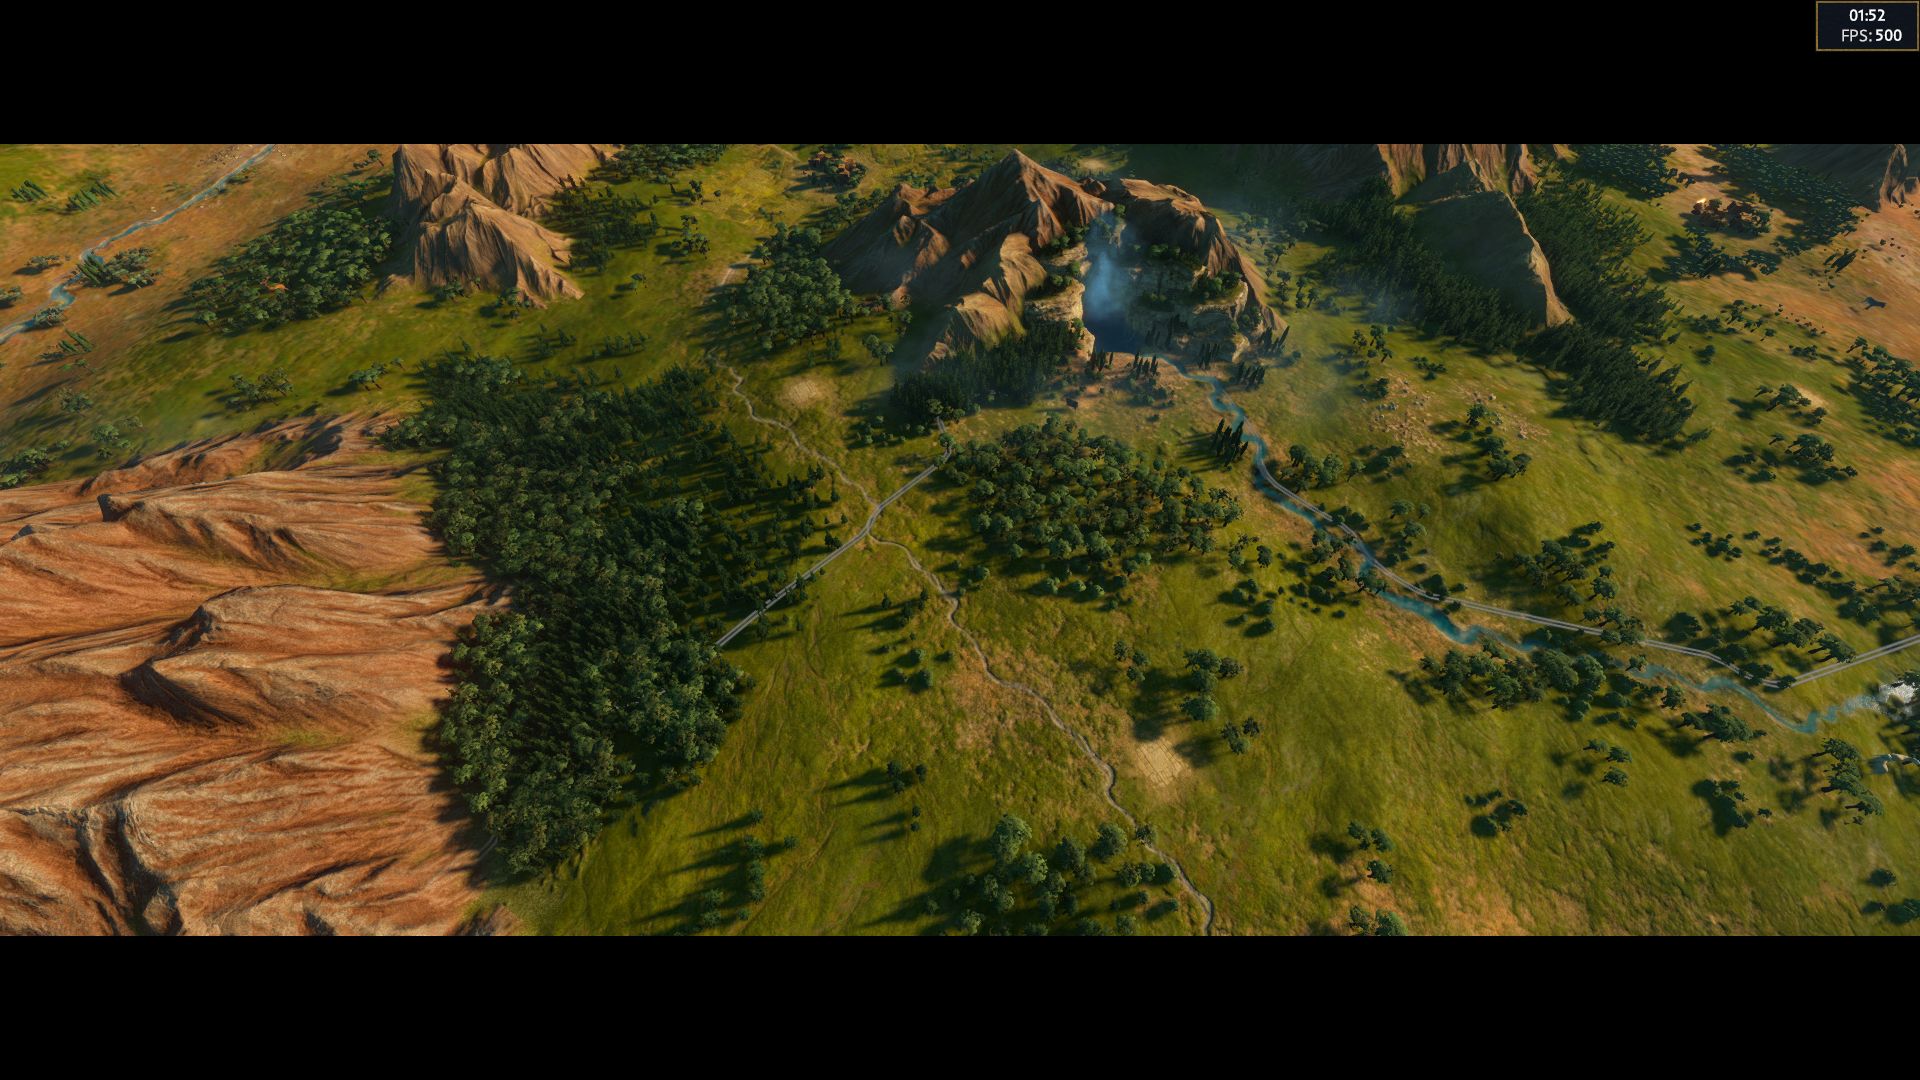
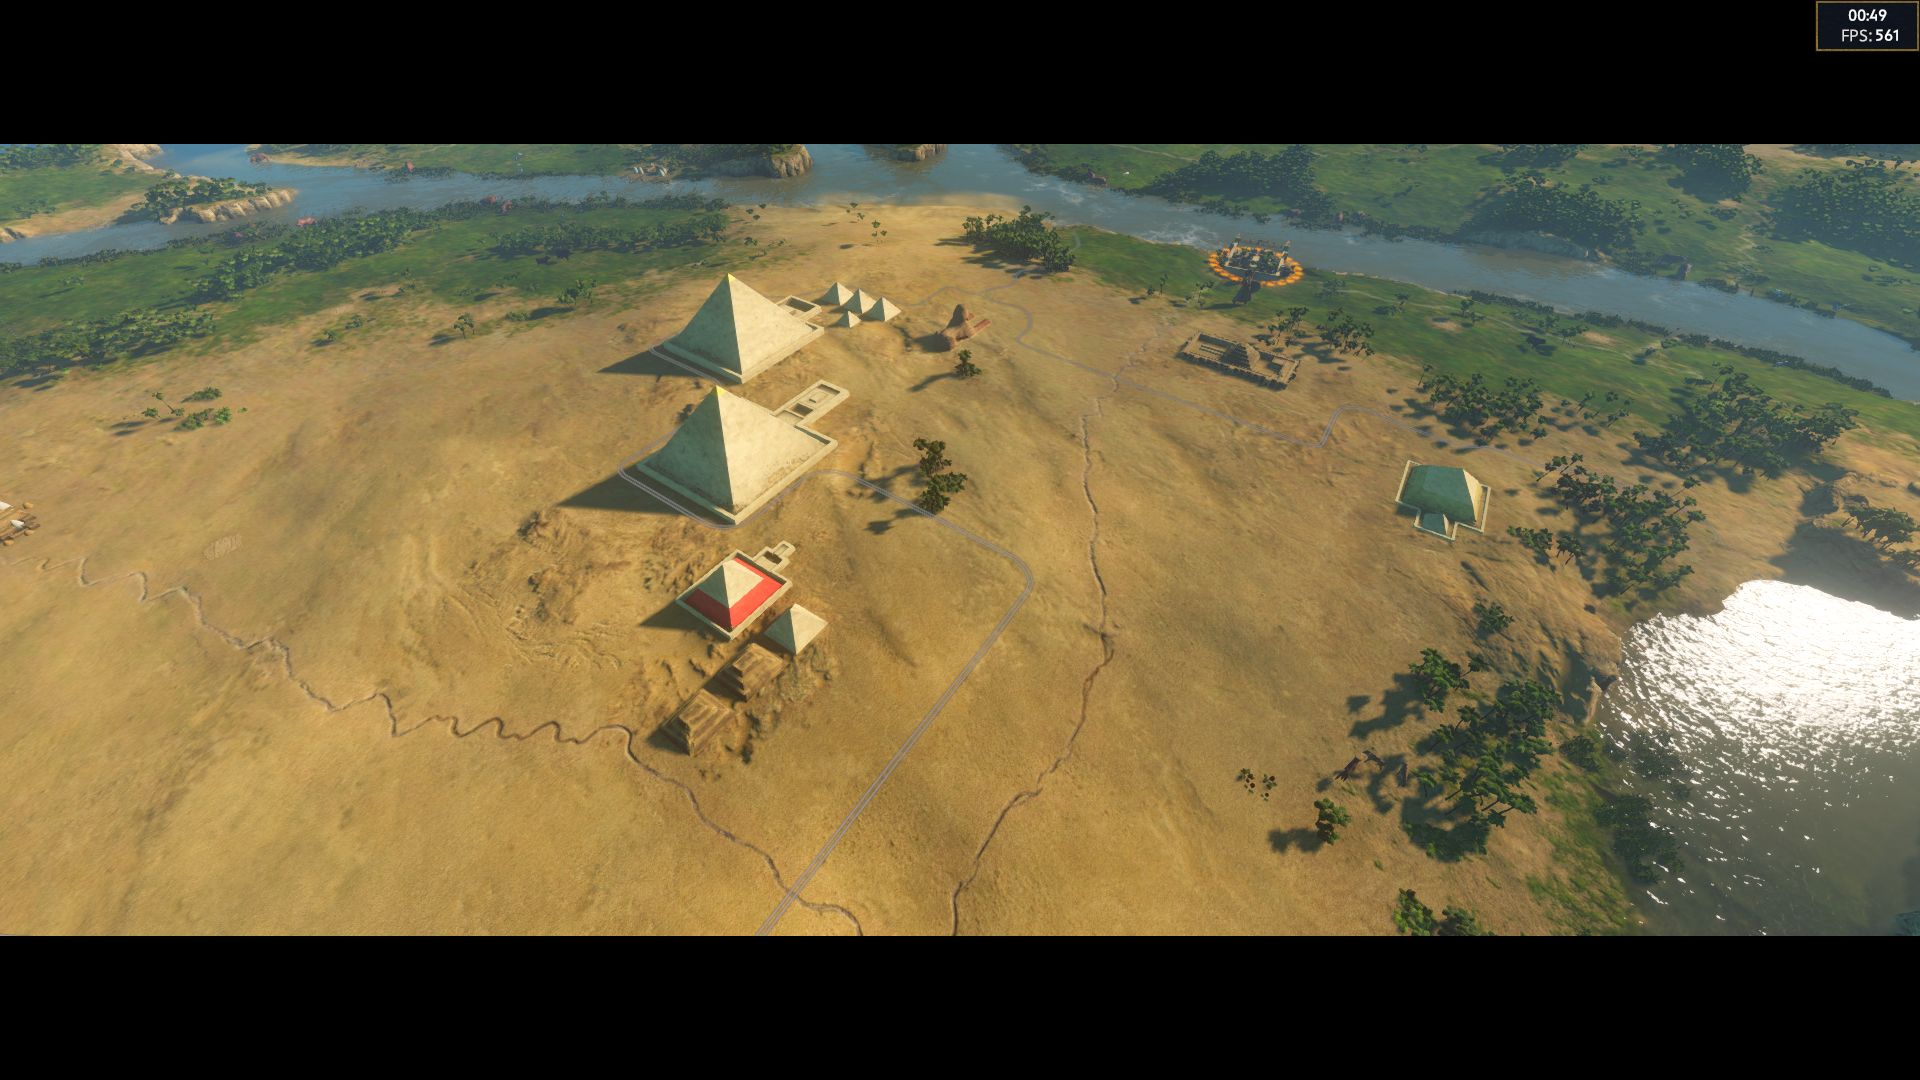
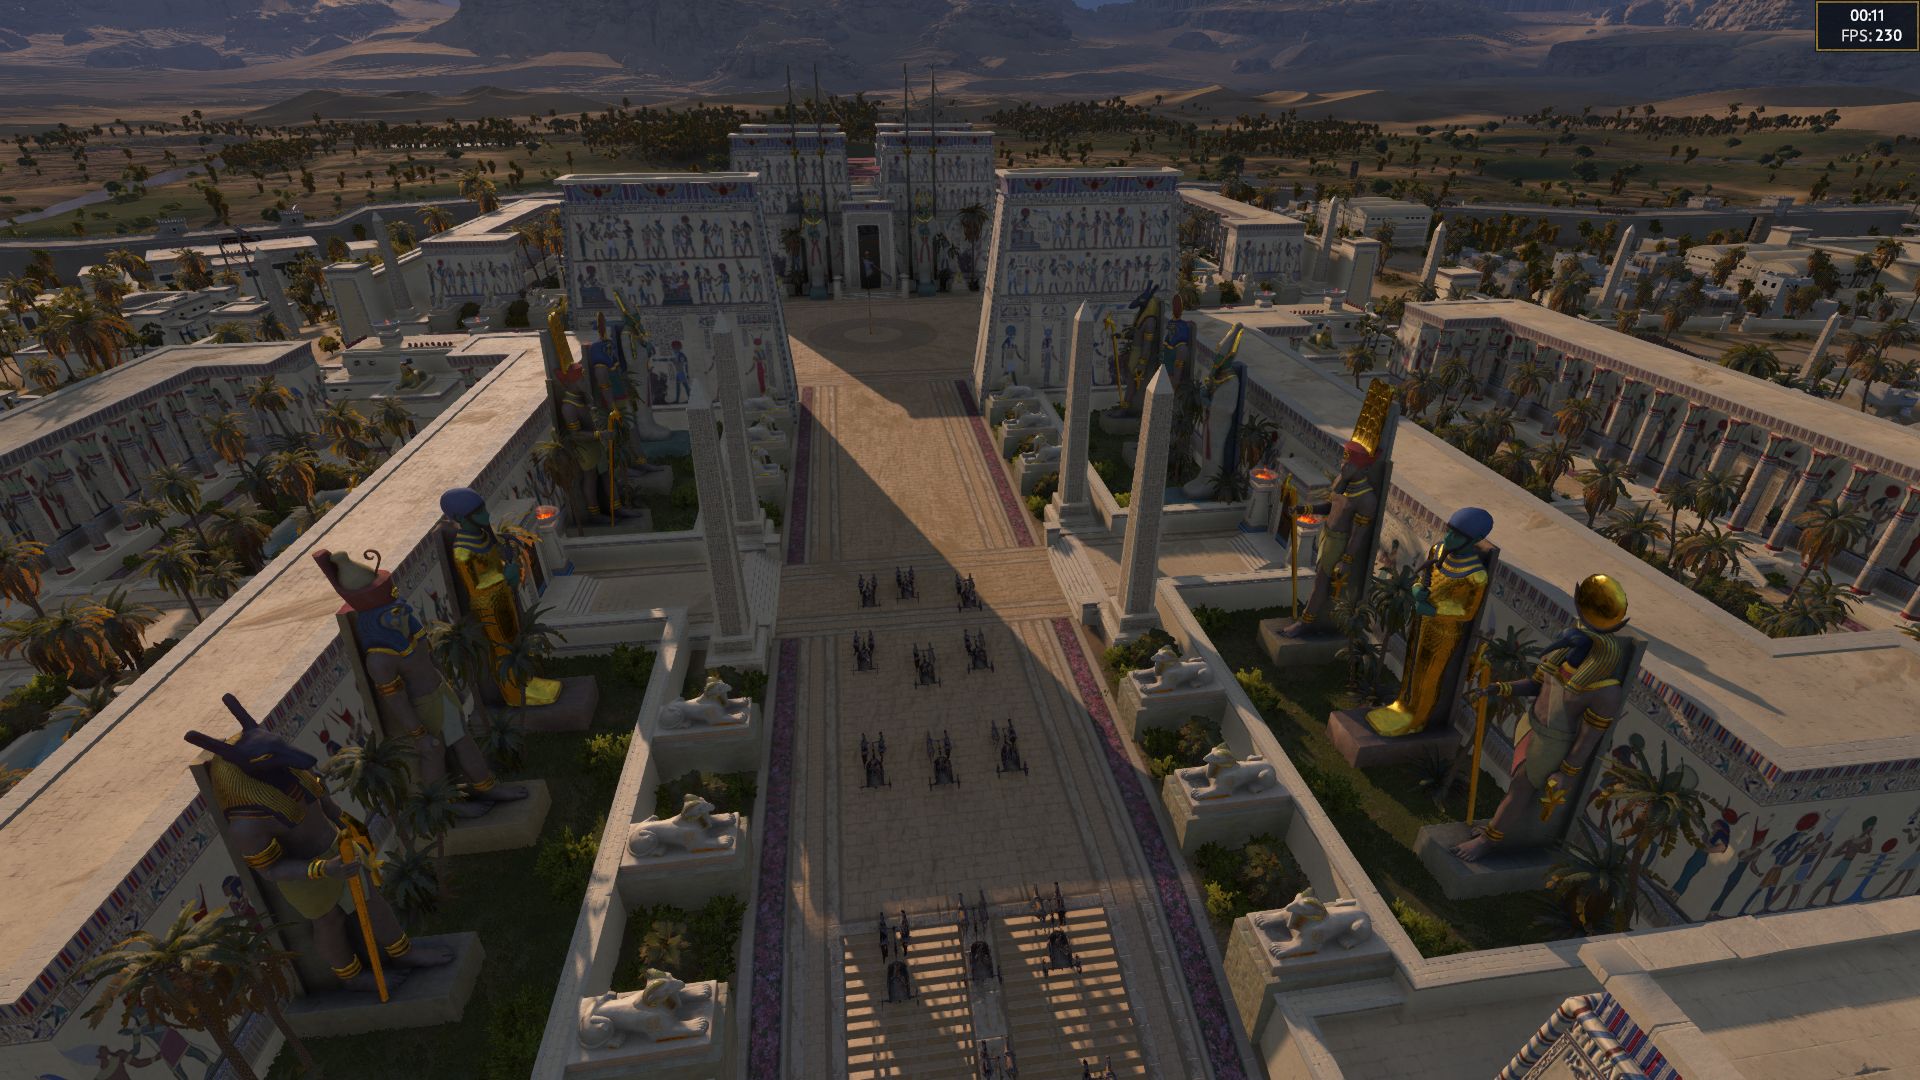
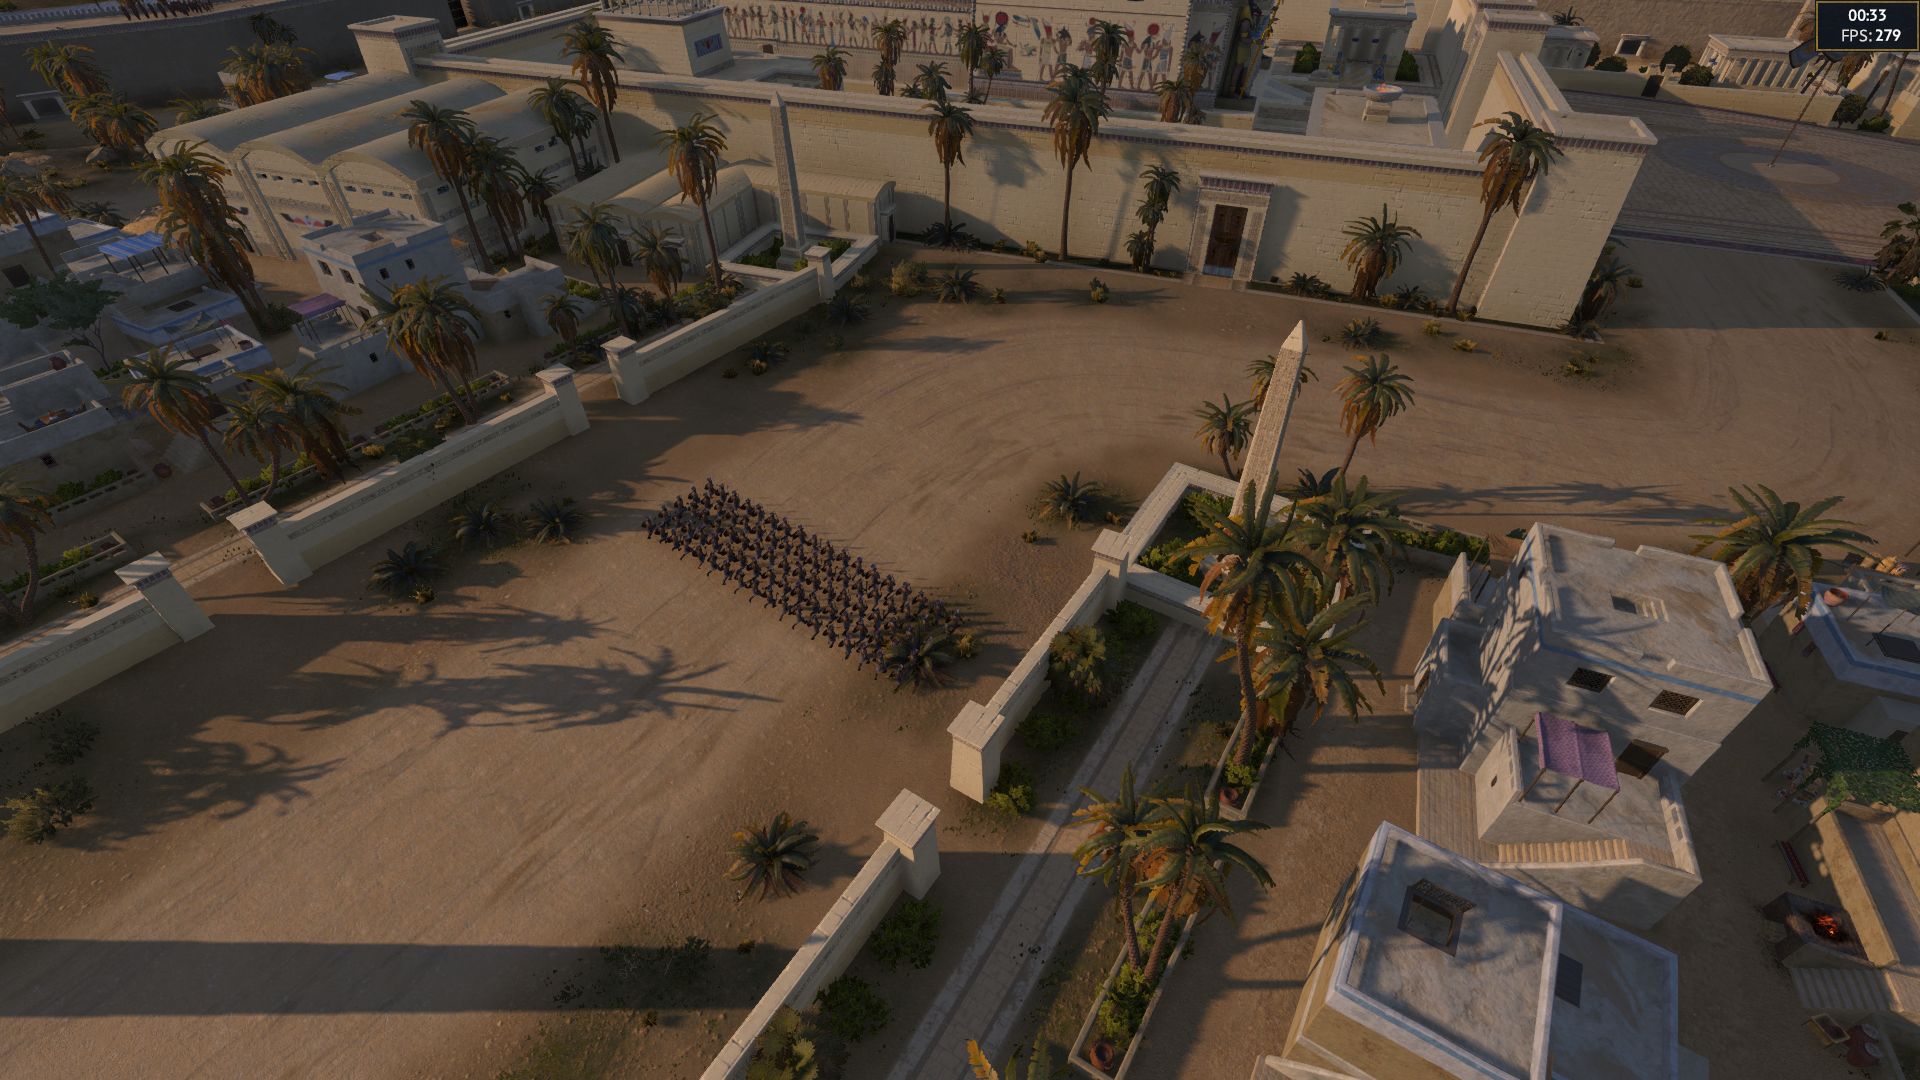
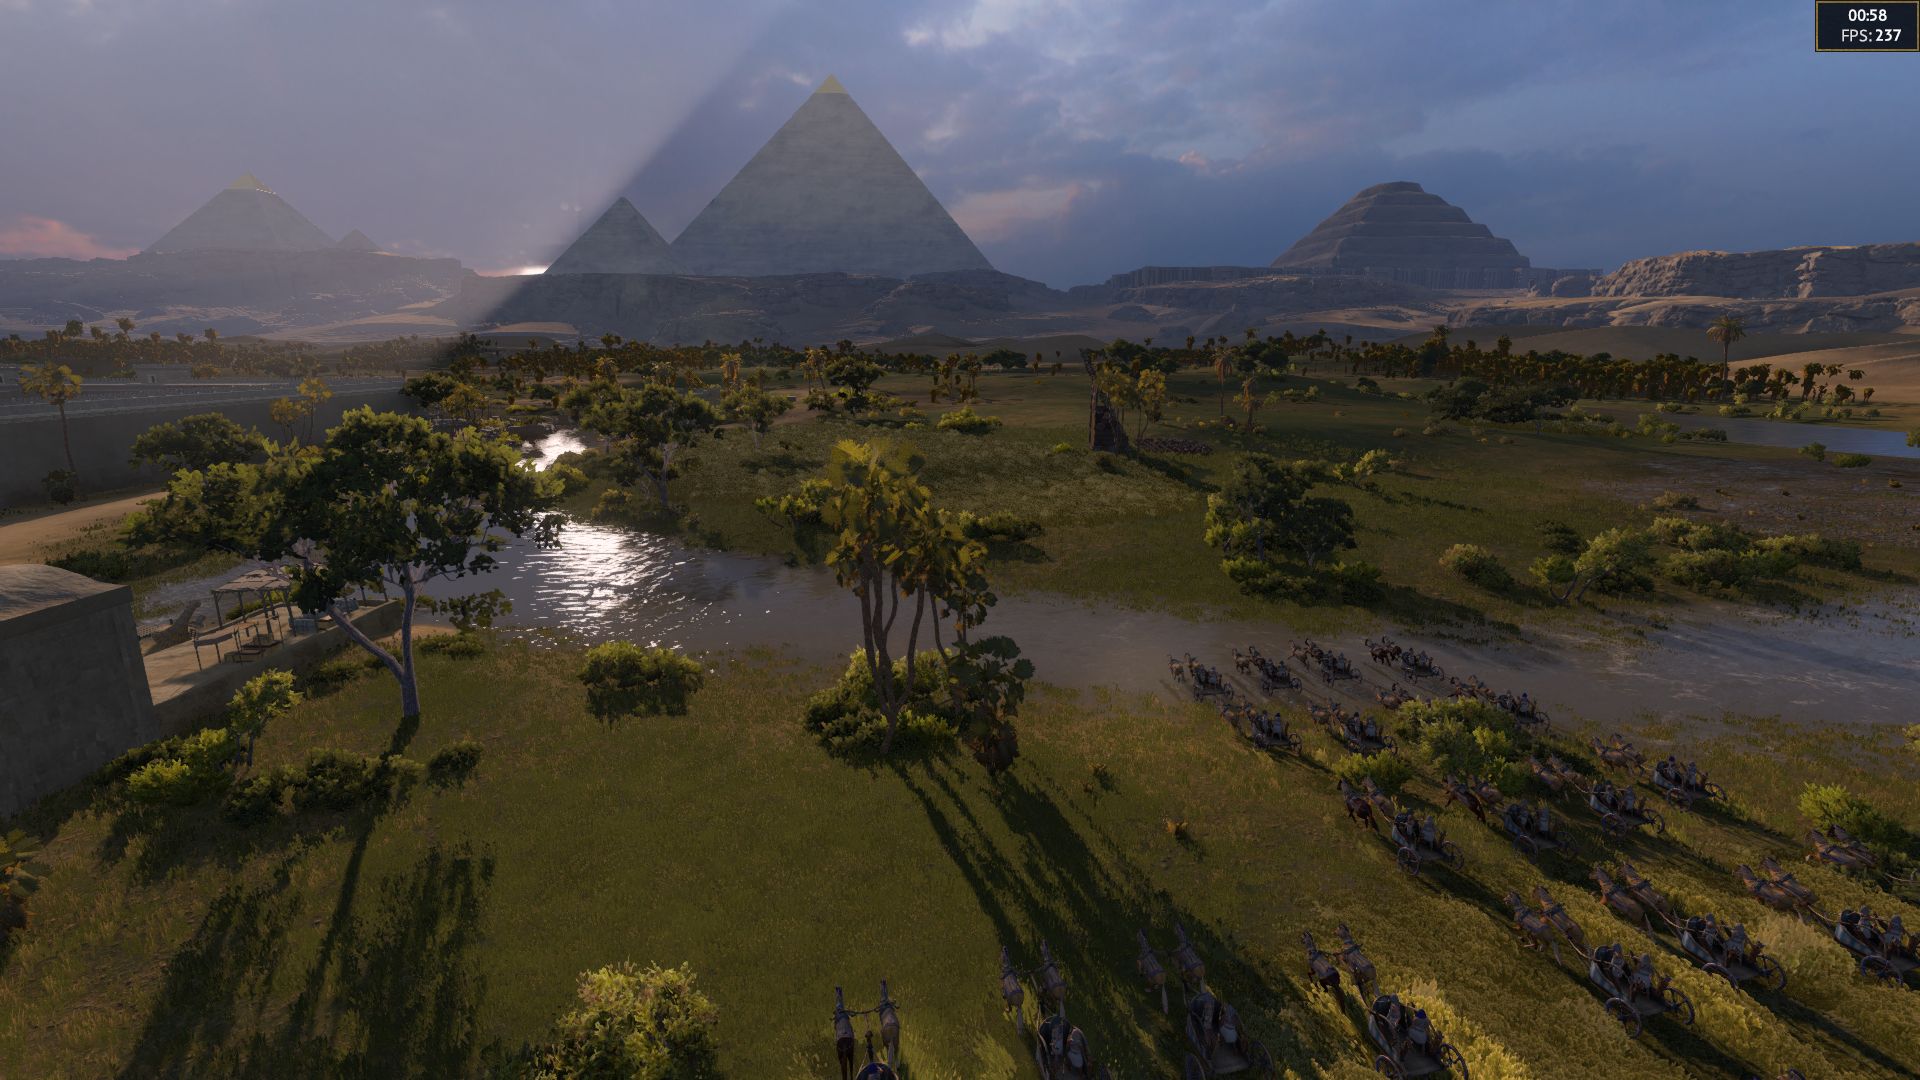
As a result of the desert landscape, Pharaoh's graphics look a bit dull and dreary in places, but the visuals look quite good in close-ups (especially in combat situations). Besides the textures and the vegetation, the units and effects (water simulation, etc.) also look modern, but they don't blow you away.

Total War Pharaoh
Total War Pharaoh
Total War Pharaoh
Total War Pharaoh
Total War Pharaoh
Total War Pharaoh

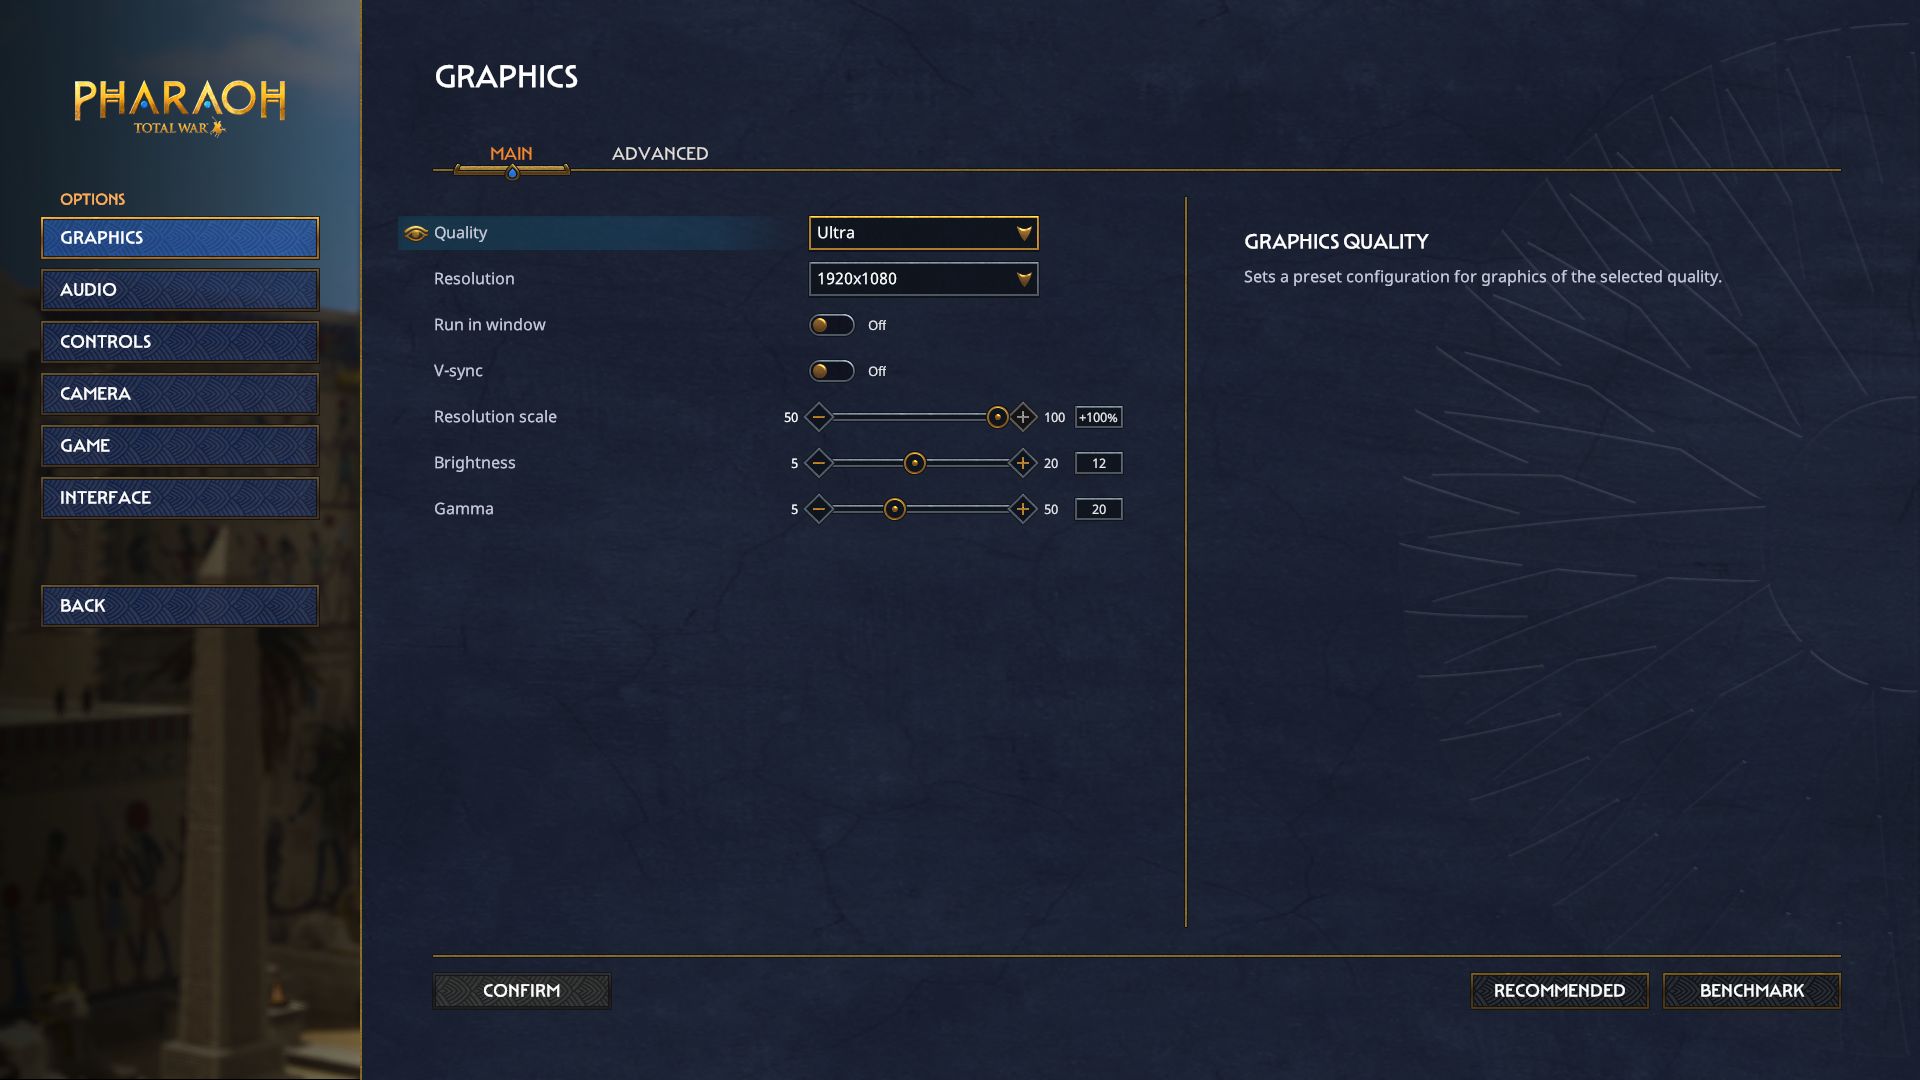
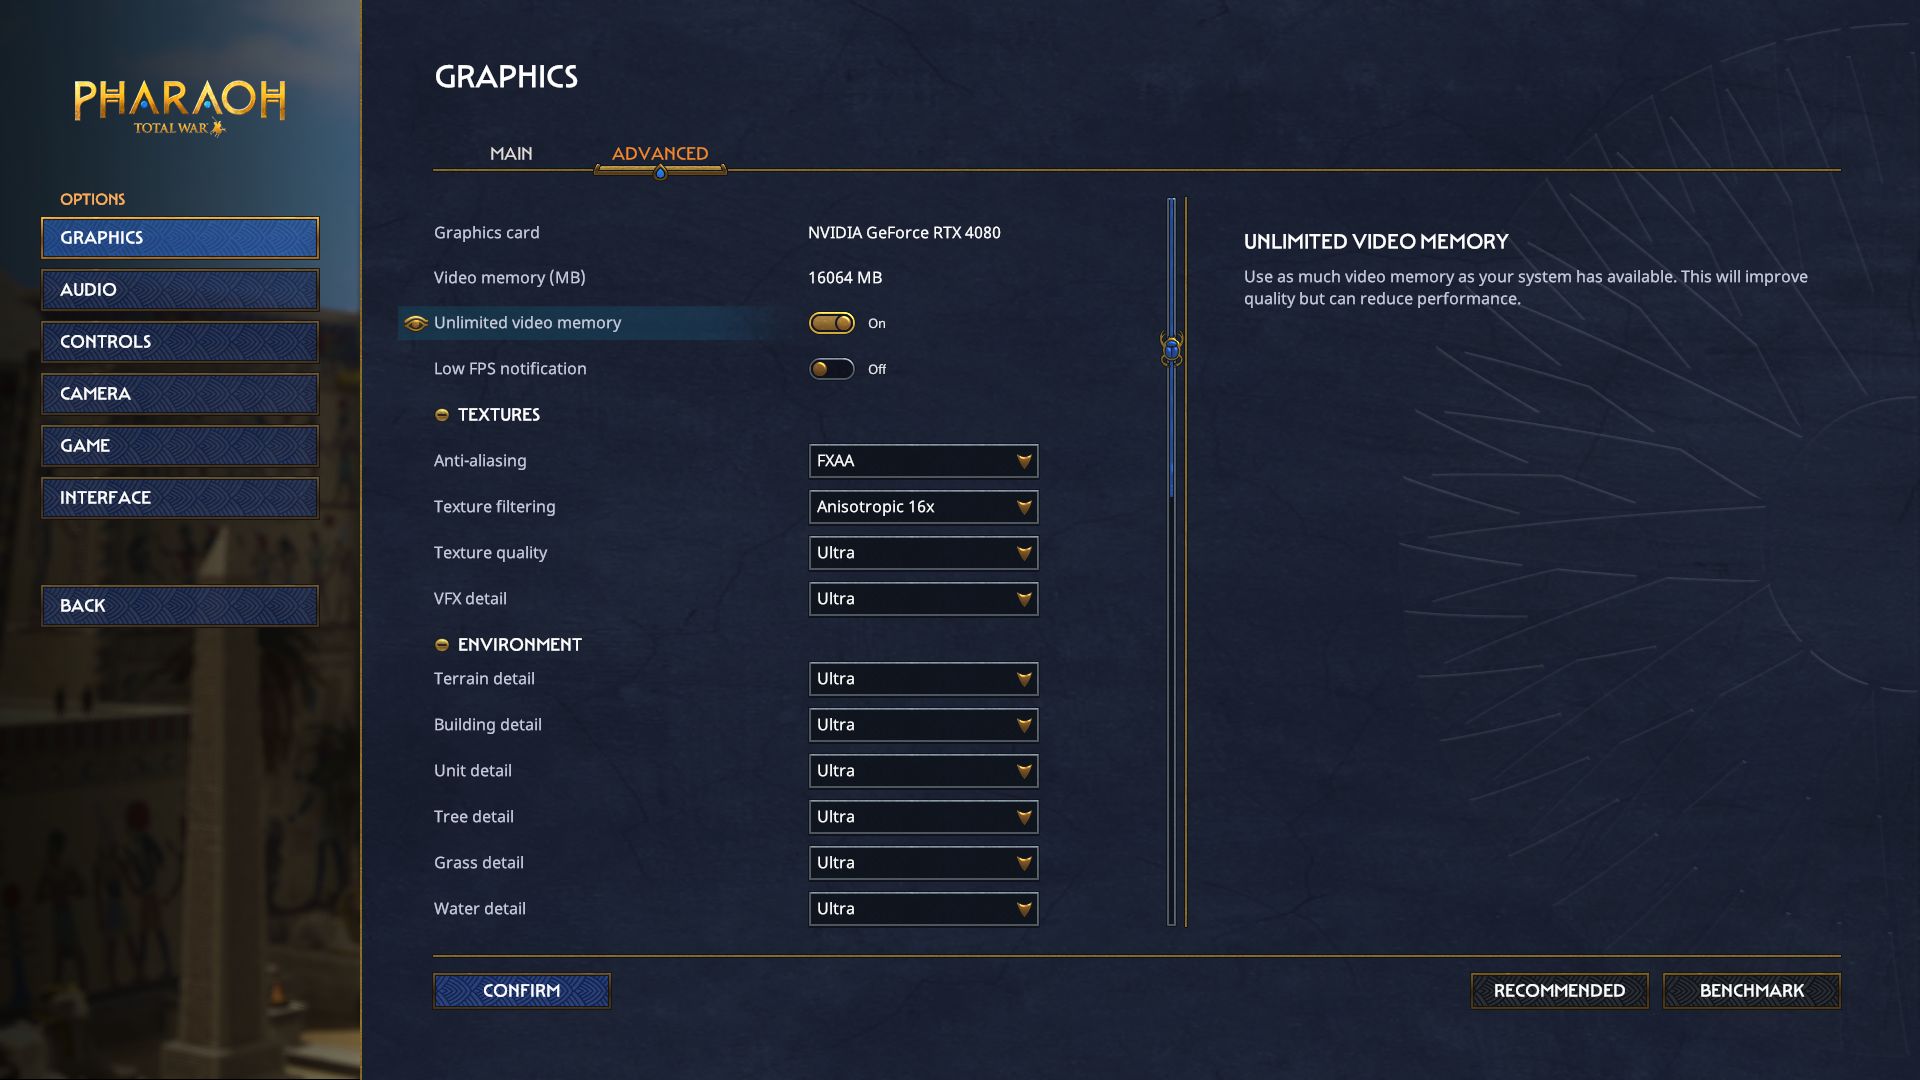
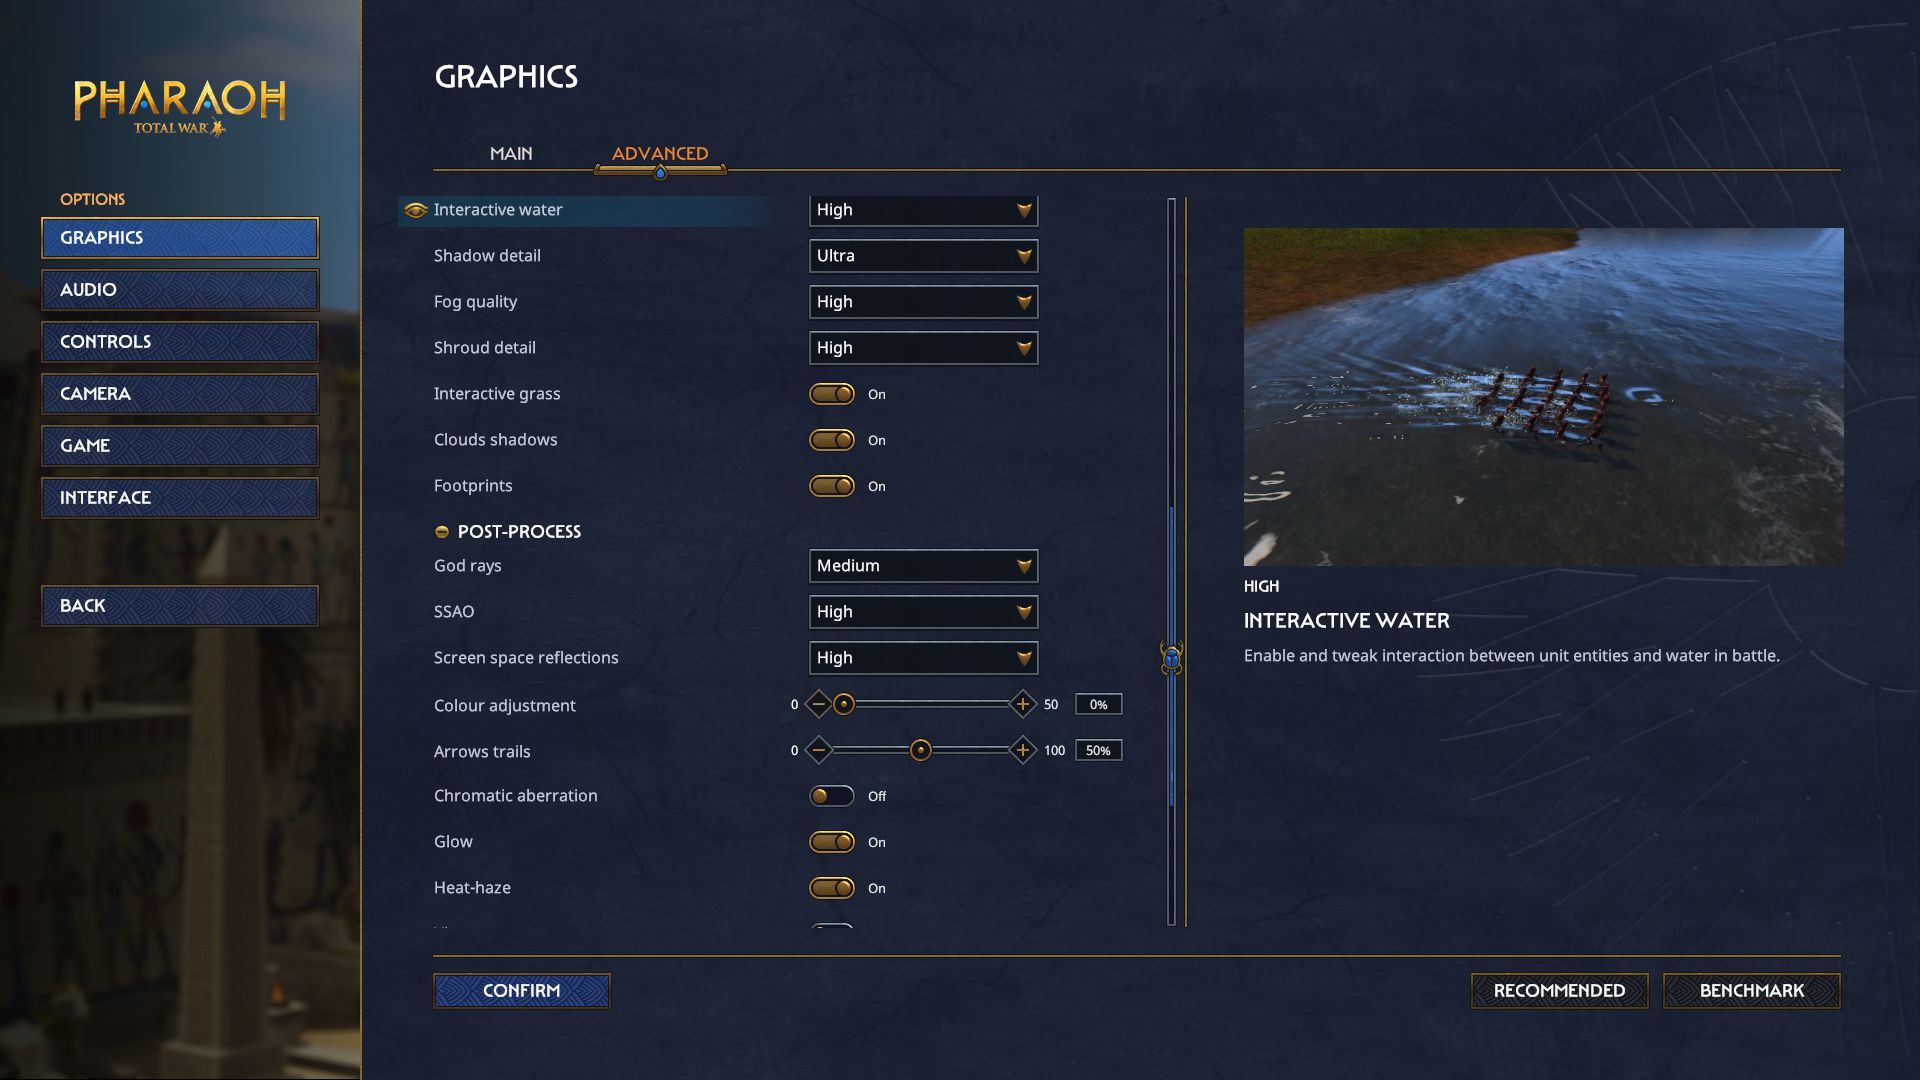
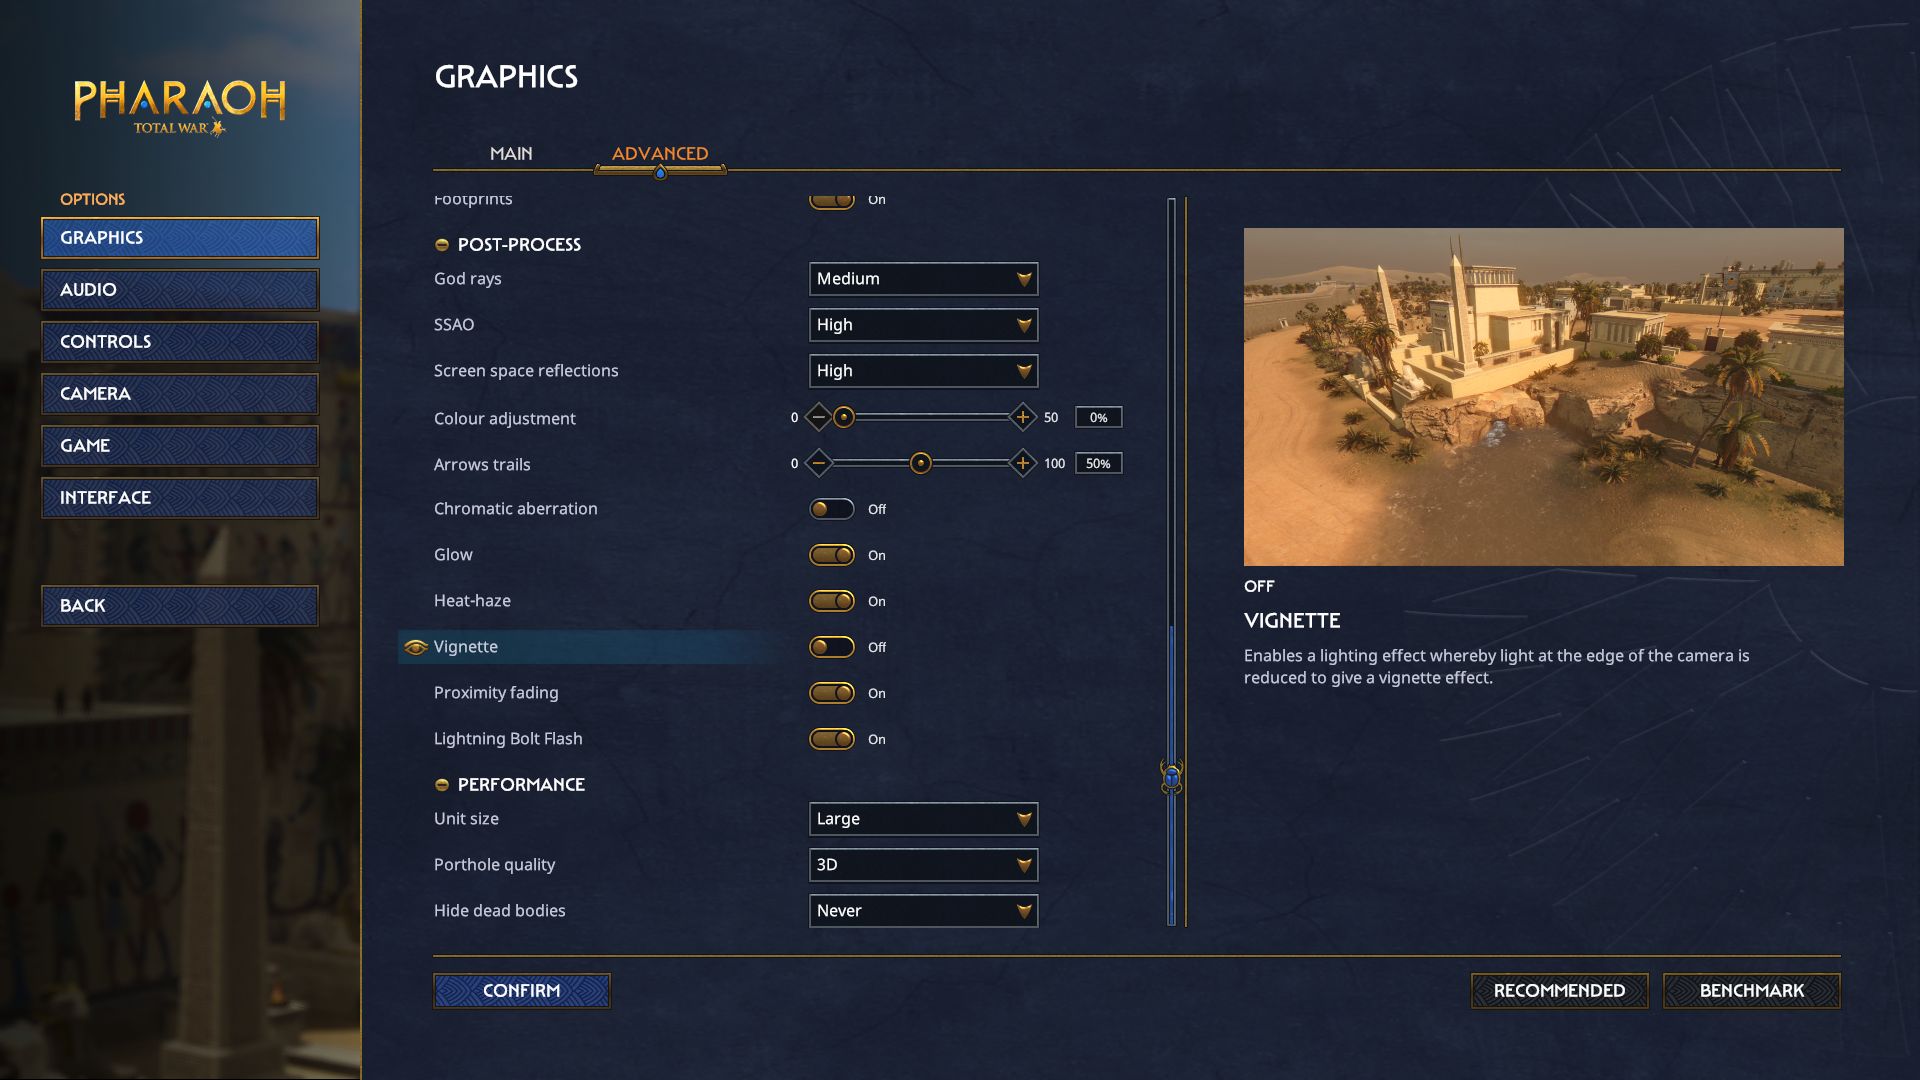
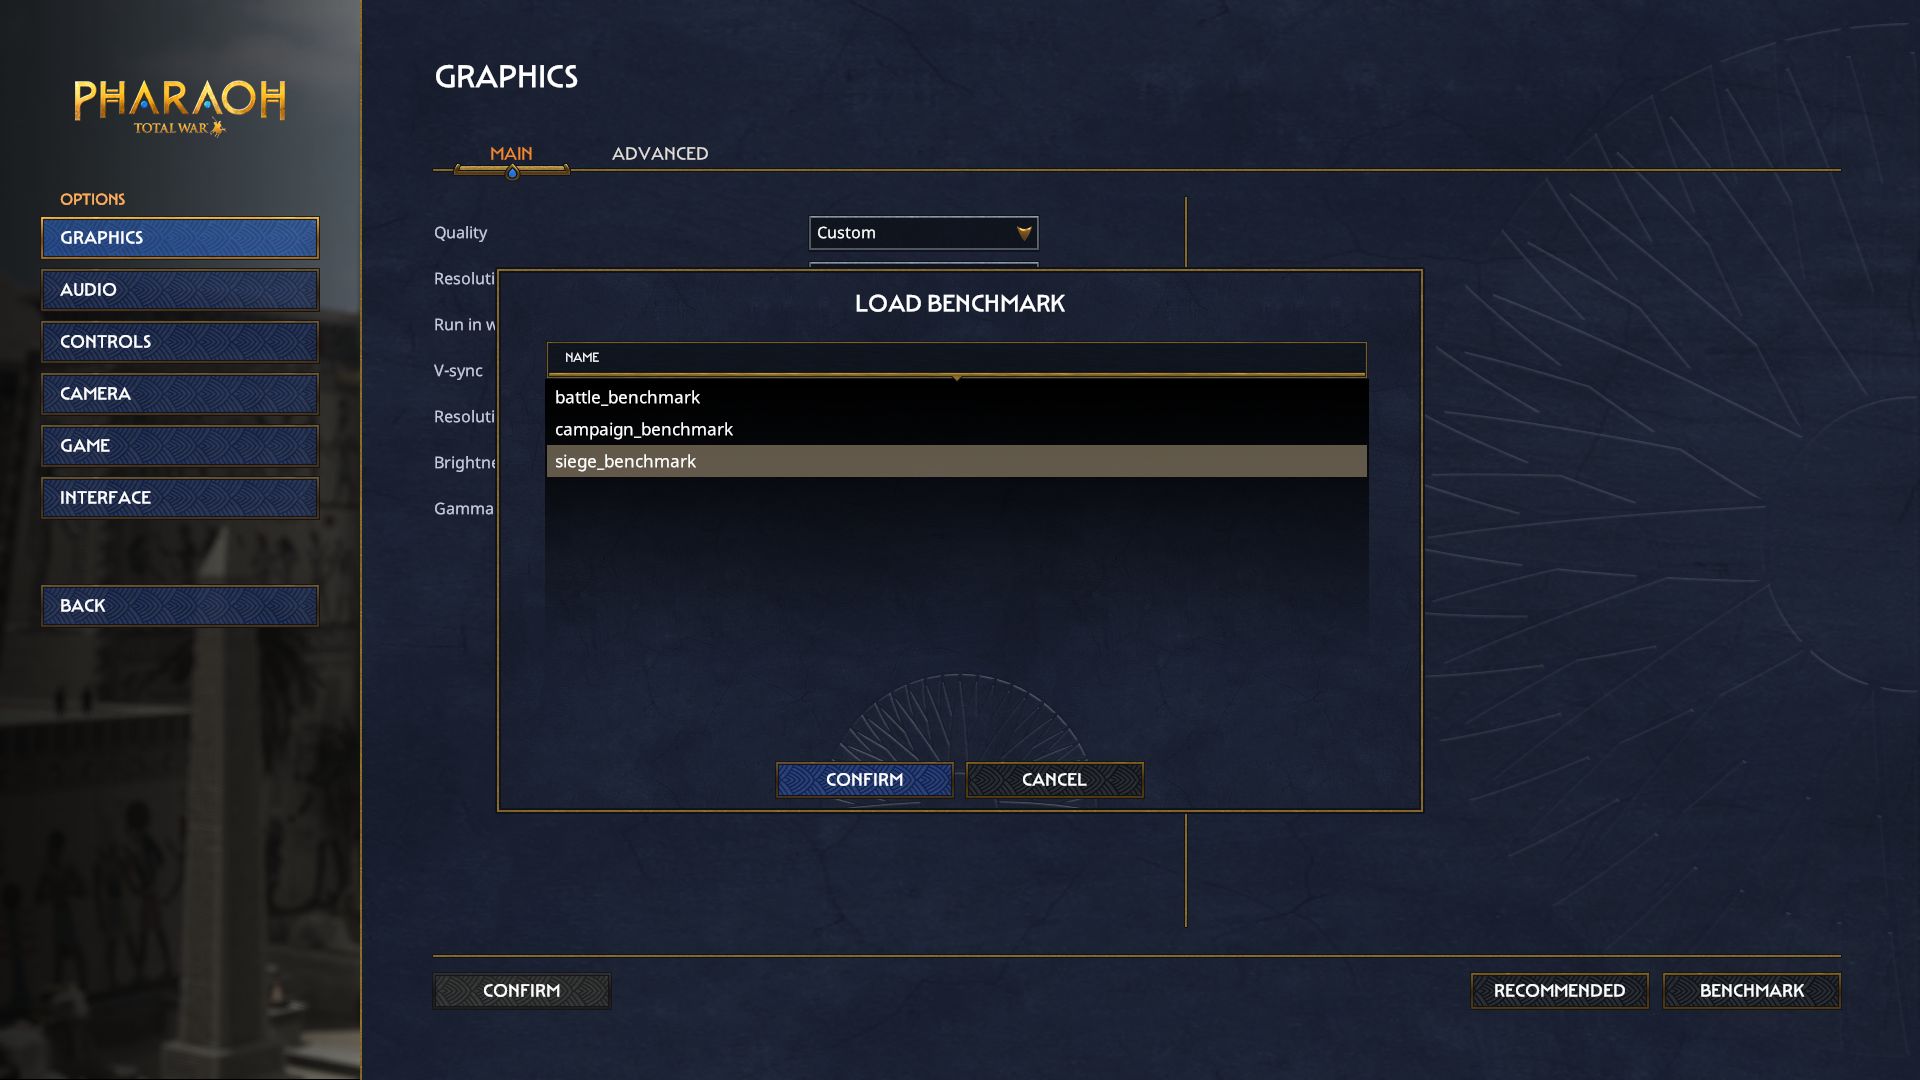
The graphics menu is also quite impressive. Starting with the main tab, which is still quite clear in view of there currently being seven options. Here, you can adjust the resolution (scaling), overall quality (there are four presets), picture mode, brightness, and gamma value. The developers have almost gone overboard with the Advanced tab. Close to 30 detail sliders are an extreme amount for a PC game — especially a strategy one — and require a lot of scrolling if you are not satisfied with the presets.

Total War Pharaoh
Total War Pharaoh
Total War Pharaoh
Total War Pharaoh
Total War Pharaoh
Total War Pharaoh

A positive: Changes are applied without having to restart the game, which is very practical. The explanations and, in some cases, comparison pictures for the individual settings also prove to come in quite handy. Players just have to do without some modern features like FSR and DLSS. The game takes up a moderate 41 GB of storage.

Total War Pharaoh
Total War Pharaoh
Total War Pharaoh
Total War Pharaoh

Benchmark

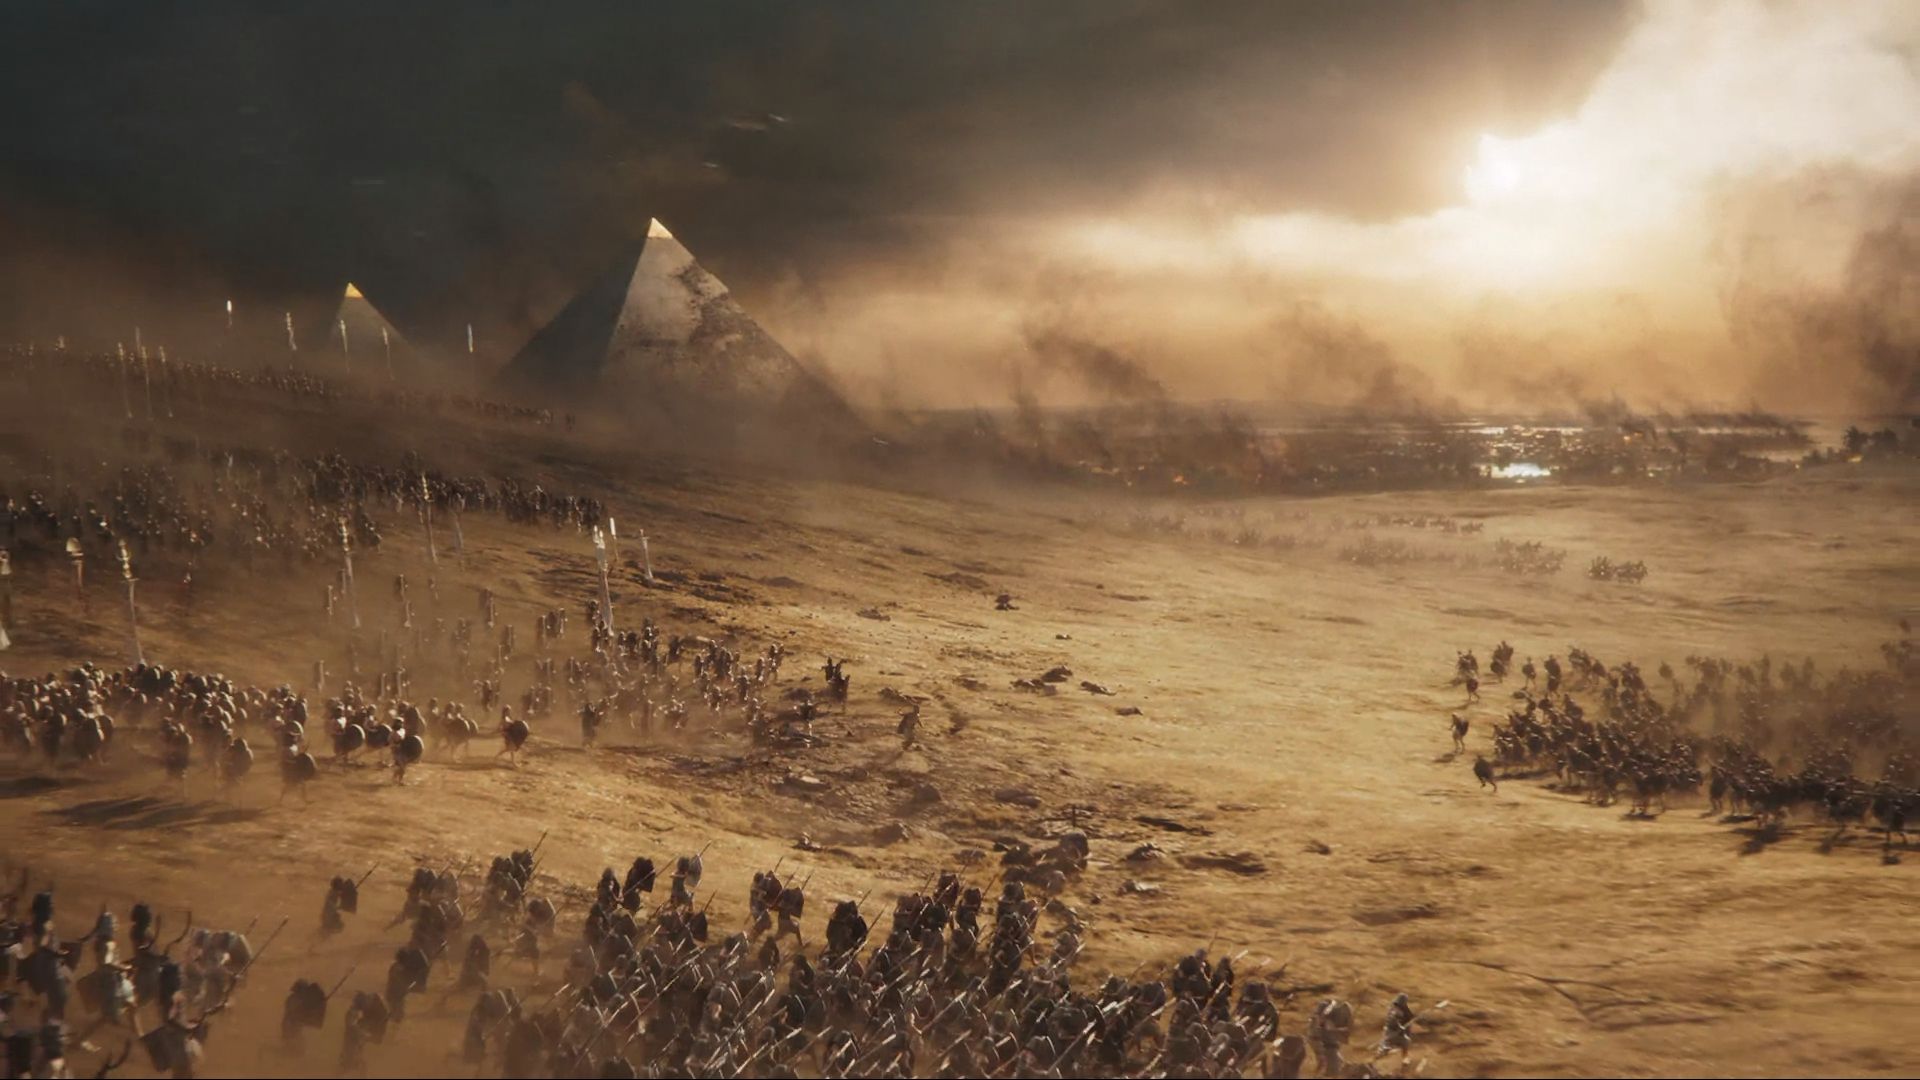
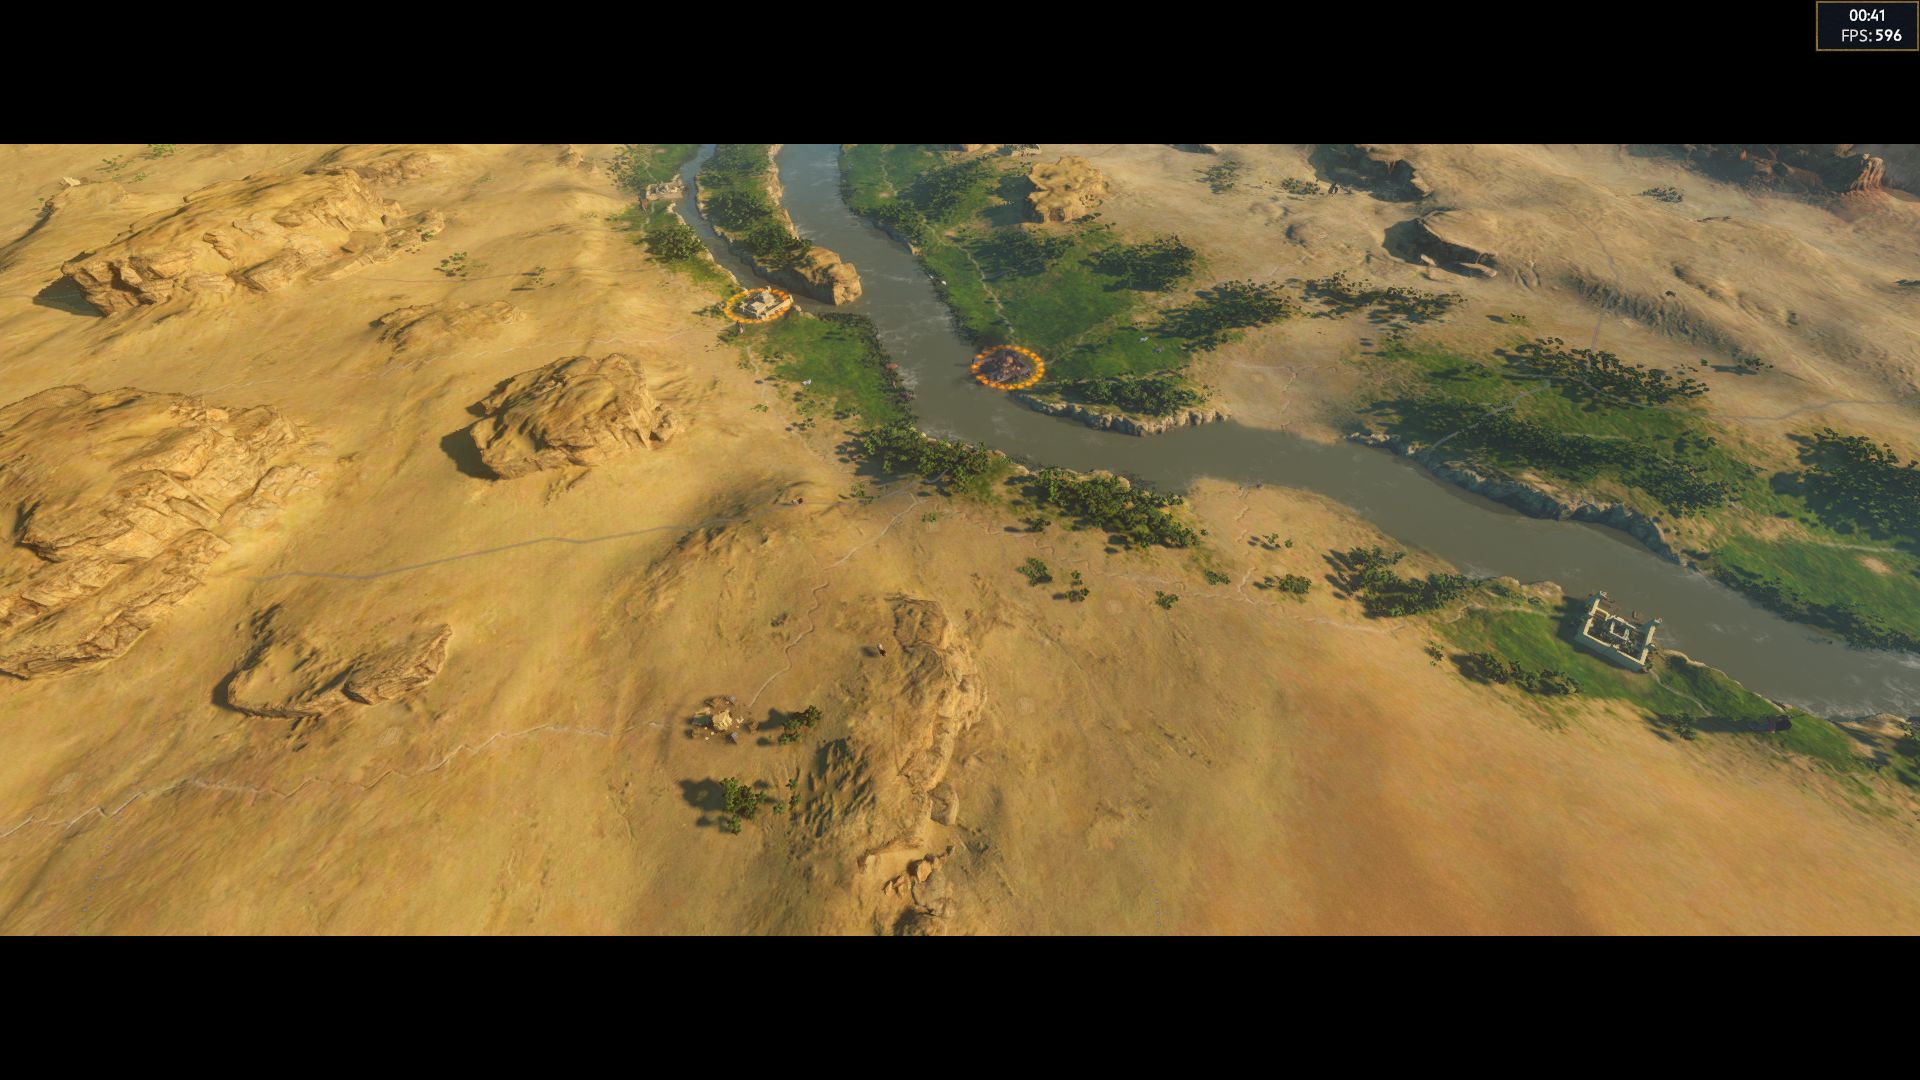
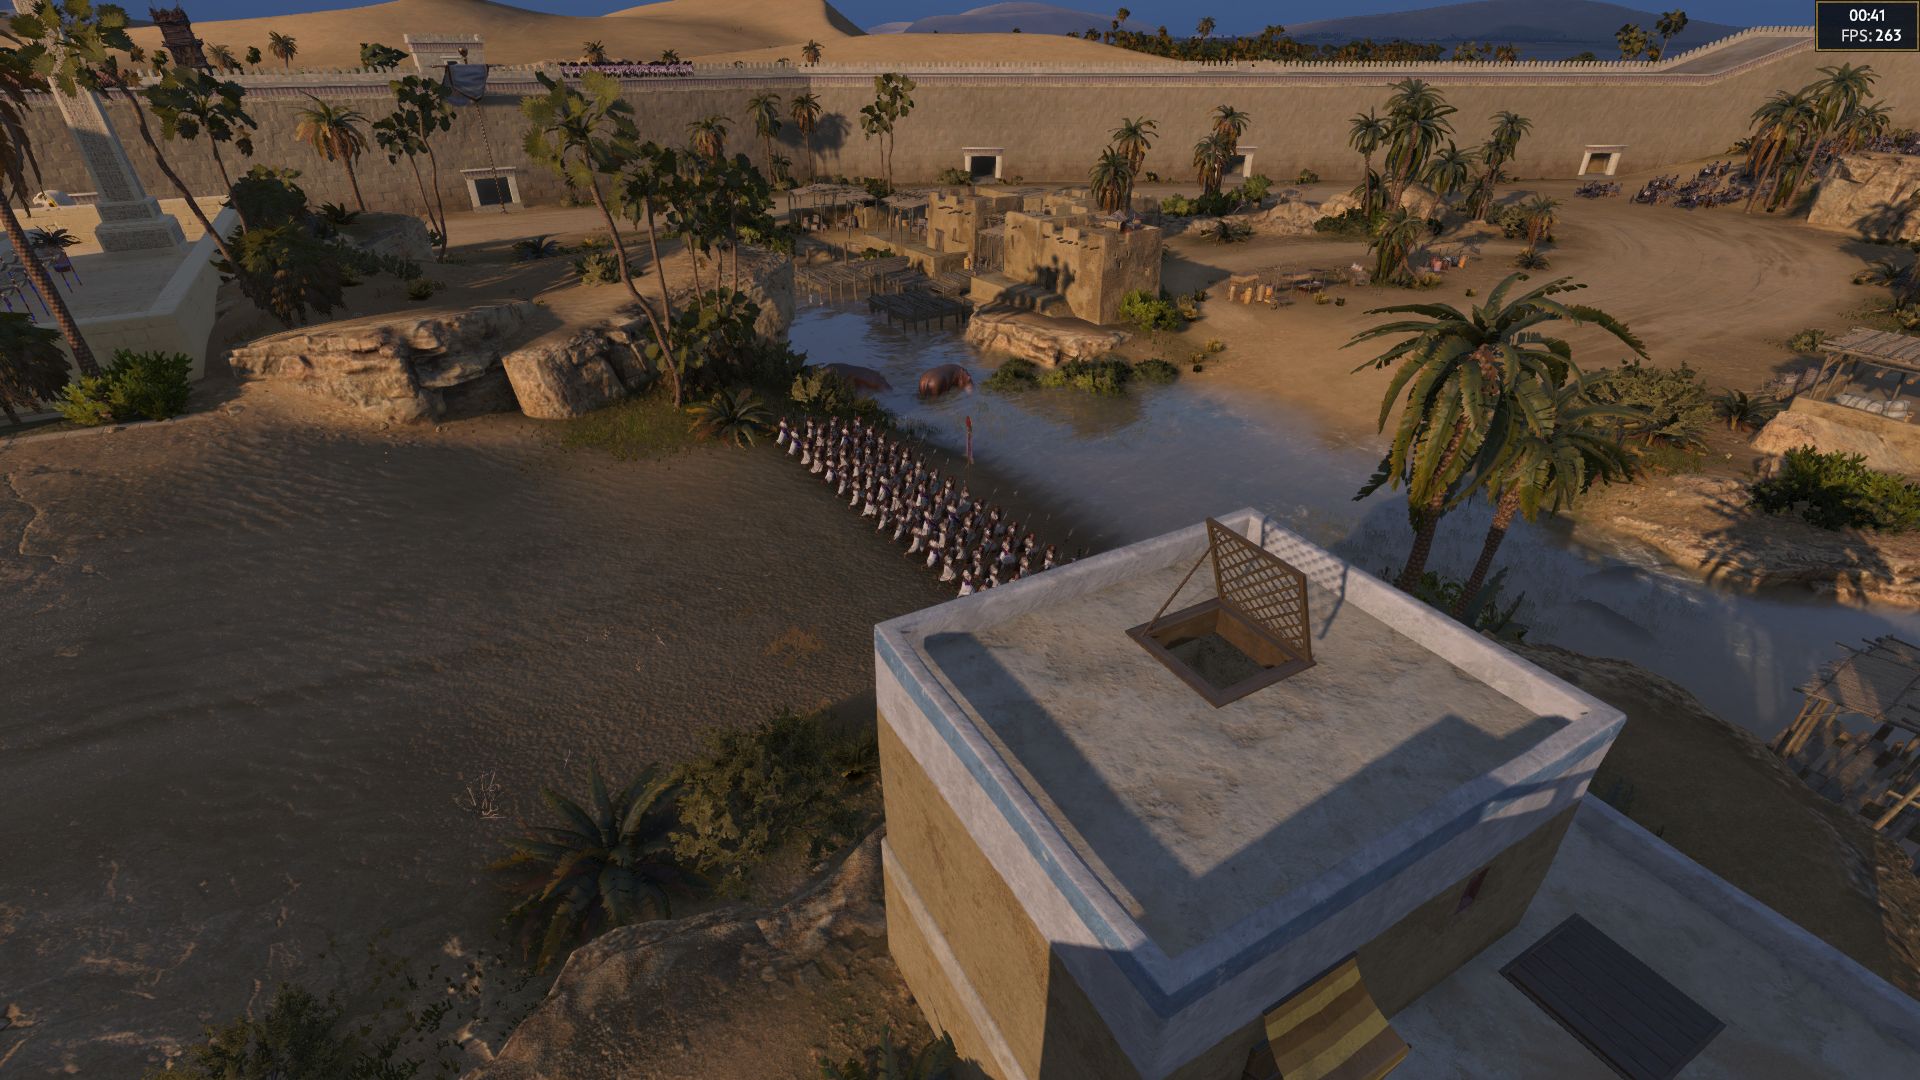
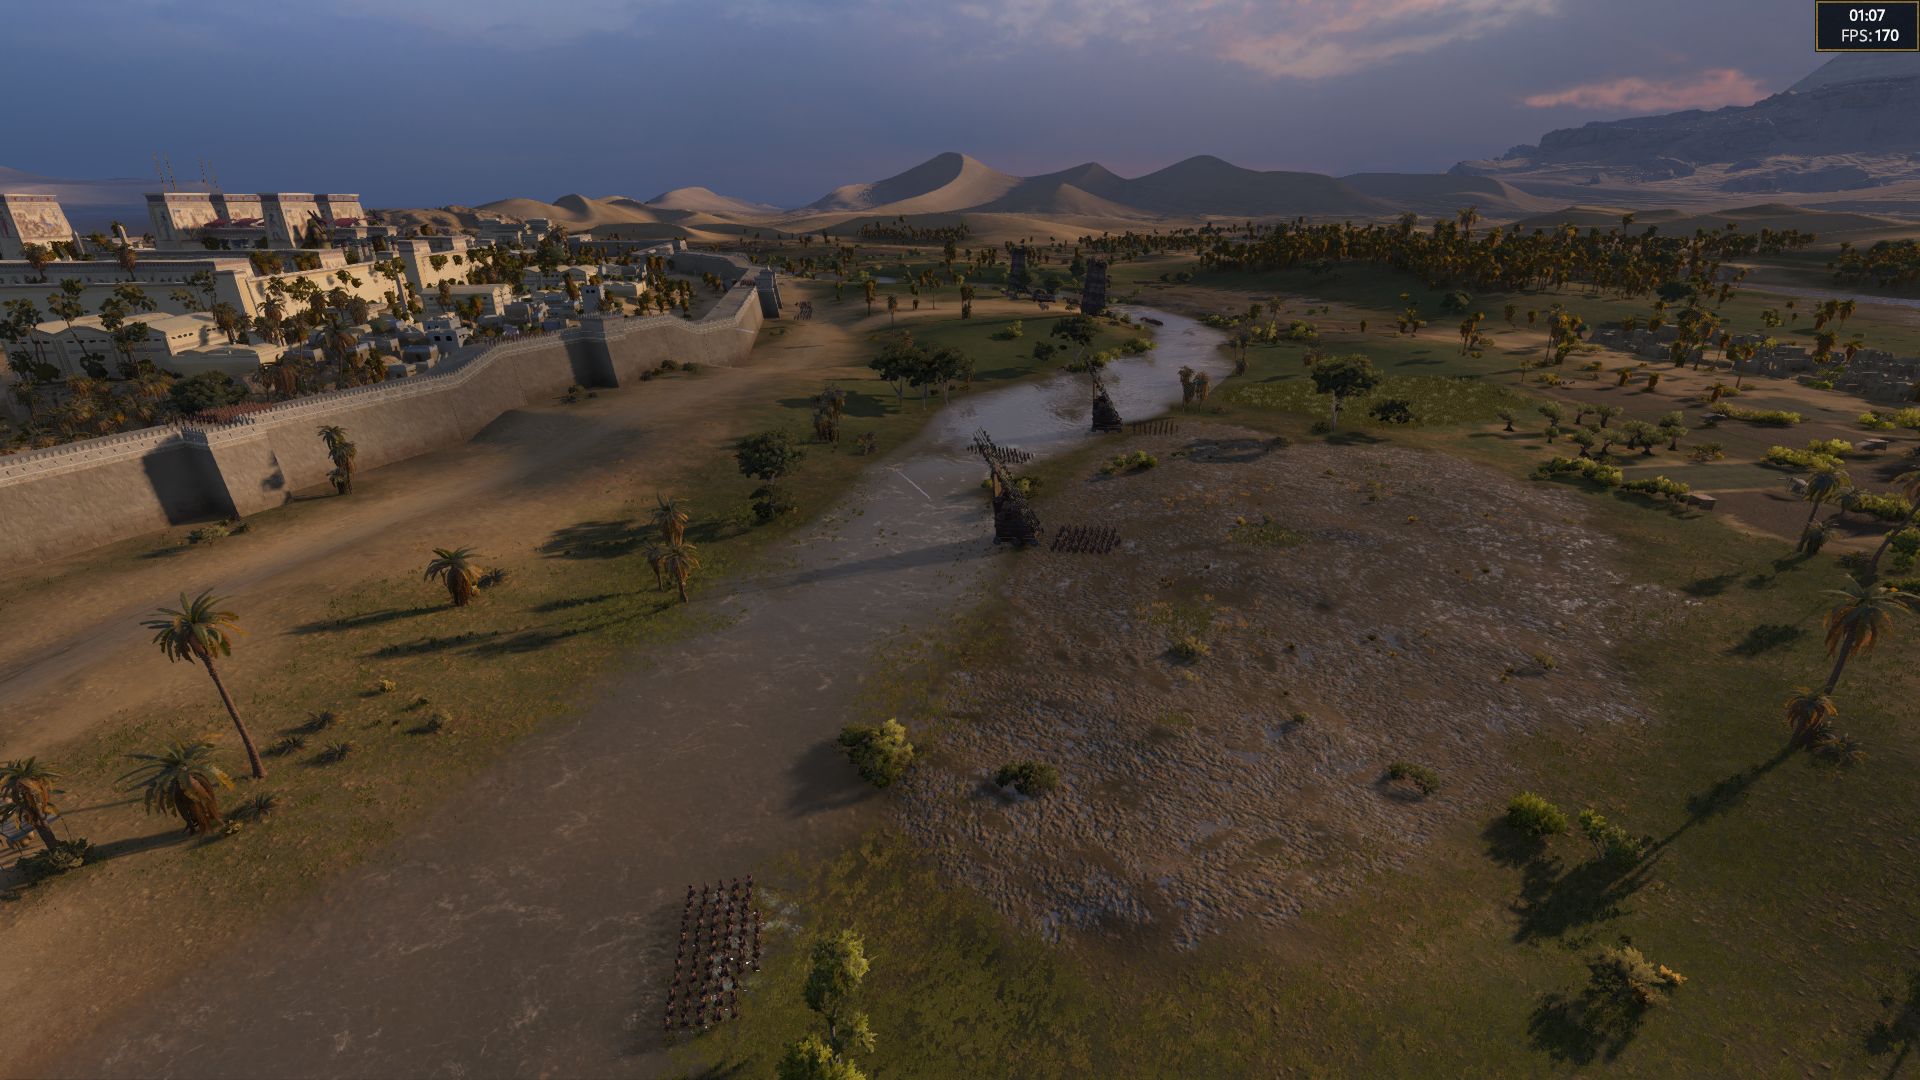
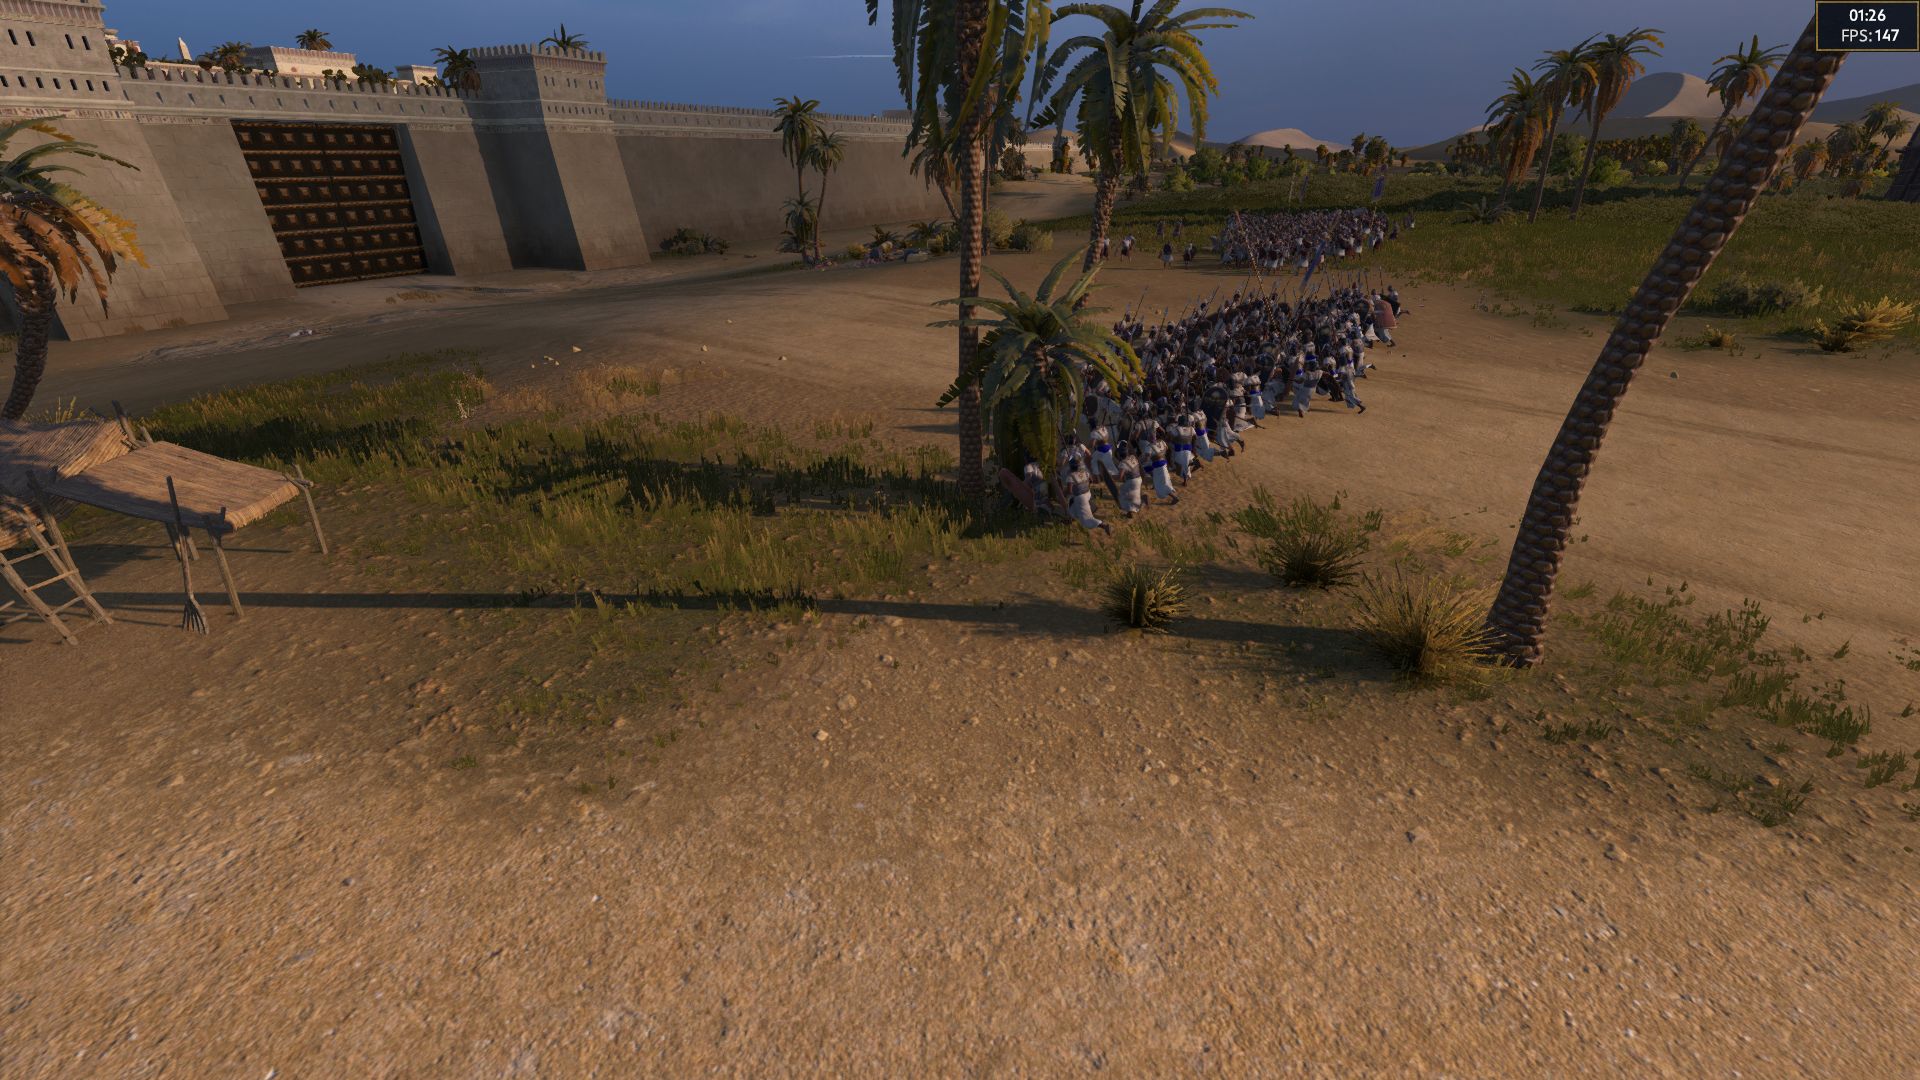
Particularly worthy of praise is the fact that the game features an integrated benchmark. To be more precise, there are three benchmarks because you can choose between a battle, siege and campaign sequence. While the latter runs significantly faster, the first two hardly have anything in common in terms of performance. Our measurements were performed with the siege benchmark, which is the most visually appealing (see video). The approximately 1.5-minute sequence shows a tracking shot with various close-ups and distant shots of a settlement or city and the corresponding surrounding area in front of a fancy pyramid backdrop.

Total War Pharaoh
Total War Pharaoh

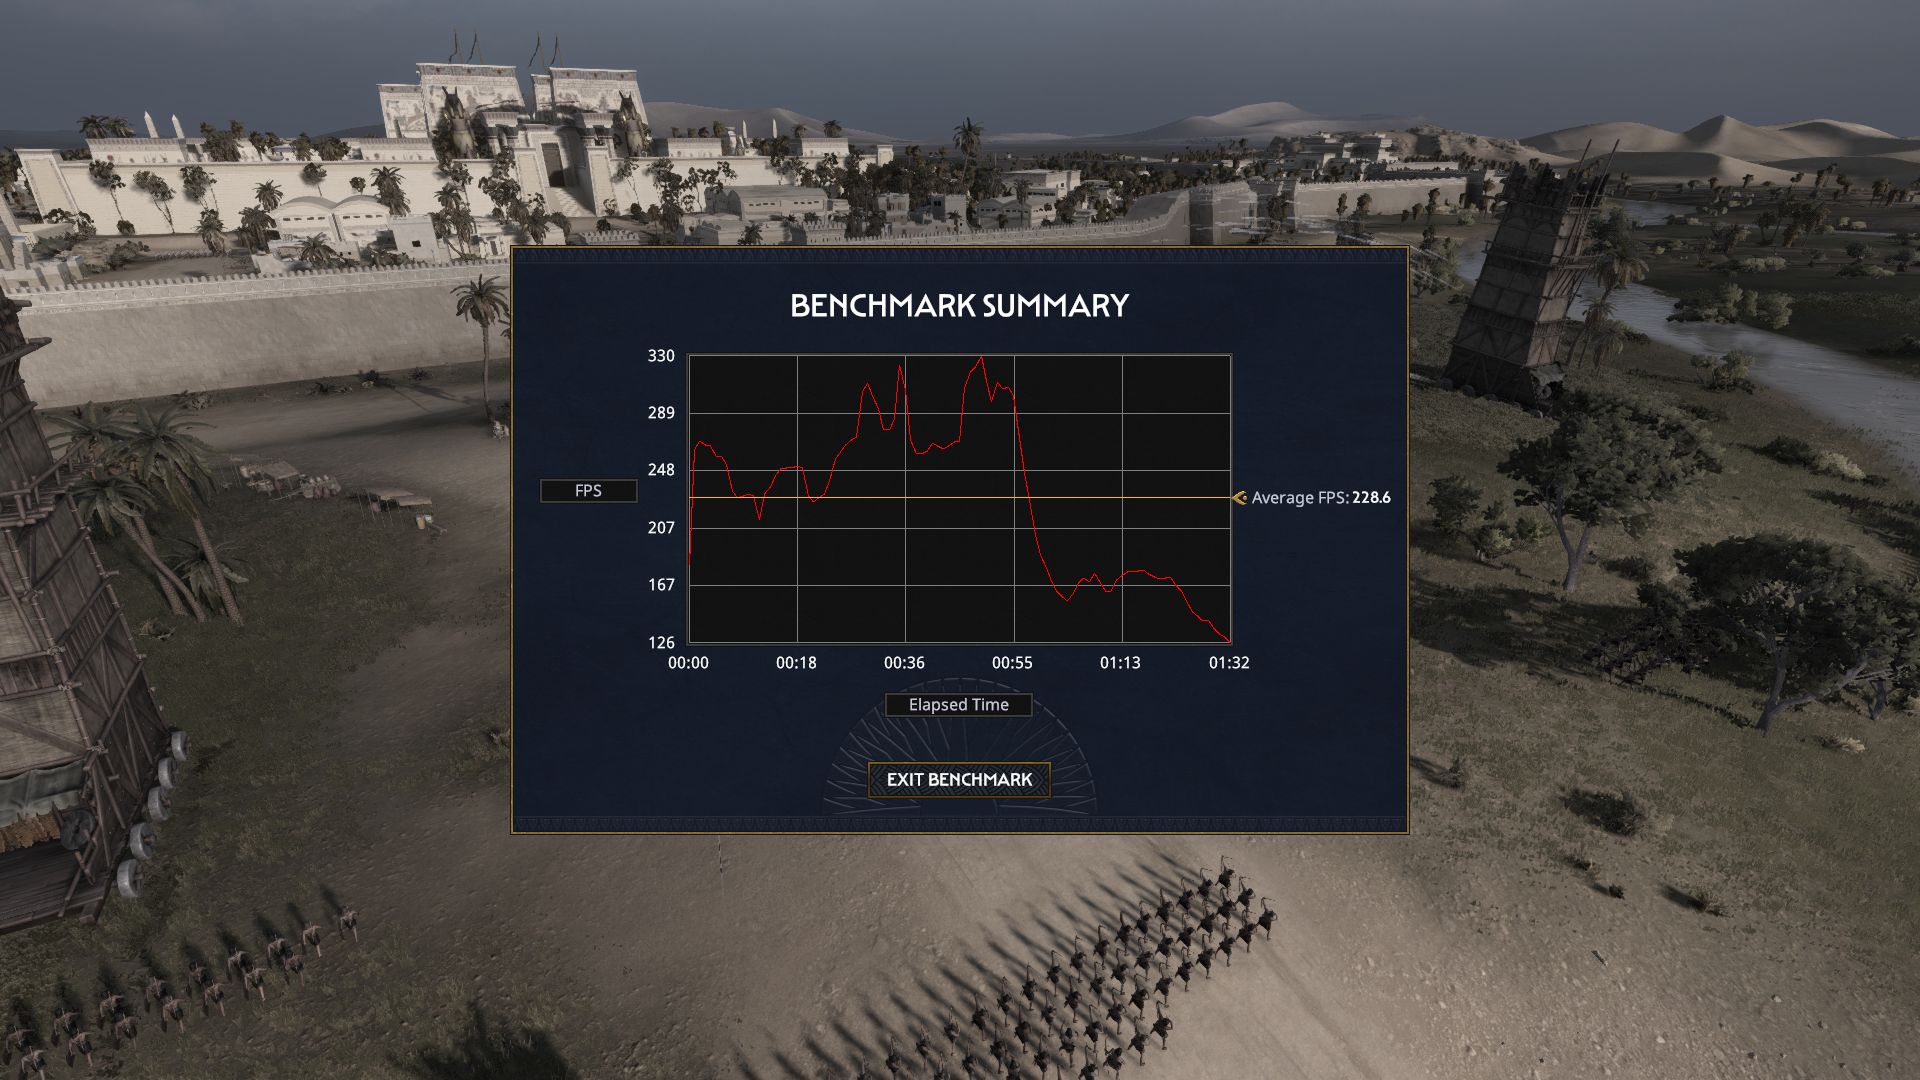
The frame rate is very dependent on the camera distance and the amount of units or unit activity shown. In order to be properly prepared for all situations, we recommend at least 40 FPS as an average graphics card benchmark value.

Results


FHD (1,920 x 1,080)

Similar to most strategy games, Total War Pharaoh is quite frugal in terms of graphics power. Even with an iGPU on the level of the Radeon 680M, the game can be run in 1,920 x 1,080 pixels and using full detail settings.

Total War Pharaoh
    1920x1080 Low Preset     1920x1080 Medium Preset     1920x1080 High Preset     1920x1080 Ultra Preset
NVIDIA GeForce RTX 4080, i9-13900K
Desktop-PC Asus ROG Strix Z790-F
396 fps ∼100%
280 fps ∼100%
229 fps ∼100%
NVIDIA GeForce RTX 4090 Laptop GPU, i9-13900HX
XMG Neo 17 E23
317 (194min) fps ∼80%
220 (131min) fps ∼79%
177 (95min) fps ∼77%
AMD Radeon RX 7900 XT, i9-13900K
Desktop-PC Asus ROG Strix Z790-F
278 (155min) fps ∼70%
187 (108min) fps ∼67%
154 (85min) fps ∼67%
NVIDIA GeForce RTX 4080 Laptop GPU, i9-13900HX
Schenker Key 17 Pro E23
281 (54min) fps ∼71%
192 (112min) fps ∼69%
154 (81min) fps ∼67%
NVIDIA GeForce RTX 4070 Laptop GPU, i9-13900HX
XMG Pro 15 E23
263 (161min) fps ∼66%
166 (97min) fps ∼59%
129 (76min) fps ∼56%
NVIDIA GeForce RTX 3080 Ti Laptop GPU, i9-12900H
Asus ROG Strix Scar 17 G733ZX
256 (146min) fps ∼65%
157 (90min) fps ∼56%
123 (73min) fps ∼54%
NVIDIA GeForce RTX 4060 Laptop GPU, i9-13900HX
XMG Pro 15 E23
239 (158min) fps ∼60%
149 (103min) fps ∼53%
116 (75min) fps ∼51%
NVIDIA GeForce RTX 4050 Laptop GPU, i9-13900HX
XMG Focus 15 E23
212 (164min) fps ∼54%
128 (99min) fps ∼46%
101 (78min) fps ∼44%
AMD Radeon RX 6800S, R9 6900HS
Asus ROG Zephyrus G14
236 (134min) fps ∼100%
164 (100min) fps ∼41%
111 (69min) fps ∼40%
91.5 (55min) fps ∼40%
AMD Radeon 780M, R9 7940HS
Minisforum Venus Series UM790 Pro
87.9 fps ∼37%
68.6 fps ∼17%
43.8 fps ∼16%
34.7 fps ∼15%
AMD Radeon 680M, R9 6900HS
Asus ROG Zephyrus G14
72.4 (61min) fps ∼31%
65.1 (54min) fps ∼16%
52.6 (38min) fps ∼19%
46.3 (31min) fps ∼20%

QHD (2,560 x 1,440)

It doesn't have to be a high-end device for a mix of 2,560 x 1,440 pixels and the Ultra preset, either. A GeForce RTX 4050 already cracks the 60 FPS mark.

Total War Pharaoh
    2560x1440 Ultra Preset
NVIDIA GeForce RTX 4080, i9-13900K
Desktop-PC Asus ROG Strix Z790-F
205 fps ∼100%
NVIDIA GeForce RTX 4090 Laptop GPU, i9-13900HX
XMG Neo 17 E23
169 (94min) fps ∼82%
AMD Radeon RX 7900 XT, i9-13900K
Desktop-PC Asus ROG Strix Z790-F
151 (91min) fps ∼74%
NVIDIA GeForce RTX 4080 Laptop GPU, i9-13900HX
Schenker Key 17 Pro E23
136 (83min) fps ∼66%
NVIDIA GeForce RTX 3080 Ti Laptop GPU, i9-12900H
Asus ROG Strix Scar 17 G733ZX
98.4 (69min) fps ∼48%
NVIDIA GeForce RTX 4070 Laptop GPU, i9-13900HX
XMG Pro 15 E23
95.4 (74min) fps ∼47%
NVIDIA GeForce RTX 4060 Laptop GPU, i9-13900HX
XMG Pro 15 E23
81.6 (63min) fps ∼40%
NVIDIA GeForce RTX 4050 Laptop GPU, i9-13900HX
XMG Focus 15 E23
66.6 (52min) fps ∼32%
AMD Radeon 780M, R9 7940HS
Minisforum Venus Series UM790 Pro
22.1 fps ∼11%

UHD (3,840 x 2,160)

Even 3,840 x 2,160 and maximum settings are super easily managed by certain mid-range chips. However, a GeForce RTX 4060 would be on the safe side.

Total War Pharaoh
    3840x2160 Ultra Preset
NVIDIA GeForce RTX 4080, i9-13900K
Desktop-PC Asus ROG Strix Z790-F
117 fps ∼100%
AMD Radeon RX 7900 XT, i9-13900K
Desktop-PC Asus ROG Strix Z790-F
98.4 (79min) fps ∼84%
NVIDIA GeForce RTX 4090 Laptop GPU, i9-13900HX
XMG Neo 17 E23
96.1 (77min) fps ∼82%
NVIDIA GeForce RTX 4080 Laptop GPU, i9-13900HX
Schenker Key 17 Pro E23
74.5 (60min) fps ∼64%
NVIDIA GeForce RTX 3080 Ti Laptop GPU, i9-12900H
Asus ROG Strix Scar 17 G733ZX
53.5 (37min) fps ∼46%
NVIDIA GeForce RTX 4070 Laptop GPU, i9-13900HX
XMG Pro 15 E23
47.1 (38min) fps ∼40%
NVIDIA GeForce RTX 4060 Laptop GPU, i9-13900HX
XMG Pro 15 E23
40.2 (32min) fps ∼34%
NVIDIA GeForce RTX 4050 Laptop GPU, i9-13900HX
XMG Focus 15 E23
32.3 (26min) fps ∼28%
AMD Radeon 780M, R9 7940HS
Minisforum Venus Series UM790 Pro
10.6 fps ∼9%

Please note

Since gaming tests are very time-consuming and often restricted by installation or activation limits, we can only provide you with a part of the benchmarks upon publication of this article. Further graphics cards will be added later.

Overview

Show Restrictions
PosModel< PrevNext >Total War Pharaoh
 Total War Pharaoh (2023)
low
1920x1080
Low Preset
med.
1920x1080
Medium Preset
high
1920x1080
High Preset
ultra
1920x1080
Ultra Preset
QHD
2560x1440
Ultra Preset
4K
3840x2160
Ultra Preset
NVIDIA GeForce RTX 4090
565.7n3
348.2n3
231.3n3
187.1n3
186.2n3
158.2n3
AMD Radeon RX 7900 XTX
599.7
406.6
285
230.6
216.1
125.8
NVIDIA GeForce RTX 4080 Super
636.25n2
410.8n2
286.1n2
232.15n2
213.25n2
120.1n2
NVIDIA GeForce RTX 4080
396
280
229
205
117
AMD Radeon RX 7900 XT
278
187
154
151
98.4
AMD Radeon RX 6950 XT
564.3
339.7
229
184.7
166
87
NVIDIA GeForce RTX 4090 Laptop GPU
317
227.5n2
177.5n2
164.5n2
96.1
NVIDIA GeForce RTX 3090
558.3
343.4
225.2
182.6
156
86.8
NVIDIA GeForce RTX 4080 Laptop GPU
281
192
154
136
74.5
NVIDIA GeForce RTX 3080 12 GB
372
252
206
152
81.8
AMD Radeon RX 6800
506.6
334.8
205
168
121.6
61
AMD Radeon RX 7700 XT
519.1
333.2
209.7
169.6
122.8
60.5
NVIDIA Titan RTX
493
319.6
200.9
159.9
116
60.8
NVIDIA GeForce RTX 3070 Ti
508.5
321.8
202.4
163.5
119.4
62.9
NVIDIA GeForce RTX 3080 Ti Laptop GPU
256
157
123
98.4
53.5
NVIDIA GeForce RTX 4070 Laptop GPU
385.9
251.25n2
156.1n2
121.15n2
91.3n2
47.1
NVIDIA GeForce RTX 3070
334
200
159
111
57.7
AMD Radeon RX 6750 XT
466.9
318.4
191.1
155.5
103.8
51.1
AMD Radeon RX 6700 XT
463.8
310.4
183.2
148.5
97.8
48
PosModel< PrevNext >Total War Pharaoh
low med. high ultra QHD 4K
NVIDIA GeForce RTX 3080 Laptop GPU
349.9
220.3
133.8
103.5
78.6
42.1
NVIDIA GeForce RTX 3060 Ti
444
283.9
175.8
139.6
97.1
49.8
Intel Arc A770
386
244
151
119
86
46
AMD Radeon RX 7600
402.9
271.5
163.1
129.1
83.3
40.8
NVIDIA GeForce RTX 4060 Laptop GPU
216n2
138.5n2
110n2
78.8n2
40.2
AMD Radeon RX 6650 XT
396.3
267.9
151.2
121
77.5
36.2
NVIDIA GeForce RTX 3070 Laptop GPU
329.3
205.4
127.1
99.1
78.3
42.5
AMD Radeon RX 6800S
236
164
111
91.5
AMD Radeon RX 7600M XT
300.7n2
179.15n2
114.05n2
89.35n2
63.55n2
33n2
Intel Arc A750
367.2
231.4
137
108.7
77.4
40.6
Apple M3 Max 40-Core GPU
242
209.5n2
138.5n2
109n2
82n2
NVIDIA Titan X Pascal
398.7
266.7
149.4
118.1
80.6
41.8
NVIDIA GeForce RTX 2070 Super (Desktop)
386.7
253.9
147.1
114.7
79
41.1
AMD Radeon RX 5700 XT (Desktop)
336.7
238.7
126.8
104.1
66.1
31.7
NVIDIA GeForce RTX 3060 Laptop GPU
97.3
69.3
36.5
AMD Radeon RX 7600S
189
117
92.7
62.8
31.6
Intel Arc A580
349.7
218.9
125
98.1
67.5
34.8
NVIDIA GeForce RTX 2060 Super (Desktop)
352
230.7
132.3
103.3
70.5
35.6
AMD Radeon RX 6600
316.1
217.3
115.8
93.7
58.8
27.7
Apple M3 Pro 18-Core GPU
212
140
77
58
42
PosModel< PrevNext >Total War Pharaoh
low med. high ultra QHD 4K
AMD Radeon RX 5700 (Desktop)
310.3
220.3
113.8
93.6
59.2
28.3
AMD Radeon RX 6600M
286.2
186.4
112.6
91.4
59.2
27.4
Apple M3 Pro 14-Core GPU
193
125
67
53
35
AMD Radeon RX 5600 XT (Desktop)
278.4
206.5
105.9
87.5
55.2
25.8
NVIDIA GeForce GTX 1660 Super (Desktop)
252.3
165
92.6
72.7
48
23.5
AMD Radeon RX 6500 XT
188.9
143.1
81.5
66
40.7
16.9
AMD Radeon RX 5500 XT (Desktop)
191.7
136.7
70.5
58.3
37
17.7
NVIDIA GeForce RTX 4050 Laptop GPU
179.5n2
106.05n2
80.35n2
66.6
32.3
Intel Arc A730M
233.6n2
139n2
84n2
67.1n2
53.3
27.3
NVIDIA GeForce GTX 1660 Ti Mobile
183.5
127.2
82.4
66.3
NVIDIA GeForce GTX 1660 (Desktop)
209.8
144.2
82.8
65.9
43.5
21.1
NVIDIA GeForce GTX 1650 Super (Desktop)
201.9
136.5
75.4
59.5
38.7
19.2
NVIDIA GeForce RTX 3050 4GB Laptop GPU
106.1
62
48.8
AMD Radeon RX 6500M
141.9
87.7
53.3
37
NVIDIA GeForce GTX 1650 Ti Mobile
156.8
94.7
57.1
45.1
AMD Radeon RX 5500M
117.6
79.1
53.6
43.4
NVIDIA GeForce RTX 2050 Mobile
80.7
50.4
29.5
19
NVIDIA GeForce GTX 1650 Mobile
144.4
93.1
53.3
41.6
Intel Arc A380
137
87
49
39
Intel Arc A310
111
73.6
41.6
32.3
PosModel< PrevNext >Total War Pharaoh
low med. high ultra QHD 4K
Intel Arc 8-Cores iGPU
99.35n2
68.65n2
49.6n2
38.05n2
Intel Arc 7-Cores iGPU
95.5
56.8
35.6
28.1
AMD Radeon 780M
88.7n6
67.1n6
48.95n6
40.8n6
22.1
10.6
Apple M3 10-Core GPU
133n3
83n3
44n3
35n3
24
AMD Radeon 680M
72.4n3
62.5n3
48.4n3
43.6n3
NVIDIA GeForce MX350
67.9
44
23
18.4
NVIDIA GeForce MX250
45.6
28.2
16.4
Intel Iris Xe Graphics G7 80EUs
44.6n2
32.25n2
22.1n2
22.4
16.8
Intel Iris Plus Graphics G7 (Ice Lake 64 EU)
39
25
13
AMD Radeon RX Vega 10
36.5
26
13.6
11
Intel UHD Graphics 32EUs (Alder Lake)
27.1
19.9
13
11.4
Intel UHD Graphics Xe 32EUs (Tiger Lake-H)
41.1
30.5
19.5
17.7
AMD Radeon RX Vega 8 (Ryzen 4000/5000)
46.4
33.5
18.4
14.4
Intel Iris Graphics 550
23.2
14.3
AMD Radeon RX Vega 6 (Ryzen 4000/5000)
40.5
31.9
21.3
18.8
Intel UHD Graphics G1 (Ice Lake 32 EU)
18.2
12.6
6.4
Intel UHD Graphics 630
16.4
Intel UHD Graphics Xe 16EUs (Tiger Lake-H)
17.8
13.5
Intel UHD Graphics 620
15.8
10.5
AMD Radeon R5 M255
14.9
PosModel< PrevNext >Total War Pharaoh
low med. high ultra QHD 4K
AMD Radeon RX Vega 3
19.7
13.4
Intel HD Graphics 4400
9
(-) * Smaller values are better. / n123 Number of benchmarks for this median value / * Approximate position


Legend
5Stutters – This game is very likely to stutter and have poor frame rates. Based on all known benchmarks using the specified graphical settings, average frame rates are expected to fall below 25fps
May Stutter – This graphics card has not been explicitly tested on this game. Based on interpolated information from surrounding graphics cards of similar performance levels, stutters and poor frame rates are expected.
30Fluent – Based on all known benchmarks using the specified graphical settings, this game should run at or above 25fps
40Fluent – Based on all known benchmarks using the specified graphical settings, this game should run at or above 35fps
60Fluent – Based on all known benchmarks using the specified graphical settings, this game should run at or above 58fps
May Run Fluently – This graphics card has not been explicitly tested on this game. Based on interpolated information from surrounding graphics cards of similar performance levels, fluent frame rates are expected.
?Uncertain – This graphics card experienced unexpected performance issues during testing for this game. A slower card may be able to achieve better and more consistent frame rates than this particular GPU running the same benchmark scene.
Uncertain – This graphics card has not been explicitly tested on this game and no reliable interpolation can be made based on the performances of surrounding cards of the same class or family.
The value in the fields displays the average frame rate of all values in the database. Move your cursor over the value to see individual results.

All test systems

Laptop Graphics card Processor RAM
XMG Neo 17 E23 Nvidia GeForce RTX 4090 @175 W TGP (16 GB GDDR6X) Intel Core i9-13900HX 2 x 16 GB DDR5
Schenker Key 17 Pro E23 Nvidia GeForce RTX 4080 @175 W TGP (12 GB GDDR6X) Intel Core i9-13900HX 2 x 16 GB DDR5
XMG Pro 15 E23 Nvidia GeForce RTX 4070 @140 W TGP (8 GB GDDR6) Intel Core i9-13900HX 2 x 16 GB DDR5
XMG Pro 15 E23 Nvidia GeForce RTX 4060 @140 W TGP (8 GB GDDR6) Intel Core i9-13900HX 2 x 16 GB DDR5
XMG Focus 15 E23 Nvidia GeForce RTX 4050 @140 W TGP (6 GB GDDR6) Intel Core i9-13900HX 2 x 16 GB DDR5
Asus ROG Strix Scar 17 Nvidia GeForce RTX 3080 Ti @150 W TGP (16 GB GDDR6) Intel Core i9-12900H 2 x 16 GB DDR5
Asus ROG Zephyrus G14 AMD Radeon RX 6800S (8 GB GDDR6) & AMD Radeon 680M AMD Ryzen 9 6900HS 2 x 16 GB DDR5
Tower PC Graphics card Processor RAM
Asus ROG Strix Z790-F Nvidia GeForce RTX 4080 (16 GB GDDR6X)
AMD Radeon RX 7900 XT (20 GB GDDR6)
Intel Core i9-13900K 2 x 24 GB DDR5 G.Skill
Mini PC Graphics card Processor RAM
Minisforum UM790 Pro AMD Radeon 780M AMD Ryzen 9 7940HS 2 x 32 GB DDR5
Operating system Nvidia driver AMD driver
Windows 11 ForceWare 537.58 Adrenalin 23.10.1
static version load dynamic
Loading Comments
Comment on this article
Please share our article, every link counts!
> Expert Reviews and News on Laptops, Smartphones and Tech Innovations > Reviews > Total War Pharaoh review: Laptop and desktop benchmarks
Florian Glaser, 2023-10-19 (Update: 2023-10-19)