Notebookcheck Logo

Intel UHD Graphics 32EUs (Alder Lake)

The Intel Xe Graphics 32 EUS (Alder Lake) is an integrated graphics card in Alder Lake CPUs that was introduced at the beginning of 2023. It is based on the Xe architecture (Gen12) and offers only 32 of the 96 installed execution units (EUs) . The GPU is manufactured at Intel using the improved 10nm process (Intel 7). The raw performance is comparable to the Radeon RX Vega 6 (in Ryzen 5000 CPUs), but the gaming performance is lower due to the weaker driver support (in 2022). Only low demanding games such as Dota 2 Reborn can be played smoothly at the lowest settings (see below).

Gen. 12 / Xe Series

Iris Xe G7 96EUs compare 96 @ 0.4 - 1.35 GHz
Iris Xe G7 80EUs compare 80 @ 0.4 - 1.35 GHz
UHD Graphics 64EUs compare 64 @ 1.4 GHz
UHD Graphics Xe G4 48EUs compare 48 @ 0.35 - 1.45 GHz
UHD Graphics 32EUs 32 @ 1.25 GHz
UHD Graphics Xe 32EUs (Tiger Lake-H) compare 32 @ 0.35 - 1.45 GHz
UHD Graphics Xe 750 32EUs compare 32 @ 0.35 - 1.45 GHz
UHD Graphics 24EUs (Alder Lake-N) compare 24 @ 0.45 - 0.75 GHz
UHD Graphics Xe 16EUs (Tiger Lake-H) compare 16 @ 0.35 - 1.45 GHz
CodenameAlder Lake Xe
Pipelines32 - unified
Core Speed1250 MHz
Shared Memoryyes
APIDirectX 12_1, OpenGL 4.6
CPU in UHD Graphics 32EUsGPU Base SpeedGPU Boost / Turbo
Intel Core 3 N3558 x 3000 MHz, 15 W? MHz1350 MHz
Intel Core 3 N3508 x ? MHz, 7 W? MHz1350 MHz
Intel Core i3-N3058 x 1800 MHz, 15 W1000 MHz1250 MHz
Intel Processor N2504 x ? MHz, 6 W1250 MHz? MHz
min. - max.1000 - 1250 MHz? - 1350 MHz

Benchmarks

Performance Rating - 3DMark 11 + Fire Strike + Time Spy
0.7 pt (2%)
Restrict / Search: Model: Max. age: years
3DMark - 3DMark Fire Strike Standard Score
min: 1574     avg: 1778     median: 1791 (3%)     max: 1989 Points
3DMark - 3DMark Fire Strike Standard Graphics
min: 1736     avg: 1932     median: 1954 (2%)     max: 2139 Points
3DMark - 3DMark Ice Storm Graphics
min: 53717     avg: 62421     median: 55455 (6%)     max: 78092 Points
3DMark - 3DMark Time Spy Score
min: 599     avg: 648     median: 639.5 (2%)     max: 714 Points
3DMark - 3DMark Time Spy Graphics
min: 523     avg: 567     median: 559.5 (1%)     max: 625 Points
Restrict / Search: Model: Max. age: years
3DMark - 3DMark Ice Storm Unlimited Graphics
min: 64090     avg: 82039     median: 88219 (9%)     max: 93809 Points
3DMark - 3DMark Ice Storm Extreme Graphics
min: 38285     avg: 42908     median: 39393 (5%)     max: 51047 Points
3DMark - 3DMark Cloud Gate Score
min: 7939     avg: 11097     median: 11548 (11%)     max: 12397 Points
3DMark - 3DMark Cloud Gate Graphics
min: 10945     avg: 12952     median: 12816 (3%)     max: 14227 Points
3DMark 11 - 3DM11 Performance Score
min: 2390     avg: 2910     median: 2979 (4%)     max: 3281 Points
3DMark 11 - 3DM11 Performance GPU
min: 2194     avg: 2601     median: 2662 (2%)     max: 2901 Points
Restrict / Search: Model: Max. age: years
3DMark Vantage
3DM Vant. Perf. total +
3DMark Vantage - 3DM Vant. Perf. total
min: 7913     avg: 9682     median: 9705 (3%)     max: 11405 Points
3DM Vant. Perf. GPU no PhysX +
3DMark Vantage - 3DM Vant. Perf. GPU no PhysX
min: 6818     avg: 8054     median: 7946 (4%)     max: 9504 Points
Restrict / Search: Model: Max. age: years
3DMark 05 - 3DMark 05 - Standard
19619 Points (21%)
Restrict / Search: Model: Max. age: years
3DMark 06 3DMark 06 - Standard 1280x1024 +
3DMark 06
min: 9971     avg: 13168     median: 14041 (18%)     max: 15491 Points
Unigine Valley 1.0 - Unigine Valley 1.0 DX
min: 5.7     avg: 6.4     median: 6.1 (2%)     max: 7.3 fps
Cinebench R10 Cinebench R10 Shading (32bit) +
Cinebench R10 - Cinebench R10 Shading (32bit)
min: 5716     avg: 7455     median: 7092 (5%)     max: 9920 points
Cinebench R11.5 Cinebench R11.5 OpenGL 64 Bit +
Cinebench R11.5 - Cinebench R11.5 OpenGL 64 Bit
min: 28.92     avg: 42.2     median: 45.6 (15%)     max: 48.5 fps
Cinebench R15
Cinebench R15 OpenGL 64 Bit +
Cinebench R15 - Cinebench R15 OpenGL 64 Bit
min: 40.69     avg: 55.7     median: 58.7 (3%)     max: 61.63 fps
Cinebench R15 OpenGL Ref. Match 64 Bit +
Cinebench R15 - Cinebench R15 OpenGL Ref. Match 64 Bit
97.8 % (98%)
GFXBench - GFXBench 5.0 4K Aztec Ruins High Tier Offscreen
6.2 fps (2%)
GFXBench - GFXBench 5.0 Aztec Ruins High Tier Offscreen
15 fps (3%)
Restrict / Search: Model: Max. age: years
GFXBench - GFXBench 5.0 Aztec Ruins Normal Tier Offscreen
47 fps (3%)
GFXBench - GFXBench Car Chase Offscreen
46 fps (4%)
GFXBench 3.1 - GFXBench Manhattan ES 3.1 Offscreen
58 fps (1%)
GFXBench 3.0 - GFXBench 3.0 Manhattan Offscreen
84 fps (4%)
GFXBench (DX / GLBenchmark) 2.7
GFXBench T-Rex HD Offscreen C24Z16 +
GFXBench (DX / GLBenchmark) 2.7 - GFXBench T-Rex HD Offscreen C24Z16
165 fps (1%)
Basemark GPU 1.2 - Basemark GPU 1.2 Vulkan Official Medium Offscreen 1080
min: 72.1     avg: 1308     median: 104.6 (3%)     max: 3747 fps
Basemark GPU 1.2 - Basemark GPU 1.2 Vulkan Official High Offscreen 2160
min: 5.61     avg: 211.8     median: 211.8 (39%)     max: 418 fps
Geekbench 6.5 - Geekbench 6.5 GPU OpenCL
min: 5031     avg: 6128     median: 6205 (2%)     max: 6826 points
Geekbench 6.5 - Geekbench 6.5 GPU Vulkan
min: 5493     avg: 6789     median: 6978 (2%)     max: 7813 points
LuxMark v2.0 64Bit - LuxMark v2.0 Room GPU
min: 232     avg: 298.7     median: 318 (1%)     max: 346 Samples/s
LuxMark v2.0 64Bit - LuxMark v2.0 Sala GPU
min: 728     avg: 778     median: 768 (1%)     max: 838 Samples/s
ComputeMark v2.1 - ComputeMark v2.1 Result
min: 1042     avg: 1099     median: 1098.5 (1%)     max: 1155 points
Power Consumption - Furmark Stress Test Power Consumption - external Monitor *
min: 12.6     avg: 20.6     median: 21.5 (3%)     max: 26.1 Watt
05101520253035Tooltip
Power Consumption - The Witcher 3 Power Consumption - external Monitor *
min: 21.5     avg: 23.1     median: 23.1 (3%)     max: 24.7 Watt
0510152025Tooltip
Power Consumption - Witcher 3 Power Consumption *
min: 26.6     avg: 27.4     median: 27.4 (6%)     max: 28.2 Watt
051015202530Tooltip
Power Consumption - Power Efficiency - Witcher 3 ultra
0.3 fps per Watt (24%)
Power Consumption - Cyberpunk 2077 Power Consumption - external Monitor *
30.1 Watt (4%)
05101520253035Tooltip
- Range of benchmark values
red legend - Average benchmark values
* Smaller numbers mean a higher performance

Game Benchmarks

The following benchmarks stem from our benchmarks of review laptops. The performance depends on the used graphics memory, clock rate, processor, system settings, drivers, and operating systems. So the results don't have to be representative for all laptops with this GPU. For detailed information on the benchmark results, click on the fps number.

med. 1920x1080
37  fps    + Compare + 📈 Graph
high 1920x1080
26.7  fps    + Compare + 📈 Graph
ultra 1920x1080
24  fps    + Compare + 📈 Graph
» With all tested laptops playable in detail settings med..
low 1920x1080
16.9  fps    + Compare + 📈 Graph
med. 1920x1080
11.9  fps    + Compare + 📈 Graph
high 1920x1080
10.4  fps    + Compare + 📈 Graph
ultra 1920x1080
7.7  fps    + Compare + 📈 Graph
» The benchmarks indicate that the game is not playable in the tested settings.
Additional Benchmarks
Low Preset 1280x720
29.6
low 1920x1080
27.1  fps    + Compare
med. 1920x1080
19.9  fps    + Compare
high 1920x1080
13  fps    + Compare
ultra 1920x1080
11.4  fps    + Compare
» The benchmarks indicate that the game is not playable in the tested settings.
Additional Benchmarks
Low Preset 1280x720
48.3
low 1920x1080
11.3  fps    + Compare + 📈 Graph
med. 1920x1080
6.4  fps    + Compare + 📈 Graph
high 1920x1080
5.3  fps    + Compare + 📈 Graph
» The benchmarks indicate that the game is not playable in the tested settings.
Additional Benchmarks
Low Preset 1280x720
12.9
low 1920x1080
6.9 7.3 7.8 ~ 7 fps    + Compare
med. 1920x1080
5.5 6 ~ 6 fps    + Compare
» The benchmarks indicate that the game is not playable in the tested settings.
Additional Benchmarks
Low Preset (FSR off) 1280x720
11.1
12
13.8
Diablo 4

Diablo 4

2023
low 1920x1080
16.1  fps    + Compare + 📈 Graph
med. 1920x1080
14.8  fps    + Compare + 📈 Graph
high 1920x1080
11.7  fps    + Compare + 📈 Graph
ultra 1920x1080
11.1  fps    + Compare + 📈 Graph
» The benchmarks indicate that the game is not playable in the tested settings.
Additional Benchmarks
Low Preset 1280x720
29.5
low 1920x1080
14.1  fps    + Compare + 📈 Graph
med. 1920x1080
11.2  fps    + Compare + 📈 Graph
» The benchmarks indicate that the game is not playable in the tested settings.
Additional Benchmarks
Low Preset / Off 1280x720
25.7
low 1920x1080
27.3  fps    + Compare
med. 1920x1080
21.1  fps    + Compare
high 1920x1080
15.9  fps    + Compare
» The benchmarks indicate that the game is not playable in the tested settings.
Additional Benchmarks
Low Preset 1280x720
33.9
F1 2021

F1 2021

2021
low 1280x720
46  fps    + Compare
med. 1920x1080
18.3  fps    + Compare
high 1920x1080
16.5  fps    + Compare
ultra 1920x1080
10.5  fps    + Compare
» With all tested laptops playable in detail settings low.
F1 2020

F1 2020

2020
low 1280x720
35.4  fps    + Compare
med. 1920x1080
18.8  fps    + Compare
high 1920x1080
14  fps    + Compare
ultra 1920x1080
8.7  fps    + Compare
» With all tested laptops playable in detail settings low.
low 1280x720
21  fps    + Compare + 📈 Graph
med. 1920x1080
11  fps    + Compare + 📈 Graph
high 1920x1080
10  fps    + Compare + 📈 Graph
ultra 1920x1080
9  fps    + Compare + 📈 Graph
» The benchmarks indicate that the game is not playable in the tested settings.
low 1280x720
16.5 25 ~ 21 fps    + Compare
med. 1920x1080
9.2  fps    + Compare
high 1920x1080
8.6  fps    + Compare
» The benchmarks indicate that the game is not playable in the tested settings.
Additional Benchmarks
Lowest Preset 1920x1080
14.3
Strange Brigade

Strange Brigade

2018
low 1280x720
32.5 39.2 41.3 44.1 ~ 39 fps    + Compare
med. 1920x1080
13.5 13.7 15.2 17.2 ~ 15 fps    + Compare
high 1920x1080
11.5 13.4 13.5 13.8 ~ 13 fps    + Compare
ultra 1920x1080
14.5  fps    + Compare
» With most tested laptops playable in detail settings low.
Far Cry 5

Far Cry 5

2018
low 1280x720
20 21 ~ 21 fps    + Compare + 📈 Graph
med. 1920x1080
9 10 ~ 10 fps    + Compare + 📈 Graph
high 1920x1080
9 9 ~ 9 fps    + Compare + 📈 Graph
ultra 1920x1080
8 8 ~ 8 fps    + Compare + 📈 Graph
» The benchmarks indicate that the game is not playable in the tested settings.
Additional Benchmarks
Low Preset TAA 1920x1080
11
low 1280x720
17.3 20.3 23.1 23.6 32.4 ~ 23 fps    + Compare
med. 1920x1080
12.7 17 17.2 19.3 21.6 ~ 18 fps    + Compare
high 1920x1080
10.7 15.7 15.9 17.8 20.1 ~ 16 fps    + Compare
» The benchmarks indicate that the game is not playable in the tested settings.
low 1280x720
14.2 18 18.7 20.3 21.6 ~ 19 fps    + Compare
med. 1920x1080
8 9.3 9.7 10.6 11.6 ~ 10 fps    + Compare
high 1920x1080
5.3 6.5 6.9 7.3 7.8 ~ 7 fps    + Compare
» The benchmarks indicate that the game is not playable in the tested settings.
F1 2017

F1 2017

2017
low 1280x720
42  fps    + Compare
» With all tested laptops playable in detail settings low.
Additional Benchmarks
Medium Preset 4xAF 1366x768
27
low 1280x720
44.2 62.5 66.2 70.4 75.1 ~ 64 fps    + Compare
med. 1366x768
31.5 39.7 43.8 51.3 51.7 ~ 44 fps    + Compare
high 1920x1080
24.1 25.1 28.4 31.2 34.9 ~ 29 fps    + Compare
ultra 1920x1080
22.1 23.1 26.6 28.7 32.1 ~ 27 fps    + Compare
» With most tested laptops playable in detail settings med..
low 1024x768
16 38.1 38.7 ~ 31 fps    + Compare + 📈 Graph
med. 1366x768
12 25.1 ~ 19 fps    + Compare
high 1920x1080
12.3 13 ~ 13 fps    + Compare + 📈 Graph
ultra 1920x1080
5.4 5.5 7 ~ 6 fps    + Compare + 📈 Graph
» The benchmarks indicate that the game is not playable in the tested settings.
Additional Benchmarks
Medium Graphics & Postprocessing 1920x1080
14.6
GTA V

GTA V

2015
low 1024x768
35.7 50.8 55.6 61.9 69.6 ~ 55 fps    + Compare
med. 1366x768
30.5 46.4 52.8 59.8 ~ 47 fps    + Compare
high 1920x1080
9.4 9.9 ~ 10 fps    + Compare
ultra 1920x1080
4 4.4 ~ 4 fps    + Compare
» With most tested laptops playable in detail settings med..
Additional Benchmarks
Normal/Off 4xAF 1920x1080
24
30.7
38
41
Lowest Settings possible 1920x1080
27
33.8
31.8
40.7
44.2
lowmed.highultraQHD4K
Prince of Persia The Lost Crown3726.724
The Finals16.911.910.47.74
Total War Pharaoh27.119.91311.4
Counter-Strike 211.36.385.29
Cyberpunk 2077 2.2 Phantom Liberty76
Diablo 416.114.811.711.1
The Witcher 3 v414.111.2
GRID Legends27.321.115.9
F1 20214618.316.510.5
F1 202035.418.8148.7
Far Cry New Dawn2111109
Shadow of the Tomb Raider219.28.6
Strange Brigade39151314.5
Far Cry 5211098
X-Plane 11.11231816
Final Fantasy XV Benchmark19107
F1 201742
Dota 2 Reborn64442927
The Witcher 33119136
GTA V5547104
lowmed.highultraQHD4K
< 30 fps
< 60 fps
< 120 fps
≥ 120 fps
12
6
1
16
3

17


12


For more games that might be playable and a list of all games and graphics cards visit our Gaming List

Add one or more devices and compare

In the following list you can select (and also search for) devices that should be added to the comparison. You can select more than one device.

search for model:
v1.34
log 26. 16:39:00

#0 ran 0s before starting gpusingle class +0s ... 0s

#1 no ids found in url (should be separated by "_") +0s ... 0s

#2 not redirecting to Ajax server +0s ... 0s

#3 did not recreate cache, as it is less than 5 days old! Created at Sat, 25 Oct 2025 05:35:13 +0200 +0.001s ... 0.001s

#4 composed specs +0.027s ... 0.028s

#5 did output specs +0s ... 0.028s

#6 start showIntegratedCPUs +0s ... 0.028s

#7 getting avg benchmarks for device 12292 +0.03s ... 0.058s

#8 got single benchmarks 12292 +0.031s ... 0.089s

#9 got avg benchmarks for devices +0s ... 0.089s

#10 min, max, avg, median took s +0.911s ... 1s

#11 before gaming benchmark output +0s ... 1s

#12 Got 139 rows for game benchmarks. +0.018s ... 1.018s

#13 composed SQL query for gamebenchmarks +0s ... 1.018s

#14 got data and put it in $dataArray +0.014s ... 1.032s

#15 benchmarks composed for output. +0.197s ... 1.229s

#16 return log +0.005s ... 1.234s

Notebook reviews with Intel UHD Graphics 32EUs (Alder Lake) graphics card

Asus NUC 14 Essential

Asus NUC 14 Essential review: An efficient mini PC as a desktop replacement that's useful for everyday use and at the office

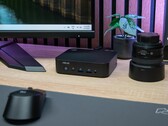
The Asus NUC 14 Essential is a mini PC equipped with Intel's Core 3 N355 processor. It's an affordable device for anyone interested in a solution for office wor...
Intel Core 3 N355 | Intel UHD Graphics 32EUs (Alder Lake) | 465 g
Acer Chromebook Plus CB514-4H review: A solid laptop with long runtimes and Gemini AI support

Acer Chromebook Plus CB514-4H review: A solid laptop with long runtimes and Gemini AI support

The Acer Chromebook Plus CB514 4H enables you to be on the go for ages. The laptop runs for up to 11 hours when working away from a power supply. Thanks to its ...
Intel Core i3-N305 | Intel UHD Graphics 32EUs (Alder Lake) | 14.00" | 1.4 kg
Acer Aspire Go 15 review: Office notebook with long runtimes for 429 euros

Acer Aspire Go 15 review: Office notebook with long runtimes for 429 euros

Alder Lake, 8 GB RAM, 512 GB SSD, and an FHD panel result in a simple office notebook for a small budget. Very good battery runtimes and USB-C Power Delivery ma...
Intel Core i3-N305 | Intel UHD Graphics 32EUs (Alder Lake) | 15.60" | 1.7 kg
Asus BR1402FG - Particularly robust convertible for students

Asus BR1402FG student laptop review: Robust for everyday use

The new Asus BR1402FG is designed for robustness with scratch-resistant Corning Gorilla Glass and US military standard MIL-STD 810H certification. Coupled with ...
Intel Core i3-N305 | Intel UHD Graphics 32EUs (Alder Lake) | 14.00" | 1.7 kg
Maxtang MTN-ALN50

Maxtang MTN-ALN50 mini PC review: Very economical office PC with good performance thanks to Intel Core i3-N305 and 8 cores

With its Intel Core i3-N305, the Maxtang MTN-ALN50 can impress with good everyday performance. Thanks to the active cooling unit, the native 8-core processor do...
Intel Core i3-N305 | Intel UHD Graphics 32EUs (Alder Lake) | 685 g

Zotac ZBOX PI430AJ: Intel Core i3-N300, 0.3 kg
  Review » Zotac Zbox pico PI430AJ review: The world's first mini PC with active AirJet technology cools the Intel Core i3-N300 in a 0.055 gal case

Acer Chromebook Spin 314 CP314-2HN: Intel Core i3-N305, 14.00", 1.6 kg
  External Review » Acer Chromebook Spin 314 CP314-2HN

Acer Chromebook Spin 312 CP312-1HN: Intel Core i3-N305, 12.20", 1.3 kg
  External Review » Acer Chromebook Spin 312 CP312-1HN

Acer Extensa 15 EX215-33: Intel Core i3-N305, 15.60", 1.7 kg
  External Review » Acer Extensa 15 EX215-33

Acer Aspire 3 A315-510P: Intel Core i3-N305, 15.60", 1.7 kg
  External Review » Acer Aspire 3 A315-510P

Acer Aspire 3 A317-55P: Intel Core i3-N305, 17.30", 2.1 kg
  External Review » Acer Aspire 3 A317-55P

HP Chromebook Plus x360 14b-cd0000: Intel Core i3-N305, 14.00", 1.5 kg
  External Review » HP Chromebook Plus x360 14b-cd0000

HP Chromebook Plus 14a-nf0000: Intel Core i3-N305, 14.00", 1.5 kg
  External Review » HP Chromebook Plus 14a-nf0000

Acer Chromebook Plus CB514-4H: Intel Core i3-N305, 14.00", 1.4 kg
  External Review » Acer Chromebook Plus 514-4HT

Acer Aspire Go 15 AG15-31P-34JP: Intel Core i3-N305, 15.60", 1.7 kg
  External Review » Acer Aspire Go 15 AG15-31P-34JP

Lenovo IdeaPad Slim 3 15IAN8: Intel Core i3-N305, 15.60", 1.6 kg
  External Review » Lenovo IdeaPad Slim 3 15IAN8

Lenovo IdeaPad Slim Chrome 14IAN8 (Slim 3i Chromebook Plus): Intel Core i3-N305, 14.00", 1.5 kg
  External Review » Lenovo IdeaPad Slim Chrome 14IAN8

HP Chromebook Plus 15at: Intel Core i3-N305, 15.60", 1.7 kg
  External Review » HP Chromebook Plus 15at

Asus Vivobook Go 15 OLED E1504G: Intel Core i3-N305, 15.60", 1.6 kg
  External Review » Asus Vivobook Go 15 OLED E1504G

Asus NUC 14 Essential: Intel Core 3 N355, 0.5 kg
   » Asus NUC 14 Essential: New mini-PC to launch in multiple configurations

Zotac ZBOX PI430AJ: Intel Core i3-N300, 0.3 kg
   » Zotac Zbox pico PI430AJ Mini-PC with active AirJet cooling unit reviewed

Please share our article, every link counts!
Mail Logo

» Comparison of GPUs
Detailed list of all laptop GPUs sorted by class and performance.

» Benchmark List
Sort and restrict laptop GPUs based on performance in synthetic benchmarks.

» Notebook Gaming List
Playable games for each graphics card and their average FPS results.

Class 1

Class 2

Radeon PRO W6600M *
Arc B 12 Xe3 Panther Lake iGPU

Class 3

UHD Graphics 750

Class 4

Class 5

Class 6

* Approximate position of the graphics adapter

Klaus Hinum (Update: 2025-10-26)