Notebookcheck Logo

AMD Radeon RX 6800 XT

AMD Radeon RX 6800 XT

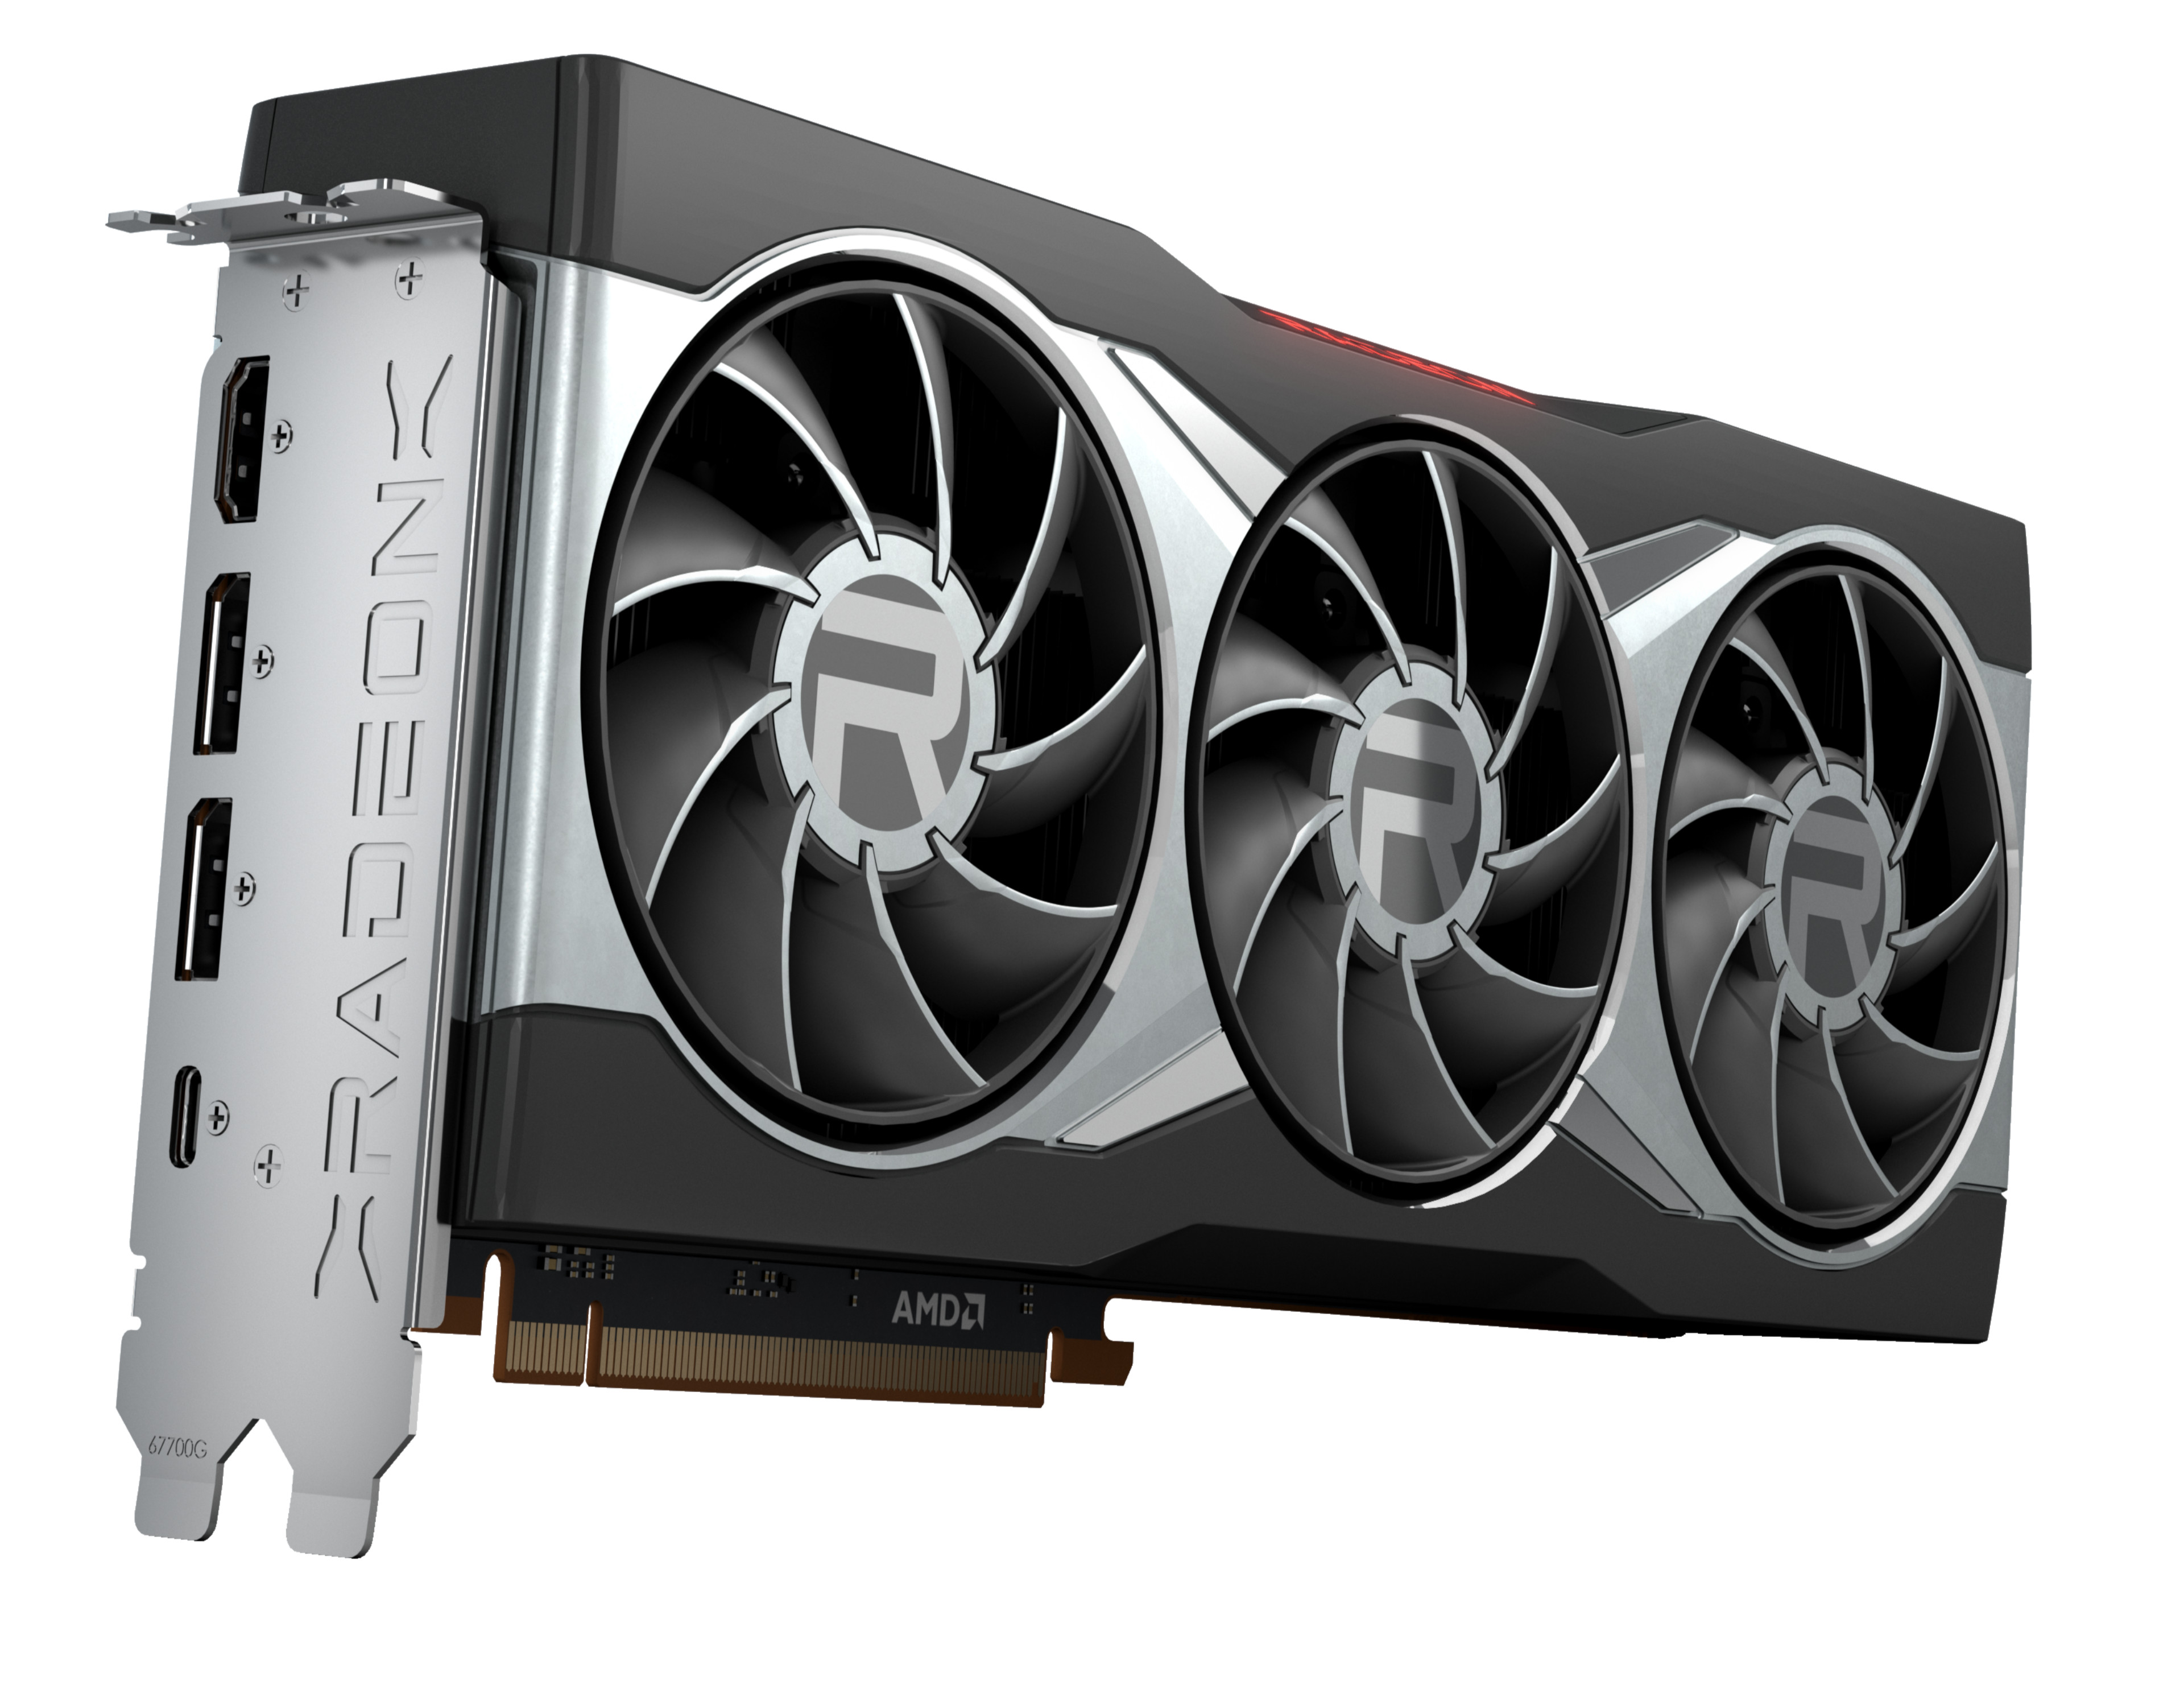
The AMD Radeon RX 6800 XT is a high-desktop GPU based on the RDNA2 architecture and uses the Navi 21 chip which is manufactured in 7nm at TSMC. The GPU has 4,608 shader units, as well as 16 GB of GDDR6 VRAM with a 256-bit interface (16 Gbps, 512 GB/s).

Features.
RDNA2 serves as the basis for the Navi 21 graphics chip, which is the successor to the Navi 10 graphics chip from the previous RX 5700 series. A number of new features like SAM (Smart Access Memory) and the Infinity Cache make the RX 6800 series very interesting. PCI Express 4.0 and RIS (Radeon Image Sharpening) are still available. The new Media Engine lets you decode video at up to 8K resolution, and the new Display Engine supports screens up to 8K at 60Hz including HDR or 4K HDR at 144Hz. 

Performance.
The performance of the AMD Radeon RX 6800 XT is comparable to a Nvidia GeForce RTX 3080. In the internal duel, the RX 6800 XT clearly surpasses the performance of a Radeon RX 5700 XT. This makes the RX 6800 XT suitable for 4K gaming.

Power consumption

The power consumption of the AMD Radeon RX 6800 XT is quantified by the manufacturer at 300 watts (TGP) and is thus somewhat more economical than the GeForce RTX 3080 (320 watts).

Radeon RX 6800 Series

Radeon RX 6800 XT 4608 @ 1.83 - 2.25 GHz256 Bit @ 16000 MHz
Radeon RX 6800 compare 3840 @ 1.82 - 2.11 GHz256 Bit @ 16000 MHz
CodenameNavi 21
ArchitectureNavi / RDNA2
Pipelines4608 - unified
Core Speed1825 - 2250 (Boost) MHz
Memory Speed16000 MHz
Memory Bus Width256 Bit
Memory TypeGDDR6
Max. Amount of Memory16 GB
Shared Memoryno
APIDirectX 12_2, Shader 6.5, OpenGL 4.6
Power Consumption300 Watt
Transistor Count26.8 Billion
technology7 nm
FeaturesDisplayPort 1.4 w/DFSC, HDMI 2.1 VRR, PCIe 4.0, Radeon Media Engine (H.264 4K150 decode, 4K90 encode / H.265 4K90 decode, 8K24, 4K60 encode / VP9 4K90. 8K24 decode)
Date of Announcement18.11.2020

Benchmarks

Performance Rating - 3DMark 11 + Fire Strike + Time Spy
22.7 pt (68%)
3DMark - 3DMark Ice Storm Extreme Graphics
422169 Points (54%)
3DMark Vantage
3DM Vant. Perf. total +
3DM Vant. Perf. GPU no PhysX +
3DMark Vantage - 3DM Vant. Perf. GPU no PhysX
101445 Points (58%)
3DMark 06 3DMark 06 - Standard 1280x1024 +
SPECviewperf 12
specvp12 sw-03 +
specvp12 snx-02 +
specvp12 showcase-01 +
specvp12 mediacal-01 +
specvp12 maya-04 +
specvp12 energy-01 +
specvp12 creo-01 +
specvp12 catia-04 +
specvp12 3dsmax-05 +
SPECviewperf 13 specvp13 sw-04 +
specvp13 snx-03 +
specvp13 showcase-02 +
specvp13 medical-02 +
specvp13 maya-05 +
specvp13 energy-02 +
specvp13 creo-02 +
specvp13 catia-05 +
specvp13 3dsmax-06 +
SPECviewperf 2020 specvp2020 solidworks-05 4k +
specvp2020 snx-04 4k +
specvp2020 medical-03 4k +
specvp2020 maya-06 4k +
specvp2020 energy-03 4k +
specvp2020 creo-03 4k +
specvp2020 catia-06 4k +
specvp2020 3dsmax-07 4k +
Cinebench R10 Cinebench R10 Shading (32bit) +
Cinebench R11.5 Cinebench R11.5 OpenGL 64 Bit +
Cinebench R15
Cinebench R15 OpenGL 64 Bit +
Cinebench R15 OpenGL Ref. Match 64 Bit +
LuxMark v2.0 64Bit - LuxMark v2.0 Sala GPU
28023 Samples/s (49%)
- Range of benchmark values for this graphics card
- Average benchmark values for this graphics card
* Smaller numbers mean a higher performance

Game Benchmarks

The following benchmarks stem from our benchmarks of review laptops. The performance depends on the used graphics memory, clock rate, processor, system settings, drivers, and operating systems. So the results don't have to be representative for all laptops with this GPU. For detailed information on the benchmark results, click on the fps number.

low 1280x720
141  fps    + Compare + 📈 Graph
med. 1920x1080
132  fps    + Compare + 📈 Graph
high 1920x1080
136  fps    + Compare + 📈 Graph
ultra 1920x1080
122  fps    + Compare + 📈 Graph
QHD 2560x1440
114  fps    + Compare + 📈 Graph
4K 3840x2160
60.3  fps    + Compare + 📈 Graph
» With all tested laptops playable in detail settings ultra.
low 1280x720
289  fps    + Compare + 📈 Graph
med. 1920x1080
277  fps    + Compare + 📈 Graph
high 1920x1080
179  fps    + Compare + 📈 Graph
ultra 1920x1080
144  fps    + Compare + 📈 Graph
QHD 2560x1440
80.4  fps    + Compare + 📈 Graph
4K 3840x2160
64  fps    + Compare + 📈 Graph
» With all tested laptops playable in detail settings ultra.
Additional Benchmarks
Highest Settings + Ultra Ray Tracing 1920x1080
21.8
low 1280x720
202  fps    + Compare
med. 1920x1080
158  fps    + Compare
high 1920x1080
135  fps    + Compare
ultra 1920x1080
118  fps    + Compare
QHD 2560x1440
98  fps    + Compare
4K 3840x2160
65  fps    + Compare
» With all tested laptops playable in detail settings ultra.
Dirt 5

Dirt 5

2020
low 1280x720
299  fps    + Compare
med. 1920x1080
208  fps    + Compare
high 1920x1080
178  fps    + Compare
ultra 1920x1080
159  fps    + Compare
QHD 2560x1440
134  fps    + Compare
4K 3840x2160
83.1  fps    + Compare
» With all tested laptops playable in detail settings ultra.
low 1280x720
173  fps    + Compare + 📈 Graph
med. 1920x1080
169  fps    + Compare + 📈 Graph
high 1920x1080
150  fps    + Compare + 📈 Graph
ultra 1920x1080
112  fps    + Compare + 📈 Graph
QHD 2560x1440
84.5  fps    + Compare + 📈 Graph
4K 3840x2160
49.3  fps    + Compare + 📈 Graph
» With all tested laptops playable in detail settings ultra.
Additional Benchmarks
Ultra Preset + Ultra Ray Tracing (DX12) 1920x1080
71.4
FIFA 21

FIFA 21

2020
low 1280x720
314  fps    + Compare + 📈 Graph
med. 1920x1080
309  fps    + Compare + 📈 Graph
high 1920x1080
309  fps    + Compare + 📈 Graph
ultra 1920x1080
313  fps    + Compare + 📈 Graph
QHD 2560x1440
314  fps    + Compare + 📈 Graph
4K 3840x2160
282  fps    + Compare + 📈 Graph
» With all tested laptops playable in detail settings ultra.
low 1280x720
692  fps    + Compare + 📈 Graph
med. 1920x1080
617  fps    + Compare + 📈 Graph
high 1920x1080
544  fps    + Compare + 📈 Graph
ultra 1920x1080
509  fps    + Compare + 📈 Graph
QHD 2560x1440
352  fps    + Compare + 📈 Graph
4K 3840x2160
185  fps    + Compare + 📈 Graph
» With all tested laptops playable in detail settings ultra.
low 1280x720
154  fps    + Compare + 📈 Graph
med. 1920x1080
139  fps    + Compare + 📈 Graph
high 1920x1080
121  fps    + Compare + 📈 Graph
QHD 2560x1440
112  fps    + Compare + 📈 Graph
4K 3840x2160
62.6  fps    + Compare + 📈 Graph
» With all tested laptops playable in detail settings high.
low 1280x720
122  fps    + Compare
med. 1920x1080
79  fps    + Compare
high 1920x1080
82  fps    + Compare
ultra 1920x1080
73  fps    + Compare
QHD 2560x1440
78  fps    + Compare
4K 3840x2160
75  fps    + Compare
» With all tested laptops playable in detail settings ultra.
low 1280x720
321  fps    + Compare + 📈 Graph
med. 1920x1080
248  fps    + Compare + 📈 Graph
high 1920x1080
152  fps    + Compare + 📈 Graph
ultra 1920x1080
94.7  fps    + Compare + 📈 Graph
QHD 2560x1440
83.6  fps    + Compare + 📈 Graph
4K 3840x2160
54.4  fps    + Compare + 📈 Graph
» With all tested laptops playable in detail settings ultra.
low 1280x720
246  fps    + Compare
med. 1920x1080
229  fps    + Compare
high 1920x1080
208  fps    + Compare
ultra 1920x1080
189  fps    + Compare
QHD 2560x1440
169  fps    + Compare
4K 3840x2160
113  fps    + Compare
» With all tested laptops playable in detail settings ultra.
low 1280x720
218  fps    + Compare
med. 1920x1080
210  fps    + Compare
high 1920x1080
209  fps    + Compare
ultra 1920x1080
206  fps    + Compare
QHD 2560x1440
143  fps    + Compare
4K 3840x2160
84.2  fps    + Compare
» With all tested laptops playable in detail settings ultra.
F1 2020

F1 2020

2020
low 1280x720
499  fps    + Compare
med. 1920x1080
432  fps    + Compare
high 1920x1080
387  fps    + Compare
ultra 1920x1080
279  fps    + Compare
QHD 2560x1440
215  fps    + Compare
4K 3840x2160
128  fps    + Compare
» With all tested laptops playable in detail settings ultra.
low 1280x720
495  fps    + Compare
med. 1920x1080
401  fps    + Compare
high 1920x1080
365  fps    + Compare
ultra 1920x1080
356  fps    + Compare
QHD 2560x1440
278  fps    + Compare
4K 3840x2160
153  fps    + Compare
» With all tested laptops playable in detail settings ultra.
low 1280x720
286  fps    + Compare
med. 1920x1080
235  fps    + Compare
high 1920x1080
173  fps    + Compare
QHD 2560x1440
145  fps    + Compare
4K 3840x2160
73.5  fps    + Compare
» With all tested laptops playable in detail settings high.
low 1280x720
203  fps    + Compare
med. 1920x1080
197  fps    + Compare
high 1920x1080
156  fps    + Compare
ultra 1920x1080
102  fps    + Compare
QHD 2560x1440
82.7  fps    + Compare
4K 3840x2160
52.9  fps    + Compare
» With all tested laptops playable in detail settings ultra.
med. 1920x1080
122  fps    + Compare
high 1920x1080
121  fps    + Compare
ultra 1920x1080
120  fps    + Compare
QHD 2560x1440
116  fps    + Compare
4K 3840x2160
76.2  fps    + Compare
» With all tested laptops playable in detail settings ultra.
low 1280x720
161  fps    + Compare
med. 1920x1080
158  fps    + Compare
high 1920x1080
139  fps    + Compare
ultra 1920x1080
120  fps    + Compare
QHD 2560x1440
93.6  fps    + Compare
4K 3840x2160
53.6  fps    + Compare
» With all tested laptops playable in detail settings ultra.
Control

Control

2019
low 1280x720
240  fps    + Compare
med. 1920x1080
229  fps    + Compare
high 1920x1080
168  fps    + Compare
QHD 2560x1440
108  fps    + Compare
4K 3840x2160
51.6  fps    + Compare
» With all tested laptops playable in detail settings high.
Additional Benchmarks
High Quality Preset & High Ray Tracing Preset (DX12) 1920x1080
66.9
Rage 2

Rage 2

2019
low 1280x720
419  fps    + Compare
med. 1920x1080
259  fps    + Compare
high 1920x1080
220  fps    + Compare
ultra 1920x1080
216  fps    + Compare
QHD 2560x1440
147  fps    + Compare
4K 3840x2160
73.6  fps    + Compare
» With all tested laptops playable in detail settings ultra.
Anno 1800

Anno 1800

2019
low 1280x720
136  fps    + Compare
med. 1920x1080
133  fps    + Compare
high 1920x1080
94.9  fps    + Compare
ultra 1920x1080
51.2  fps    + Compare
QHD 2560x1440
50.6  fps    + Compare
4K 3840x2160
45.5  fps    + Compare
» With all tested laptops playable in detail settings ultra.
low 1280x720
244  fps    + Compare + 📈 Graph
med. 1920x1080
201  fps    + Compare + 📈 Graph
high 1920x1080
161  fps    + Compare + 📈 Graph
ultra 1920x1080
138  fps    + Compare + 📈 Graph
QHD 2560x1440
114  fps    + Compare + 📈 Graph
4K 3840x2160
63.2  fps    + Compare + 📈 Graph
» With all tested laptops playable in detail settings ultra.
low 1280x720
143  fps    + Compare + 📈 Graph
med. 1920x1080
127  fps    + Compare + 📈 Graph
high 1920x1080
124  fps    + Compare + 📈 Graph
ultra 1920x1080
113  fps    + Compare + 📈 Graph
QHD 2560x1440
112  fps    + Compare + 📈 Graph
4K 3840x2160
94  fps    + Compare + 📈 Graph
» With all tested laptops playable in detail settings ultra.
low 1280x720
258  fps    + Compare
med. 1920x1080
198  fps    + Compare
high 1920x1080
144  fps    + Compare
ultra 1920x1080
115  fps    + Compare
QHD 2560x1440
94.6  fps    + Compare
4K 3840x2160
56.3  fps    + Compare
» With all tested laptops playable in detail settings ultra.
Additional Benchmarks
Ultra Quality DXR 16xAF 1920x1080
85.5
low 1280x720
144  fps    + Compare
med. 1920x1080
144  fps    + Compare
high 1920x1080
144  fps    + Compare
ultra 1920x1080
144  fps    + Compare
QHD 2560x1440
143  fps    + Compare
4K 3840x2160
126  fps    + Compare
» With all tested laptops playable in detail settings ultra.
low 1280x720
195.7  fps    + Compare
med. 1920x1080
191.2  fps    + Compare
high 1920x1080
183.4  fps    + Compare
ultra 1920x1080
175.4  fps    + Compare
QHD 2560x1440
153.7  fps    + Compare
4K 3840x2160
102.5  fps    + Compare
» With all tested laptops playable in detail settings ultra.
Additional Benchmarks
Ultra Preset DXR 1920x1080
94.5
low 1280x720
230  fps    + Compare
med. 1920x1080
213  fps    + Compare
high 1920x1080
204  fps    + Compare
ultra 1920x1080
194  fps    + Compare
QHD 2560x1440
148  fps    + Compare
4K 3840x2160
79.6  fps    + Compare
» With all tested laptops playable in detail settings ultra.
Strange Brigade

Strange Brigade

2018
low 1280x720
630  fps    + Compare
med. 1920x1080
404  fps    + Compare
high 1920x1080
355  fps    + Compare
ultra 1920x1080
302  fps    + Compare
QHD 2560x1440
222  fps    + Compare
4K 3840x2160
133  fps    + Compare
» With all tested laptops playable in detail settings ultra.
Far Cry 5

Far Cry 5

2018
low 1280x720
161  fps    + Compare + 📈 Graph
med. 1920x1080
143  fps    + Compare + 📈 Graph
high 1920x1080
139  fps    + Compare + 📈 Graph
ultra 1920x1080
130  fps    + Compare + 📈 Graph
QHD 2560x1440
131  fps    + Compare + 📈 Graph
4K 3840x2160
95  fps    + Compare + 📈 Graph
» With all tested laptops playable in detail settings ultra.
low 1280x720
83.5  fps    + Compare
med. 1920x1080
67.5  fps    + Compare
high 1920x1080
57.8  fps    + Compare
4K 3840x2160
40.1  fps    + Compare
» With all tested laptops playable in detail settings high.
low 1280x720
231  fps    + Compare
med. 1920x1080
211  fps    + Compare
high 1920x1080
149  fps    + Compare
QHD 2560x1440
113  fps    + Compare
4K 3840x2160
65.2  fps    + Compare
» With all tested laptops playable in detail settings high.
low 1024x768
438  fps    + Compare
high 1920x1080
258  fps    + Compare
ultra 1920x1080
205  fps    + Compare
4K 3840x2160
98.4  fps    + Compare
» With all tested laptops playable in detail settings ultra.
low 1280x720
220.9  fps    + Compare
med. 1366x768
169.8  fps    + Compare
high 1920x1080
166.1  fps    + Compare
ultra 1920x1080
144.7  fps    + Compare
4K 3840x2160
122.2  fps    + Compare
» With all tested laptops playable in detail settings ultra.
low 1024x768
596  fps    + Compare
high 1920x1080
294  fps    + Compare
ultra 1920x1080
160  fps    + Compare
4K 3840x2160
110  fps    + Compare
» With all tested laptops playable in detail settings ultra.
GTA V

GTA V

2015
low 1024x768
186  fps    + Compare
med. 1366x768
185  fps    + Compare
high 1920x1080
179  fps    + Compare
ultra 1920x1080
121  fps    + Compare
QHD 2560x1440
120  fps    + Compare
4K 3840x2160
134  fps    + Compare
» With all tested laptops playable in detail settings ultra.
Additional Benchmarks
Highest Settings possible 16xAF 4xMSAA + FXAA 3840x2160
67.9
Lowest Settings possible 1920x1080
186
lowmed.highultraQHD4K
Yakuza Like a Dragon14113213612211460.3
Call of Duty Black Ops Cold War28927717914480.464
Assassin´s Creed Valhalla2021581351189865
Dirt 529920817815913483.1
Watch Dogs Legion17316915011284.549.3
FIFA 21314309309313314282
Star Wars Squadrons692617544509352185
Mafia Definitive Edition15413912111262.6
Serious Sam 41227982737875
Crysis Remastered32124815294.783.654.4
Horizon Zero Dawn246229208189169113
Death Stranding21821020920614384.2
F1 2020499432387279215128
Doom Eternal495401365356278153
Hunt Showdown28623517314573.5
Red Dead Redemption 220319715610282.752.9
Star Wars Jedi Fallen Order12212112011676.2
Borderlands 316115813912093.653.6
Control24022916810851.6
Rage 241925922021614773.6
Anno 180013613394.951.250.645.5
The Division 224420116113811463.2
Far Cry New Dawn14312712411311294
Metro Exodus25819814411594.656.3
Apex Legends144144144144143126
Battlefield V195.7191.2183.4175.4153.7102.5
Shadow of the Tomb Raider23021320419414879.6
Strange Brigade630404355302222133
Far Cry 516114313913013195
X-Plane 11.1183.567.557.840.1
Final Fantasy XV Benchmark23121114911365.2
Rise of the Tomb Raider43825820598.4
Dota 2 Reborn220.9169.8166.1144.7122.2
The Witcher 3596294160110
GTA V186185179121120134
< 30 fps
< 60 fps
< 120 fps
≥ 120 fps


1
33


2
31

1
2
32

1
7
22

1
15
15

8
19
8

For more games that might be playable and a list of all games and graphics cards visit our Gaming List

Add one or more devices and compare

In the following list you can select (and also search for) devices that should be added to the comparison. You can select more than one device.

restrict list:

show all (including archived), 2024, 2023
v1.26
log 17. 04:30:27

#0 no ids found in url (should be separated by "_") +0s ... 0s

#1 not redirecting to Ajax server +0s ... 0s

#2 did not recreate cache, as it is less than 5 days old! Created at Sat, 16 Mar 2024 05:38:32 +0100 +0.001s ... 0.001s

#3 composed specs +0.053s ... 0.054s

#4 did output specs +0s ... 0.054s

#5 start showIntegratedCPUs +0s ... 0.054s

#6 getting avg benchmarks for device 10562 +0.048s ... 0.102s

#7 got single benchmarks 10562 +0.01s ... 0.112s

#8 got avg benchmarks for devices +0s ... 0.112s

#9 min, max, avg, median took s +1.051s ... 1.164s

#10 before gaming benchmark output +0s ... 1.164s

#11 Got 198 rows for game benchmarks. +0.09s ... 1.254s

#12 composed SQL query for gamebenchmarks +0s ... 1.254s

#13 got data and put it in $dataArray +0.031s ... 1.285s

#14 benchmarks composed for output. +2.342s ... 3.626s

#15 return log +0.082s ... 3.709s

No reviews found for this graphics card.

Please share our article, every link counts!

» Comparison of GPUs
Detailed list of all laptop GPUs sorted by class and performance.

» Benchmark List
Sort and restrict laptop GPUs based on performance in synthetic benchmarks.

» Notebook Gaming List
Playable games for each graphics card and their average FPS results.

Class 0

Arc A380

Class 1

Arc A580 Desktop

Class 2

Class 3

UHD Graphics 32EUs
UHD Graphics 750

Class 4

* Approximate position of the graphics adapter

> Expert Reviews and News on Laptops, Smartphones and Tech Innovations > Benchmarks / Tech > Comparison of Laptop Graphics Cards > AMD Radeon RX 6800 XT (Desktop) GPU - Benchmarks and Specs
Klaus Hinum (Update: 2021-01-22)