
Notebookcheck Logo

Intel Graphics 2 Xe3 Panther Lake iGPU

Intel Intel Graphics 2 Xe3 PTL

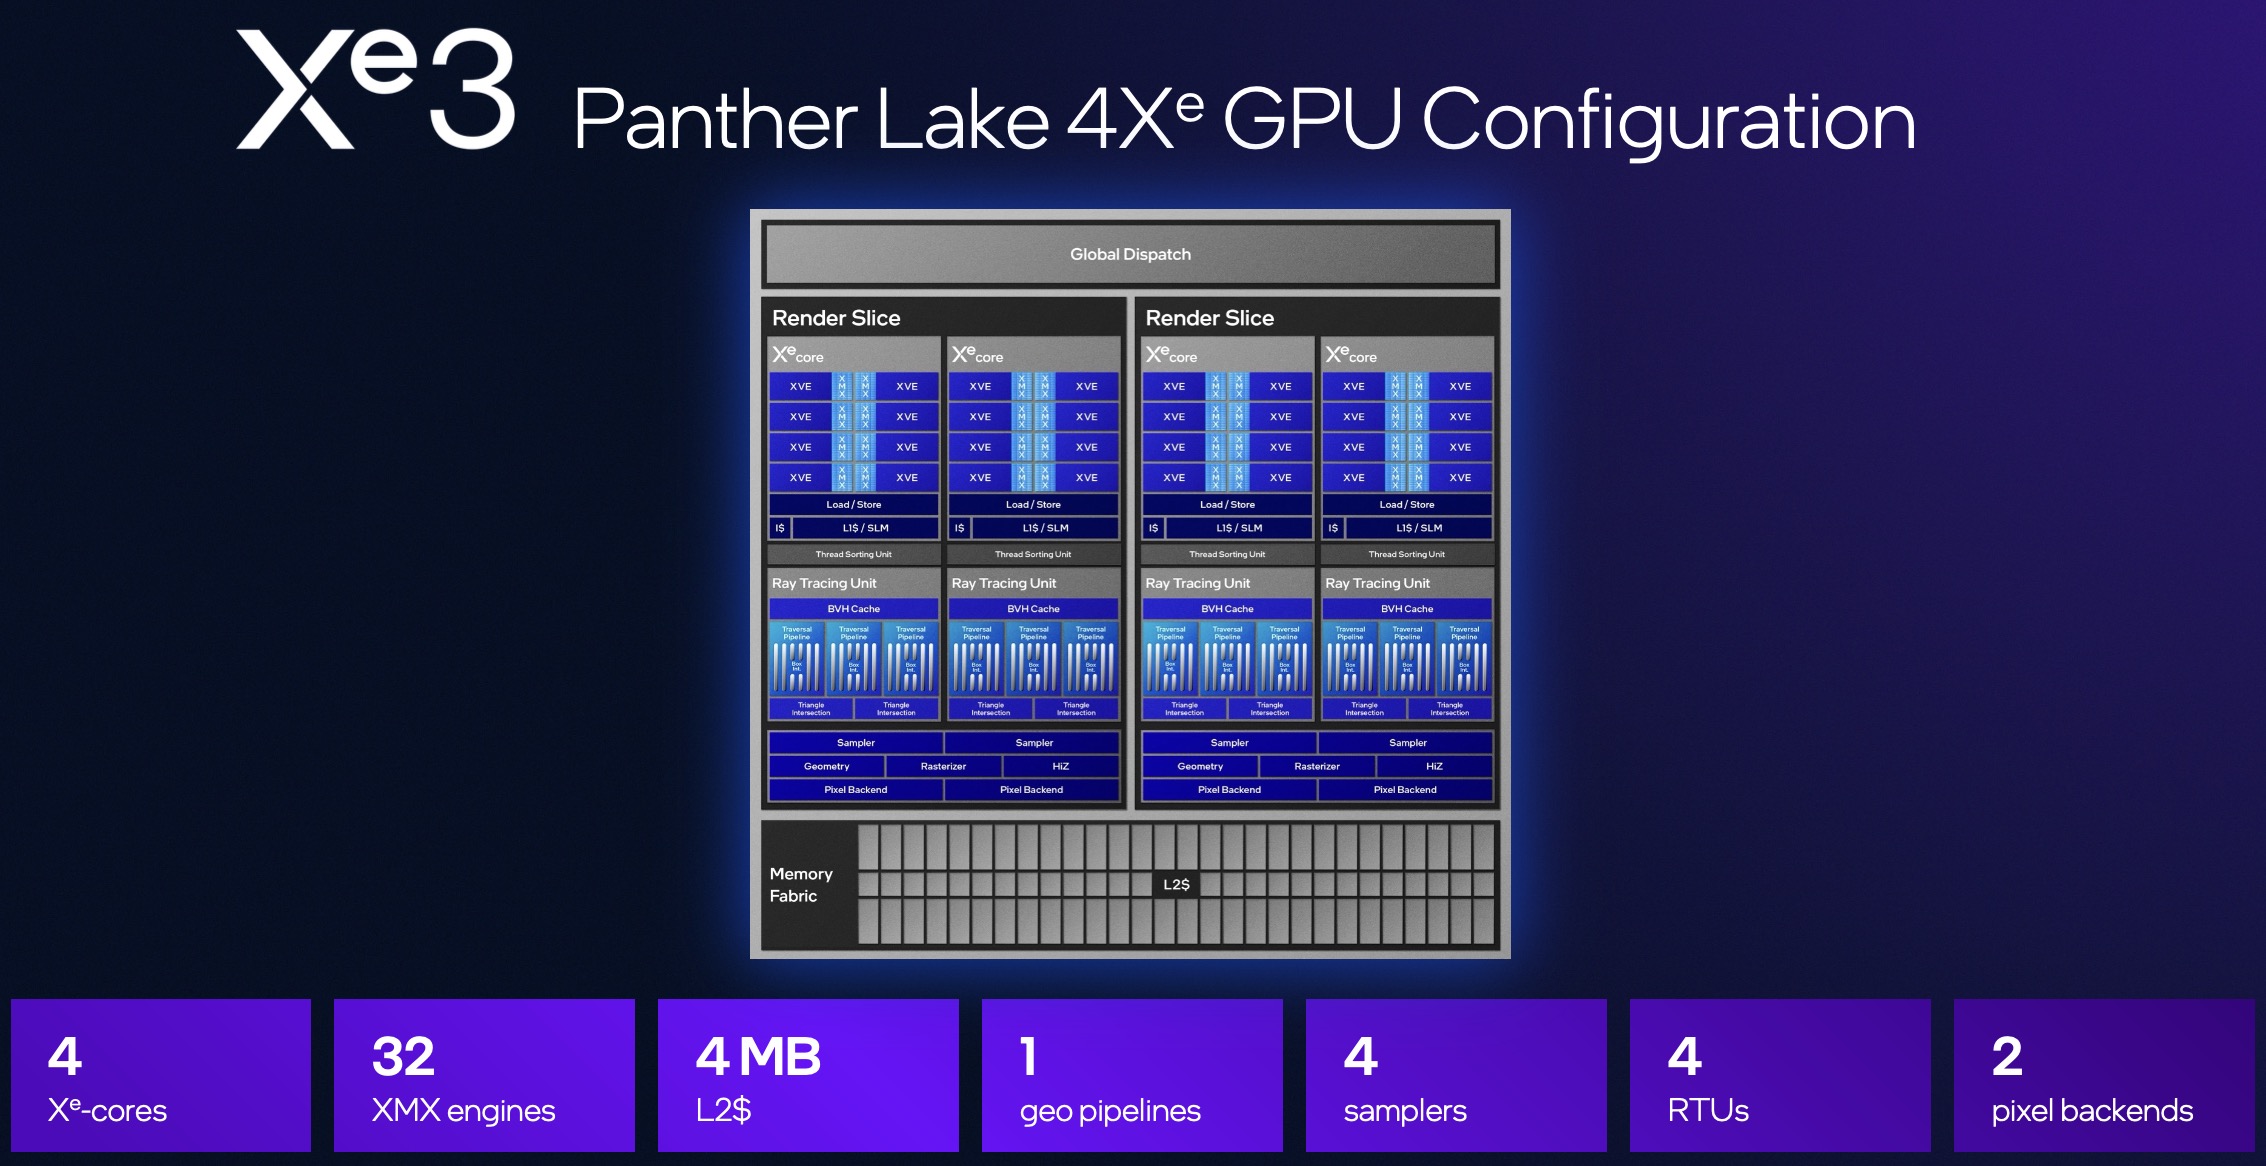
The Intel Graphics 2-Core Xe3 is an integrated graphics card in Panther Lake SoCs with 2 Xe3 cores (16 EUs / 256 ALUs) and 2 raytracing cores. In contrast to the large 12-core Arc B390 variant, the GPU tile is not manufactured by TSMC but by Intel (ev Intel 4).

The new media engine now supports AV1 encode and decode, VVC decode, AVC 10-bit and eDP 1.5.

Panther Lake Xe3 Series

Intel Graphics 4 Xe3 PTL compare 32 @ 2.5 GHz
Intel Graphics 2 Xe3 PTL 16
CodenamePanther Lake
iGPUIntegrated Graphics
Pipelines16 - unified
Raytracing Cores2
AI GPU20 TOPS INT8
CacheL2: 4 MB
Shared Memoryno
APIDirectX 12_2
Date of Announcement08.01.2026
CPU in Intel Graphics 2 Xe3 PTLGPU Base SpeedGPU Boost / Turbo
Intel Core Ultra 5 3326 x 1900 MHz, 25 W? MHz2450 MHz
Intel Core Ultra 5 3226 x 1900 MHz, 25 W? MHz2300 MHz
min. - max.? MHz2300 - 2450 MHz

Benchmarks

Performance Rating - 3DMark 11 + Fire Strike + Time Spy
1.4 pt (4%)
Restrict / Search: Model: Max. age: years
3DMark - 3DMark Fire Strike Standard Score
2936 Points (4%)
3DMark - 3DMark Fire Strike Standard Graphics
3085 Points (3%)
3DMark - 3DMark Ice Storm Graphics
183489 Points (20%)
3DMark - 3DMark Time Spy Graphics
1362 Points (3%)
Restrict / Search: Model: Max. age: years
3DMark - 3DMark Cloud Gate Score
18029 Points (17%)
3DMark - 3DMark Cloud Gate Graphics
23017 Points (6%)
3DMark 11 - 3DM11 Performance Score
4114 Points (5%)
3DMark 11 - 3DM11 Performance GPU
3683 Points (3%)
Restrict / Search: Model: Max. age: years
3DMark Vantage
3DM Vant. Perf. total +
3DMark Vantage - 3DM Vant. Perf. total
19754 Points (6%)
3DM Vant. Perf. GPU no PhysX +
3DMark Vantage - 3DM Vant. Perf. GPU no PhysX
16985 Points (9%)
Restrict / Search: Model: Max. age: years
3DMark 06 3DMark 06 - Standard 1280x1024 +
3DMark 06
27030 Points (35%)
Cinebench R15
Cinebench R15 OpenGL 64 Bit +
Cinebench R15 - Cinebench R15 OpenGL 64 Bit
113.5 fps (7%)
Cinebench R15 OpenGL Ref. Match 64 Bit +
Cinebench R15 - Cinebench R15 OpenGL Ref. Match 64 Bit
97.8 % (98%)
Basemark GPU 1.2 - Basemark GPU 1.2 Vulkan Official Medium Offscreen 1080
104.6 fps (3%)
Geekbench 6.6 - Geekbench 6.6 GPU OpenCL
11649 points (3%)
Geekbench 6.6 - Geekbench 6.6 GPU Vulkan
11846 points (3%)
LuxMark v2.0 64Bit - LuxMark v2.0 Room GPU
393 Samples/s (1%)
LuxMark v2.0 64Bit - LuxMark v2.0 Sala GPU
954 Samples/s (2%)
ComputeMark v2.1 - ComputeMark v2.1 Result
2584 points (2%)
Power Consumption - Cyberpunk 2077 Power Consumption 150cd *
34 Watt (9%)
- Range of benchmark values
red legend - Average benchmark values
* Smaller numbers mean a higher performance

Game Benchmarks

The following benchmarks stem from our benchmarks of review laptops. The performance depends on the used graphics memory, clock rate, processor, system settings, drivers, and operating systems. So the results don't have to be representative for all laptops with this GPU. For detailed information on the benchmark results, click on the fps number.

Pragmata

Pragmata

2026
low 1920x1080
14.4  fps    + Compare
med. 1920x1080
10.4  fps    + Compare
high 1920x1080
8.4  fps    + Compare
» The benchmarks indicate that the game is not playable in the tested settings.
low 1920x1080
25  fps    + Compare
med. 1920x1080
22  fps    + Compare
high 1920x1080
15  fps    + Compare
» The benchmarks indicate that the game is not playable in the tested settings.
low 1920x1080
29.2  fps    + Compare
med. 1920x1080
18.3  fps    + Compare
high 1920x1080
9.1  fps    + Compare
» The benchmarks indicate that the game is not playable in the tested settings.
low 1920x1080
8.5  fps    + Compare
med. 1920x1080
7  fps    + Compare
high 1920x1080
5.1  fps    + Compare
» The benchmarks indicate that the game is not playable in the tested settings.
F1 25

F1 25

2025
low 1920x1080
29  fps    + Compare
med. 1920x1080
23  fps    + Compare
high 1920x1080
18  fps    + Compare
» The benchmarks indicate that the game is not playable in the tested settings.
low 1920x1080
6.5  fps    + Compare
med. 1920x1080
6.2  fps    + Compare
high 1920x1080
6  fps    + Compare
» The benchmarks indicate that the game is not playable in the tested settings.
low 1920x1080
16.1  fps    + Compare
med. 1920x1080
11.4  fps    + Compare
high 1920x1080
9.2  fps    + Compare
» The benchmarks indicate that the game is not playable in the tested settings.
low 1920x1080
18.8  fps    + Compare
med. 1920x1080
14  fps    + Compare
high 1920x1080
12.2  fps    + Compare
ultra 1920x1080
8.9  fps    + Compare
» The benchmarks indicate that the game is not playable in the tested settings.
Additional Benchmarks
30min Start Ultra Preset (FSR off) 1920x1080
8.7
low 1280x720
22.9  fps    + Compare
med. 1920x1080
22.9  fps    + Compare
high 1920x1080
22.9  fps    + Compare
» The benchmarks indicate that the game is not playable in the tested settings.
low 1280x720
91.7  fps    + Compare
med. 1366x768
72.6  fps    + Compare
high 1920x1080
52.2  fps    + Compare
ultra 1920x1080
34.6  fps    + Compare
» With all tested laptops playable in detail settings high.
lowmed.highultraQHD4K
Pragmata14.410.48.4
Call of Duty Black Ops 7252215
ARC Raiders29.218.39.1
Borderlands 48.575.1
F1 25292318
The Elder Scrolls IV Oblivion Remastered6.56.26
Kingdom Come Deliverance 216.111.49.2
Cyberpunk 207718.81412.28.9
X-Plane 11.1122.922.922.9
Dota 2 Reborn91.772.652.234.6
lowmed.highultraQHD4K
< 30 fps
< 60 fps
< 120 fps
≥ 120 fps
9

1
9

1
9
1

1
1


For more games that might be playable and a list of all games and graphics cards visit our Gaming List

Add one or more devices and compare

In the following list you can select (and also search for) devices that should be added to the comparison. You can select more than one device.

search for model:
v1.35
log 29. 20:01:03

#0 ran 0s before starting gpusingle class +0s ... 0s

#1 no ids found in url (should be separated by "_") +0s ... 0s

#2 not redirecting to Ajax server +0s ... 0s

#3 did not recreate cache, as it is less than 5 days old! Created at Thu, 28 May 2026 05:28:48 +0200 +0.004s ... 0.004s

#4 composed specs +0.016s ... 0.02s

#5 did output specs +0s ... 0.02s

#6 start showIntegratedCPUs +0s ... 0.02s

#7 getting avg benchmarks for device 13357 +0.061s ... 0.081s

#8 got single benchmarks 13357 +0.009s ... 0.09s

#9 got avg benchmarks for devices +0s ... 0.09s

#10 min, max, avg, median took s +1.782s ... 1.871s

#11 before gaming benchmark output +0s ... 1.872s

#12 Got 32 rows for game benchmarks. +0.002s ... 1.874s

#13 composed SQL query for gamebenchmarks +0s ... 1.874s

#14 got data and put it in $dataArray +0.007s ... 1.88s

#15 benchmarks composed for output. +0.126s ... 2.007s

#16 return log +0.223s ... 2.229s

No reviews found.

Google LogoAdd as a preferred source on Google
Mail Logo

» Comparison of GPUs
Detailed list of all laptop GPUs sorted by class and performance.

» Benchmark List
Sort and restrict laptop GPUs based on performance in synthetic benchmarks.

» Notebook Gaming List
Playable games for each graphics card and their average FPS results.

Class 1

Class 2

M5 Max 32-Core GPU *
M5 Pro 16-Core GPU *
Radeon PRO W6600M *

Class 3

M4 9-Core GPU *
UHD Graphics 750
A19 4-Core GPU *

Class 4

Class 5

Class 6

* Approximate position of the graphics adapter

Klaus Hinum (Update: 2026-04-14)