Notebook reviews with NVIDIA GeForce MX250 graphics card
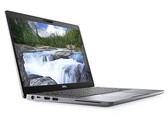
Dell Latitude 14 5411 laptop in review: Business laptop with powerful CPU
The Dell Latitude 14 5411 is not slim, but it is powerful. With Intel's Core i7-10850H and Nvidia's GeForce MX250, it can also be used for much more than just office applications. Our review shows what the small business laptop can do in everyday use.
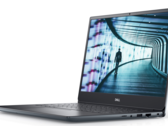
Intel Core i7-10850H, NVIDIA GeForce MX250, 14", 1.5 kgDell Vostro 14 5490: Business laptop with dedicated GPU in review
With the Vostro series, Dell primarily targets small businesses that want to offer a good compromise between performance and cost. Our 14-inch Vostro 5490 even has a dedicated graphics card, but the fan control is not well developed.
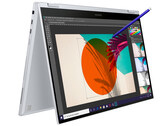
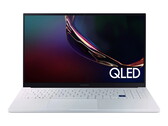
Intel Core i7-10510U, NVIDIA GeForce MX250, 14", 1.5 kgSamsung Galaxy Book Flex NP950QCG Review: Very Bright Display Thanks To Outdoor+ Mode
Samsung's 15.6-inch convertible offers a compact case, very good battery life, and a very bright display with a brightness of up to 600 nits. Its touchscreen display (QLED, IPS, FHD) does not only support finger but also stylus input using the included S Pen.
Intel Core i7-1065G7, NVIDIA GeForce MX250, 15.6", 1.6 kgSamsung Galaxy Book Ion Aura Silver Laptop Review: Great 15-inch Ultrabook with driver issues
After its 13-inch Modell Samsung has now introduced a 15-inch version of its ultra light-weight Ion laptop. We took a look at it to find out whether the larger model has the same issues as its smaller brother (loud fans) and whether the Galaxy Book Ion really can be considered a decent alternative to the ultra light-weight LG Gram.
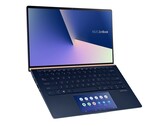
Intel Core i7-10510U, NVIDIA GeForce MX250, 15.6", 1.3 kgAsus ZenBook 14 UX434FL Laptop Review: ScreenPad Is Here To Stay
This Asus Ultrabook is unlike any other competing model in its size class due to its integrated secondary display. Though awesome from a conceptual standpoint, we go over some hidden drawbacks that potential owners should know about.
Intel Core i7-8565U, NVIDIA GeForce MX250, 14", 1.3 kgAcer Aspire 3 A317-51G-72MD: Intel Core i7-10510U, 17.30", 2.8 kg
Review » Acer Aspire 3 A317-51G in review: 17.3-inch all-rounder offers 2 TB of storage space
HP ProBook 450 G7 8WC04UT: Intel Core i7-10510U, 15.60", 1.9 kg
Review » HP ProBook 450 G7 Core i7 Laptop Review: Is It Better Than The Ryzen 7 ProBook 455 G7?
Asus VivoBook S14 S433FL: Intel Core i7-10510U, 14.00", 1.4 kg
Review » Asus VivoBook S14 S433FL in review: Colorful laptop with stable case
Huawei MateBook X Pro 2020 i7: Intel Core i7-10510U, 13.90", 1.3 kg
Review » Huawei MateBook X Pro 2020 in Review – Compact Laptop with Performance Issues
Asus ZenBook Duo UX481FL: Intel Core i7-10510U, 14.00", 1.8 kg
Review » Like The Apple Touch Bar, But Better: Asus ZenBook Duo UX481 Laptop Review
Acer Aspire 5 A515-54G: Intel Core i5-10210U, 15.60", 1.7 kg
Review » Acer Aspire 5 A515-54G Review: Laptop for Casual Gamers
MSI Modern 15 A10RB: Intel Core i7-10510U, 15.60", 1.6 kg
Review » MSI Modern 15 A10RB Laptop Review: The Dell XPS 15 Lite
Lenovo Ideapad S540-15IML: Intel Core i5-10210U, 15.60", 1.9 kg
Review » Lenovo IdeaPad S540-15IML laptop review: Terrific battery life
MSI Modern 14 A10RB-459US: Intel Core i5-10210U, 14.00", 1.2 kg
Review » MSI Modern 14 A10RB Laptop Review: Lighter than it Looks
HP Pavilion 14-ce3040ng: Intel Core i7-1065G7, 14.00", 1.6 kg
Review » HP Pavilion 14 Laptop Review: A stylish all-rounder with a bright display
HP Spectre X360 15-5ZV31AV: Intel Core i7-10510U, 15.60", 2.1 kg
Review » HP Spectre X360 15 Late 2019 Convertible Review: Comet Lake Core i7 with GeForce MX Graphics
HP Envy 17-ce1004ng: Intel Core i7-10510U, 17.30", 2.8 kg
Review » HP Envy 17-ce1002ng Laptop Review: A slim 17-inch machine with mixed performance
Lenovo ThinkPad T590-20N40009GE: Intel Core i7-8565U, 15.60", 1.8 kg
Review » Lenovo ThinkPad T590 laptop review: The 4K display offers excellent image quality but requires a lot of energy
Lenovo ThinkPad T490-20N30000GE: Intel Core i7-8565U, 14.00", 1.5 kg
Review » Lenovo ThinkPad T490 Review: The WQHD HDR panel convinces in the test, but makes only limited sense in an office laptop
HP Envy 13-aq0003ng: Intel Core i7-8565U, 13.30", 1.2 kg
Review » HP Envy 13 Review: A well-rounded subnotebook with a good number of features
Asus VivoBook S15 S532F: Intel Core i7-8565U, 15.60", 1.8 kg
Review » ScreenPad 2.0 Debut: Asus VivoBook S15 S532FL Laptop Review
Lenovo ThinkPad T590-20N4002VGE: Intel Core i7-8565U, 15.60", 1.9 kg
Review » Lenovo ThinkPad T590 business laptop review: Large & lightweight, but bad screen
Lenovo IdeaPad S540-14IWL: Intel Core i5-8265U, 14.00", 1.4 kg
Review » Lenovo IdeaPad S540 Laptop Review: AMD or Intel? Lenovo gives consumers the choice and we compare both
Acer Swift 3 SF314-55G-768V: Intel Core i7-8565U, 14.00", 1.5 kg
Review » Acer Swift 3 SF314 (i7-8565U, MX250) Laptop Review
Lenovo ThinkPad T490-20N3S02L00: Intel Core i7-8565U, 14.00", 1.5 kg
Review » Lenovo ThinkPad T490 (i7, MX250, Low Power FHD) Laptop Review
Huawei MateBook 14 KLV-W29: Intel Core i7-8565U, 14.00", 1.5 kg
Review » Huawei MateBook 14 (i7-8565U, GeForce MX250) Laptop Review
HP Pavilion 15-cs2019ng: Intel Core i5-8265U, 15.60", 1.9 kg
Review » HP Pavilion 15 (Core i5-8265U, GeForce MX250, 16 GB RAM) Laptop Review
Acer Aspire 5 A515-52G-723L: Intel Core i7-8565U, 15.60", 1.8 kg
Review » Acer Aspire 5 A515-52G (i7-8565U, GeForce MX250, SSD, FHD) Laptop Review
HP 15s-du1031tx: Intel Core i7-10510U, 15.60", 1.8 kg
External Review » HP 15s-du1031tx
Huawei Matebook D 14, i5-10210U MX250: Intel Core i5-10210U, 14.00", 1.4 kg
External Review » Huawei Matebook D 14, i5-10210U MX250
Asus VivoBook S15 S533FL-BQ057T: Intel Core i7-10510U, 15.60", 1.8 kg
External Review » Asus VivoBook S15 S533FL-BQ057T
Dell Latitude 14 5411-WJ40N: Intel Core i7-10850H, 14.00", 1.5 kg
External Review » Dell Latitude 14 5411-WJ40N
Huawei MateBook X 2020 i5: Intel Core i5-10210U, 13.90", 1.3 kg
External Review » Huawei MateBook X 2020 i5
Asus VivoBook S14 S433FL-EB180T: Intel Core i7-10510U, 14.00", 1.5 kg
External Review » Asus VivoBook S14 S433FL-EB180T
HP EliteBook 850 G7, i7-10510U MX250: Intel Core i7-10510U, 15.60", 1.7 kg
External Review » HP EliteBook 850 G7, i7-10510U MX250
Asus VivoBook S14 S433FL-EB181: Intel Core i7-10510U, 14.00", 1.4 kg
External Review » Asus VivoBook S14 S433FL-EB181
Huawei MateBook 13 2020 MX250 i7: Intel Core i7-10510U, 13.00", 1.3 kg
External Review » Huawei MateBook 13 2020 MX250 i7
Xiaomi Mi Notebook 14, i5-10210U MX250: Intel Core i5-10210U, 14.00", 1.5 kg
External Review » Xiaomi Mi Notebook 14, i5-10210U MX250
Huawei MateBook 14 KLV-W29: Intel Core i7-8565U, 14.00", 1.5 kg
External Review » Huawei MateBook 14 KLV-W29
Acer TravelMate P6 TMP614-51TG-G2: Intel Core i7-10510U, 14.00", 1.2 kg
External Review » Acer TravelMate P6 TMP614-51TG-G2
Asus VivoBook S15 S533FL-BQ024T: Intel Core i7-10510U, 15.60", 1.8 kg
External Review » Asus VivoBook S15 S533FL-BQ024T
Asus ZenBook 13 UX334FLC-A3167T: Intel Core i7-10510U, 13.30", 1.2 kg
External Review » Asus ZenBook 13 UX334FLC-A3167T
HP Pavilion 15-cs3022ns: Intel Core i7-1065G7, 15.60", 1.9 kg
External Review » HP Pavilion 15-cs3022ns
Asus VivoBook S15 S533F-LBQ536T: Intel Core i5-10210U, 15.60", 1.8 kg
External Review » Asus VivoBook S15 S533F-LBQ536T
Acer Swift 3 SF314-58G-77JX: Intel Core i5-10210U, 14.00", 1.6 kg
External Review » Acer Swift 3 SF314-58G-77JX
MSI Modern 15 A10RB: Intel Core i7-10510U, 15.60", 1.6 kg
External Review » MSI Modern 15 A10RB
Huawei MateBook 13 2020 MX250: Intel Core i5-10210U, 13.00", 1.3 kg
External Review » Huawei MateBook 13 2020 MX250
Acer Aspire 5 A514-52G-7045: Intel Core i7-10510U, 14.00", 1.6 kg
External Review » Acer Aspire 5 A514-52G-7045
MSI Prestige 14 A10RB: Intel Core i7-10710U, 14.00", 1.3 kg
External Review » MSI Prestige 14 A10RB
MSI PS42 Modern 8RA-280XES: Intel Core i7-8565U, 14.00", 1.2 kg
External Review » MSI PS42 Modern 8RA-280XES
HP Pavilion 14-ce3013tx: Intel Core i7-1065G7, 14.00", 1.6 kg
External Review » HP Pavilion 14-ce3013tx
Asus ZenBook Duo UX481FL: Intel Core i7-10510U, 14.00", 1.8 kg
External Review » Asus ZenBook Duo UX481FL
Lenovo IdeaPad S540-15IML-81NG00A3GE: Intel Core i7-10510U, 15.60", 2 kg
External Review » Lenovo IdeaPad S540-15IML-81NG00A3GE
Huawei MateBook X Pro 2020 i7: Intel Core i7-10510U, 13.90", 1.3 kg
External Review » Huawei MateBook X Pro 2020 i7
HP Pavilion 15-cs2019ng: Intel Core i5-8265U, 15.60", 1.9 kg
External Review » HP Pavilion 15-cs2019ng
Dell Inspiron 14 7490-D0R43: Intel Core i7-10510U, 14.00", 1.3 kg
External Review » Dell Inspiron 14 7490-D0R43
Asus VivoBook S14 S432FL-EB074T: Intel Core i5-10210U, 14.00", 1.5 kg
External Review » Asus VivoBook S14 S432FL-EB074T
Asus VivoBook S14 S433FL-EB008T: Intel Core i5-10210U, 14.00", 1.5 kg
External Review » Asus VivoBook S14 S433FL-EB008T
Asus VivoBook S15 S532FL-BQ049T: Intel Core i5-8265U, 15.60", 1.8 kg
External Review » Asus VivoBook S15 S532FL-BQ049T
Asus VivoBook S14 S433FL: Intel Core i7-10510U, 14.00", 1.4 kg
External Review » Asus VivoBook S14 S433FL-EB029T
MSI Modern 14 A10RB: Intel Core i7-10710U, 14.00", 1.2 kg
External Review » MSI Modern 14 A10RB
HP Pavilion 14-ce3005ns: Intel Core i7-1065G7, 14.00", 1.6 kg
External Review » HP Pavilion 14-ce3005ns
Acer Swift 5 Pro SF514-54GT-54PK: Intel Core i5-1035G1, 14.00", 1 kg
External Review » Acer Swift 5 Pro SF514-54GT-54PK
Asus VivoBook A512FL, i5 10210U, MX250: Intel Core i5-10210U, 15.60", 1.7 kg
External Review » Asus VivoBook A512FL, i5 10210U, MX250
Asus VivoBook S15 S532FL-BN184T: Intel Core i7-10510U, 15.60", 1.8 kg
External Review » Asus VivoBook S15 S532FL-BN184T
Lenovo IdeaPad S540-14IWL: Intel Core i5-8265U, 14.00", 1.4 kg
External Review » Lenovo IdeaPad S540-14IWL
Asus ZenBook 14 UX434FLC-A5131R: Intel Core i7-10510U, 14.00", 1.3 kg
External Review » Asus ZenBook 14 UX434FLC-A5131R
Asus ZenBook 14 UX431FL-AM049T: Intel Core i7-10510U, 14.00", 1.4 kg
External Review » Asus ZenBook 14 UX431FL-AM049T
MSI Modern 14 A10RB-663XES: Intel Core i7-10510U, 14.00", 1.2 kg
External Review » MSI Modern 14 A10RB-663XES
Acer Swift 5 SF514-54GT-762S: Intel Core i7-1065G7, 14.00", 1 kg
External Review » Acer Swift 5 SF514-54GT-762S
Xiaomi RedmiBook 13, i5-10210U: Intel Core i5-10210U, 13.30", 1.2 kg
External Review » Xiaomi RedmiBook 13, i5-10210U
Acer Aspire 5 A515-54G-54PC: Intel Core i5-10210U, 15.60", 1.9 kg
External Review » Acer Aspire 5 A515-54G-54PC
MSI Modern 14 A10RB-665XES: Intel Core i7-10510U, 14.00", 1.2 kg
External Review » MSI Modern 14 A10RB-665XES
Lenovo Ideapad S540-15IWL-81NE0040GE: Intel Core i7-8565U, 15.60", 2 kg
External Review » Lenovo Ideapad S540-15IWL-81NE0040GE
Asus Zenbook Pro Duo UX481FL-BM044T: Intel Core i7-10510U, 14.00", 1.5 kg
External Review » Asus Zenbook Pro Duo UX481FL-BM044T
Asus ZenBook 13 UX334FL-A4137T: Intel Core i7-8565U, 13.30", 1.2 kg
External Review » Asus ZenBook 13 UX334FL-A4137T
Lenovo Yoga S740-14IIL-81RS0016GE: Intel Core i7-1065G7, 14.00", 1.4 kg
External Review » Lenovo Yoga S740-14IIL-81RS0016GE
Asus ZenBook Duo UX481FL-BM039R: Intel Core i7-10510U, 14.00", 1.5 kg
External Review » Asus ZenBook Duo UX481FL-BM039R
Dell Vostro 14 5490: Intel Core i7-10510U, 14.00", 1.5 kg
External Review » Dell Vostro 14 5490, i7-10510U, MX250
Acer TravelMate P6 TMP614-51TG-792V: Intel Core i7-8565U, 14.00", 1.2 kg
External Review » Acer TravelMate P6 TMP614-51TG-792V
HP Pavilion x360 14-dh0226ng: Intel Core i7-8565U, 14.00", 1.6 kg
External Review » HP Pavilion x360 14-dh0226ng
Asus VivoBook 14 X412FL-EB151T: Intel Core i5-8265U, 14.00", 1.5 kg
External Review » Asus VivoBook 14 X412FL-EB151T
Acer Aspire 3 A317-51G-7604: Intel Core i7-10510U, 17.30", 2.7 kg
External Review » Acer Aspire 3 A317-51G-7604
Asus VivoBook S15 S512FL-BQ279T: Intel Core i7-8565U, 15.60", 1.8 kg
External Review » Asus VivoBook S15 S512FL-BQ279T
Asus VivoBook S15 S532FL-BN010T: Intel Core i7-8565U, 15.60", 1.8 kg
External Review » Asus VivoBook S15 S532FL-BN010T
Xiaomi RedmiBook 14 2019, i7-8565U: Intel Core i7-8565U, 14.00", 1.5 kg
External Review » Xiaomi RedmiBook 14 2019, i7-8565U
Acer Swift 5 SF514-54GT-70SY: Intel Core i7-1065G7, 14.00", 1 kg
External Review » Acer Swift 5 SF514-54GT-70SY
Asus Zenbook 14 UX434FL-A6015T: Intel Core i5-8265U, 14.00", 1.6 kg
External Review » Asus Zenbook 14 UX434FL-A6015T
Acer Aspire 5 A514-52G-516T: Intel Core i5-10210U, 14.00", 1.6 kg
External Review » Acer Aspire 5 A514-52G-516T
Acer Swift 3 SF314-56G-79D1: Intel Core i7-8565U, 14.00", 1.6 kg
External Review » Acer Swift 3 SF314-56G-79D1
Asus ZenBook 14 UX431FL-AN012T: Intel Core i7-8565U, 14.00", 1.5 kg
External Review » Asus ZenBook 14 UX431FL-AN012T
Dell Inspiron 15 7590 2-in-1: Intel Core i7-8565U, 15.60", 2 kg
External Review » Dell Inspiron 15 7590 2-in-1
Asus VivoBook S15 S532F: Intel Core i7-8565U, 15.60", 1.8 kg
External Review » Asus VivoBook S15 S532F
Asus VivoBook S15 S532FL-BN011T: Intel Core i5-8265U, 15.60", 1.8 kg
External Review » Asus VivoBook S15 S532FL-BN011T
HP Envy 13-aq0003ng: Intel Core i7-8565U, 13.30", 1.2 kg
External Review » HP Envy 13-aq0003ng
Lenovo Ideapad S340-15IWL-81N800CPGE: Intel Core i5-8265U, 15.60", 1.8 kg
External Review » Lenovo Ideapad S340-15IWL-81N800CPGE
Asus VivoBook 15 A512FL: Intel Core i5-8265U, 15.60", 1.8 kg
External Review » Asus VivoBook 15 A512FL
Asus VivoBook 15 X512FL-EJ205T: Intel Core i7-8565U, 15.60", 1.8 kg
External Review » Asus VivoBook 15 X512FL-EJ205T
Acer Aspire 5 A515-54G-7895: Intel Core i7-8565U, 15.60", 1.8 kg
External Review » Acer Aspire 5 A515-54G-7895
Asus ZenBook 14 UX434FL, i7-8565U: Intel Core i7-8565U, 14.00", 1.3 kg
External Review » Asus ZenBook 14 UX434FL, i7-8565U
Lenovo Ideapad S540-15IWL-81NE003XGE: Intel Core i5-8265U, 15.60", 2 kg
External Review » Lenovo Ideapad S540-15IWL-81NE003XGE
Asus ZenBook Edition 30 UX334FL, i7-8565U: Intel Core i7-8565U, 13.30", 1.3 kg
External Review » Asus ZenBook Edition 30 UX334FL, i7-8565U
Asus VivoBook S14 S431FL, i7-8565U: Intel Core i7-8565U, 14.00", 1.4 kg
External Review » Asus VivoBook S14 S431FL, i7-8565U
Asus VivoBook S15 S531FL, i7-8565U: Intel Core i7-8565U, 15.60", 1.8 kg
External Review » Asus VivoBook S15 S531FA, i7-8565U
Asus ZenBook Pro Duo UX481: Intel Core i7-9750H, 14.00", 1.8 kg
External Review » Asus ZenBook Pro Duo UX481
HP Envy 13-aq0005ng: Intel Core i7-8565U, 13.30", 1.2 kg
External Review » HP Envy 13-aq0005ng
Huawei MateBook X Pro 2019, i7-8565U: Intel Core i7-8565U, 13.90", 1.3 kg
External Review » Huawei MateBook X Pro 2019, i7-8565U
Huawei MateBook 14-KLV-W29B: Intel Core i7-8565U, 14.00", 1.5 kg
External Review » Huawei MateBook 14-KLV-W29B
Huawei MateBook X Pro 2019, i5-8265U: Intel Core i5-8265U, 13.90", 1.3 kg
External Review » Huawei MateBook X Pro 2019, i5-8265U
Huawei MateBook 14, i5 (KLV-W19): Intel Core i5-8265U, 14.00", 1.5 kg
External Review » Huawei MateBook 14, i5 (KLV-W19)
Dell Latitude 14 5411-WJ40N: Intel Core i7-10850H, 14.00", 1.5 kg
» Dell Latitude 14 5411: A lot of performance in the 14-inch laptop
Samsung Galaxy Book Flex 15-NP950: Intel Core i7-1065G7, 15.60", 1.6 kg
» Samsung Galaxy Book Flex 15.6 with wireless charging clickpad for smartphones
Samsung Galaxy Book Ion Aura Silver: Intel Core i7-10510U, 15.60", 1.3 kg
» The 15-inch Ultrabook Samsung Galaxy Book Ion is great - but it still has some issues.
Asus ZenBook 14 UX434FL-DB77: Intel Core i7-8565U, 14.00", 1.3 kg
» Asus ScreenPad 2.0 is so much better than before, but it could still use some work
Acer Aspire 3 A317-51G-72MD: Intel Core i7-10510U, 17.30", 2.8 kg
» The CPU in the Acer Aspire 3 A317-51G is slowed down
HP ProBook 450 G7 8WC04UT: Intel Core i7-10510U, 15.60", 1.9 kg
» AMD embarrasses Intel with Ryzen 7 HP ProBook 455 G7 running 150 percent faster than the more expensive Core i7 ProBook 450 G7
Asus VivoBook S14 S433FL: Intel Core i7-10510U, 14.00", 1.4 kg
» Asus VivoBook S14 S433FL: When laptops become a part of your lifestyle
Asus ZenBook Duo UX481FL: Intel Core i7-10510U, 14.00", 1.8 kg
» The Asus ZenBook Duo ScreenPad is incredibly useful, but watch out for these limitations
Acer Aspire 5 A515-54G: Intel Core i5-10210U, 15.60", 1.7 kg
» Acer Aspire 5 in review: Casual gamer with an upgrade kit
» Acer Aspire 5 Review: Casual gaming notebook with an upgrade kit
MSI Modern 15 A10RB: Intel Core i7-10510U, 15.60", 1.6 kg
» The MSI Modern 15 has dual-channel RAM while the Modern 14 is stuck in single-channel mode