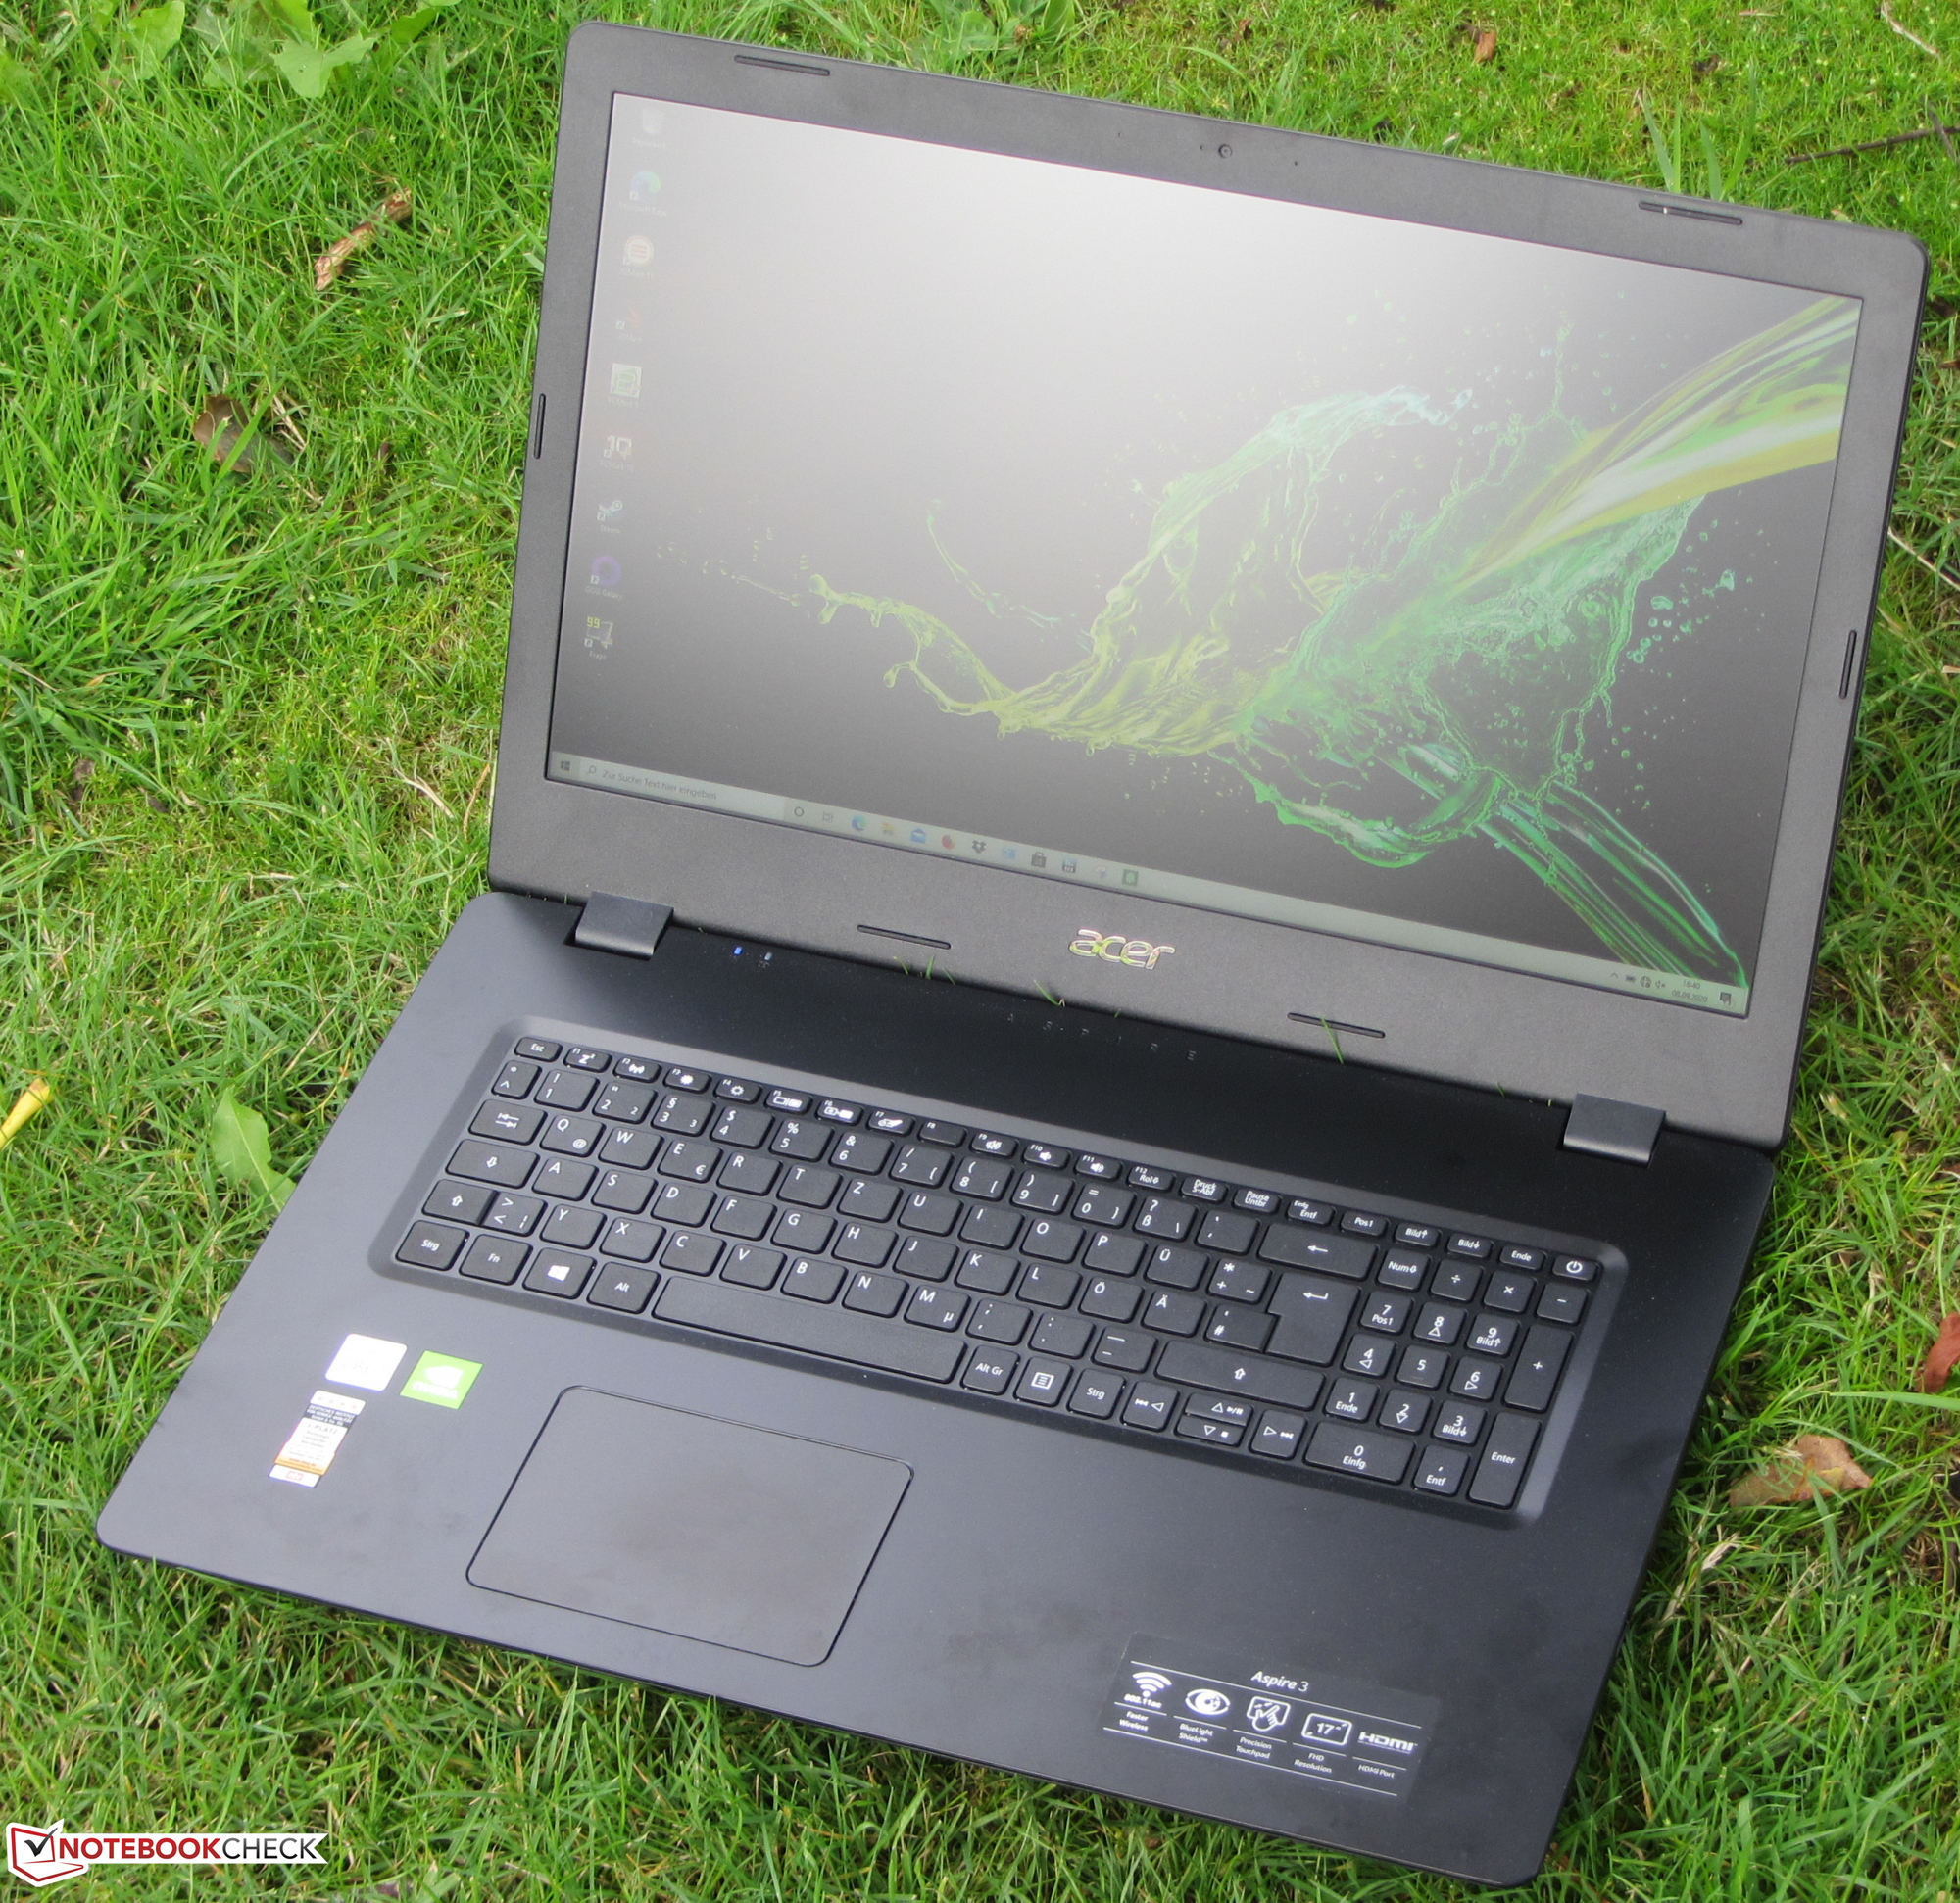
Acer Aspire 3 A317-51G in review: 17.3-inch all-rounder offers 2 TB of storage space

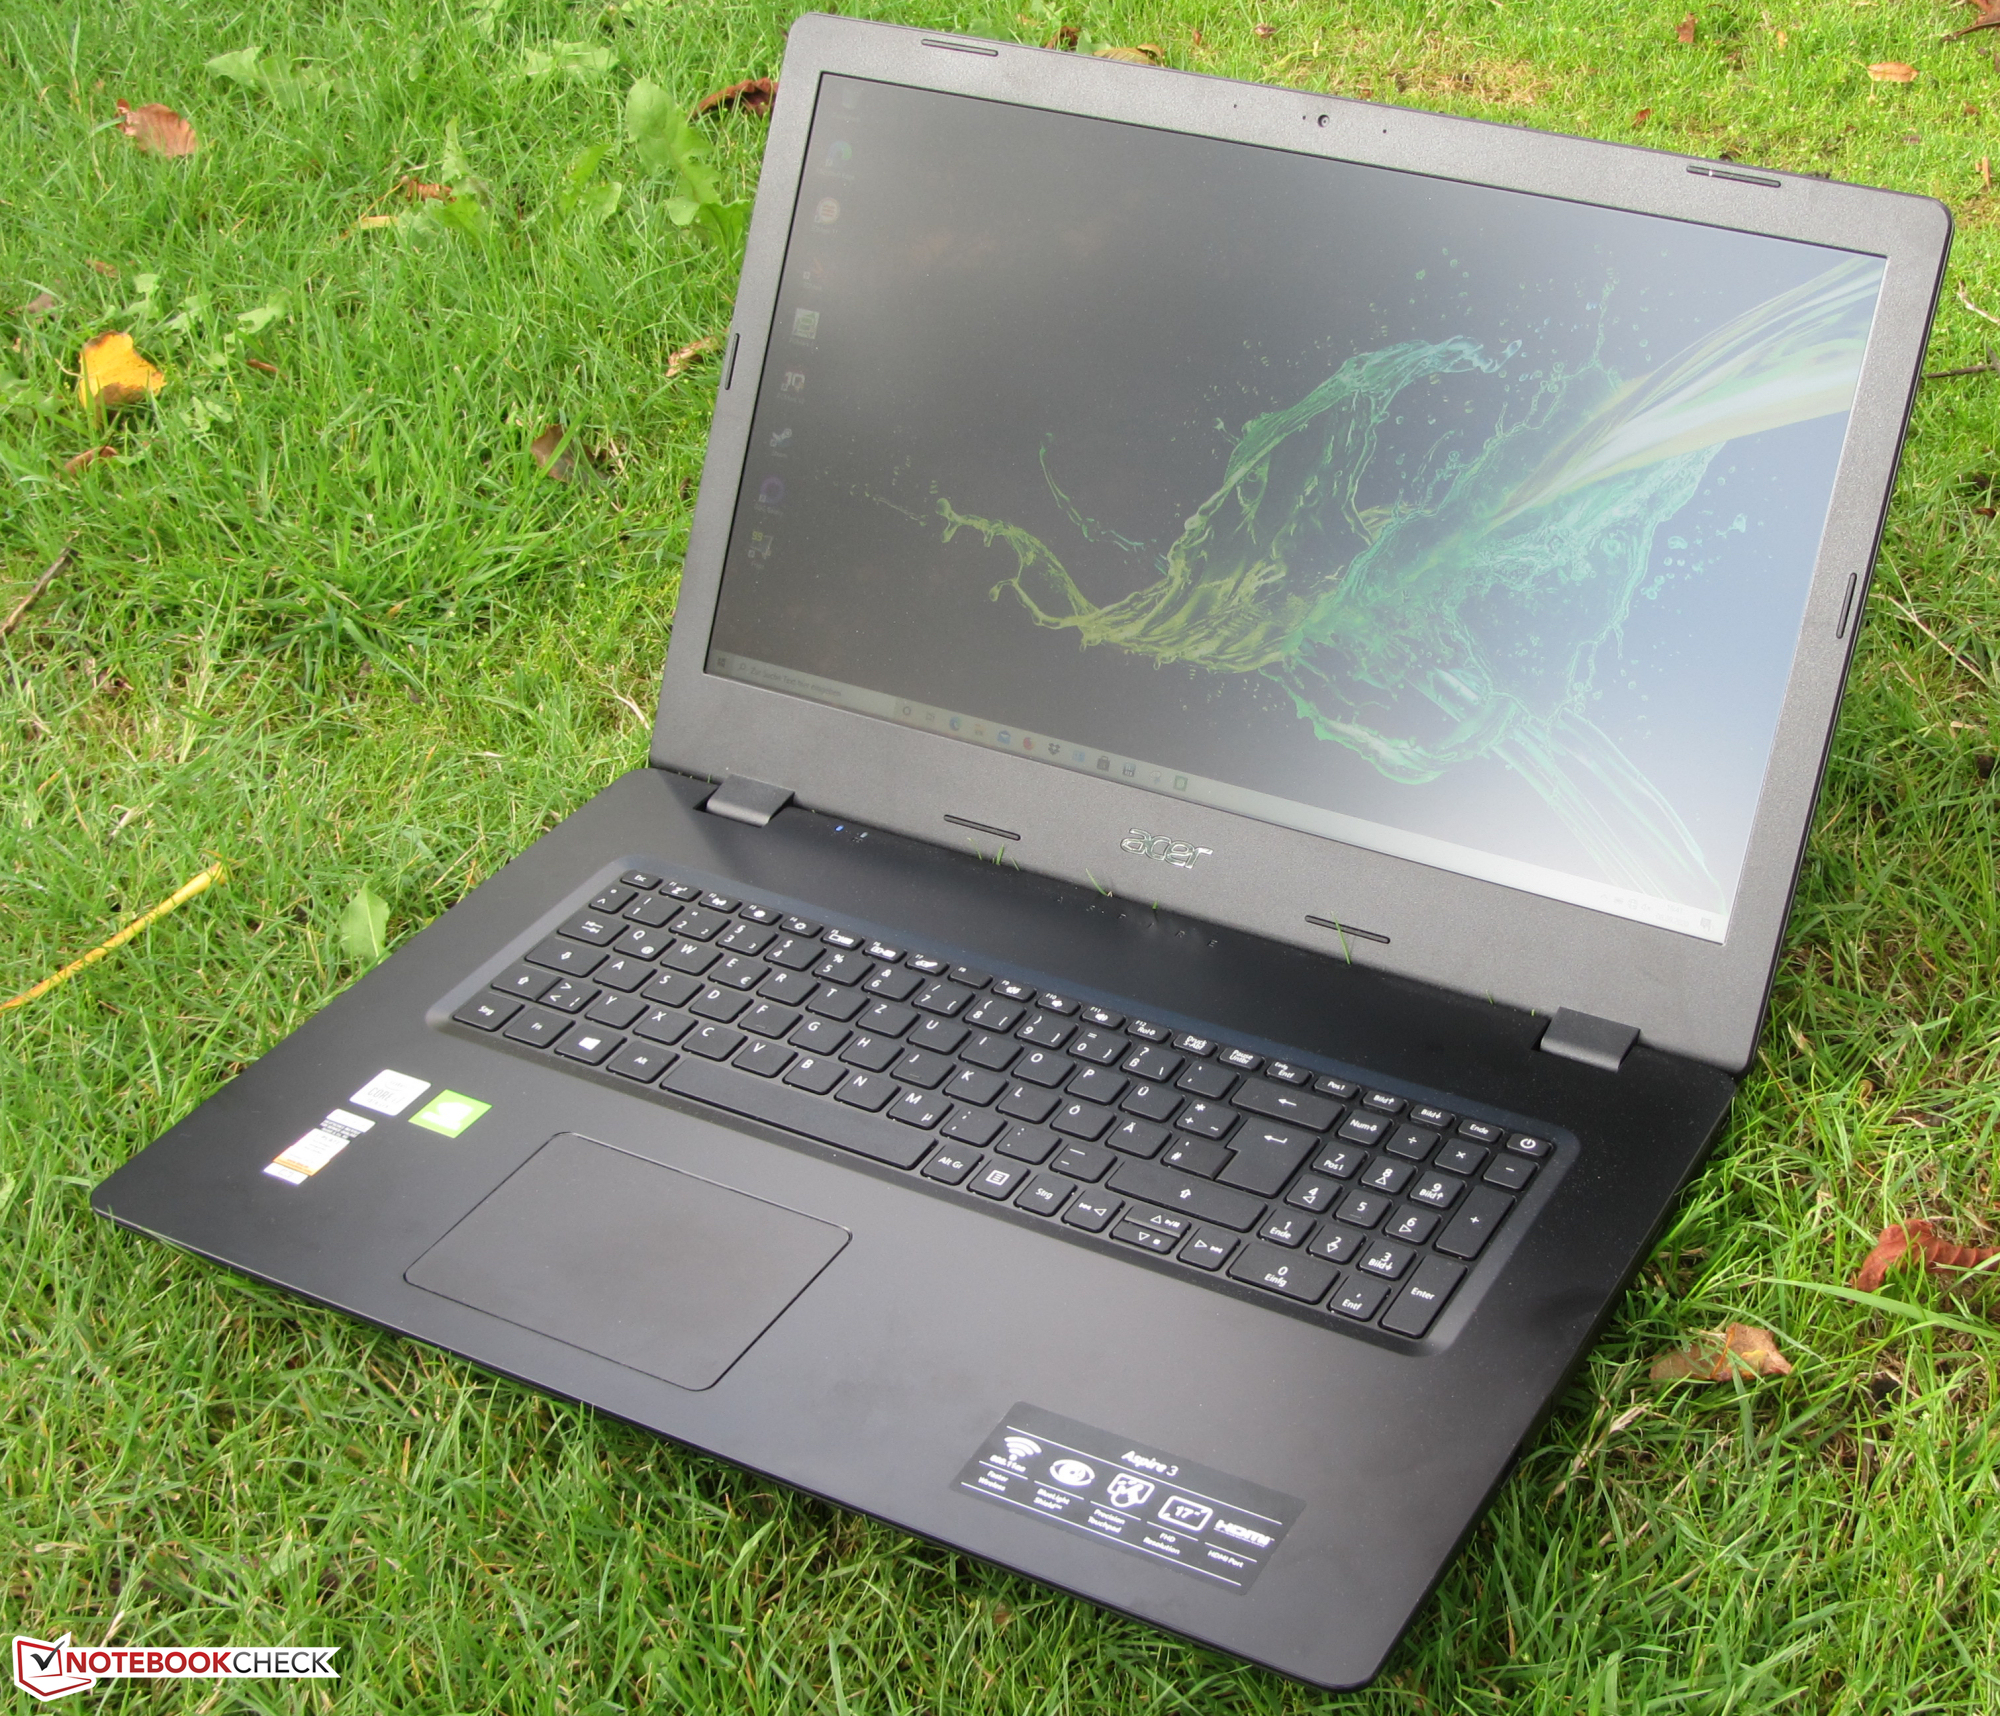
The Acer Aspire 3 A317-51G is a multimedia all-rounder in the 17.3-inch format. The laptop is powered by a Core i7-10510U processor and a GeForce MX250 graphics core. Among the competitors are devices like the HP 470 G7, the Lenovo IdeaPad L340-17API, and the Asus VivoBook 17 F712FA.
Rating | Date | Model | Weight | Height | Size | Resolution | Price |
|---|---|---|---|---|---|---|---|
| 76.4 % v7 (old) | 09 / 2020 | Acer Aspire 3 A317-51G-72MD i7-10510U, GeForce MX250 | 2.8 kg | 24.65 mm | 17.30" | 1920x1080 | |
| 78.8 % v7 (old) | 06 / 2020 | HP 470 G7 8VU24EA i7-10510U, Radeon 530 | 2.4 kg | 24.5 mm | 17.30" | 1920x1080 | |
| 80.8 % v6 (old) | 08 / 2019 | Lenovo Ideapad L340-17API-81LY0004GE R5 3500U, Vega 8 | 2.8 kg | 24.3 mm | 17.30" | 1600x900 | |
| 77 % v7 (old) | 09 / 2020 | Asus VivoBook 17 F712FA-AU518T i5-10210U, UHD Graphics 620 | 2.3 kg | 21.4 mm | 17.30" | 1920x1080 |
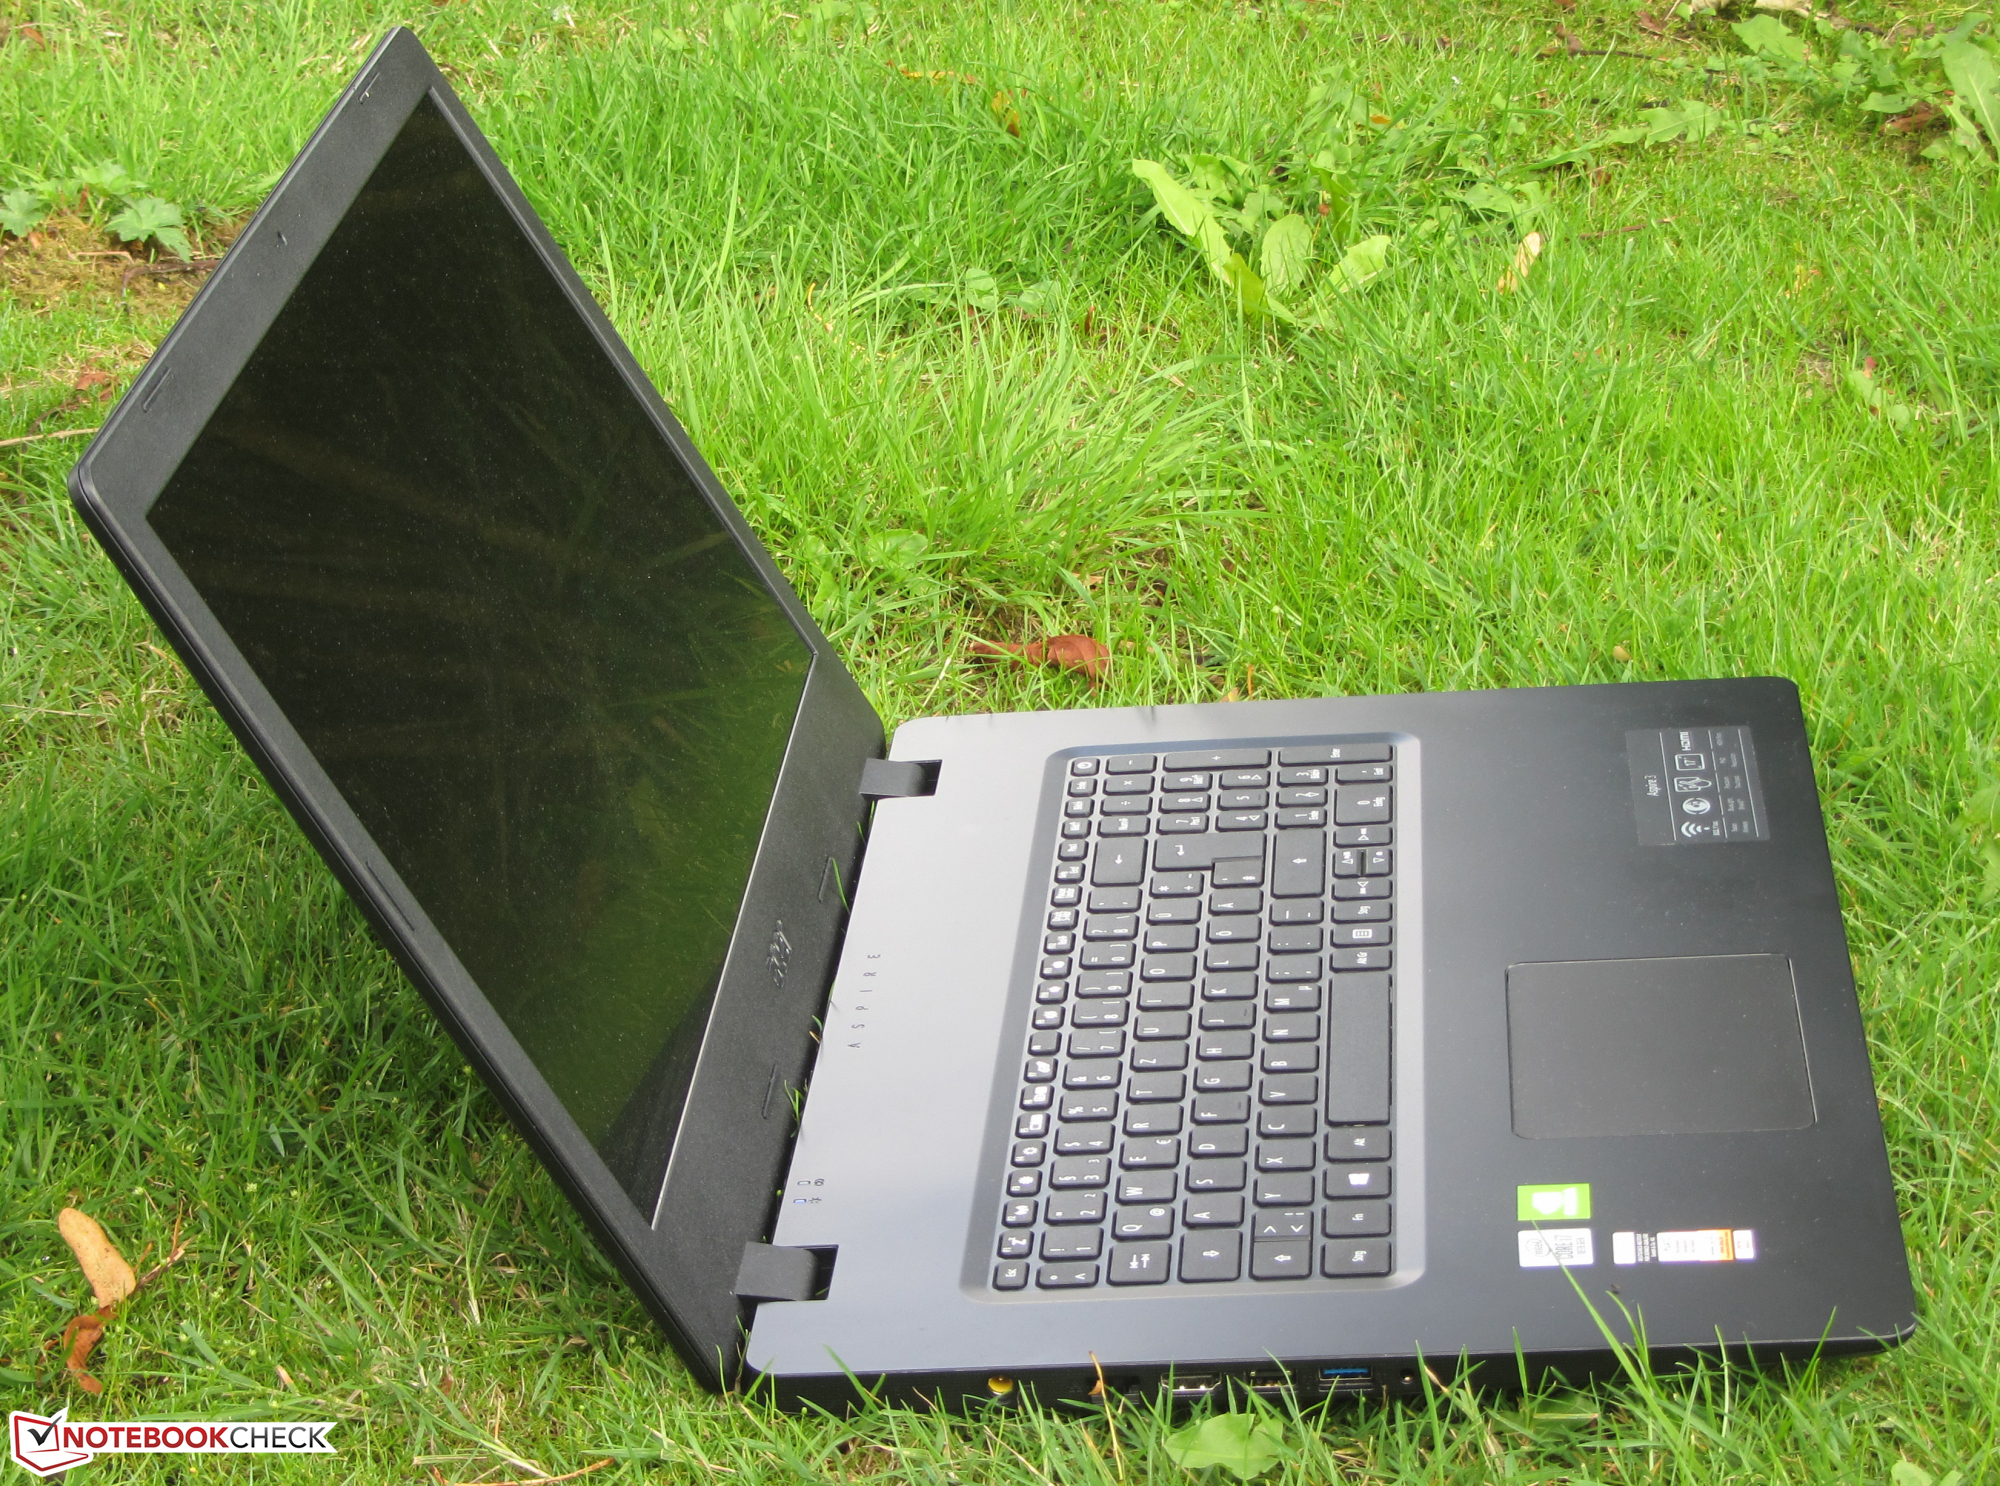
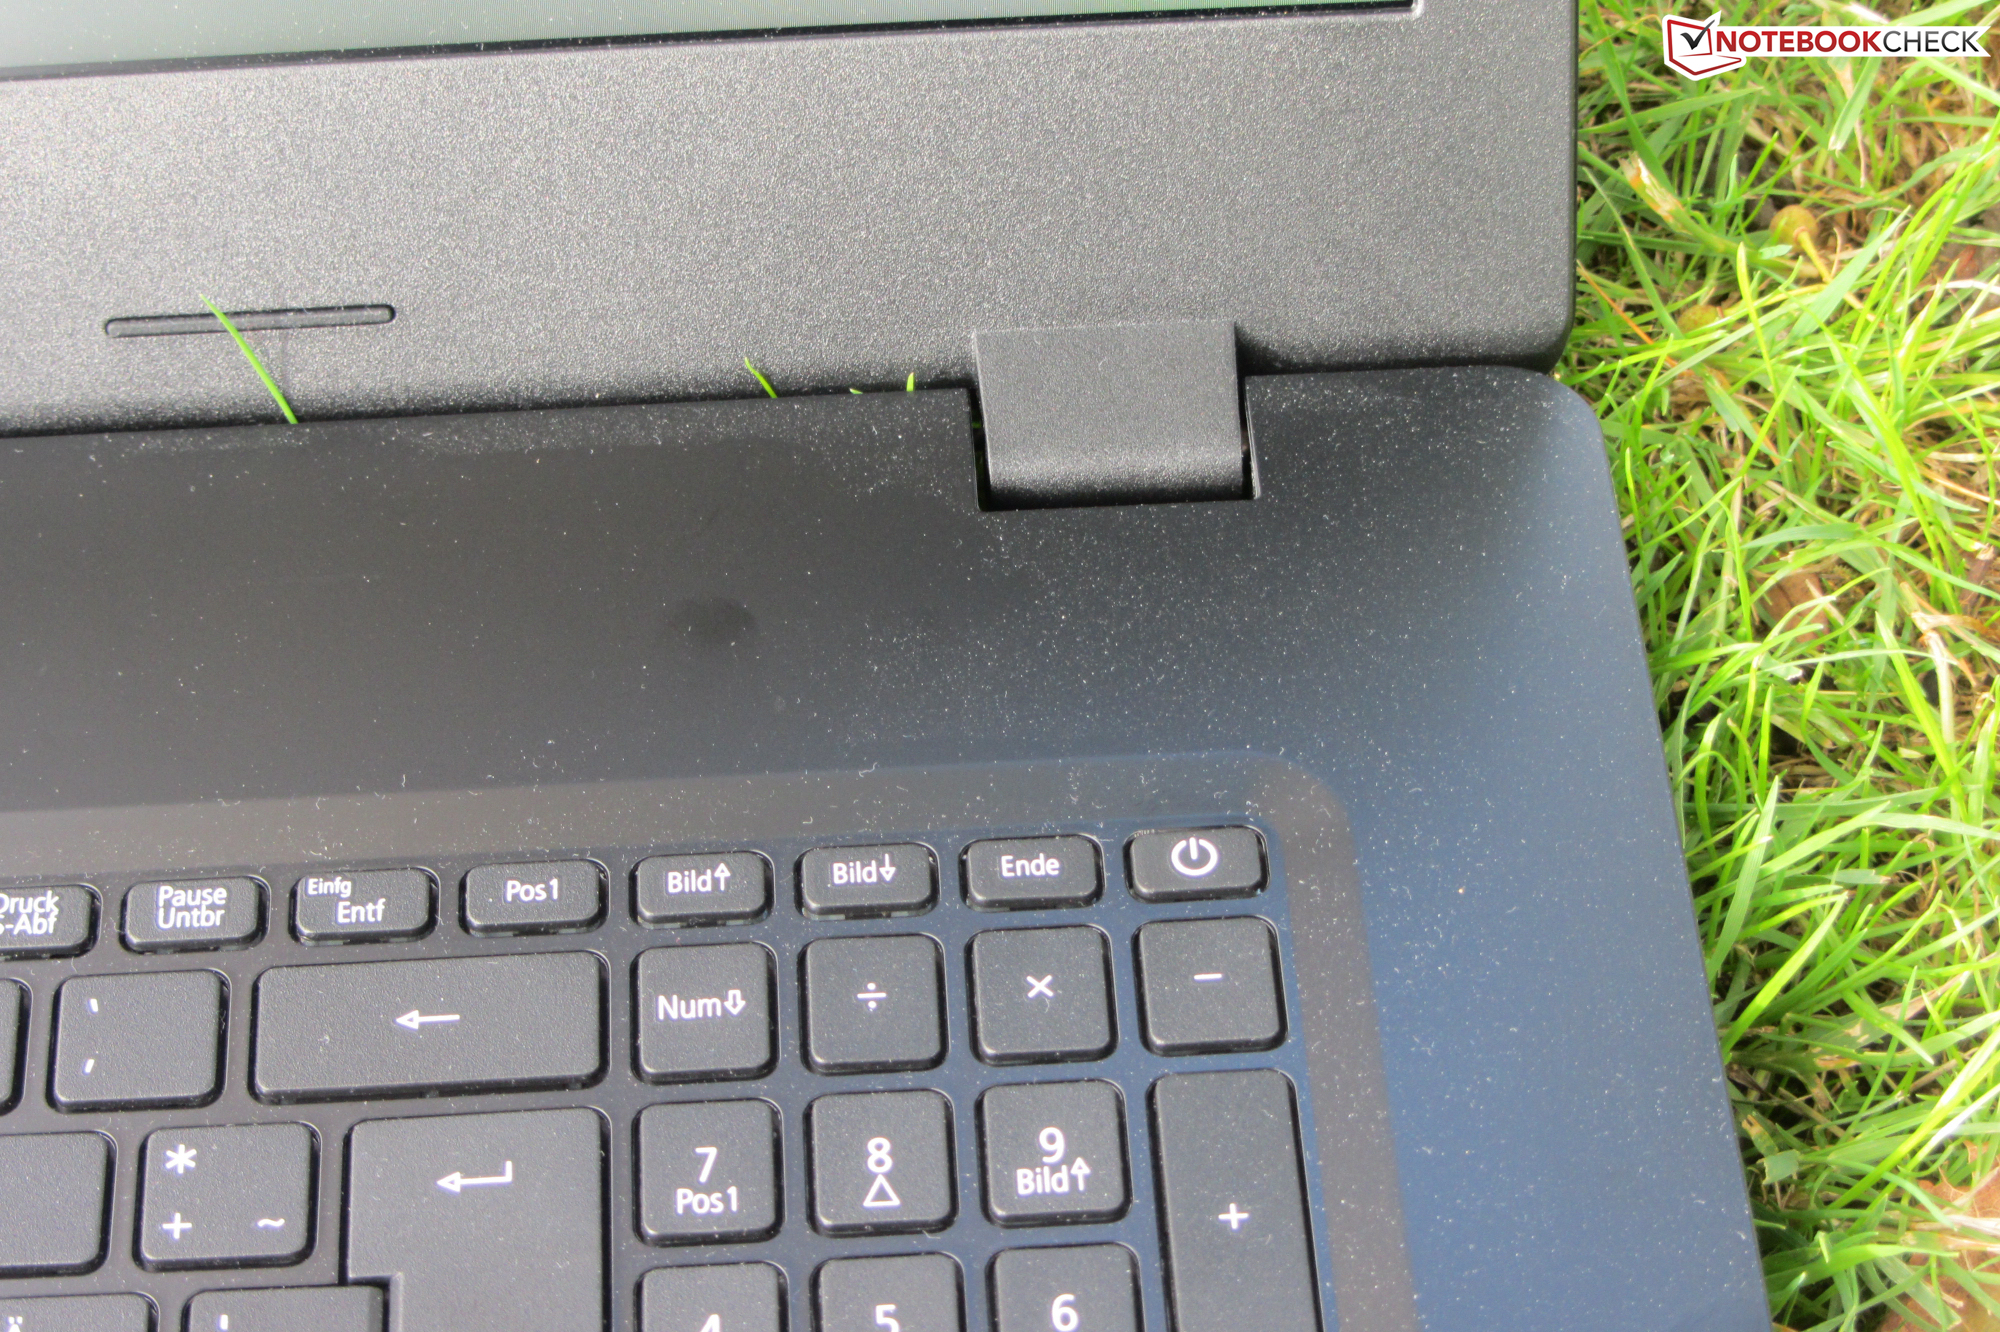
Case and connectivity - No USB Type-C for the A317
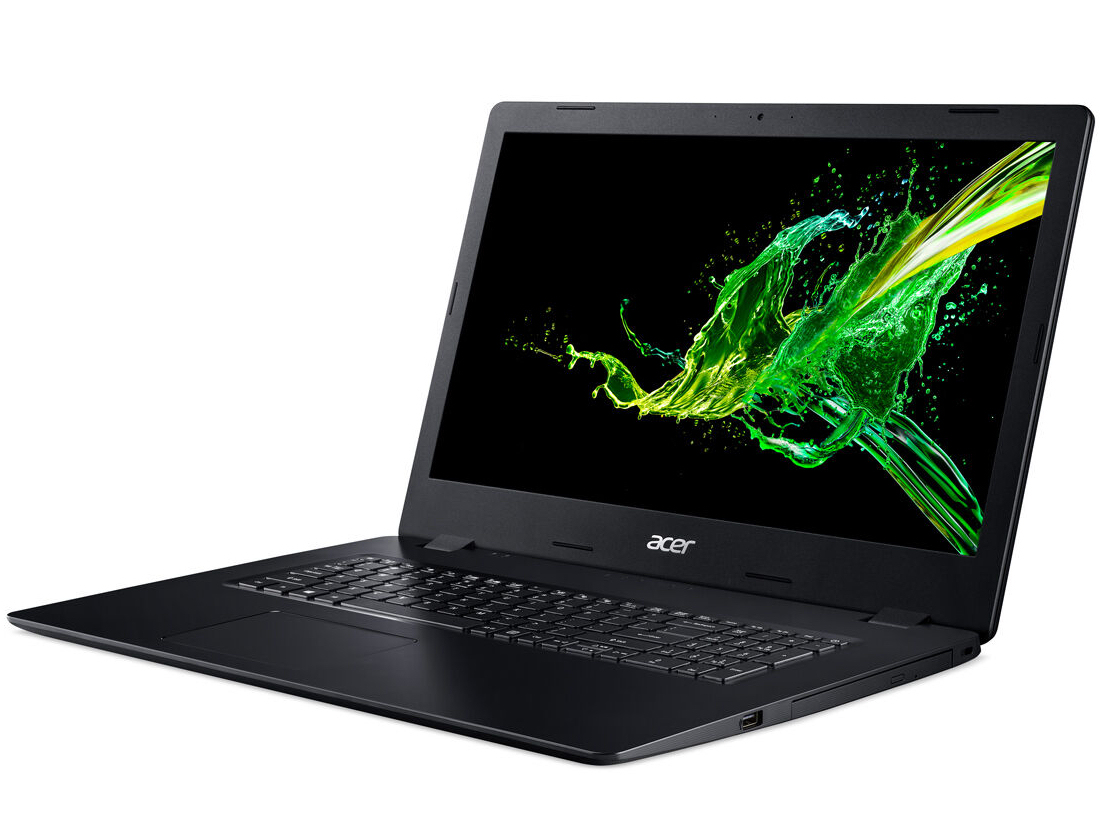
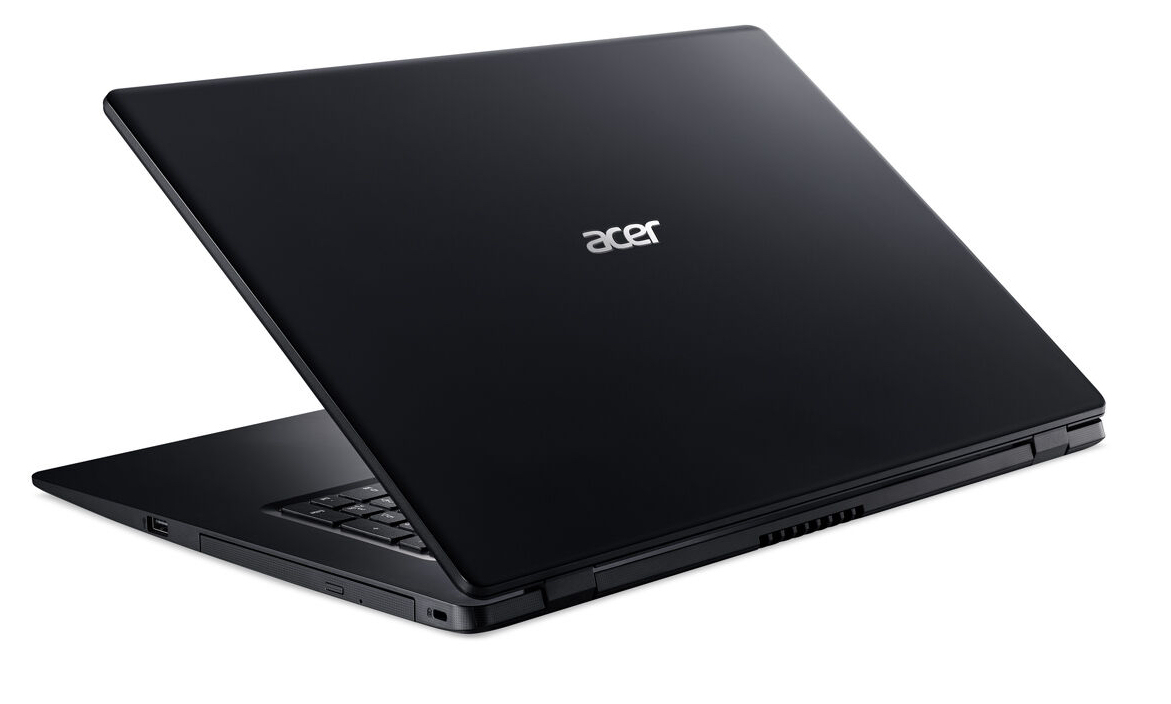
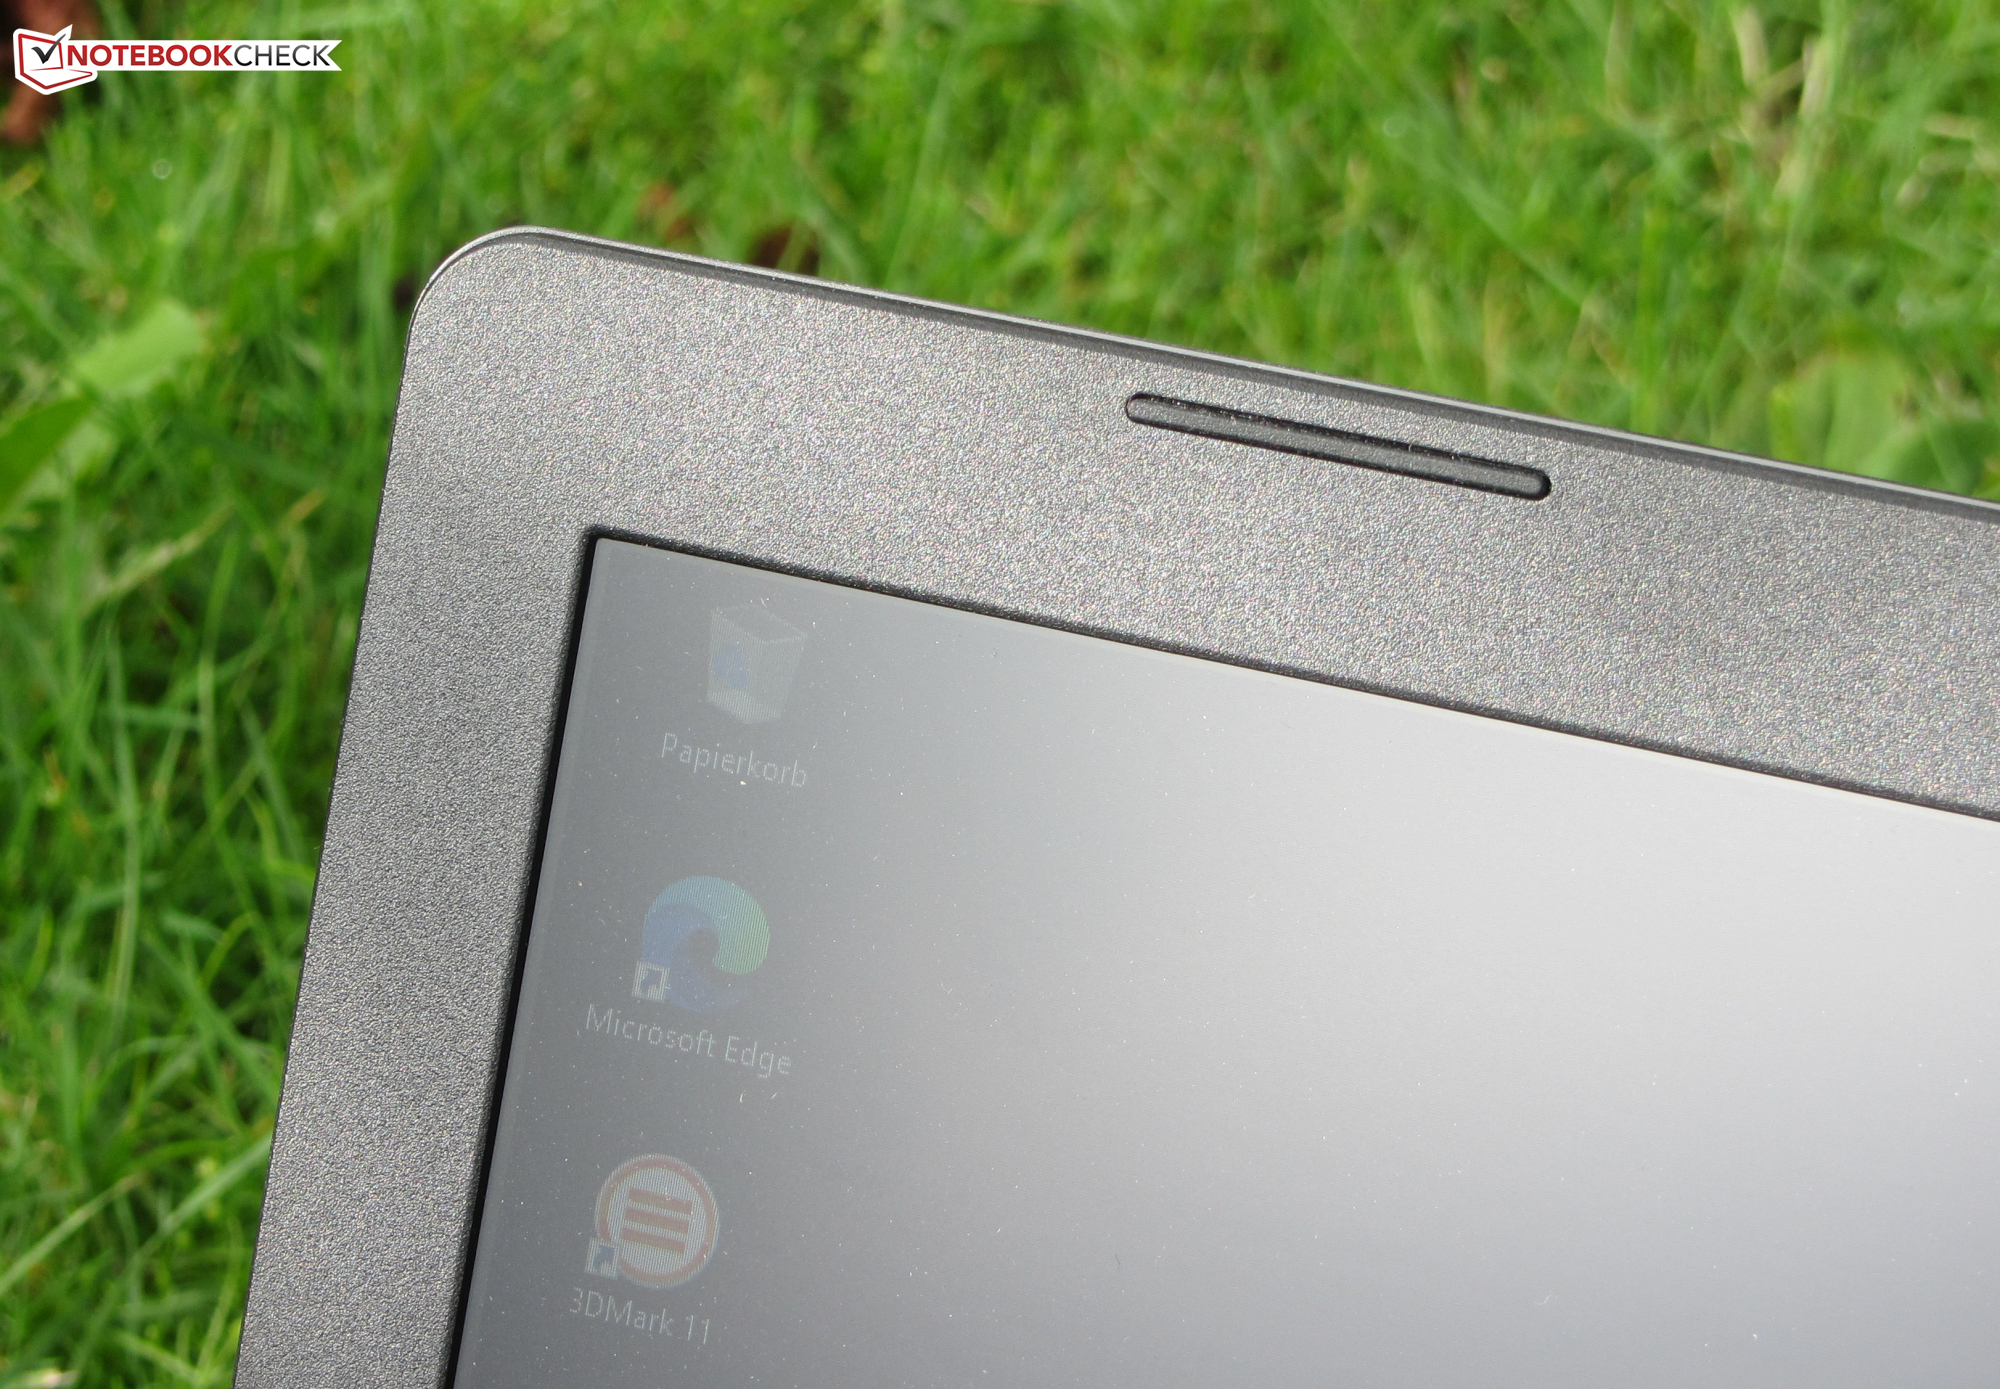
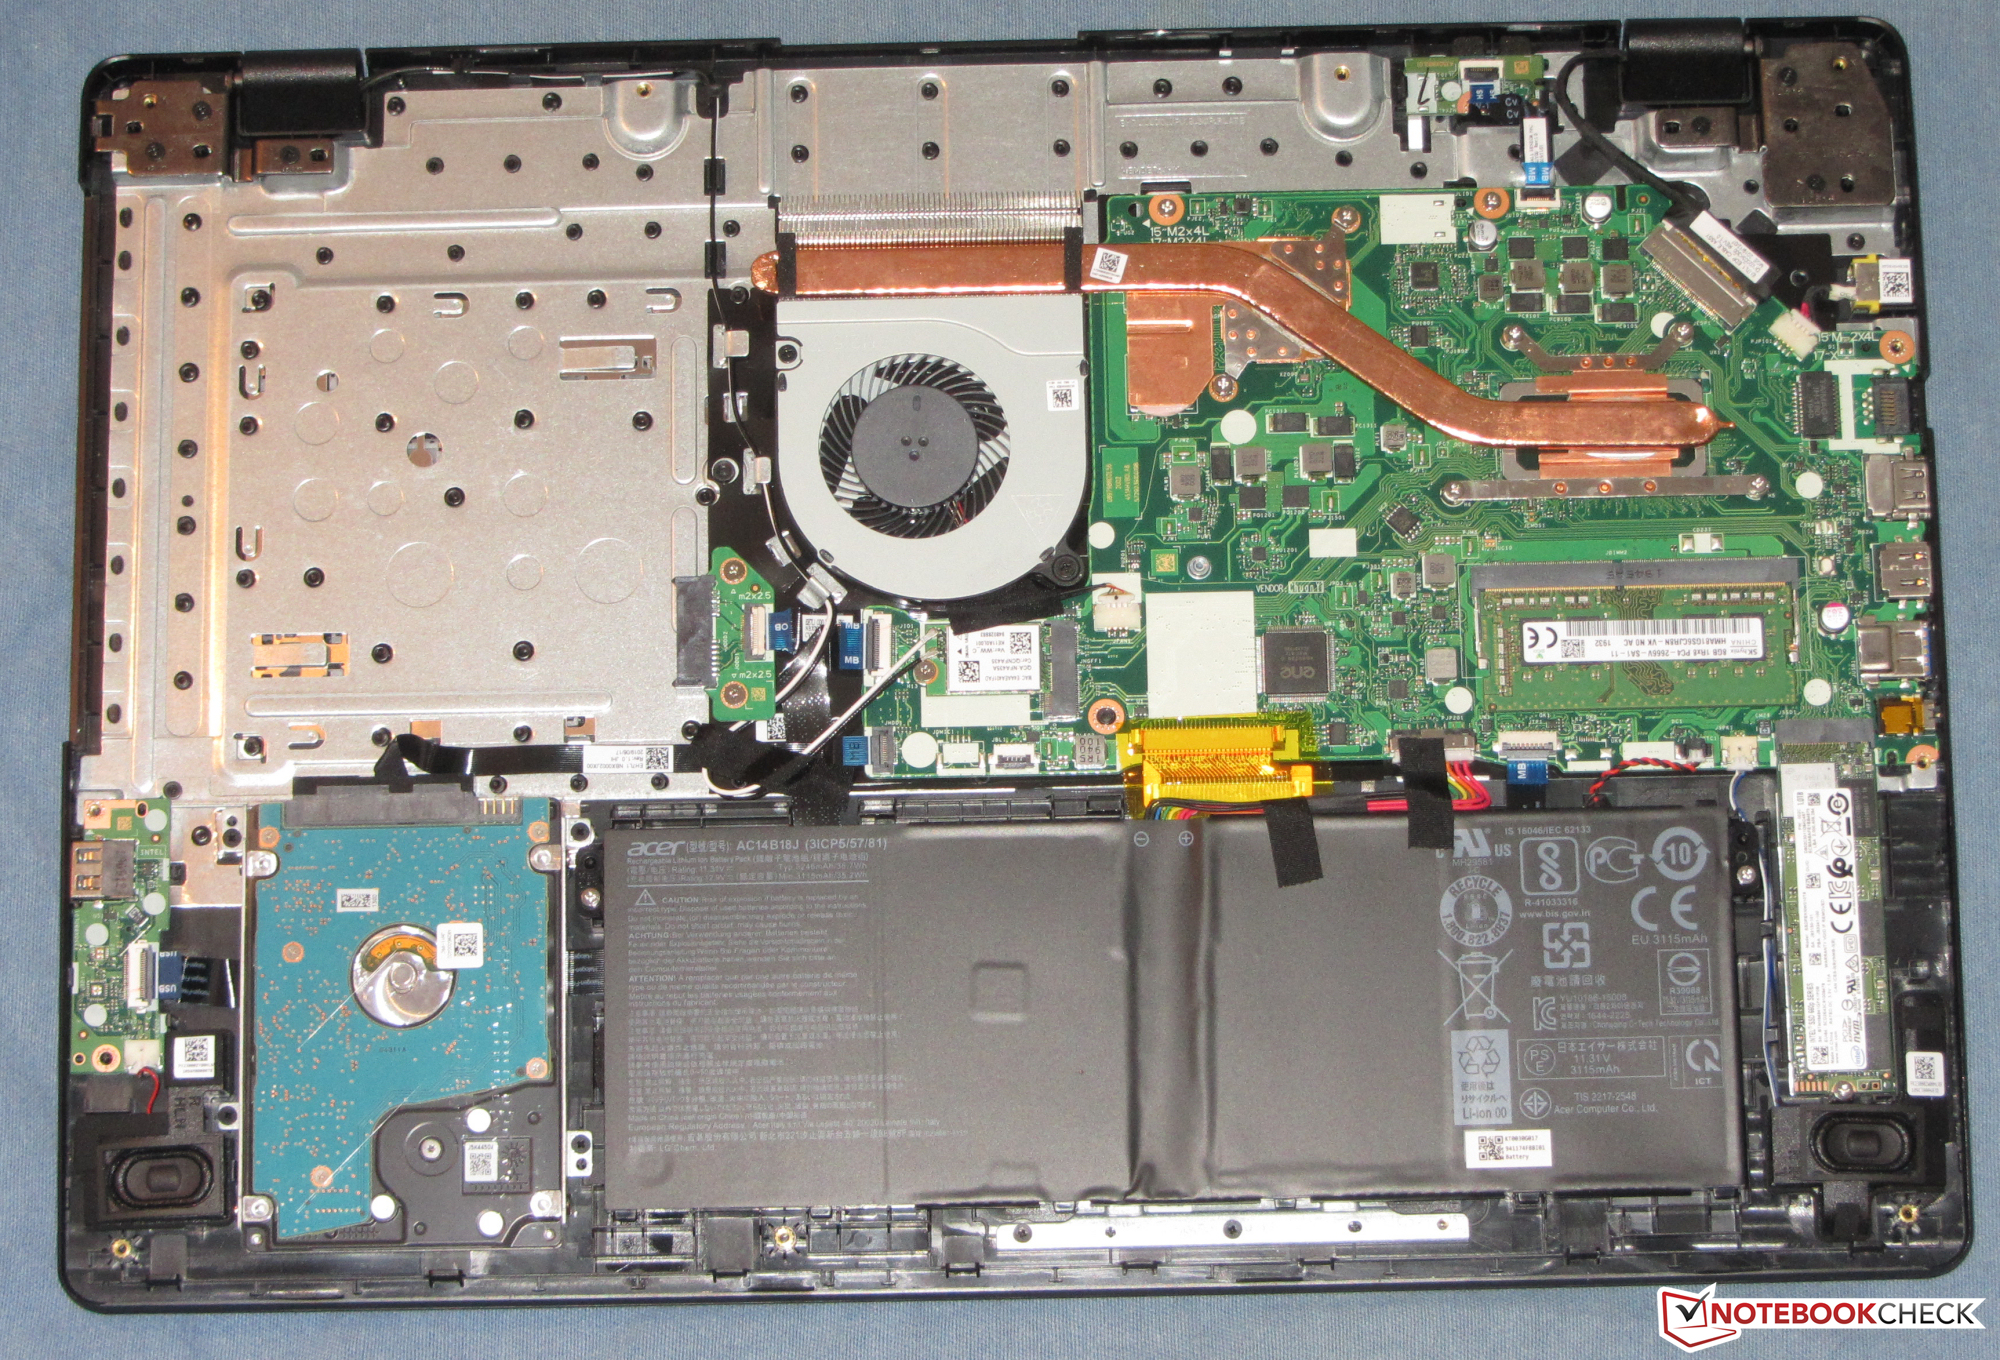
The case is made completely of black plastic. The palm rest and the back of the lid are provided with a shiny, matte, and smooth surface that is quite susceptible to fingerprints. The gap dimensions are in order, and excess material is not noticeable. Moreover, the lid and base unit should have a slightly higher stiffness. The battery is firmly installed. You can reach the inside after removing the bottom cover.
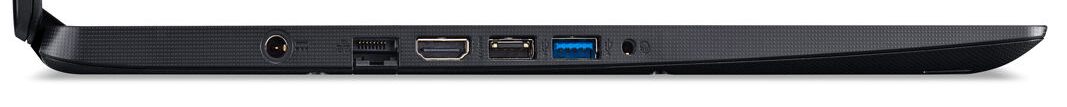
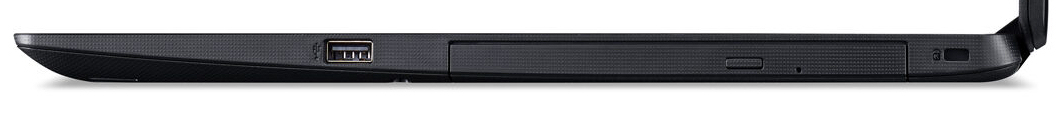
Acer has provided the laptop with three USB Type-A ports (2x USB 2.0, 1x USB 3.2 Gen 1). There is no USB Type-C USB port. In addition, an external monitor can be connected via HDMI. A memory card reader has been completely forgone.
The WLAN chip (Qualcomm QCA9377) supports the 802.11a/b/g/n/ac standards. The transmission speeds determined under optimal conditions (no other WLAN devices nearby, short distance between laptop and server PC) are average. We do our testing with the Netgear Nighthawk AX12 Wi-Fi 6 tri-band router.
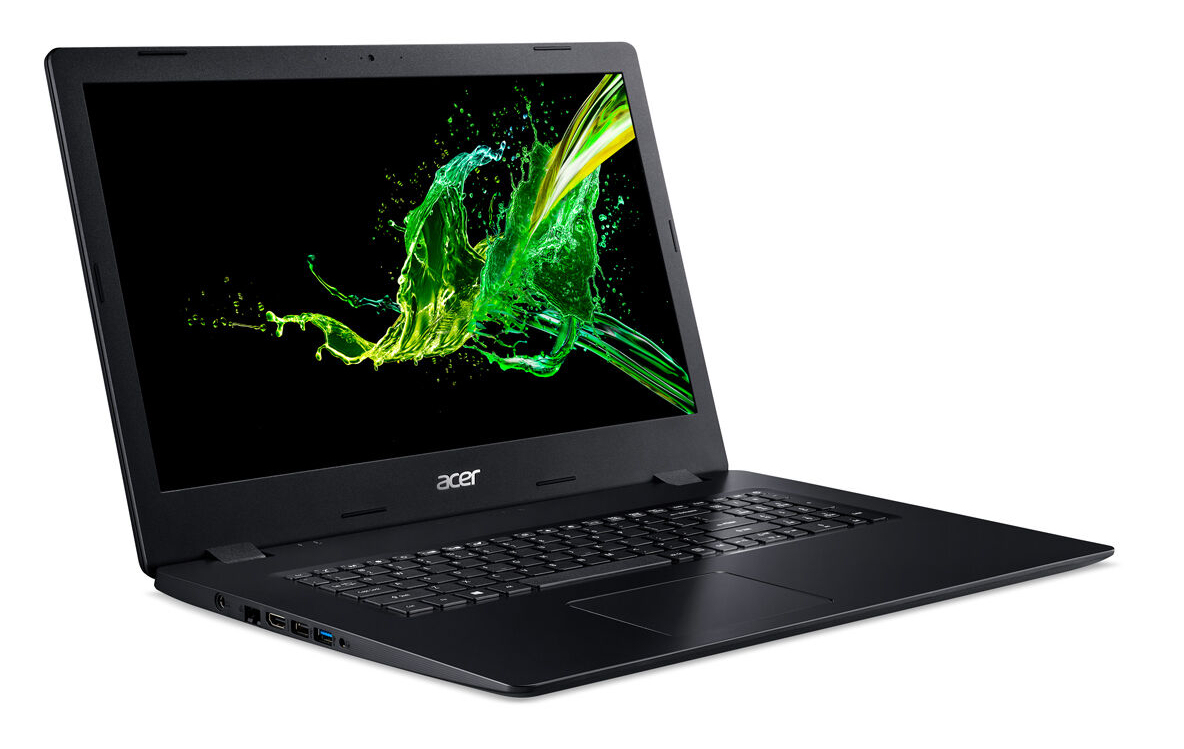
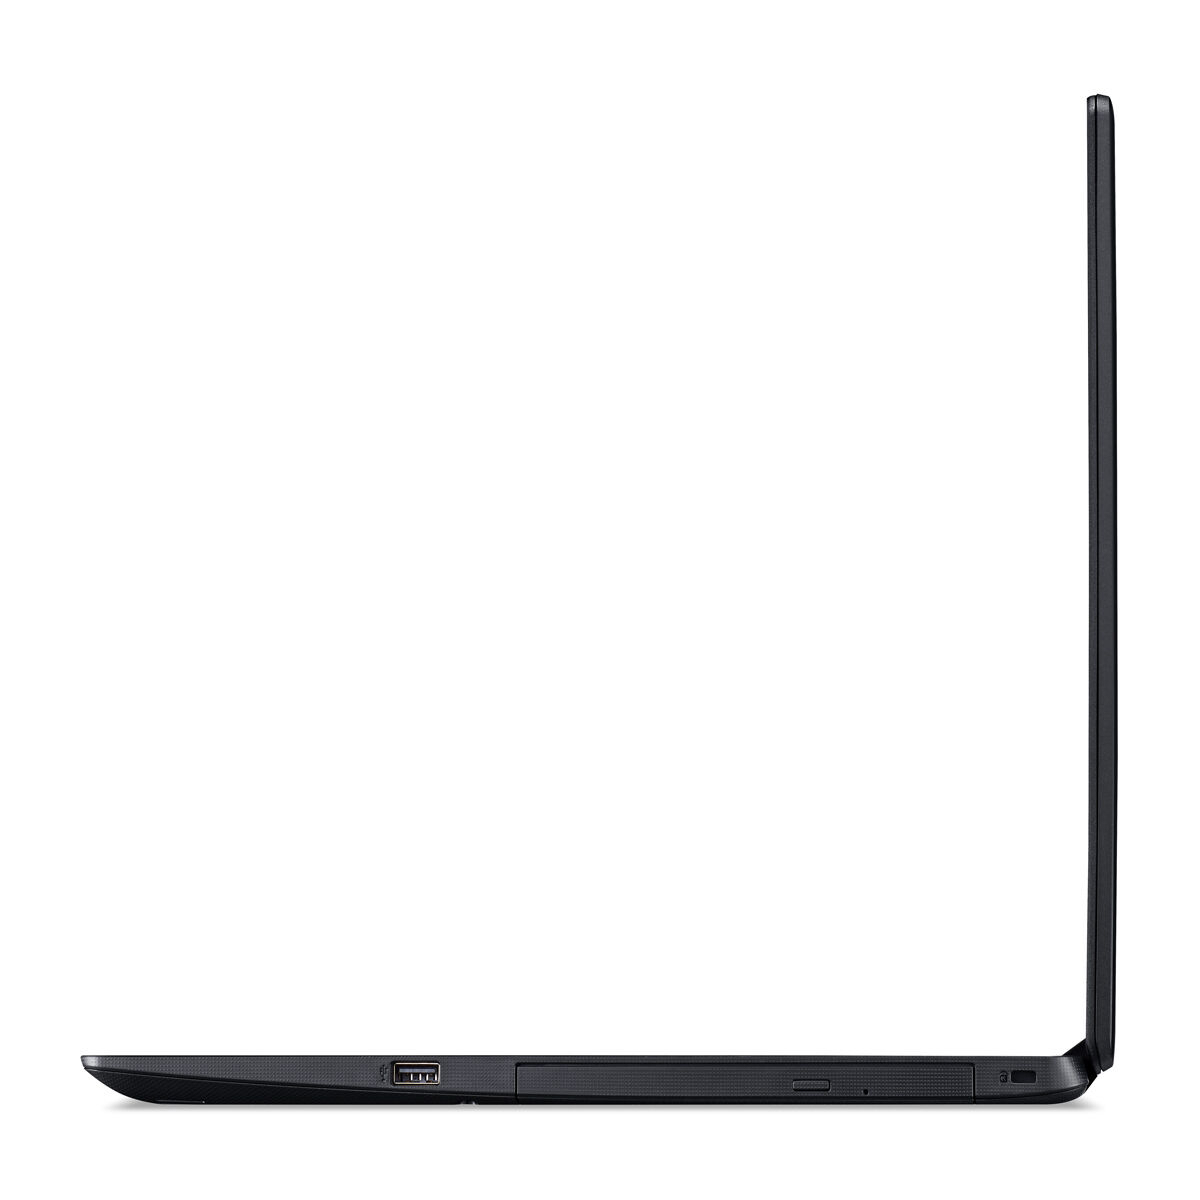
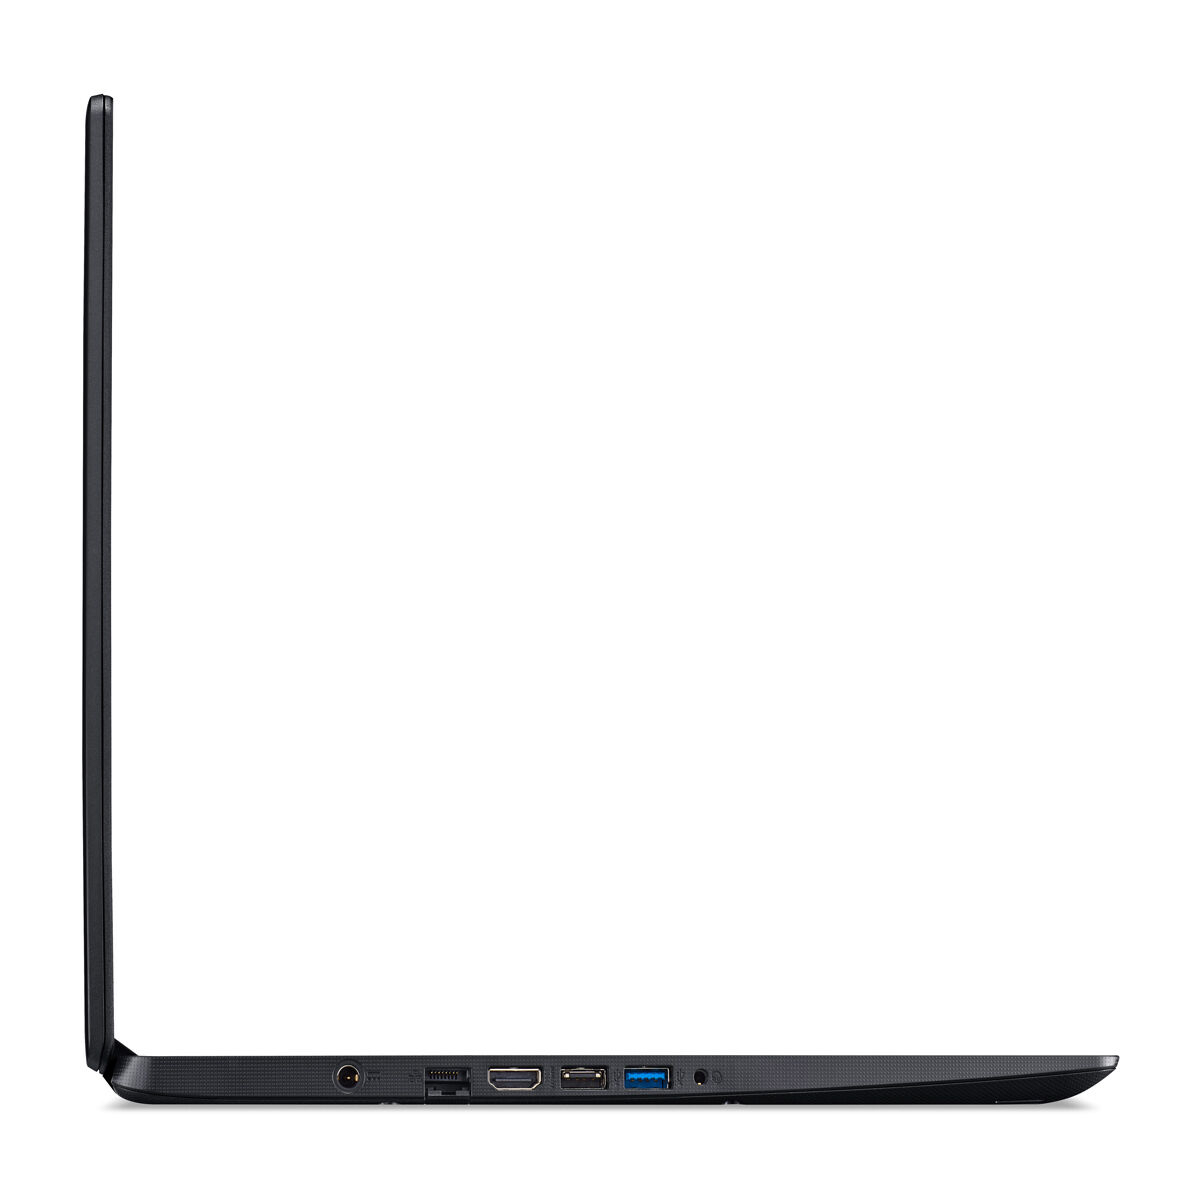
Port configuration


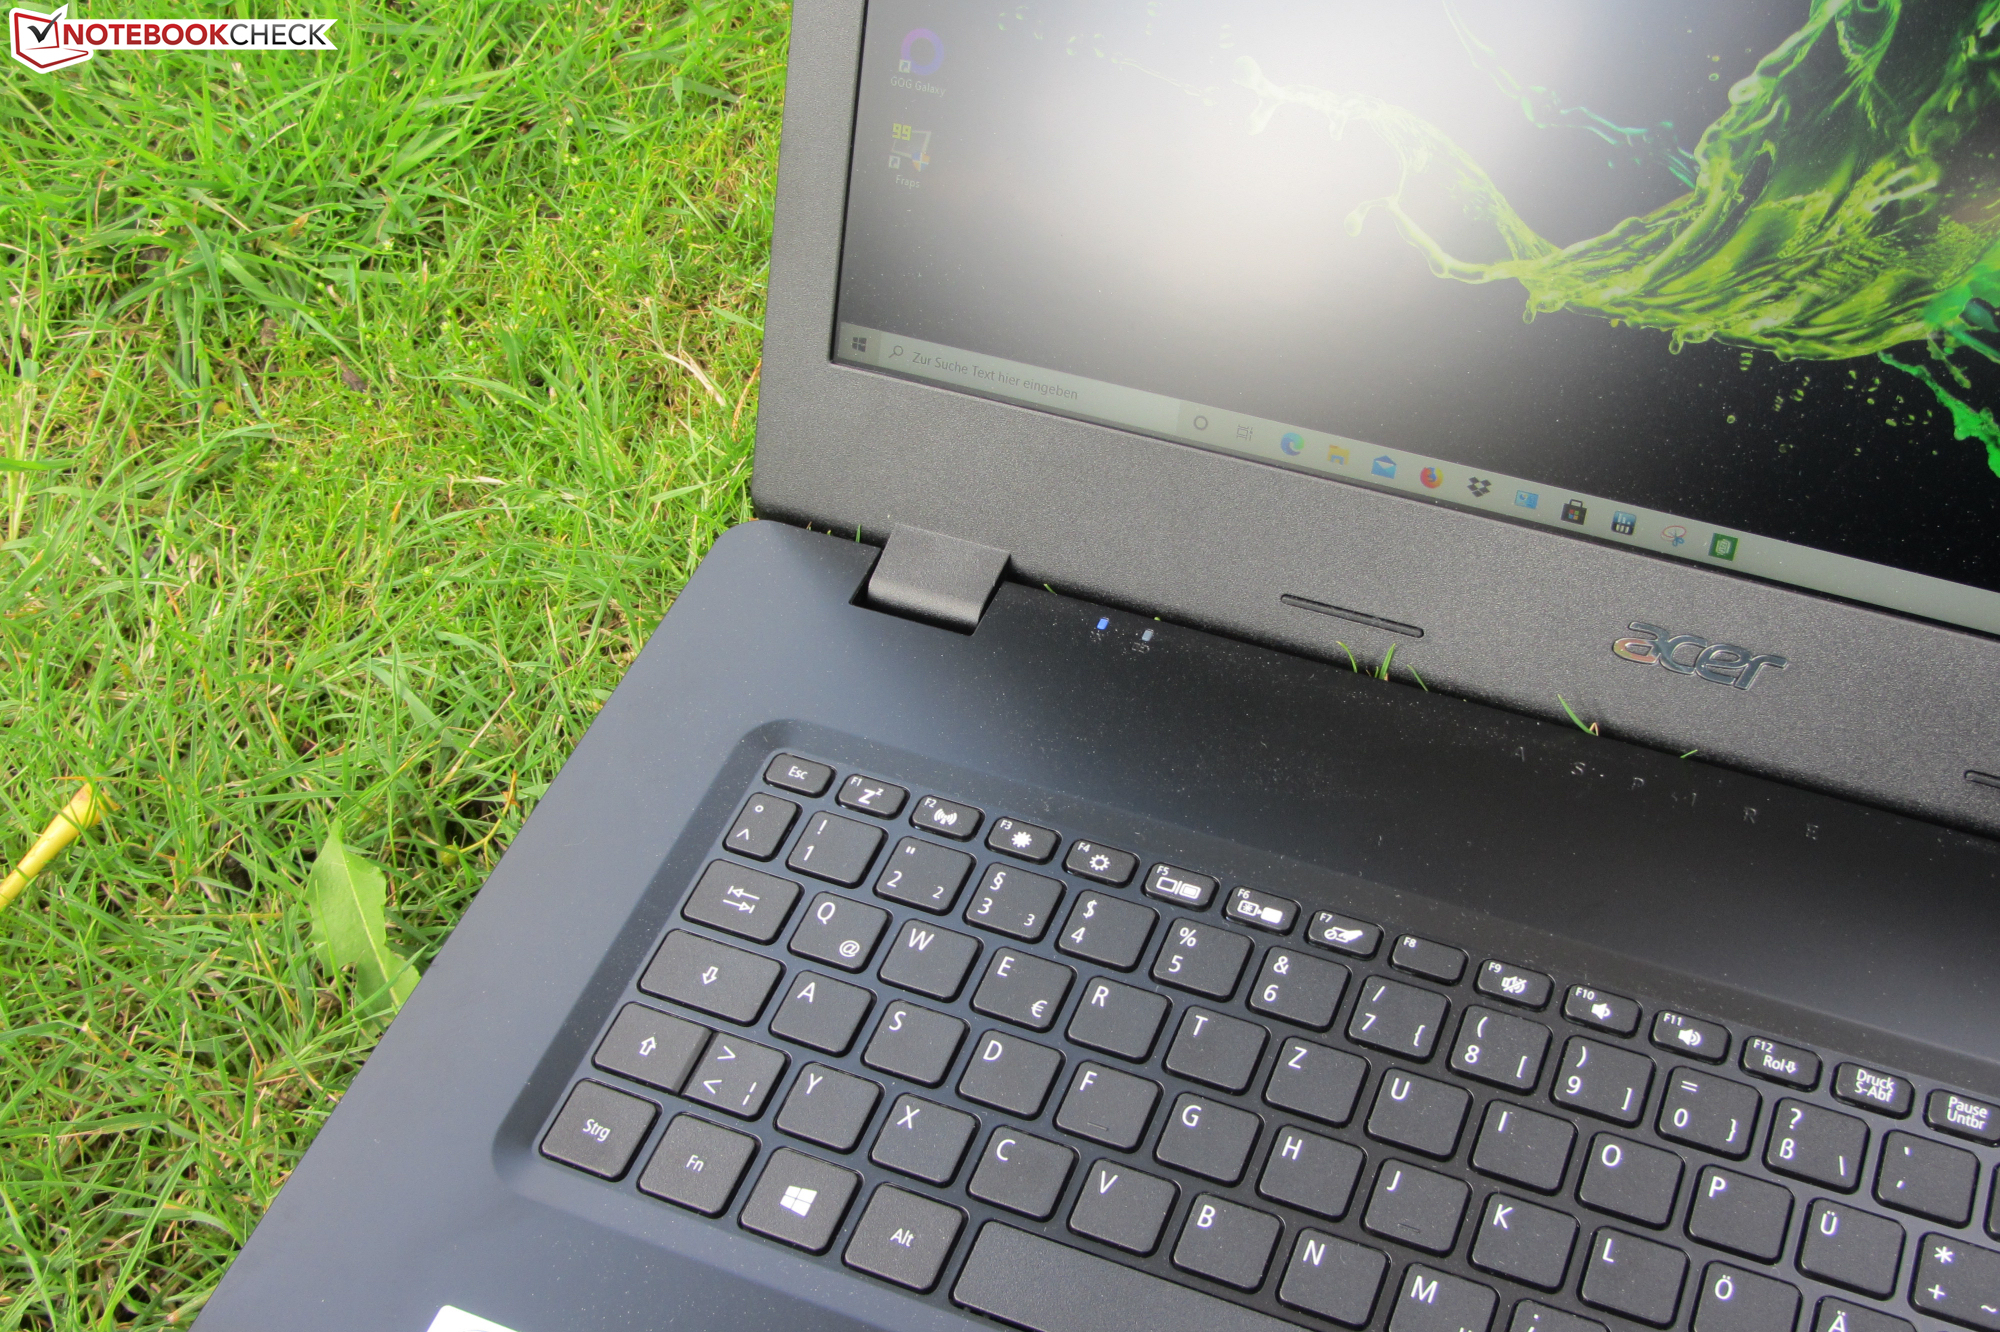
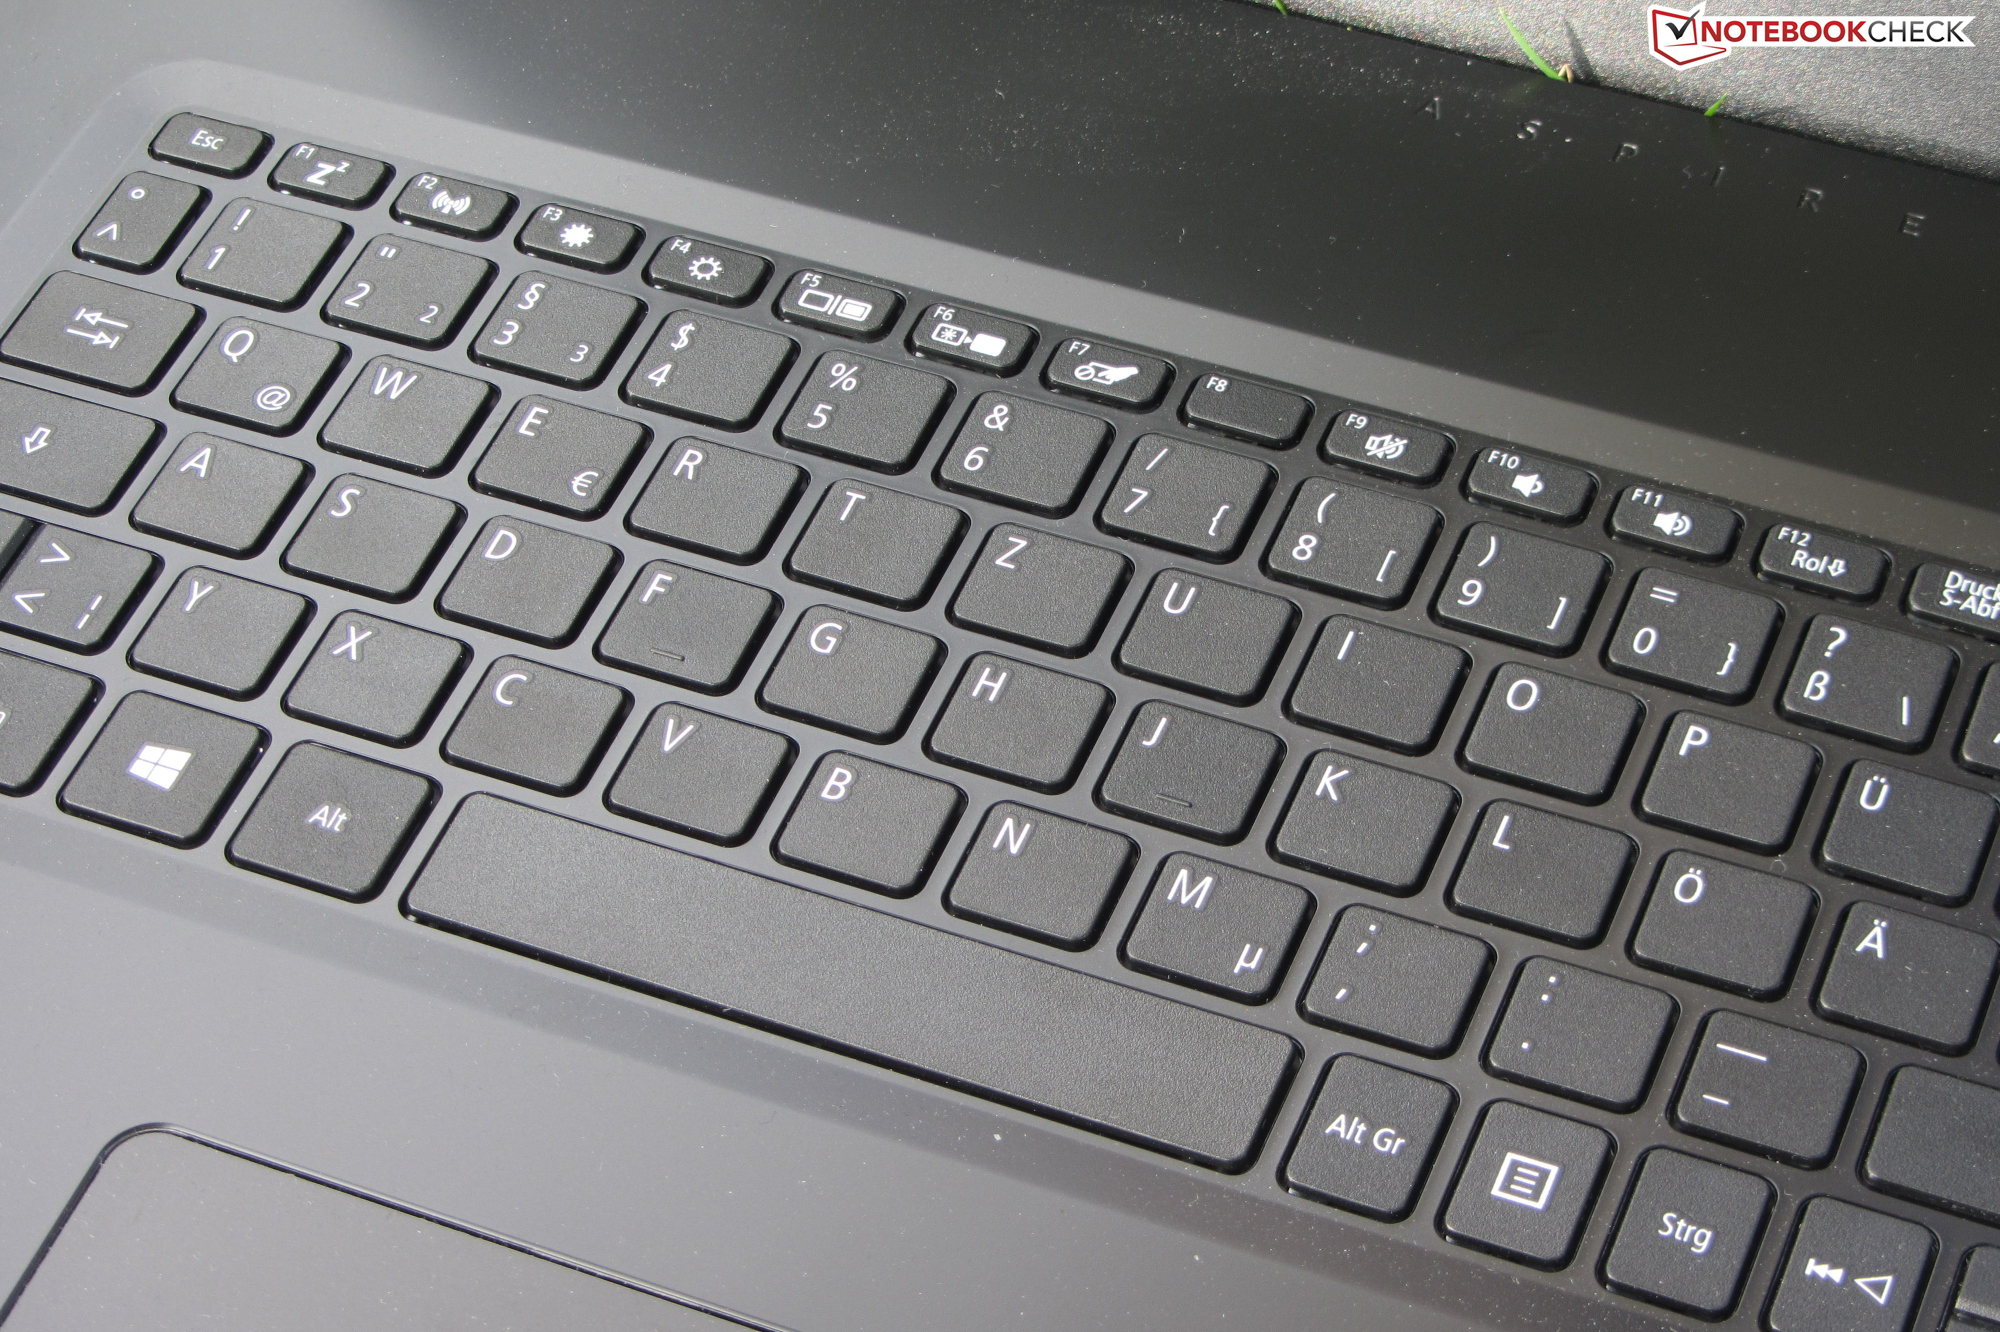
Input devices - The Aspire 3 doesn't offer keyboard backlighting
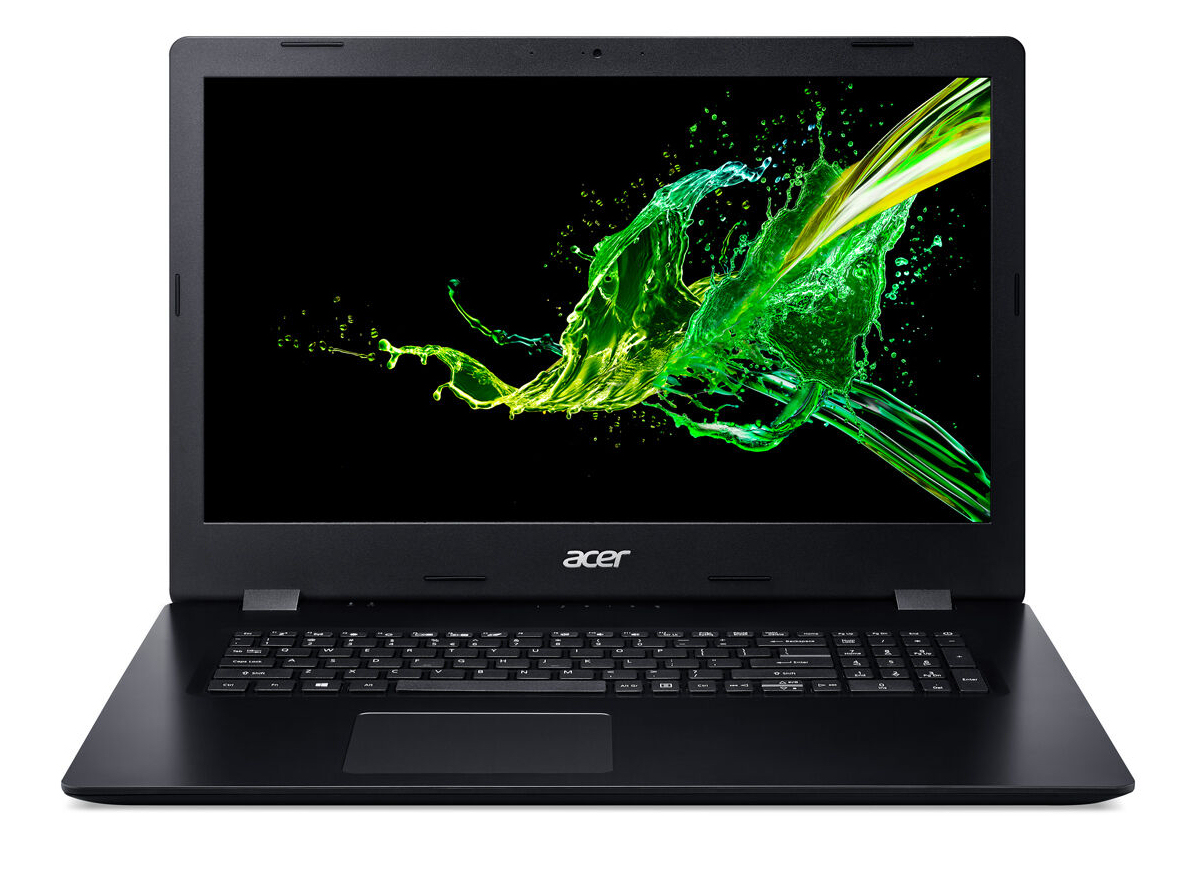
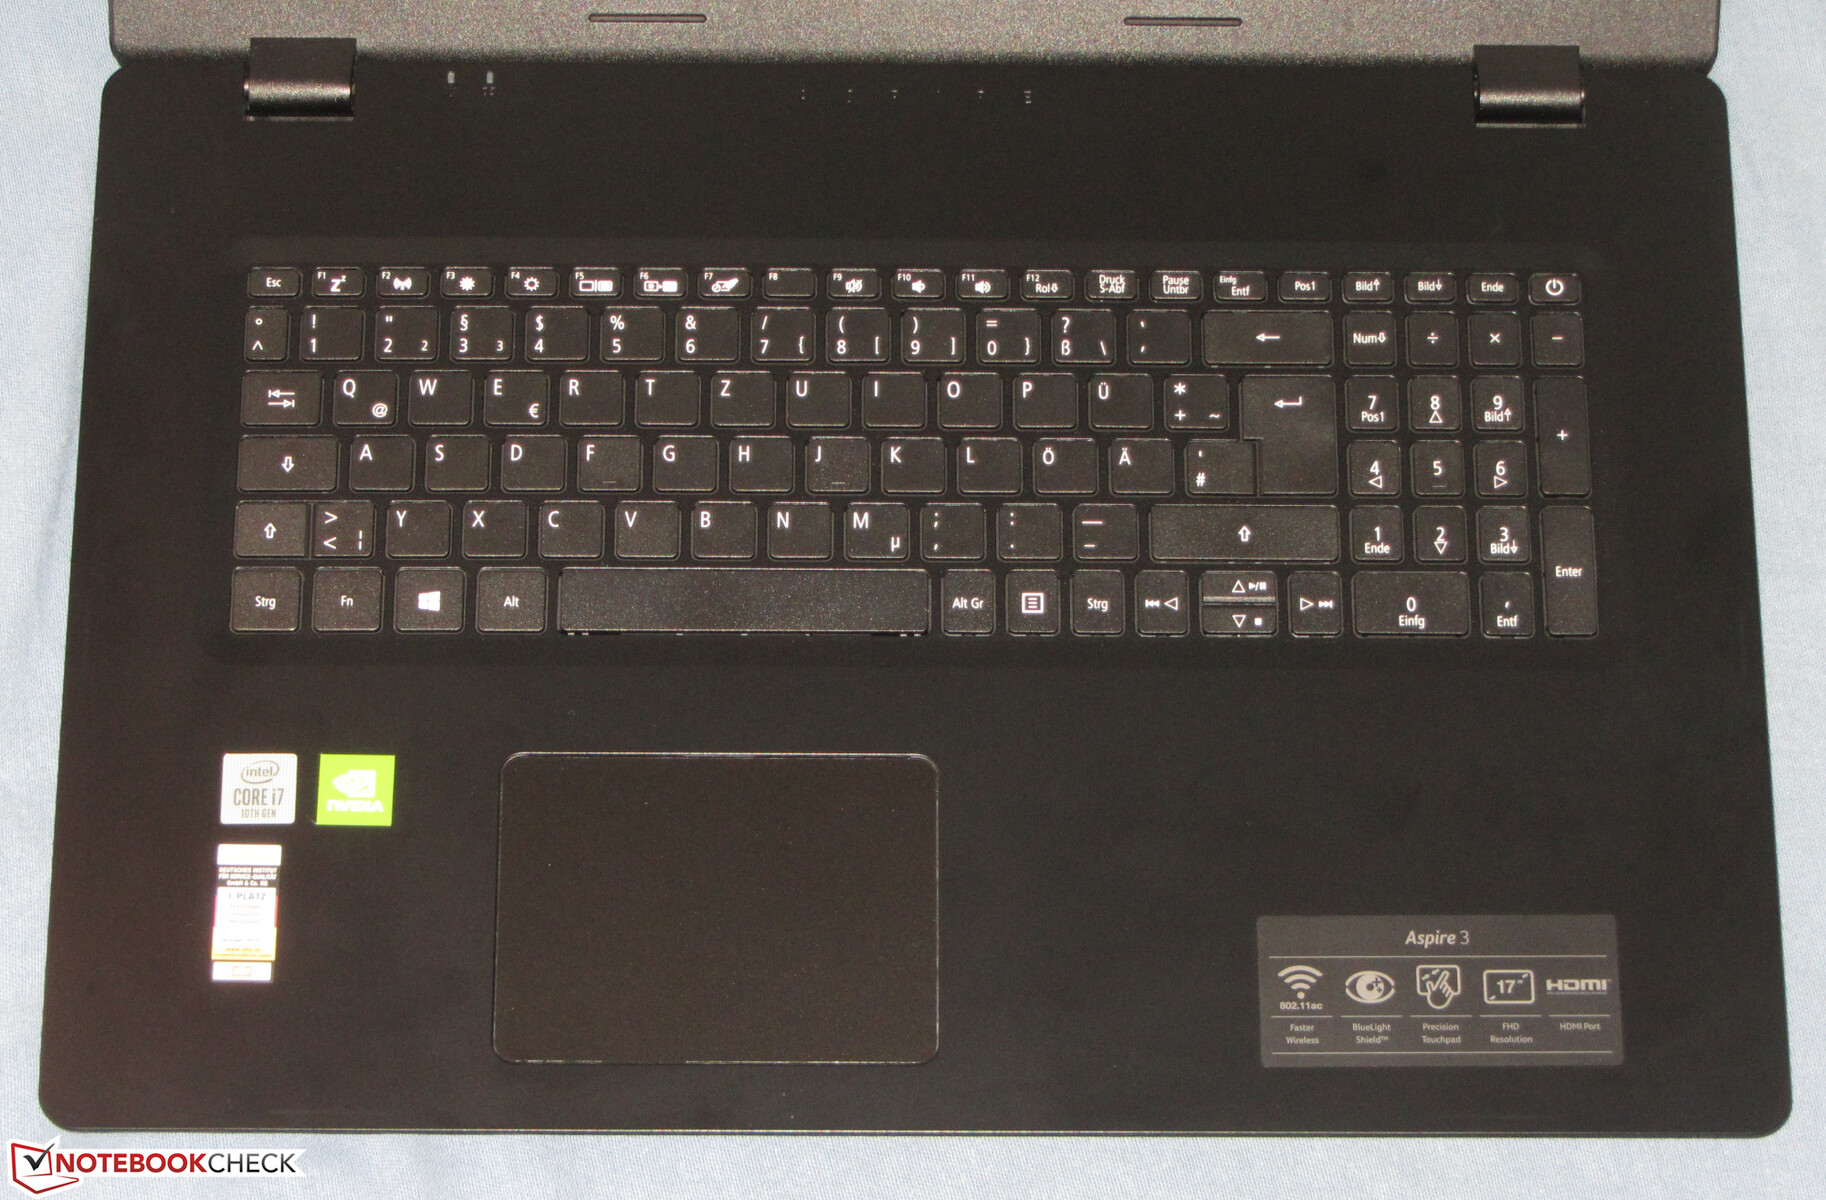
The Aspire A317 has a chiclet keyboard (not backlit) with a number pad on board. The flat, slightly roughened keys offer a short travel and a clear pressure point. The resistance provided by the keys should be crisper. All in all, Acer delivers a keyboard suitable for everyday use here.
The multi-touch capable ClickPad takes up an area of about 10.6 x 7.8 cm. As a result, there is enough space for using gesture controls. In addition, the smooth pad surface makes it easy for fingers to glide on it. It also reacts to input in the corners. The pad has a short travel and a clear pressure point.
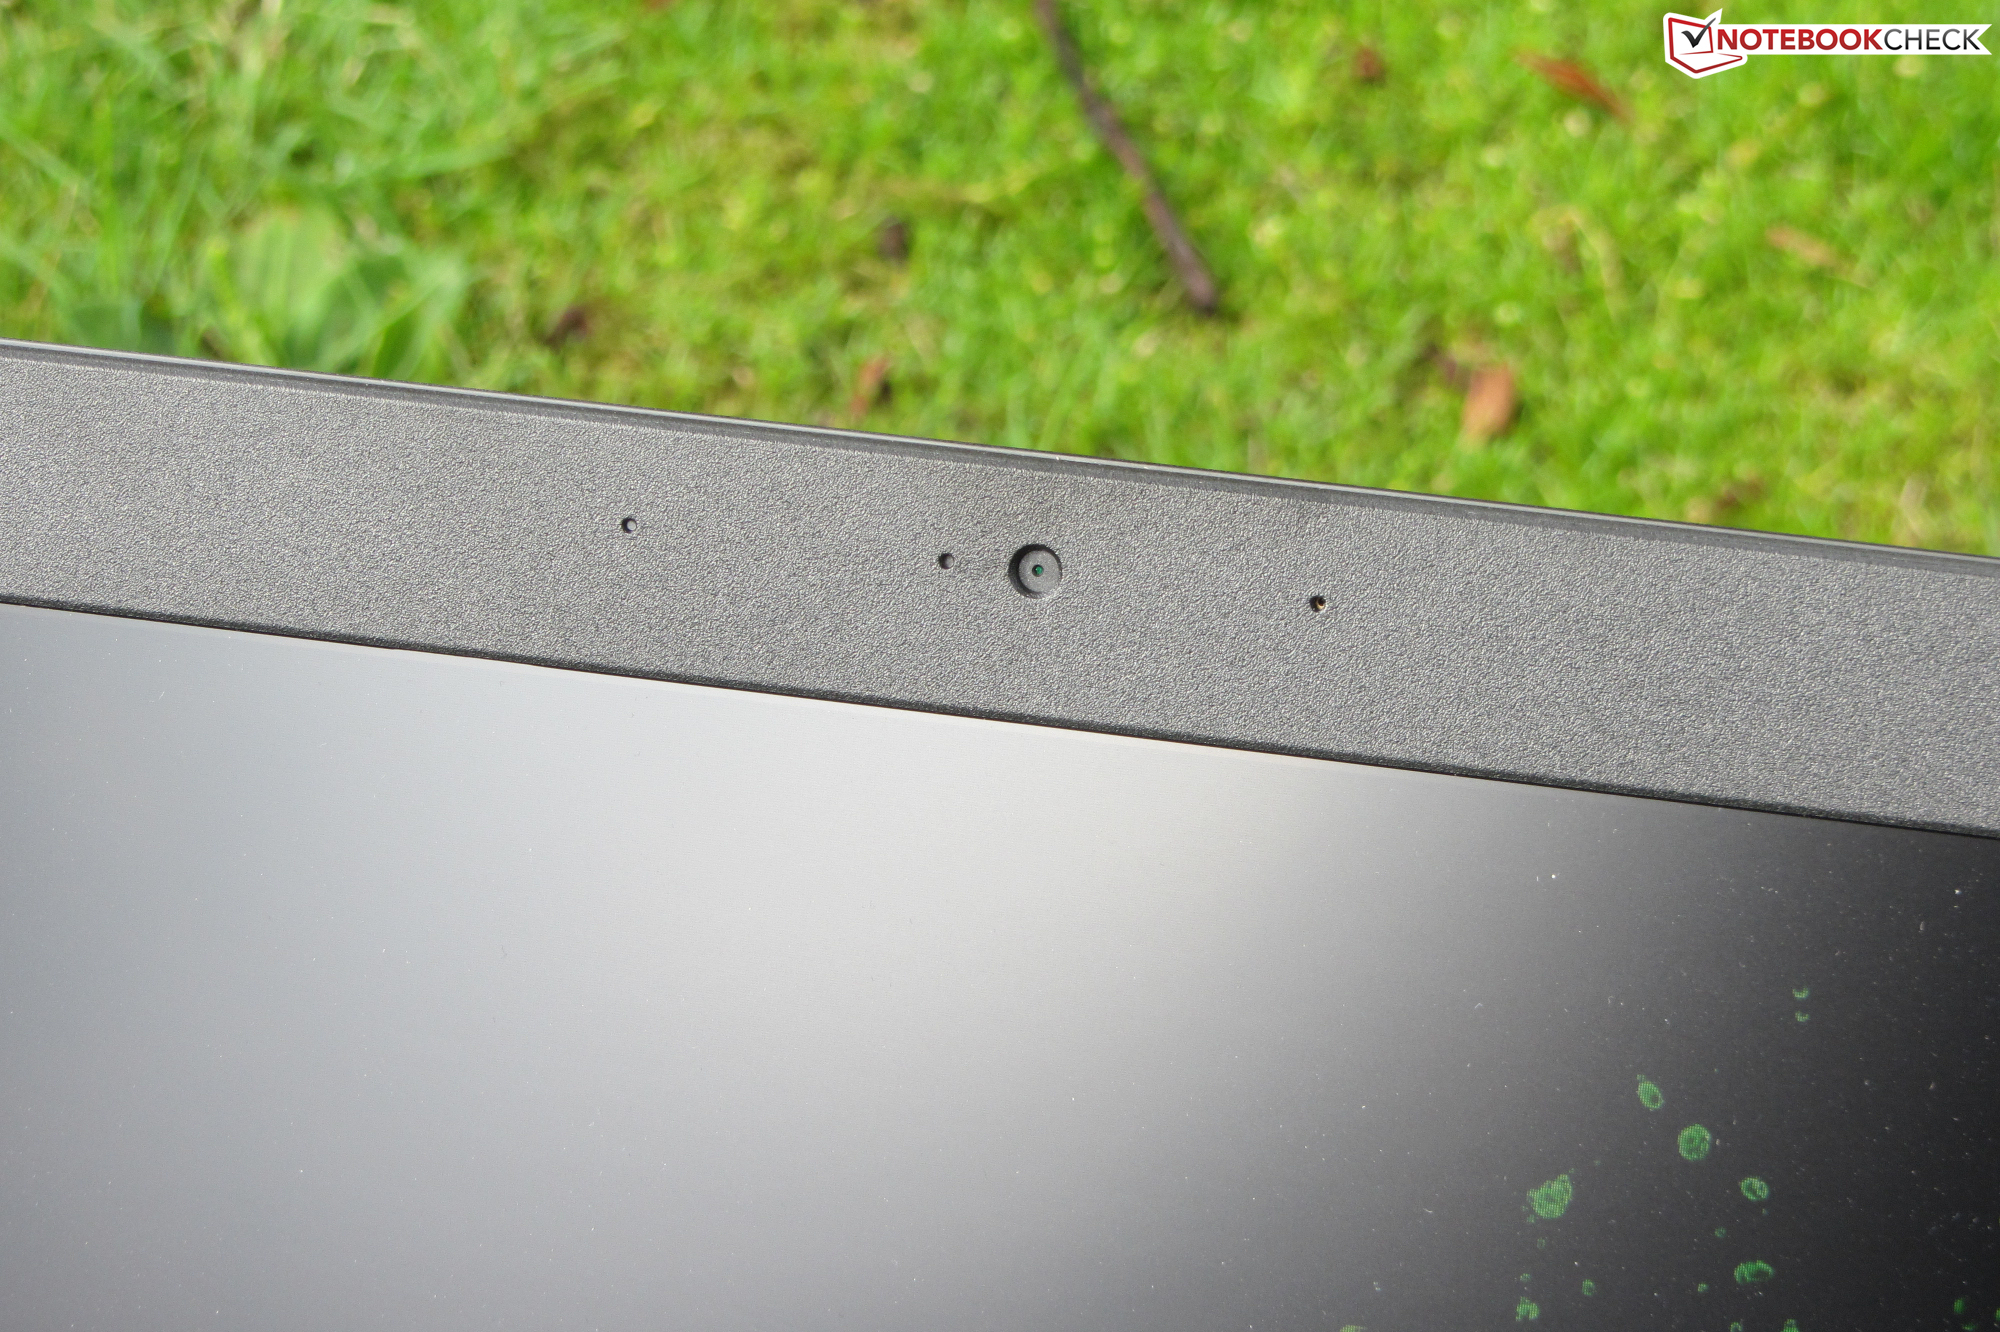
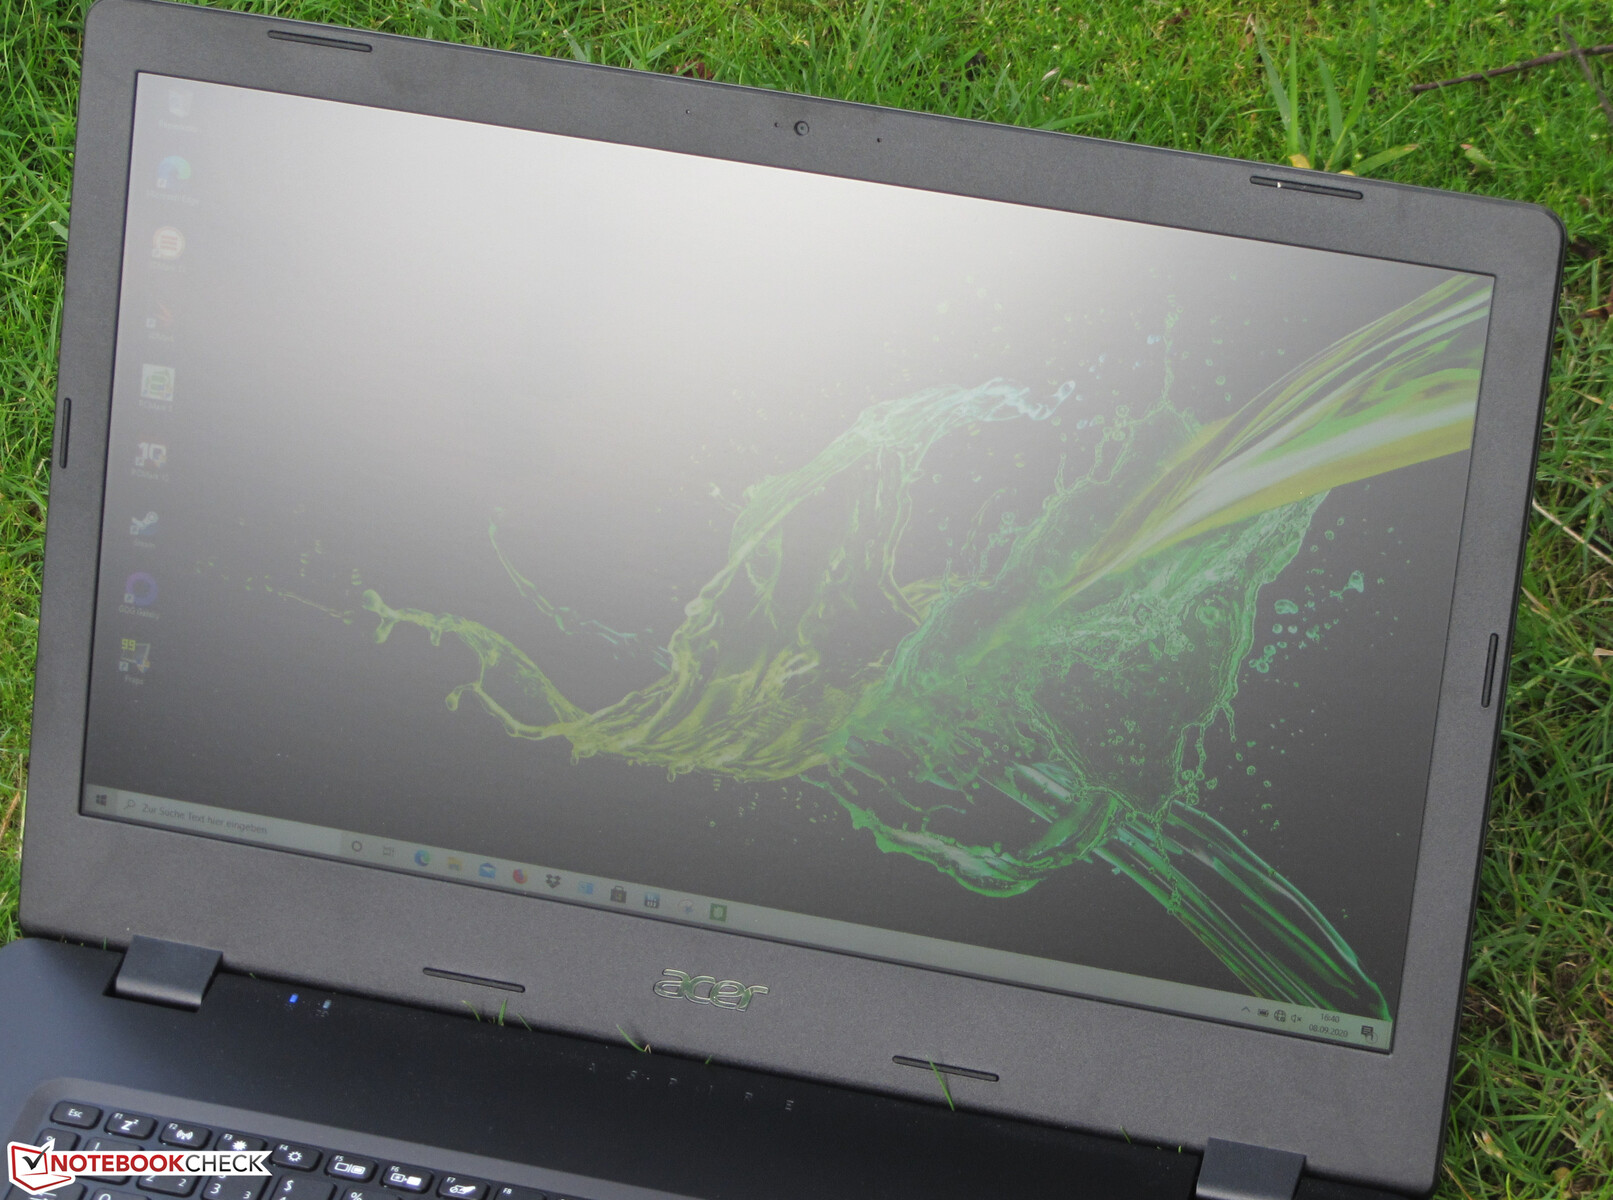
Display - IPS on board
The matte 17.3-inch display (1920x1080 pixels) provides a good contrast ratio (1,535:1), but the maximum brightness (258.1 cd/m²) is too low. We consider values beyond 300 cd/m² to be good.
The display flickers at brightness levels of 90% and below at a frequency of 2,500 Hz. Due to the high frequency, even sensitive users shouldn't be troubled by headaches and/or eye problems.
| |||||||||||||||||||||||||
Brightness Distribution: 81 %
Center on Battery: 245 cd/m²
Contrast: 1535:1 (Black: 0.17 cd/m²)
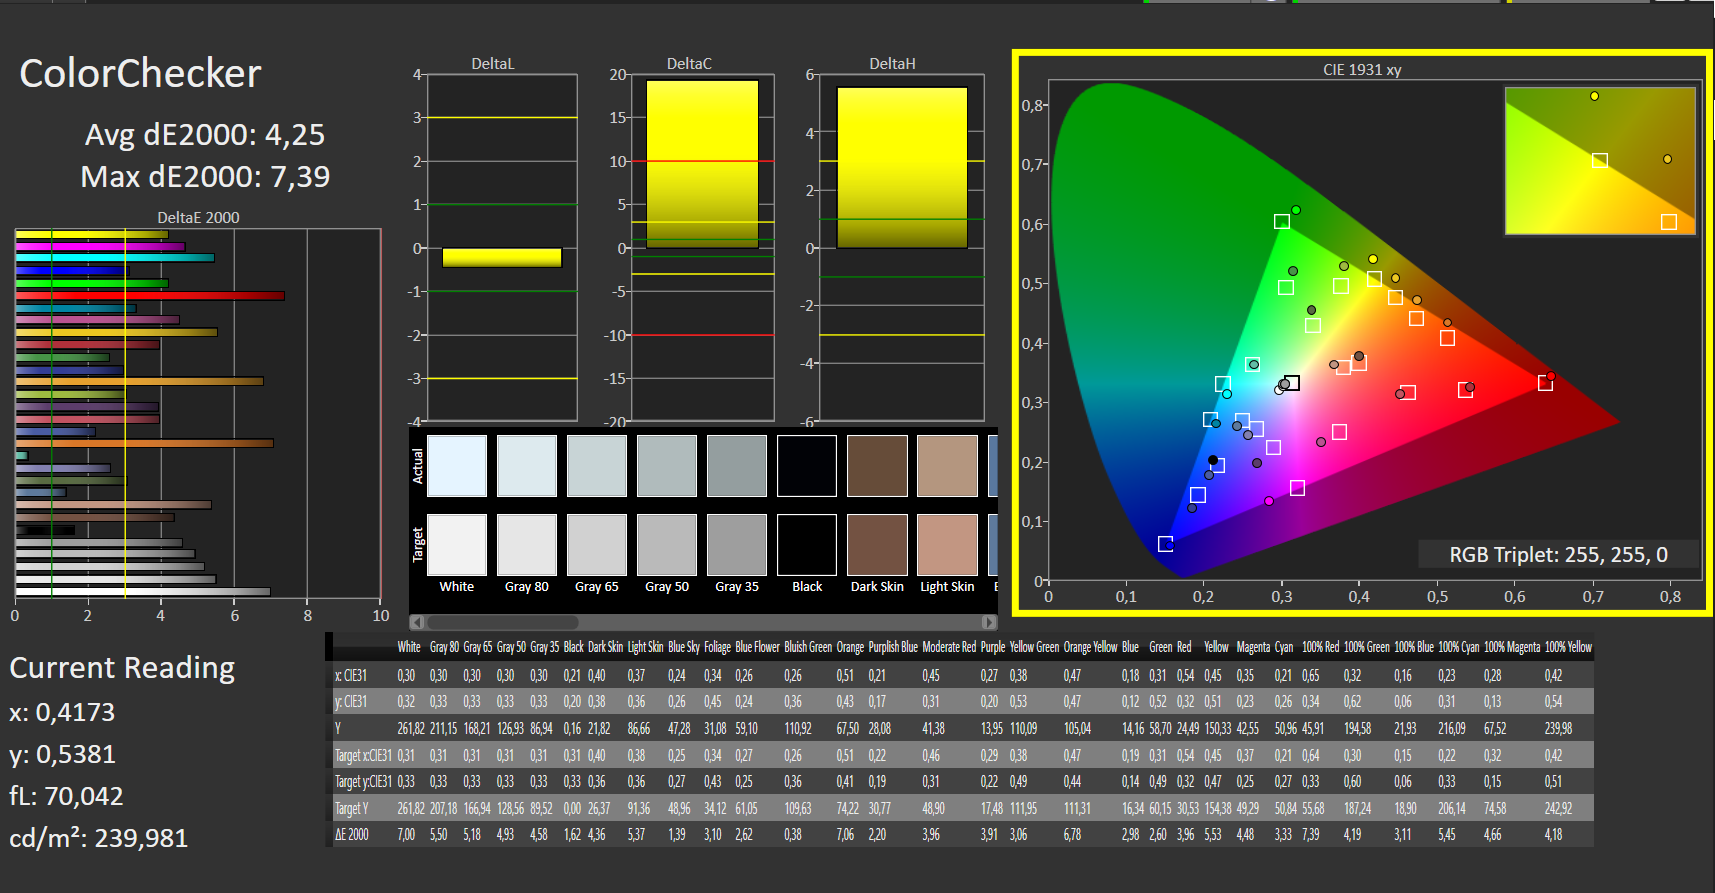
ΔE ColorChecker Calman: 4.25 | ∀{0.5-29.43 Ø4.72}
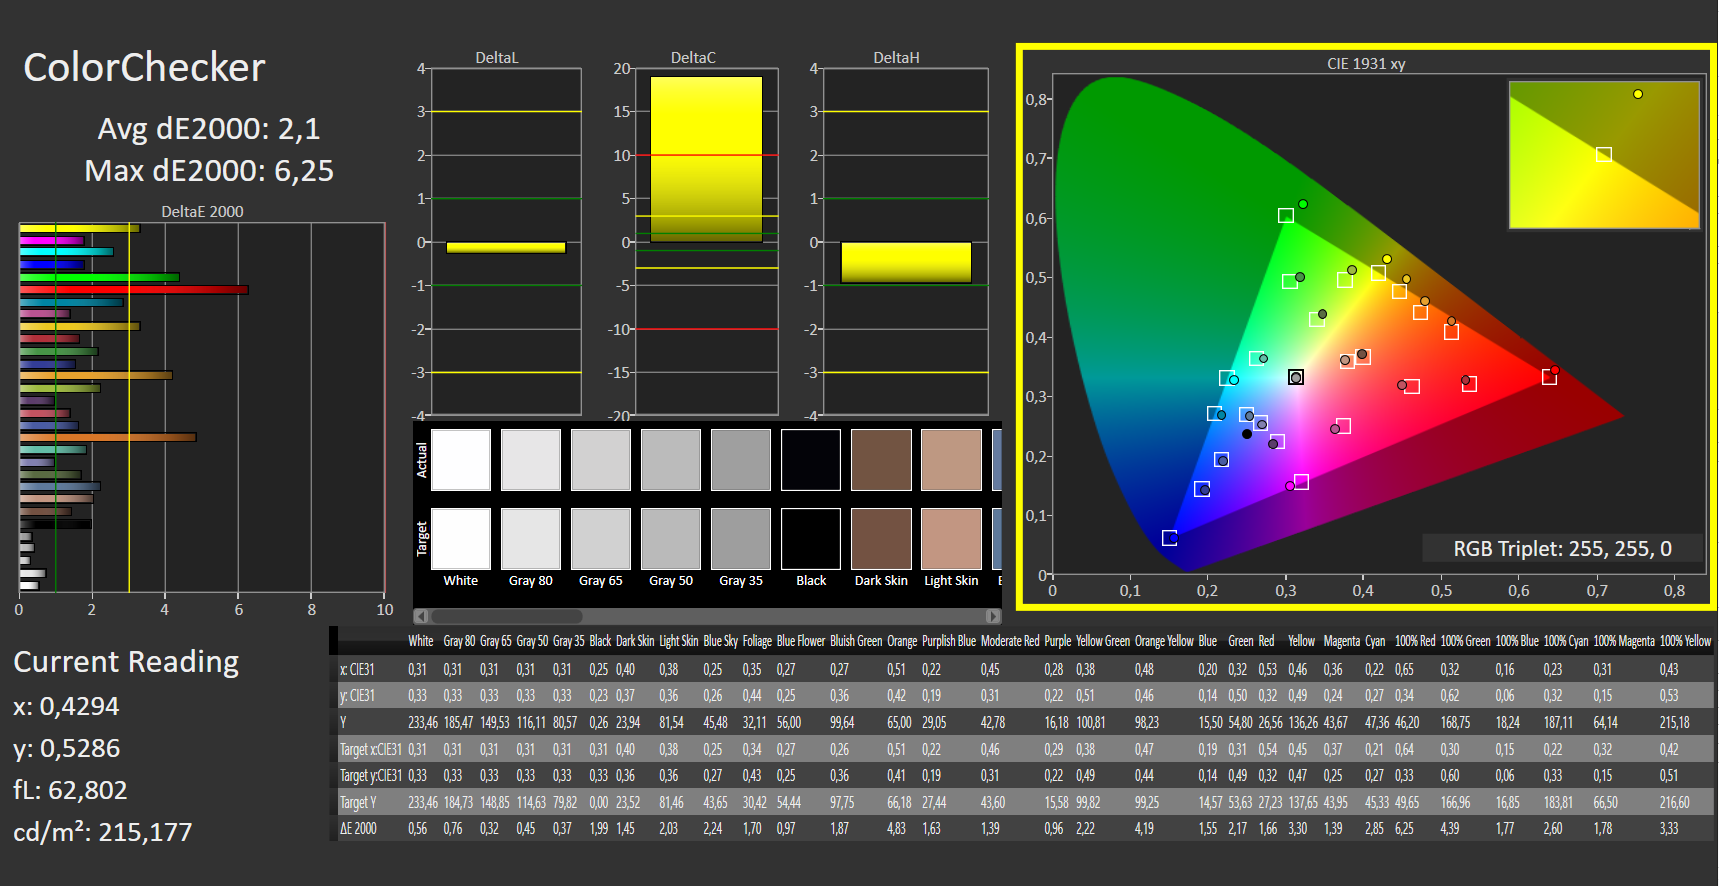
calibrated: 2.1
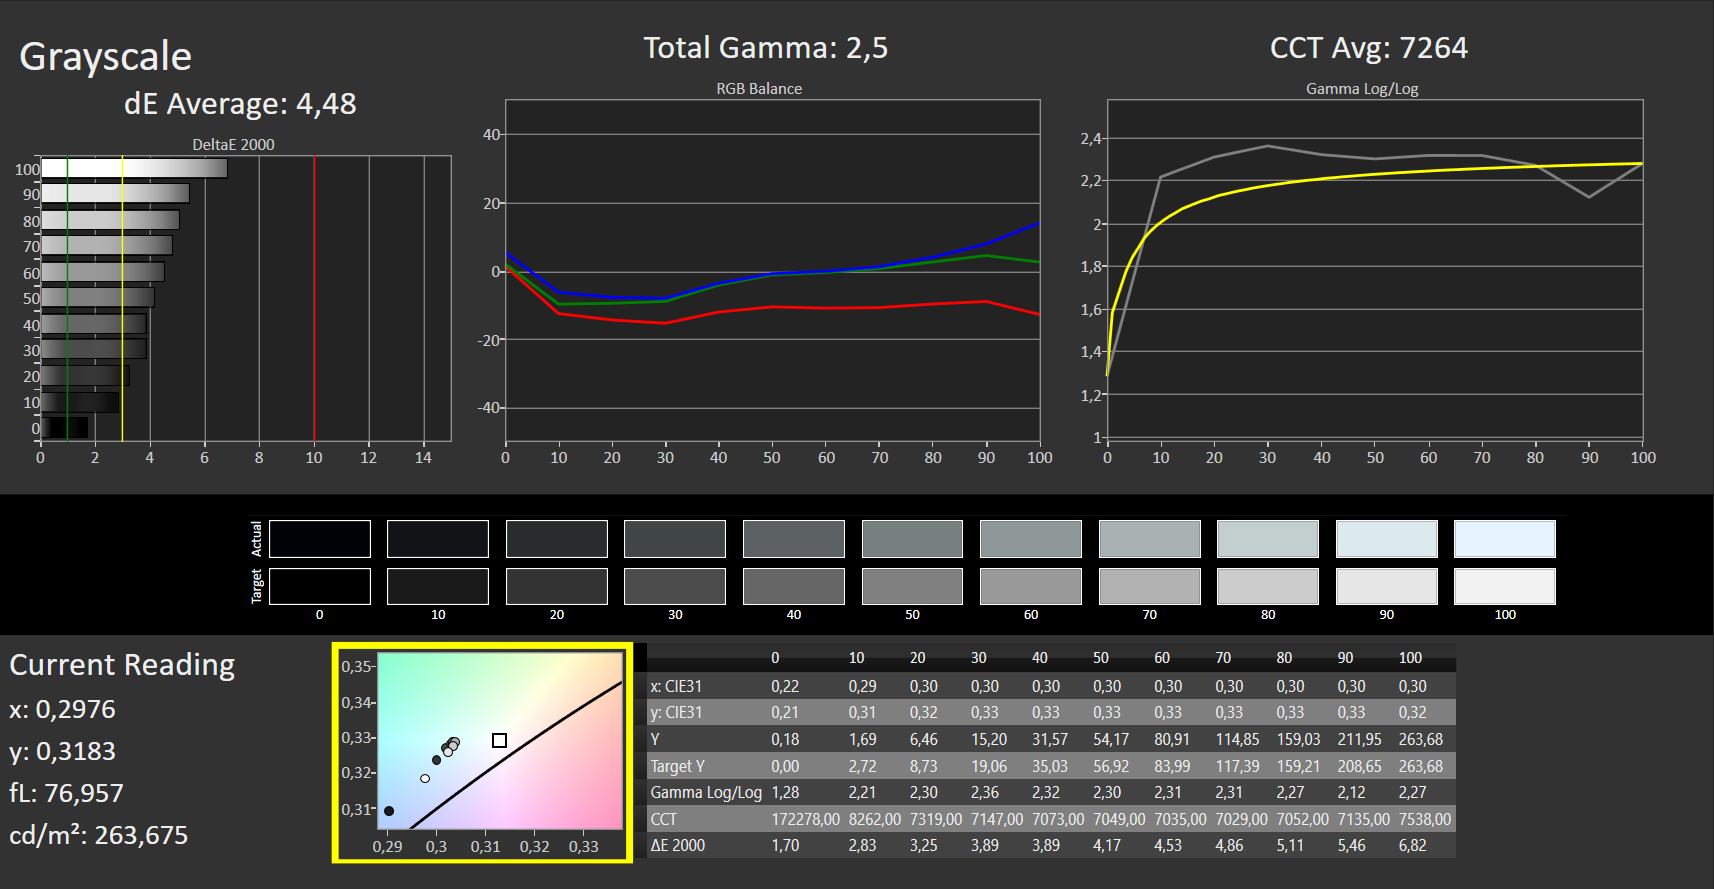
ΔE Greyscale Calman: 4.48 | ∀{0.09-98 Ø4.97}
86.7% sRGB (Argyll 1.6.3 3D)
56.8% AdobeRGB 1998 (Argyll 1.6.3 3D)
63.2% AdobeRGB 1998 (Argyll 3D)
86.9% sRGB (Argyll 3D)
63.4% Display P3 (Argyll 3D)
Gamma: 2.5
CCT: 7264 K
| Acer Aspire 3 A317-51G-72MD BOE CQ NV173FHM-N41, IPS, 1920x1080, 17.3" | HP 470 G7 8VU24EA BOE 077B, IPS, 1920x1080, 17.3" | Lenovo Ideapad L340-17API-81LY0004GE AU Optronics B173RTN02.1, TN LED, 1600x900, 17.3" | Asus VivoBook 17 F712FA-AU518T BOE NV173FHM-N49, IPS, 1920x1080, 17.3" | |
|---|---|---|---|---|
| Display | 7% | -17% | -36% | |
| Display P3 Coverage (%) | 63.4 | 69.1 9% | 51.1 -19% | 39.03 -38% |
| sRGB Coverage (%) | 86.9 | 92.3 6% | 73.9 -15% | 58.4 -33% |
| AdobeRGB 1998 Coverage (%) | 63.2 | 67.5 7% | 52.7 -17% | 40.32 -36% |
| Response Times | -67% | -7% | 9% | |
| Response Time Grey 50% / Grey 80% * (ms) | 29 ? | 42 ? -45% | 42 ? -45% | 24 ? 17% |
| Response Time Black / White * (ms) | 16 ? | 30 ? -88% | 11 ? 31% | 16 ? -0% |
| PWM Frequency (Hz) | 2500 ? | 250 | ||
| Screen | -9% | -80% | -39% | |
| Brightness middle (cd/m²) | 261 | 280 7% | 230 -12% | 288 10% |
| Brightness (cd/m²) | 258 | 281 9% | 201 -22% | 262 2% |
| Brightness Distribution (%) | 81 | 83 2% | 78 -4% | 83 2% |
| Black Level * (cd/m²) | 0.17 | 0.29 -71% | 0.46 -171% | 0.24 -41% |
| Contrast (:1) | 1535 | 966 -37% | 500 -67% | 1200 -22% |
| Colorchecker dE 2000 * | 4.25 | 4.18 2% | 10.36 -144% | 6.14 -44% |
| Colorchecker dE 2000 max. * | 7.39 | 7.59 -3% | 18.63 -152% | 18.55 -151% |
| Colorchecker dE 2000 calibrated * | 2.1 | 2 5% | 4.6 -119% | |
| Greyscale dE 2000 * | 4.48 | 5.63 -26% | 13.32 -197% | 4.55 -2% |
| Gamma | 2.5 88% | 2.44 90% | 2.54 87% | 2.37 93% |
| CCT | 7264 89% | 6801 96% | 14124 46% | 7161 91% |
| Color Space (Percent of AdobeRGB 1998) (%) | 56.8 | 60 6% | 48 -15% | 37 -35% |
| Color Space (Percent of sRGB) (%) | 86.7 | 92 6% | 74 -15% | 58.1 -33% |
| Total Average (Program / Settings) | -23% /
-13% | -35% /
-58% | -22% /
-33% |
* ... smaller is better
Display Response Times
| ↔ Response Time Black to White | ||
|---|---|---|
| 16 ms ... rise ↗ and fall ↘ combined | ↗ 8 ms rise | 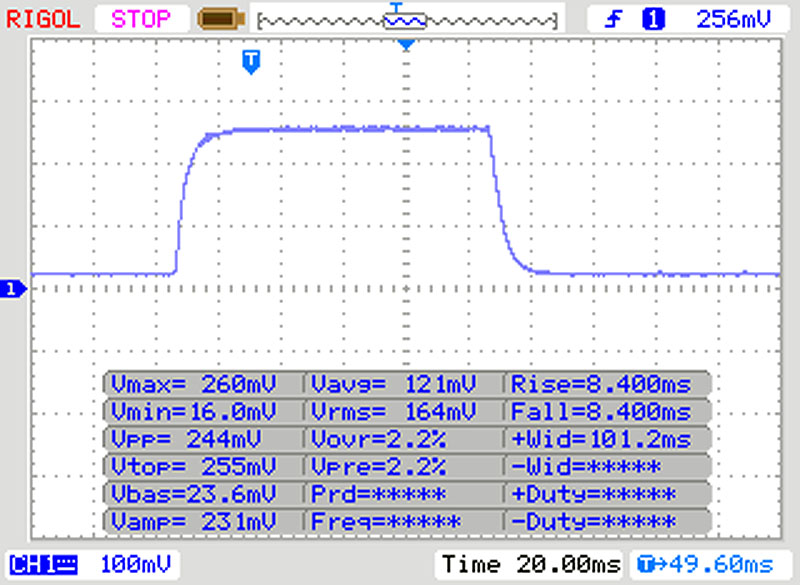 |
| ↘ 8 ms fall | ||
| The screen shows good response rates in our tests, but may be too slow for competitive gamers. In comparison, all tested devices range from 0.1 (minimum) to 240 (maximum) ms. » 37 % of all devices are better. This means that the measured response time is better than the average of all tested devices (19.8 ms). | ||
| ↔ Response Time 50% Grey to 80% Grey | ||
| 29 ms ... rise ↗ and fall ↘ combined | ↗ 14 ms rise | 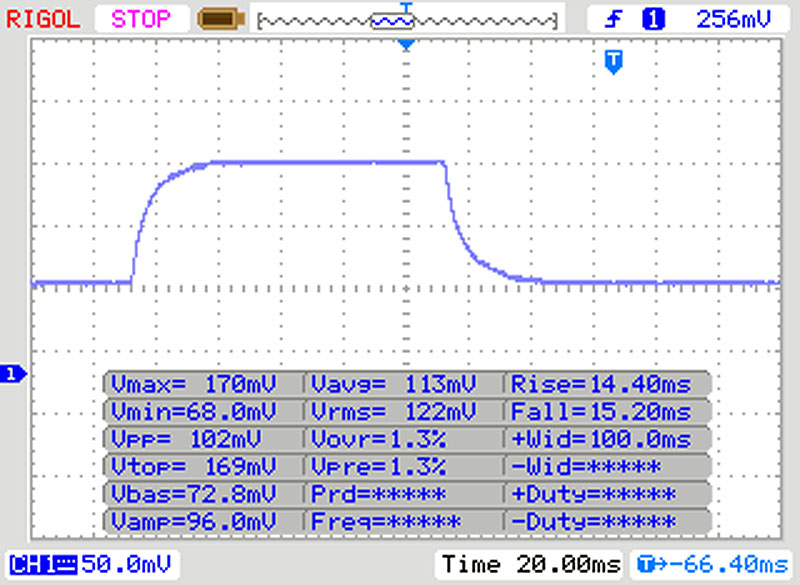 |
| ↘ 15 ms fall | ||
| The screen shows relatively slow response rates in our tests and may be too slow for gamers. In comparison, all tested devices range from 0.165 (minimum) to 636 (maximum) ms. » 39 % of all devices are better. This means that the measured response time is similar to the average of all tested devices (31 ms). | ||
Screen Flickering / PWM (Pulse-Width Modulation)
| Screen flickering / PWM detected | 2500 Hz | ≤ 90 % brightness setting | 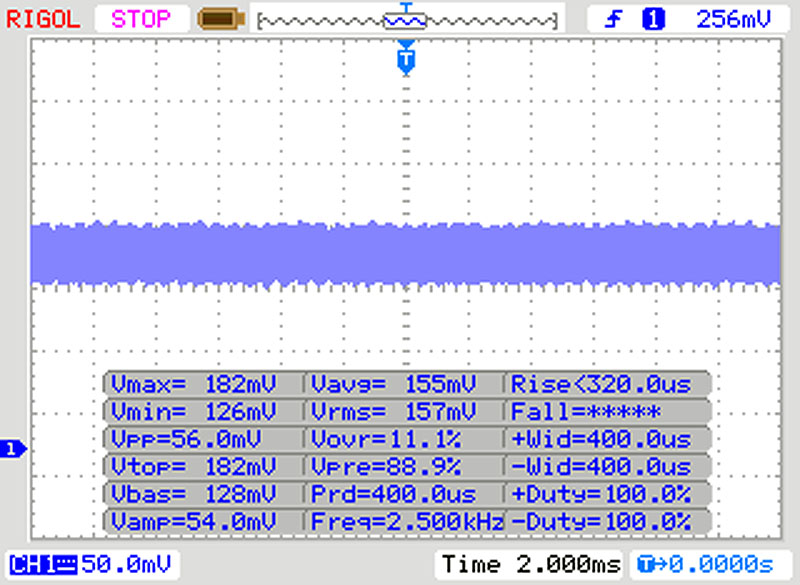 |
The display backlight flickers at 2500 Hz (worst case, e.g., utilizing PWM) Flickering detected at a brightness setting of 90 % and below. There should be no flickering or PWM above this brightness setting. The frequency of 2500 Hz is quite high, so most users sensitive to PWM should not notice any flickering. In comparison: 52 % of all tested devices do not use PWM to dim the display. If PWM was detected, an average of 7750 (minimum: 5 - maximum: 343500) Hz was measured. | |||
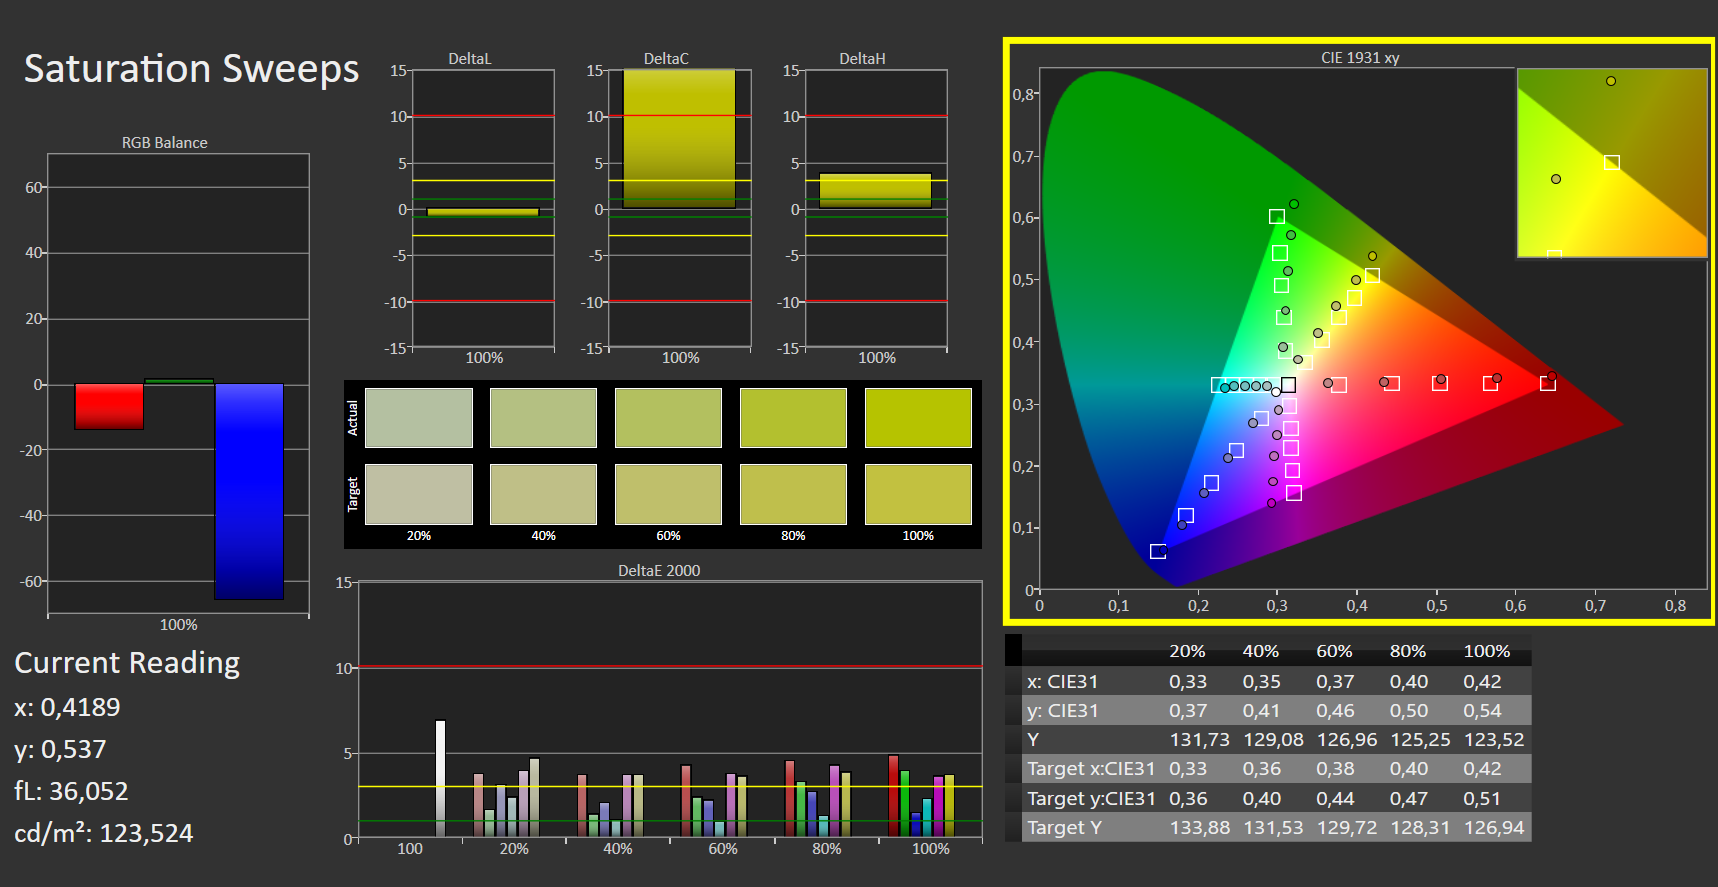
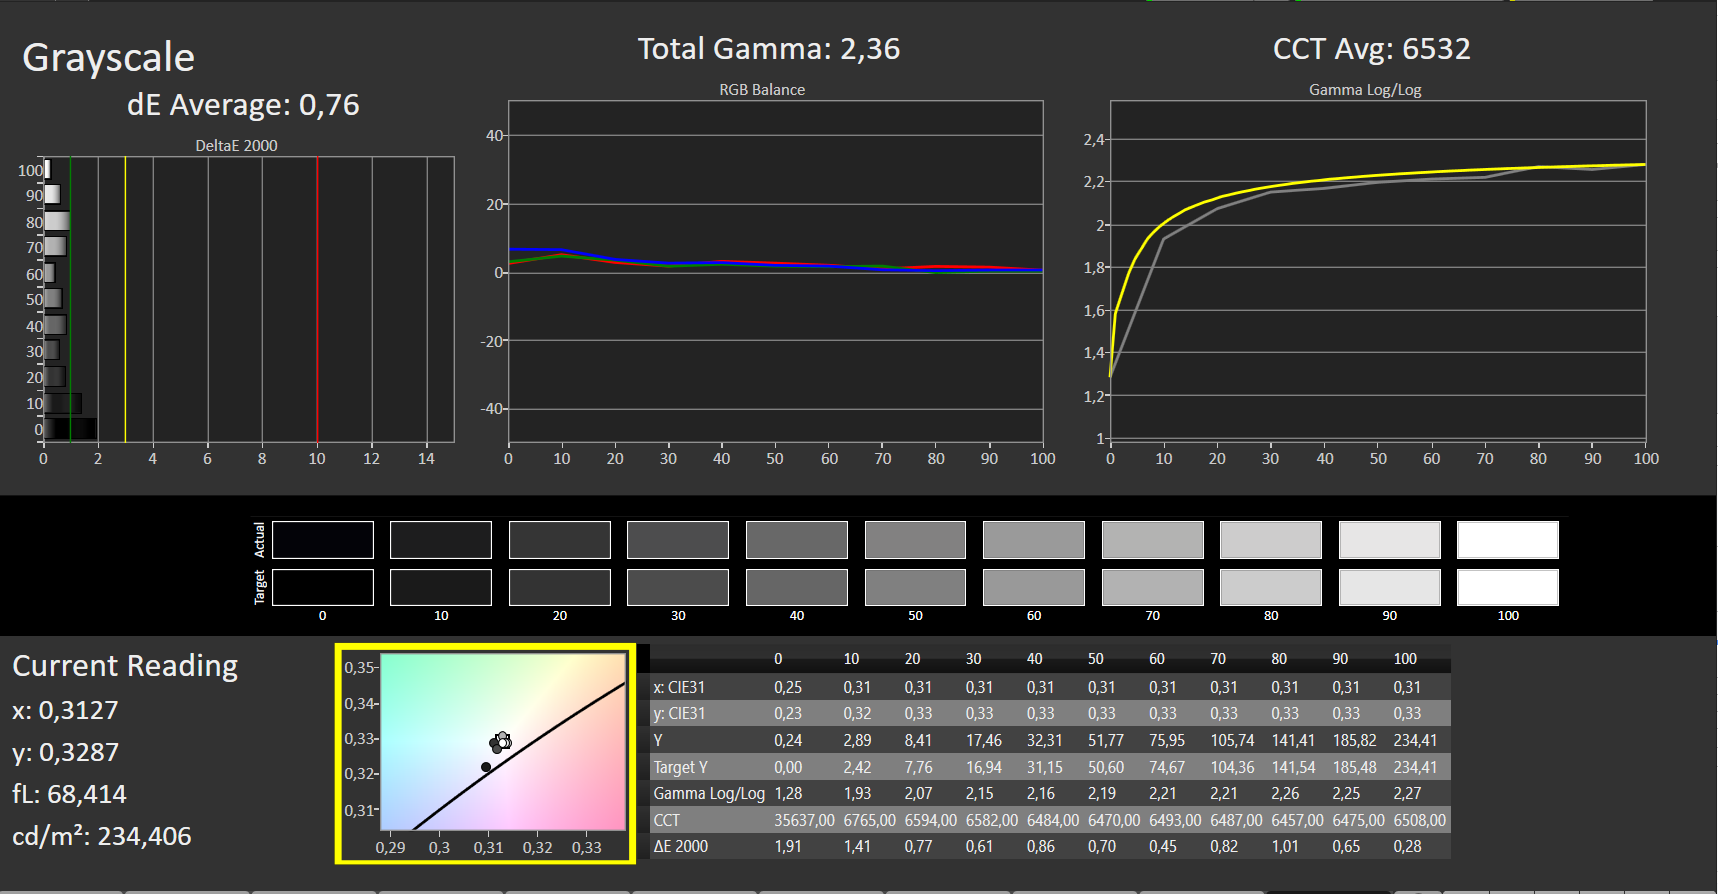
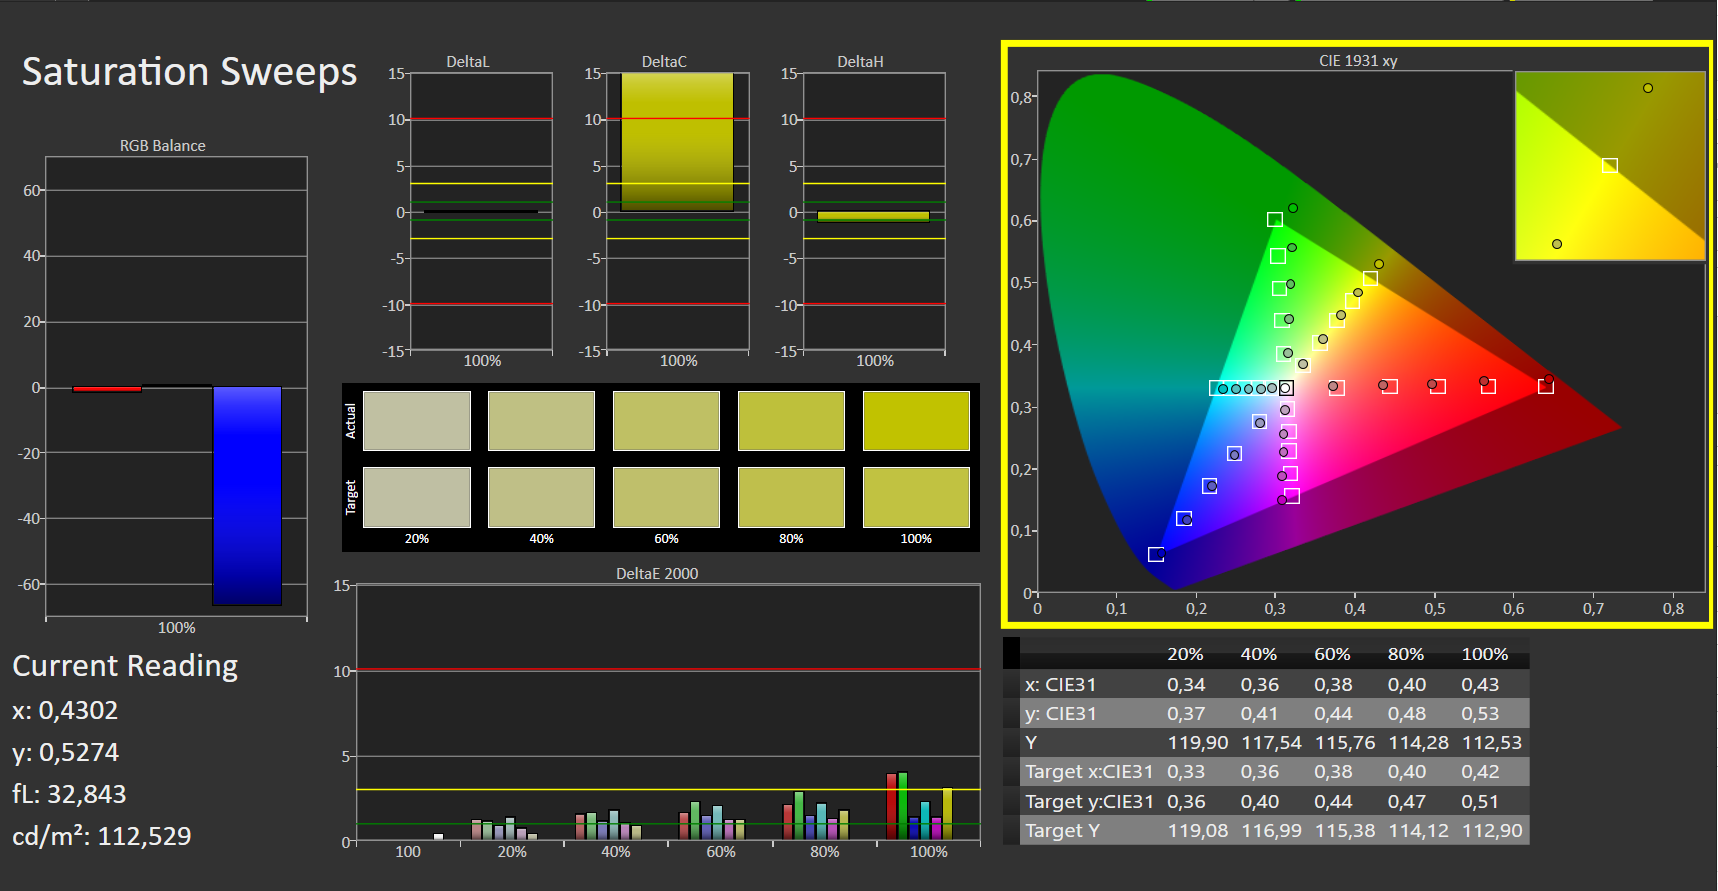
Out of the box, the display shows a very decent color reproduction. With a Delta E 2000 color deviation of just under 4.3, however, the target (Delta E less than 3) is missed. Moreover, the display doesn't suffer from a blue tint. Calibration leads to improvements, and as a result, the color deviation is reduced to 2.1, and the grayscales are displayed in a much more balanced way. The AdobeRGB (56.8%) and sRGB (86.7%) color spaces aren't fully reproduced.
Acer has installed a viewing-angle-stable IPS panel. Consequently, the screen can be read from any position. The screen can be read outdoors when the sun is not too bright.
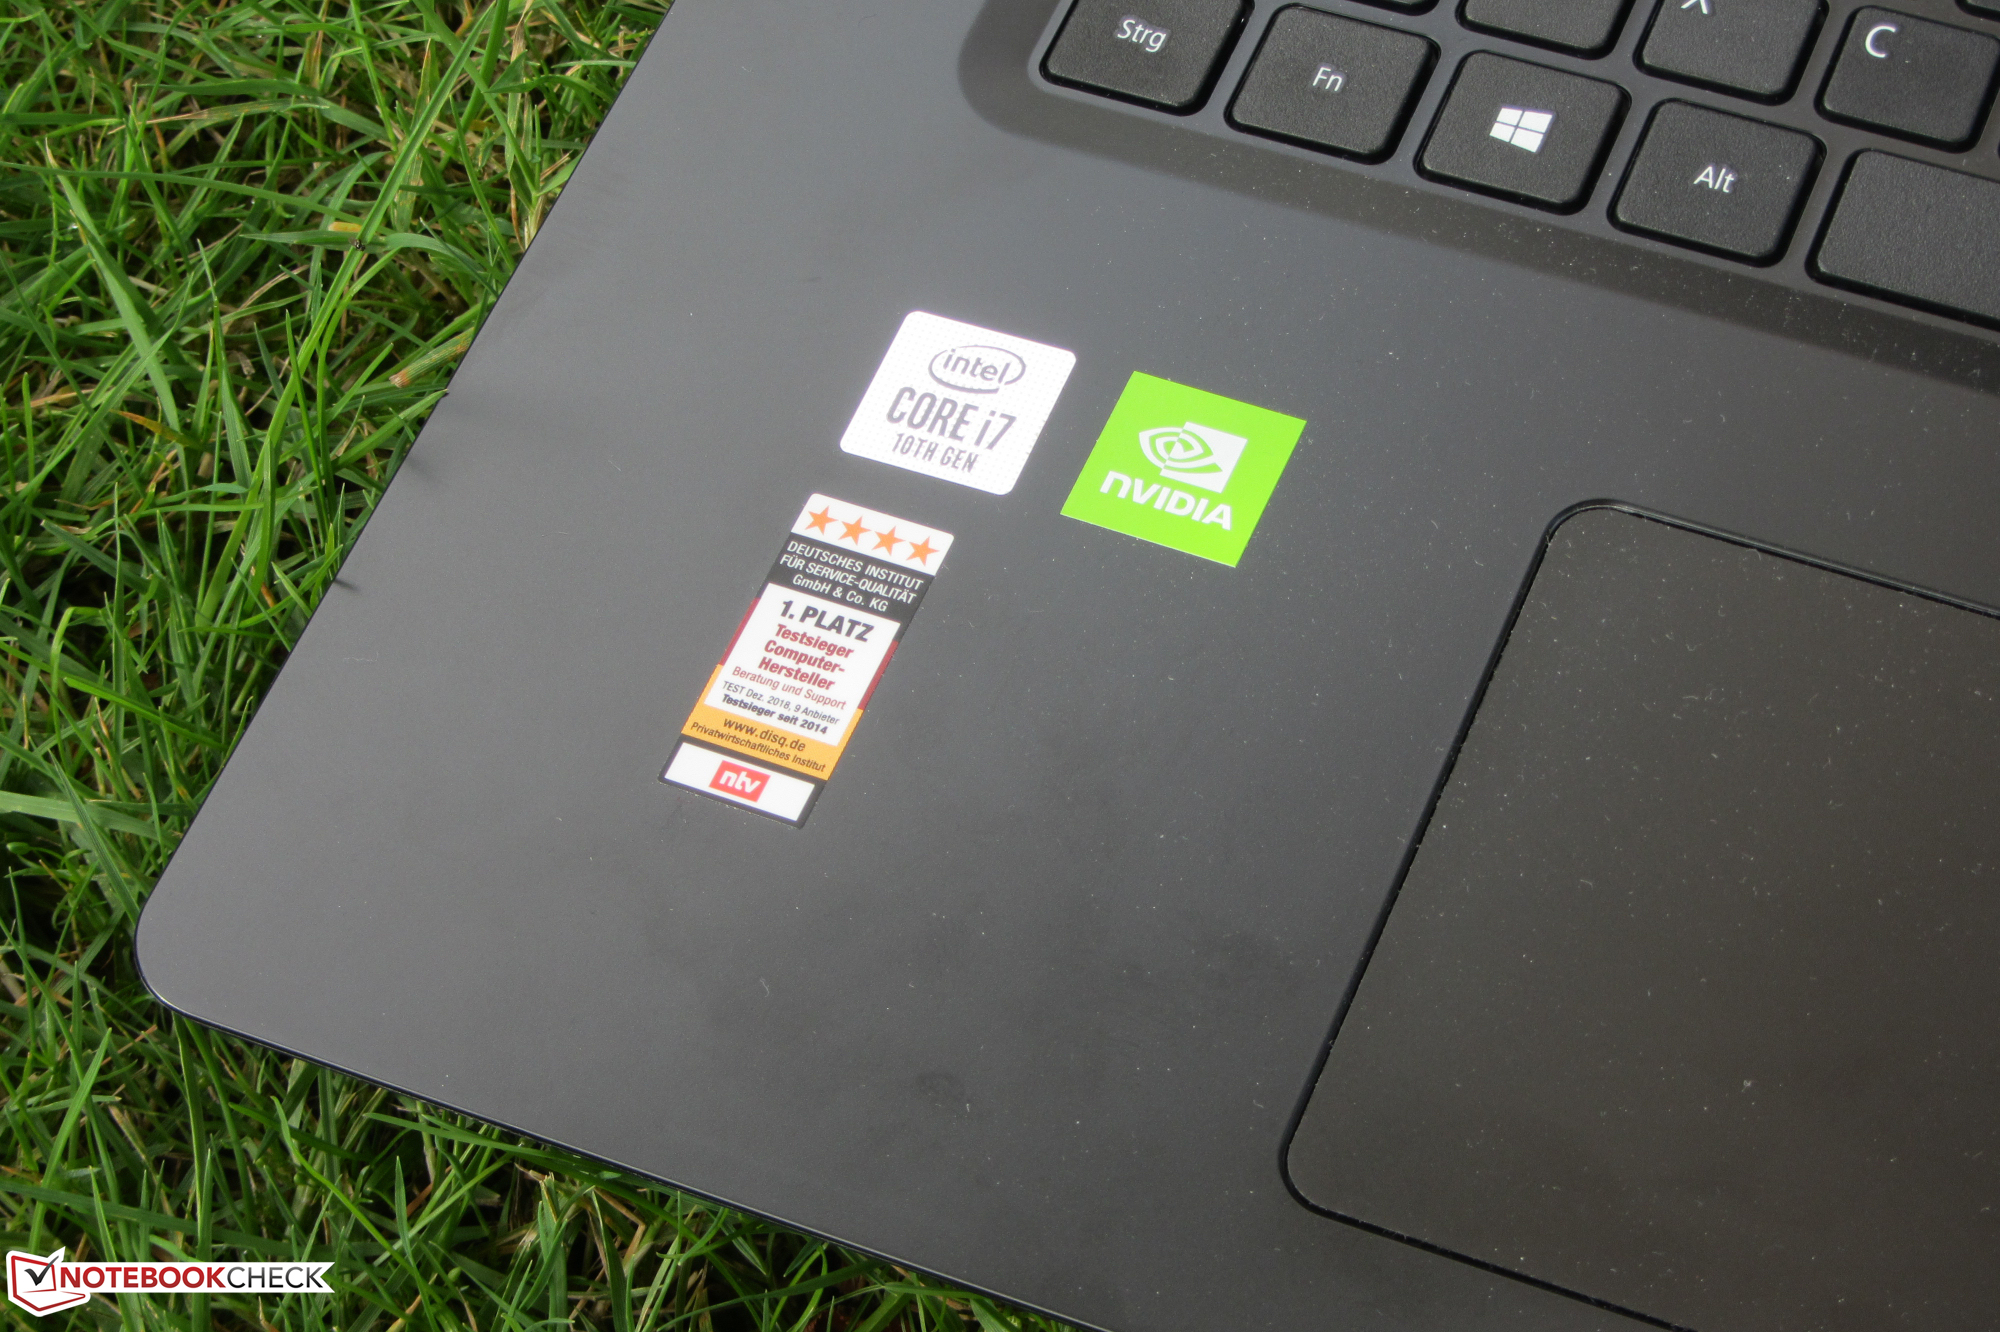
Performance - Acer installs mid-range hardware
Acer's 17.3-inch multimedia all-rounder offers enough computing power for office and Internet applications. The dedicated graphics core allows playing computer games to a limited extent. Moreover, our test device is available for about 1,000 Euros ($1,185). Other configuration variants are available as well.
Processor
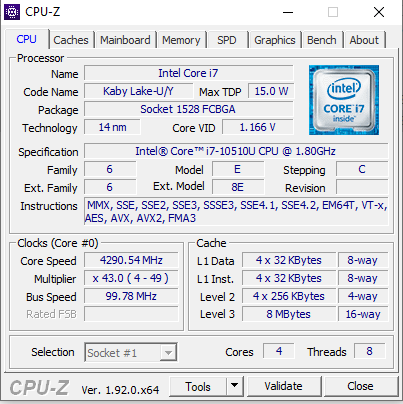
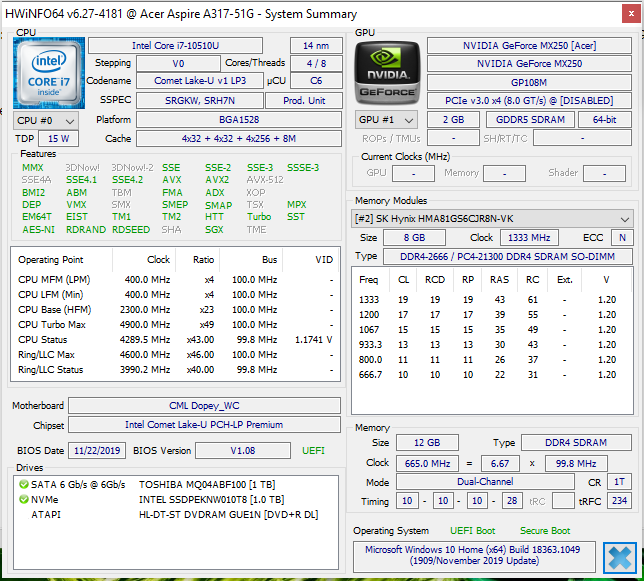
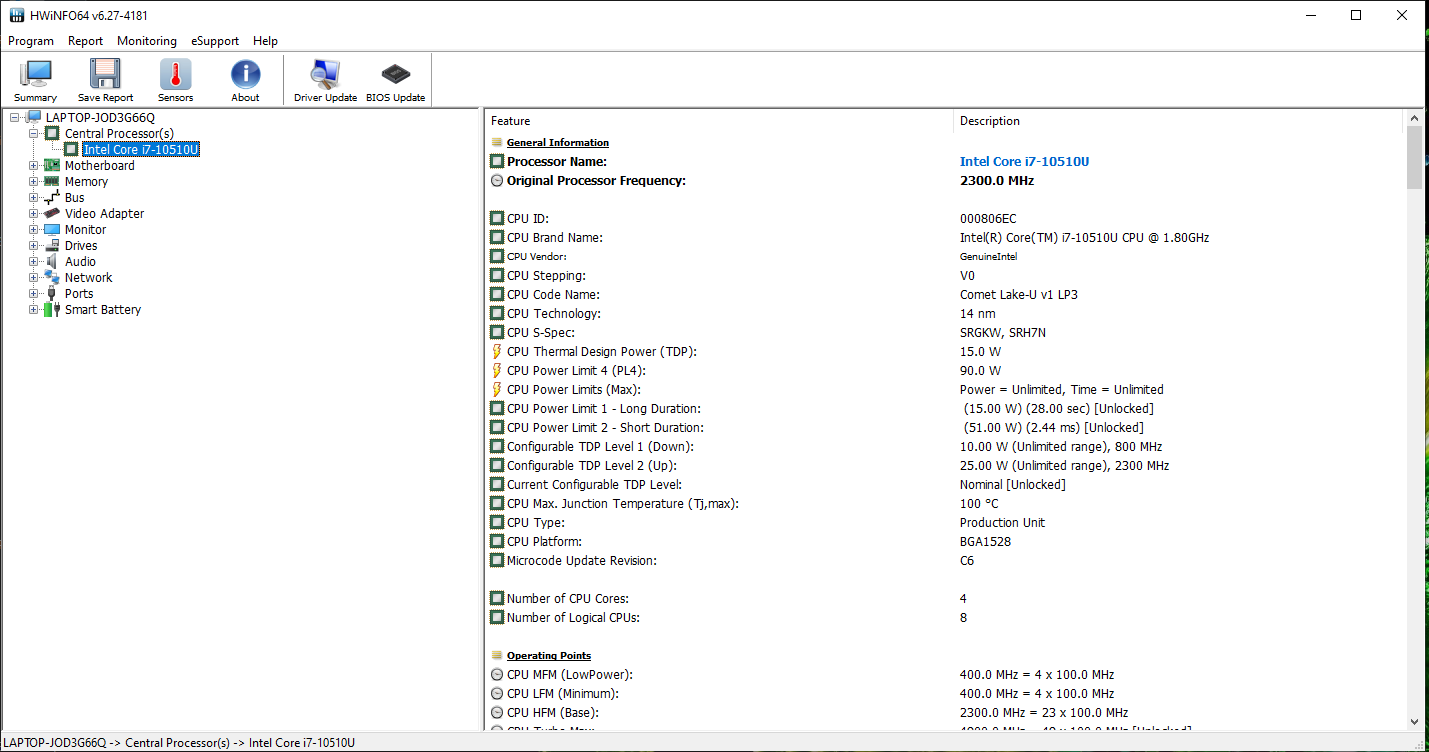
Acer has equipped the A317 with a Core i7-10510U quad-core processor (Comet Lake). The CPU operates at a base speed of 1.8 GHz. An increase to 4.3 GHz (four cores) or 4.9 GHz (one core) is possible via Turbo.
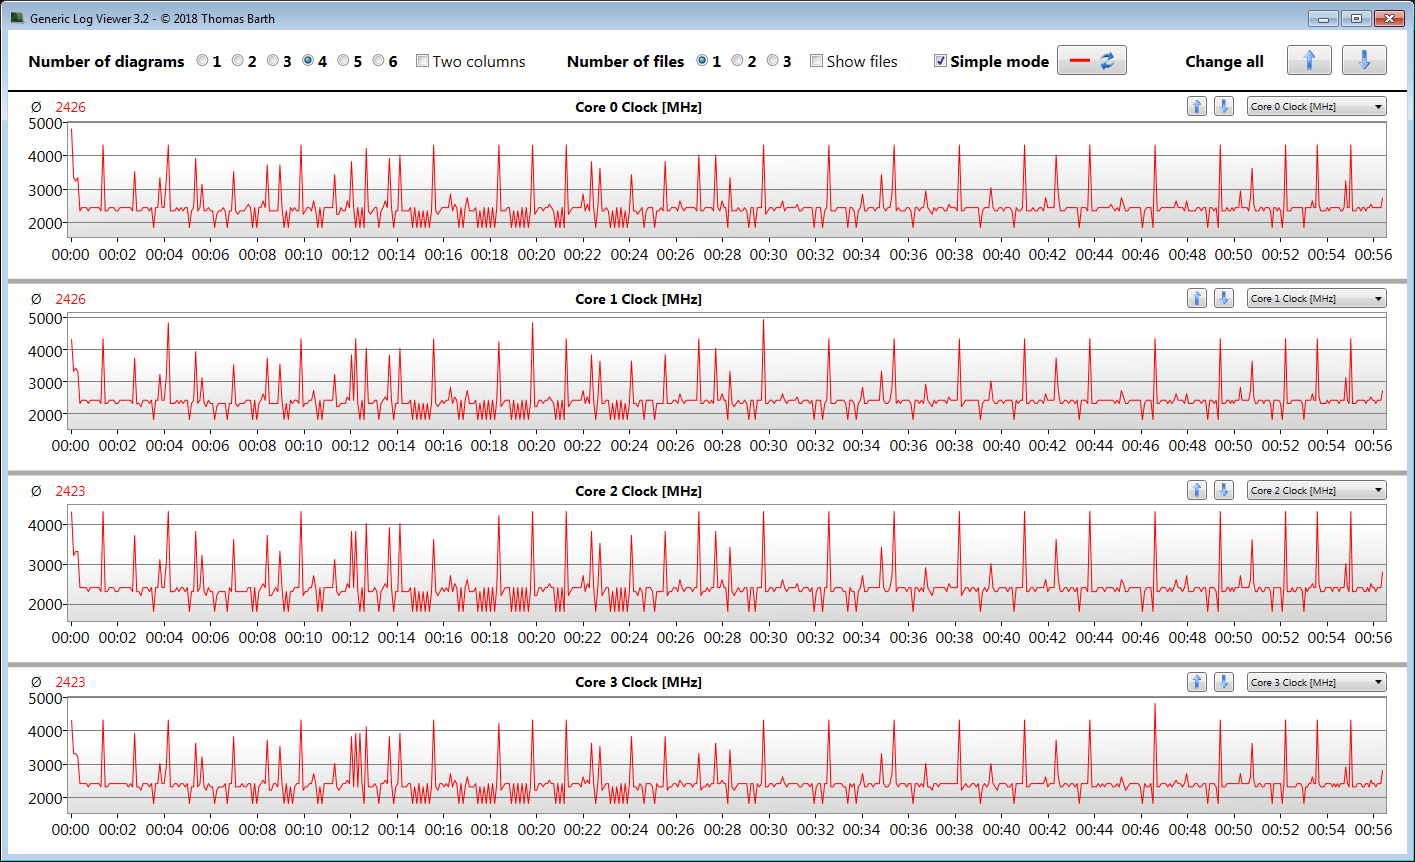
The multithread tests of the Cinebench benchmarks are processed at 3.2 to 3.4 GHz for a short time. The clock rate then drops to between 2.3 and 2.4 GHz. The single-thread tests are run at 3.9 to 4.1 GHz. On battery power, the clock rates are 2.2 to 2.4 GHz (multithread) and 2.3 to 3.9 GHz (single-thread), respectively.
We verify if the CPU Turbo is also consistently used when plugged in by running the Cinebench R15 benchmark's multithread test in a continuous loop for at least 30 minutes. Turbo is used to a relatively low extent.
All in all, the CPU falls short of its potential, since Acer has set the Power Limit 1 value very low at 15 watts (PL2: 51 watts). As a result, the CPU Turbo speeds can only be reached briefly. For comparison: The Asus VivoBook 17's Core i5 processor achieves consistently higher Turbo speeds due to its 40-watt limit (PL1).
* ... smaller is better
System performance
The system is fast and smooth. The built-in hardware can handle office and Internet applications and - to a limited extent - computer games as well. The PCMark results are good.
| PCMark 8 Home Score Accelerated v2 | 3538 points | |
| PCMark 8 Creative Score Accelerated v2 | 3604 points | |
| PCMark 8 Work Score Accelerated v2 | 5068 points | |
| PCMark 10 Score | 4097 points | |
Help | ||
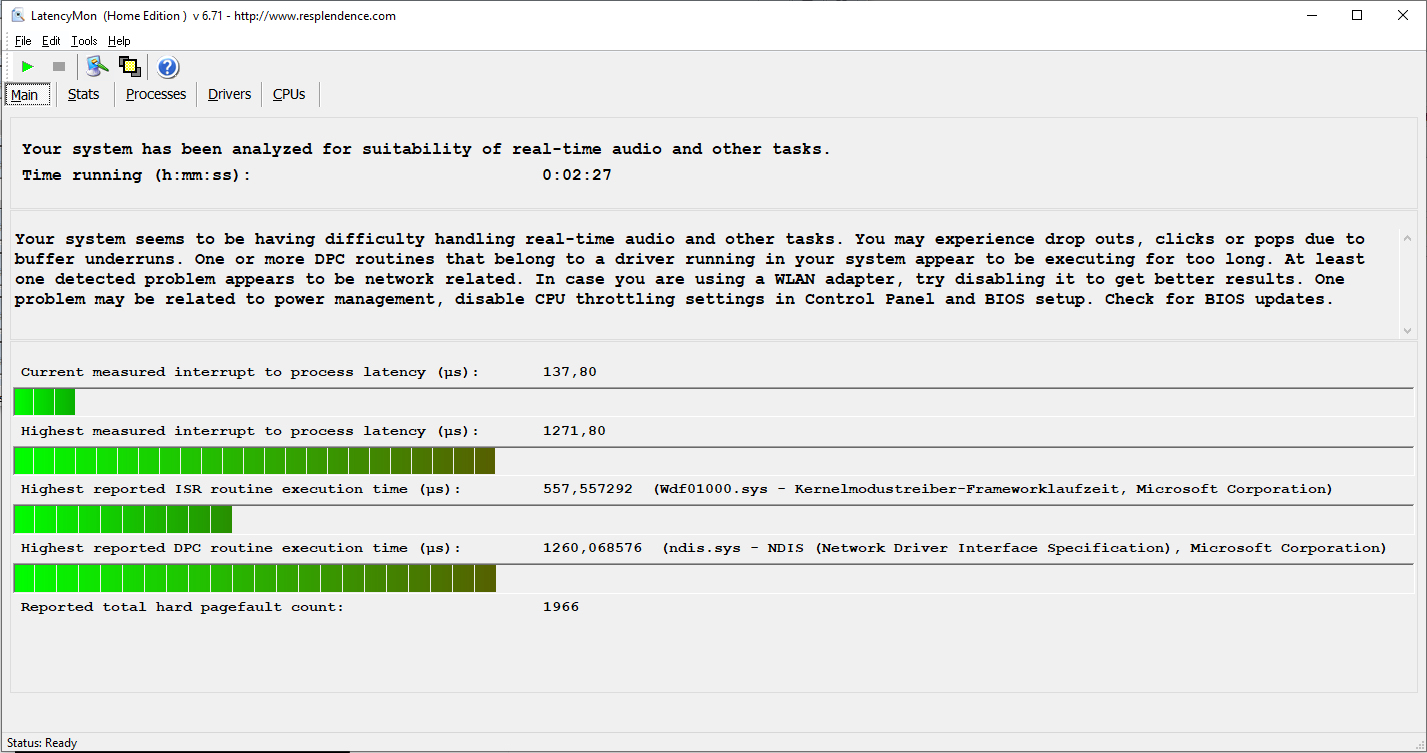
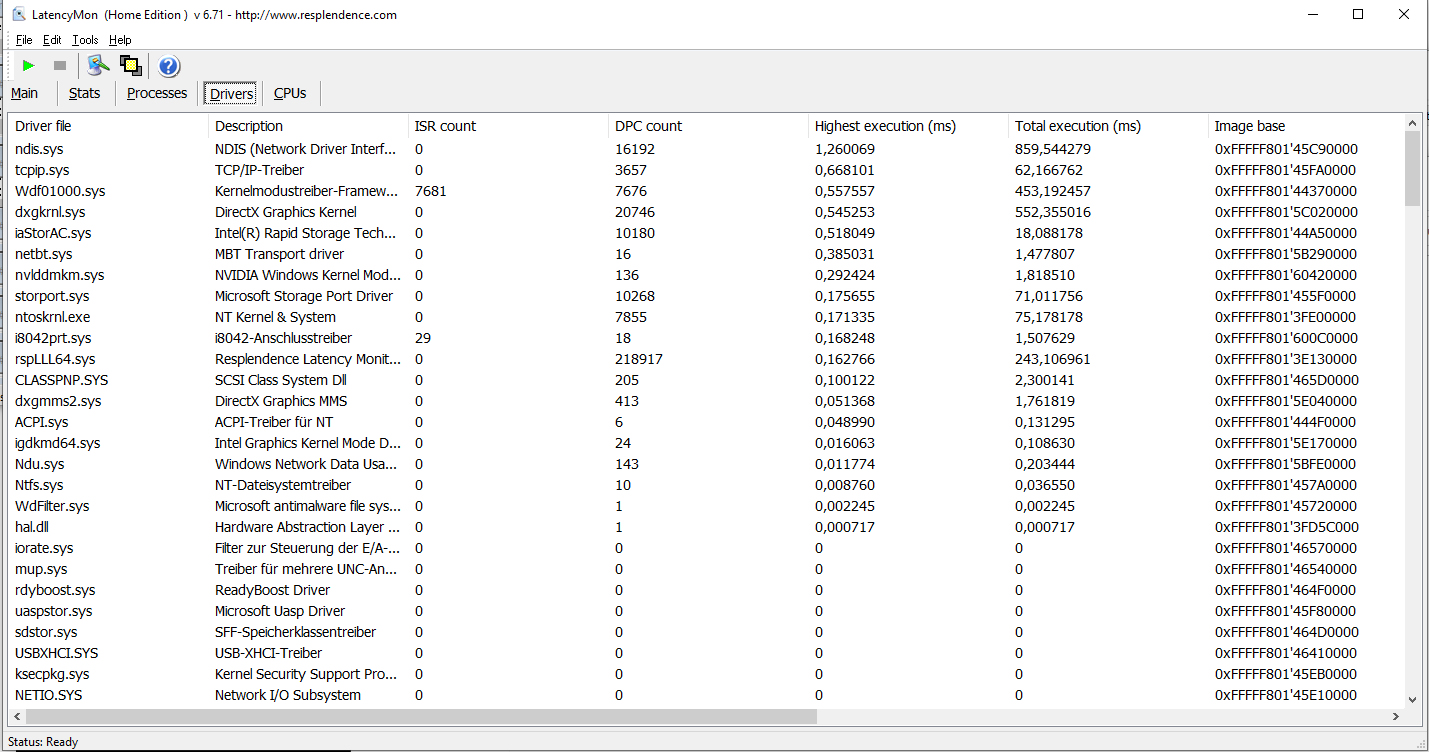
DPC latencies
In our standardized latency monitor test (web surfing, 4K video playback, high-load Prime95), we could observe issues with the DPC latencies. The system doesn't seem to be suitable for real-time video and audio-editing.
| DPC Latencies / LatencyMon - interrupt to process latency (max), Web, Youtube, Prime95 | |
| Asus VivoBook 17 F712FA-AU518T | |
| HP 470 G7 8VU24EA | |
| Acer Aspire 3 A317-51G-72MD | |
* ... smaller is better
Storage
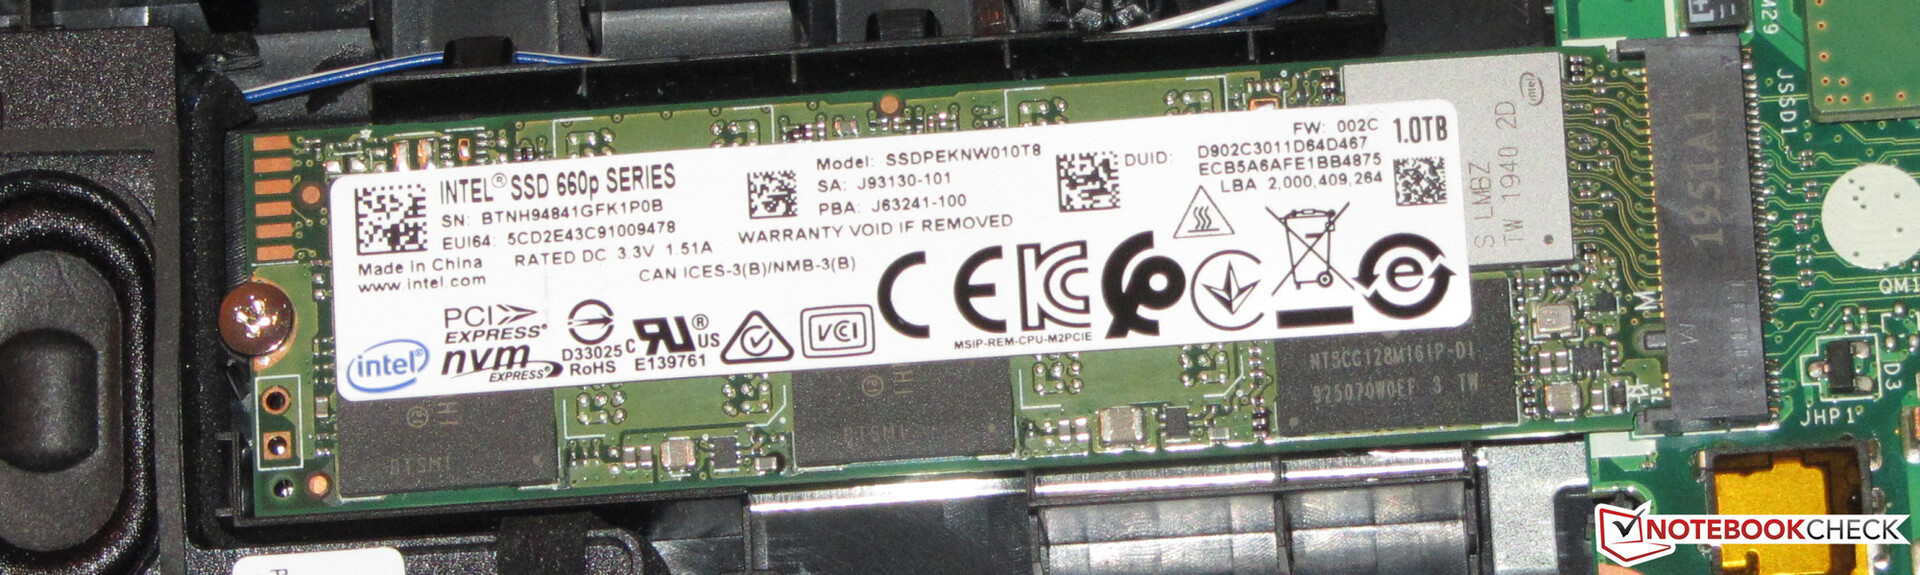
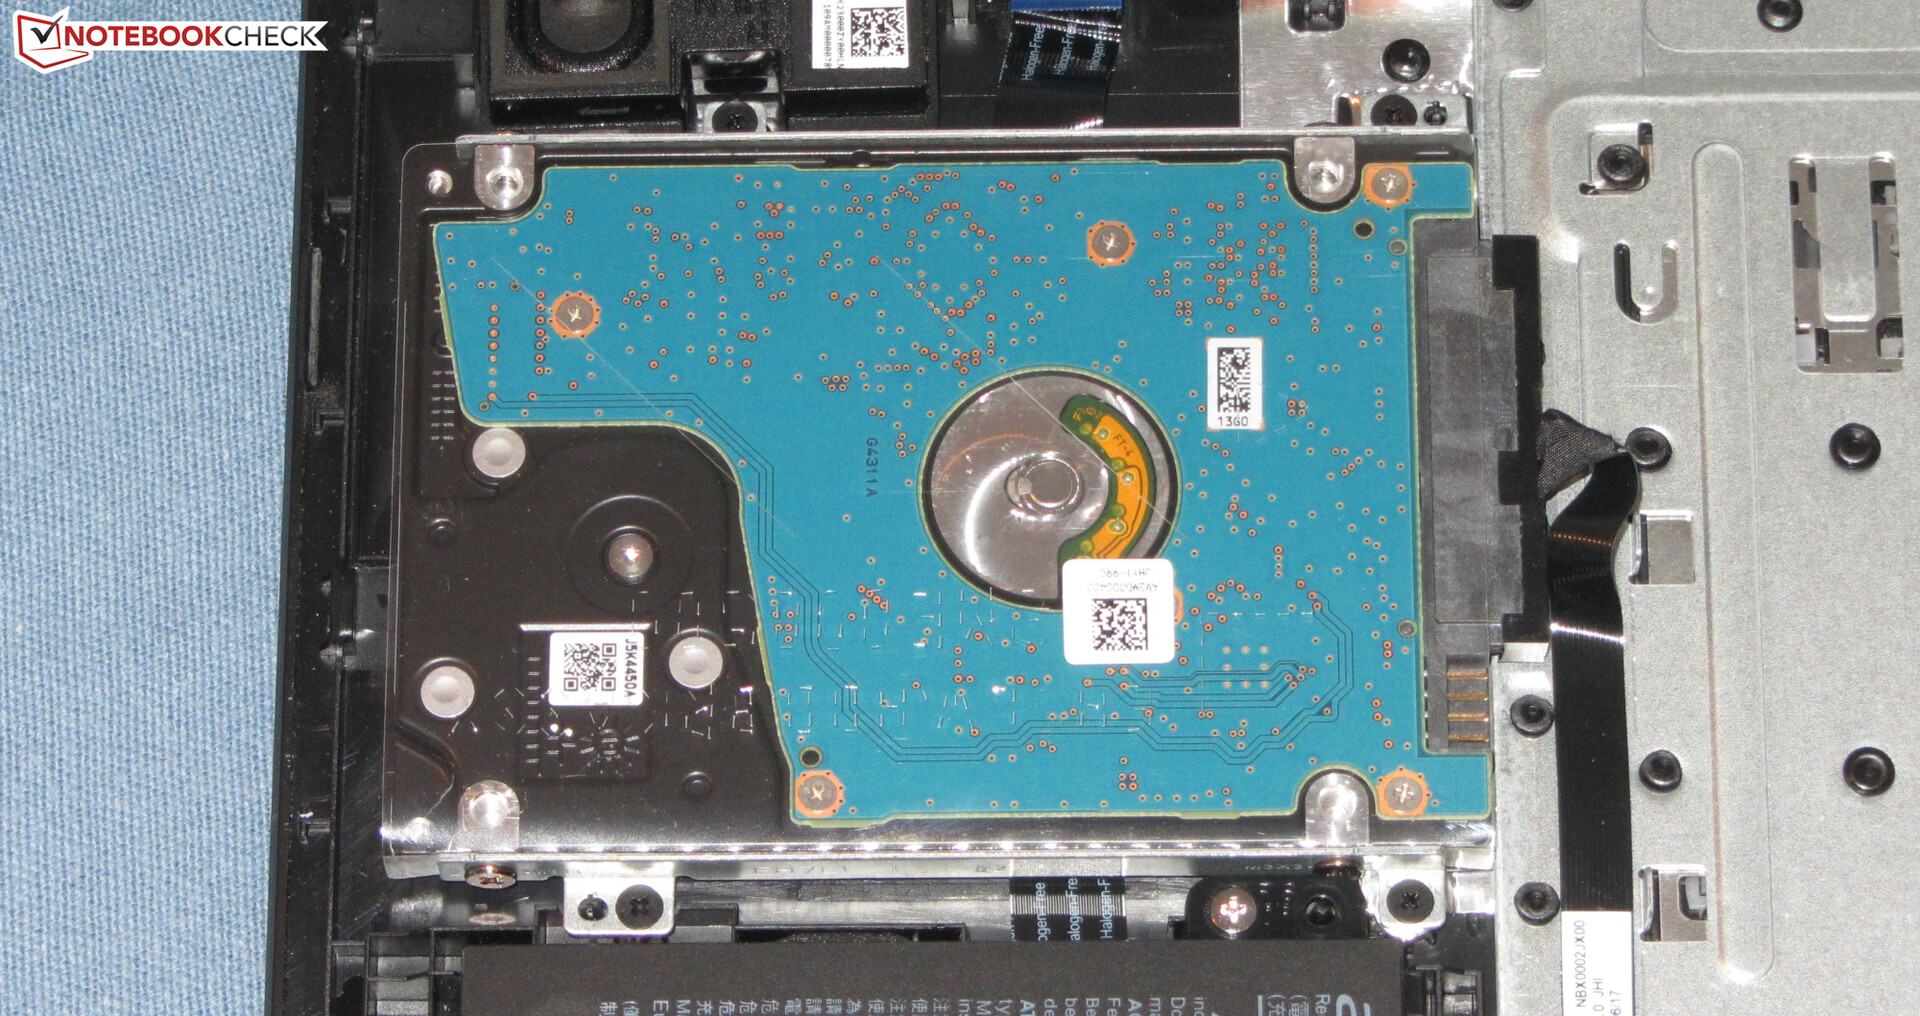
The system drive is a 1 TB NVMe SSD (M.2 2280) from Intel that provides good transfer rates. It's not one of the fastest SSDs, though. In addition, there's a 2.5-inch hard drive (1 TB, 5,400 rpm) on board.

| Acer Aspire 3 A317-51G-72MD Intel SSD 660p 1TB SSDPEKNW010T8 | HP 470 G7 8VU24EA WDC PC SN520 SDAPNUW-512G | Lenovo Ideapad L340-17API-81LY0004GE Samsung SSD PM871b MZ7LN256HAJQ | Asus VivoBook 17 F712FA-AU518T Intel SSD 660p SSDPEKNW512G8 | Average Intel SSD 660p 1TB SSDPEKNW010T8 | Average of class Multimedia | |
|---|---|---|---|---|---|---|
| CrystalDiskMark 5.2 / 6 | -12% | -59% | -16% | -10% | 72% | |
| Write 4K (MB/s) | 185.3 | 190.6 3% | 94.4 -49% | 180.3 -3% | 144.5 ? -22% | 163.8 ? -12% |
| Read 4K (MB/s) | 62.7 | 49.01 -22% | 32.45 -48% | 62.1 -1% | 54.1 ? -14% | 68.1 ? 9% |
| Write Seq (MB/s) | 1681 | 1108 -34% | 482.8 -71% | 972 -42% | 1445 ? -14% | 2680 ? 59% |
| Read Seq (MB/s) | 1570 | 1077 -31% | 524 -67% | 1608 2% | 1446 ? -8% | 3133 ? 100% |
| Write 4K Q32T1 (MB/s) | 426.9 | 429.3 1% | 232 -46% | 397.4 -7% | 427 ? 0% | 457 ? 7% |
| Read 4K Q32T1 (MB/s) | 514 | 544 6% | 253.6 -51% | 343 -33% | 456 ? -11% | 583 ? 13% |
| Write Seq Q32T1 (MB/s) | 1738 | 1458 -16% | 496.5 -71% | 973 -44% | 1650 ? -5% | 4658 ? 168% |
| Read Seq Q32T1 (MB/s) | 1780 | 1734 -3% | 540 -70% | 1779 0% | 1728 ? -3% | 5868 ? 230% |
| AS SSD | 16% | -64% | -18% | -8% | 88% | |
| Seq Read (MB/s) | 1753 | 1531 -13% | 489.9 -72% | 1679 -4% | 1456 ? -17% | 4496 ? 156% |
| Seq Write (MB/s) | 1584 | 1379 -13% | 472.2 -70% | 910 -43% | 1404 ? -11% | 3066 ? 94% |
| 4K Read (MB/s) | 52.3 | 43.09 -18% | 29.14 -44% | 56.1 7% | 48.7 ? -7% | 61.6 ? 18% |
| 4K Write (MB/s) | 124.3 | 130.2 5% | 59.8 -52% | 153.6 24% | 131.6 ? 6% | 185.7 ? 49% |
| 4K-64 Read (MB/s) | 592 | 1040 76% | 262.2 -56% | 324.4 -45% | 586 ? -1% | 1080 ? 82% |
| 4K-64 Write (MB/s) | 828 | 1138 37% | 236.2 -71% | 792 -4% | 788 ? -5% | 2231 ? 169% |
| Access Time Read * (ms) | 0.058 | 0.085 | 0.088 | 0.07236 ? | 0.06007 ? | |
| Access Time Write * (ms) | 0.04 | 0.029 27% | 0.061 -53% | 0.046 -15% | 0.07731 ? -93% | 0.07561 ? -89% |
| Score Read (Points) | 819 | 1236 51% | 342 -58% | 548 -33% | 780 ? -5% | 1591 ? 94% |
| Score Write (Points) | 1110 | 1406 27% | 343 -69% | 1037 -7% | 1060 ? -5% | 2724 ? 145% |
| Score Total (Points) | 2357 | 3274 39% | 869 -63% | 1849 -22% | 2252 ? -4% | 5069 ? 115% |
| Copy ISO MB/s (MB/s) | 1480 | 1236 -16% | 282.8 -81% | 801 -46% | 1469 ? -1% | 2830 ? 91% |
| Copy Program MB/s (MB/s) | 432.4 | 442.4 2% | 128.1 -70% | 340.9 -21% | 484 ? 12% | 850 ? 97% |
| Copy Game MB/s (MB/s) | 761 | 830 9% | 184.9 -76% | 568 -25% | 997 ? 31% | 1706 ? 124% |
| Total Average (Program / Settings) | 2% /
6% | -62% /
-62% | -17% /
-17% | -9% /
-8% | 80% /
82% |
* ... smaller is better
Continuous load read: DiskSpd Read Loop, Queue Depth 8
Graphics card
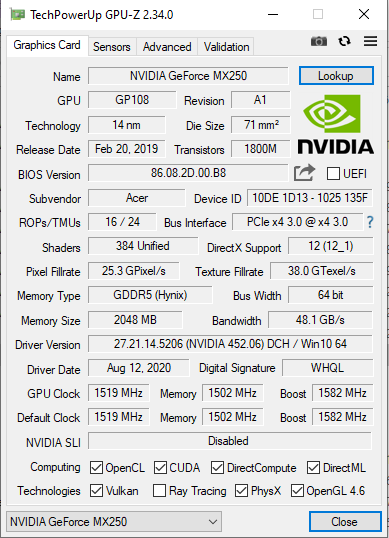
The dedicated GeForce MX250 graphics core (Pascal) is an obsolete mid-range GPU. The significantly more powerful successor (GeForce MX350) has been available for several months, and the latter's successor (GeForce MX450) has already been announced.
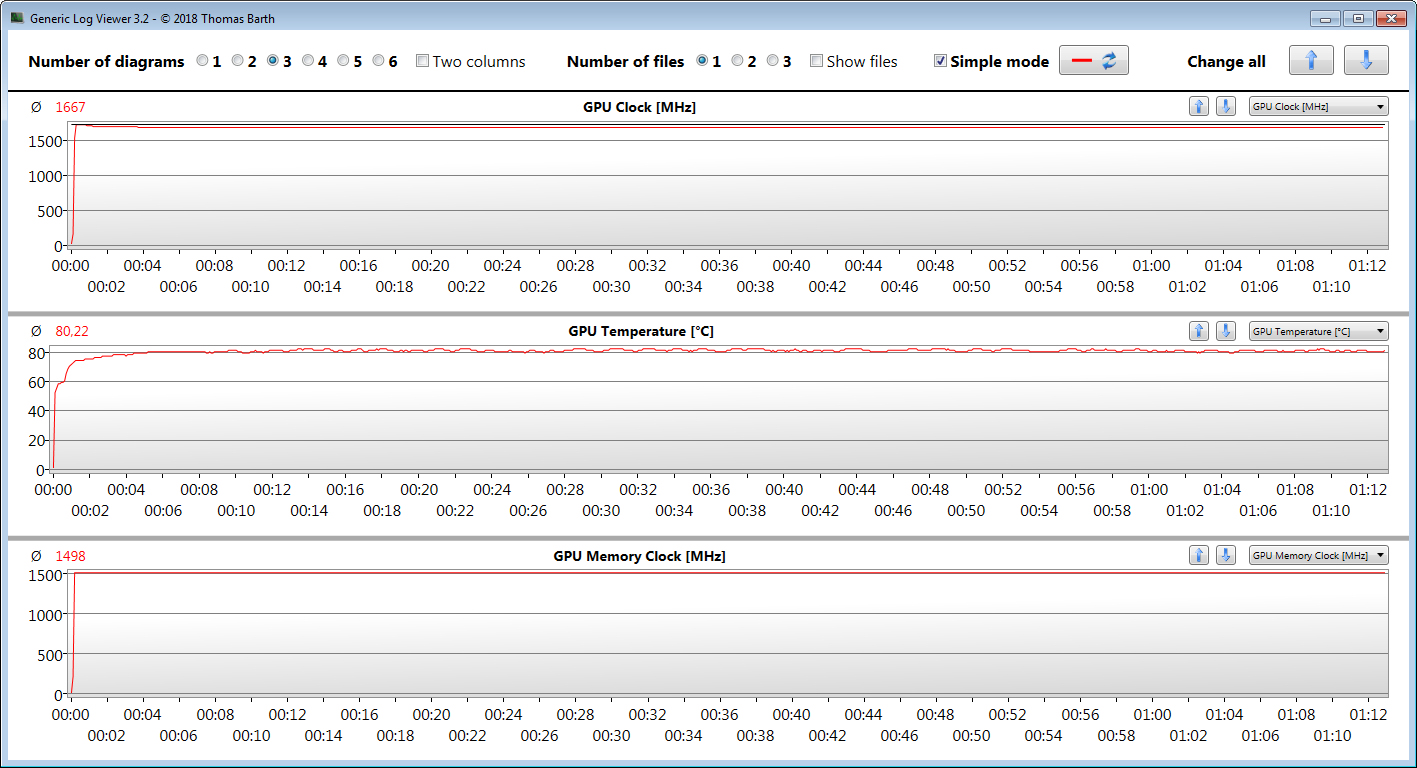
The GPU consistently achieves speeds (The Witcher 3 average: 1,667 MHz) above the clock range specified by Nvidia (1,519 to 1,582 MHz). This is feasible if the GPU doesn't reach a specified temperature and/or energy threshold.
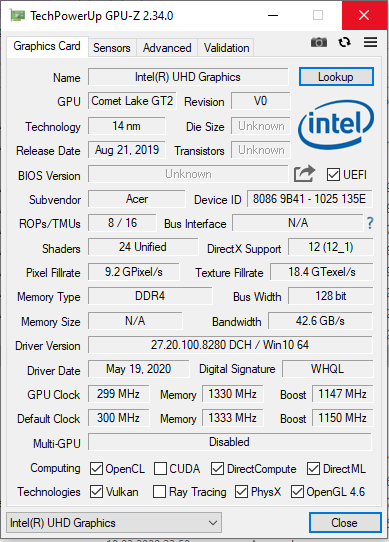
The results in the 3DMark benchmarks are at a normal level for this GPU. The latter can access fast GDDR5 graphics memory (2,048 MB). In addition, the UHD Graphics 620 GPU that's integrated into the processor is active, and the laptop works with Nvidia's Optimus graphics-switching solution.
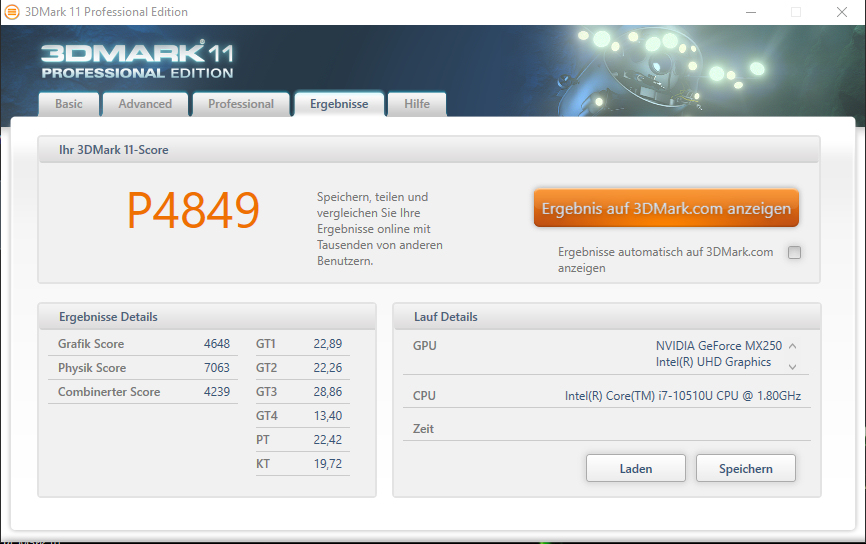
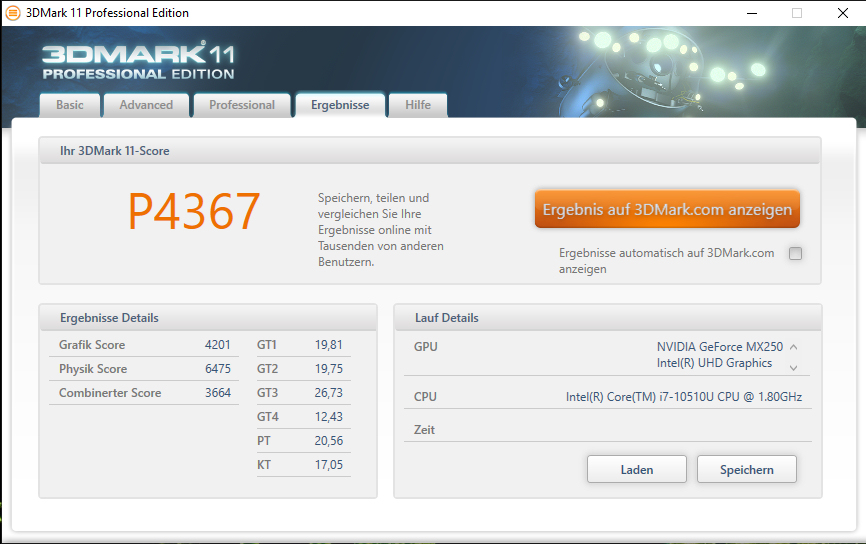
| 3DMark 11 Performance | 4849 points | |
| 3DMark Cloud Gate Standard Score | 12619 points | |
| 3DMark Fire Strike Score | 3191 points | |
| 3DMark Time Spy Score | 1212 points | |
Help | ||
Gaming performance
The built-in hardware can bring quite a lot of games smoothly onto the screen. Most titles achieve sufficiently high frame rates at HD resolution (1280x720 pixels) and medium quality settings. In addition, games with moderate hardware requirements allow more. Modern, performance-hungry hits often require a reduction of the resolution and/or quality level.
| The Witcher 3 - 1024x768 Low Graphics & Postprocessing | |
| Average of class Multimedia (68 - 380, n=8, last 2 years) | |
| Acer Aspire 3 A317-51G-72MD | |
| Average NVIDIA GeForce MX250 (47.4 - 70, n=24) | |
| HP 470 G7 8VU24EA | |
| BioShock Infinite - 1920x1080 Ultra Preset, DX11 (DDOF) | |
| Average NVIDIA GeForce MX250 (32.3 - 38.1, n=14) | |
| Acer Aspire 3 A317-51G-72MD | |
| HP 470 G7 8VU24EA | |
| Lenovo Ideapad L340-17API-81LY0004GE | |
| Asus VivoBook 17 F712FA-AU518T | |
| F1 2020 - 1280x720 Ultra Low Preset | |
| Acer Aspire 3 A317-51G-72MD | |
| Average NVIDIA GeForce MX250 (74 - 80, n=2) | |
| Gears Tactics - 1280x720 Low Preset | |
| Acer Aspire 3 A317-51G-72MD | |
| Average NVIDIA GeForce MX250 (65.7 - 99.3, n=2) | |
| HP 470 G7 8VU24EA | |
| Hunt Showdown - 1280x720 Low Preset | |
| Acer Aspire 3 A317-51G-72MD | |
| Average NVIDIA GeForce MX250 (n=1) | |
| HP 470 G7 8VU24EA | |
| Escape from Tarkov - 1280x720 Low Preset | |
| Acer Aspire 3 A317-51G-72MD | |
| Average NVIDIA GeForce MX250 (n=1) | |
| HP 470 G7 8VU24EA | |
| Total War: Three Kingdoms - 1280x720 Low (incl textures) | |
| Average of class Multimedia (186 - 317, n=2, last 2 years) | |
| Acer Aspire 3 A317-51G-72MD | |
| Average NVIDIA GeForce MX250 (71.2 - 78.2, n=2) | |
| HP 470 G7 8VU24EA | |
| Lenovo Ideapad L340-17API-81LY0004GE | |
| Shadow of the Tomb Raider - 1280x720 Lowest Preset | |
| Average of class Multimedia (66 - 204, n=7, last 2 years) | |
| Acer Aspire 3 A317-51G-72MD | |
| Average NVIDIA GeForce MX250 (24 - 56, n=8) | |
| HP 470 G7 8VU24EA | |
In order to verify whether the frame rates remain largely constant over a prolonged period of time, we let the game The Witcher 3 run for about 60 minutes at Full HD resolution and maximum quality settings. The character embodied by the player is not moved. A drop in frame rates wasn't found.
| low | med. | high | ultra | |
|---|---|---|---|---|
| BioShock Infinite (2013) | 194.7 | 111.4 | 94.4 | 35.1 |
| The Witcher 3 (2015) | 64.6 | 36.2 | 21.9 | 12 |
| World of Tanks enCore (2018) | 339.1 | 75.1 | 29.2 | |
| Shadow of the Tomb Raider (2018) | 53 | 18 | 12 | 9 |
| Forza Horizon 4 (2018) | 72 | 31 | 24 | 16 |
| Total War: Three Kingdoms (2019) | 78.2 | 23.3 | 10.7 | 6.2 |
| Call of Duty Modern Warfare 2019 (2019) | 36.6 | 22.2 | 14.6 | 12.3 |
| Red Dead Redemption 2 (2019) | 30.6 | 13.7 | ||
| Escape from Tarkov (2020) | 69.1 | 29.2 | 22.1 | 22 |
| Hunt Showdown (2020) | 52.6 | 18.2 | 14 | |
| Doom Eternal (2020) | 35.9 | |||
| Gears Tactics (2020) | 99.3 | 35.5 | 23.4 | 14 |
| Valorant (2020) | 157.9 | 117.7 | 115.3 | |
| F1 2020 (2020) | 80 | 38 | 29 | 16 |
| Death Stranding (2020) | 34.3 | 15.7 | 14.4 | 14.2 |
| Horizon Zero Dawn (2020) | 29 | 13 | 11 |
Emissions and energy - Battery life is sufficient for home use
Noise emissions
In idle usage, the fan is usually quiet and silence prevails. But it turns up under load. In this way, we register a sound pressure level of 43.7 dB(A) during the stress test. The laptop is somewhat quieter during our The Witcher 3 test at a level of 40.1 dB(A).
Noise level
| Idle |
| 26.9 / 26.9 / 26.9 dB(A) |
| DVD |
| 35.6 / dB(A) |
| Load |
| 40.9 / 43.7 dB(A) |
 | ||
30 dB silent 40 dB(A) audible 50 dB(A) loud |
||
min: | ||
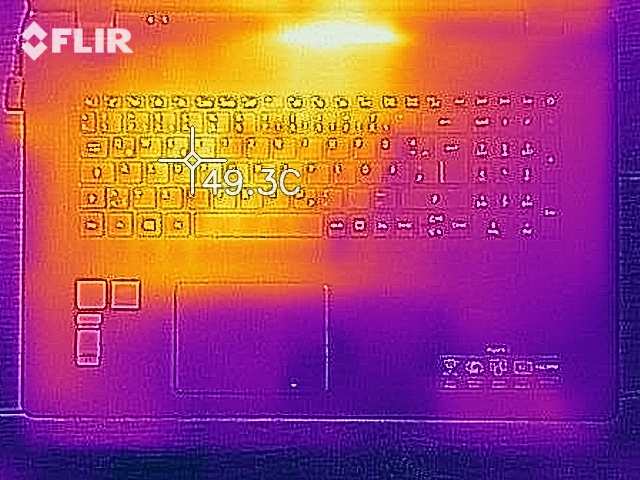
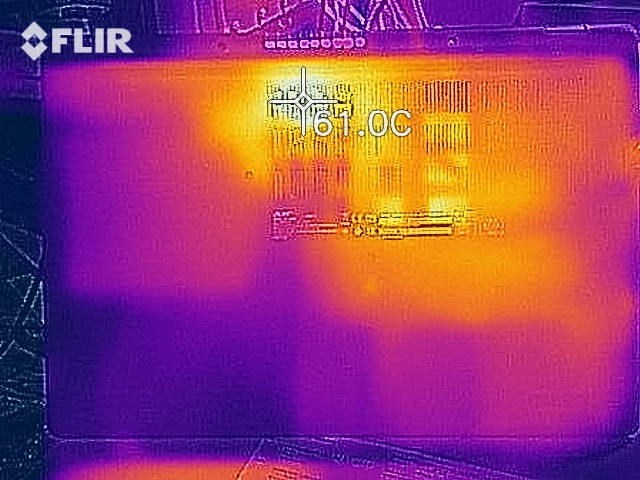
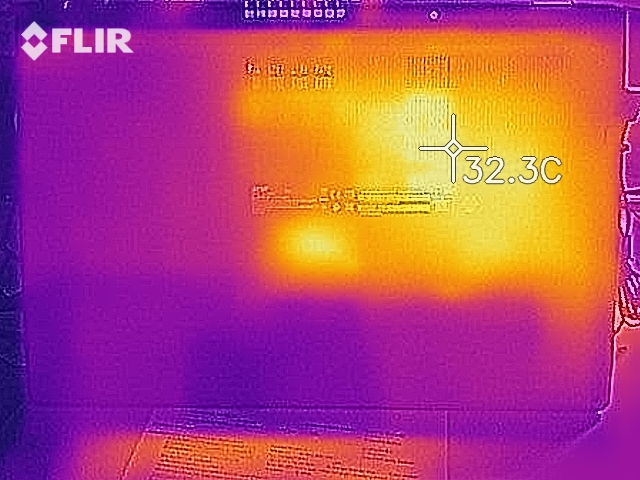
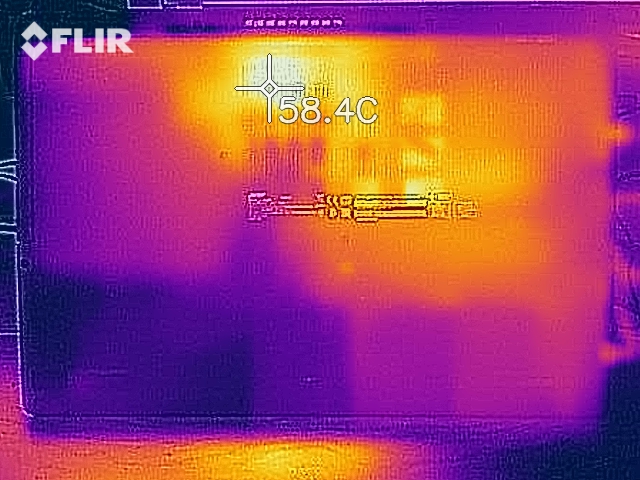
Temperature
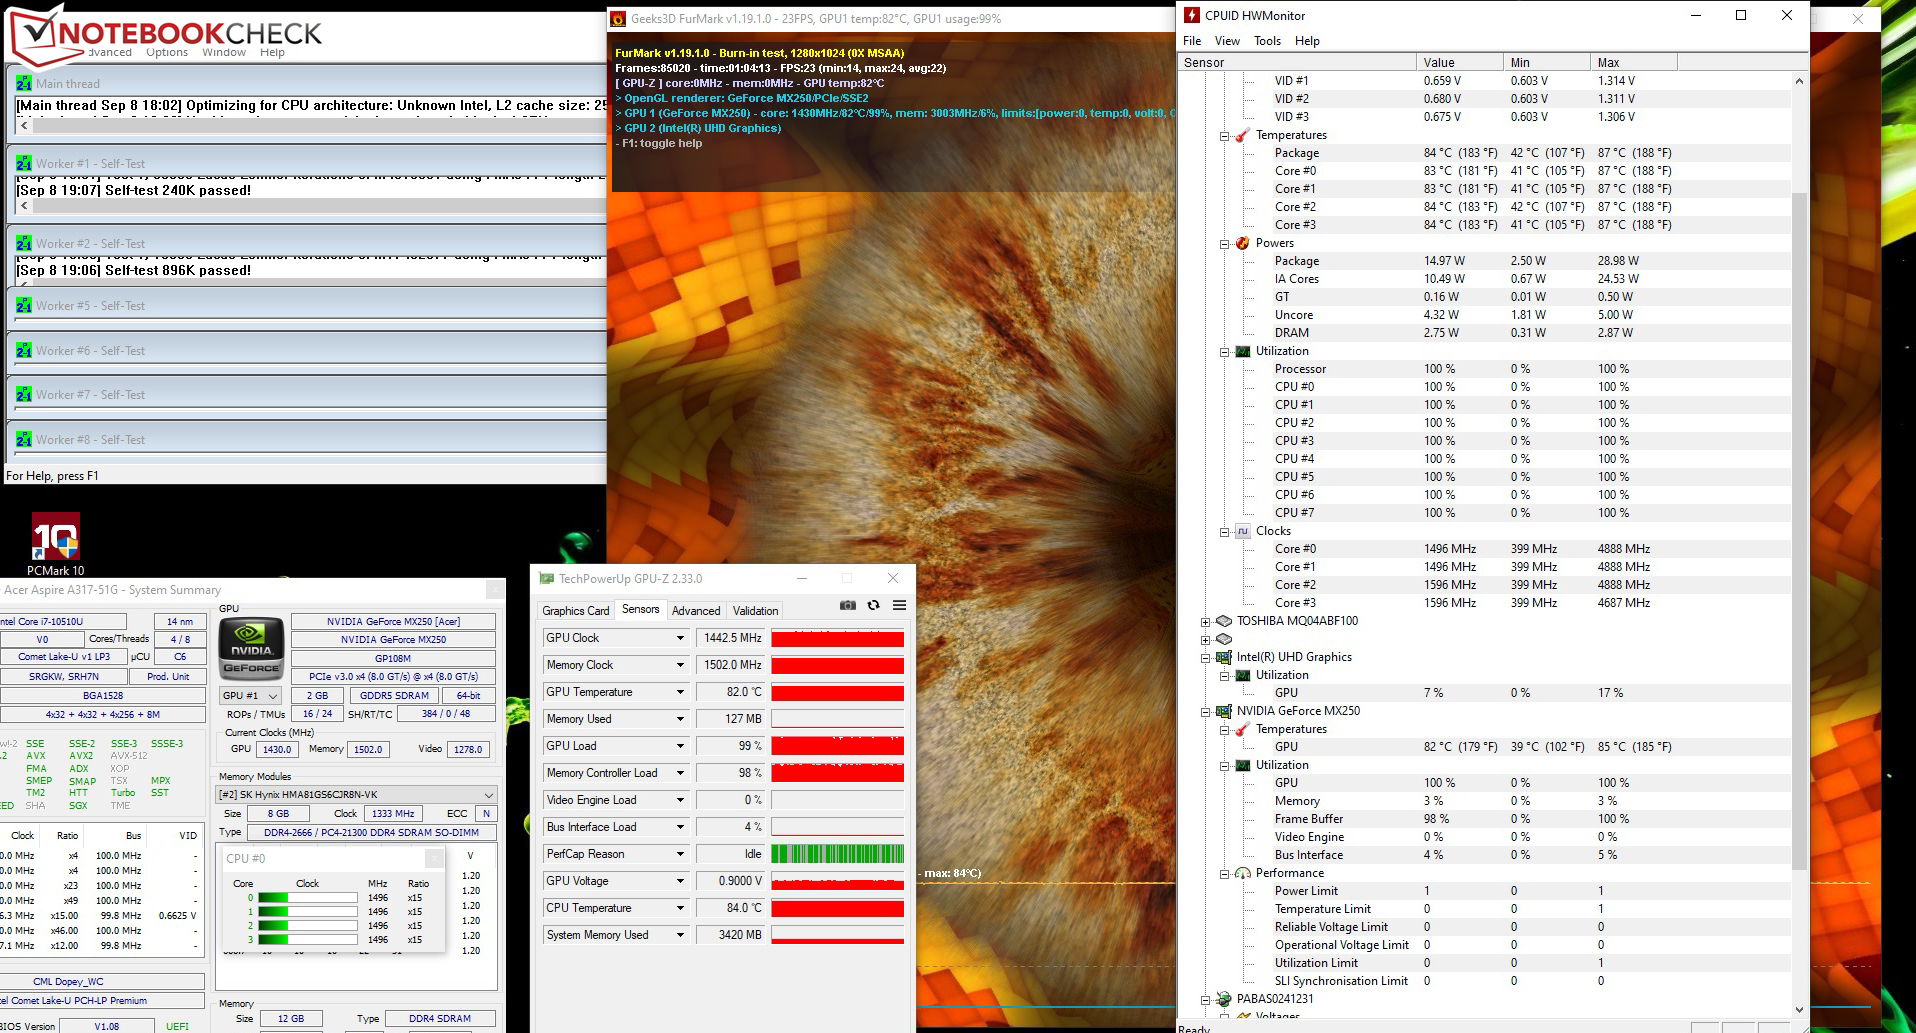
Our stress test (Prime95 and FurMark run for at least an hour) is run by the processor and graphics core at 1.5 GHz and 1,443 MHz, respectively. On battery power, the clock speeds of the CPU are mostly at 400 MHz. Occasionally, the CPU is accelerated to 1.8 GHz. Furthermore, the GPU runs at about 1,200 MHz. The stress test represents an extreme scenario that doesn't occur in everyday life. With this test we check if the system remains stable even at full load.
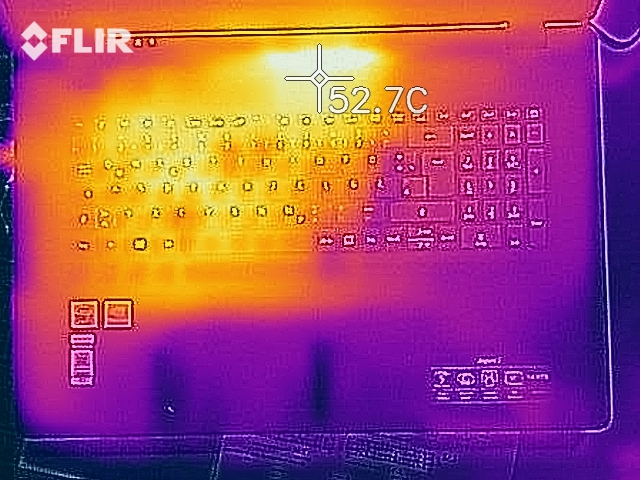
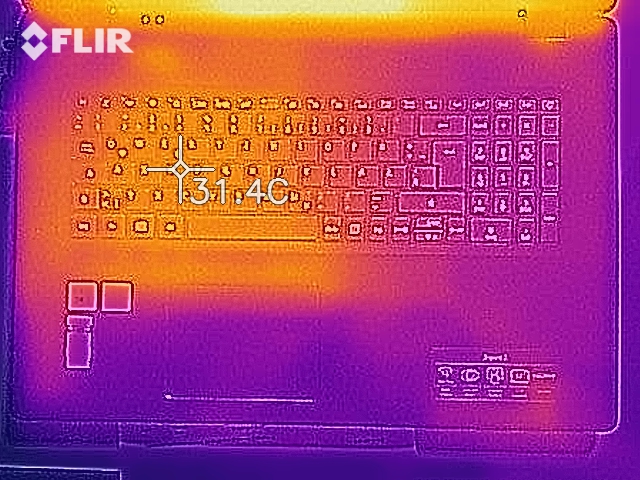
The laptop warms up noticeably in some areas. The stress test and our The Witcher 3 test let the temperature on the bottom of the laptop rise to 53 °C (~127 °F) in the area of the fan. Moreover, the remaining measuring points heat up less. In everyday use, the temperatures are in the green range.
(±) The maximum temperature on the upper side is 44.2 °C / 112 F, compared to the average of 36.8 °C / 98 F, ranging from 21 to 71 °C for the class Multimedia.
(-) The bottom heats up to a maximum of 53 °C / 127 F, compared to the average of 39.1 °C / 102 F
(+) In idle usage, the average temperature for the upper side is 25.4 °C / 78 F, compared to the device average of 31.3 °C / 88 F.
(+) Playing The Witcher 3, the average temperature for the upper side is 31.6 °C / 89 F, compared to the device average of 31.3 °C / 88 F.
(+) The palmrests and touchpad are cooler than skin temperature with a maximum of 28 °C / 82.4 F and are therefore cool to the touch.
(±) The average temperature of the palmrest area of similar devices was 28.7 °C / 83.7 F (+0.7 °C / 1.3 F).
Speakers
The stereo speakers are located in the front area of the bottom of the device. They produce a decent sound that hardly has any bass, though. The maximum volume is quite low too.
Acer Aspire 3 A317-51G-72MD audio analysis
(-) | not very loud speakers (70.3 dB)
Bass 100 - 315 Hz
(-) | nearly no bass - on average 31.8% lower than median
(±) | linearity of bass is average (8.9% delta to prev. frequency)
Mids 400 - 2000 Hz
(±) | reduced mids - on average 5.5% lower than median
(±) | linearity of mids is average (8.2% delta to prev. frequency)
Highs 2 - 16 kHz
(+) | balanced highs - only 2.6% away from median
(+) | highs are linear (5% delta to prev. frequency)
Overall 100 - 16.000 Hz
(±) | linearity of overall sound is average (24% difference to median)
Compared to same class
» 85% of all tested devices in this class were better, 6% similar, 10% worse
» The best had a delta of 5%, average was 17%, worst was 45%
Compared to all devices tested
» 72% of all tested devices were better, 6% similar, 22% worse
» The best had a delta of 4%, average was 23%, worst was 134%
Energy consumption
In idle usage, we register a maximum power consumption of 8.5 watts. During our stress test, the value rises up to 62 watts. In gaming mode (The Witcher 3 test), the consumption is lower at an average of 56 watts (52 to 57.5 watts). The power adapter's output is 65 watts.
The energy requirement of the entire laptop needs to remain within the energy budget provided by the 65-watt power adapter. Our stress test shows that the situation is tight in this regard: The battery drains during the test.
| Off / Standby | |
| Idle | |
| Load |
|
Key:
min: | |
Battery life
The Aspire 3 achieves a runtime of 5:14 hours in our practical WLAN test. A script is used to reproduce the load caused by accessing websites.
Pros
Cons
Verdict


The Aspire 3's Core i7-10510U processor offers enough processing power for office and Internet applications. In combination with the dedicated GeForce MX250 graphics core, playing computer games is possible to a limited extent.
With the Aspire 3 A317-51G, Acer delivers a multimedia all-rounder that is made for the desk at home.
Prospective buyers should consider a cheaper Core i5 Aspire. It can be assumed that the Core i5 and Core i7 are on par in terms of performance due to the limited Turbo usage. But this can be different on Aspire models that lack a dedicated GPU.
Storage space won't run out that quickly since the laptop comes with a full 2 TB of it (1 TB NMVe SSD, 1 TB HDD). Users who want/need an optical drive were also taken into account. Moreover, replacing the storage devices is possible. To do so, the laptop's bottom cover would have to be removed.
The Aspire comes with a keyboard (not backlit) suitable for everyday use. This is accompanied by decent battery life. The display (Full HD, IPS) scores points with a matte surface, stable viewing angles, good contrast, and decent color reproduction. However, the maximum brightness and the color-space coverage are too low for a device in this price range.
Acer Aspire 3 A317-51G-72MD
- 09/14/2020 v7 (old)
Sascha Mölck
Price comparison

