Notebookcheck Logo

Hunt Showdown Notebook and Desktop Benchmarks

Survival of the fittest. Hunt Showdown had a rough start. In its early access phase it was plagued by poor performance. Find out in our benchmark test whether the final version is any better.
Hunt Showdown

Technology

Battle Royale and survival games are incredibly popular right now, and Hunt Showdown has been trying to cut out its piece of the pie from its competing rivals, namely FortnitePUBG, and Apex Legends. Given that the first-person shooter was developed by Crytek it comes as no surprise that it is based on the CryEngine. In the recent years, this particular engine has also been responsible for the great visuals of games such as EvolveKingdom Come Deliverance, Prey, and Ryse Son of Rome (albeit not in its current version V).

Hunt Showdown
Hunt Showdown
Hunt Showdown
Hunt Showdown
Hunt Showdown
Hunt Showdown

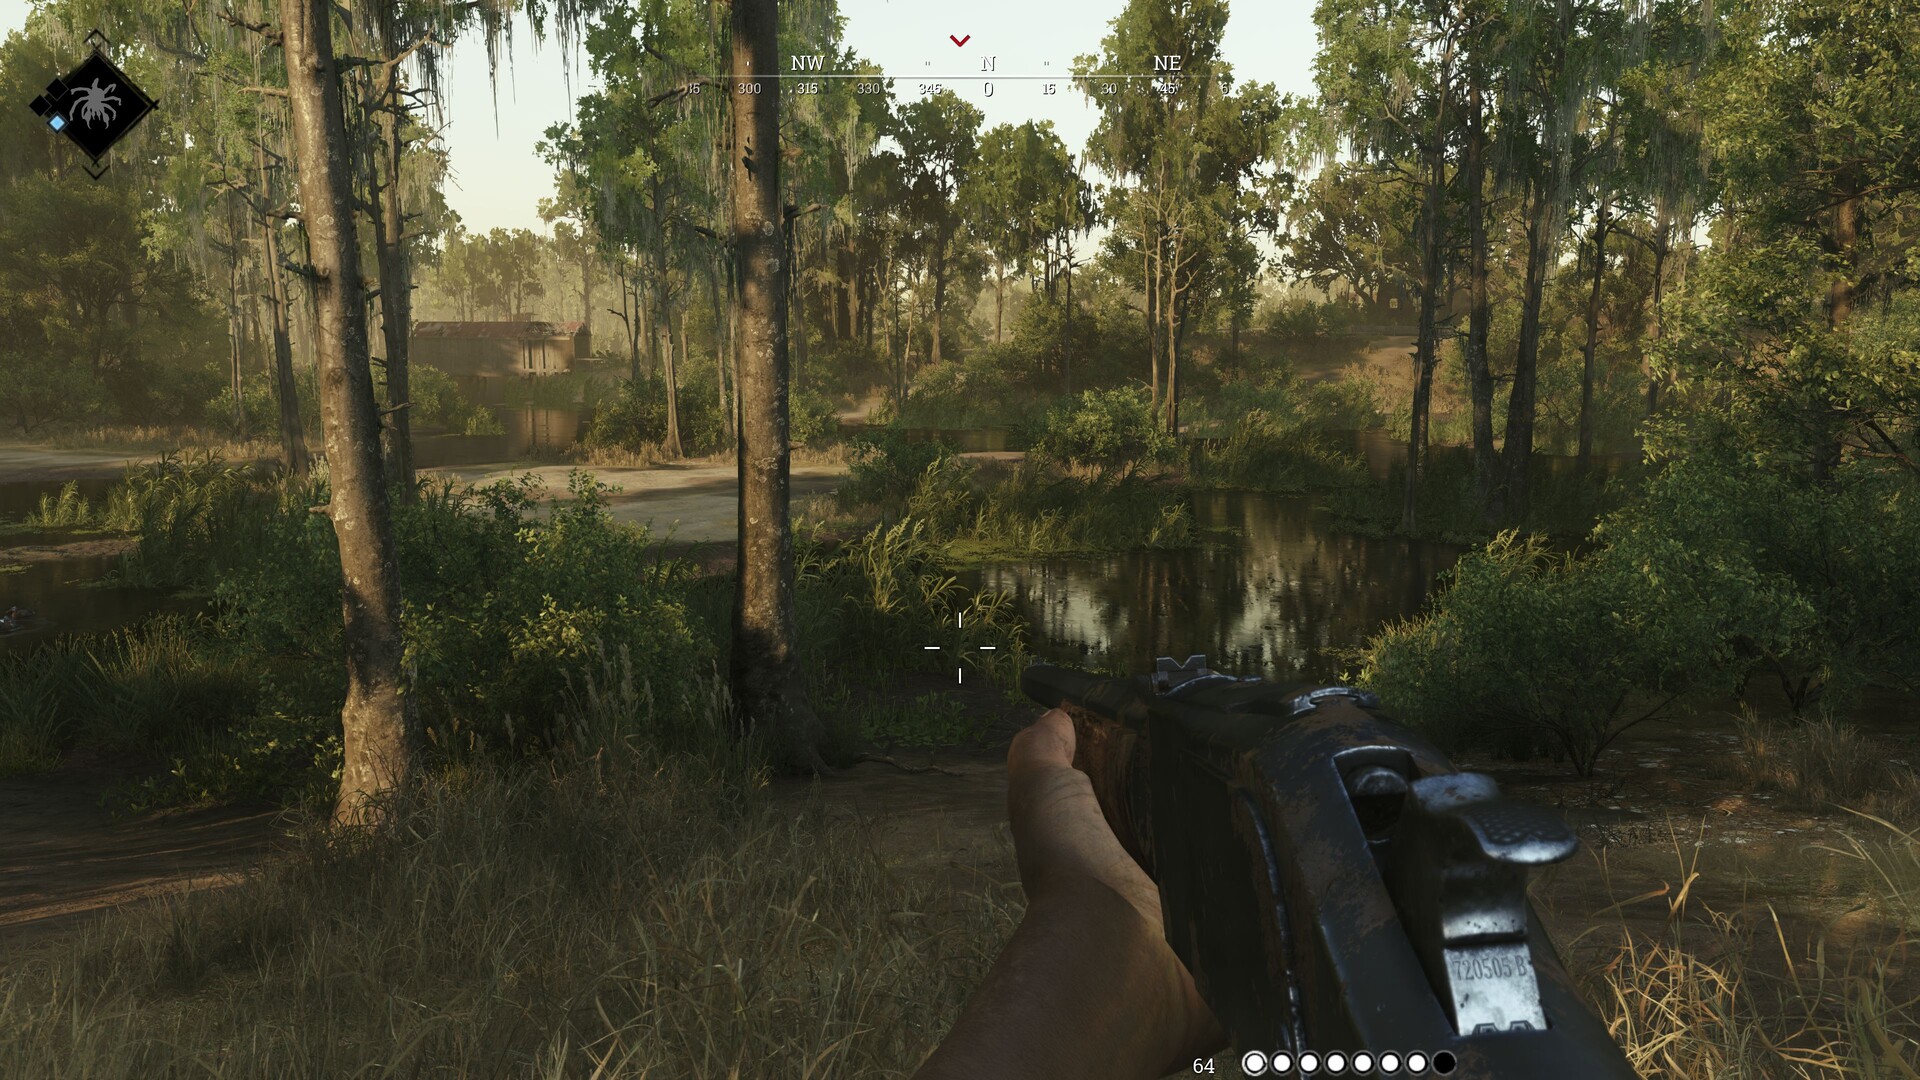
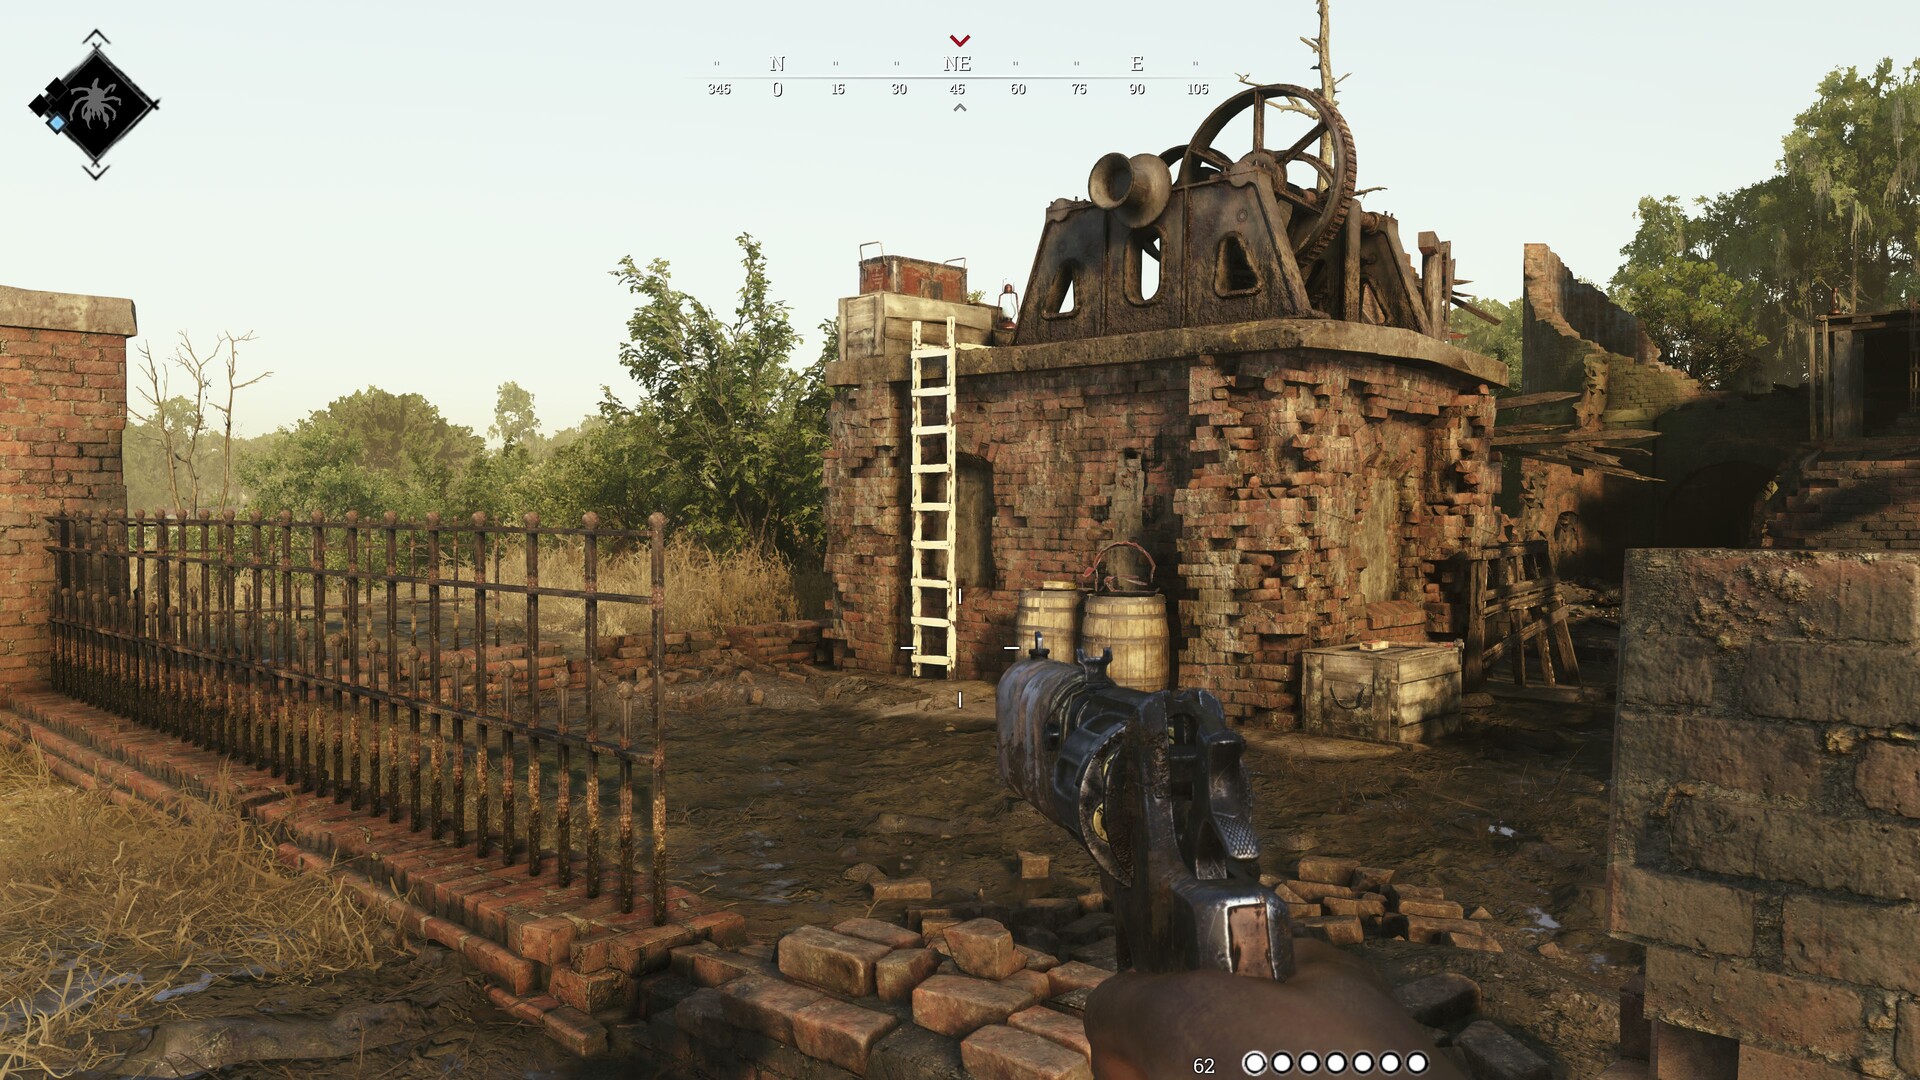
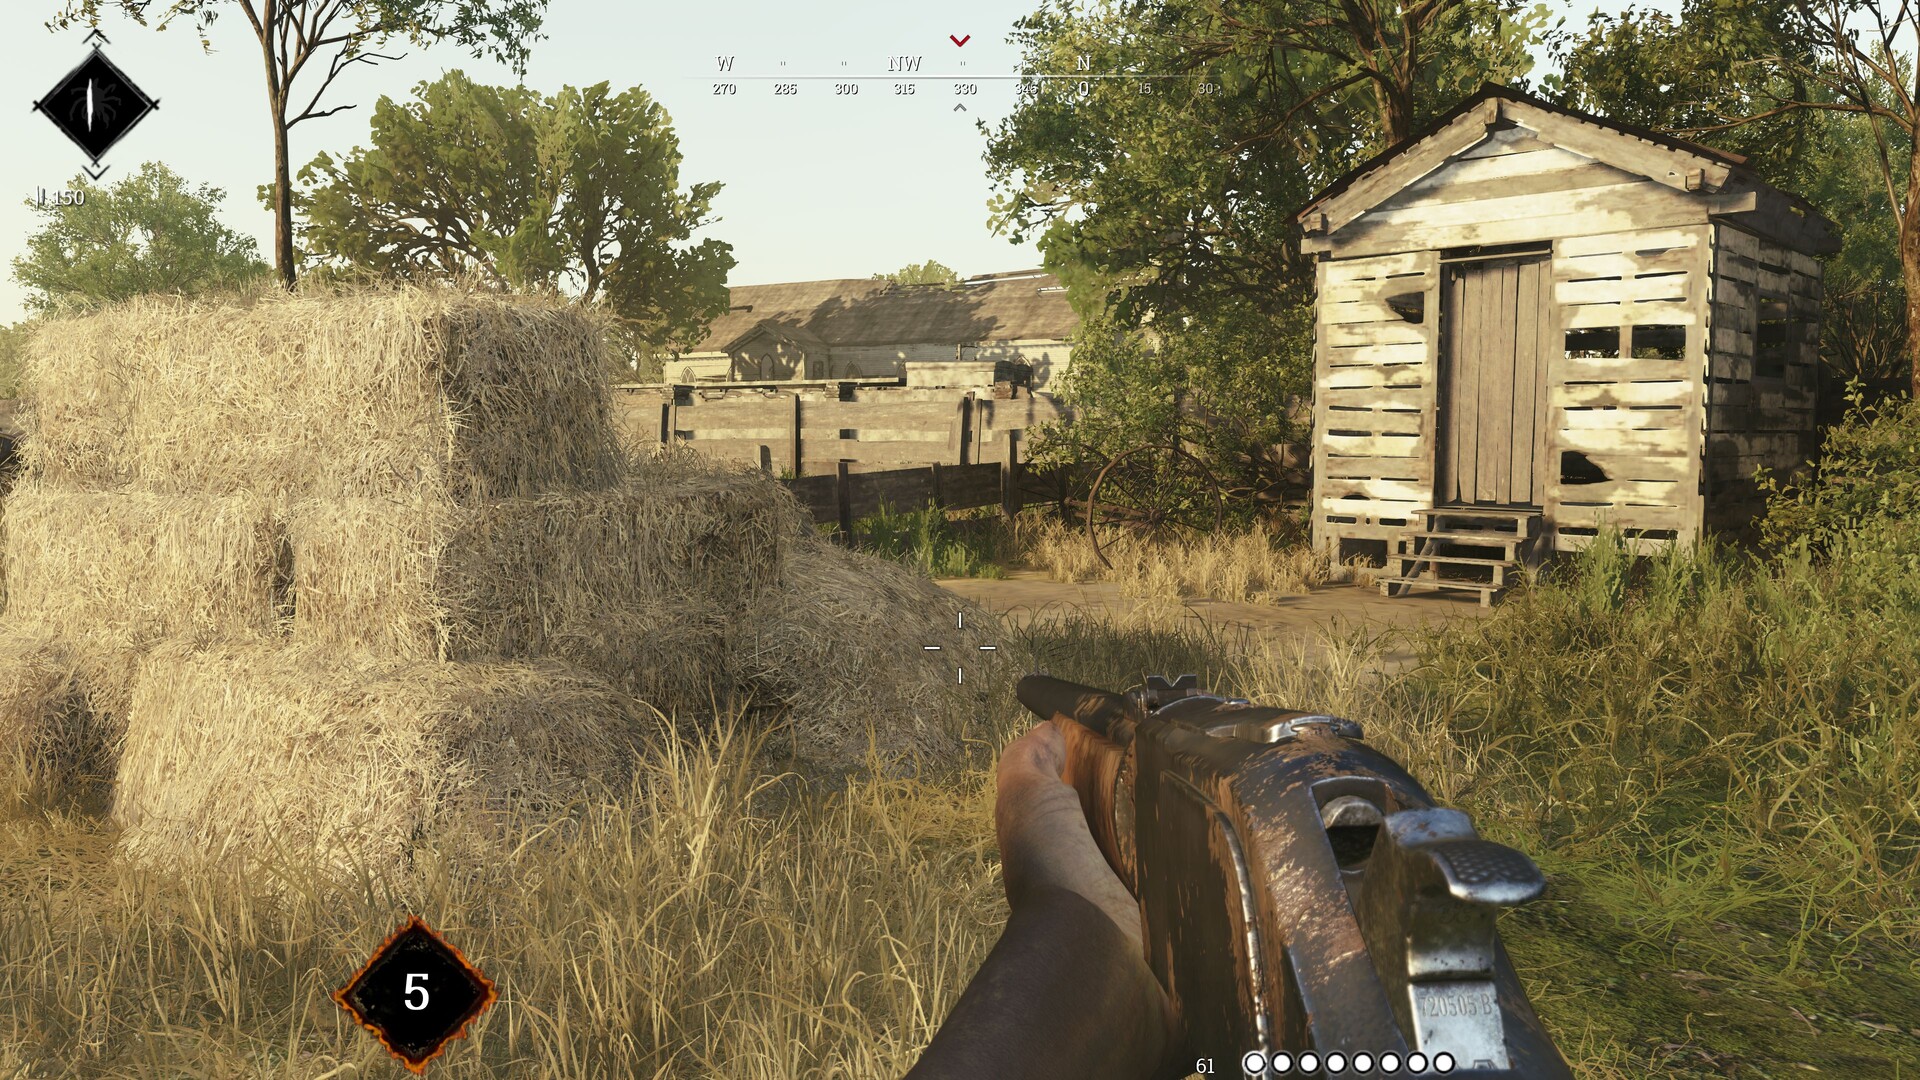
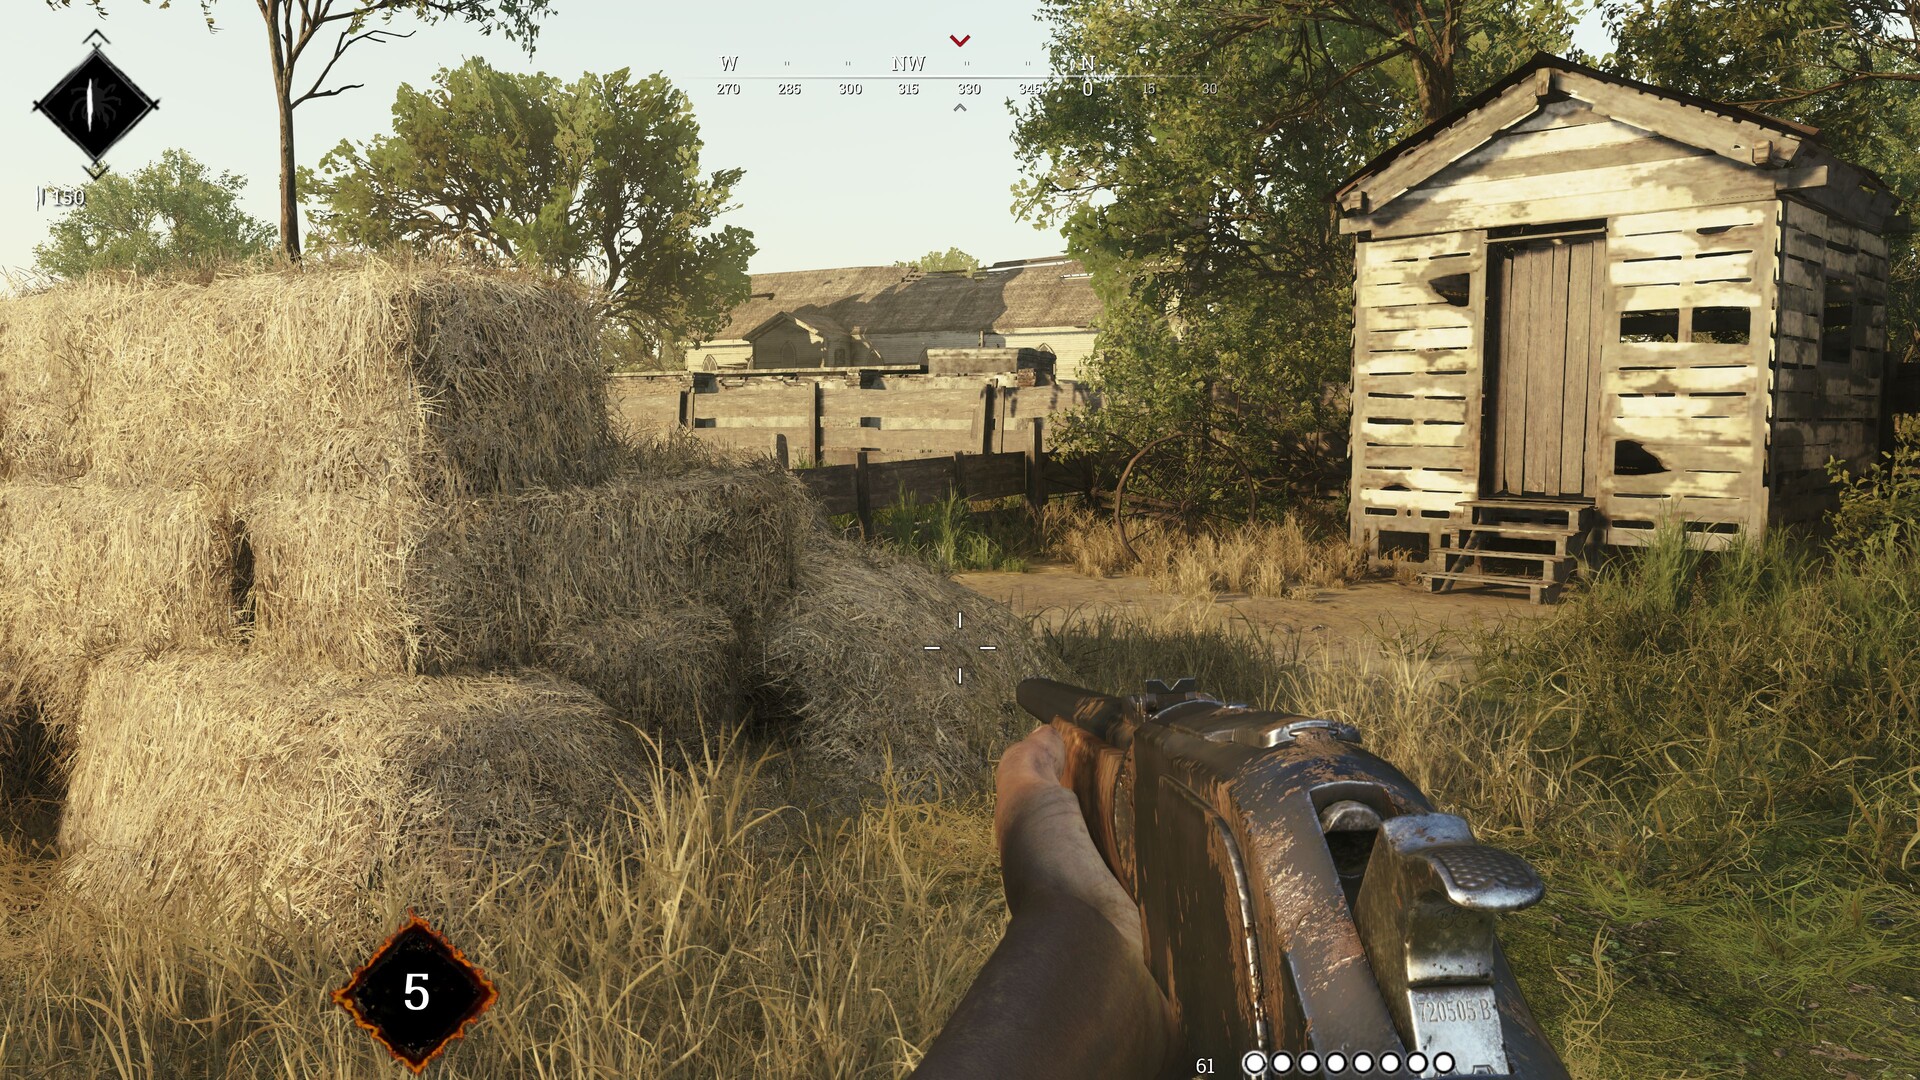
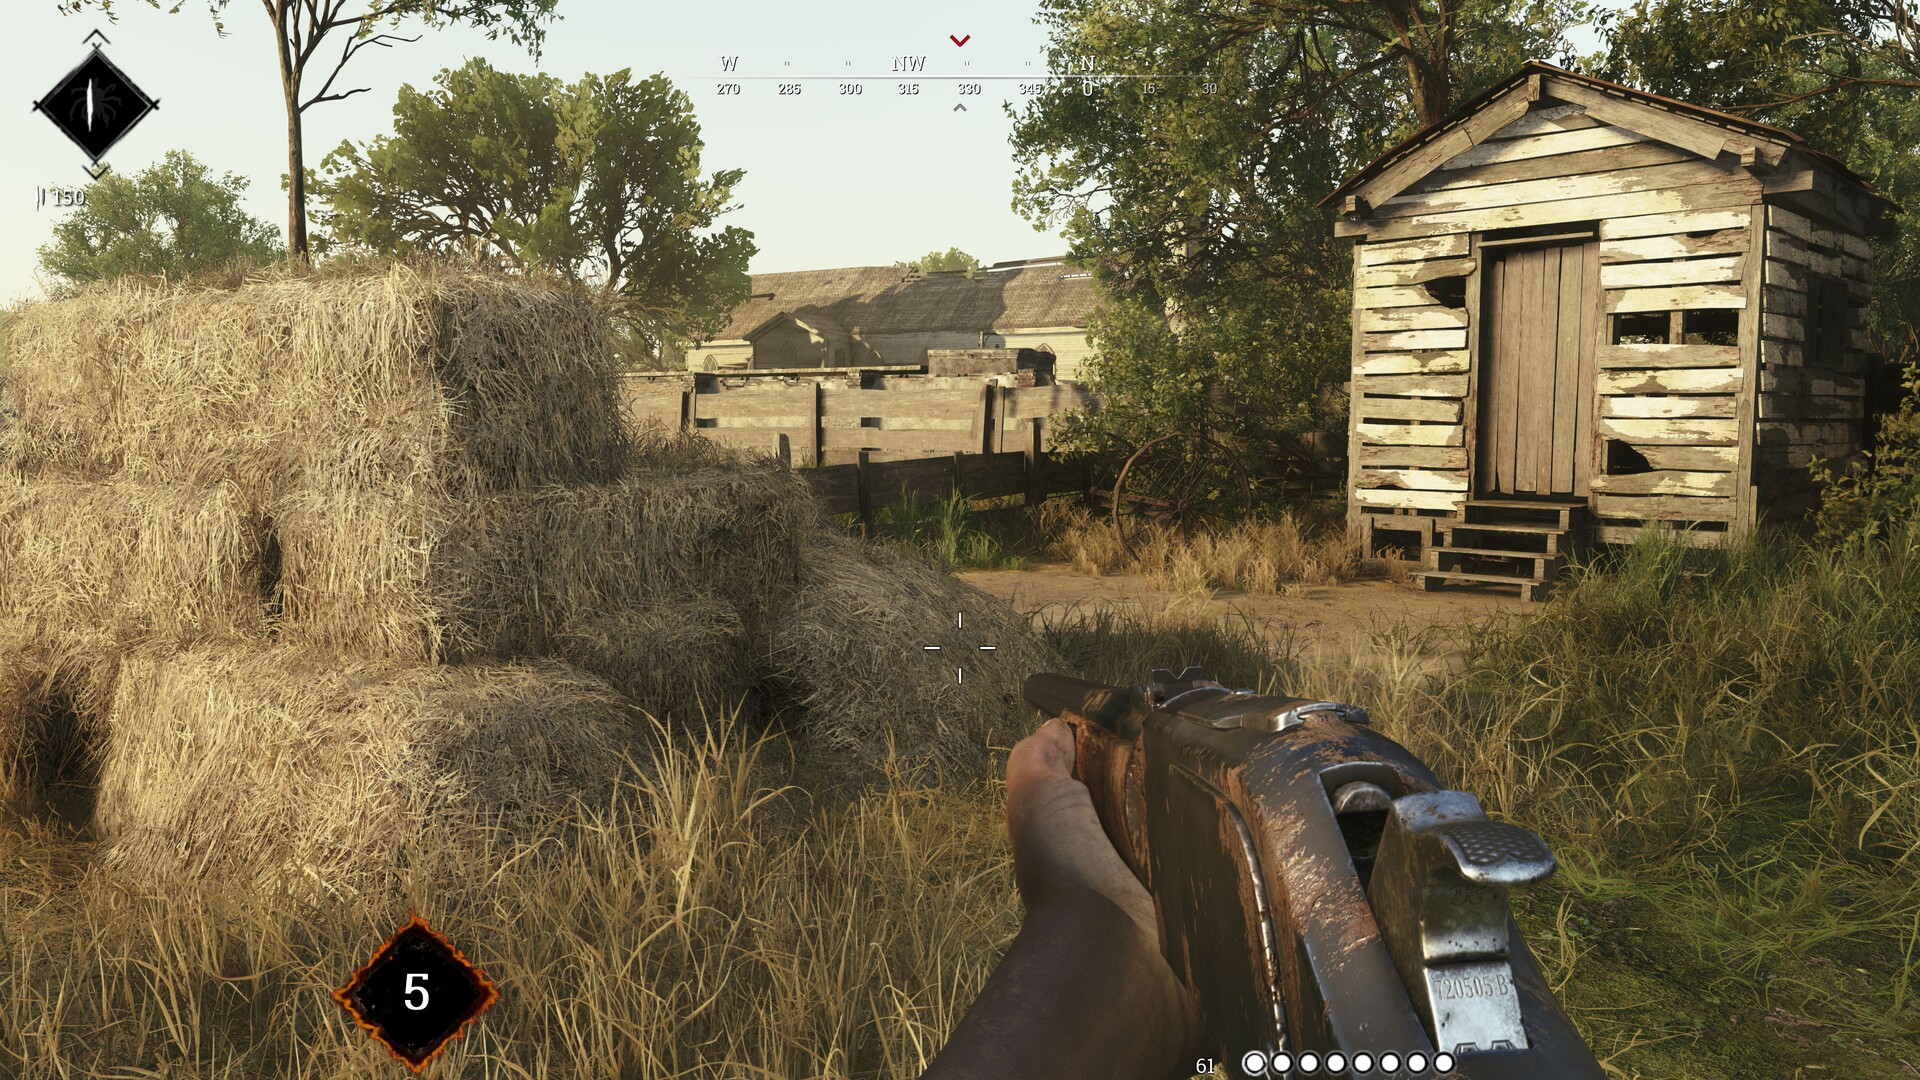
Despite some room for improvement we would certainly consider Hunt Showdown’s graphic quality as good. For example, we encountered random objects popping up and disappearing again even on maximum details, and some objects switched to sharper textures and more polygons as we approached them, particularly trees. On some computers, the game required multiple restarts to start up in full screen. And, last but not least, loading times could use some optimization, too.

Hunt Showdown
Hunt Showdown
Hunt Showdown
Hunt Showdown
Hunt Showdown
Hunt Showdown

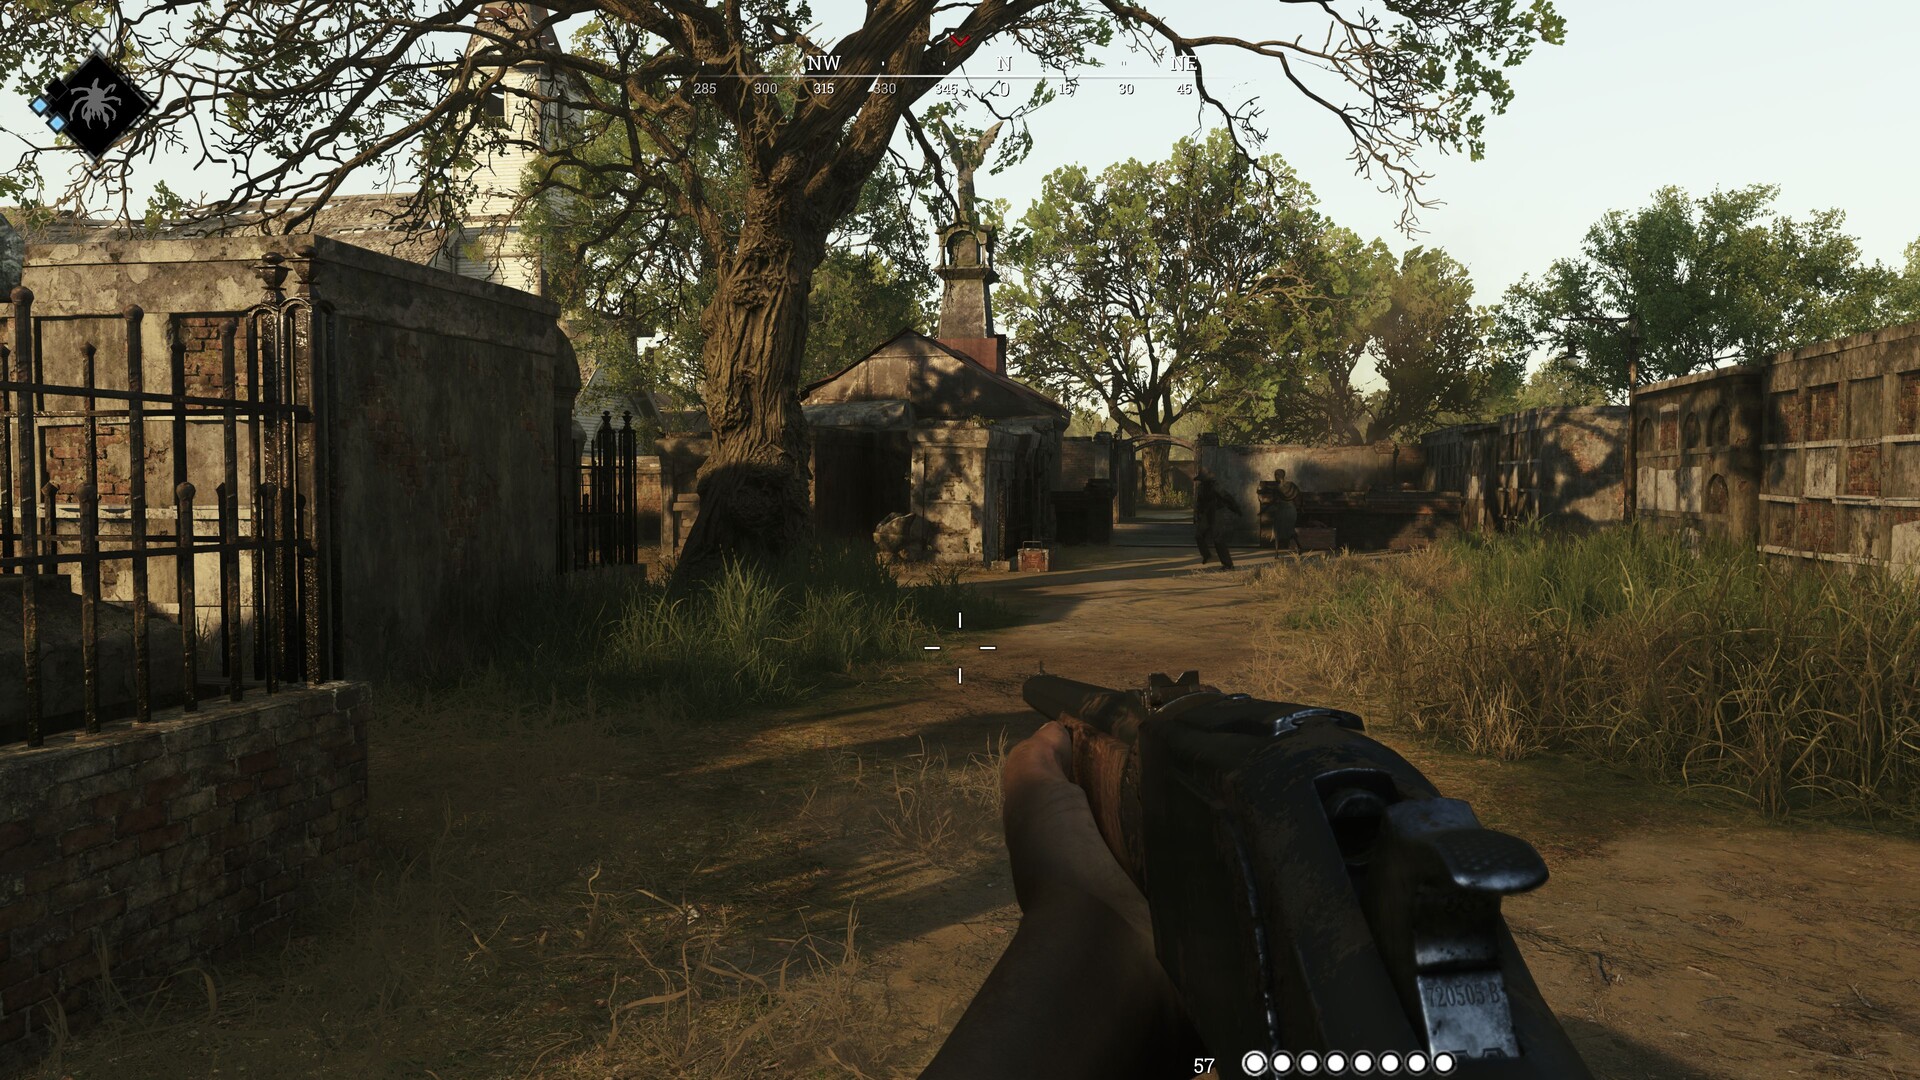
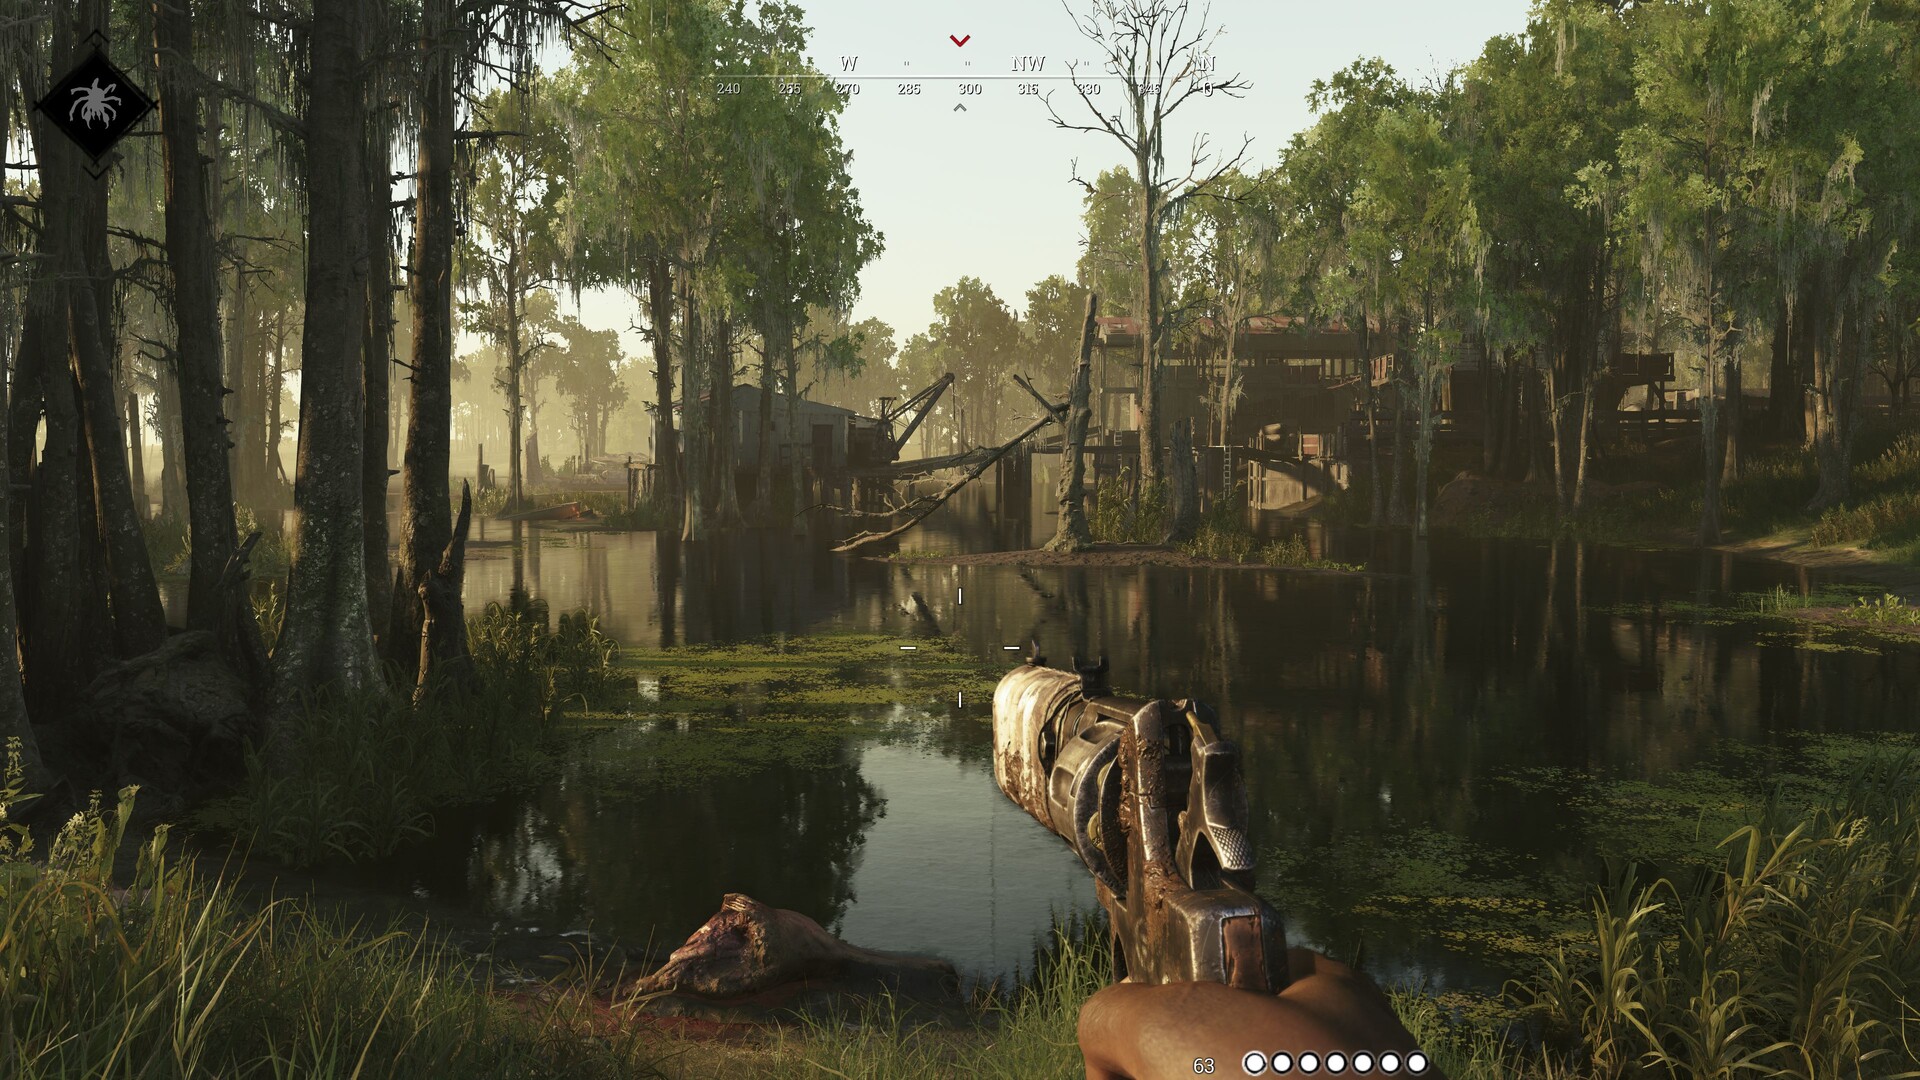
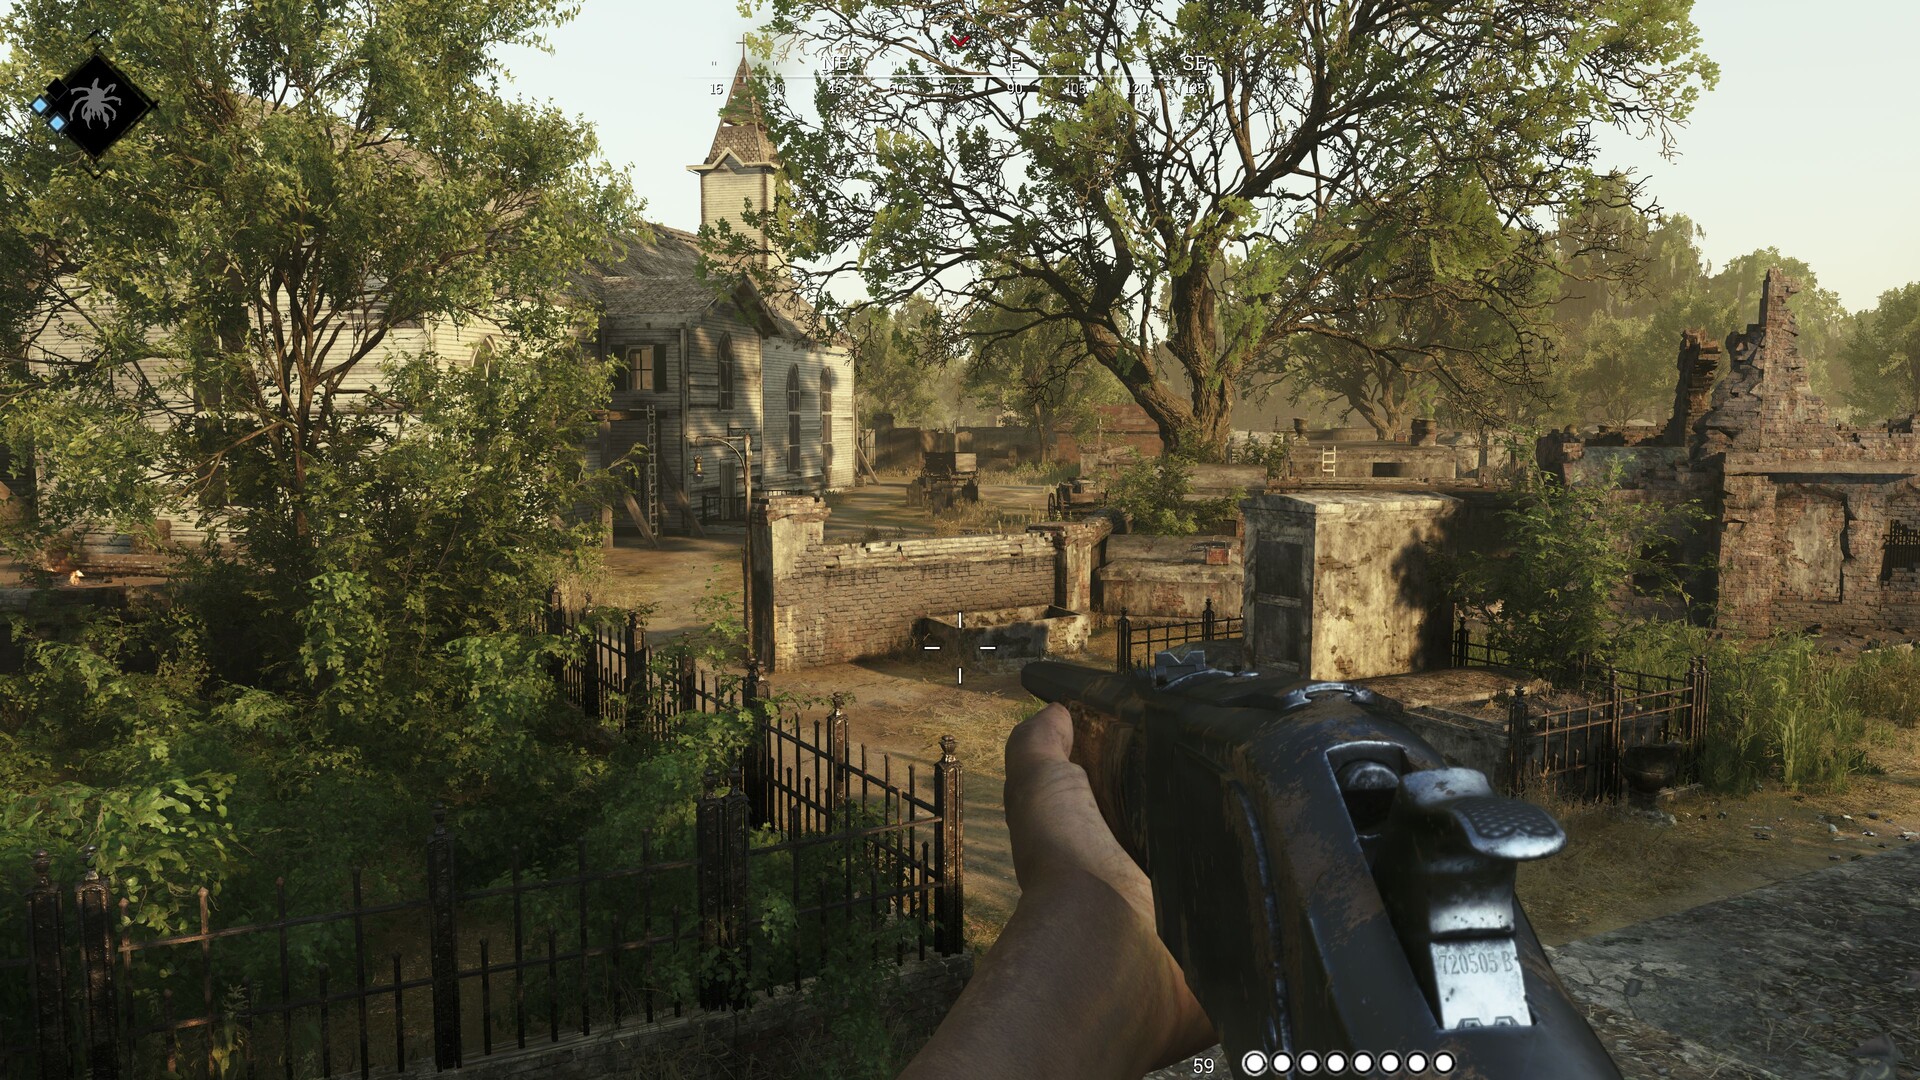
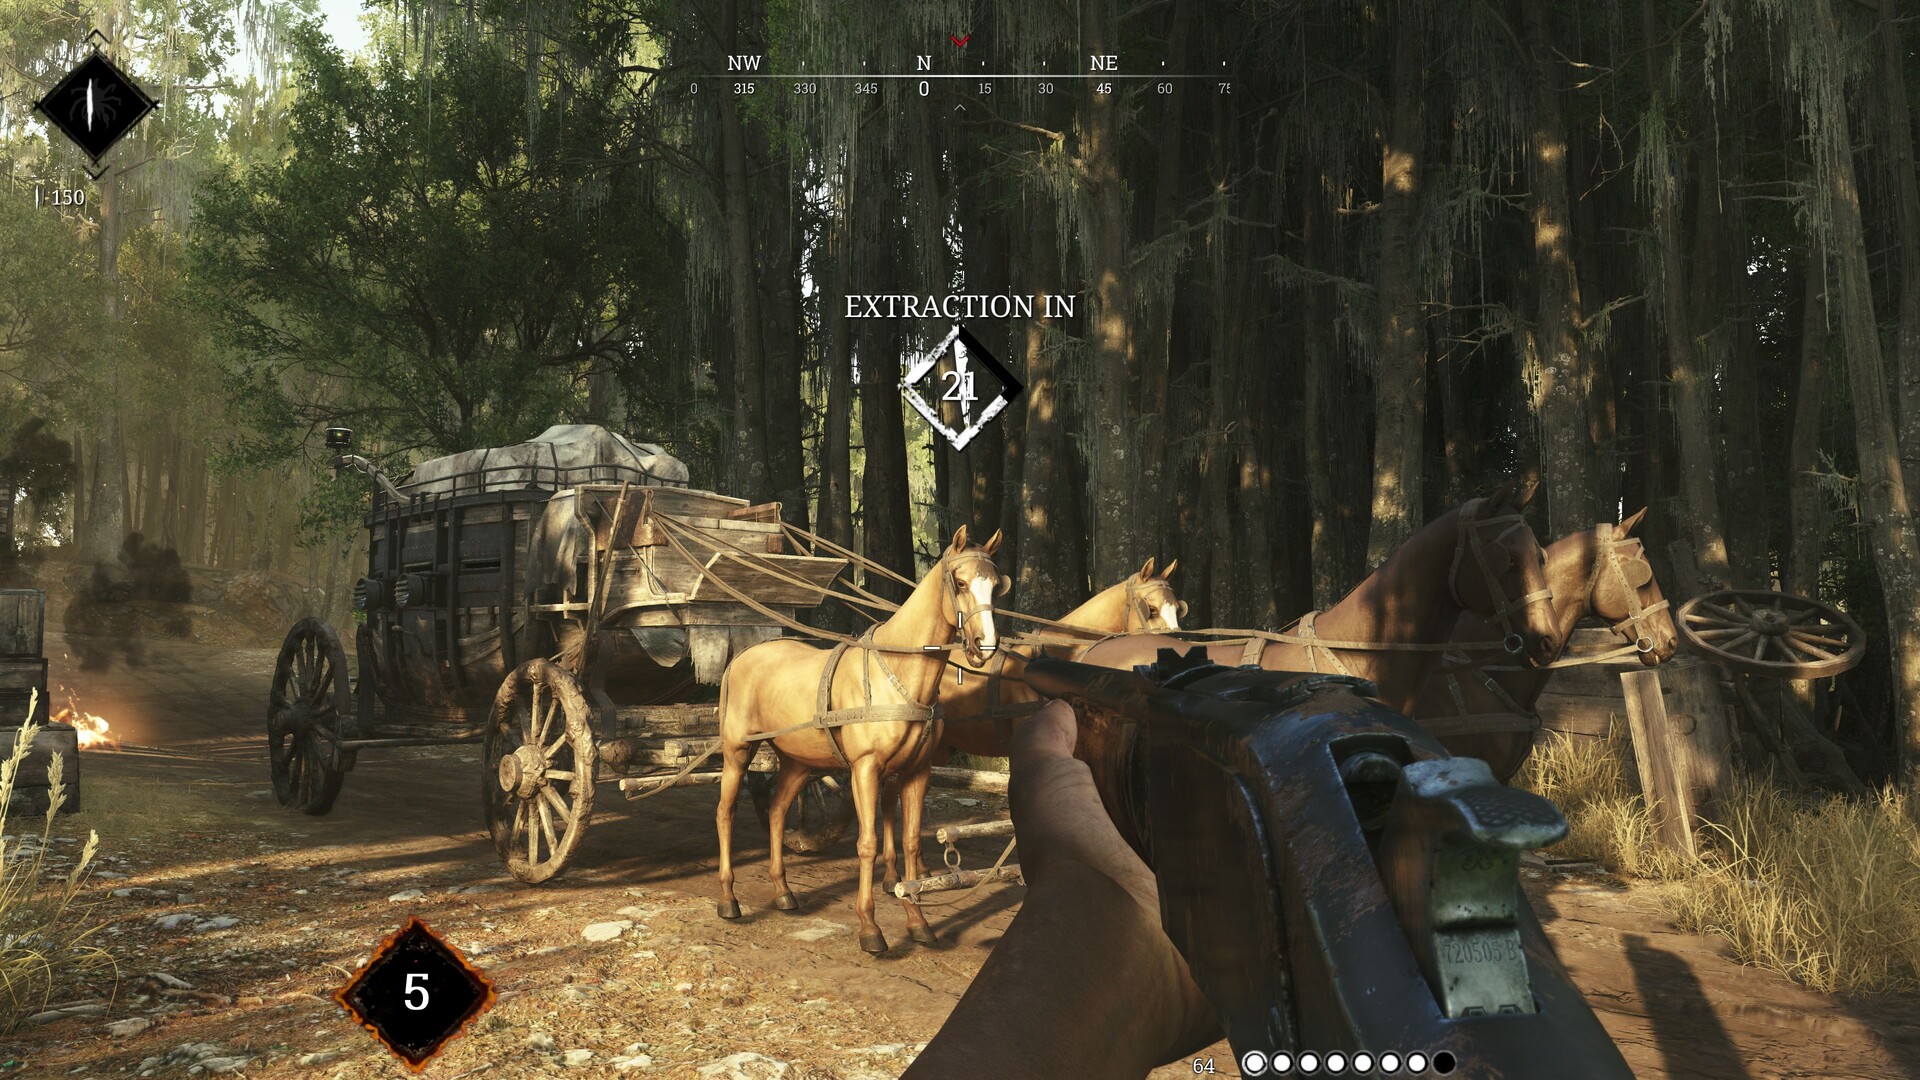
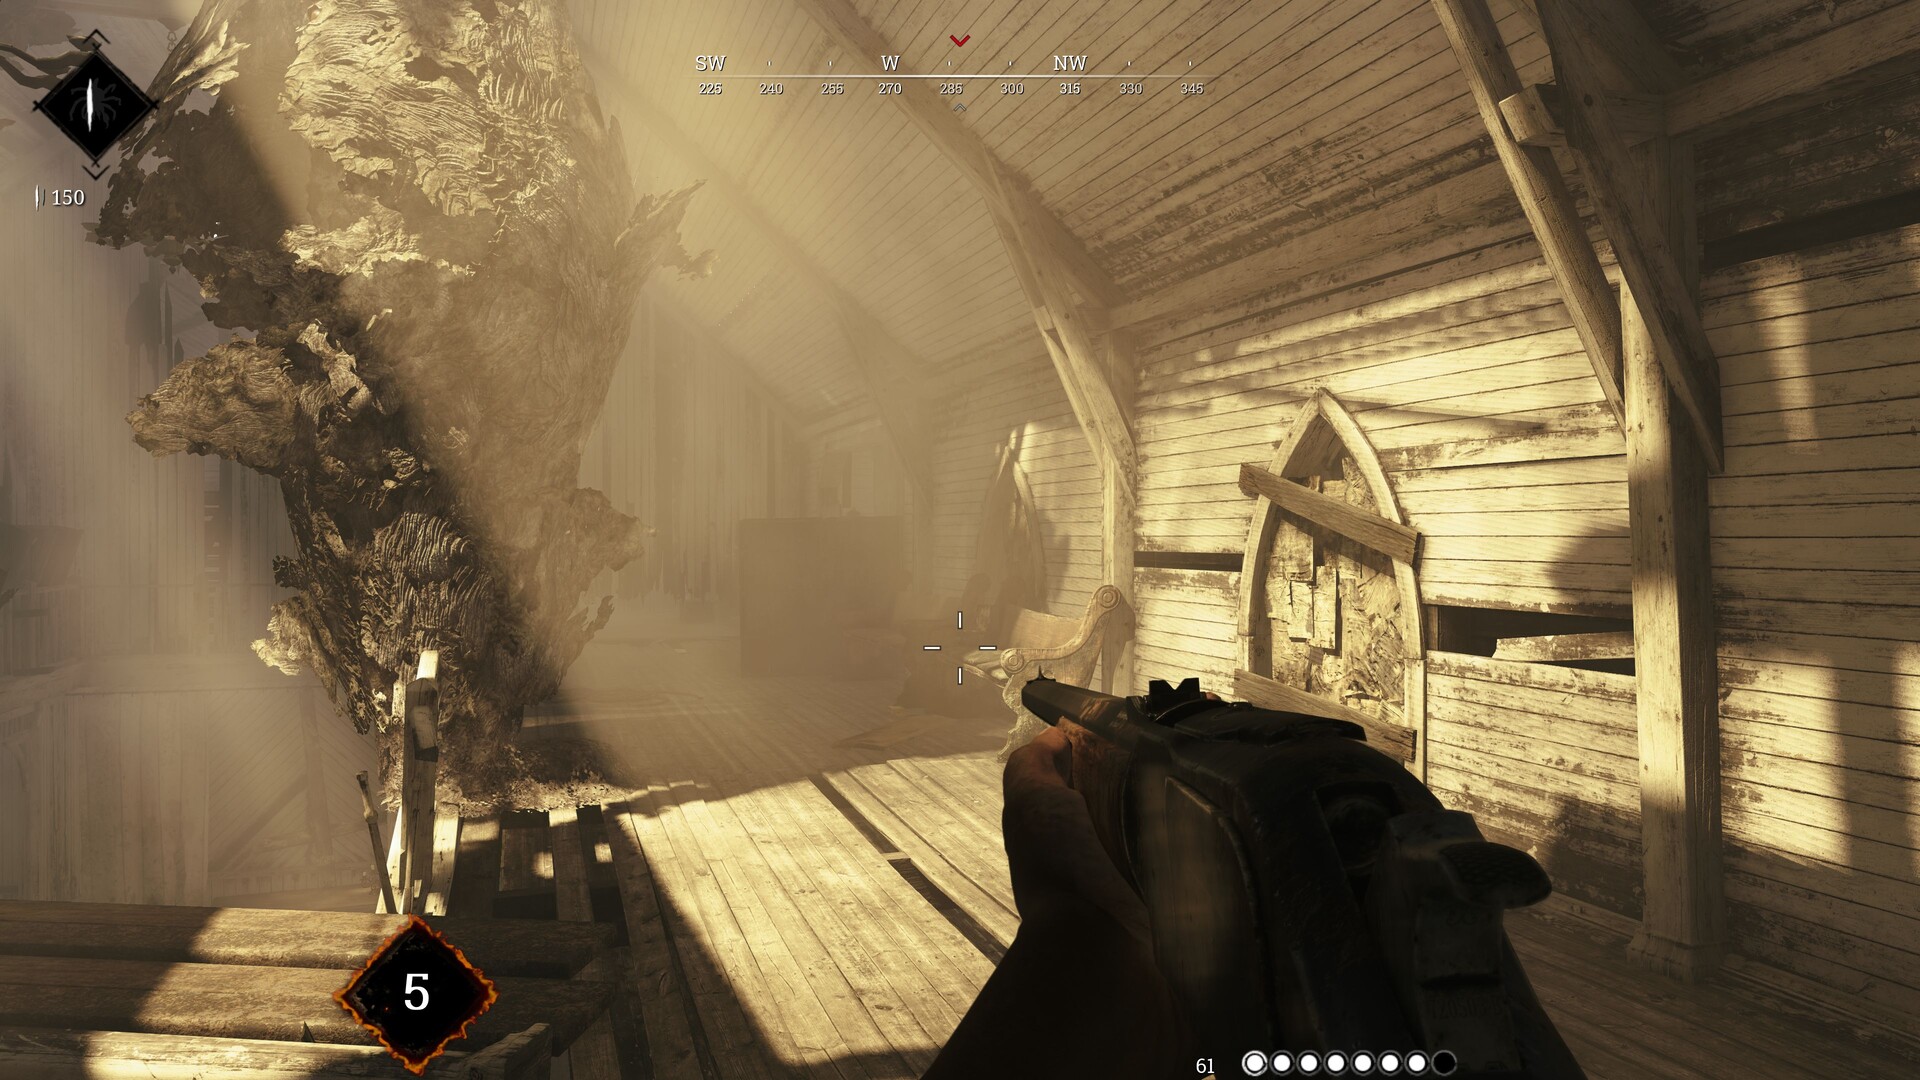
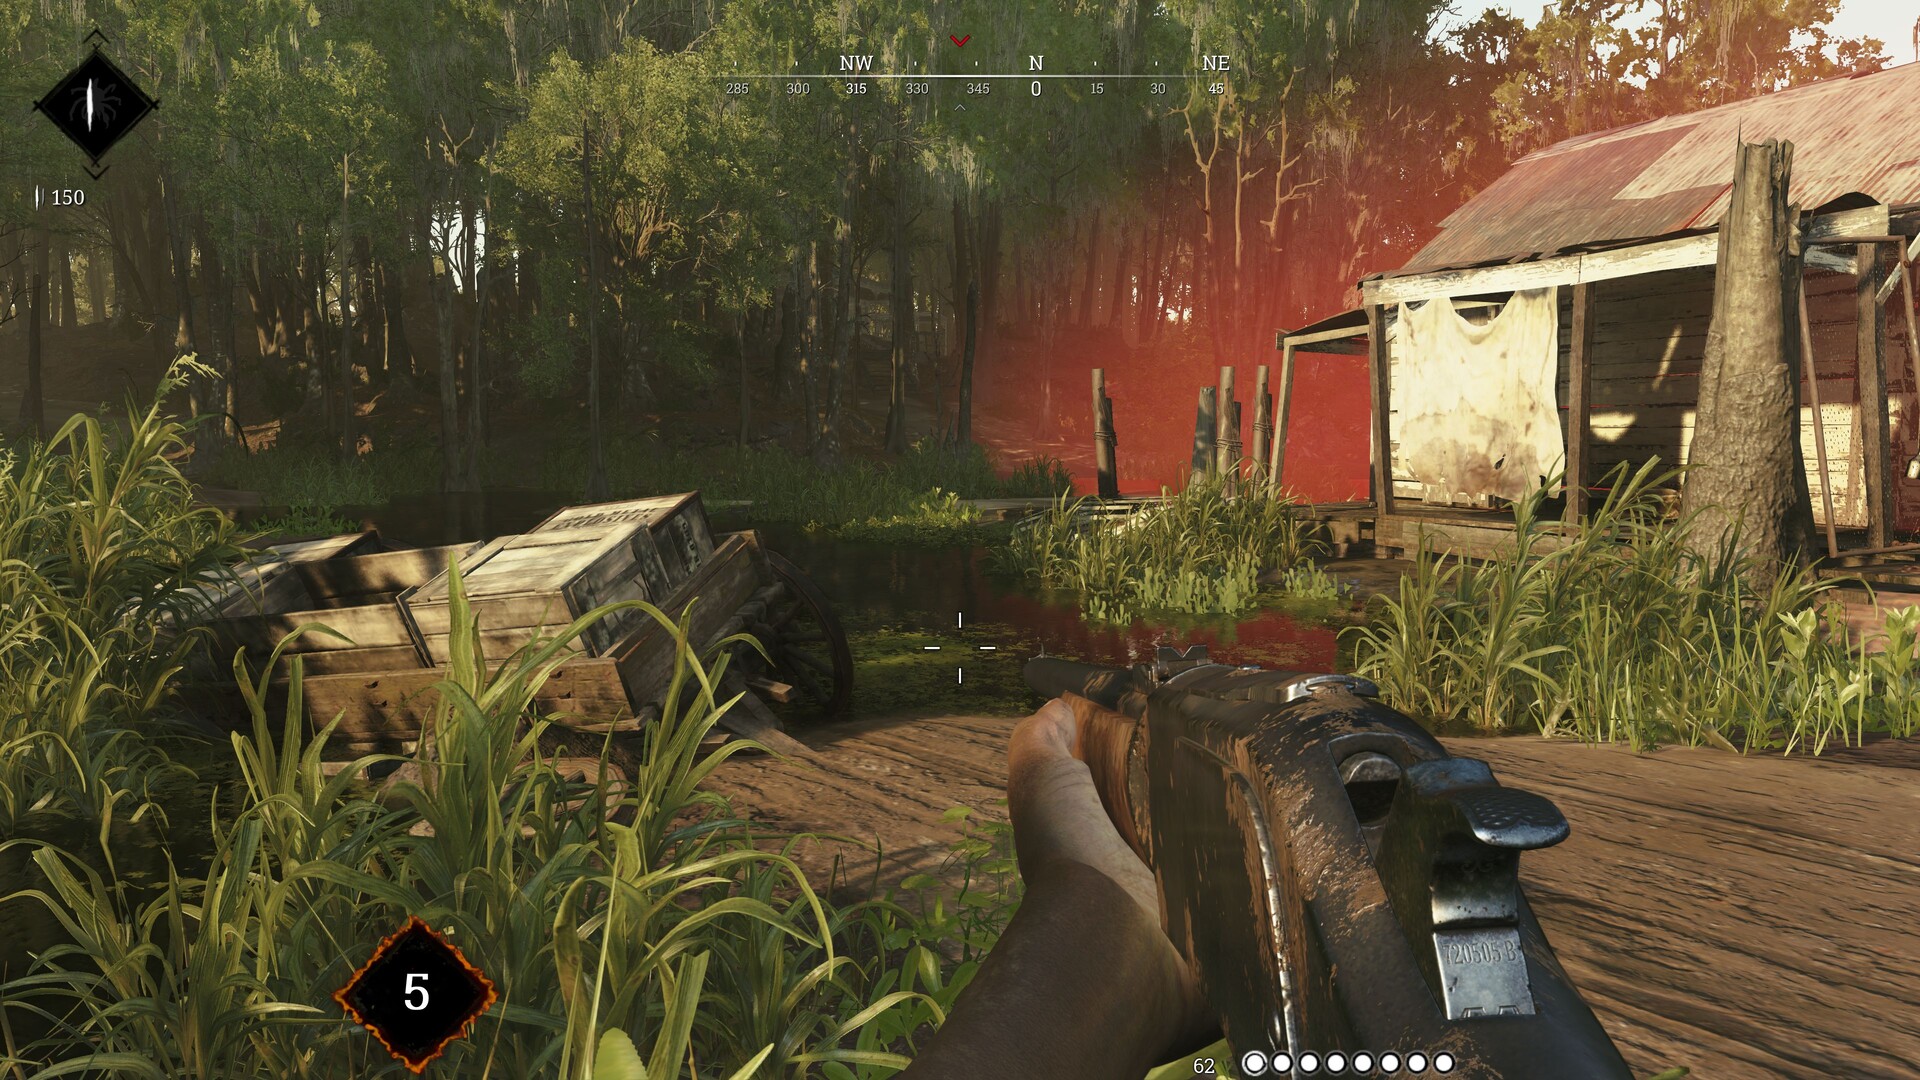
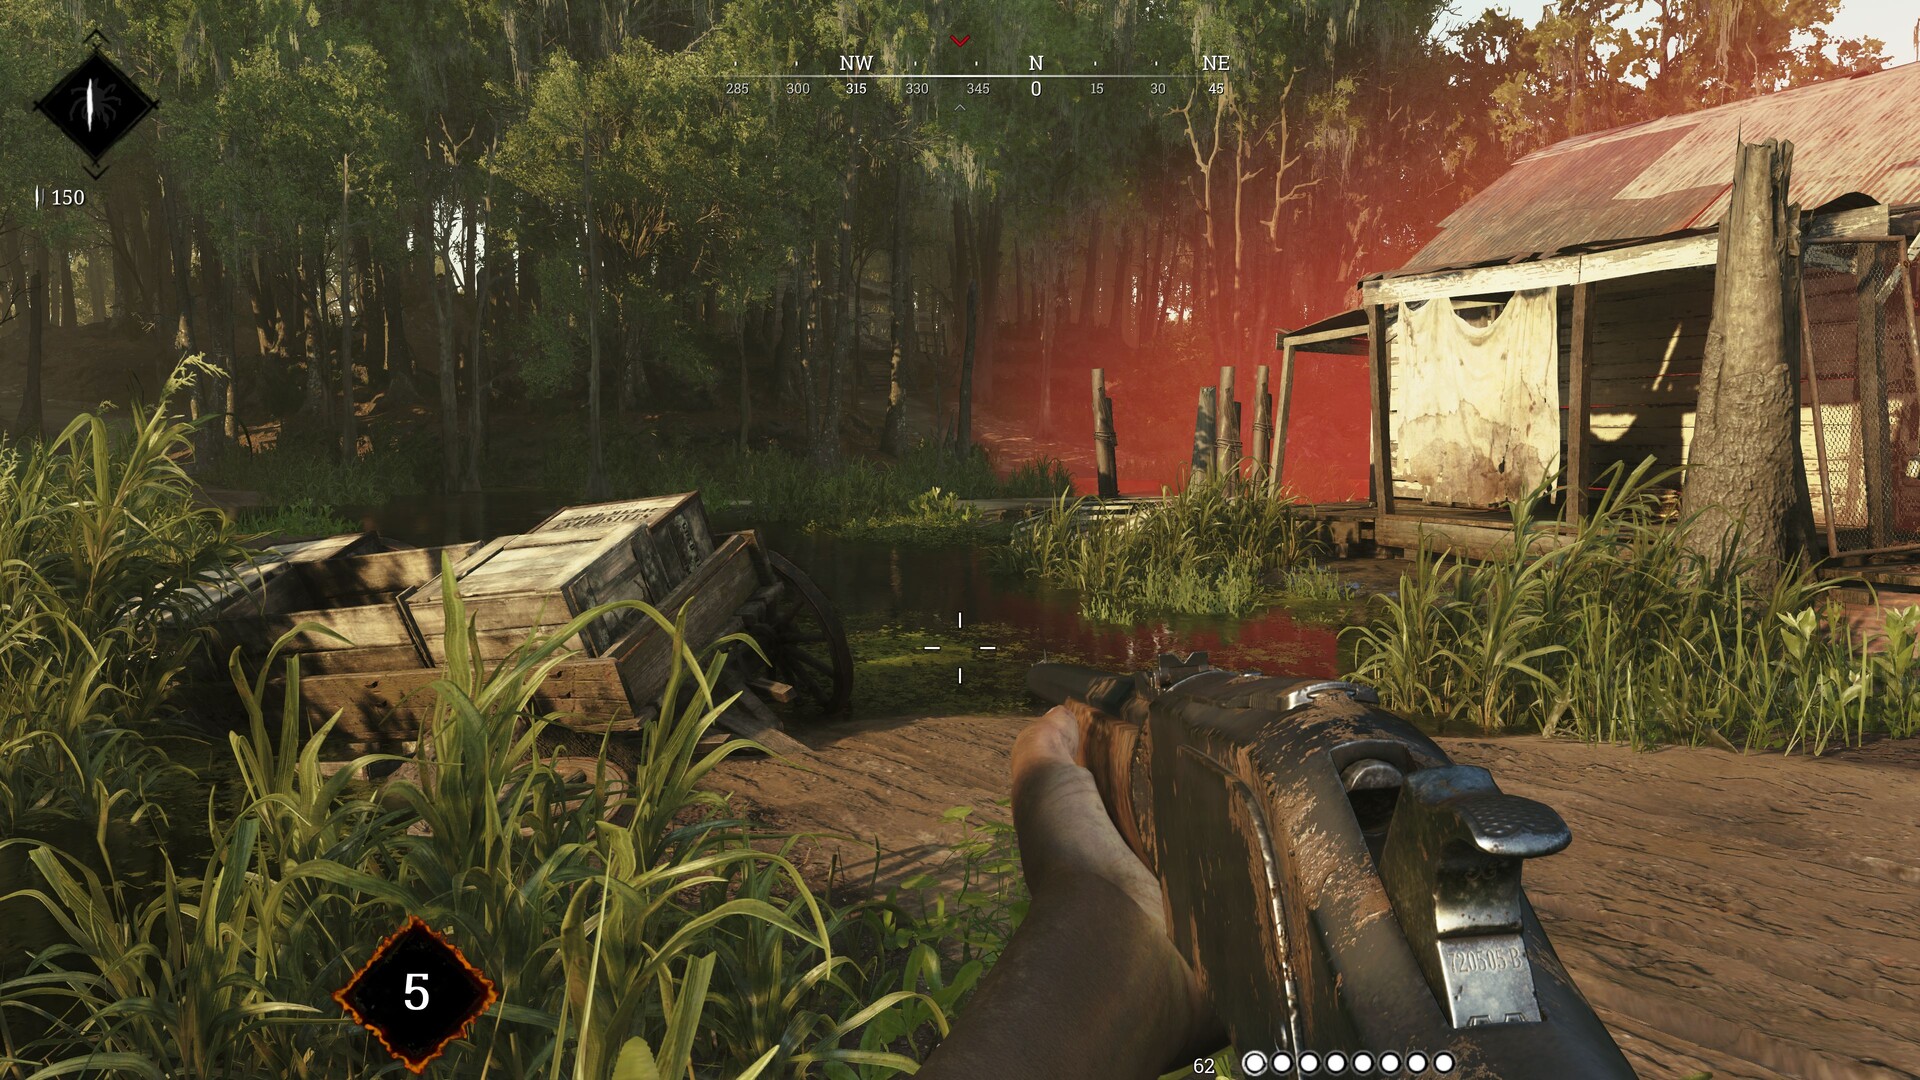
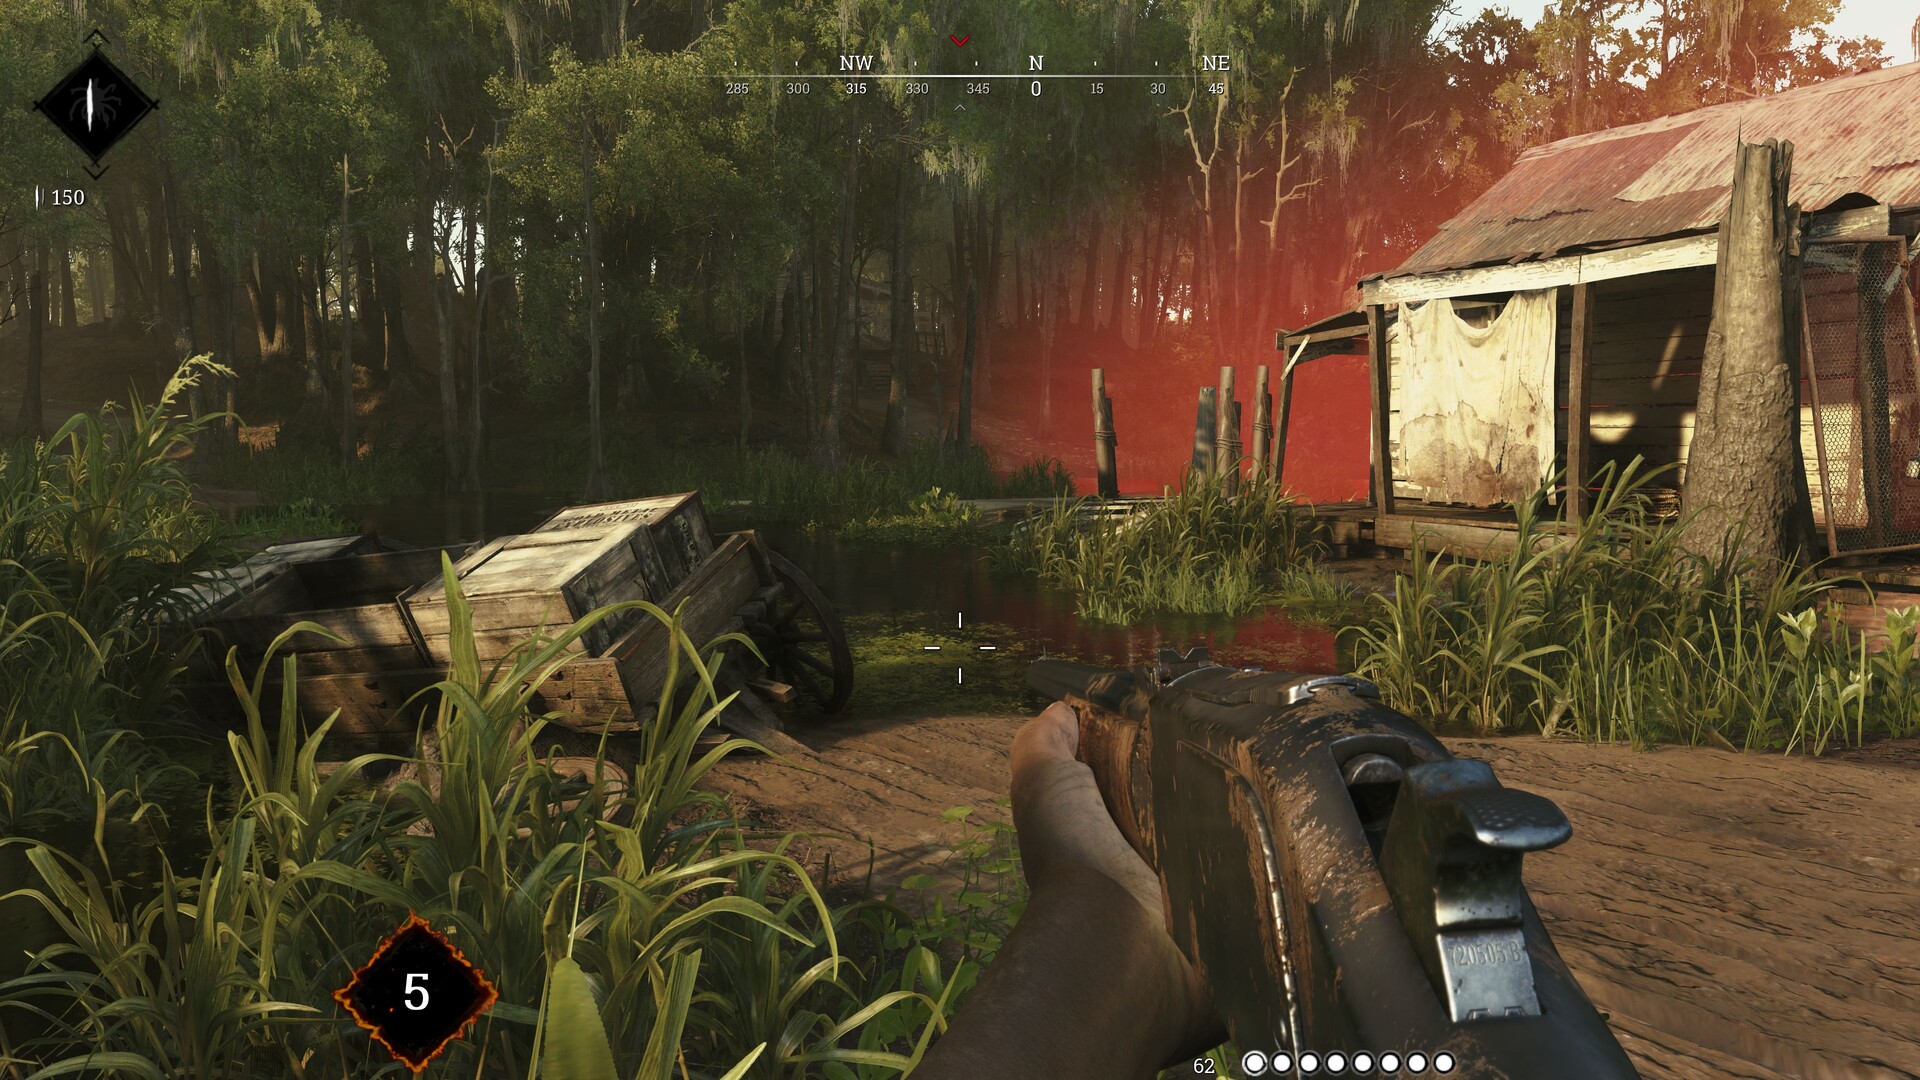
Otherwise, the technology behind the game is pretty solid. Particularly noteworthy are the game’s thick vegetation and the well-made play with lights and shadows, and more generally, color composition. These elements combined with the unique flair, a mix between horror and western,) create a great atmosphere, which is unique in the sphere of multiplayer games. We also liked the powerful and deep weapon experience (animations, feedback, sound) and the great mix between casual and hardcore in regards to difficulty. Thanks to a good tutorial and a clean, well-structured, and clearly arranged menu the entry threshold is much lower than on other much harder games, such as for example Escape from Tarkov.

Hunt Showdown
Hunt Showdown
Hunt Showdown
Hunt Showdown
Hunt Showdown
Hunt Showdown

Speaking of menus and settings, the PC version’s graphic settings are plentiful. The top part of the basic menu contains settings for (rendering) resolution and image mode while below that are 10 different settings for quality and details that can be configured comfortably via Global Graphics Quality. Modifications are enabled instantly and do not require a restart. If required, you can also enable a performance display, v-sync, and limit maximum FPS (which we disabled for our tests).

Hunt Showdown
Hunt Showdown
Hunt Showdown

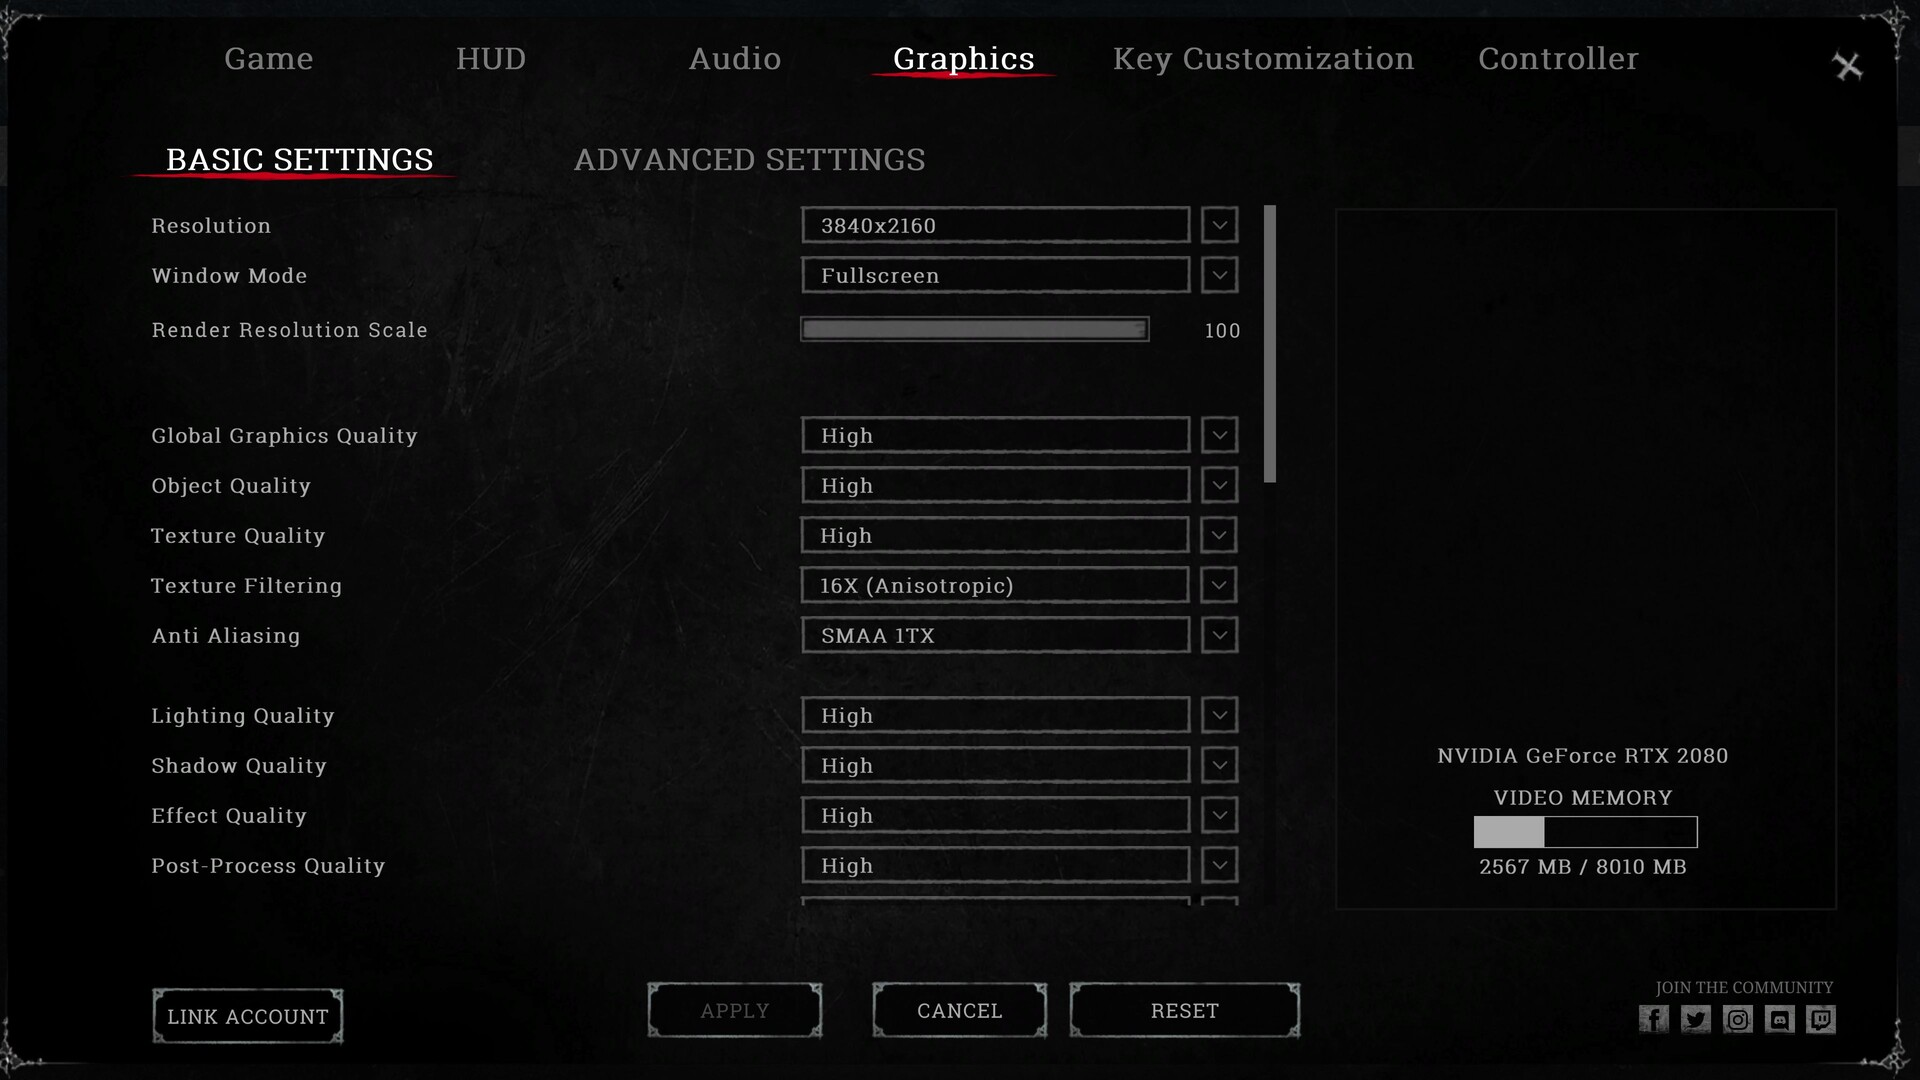
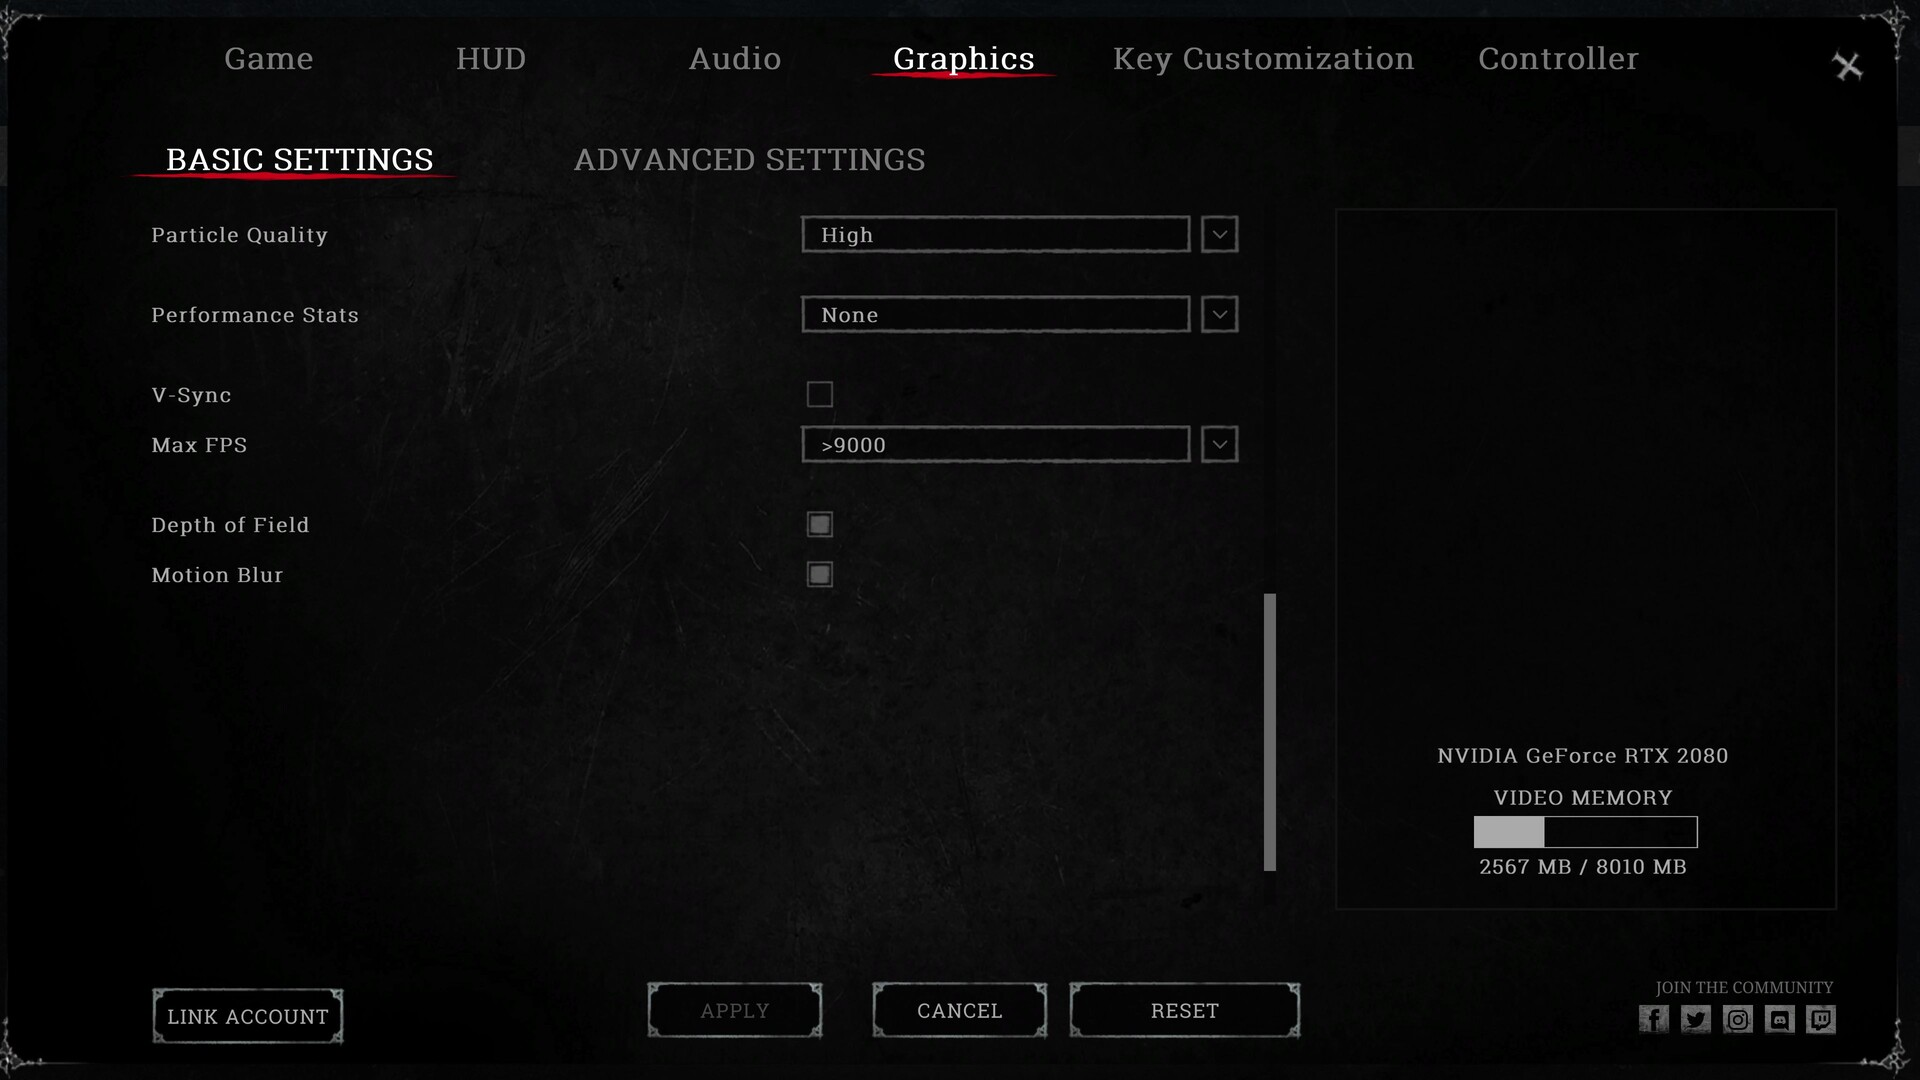
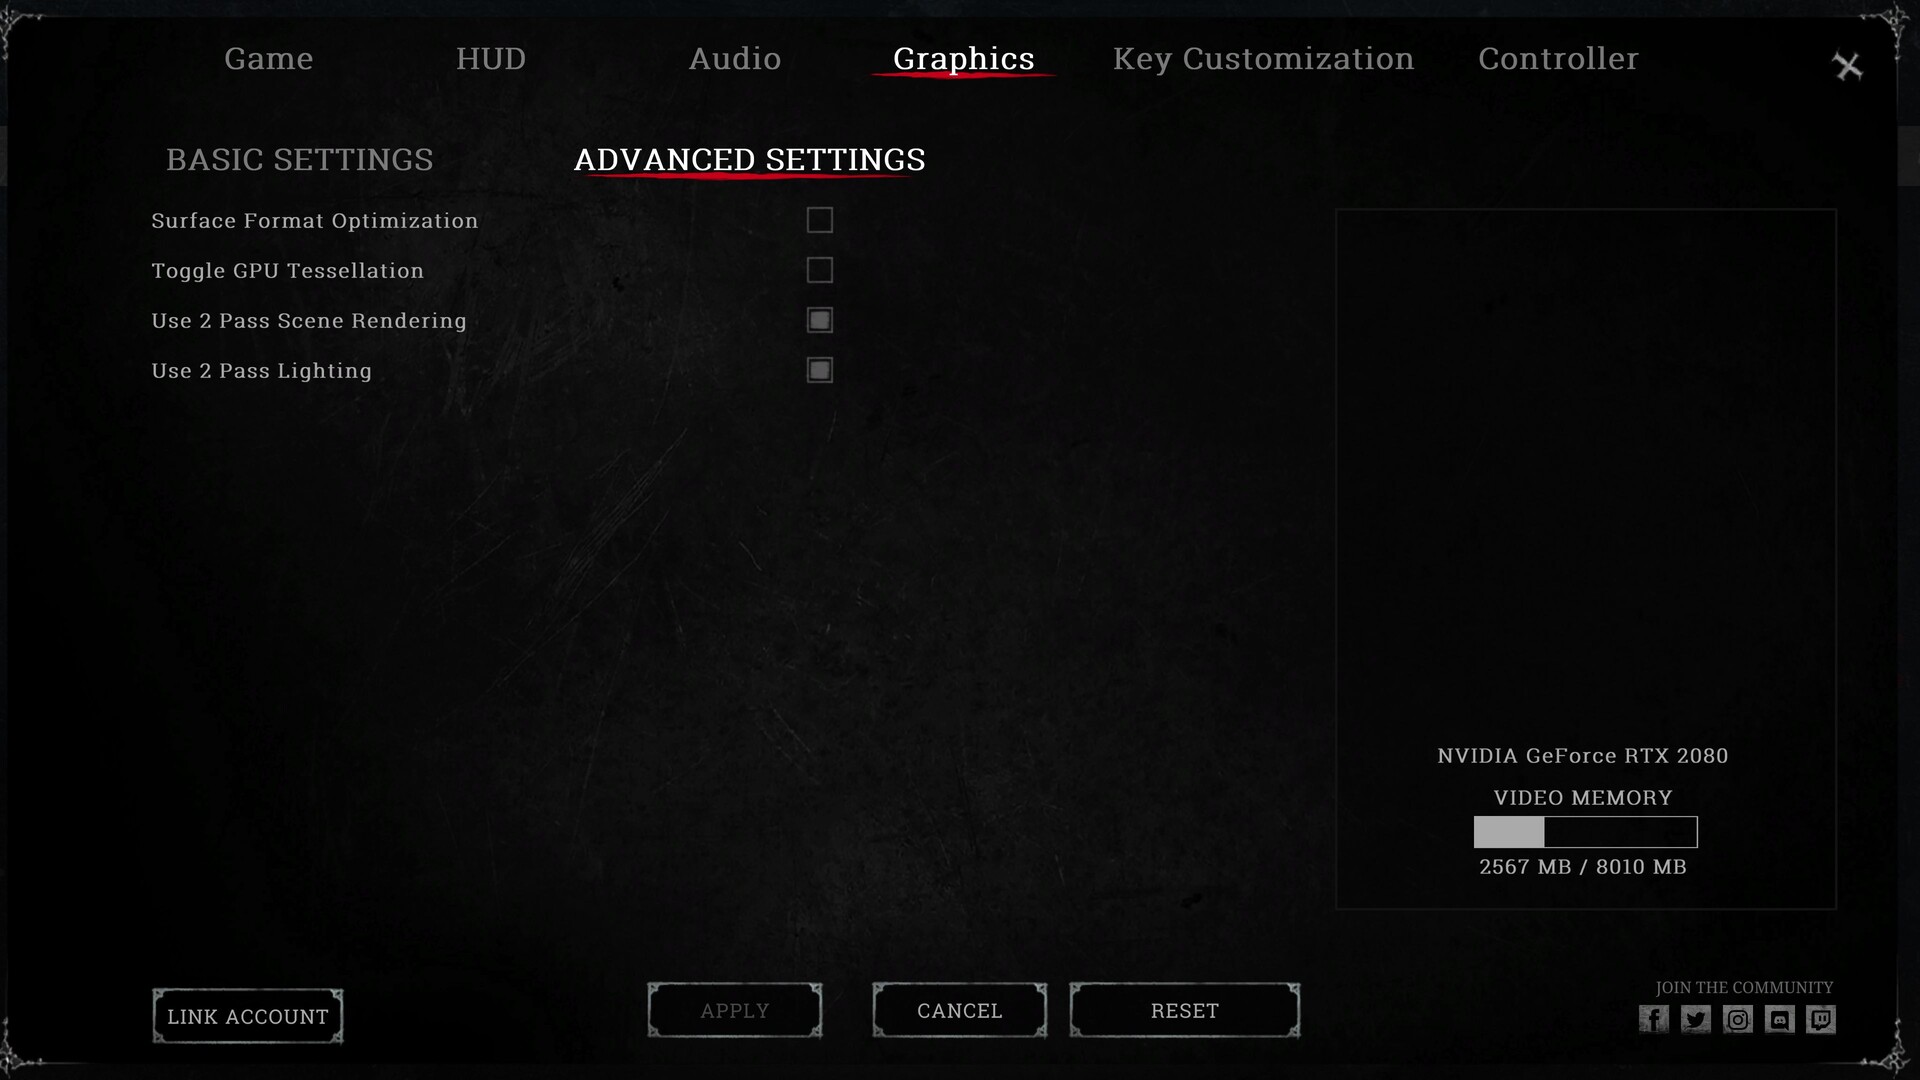
Another plus are the setting explanations and the built-in VRAM display. With a download size of around 24 GB the game is not particularly large, compared to other first-person shooters that require 50 or even 100 GB.

Low Preset
Low Preset
Medium Preset
Medium Preset
High Preset
High Preset
Low Preset
Low Preset
Medium Preset
Medium Preset
High Preset
High Preset

Benchmark

Our tests were conducted with the included tutorial as it does not contain any human enemies to deal with. Since spawning occurs at random spots throughout the game the benchmarks were not always identical. However, due to the constant frame rates this difference was barely noticeable in the final results. We use Fraps to record a 30 second sprint on a street. See the video below for an example. In order to enjoy Hunt Showdown smoothly and without frame drops you should achieve at least 45 FPS, or even 60 FPS for a completely smooth and trouble-free gaming experience.

Results

FHD (1920 x 1080)

For a first-person shooter, Hunt Showdown’s hardware requirements are mediocre. Playing in FHD resolution in the High preset the game will run fine on mid-range GPUs such as a GeForce GTX 1650 or GTX 1060.

Hunt Showdown
    1920x1080 High Preset     1920x1080 Medium Preset
NVIDIA GeForce RTX 2080 Ti (Desktop)
MSI GeForce RTX 2080 Ti, i9-9900K
170 (157min) fps ∼42%
200 (177min) fps ∼43%
NVIDIA GeForce RTX 2080 (Desktop)
MSI GeForce RTX 2080, i9-9900K
145 (139min) fps ∼36%
164 (150min) fps ∼36%
NVIDIA GeForce RTX 2080 Mobile
MSI GT76 Titan DT 9SG, i9-9900K
135 (125min) fps ∼34%
155 (146min) fps ∼34%
NVIDIA GeForce RTX 2070 (Desktop)
MSI GeForce RTX 2070, i9-9900K
125 (116min) fps ∼31%
152 (140min) fps ∼33%
NVIDIA GeForce GTX 1080 Ti (Desktop)
Aorus Z370 Ultra Gaming Desktop DDR4-2666, i7-8086K
123 (116min) fps ∼31%
NVIDIA GeForce RTX 2070 Mobile
MSI GP65 Leopard 9SF, i7-9750H
105 (96min) fps ∼26%
123 (113min) fps ∼27%
NVIDIA GeForce RTX 2060 (Desktop)
MSI GeForce RTX 2060, i9-9900K
104 (95min) fps ∼26%
120 (112min) fps ∼26%
NVIDIA GeForce GTX 1080 Mobile
Alienware 17 R4, i7-7820HK
93.8 (79min) fps ∼23%
114 (98min) fps ∼25%
NVIDIA GeForce RTX 2060 Mobile
MSI GE65 Raider 9SE, i7-9750H
87.4 (81min) fps ∼22%
109 (101min) fps ∼24%
NVIDIA GeForce GTX 1070 Mobile
Asus G752VS, 6820HK
79.1 (71min) fps ∼20%
97.5 (89min) fps ∼21%
NVIDIA GeForce GTX 1660 Ti Mobile
MSI GP65 Leopard 9SD, i7-9750H
73.5 (69min) fps ∼18%
89.3 (82min) fps ∼19%
AMD Radeon RX 5500M
MSI Alpha 15, R7 3750H
58.1 (52min) fps ∼14%
72.4 (65min) fps ∼16%
NVIDIA GeForce GTX 1060 Mobile
MSI GT62VR, 6820HK
53.4 (50min) fps ∼13%
67.4 (62min) fps ∼15%
NVIDIA GeForce GTX 1650 Mobile
MSI GP75 Leopard 9SC, i7-9750H
48.3 (43min) fps ∼12%
57.9 (45min) fps ∼13%
NVIDIA GeForce GTX 1050 Ti Mobile
MSI GE72 7RE, i7-7700HQ
34.3 (31min) fps ∼9%
42.7 (40min) fps ∼9%
NVIDIA GeForce GTX 1050 Ti (Desktop)
Aorus Z370 Ultra Gaming Desktop MSI GTX 1050 Ti, i7-8086K
33.5 (30min) fps ∼8%
41.6 (39min) fps ∼9%
NVIDIA GeForce GTX 1050 Mobile
MSI GL62M 7RD, i7-7700HQ
28.9 (26min) fps ∼7%
36.2 (33min) fps ∼8%

QHD (2560 x 1440)

In order to ensure a smooth gaming experience in QHD and the High preset you will need at least a GeForce GTX 1660 Ti or GTX 1070, which at the time of writing were right in-between mid-range and high-end.

Hunt Showdown
    2560x1440 High Preset
NVIDIA GeForce RTX 2080 Ti (Desktop), i9-9900K
MSI GeForce RTX 2080 Ti
125 (118min) fps ∼45%
NVIDIA GeForce RTX 2080 (Desktop), i9-9900K
MSI GeForce RTX 2080
98.4 (90min) fps ∼35%
NVIDIA GeForce RTX 2080 Mobile, i9-9900K
MSI GT76 Titan DT 9SG
85.7 (81min) fps ∼31%
NVIDIA GeForce GTX 1080 Ti (Desktop), i7-8086K
Aorus Z370 Ultra Gaming Desktop DDR4-2666
79.7 (70min) fps ∼28%
NVIDIA GeForce RTX 2070 (Desktop), i9-9900K
MSI GeForce RTX 2070
78.8 (73min) fps ∼28%
NVIDIA GeForce RTX 2070 Mobile, i7-9750H
MSI GP65 Leopard 9SF
65.8 (62min) fps ∼24%
NVIDIA GeForce RTX 2060 (Desktop), i9-9900K
MSI GeForce RTX 2060
63.8 (60min) fps ∼23%
NVIDIA GeForce GTX 1080 Mobile, i7-7820HK
Alienware 17 R4
59.9 (56min) fps ∼21%
NVIDIA GeForce RTX 2060 Mobile, i7-9750H
MSI GE65 Raider 9SE
51.7 (49min) fps ∼18%
NVIDIA GeForce GTX 1080 Max-Q, i7-7700HQ
Asus Zephyrus GX501
50.7 (48min) fps ∼18%
NVIDIA GeForce GTX 1070 Mobile, 6820HK
Asus G752VS
48.2 (45min) fps ∼17%
NVIDIA GeForce GTX 1660 Ti Mobile, i7-9750H
MSI GP65 Leopard 9SD
47.4 (42min) fps ∼17%
AMD Radeon RX 5500M, R7 3750H
MSI Alpha 15
35.4 (32min) fps ∼13%
NVIDIA GeForce GTX 1060 Mobile, 6820HK
MSI GT62VR
31.9 (29min) fps ∼11%
NVIDIA GeForce GTX 1650 Mobile, i7-9750H
MSI GP75 Leopard 9SC
27.1 (22min) fps ∼10%
NVIDIA GeForce GTX 1050 Ti Mobile, i7-7700HQ
MSI GE72 7RE
19.9 (18min) fps ∼7%
NVIDIA GeForce GTX 1050 Mobile, i7-7700HQ
MSI GL62M 7RD
16.6 (15min) fps ∼6%

UHD (3840 x 2160)

Only when playing Hunt Showdown in UHD resolution does it suddenly turn into a resource hog. At this resolution, even the currently fastest available notebook GPU – a GeForce RTX 2080 – is not powerful enough to avoid frame drops.

Hunt Showdown
    3840x2160 High Preset
NVIDIA GeForce RTX 2080 Ti (Desktop), i9-9900K
MSI GeForce RTX 2080 Ti
60.4 (58min) fps ∼46%
NVIDIA GeForce RTX 2080 (Desktop), i9-9900K
MSI GeForce RTX 2080
45.4 (43min) fps ∼35%
NVIDIA GeForce RTX 2080 Mobile, i9-9900K
MSI GT76 Titan DT 9SG
41.5 (39min) fps ∼32%
NVIDIA GeForce GTX 1080 Ti (Desktop), i7-8086K
Aorus Z370 Ultra Gaming Desktop DDR4-2666
37.5 (32min) fps ∼29%
NVIDIA GeForce RTX 2070 (Desktop), i9-9900K
MSI GeForce RTX 2070
37 (35min) fps ∼28%
NVIDIA GeForce RTX 2070 Mobile, i7-9750H
MSI GP65 Leopard 9SF
31.3 (29min) fps ∼24%
NVIDIA GeForce RTX 2060 (Desktop), i9-9900K
MSI GeForce RTX 2060
30.3 (28min) fps ∼23%
NVIDIA GeForce GTX 1080 Mobile, i7-7820HK
Alienware 17 R4
28.2 (26min) fps ∼22%
NVIDIA GeForce RTX 2060 Mobile, i7-9750H
MSI GE65 Raider 9SE
24.8 (23min) fps ∼19%
NVIDIA GeForce GTX 1080 Max-Q, i7-7700HQ
Asus Zephyrus GX501
23.8 (22min) fps ∼18%
NVIDIA GeForce GTX 1070 Mobile, 6820HK
Asus G752VS
22.6 (21min) fps ∼17%
NVIDIA GeForce GTX 1660 Ti Mobile, i7-9750H
MSI GP65 Leopard 9SD
21.2 (20min) fps ∼16%
AMD Radeon RX 5500M, R7 3750H
MSI Alpha 15
15.6 (14min) fps ∼12%
NVIDIA GeForce GTX 1060 Mobile, 6820HK
MSI GT62VR
14.6 (14min) fps ∼11%
NVIDIA GeForce GTX 1650 Mobile, i7-9750H
MSI GP75 Leopard 9SC
12.5 (11min) fps ∼10%
NVIDIA GeForce GTX 1050 Ti Mobile, i7-7700HQ
MSI GE72 7RE
10.6 (9min) fps ∼8%
NVIDIA GeForce GTX 1050 Mobile, i7-7700HQ
MSI GL62M 7RD
8 (7min) fps ∼6%

Note

Please keep in mind that running these gaming tests is incredibly time consuming and often obstructed by installation and/or activation limits. Accordingly, we can only present you with some results at this point and are going to add additional benchmark results in the coming days and weeks.

Overview

Show Restrictions
PosModel< PrevNext >Hunt Showdown
 Hunt Showdown (2020)
low
1280x720
Low Preset
med.
1920x1080
Medium Preset
high
1920x1080
High Preset
QHD
2560x1440
High Preset
4K
3840x2160
High Preset
NVIDIA GeForce RTX 4090 Laptop GPU
367
285
262
168
NVIDIA GeForce RTX 3090
254.5n2
242.25n2
222n2
200.7n2
116.9n2
NVIDIA GeForce RTX 3080
248n2
202.5n2
200n2
171.5n2
101.4n2
AMD Radeon RX 6800 XT
286
235
173
145
73.5
NVIDIA Titan RTX
235
194
171
124
61.8
NVIDIA GeForce RTX 3080 Ti Laptop GPU
243.2
201.95n2
174.3n2
110.3n2
54.3
NVIDIA GeForce RTX 3070
195n2
172n2
158.5n2
133n2
72.2n2
NVIDIA GeForce RTX 2080 Ti (Desktop)
235
200
170
125
60.4
NVIDIA GeForce RTX 3080 Laptop GPU
111n3
74.65n2
37.3n2
NVIDIA GeForce RTX 3070 Ti Laptop GPU
139
120.95n2
78.8n2
36.5
NVIDIA GeForce RTX 2080 Super (Desktop)
254
170
142
96.6
46.8
NVIDIA GeForce RTX 2080 (Desktop)
225
164
145
98.4
45.4
NVIDIA GeForce RTX 2080 Super Mobile
151
126.5n2
87.75n2
62n2
NVIDIA GeForce RTX 3070 Laptop GPU
98.4
62.3
30.9
AMD Radeon RX 6800S
137
112
70.8
33.9
NVIDIA GeForce RTX 2080 Mobile
264
155
135
85.7
41.5
AMD Radeon RX 6700M
125
100
NVIDIA GeForce GTX 1080 Ti (Desktop)
123
79.7
37.5
NVIDIA Titan X Pascal
237
152
117
78
35.2
PosModel< PrevNext >Hunt Showdown
low med. high QHD 4K
NVIDIA GeForce RTX 2070 Super (Desktop)
254n2
160n2
128n2
80.9n2
39.8n2
AMD Radeon VII
213.4
159.4
142.5
100.8
53.8
AMD Radeon RX 5700 XT (Desktop)
195
128
112
71.4
33.6
NVIDIA GeForce RTX 2070 (Desktop)
229
152
125
78.8
37
NVIDIA GeForce RTX 3060 Laptop GPU
100.65n2
69.8
34.4
NVIDIA GeForce RTX 2070 Super Mobile
136
113
74
34.1
NVIDIA GeForce RTX 2080 Super Max-Q
207.4
120.2n2
101.5n2
68.8
32.4
NVIDIA GeForce RTX 2060 Super (Desktop)
252
137
105
71
33.1
AMD Radeon RX 5700 (Desktop)
210
124
99.7
60.1
29.9
AMD Radeon RX 6700S
124.7
99.3
72
NVIDIA GeForce RTX 2070 Mobile
194.6n2
123.5n2
101.7n3
65.8
31.3
NVIDIA GeForce RTX 2080 Max-Q
184
134
121
NVIDIA GeForce RTX 2060 (Desktop)
228
120
104
63.8
30.3
AMD Radeon RX Vega 64
208
126
92
59.3
28
NVIDIA GeForce GTX 1080 Mobile
185
114
93.8
59.9
28.2
NVIDIA GeForce RTX 2070 Super Max-Q
109
94.2n2
56.8
27.4
NVIDIA GeForce RTX 2070 Max-Q
126
72.5
64
42.3
26.3
NVIDIA GeForce RTX 2060 Mobile
183.8n2
101.6n2
81.2n2
51.7
24.8
AMD Radeon RX 5600 XT (Desktop)
225
111
87.3
57.6
27.2
NVIDIA GeForce GTX 1080 Max-Q
100
50.7
23.8
PosModel< PrevNext >Hunt Showdown
low med. high QHD 4K
NVIDIA GeForce GTX 1070 Mobile
184
97.5
79.1
48.2
22.6
NVIDIA GeForce RTX 2060 Max-Q
194.2
96.3
75.7
NVIDIA GeForce GTX 1660 Ti (Desktop)
195
100
82
47.2
24.2
NVIDIA GeForce GTX 1660 Super (Desktop)
224
95.6
77
48.9
21.6
AMD Radeon RX 5500 XT (Desktop)
159.8
103.3
84.2
53.5
26
Intel Arc A730M
88.2
72.3
50.1
AMD Radeon RX 5600M
150.7
91.3
66.2
NVIDIA GeForce GTX 1660 Ti Mobile
166
89.3
71.3n2
47.4
21.2
NVIDIA GeForce RTX 3050 Ti Laptop GPU
86.7n3
79n3
46.7
23.4
NVIDIA GeForce GTX 1660 (Desktop)
211
82.1
64.8
39.7
19.8
NVIDIA GeForce RTX 3050 4GB Laptop GPU
73.5
67.7
42
19.5
NVIDIA GeForce GTX 1660 Ti Max-Q
176.8
81.2
63.3
AMD Radeon RX 6500M
124.8
68.9
57.3
AMD Radeon RX 590 (Desktop)
184
73.4
64.3
38.8
18.7
NVIDIA GeForce GTX 1060 Mobile
147
67.4
53.4
31.9
14.6
NVIDIA GeForce GTX 1650 Ti Mobile
150
58.5
47.5
AMD Radeon RX 5500M
105
72.4
57.3n2
35.4
15.6
NVIDIA GeForce RTX 2050 Mobile
112.2
51
43
NVIDIA GeForce GTX 1650 (Desktop)
145.5n2
55.5n2
45.8n2
28.2n2
19.1n2
NVIDIA GeForce GTX 1650 Mobile
148.2n2
57.35n2
47.35n2
27.1
12.5
PosModel< PrevNext >Hunt Showdown
low med. high QHD 4K
AMD Radeon RX 5300M
137
53
43.2
NVIDIA GeForce GTX 1650 Ti Max-Q
115.7
50.1
41.8
NVIDIA GeForce GTX 1650 Max-Q
114.8
45.6
35.3
NVIDIA Quadro T1000 (Laptop)
134.1
51
44.4
AMD Radeon RX Vega M GH
133
53.3
41.3
24.5
11
NVIDIA GeForce GTX 1050 Ti Mobile
107
42.7
34.3
19.9
10.6
NVIDIA GeForce GTX 1050 Ti (Desktop)
109
41.6
33.5
AMD Radeon 680M
95.8
38
29.5
NVIDIA GeForce MX450
76.6
29.2
22
AMD Radeon RX Vega M GL / 870
90.6
35.3
29.5
18.9
NVIDIA GeForce GTX 1050 Mobile
92.75n2
36.25n2
28.4n2
16.6
8
NVIDIA GeForce GTX 1050 Max-Q
83.1
32.5
26.4
15.4
7.5
AMD Radeon 660M
70.8
24.2
19.2
Intel Iris Xe MAX Graphics
45.4
19.9
15
AMD Radeon Pro 560X
71
23.7
20.6
Intel Iris Xe Graphics G7 96EUs
49n2
28.3
NVIDIA GeForce MX350
59.1n2
25.75n2
21.4n2
NVIDIA GeForce GT 1030 (Desktop)
51.6
17
14.6
NVIDIA GeForce MX250
52.6
18.2
14
NVIDIA GeForce MX330
51.6
19
15.1
PosModel< PrevNext >Hunt Showdown
low med. high QHD 4K
NVIDIA GeForce MX150
53.8
21.2
16.6
Intel Iris Xe Graphics G7 80EUs
39.55n2
16.45n2
13.6n2
AMD Radeon 540X
37.6
13.5
11.1
Intel UHD Graphics 64EUs (Alder Lake 12th Gen)
57.3
22
17.9
Intel Iris Plus Graphics G7 (Ice Lake 64 EU)
30.7
13.4
9.9
AMD Radeon RX Vega 10
26.7
11.4
Intel UHD Graphics Xe G4 48EUs
29.5
13.6
11.6
Intel UHD Graphics 770
40.7
16.1
AMD Radeon RX Vega 8 (Ryzen 4000/5000)
49.3
16.6
14.3
9.05
AMD Radeon RX Vega 7
44.1n2
16.5n2
13.75n2
NVIDIA GeForce MX130
17.9
6.32
AMD Radeon RX Vega 8 (Ryzen 2000/3000)
28.7n2
11.3n2
Intel Iris Plus Graphics G4 (Ice Lake 48 EU)
26.5
11.5
NVIDIA GeForce 930MX
24.5
9.2
NVIDIA GeForce 930M
22.6
Intel Iris Graphics 550
21
8.78
AMD Radeon 530
20.7
9
7.7
AMD Radeon RX Vega 6 (Ryzen 4000/5000)
36.1n2
13.5
11.5
NVIDIA GeForce MX110
25.6
9.8
AMD Radeon RX Vega 6 (Ryzen 2000/3000)
19.7
7.8
PosModel< PrevNext >Hunt Showdown
low med. high QHD 4K
AMD Radeon RX Vega 5
32.3
12.2
Intel UHD Graphics G1 (Ice Lake 32 EU)
20.9
7.8
Intel HD Graphics 630
13.3
5.5
AMD Radeon R5 (Bristol Ridge)
10.1
Intel UHD Graphics 620
14
AMD Radeon R5 M255
17.9
AMD Radeon RX Vega 3
10.3
6
NVIDIA GeForce GT 720M
11.2
Intel HD Graphics 4600
8.7
Intel HD Graphics 5500
9.4
Intel UHD Graphics 610
8.59
Intel HD Graphics 4400
8.1
AMD Radeon R4 (Stoney Ridge)
7.1
(-) * Smaller values are better. / n123 Number of benchmarks for this median value / * Approximate position


Legend
5Stutters – This game is very likely to stutter and have poor frame rates. Based on all known benchmarks using the specified graphical settings, average frame rates are expected to fall below 25fps
May Stutter – This graphics card has not been explicitly tested on this game. Based on interpolated information from surrounding graphics cards of similar performance levels, stutters and poor frame rates are expected.
30Fluent – Based on all known benchmarks using the specified graphical settings, this game should run at or above 25fps
40Fluent – Based on all known benchmarks using the specified graphical settings, this game should run at or above 35fps
60Fluent – Based on all known benchmarks using the specified graphical settings, this game should run at or above 58fps
May Run Fluently – This graphics card has not been explicitly tested on this game. Based on interpolated information from surrounding graphics cards of similar performance levels, fluent frame rates are expected.
?Uncertain – This graphics card experienced unexpected performance issues during testing for this game. A slower card may be able to achieve better and more consistent frame rates than this particular GPU running the same benchmark scene.
Uncertain – This graphics card has not been explicitly tested on this game and no reliable interpolation can be made based on the performances of surrounding cards of the same class or family.
The value in the fields displays the average frame rate of all values in the database. Move your cursor over the value to see individual results.

Test systems

Device Graphics Card Processor RAM Operating System
Desktop-PC I MSI GeForce RTX 2080 Ti (11 GB GDDR6)
MSI GeForce RTX 2080 (8 GB GDDR6)
MSI GeForce RTX 2070 (8 GB GDDR6)
MSI GeForce RTX 2060 (6 GB GDDR6)
Intel Core i9-9900K 4 x 8 GB DDR4 Windows 10 64 Bit
Desktop-PC II Nvidia GeForce GTX 1080 Ti (11 GB GDDR5X)
Asus GeForce GTX 980 Ti (6 GB GDDR5)
XFX Radeon R9 Fury (4 GB HBM)
Sapphire Radeon R9 290X (4 GB GDDR5)
Sapphire Radeon R9 280X (3 GB GDDR5)
MSI Radeon R7 370 (2 GB GDDR5)
Intel Core i7-8086K, Aorus Z370 Ultra Gaming 2 x 8 GB DDR4 Windows 10 64 Bit
Desktop-PC III Nvidia Titan RTX (24 GB GDDR6)
Nvidia GeForce RTX 2080 Super (8 GB GDDR6)
Nvidia GeForce RTX 2070 Super (8 GB GDDR6)
Nvidia GeForce RTX 2060 Super (8 GB GDDR6)
KFA2 GeForce RTX 2060 Super (8 GB GDDR6)
Nvidia Titan X (Pascal) (12 GB GDDR5X)
KFA2 GeForce GTX 1660 Super (6 GB GDDR6)
PNY GeForce GTX 1660 (6 GB GDDR5)
Gainward GeForce GTX 1650 (4 GB GDDR5)
Zotac GeForce GT 1030 (2 GB GDDR5)
AMD Radeon RX 5700 XT (8 GB GDDR6)
AMD Radeon RX 5700 (8 GB GDDR6)
AMD Radeon RX Vega 64 (8 GB HBM2)
XFX AMD Radeon RX 590 (8 GB GDDR5)
AMD Ryzen 9 3900X 2 x 8 GB DDR4 Windows 10 64 Bit
MSI GT76 Nvidia GeForce RTX 2080 (8 GB GDDR6) Intel Core i9-9900K 2 x 16 GB DDR4 Windows 10 64 Bit
MSI GP65 Nvidia GeForce RTX 2070 (8 GB GDDR6) Intel Core i7-9750H 2 x 16 GB DDR4 Windows 10 64 Bit
MSI GE65 Nvidia GeForce RTX 2060 (6 GB GDDR6) Intel Core i7-9750H 2 x 8 GB DDR4 Windows 10 64 Bit
MSI GP65 Nvidia GeForce GTX 1660 Ti (6 GB GDDR6) Intel Core i7-9750H 2 x 16 GB DDR4 Windows 10 64 Bit
MSI GP75 Nvidia GeForce GTX 1650 (4 GB GDDR5) Intel Core i7-9750H 2 x 8 GB DDR4 Windows 10 64 Bit
Alienware 17 R4 Nvidia GeForce GTX 1080 (8 GB GDDR5X) Intel Core i7-7820HK 2 x 16 GB DDR4 Windows 10 64 Bit
Asus G752VS Nvidia GeForce GTX 1070 (8 GB GDDR5) Intel Core i7-6820HK 2 x 16 GB DDR4 Windows 10 64 Bit
MSI GT62VR Nvidia GeForce GTX 1060 (6 GB GDDR5) Intel Core i7-6820HK 2 x 8 GB DDR4 Windows 10 64 Bit
MSI GE72 Nvidia GeForce GTX 1050 Ti (2 GB GDDR5) Intel Core i7-7700HQ 2 x 4 GB DDR4 Windows 10 64 Bit
MSI GL62 Nvidia GeForce GTX 1050 (2 GB GDDR5) Intel Core i7-7700HQ 2 x 4 GB DDR4 Windows 10 64 Bit
MSI GE72 Nvidia GeForce GTX 965M (2 GB GDDR5) Intel Core i7-6700HQ 1 x 8 GB DDR4 Windows 10 64 Bit
MSI PE60 Nvidia GeForce GTX 950M (2 GB GDDR5) Intel Core i7-6700HQ 2 x 4 GB DDR4 Windows 10 64 Bit
MSI CX72 Nvidia GeForce 940MX (2 GB DDR3) Intel Core i7-6700HQ 2 x 8 GB DDR4 Windows 10 64 Bit
MSI GP62 Nvidia GeForce 940M (2 GB DDR3) Intel Core i7-5700HQ 1 x 8 GB DDR3 Windows 10 64 Bit
MSI CX61 Nvidia GeForce 920M (2 GB DDR3) Intel Celeron 2970M 1 x 8 GB DDR3 Windows 10 64 Bit
MSI Alpha 15 AMD Radeon RX5500M (4 GB GDDR6) AMD Ryzen 7 3750H 2 x 8 GB DDR4 Windows 10 64 Bit
Honor Magicbook AMD Radeon RX Vega 8 AMD Ryzen 5 2500U 1 x 8 GB DDR4 Windows 10 64 Bit
4K displays Nvidia driver AMD driver
Asus PB287Q, Philips Brilliance 329P9H ForceWare 442.19 Adrenalin 20.2.1
Read all 1 comments / answer
static version load dynamic
Loading Comments
Comment on this article
Please share our article, every link counts!
> Expert Reviews and News on Laptops, Smartphones and Tech Innovations > Reviews > Hunt Showdown Notebook and Desktop Benchmarks
Florian Glaser, 2020-03-13 (Update: 2022-01-21)