Notebook reviews with AMD Radeon RX Vega 7 graphics card
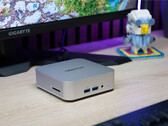
Compact and efficient: Geekom A5 Pro 2026 Edition mini PC with AMD Ryzen power review
The Geekom A5 Pro combines the Ryzen 5 7530U, the Radeon Vega 7, DDR4 RAM and an SSD - compact, suitable for everyday use and attractively priced. But how does the system compare to the competition and how efficiently does the mini PC work in everyday use? In our test, we took a close look at the performance based on numerous measurements.
AMD Ryzen 5 7530U, Vega 7, 423 gAffordable laptop with AMD Ryzen 5 APU and 2K display for $395 - Chuwi CoreBook X review
The Chuwi CoreBook X with AMD Ryzen 5 7430U is aimed at users who are looking for a reliable notebook for the office, studies, and everyday applications - and at a fair price. But how well does the compact 14-inch device perform in practical use? In our test, we take a closer look at its features, performance, and suitability for everyday use.
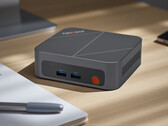
AMD Ryzen 5 7430U, Vega 7, 14", 1.4 kgAffordable mini PC for the office and home office - review of the Ninkear M7 with AMD Ryzen 5 APU
The Ninkear M7 is a compact mini PC with the AMD Ryzen 5 7430U processor and integrated Radeon RX Vega 7 graphics. With a price of around $350, it remains budget-friendly and is aimed at users who are looking for a solid and economical mini PC. Our short test shows how the device performs in everyday use.
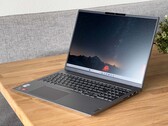
AMD Ryzen 5 7430U, Vega 7, 400 gLenovo ThinkBook 16 G6 review - The inexpensive multimedia laptop with a Ryzen 7000
The Lenovo ThinkBook 16 G6 is a 16-inch multimedia laptop with an IPS display and an AMD Ryzen 7000 processor. At a price of US$900, you will surely have to make quite a few compromises but even so, it boasts a good keyboard and long runtimes.
AMD Ryzen 5 7530U, Vega 7, 16", 1.8 kgHP ProBook 445 G10 in review: Lights and shadows of the office laptop
ProBook, EliteBook, ZBook: Keeping track of HP's model range is increasingly difficult. With the ProBook 445 G10, we test one of the manufacturer's cheaper AMD-based office laptops with a surprisingly bright display.
AMD Ryzen 5 7530U, Vega 7, 14", 1.3 kgLenovo ThinkPad L14 G4 21H6S00900: AMD Ryzen 5 7530U, 14.00", 1.5 kg
Review » Lenovo ThinkPad L14 G4 AMD Review: affordable laptop with good upgradeability and battery life
Dell Inspiron 14 7435 2-in-1: AMD Ryzen 5 7530U, 14.00", 1.6 kg
Review » Dell Inspiron 14 7435 2-in-1 convertible review: Ryzen 5 7530U for budget users
Lenovo ThinkPad L13 Yoga G4 21FSS00100: AMD Ryzen 5 7530U, 13.30", 1.4 kg
Review » Lenovo ThinkPad L13 Yoga G4 AMD Laptop Review: Quiet Ryzen convertible for students
Dell Inspiron 16 7635 2-in-1: AMD Ryzen 5 7530U, 16.00", 2 kg
Review » Dell Inspiron 16 7635 2-in-1 laptop review: A watered-down Inspiron 16 7630 with AMD Ryzen
Fujitsu LifeBook E5412A E542AMHAAMDE: AMD Ryzen 5 PRO 5675U, 14.00", 1.4 kg
Review » Fujitsu LifeBook E5412A laptop review: A classic business laptop with two RAM slots
Asus VivoBook 15X OLED M3504YA: AMD Ryzen 5 7530U, 15.60", 1.7 kg
Review » Asus VivoBook 15X OLED M3504 Laptop Review: Capable daily driver with AMD Ryzen Barcelo-R and OLED
Minisforum Venus Series UM560 XT: AMD Ryzen 5 5600H, 0.7 kg
Review » Minisforum Venus Series UM560 XT Desktop PC reviewed: A mini PC with an AMD Cezanne SoC at an affordable price!
Lenovo IdeaPad 3 17ABA7: AMD Ryzen 5 5625U, 17.30", 2 kg
Review » Lenovo IdeaPad 3 17ABA7 Review: Office laptop relies on AMD Ryzen 5 Barcelo-U
Lenovo IdeaPad 3 15ABA7: AMD Ryzen 5 5625U, 15.60", 1.6 kg
Review » Lenovo IdeaPad 3 15ABA7 review: Enduring office notebook with a powerful Ryzen APU
Asus VivoBook 15 X M1503QA: AMD Ryzen 5 5600H, 15.60", 1.7 kg
Review » 1080p OLED for the masses: Asus VivoBook 15X M1503QA laptop review
Minisforum Mars Series MC560: AMD Ryzen 5 5600U, 0.6 kg
Review » Minisforum Mars Series MC560 review: Powerful mini PC with AMD Ryzen 5 and integrated webcam for office use
Lenovo ThinkBook 15 G3 ACL 21A400B2GE: AMD Ryzen 5 5500U, 15.60", 1.7 kg
Review » Lenovo ThinkBook 15 G3 ACL review: low-emissions office notebook that goes the distance
Lenovo ThinkPad L14 G3 21C50030GE: AMD Ryzen 5 PRO 5675U, 14.00", 1.6 kg
Review » Lenovo ThinkPad L14 G3 AMD laptop review: Long battery life plus AMD power
Beelink SER Pro Ryzen 5 5600H: AMD Ryzen 5 5600H, 0.5 kg
Review » Beelink SER5 Pro 5600H mini PC review: NUC 11 speeds with AMD Ryzen
Minipc Union Ace Magician AMR5: AMD Ryzen 5 5600U, 0.6 kg
Review » Ace Magician AMR5 in review: Stylish Mini PC with a Ryzen 5 5600U and discreet RGB lighting
Lenovo ThinkBook 15 G4 21DL0009GE: AMD Ryzen 5 5625U, 15.60", 1.8 kg
Review » Lenovo ThinkBook 15 G4 Laptop review: An efficient laptop of many talents
Lenovo ThinkBook 14 G4 21DK0004GE: AMD Ryzen 5 5625U, 14.00", 1.5 kg
Review » Lenovo ThinkBook 14 G4 Laptop review: Solid laptop with plenty of lightweight metal
Dell Inspiron 14 5425 6VPKR: AMD Ryzen 5 5625U, 14.00", 1.6 kg
Review » Dell Inspiron 14 5425 in review: Ryzen 5 office laptop offers long battery life
HP ProBook 445 G8-3Z6Q8ES: AMD Ryzen 5 5600U, 14.00", 1.4 kg
Review » HP ProBook 445 G8 in review: Quiet office laptop with AMD Turbo
Dynabook Satellite Pro C50D-B-115: AMD Ryzen 5 5600U, 15.60", 1.8 kg
Review » Dynabook Satellite Pro C50D laptop in review - Office computer with AMD Ryzen
Huawei MateBook D 15 Ryzen 5 5500U: AMD Ryzen 5 5500U, 15.60", 1.6 kg
Review » Huawei MateBook D 15 AMD: Budget multimedia laptop in review
Honor MagicBook 16 2022: AMD Ryzen 5 5600H, 16.10", 1.8 kg
Review » Honor MagicBook 16 2022 review - Good multimedia laptop with weak power adapter
Huawei MateBook 14 2021 AMD: AMD Ryzen 5 5500U, 14.00", 1.5 kg
Review » Huawei MateBook 14 2021 AMD Laptop Review - Subnotebook with CPU Downgrade
Lenovo V15 G2 ALC-82KD003XGE: AMD Ryzen 5 5500U, 15.60", 1.6 kg
Review » Lenovo V15 Gen 2 AMD review: Hexa-core machine with a caveat
Acer Swift 3 SF314-43-R8BP: AMD Ryzen 5 5500U, 14.00", 1.3 kg
Review » Acer Swift 3 SF314 in review: No flight of fancy for the AMD laptop
Lenovo ThinkPad L13 Yoga G2 21AES01A00: AMD Ryzen 5 PRO 5650U, 13.30", 1.4 kg
Review » Lenovo ThinkPad L13 Yoga G2 AMD Laptop in review: Ryzen Pro unleashed inside a ThinkPad convertible
Lenovo ThinkPad L13 Gen2-21AB000PGE: AMD Ryzen 5 PRO 5650U, 13.30", 1.4 kg
Review » Lenovo ThinkPad L13 Gen2 AMD laptop in review - Fast, enduring Ryzen ultrabook
Lenovo IdeaPad 5 Pro 14ACN6: AMD Ryzen 5 5600U, 14.00", 1.5 kg
Review » Lenovo IdeaPad 5 Pro 14 16:10 laptop review: The series keeps getting better
Asus VivoBook 15 KM513UA-L503TS: AMD Ryzen 5 5500U, 15.60", 1.8 kg
Review » Asus VivoBook 15 KM513 Laptop Review: Ryzen and OLED goodness that doesn't break the bank
Lenovo ThinkPad X13 G2 AMD 20XH001KGE: AMD Ryzen 5 PRO 5650U, 13.30", 1.4 kg
Review » Lenovo ThinkPad X13 Gen 2 review: AMD Ryzen Pro makes the compact business laptop fast
HP 14s-fq1357ng: AMD Ryzen 5 5500U, 14.00", 1.5 kg
Review » HP 14s with Ryzen in review: Cheap laptop gives away potential
Lenovo IdeaPad 5 15ALC05: AMD Ryzen 5 5500U, 15.60", 1.7 kg
Review » Lenovo IdeaPad 5 15ALC05 in review: 15.6-inch laptop convinces and surprises
Lenovo ThinkPad L15 G2 AMD: AMD Ryzen 5 5600U, 15.60", 1.9 kg
Review » Lenovo ThinkPad L15 Gen 2 in review: Compelling AMD laptop for under 1,000 Euros
Lenovo ThinkPad E14 G3-20Y7003SGE: AMD Ryzen 5 5500U, 14.00", 1.6 kg
Review » Lenovo ThinkPad E14 G3 AMD Laptop Review - Affordable Business Notebook with Ryzen Power
Lenovo Yoga 6 13 82ND0009US: AMD Ryzen 5 5500U, 13.30", 1.3 kg
Review » Lenovo Yoga 6 13 Convertible Review: Laptops Have Clothes and Fabric Now
Microsoft Surface Laptop 4 13 Ryzen 5: AMD Ryzen 5 4680U, 13.50", 1.3 kg
Review » Microsoft Surface Laptop 4 13 Review: Is AMD's Ryzen held back on purpose?
Lenovo IdeaPad 5 14ALC05 82LM005YGE: AMD Ryzen 5 5500U, 14.00", 1.4 kg
Review » Lenovo IdeaPad 5 14ALC05 in review: Compact, powerful, enduring
Lenovo IdeaPad Flex 5 14ALC05-82HU006NGE: AMD Ryzen 5 5500U, 14.00", 1.5 kg
Review » Lenovo IdeaPad Flex 5 with Ryzen 5 in review: A lot of performance for a small budget
Lenovo ThinkPad P14s Gen1-20Y10002GE: AMD Ryzen 7 PRO 4750U, 14.00", 1.6 kg
Review » Lenovo ThinkPad P14s Gen 1 Laptop Review: AMD workstation sans dedicated GPU
Lenovo Yoga Slim 7 14ARE05 82A20008GE: AMD Ryzen 7 4700U, 14.00", 1.4 kg
Review » Lenovo Yoga Slim 7 14ARE05 in Review: Compact Powerhouse with Good Battery Life
Lenovo ThinkPad E15 Gen2-20T9S00K00: AMD Ryzen 7 4700U, 15.60", 1.8 kg
Review » Lenovo ThinkPad E15 Gen.2 Review: Office laptop with an AMD chip and new design
HP EliteBook 845 G7 Ryzen 7 Pro 4750U: AMD Ryzen 7 PRO 4750U, 14.00", 1.4 kg
Review » A Ryzen 7 4800U for Businesses: HP EliteBook 845 G7 Ryzen 7 Pro 4750U Laptop Review
Lenovo ThinkPad L15-20U8S0AH00: AMD Ryzen 7 PRO 4750U, 15.60", 1.9 kg
Review » Lenovo ThinkPad L15 laptop review - Decent office companion with high system performance
Asus VivoBook Flip 14 TM420IA: AMD Ryzen 7 4700U, 14.00", 1.6 kg
Review » Asus VivoBook Flip 14 TM420IA Ryzen 7 Convertible Review: Core i7 Need Not Apply
Lenovo ThinkPad X13-20UGS00800: AMD Ryzen 7 PRO 4750U, 13.30", 1.3 kg
Review » Lenovo ThinkPad X13 Gen 1 review: With AMD Renoir the fastest 13-inch ThinkPad laptop
Lenovo ThinkPad T14s-20UJS00K00: AMD Ryzen 7 PRO 4750U, 14.00", 1.3 kg
Review » Lenovo ThinkPad T14s Review: Business laptop is better with AMD
HP ProBook 455 G7-175W8EA: AMD Ryzen 7 4700U, 15.60", 1.8 kg
Review » HP ProBook 455 G7 Laptop in Review: Faster Performance Thanks to Zen2
Acer Swift 3 SF314-42-R4XJ: AMD Ryzen 7 4700U, 14.00", 1.2 kg
Review » Acer Swift 3 SF314-42 Laptop Review: Fast, slim and with good battery life - The Ryzen subnotebook is almost completely convincing
Lenovo ThinkPad L13 Yoga G2 21AES01A00: AMD Ryzen 5 PRO 5650U, 13.30", 1.4 kg
External Review » Lenovo ThinkPad L13 Yoga G2 21AES01A00
Chuwi CoreBook X: AMD Ryzen 5 7430U, 14.00", 1.4 kg
External Review » Chuwi CoreBook X
Lenovo IdeaPad Flex 5 14ABR8: AMD Ryzen 5 7430U, 14.00", 1.6 kg
External Review » Lenovo IdeaPad Flex 5 14ABR8
Infinix XBook B15: AMD Ryzen 5 7430U, 15.60", 1.6 kg
External Review » Infinix XBook B15
HP 15-fc0000: AMD Ryzen 5 7430U, 15.60", 1.6 kg
External Review » HP 15-fc0000
HP 245 G10: AMD Ryzen 5 7530U, 14.00", 1.4 kg
External Review » HP 245 G10
Lenovo ThinkBook 14 G4 21DK0004GE: AMD Ryzen 5 5625U, 14.00", 1.5 kg
External Review » Lenovo ThinkBook 14 G4 21DK0004GE
Lenovo ThinkPad E16 G1: AMD Ryzen 5 7530U, 16.00", 2 kg
External Review » Lenovo ThinkPad E16 G1
HP 15-ef2099nr: AMD Ryzen 5 5500U, 15.60", 1.7 kg
External Review » HP 15-ef2099nr
HP 15s-eq2152ns: AMD Ryzen 5 5500U, 15.60", 1.7 kg
External Review » HP 15s-eq2152ns
Acer Swift Go 14 SFG14-41, R5 7530U: AMD Ryzen 5 7530U, 14.00", 1.3 kg
External Review » Acer Swift Go 14 SFG14-41, R5 7530U
Lenovo Yoga 6 13ABR8: AMD Ryzen 5 7530U, 13.30", 1.4 kg
External Review » Lenovo Yoga 6 13ABR8
Dell Inspiron 16 7635 2-in-1: AMD Ryzen 5 7530U, 16.00", 2 kg
External Review » Dell Inspiron 16 7635 2-in-1
Lenovo IdeaPad Slim Flex 5 16IRU8: AMD Ryzen 5 7530U, 16.00", 2.1 kg
External Review » Lenovo IdeaPad Slim Flex 5 16IRU8
Lenovo IdeaPad Flex 5 16ABR G8, R5 7530U: AMD Ryzen 5 7530U, 16.00", 2.1 kg
External Review » Lenovo IdeaPad Flex 5 16ABR G8, R5 7530U
MSI Modern 15 B7M, R5 7530U: AMD Ryzen 5 7530U, 15.60", 1.8 kg
External Review » MSI Modern 15 B7M, R5 7530U
Lenovo V15 G3 ABA: AMD Ryzen 5 5625U, 15.60", 1.7 kg
External Review » Lenovo V15 G3 ABA
Dell Inspiron 14 7435 2-in-1: AMD Ryzen 5 7530U, 14.00", 1.6 kg
External Review » Dell Inspiron 14 7435 2-in-1
Lenovo IdeaPad Flex 5 14ABR G8: AMD Ryzen 5 7530U, 14.00", 1.5 kg
External Review » Lenovo IdeaPad Flex 5 14ABR G8
HP 245 G9: AMD Ryzen 5 5625U, 14.00", 1.5 kg
External Review » HP 245 G9
MSI Modern 14 C7M: AMD Ryzen 5 7530U, 14.00", 1.4 kg
External Review » MSI Modern 14 C7M
LG UltraPC 16UD70R: AMD Ryzen 5 7530U, 16.00", 1.6 kg
External Review » LG UltraPC 16UD70R
Asus ZenBook 14 UM3402YA, R5 7530U: AMD Ryzen 5 7530U, 14.00", 1.4 kg
External Review » Asus ZenBook 14 UM3402YA, R5 7530U
Dell Inspiron 14 7425 2-in-1: AMD Ryzen 5 5625U, 14.00", 1.7 kg
External Review » Dell Inspiron 14 7425 2-in-1
Lenovo IdeaPad 1 15ALC7, R5 5625U: AMD Ryzen 5 5625U, 15.60", 1.6 kg
External Review » Lenovo IdeaPad 1 15ALC7, R5 5625U
HP Pavilion 15-eh3100: AMD Ryzen 5 7530U, 15.60", 1.8 kg
External Review » HP Pavilion 15-eh3100
HP Pavilion 14-ec1871nd: AMD Ryzen 5 5625U, 14.00", 1.4 kg
External Review » HP Pavilion 14-ec1871nd
MSI Modern 14 C5M: AMD Ryzen 5 5625U, 14.00", 1.4 kg
External Review » MSI Modern 14 C5M
Lenovo IdeaPad Slim 5 16ABR8: AMD Ryzen 5 7530U, 16.00", 1.9 kg
External Review » Lenovo IdeaPad Slim 5 16ABR8
Lenovo ThinkPad E14 G4, R5 5625U: AMD Ryzen 5 5625U, 14.00", 1.6 kg
External Review » Lenovo ThinkPad E14 G4, R5 5625U
Lenovo ThinkBook 14 G3 ACL, Ryzen 5 5500U: AMD Ryzen 5 5500U, 14.00", 1.4 kg
External Review » Lenovo ThinkBook 14 G3 ACL, Ryzen 5 5500U
Lenovo IdeaPad 3 14ABA7: AMD Ryzen 5 5625U, 14.00", 1.4 kg
External Review » Lenovo IdeaPad 3 14ABA7
MSI Modern 15 B5M: AMD Ryzen 5 5625U, 15.60", 1.8 kg
External Review » MSI Modern 15 B5M
Lenovo IdeaPad Flex 5 14ALC7, R5 5500U: AMD Ryzen 5 5500U, 14.00", 1.6 kg
External Review » Lenovo IdeaPad Flex 5 14ALC7, R5 5500U
HP Pavilion Aero 13-be1001AU: AMD Ryzen 5 5625U, 13.30", 1 kg
External Review » HP Pavilion Aero 13-be1001AU
Lenovo IdeaPad 1 15ALC7, R5 5500U: AMD Ryzen 5 5500U, 15.60", 1.6 kg
External Review » Lenovo IdeaPad 1 15ALC7, R5 5500U
Asus VivoBook 15 M515UA-EJ522W: AMD Ryzen 5 5500U, 15.60", 1.8 kg
External Review » Asus VivoBook 15 M515UA-EJ522W
HP 17-cp0002ns: AMD Ryzen 5 5500U, 17.30", 2.1 kg
External Review » HP 17-cp0002ns
Acer Chromebook Spin 514 CP514-3H-R6VK: AMD Ryzen 5 5625C, 14.00", 1.4 kg
External Review » Acer Chromebook Spin 514 CP514-3HH-R6VK
Lenovo ThinkPad L13 G3-21B90029GE: AMD Ryzen 5 PRO 5675U, 13.30", 1.3 kg
External Review » Lenovo ThinkPad L13 G3-21B90029GE
Asus VivoBook 17X M1703, R5 5600H: AMD Ryzen 5 5600H, 17.30", 2.1 kg
External Review » Asus VivoBook 17X M1703, R5 5600H
Asus Vivobook 15X M1503, R7 4800H: AMD Ryzen 7 4800H, 15.60", 1.7 kg
External Review » Asus Vivobook 15X M1503, R7 4800H
Asus ZenBook 14 UM3402YA-KM063W: AMD Ryzen 5 5625U, 14.00", 1.4 kg
External Review » Asus ZenBook 14 UM3402YA-KM063W
LG UltraPC 16U70Q, R5 5625U: AMD Ryzen 5 5625U, 16.00", 1.6 kg
External Review » LG UltraPC 16U70Q, R5 5625U
LG UltraPC 13U70Q, R5 5500U: AMD Ryzen 5 5500U, 13.00", 1 kg
External Review » LG UltraPC 13U70Q, R5 5500U
HP Envy x360 15-ey0153ng: AMD Ryzen 5 5625U, 15.60", 1.8 kg
External Review » HP Envy x360 15-ey0153ng
HP 17-cp1153ng: AMD Ryzen 5 5625U, 17.30", 2.2 kg
External Review » HP 17-cp1153ng
Asus Vivobook 16X M1603QA, R5 5600H: AMD Ryzen 5 5600H, 16.00", 1.9 kg
External Review » Asus Vivobook 16X M1603QA, R5 5600H
HP Envy x360 15-ey0150nd : AMD Ryzen 5 5625U, 15.60", 1.8 kg
External Review » HP Envy x360 15-ey0150nd
HP 15s-eq2003ns: AMD Ryzen 5 5500U, 15.60", 1.7 kg
External Review » HP 15s-eq2003ns
Acer Aspire 3 A315-43-R3QN: AMD Ryzen 5 5500U, 15.60", 1.8 kg
External Review » Acer Aspire 3 A315-43-R3QN
HP 15s-eq3456ng: AMD Ryzen 5 5625U, 15.60", 1.7 kg
External Review » HP 15s-eq3456ng
HP 15s-eq2122ns: AMD Ryzen 5 5500U, 15.60", 1.7 kg
External Review » HP 15s-eq2122ns
HP 15s-eq2068ns: AMD Ryzen 5 5500U, 15.60", 1.7 kg
External Review » HP 15s-eq2068ns
Acer Swift 3 SF314-43-R4JS: AMD Ryzen 5 5500U, 14.00", 1.2 kg
External Review » Acer Swift 3 SF314-43-R4JS
Asus Vivobook 14X M1403Q: AMD Ryzen 5 5600H, 14.00", 1.6 kg
External Review » Asus Vivobook 14X M1403Q
Asus VivoBook S 14 Flip TN3402QA, Ryzen 5 5600H: AMD Ryzen 5 5600H, 14.00", 1.5 kg
External Review » Asus VivoBook S 14 Flip TN3402QA, Ryzen 5 5600H
Asus Vivobook Pro 14 M3400, R5 5600H: AMD Ryzen 5 5600H, 14.00", 1.4 kg
External Review » Asus Vivobook Pro 14 M3400, R5 5600H
HP 255 G9, R5 5625U: AMD Ryzen 5 5625U, 15.60", 1.7 kg
External Review » HP 255 G9, R5 5625U
Asus Vivobook 15X M1503, R5 5600H: AMD Ryzen 5 5600H, 15.60", 1.7 kg
External Review » Asus Vivobook 15X M1503, R5 5600H
HP 15s-eq2072ns: AMD Ryzen 5 5500U, 15.60", 1.7 kg
External Review » HP 15s-eq2072ns
Lenovo IdeaPad Flex 5 14ALC05-82HU00XNMH: AMD Ryzen 5 5500U, 14.00", 1.5 kg
External Review » Lenovo IdeaPad Flex 5 14ALC05-82HU00XNMH
Dell Inspiron 15 3525, Ryzen 5 5625U: AMD Ryzen 5 5625U, 15.60", 1.7 kg
External Review » Dell Inspiron 15 3525, Ryzen 5 5625U
HP 15s-eq2721nd: AMD Ryzen 5 5500U, 15.60", 1.7 kg
External Review » HP 15s-eq2721nd
Lenovo IdeaPad 5 15ALC05: AMD Ryzen 5 5500U, 15.60", 1.7 kg
External Review » Lenovo IdeaPad 5 15ALC05
Dell Vostro 15 3525, Ryzen 5 5625U: AMD Ryzen 5 5625U, 15.60", 1.9 kg
External Review » Dell Vostro 15 3525, Ryzen 5 5625U
HP 15s-eq2117ns: AMD Ryzen 5 5500U, 15.60", 1.7 kg
External Review » HP 15s-eq2117ns
Lenovo Yoga 6 13ALC7, R5 5500U: AMD Ryzen 5 5500U, 13.30", 1.4 kg
External Review » Lenovo Yoga 6 13ALC7, R5 5500U
Asus VivoBook 15 M515UA-BQ384: AMD Ryzen 5 5500U, 15.60", 1.8 kg
External Review » Asus VivoBook 15 M515UA-BQ384
HP Pavilion 15-eh1002ns: AMD Ryzen 5 5500U, 15.60", 1.8 kg
External Review » HP Pavilion 15-eh1002ns
HP 15s-eq2118ns: AMD Ryzen 5 5500U, 15.60", 1.7 kg
External Review » HP 15s-eq2118ns
HP EliteBook 845 G8: AMD Ryzen 5 PRO 5650U, 14.00", 1.4 kg
External Review » HP EliteBook 845 G8
Lenovo IdeaPad 3 15ALC6-LDSP: AMD Ryzen 5 5500U, 15.60", 1.7 kg
External Review » Lenovo IdeaPad 3 15ALC6-LDSP
HP ProBook x360 435 G8 R7-5600U: AMD Ryzen 5 5600U, 13.30", 1.5 kg
External Review » HP ProBook x360 435 G8 R7-5600U
HP Envy x360 15-eu0027nf: AMD Ryzen 5 5500U, 15.60", 1.9 kg
External Review » HP Envy x360 15-eu0027nf
Lenovo IdeaPad 5 15ALC05-82LN00VMSP: AMD Ryzen 5 5500U, 15.60", 1.7 kg
External Review » Lenovo IdeaPad 5 15ALC05-82LN00VMSP
Lenovo Yoga 6 13 82ND0009US: AMD Ryzen 5 5500U, 13.30", 1.3 kg
External Review » Lenovo Yoga 6 13 82ND0009US
Dell Vostro 16 5625, Ryzen 5 5625U: AMD Ryzen 5 5625U, 16.00", 1.9 kg
External Review » Dell Vostro 16 5625, Ryzen 5 5625U
Huawei MateBook 14 2021 AMD: AMD Ryzen 5 5500U, 14.00", 1.5 kg
External Review » Huawei MateBook 14 2021 AMD
HP Pavilion 15-eh1005ns: AMD Ryzen 5 5500U, 15.60", 1.8 kg
External Review » HP Pavilion 15-eh1005ns
Acer Aspire 5 A515-45-R74Z: AMD Ryzen 5 5500U, 15.60", 1.8 kg
External Review » Acer Aspire 5 A515-45-R74Z
Lenovo ThinkPad E15 G3-20YG004CGE: AMD Ryzen 5 5500U, 15.60", 1.7 kg
External Review » Lenovo ThinkPad E15 G3-20YG004CGE
HP 15s-eq2066ns: AMD Ryzen 5 5500U, 15.60", 1.7 kg
External Review » HP 15s-eq2066ns
Acer Swift 3 SF314-43-R704: AMD Ryzen 5 5500U, 14.00", 1.2 kg
External Review » Acer Swift 3 SF314-43-R704
Dynabook Satellite Pro C50D-B-10I: AMD Ryzen 5 5600U, 15.60", 1.9 kg
External Review » Dynabook Satellite Pro C50D-B-10I
Huawei MateBook D 15 Ryzen 5 5500U: AMD Ryzen 5 5500U, 15.60", 1.6 kg
External Review » Huawei MateBook D 15 Ryzen 5 5500U
HP Pavilion Aero 13-be0053nf: AMD Ryzen 5 5600U, 13.30", 1 kg
External Review » HP Pavilion Aero 13-be0053nf
Acer Swift 3 SF314-43-R1PS: AMD Ryzen 5 5500U, 14.00", 1.2 kg
External Review » Acer Swift 3 SF314-43-R1PS
Lenovo IdeaPad 3 14ALC6-82KT0041SP: AMD Ryzen 5 5500U, 14.00", 1.4 kg
External Review » Lenovo IdeaPad 3 14ALC6-82KT0041SP
Acer Aspire 5 A515-45-R7HG: AMD Ryzen 5 5500U, 15.60", 1.8 kg
External Review » Acer Aspire 5 A515-45-R7HG
Lenovo IdeaPad Flex 5 14-82HU00JWUS: AMD Ryzen 5 5500U, 14.00", 1.5 kg
External Review » Lenovo IdeaPad Flex 5 14-82HU00JWUS
Fujitsu Lifebook U9311A, R7 4700U: AMD Ryzen 7 4700U, 13.30", 0.9 kg
External Review » Fujitsu Lifebook U9311A, R7 4700U
HP 14-fq1025nr: AMD Ryzen 5 5500U, 14.00", 1.5 kg
External Review » HP 14-fq1025nr
Lenovo V15 G2 ALC-82KD003XGE: AMD Ryzen 5 5500U, 15.60", 1.6 kg
External Review » Lenovo V15 G2 ALC-82KD003XGE
Lenovo ThinkPad E14 G3-20Y7003SGE: AMD Ryzen 5 5500U, 14.00", 1.6 kg
External Review » Lenovo ThinkPad E14 G3-20Y7003SGE
Honor MagicBook 16 2022: AMD Ryzen 5 5600H, 16.10", 1.8 kg
External Review » Honor MagicBook 16 2022
HP Pavilion 14-ec0008ns: AMD Ryzen 5 5500U, 14.00", 2.1 kg
External Review » HP Pavilion 14-ec0008ns
HP Pavilion 15-eh1006ns: AMD Ryzen 5 5500U, 15.60", 1.8 kg
External Review » HP Pavilion 15-eh1006ns
Asus VivoBook Flip 14 TM420IA-EC230T: AMD Ryzen 7 4700U, 14.00", 1.5 kg
External Review » Asus VivoBook Flip 14 TM420IA-EC230T
Lenovo Ideapad 3 14ALC6-82KT00GVUS: AMD Ryzen 5 5500U, 14.00", 1.4 kg
External Review » Lenovo Ideapad 3 14ALC6-82KT00GVUS
HP Pavilion Aero 13-be000AU: AMD Ryzen 5 5600U, 13.30", 1 kg
External Review » HP Pavilion Aero 13-be000AU
HP 15s-eq2083ns: AMD Ryzen 5 5500U, 15.60", 1.7 kg
External Review » HP 15s-eq2083ns
Acer Swift 3 SF314-43-R8BP: AMD Ryzen 5 5500U, 14.00", 1.3 kg
External Review » Acer Swift 3 SF314-43-R8BP
Huawei MateBook 14 AMD 2021, 5500U: AMD Ryzen 5 5500U, 14.00", 1.5 kg
External Review » Huawei MateBook 14 AMD 2021, 5500U
HP Envy x360 13-ay0004ns: AMD Ryzen 7 4700U, 13.30", 1.3 kg
External Review » HP Envy x360 13-ay0004ns
Lenovo IdeaPad 5 14ALC05-82LM00AGMH: AMD Ryzen 5 5500U, 14.00", 1.4 kg
External Review » Lenovo IdeaPad 5 14ALC05-82LM00AGMH
Huawei MateBook 14 2020 AMD: AMD Ryzen 7 4800H, 14.00", 1.6 kg
External Review » Huawei MateBook 14 2020 AMD
HP 255 G8, R5 5500U: AMD Ryzen 5 5500U, 15.60", 1.7 kg
External Review » HP 255 G8, R5 5500U
HP 17-cp0055ng: AMD Ryzen 5 5500U, 17.30", 2.1 kg
External Review » HP 17-cp0055ng
Honor MagicBook 14 NMH-WDQ9H: AMD Ryzen 5 5500U, 14.00", 1.4 kg
External Review » Honor MagicBook 14 NMH-WDQ9H
Asus VivoBook 15 KM513UA-L503TS: AMD Ryzen 5 5500U, 15.60", 1.8 kg
External Review » Asus VivoBook 15 KM513UA-L503TS
Lenovo IdeaPad Flex 5 14ALC05-82HU0036US: AMD Ryzen 5 5500U, 14.00", 1.5 kg
External Review » Lenovo IdeaPad Flex 5 14ALC05-82HU0036US
HP Pavilion 15-eh1000ns: AMD Ryzen 5 5500U, 15.60", 1.8 kg
External Review » HP Pavilion 15-eh1000ns
Lenovo IdeaPad 3 14ALC6-82KT00AMUS: AMD Ryzen 5 5500U, 14.00", 1.4 kg
External Review » Lenovo IdeaPad 3 14ALC6-82KT00AMUS
HP Envy x360 15-eu0155ng: AMD Ryzen 5 5500U, 15.60", 1.9 kg
External Review » HP Envy x360 15-eu0155ng
Dell Inspiron 15 5515, R5 5500U: AMD Ryzen 5 5500U, 15.60", 1.8 kg
External Review » Dell Inspiron 15 5515, R5 5500U
Lenovo IdeaPad 3 15ALC6-82KU00BUGE: AMD Ryzen 5 5500U, 15.60", 1.7 kg
External Review » Lenovo IdeaPad 3 15ALC6-82KU00BUGE
Honor MagicBook 15, R5 5500U: AMD Ryzen 5 5500U, 15.60", 1.6 kg
External Review » Honor MagicBook 15, R5 5500U
MSI Modern 15 A5M-010XES: AMD Ryzen 5 5500U, 15.60", 1.6 kg
External Review » MSI Modern 15 A5M-010XES
Acer Aspire 5 A515-45-R695: AMD Ryzen 5 5500U, 15.60", 1.8 kg
External Review » Acer Aspire 5 A515-45-R695
LG Ultra PC 13U70P-G.AAW7U1: AMD Ryzen 7 4700U, 13.30", 1 kg
External Review » LG Ultra PC 13U70P-G.AAW7U1
Asus VivoBook S15 M533, R5 5500U: AMD Ryzen 5 5500U, 15.60", 1.8 kg
External Review » Asus VivoBook S15 M533, R5 5500U
HP 15s-eq1073ns: AMD Ryzen 7 4700U, 15.60", 1.7 kg
External Review » HP 15s-eq1073ns
HP Pavilion Aero 13-be0821no: AMD Ryzen 5 5600U, 13.30", 1 kg
External Review » HP Pavilion Aero 13-be0821no
Lenovo IdeaPad 3 17ALC6-82KV000PGE: AMD Ryzen 5 5500U, 17.30", 2.1 kg
External Review » Lenovo IdeaPad 3 17ALC6-82KV000PGE
HP 15s-eq1071ns: AMD Ryzen 7 4700U, 15.60", 1.7 kg
External Review » HP 15s-eq1071ns
HP Pavilion Aero 13-be0755ng: AMD Ryzen 5 5600U, 13.30", 1 kg
External Review » HP Pavilion Aero 13-be0755ng
Asus VivoBook 17 S712UA-AU084T: AMD Ryzen 5 5500U, 17.30", 2.3 kg
External Review » Asus VivoBook 17 S712UA-AU084T
Acer Aspire 5 A515-44-R5QH: AMD Ryzen 7 4700U, 15.60", 1.8 kg
External Review » Acer Aspire 5 A515-44-R5QH
HP 15s-eq1083ns: AMD Ryzen 7 4700U, 15.60", 1.7 kg
External Review » HP 15s-eq1083ns
HP 15s-eq2720nd: AMD Ryzen 5 5500U, 15.60", 1.7 kg
External Review » HP 15s-eq2720nd
Asus VivoBook S14 S413UA-DS51: AMD Ryzen 5 5500U, 14.00", 1.4 kg
External Review » Asus VivoBook S14 S413UA-DS51
Lenovo IdeaPad 5 Pro 14ACN6-82L7006PMH: AMD Ryzen 5 5600U, 14.00", 1.4 kg
External Review » Lenovo IdeaPad 5 Pro 14ACN6-82L7006PMH
HP 14-fq1021nr: AMD Ryzen 5 5500U, 14.00", 1.5 kg
External Review » HP 14-fq1021nr
HP 15z-ef2000: AMD Ryzen 5 5500U, 15.60", 1.7 kg
External Review » HP 15z-ef2000
Asus VivoBook Flip 14 TM420UA-EC004T: AMD Ryzen 5 5500U, 14.00", 1.5 kg
External Review » Asus VivoBook Flip 14 TM420UA-EC004T
HP 15s-eq2442ng: AMD Ryzen 5 5500U, 15.60", 1.7 kg
External Review » HP 15s-eq2442ng
HP Envy x360 13-ay0003ns: AMD Ryzen 7 4700U, 13.30", 1.3 kg
External Review » HP Envy x360 13-ay0003ns
Acer Swift 3 SF314-42-R7QS: AMD Ryzen 7 4700U, 14.00", 1.2 kg
External Review » Acer Swift 3 SF314-42-R7QS
HP Pavilion 15-eh1254ng: AMD Ryzen 5 5500U, 15.60", 1.8 kg
External Review » HP Pavilion 15-eh1254ng
Acer Aspire 5 A515-45-R3YX: AMD Ryzen 5 5500U, 15.60", 1.8 kg
External Review » Acer Aspire 5 A515-45-R3YX
Asus VivoBook 15 S513IA-DB74: AMD Ryzen 7 4700U, 15.60", 1.6 kg
External Review » Asus VivoBook 15 S513IA-DB74
Lenovo ThinkPad X13-20UF000NMH: AMD Ryzen 7 PRO 4750U, 13.30", 1.3 kg
External Review » Lenovo ThinkPad X13-20UF000NMH
Lenovo IdeaPad Flex 5 14ALC05-82HU006KSP: AMD Ryzen 5 5500U, 14.00", 1.6 kg
External Review » Lenovo IdeaPad Flex 5 14ALC05-82HU006KSP
HP Pavilion 15-eh0014na: AMD Ryzen 7 4700U, 15.60", 1.8 kg
External Review » HP Pavilion 15-eh0014na
HP 15s-eq1105ns: AMD Ryzen 7 4700U, 15.60", 1.7 kg
External Review » HP 15s-eq1105ns
HP Pavilion 15-ec2016ns: AMD Ryzen 5 5600U, 15.60", 2 kg
External Review » HP Pavilion 15-ec2016ns
Asus ZenBook 13 OLED UM325UA-KG004R: AMD Ryzen 5 5500U, 13.30", 1.1 kg
External Review » Asus ZenBook 13 OLED UM325UA-KG004R
Asus ZenBook 14 UM425UA-KI156R: AMD Ryzen 5 5500U, 14.00", 1.2 kg
External Review » Asus ZenBook 14 UM425UA-KI156R
HP Pavilion 15-eh0177ng: AMD Ryzen 7 4700U, 15.60", 1.8 kg
External Review » HP Pavilion 15-eh0177ng
Lenovo IdeaPad Flex 5 14ALC05-82HU006NGE: AMD Ryzen 5 5500U, 14.00", 1.5 kg
External Review » Lenovo IdeaPad Flex 5 14ALC05-82HU006NGE
HP Probook 635 Aero G7, 4700U: AMD Ryzen 7 4700U, 13.30", 1 kg
External Review » HP Probook 635 Aero G7, 4700U
Microsoft Surface Laptop 4 13 Ryzen 5: AMD Ryzen 5 4680U, 13.50", 1.3 kg
External Review » Microsoft Surface Laptop 4 13 Ryzen 5
Lenovo Yoga Slim 7 14ARE05-82A200ABMH: AMD Ryzen 7 4700U, 14.00", 1.3 kg
External Review » Lenovo Yoga Slim 7 14ARE05-82A200ABMH
Asus VivoBook 15 M513IA-BQ443T: AMD Ryzen 7 4700U, 15.60", 1.8 kg
External Review » Asus VivoBook 15 M513IA-BQ443T
Lenovo ThinkBook 14 G2 ARE-20VF000BGE: AMD Ryzen 7 4700U, 14.00", 1.4 kg
External Review » Lenovo ThinkBook 14 G2 ARE-20VF000BGE
Asus ZenBook 13 OLED UM325UA-KG044T: AMD Ryzen 5 5500U, 13.30", 1.1 kg
External Review » Asus ZenBook 13 OLED UM325UA-KG044T
MSI Modern 14 B4MW-005TH: AMD Ryzen 7 4700U, 14.00", 1.3 kg
External Review » MSI Modern 14 B4MW-005TH
Asus ZenBook 13 OLED UM325 5500U: AMD Ryzen 5 5500U, 13.30", 1.1 kg
External Review » Asus ZenBook 13 OLED UM325 5500U
Asus ZenBook 14 UM425IA-AM006T: AMD Ryzen 7 4700U, 14.00", 1.3 kg
External Review » Asus ZenBook 14 UM425IA-AM006T
Asus VivoBook S15 M513IA-EJ354: AMD Ryzen 7 4700U, 15.60", 1.8 kg
External Review » Asus VivoBook S15 M513IA-EJ354
Asus VivoBook Flip 14 TM420IA-EC207: AMD Ryzen 7 4700U, 14.00", 1.5 kg
External Review » Asus VivoBook Flip 14 TM420IA-EC207
Lenovo ThinkPad L14-20U50001CK: AMD Ryzen 7 PRO 4750U, 14.00", 1.7 kg
External Review » Lenovo ThinkPad L14-20U50001CK
Acer Swift 3 SF314-42-R30P: AMD Ryzen 7 4700U, 14.00", 1.2 kg
External Review » Acer Swift 3 SF314-42-R30P
Asus VivoBook S14 M433IA-EB069: AMD Ryzen 7 4700U, 14.00", 1.4 kg
External Review » Asus VivoBook S14 M433IA-EB069
Asus ZenBook 14 UM421IA: AMD Ryzen 7 4700U, 14.00", 1.3 kg
External Review » Asus ZenBook 14 UM421IA
Acer Aspire 5 A515-45-R3UG: AMD Ryzen 5 5500U, 15.60", 1.8 kg
External Review » Acer Aspire 5 A515-45-R3UG
Lenovo IdeaPad Flex 5 14ARE05-81X200DHMH: AMD Ryzen 7 4700U, 14.00", 1.5 kg
External Review » Lenovo IdeaPad Flex 5 14ARE05-81X200DHMH
HP Envy x360 15-ee0425no: AMD Ryzen 7 4700U, 15.60", 2 kg
External Review » HP Envy x360 15-ee0425no
Lenovo ThinkPad T14s-20UH001AUK: AMD Ryzen 7 PRO 4750U, 14.00", 1.3 kg
External Review » Lenovo ThinkPad T14s-20UH001AUK
Asus VivoBook 14 S413IA-EK663T: AMD Ryzen 7 4700U, 14.00", 1.4 kg
External Review » Asus VivoBook 14 S413IA-EK663T
HP EliteBook 845 G7 Ryzen 7 Pro 4750U: AMD Ryzen 7 PRO 4750U, 14.00", 1.4 kg
External Review » HP EliteBook 845 G7 Ryzen 7 Pro 4750U
HP ProBook x360 435 G7, Ryzen 7 4700U: AMD Ryzen 7 4700U, 13.30", 1.5 kg
External Review » HP ProBook x360 435 G7, Ryzen 7 4700U
Lenovo ThinkPad E15 Gen2-20T9S00K00: AMD Ryzen 7 4700U, 15.60", 1.8 kg
External Review » Lenovo ThinkPad E15 Gen2-20T9S00K00
Lenovo Yoga Slim 7 14ARE05 82A20008GE: AMD Ryzen 7 4700U, 14.00", 1.4 kg
External Review » Lenovo Yoga Slim 7 14ARE05 82A20008GE
Huawei MateBook 14 2020 AMD KLVL-WFE9: AMD Ryzen 7 4800H, 14.00", 1.5 kg
External Review » Huawei MateBook 14 2020 AMD KLVL-WFE9
HP Envy x360 13-ay0008nw: AMD Ryzen 7 4700U, 13.30", 1.4 kg
External Review » HP Envy x360 13-ay0008nw
Huawei MateBook 14 2020 AMD 4800H: AMD Ryzen 7 4800H, 14.00", 1.5 kg
External Review » Huawei MateBook 14 2020 AMD 4800H
Lenovo Yoga 6 13, 4700U: AMD Ryzen 7 4700U, 13.30", 1.4 kg
External Review » Lenovo Yoga 6 13, 4700U
Acer Swift 3 SF314-42-R3ZU: AMD Ryzen 7 4700U, 14.00", 1.2 kg
External Review » Acer Swift 3 SF314-42-R3ZU
HP ProBook 445 G7, R7 4700U: AMD Ryzen 7 4700U, 14.00", 1.6 kg
External Review » HP ProBook 445 G7, R7 4700U
Lenovo IdeaPad Flex 5 14ARE05-81X2004YGE: AMD Ryzen 7 4700U, 14.00", 1.5 kg
External Review » Lenovo IdeaPad Flex 5 14ARE05-81X2004YGE
HP Envy x360 13-ay0003nd: AMD Ryzen 7 4700U, 13.30", 1.3 kg
External Review » HP Envy x360 13-ay0003nd
HP Envy x360 15-ee0175nd: AMD Ryzen 7 4700U, 15.60", 2 kg
External Review » HP Envy x360 15-ee0175nd
Asus VivoBook S15 M533IA-BQ070T: AMD Ryzen 7 4700U, 15.60", 1.8 kg
External Review » Asus VivoBook S15 M533IA-BQ070T
HP ProBook 455 G7-175W8EA: AMD Ryzen 7 4700U, 15.60", 1.8 kg
External Review » HP ProBook 455 G7-175W8EA
Asus VivoBook Flip 14 TM420IA: AMD Ryzen 7 4700U, 14.00", 1.6 kg
External Review » Asus VivoBook Flip 14 TM420IA
Lenovo ThinkPad E14 Gen2-20T6000MGE: AMD Ryzen 7 4700U, 14.00", 1.6 kg
External Review » Lenovo ThinkPad E14 Gen2-20T6000MGE
Acer Swift 3 SF314-42-R991: AMD Ryzen 7 4700U, 14.00", 1.2 kg
External Review » Acer Swift 3 SF314-42-R991
HP Envy x360 13-ay0002ns: AMD Ryzen 7 4700U, 13.30", 1.3 kg
External Review » HP Envy x360 13-ay0002ns
MSI Modern 14 B4MW-032XES: AMD Ryzen 7 4700U, 14.00", 1.3 kg
External Review » MSI Modern 14 B4MW-032XES
Asus ZenBook 14 UM425IA-HM032R: AMD Ryzen 7 4700U, 14.00", 1.1 kg
External Review » Asus ZenBook 14 UM425IA-HM032R
Acer Aspire 5 A515-44-R8VV: AMD Ryzen 7 4700U, 15.60", 1.8 kg
External Review » Acer Aspire 5 A515-44-R8VV
Xiaomi RedmiBook 16 R7 4700U: AMD Ryzen 7 4700U, 16.10", 1.8 kg
External Review » Xiaomi RedmiBook 16 R7 4700U
MSI Bravo 17 A4DDK: unknown, 17.30", 2.2 kg
External Review » MSI Bravo 17 A4DDK
Lenovo ThinkPad T14s-20UJS00K00: AMD Ryzen 7 PRO 4750U, 14.00", 1.3 kg
External Review » Lenovo ThinkPad T14s-20UJS00K00
Lenovo Yoga Slim 7-14ARE05, Ryzen 7 4700U: AMD Ryzen 7 4700U, 14.00", 1.4 kg
External Review » Lenovo Yoga Slim 7 14ARE05, Ryzen 7 4700U
Acer Swift 3 SF314-42-R9YN: AMD Ryzen 7 4700U, 14.00", 1.2 kg
External Review » Acer Swift 3 SF314-42-R9YN
Lenovo IdeaPad 5 15ARE05-81YQ006JMH: AMD Ryzen 7 4700U, 15.60", 1.6 kg
External Review » Lenovo IdeaPad 5 15ARE05-81YQ006JMH
Asus VivoBook S14 M433IA, Ryzen 7 4700U: AMD Ryzen 7 4700U, 14.00", 1.4 kg
External Review » Asus VivoBook S14 M433IA, Ryzen 7 4700U
Acer Swift 3 SF314-42-R4XJ: AMD Ryzen 7 4700U, 14.00", 1.2 kg
External Review » Acer Swift 3 SF314-42-R4XJ
Lenovo IdeaPad Flex 5 14ABR G8: AMD Ryzen 5 7530U, 14.00", 1.5 kg
Article » AMD Ryzen 7 7730U & Ryzen 5 7530U initial benchmarks - Zen 3 is still competitive
Geekom A5 Pro: AMD Ryzen 5 7530U, 0.4 kg
» Geekom A5 Pro 2026 with AMD Ryzen APU: Compact, efficient mini PC built for everyday performance
Chuwi CoreBook X: AMD Ryzen 5 7430U, 14.00", 1.4 kg
» Warning: Chuwi CoreBook X uses AMD Ryzen 5 5500U instead of 7430U
» Top laptop deal: Chuwi CoreBook X with AMD Ryzen 5 and 14-inch 2K display for under $400
Ninkear M7, (16+512): AMD Ryzen 5 7430U, 0.4 kg
» Quiet budget mini PC for the home office: review of the Ninkear M7 with Ryzen 5 APU for office & multimedia
Lenovo ThinkPad L14 G3 21C50030GE: AMD Ryzen 5 PRO 5675U, 14.00", 1.6 kg
» AMD-powered Lenovo ThinkPad L14 Gen 3 with 16GB RAM is now just $292 thanks to big refurbished discount
» Quiet Lenovo ThinkPad L14 Gen 3 with AMD Ryzen 5 Pro, 16GB RAM and 512GB SSD drops to $295 in refurbished laptop sale
Lenovo ThinkPad L15 G2 AMD: AMD Ryzen 5 5600U, 15.60", 1.9 kg
» Lenovo ThinkPad L15 with 64GB RAM and AMD Ryzen 7 Pro drops to $400 in refurbished laptop sale
Lenovo ThinkPad L14 G3 21C50030GE: AMD Ryzen 5 PRO 5675U, 14.00", 1.6 kg
» Lenovo ThinkPad L14 with AMD Ryzen 7 Pro and 16GB RAM drops to $394 in certified-refurbished sale
» Lenovo ThinkPad L14 Gen 3 laptop with AMD Ryzen 5 Pro gets big 77% discount in early Black Friday sale
Lenovo ThinkPad L14 G4 21H6S00900: AMD Ryzen 5 7530U, 14.00", 1.5 kg
» ThinkPad L14 Gen 4: AMD Ryzen 7030 in cheaper laptops is annoying
Lenovo ThinkPad X13 G2 AMD 20XH001KGE: AMD Ryzen 5 PRO 5650U, 13.30", 1.4 kg
» Lenovo ThinkPad X13 Gen 2 with AMD Ryzen 5 Pro and 16GB RAM gets gigantic discount
Lenovo ThinkPad L13 Yoga G4 21FSS00100: AMD Ryzen 5 7530U, 13.30", 1.4 kg
» Lenovo ThinkPad L13 Yoga G4: a good AMD convertible with a weak chassis
Dell Inspiron 16 7635 2-in-1: AMD Ryzen 5 7530U, 16.00", 2 kg
» Soldered 8 GB RAM makes the Dell Inspiron 16 7630 and 7635 2-in-1 series a tricky recommendation
Lenovo IdeaPad 3 15ABA7: AMD Ryzen 5 5625U, 15.60", 1.6 kg
» Direct from the test lab: Lenovo IdeaPad 3 - Ryzen with stamina
Minipc Union Ace Magician AMR5: AMD Ryzen 5 5600U, 0.6 kg
» Chatreey AMR5 and AM08 arrive as affordable mini-PCs with unusual physical performance dials
Lenovo ThinkPad L14 G3 21C50030GE: AMD Ryzen 5 PRO 5675U, 14.00", 1.6 kg
» Lenovo ThinkPad L14 G3 AMD reviewed: Budget business laptop with long battery life has advantages over ThinkPad T14
Dell Inspiron 14 5425 6VPKR: AMD Ryzen 5 5625U, 14.00", 1.6 kg
» Dell Inspiron 14 5425: Stylish, fast, enduring office laptop
HP ProBook 445 G8-3Z6Q8ES: AMD Ryzen 5 5600U, 14.00", 1.4 kg
» HP ProBook 445 G8 reviewed: 14-inch office laptop is quiet and fast thanks to AMD Zen 3
Lenovo V15 G2 ALC-82KD003XGE: AMD Ryzen 5 5500U, 15.60", 1.6 kg
» Lenovo V15 Gen 2 AMD test: Speed boost on an antique display
Lenovo ThinkPad L13 Yoga G2 21AES01A00: AMD Ryzen 5 PRO 5650U, 13.30", 1.4 kg
» Lenovo ThinkPad Yoga L13: Great use of the AMD Ryzen 5 Pro
Lenovo IdeaPad 5 Pro 14ACN6: AMD Ryzen 5 5600U, 14.00", 1.5 kg
» Ryzen 5 5600U is putting pressure on Intel and its 11th gen Core series on midrange laptops
Lenovo ThinkPad X13 G2 AMD 20XH001KGE: AMD Ryzen 5 PRO 5650U, 13.30", 1.4 kg
» The Lenovo ThinkPad X13 Gen 2 is better with Ryzen
Lenovo ThinkPad L15 G2 AMD: AMD Ryzen 5 5600U, 15.60", 1.9 kg
» Lenovo ThinkPad L15 Gen 2: Solid AMD laptop for everyday office use
Lenovo ThinkPad E14 G3-20Y7003SGE: AMD Ryzen 5 5500U, 14.00", 1.6 kg
» Lenovo's ThinkPad E14 G3 AMD offers plenty of performance and an excellent keyboard
Lenovo Yoga 6 13 82ND0009US: AMD Ryzen 5 5500U, 13.30", 1.3 kg
» The Lenovo Yoga 6 13 2-in-1 fabric feels like an old shirt
Lenovo ThinkPad P14s Gen1-20Y10002GE: AMD Ryzen 7 PRO 4750U, 14.00", 1.6 kg
» Lenovo ThinkPad P14s shows: AMD Ryzen Pro can work in workstations
Lenovo Yoga Slim 7 14ARE05 82A20008GE: AMD Ryzen 7 4700U, 14.00", 1.4 kg
» Ryzen 7 4700U Unleashed - Lenovo does not hold back the Yoga 7 Slim 14ARE05's APU
Lenovo ThinkPad E15 Gen2-20T9S00K00: AMD Ryzen 7 4700U, 15.60", 1.8 kg
» Lenovo's ThinkPad E15 Gen.2 AMD offers a more compact design and a lot more performance
HP EliteBook 845 G7 Ryzen 7 Pro 4750U: AMD Ryzen 7 PRO 4750U, 14.00", 1.4 kg
» The 7 nm AMD Ryzen 7 Pro 4750U destroys the Core i7-10810U and Intel has no answer at the moment
Asus VivoBook Flip 14 TM420IA: AMD Ryzen 7 4700U, 14.00", 1.6 kg
» Ryzen-powered Asus VivoBook Flip 14 shows just how badly Intel needs to launch its Tiger Lake platform
Lenovo ThinkPad X13-20UGS00800: AMD Ryzen 7 PRO 4750U, 13.30", 1.3 kg
» Battery life better with Intel: ThinkPad X13 AMD shows a Renoir weakness
Lenovo ThinkPad T14s-20UJS00K00: AMD Ryzen 7 PRO 4750U, 14.00", 1.3 kg
» The ThinkPad T14s AMD is cheaper and much faster
Lenovo ThinkPad X13-20UGS00800: AMD Ryzen 7 PRO 4750U, 13.30", 1.3 kg
» First benchmarks: AMD Ryzen 4000 excels in the Lenovo ThinkPad X13 Gen 1
Lenovo ThinkPad T14s-20UJS00K00: AMD Ryzen 7 PRO 4750U, 14.00", 1.3 kg
» Lenovo ThinkPad T14s: AMD Ryzen 7 Pro 4750U leaves Intel in the dust
HP ProBook 455 G7-175W8EA: AMD Ryzen 7 4700U, 15.60", 1.8 kg
» HP ProBook 455 G7 Laptop with faster performance and unaffected battery life
Lenovo ThinkPad E15 Gen2-20T9S00K00: AMD Ryzen 7 4700U, 15.60", 1.8 kg
» The first ThinkPad with Ryzen 4000 has arrived: AMD much faster than Intel
Acer Swift 3 SF314-42-R4XJ: AMD Ryzen 7 4700U, 14.00", 1.2 kg
» No chance for Intel: AMD Ryzen 7 4700U takes apart the Core i7-1065G7 in our Acer Swift 3 SF314-42 review