Lenovo Yoga 6 13 Convertible Review: Laptops Have Clothes and Fabric Now
The 13.3-inch 2021 Lenovo Yoga 6 13 directly succeeds last year's Yoga 6 13 by replacing the older Ryzen 7 4700U CPU with the newer Ryzen 7 5500U. Though the Yoga series is supposed to be home to Lenovo's upper midrange to high-end consumer laptops, the Yoga 6 13 is fairly inexpensive at only around $800 USD as configured in our review.
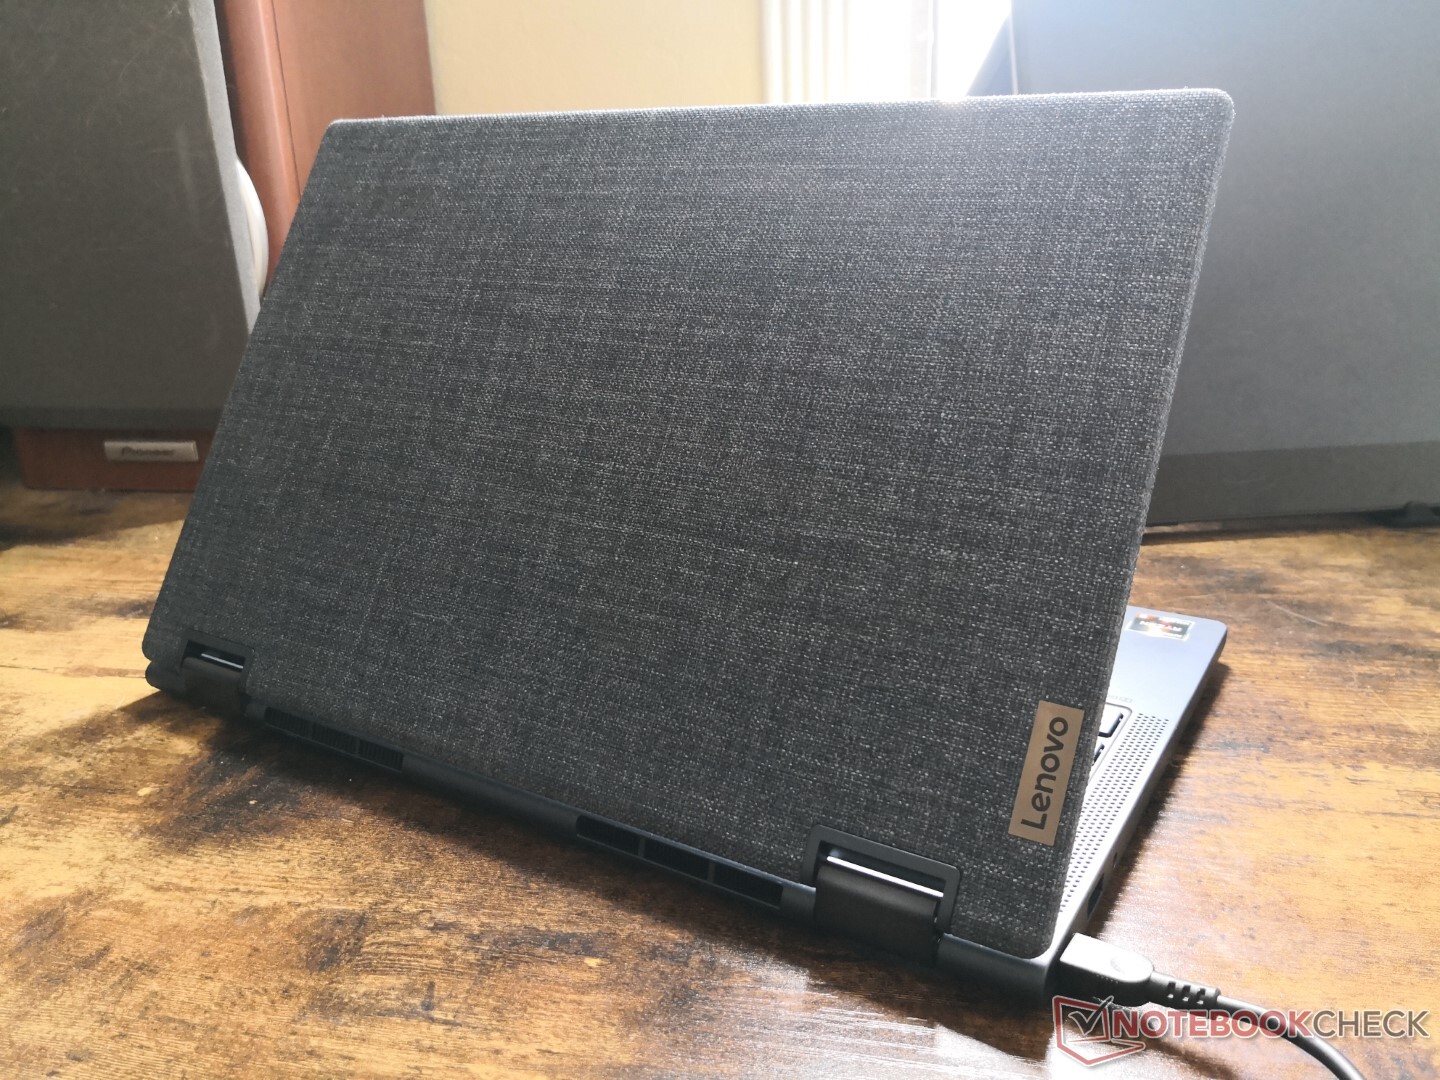
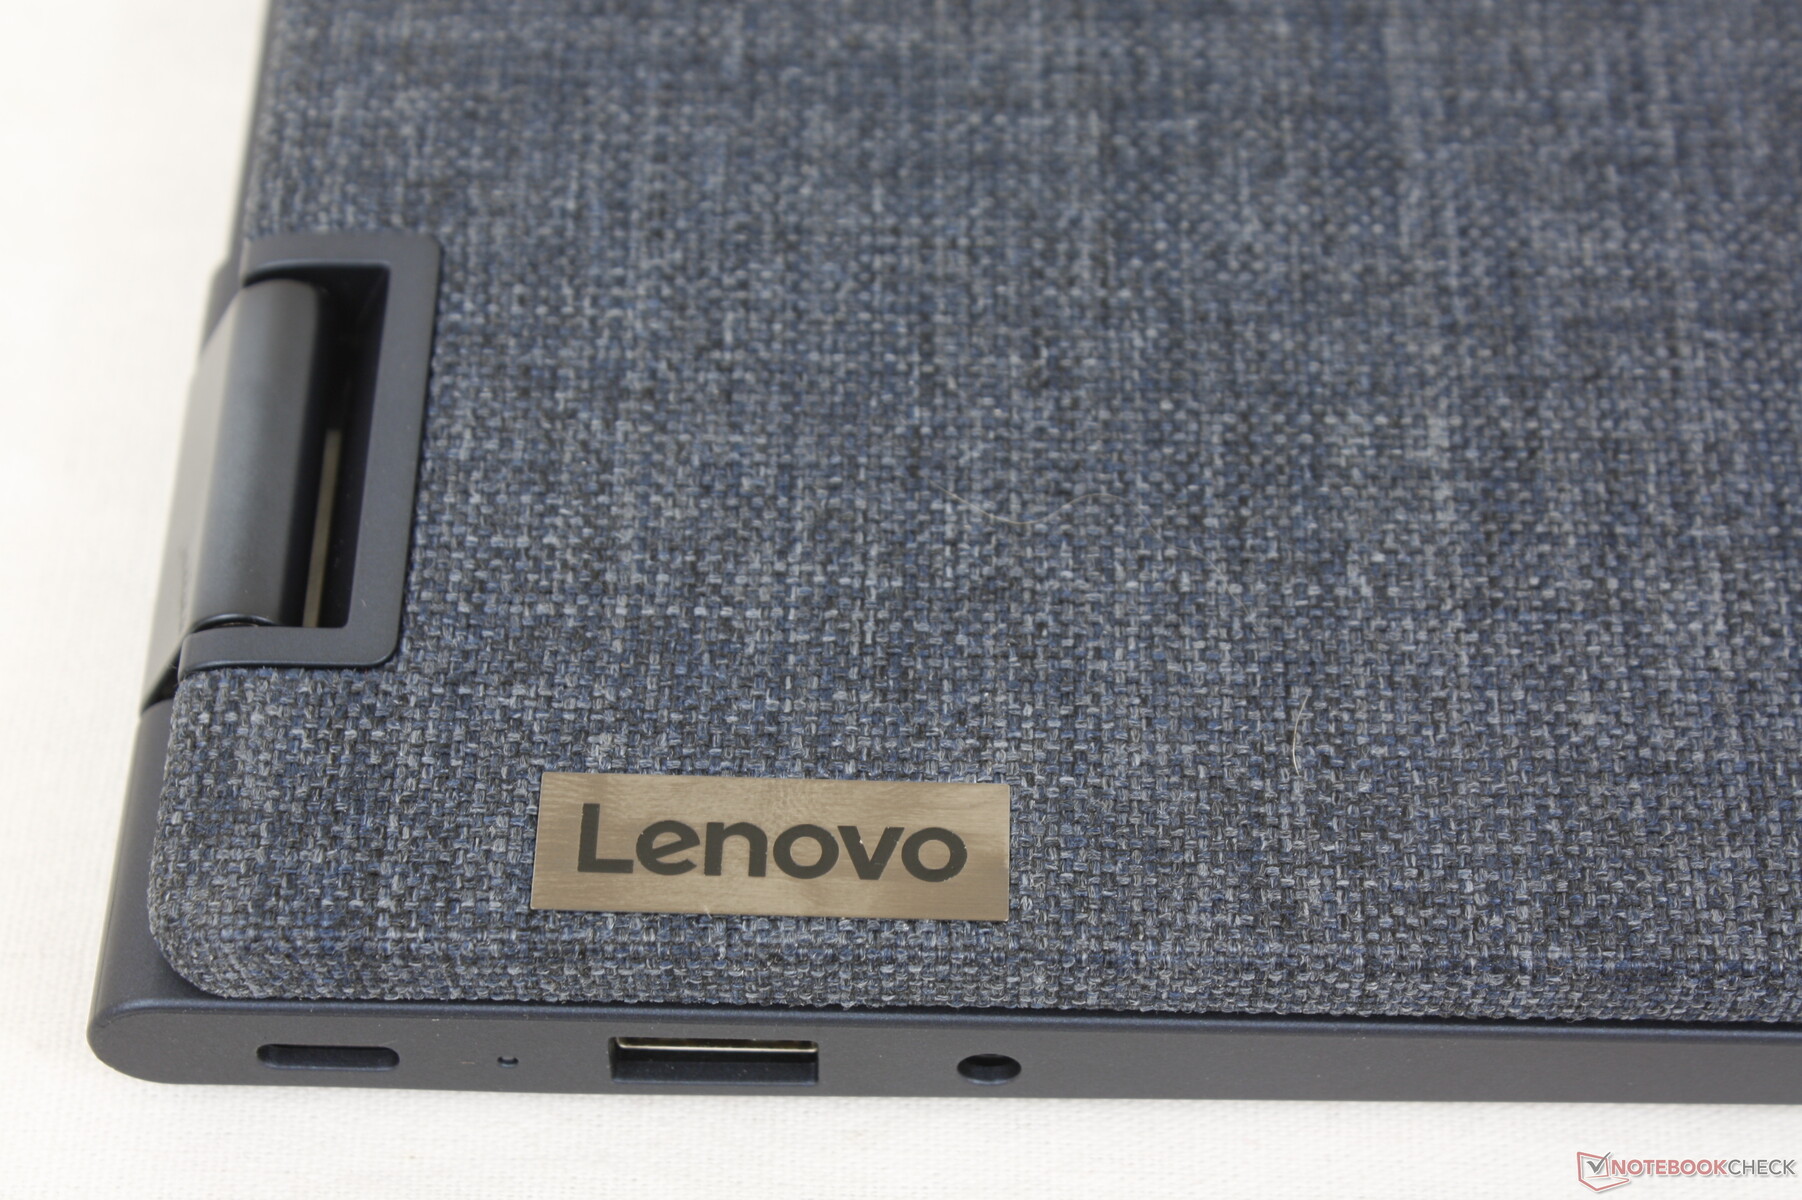
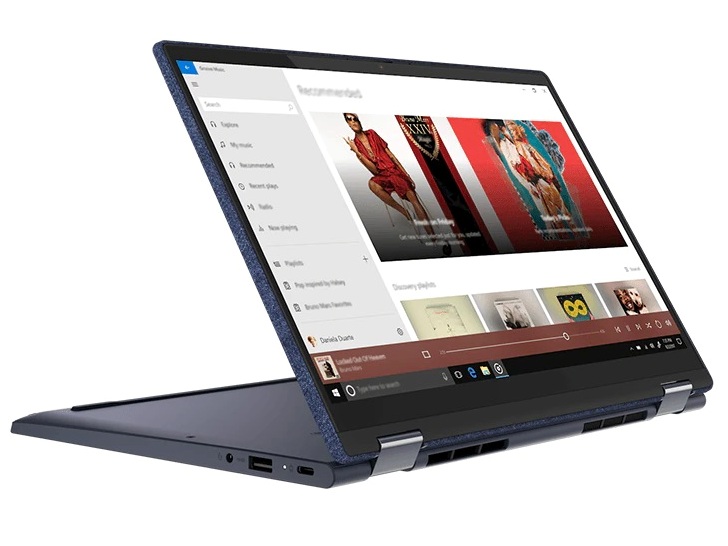
The most striking feature of the Yoga 6 13 is its fabric-encased outer lid which sets the system apart from the sea of other convertible laptop options. Competitors in this space include other affordable models like the Acer Spin 3 SP313, Dell Inspiron 2-in-1, HP Envy x360 13, or Asus VivoBook Flip.
More Lenovo reviews:
potential competitors in comparison
Rating | Date | Model | Weight | Height | Size | Resolution | Price |
|---|---|---|---|---|---|---|---|
| 84.7 % v7 (old) | 07 / 2021 | Lenovo Yoga 6 13 82ND0009US R5 5500U, Vega 7 | 1.3 kg | 18.2 mm | 13.30" | 1920x1080 | |
| 86.3 % v7 (old) | 07 / 2021 | Asus ZenBook Flip 13 UX363EA-HP069T i7-1165G7, Iris Xe G7 96EUs | 1.2 kg | 13 mm | 13.30" | 1920x1080 | |
| 85.4 % v7 (old) | 06 / 2021 | Samsung Galaxy Book Pro 360 13 i5-1135G7, Iris Xe G7 80EUs | 1.1 kg | 13 mm | 13.20" | 1920x1080 | |
| 87.8 % v7 (old) | 05 / 2021 | HP Spectre x360 13-aw2003dx i5-1135G7, Iris Xe G7 80EUs | 1.2 kg | 16.9 mm | 13.30" | 3840x2160 | |
| 86.9 % v7 (old) | 04 / 2021 | MSI Summit E13 Flip Evo A11MT i7-1185G7, Iris Xe G7 96EUs | 1.4 kg | 14.9 mm | 13.40" | 1920x1200 | |
| 83.7 % v7 (old) | 05 / 2021 | Lenovo IdeaPad Flex 5 CB 13IML05 82B80010GE i5-10210U, UHD Graphics 620 | 1.4 kg | 17.95 mm | 13.30" | 1920x1080 |
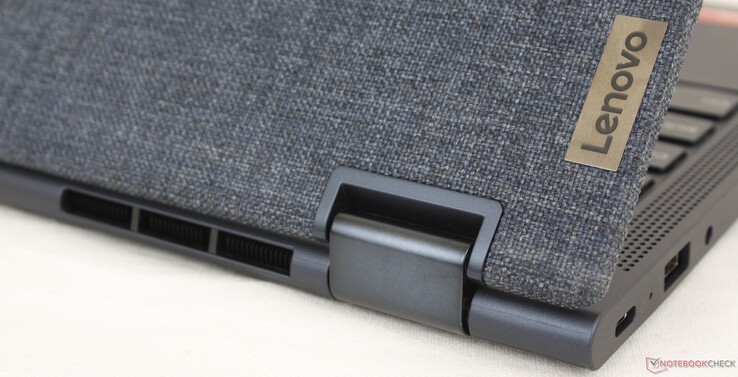
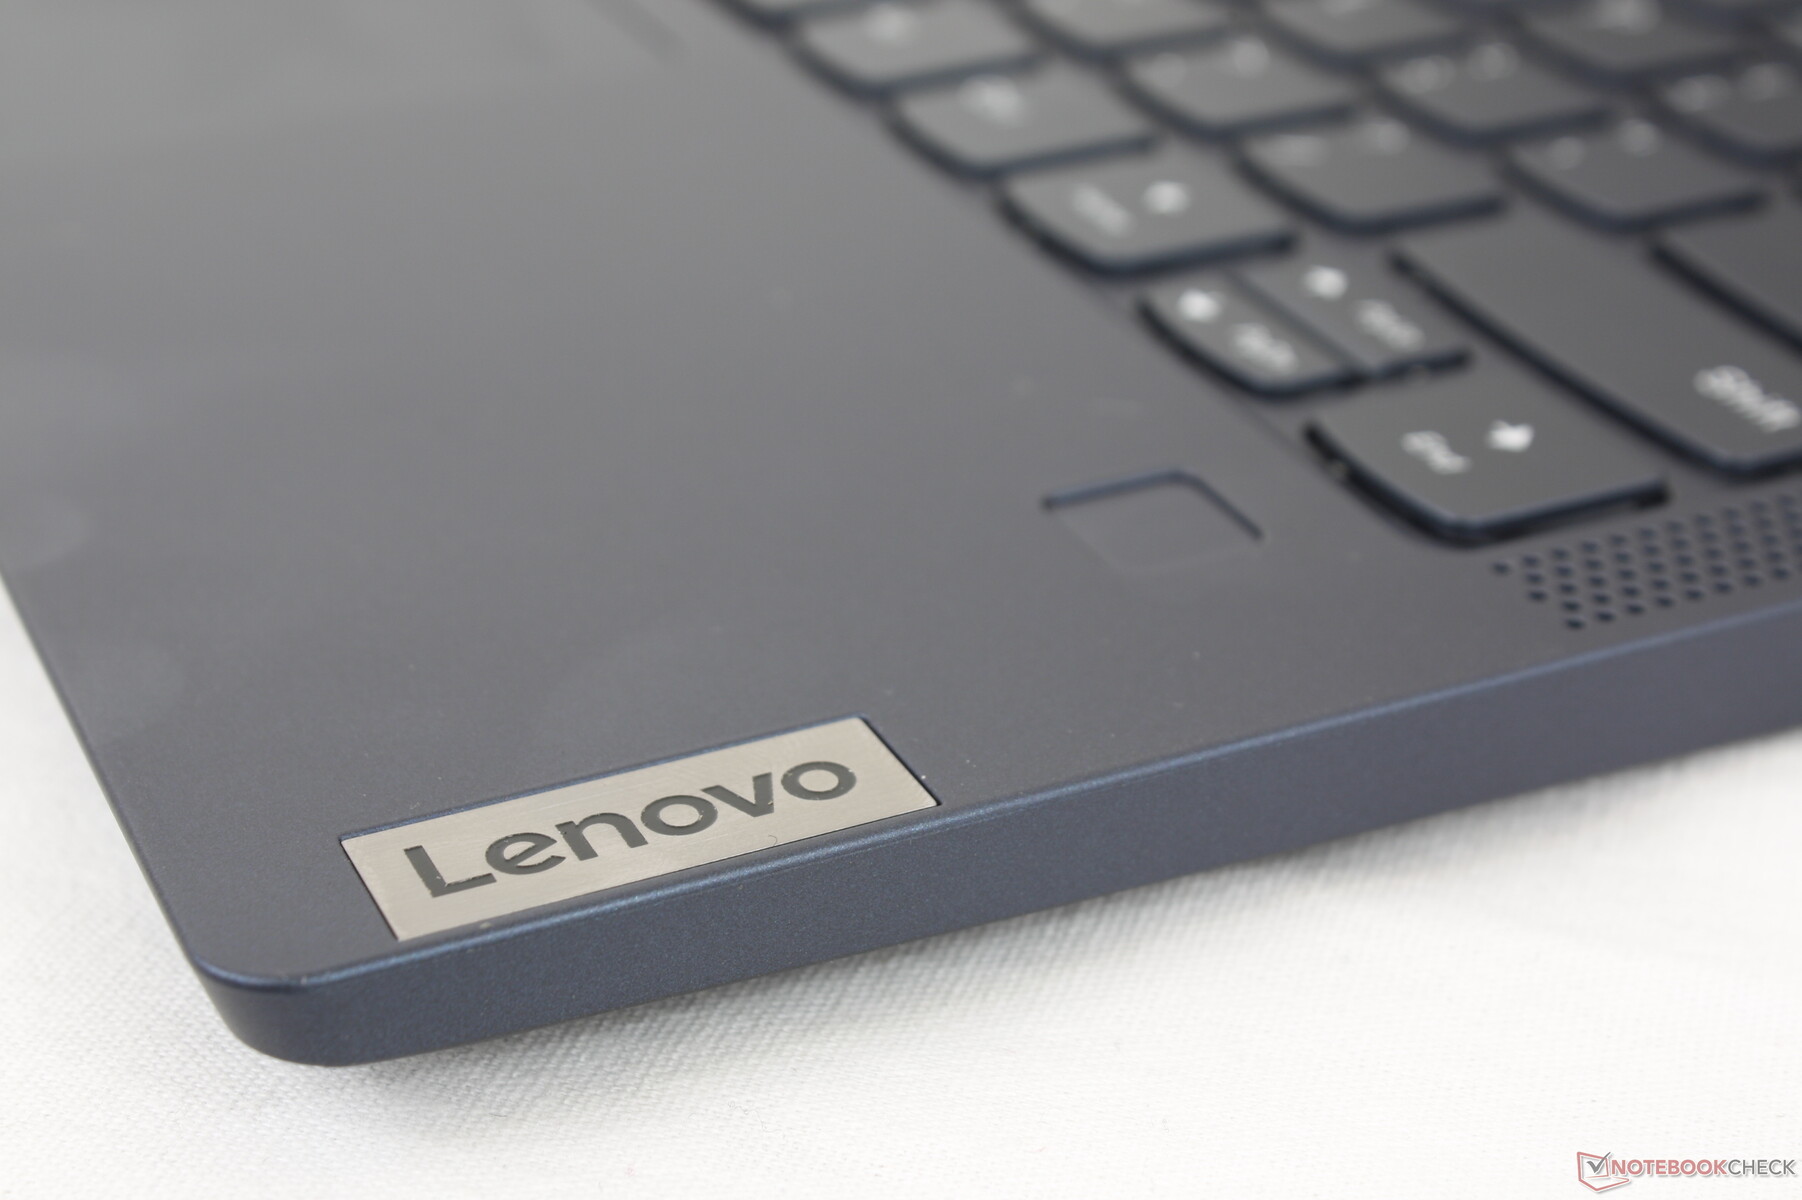
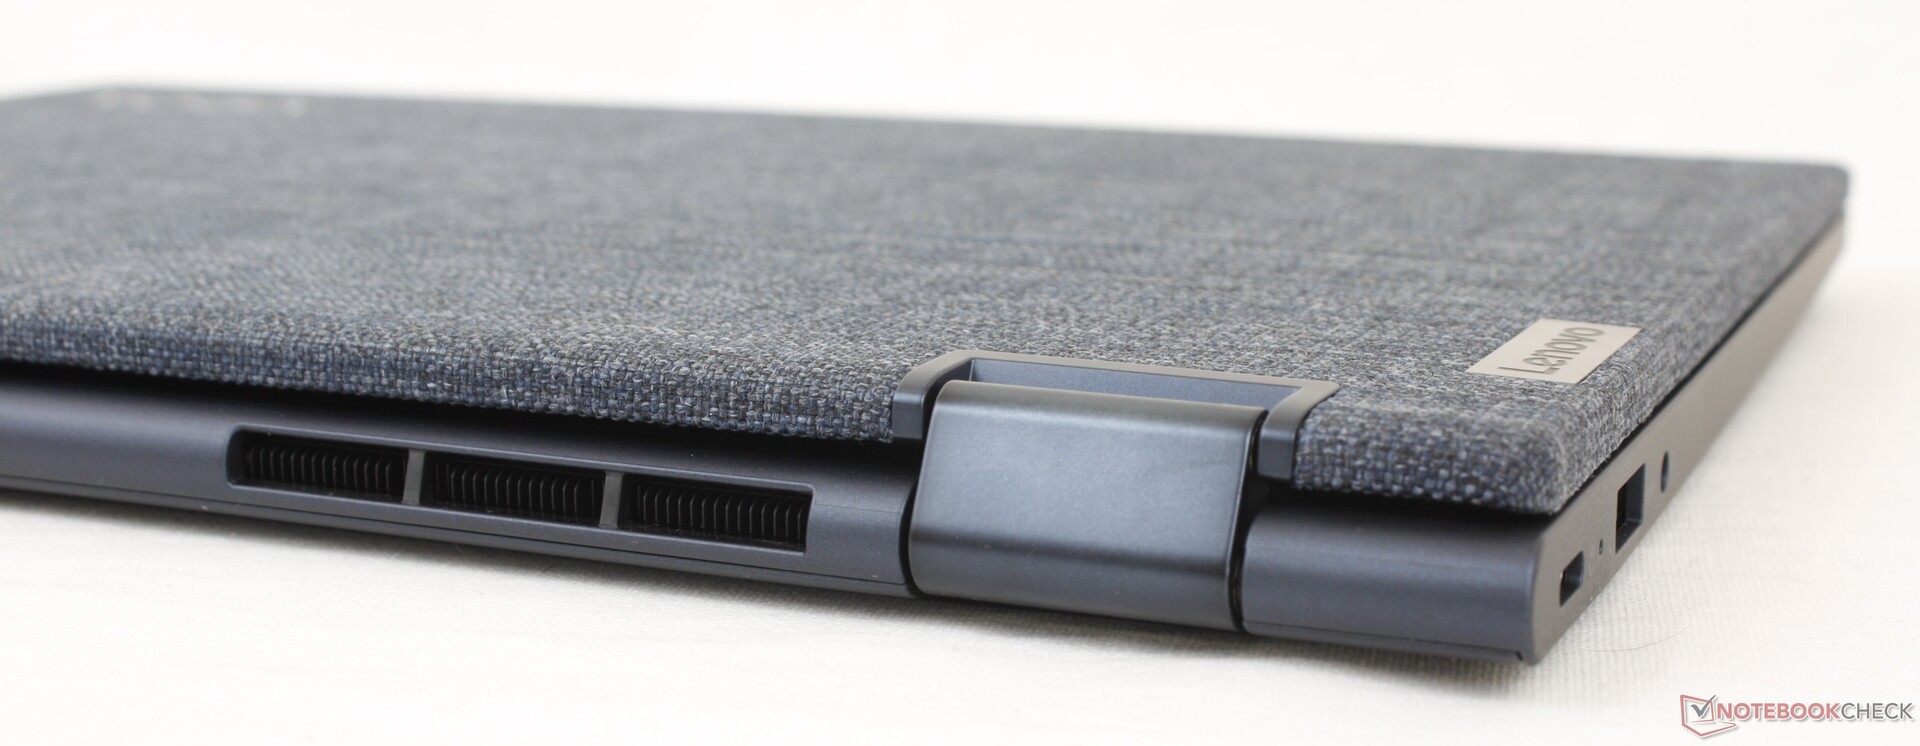
Case — Abyss Blue Fabric For Style
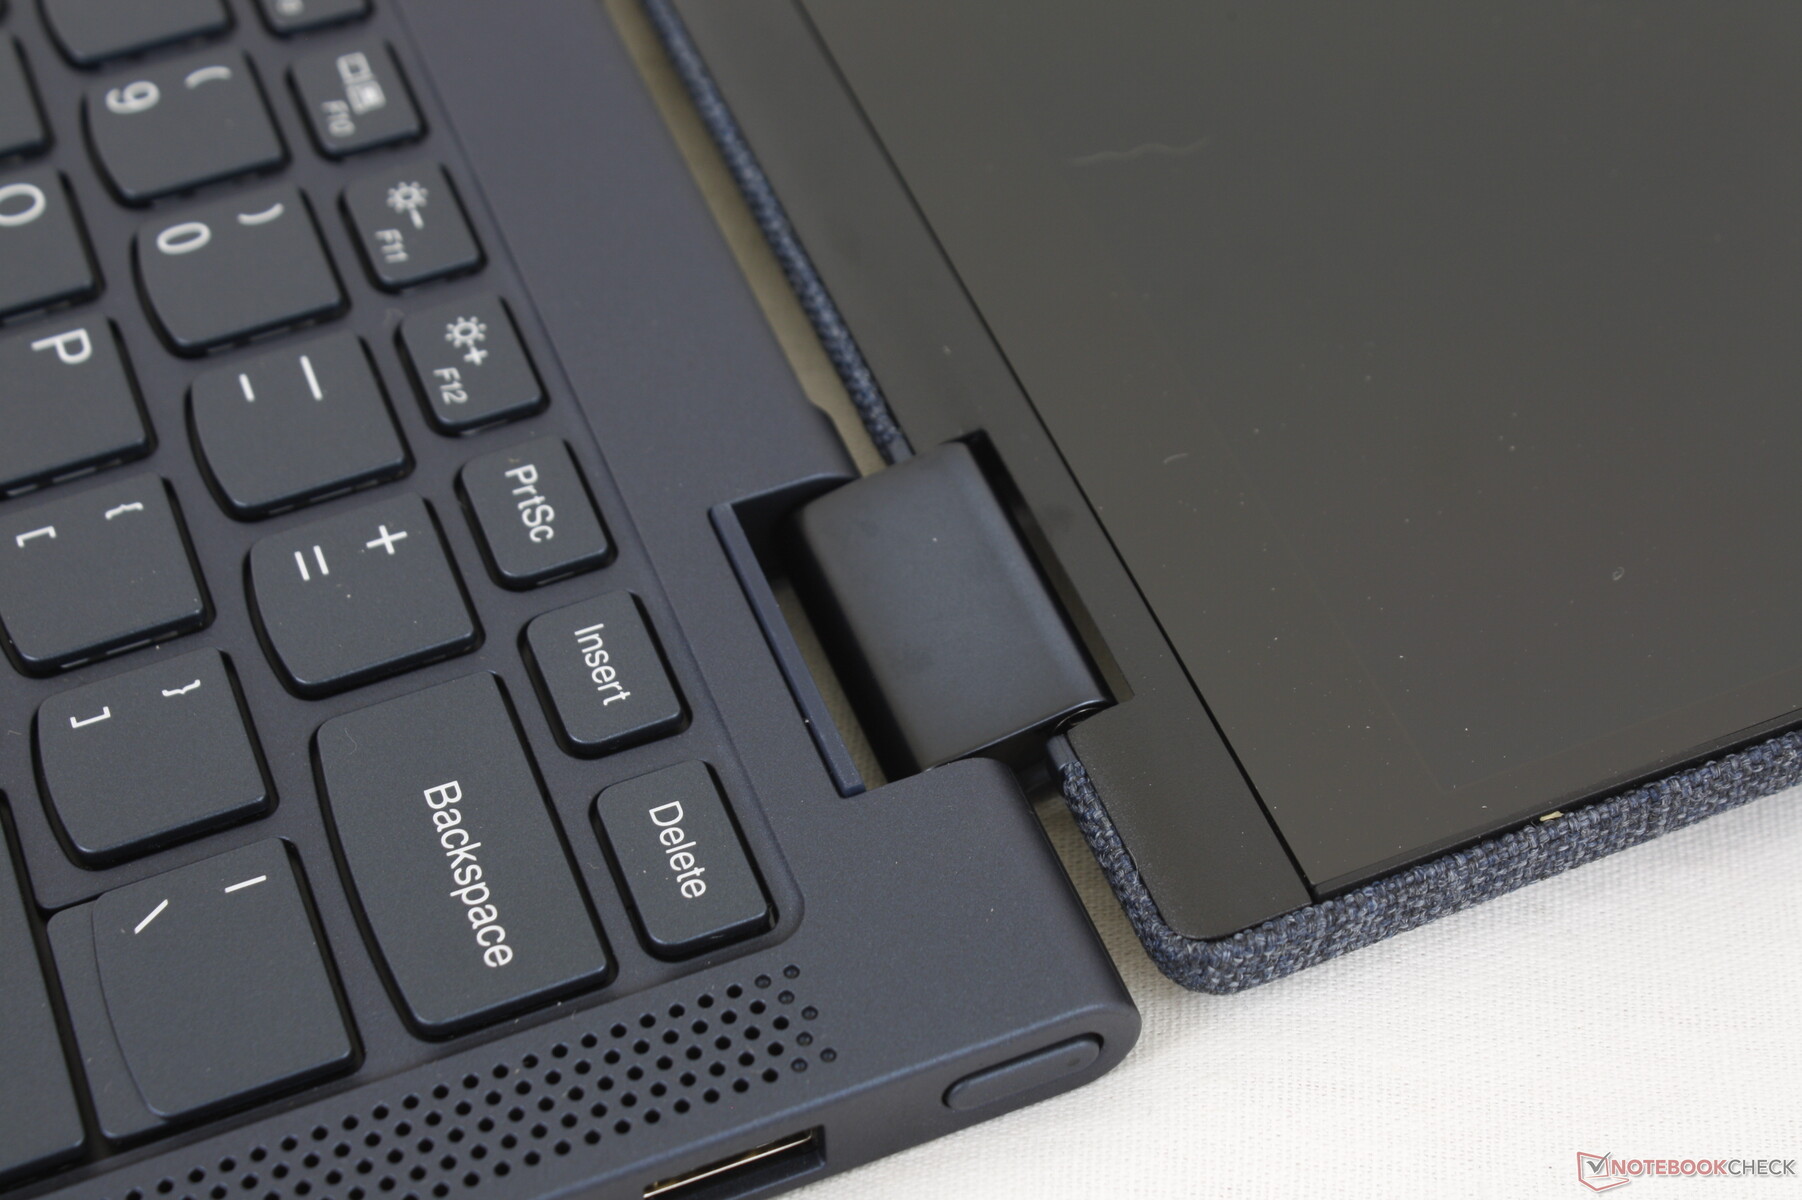
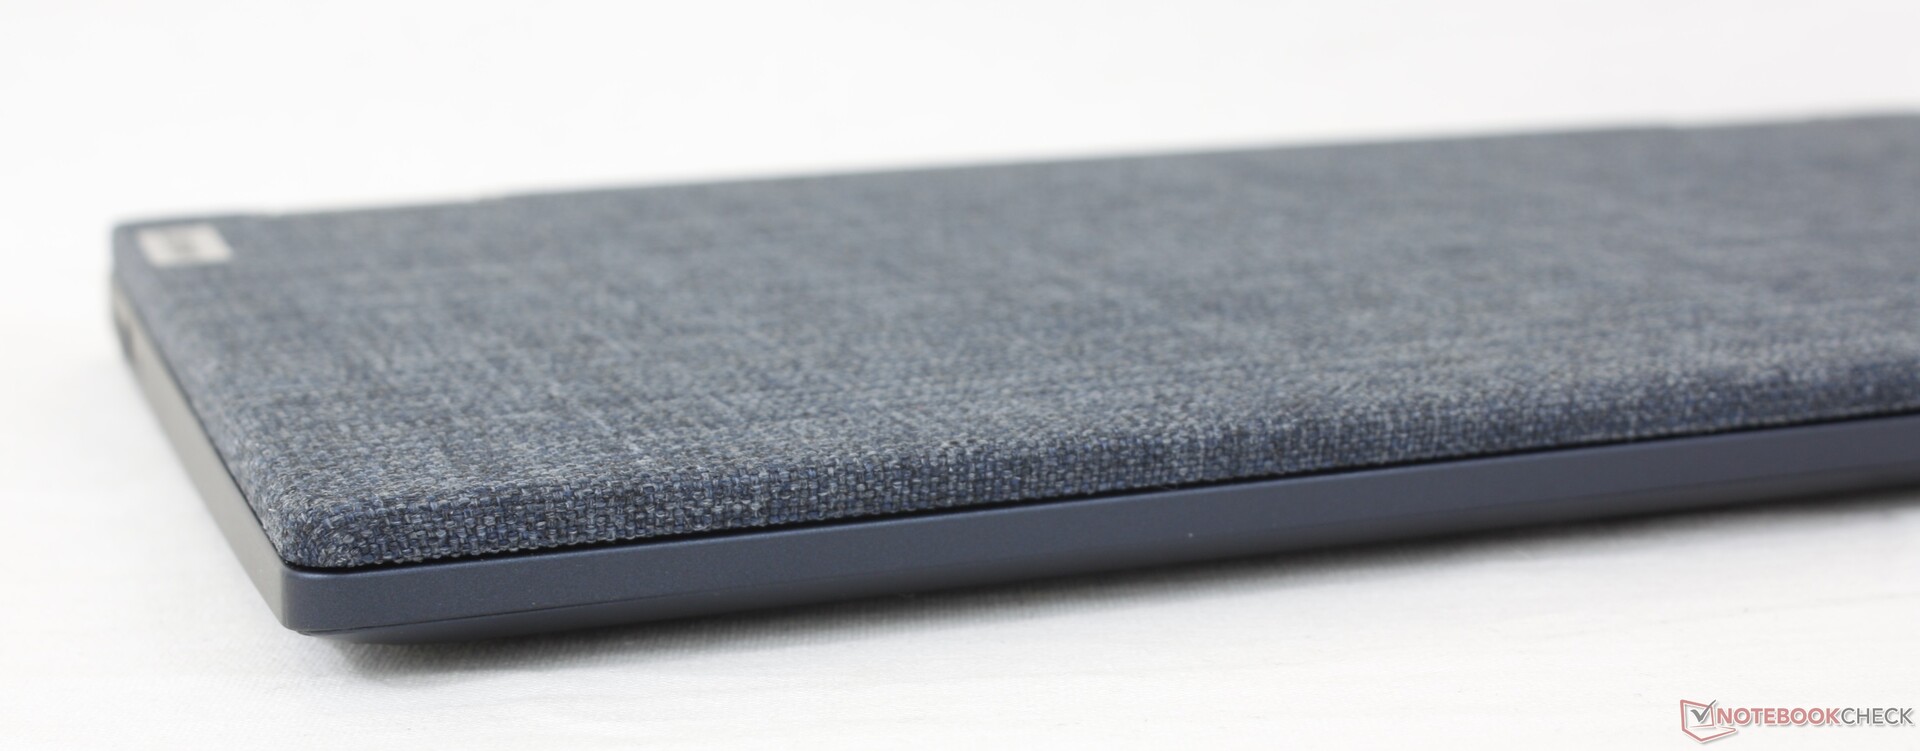
We have to give Lenovo props for deviating from the typical plastic, metal, carbon fiber, and even leather surfaces that make up most other laptops in the market. The manufacturer has done an excellent job integrating and securing the fabric along the edges of the lid for a seamless transition between the fabric and glass screen. The plastic keyboard deck and base are not made of anything special as the fabric applies only on the outer lid.
Our main worry about the fabric-encased outer lid is that its surface is constantly exposed to the elements including fingers, dirt, dust, and potentially liquids that can be difficult to properly clean. We wouldn't be surprised to see its clean blue surface darken or brown over time for an unsightly appearance. The Alcantara material on Microsoft Surface tablets also suffers from similar issues.
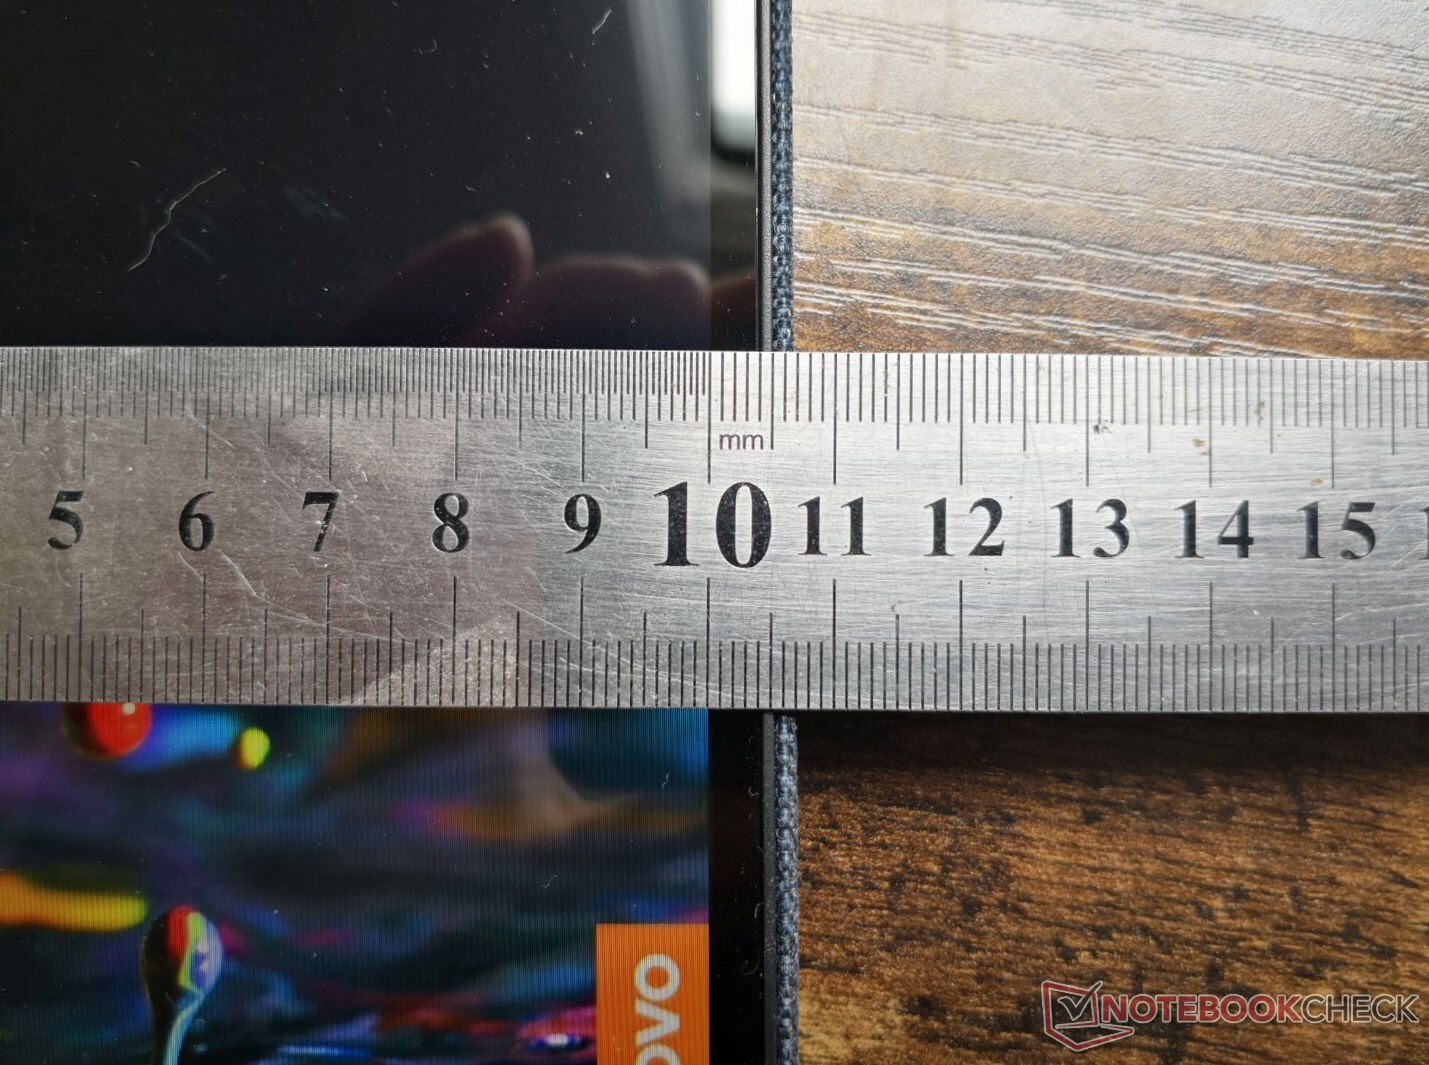
At 18.2 mm, the system is slightly thicker than most convertible laptops including the IdeaPad Flex 5, Yoga C940, and HP Spectre x360 13. Length and width are comparable to the ZenBook Flip 13 UX363, but we believe it could have been smaller since the top and bottom bezels are somewhat thick on the Yoga 6 13.
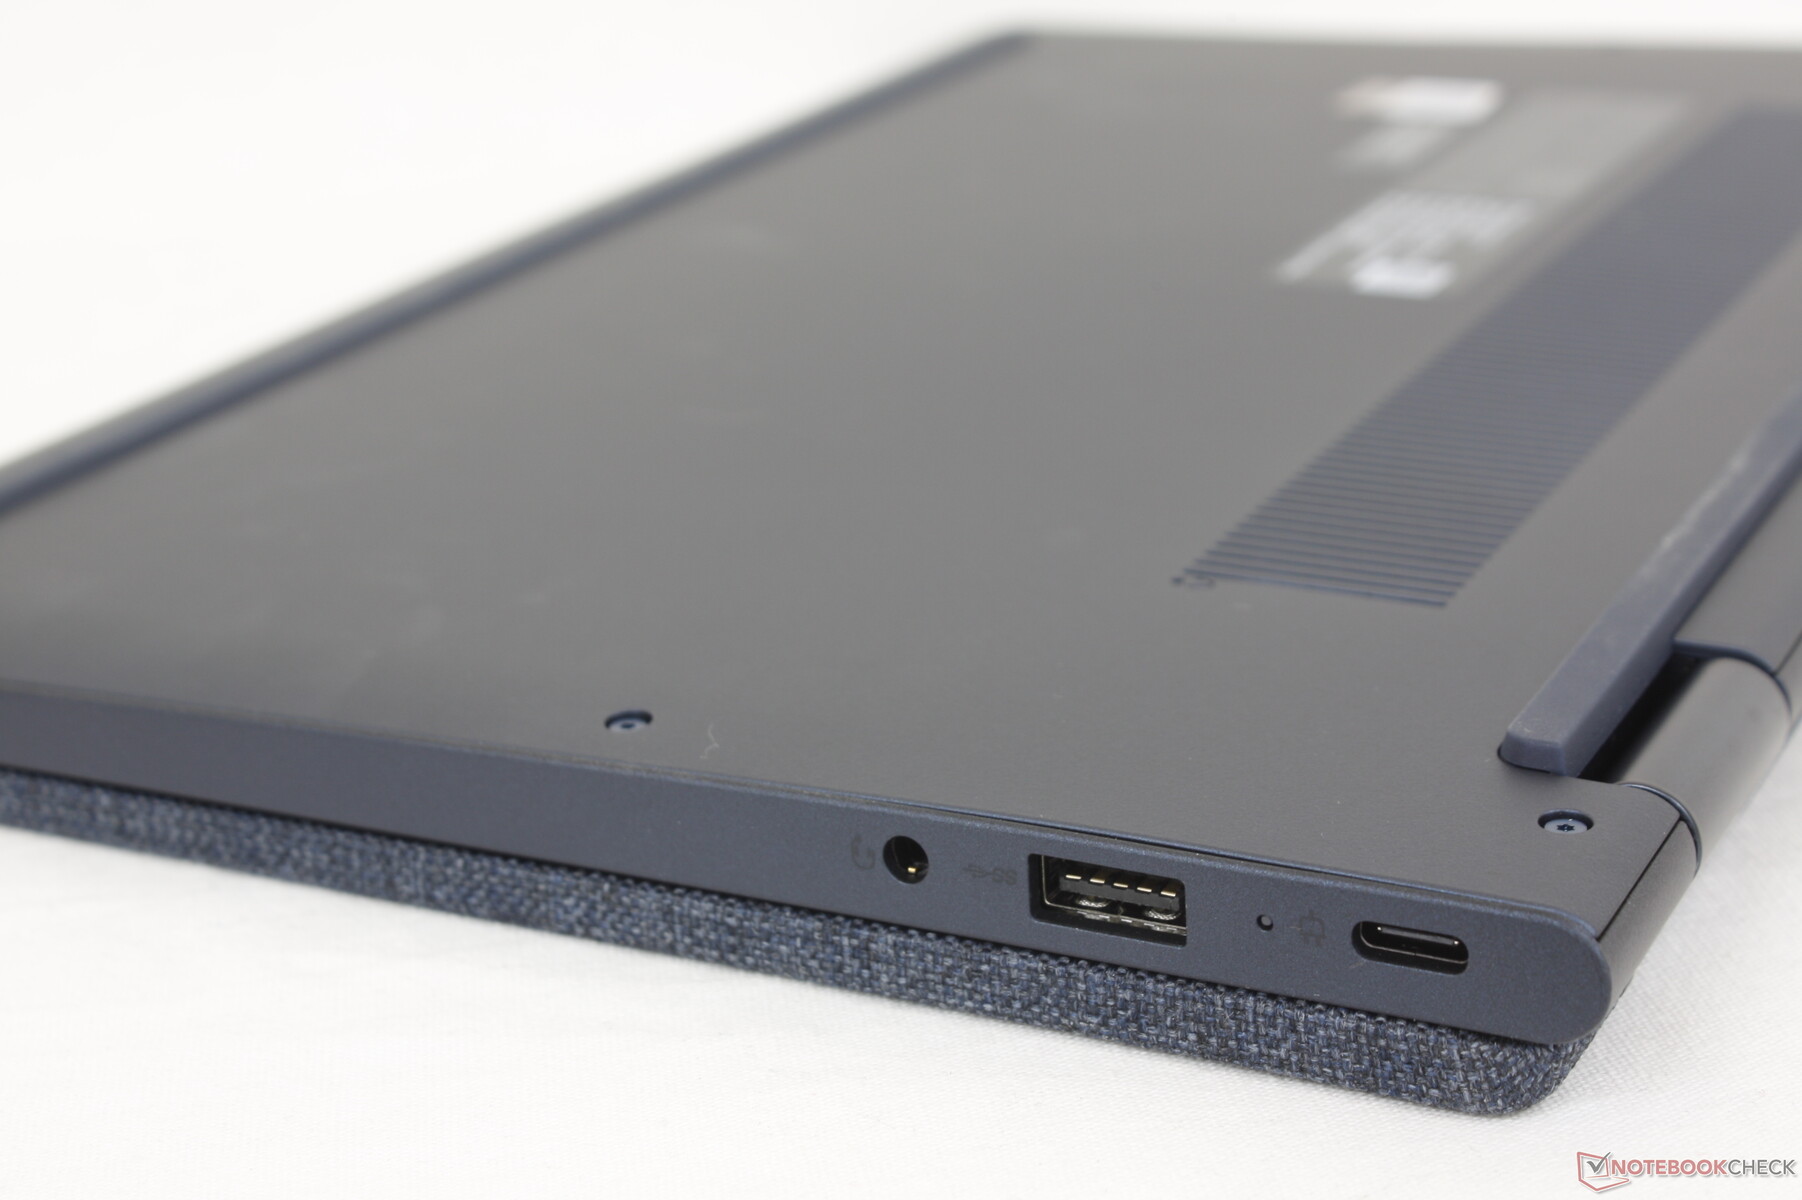
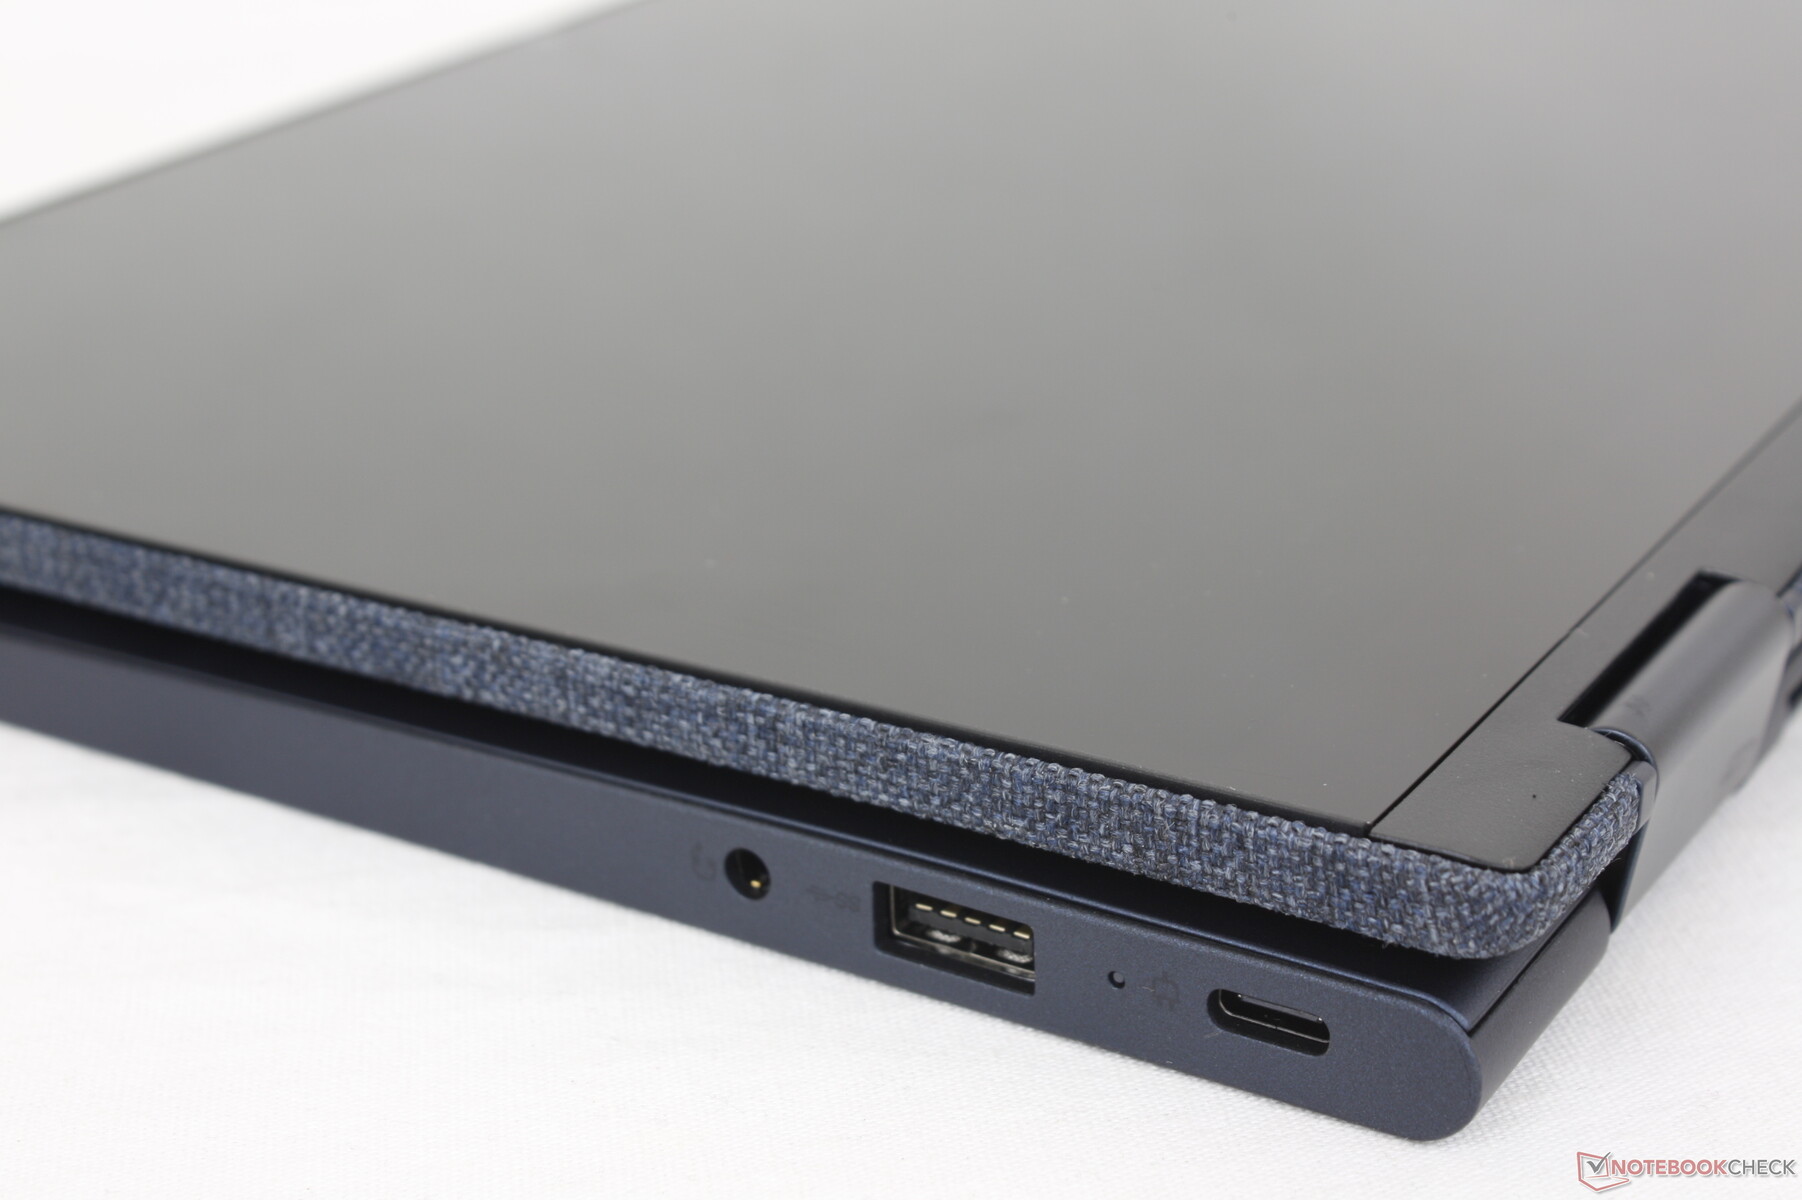
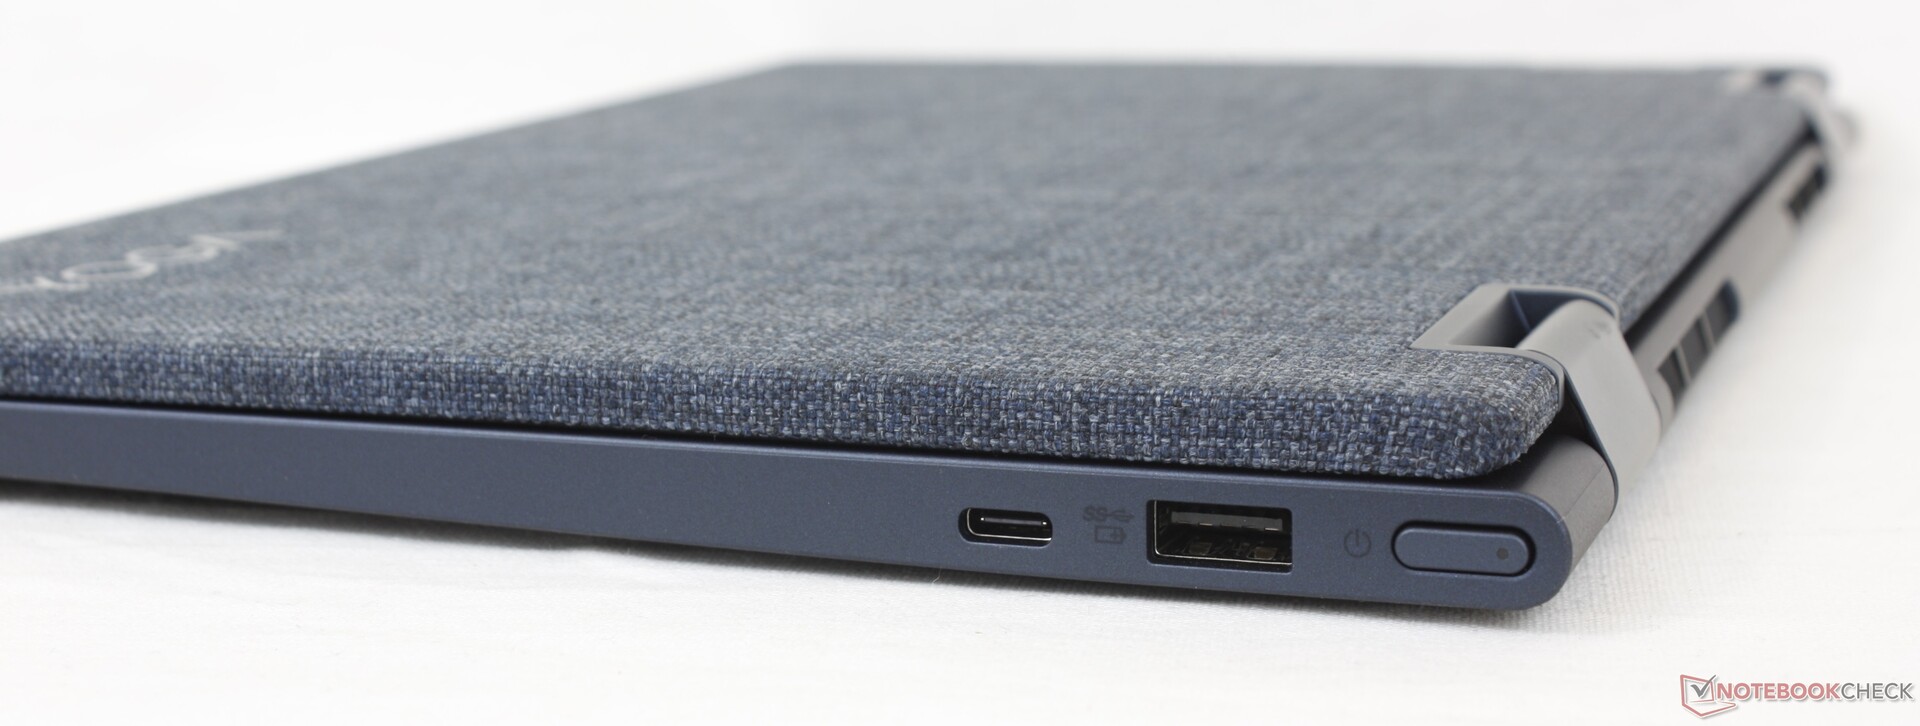
Connectivity — Good Selection of Ports
Annoyingly, only the USB-C port along the left edge supports Power Delivery meaning you can only charge the laptop on this side. The USB-C port along the right edge does not support Power Delivery.
There is no integrated HDMI port unlike on the ZenBook Flip 13. Thunderbolt is not supported as well due to the AMD processor.

Communication
The system ships with a Realtek RTL8852AE for Wi-Fi 6 and Bluetooth 5.2 connectivity instead of the usual Intel AX200/201 likely to save on costs. Transfer rates are stable but generally slower than on laptops with the Intel module.
Webcam
The camera integrates a manual shutter like on most laptops these days. Camera quality, however, remains poor.


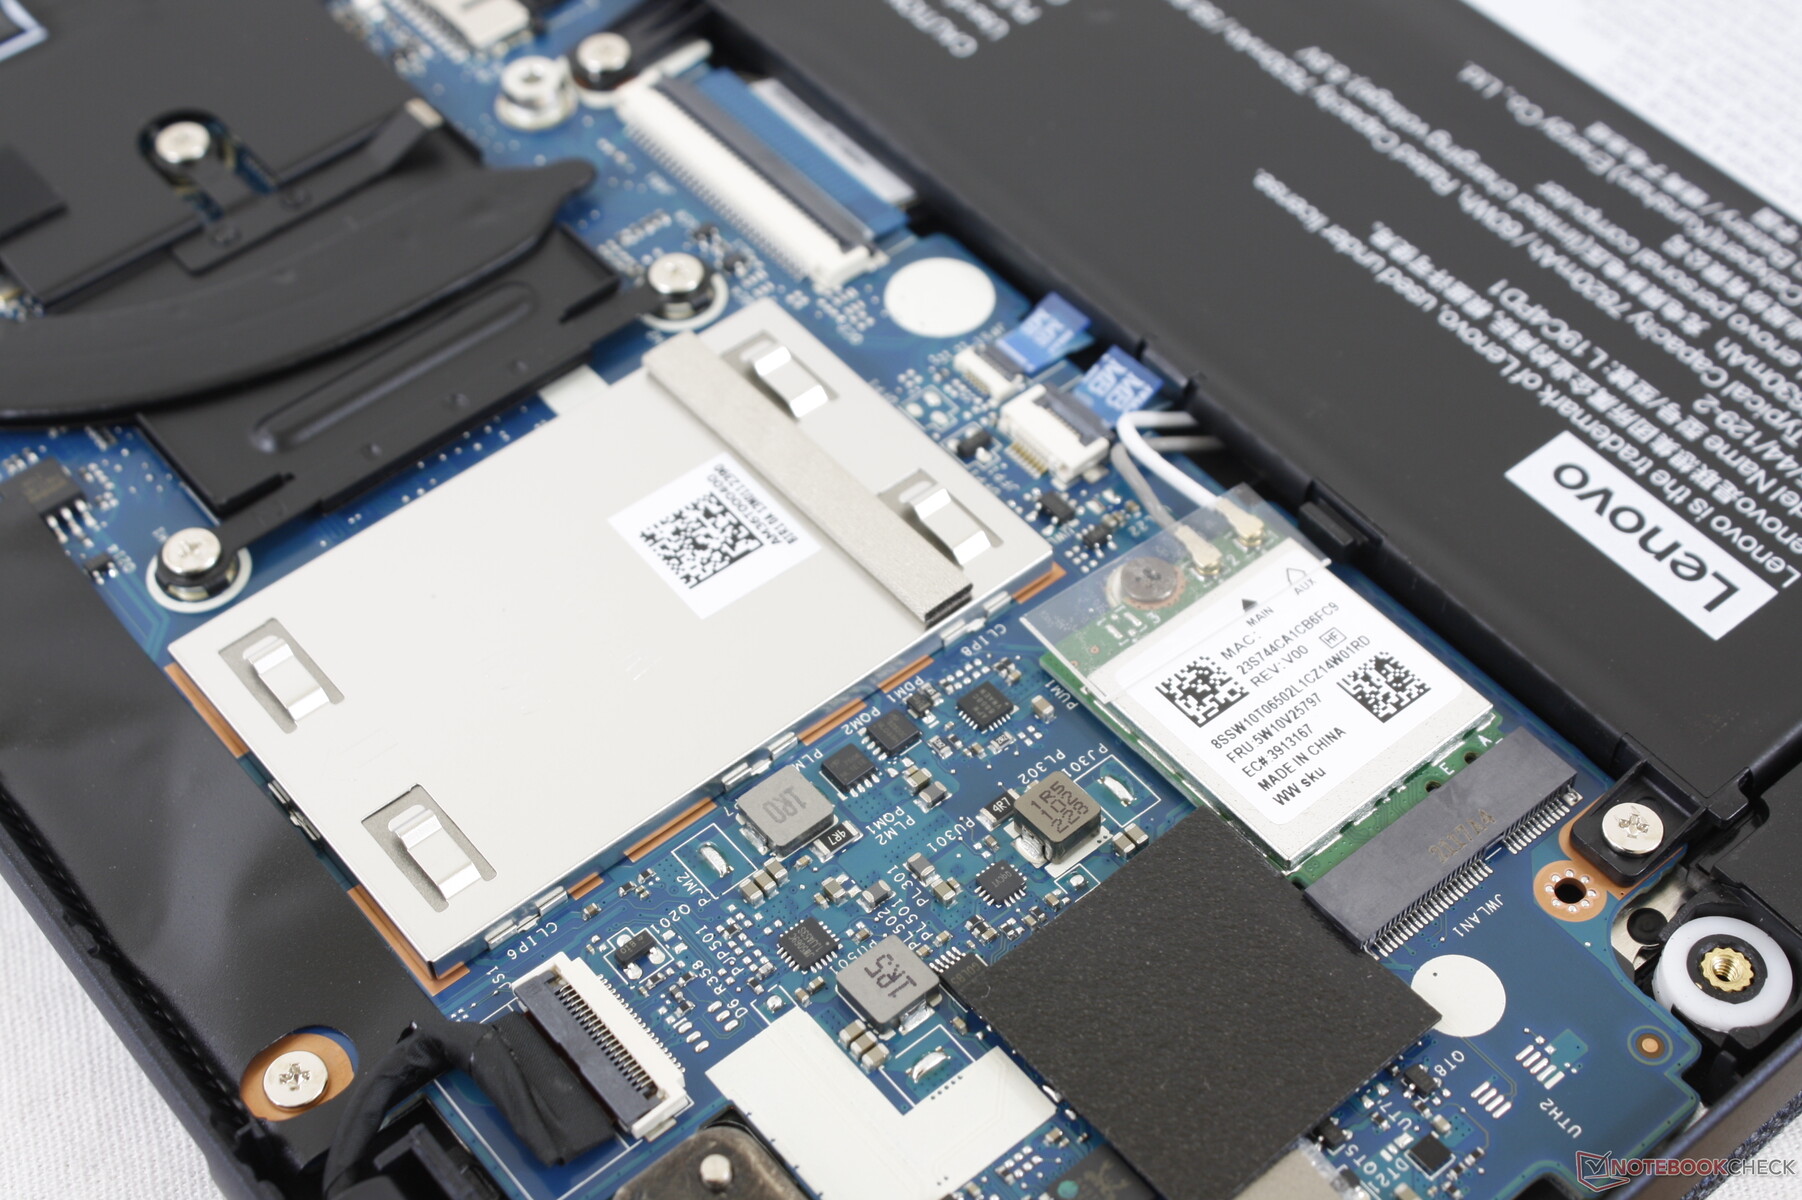
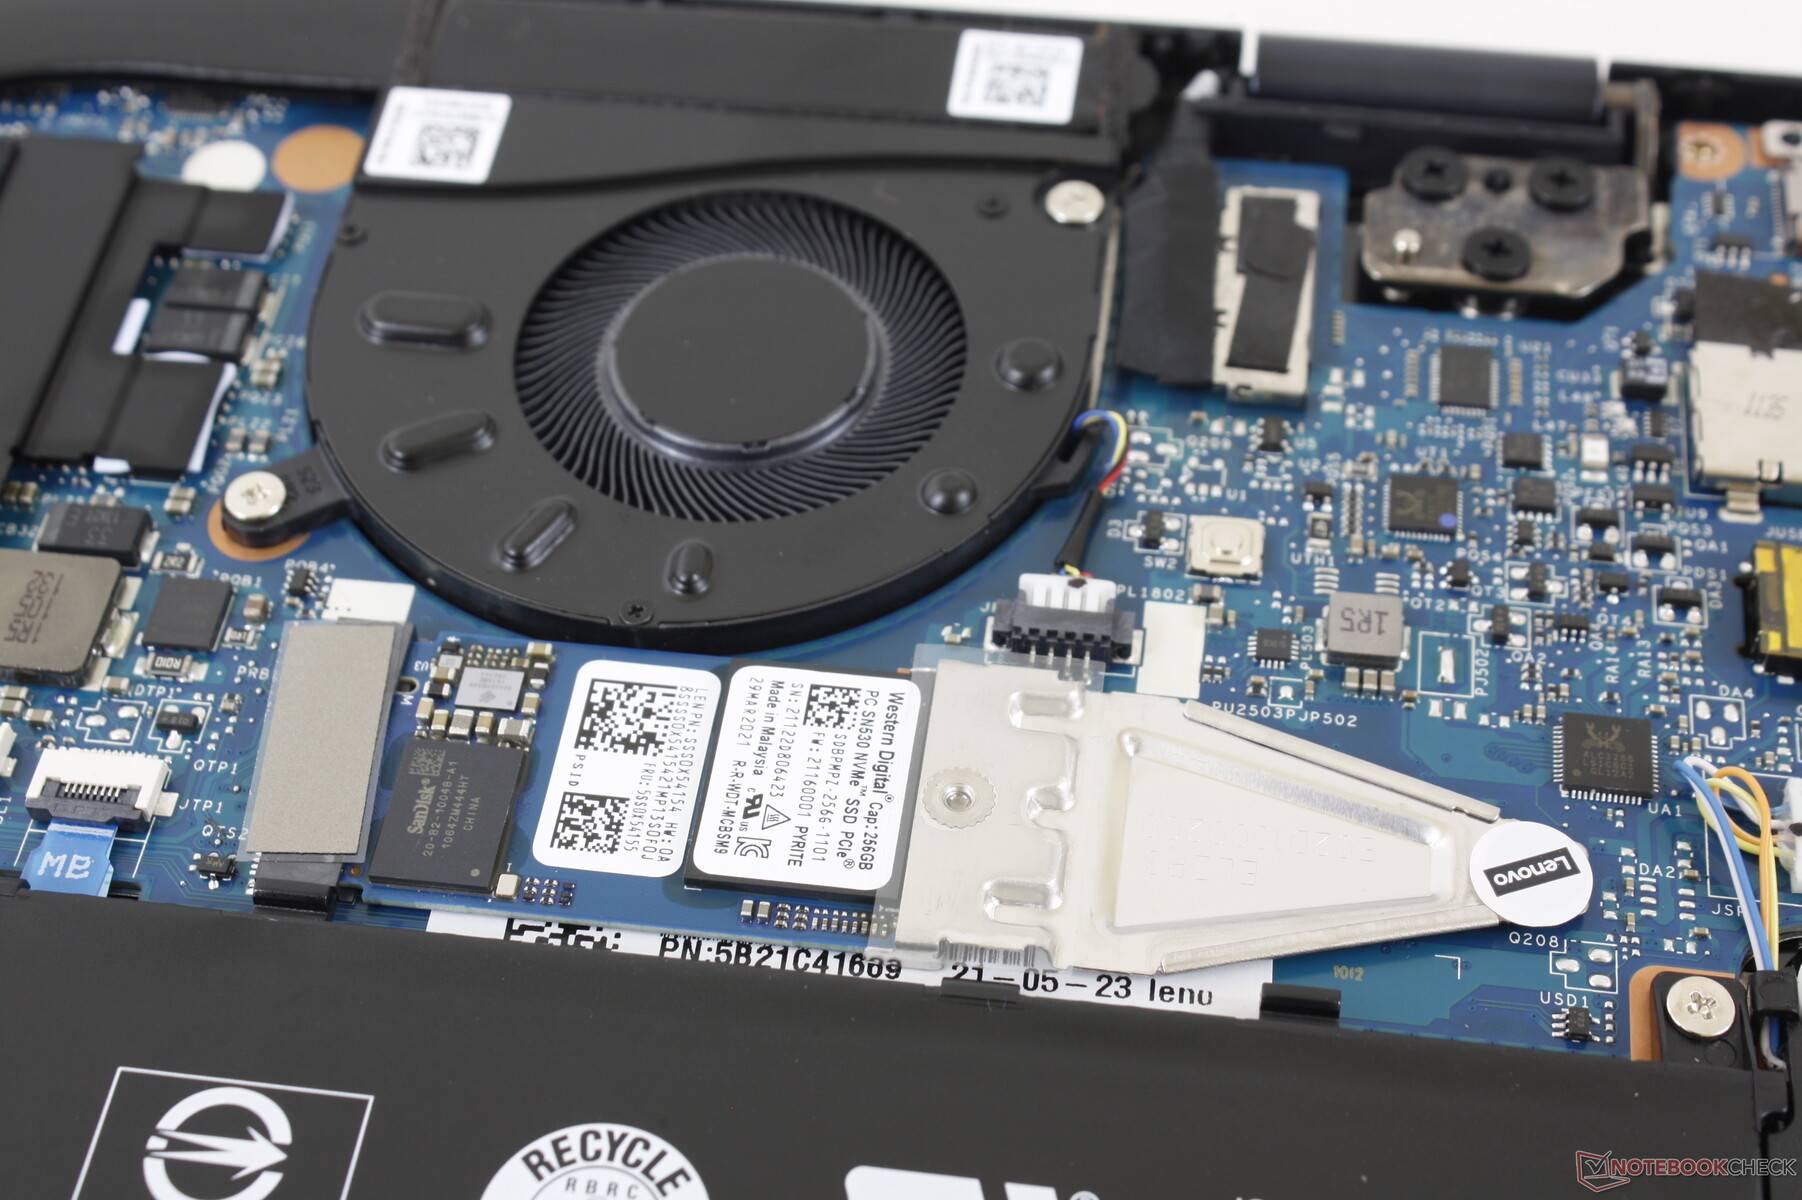
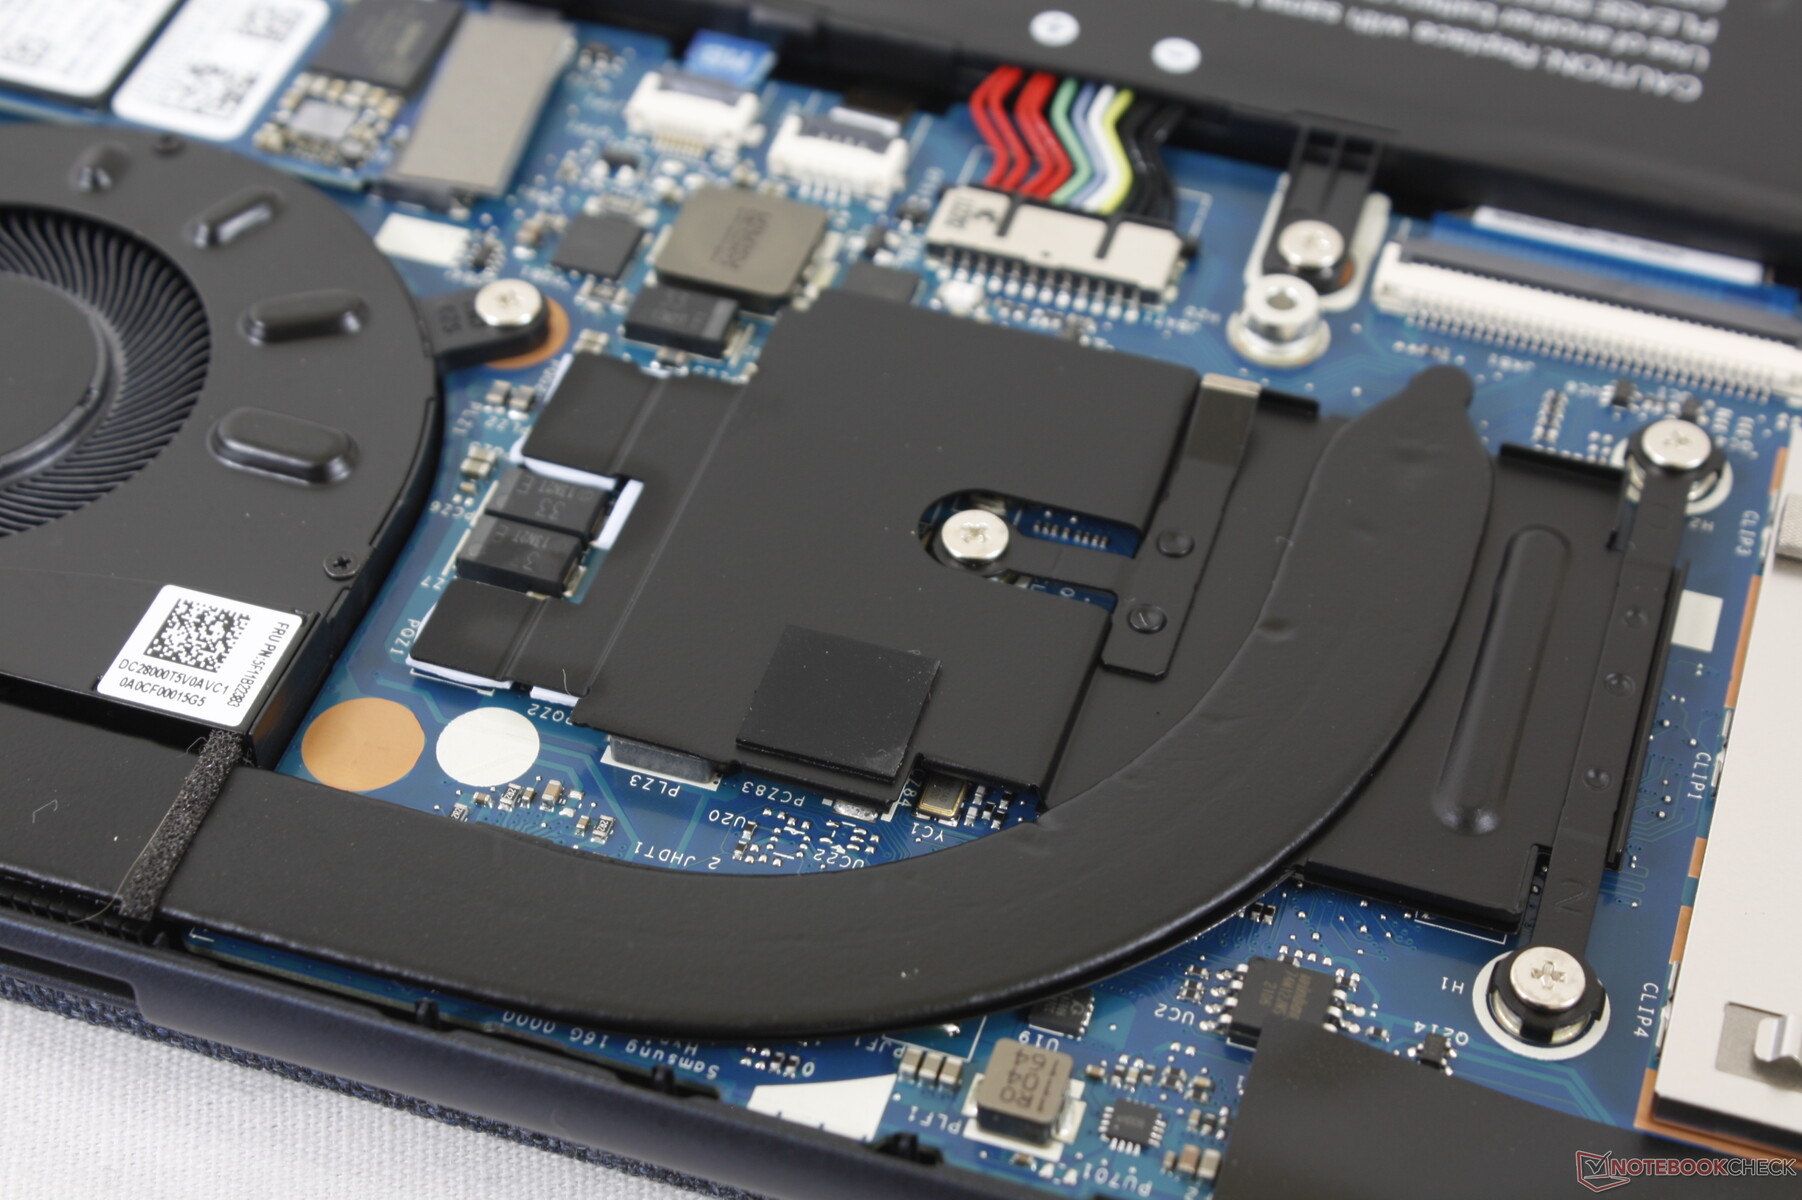
Maintenance
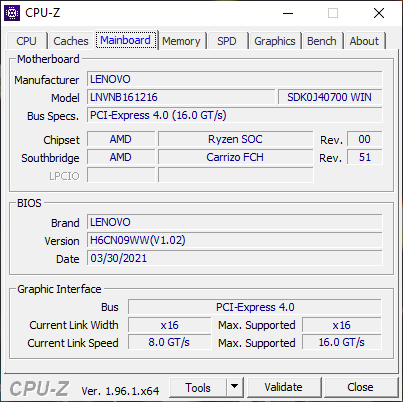
The bottom panel is easily removable provided you have a T5 Torx wrench. The motherboard allows for easy WLAN or M.2 SSD upgrades once exposed although a Lenovo sticker must be broken if upgrading the SSD. RAM is soldered and therefore not upgradeable.

Accessories and Warranty
There are no extras in the box outside of the AC adapter and paperwork which is disappointing because the system has full support for active pens. The standard one-year limited warranty applies.
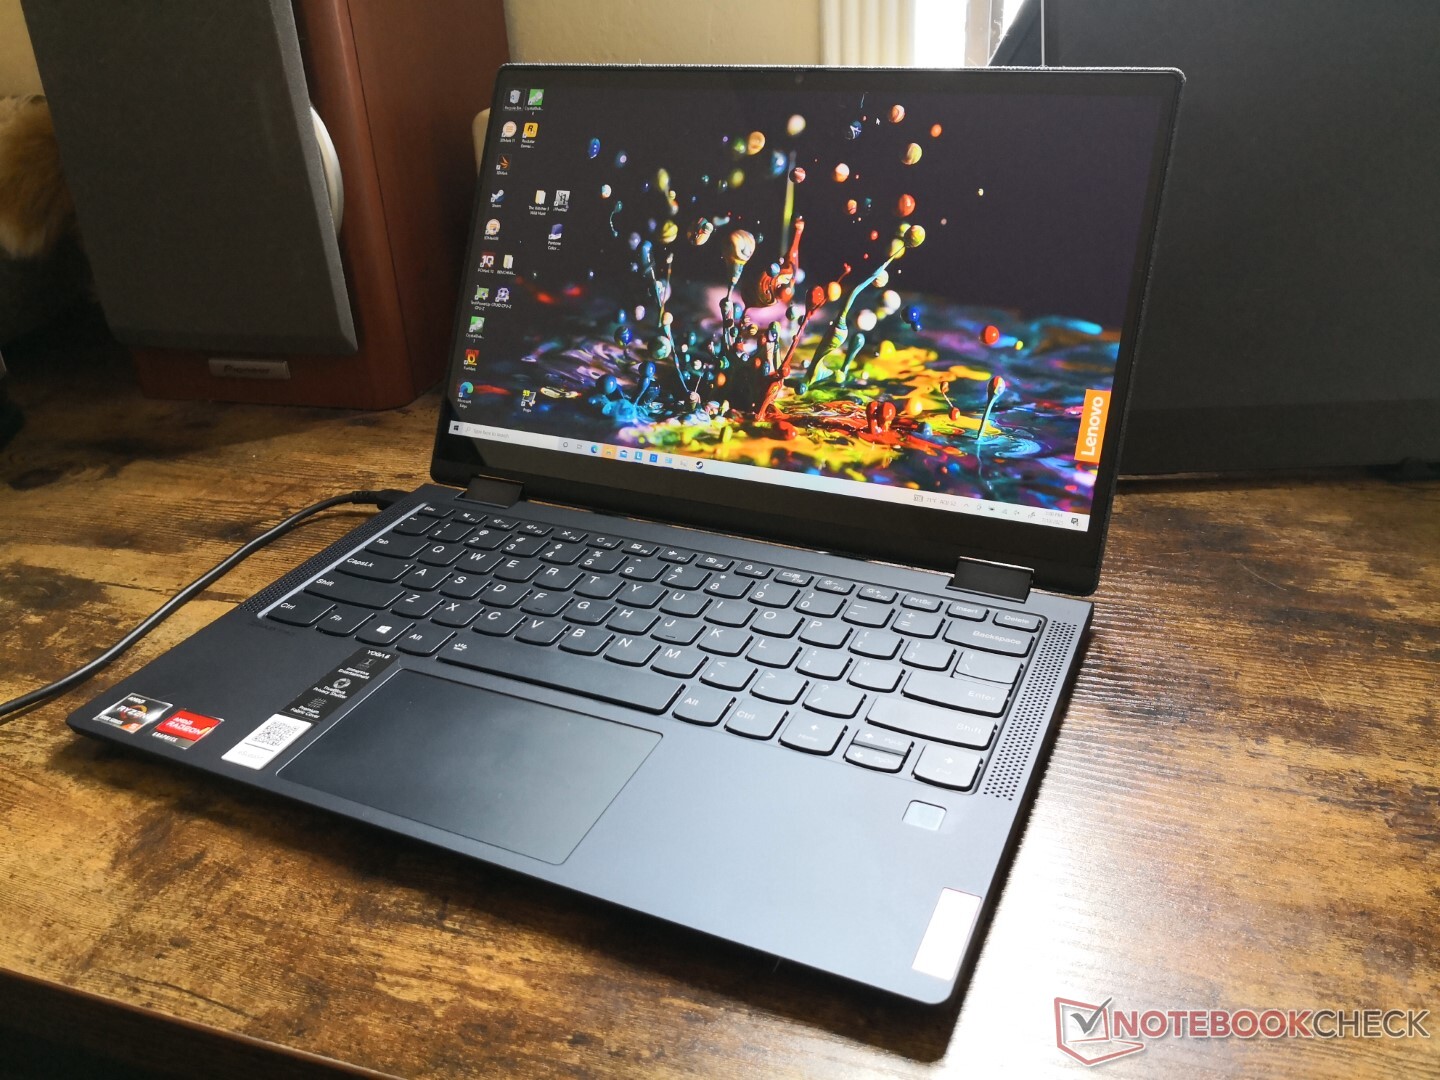
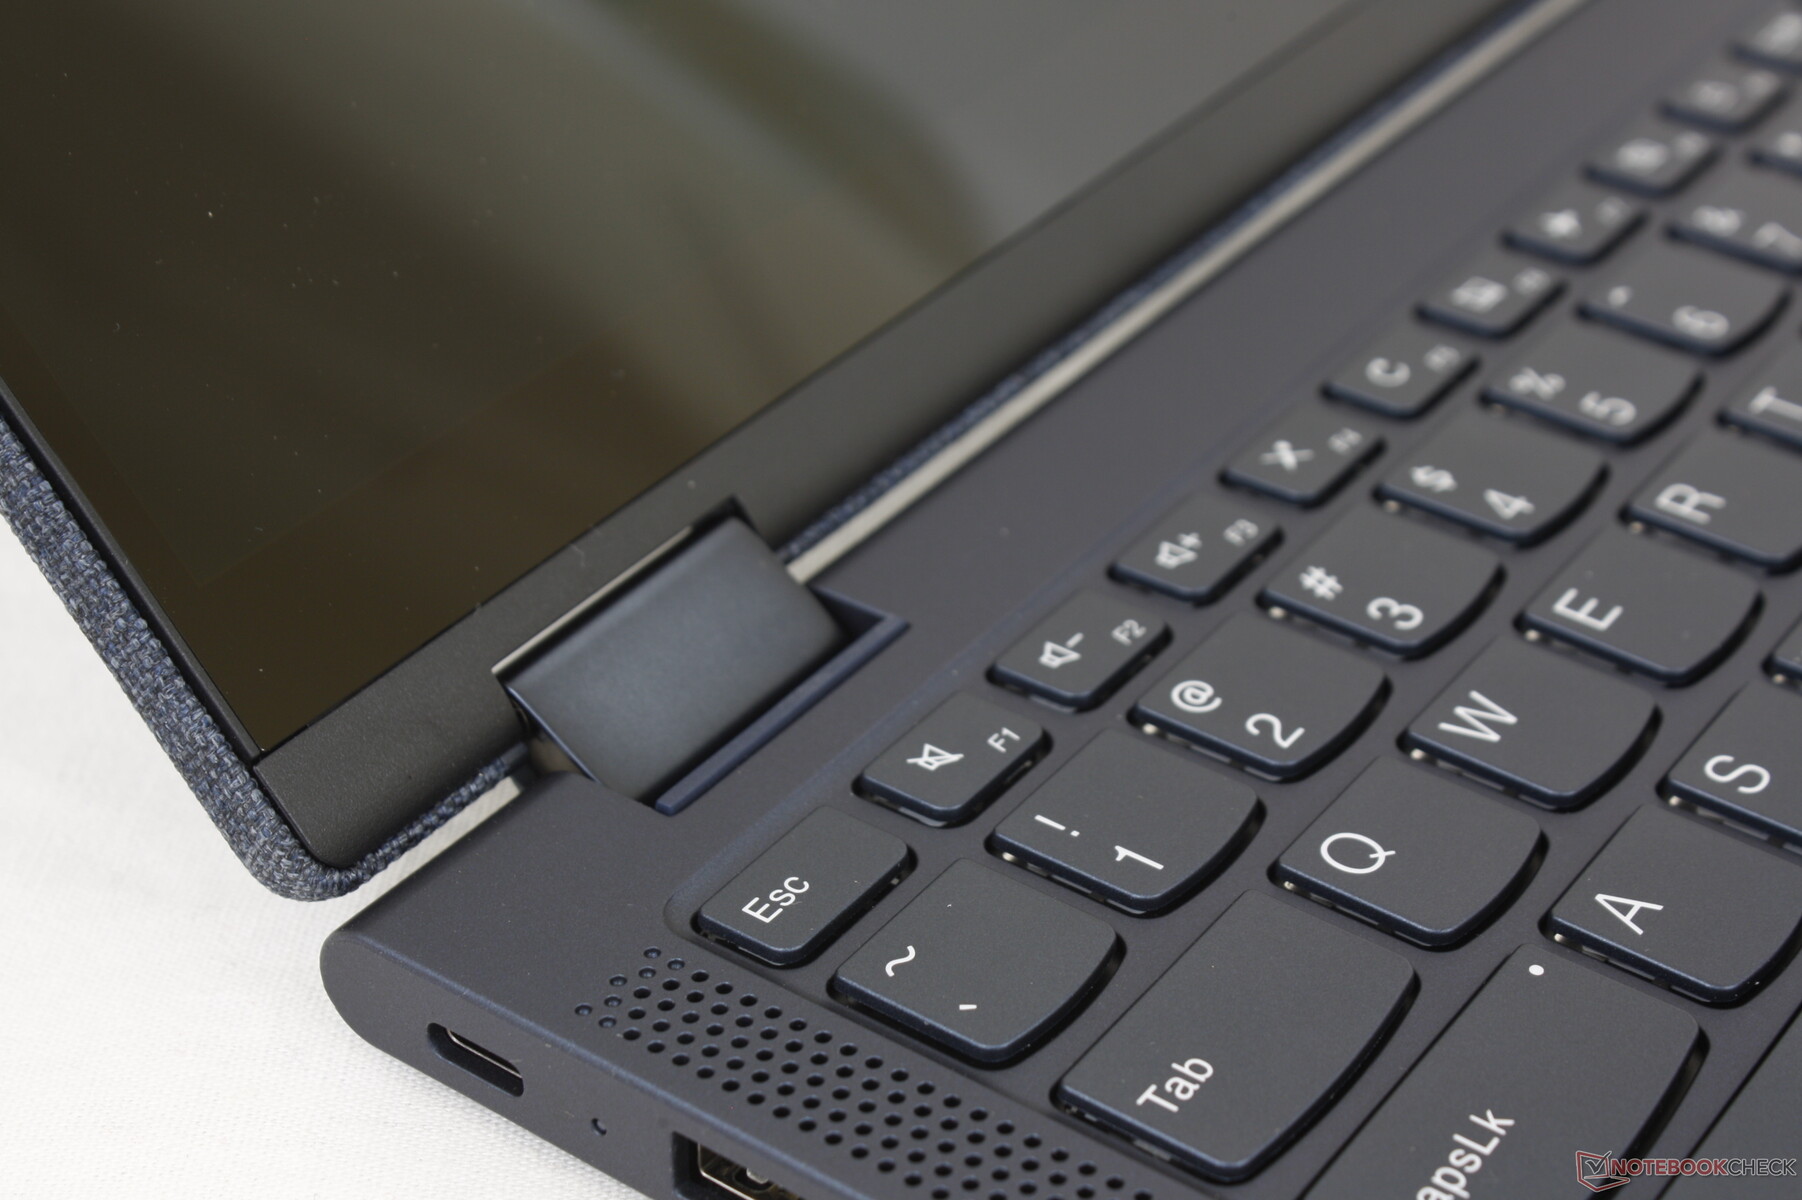
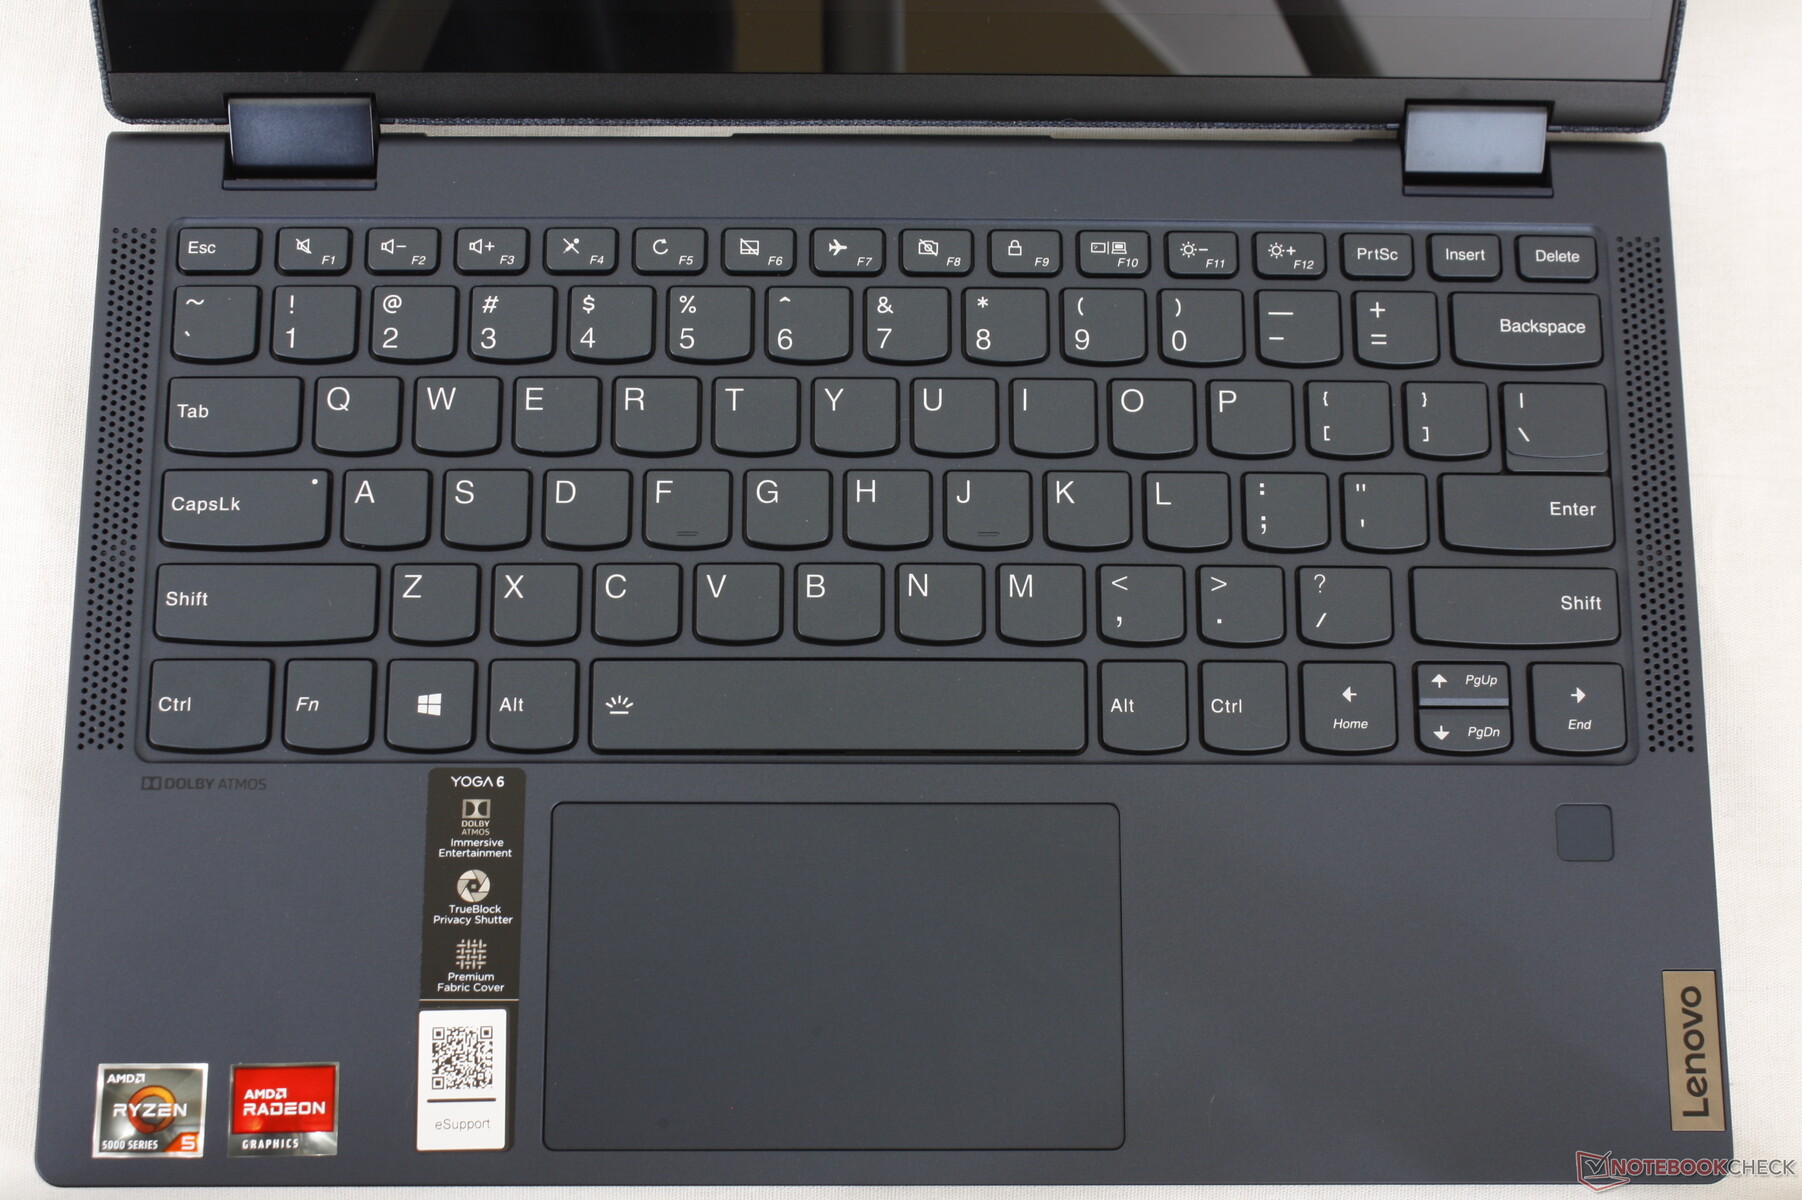
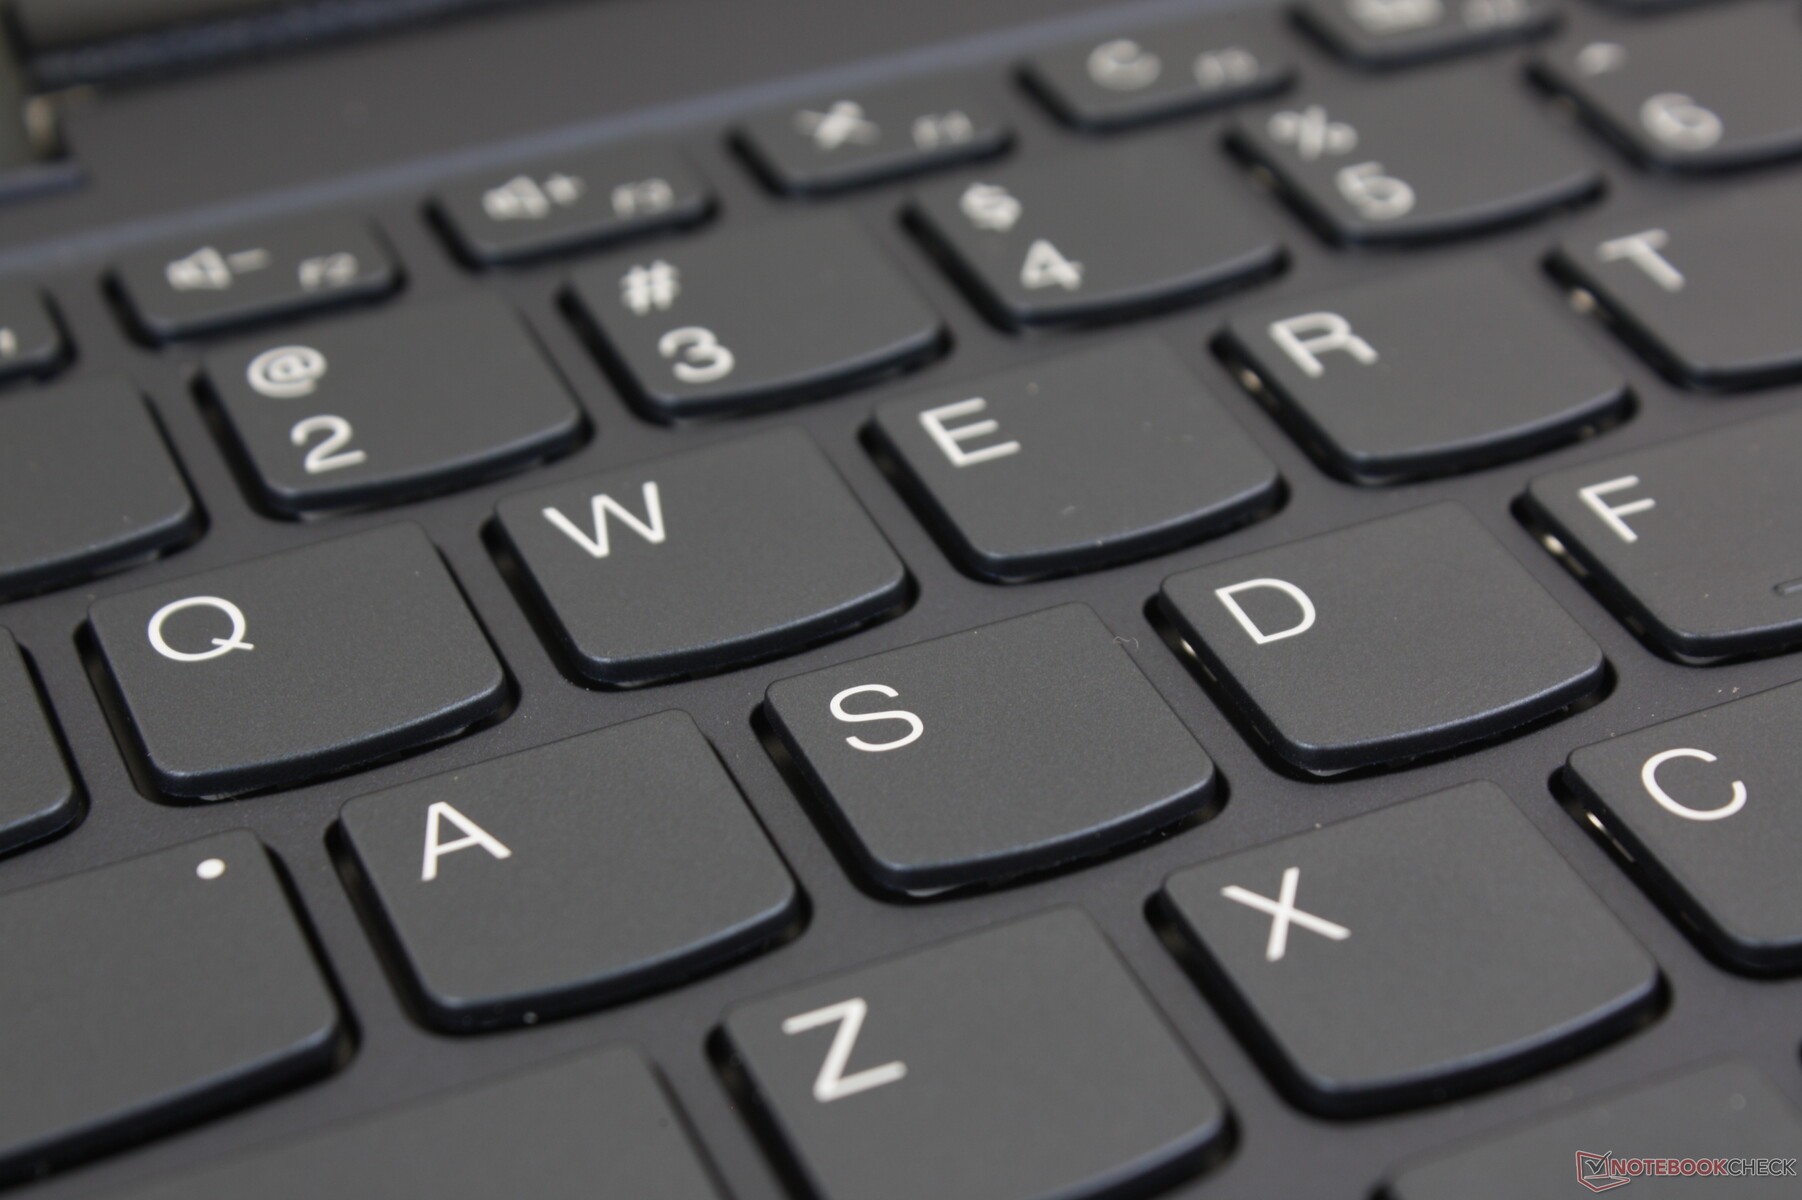
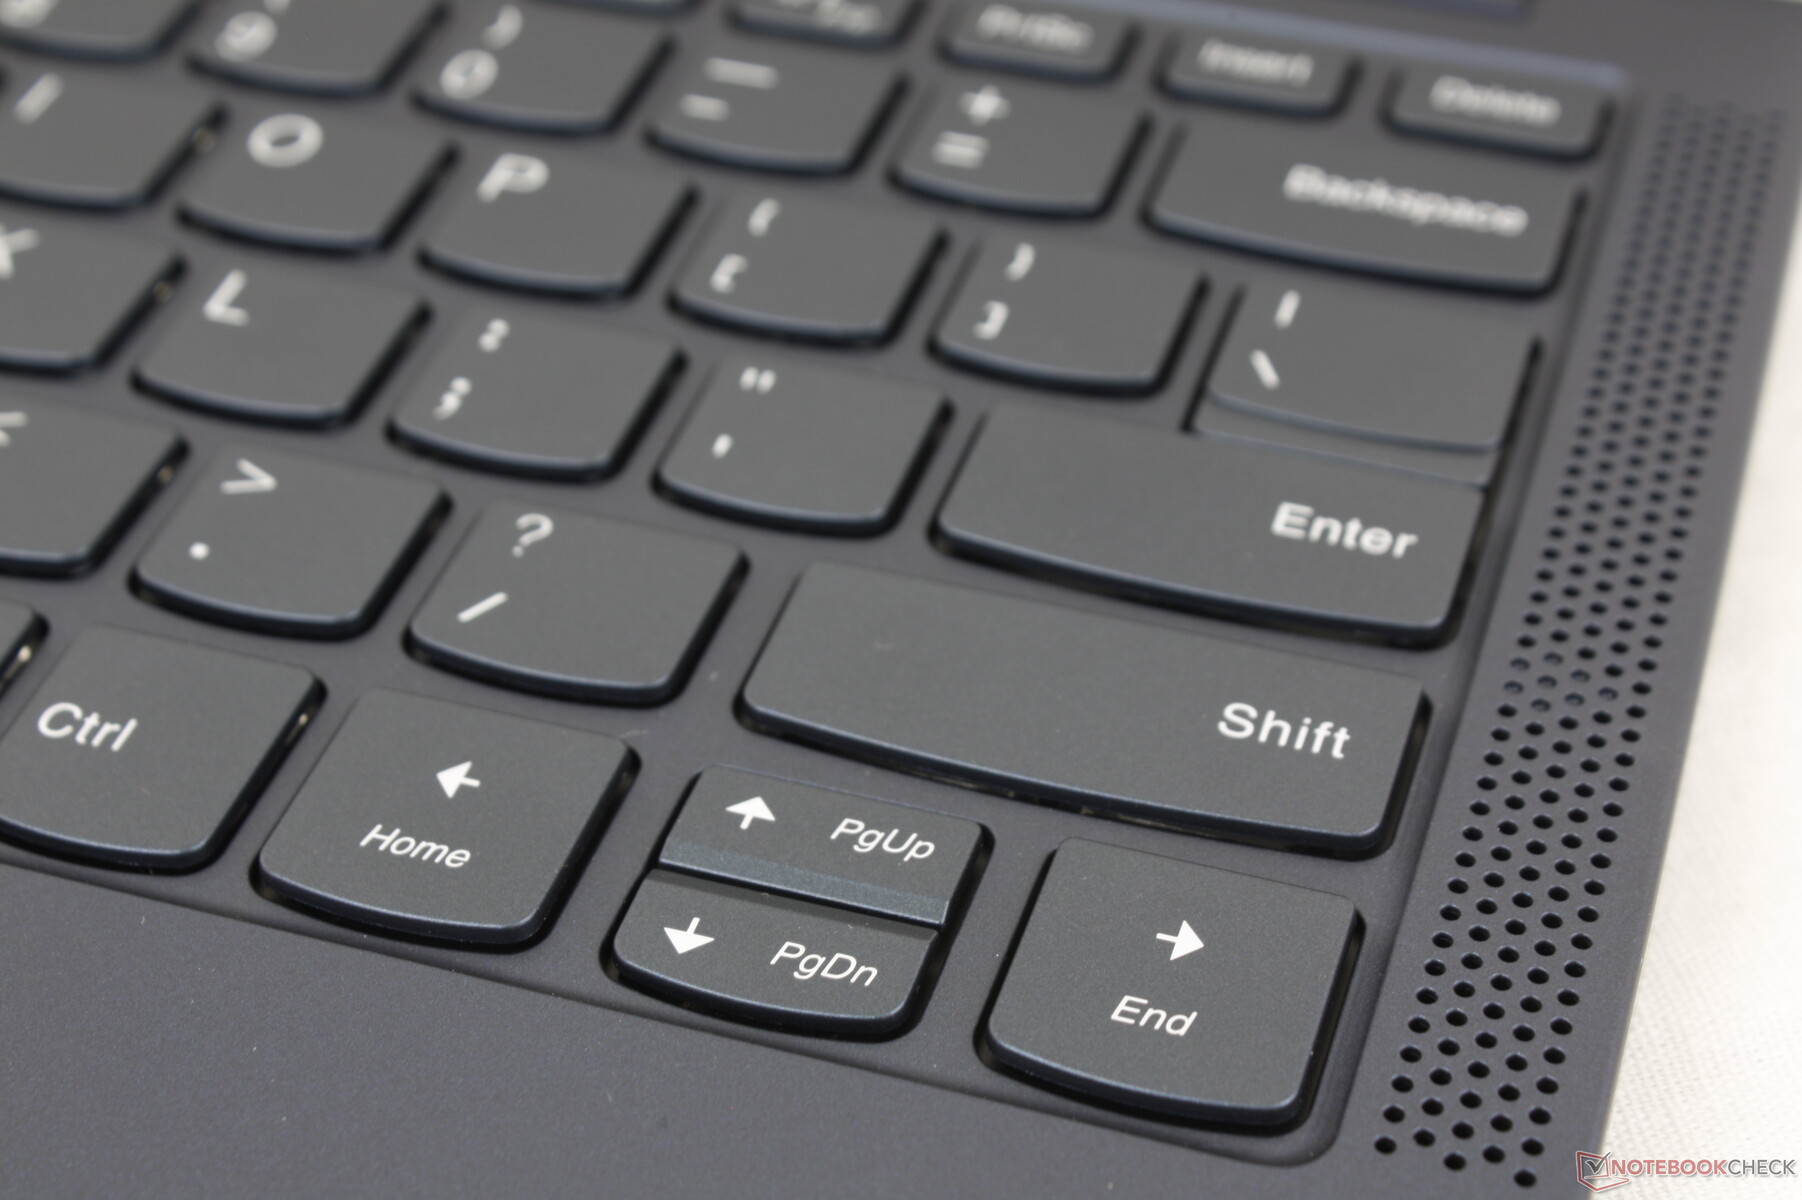
Input Devices —More IdeaPad Than ThinkPad
Keyboard
If you've typed on an IdeaPad or Yoga laptop in the past, then you'll have a good idea of how typing on the Yoga 6 13 will feel. Both key feedback and travel are on the lighter and shallower side, respectively, especially when compared to the firmer and deeper keys on ThinkPad models or the competing HP Envy x360 13. It's too bad that the keys here aren't closer to what Lenovo is offering on its superior ThinkPad series.
Key layout has changed slightly from other Yoga laptops. In particular, the top row of secondary functions are now different from the keys on the Yoga 9i 14 or Yoga Slim 7 due in part to the inclusion of a camera kill switch.
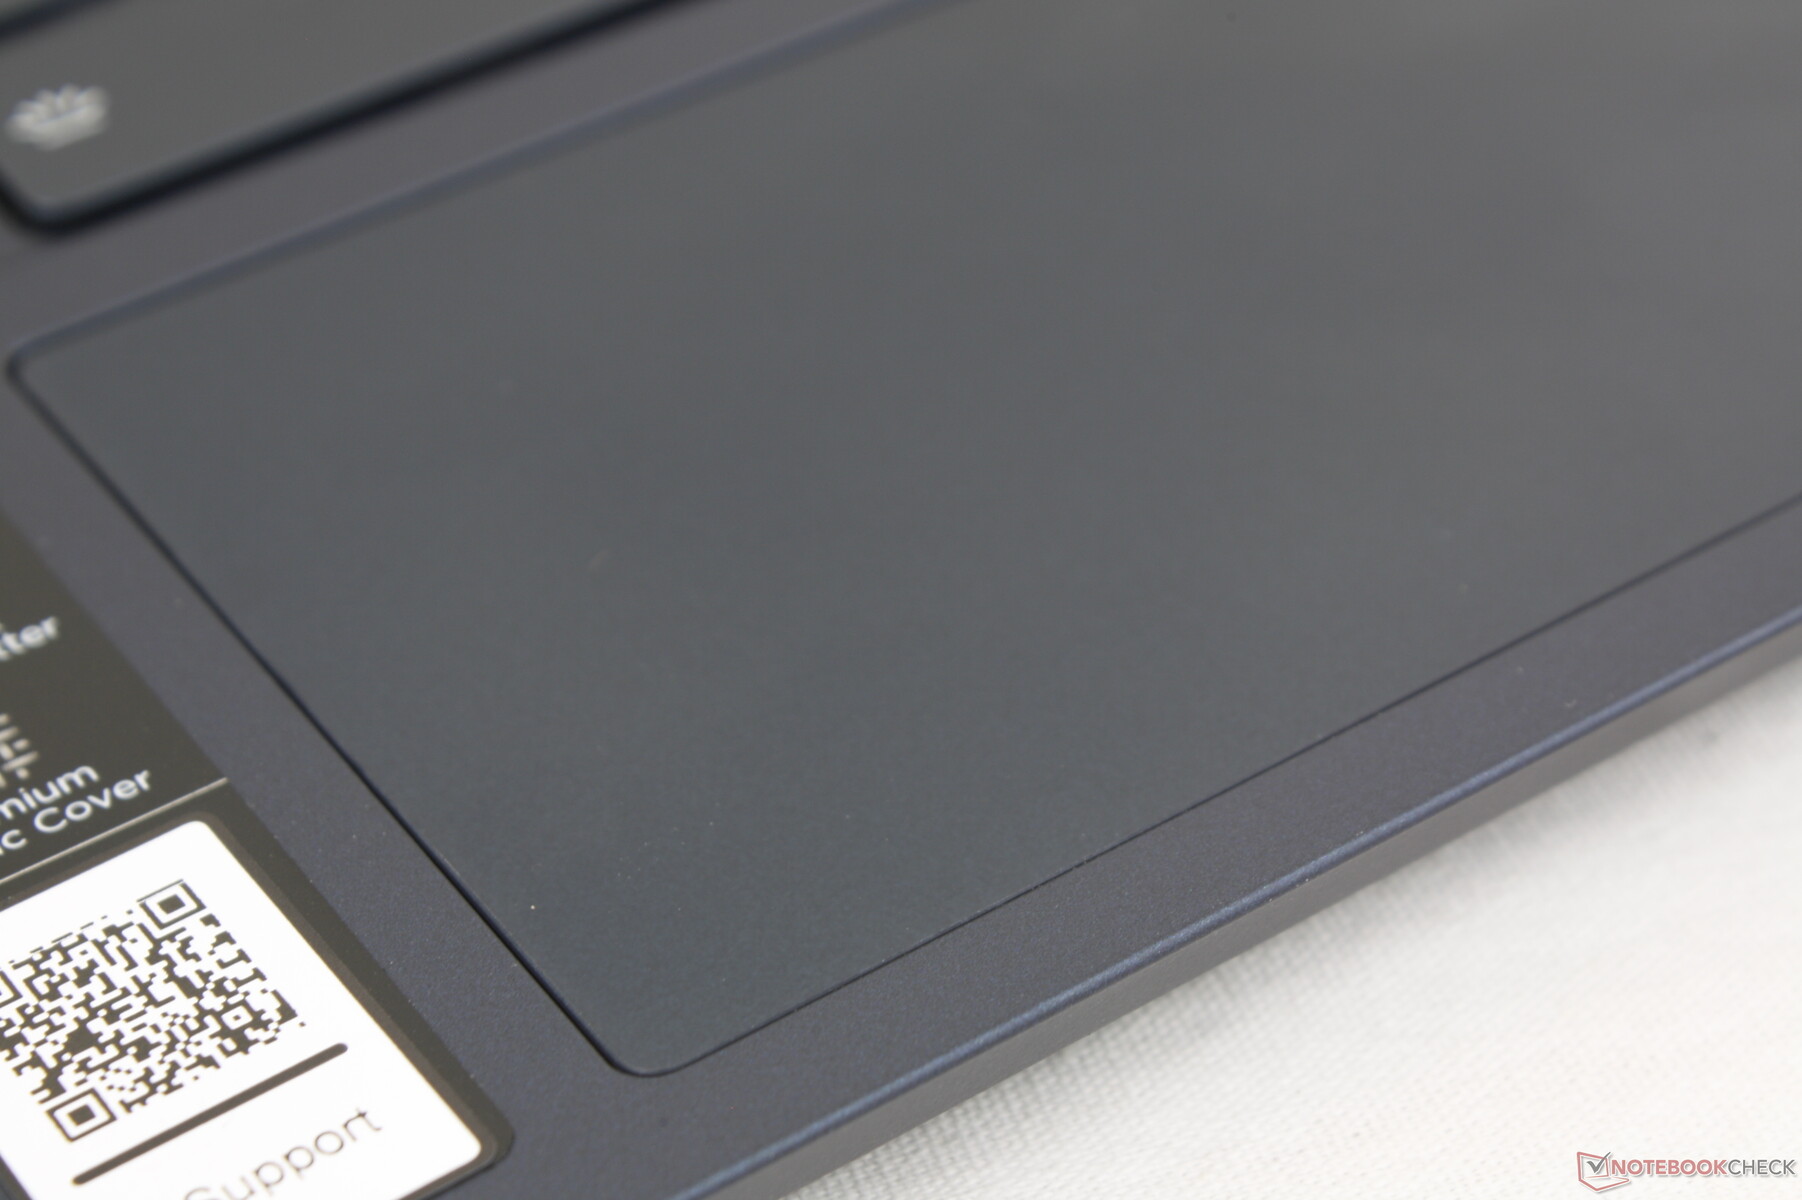
Touchpad
The clickpad is on the small side at 10 x 6.4 cm compared to 11.3 x 6.8 cm on the XPS 13 7390 2-in-1. Traction is completely smooth with only a bit of sticking when gliding at slower speeds for more accurate control. Unfortunately, clicking on the clickpad is unsatisfying due to its shallow travel and weak feedback. Users are going to want an external mouse for longer sessions.
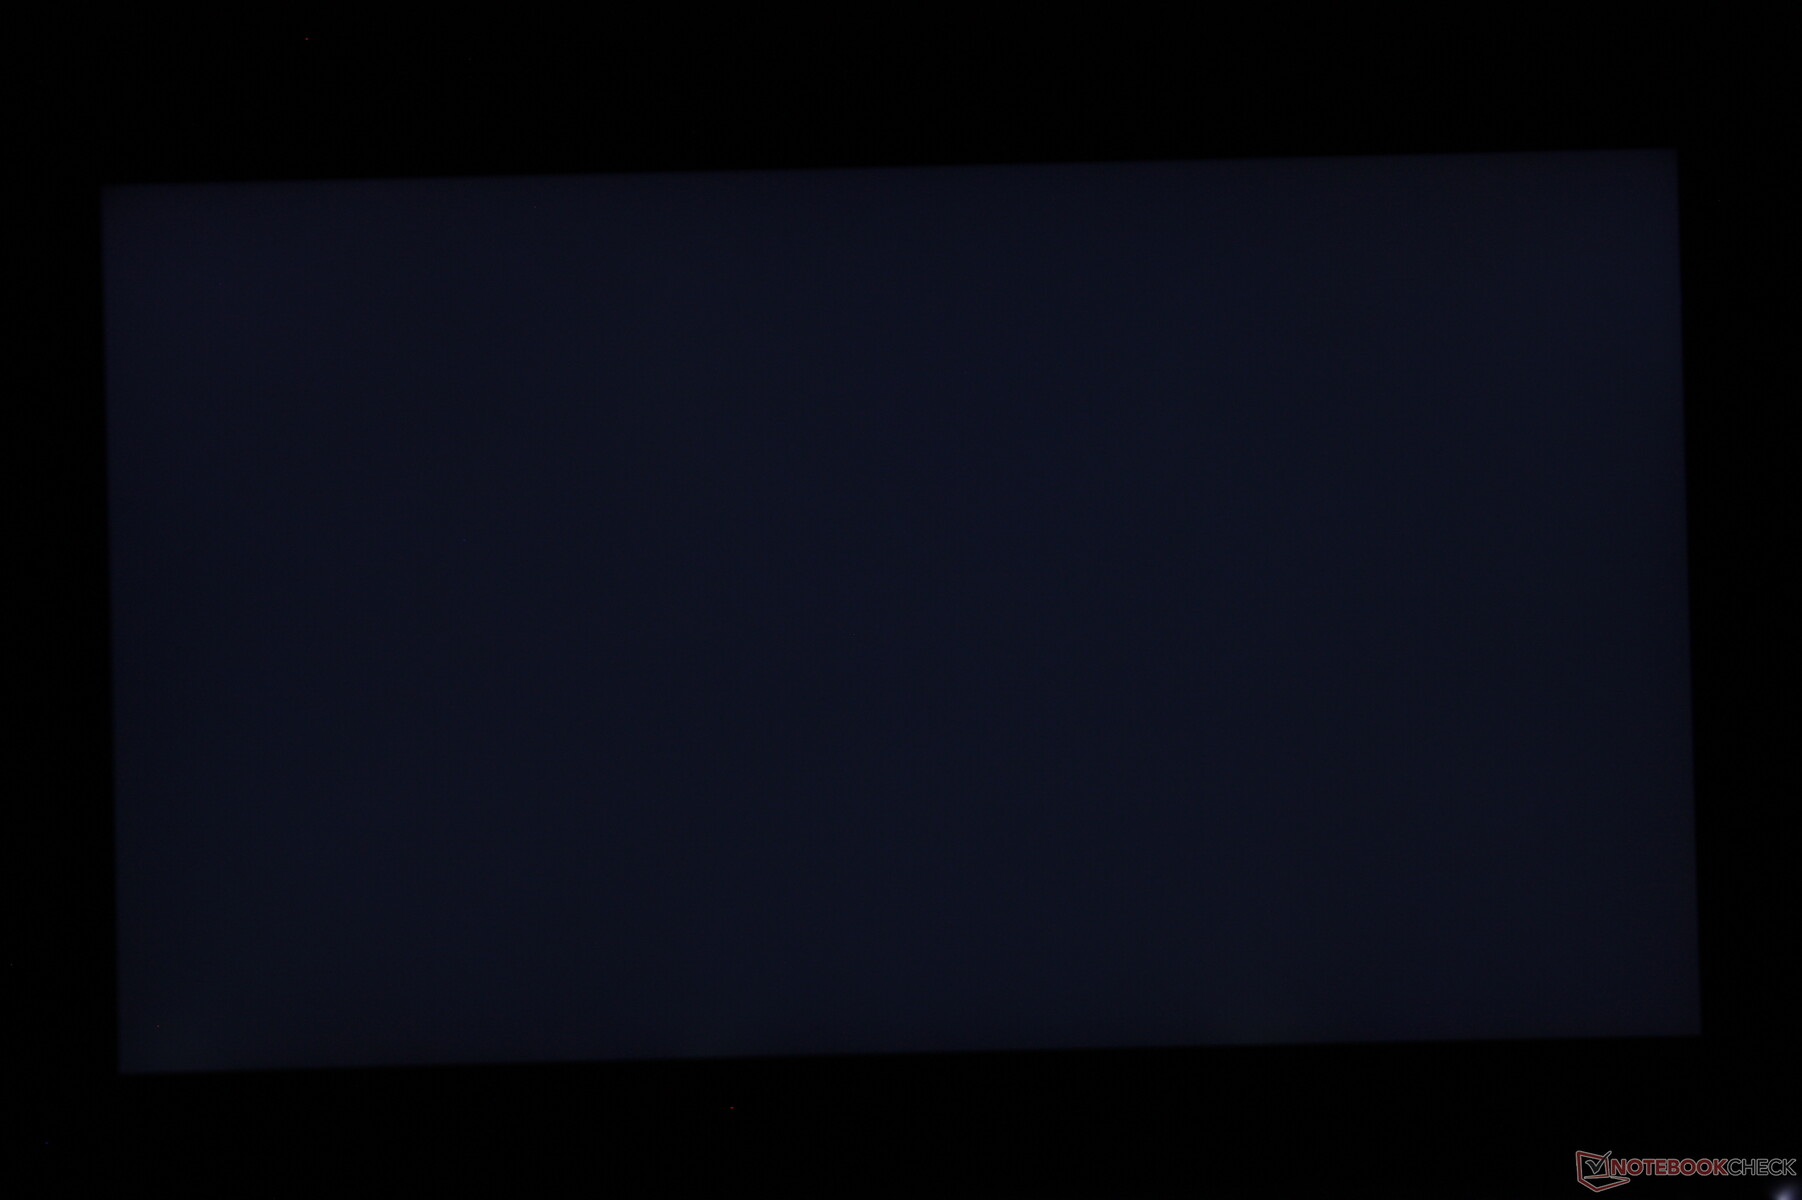
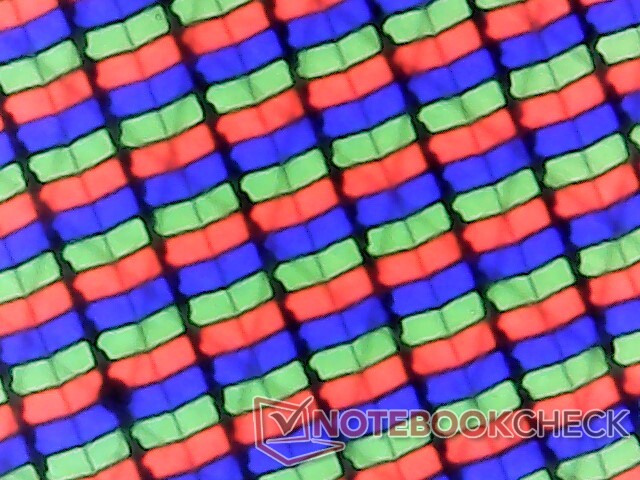
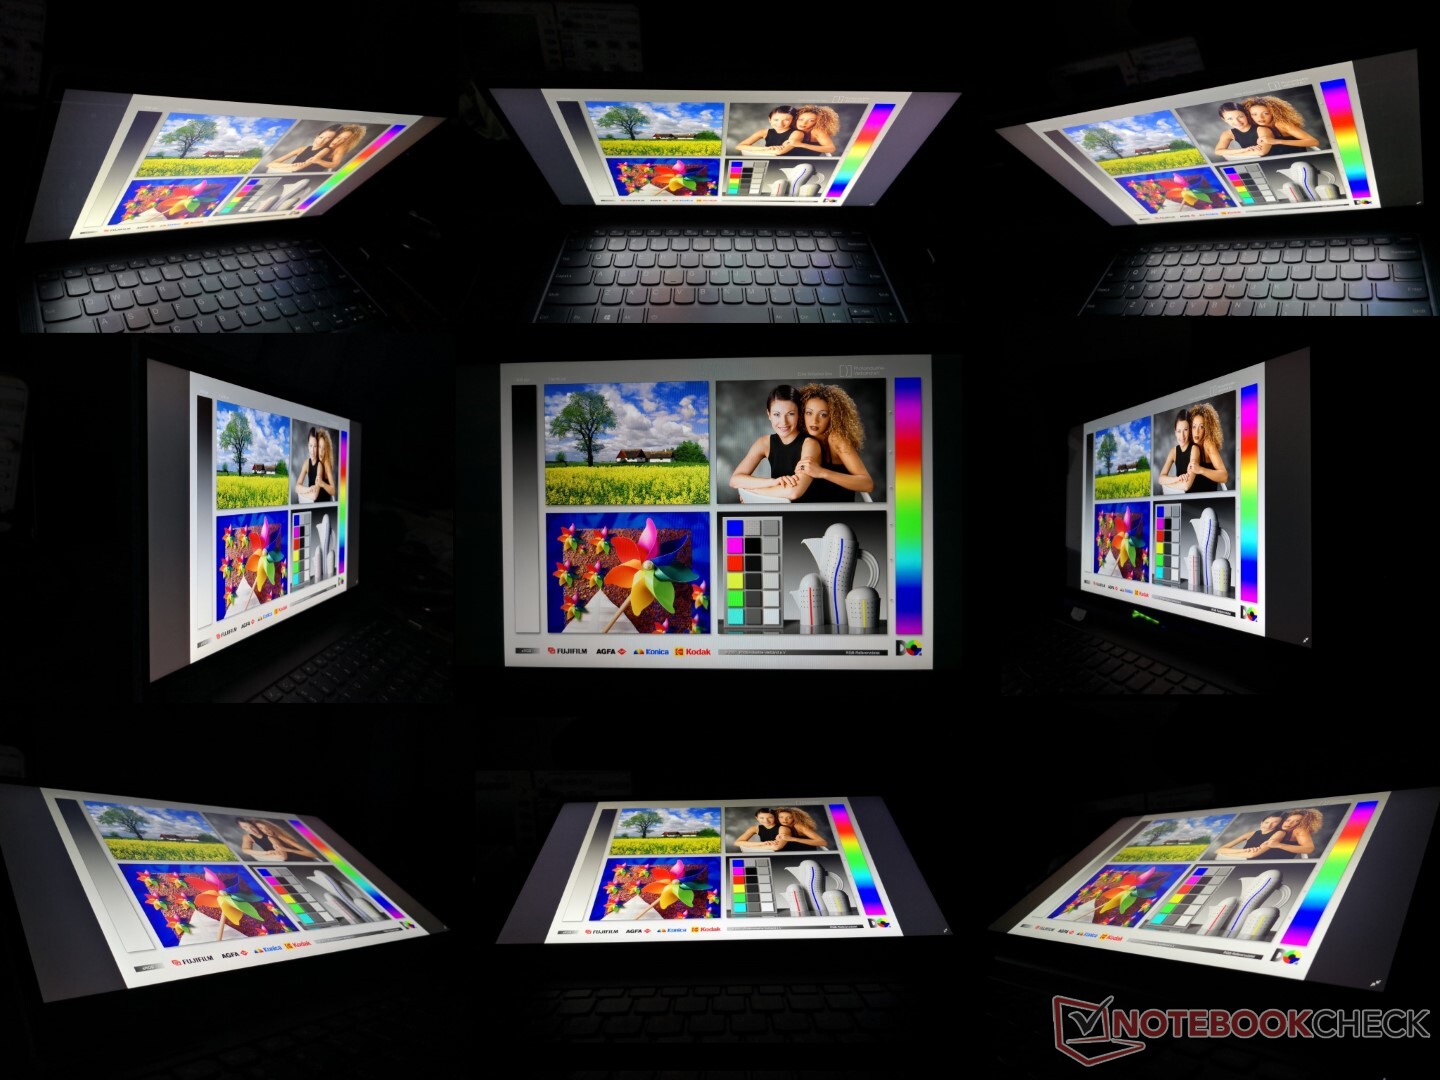
Display — Full sRGB Coverage
The AU Optronics B133HAN05 panel series is common on many 13.3-inch laptops including on the Asus ZenBook 13 UX333. However, this is the first time we've seen a "B133HAN05.F" variant. Contrast is excellent at over 1000:1 and our independent brightness measurements are indeed very close to Lenovo's claim of 300 nits. Colors are also vivid and comparable to many costlier Ultrabooks with 1080p panels. On the other hand, response times are only average for noticeable ghosting especially if gaming.

| |||||||||||||||||||||||||
Brightness Distribution: 93 %
Center on Battery: 291.5 cd/m²
Contrast: 1534:1 (Black: 0.19 cd/m²)
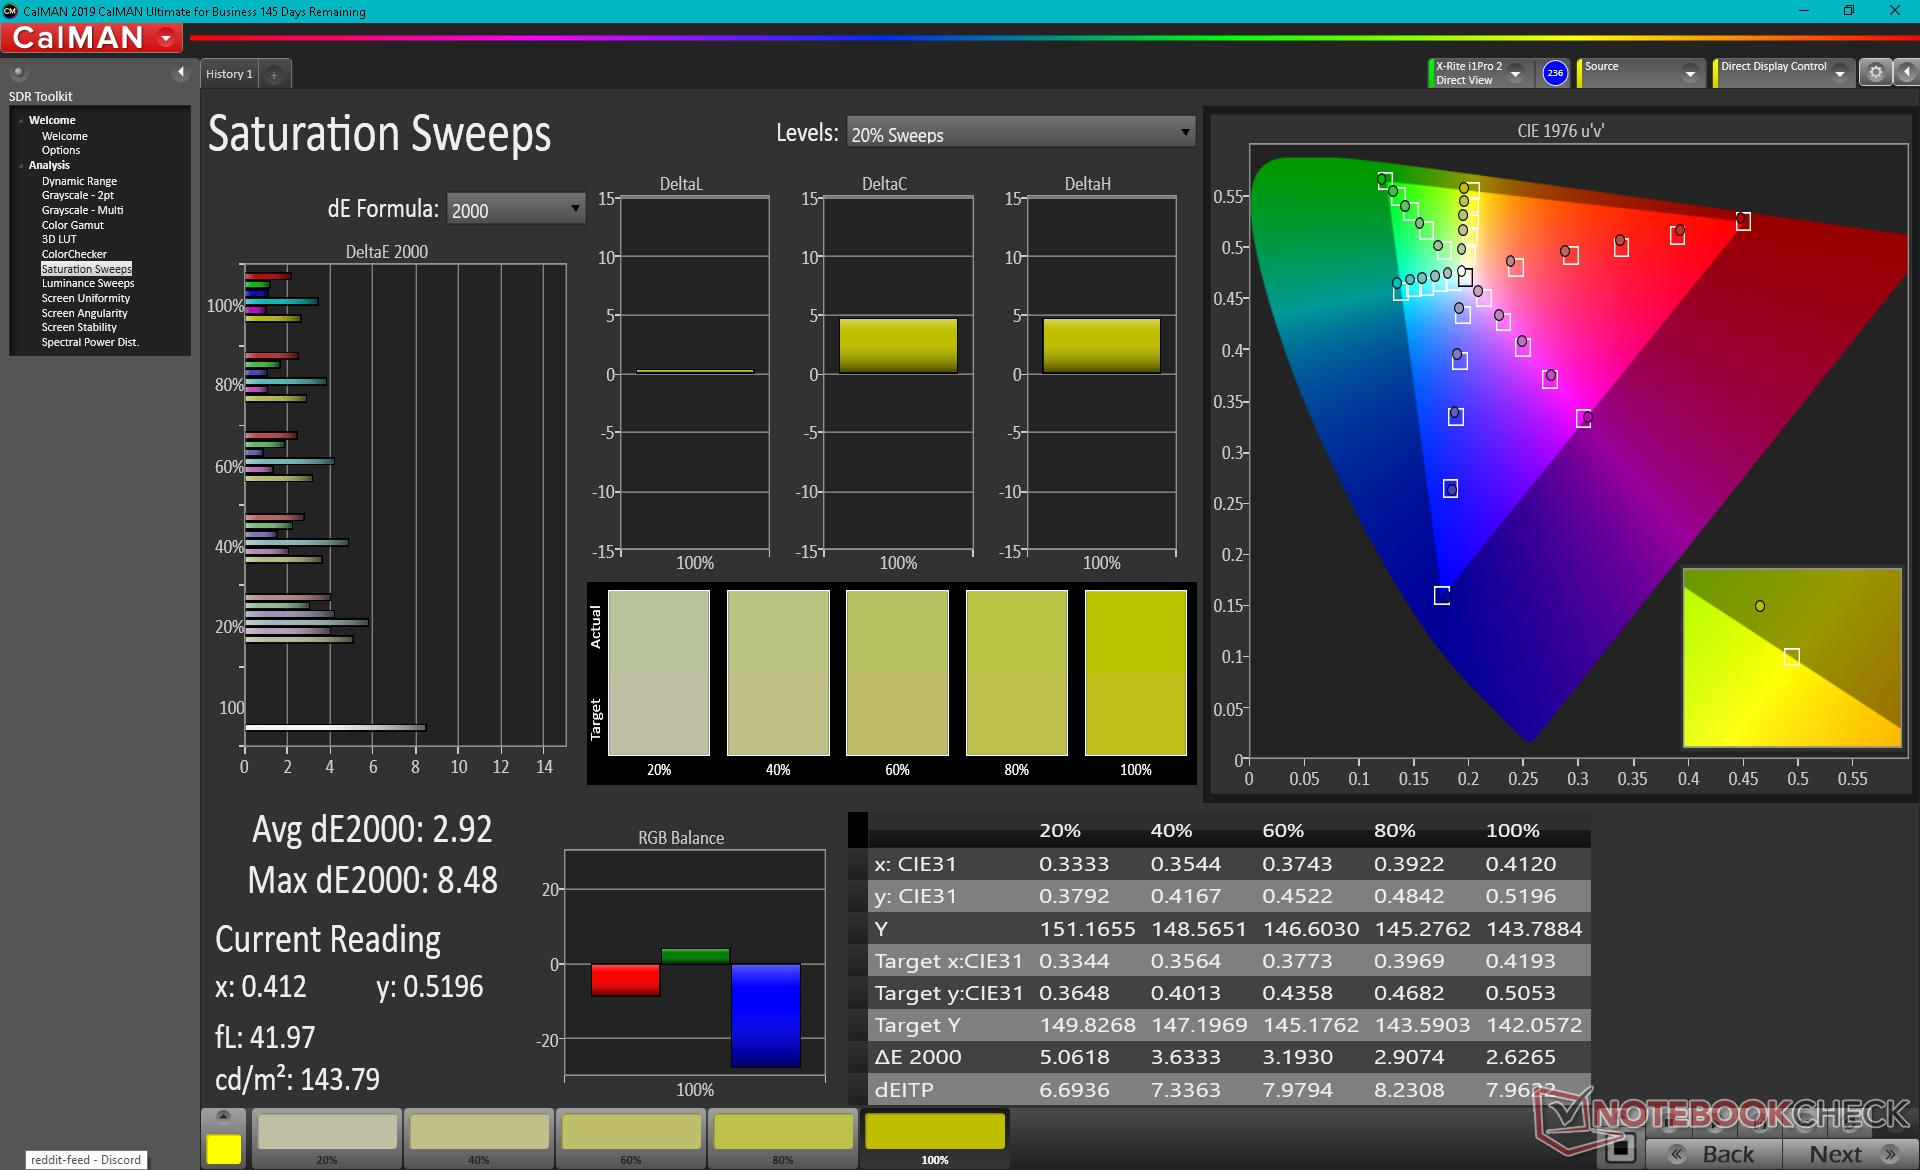
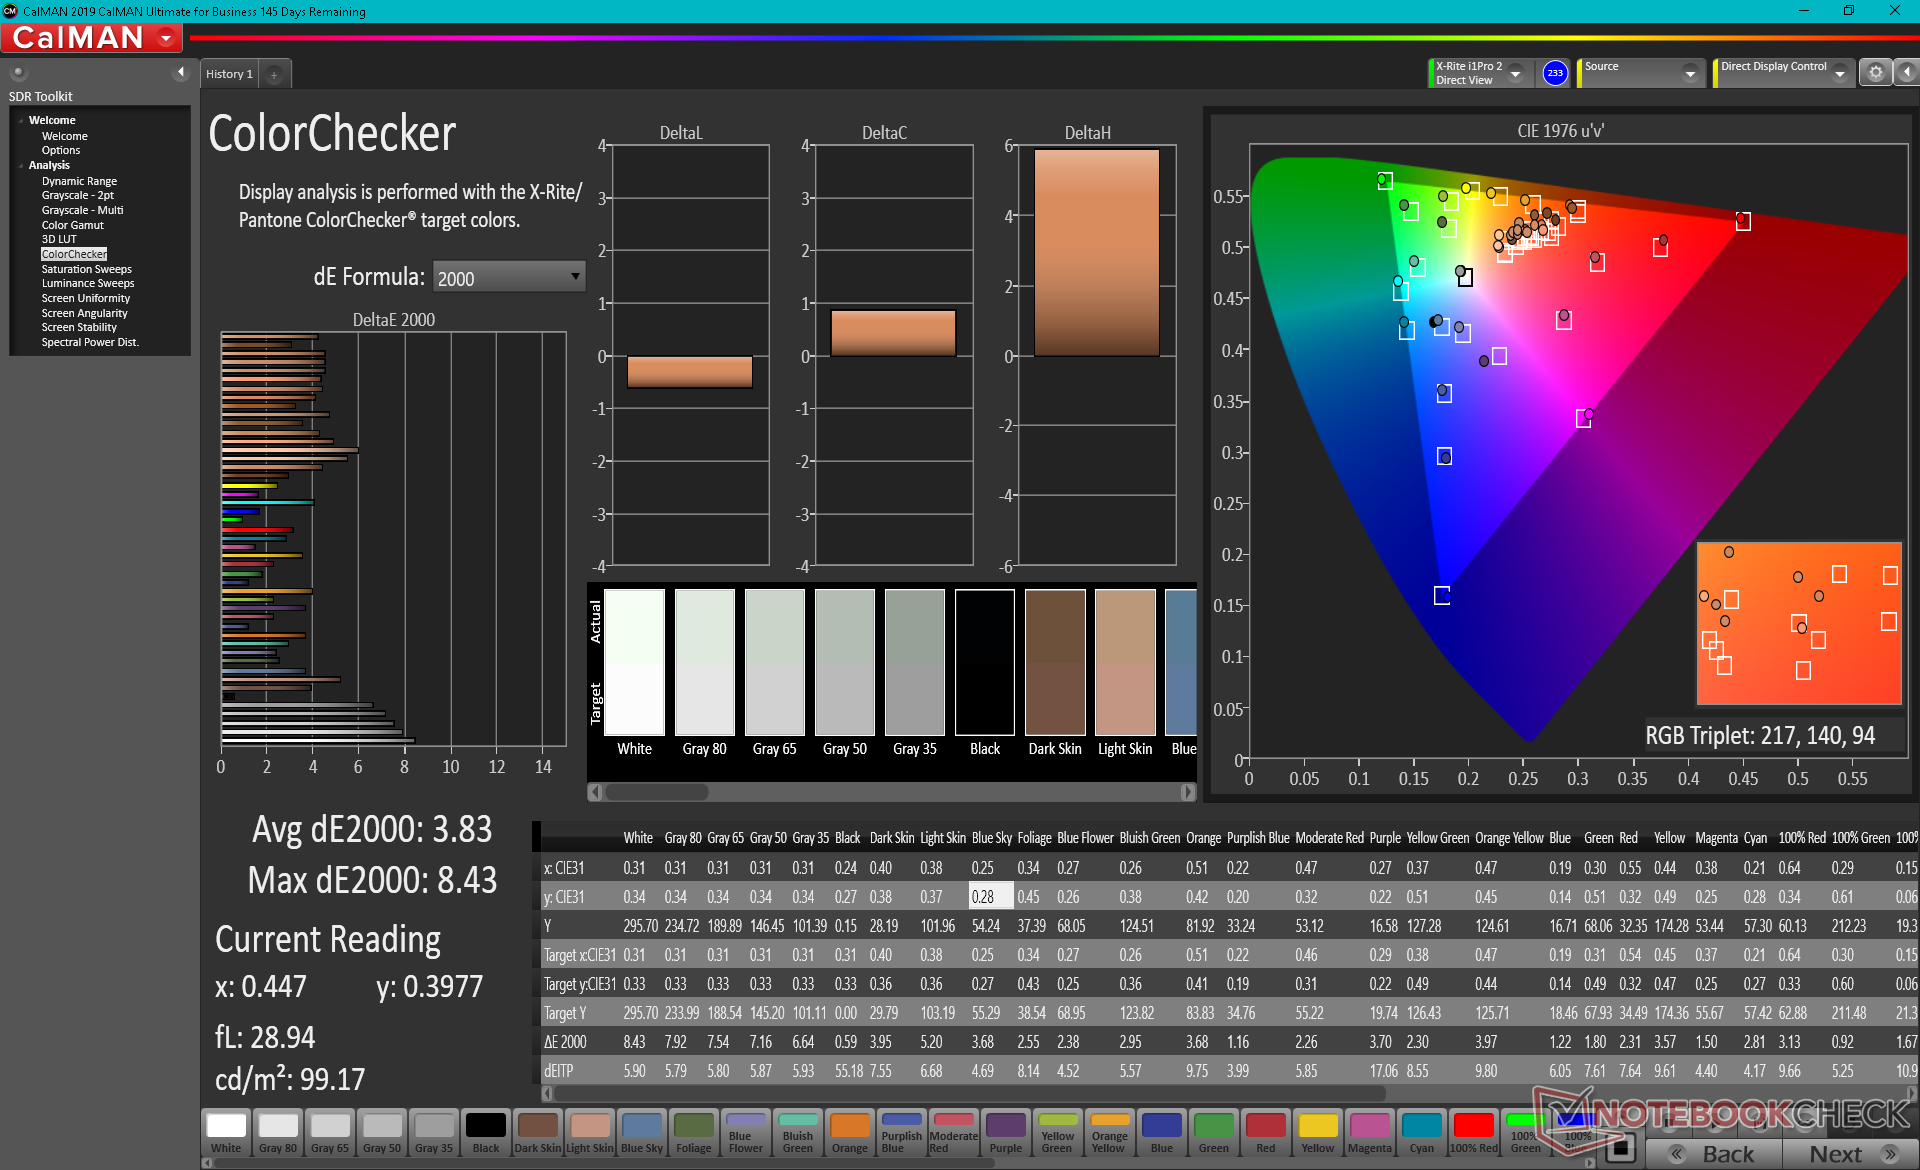
ΔE ColorChecker Calman: 3.83 | ∀{0.5-29.43 Ø4.71}
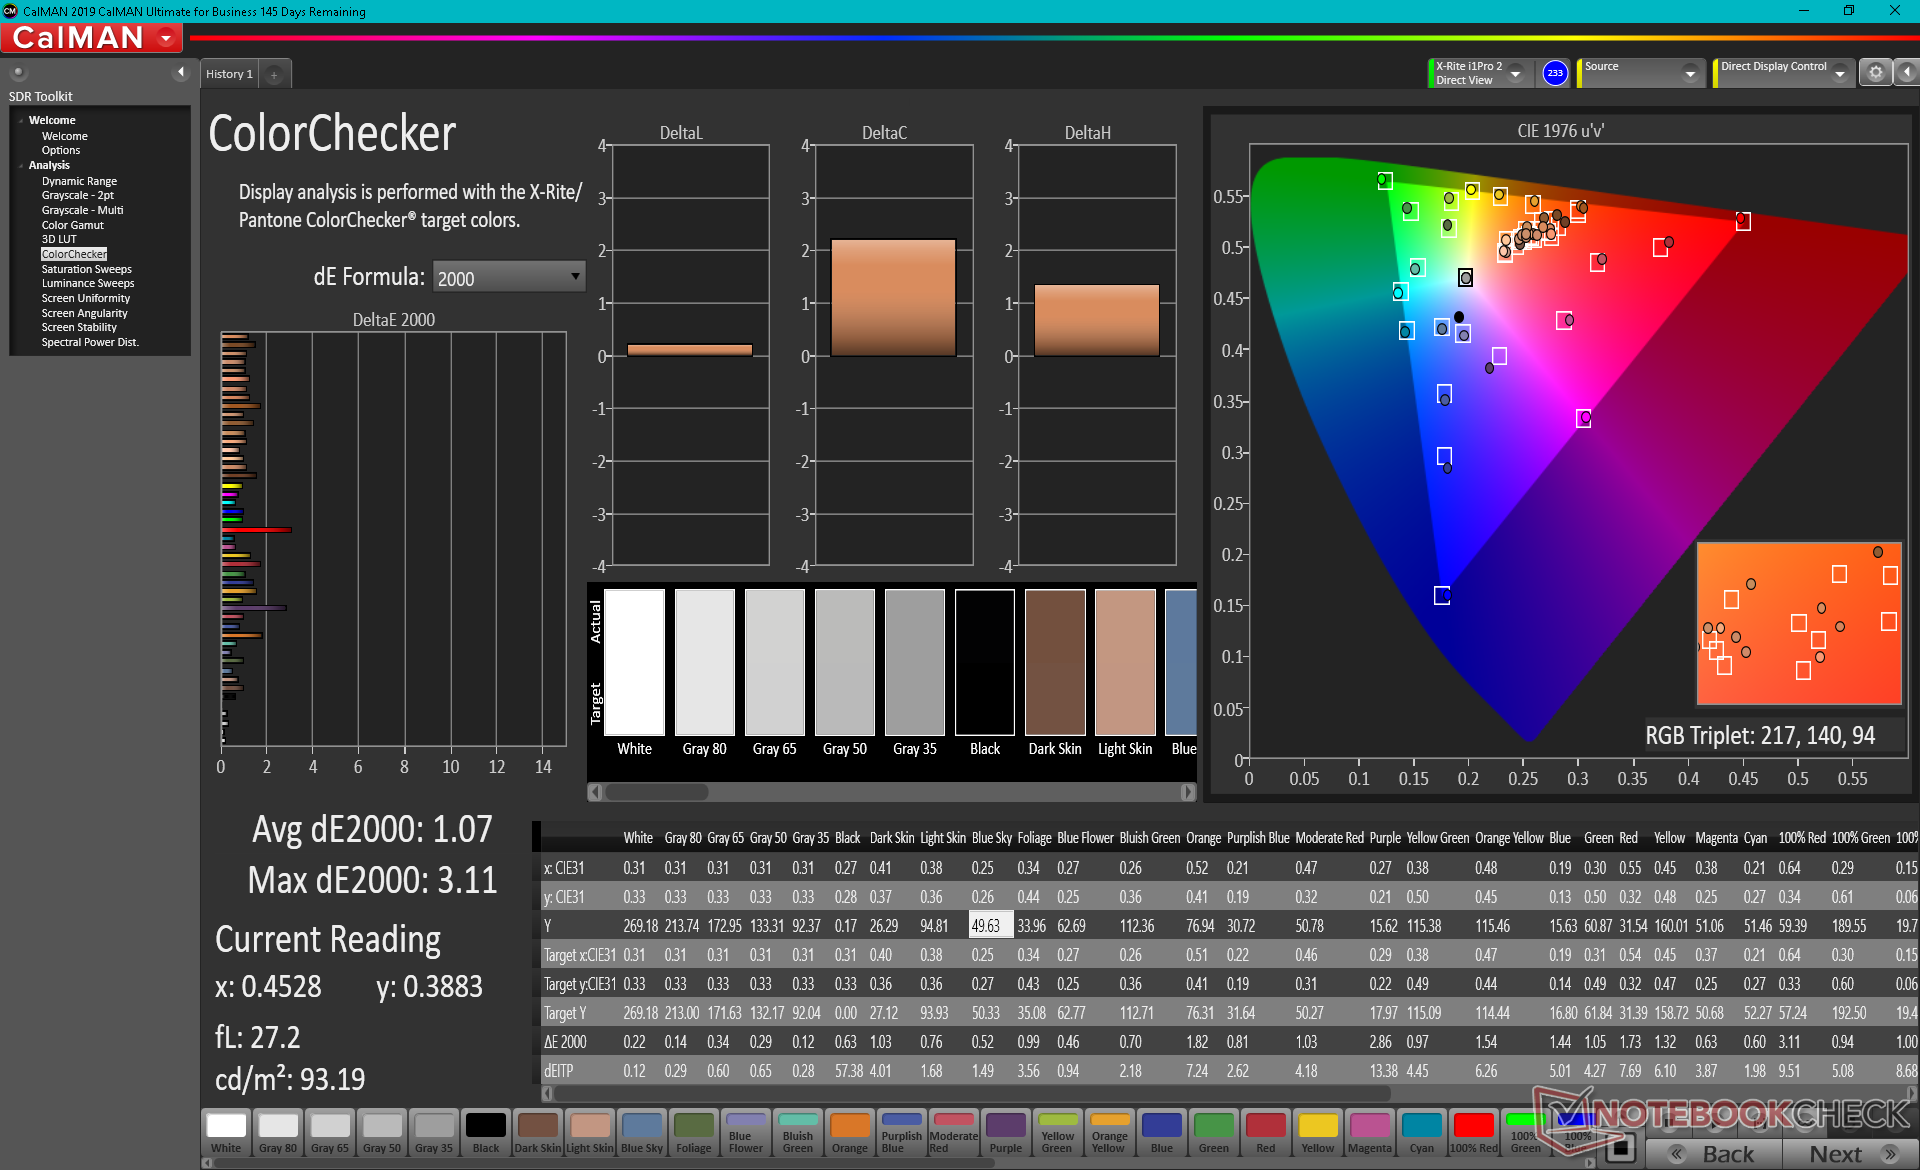
calibrated: 1.07
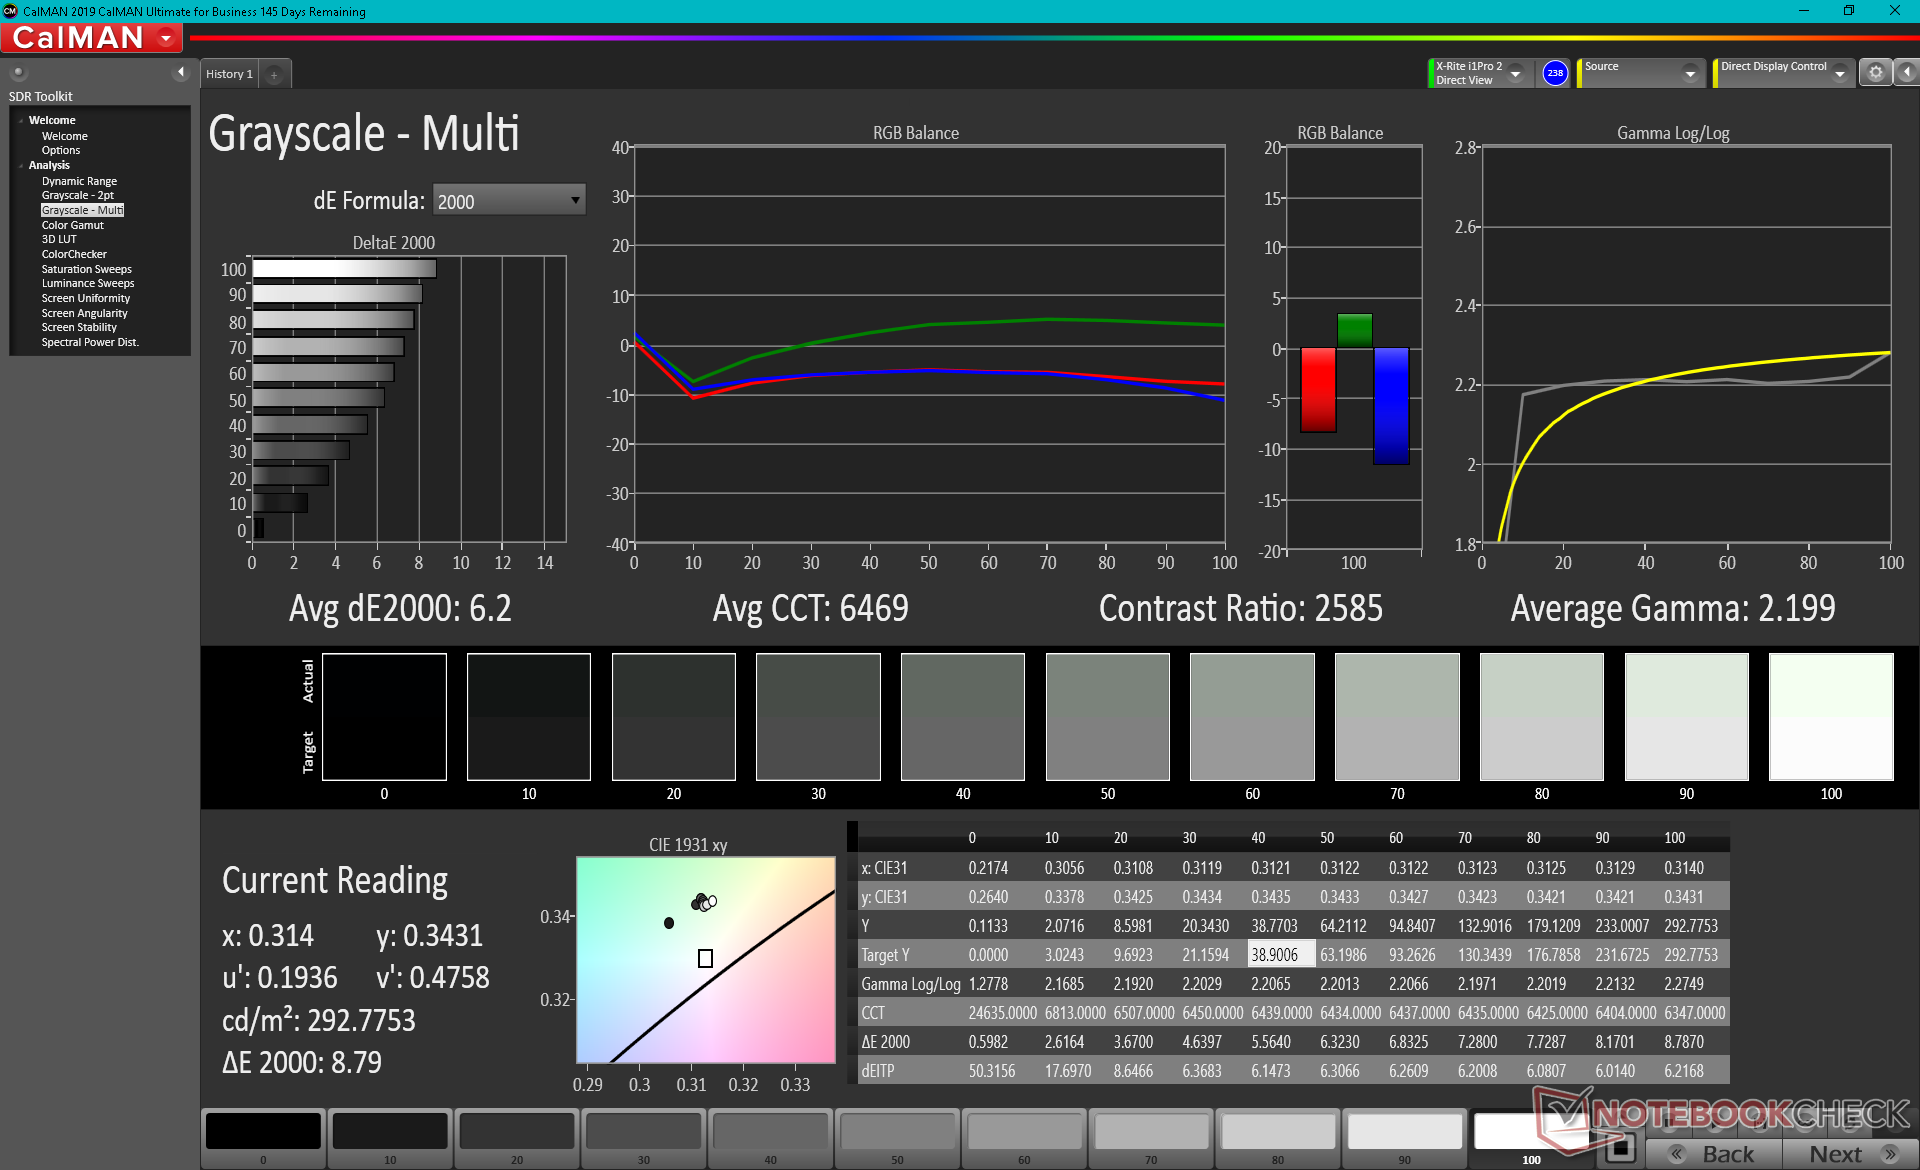
ΔE Greyscale Calman: 6.2 | ∀{0.09-98 Ø4.96}
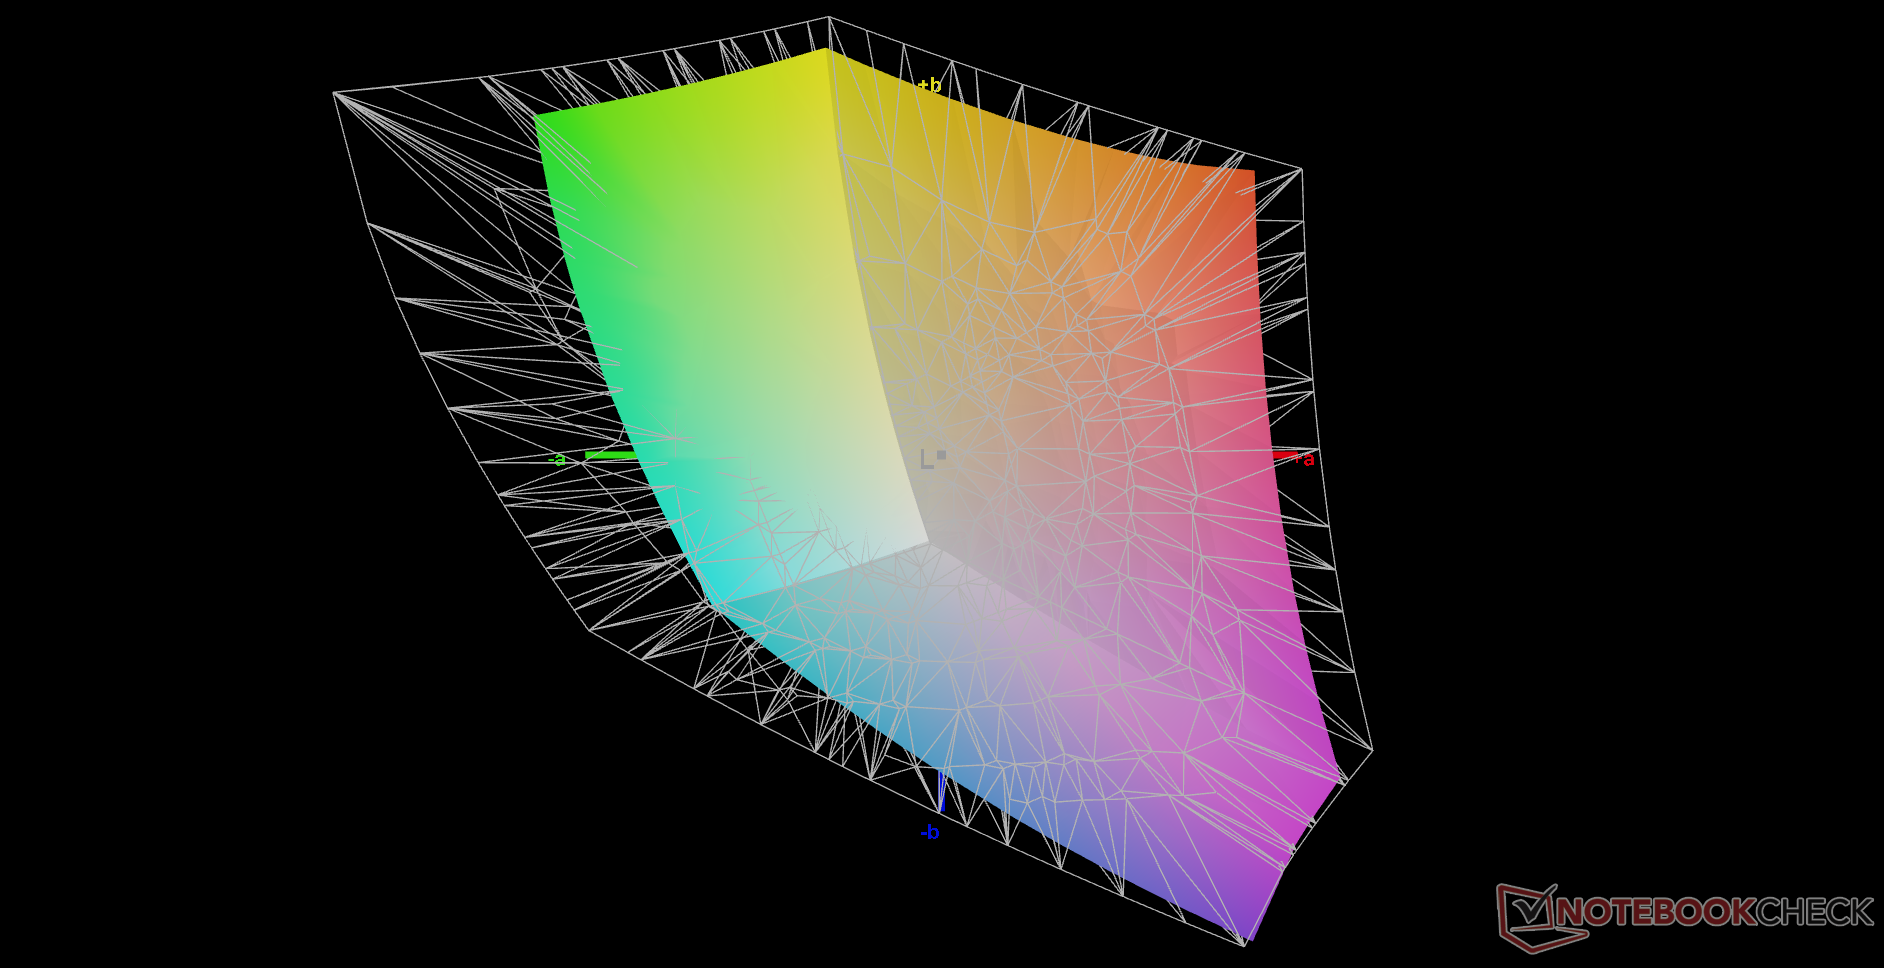
71.4% AdobeRGB 1998 (Argyll 3D)
99.2% sRGB (Argyll 3D)
69.7% Display P3 (Argyll 3D)
Gamma: 2.2
CCT: 6469 K
| Lenovo Yoga 6 13 82ND0009US AU Optronics B133HAN05.F, IPS, 13.3", 1920x1080 | Asus ZenBook Flip 13 UX363EA-HP069T Samsung, SDC414A, OLED, 13.3", 1920x1080 | Samsung Galaxy Book Pro 360 13 AMOLED, 13.2", 1920x1080 | HP Spectre x360 13-aw2003dx Samsung SDC4149, OLED, 13.3", 3840x2160 | MSI Summit E13 Flip Evo A11MT Sharp LQ134N1JW53, IPS, 13.4", 1920x1200 | Lenovo IdeaPad Flex 5 CB 13IML05 82B80010GE IPS, 13.3", 1920x1080 | |
|---|---|---|---|---|---|---|
| Display | 26% | 1% | -0% | |||
| Display P3 Coverage (%) | 69.7 | 99.4 43% | 70 0% | 69.8 0% | ||
| sRGB Coverage (%) | 99.2 | 100 1% | 88.5 -11% | 98.8 0% | ||
| AdobeRGB 1998 Coverage (%) | 71.4 | 96 34% | 81.2 14% | 70.6 -1% | ||
| Response Times | 95% | 95% | 92% | -45% | -2% | |
| Response Time Grey 50% / Grey 80% * (ms) | 46.8 ? | 2 ? 96% | 2 ? 96% | 2.8 ? 94% | 64 ? -37% | 47 ? -0% |
| Response Time Black / White * (ms) | 28.8 ? | 2 ? 93% | 2 ? 93% | 2.8 ? 90% | 44 ? -53% | 30 ? -4% |
| PWM Frequency (Hz) | 60 | 60 ? | 242.7 ? | |||
| Screen | -29% | 252% | -68% | 24% | 10% | |
| Brightness middle (cd/m²) | 291.5 | 353 21% | 287 -2% | 355 22% | 551.3 89% | 242 -17% |
| Brightness (cd/m²) | 294 | 359 22% | 289 -2% | 368 25% | 517 76% | 232 -21% |
| Brightness Distribution (%) | 93 | 95 2% | 96 3% | 93 0% | 91 -2% | 85 -9% |
| Black Level * (cd/m²) | 0.19 | 0.1 47% | 0.01 95% | 0.37 -95% | 0.235 -24% | |
| Contrast (:1) | 1534 | 3530 130% | 28700 1771% | 1490 -3% | 1030 -33% | |
| Colorchecker dE 2000 * | 3.83 | 3.98 -4% | 2.24 42% | 5.74 -50% | 1.45 62% | 1.99 48% |
| Colorchecker dE 2000 max. * | 8.43 | 53.07 -530% | 3.69 56% | 9.52 -13% | 2.86 66% | 2.77 67% |
| Colorchecker dE 2000 calibrated * | 1.07 | 6.69 -525% | 1.7 -59% | |||
| Greyscale dE 2000 * | 6.2 | 1.41 77% | 2.73 56% | 2.2 65% | 1.3 79% | 1.78 71% |
| Gamma | 2.2 100% | 2.39 92% | 2.46 89% | 2.03 108% | 2.14 103% | 2.31 95% |
| CCT | 6469 100% | 6346 102% | 6523 100% | 6505 100% | 6580 99% | 6567 99% |
| Color Space (Percent of AdobeRGB 1998) (%) | 73.6 | 65 | ||||
| Color Space (Percent of sRGB) (%) | 88.6 | 99 | ||||
| Total Average (Program / Settings) | 33% /
-5% | 124% /
176% | 8% /
-24% | -7% /
9% | 4% /
8% |
* ... smaller is better
Color space covers over 99 percent of sRGB much like most mid-range to higher-end Ultrabooks. Certain AMOLED panels on other models like the Samsung Galaxy Book Pro 360 13 are able to offer wider ranges for deeper colors.
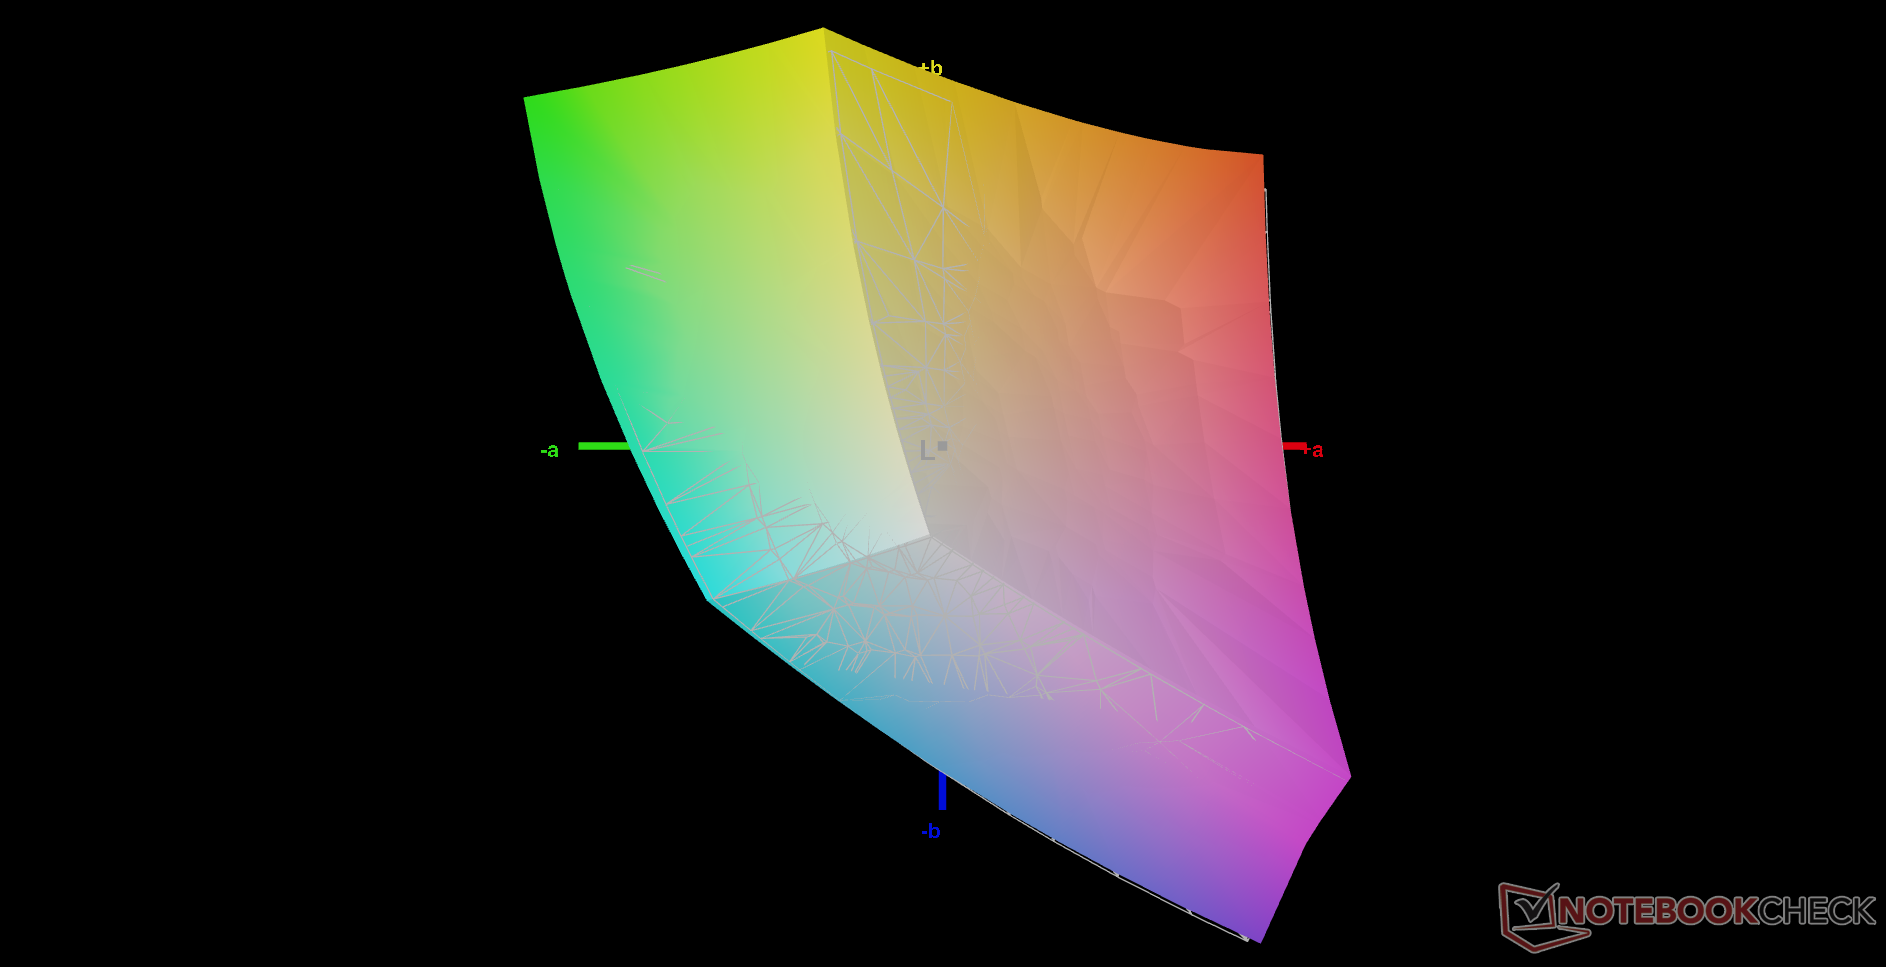
The display is poorly calibrated out of the box with relatively high grayscale and color deltaE values of 6.2 and 3.83, respectively. Calibrating the panel ourselves would improve both colors and grayscale substantially to deltaE values of well under 2 each.

Display Response Times
| ↔ Response Time Black to White | ||
|---|---|---|
| 28.8 ms ... rise ↗ and fall ↘ combined | ↗ 15.6 ms rise | 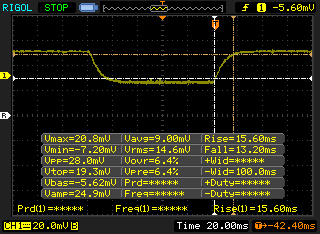 |
| ↘ 13.2 ms fall | ||
| The screen shows relatively slow response rates in our tests and may be too slow for gamers. In comparison, all tested devices range from 0.1 (minimum) to 240 (maximum) ms. » 76 % of all devices are better. This means that the measured response time is worse than the average of all tested devices (19.8 ms). | ||
| ↔ Response Time 50% Grey to 80% Grey | ||
| 46.8 ms ... rise ↗ and fall ↘ combined | ↗ 20.8 ms rise | 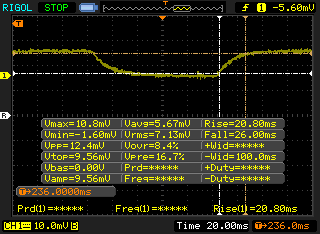 |
| ↘ 26 ms fall | ||
| The screen shows slow response rates in our tests and will be unsatisfactory for gamers. In comparison, all tested devices range from 0.165 (minimum) to 636 (maximum) ms. » 81 % of all devices are better. This means that the measured response time is worse than the average of all tested devices (31 ms). | ||
Screen Flickering / PWM (Pulse-Width Modulation)
| Screen flickering / PWM not detected | 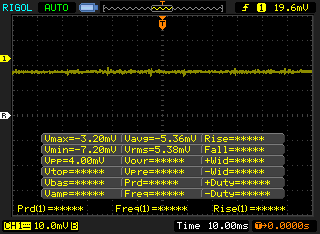 | ||
In comparison: 52 % of all tested devices do not use PWM to dim the display. If PWM was detected, an average of 7754 (minimum: 5 - maximum: 343500) Hz was measured. | |||
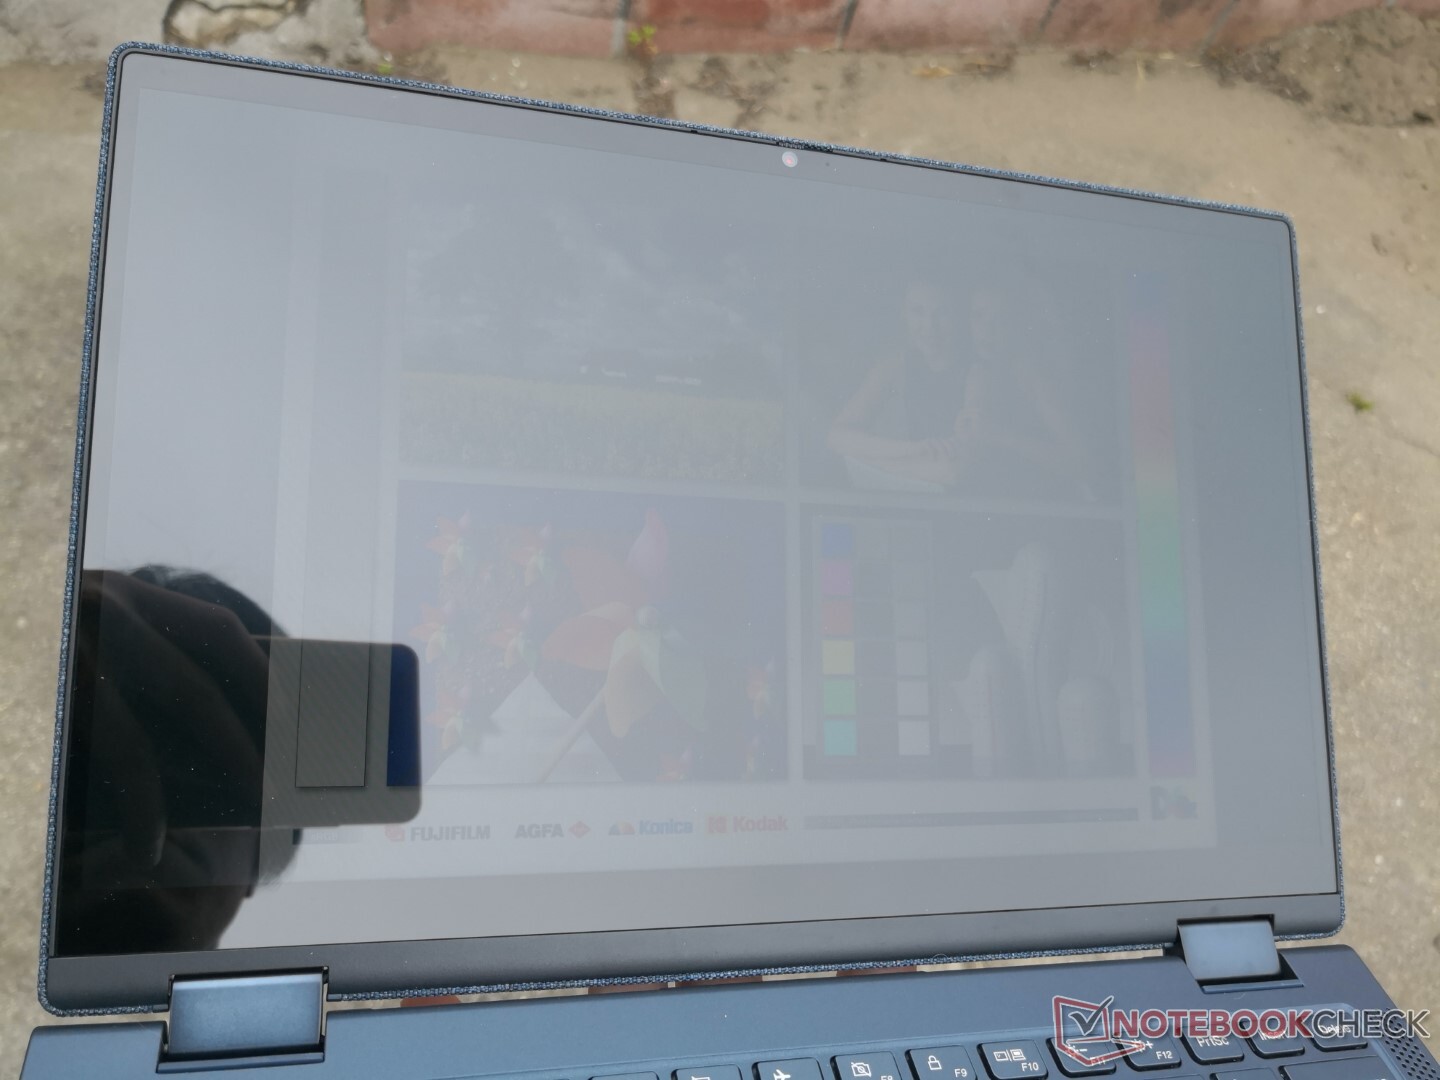
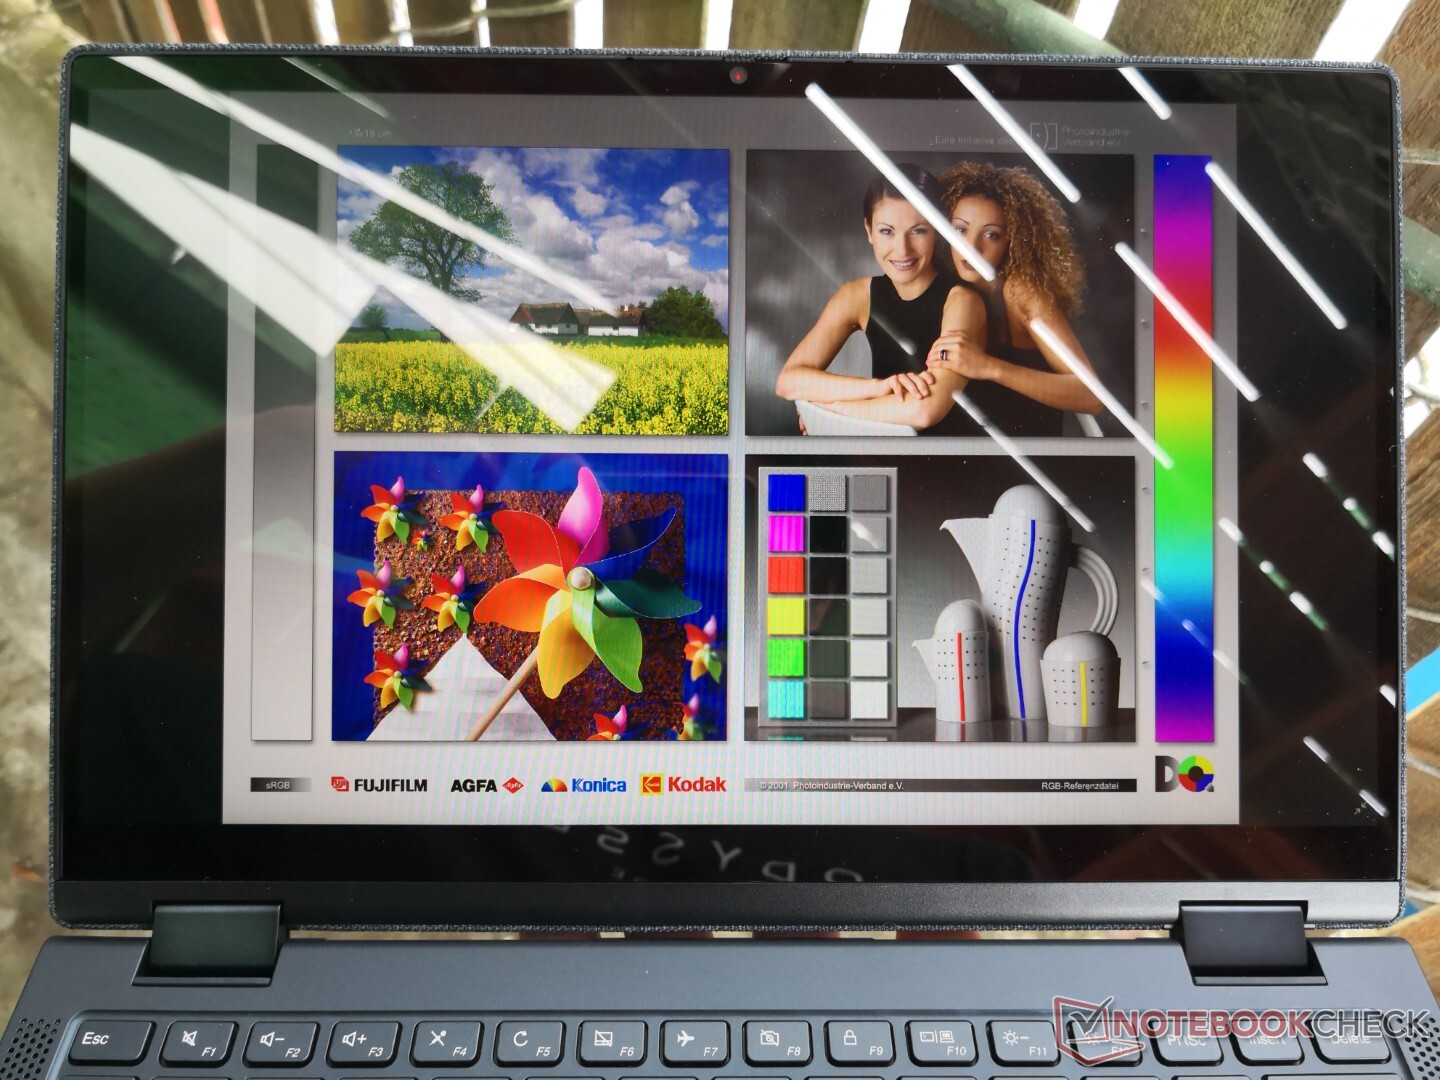
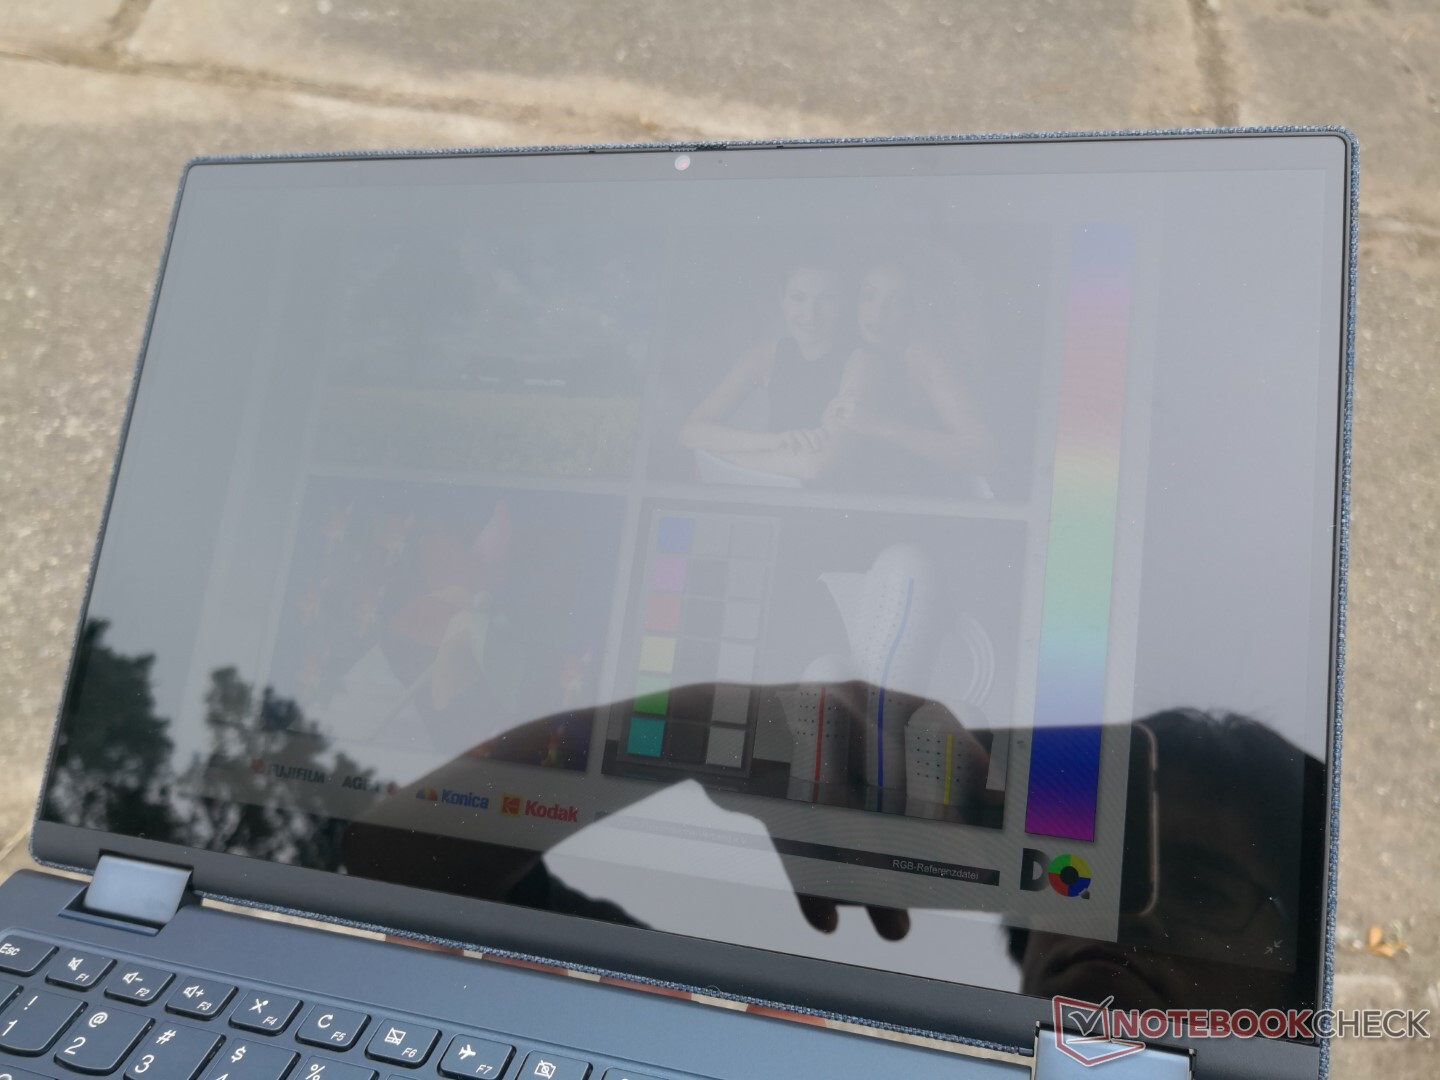
Outdoor visibility is poor especially if sunny or during an otherwise bright overcast day. Shade definitely helps prevent colors from being washed out, but noticeable glare is ever present.
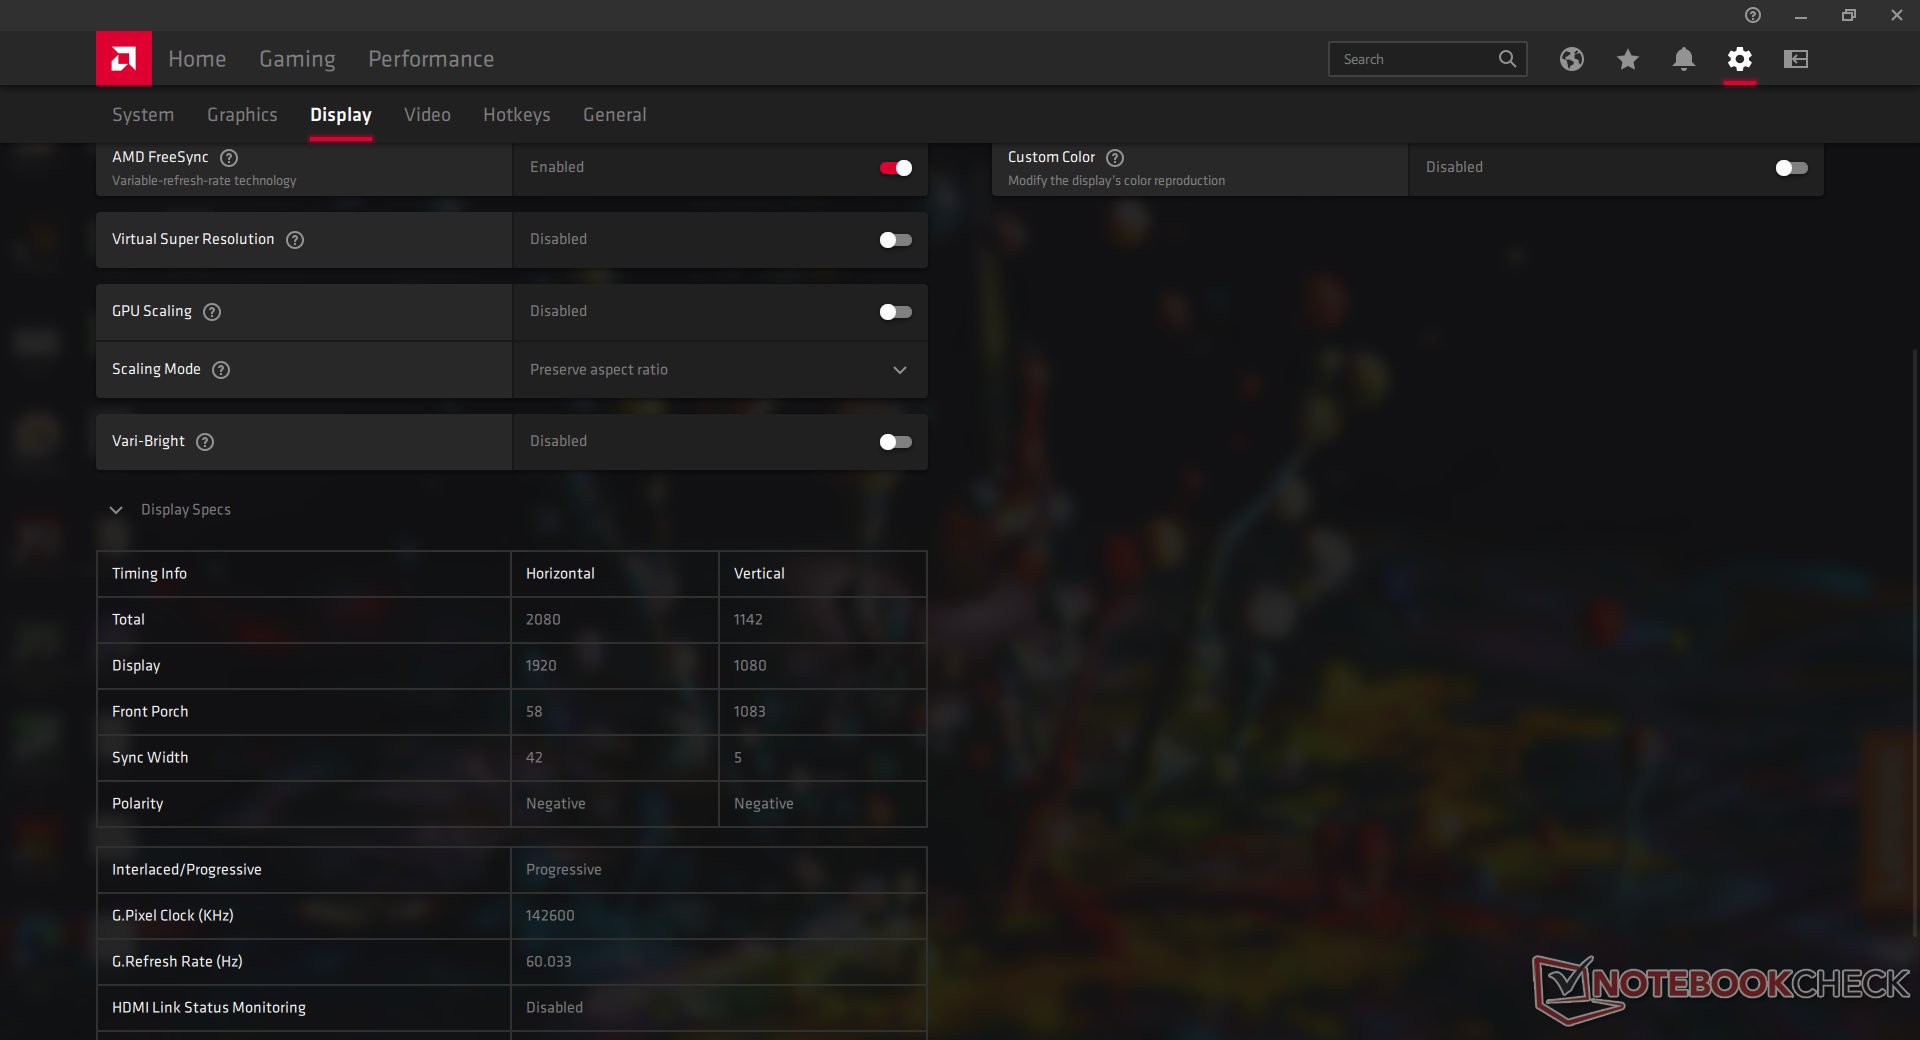
Be sure to disable AMD Vari-Bright via the Radeon software or else maximum brightness will automatically drop when running on battery power.
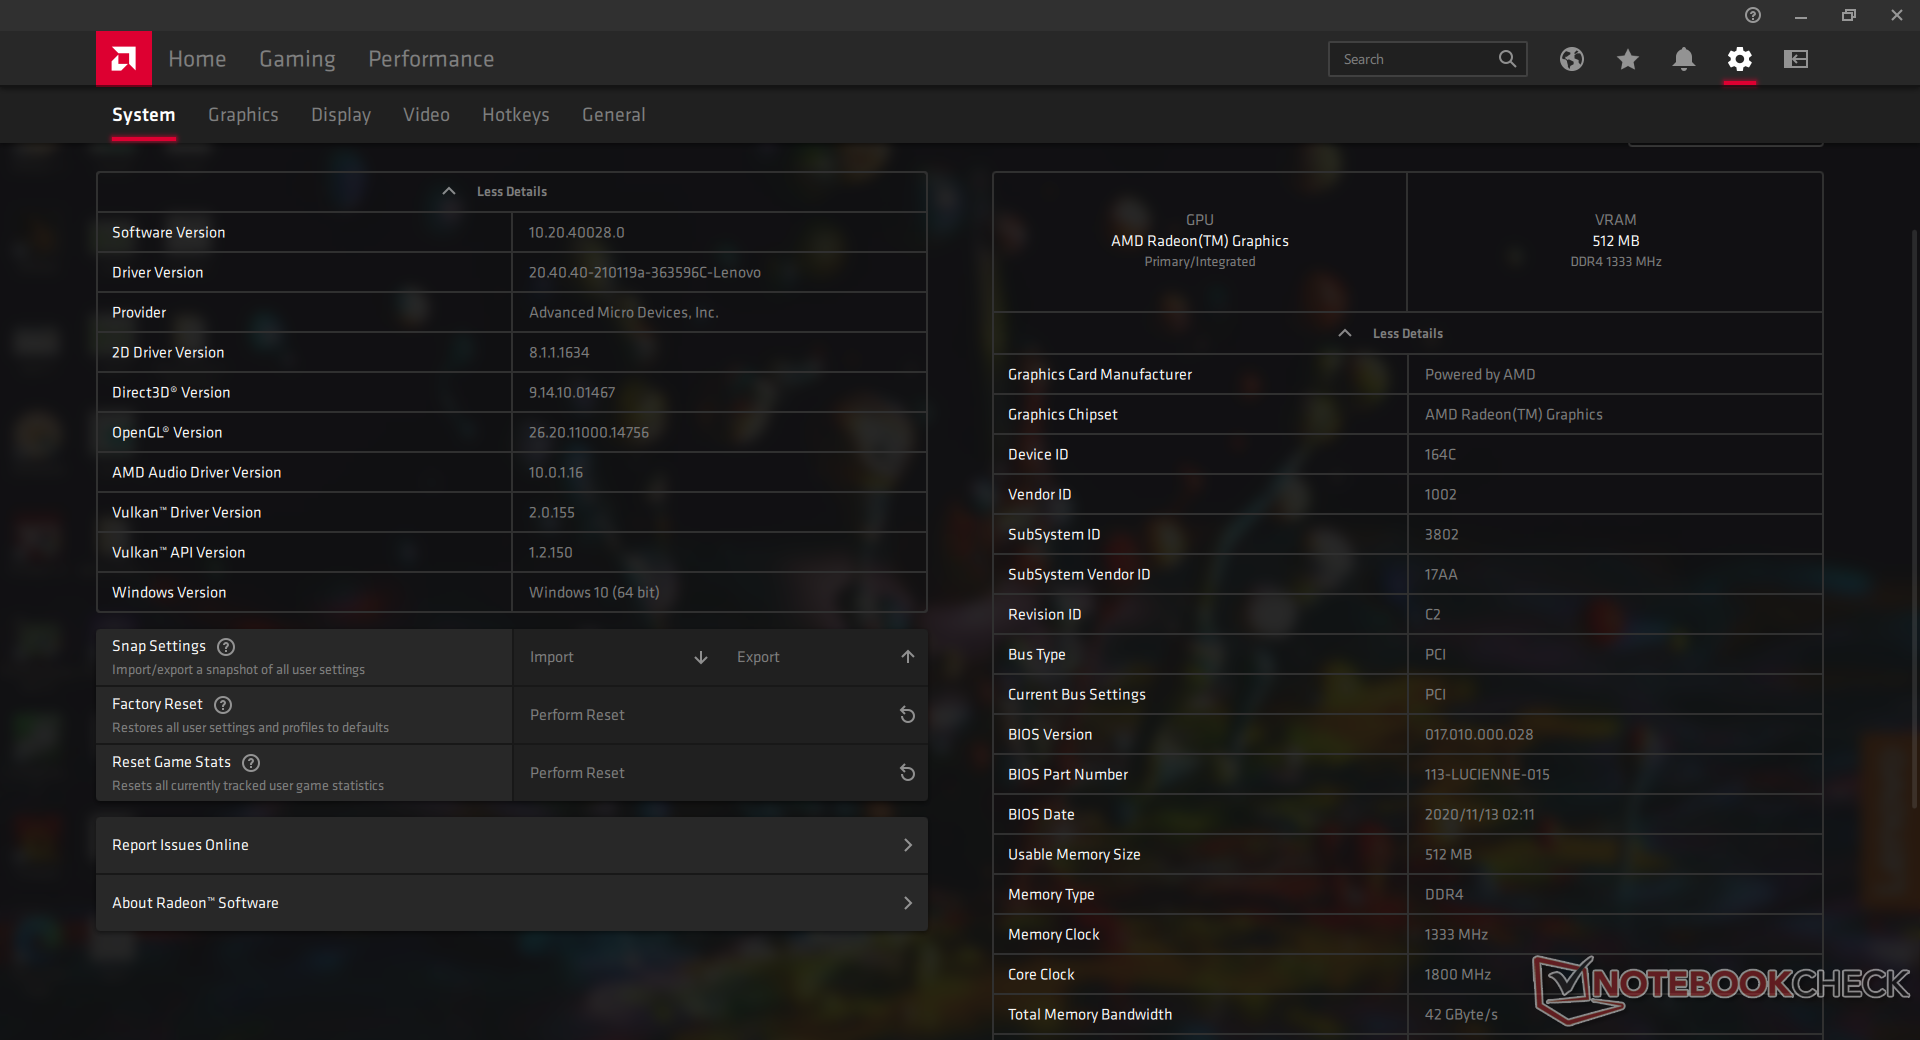
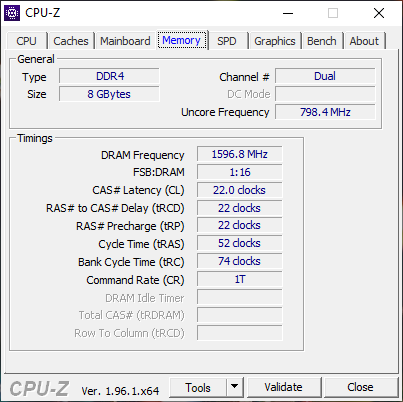
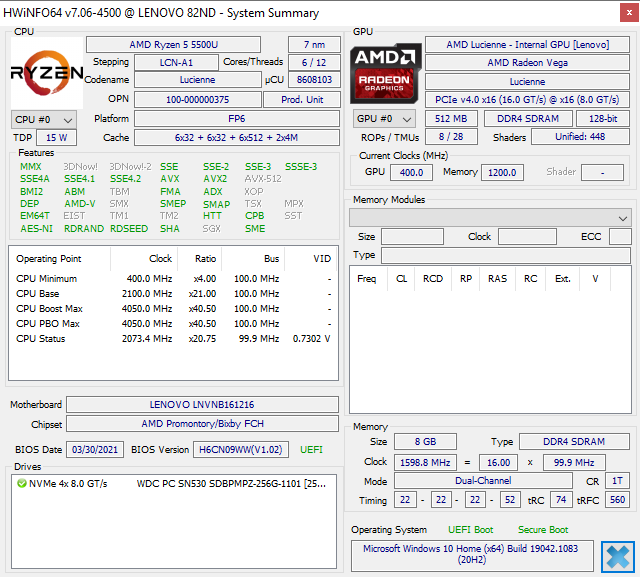
Performance — Hexa-Core 7 nm AMD is Fast
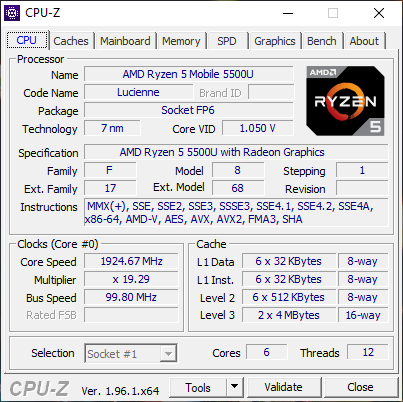
Lenovo is only offering the Ryzen 7 5500U CPU with integrated Radeon RX Vega 7 graphics as of this writing with no other options. This particular hexa-core processor is a Zen 2 CPU despite the 5xxxU naming convention, but raw performance levels should still be comparable to most Core i7 U-series CPUs from Intel.
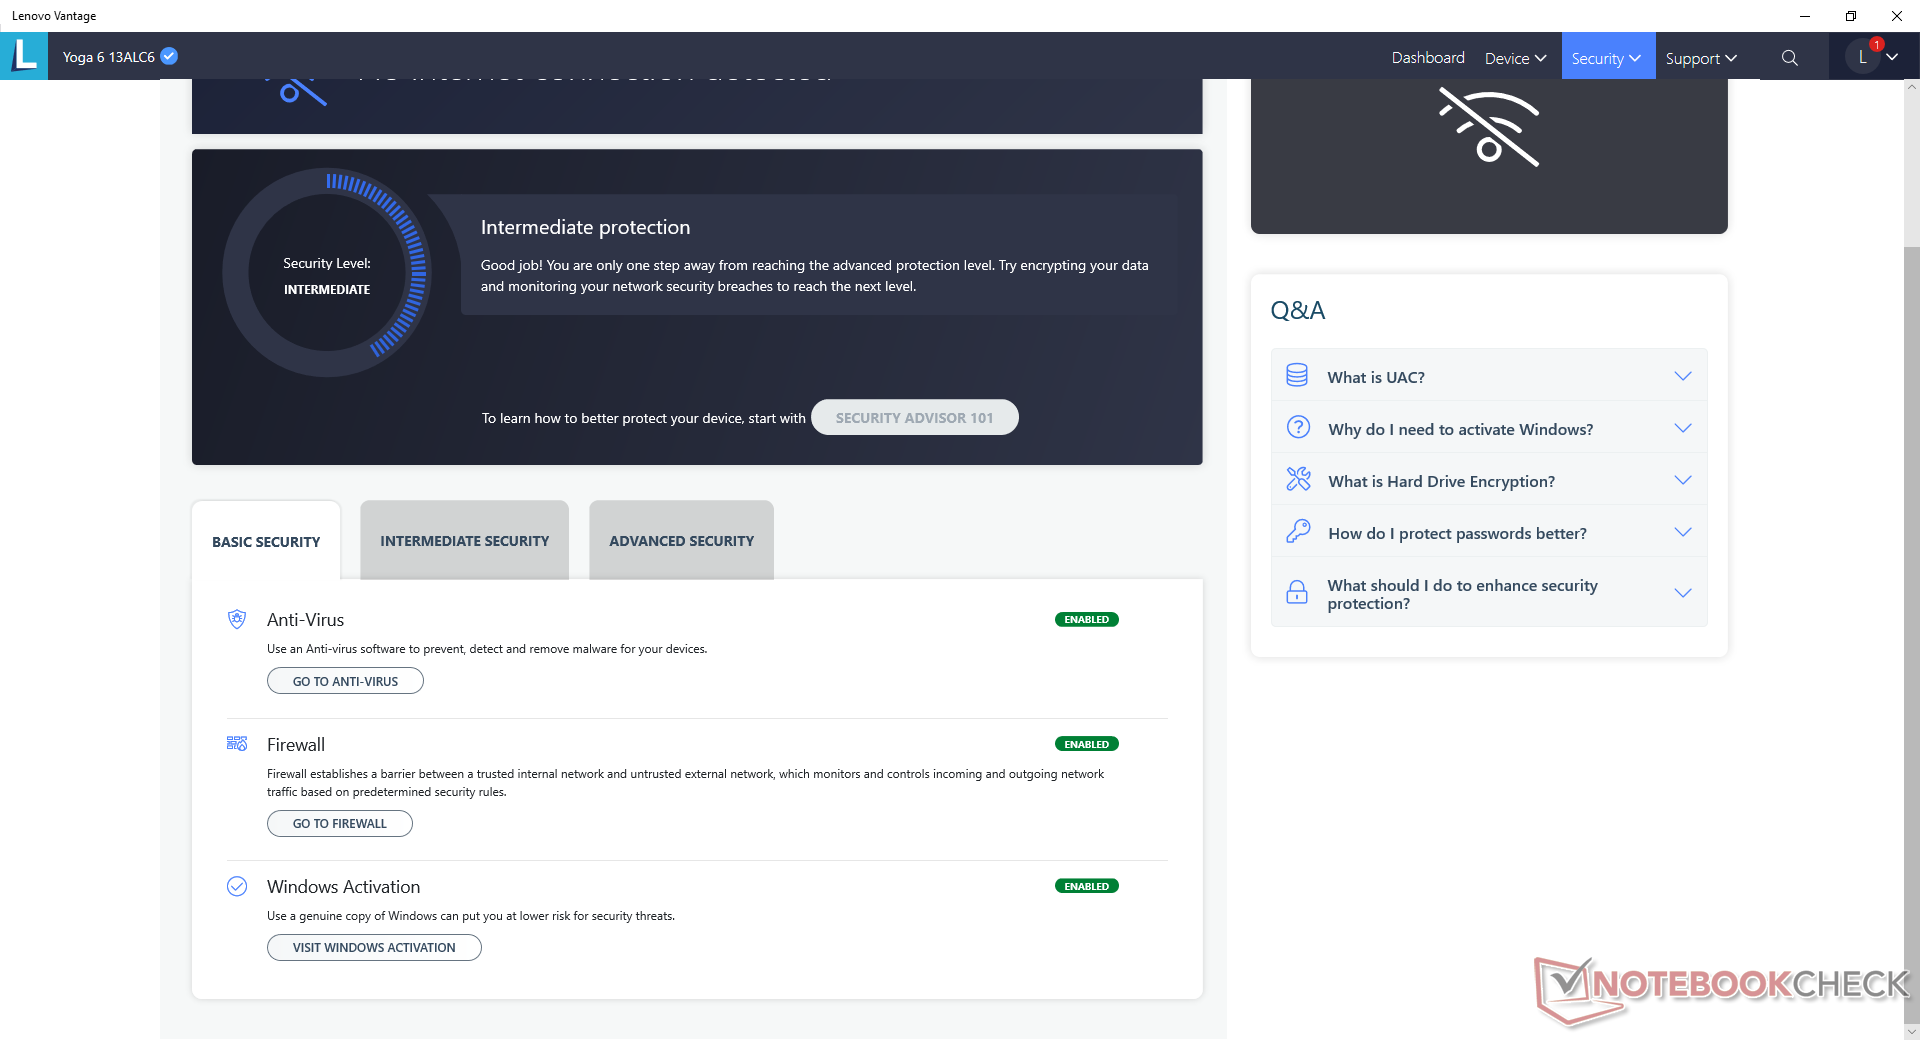
Our unit was set to Extreme Performance mode via Lenovo Vantage prior to running nay performance benchmarks below for the highest possible scores. We recommend users become familiar with both Vantage and Radeon software as most Lenovo-specific features and updates are toggled here.
Notably, the internal display supports AMD FreeSync to eliminate tearing when gaming which is not common on other convertibles.


Processor
Raw multi-thread performance is about 10 percent faster than a competing laptop with the Core i7-1165G7 which is Intel's top-of-the-line Tiger Lake-U CPU at the moment. Single-thread performance, however, is about 20 percent slower. If you value multi-thread performance over single-thread, then an AMD Ryzen system may be the better investment over Intel and vice versa.
Performance sustainability is good save for an unusual short-lived dip in clock rates near the beginning of our CineBench R15 xT loop test as shown by our results below.
Cinebench R15 Multi Loop
Cinebench R23: Multi Core | Single Core
Cinebench R15: CPU Multi 64Bit | CPU Single 64Bit
Blender: v2.79 BMW27 CPU
7-Zip 18.03: 7z b 4 -mmt1 | 7z b 4
Geekbench 5.5: Single-Core | Multi-Core
HWBOT x265 Benchmark v2.2: 4k Preset
LibreOffice : 20 Documents To PDF
R Benchmark 2.5: Overall mean
| Cinebench R23 / Multi Core | |
| Lenovo Yoga Slim 7 14ARE05 82A20008GE | |
| Asus ZenBook 13 OLED UM325UA | |
| Average AMD Ryzen 5 5500U (6030 - 8565, n=19) | |
| Lenovo Yoga 6 13 82ND0009US | |
| Lenovo ThinkPad X13 G2 20WK0024GE | |
| Lenovo ThinkBook 14 G2 ITL 20VD008WGE | |
| Asus VivoBook S13 S333JA-DS51 | |
| Cinebench R23 / Single Core | |
| Lenovo ThinkPad X13 G2 20WK0024GE | |
| Lenovo ThinkBook 14 G2 ITL 20VD008WGE | |
| Asus ZenBook 13 OLED UM325UA | |
| Lenovo Yoga Slim 7 14ARE05 82A20008GE | |
| Average AMD Ryzen 5 5500U (1149 - 1183, n=18) | |
| Lenovo Yoga 6 13 82ND0009US | |
| Asus VivoBook S13 S333JA-DS51 | |
* ... smaller is better
System Performance
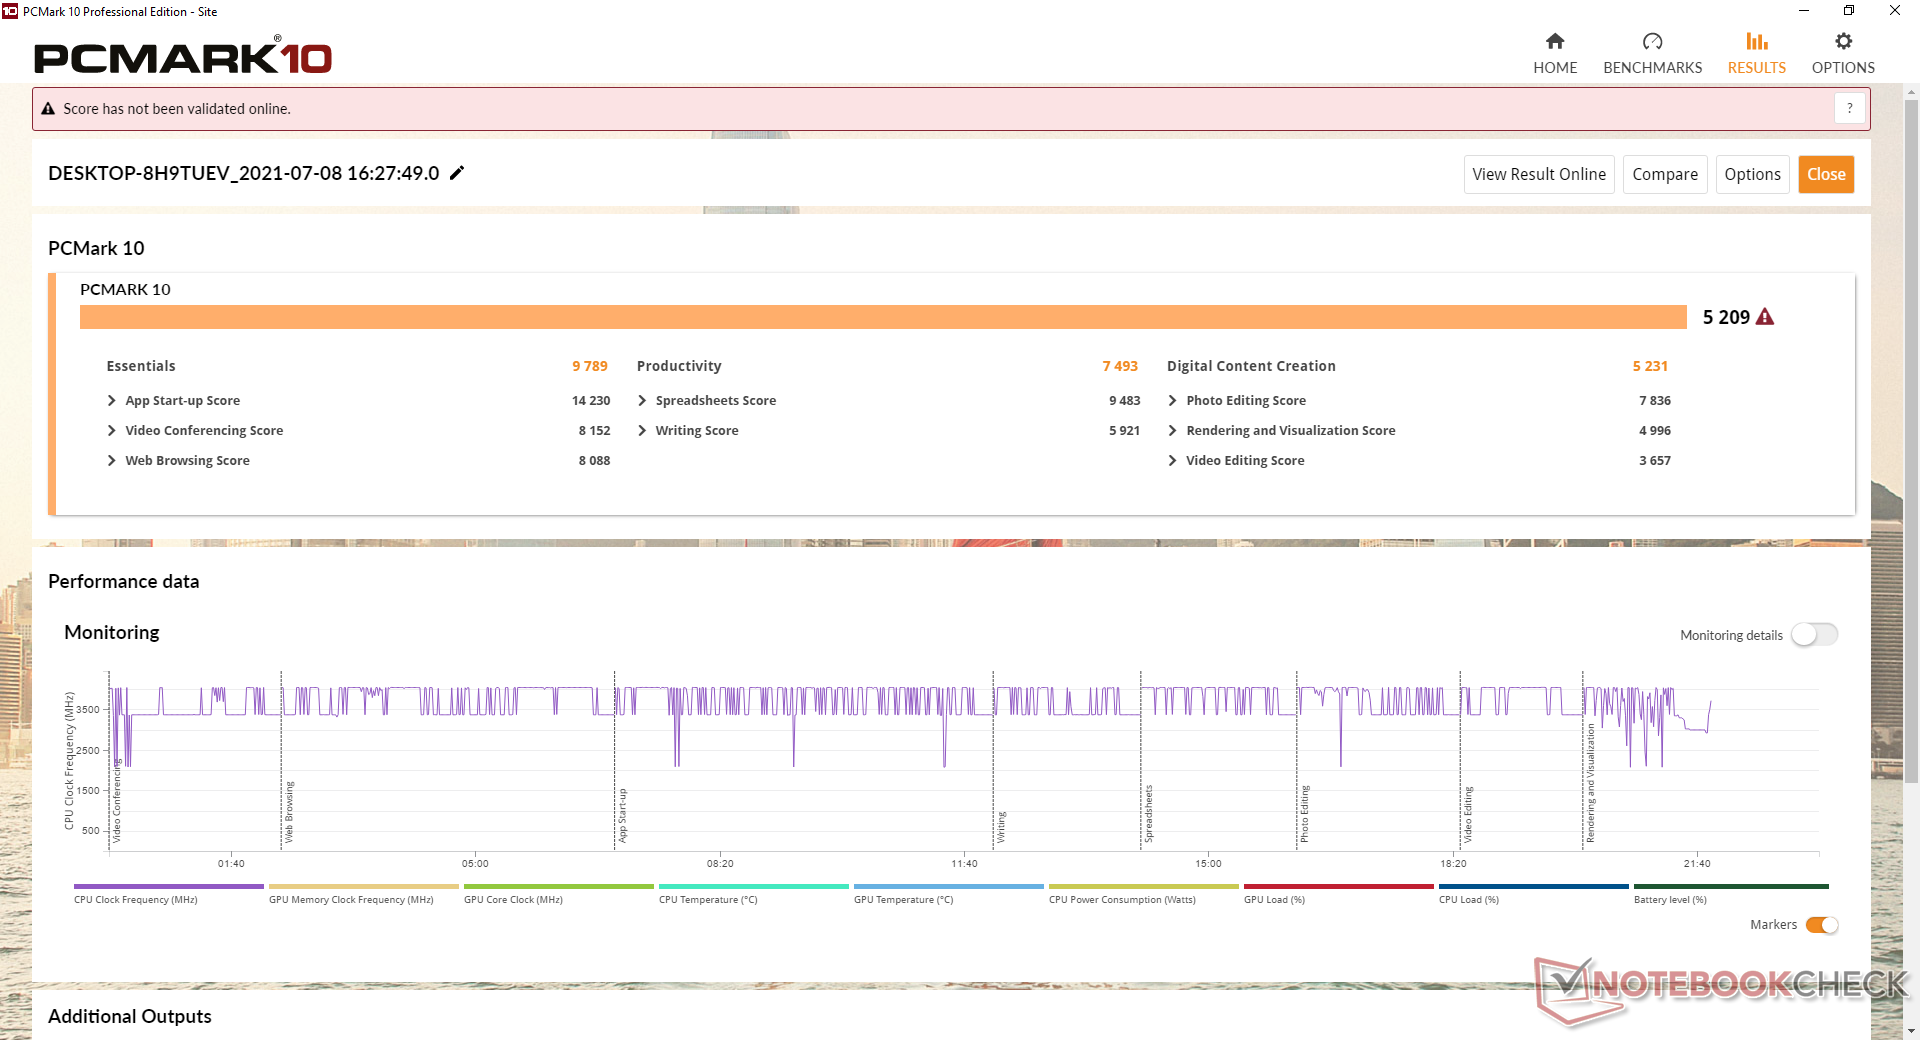
PCMark results are slightly higher than most competing Intel 11th gen Tiger Lake-U Ultrabooks likely due in part to the higher multi-thread performance of the AMD CPU. Keep in mind that real-world graphics performance is still slower than the Iris Xe series despite what the PCMark scores may suggest.
| PCMark 10 / Score | |
| Lenovo Yoga 6 13 82ND0009US | |
| Average AMD Ryzen 5 5500U, AMD Radeon RX Vega 7 (4626 - 5301, n=13) | |
| Asus ZenBook Flip 13 UX363EA-HP069T | |
| MSI Summit E13 Flip Evo A11MT | |
| HP Spectre x360 13-aw2003dx | |
| Samsung Galaxy Book Pro 360 13 | |
| PCMark 10 / Essentials | |
| Asus ZenBook Flip 13 UX363EA-HP069T | |
| Lenovo Yoga 6 13 82ND0009US | |
| HP Spectre x360 13-aw2003dx | |
| Samsung Galaxy Book Pro 360 13 | |
| Average AMD Ryzen 5 5500U, AMD Radeon RX Vega 7 (8390 - 9789, n=13) | |
| MSI Summit E13 Flip Evo A11MT | |
| PCMark 10 / Productivity | |
| Lenovo Yoga 6 13 82ND0009US | |
| Average AMD Ryzen 5 5500U, AMD Radeon RX Vega 7 (6262 - 7958, n=13) | |
| Asus ZenBook Flip 13 UX363EA-HP069T | |
| MSI Summit E13 Flip Evo A11MT | |
| Samsung Galaxy Book Pro 360 13 | |
| HP Spectre x360 13-aw2003dx | |
| PCMark 10 / Digital Content Creation | |
| Lenovo Yoga 6 13 82ND0009US | |
| Average AMD Ryzen 5 5500U, AMD Radeon RX Vega 7 (4513 - 5540, n=13) | |
| MSI Summit E13 Flip Evo A11MT | |
| HP Spectre x360 13-aw2003dx | |
| Samsung Galaxy Book Pro 360 13 | |
| Asus ZenBook Flip 13 UX363EA-HP069T | |
| PCMark 10 Score | 5209 points | |
Help | ||
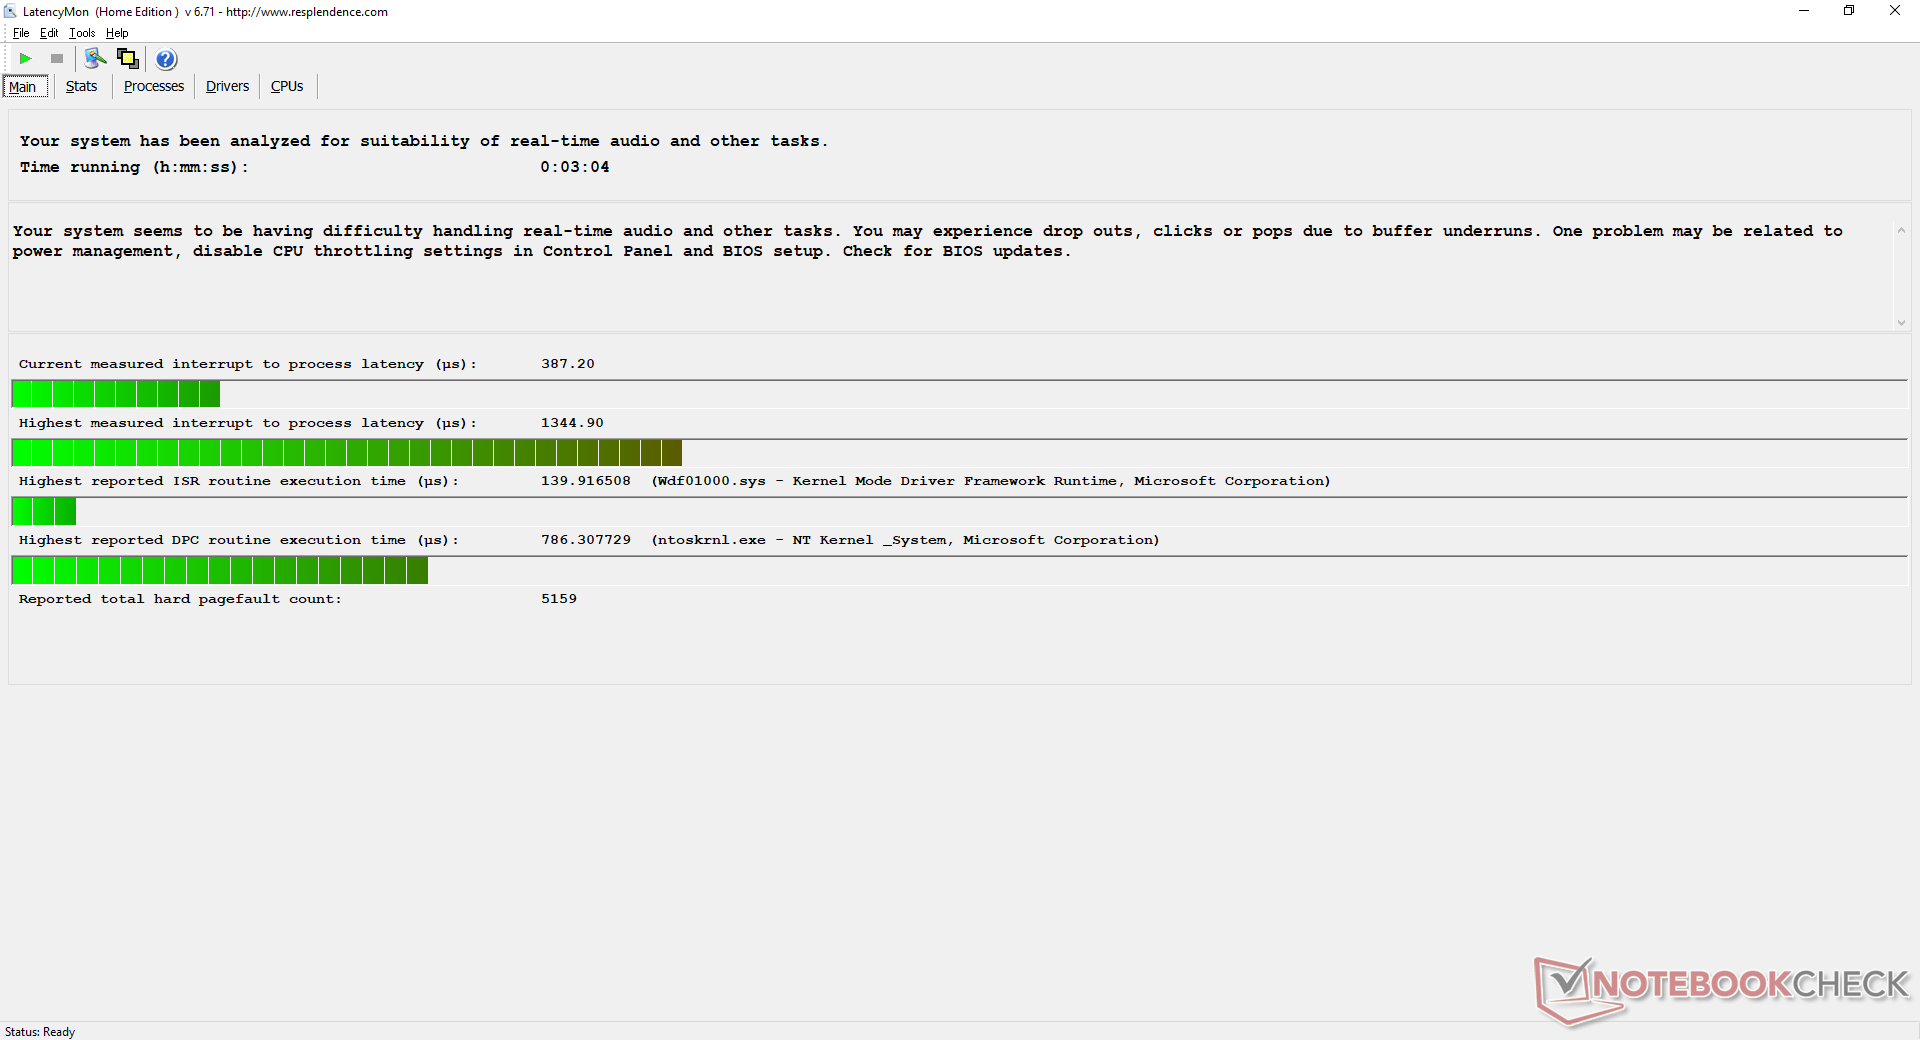
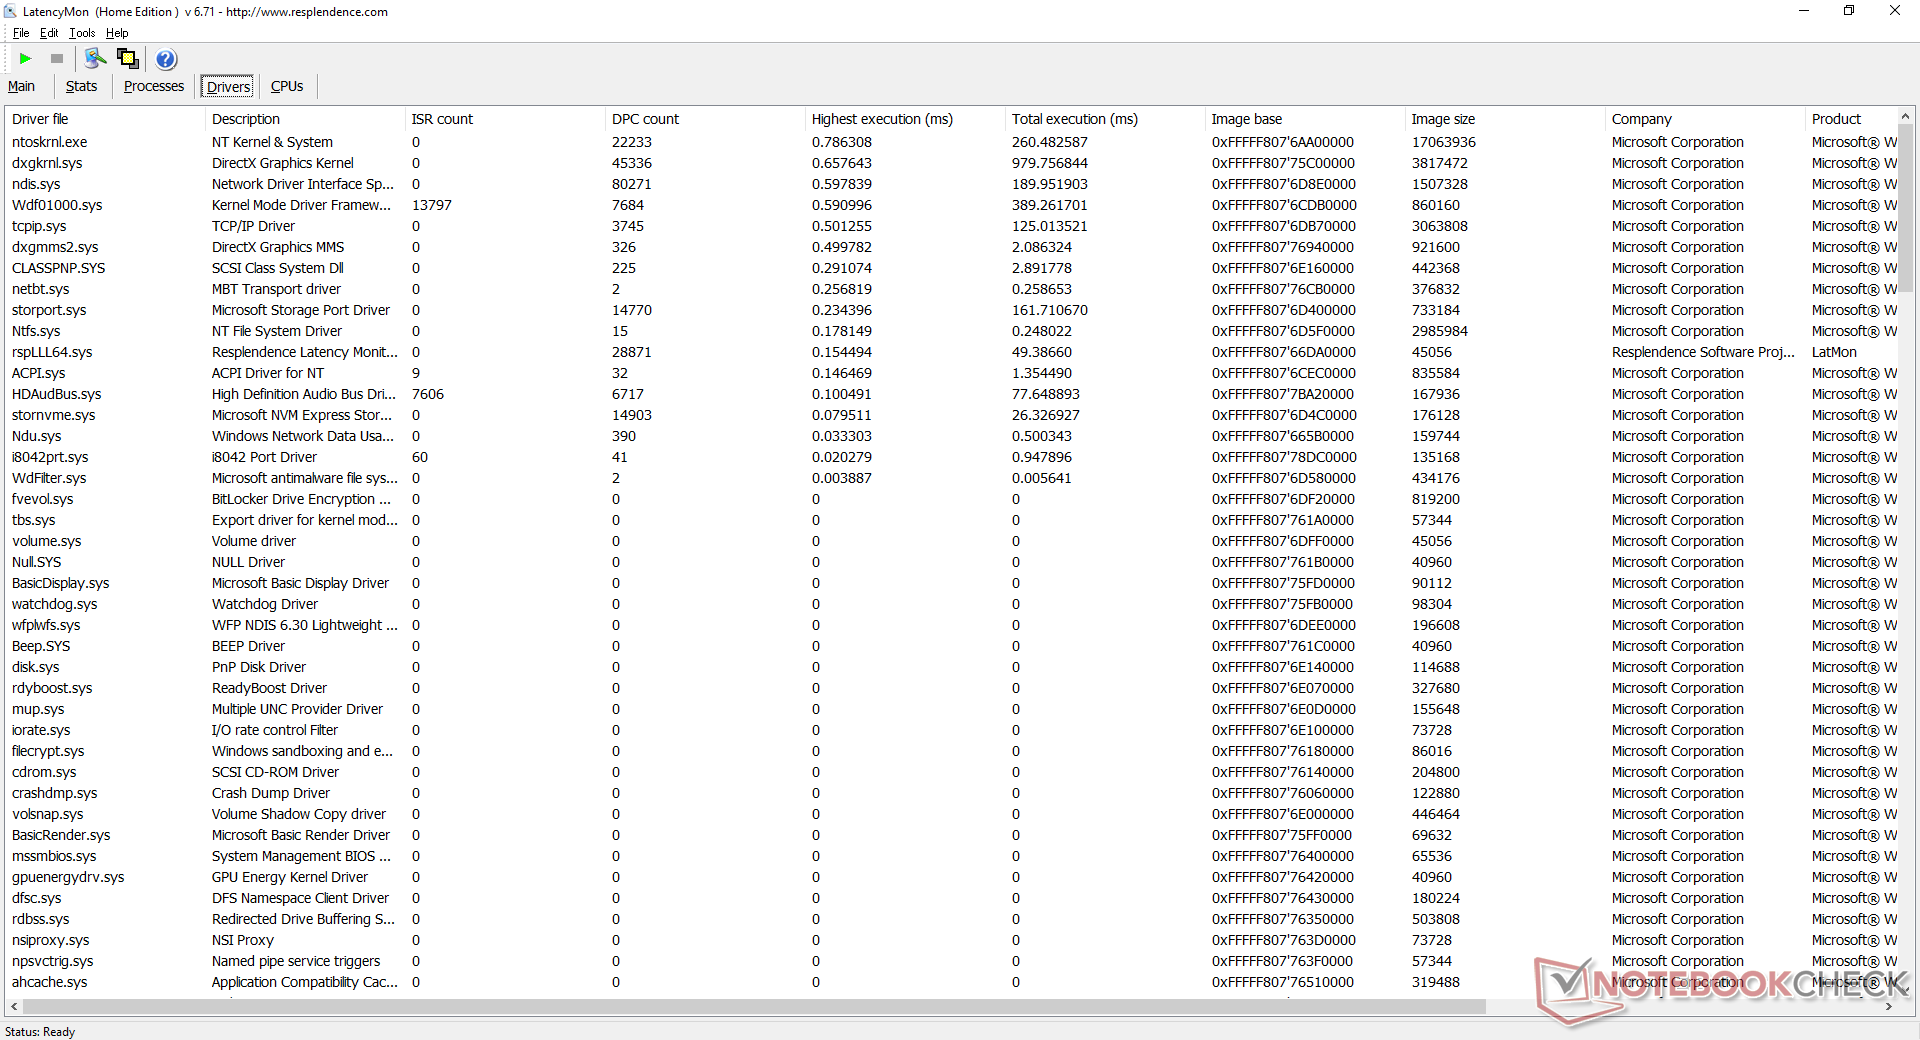
DPC Latency
LatencyMon shows no DPC latency issues when web browsing or video streaming, but latency would spike when running high CPU loads like Prime95. Video playback at 4K60 FPS is otherwise smooth and without any dropped frames.
| DPC Latencies / LatencyMon - interrupt to process latency (max), Web, Youtube, Prime95 | |
| Samsung Galaxy Book Pro 360 13 | |
| Asus ZenBook Flip 13 UX363EA-HP069T | |
| MSI Summit E13 Flip Evo A11MT | |
| HP Spectre x360 13-aw2003dx | |
| Lenovo Yoga 6 13 82ND0009US | |
* ... smaller is better
Storage Devices
Our test unit comes with a midrange Western Digital SN530 M.2 2242 NVMe SSD. Sequential write rates are decent at up to 2400 MB/s, but theoretical write rates are relatively slow at up to 950 MB/s. In fact, we're only able to reach up to 650 MB/s in benchmarks to suggest that the theoretical write rate may be unattainable in most circumstances.


| Lenovo Yoga 6 13 82ND0009US WDC PC SN530 SDBPMPZ-265G | Asus ZenBook Flip 13 UX363EA-HP069T WDC PC SN730 SDBPNTY-1T00 | Samsung Galaxy Book Pro 360 13 Samsung PM991 MZVLQ256HAJD | HP Spectre x360 13-aw2003dx Intel Optane Memory H10 with Solid State Storage 32GB + 512GB HBRPEKNX0202A(L/H) | MSI Summit E13 Flip Evo A11MT Phison 1TB SM2801T24GKBB4S-E162 | Lenovo IdeaPad Flex 5 CB 13IML05 82B80010GE Samsung PM991 MZALQ128HBHQ-000L2 | |
|---|---|---|---|---|---|---|
| AS SSD | 204% | 88% | 93% | 261% | ||
| Seq Read (MB/s) | 1860 | 2767 49% | 1771 -5% | 1337 -28% | 3789 104% | |
| Seq Write (MB/s) | 500 | 1368 174% | 894 79% | 652 30% | 2257 351% | |
| 4K Read (MB/s) | 36.26 | 46.86 29% | 53.5 48% | 61.8 70% | 54.2 49% | |
| 4K Write (MB/s) | 118.6 | 140.1 18% | 157.8 33% | 106.7 -10% | 78.7 -34% | |
| 4K-64 Read (MB/s) | 419 | 954 128% | 478.1 14% | 565 35% | 1330 217% | |
| 4K-64 Write (MB/s) | 219 | 1361 521% | 741 238% | 757 246% | 2038 831% | |
| Access Time Read * (ms) | 0.102 | 0.051 50% | 0.156 -53% | 0.079 23% | 0.042 59% | |
| Access Time Write * (ms) | 0.17 | 0.022 87% | 0.023 86% | 0.046 73% | 0.04 76% | |
| Score Read (Points) | 641 | 1277 99% | 709 11% | 761 19% | 1763 175% | |
| Score Write (Points) | 388 | 1638 322% | 988 155% | 929 139% | 2343 504% | |
| Score Total (Points) | 1300 | 3507 170% | 2034 56% | 2067 59% | 4938 280% | |
| Copy ISO MB/s (MB/s) | 880 | 2767 214% | 960 9% | 912 4% | 2270 158% | |
| Copy Program MB/s (MB/s) | 185.3 | 1072 479% | 648 250% | 696 276% | 670 262% | |
| Copy Game MB/s (MB/s) | 212.7 | 1319 520% | 882 315% | 994 367% | 1525 617% | |
| CrystalDiskMark 5.2 / 6 | 65% | 12% | 31% | 130% | ||
| Write 4K (MB/s) | 89.2 | 143 60% | 170.6 91% | 64.8 -27% | 311.1 249% | |
| Read 4K (MB/s) | 33.09 | 50.2 52% | 44.51 35% | 98 196% | 56.6 71% | |
| Write Seq (MB/s) | 988 | 1963 99% | 872 -12% | 994 1% | 2397 143% | |
| Read Seq (MB/s) | 1322 | 1990 51% | 1188 -10% | 1440 9% | 2277 72% | |
| Write 4K Q32T1 (MB/s) | 332.6 | 375 13% | 483.1 45% | 444.5 34% | 803 141% | |
| Read 4K Q32T1 (MB/s) | 389.3 | 363.7 -7% | 284.3 -27% | 397.1 2% | 849 118% | |
| Write Seq Q32T1 (MB/s) | 984 | 3086 214% | 950 -3% | 1265 29% | 2410 145% | |
| Read Seq Q32T1 (MB/s) | 2461 | 3382 37% | 1872 -24% | 2501 2% | 4954 101% | |
| Write 4K Q8T8 (MB/s) | 405.6 | |||||
| Read 4K Q8T8 (MB/s) | 930 | |||||
| Total Average (Program / Settings) | 135% /
154% | 50% /
61% | 62% /
70% | 196% /
213% |
* ... smaller is better

Disk Throttling: DiskSpd Read Loop, Queue Depth 8
GPU Performance — Mixed Bag Due to only 8 GB of RAM
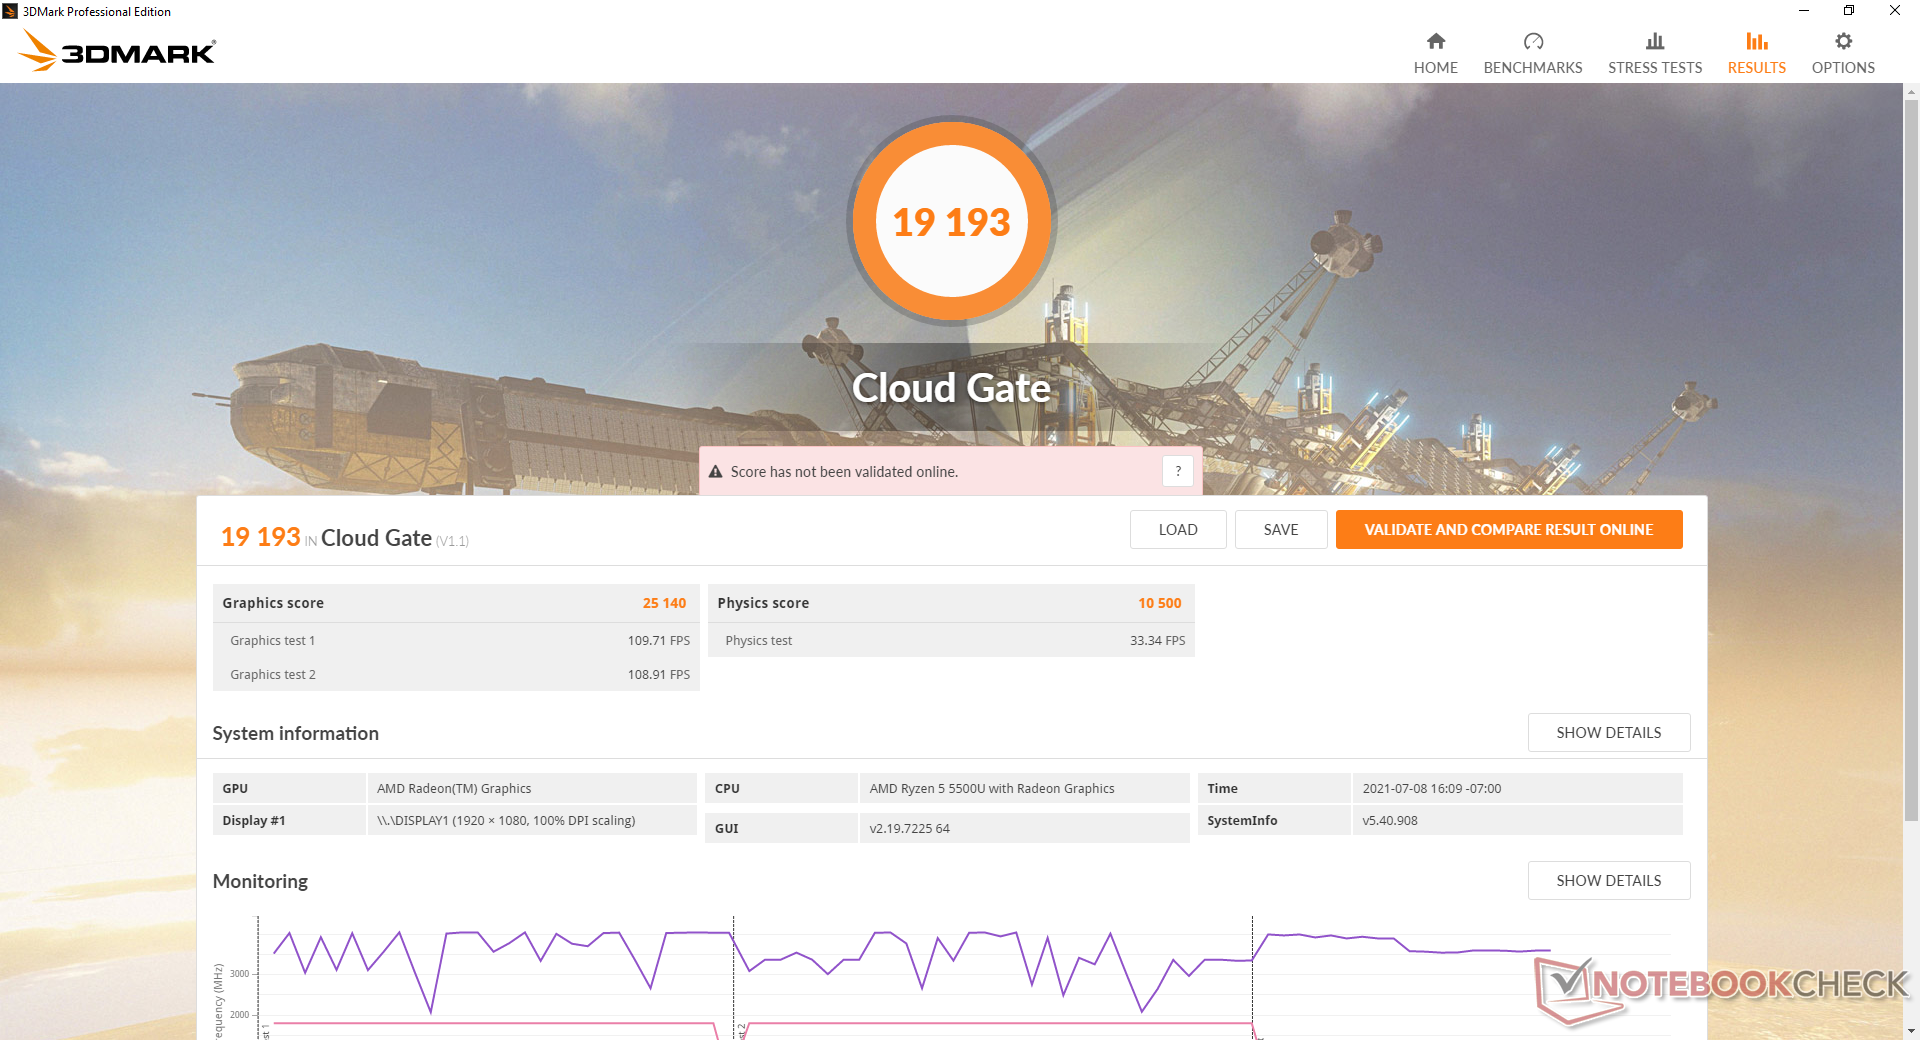
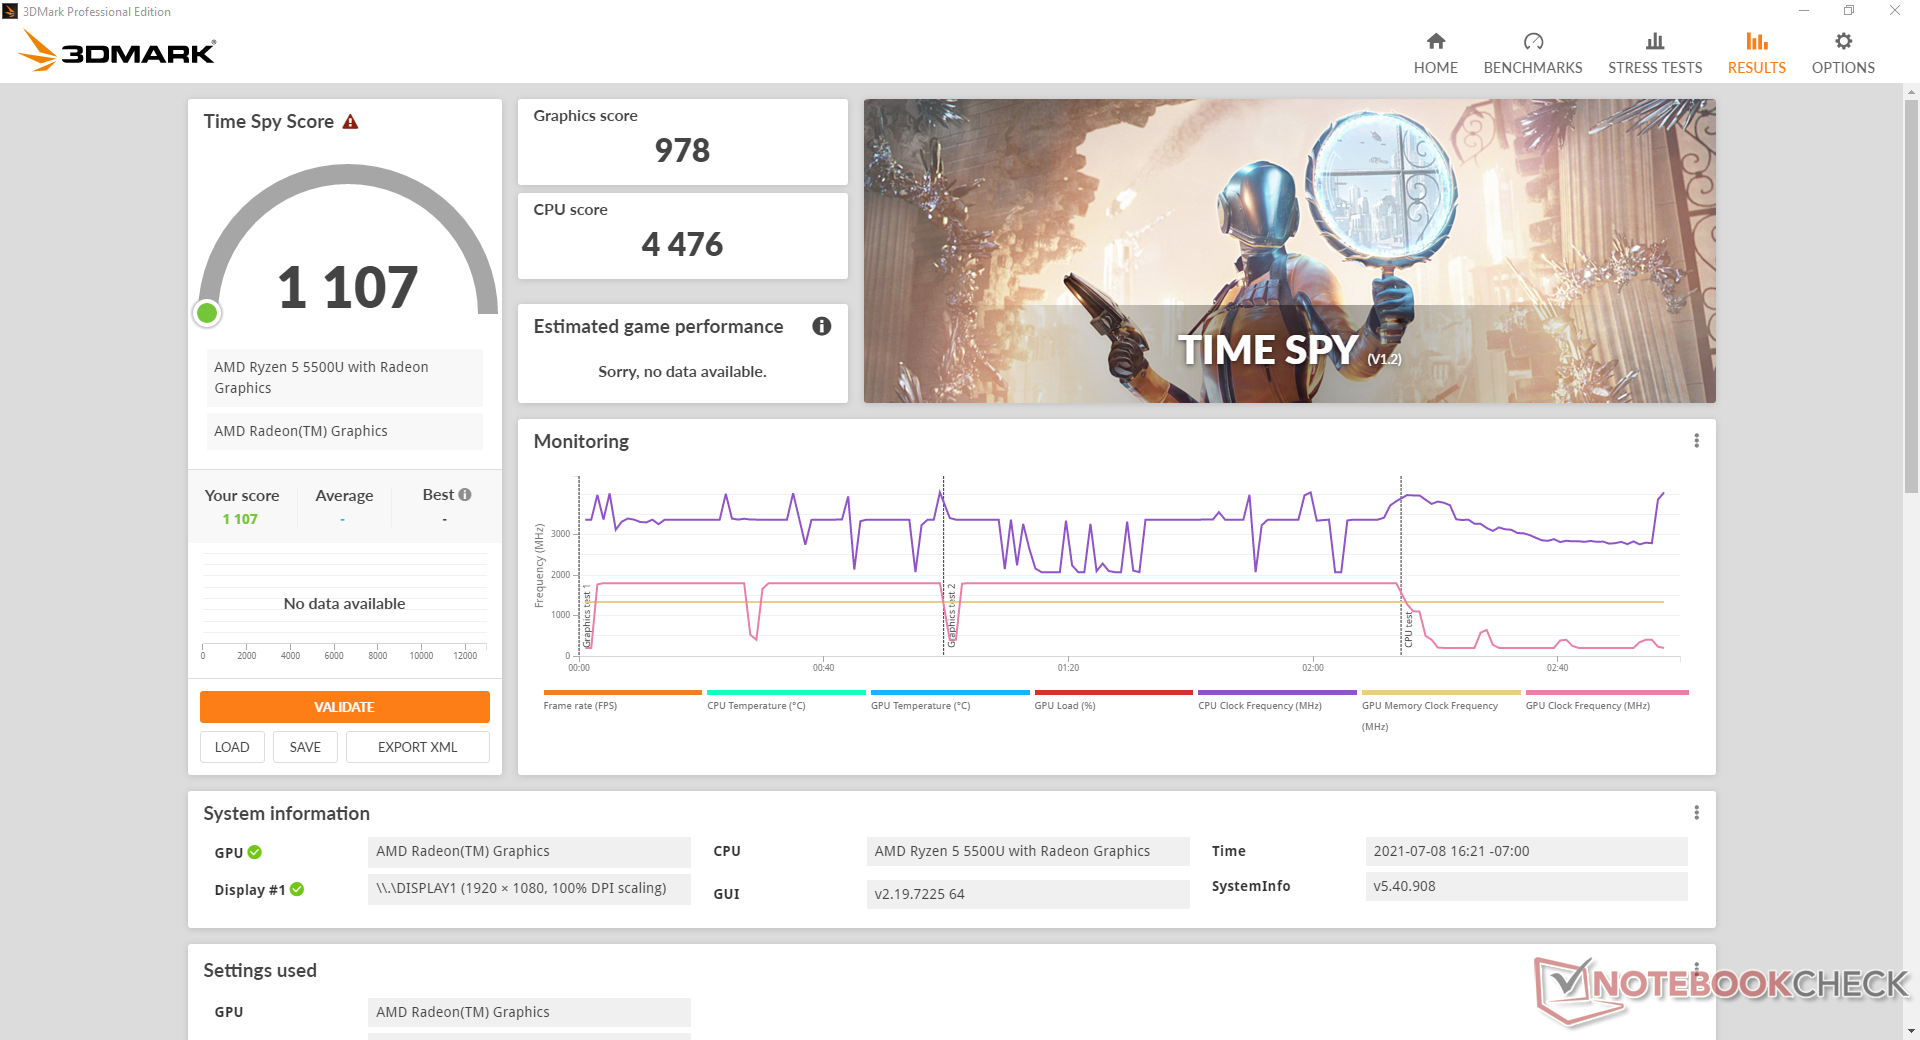
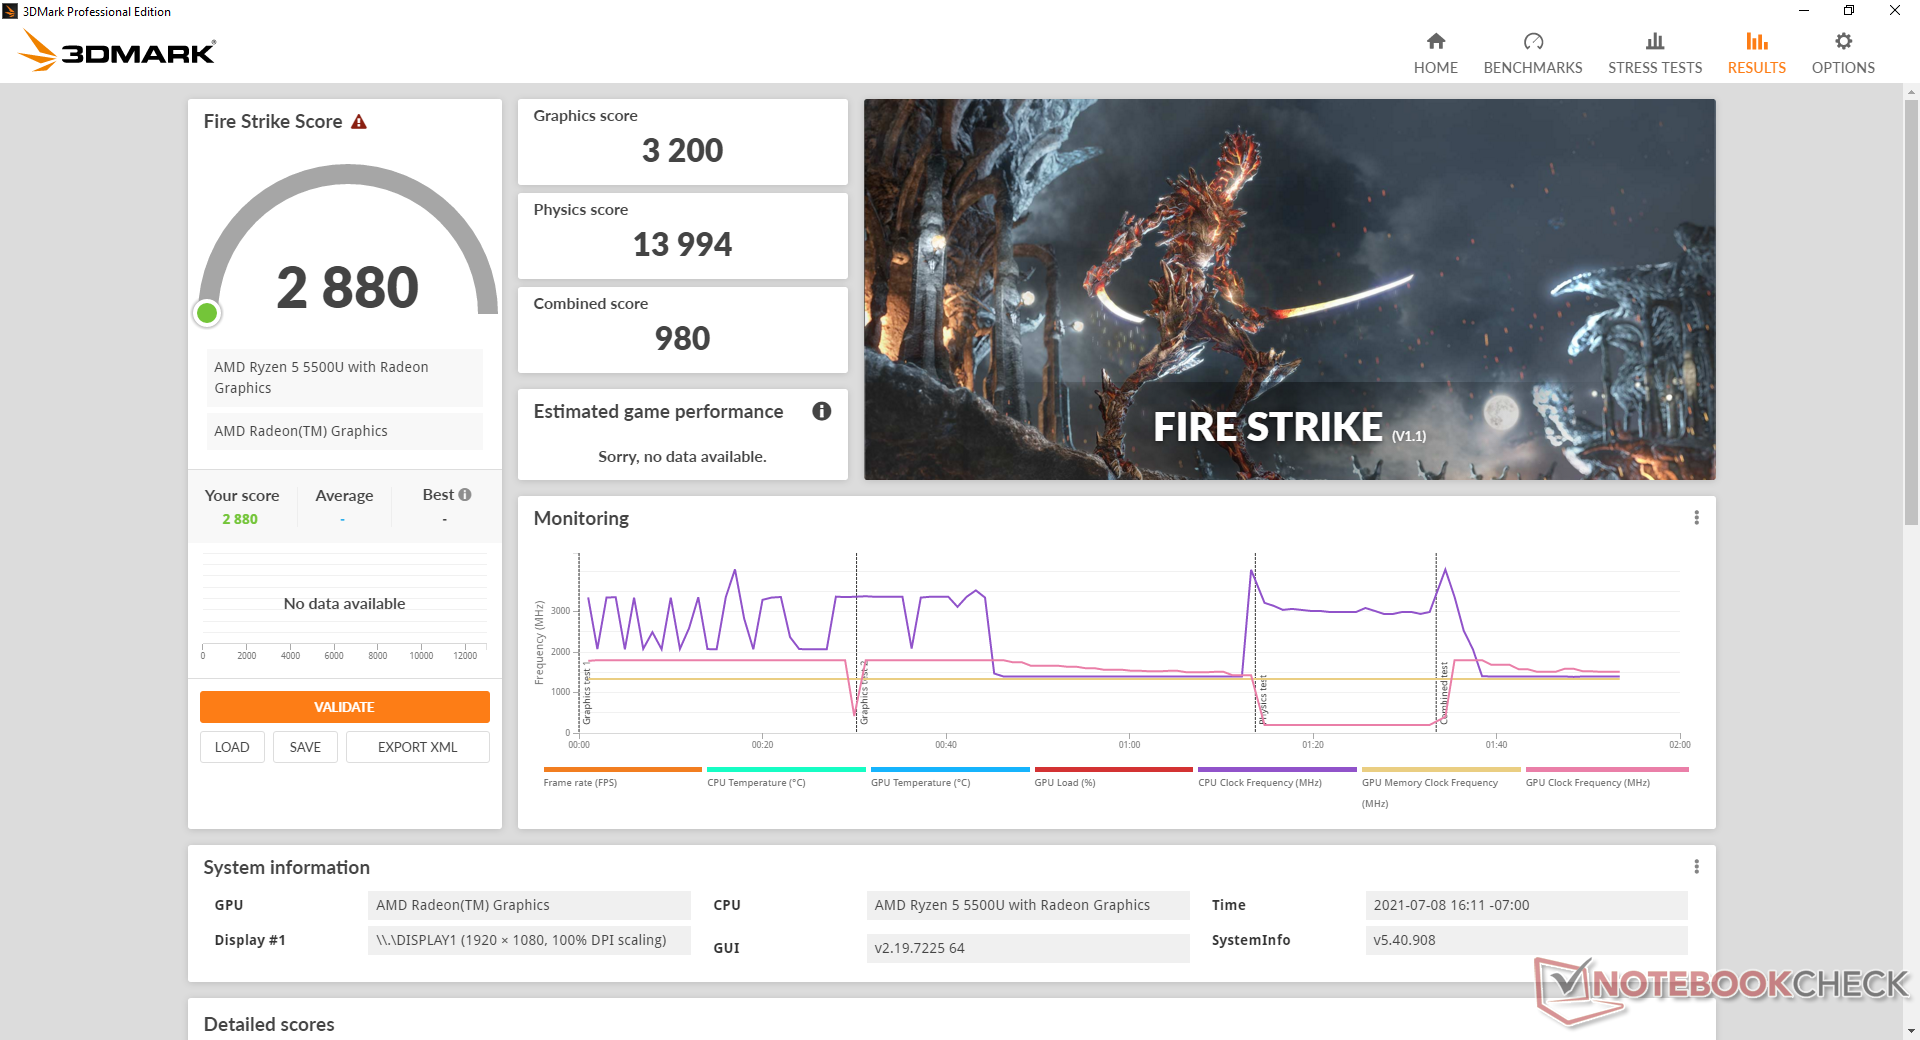
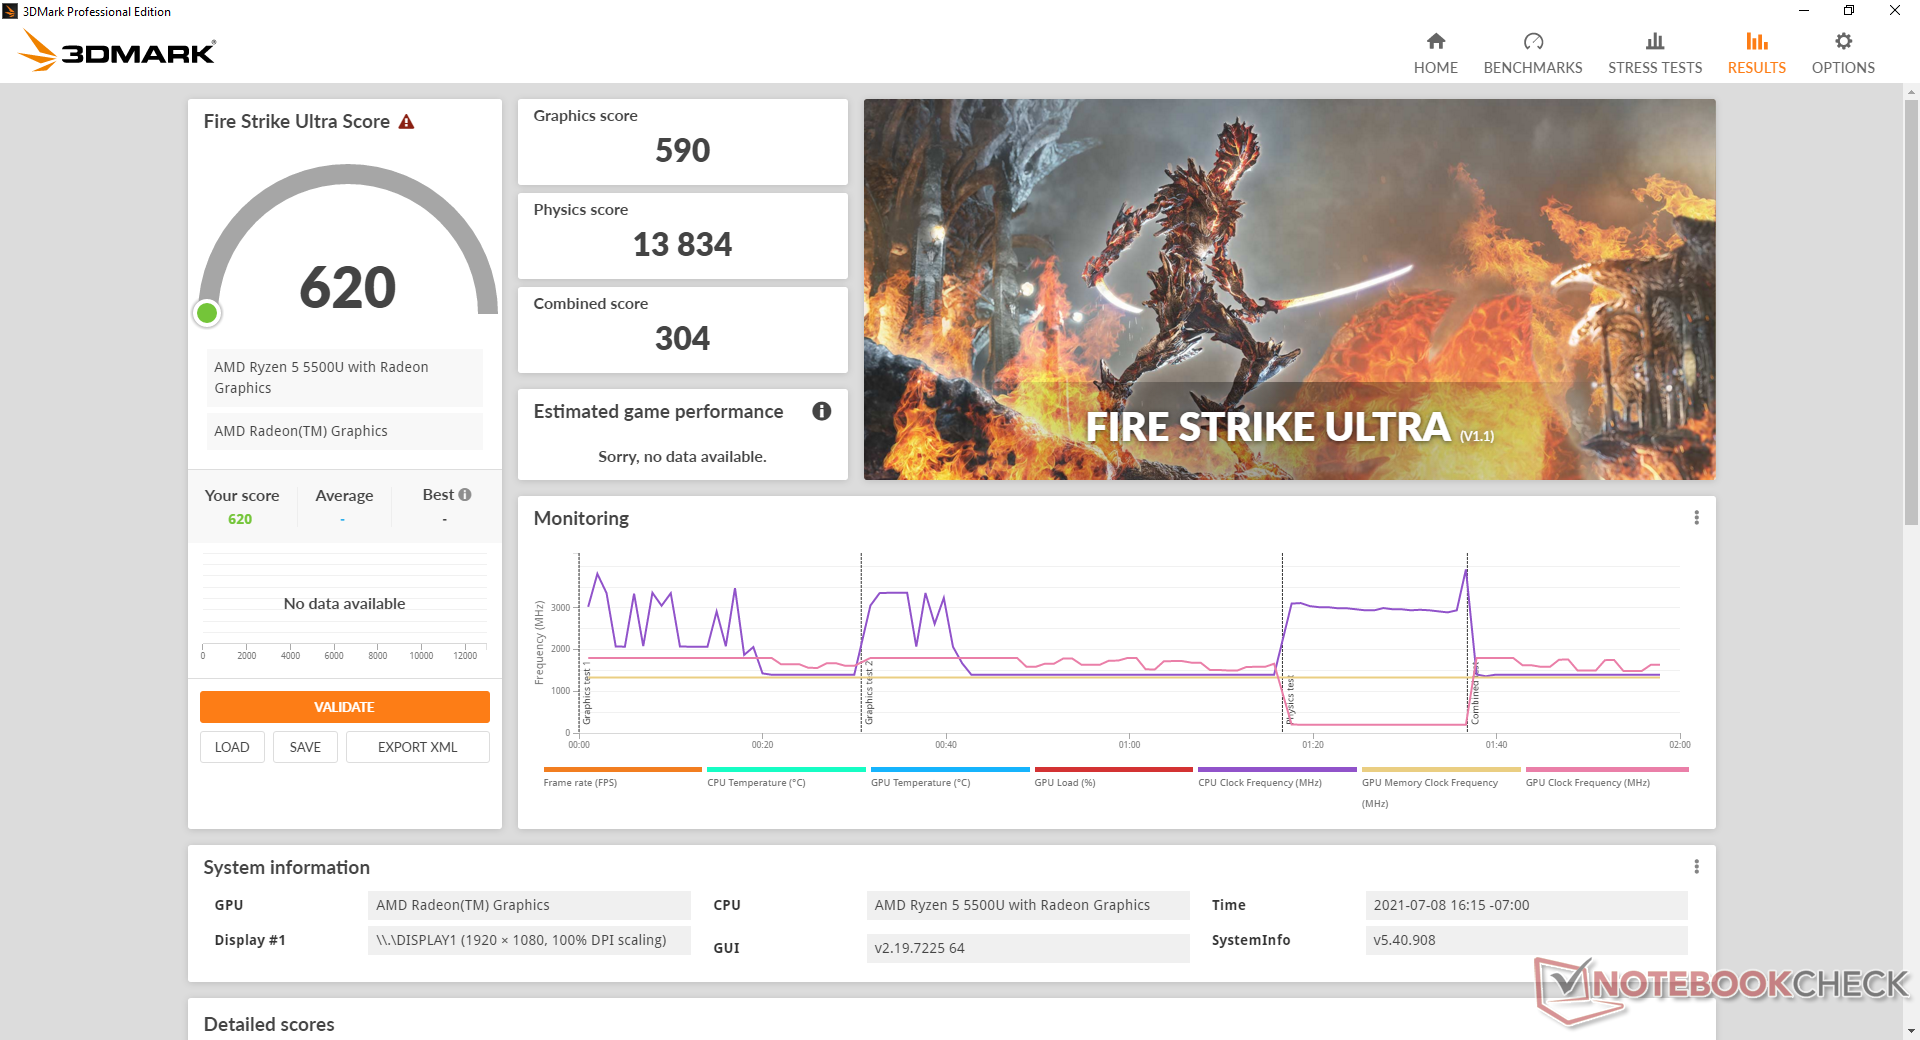
3DMark results are roughly 30 percent and 40 percent slower than the competing Intel Iris Xe 80 EUs and 96 EUs, respectively. Fortunately for AMD, the performance delta during real-world games is typically narrower. We suspect that the limited 8 GB of system RAM is also bottlenecking overall frame rates on our machine.
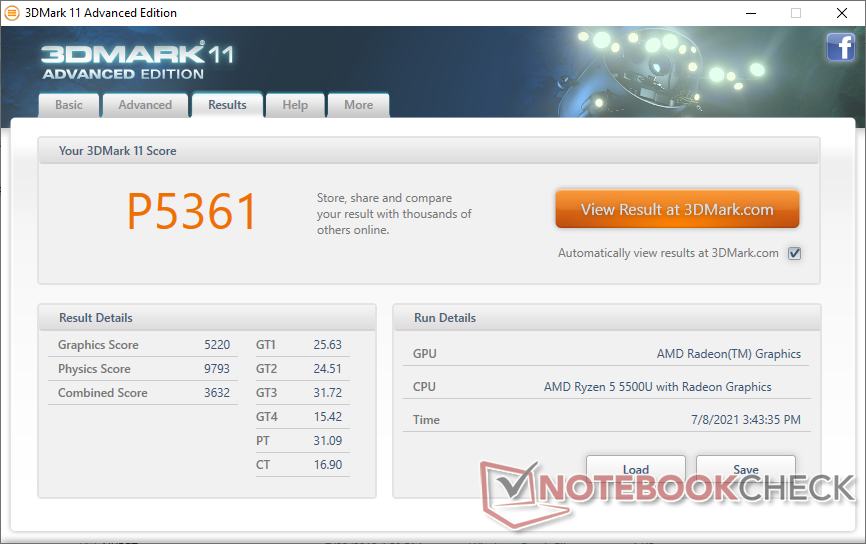
| 3DMark 11 Performance | 5361 points | |
| 3DMark Cloud Gate Standard Score | 19193 points | |
| 3DMark Fire Strike Score | 2880 points | |
| 3DMark Time Spy Score | 1107 points | |
Help | ||
Witcher 3 FPS Chart
| low | med. | high | ultra | |
|---|---|---|---|---|
| GTA V (2015) | 85.6 | 21.9 | 8.98 | |
| The Witcher 3 (2015) | 66.9 | 20.4 | 13.6 | |
| Dota 2 Reborn (2015) | 97.7 | 75 | 44.4 | 41.6 |
| Final Fantasy XV Benchmark (2018) | 29.7 | 15.2 | 9.83 | |
| X-Plane 11.11 (2018) | 36.9 | 28.7 | 25 | |
| Strange Brigade (2018) | 72.8 | 27.4 | 22.5 | 20.7 |
Emissions — Quiet For Basic Workloads
System Noise
Fan noise is generally quiet when simply emailing or video streaming. The fan may occasionally jump to 33 dB(A) if web browsing on Extreme Performance mode before quickly falling back down to 26.3 dB(A) or lower.
Fan noise ramps up significantly when running higher loads like games. When under such conditions, the fan will range between 38 dB(A) to 41 dB(A) which is not unlike what we observed on the MSI Summit E13 Flip Evo or Galaxy Book Pro 13. The system is thankfully only loud when it needs to be. Setting the system to Intelligent Cooling or Battery Saving via Lenovo Vantage will lower the fan noise ceiling at the cost of performance.

| Lenovo Yoga 6 13 82ND0009US Vega 7, R5 5500U, WDC PC SN530 SDBPMPZ-265G | Asus ZenBook Flip 13 UX363EA-HP069T Iris Xe G7 96EUs, i7-1165G7, WDC PC SN730 SDBPNTY-1T00 | Samsung Galaxy Book Pro 360 13 Iris Xe G7 80EUs, i5-1135G7, Samsung PM991 MZVLQ256HAJD | HP Spectre x360 13-aw2003dx Iris Xe G7 80EUs, i5-1135G7, Intel Optane Memory H10 with Solid State Storage 32GB + 512GB HBRPEKNX0202A(L/H) | MSI Summit E13 Flip Evo A11MT Iris Xe G7 96EUs, i7-1185G7, Phison 1TB SM2801T24GKBB4S-E162 | Lenovo IdeaPad Flex 5 CB 13IML05 82B80010GE UHD Graphics 620, i5-10210U, Samsung PM991 MZALQ128HBHQ-000L2 | |
|---|---|---|---|---|---|---|
| Noise | -11% | -6% | 0% | -3% | 1% | |
| off / environment * (dB) | 25.1 | 27 -8% | 27 -8% | 25.3 -1% | 24.5 2% | 26.5 -6% |
| Idle Minimum * (dB) | 25.1 | 27 -8% | 27 -8% | 25.4 -1% | 24.7 2% | 26.5 -6% |
| Idle Average * (dB) | 25.1 | 27 -8% | 27 -8% | 25.4 -1% | 24.7 2% | 26.5 -6% |
| Idle Maximum * (dB) | 25.1 | 27 -8% | 27 -8% | 25.4 -1% | 26.4 -5% | 26.5 -6% |
| Load Average * (dB) | 41 | 46 -12% | 40.7 1% | 25.4 38% | 37.8 8% | 32.6 20% |
| Witcher 3 ultra * (dB) | 38.6 | 44.6 -16% | 41.4 -7% | |||
| Load Maximum * (dB) | 38.7 | 46.6 -20% | 40.7 -5% | 44.8 -16% | 48.8 -26% | 35.5 8% |
* ... smaller is better
Noise level
| Idle |
| 25.1 / 25.1 / 25.1 dB(A) |
| Load |
| 41 / 38.7 dB(A) |
 | ||
30 dB silent 40 dB(A) audible 50 dB(A) loud |
||
min: | ||
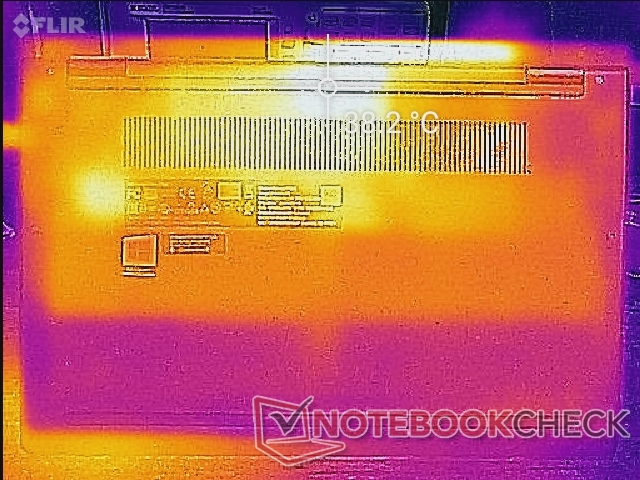
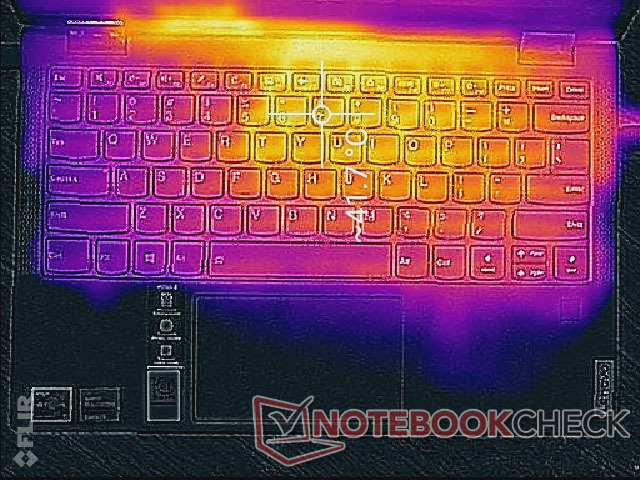
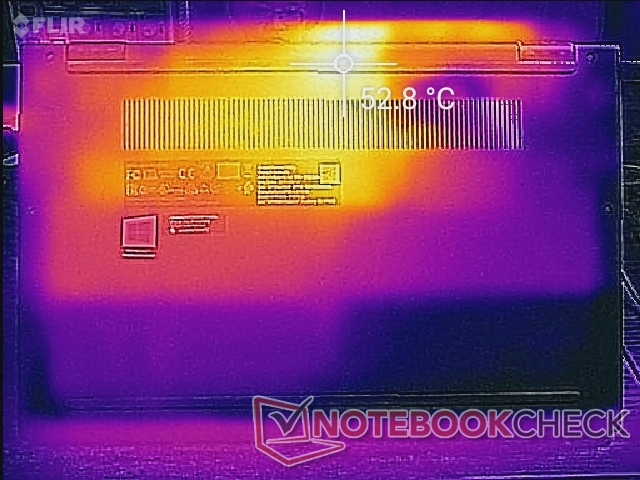
Temperature
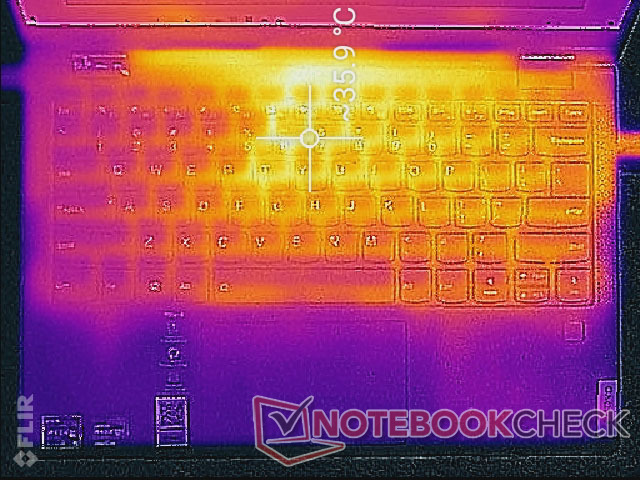
Surface temperatures remain cool on most of the laptop even when under heavy loads. Only two small hot spots on the top and bottom can become very warm at up to 41 C to 53 C, but these areas are thankfully far away from the palm rests and most keys. Other models like the Samsung Galaxy Book Pro 360 13 tend to have cooler hot spots but warmer average temperatures.
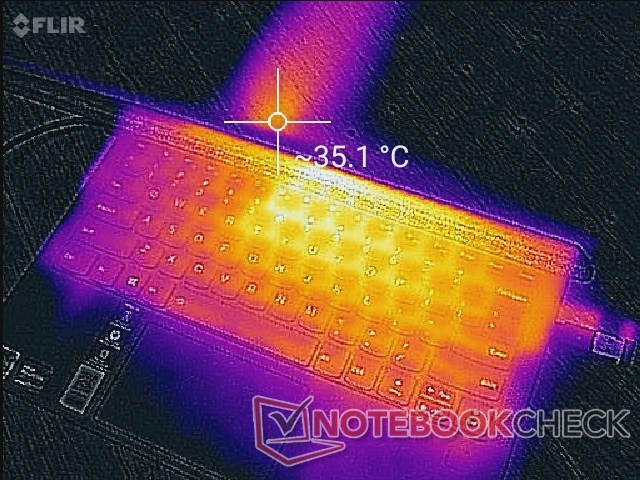
(±) The maximum temperature on the upper side is 41.6 °C / 107 F, compared to the average of 35.4 °C / 96 F, ranging from 19.6 to 60 °C for the class Convertible.
(-) The bottom heats up to a maximum of 52.2 °C / 126 F, compared to the average of 36.9 °C / 98 F
(+) In idle usage, the average temperature for the upper side is 30.8 °C / 87 F, compared to the device average of 30.3 °C / 87 F.
(+) The palmrests and touchpad are cooler than skin temperature with a maximum of 27.6 °C / 81.7 F and are therefore cool to the touch.
(±) The average temperature of the palmrest area of similar devices was 28 °C / 82.4 F (+0.4 °C / 0.7 F).
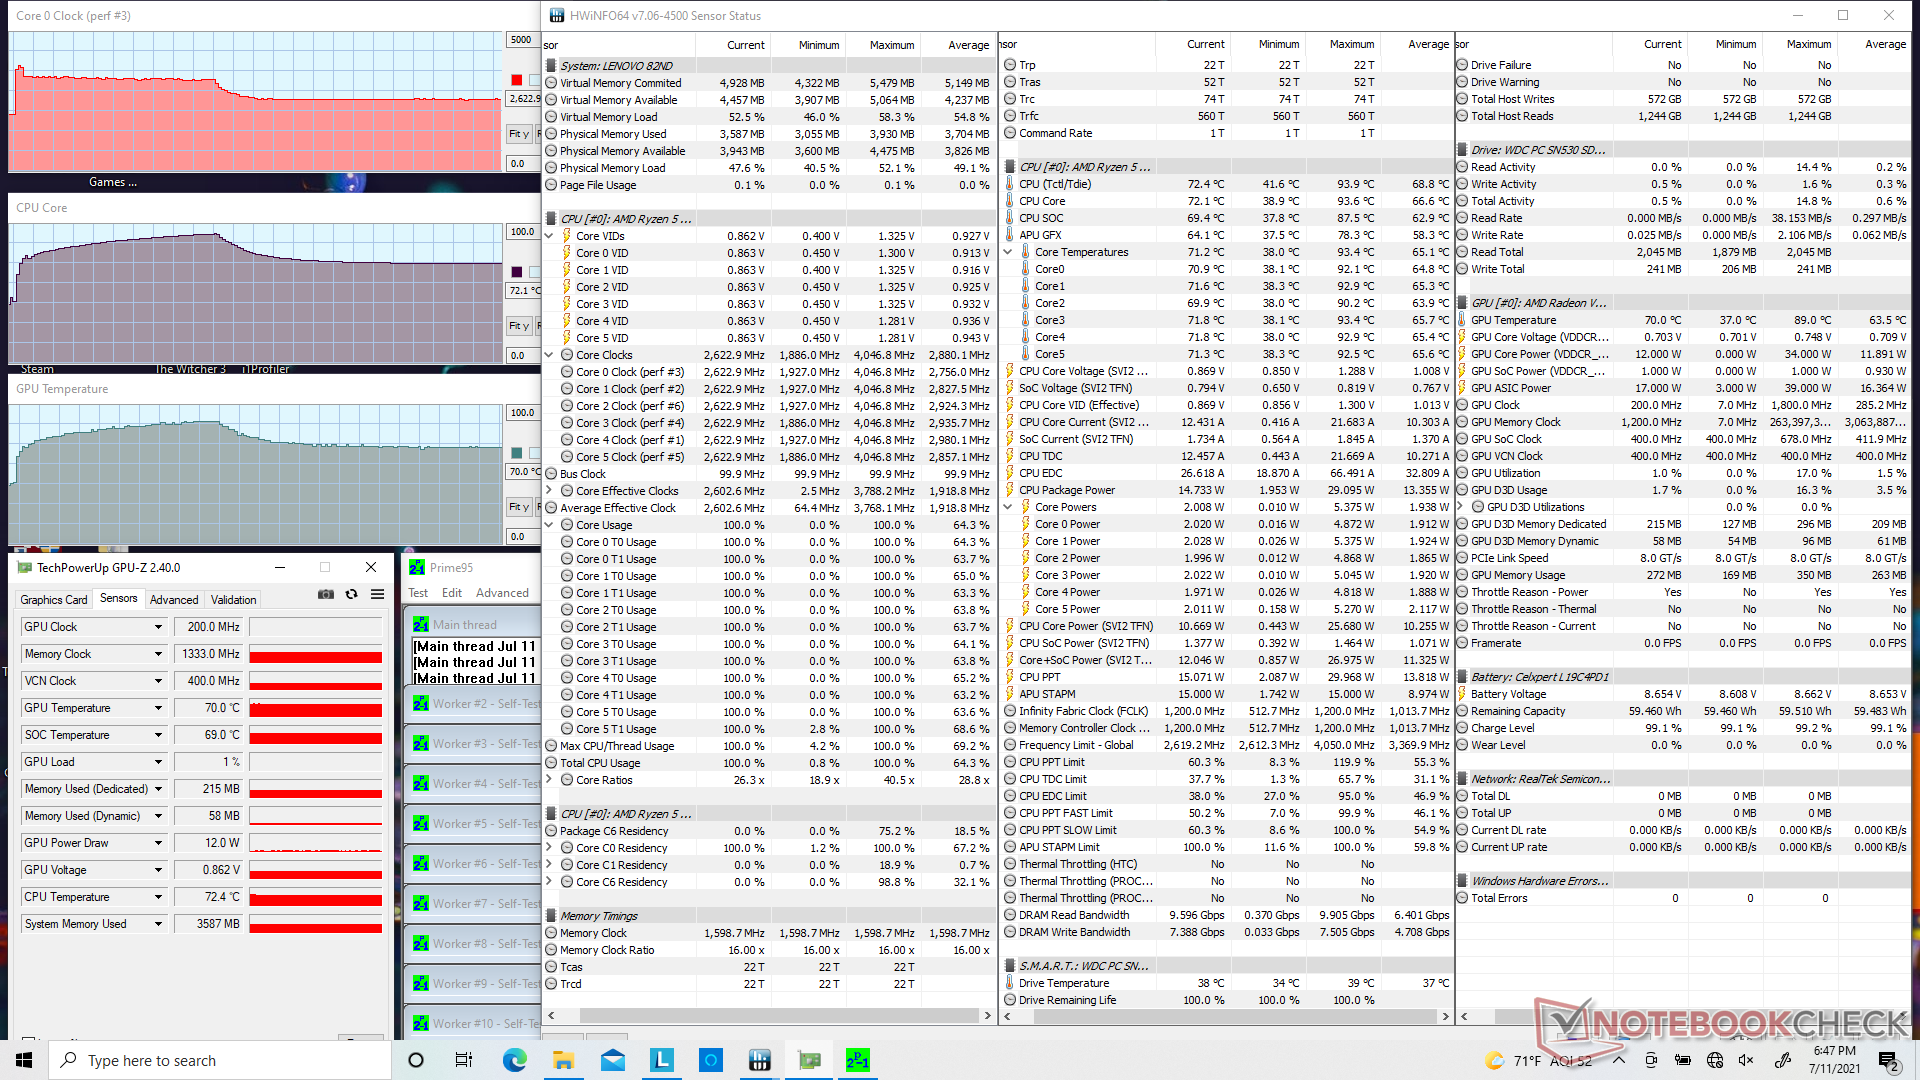
Stress Test
When stressed with Prime95, the CPU would boost to 3.9 GHz for the first couple of seconds before falling to 3.4 GHz for the next several minutes until core temperature reaches 93 C. Clock rates would then fall and stabilize at 2.6 GHz in order to maintain a cooler core temperature of 72 C.
Running Witcher 3 is more representative of real-world stress. The AMD processor would stabilize at 67 C compared to 65 C on the MSI Summit E13 Flip when under similar conditions.
Running on battery power will reduce performance slightly. A 3DMark 11 test on batteries would return Physics and Graphics scores of 9921 and 5050 points, respectively, compared to 9793 and 5220 points when on mains.


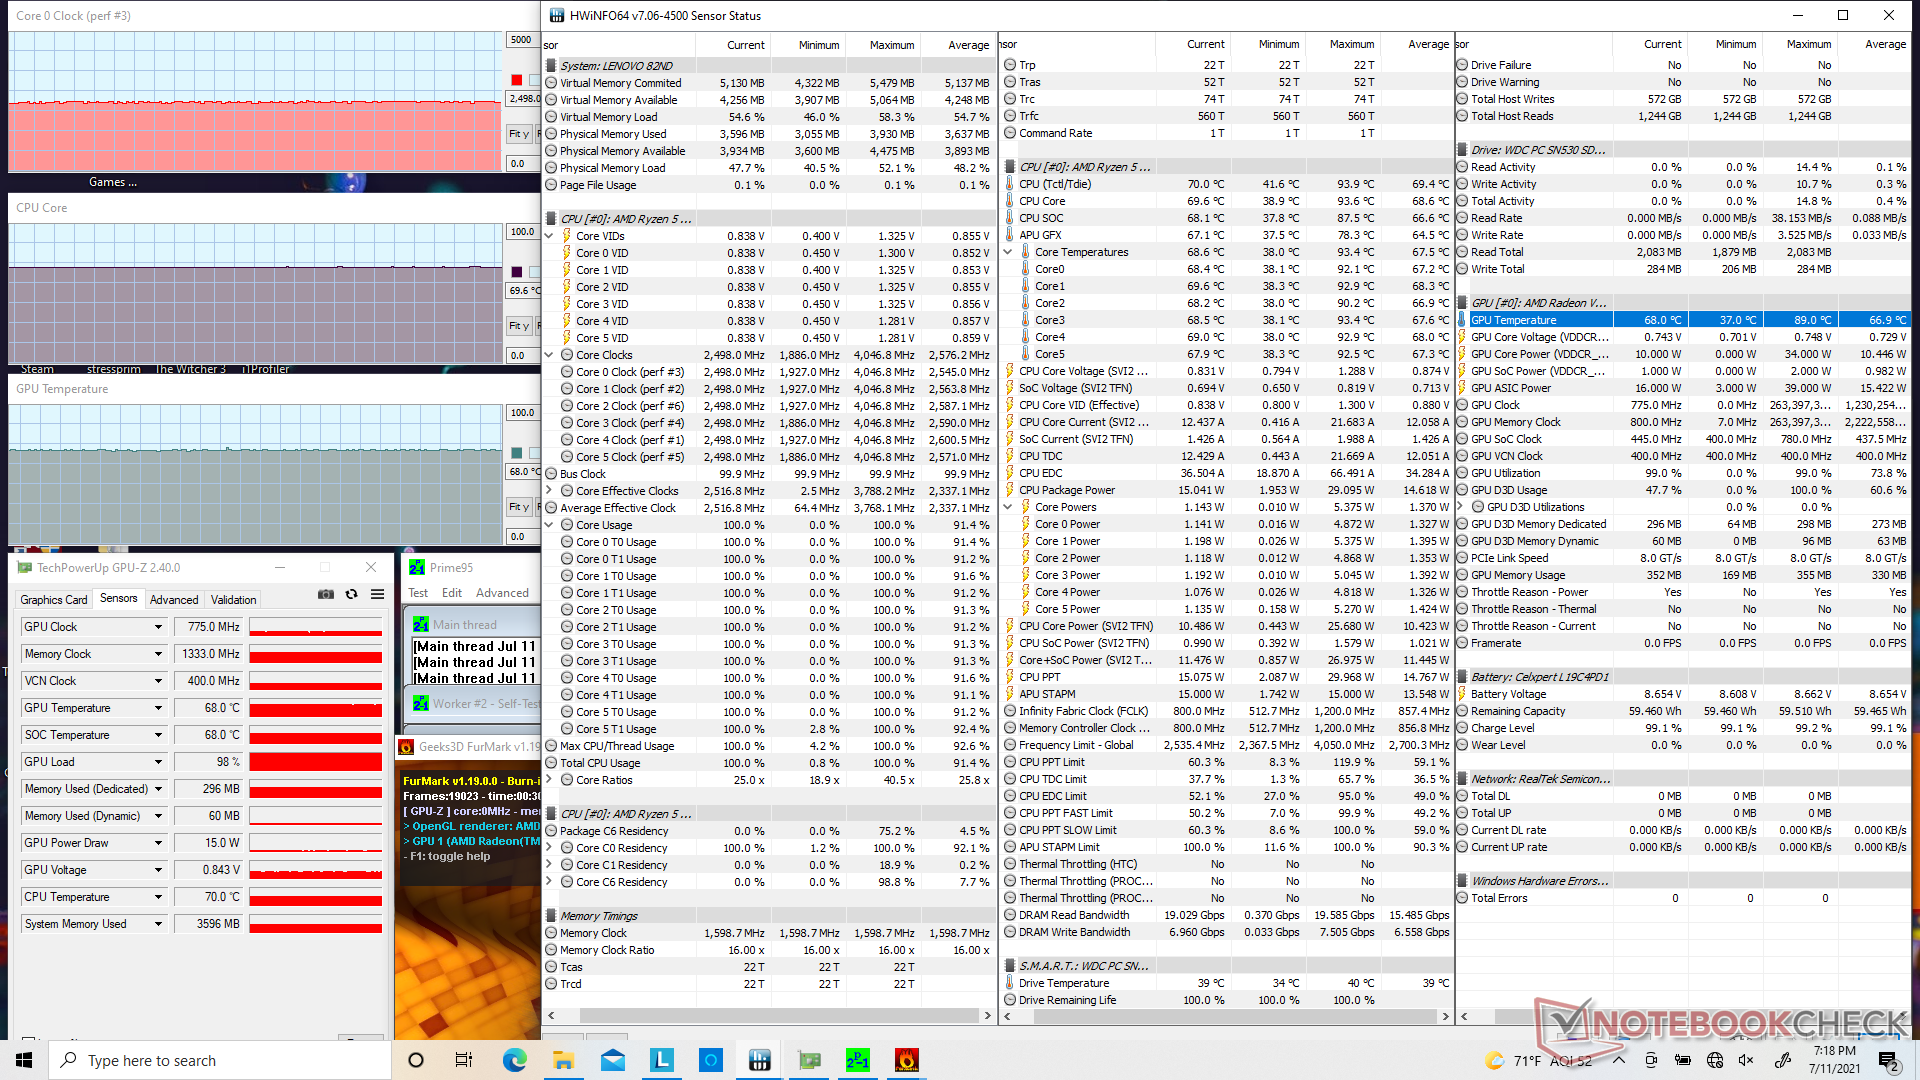
| CPU Clock (GHz) | GPU Clock (MHz) | Average CPU Temperature (°C) | |
| System Idle | -- | -- | 39 |
| Prime95 Stress | 2.6 | -- | 72 |
| Prime95 + FurMark Stress | 2.5 | 775 | 69 |
| Witcher 3 Stress | 1.4 | 1400 | 67 |
Speakers — Good For Video Calls, Bad For Multimedia

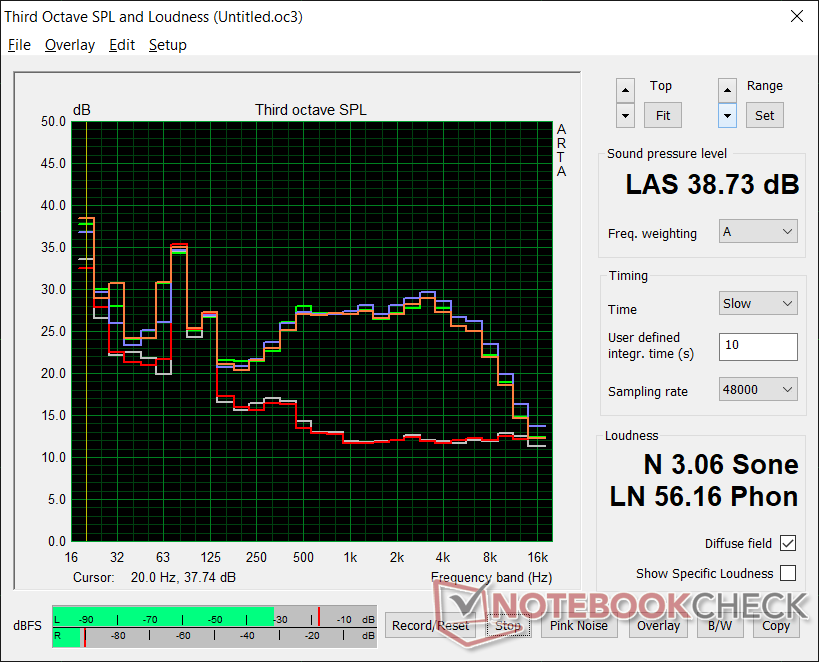
Audio quality from the internal speakers are below average due to the poor bass reproduction. Music and video sound tinny for a clear but unsatisfying audio experience no matter the volume setting. The speakers work well for voice calls, but earphones are recommended for any sort of multimedia playback.
Lenovo Yoga 6 13 82ND0009US audio analysis
(±) | speaker loudness is average but good (78.3 dB)
Bass 100 - 315 Hz
(-) | nearly no bass - on average 17.6% lower than median
(±) | linearity of bass is average (9.7% delta to prev. frequency)
Mids 400 - 2000 Hz
(+) | balanced mids - only 4% away from median
(+) | mids are linear (3.4% delta to prev. frequency)
Highs 2 - 16 kHz
(±) | higher highs - on average 6.5% higher than median
(+) | highs are linear (5.4% delta to prev. frequency)
Overall 100 - 16.000 Hz
(±) | linearity of overall sound is average (19.4% difference to median)
Compared to same class
» 47% of all tested devices in this class were better, 6% similar, 47% worse
» The best had a delta of 6%, average was 20%, worst was 57%
Compared to all devices tested
» 48% of all tested devices were better, 7% similar, 45% worse
» The best had a delta of 4%, average was 23%, worst was 134%
Apple MacBook 12 (Early 2016) 1.1 GHz audio analysis
(+) | speakers can play relatively loud (83.6 dB)
Bass 100 - 315 Hz
(±) | reduced bass - on average 11.3% lower than median
(±) | linearity of bass is average (14.2% delta to prev. frequency)
Mids 400 - 2000 Hz
(+) | balanced mids - only 2.4% away from median
(+) | mids are linear (5.5% delta to prev. frequency)
Highs 2 - 16 kHz
(+) | balanced highs - only 2% away from median
(+) | highs are linear (4.5% delta to prev. frequency)
Overall 100 - 16.000 Hz
(+) | overall sound is linear (10.2% difference to median)
Compared to same class
» 7% of all tested devices in this class were better, 2% similar, 90% worse
» The best had a delta of 5%, average was 18%, worst was 53%
Compared to all devices tested
» 5% of all tested devices were better, 1% similar, 94% worse
» The best had a delta of 4%, average was 23%, worst was 134%
Energy Management — Low Consumption For Long Battery Life
Power Consumption
Idling on desktop consumes just 5 W to 7 W depending on the brightness setting compared to 5 W to 12 W on the Galaxy Book Pro 360 13 due to the latter's AMOLED touchscreen.
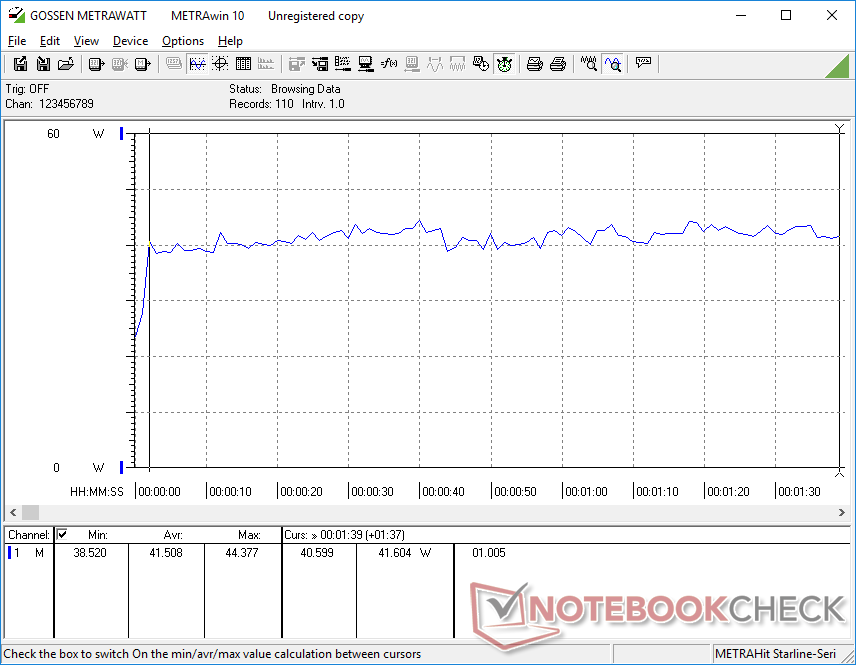
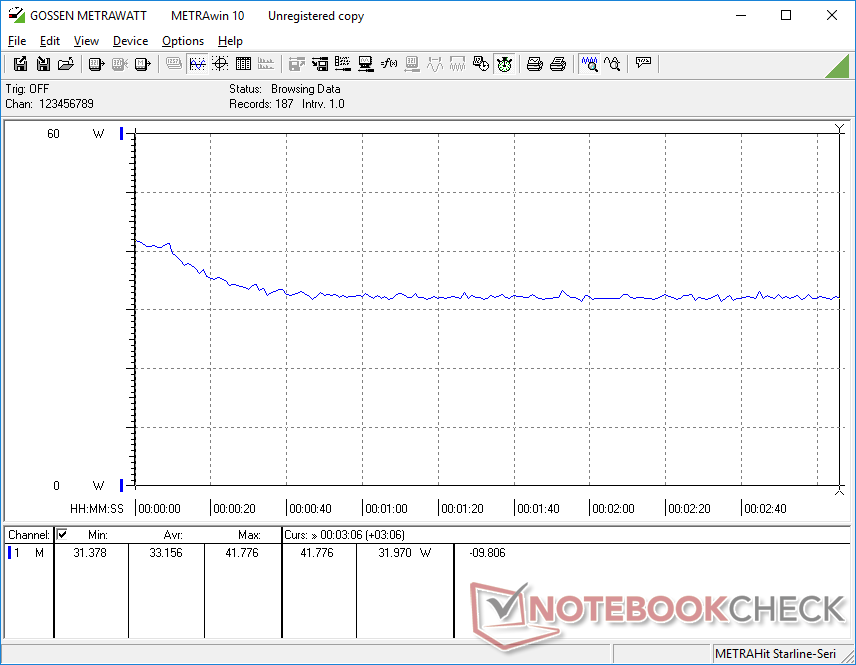
Running games will draw between 33 W and 42 W whereas the Summit E13 Flip Evo would draw between 47 W and 52 W under similar conditions. Certain intel Tiger Lake-U machines may draw more power when gaming, but they tend to offer slightly faster performance as well.
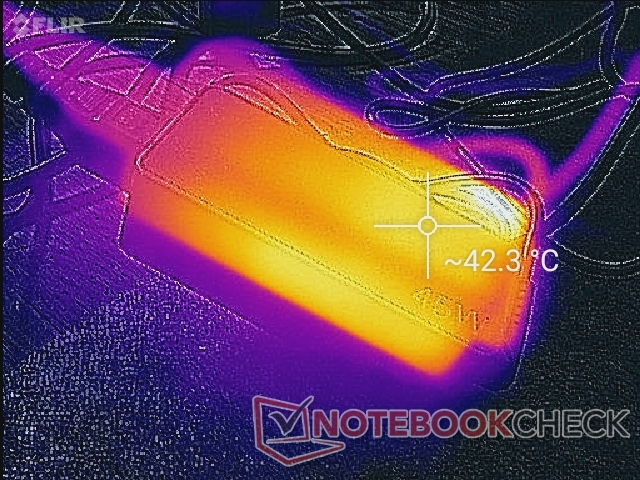
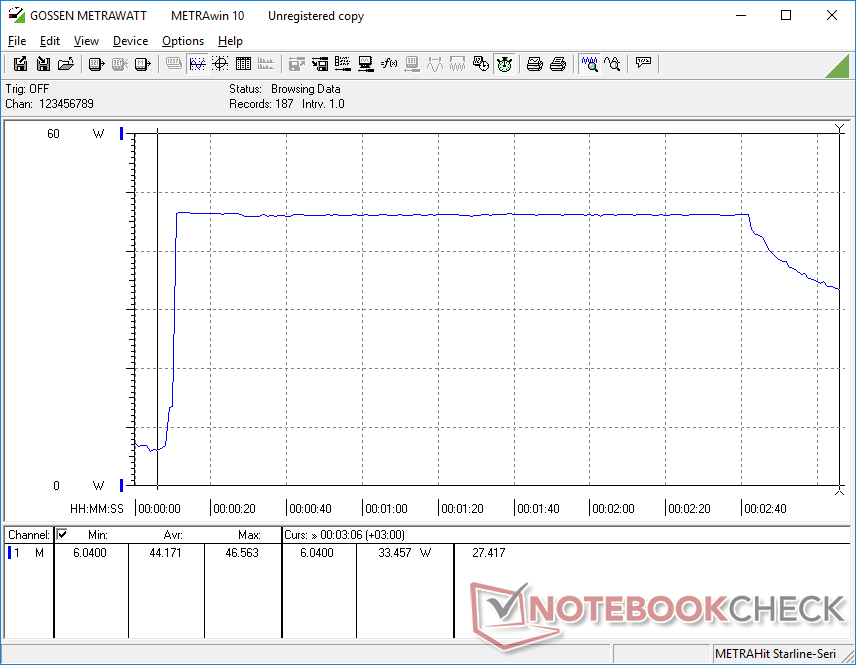
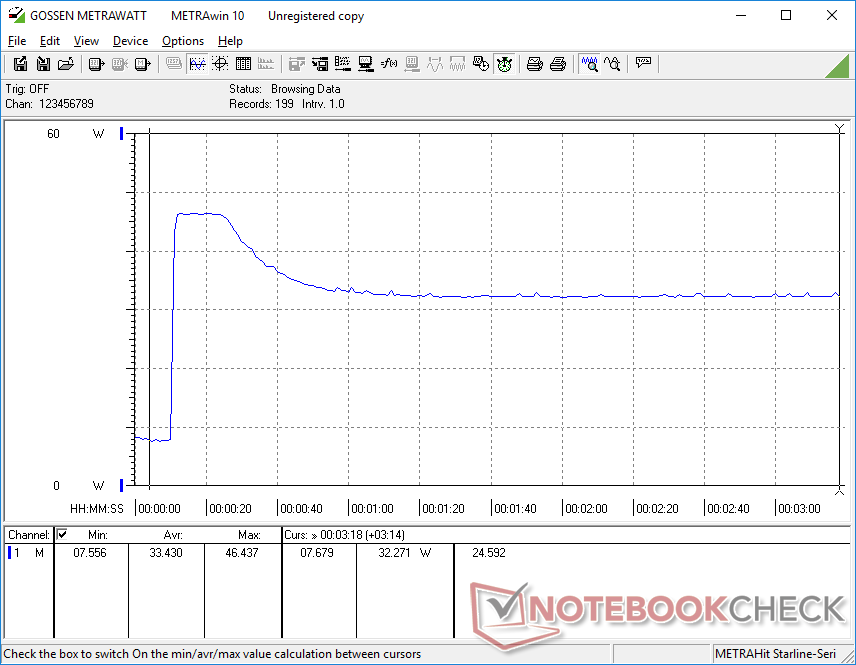
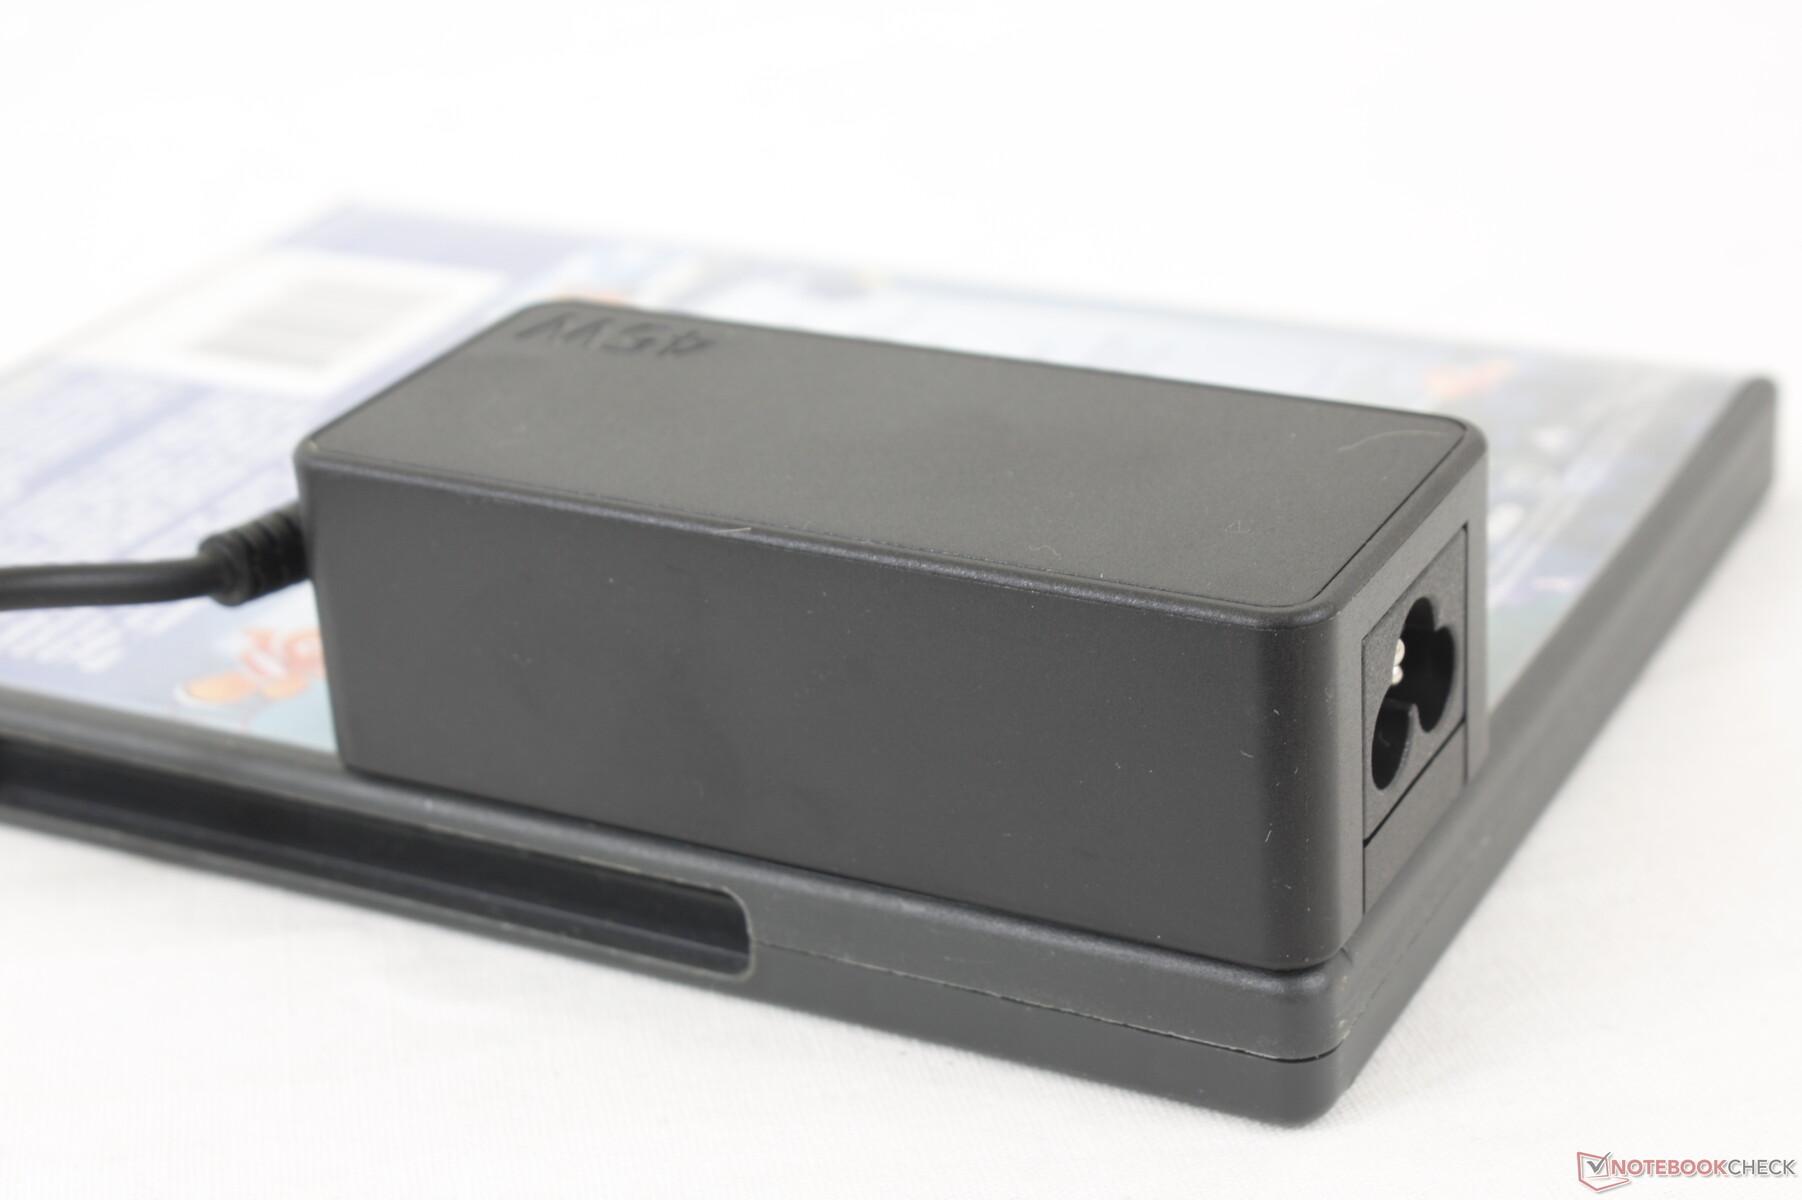
We're able to record a temporary maximum draw of 46.5 W from the small (~9.4 x 4.1 x 3 cm) 45 W AC adapter when running extreme loads.
| Off / Standby | |
| Idle | |
| Load |
|
Key:
min: | |
| Lenovo Yoga 6 13 82ND0009US R5 5500U, Vega 7, WDC PC SN530 SDBPMPZ-265G, IPS, 1920x1080, 13.3" | Asus ZenBook Flip 13 UX363EA-HP069T i7-1165G7, Iris Xe G7 96EUs, WDC PC SN730 SDBPNTY-1T00, OLED, 1920x1080, 13.3" | Samsung Galaxy Book Pro 360 13 i5-1135G7, Iris Xe G7 80EUs, Samsung PM991 MZVLQ256HAJD, AMOLED, 1920x1080, 13.2" | HP Spectre x360 13-aw2003dx i5-1135G7, Iris Xe G7 80EUs, Intel Optane Memory H10 with Solid State Storage 32GB + 512GB HBRPEKNX0202A(L/H), OLED, 3840x2160, 13.3" | MSI Summit E13 Flip Evo A11MT i7-1185G7, Iris Xe G7 96EUs, Phison 1TB SM2801T24GKBB4S-E162, IPS, 1920x1200, 13.4" | Lenovo IdeaPad Flex 5 CB 13IML05 82B80010GE i5-10210U, UHD Graphics 620, Samsung PM991 MZALQ128HBHQ-000L2, IPS, 1920x1080, 13.3" | |
|---|---|---|---|---|---|---|
| Power Consumption | 3% | -5% | -23% | -27% | 23% | |
| Idle Minimum * (Watt) | 5 | 4.4 12% | 5 -0% | 5.7 -14% | 4.8 4% | 3.7 26% |
| Idle Average * (Watt) | 6.3 | 7.4 -17% | 6 5% | 8.4 -33% | 8.4 -33% | 5.5 13% |
| Idle Maximum * (Watt) | 6.9 | 11.3 -64% | 11.7 -70% | 8.8 -28% | 8.6 -25% | 6.5 6% |
| Load Average * (Watt) | 41.5 | 22 47% | 28 33% | 38.9 6% | 47.1 -13% | 27 35% |
| Witcher 3 ultra * (Watt) | 33.2 | 22.8 31% | 28.3 15% | 40.5 -22% | 51.6 -55% | |
| Load Maximum * (Watt) | 46.5 | 42.5 9% | 53 -14% | 66.9 -44% | 65.9 -42% | 30.6 34% |
* ... smaller is better
Power Consumption Witcher 3 / Stresstest
Battery Life
The internal 60 Wh battery provides almost 13.5 hours of real-world WLAN use to be longer than expected for a 14-inch convertible. Charging from empty to full capacity takes just under 2 hours.
| Lenovo Yoga 6 13 82ND0009US R5 5500U, Vega 7, 60 Wh | Asus ZenBook Flip 13 UX363EA-HP069T i7-1165G7, Iris Xe G7 96EUs, 67 Wh | Samsung Galaxy Book Pro 360 13 i5-1135G7, Iris Xe G7 80EUs, 63 Wh | HP Spectre x360 13-aw2003dx i5-1135G7, Iris Xe G7 80EUs, 60 Wh | MSI Summit E13 Flip Evo A11MT i7-1185G7, Iris Xe G7 96EUs, 70 Wh | Lenovo IdeaPad Flex 5 CB 13IML05 82B80010GE i5-10210U, UHD Graphics 620, 51 Wh | |
|---|---|---|---|---|---|---|
| Battery runtime | 23% | 47% | -32% | -1% | -42% | |
| Reader / Idle (h) | 17.5 | 20.5 17% | 31.3 79% | 11.9 -32% | 21.1 21% | |
| WiFi v1.3 (h) | 13.2 | 10.7 -19% | 12.1 -8% | 6.1 -54% | 11.2 -15% | 7.6 -42% |
| Load (h) | 2 | 3.4 70% | 3.4 70% | 1.8 -10% | 1.8 -10% |
Pros
Cons
Verdict — Different Doesn't Mean Better
From an objective point of view, the outer lid fabric has its advantages and disadvantages when compared to the usual plastic or metal. Its rough texture hides fingerprints and other minor imperfections that can sometimes be easy to spot on most other laptops. On the other hand, the fabric is difficult to clean and it will readily absorb grease and dirt that will only accumulate over time.
The fabric is an interesting selling point that we recommend users to see and feel in person before purchasing. It's a breath of fresh air from the typical smooth metal, but it also risks going out of style.
Other notable strengths of the Yoga 6 13 include the fast AMD processor and color-accurate 1080p touchscreen which are comparable to Intel-powered Ultrabooks like the Asus ZenBook Flip 13 or HP Spectre x360 13. Unfortunately, the limited 8 GB of non-upgradeable RAM will likely turn off heavy multitaskers. This is a decent convertible subnotebook with strong colors and performance so long as you don't value certain features like IR, Thunderbolt or HDMI.
Price and availability
Lenovo Yoga 6 13 82ND0009US
- 07/12/2021 v7 (old)
Allen Ngo
Price comparison
