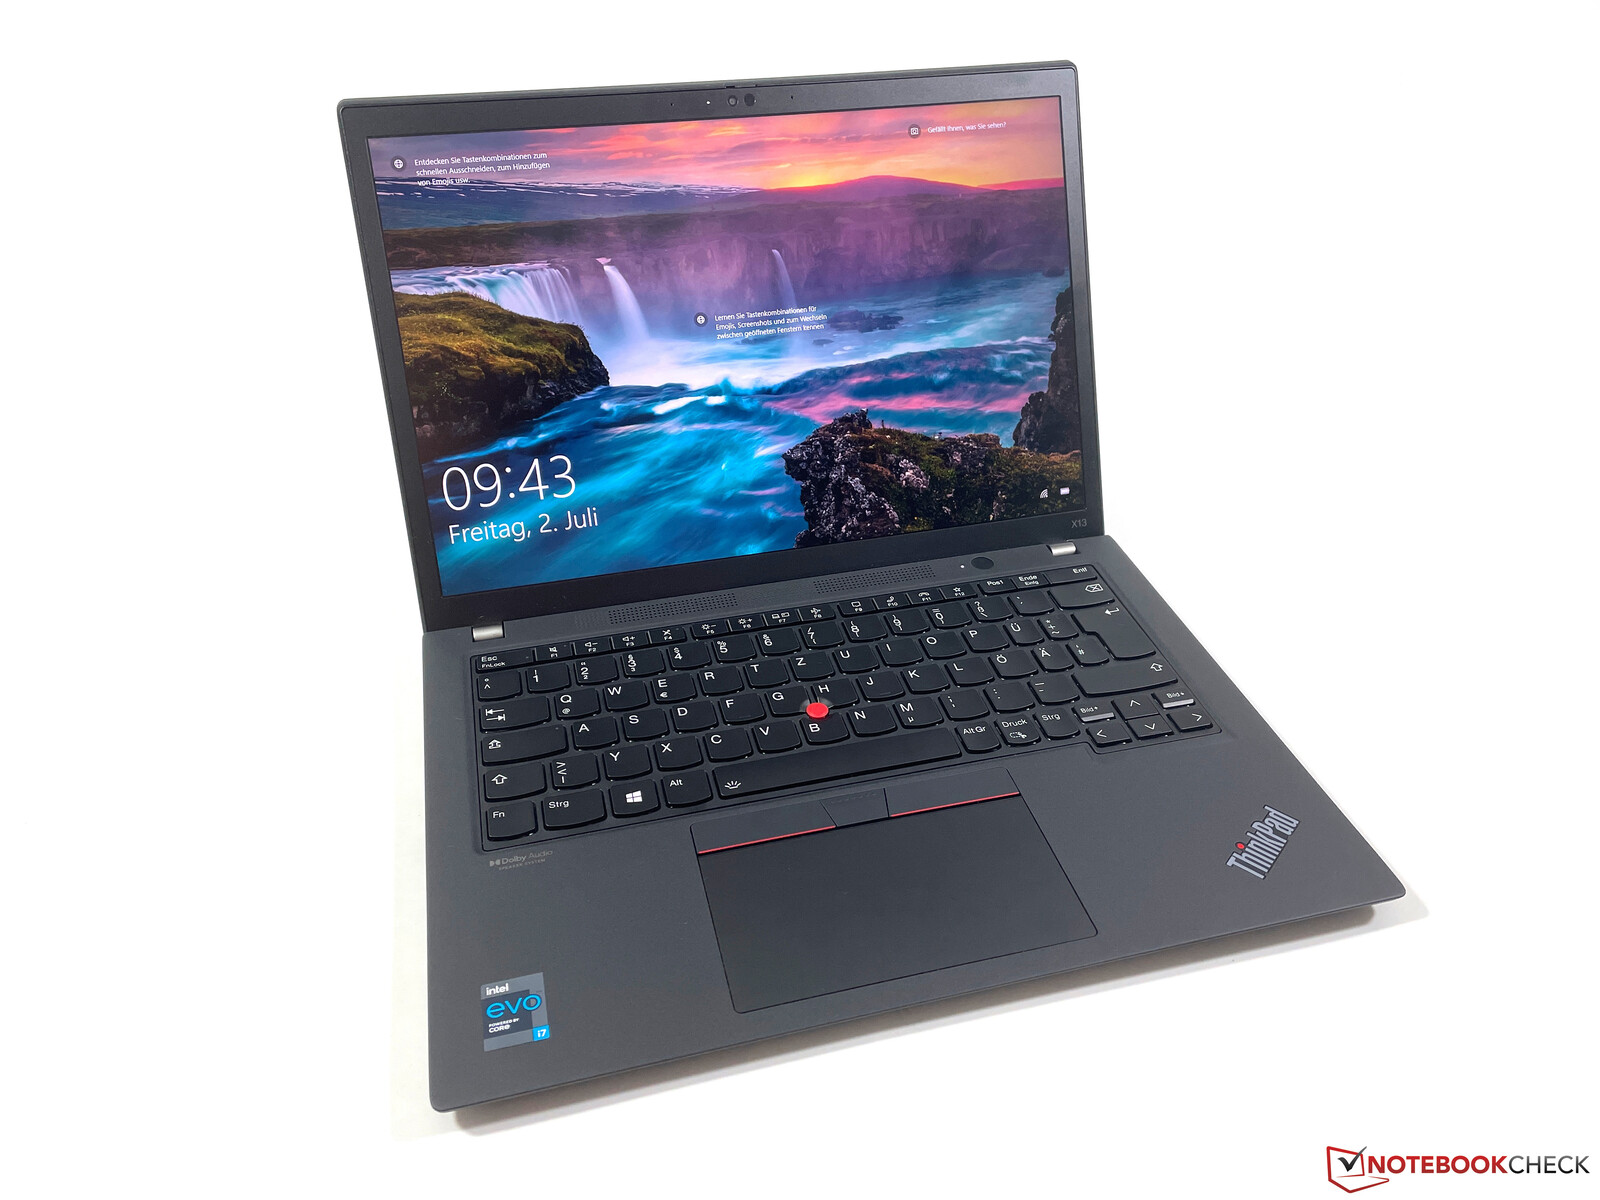
Lenovo ThinkPad X13 G2 Review: The perfect mobile companion?

Last year’s ThinkPad X13 did get a new designation, but it was still based on the old ThinkPad X390. The second generation of the ThinkPad X13 on the other hand is a major update with a new chassis, updated CPUs and, like the ThinkPad X1 models, new 16:10 aspect ratio screens.
The ThinkPad X13 G2 is once again available with Intel or AMD CPUs, but the Intel models are available first. Our test unit carries the designation 20WK0024GE and costs ~1900 Euros for regular customers or ~1800 Euros if you have access to Lenovo’s education program. The configuration includes a modern Tiger Lake i7 processor, 16 GB RAM, 512 GB PCIe-SSD storage, a 16:10 panel with 1920 x 1200 pixels, and a 5G modem.
We have not reviewed all immediate business rivals from Dell, Fujitsu or HP yet, so we will also use some consumer models as comparison devices for this review.
Possible Competitors
Rating | Date | Model | Weight | Height | Size | Resolution | Price |
|---|---|---|---|---|---|---|---|
| 89.3 % v7 (old) | 07 / 2021 | Lenovo ThinkPad X13 G2 20WK0024GE i7-1165G7, Iris Xe G7 96EUs | 1.3 kg | 18.2 mm | 13.30" | 1920x1200 | |
| 88.1 % v7 (old) | 10 / 2020 | Dell XPS 13 9310 Core i7 FHD i7-1165G7, Iris Xe G7 96EUs | 1.3 kg | 14.8 mm | 13.40" | 1920x1200 | |
| 91.1 % v7 (old) | 12 / 2020 | Apple MacBook Pro 13 Late 2020 M1 Entry (8 / 256 GB) M1, M1 8-Core GPU | 1.4 kg | 15.6 mm | 13.30" | 2560x1600 | |
| 88.7 % v7 (old) | 09 / 2020 | HP EliteBook 830 G7 i7-10810U, UHD Graphics 620 | 1.3 kg | 18.1 mm | 13.30" | 1920x1080 | |
| 87.8 % v7 (old) | 03 / 2021 | Huawei MateBook X Pro 2021 i7-1165G7, Iris Xe G7 96EUs | 1.3 kg | 14.6 mm | 13.90" | 3000x2000 |
Case - Lenovo with new materials
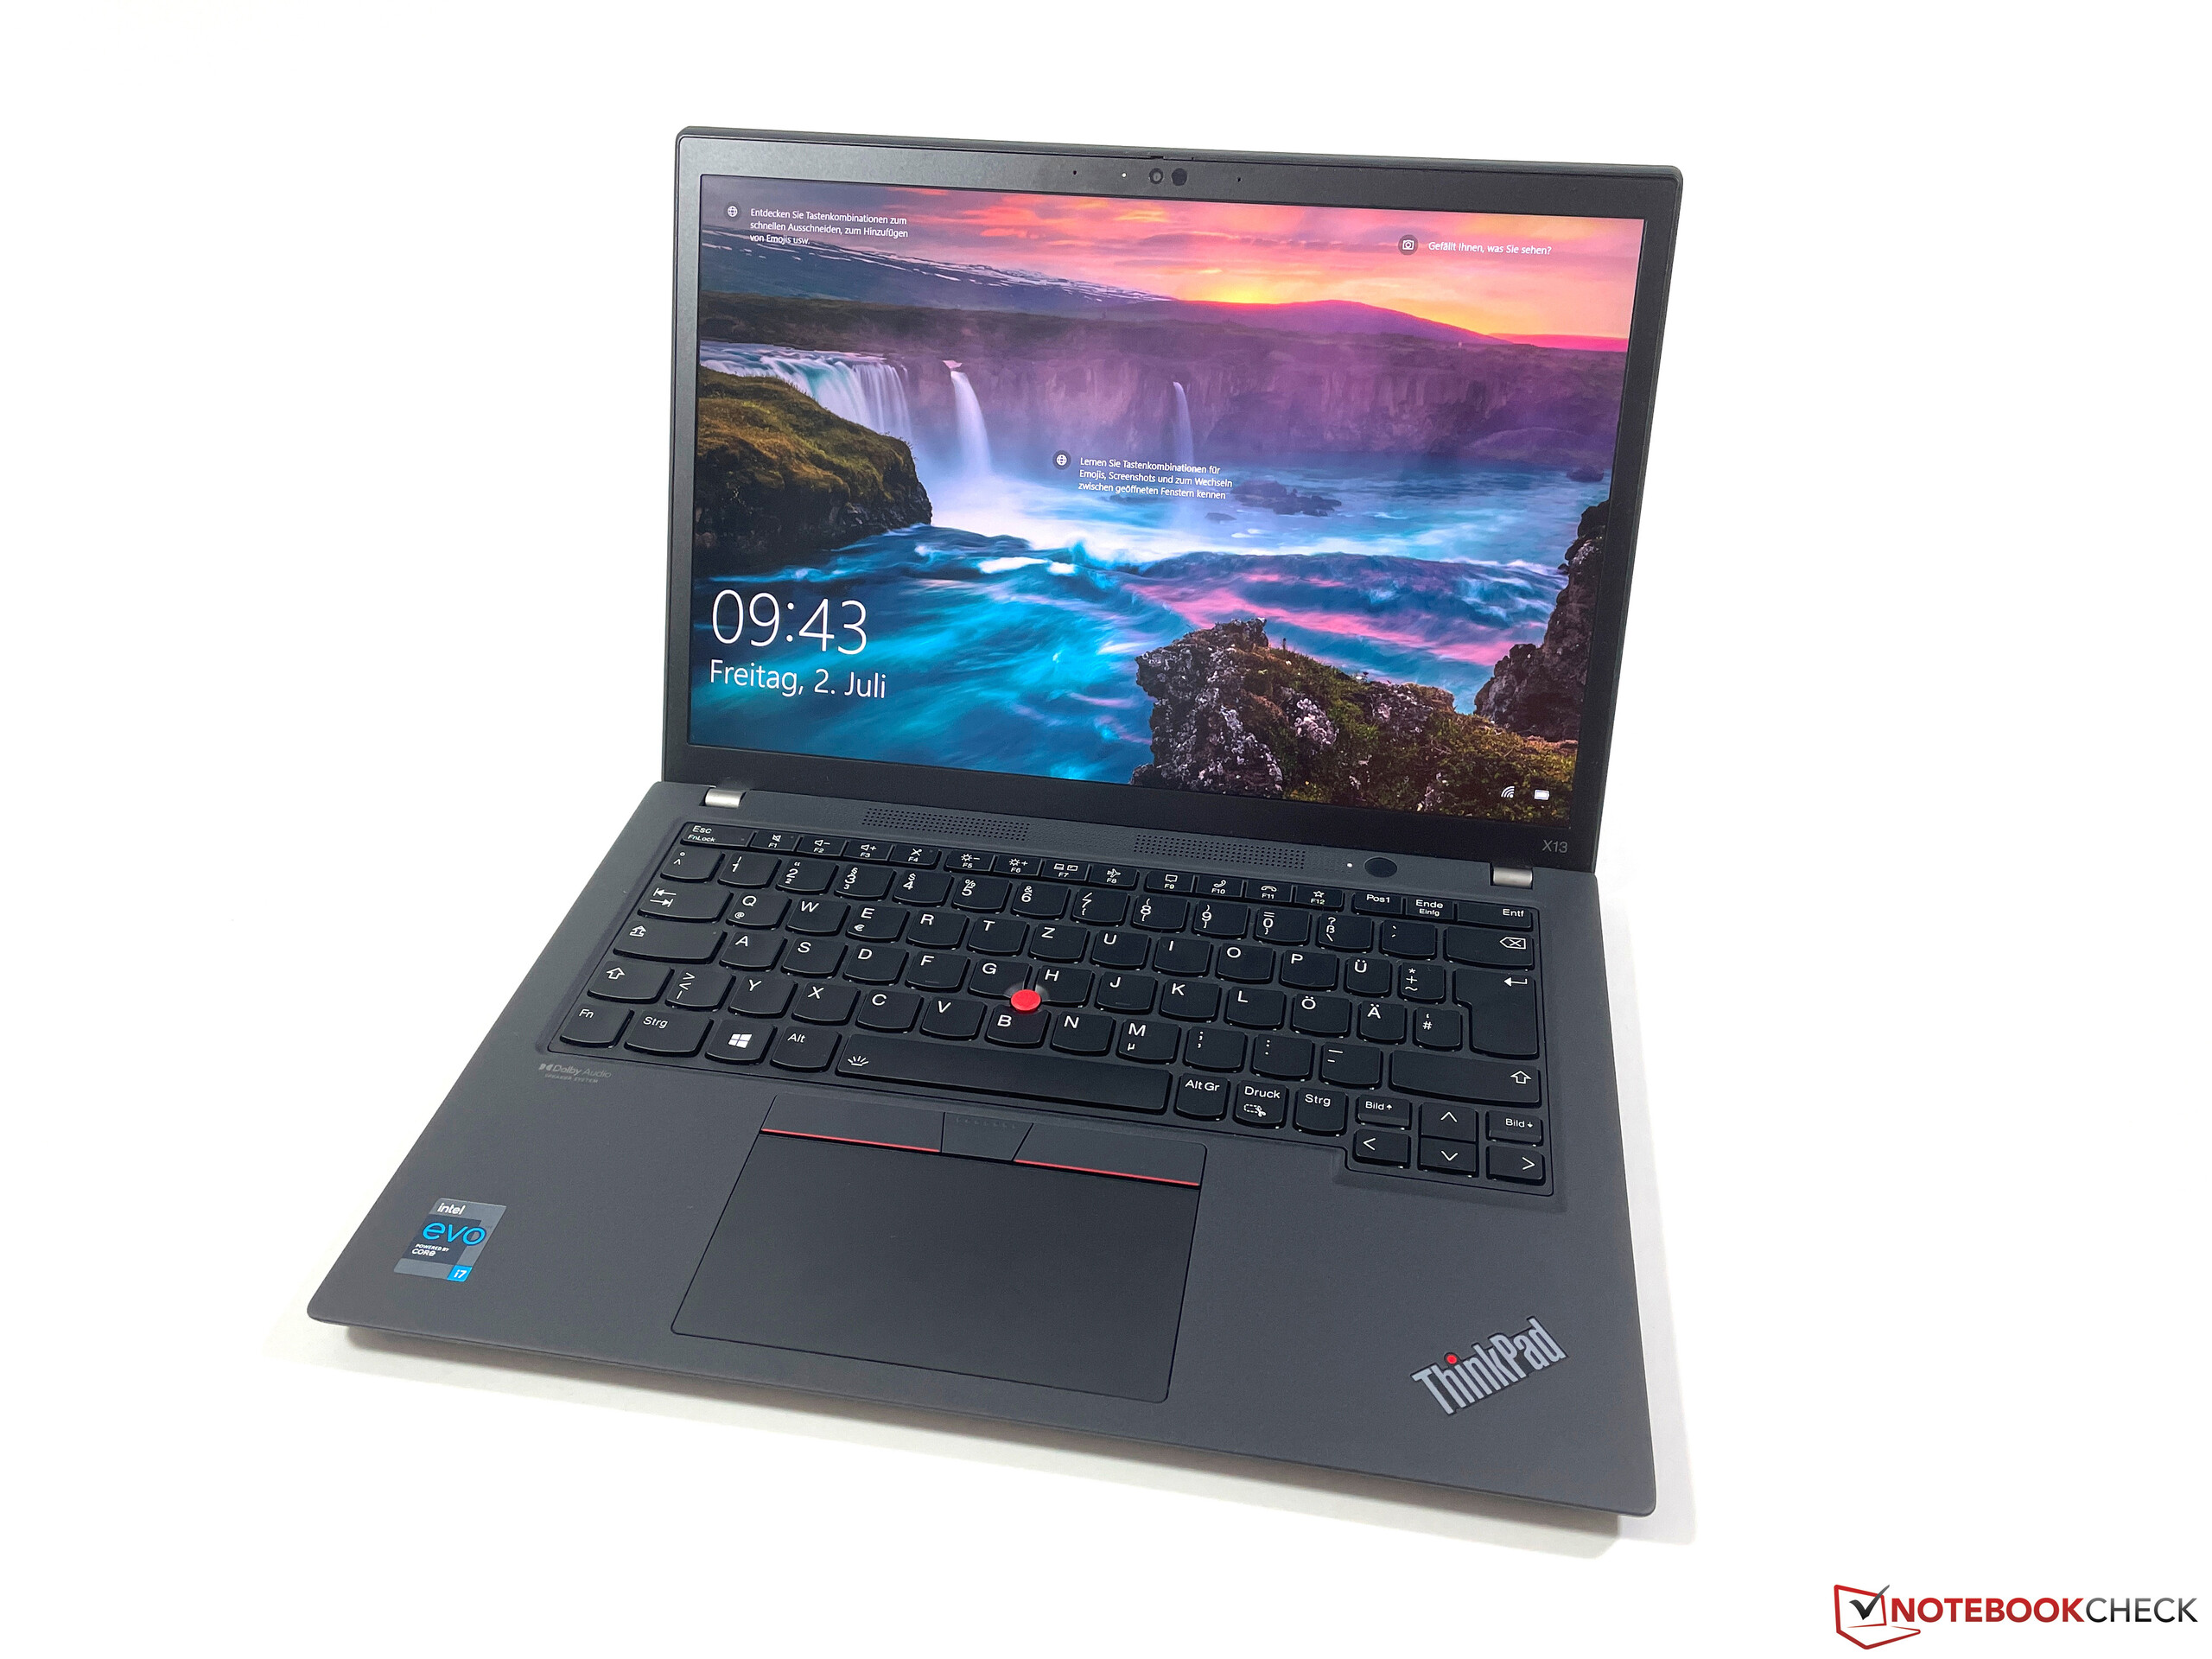
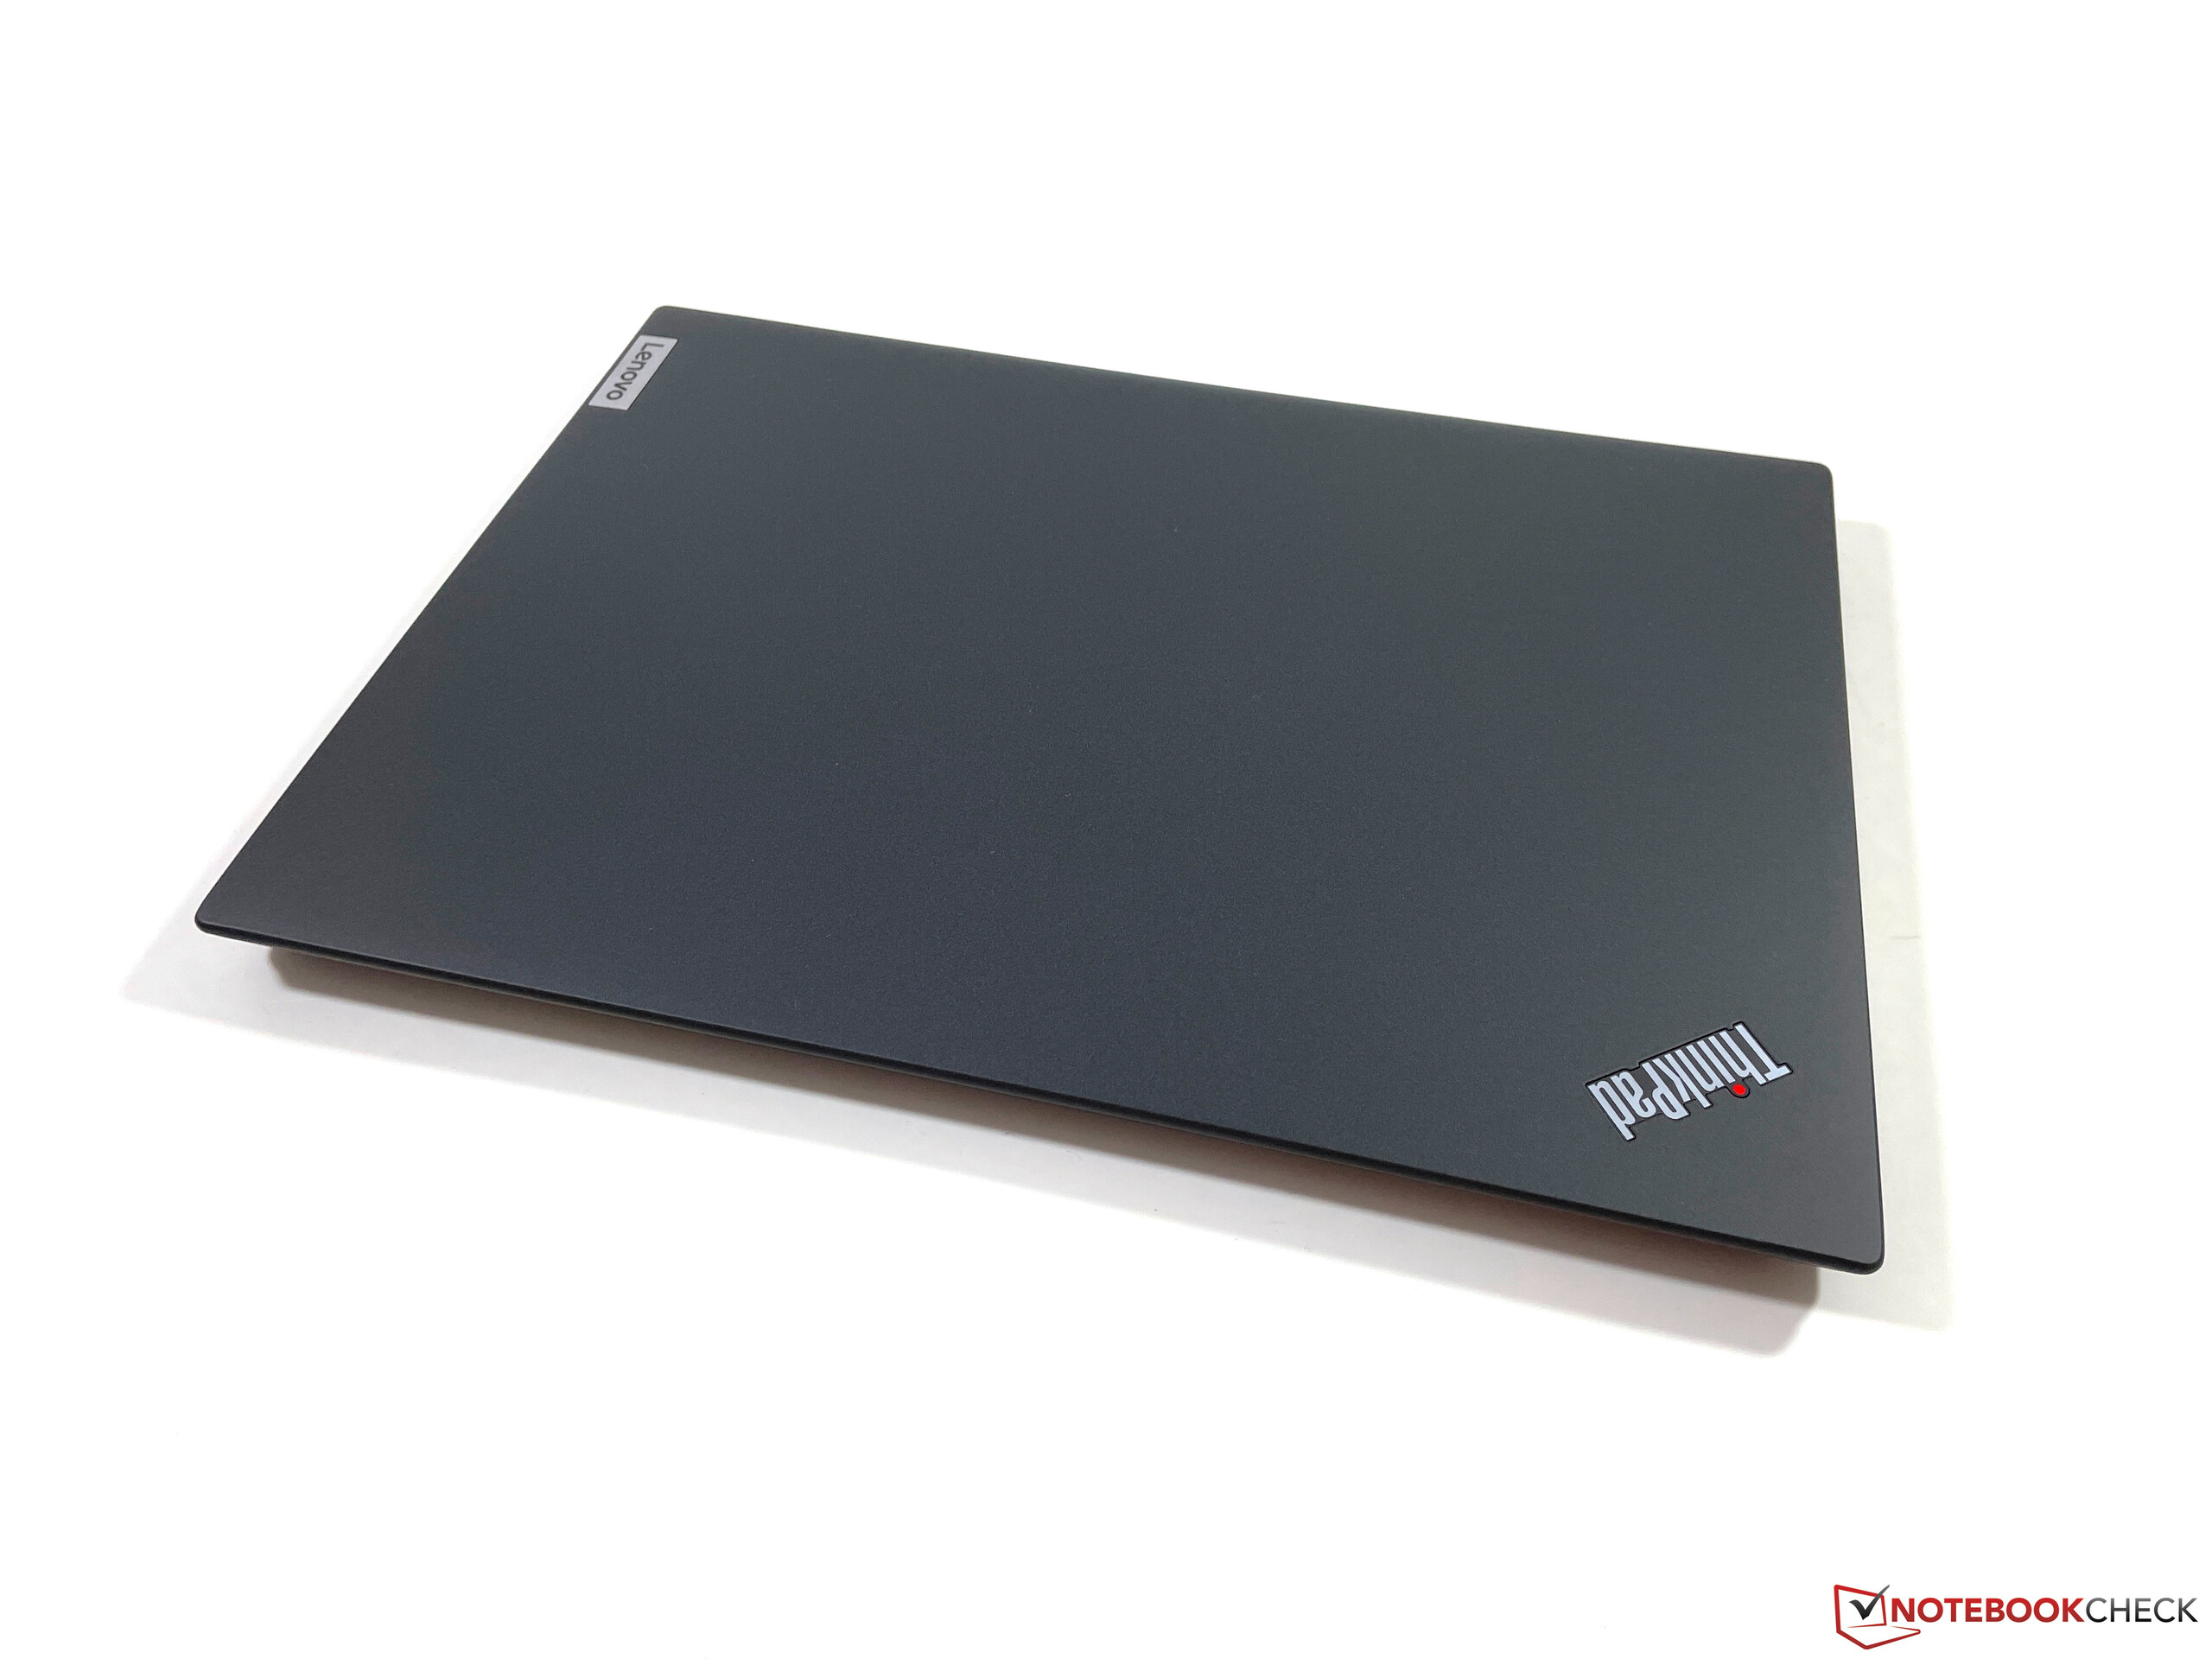
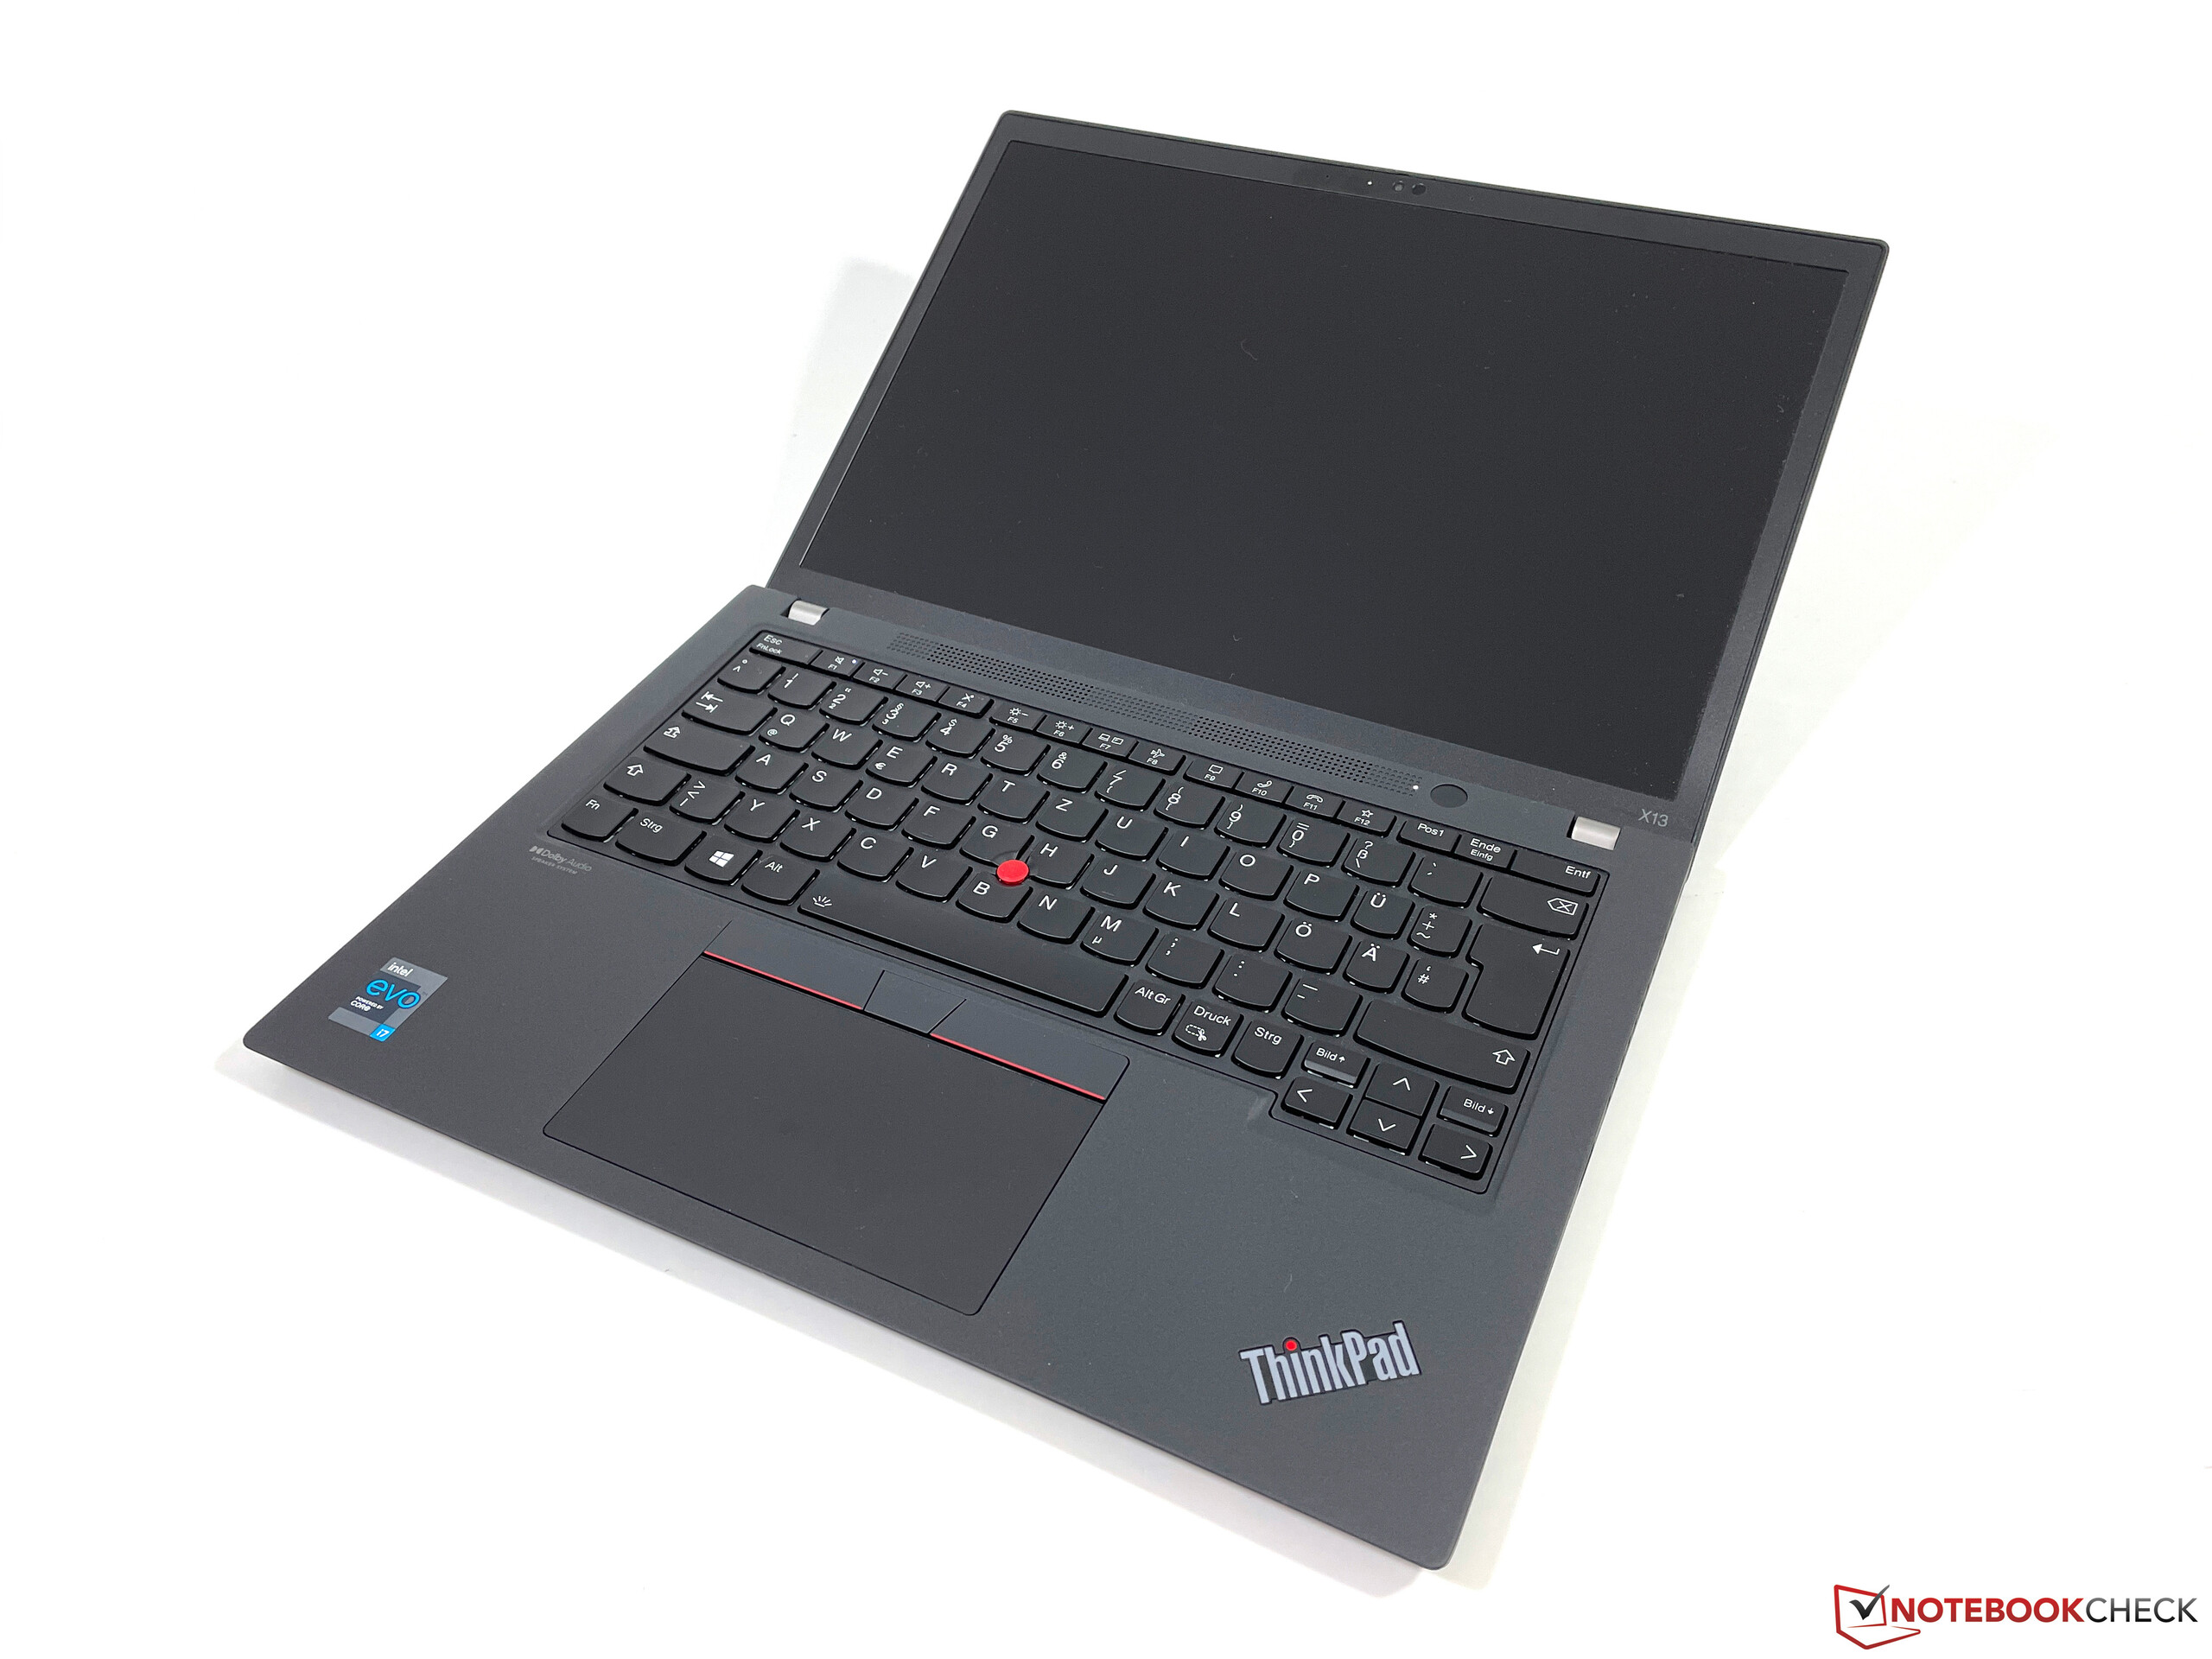
Lenovo uses a new chassis for the second generation. You will not notice a big difference from the outside, but you will immediately see the new 16:10 panel and the slim bezels on all sides when you open the lid, which appears much more modern. The color is another difference, because the black surfaces are now a bit brighter and there is a clearly visible contrast to the keyboard and the touchpad. You can also get the X13 G2 in silver (Storm Grey).
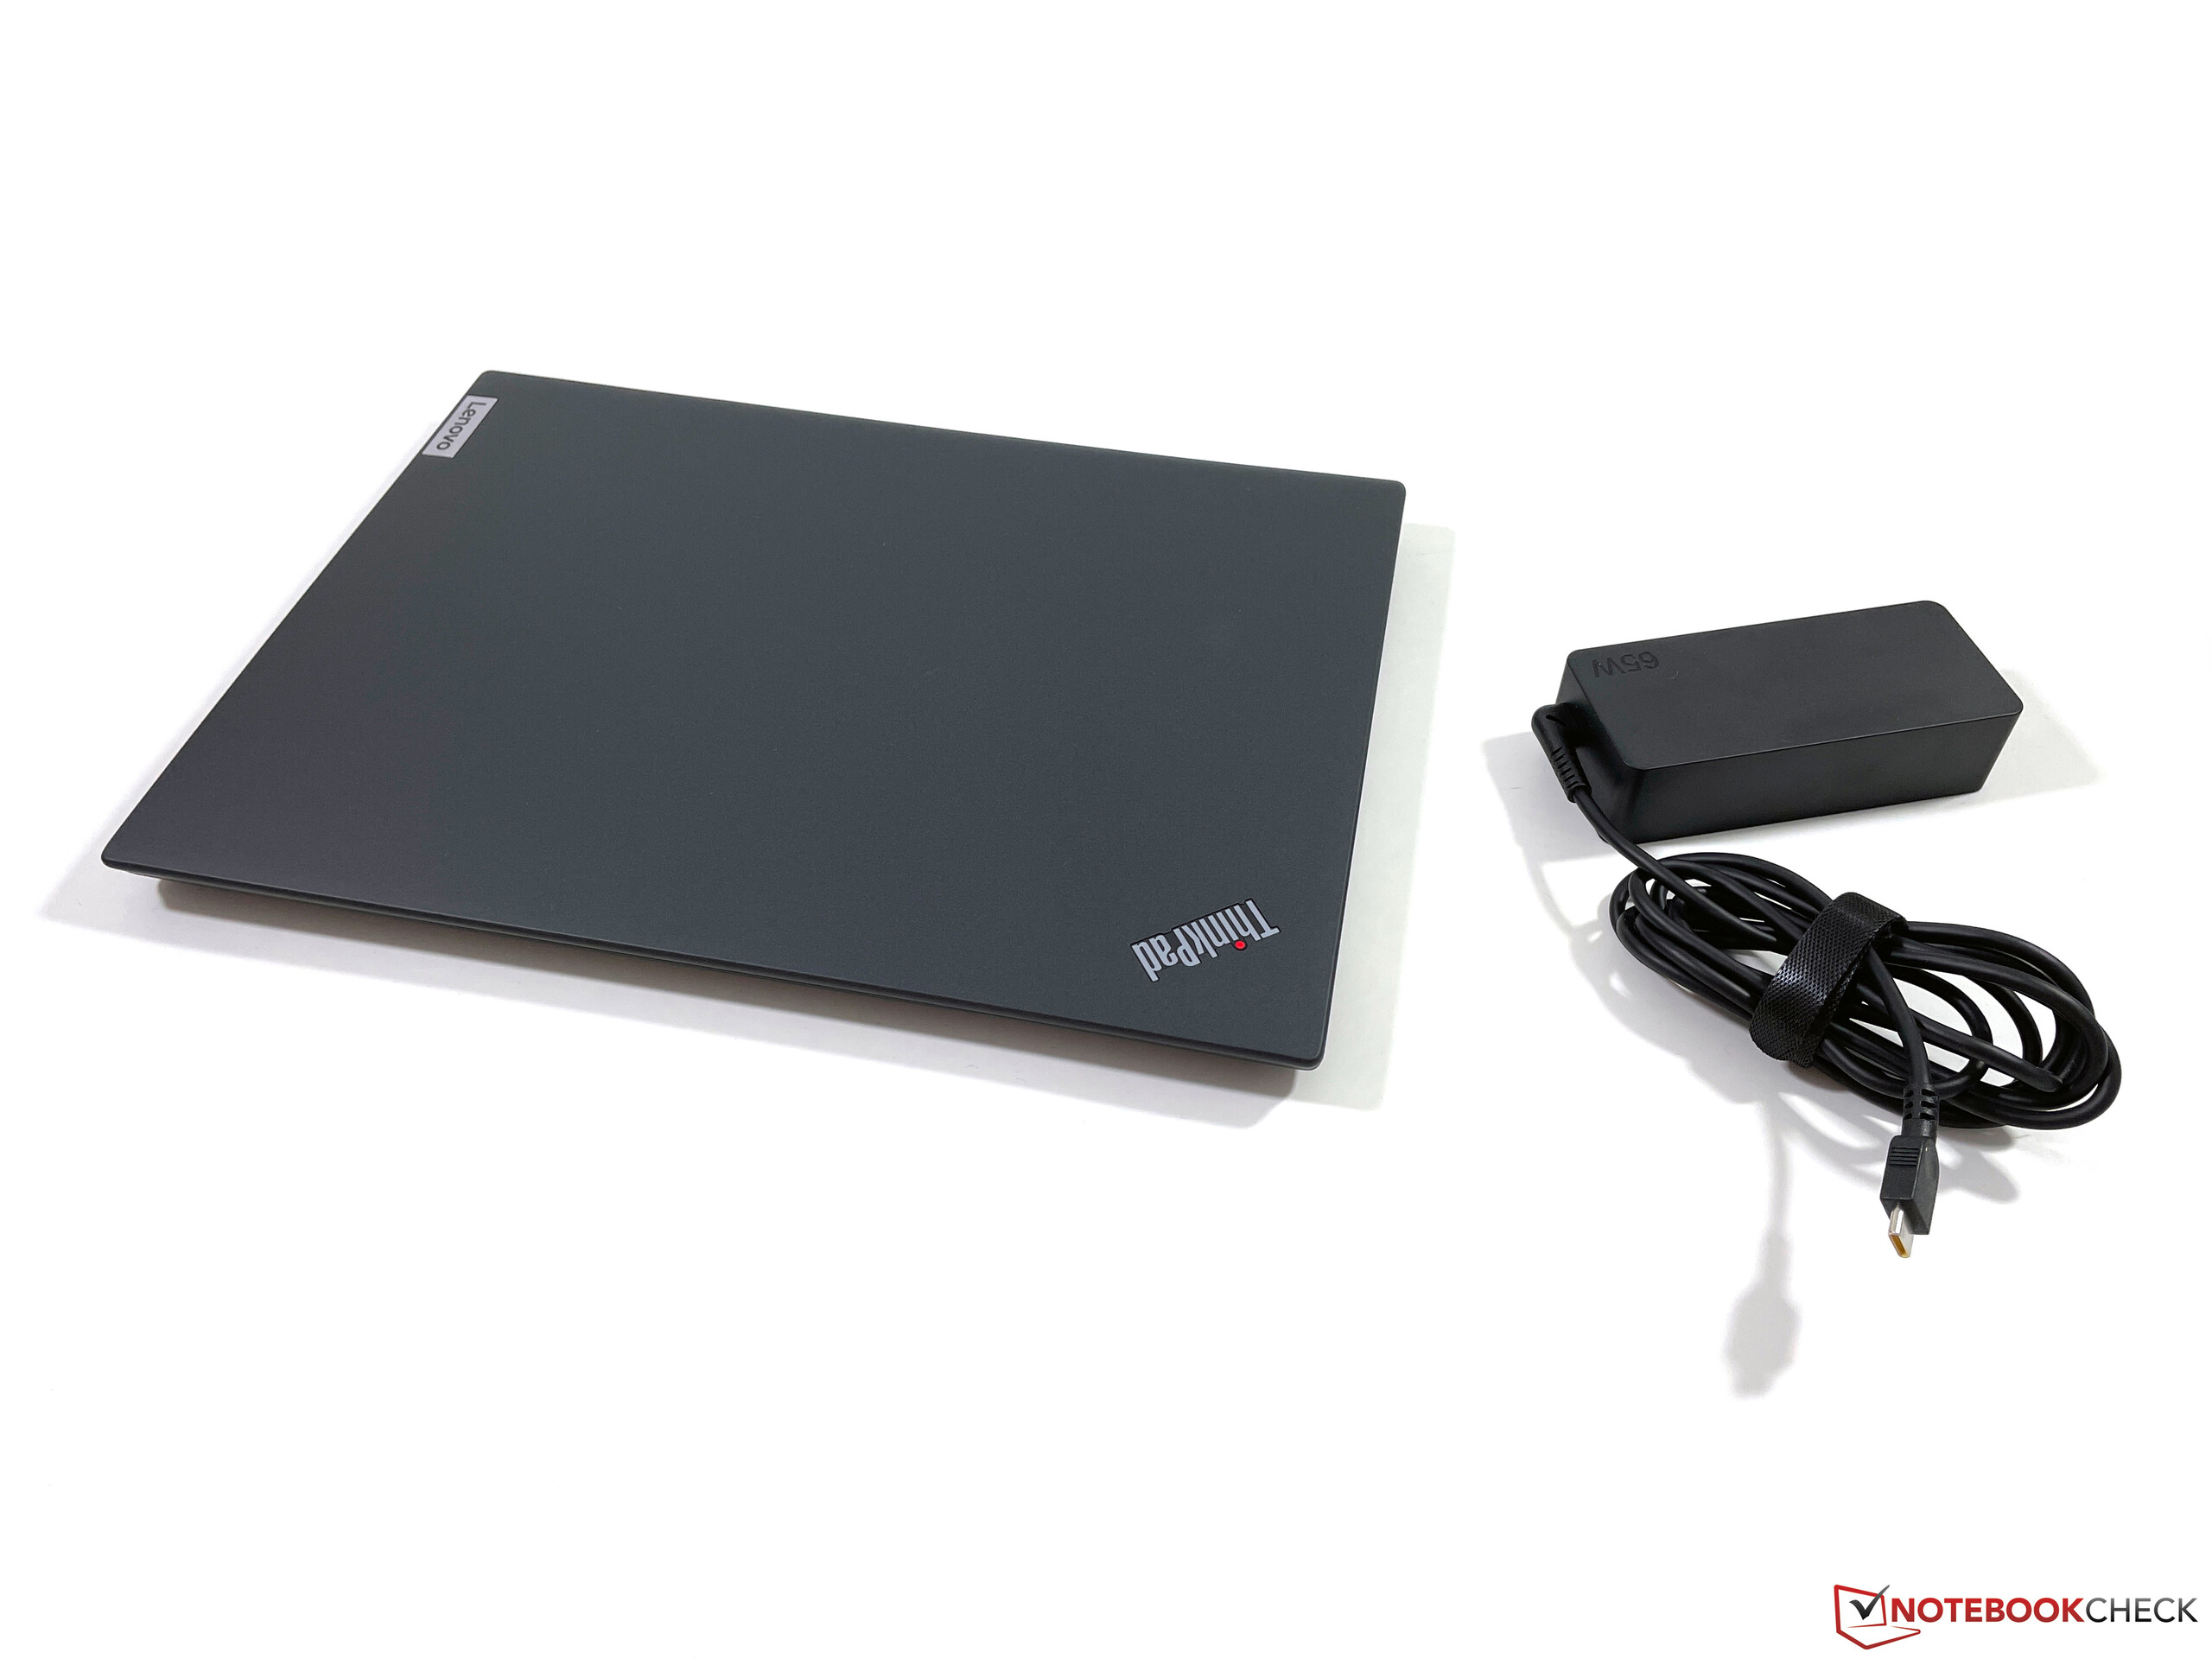
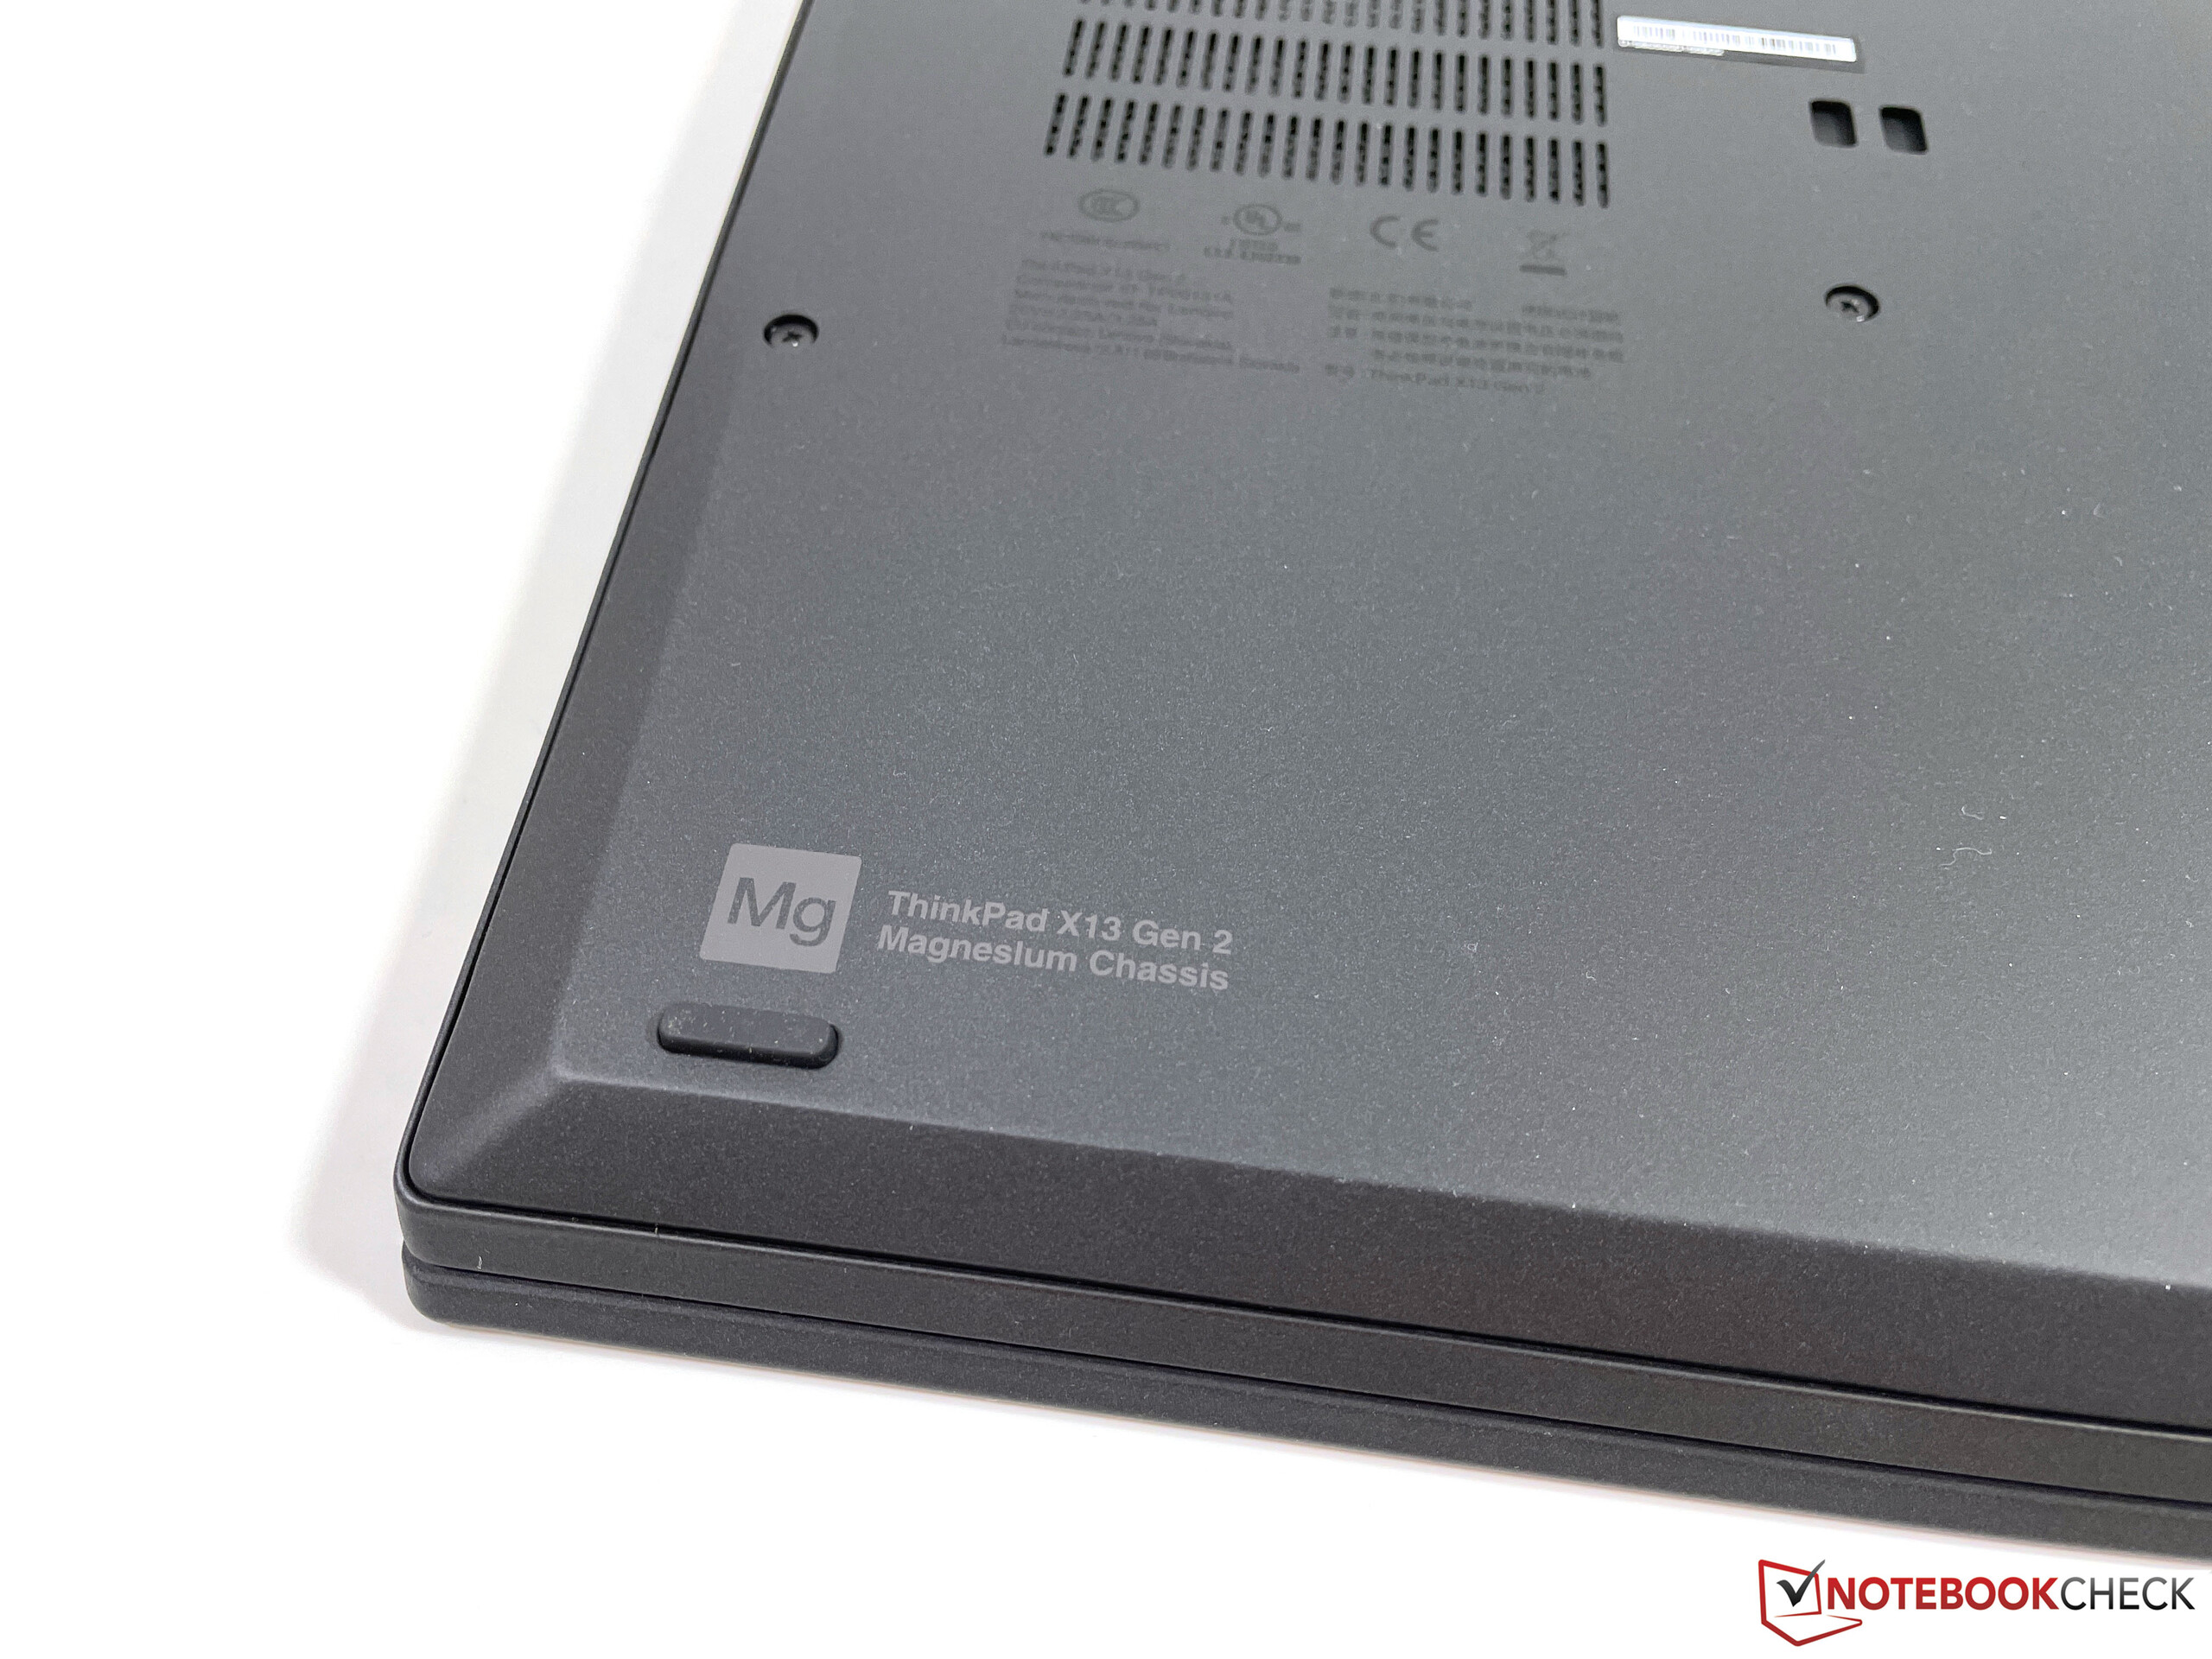
The materials also changed quite a bit and there are also significant differences to the X13 Yoga G2. Both the top and the bottom of the base unit used to be made of magnesium, but the new model only has a top made of magnesium and the surface is also a bit rougher. The latter has the advantage that you will not see fingerprints as quickly. The bottom panel is now made of aluminum. All in all, the stability of the base unit is very good, and we can only provoke some creaking noises when we try to twist the base unit.
The lid is not made of a PPS plastic/glass fiber composite anymore, but only PPS plastic. The lid is very sturdy, and we cannot provoke picture irritations. The two hinges once again allow a maximum opening angle of 180 degrees, but they could be a bit firmer for our taste. There is some bouncing, and the lid closes from an angle of around 20 degrees.
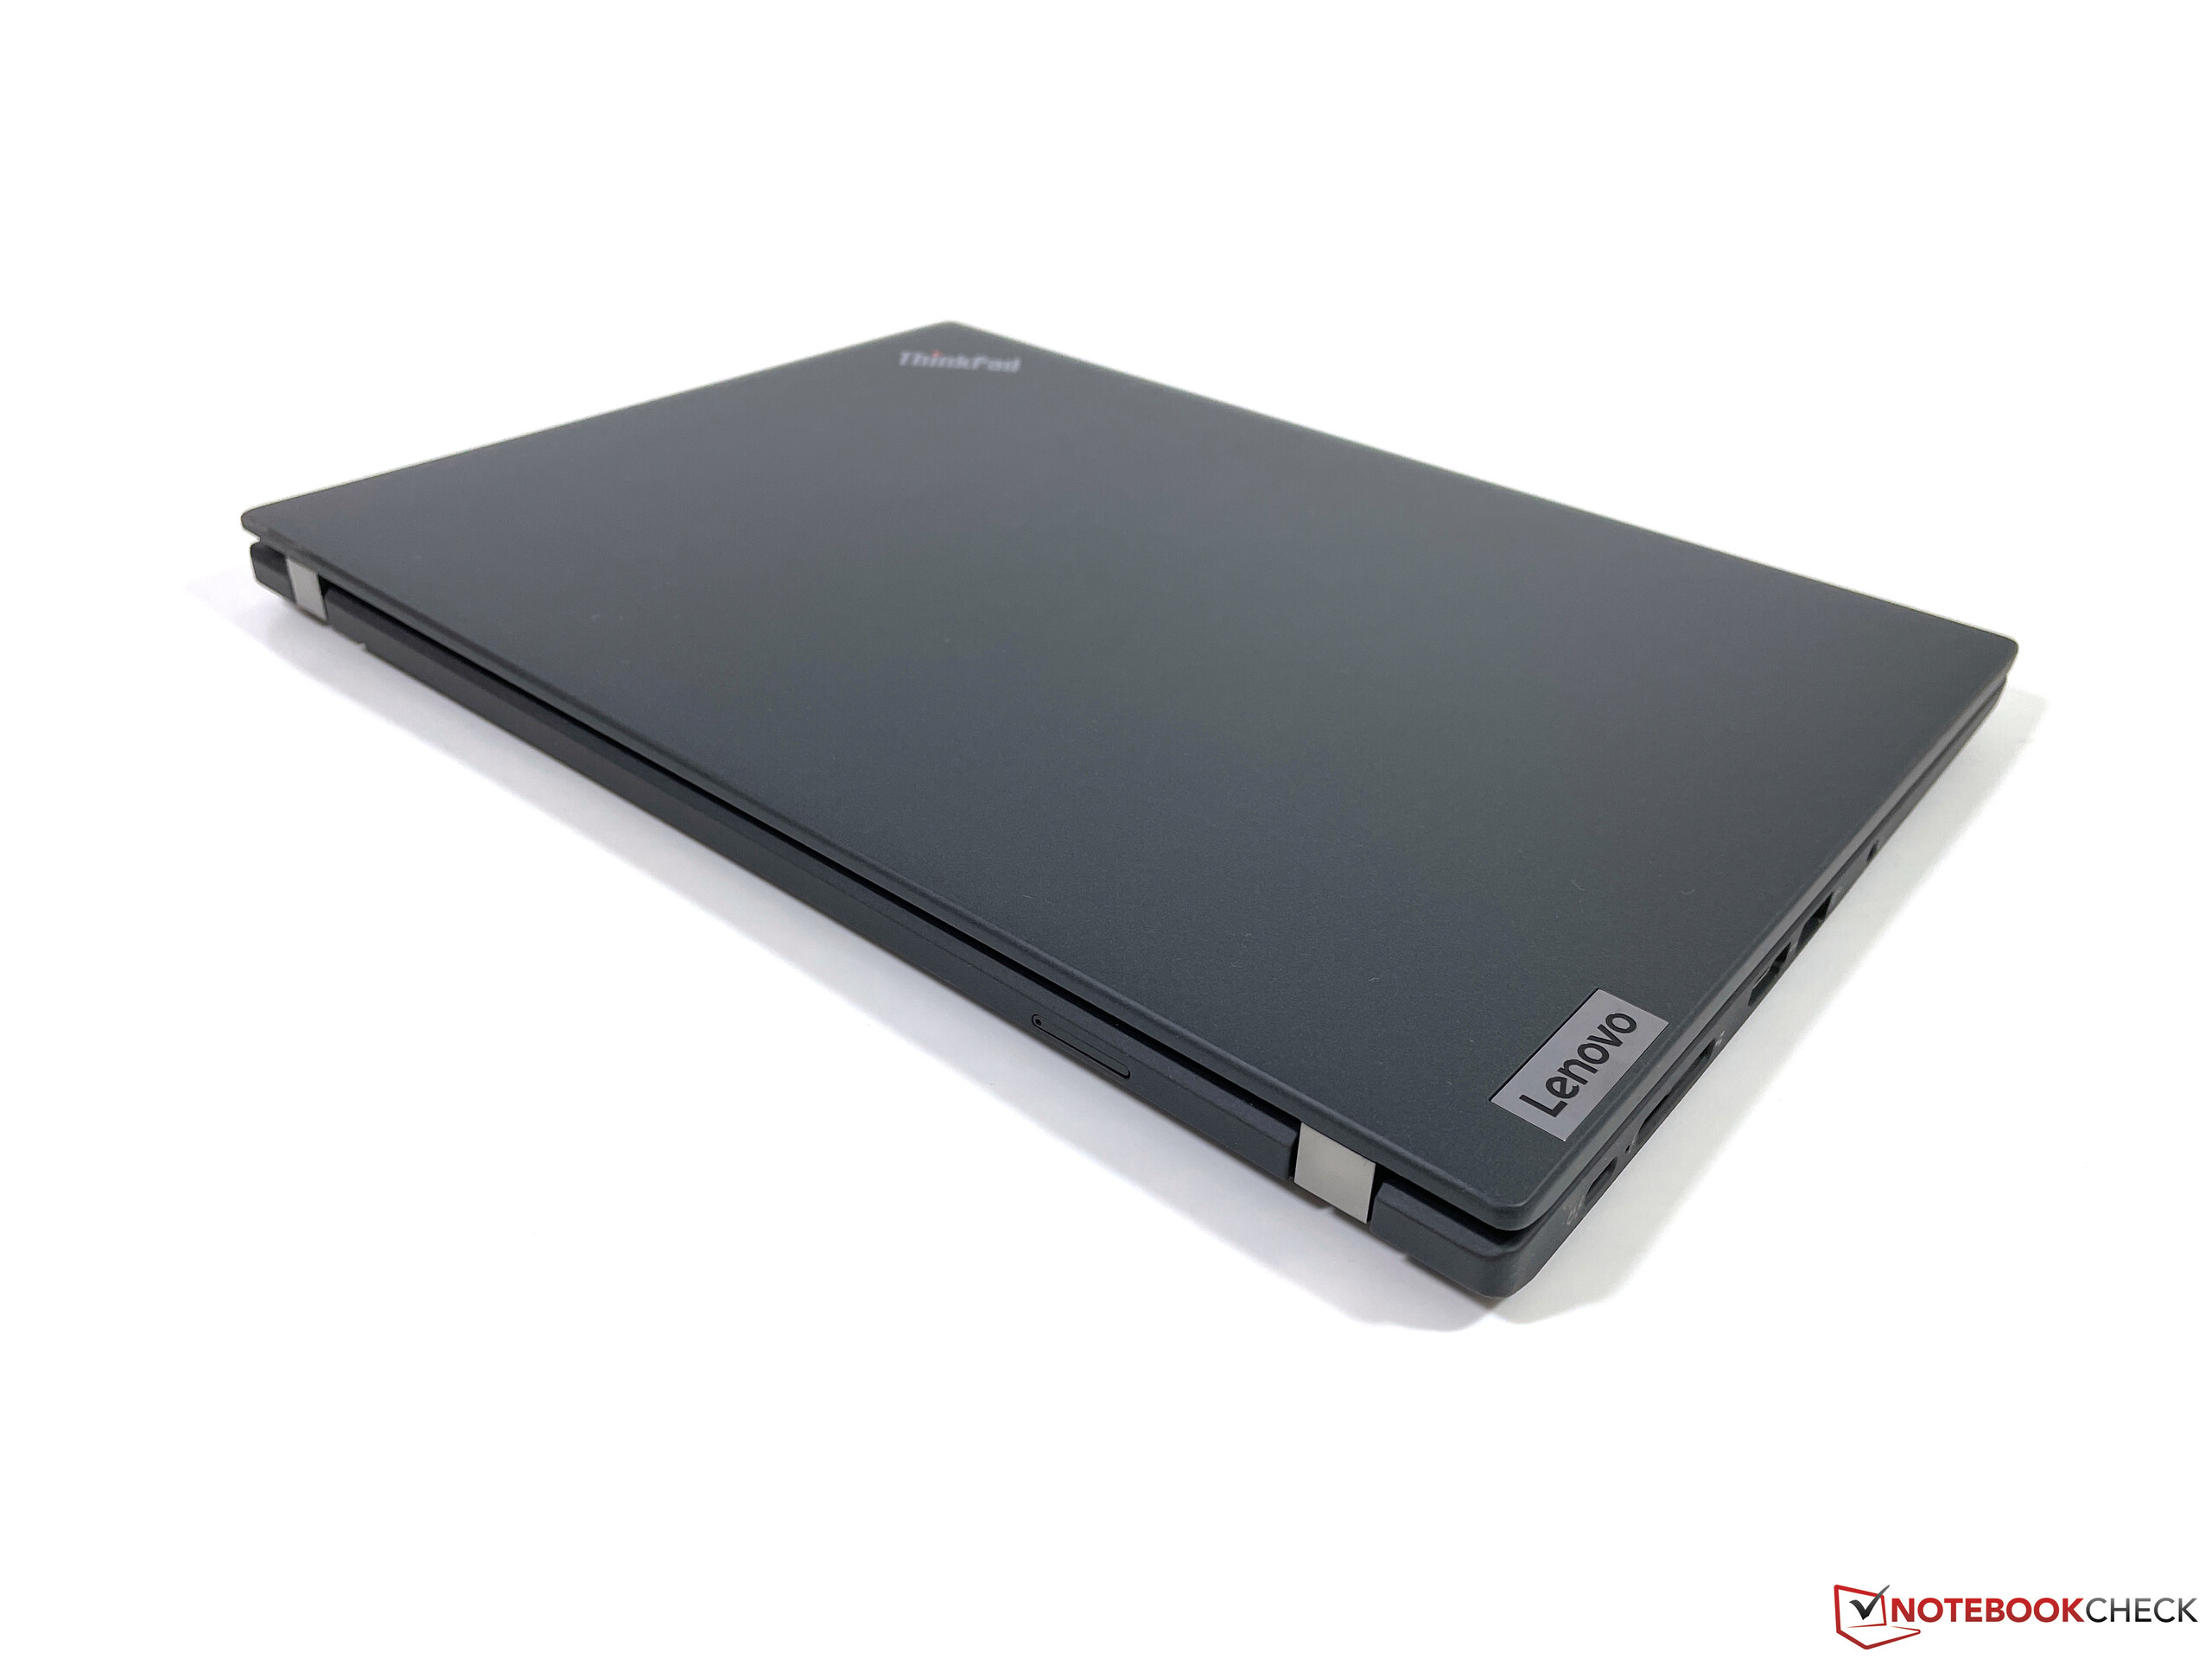
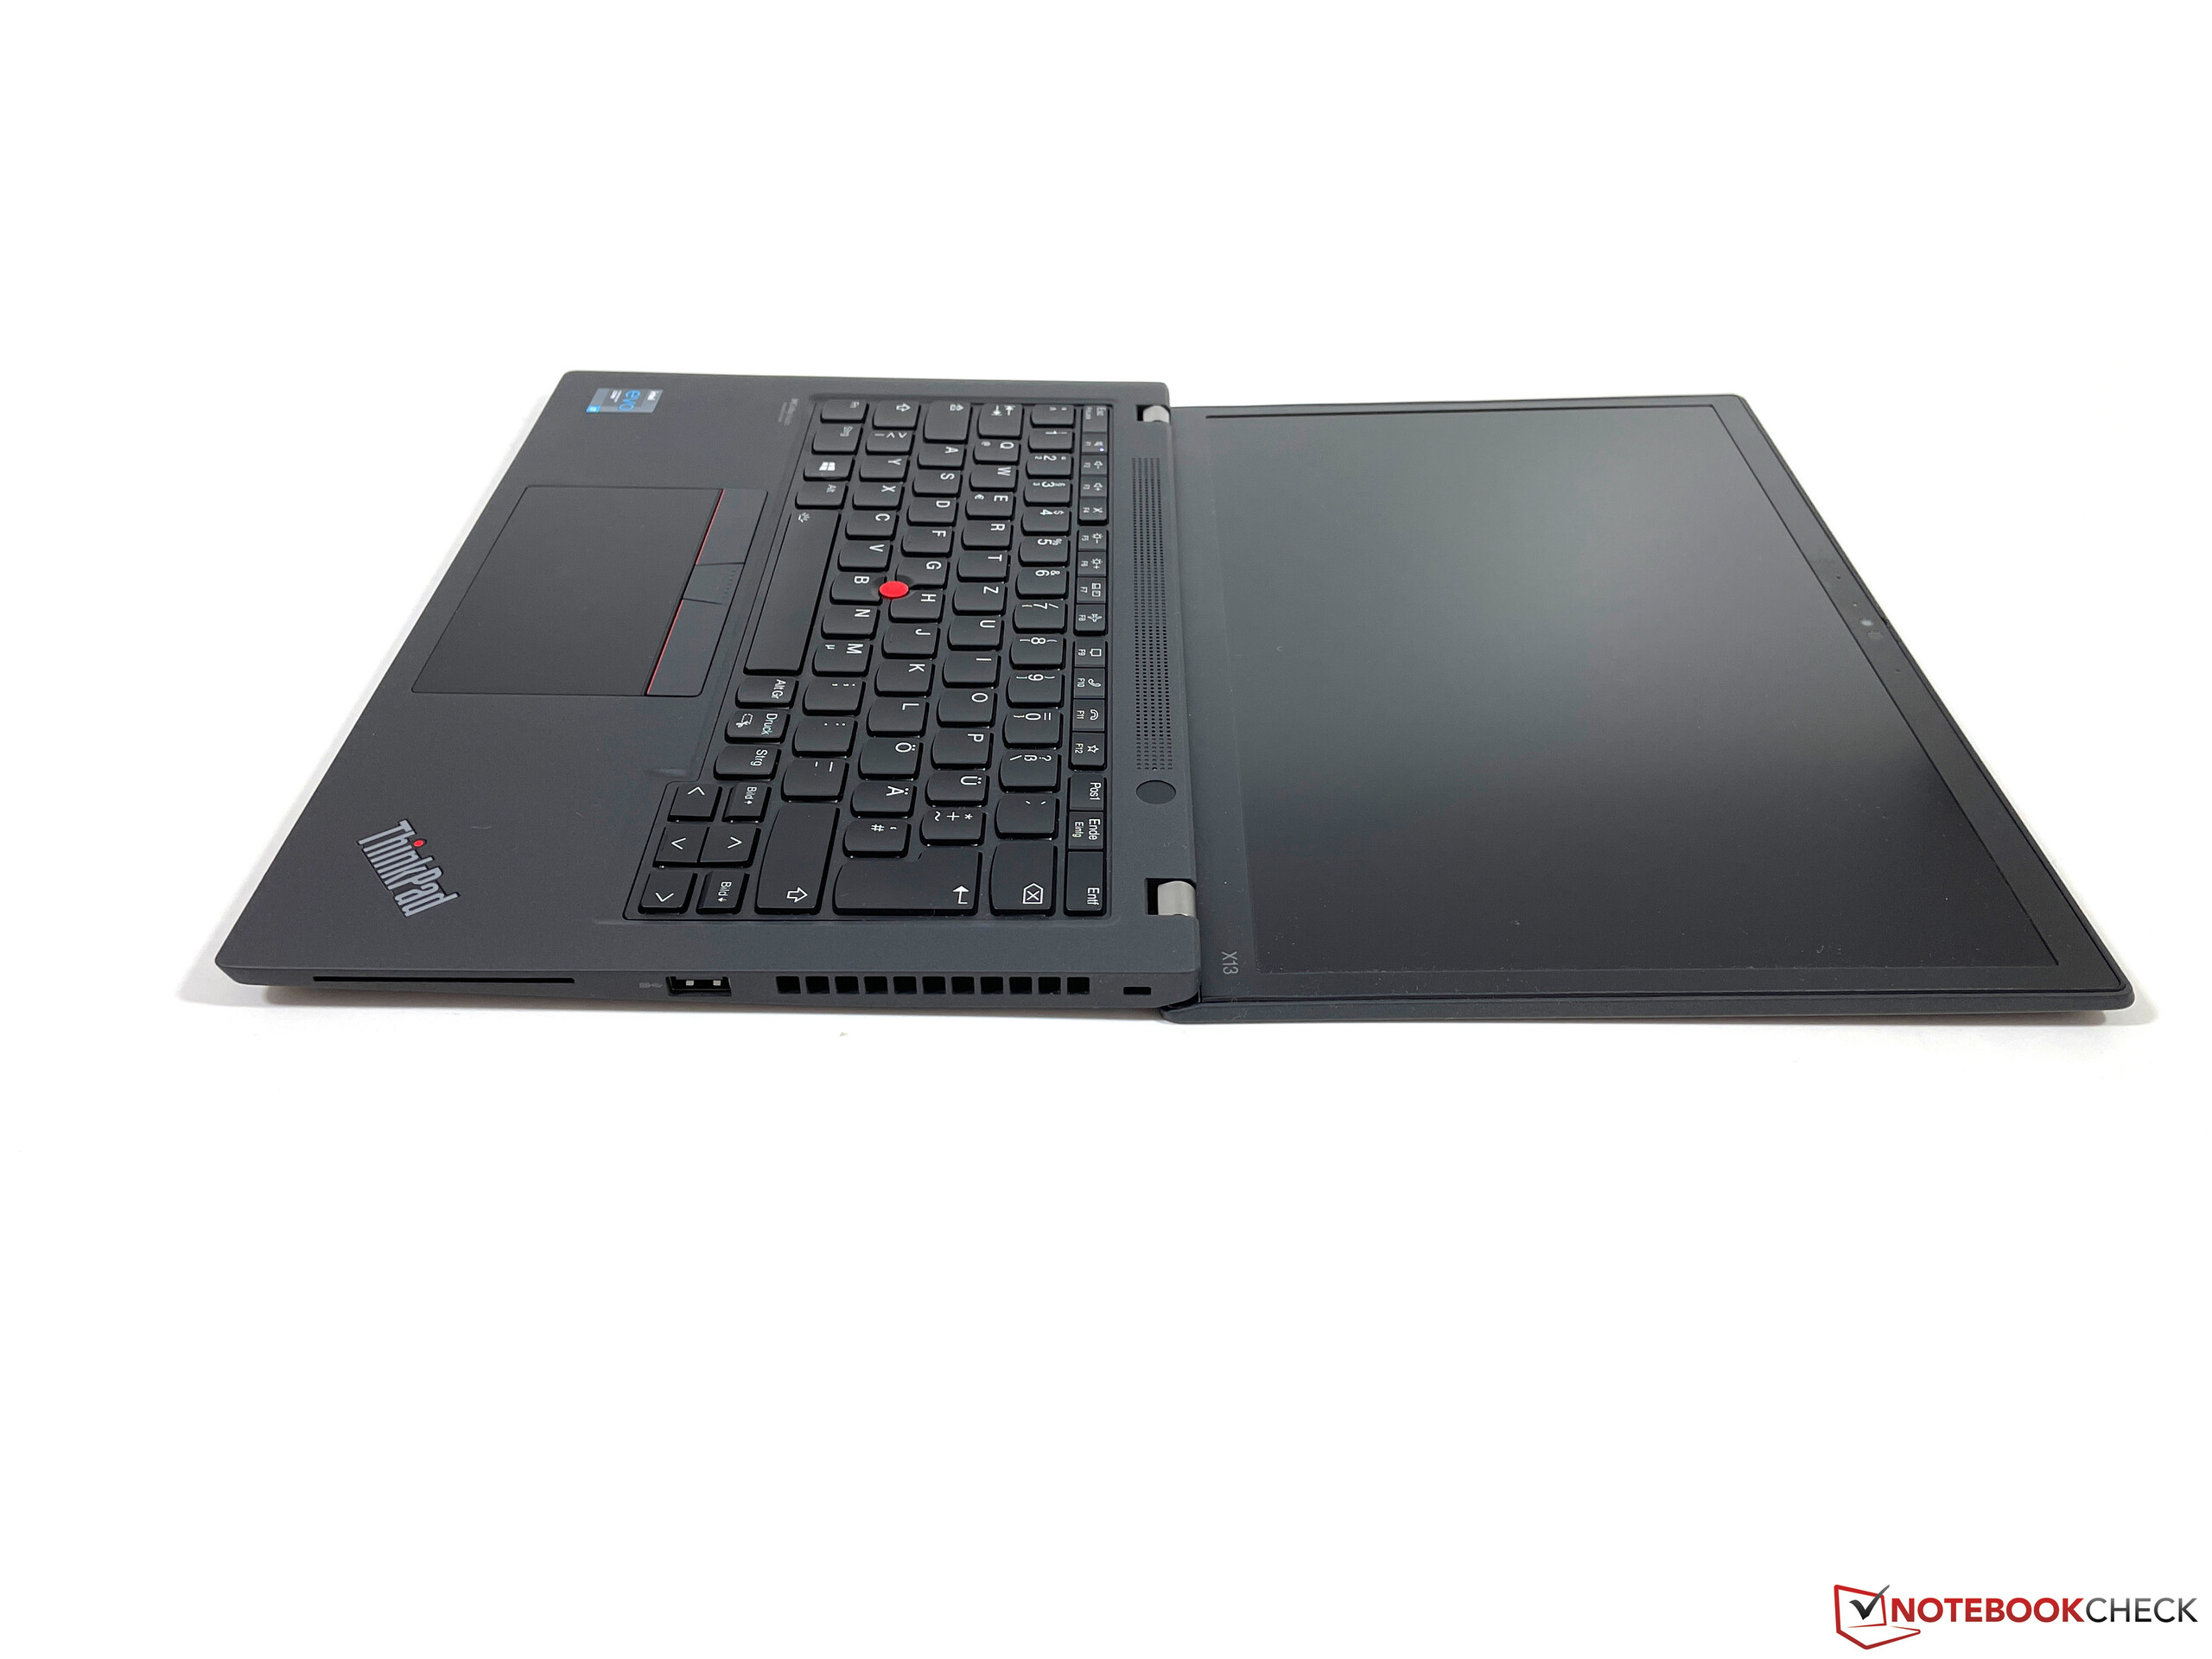
Compared to the old ThinkPad X13, the new model is a bit narrower, but the dimensions and the weight of around 1.3 kg are comparable. All the other comparison devices are also in the same ballpark, only the Dell XPS 13 is much more compact.
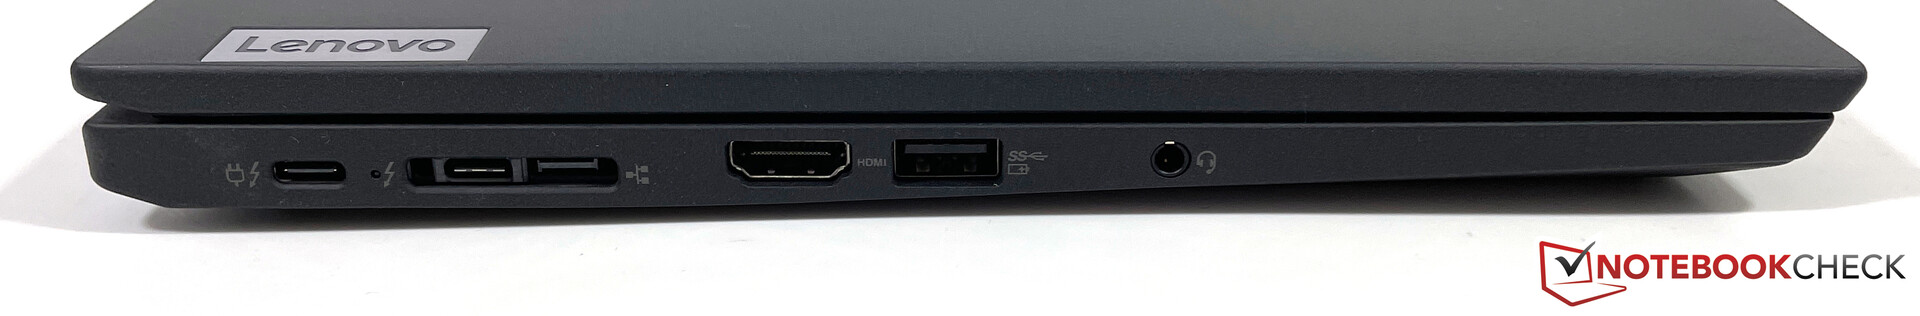
Connectivity - X13 now with Thunderbolt 4
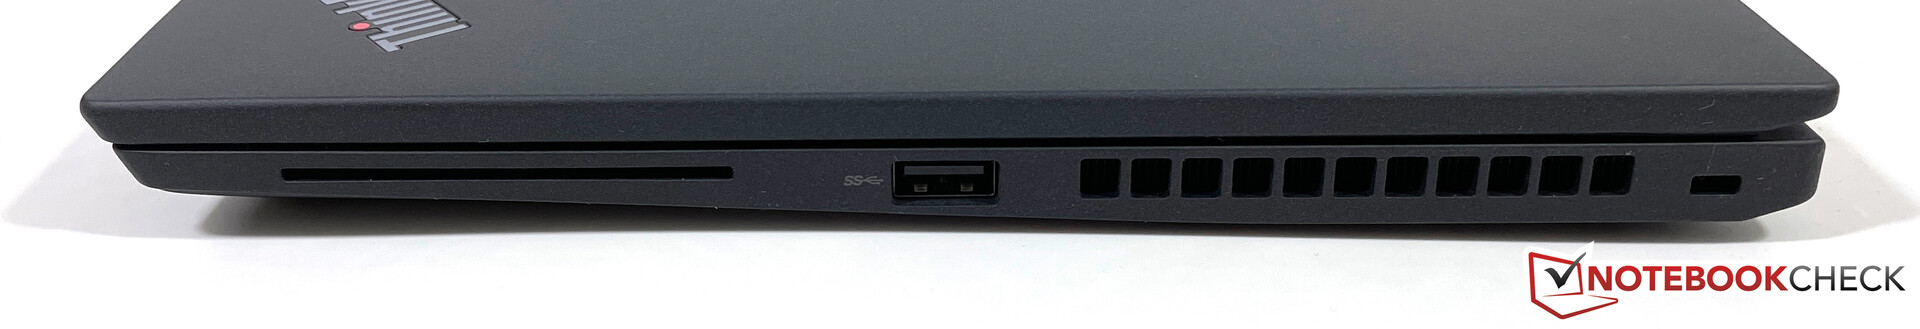
The port situation on the X13 G2 is much better compared to the rivals. You do not only get two USB-C ports with Thunderbolt 4 support, but also a full-size HDMI output and two regular USB-A ports. However, there is no SD-card reader.
Communication - 5G as an option
In addition to wired Gigabit-Ethernet (via adapter), Lenovo also equips the X13 G2 with the latest Wi-Fi 6E module from Intel (AX210). It manages very high transfer rates in our standardized Wi-Fi test with the router Netgear Nighthawk RAX120 and we did not notice any connectivity issues during our review period, neither with the Netgear router, nor the AVM Fritz!Box 7590 (Wi-Fi 5).
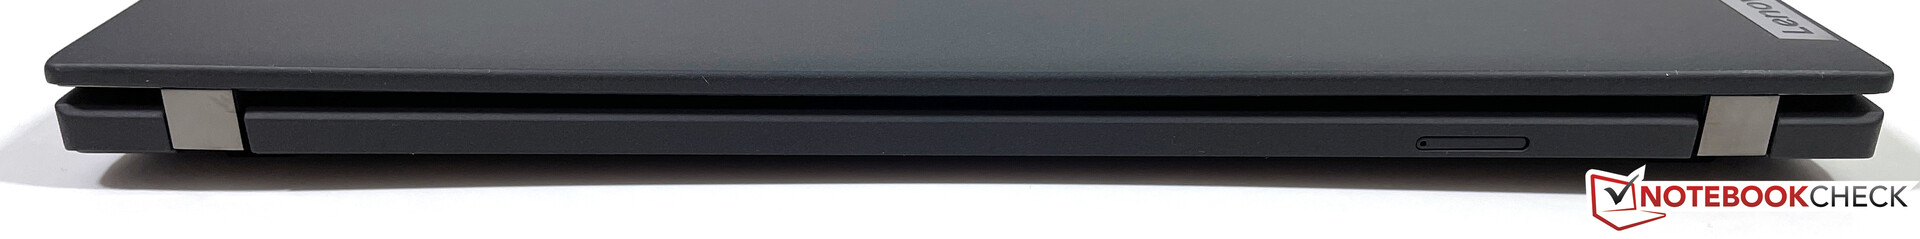
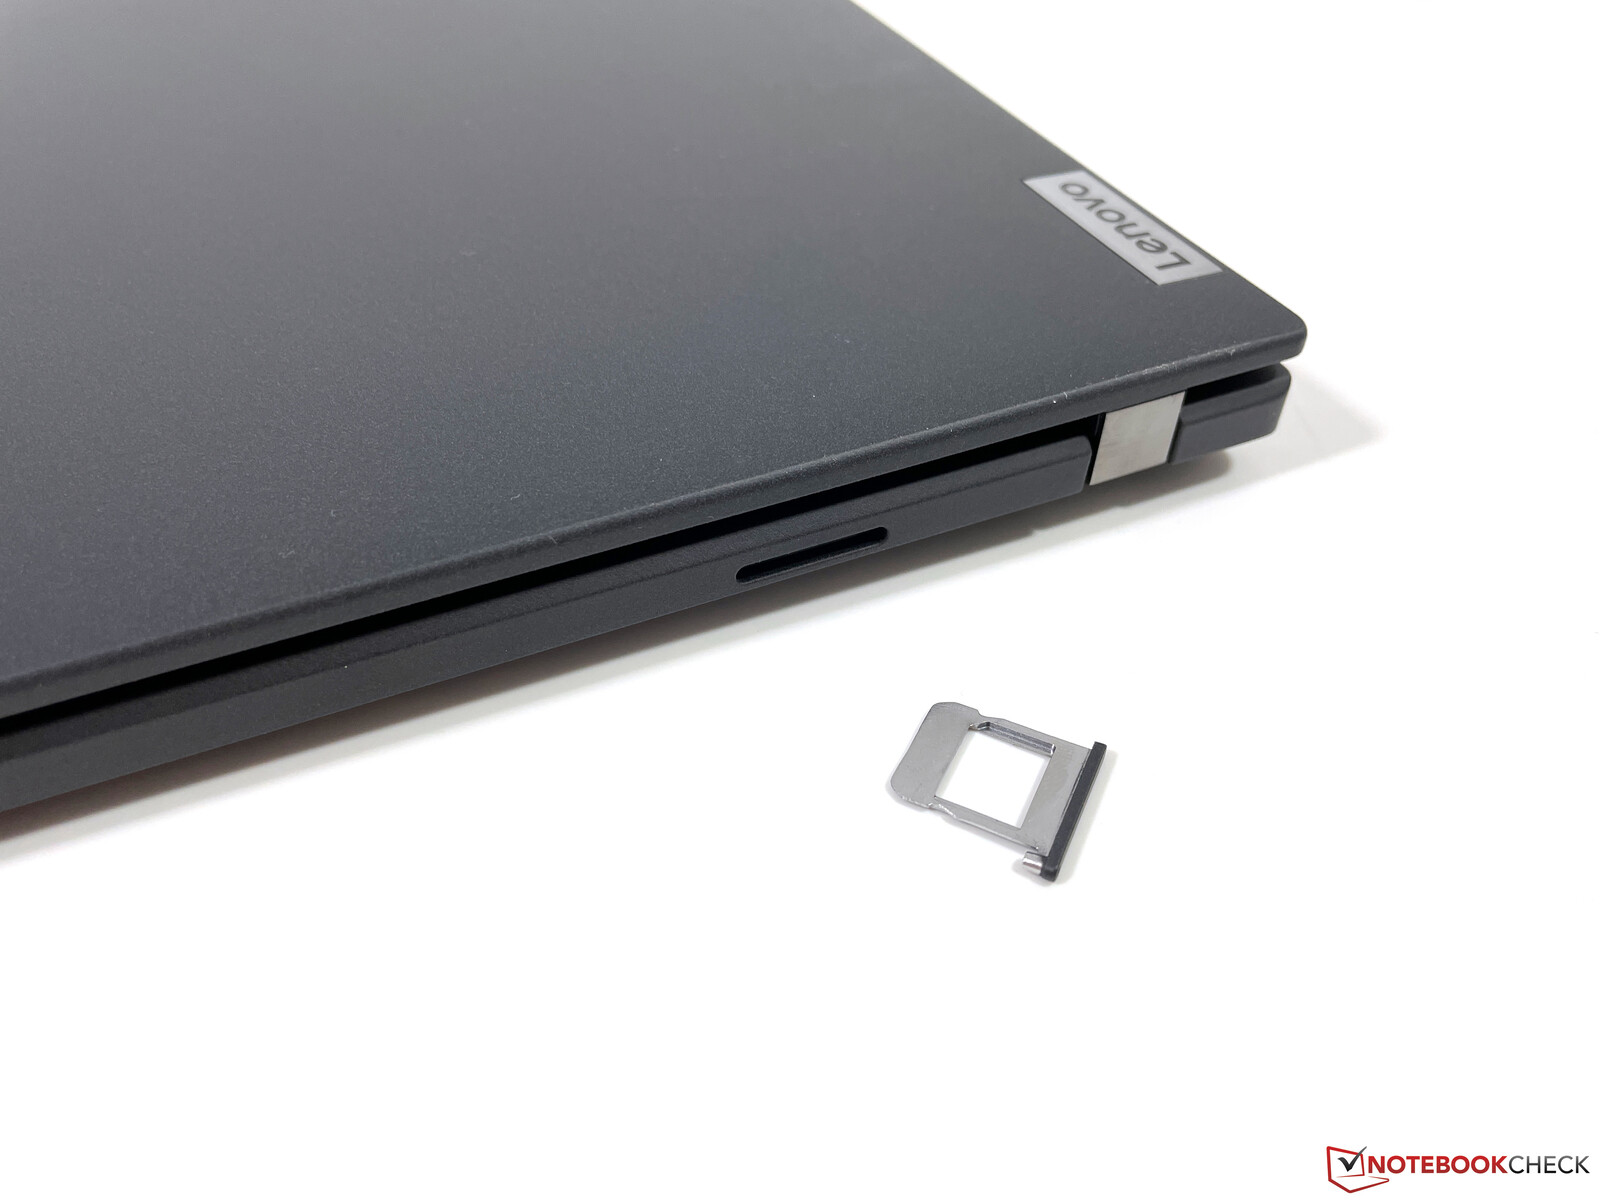
You can also get the X13 G2 with 4G or 5G modems. Our review unit is equipped with a 5G module from Qualcomm (Snapdragon X55), but it only works in combination with an eSIM. The slot for the Nano-SIM at the rear did not work with our SIM card from T-Mobile.
Webcam - ThinkPad now with 1080p
Lenovo now uses a 1080p camera with 2MP and the picture quality is a bit better than before. The camera obviously works for video conferences and the like, but it still does not take great pictures.


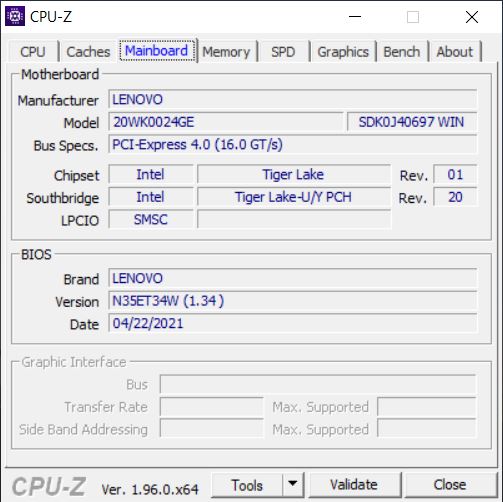
Maintenance
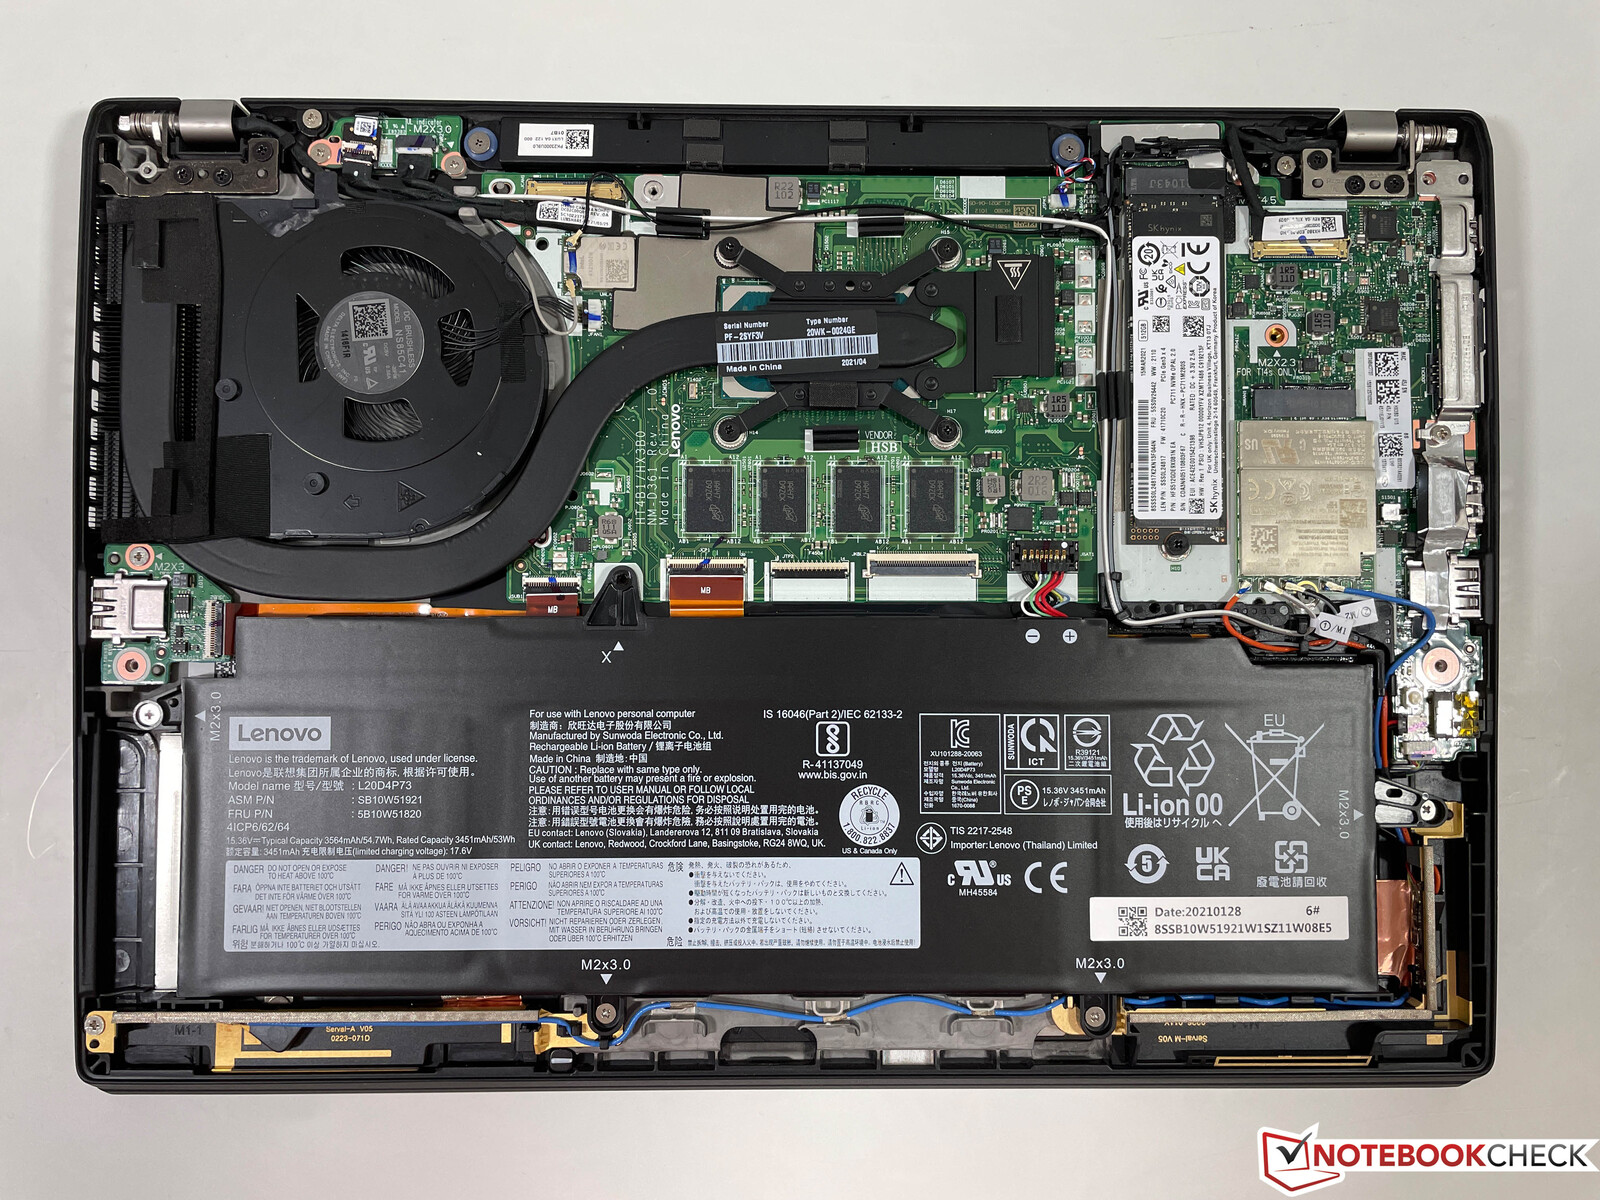
The bottom panel is secured with a couple of Philips screw and is easy to remove. Lenovo uses the same mainboard for the X13 G2 and the T14s G2, and the user cannot do a lot inside. Both the Wi-Fi module as well as the memory are soldered, so you can only access the WWAN module as well as the M.2-2280 SSD, and the fan can be cleaned as well.
Input Devices - Shallower keys and reduced travel
Keyboard
The width of the keyboard is once again a bit reduced (about 95% of the regular size), but you will get used to that quite quickly. However, similar to the current ThinkPad X1 Carbon, the keys now have a reduced key travel of 1.5 mm and the keys are also flatter. This clearly affects the typing experience. There are still advantages compared to consumer laptops, but other business keyboards from HP or Dell are pretty much on the same level and there is no big advantage of the ThinkPad X13 G2 anymore. Sure, we are complaining on a high level here, and the keyboard is also suited for longer texts, but the previous model had a big advantage in this category.
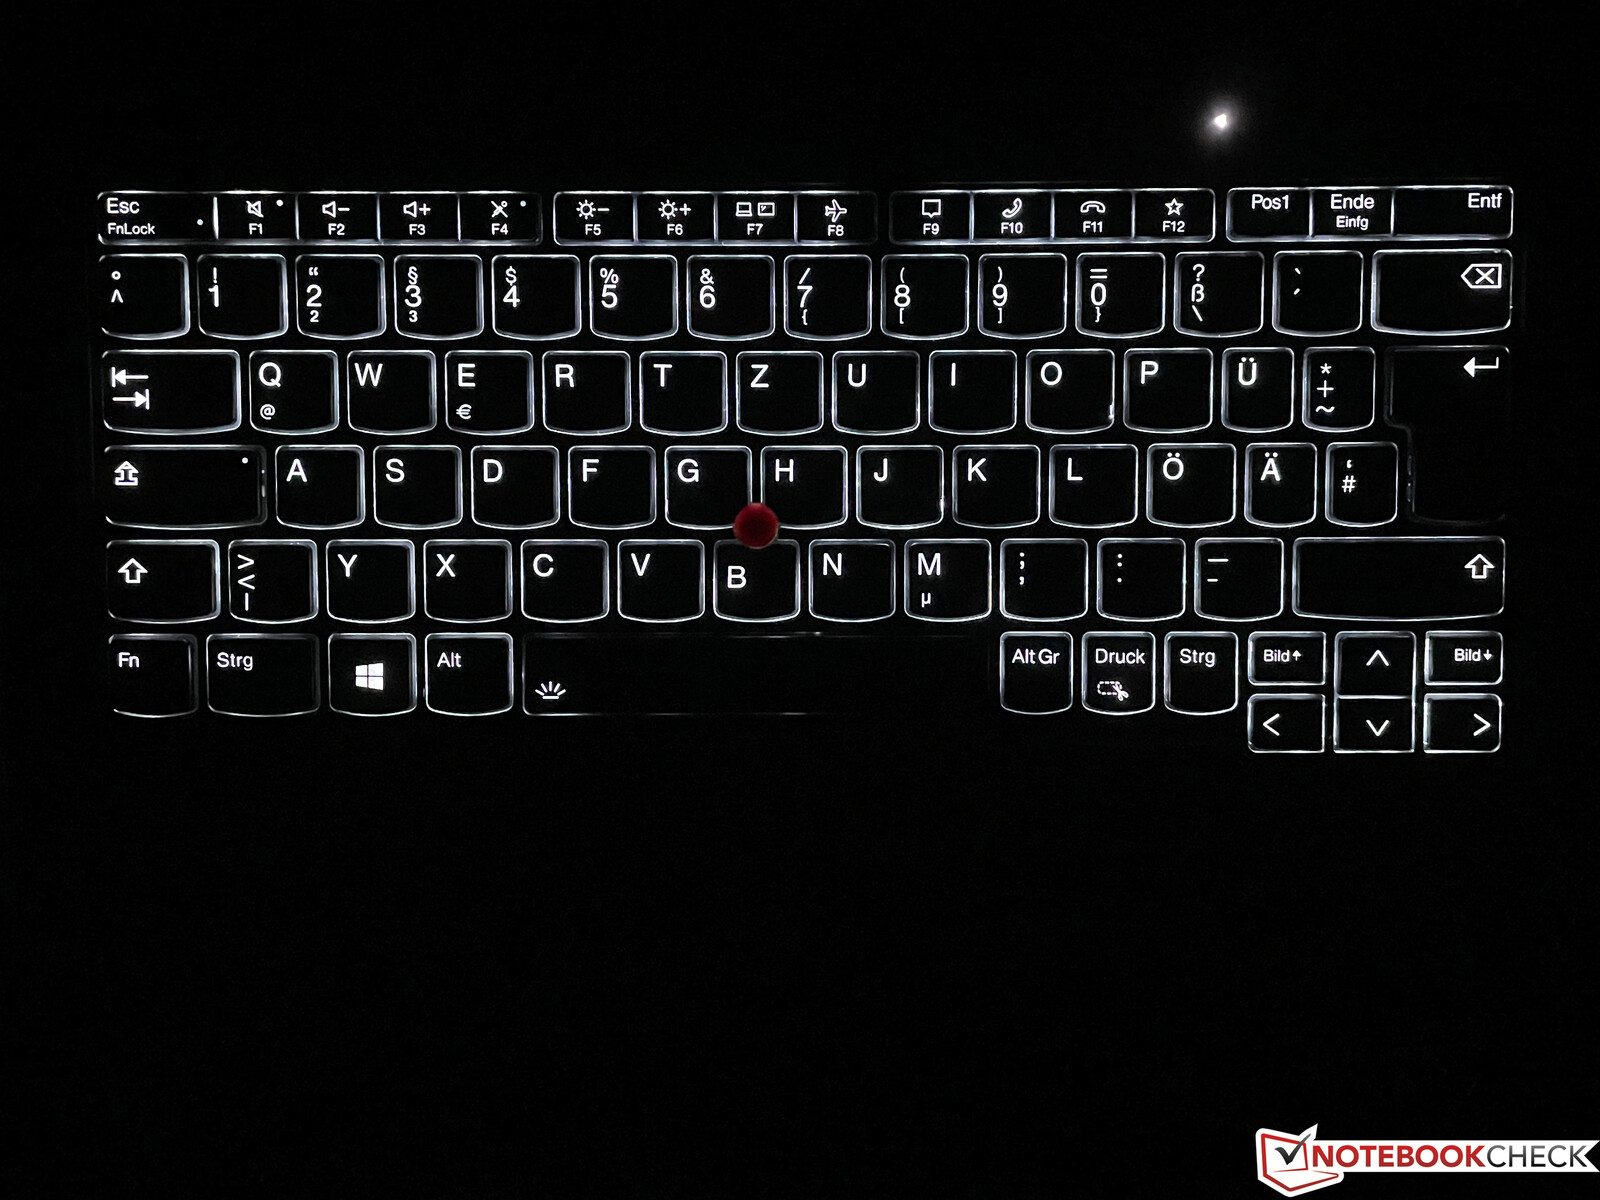
You still get a two-stage white background illumination, which works well and it makes working in dark environments much easier.
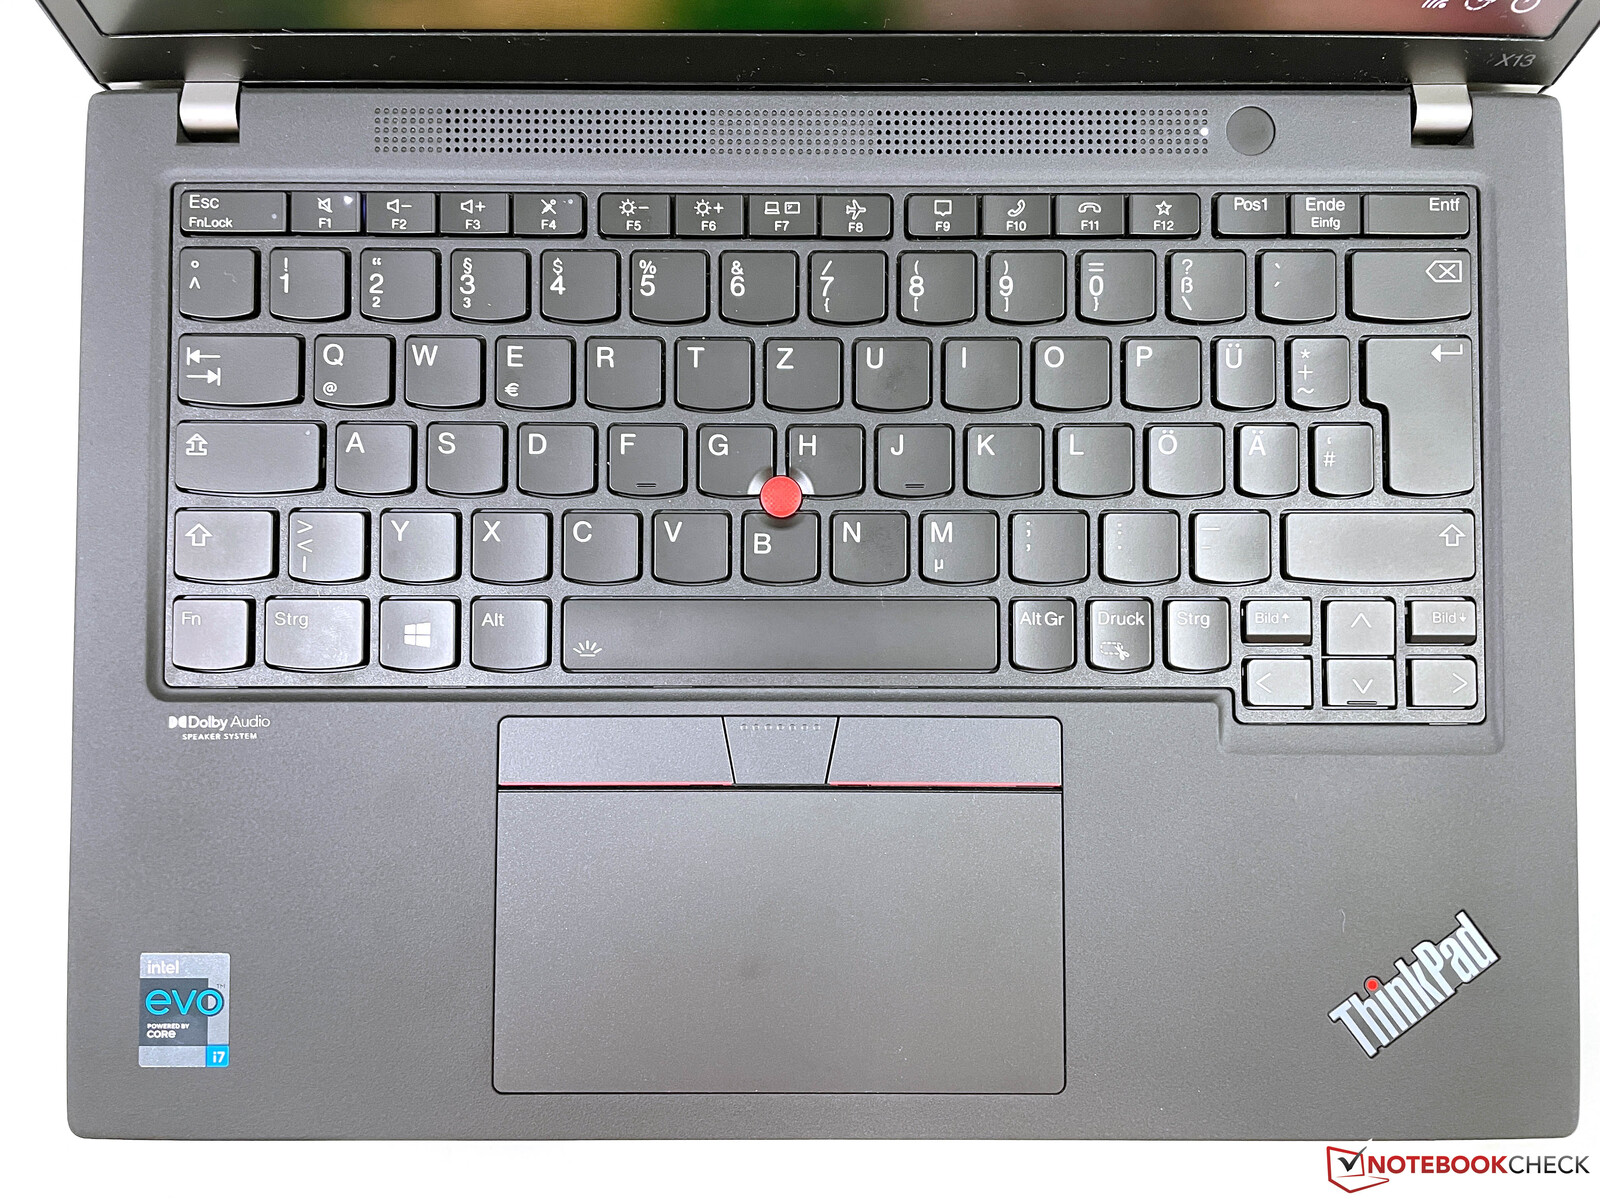
Touchpad & TrackPoint
Lenovo now uses a much wider touchpad (11.5 x 6.1 cm) for the new X13 G2 and it is easy to use. The smooth surface provides good gliding capabilities, but you will hear a pretty loud and cheap clicking noise when you click on the lower part of the touchpad.
The red TrackPoint and the additional buttons above the keyboard is once again available and is easy to use once you get used to it. The dedicated buttons also work well, but the clicking noise of the two buttons differs a bit.
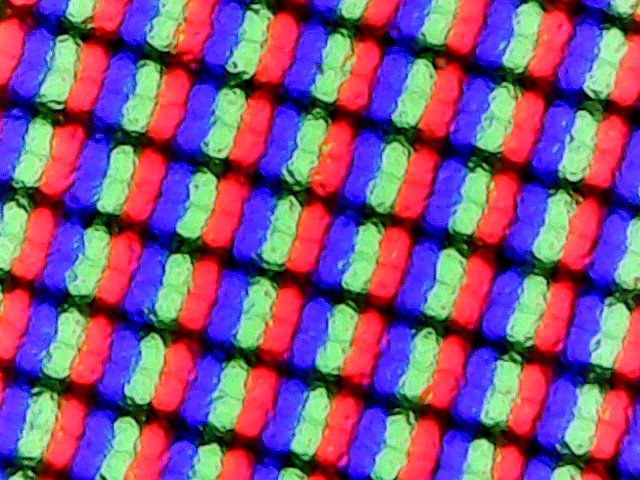
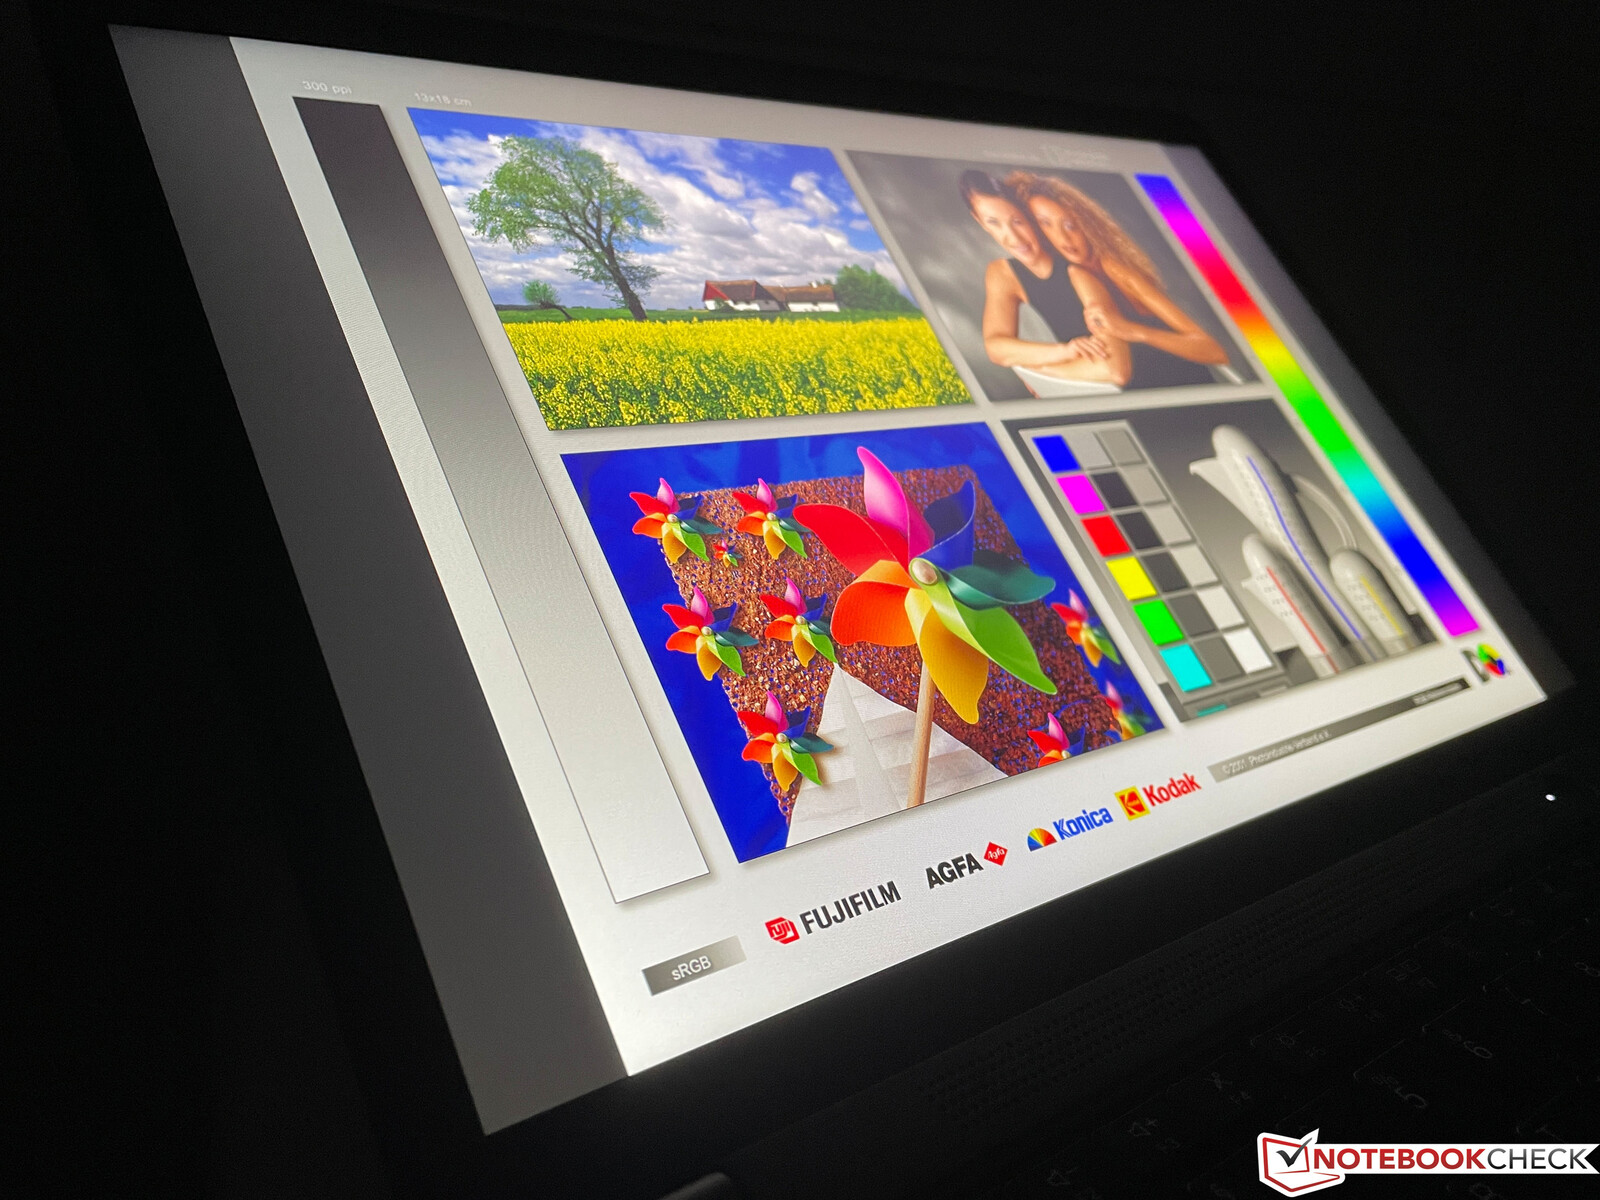
Display - 13.3-inch now in 16:10
Lenovo equips the X13 G2 with matte 13.3-inch IPS screens with a 16:10 aspect ratio. You can select between four different options:
- WUXGA (1920 x 1200, 300 cd/m²)
- WUXGA (1920 x 1200, Touch, 300 cd/m²)
- WUXGA (1920 x 1200, Privacy Guard, 500 cd/m²)
- WQXGA (2560 x 1600, LowPower, 400 cd/m²)
We already had the chance to review the WQXGA panel in the X13 Yoga G2; our review unit of the X13 G2 is equipped with the default WUXGA display and a brightness of 300 nits. We are slightly disappointed with the screens; we would have liked to see at least 400 nits and LowPower screens we know from Lenovo’s 14-inch lineup.
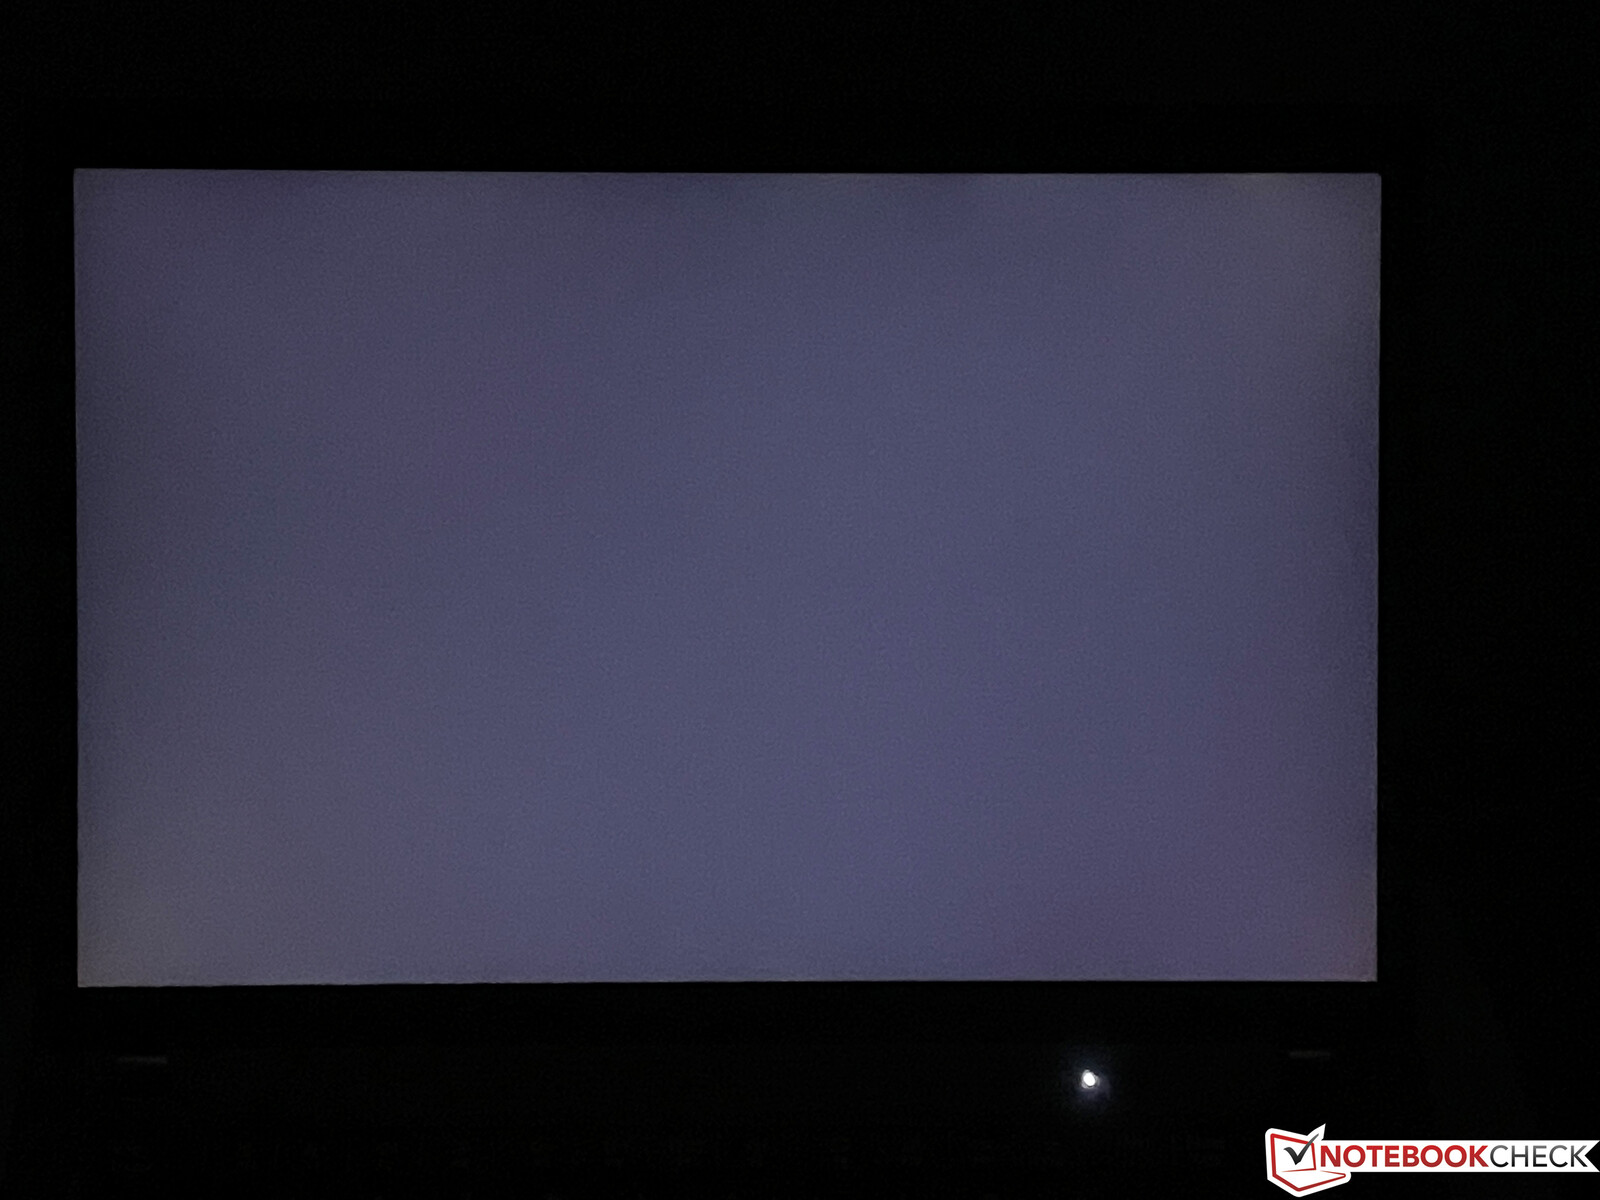
Our test unit manages an average brightness of 310 nits with a contrast ratio of more than 1300:1. The subjective picture impression is good and even bright surfaces do not look too grainy. We did not detect any PWM flickering and the viewing angle stability of the IPS screen is very good. Backlight bleeding is no major problem; there are only some brighter spots at the upper edge when you use the maximum brightness is combination with a dark background.
| |||||||||||||||||||||||||
Brightness Distribution: 89 %
Center on Battery: 319 cd/m²
Contrast: 1333:1 (Black: 0.24 cd/m²)
ΔE ColorChecker Calman: 2.7 | ∀{0.5-29.43 Ø4.71}
calibrated: 0.9
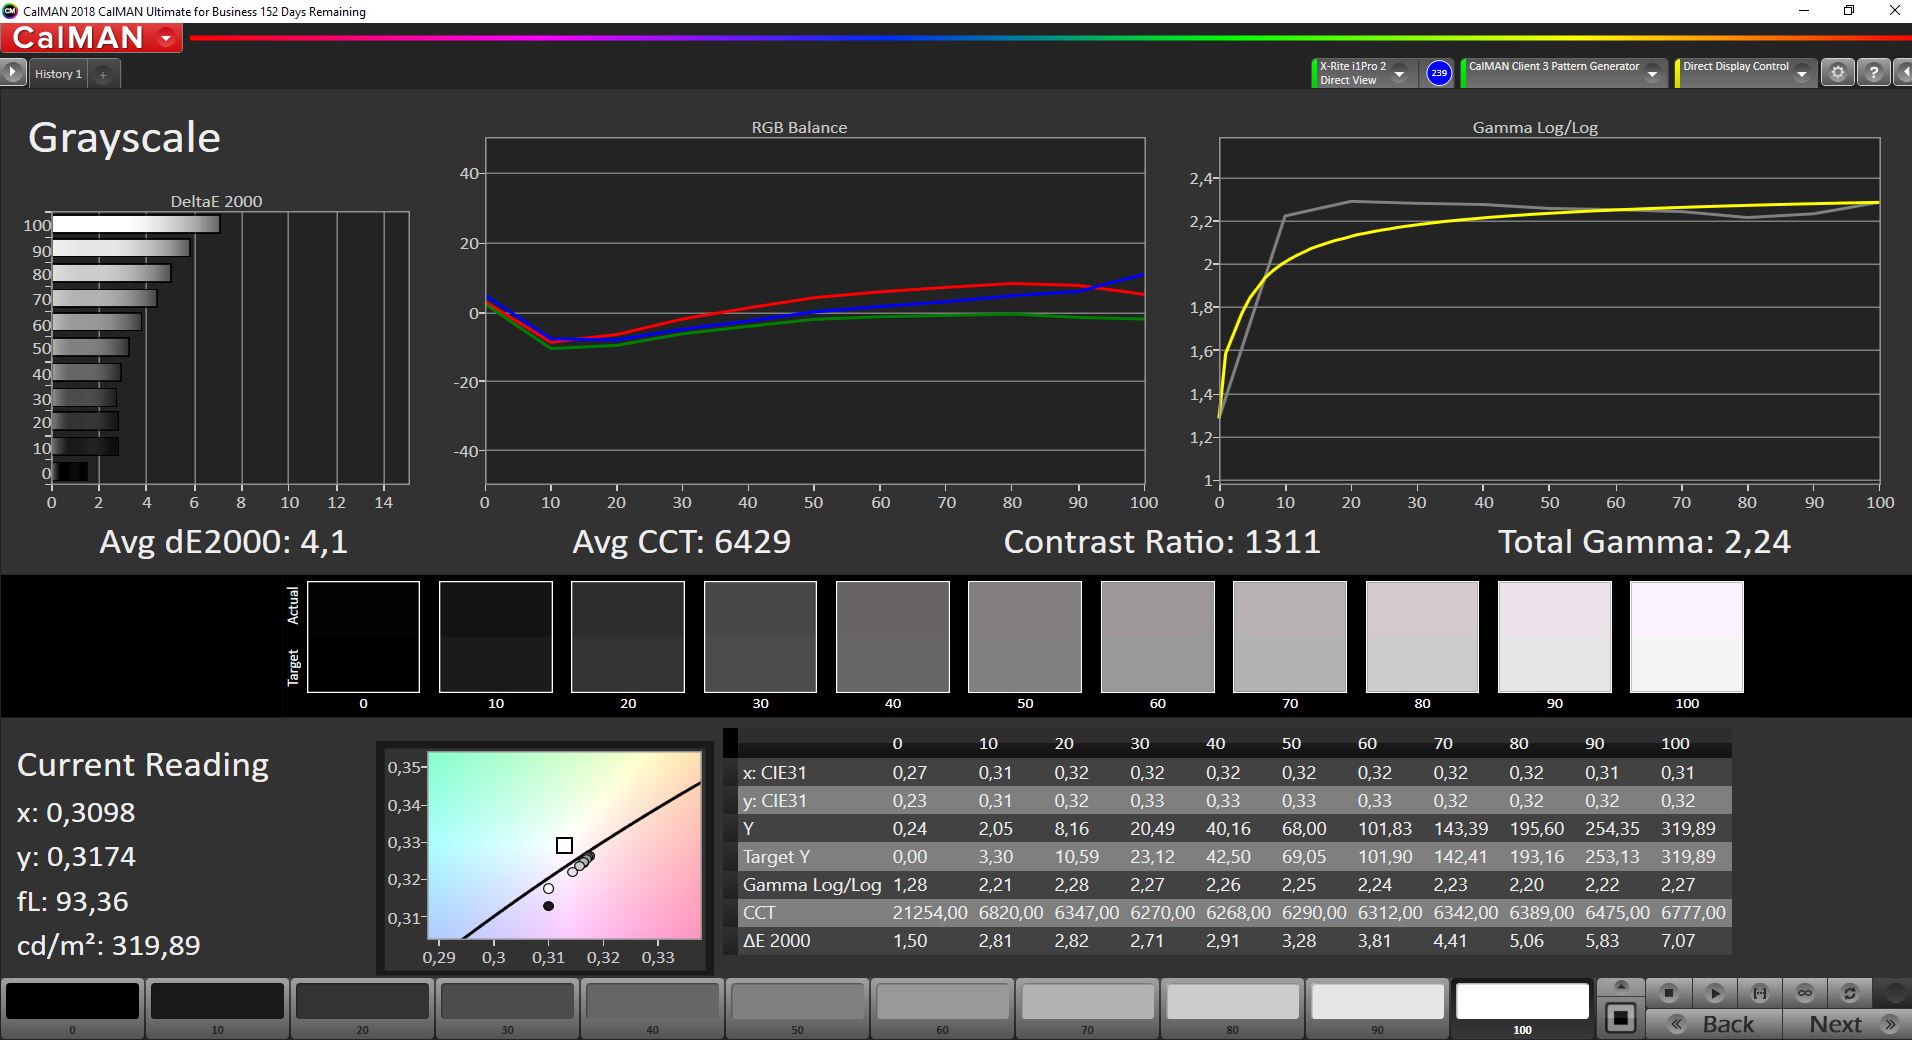
ΔE Greyscale Calman: 4.1 | ∀{0.09-98 Ø4.96}
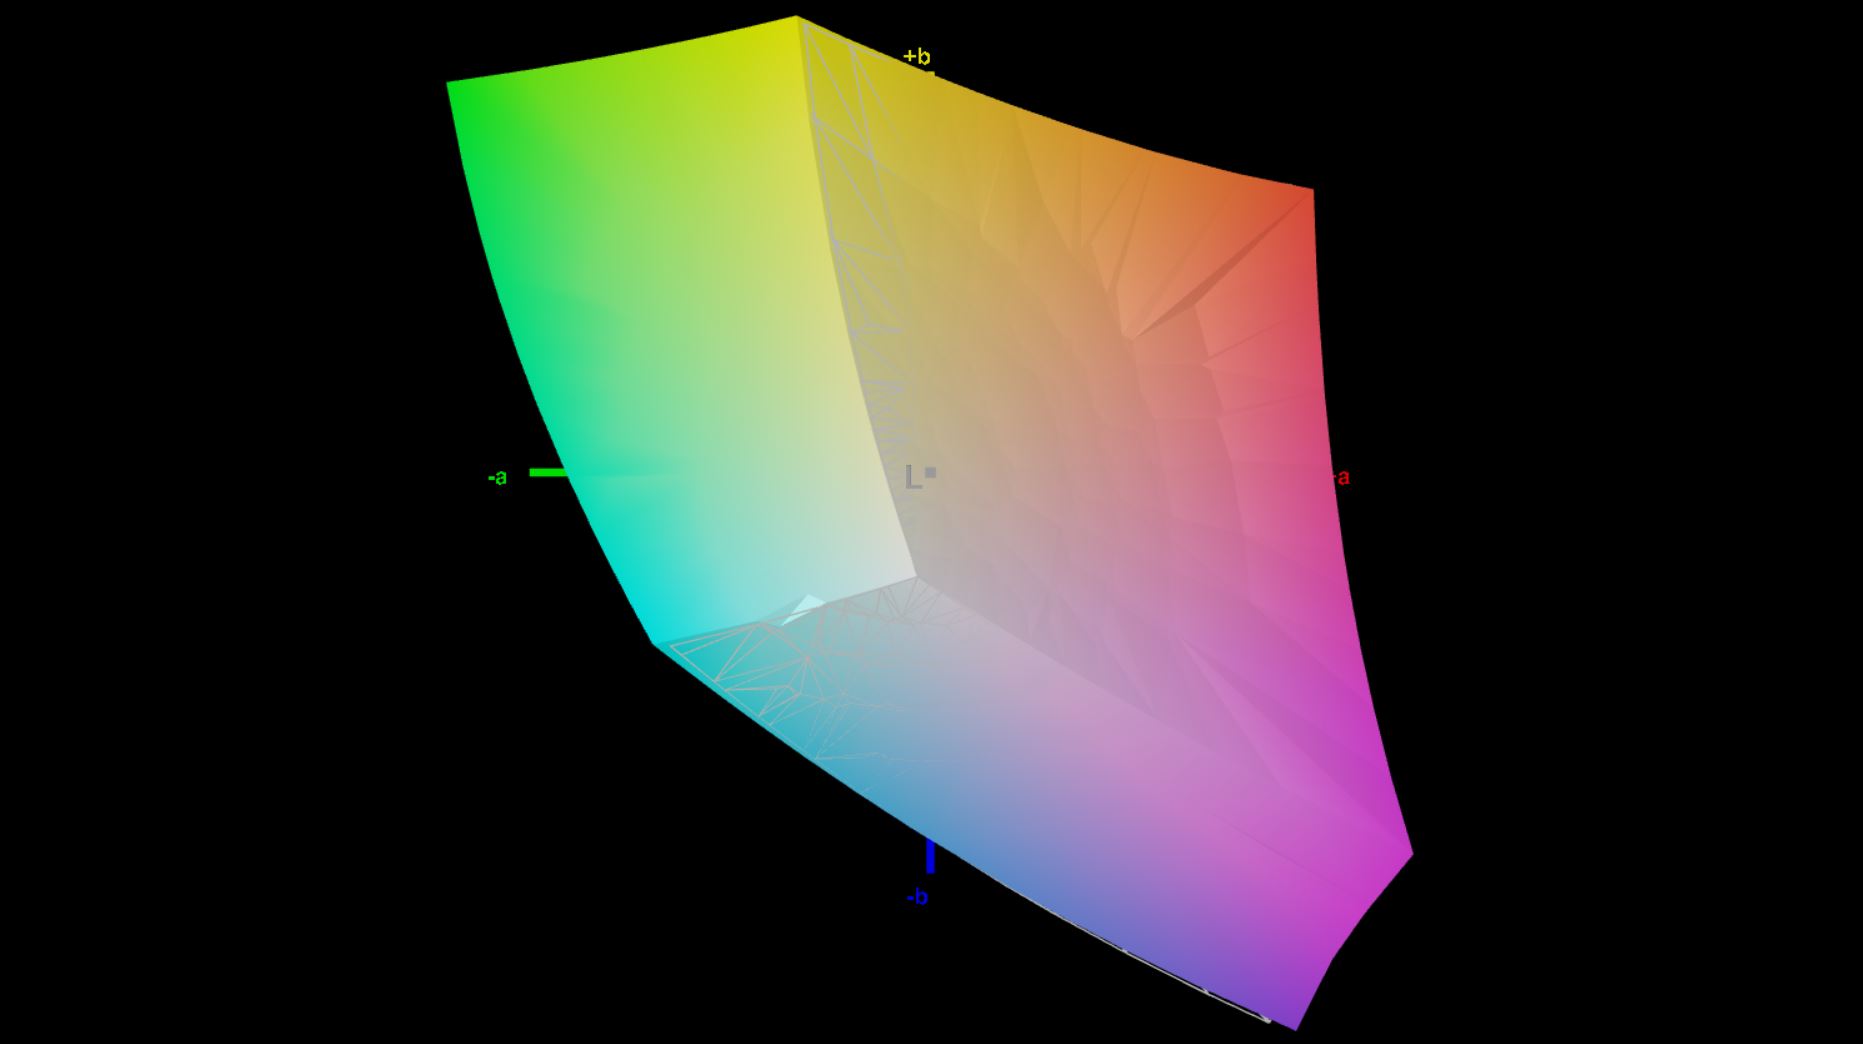
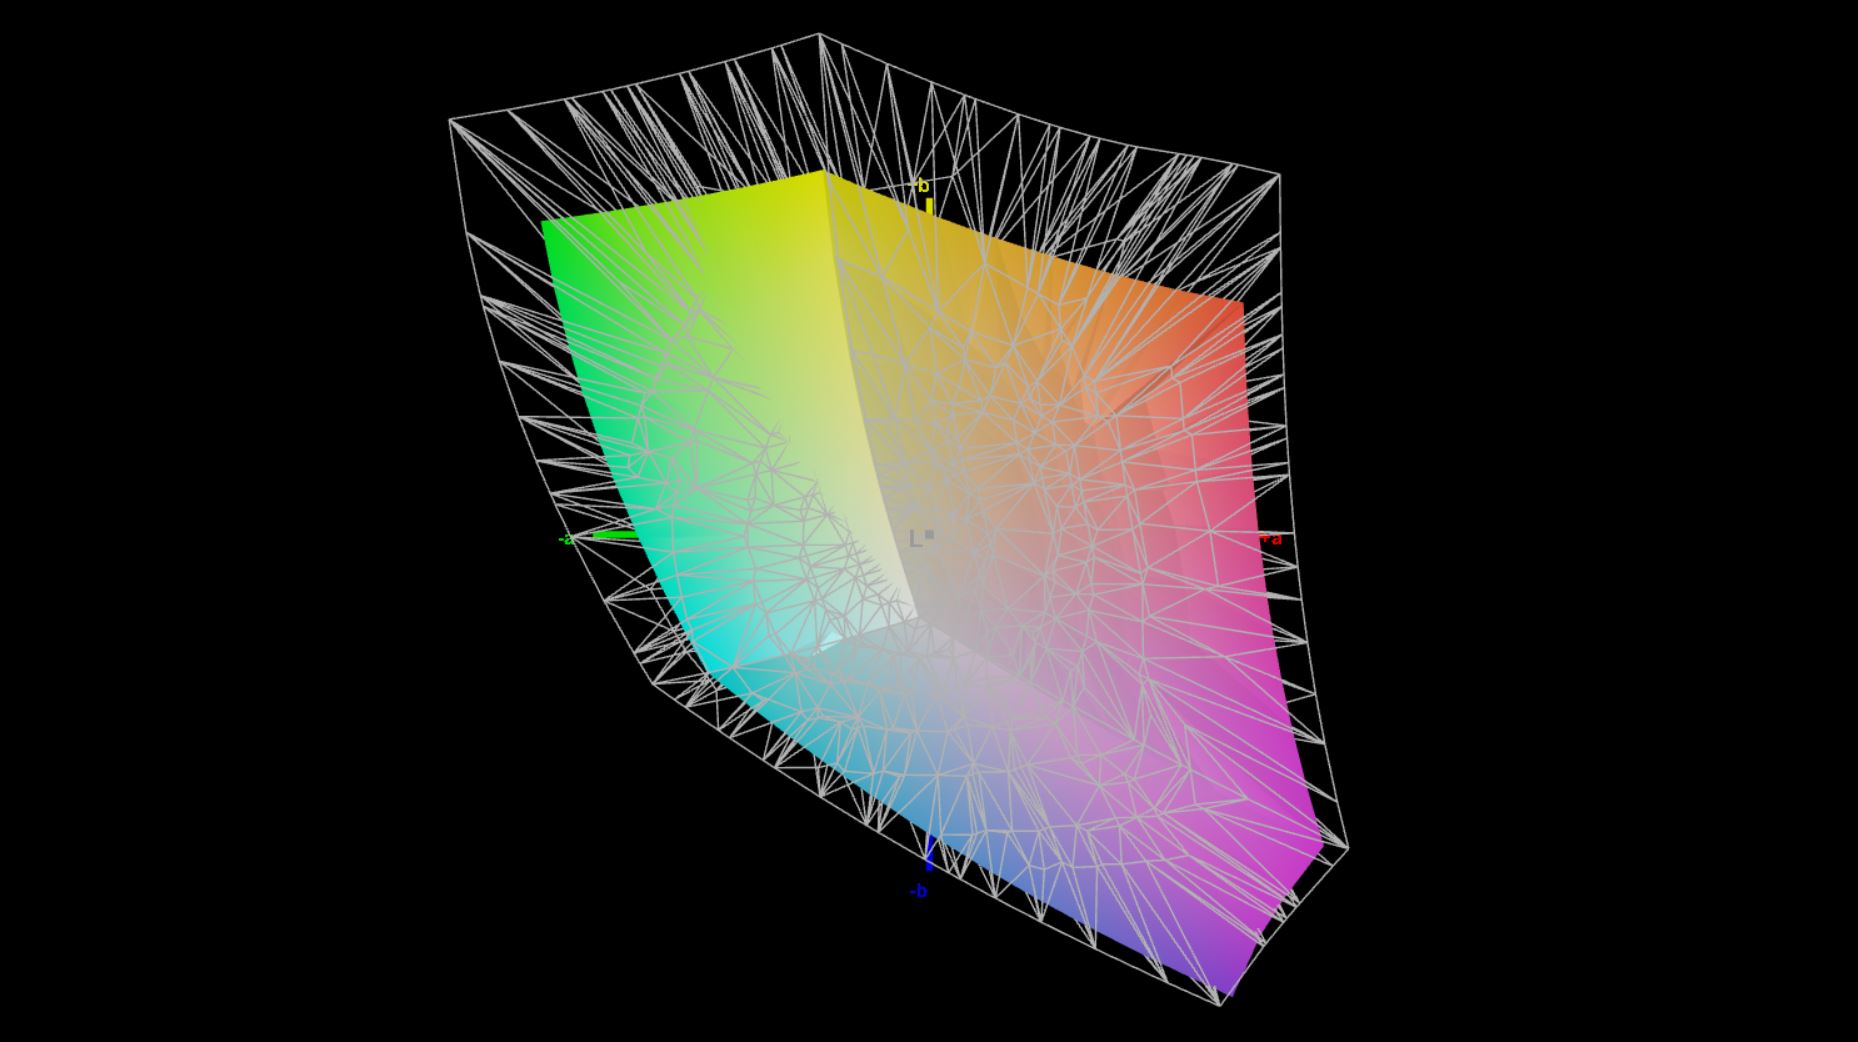
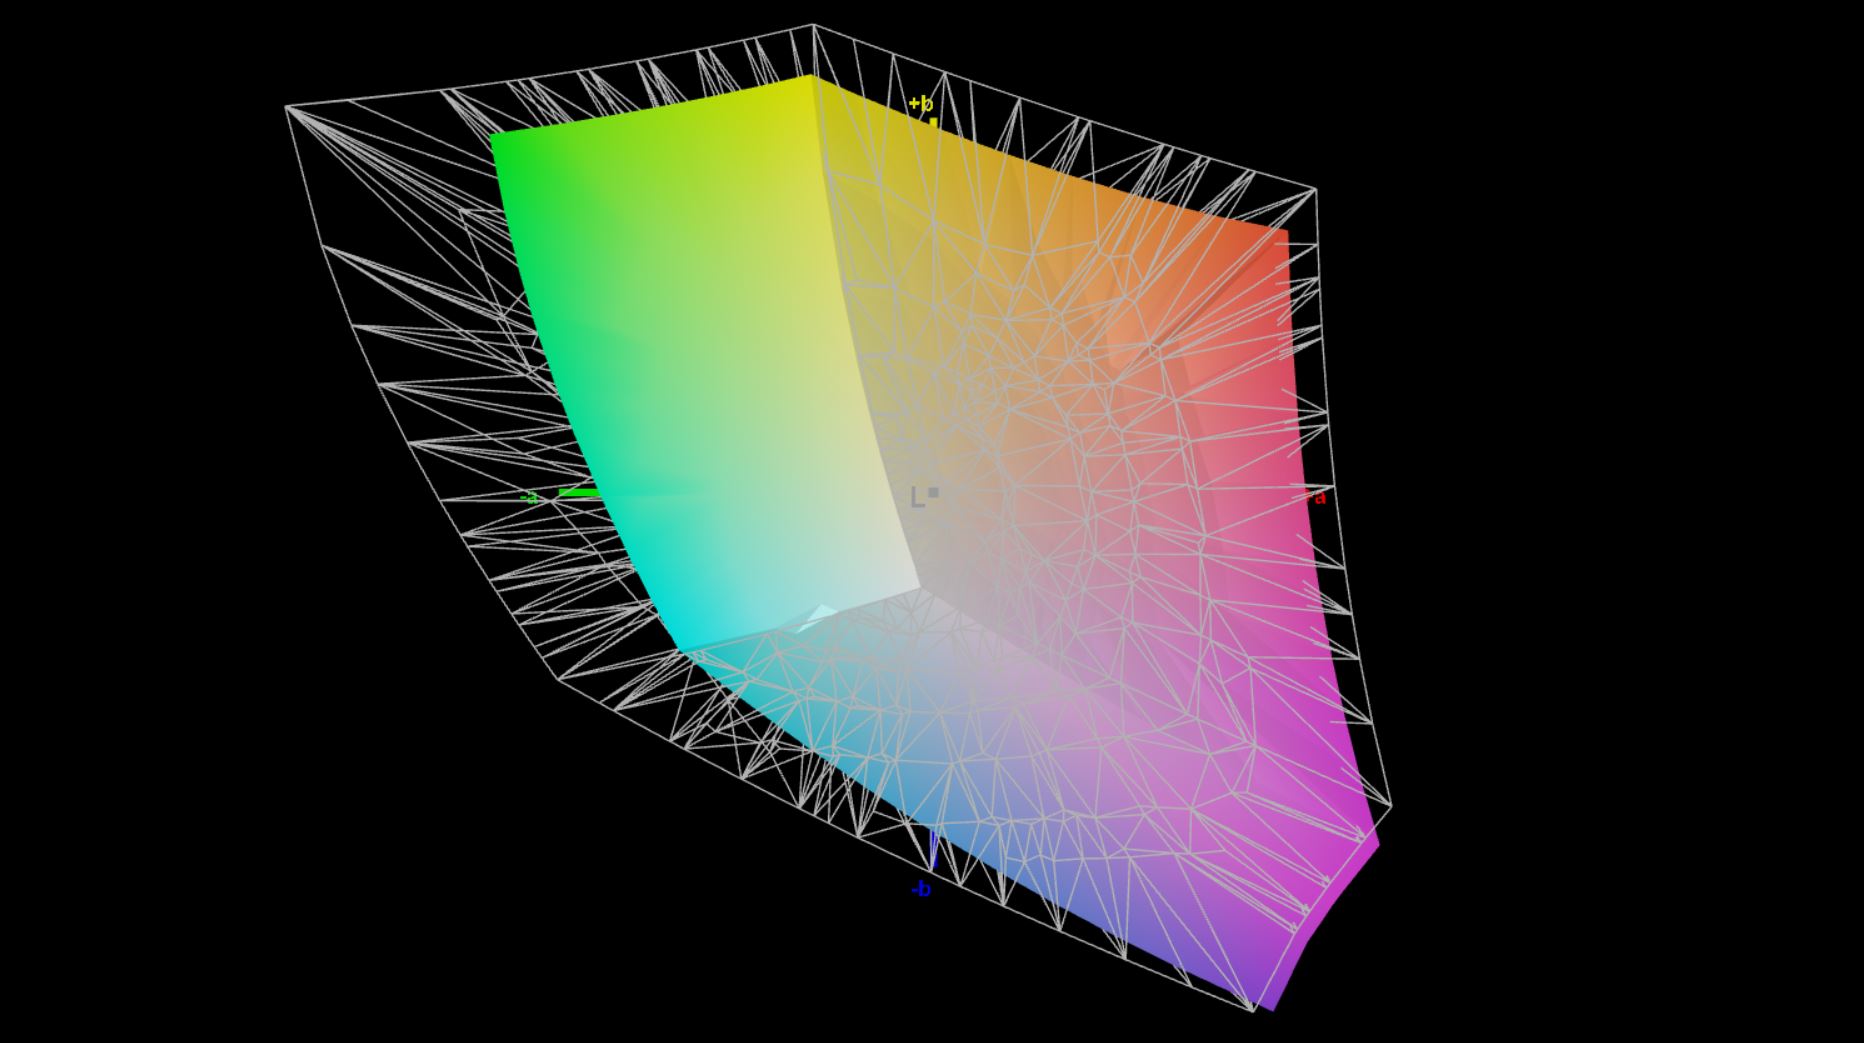
71.1% AdobeRGB 1998 (Argyll 3D)
99.7% sRGB (Argyll 3D)
71.1% Display P3 (Argyll 3D)
Gamma: 2.24
CCT: 6429 K
| Lenovo ThinkPad X13 G2 20WK0024GE NV133WUM-N61, IPS, 1920x1200, 13.3" | Dell XPS 13 9310 Core i7 FHD Sharp LQ134N1, IPS, 1920x1200, 13.4" | Apple MacBook Pro 13 Late 2020 M1 Entry (8 / 256 GB) IPS, 2560x1600, 13.3" | HP EliteBook 830 G7 Chi Mei CMN13A9, IPS, 1920x1080, 13.3" | Huawei MateBook X Pro 2021 TIANMA XM, IPS, 3000x2000, 13.9" | Lenovo ThinkPad X13-20UGS00800 B133HAK01.1, IPS LED, 1920x1080, 13.3" | Lenovo ThinkPad X13 Yoga G2 LP133WQ1-SPF2, IPS LED, 2560x1600, 13.3" | |
|---|---|---|---|---|---|---|---|
| Display | 1% | -5% | -7% | -7% | -2% | ||
| Display P3 Coverage (%) | 71.1 | 70.9 0% | 65.7 -8% | 64.9 -9% | 64.8 -9% | 68.3 -4% | |
| sRGB Coverage (%) | 99.7 | 99.1 -1% | 97.4 -2% | 94.4 -5% | 95.6 -4% | 99.1 -1% | |
| AdobeRGB 1998 Coverage (%) | 71.1 | 72.9 3% | 67.4 -5% | 66.3 -7% | 65.7 -8% | 70.3 -1% | |
| Response Times | -81% | -52% | -69% | -38% | -79% | -78% | |
| Response Time Grey 50% / Grey 80% * (ms) | 30.8 ? | 52 ? -69% | 48 ? -56% | 46.8 ? -52% | 37.6 ? -22% | 56.8 ? -84% | 52 ? -69% |
| Response Time Black / White * (ms) | 17.2 ? | 33.2 ? -93% | 25.2 ? -47% | 32 ? -86% | 26.4 ? -53% | 30 ? -74% | 32 ? -86% |
| PWM Frequency (Hz) | 2475 ? | 122000 ? | 26600 ? | ||||
| Screen | 2% | 37% | 2% | 24% | -23% | 30% | |
| Brightness middle (cd/m²) | 320 | 543.3 70% | 510 59% | 454.5 42% | 502 57% | 331 3% | 460 44% |
| Brightness (cd/m²) | 310 | 524 69% | 491 58% | 435 40% | 474 53% | 315 2% | 423 36% |
| Brightness Distribution (%) | 89 | 92 3% | 94 6% | 91 2% | 89 0% | 90 1% | 85 -4% |
| Black Level * (cd/m²) | 0.24 | 0.38 -58% | 0.29 -21% | 0.27 -13% | 0.33 -38% | 0.21 12% | 0.33 -38% |
| Contrast (:1) | 1333 | 1430 7% | 1759 32% | 1683 26% | 1521 14% | 1576 18% | 1394 5% |
| Colorchecker dE 2000 * | 2.7 | 3.02 -12% | 1.3 52% | 3.12 -16% | 1.35 50% | 6.1 -126% | 1 63% |
| Colorchecker dE 2000 max. * | 7.6 | 7.61 -0% | 3 61% | 4.85 36% | 3.67 52% | 10 -32% | 1.5 80% |
| Colorchecker dE 2000 calibrated * | 0.9 | 1.23 -37% | 1.97 -119% | 1.2 -33% | 1.2 -33% | 0.8 11% | |
| Greyscale dE 2000 * | 4.1 | 5 -22% | 2 51% | 3.1 24% | 1.7 59% | 6.3 -54% | 1.2 71% |
| Gamma | 2.24 98% | 2.02 109% | 2.23 99% | 2.01 109% | 2.24 98% | 2.77 79% | 2.26 97% |
| CCT | 6429 101% | 6550 99% | 6933 94% | 6902 94% | 6440 101% | 6938 94% | 6652 98% |
| Color Space (Percent of AdobeRGB 1998) (%) | 66.8 | 88.3 | 61.5 | 61.1 | 60.7 | 64.4 | |
| Color Space (Percent of sRGB) (%) | 99.6 | 100 | 97 | 94.3 | 95.4 | 99.12 | |
| Total Average (Program / Settings) | -26% /
-10% | -8% /
20% | -24% /
-9% | -7% /
8% | -36% /
-28% | -17% /
8% |
* ... smaller is better
The color accuracy is already very good out of the box and all colors are within the target deviation of 3 compared to the sRGB color reference. Our display analysis with the professional CalMAN software reveals a slight color cast in the grayscale towards pink. However, this is only noticeable in direct comparison with a calibrated screen.
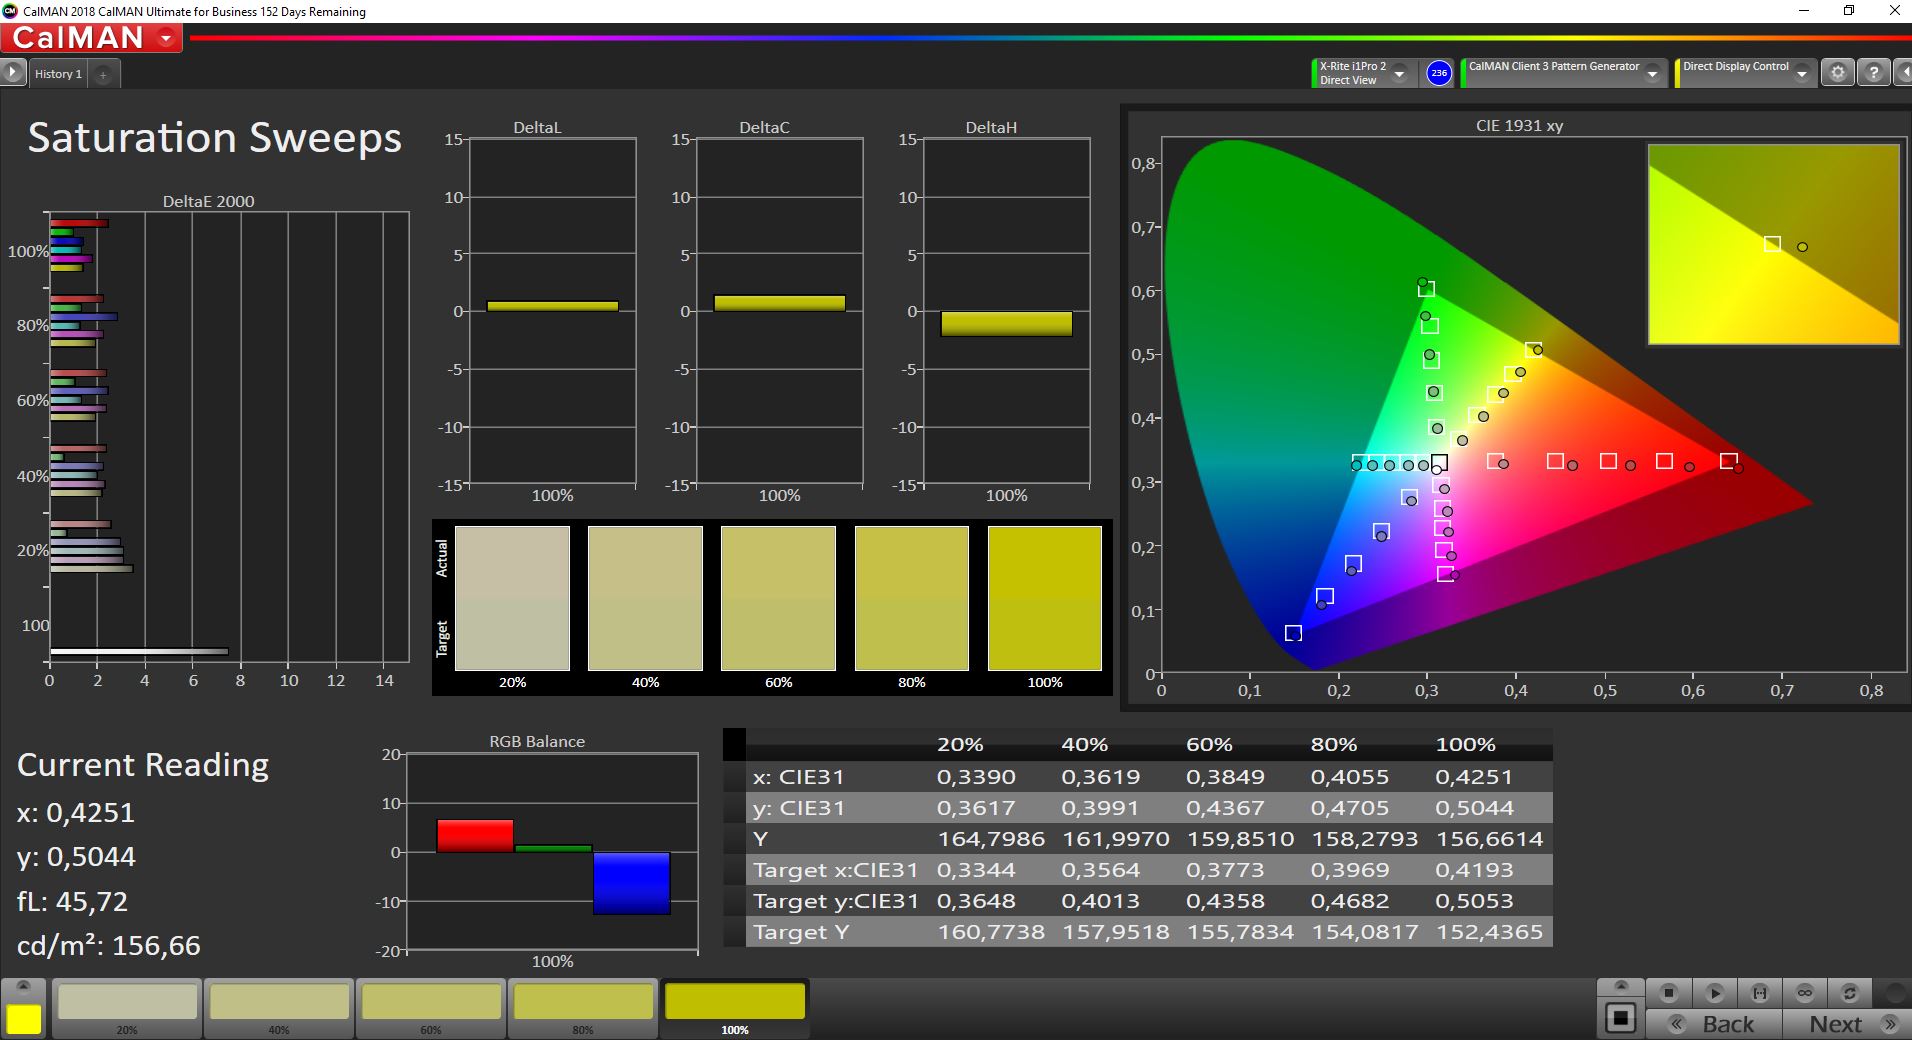
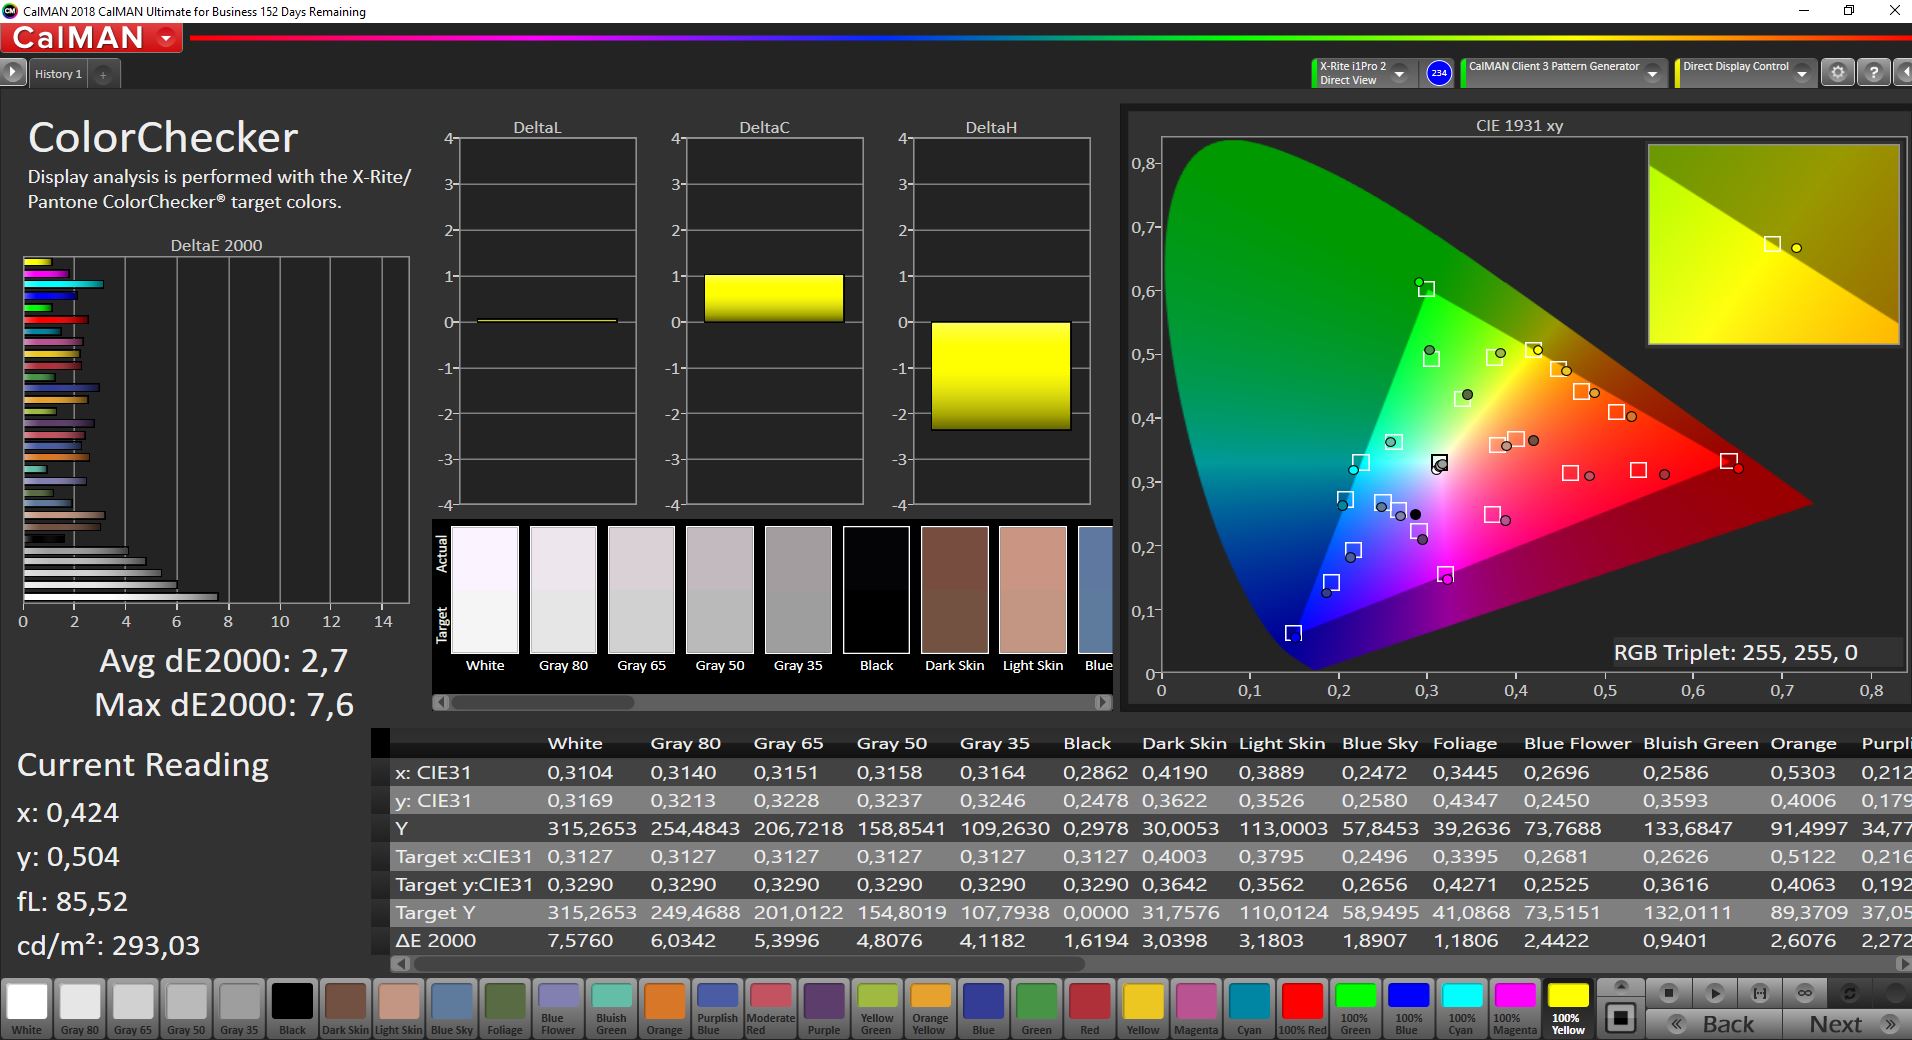
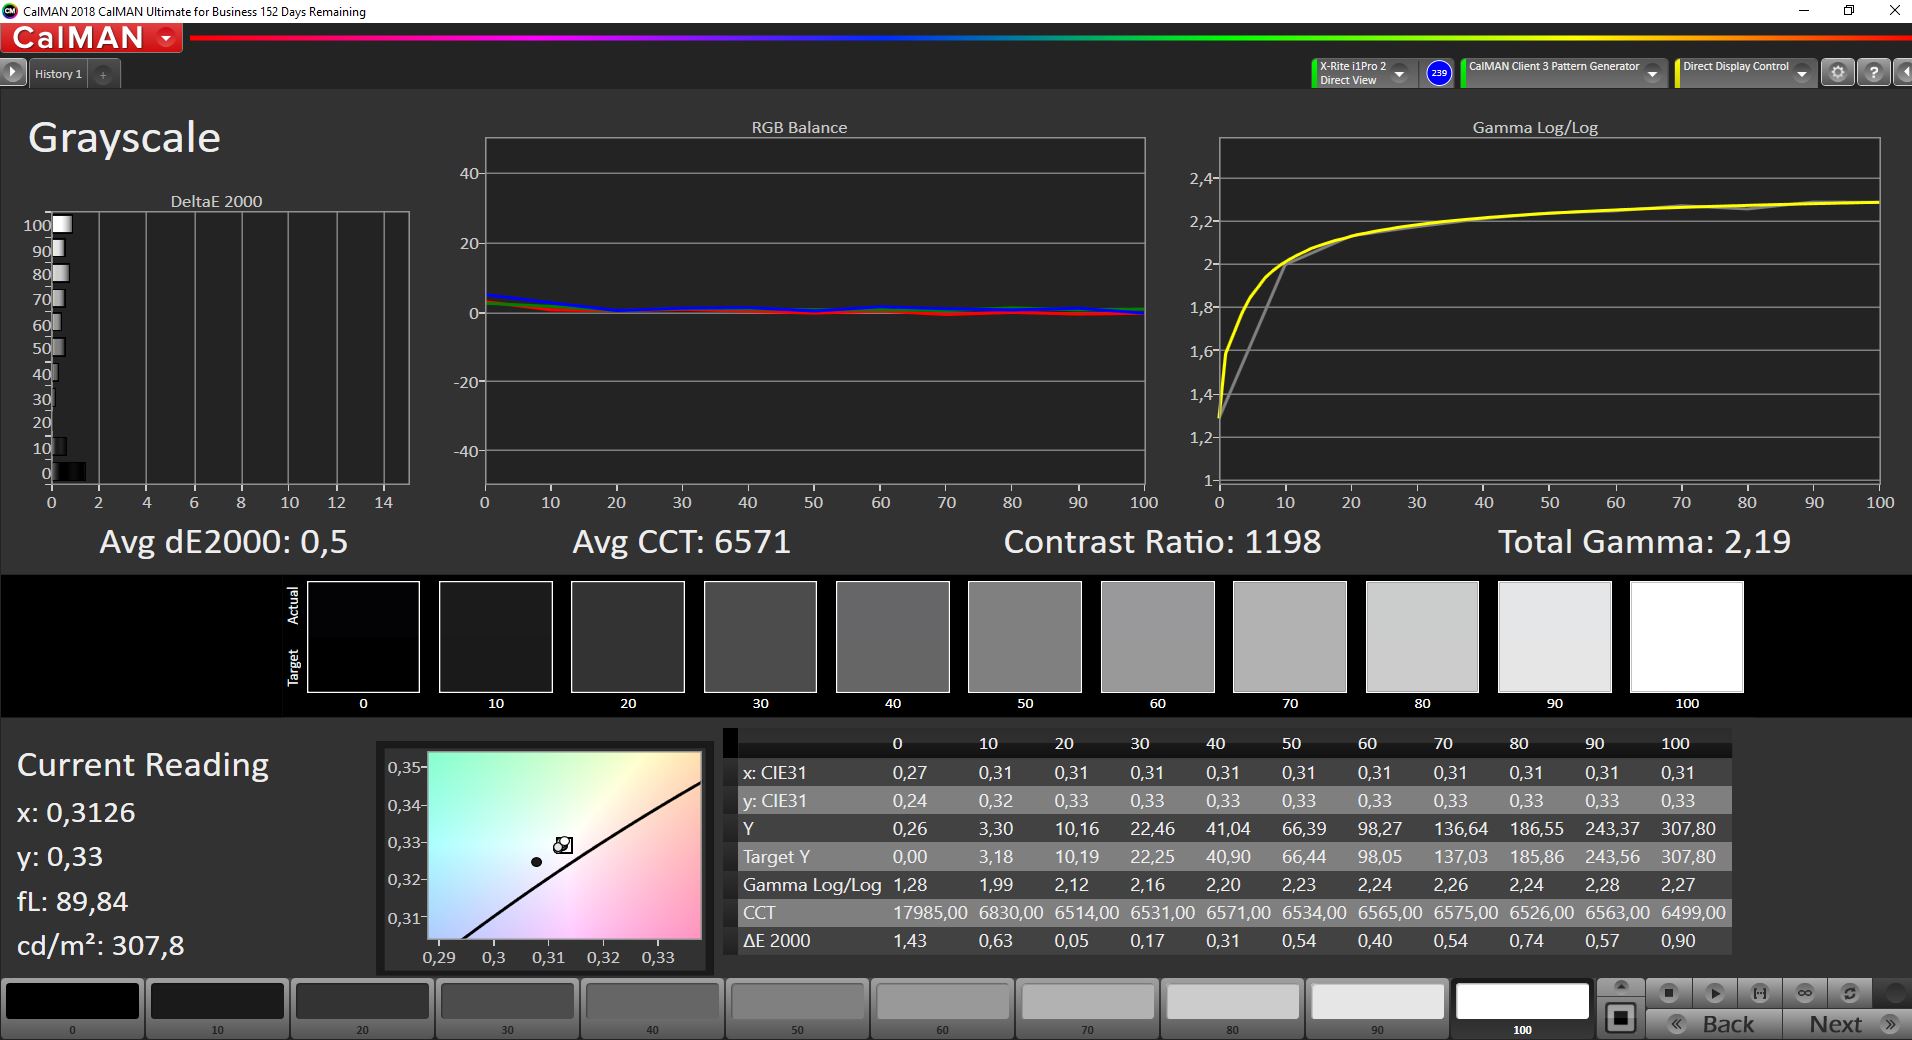
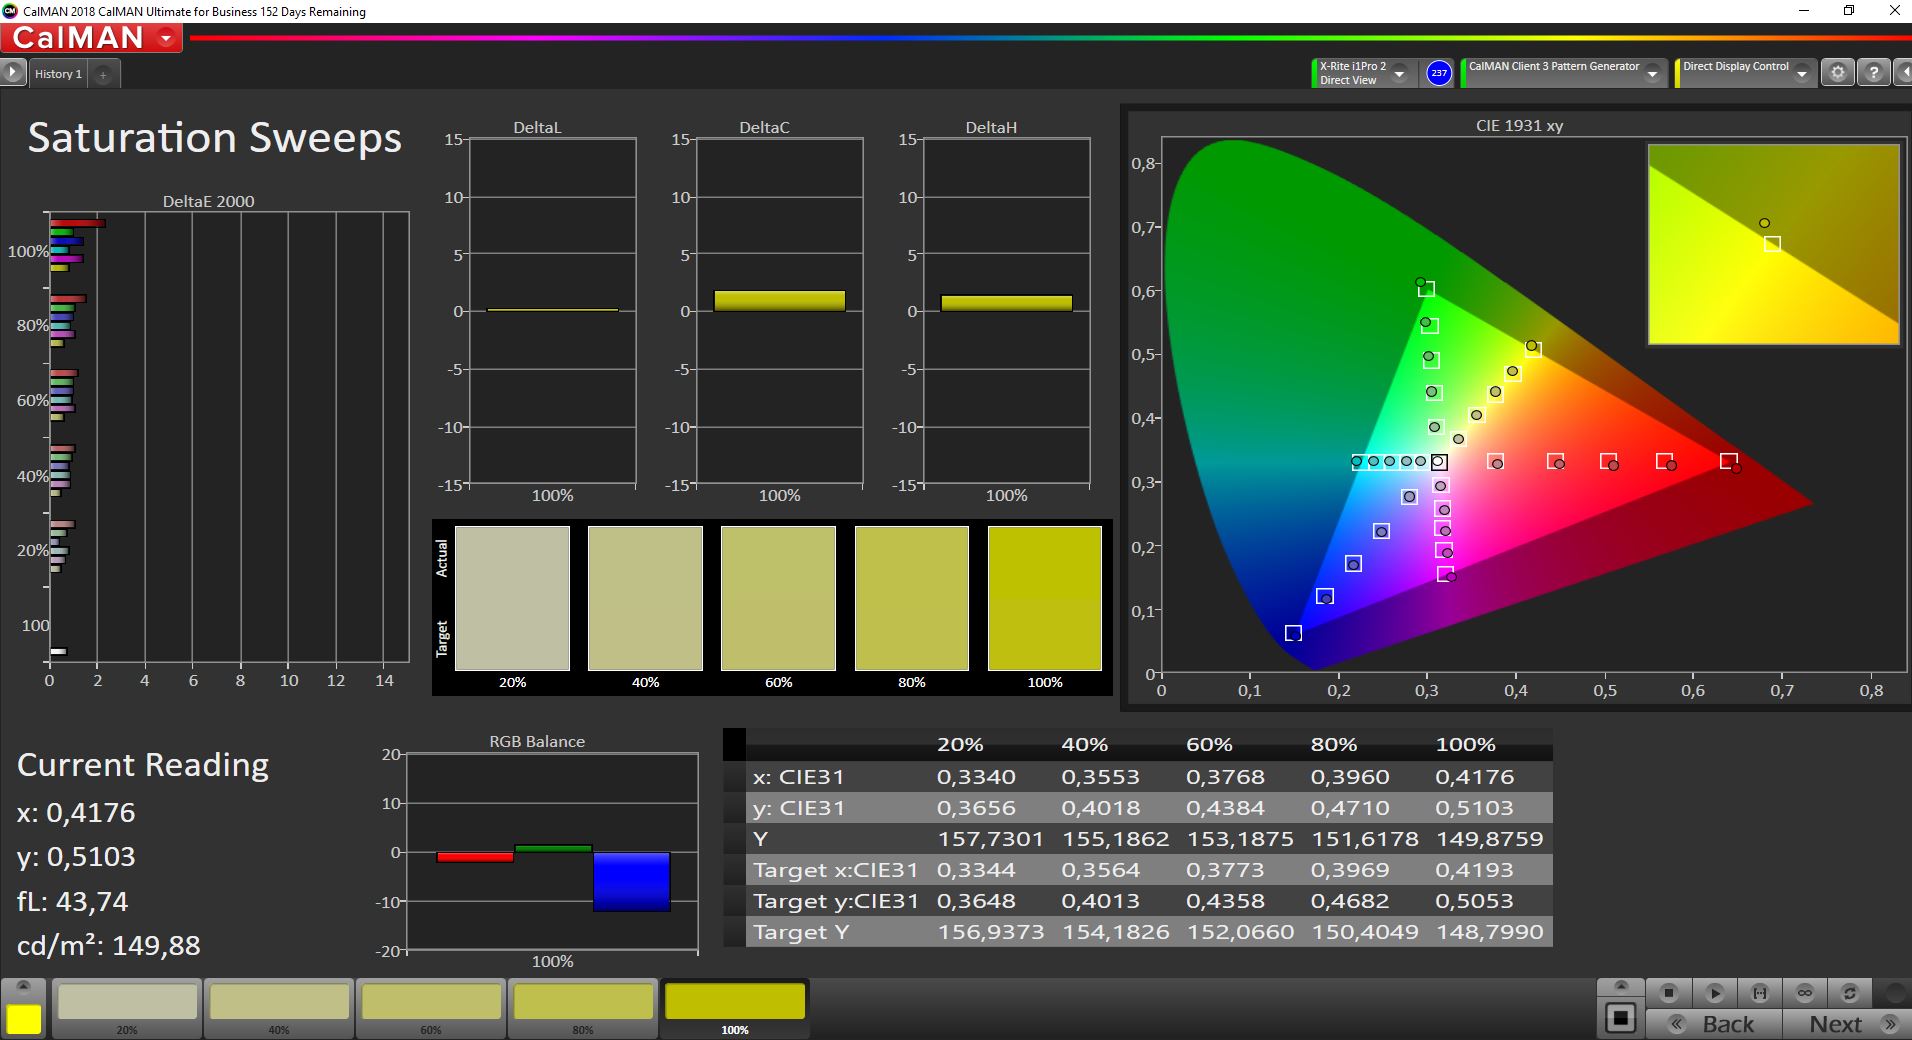
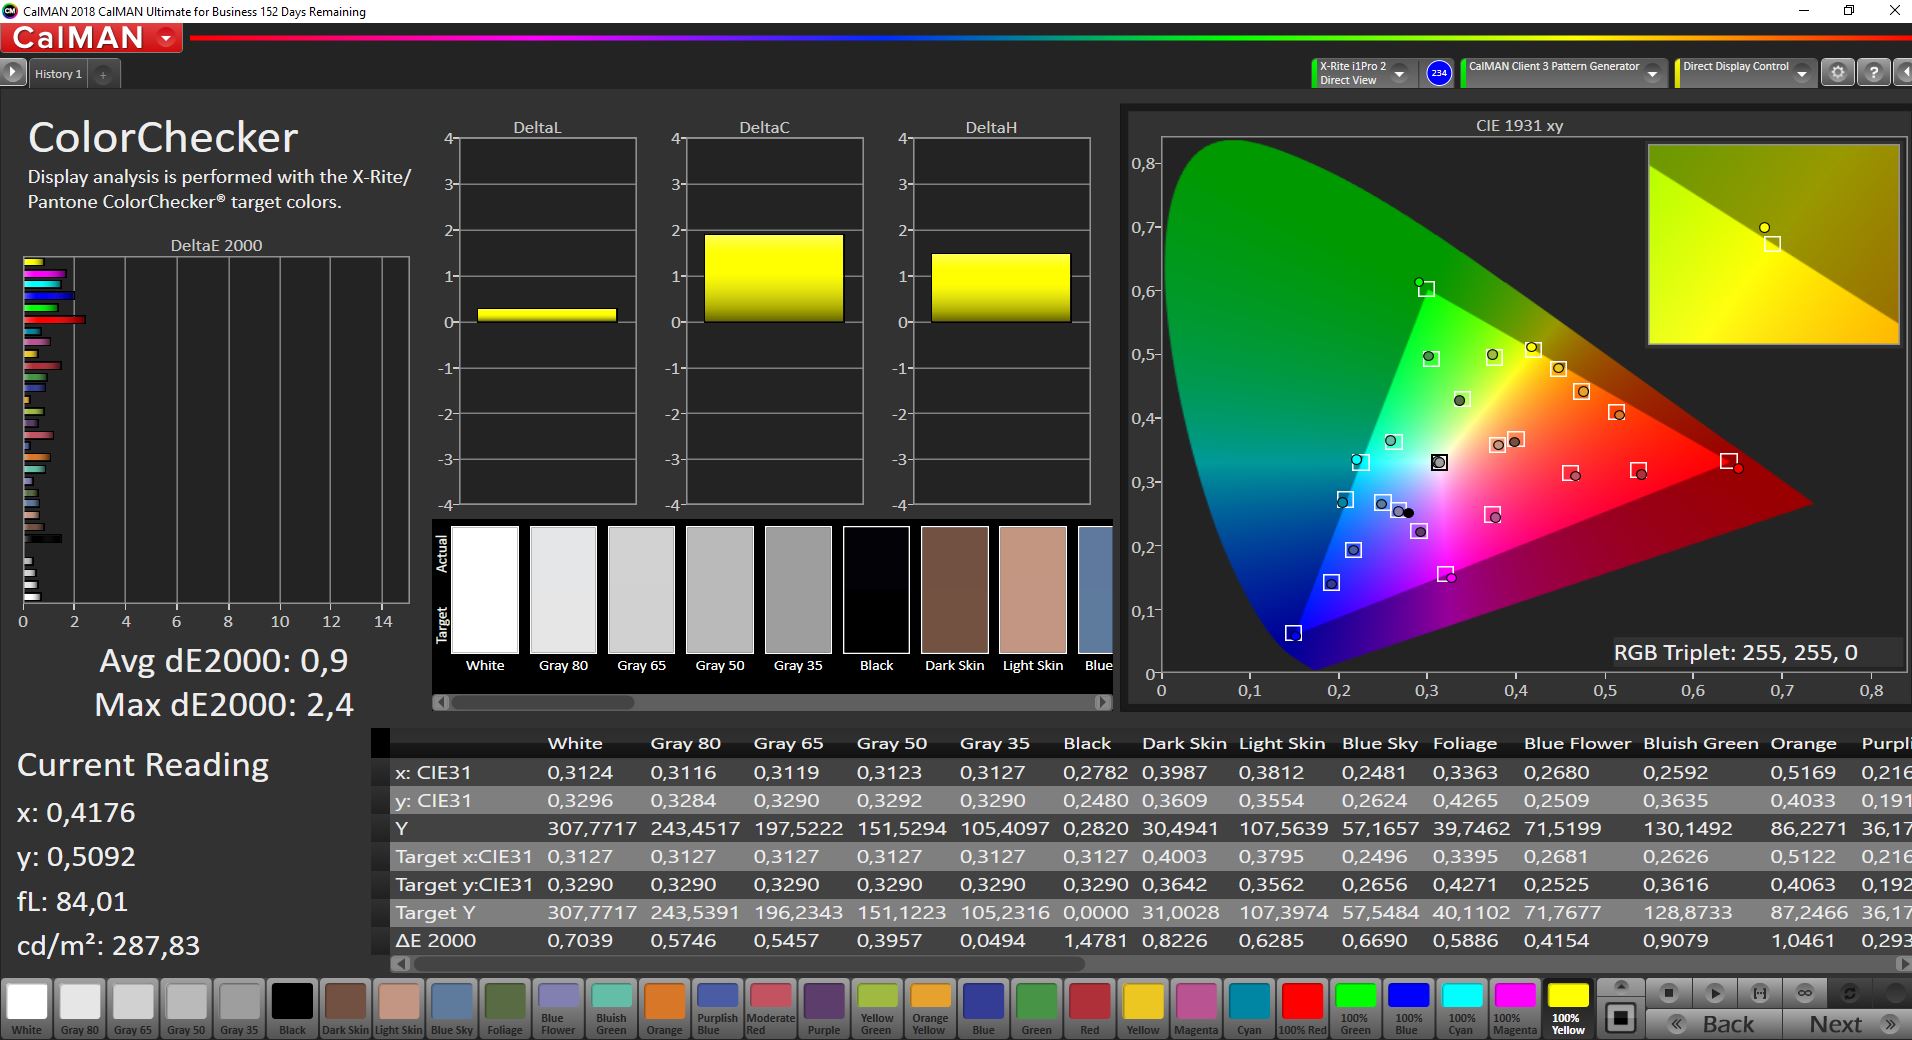
We did calibrate the panel with the X-Rite i1 Pro 2 spectrophotometer (the profile can be downloaded for free above) and we managed to improve both the grayscale as well as the colors. The small sRGB color space is covered completely, which means the panel is suited for picture/video editing.
Display Response Times
| ↔ Response Time Black to White | ||
|---|---|---|
| 17.2 ms ... rise ↗ and fall ↘ combined | ↗ 8.4 ms rise | 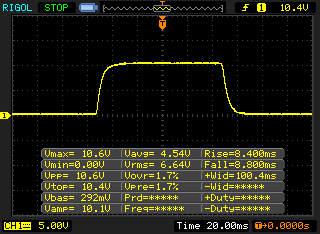 |
| ↘ 8.8 ms fall | ||
| The screen shows good response rates in our tests, but may be too slow for competitive gamers. In comparison, all tested devices range from 0.1 (minimum) to 240 (maximum) ms. » 39 % of all devices are better. This means that the measured response time is better than the average of all tested devices (19.8 ms). | ||
| ↔ Response Time 50% Grey to 80% Grey | ||
| 30.8 ms ... rise ↗ and fall ↘ combined | ↗ 14.8 ms rise | 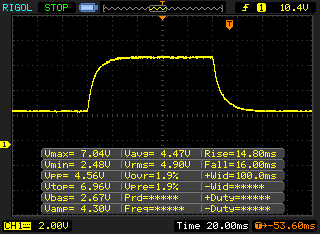 |
| ↘ 16 ms fall | ||
| The screen shows slow response rates in our tests and will be unsatisfactory for gamers. In comparison, all tested devices range from 0.165 (minimum) to 636 (maximum) ms. » 41 % of all devices are better. This means that the measured response time is similar to the average of all tested devices (31 ms). | ||
Screen Flickering / PWM (Pulse-Width Modulation)
| Screen flickering / PWM not detected |  | ||
In comparison: 52 % of all tested devices do not use PWM to dim the display. If PWM was detected, an average of 7747 (minimum: 5 - maximum: 343500) Hz was measured. | |||
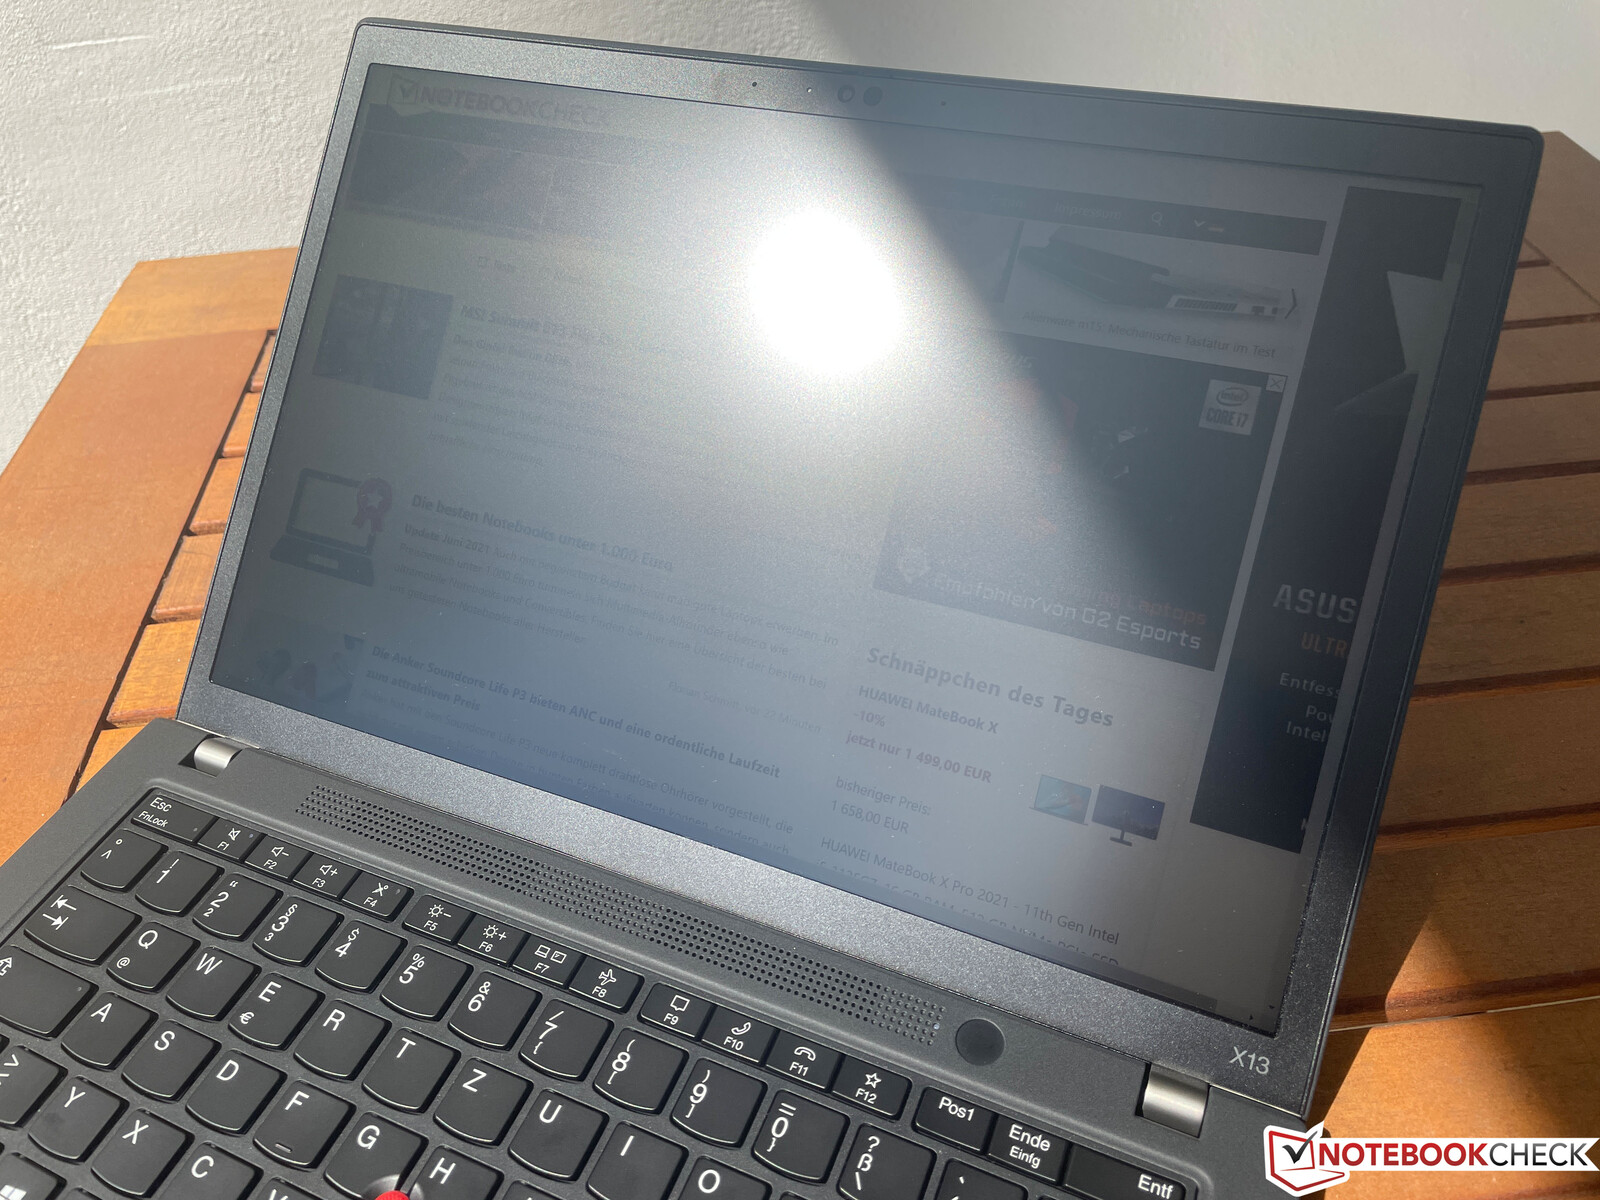
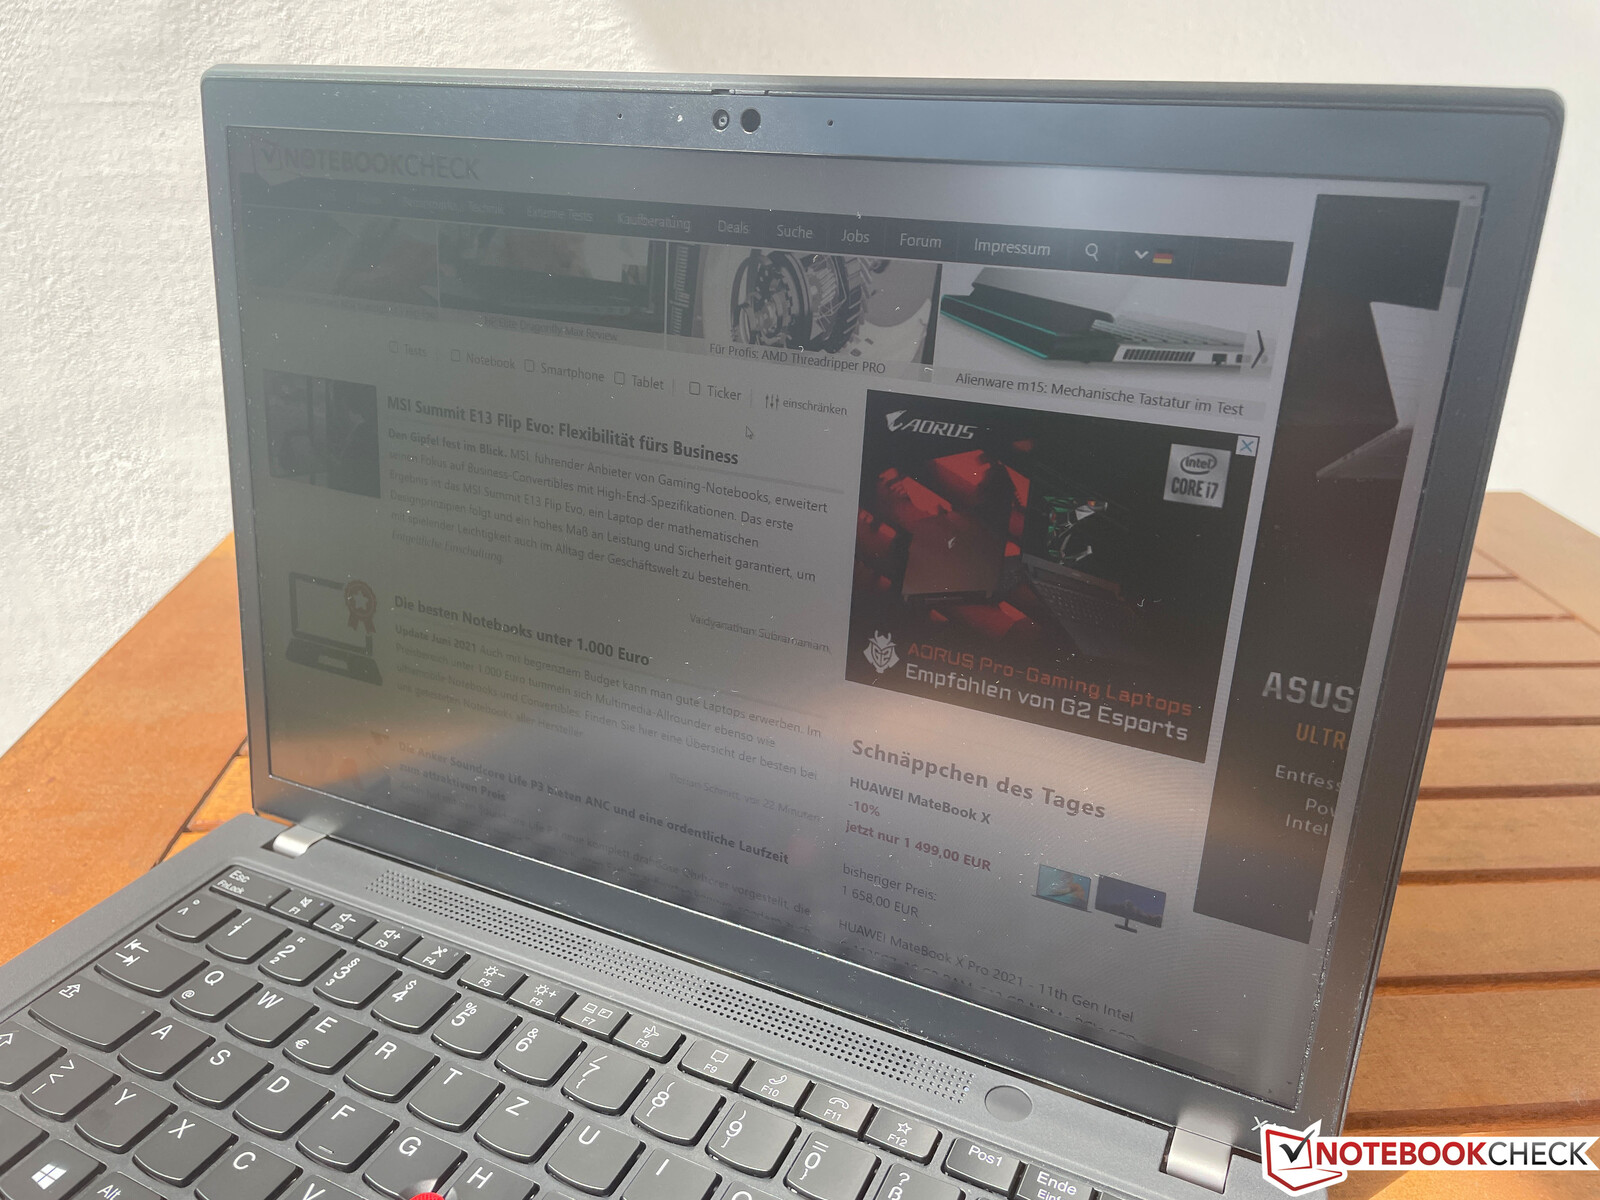
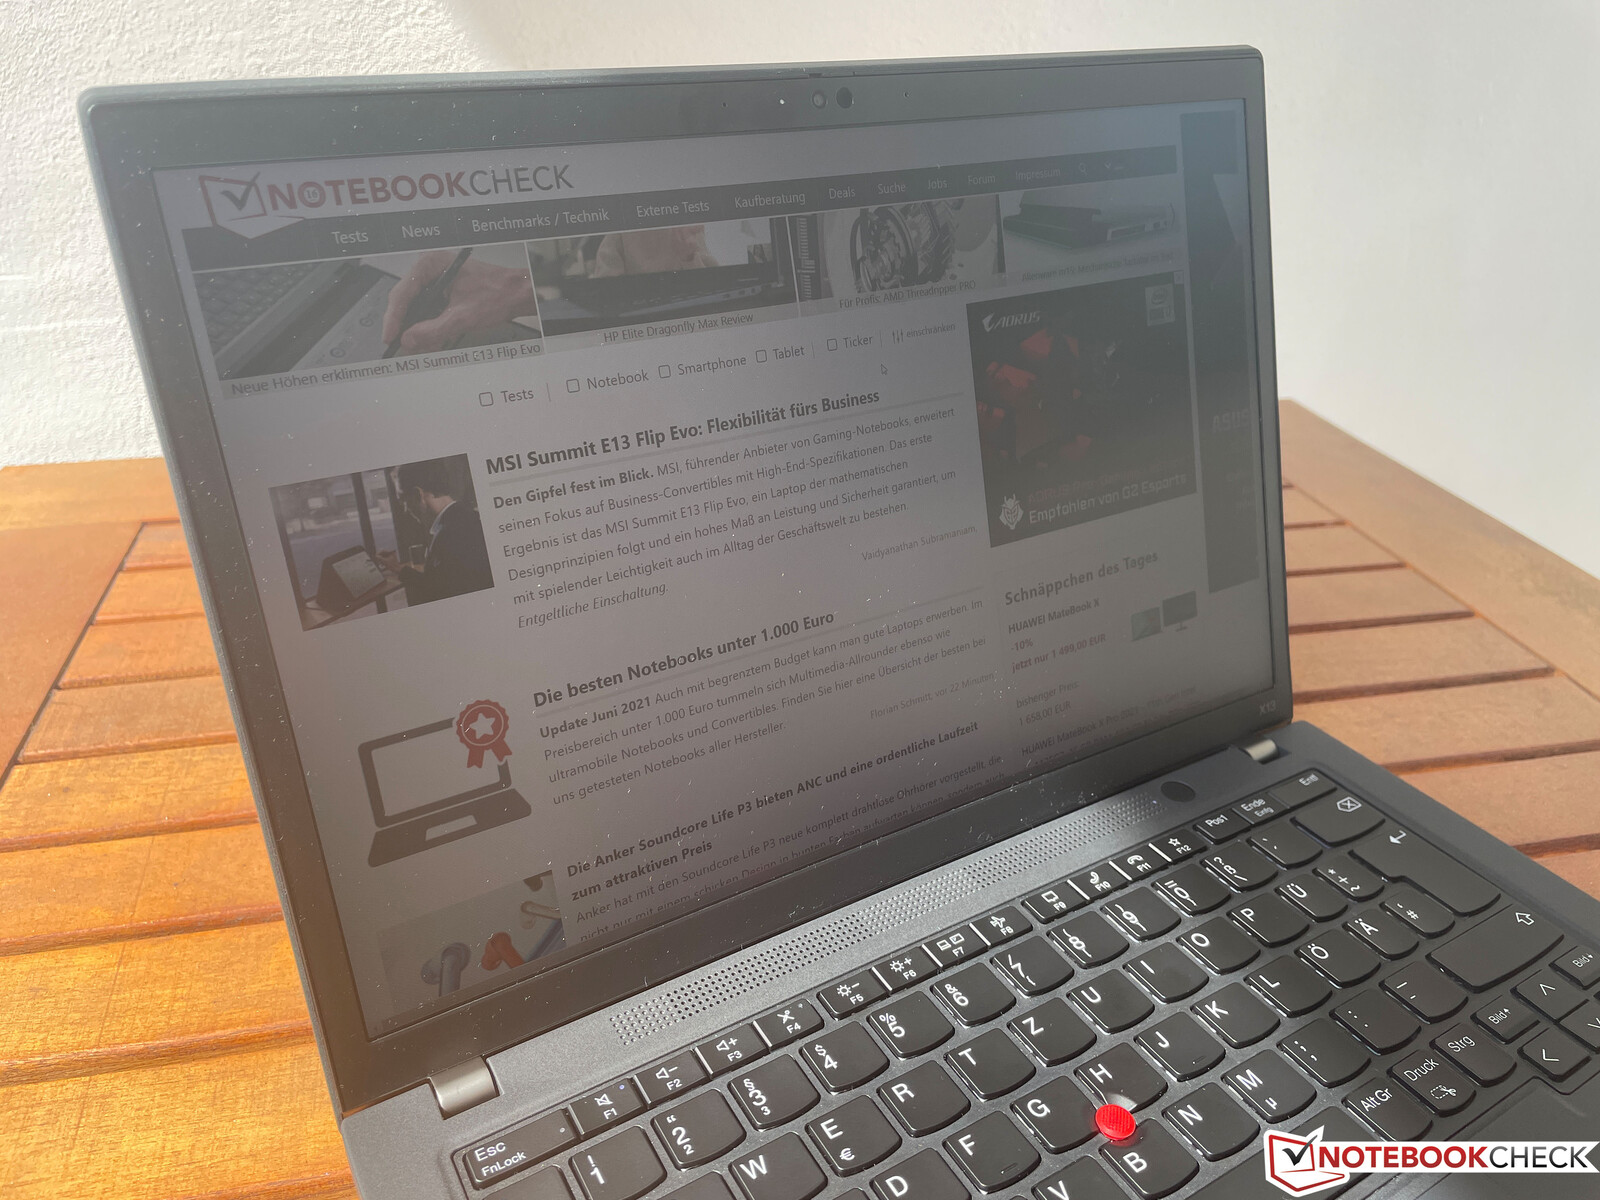
It is no problem to use the X13 G2 outdoors thanks to the matte panel. You can even see the content in very bright environments as long as you avoid direct sunlight. We would still have appreciated a brighter panel for more viewing comfort.
Performance - Tiger Lake and soldered RAM
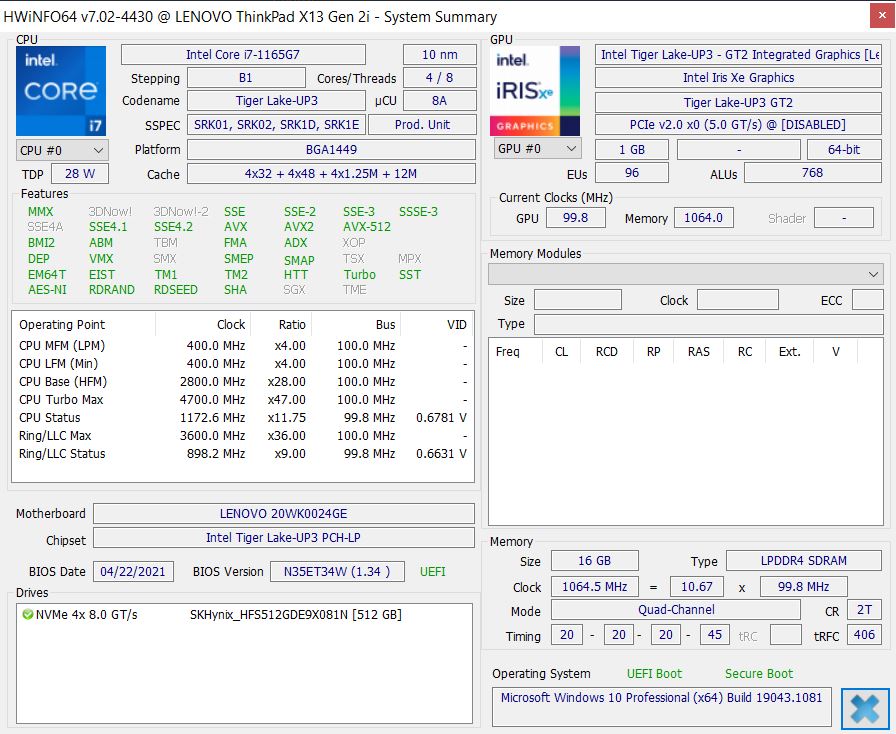
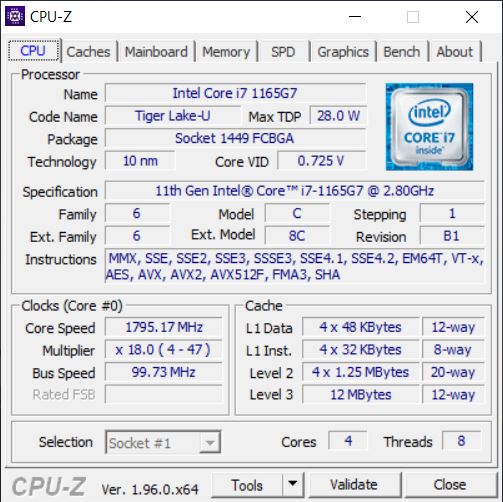
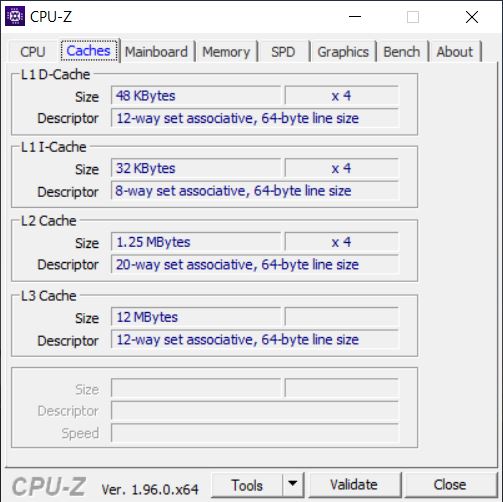
Processor - Core i7-1165G7
Our review unit uses the familiar Tiger Lake processor Core i7-1165G7 (UP3) with a maximum clock of 4.7 GHz for one core or up to 4.1 GHz when you stress all four cores (8 threads). More information about the processor is available here.
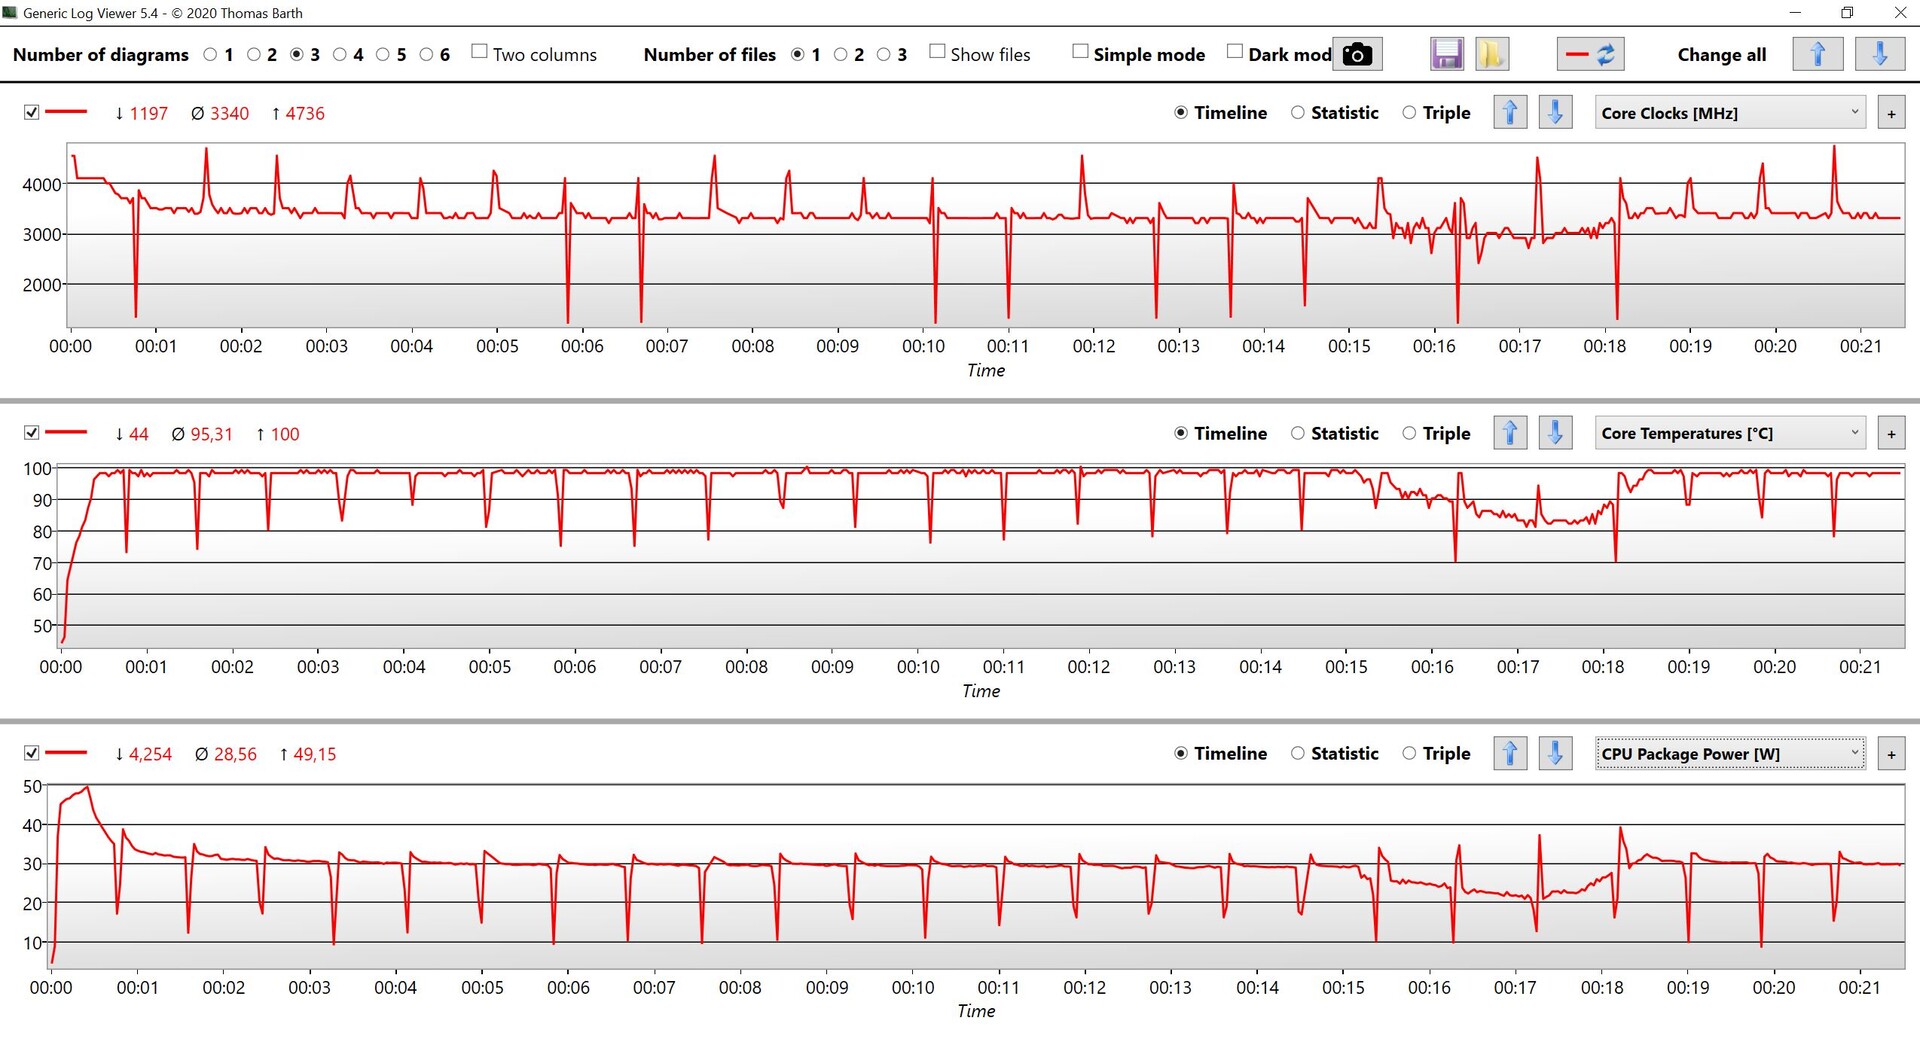
Lenovo sets the power limits very generously and we can really see the maximum clock of 4.1 GHz (equals ~50W) at the beginning of the benchmarks. After a little while, however, the value levels off at 4x 3.3 GHz and 30W. All in all good results, but the processor often scratches the 100 °C mark. We can see a small performance drop after around 15 minutes, but the performance quickly stabilizes again.
Cinebench R15 Multi Loop
How does the new X13 G2 perform compared to other Tiger Lake laptops and its predecessor? The Core i7 mainly benefits from the high clock in single-core benchmarks and the new X13 G2 is often at the top of the ranking. The performance is also decent and ahead of all other Intel based rivals (the predecessor with Comet Lake is beaten by 30%), but the old X13 G1 AMD is still noticeably faster. We are already eager to see the performance of the X13 G2 with the new Ryzen 5000 CPUs. We expect even better CPU better if the power limits are comparable. Apple's M1 CPU in the MacBook Pro 13 is just as fast when you stress one core, but it is much faster in native multi-core benchmarks (>30%).
The power consumption is limited to 30W on battery power, so there is just a small performance deficit of ~15% compared to mains.
Cinebench R20: CPU (Single Core) | CPU (Multi Core)
Cinebench R15: CPU Single 64Bit | CPU Multi 64Bit
Blender: v2.79 BMW27 CPU
7-Zip 18.03: 7z b 4 -mmt1 | 7z b 4
Geekbench 5.5: Single-Core | Multi-Core
HWBOT x265 Benchmark v2.2: 4k Preset
LibreOffice : 20 Documents To PDF
R Benchmark 2.5: Overall mean
| Cinebench R23 / Single Core | |
| Average of class Subnotebook (358 - 2213, n=61, last 2 years) | |
| Lenovo ThinkPad X13 G2 20WK0024GE | |
| Apple MacBook Pro 13 Late 2020 M1 Entry (8 / 256 GB) | |
| Average Intel Core i7-1165G7 (1110 - 1539, n=59) | |
| Huawei MateBook X Pro 2021 | |
| Cinebench R23 / Multi Core | |
| Average of class Subnotebook (1555 - 21812, n=60, last 2 years) | |
| Apple MacBook Pro 13 Late 2020 M1 Entry (8 / 256 GB) | |
| Lenovo ThinkPad X13 G2 20WK0024GE | |
| Average Intel Core i7-1165G7 (2525 - 6862, n=64) | |
| Huawei MateBook X Pro 2021 | |
| Cinebench R20 / CPU (Single Core) | |
| Average of class Subnotebook (128 - 832, n=57, last 2 years) | |
| Lenovo ThinkPad X13 G2 20WK0024GE | |
| Dell XPS 13 9310 Core i7 FHD | |
| Average Intel Core i7-1165G7 (442 - 589, n=81) | |
| Huawei MateBook X Pro 2021 | |
| Lenovo ThinkPad X13-20UGS00800 | |
| HP EliteBook 830 G7 | |
| Apple MacBook Pro 13 Late 2020 M1 Entry (8 / 256 GB) | |
| Lenovo ThinkPad X13-20T20033GE | |
| Cinebench R20 / CPU (Multi Core) | |
| Average of class Subnotebook (579 - 8541, n=57, last 2 years) | |
| Lenovo ThinkPad X13-20UGS00800 | |
| Lenovo ThinkPad X13 G2 20WK0024GE | |
| Apple MacBook Pro 13 Late 2020 M1 Entry (8 / 256 GB) | |
| Average Intel Core i7-1165G7 (1060 - 2657, n=81) | |
| Dell XPS 13 9310 Core i7 FHD | |
| Huawei MateBook X Pro 2021 | |
| HP EliteBook 830 G7 | |
| Lenovo ThinkPad X13-20T20033GE | |
| Cinebench R15 / CPU Single 64Bit | |
| Average of class Subnotebook (72.4 - 322, n=57, last 2 years) | |
| Lenovo ThinkPad X13 G2 20WK0024GE | |
| Dell XPS 13 9310 Core i7 FHD | |
| Average Intel Core i7-1165G7 (115 - 230, n=78) | |
| Huawei MateBook X Pro 2021 | |
| Apple MacBook Pro 13 Late 2020 M1 Entry (8 / 256 GB) | |
| Lenovo ThinkPad X13-20UGS00800 | |
| HP EliteBook 830 G7 | |
| Lenovo ThinkPad X13-20T20033GE | |
| Cinebench R15 / CPU Multi 64Bit | |
| Average of class Subnotebook (327 - 3345, n=57, last 2 years) | |
| Lenovo ThinkPad X13-20UGS00800 | |
| Apple MacBook Pro 13 Late 2020 M1 Entry (8 / 256 GB) | |
| Lenovo ThinkPad X13 G2 20WK0024GE | |
| Dell XPS 13 9310 Core i7 FHD | |
| Average Intel Core i7-1165G7 (553 - 1027, n=86) | |
| Lenovo ThinkPad X13-20T20033GE | |
| Huawei MateBook X Pro 2021 | |
| Blender / v2.79 BMW27 CPU | |
| Lenovo ThinkPad X13-20T20033GE | |
| Huawei MateBook X Pro 2021 | |
| HP EliteBook 830 G7 | |
| Dell XPS 13 9310 Core i7 FHD | |
| Average Intel Core i7-1165G7 (468 - 1138, n=80) | |
| Lenovo ThinkPad X13 G2 20WK0024GE | |
| Lenovo ThinkPad X13-20UGS00800 | |
| Average of class Subnotebook (159 - 2271, n=58, last 2 years) | |
| 7-Zip 18.03 / 7z b 4 -mmt1 | |
| Average of class Subnotebook (2643 - 6699, n=59, last 2 years) | |
| Dell XPS 13 9310 Core i7 FHD | |
| Lenovo ThinkPad X13 G2 20WK0024GE | |
| Average Intel Core i7-1165G7 (4478 - 5507, n=80) | |
| Huawei MateBook X Pro 2021 | |
| HP EliteBook 830 G7 | |
| Lenovo ThinkPad X13-20UGS00800 | |
| Lenovo ThinkPad X13-20T20033GE | |
| 7-Zip 18.03 / 7z b 4 | |
| Average of class Subnotebook (11668 - 77867, n=57, last 2 years) | |
| Lenovo ThinkPad X13-20UGS00800 | |
| Lenovo ThinkPad X13 G2 20WK0024GE | |
| Average Intel Core i7-1165G7 (15347 - 27405, n=80) | |
| HP EliteBook 830 G7 | |
| Dell XPS 13 9310 Core i7 FHD | |
| Huawei MateBook X Pro 2021 | |
| Lenovo ThinkPad X13-20T20033GE | |
| Geekbench 5.5 / Single-Core | |
| Average of class Subnotebook (726 - 2224, n=48, last 2 years) | |
| Apple MacBook Pro 13 Late 2020 M1 Entry (8 / 256 GB) | |
| Dell XPS 13 9310 Core i7 FHD | |
| Lenovo ThinkPad X13 G2 20WK0024GE | |
| Average Intel Core i7-1165G7 (1302 - 1595, n=77) | |
| Huawei MateBook X Pro 2021 | |
| HP EliteBook 830 G7 | |
| Lenovo ThinkPad X13-20UGS00800 | |
| Lenovo ThinkPad X13-20T20033GE | |
| Geekbench 5.5 / Multi-Core | |
| Average of class Subnotebook (2557 - 17218, n=48, last 2 years) | |
| Apple MacBook Pro 13 Late 2020 M1 Entry (8 / 256 GB) | |
| Dell XPS 13 9310 Core i7 FHD | |
| Lenovo ThinkPad X13 G2 20WK0024GE | |
| Lenovo ThinkPad X13-20UGS00800 | |
| Huawei MateBook X Pro 2021 | |
| Average Intel Core i7-1165G7 (3078 - 5926, n=77) | |
| Lenovo ThinkPad X13-20T20033GE | |
| HP EliteBook 830 G7 | |
| HWBOT x265 Benchmark v2.2 / 4k Preset | |
| Average of class Subnotebook (0.97 - 25.1, n=57, last 2 years) | |
| Lenovo ThinkPad X13-20UGS00800 | |
| Lenovo ThinkPad X13 G2 20WK0024GE | |
| Average Intel Core i7-1165G7 (1.39 - 8.47, n=80) | |
| Dell XPS 13 9310 Core i7 FHD | |
| Huawei MateBook X Pro 2021 | |
| HP EliteBook 830 G7 | |
| Lenovo ThinkPad X13-20T20033GE | |
| LibreOffice / 20 Documents To PDF | |
| HP EliteBook 830 G7 | |
| Lenovo ThinkPad X13-20UGS00800 | |
| Average of class Subnotebook (39.9 - 220, n=56, last 2 years) | |
| Lenovo ThinkPad X13-20T20033GE | |
| Average Intel Core i7-1165G7 (21.5 - 88.1, n=78) | |
| Dell XPS 13 9310 Core i7 FHD | |
| Lenovo ThinkPad X13 G2 20WK0024GE | |
| Huawei MateBook X Pro 2021 | |
| R Benchmark 2.5 / Overall mean | |
| Lenovo ThinkPad X13-20T20033GE | |
| HP EliteBook 830 G7 | |
| Lenovo ThinkPad X13-20UGS00800 | |
| Huawei MateBook X Pro 2021 | |
| Average Intel Core i7-1165G7 (0.552 - 1.002, n=80) | |
| Dell XPS 13 9310 Core i7 FHD | |
| Lenovo ThinkPad X13 G2 20WK0024GE | |
| Average of class Subnotebook (0.4024 - 1.456, n=58, last 2 years) | |
* ... smaller is better
System Performance
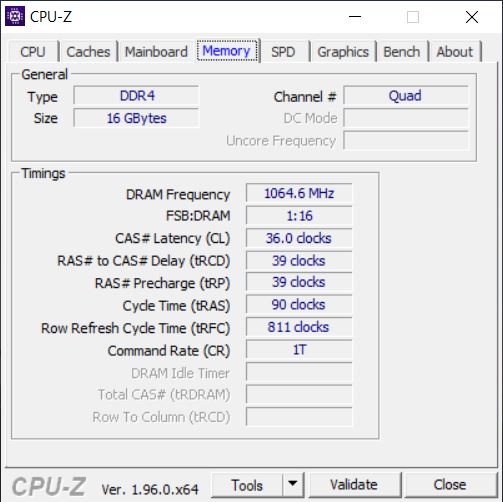
The subjective performance impression of the ThinkPad X13 G2 is very good an all inputs are executed without noticeable delays. The results in the synthetic benchmarks are also good, even though most comparison devices are very close thanks to similar components and you will not notice a difference in practice. The memory (LPDDR4x-4266) of the X13 G2 is now soldered and cannot be expanded. Considering the high price, we would recommend at least 16 GB; you can get up to 32 GB.
| PCMark 10 / Score | |
| Average of class Subnotebook (4920 - 9939, n=45, last 2 years) | |
| Lenovo ThinkPad X13 G2 20WK0024GE | |
| Average Intel Core i7-1165G7, Intel Iris Xe Graphics G7 96EUs (4531 - 5454, n=50) | |
| Lenovo ThinkPad X13-20UGS00800 | |
| Dell XPS 13 9310 Core i7 FHD | |
| Huawei MateBook X Pro 2021 | |
| HP EliteBook 830 G7 | |
| Lenovo ThinkPad X13-20T20033GE | |
| PCMark 10 / Essentials | |
| Average of class Subnotebook (8552 - 11646, n=45, last 2 years) | |
| Huawei MateBook X Pro 2021 | |
| Lenovo ThinkPad X13 G2 20WK0024GE | |
| Average Intel Core i7-1165G7, Intel Iris Xe Graphics G7 96EUs (8997 - 11505, n=50) | |
| Dell XPS 13 9310 Core i7 FHD | |
| Lenovo ThinkPad X13-20UGS00800 | |
| Lenovo ThinkPad X13-20T20033GE | |
| HP EliteBook 830 G7 | |
| PCMark 10 / Productivity | |
| Average of class Subnotebook (5435 - 16606, n=45, last 2 years) | |
| Lenovo ThinkPad X13-20UGS00800 | |
| HP EliteBook 830 G7 | |
| Lenovo ThinkPad X13 G2 20WK0024GE | |
| Dell XPS 13 9310 Core i7 FHD | |
| Lenovo ThinkPad X13-20T20033GE | |
| Huawei MateBook X Pro 2021 | |
| Average Intel Core i7-1165G7, Intel Iris Xe Graphics G7 96EUs (5570 - 7136, n=50) | |
| PCMark 10 / Digital Content Creation | |
| Average of class Subnotebook (5722 - 13779, n=45, last 2 years) | |
| Lenovo ThinkPad X13 G2 20WK0024GE | |
| Average Intel Core i7-1165G7, Intel Iris Xe Graphics G7 96EUs (4083 - 5550, n=50) | |
| Lenovo ThinkPad X13-20UGS00800 | |
| Dell XPS 13 9310 Core i7 FHD | |
| Huawei MateBook X Pro 2021 | |
| HP EliteBook 830 G7 | |
| Lenovo ThinkPad X13-20T20033GE | |
| PCMark 10 Score | 5105 points | |
Help | ||
DPC-Latency
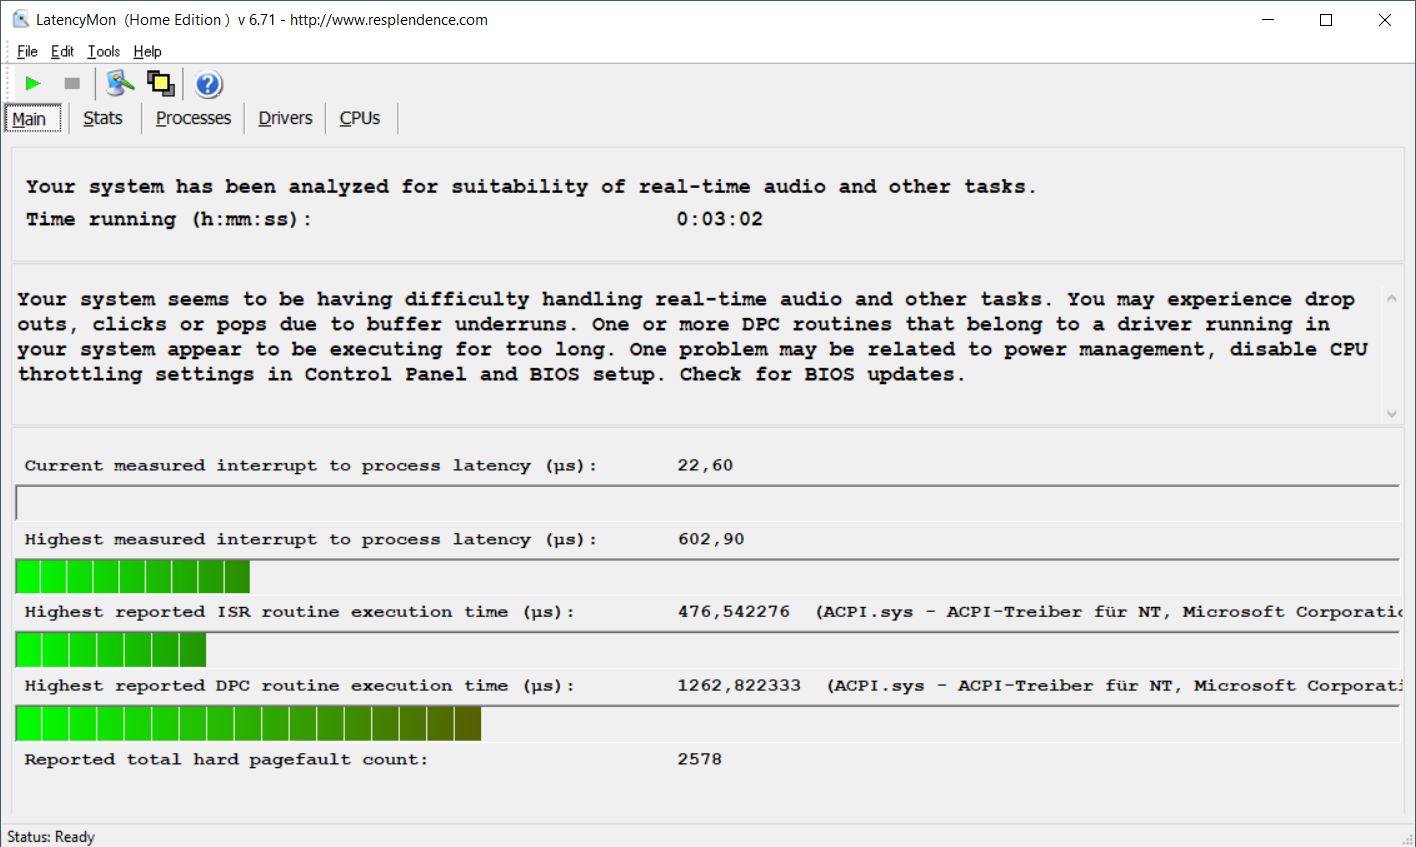
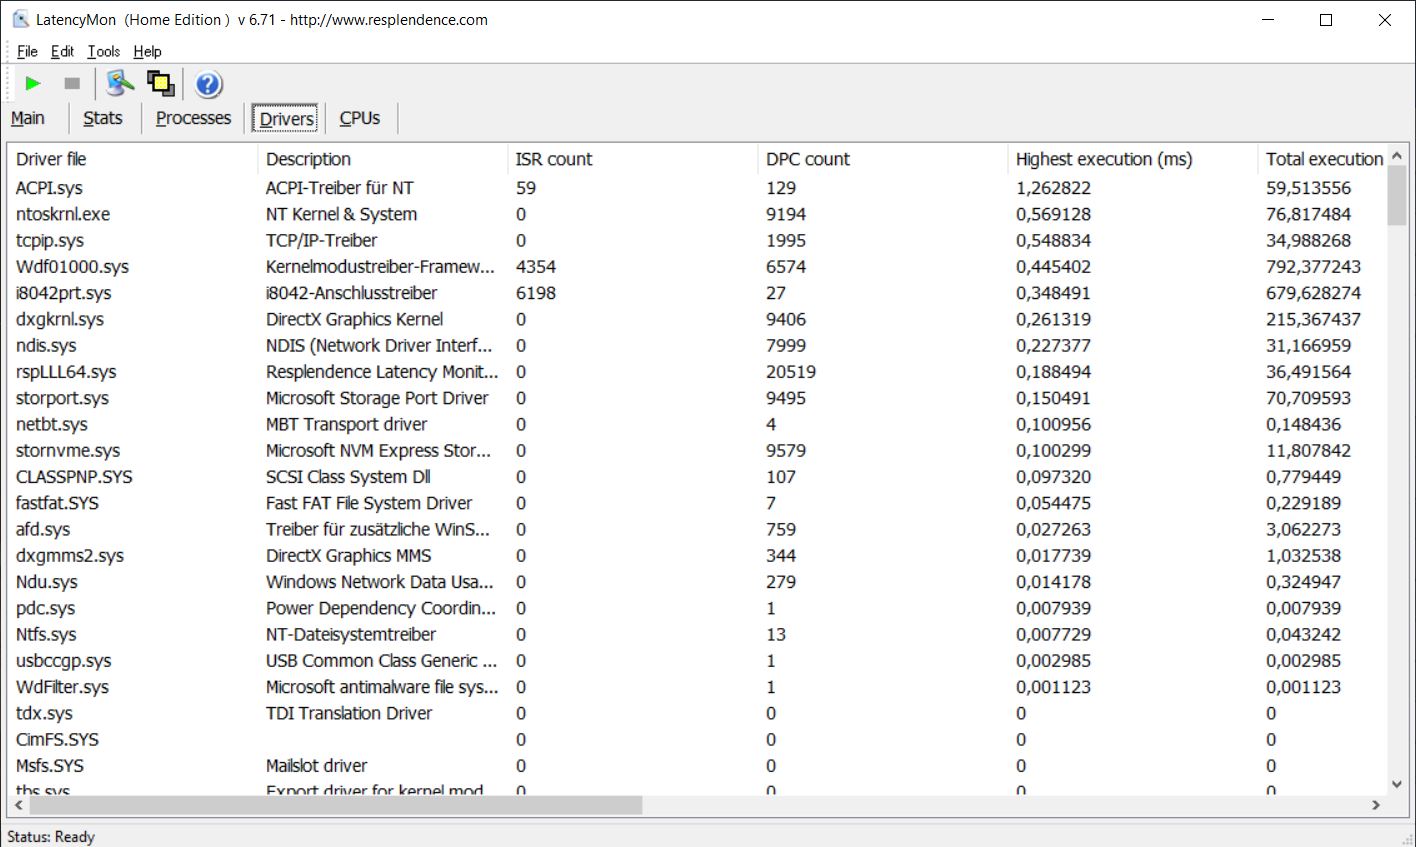
Our standardized DPC latency test (web browsing, YouTube 4K playback, CPU load) does not show any problems for the ThinkPad X13 G2 and there were no dropped frames during YouTube video playback, either.
| DPC Latencies / LatencyMon - interrupt to process latency (max), Web, Youtube, Prime95 | |
| Lenovo ThinkPad X13-20UGS00800 | |
| Huawei MateBook X Pro 2021 | |
| Dell XPS 13 9310 Core i7 FHD | |
| Lenovo ThinkPad X13-20T20033GE | |
| HP EliteBook 830 G7 | |
| Lenovo ThinkPad X13 G2 20WK0024GE | |
* ... smaller is better
Storage Devices - ThinkPad supports PCIe 4.0
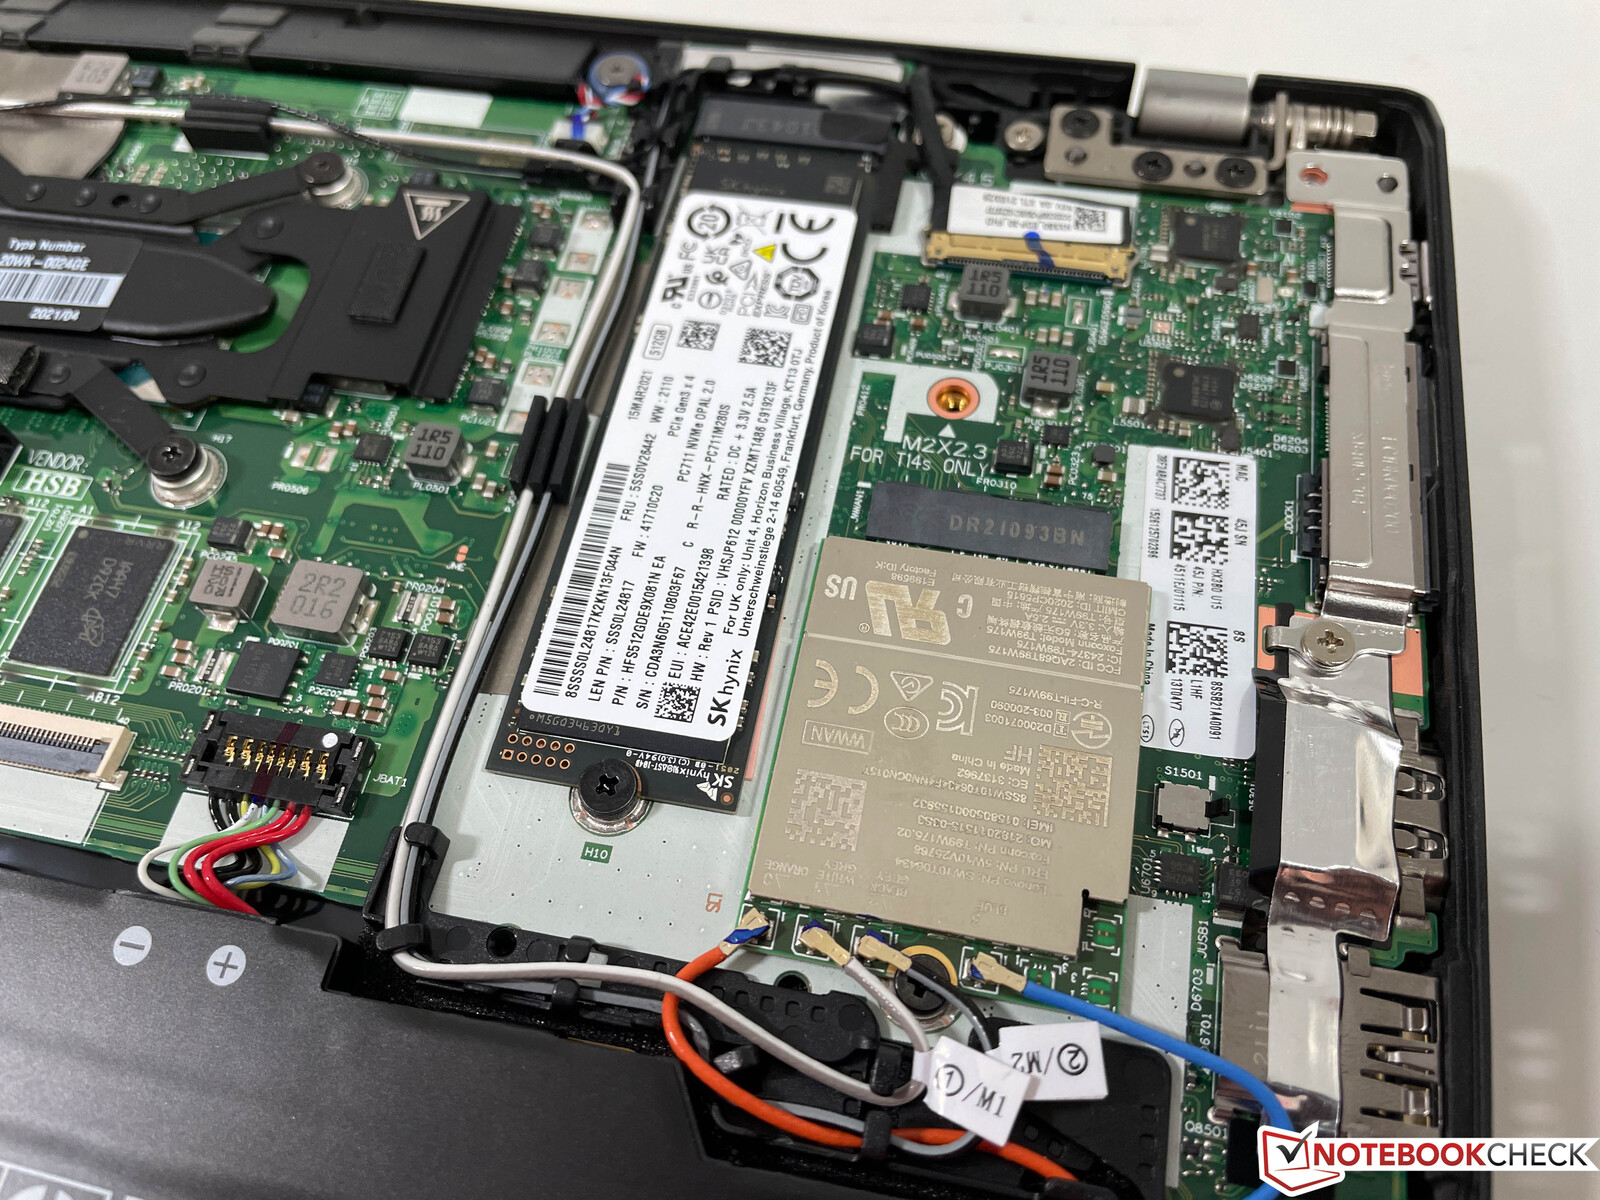
The new ThinkPad X13 G2 does support the fast PCIe 4.0 standard, but our unit still uses a PCIe-3.0-x4 drive. You will hardly notice a difference in practice though because it is a very fast drive from SK Hynix.
The storage capacity is 512 GB and you can use around 411 GB after the initial set-up. We can see transfer rates up to 3.5 GB/s (read) and almost 2.9 GB/s (write). More SSD benchmarks are available here.
| Lenovo ThinkPad X13 G2 20WK0024GE SK Hynix HFS512 GDE9X081N | Dell XPS 13 9310 Core i7 FHD Micron 2300 512GB MTFDHBA512TDV | HP EliteBook 830 G7 Samsung SSD PM981a MZVLB512HBJQ | Huawei MateBook X Pro 2021 Samsung PM981a MZVLB1T0HBLR | Average SK Hynix HFS512 GDE9X081N | |
|---|---|---|---|---|---|
| CrystalDiskMark 5.2 / 6 | -12% | -7% | 14% | -5% | |
| Write 4K (MB/s) | 171.4 | 97.5 -43% | 118.3 -31% | 197.5 15% | 137.4 ? -20% |
| Read 4K (MB/s) | 70.8 | 50.9 -28% | 60.4 -15% | 52.9 -25% | 61.7 ? -13% |
| Write Seq (MB/s) | 1771 | 1811 2% | 2067 17% | 2174 23% | 2043 ? 15% |
| Read Seq (MB/s) | 1755 | 1836 5% | 2394 36% | 2156 23% | 1800 ? 3% |
| Write 4K Q32T1 (MB/s) | 525 | 521 -1% | 325.5 -38% | 632 20% | 463 ? -12% |
| Read 4K Q32T1 (MB/s) | 479.5 | 357.5 -25% | 332.2 -31% | 694 45% | 408 ? -15% |
| Write Seq Q32T1 (MB/s) | 2818 | 2879 2% | 2978 6% | 3017 7% | 2893 ? 3% |
| Read Seq Q32T1 (MB/s) | 3548 | 3204 -10% | 3552 0% | 3561 0% | 3585 ? 1% |
| AS SSD | -155% | -57% | -9% | -15% | |
| Seq Read (MB/s) | 2776 | 2091 -25% | 2081 -25% | 2794 1% | 2727 ? -2% |
| Seq Write (MB/s) | 1461 | 1396 -4% | 1433 -2% | 2385 63% | 1664 ? 14% |
| 4K Read (MB/s) | 63.8 | 49.29 -23% | 49.92 -22% | 60.7 -5% | 53.6 ? -16% |
| 4K Write (MB/s) | 209.4 | 104.2 -50% | 119.1 -43% | 180.8 -14% | 152.5 ? -27% |
| 4K-64 Read (MB/s) | 1148 | 827 -28% | 585 -49% | 1768 54% | 1025 ? -11% |
| 4K-64 Write (MB/s) | 1623 | 1636 1% | 1630 0% | 1800 11% | 1731 ? 7% |
| Access Time Read * (ms) | 0.032 | 0.066 -106% | 0.043 -34% | 0.037 -16% | 0.05417 ? -69% |
| Access Time Write * (ms) | 0.019 | 0.365 -1821% | 0.097 -411% | 0.073 -284% | 0.026 ? -37% |
| Score Read (Points) | 1489 | 1086 -27% | 843 -43% | 2108 42% | 1351 ? -9% |
| Score Write (Points) | 1978 | 1880 -5% | 1892 -4% | 2219 12% | 2051 ? 4% |
| Score Total (Points) | 4178 | 3499 -16% | 3149 -25% | 5392 29% | 4051 ? -3% |
| Copy ISO MB/s (MB/s) | 1833 | 1544 -16% | 2452 34% | 2065 13% | 2050 ? 12% |
| Copy Program MB/s (MB/s) | 993 | 613 -38% | 72.2 -93% | 734 -26% | 542 ? -45% |
| Copy Game MB/s (MB/s) | 1607 | 1451 -10% | 404 -75% | 1629 1% | 1228 ? -24% |
| Total Average (Program / Settings) | -84% /
-103% | -32% /
-39% | 3% /
-1% | -10% /
-11% |
* ... smaller is better

Disk Throttling: DiskSpd Read Loop, Queue Depth 8
GPU Performance - Iris Xe Graphics G7
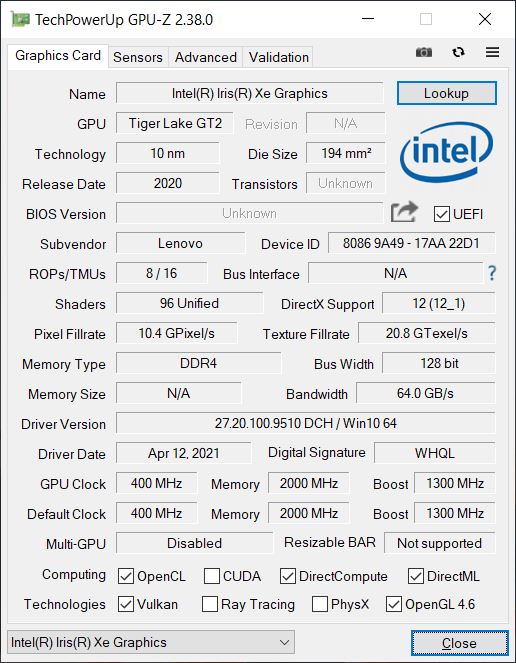
The Core i7-1165G7 is equipped with the integrated Xe Graphics G7. It is the faster version with 96 EUs and a maximum clock of 1300 MHz. The iGPU also benefits from the fast memory in a dual-channel configuration.
The X13 G2 is faster than the competitors in the synthetic benchmarks and the graphics performance is also stable under sustained workloads; it passes the 3DMark stress test (Fire Strike). Compared to the old X13 G1 with Intel iGPU, the performance was almost increased by the factor 3 and the modern Ryzen iGPUs are beaten as well. You can use the full GPU performance on battery power.
| 3DMark 11 Performance | 7169 points | |
| 3DMark Ice Storm Standard Score | 95856 points | |
| 3DMark Cloud Gate Standard Score | 20532 points | |
| 3DMark Fire Strike Score | 4795 points | |
| 3DMark Time Spy Score | 1746 points | |
Help | ||
Gaming Performance
Despite the improved graphics performance, the X13 G2 is still no gaming laptop, but you can at least play older or less demanding titles with the iGPU. The gaming performance is also stable in longer gaming sessions. More gaming benchmarks are available in our tech section.
| F1 2020 | |
| 1920x1080 Ultra High Preset AA:T AF:16x | |
| Lenovo ThinkPad X13 G2 20WK0024GE | |
| Average Intel Iris Xe Graphics G7 96EUs (15 - 28, n=31) | |
| 1920x1080 High Preset AA:T AF:16x | |
| Lenovo ThinkPad X13 G2 20WK0024GE | |
| Average Intel Iris Xe Graphics G7 96EUs (22 - 44.4, n=32) | |
| 1920x1080 Medium Preset AF:16x | |
| Lenovo ThinkPad X13 G2 20WK0024GE | |
| Average Intel Iris Xe Graphics G7 96EUs (23.1 - 57.5, n=34) | |
| 1280x720 Ultra Low Preset | |
| Lenovo ThinkPad X13 G2 20WK0024GE | |
| Average Intel Iris Xe Graphics G7 96EUs (49 - 109.6, n=34) | |
Witcher 3 FPS Diagram
| low | med. | high | ultra | |
|---|---|---|---|---|
| GTA V (2015) | 89.2 | 27.4 | 10.8 | |
| The Witcher 3 (2015) | 97 | 58 | 31 | 12.7 |
| Dota 2 Reborn (2015) | 83 | 72.1 | 46.9 | 44.4 |
| Final Fantasy XV Benchmark (2018) | 39.3 | 21.3 | 15.8 | |
| X-Plane 11.11 (2018) | 43.2 | 36.1 | 32.4 | |
| Far Cry 5 (2018) | 55 | 26 | 24 | 21 |
| Strange Brigade (2018) | 91.2 | 38.9 | 30.9 | 25 |
| F1 2020 (2020) | 88 | 46 | 34 | 23 |
Emissions - More performance and noisier fan
System Noise
Thanks to the high power limits, the fan has to spin faster under load and the new model is noticeably louder than the very quiet predecessor. The murmur of the fan is not annoying though and there is no high-pitched sound, either. The fan will also kick in quite quickly in everyday situations when you use the “Best Performance” mode (Windows power slider). If you do not need the maximum performance, we would definitely recommend one of the two less powerful energy settings. Our test unit did not have any problems with electronic noises like coil whine.
Noise level
| Idle |
| 25.5 / 25.5 / 29 dB(A) |
| Load |
| 37.4 / 37.4 dB(A) |
 | ||
30 dB silent 40 dB(A) audible 50 dB(A) loud |
||
min: | ||
| Lenovo ThinkPad X13 G2 20WK0024GE Iris Xe G7 96EUs, i7-1165G7, SK Hynix HFS512 GDE9X081N | Dell XPS 13 9310 Core i7 FHD Iris Xe G7 96EUs, i7-1165G7, Micron 2300 512GB MTFDHBA512TDV | Apple MacBook Pro 13 Late 2020 M1 Entry (8 / 256 GB) M1 8-Core GPU, M1, Apple SSD AP0256 | HP EliteBook 830 G7 UHD Graphics 620, i7-10810U, Samsung SSD PM981a MZVLB512HBJQ | Huawei MateBook X Pro 2021 Iris Xe G7 96EUs, i7-1165G7, Samsung PM981a MZVLB1T0HBLR | Lenovo ThinkPad X13-20UGS00800 Vega 7, R7 PRO 4750U, Samsung SSD PM981a MZVLB512HBJQ | |
|---|---|---|---|---|---|---|
| Noise | 6% | -7% | 0% | 7% | -2% | |
| off / environment * (dB) | 25.5 | 25.7 -1% | 29.2 -15% | 26.8 -5% | 25.4 -0% | 29.1 -14% |
| Idle Minimum * (dB) | 25.5 | 25.7 -1% | 29.2 -15% | 27.1 -6% | 25.6 -0% | 29.1 -14% |
| Idle Average * (dB) | 25.5 | 25.7 -1% | 29.2 -15% | 27.1 -6% | 25.6 -0% | 29.1 -14% |
| Idle Maximum * (dB) | 29 | 25.9 11% | 29.2 -1% | 27.1 7% | 25.6 12% | 29.1 -0% |
| Load Average * (dB) | 37.4 | 26.2 30% | 32.1 14% | 31.4 16% | 28.7 23% | 31.1 17% |
| Witcher 3 ultra * (dB) | 37.4 | 36.5 2% | 32 14% | |||
| Load Maximum * (dB) | 37.4 | 36.6 2% | 41.9 -12% | 39 -4% | 38.2 -2% | 31.8 15% |
* ... smaller is better
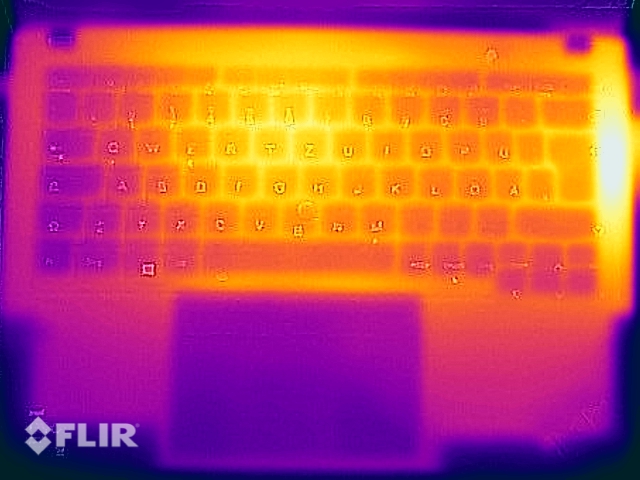
Temperature
The compact X13 G2 gets quite warm under load and we can measure more than 50 °C on the right side of the base unit around the fan exhaust. The bottom panel primarily warms up in the center where the CPU is located. You should not put the notebook on your lap when you stress it, but there are no limitations in everyday scenarios.
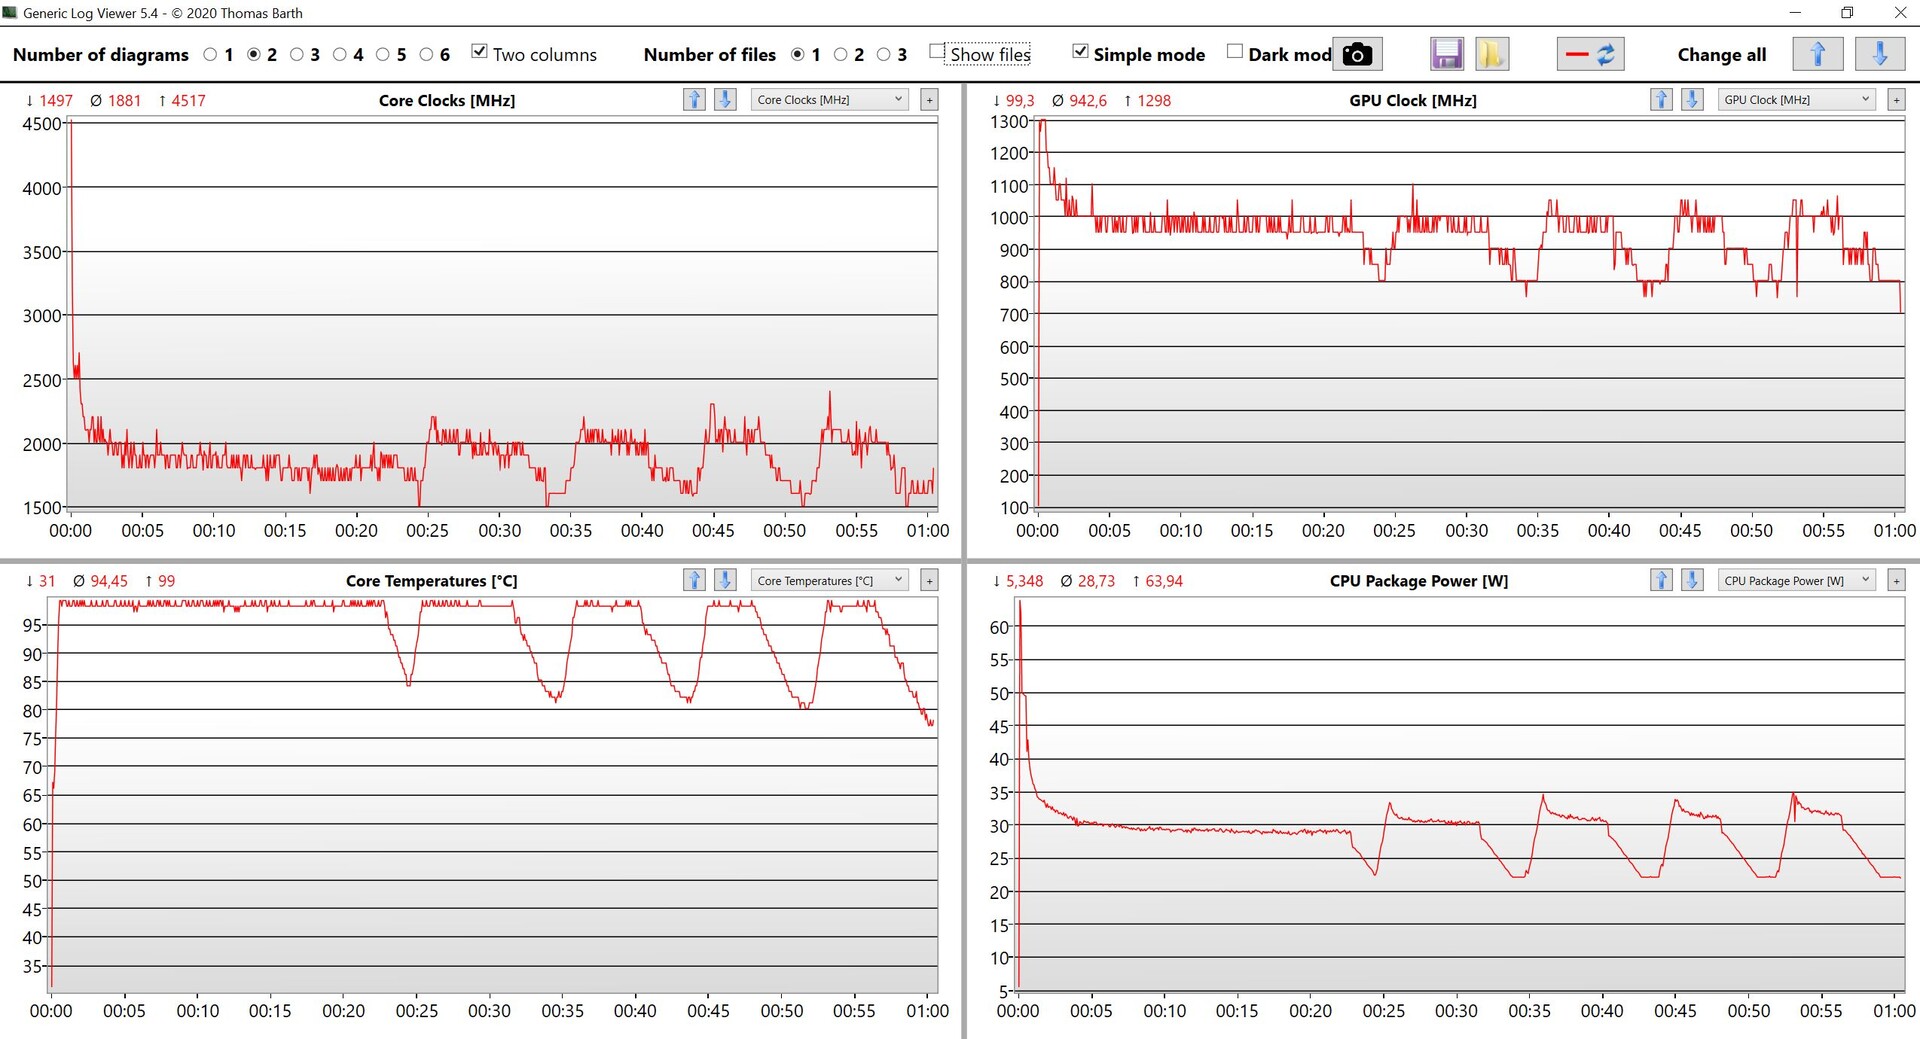
We can once again see that the processor quickly levels off at around 30W (~1.9 GHz CPU & ~950 MHz iGPU) in combined workloads. After about 25 minutes, we can see a fluctuation, but the average values are roughly the same. There might be a software update to stabilize the performance in the future.
(-) The maximum temperature on the upper side is 53.9 °C / 129 F, compared to the average of 35.9 °C / 97 F, ranging from 21.4 to 59 °C for the class Subnotebook.
(-) The bottom heats up to a maximum of 49.1 °C / 120 F, compared to the average of 39.2 °C / 103 F
(+) In idle usage, the average temperature for the upper side is 24 °C / 75 F, compared to the device average of 30.8 °C / 87 F.
(-) Playing The Witcher 3, the average temperature for the upper side is 39.4 °C / 103 F, compared to the device average of 30.8 °C / 87 F.
(±) The palmrests and touchpad can get very hot to the touch with a maximum of 37 °C / 98.6 F.
(-) The average temperature of the palmrest area of similar devices was 28.2 °C / 82.8 F (-8.8 °C / -15.8 F).

Speakers
The two stereo speakers are located above the keyboard and direct the sound towards the user. The quality leaves room for optimizations, which is shown by systems like the X1 Carbon, for example. Consumer models like the MacBook Pro 13 or the Huawei MateBook X Pro also have a big advantage here. The speakers are definitely sufficient for video conferences, but we recommend headphones or external speakers when you listen to music or watch movies. The preloaded Dolby software offers different profiles, but the sound differences are small.
Lenovo ThinkPad X13 G2 20WK0024GE audio analysis
(±) | speaker loudness is average but good (77.4 dB)
Bass 100 - 315 Hz
(-) | nearly no bass - on average 21.2% lower than median
(±) | linearity of bass is average (7.8% delta to prev. frequency)
Mids 400 - 2000 Hz
(+) | balanced mids - only 3.5% away from median
(±) | linearity of mids is average (7.6% delta to prev. frequency)
Highs 2 - 16 kHz
(+) | balanced highs - only 1.5% away from median
(+) | highs are linear (2.8% delta to prev. frequency)
Overall 100 - 16.000 Hz
(±) | linearity of overall sound is average (18% difference to median)
Compared to same class
» 51% of all tested devices in this class were better, 8% similar, 41% worse
» The best had a delta of 5%, average was 18%, worst was 53%
Compared to all devices tested
» 38% of all tested devices were better, 8% similar, 54% worse
» The best had a delta of 4%, average was 23%, worst was 134%
Apple MacBook Pro 13 Late 2020 M1 Entry (8 / 256 GB) audio analysis
(±) | speaker loudness is average but good (77.5 dB)
Bass 100 - 315 Hz
(±) | reduced bass - on average 8.7% lower than median
(±) | linearity of bass is average (8.6% delta to prev. frequency)
Mids 400 - 2000 Hz
(+) | balanced mids - only 4.2% away from median
(+) | mids are linear (4.2% delta to prev. frequency)
Highs 2 - 16 kHz
(+) | balanced highs - only 1.2% away from median
(+) | highs are linear (4% delta to prev. frequency)
Overall 100 - 16.000 Hz
(+) | overall sound is linear (12.9% difference to median)
Compared to same class
» 20% of all tested devices in this class were better, 5% similar, 75% worse
» The best had a delta of 5%, average was 18%, worst was 53%
Compared to all devices tested
» 12% of all tested devices were better, 3% similar, 85% worse
» The best had a delta of 4%, average was 23%, worst was 134%
Huawei MateBook X Pro 2021 audio analysis
(+) | speakers can play relatively loud (82.7 dB)
Bass 100 - 315 Hz
(±) | reduced bass - on average 13.6% lower than median
(±) | linearity of bass is average (10.1% delta to prev. frequency)
Mids 400 - 2000 Hz
(+) | balanced mids - only 2.9% away from median
(+) | mids are linear (3.3% delta to prev. frequency)
Highs 2 - 16 kHz
(+) | balanced highs - only 4.6% away from median
(±) | linearity of highs is average (8.2% delta to prev. frequency)
Overall 100 - 16.000 Hz
(+) | overall sound is linear (11.8% difference to median)
Compared to same class
» 13% of all tested devices in this class were better, 4% similar, 83% worse
» The best had a delta of 5%, average was 18%, worst was 53%
Compared to all devices tested
» 9% of all tested devices were better, 3% similar, 89% worse
» The best had a delta of 4%, average was 23%, worst was 134%
Energy Management - Decent stamina
Power Consumption
Our energy measurements do not show any surprises. The X13 G2 is very efficient while idling and is also much better than the old X13 G1 with AMD processor. We are already eager to see how the new X13 G2 with Ryzen 5000 will perform. You should only use the first level of the keyboard illumination on battery power, because it only increases the consumption by ~0.4W (level 2 +1.4W).
The consumption climbs up to 68.2W during our stress test, but quickly levels off at around 45W. This means the included 65W power adapter is completely sufficient.
| Off / Standby | |
| Idle | |
| Load |
|
Key:
min: | |
| Lenovo ThinkPad X13 G2 20WK0024GE i7-1165G7, Iris Xe G7 96EUs, SK Hynix HFS512 GDE9X081N, IPS, 1920x1200, 13.3" | Dell XPS 13 9310 Core i7 FHD i7-1165G7, Iris Xe G7 96EUs, Micron 2300 512GB MTFDHBA512TDV, IPS, 1920x1200, 13.4" | Apple MacBook Pro 13 Late 2020 M1 Entry (8 / 256 GB) M1, M1 8-Core GPU, Apple SSD AP0256, IPS, 2560x1600, 13.3" | HP EliteBook 830 G7 i7-10810U, UHD Graphics 620, Samsung SSD PM981a MZVLB512HBJQ, IPS, 1920x1080, 13.3" | Huawei MateBook X Pro 2021 i7-1165G7, Iris Xe G7 96EUs, Samsung PM981a MZVLB1T0HBLR, IPS, 3000x2000, 13.9" | Lenovo ThinkPad X13-20UGS00800 R7 PRO 4750U, Vega 7, Samsung SSD PM981a MZVLB512HBJQ, IPS LED, 1920x1080, 13.3" | Average Intel Iris Xe Graphics G7 96EUs | Average of class Subnotebook | |
|---|---|---|---|---|---|---|---|---|
| Power Consumption | 0% | 16% | 7% | -40% | -34% | -43% | -11% | |
| Idle Minimum * (Watt) | 2.8 | 3.9 -39% | 1.67 40% | 3.6 -29% | 6.7 -139% | 6 -114% | 5.51 ? -97% | 3.76 ? -34% |
| Idle Average * (Watt) | 5.9 | 5.9 -0% | 6.7 -14% | 4.7 20% | 10 -69% | 8.9 -51% | 8.66 ? -47% | 6.54 ? -11% |
| Idle Maximum * (Watt) | 6.8 | 6.3 7% | 7.4 -9% | 5.1 25% | 10.3 -51% | 11.3 -66% | 10.9 ? -60% | 7.89 ? -16% |
| Load Average * (Watt) | 41.5 | 39.7 4% | 28 33% | 33.3 20% | 35.7 14% | 34.2 18% | 45.6 ? -10% | 42 ? -1% |
| Witcher 3 ultra * (Watt) | 34.2 | 34.8 -2% | 32.7 4% | |||||
| Load Maximum * (Watt) | 68.2 | 47.5 30% | 47.5 30% | 70 -3% | 67.6 1% | 37.2 45% | 67.8 ? 1% | 64.8 ? 5% |
* ... smaller is better
Power Consumption Witcher 3
Battery Runtime
Lenovo increased the battery capacity from 48 to 54.7 Wh and the battery runtime is improved. The X13 G2 benefits from the more efficient video decoder in the video test with a runtime of 15 hours at a brightness of 150 nits. The Wi-Fi test at 150 nits runs for almost 10 hours, but the competitors last even longer. We still think 10 hours should be sufficient for most situations. The Wi-Fi test at the full brightness still runs for about 8.5 hours.
A full charge of the battery takes 111 minutes when the device is turned on. 50% of the capacity is available after ~28 minutes; 80% after 54 minutes.
| Lenovo ThinkPad X13 G2 20WK0024GE i7-1165G7, Iris Xe G7 96EUs, 54.7 Wh | Dell XPS 13 9310 Core i7 FHD i7-1165G7, Iris Xe G7 96EUs, 52 Wh | Apple MacBook Pro 13 Late 2020 M1 Entry (8 / 256 GB) M1, M1 8-Core GPU, 58.2 Wh | HP EliteBook 830 G7 i7-10810U, UHD Graphics 620, 53 Wh | Huawei MateBook X Pro 2021 i7-1165G7, Iris Xe G7 96EUs, 56 Wh | Lenovo ThinkPad X13-20UGS00800 R7 PRO 4750U, Vega 7, 48 Wh | Lenovo ThinkPad X13-20T20033GE i5-10210U, UHD Graphics 620, 48 Wh | Average of class Subnotebook | |
|---|---|---|---|---|---|---|---|---|
| Battery runtime | 70% | 66% | 90% | 60% | -17% | 21% | 28% | |
| H.264 (h) | 15 | 19.2 28% | 8.3 -45% | 11.7 -22% | 15.4 ? 3% | |||
| WiFi v1.3 (h) | 10 | 11 10% | 20.4 104% | 11.5 15% | 10.5 5% | 8.7 -13% | 9.3 -7% | 14 ? 40% |
| Load (h) | 1.4 | 3.2 129% | 3.7 164% | 3 114% | 1.5 7% | 2.7 93% | 1.969 ? 41% |
Pros
Cons
Verdict - ThinkPad X13 G2 with unused potential
The new ThinkPad X13 G2 is a good update. The device is slightly more compact, you get 16:10 displays, the performance of the Tiger Lake processor is good and Lenovo also managed to increase the battery capacity.
The biggest advantage compared to consumer devices like the Dell XPS 13, Apple MacBook Pro 13 and Huawei MateBook X Pro is the comprehensive connectivity including SmartCard reader and optional WWAN modules for LTE or even 5G: Business devices also have an advantage in terms of warranty.
Lenovo still follows the trend towards keyboards with reduced travel and shallower keys to save space. The manufacturer still advertises proven ThinkPad quality, and the keyboard is not bad by any means, but if you compare the keyboard with the current ThinkPad E14 G3 (for half the price), for example, you quickly see how much better it could be.
Great connectivity with 5G, 16:10 screen, and long battery runtime: The ThinkPad X13 G2 is still a very good mobile companion, even though the keyboard is not as good as it once was.
We are also slightly disappointed in terms of the screen. The picture quality of the matte IPS display is good, but we juts would have liked to see brighter panels. We would definitely recommend the optional WQXGA panel with 2560 x 1600 pixels, which is brighter, offer even better picture quality and it does not have big impact on the battery runtime as we have seen in our review of the X13 Yoga G2. We will review the new EliteBook 830 G8 and (as soon as it is available) the AMD version of the ThinkPad X13 G2.
Price and Availability
You can configure your own ThinkPad X13 G2 on Lenovo.com starting at ~$1200. Our review configuration is available for about $1500 right now.
Lenovo ThinkPad X13 G2 20WK0024GE
- 07/06/2021 v7 (old)
Andreas Osthoff
Price comparison
