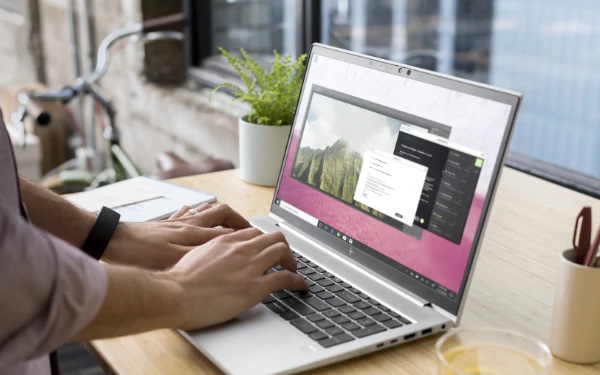
HP EliteBook 830 G7 Laptop Review: Premium for the Mainstream
The 13.3-inch EliteBook 830 G7 is HP's latest mid-range business laptop that sits in between the lower-end ProBook series and higher-end EliteBook 1030 series. The model is a visual redesign when compared to the last generation EliteBook 830 G6 or 830 G5. HP offers a 14-inch version of this laptop with many of the same hardware options and features called the EliteBook 840 G7.
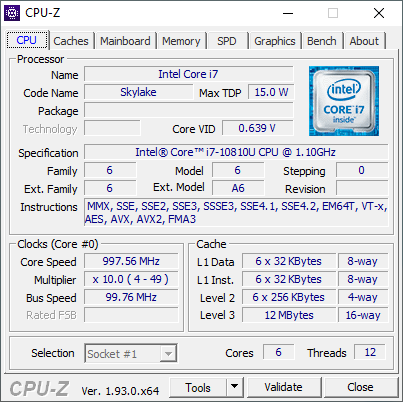
Our unit here comes configured with the Core i7-10810U CPU, 400-nit 1080p display, 16 GB RAM, Cat16 WWAN, and 512 GB NVMe SSD for approximately $2100 USD retail. Other major configurations include the Core i5-10210U, 250-nit display or the AMD Ryzen U-series via the EliteBook 835 G7, but no discrete GPU options are available. HP has designed the system to compete directly with the Lenovo ThinkPad X13 and Dell Latitude 7310.
More HP reviews:
Rating | Date | Model | Weight | Height | Size | Resolution | Price |
|---|---|---|---|---|---|---|---|
| 88.7 % v7 (old) | 09 / 2020 | HP EliteBook 830 G7 i7-10810U, UHD Graphics 620 | 1.3 kg | 18.1 mm | 13.30" | 1920x1080 | |
| 87.9 % v7 (old) | 10 / 2019 | HP EliteBook x360 830 G6 i7-8565U, UHD Graphics 620 | 1.5 kg | 16.9 mm | 13.30" | 1920x1080 | |
| 88 % v7 (old) | 08 / 2020 | Lenovo ThinkPad X13-20T20033GE i5-10210U, UHD Graphics 620 | 1.3 kg | 16.9 mm | 13.30" | 1920x1080 | |
| 89.4 % v7 (old) | 07 / 2020 | Dell Latitude 7310 i7-10610U, UHD Graphics 620 | 1.2 kg | 18.3 mm | 13.30" | 1920x1080 | |
| 85.1 % v7 (old) | 05 / 2020 | Dynabook Portege X30L-G1331 i5-10210U, UHD Graphics 620 | 859 g | 17.9 mm | 13.30" | 1920x1080 | |
| 84 % v7 (old) | 02 / 2020 | Microsoft Surface Laptop 3 13 Core i5-1035G7 i5-1035G7, Iris Plus Graphics G7 (Ice Lake 64 EU) | 1.3 kg | 14.5 mm | 13.50" | 2256x1504 |
Case
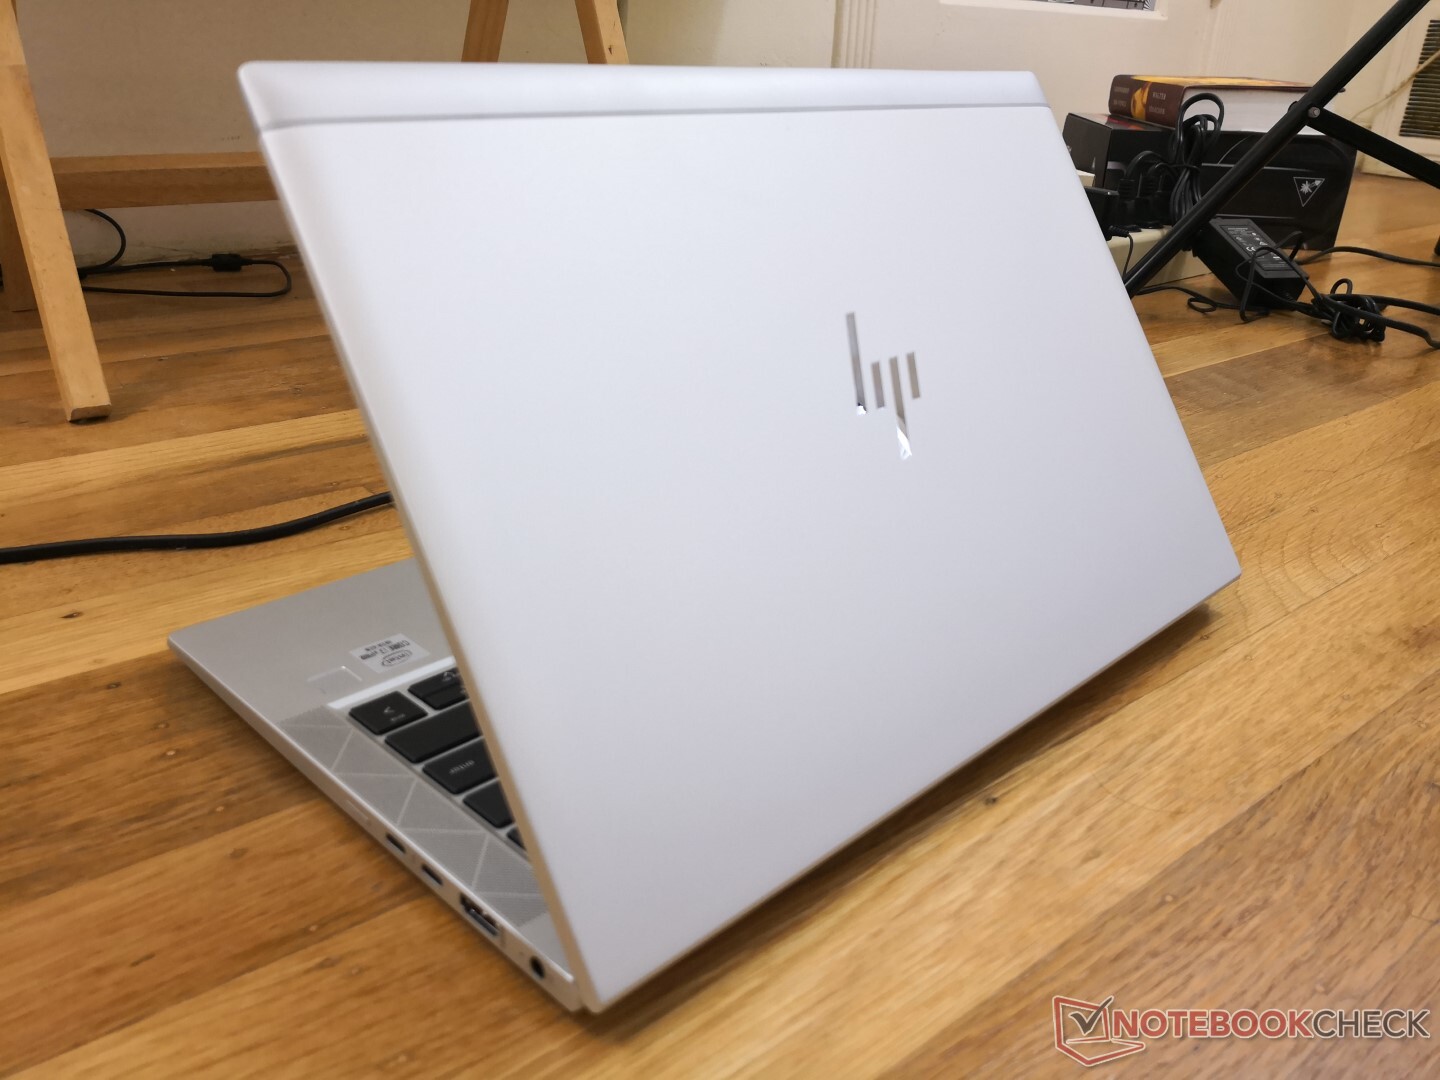
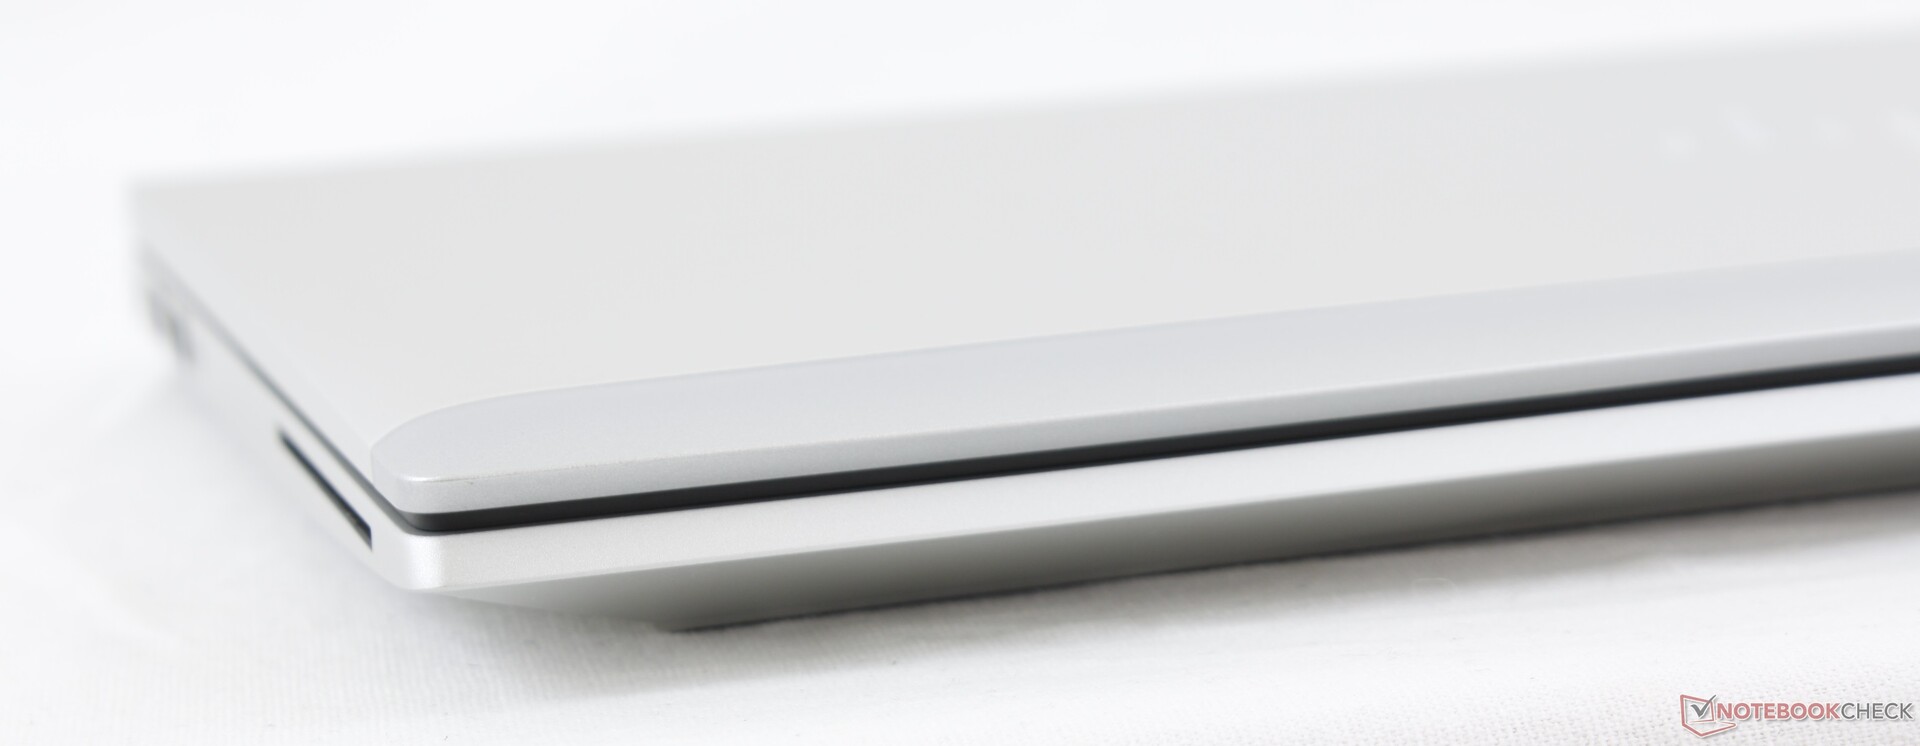
Paint a golden Spectre 13 gray and that'll give you a good idea of what an EliteBook will feel like. The chassis has a high quality impression without needing to resort to carbon fiber or woven fabric like on the ThinkPad or Dell Latitude/XPS series. Rigidity is excellent with minimal twisting and almost no creaking much like on the higher-end EliteBook 1030 series. We would love to see more color options, but there's not much else to complain about other than the superficial.
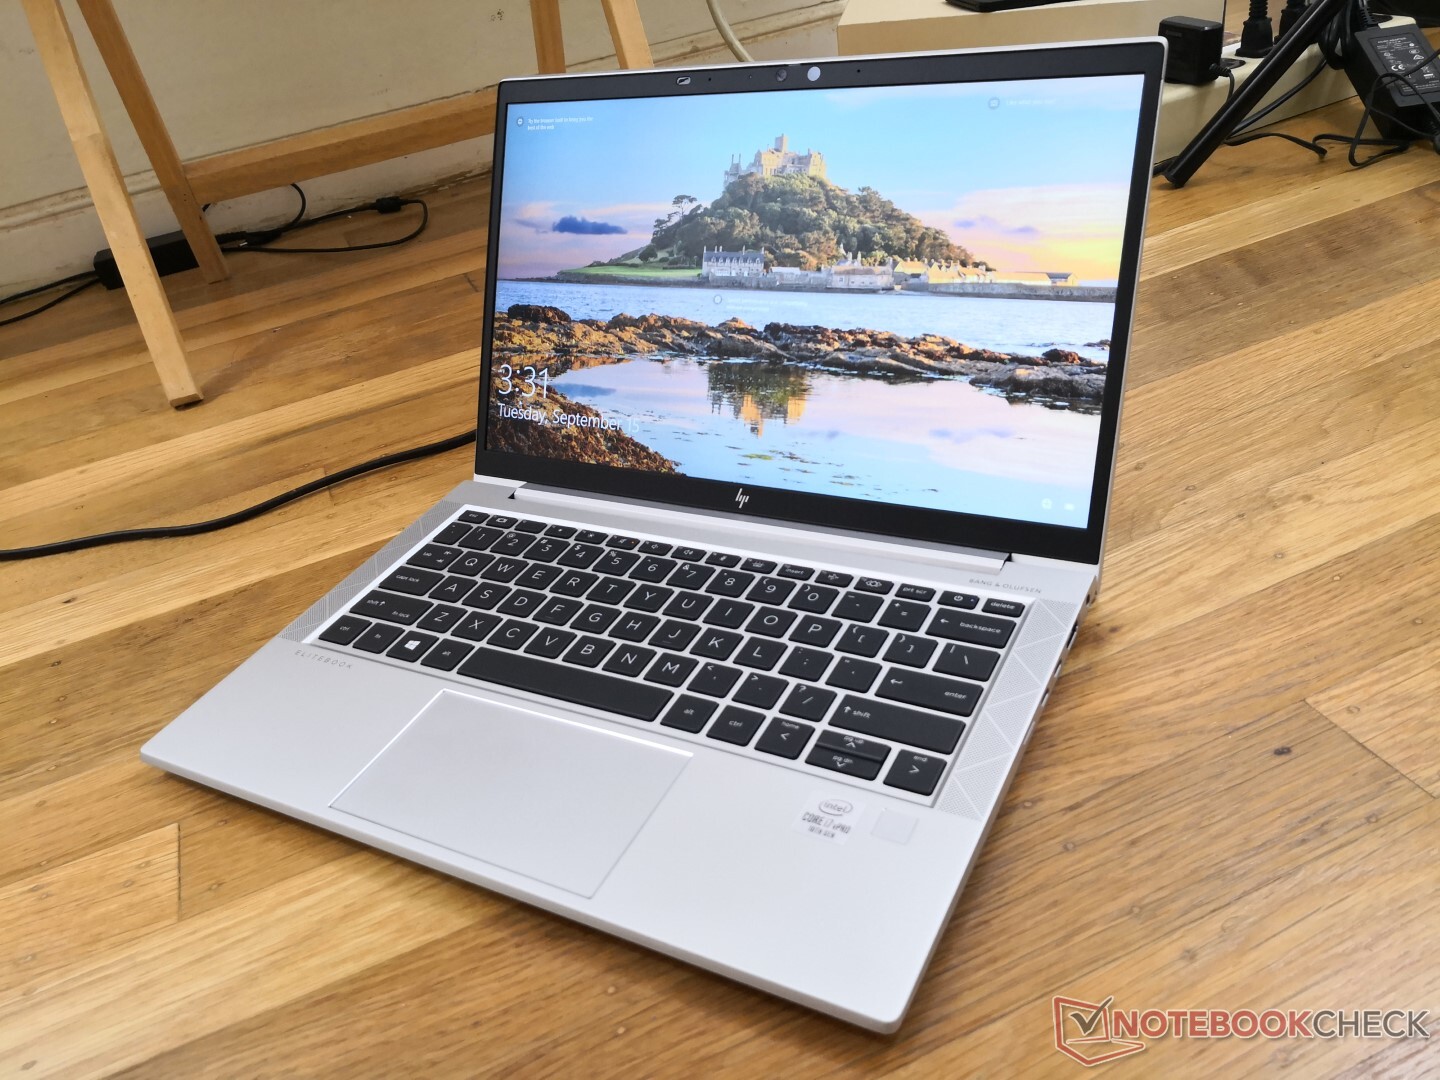
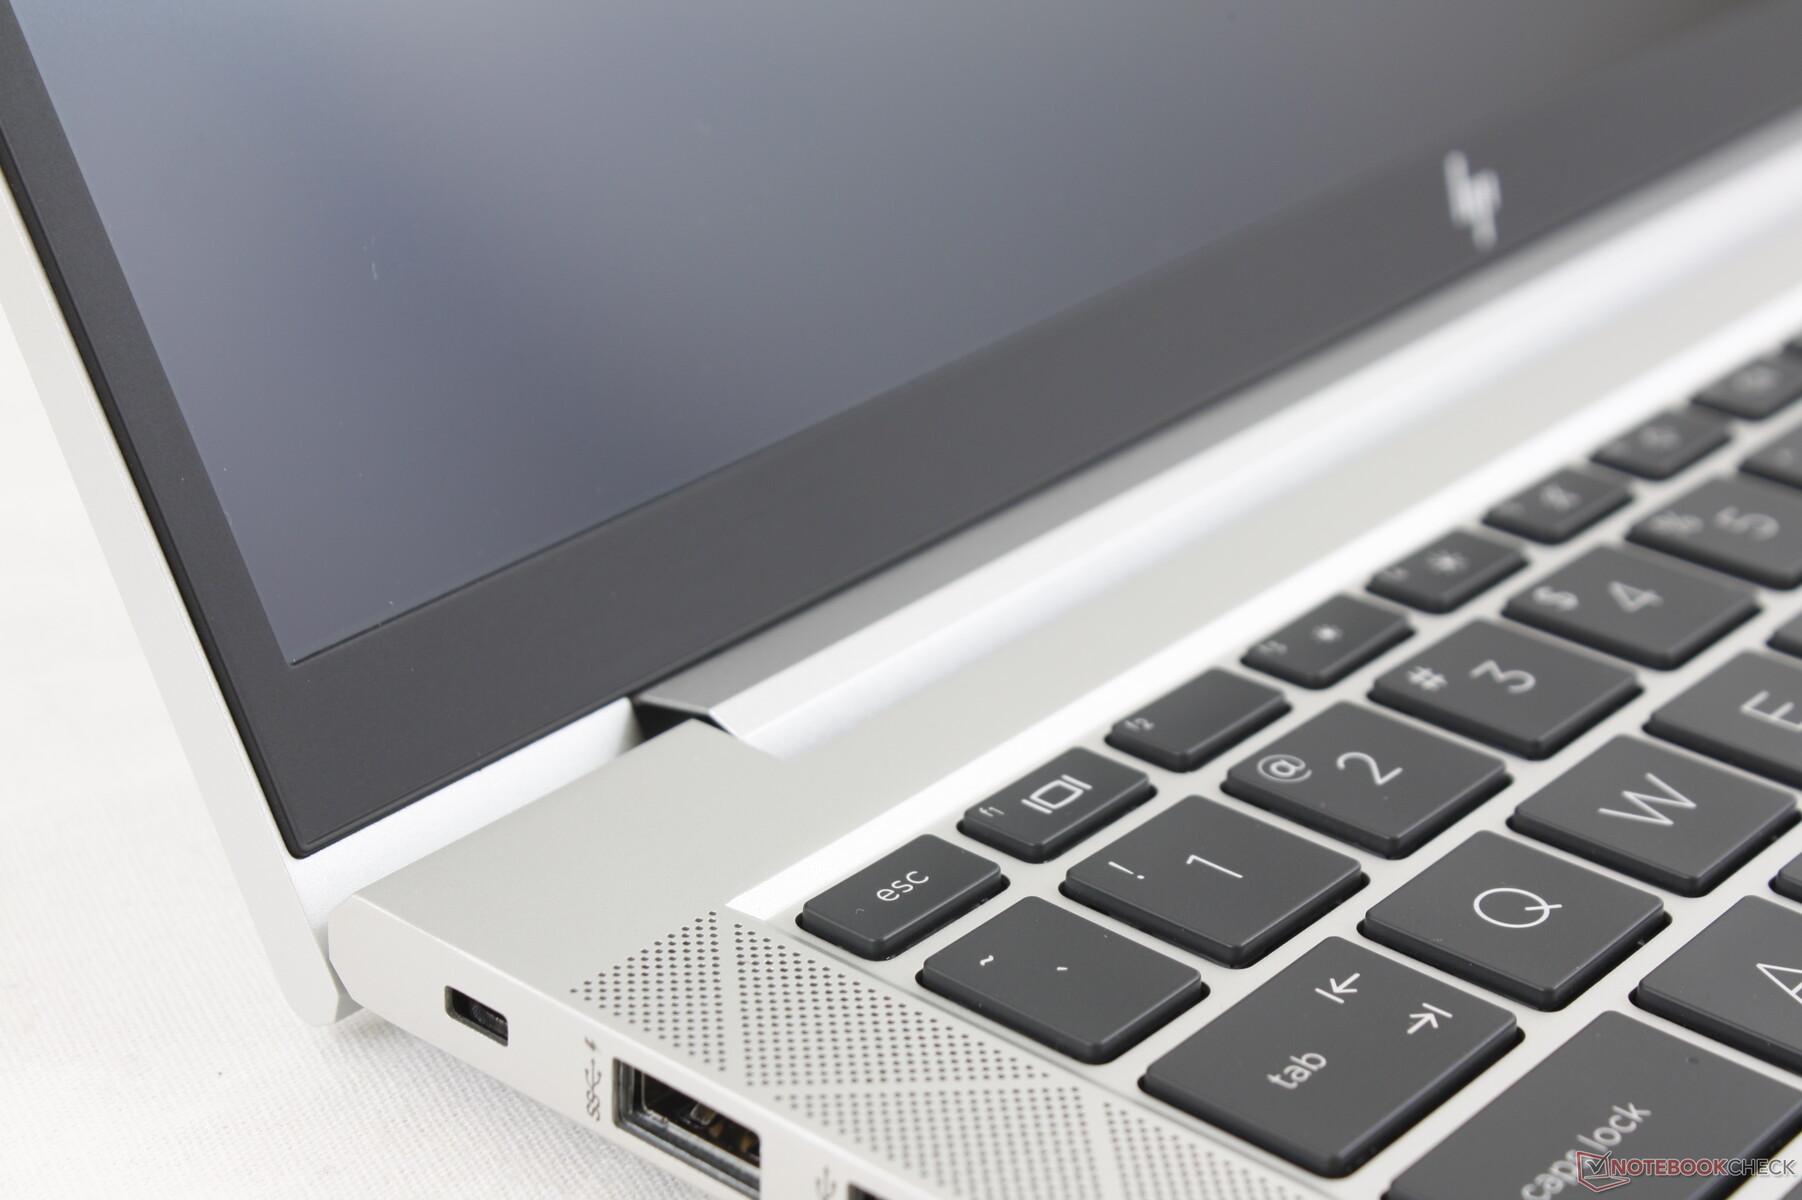
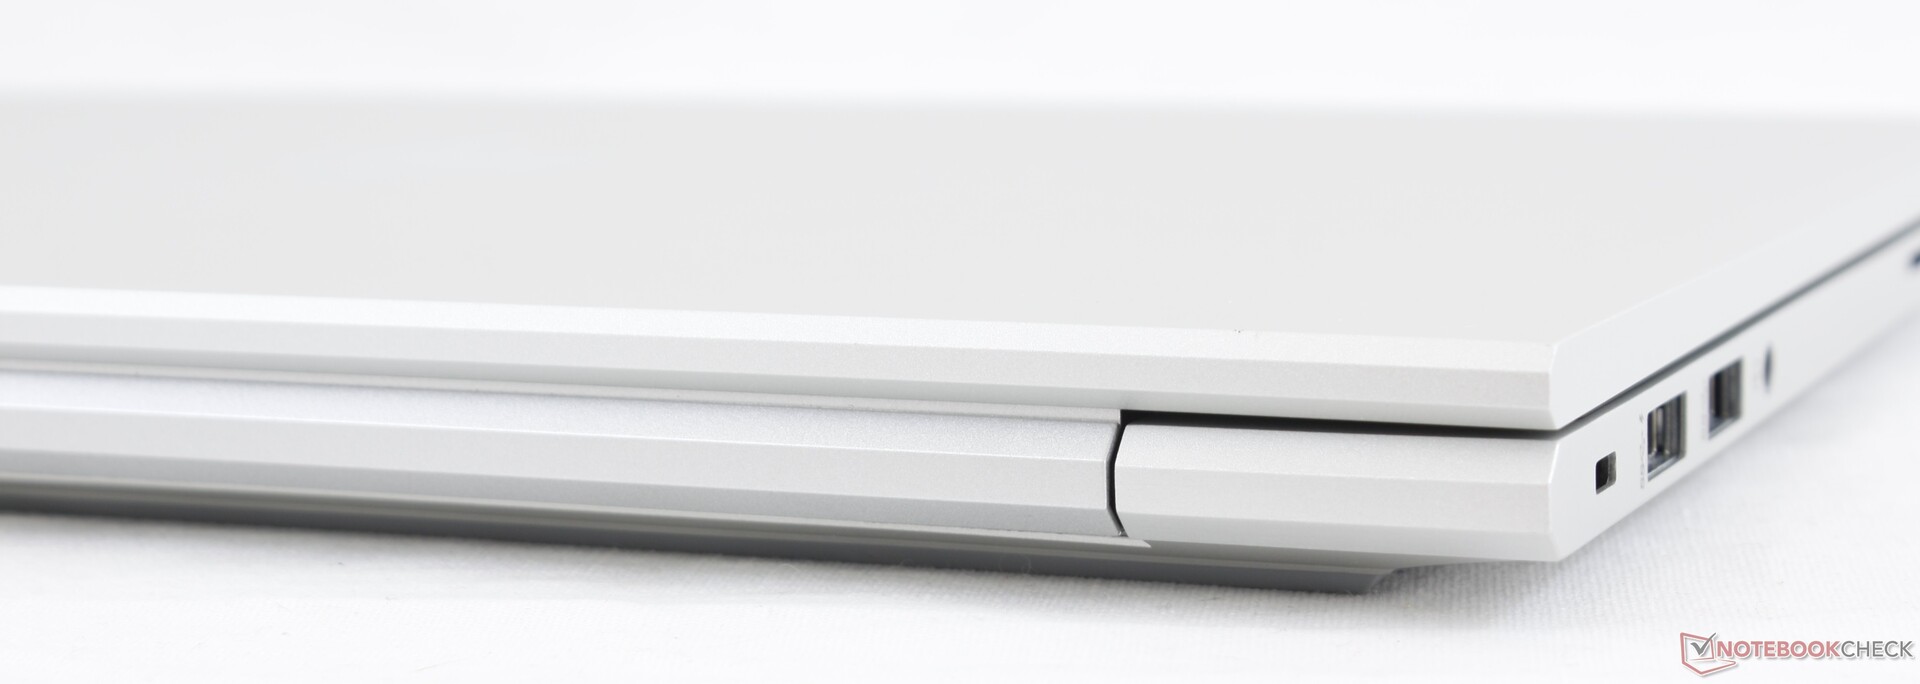
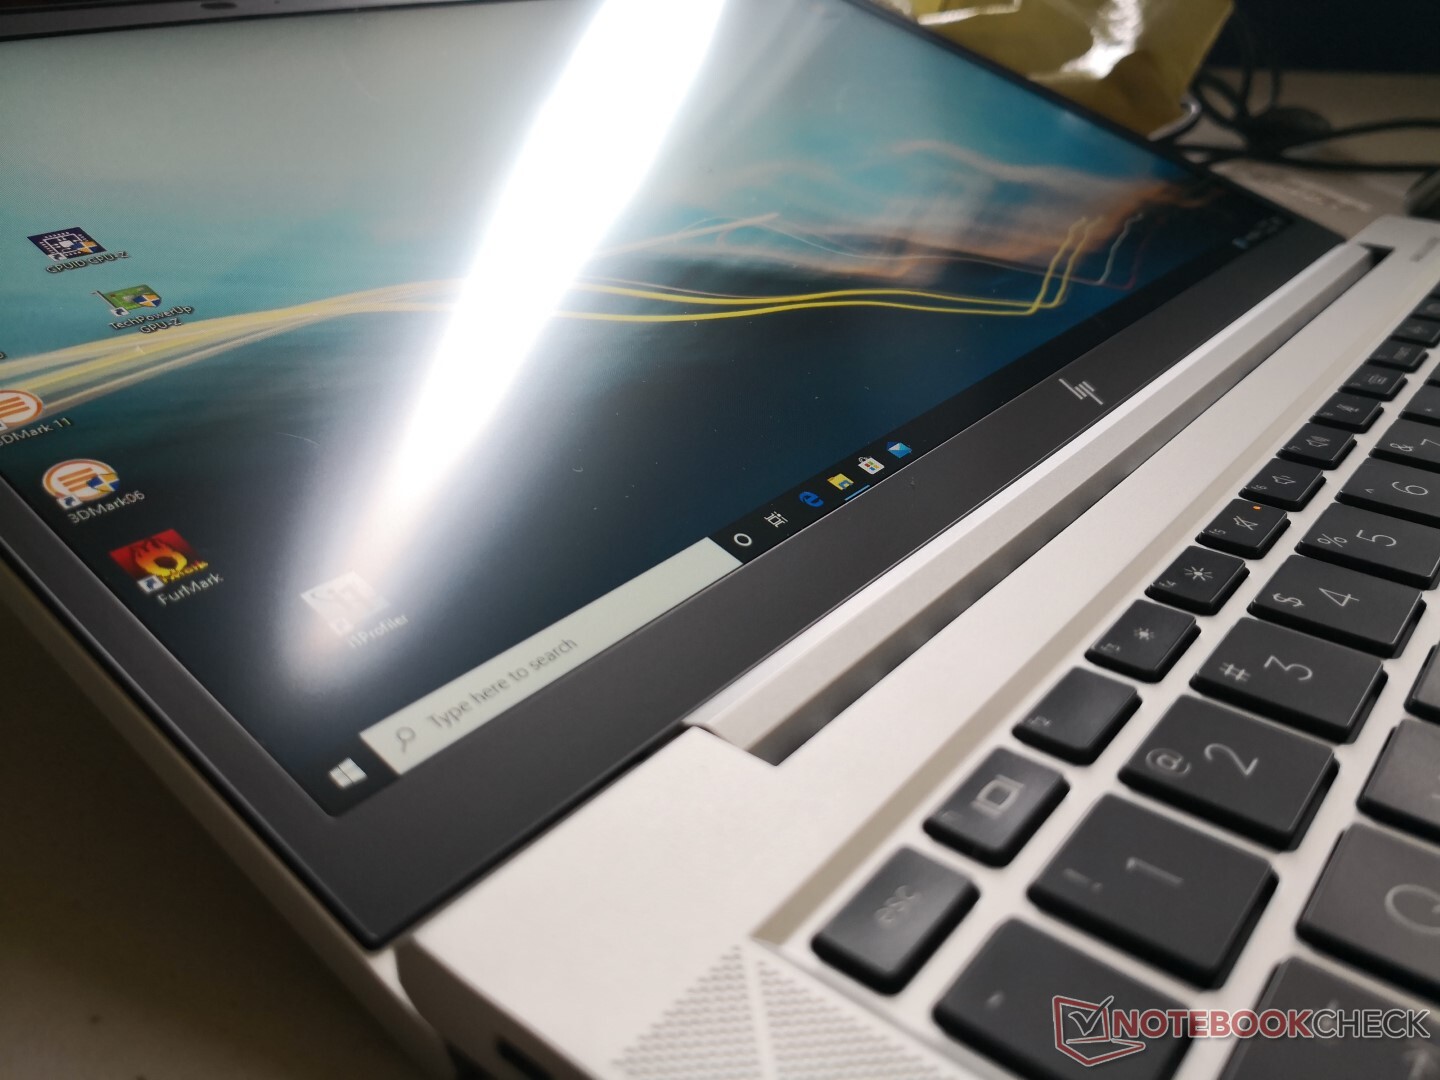
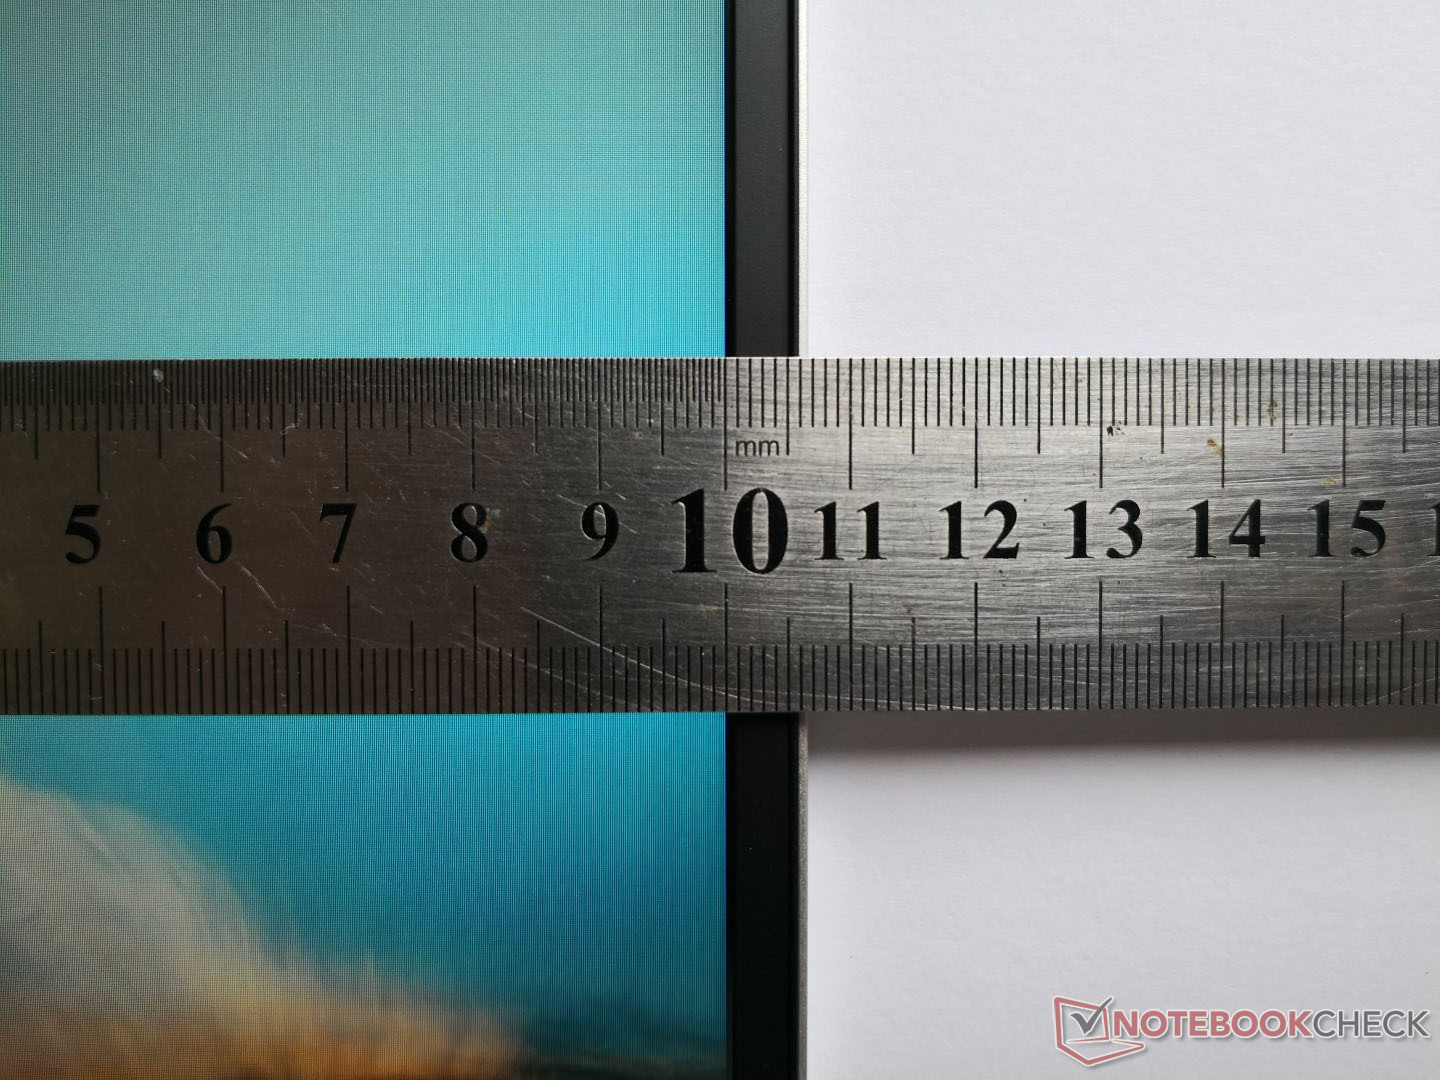
When compared to the EliteBook 830 G6, the 830 G7 has noticeably narrower bezels on all four sides especially along the top and bottom for a much higher screen-to-body ratio. HP is claiming 34 percent and 29 percent thinner top and bottom bezels, respectively, than last year's model. The system is smaller than the ThinkPad X13 while being slightly larger and heavier than the Latitude 7310. Dimensions are very nearly the same as the EliteBook x360 1030 G4 even though the latter is a pricier model.
Connectivity
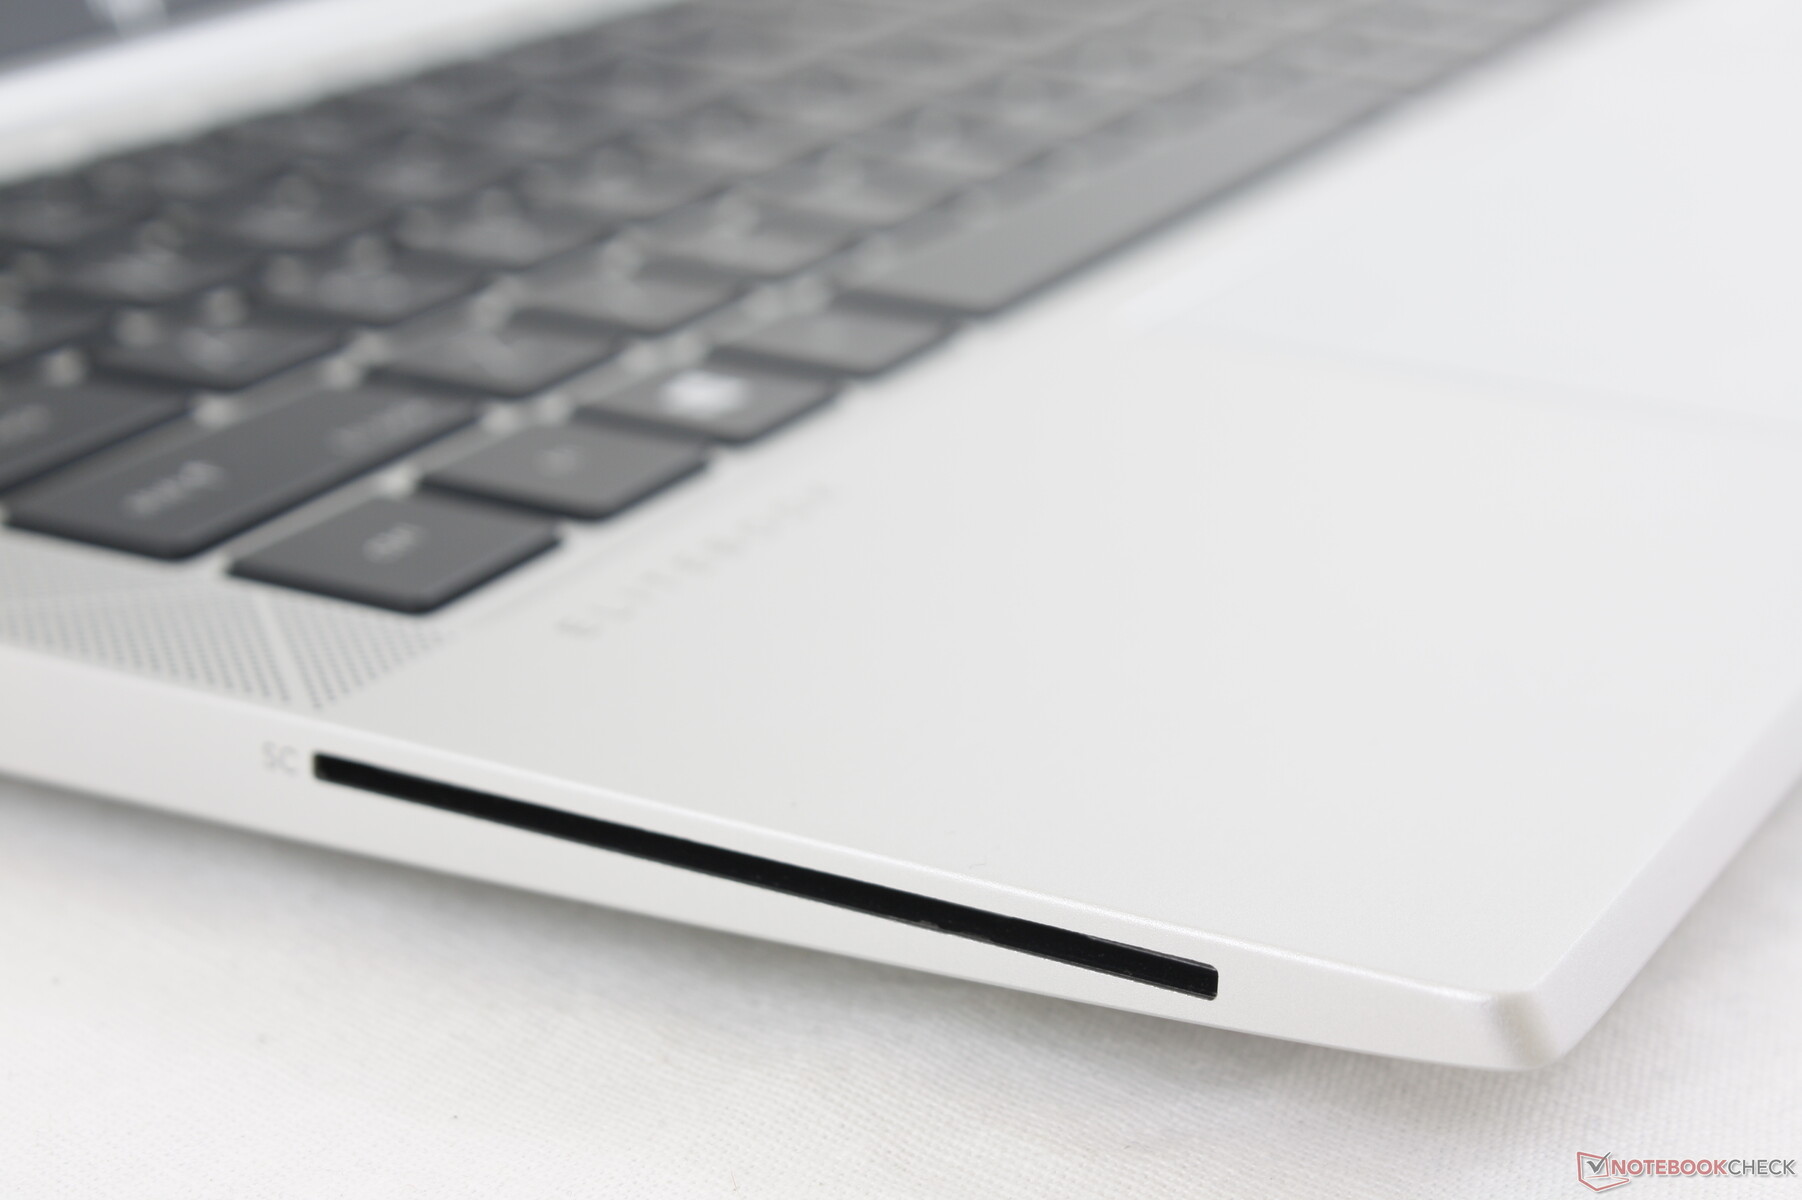
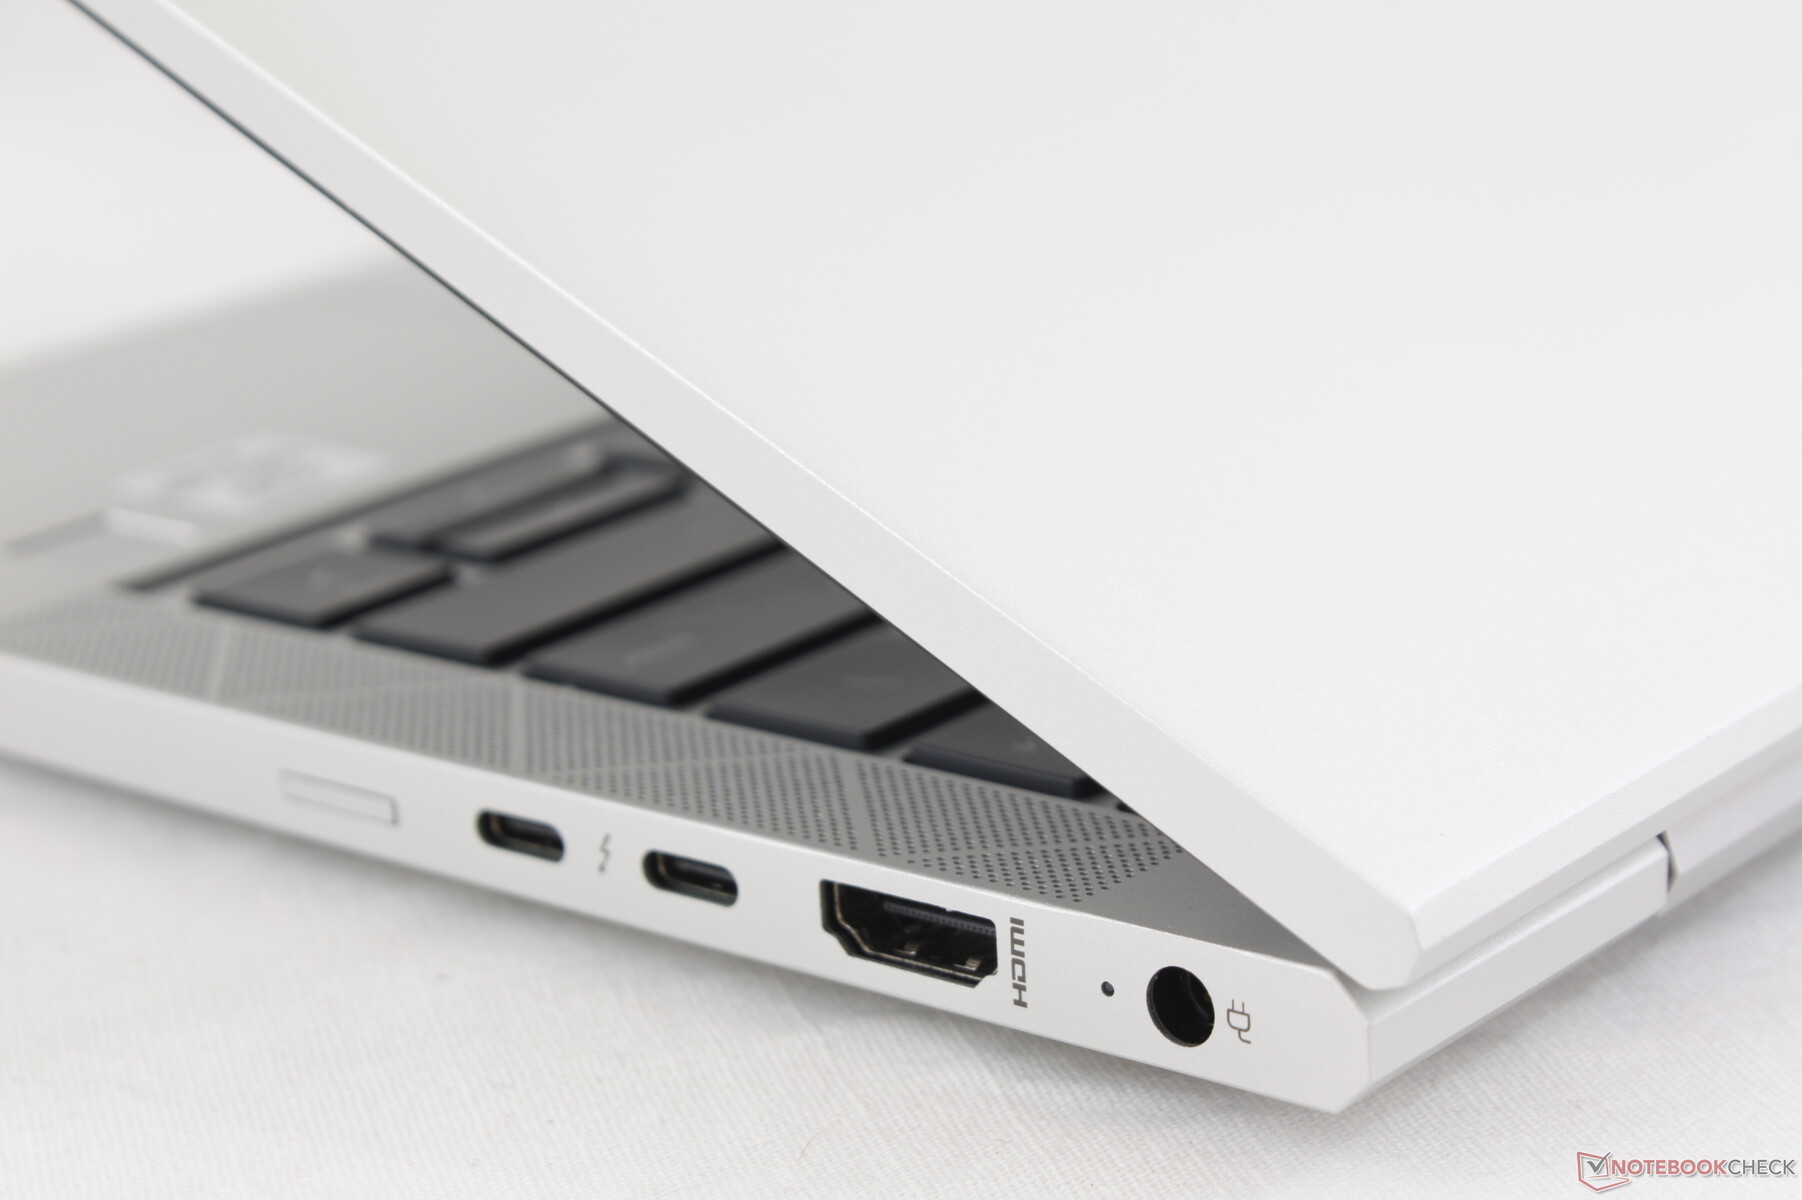
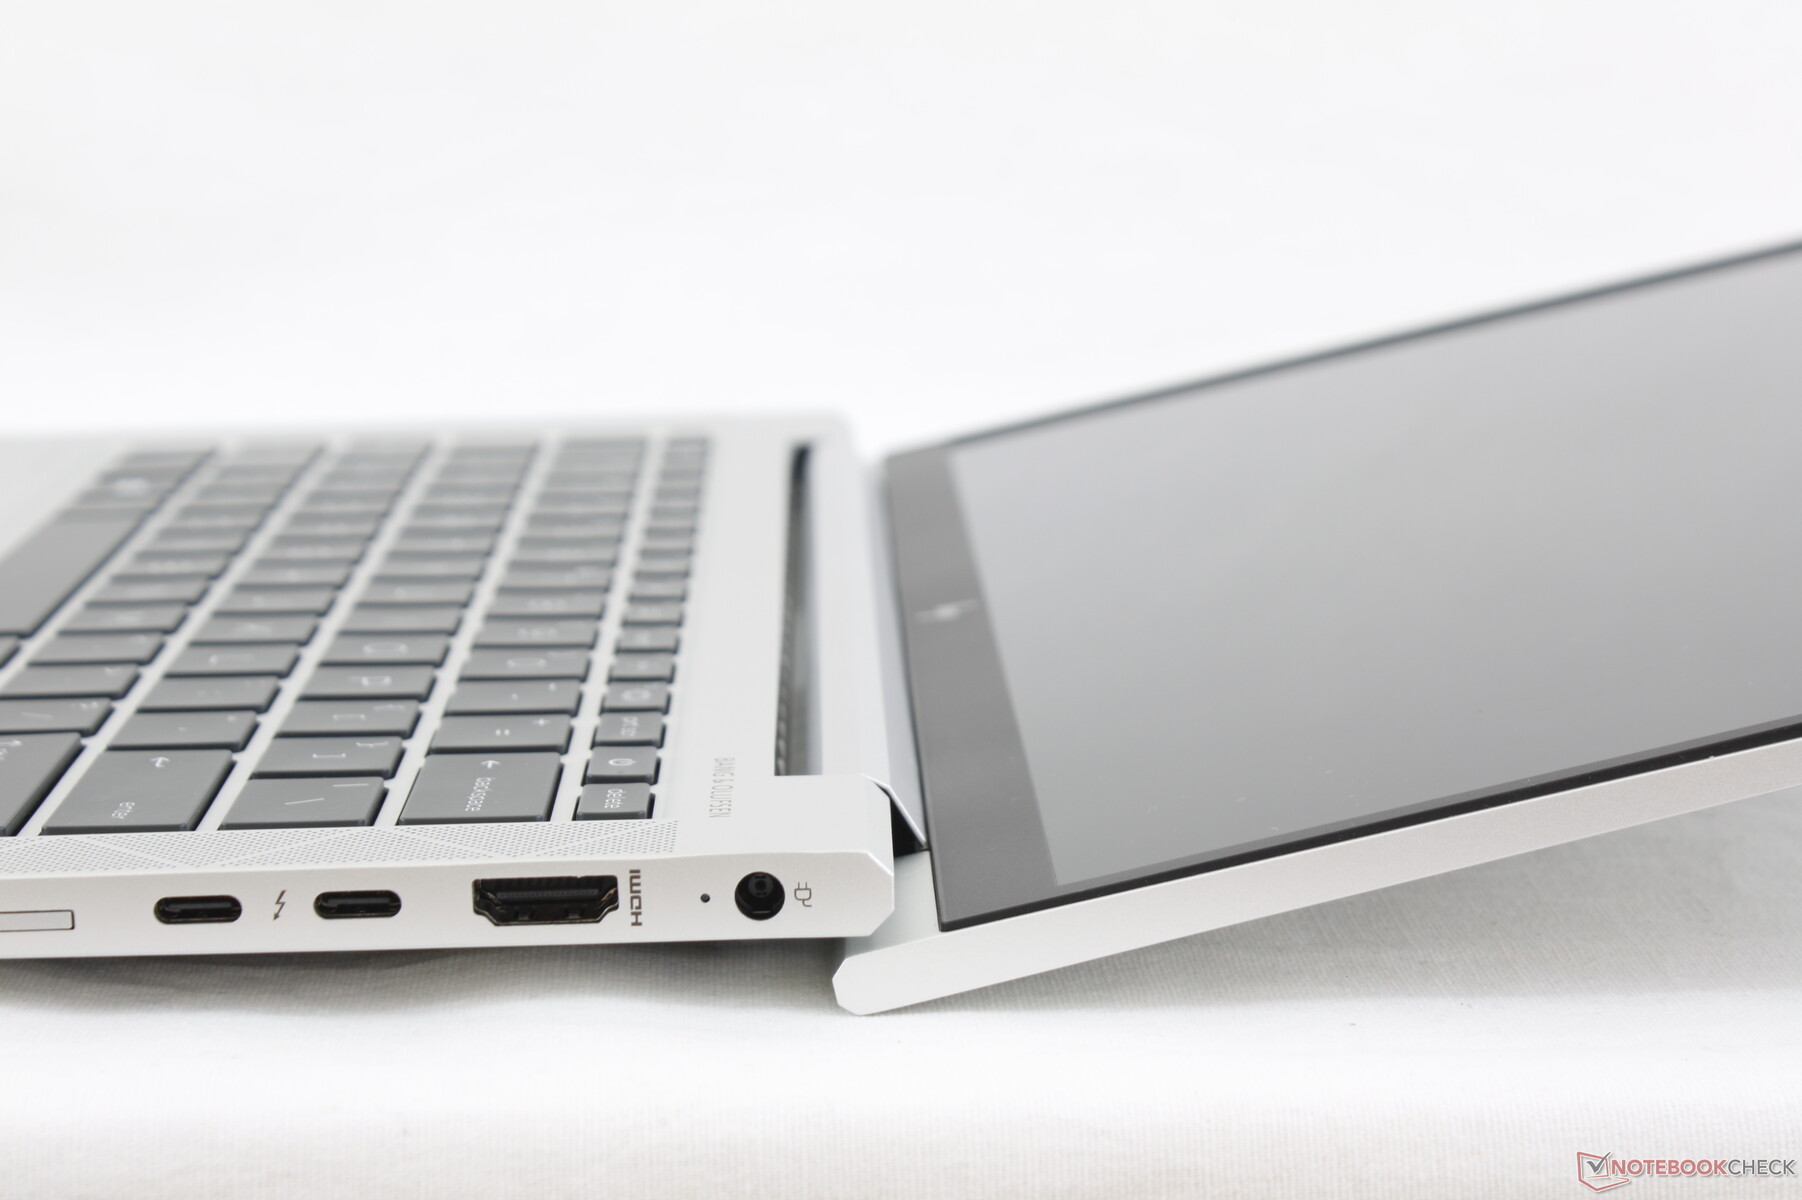
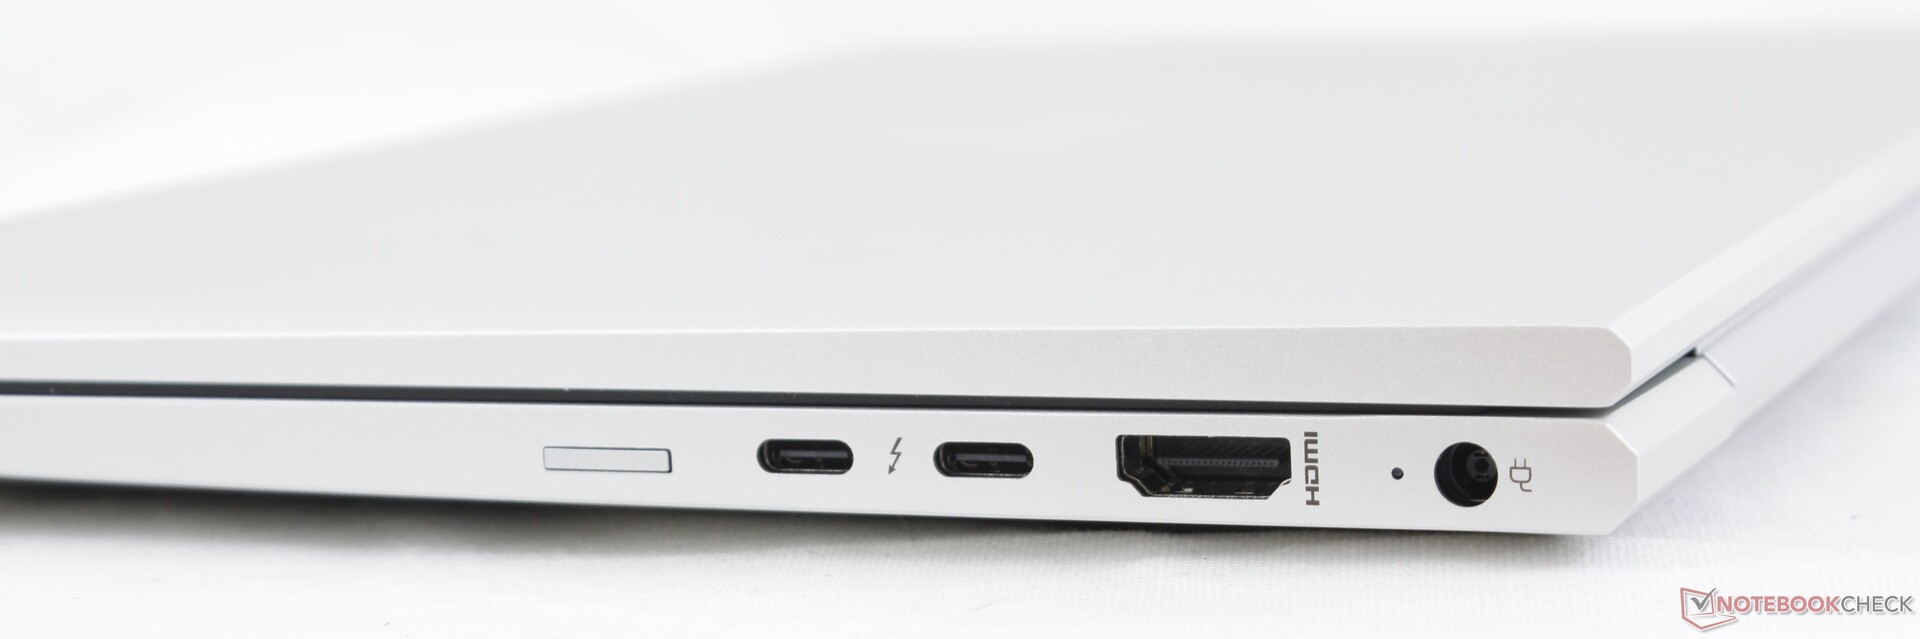
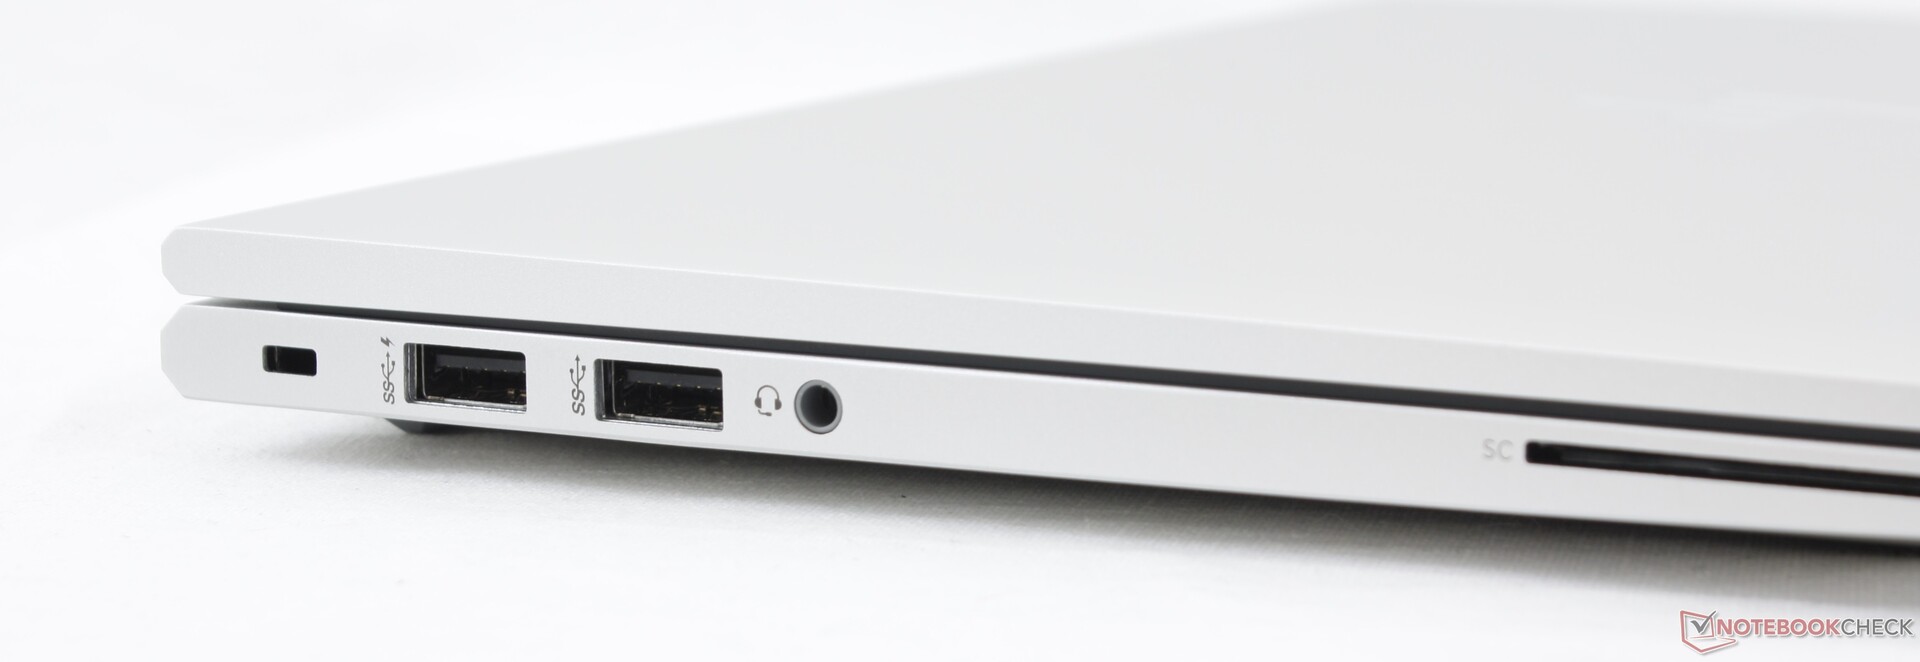
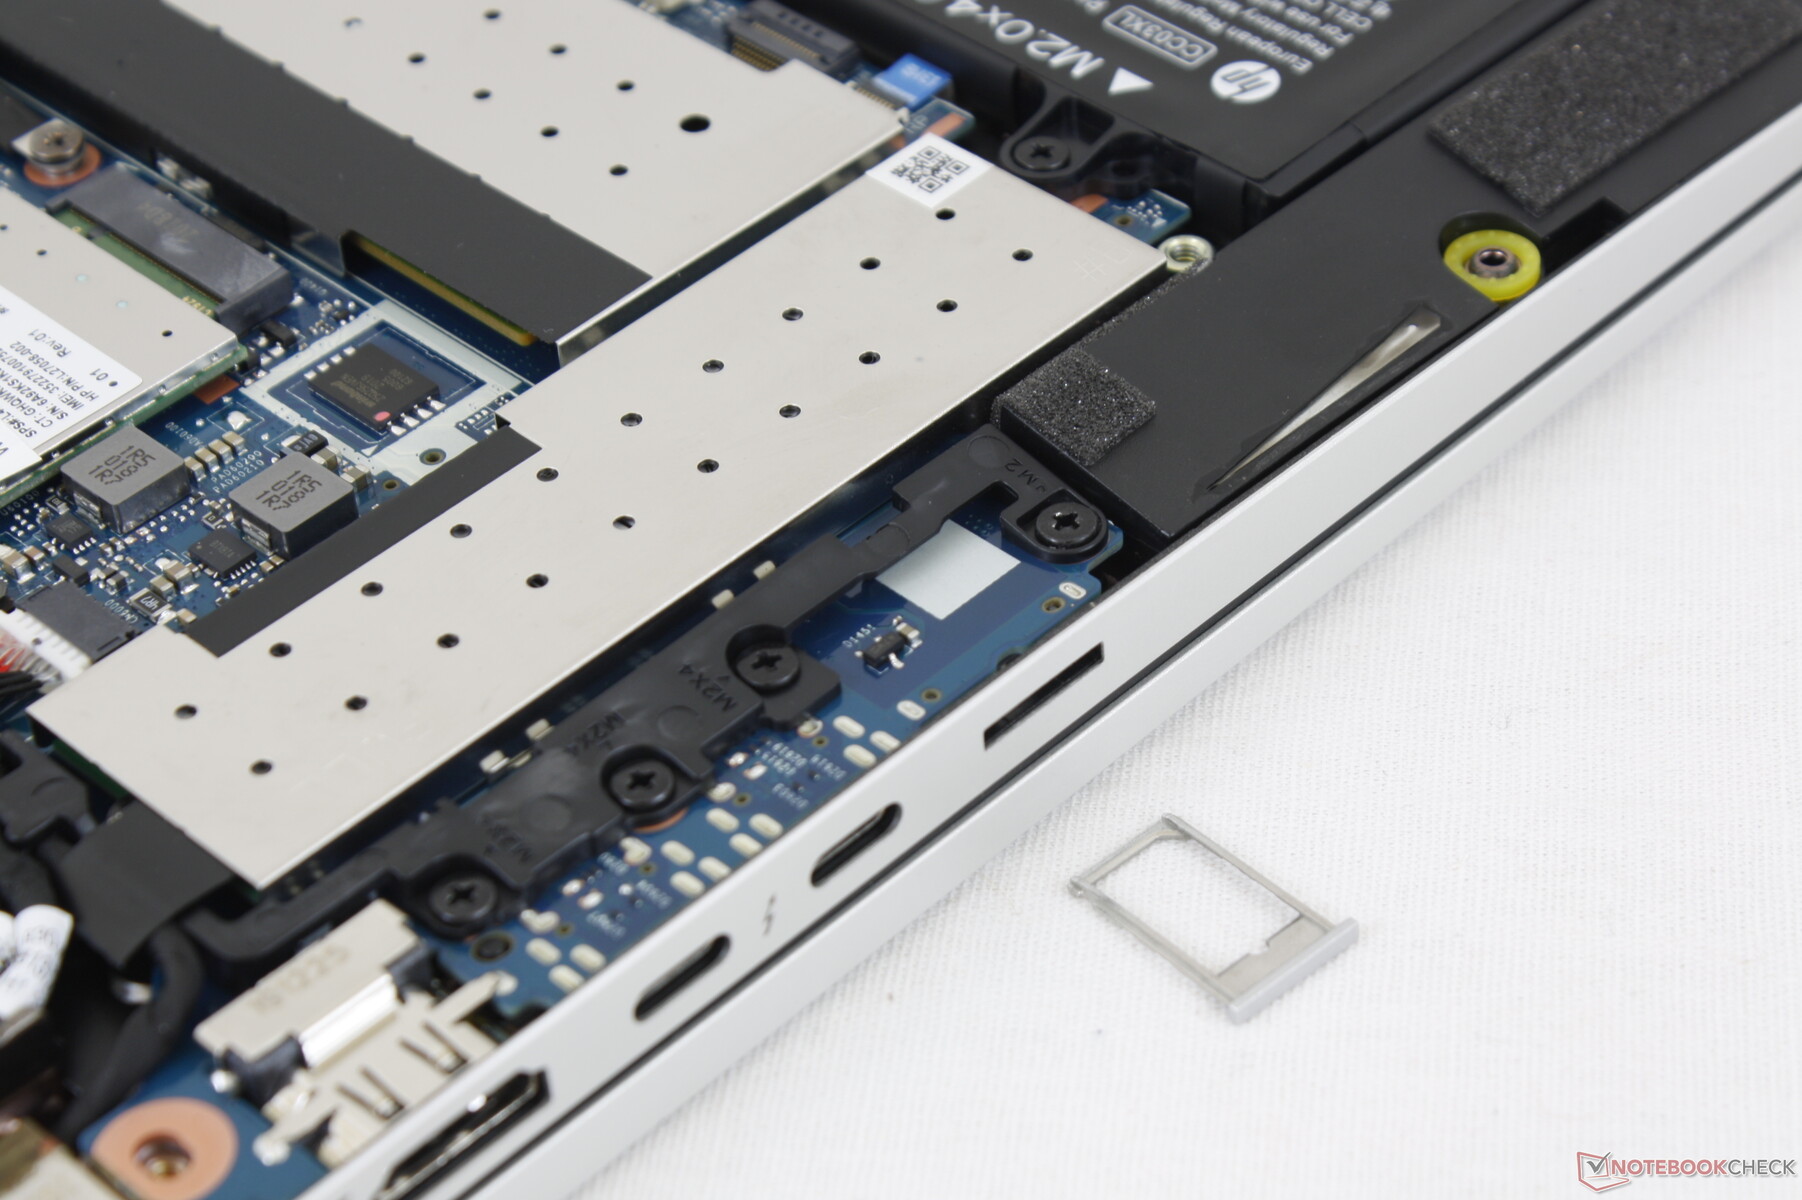
The one feature missing on the EliteBook 830 G7 is a MicroSD reader whereas both the competing Latitude 7310 and ThinkPad X13 have it standard. In return, the system has two Thunderbolt 3 ports compared to one on the 830 G6. Keep in mind that the system can be recharged by USB-C or the proprietary barrel charger. We suspect that HP will drop the barrel charger port for something more useful on future models of the EliteBook.
Communication
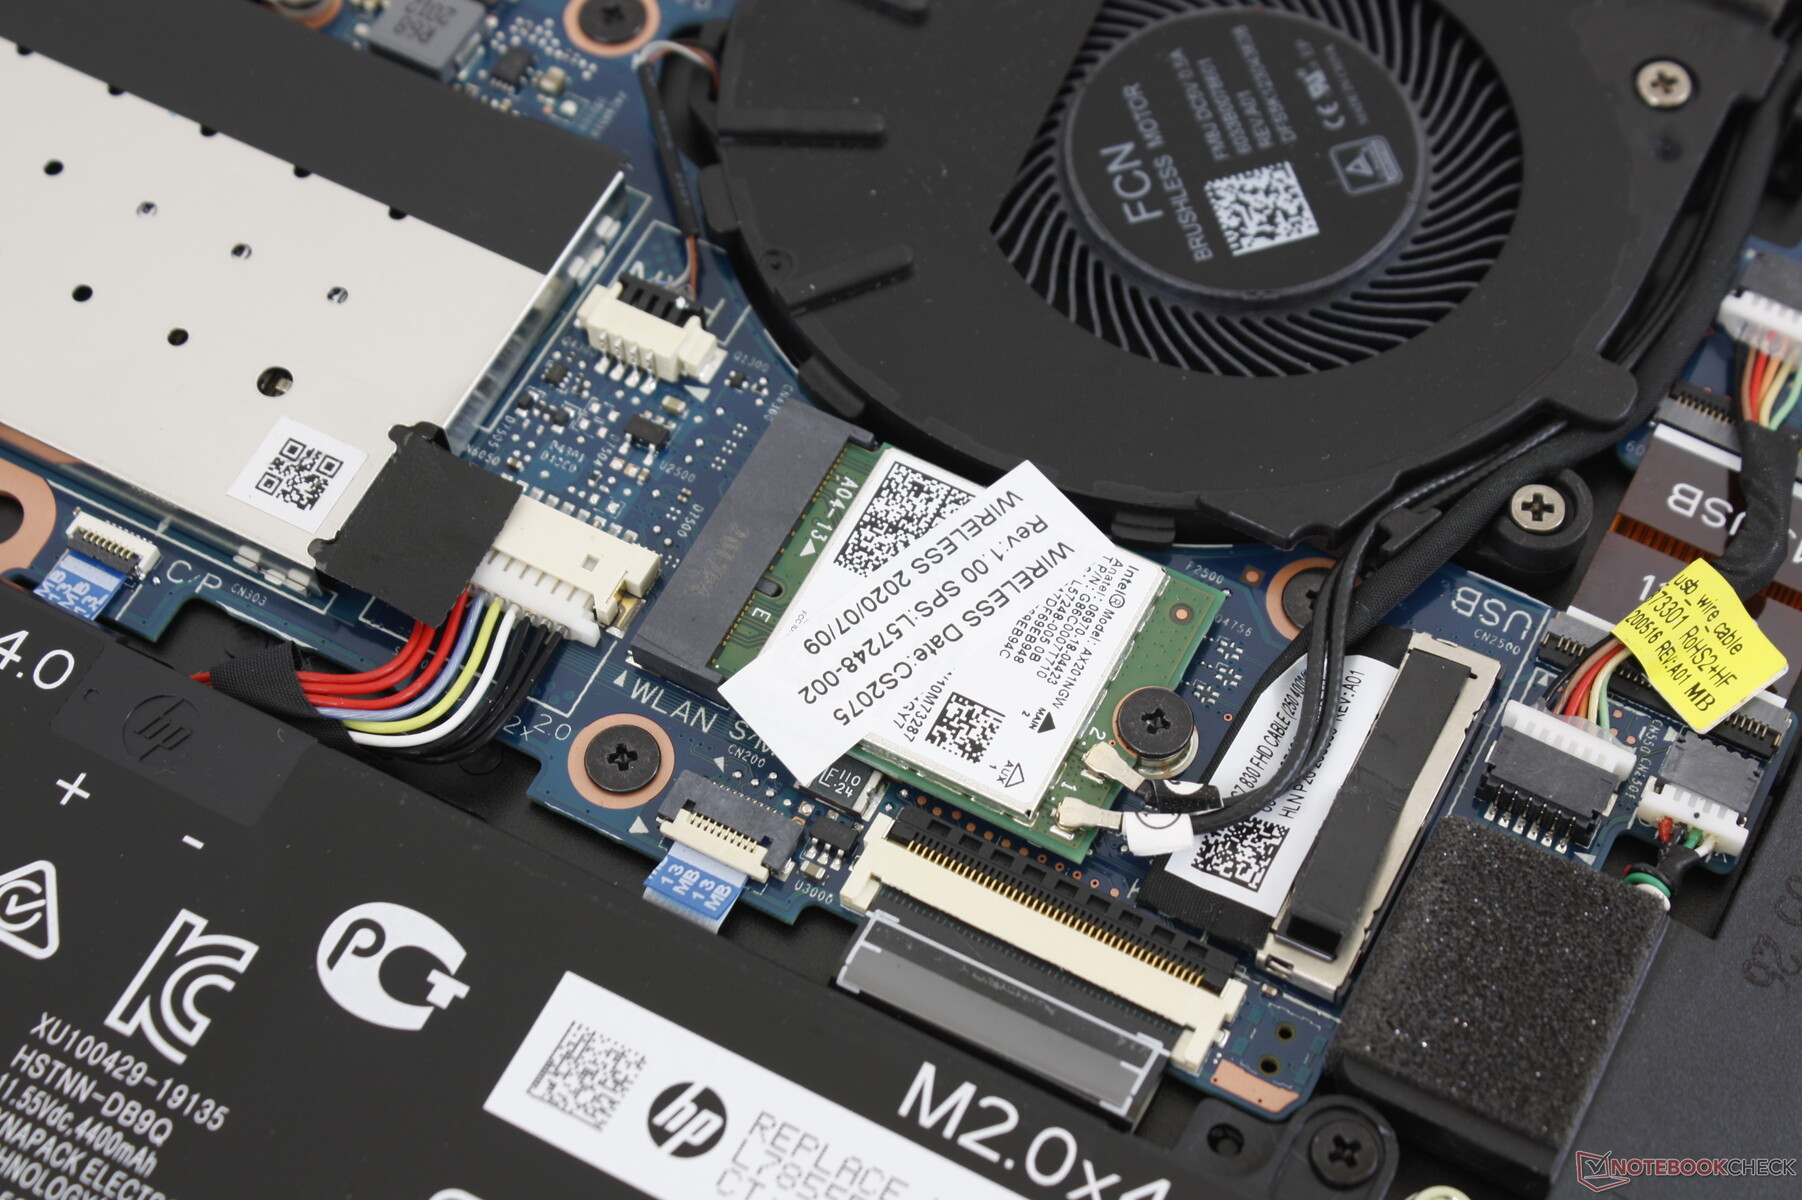
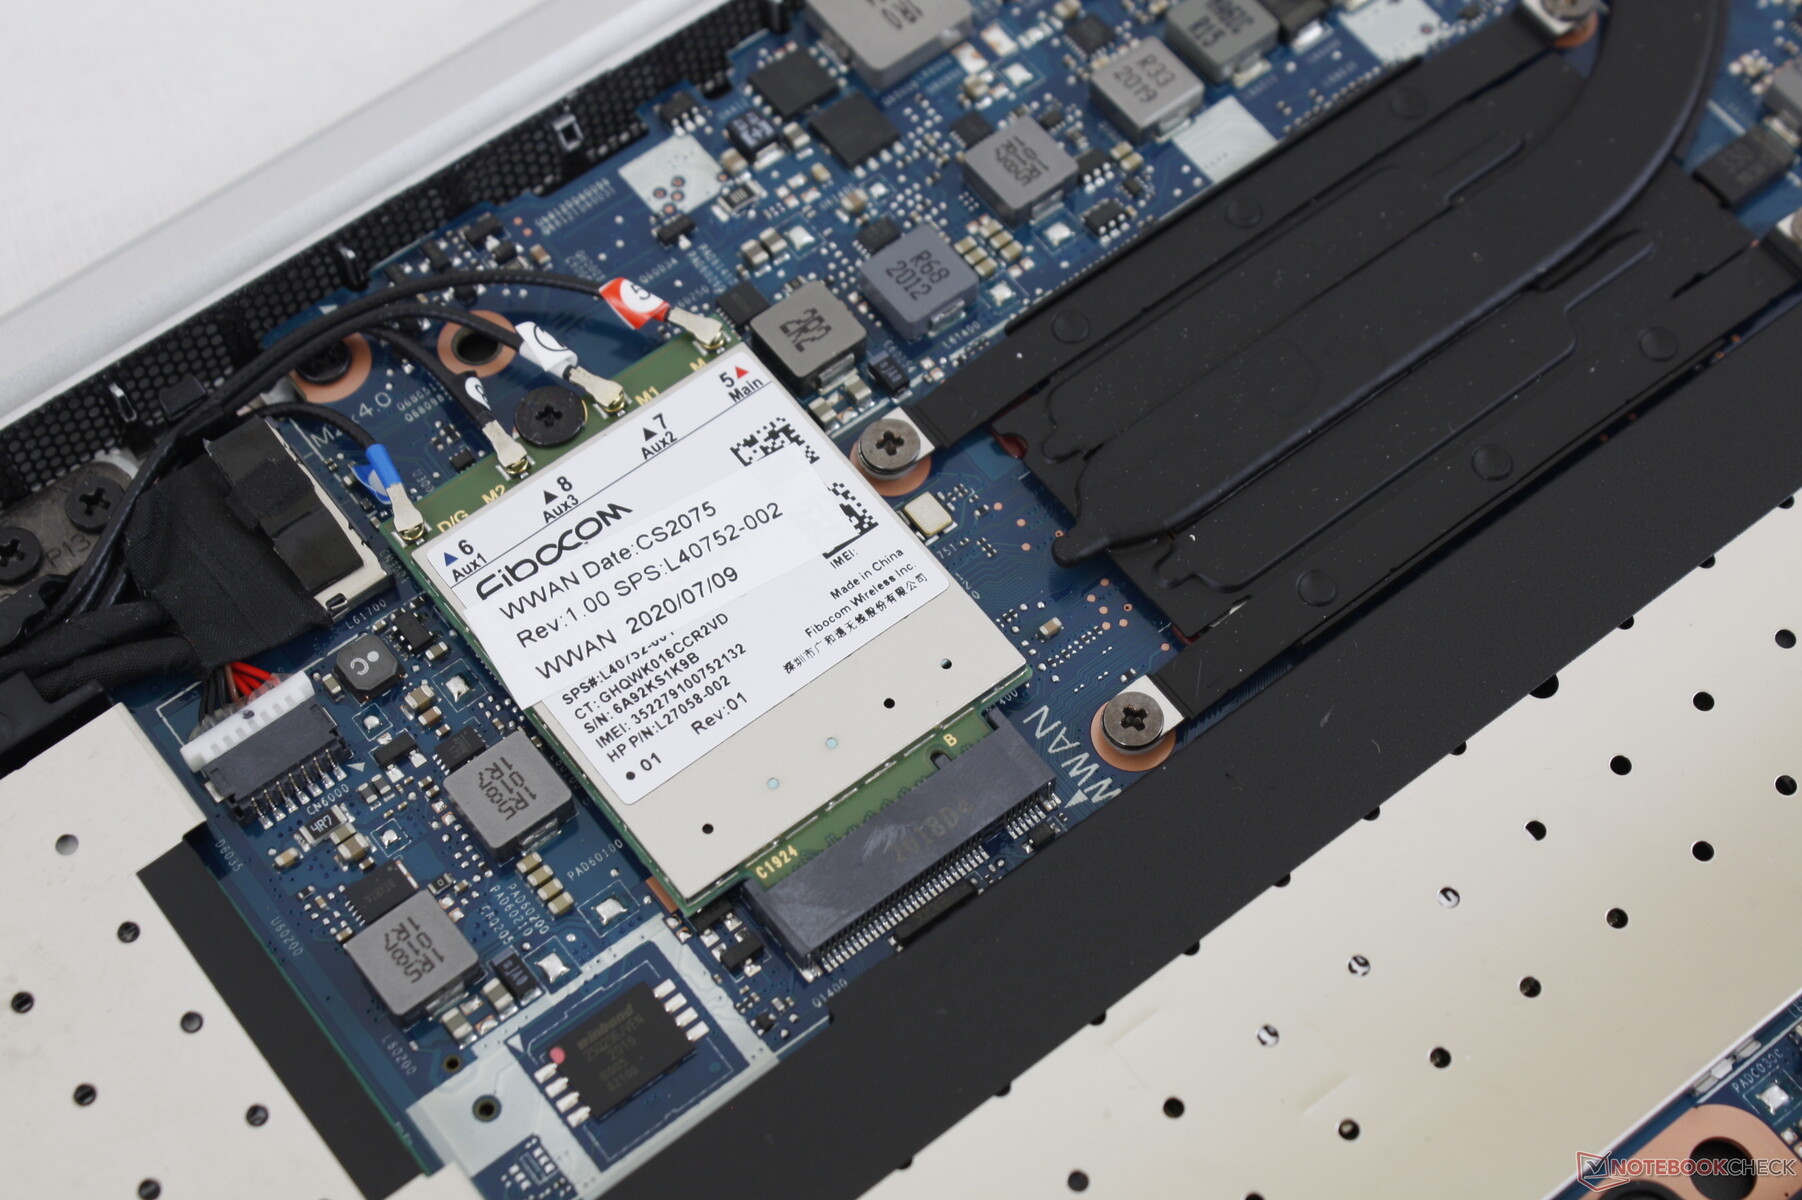
The Intel AX201 comes standard for Wi-Fi 6 and Bluetooth 5.1 connectivity with no noticeable issues when paired to our Netgear RAX200 test router. WWAN is supported as well with Intel XMM 7360 or 7560 LTE options, but eSIM is absent meaning users will have to insert their own nano-SIM cards.
Webcam
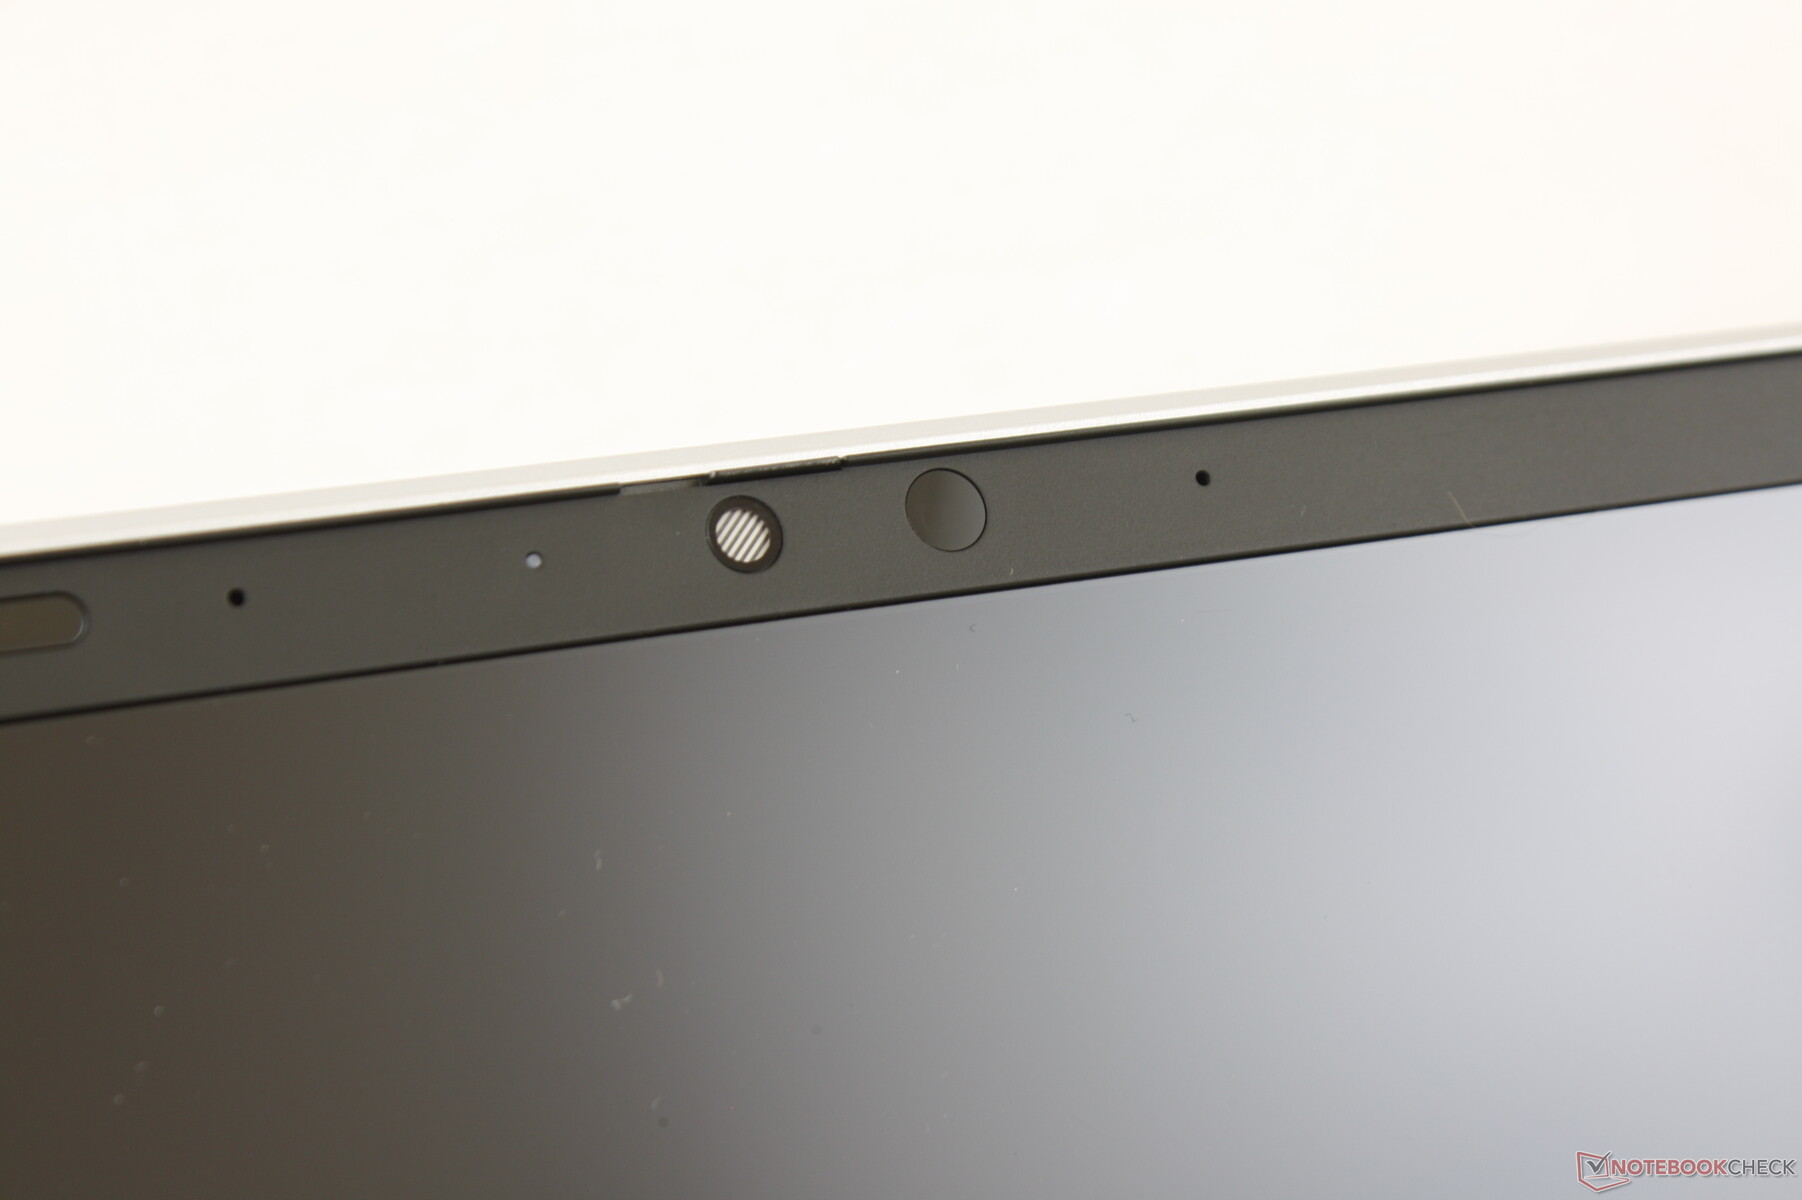
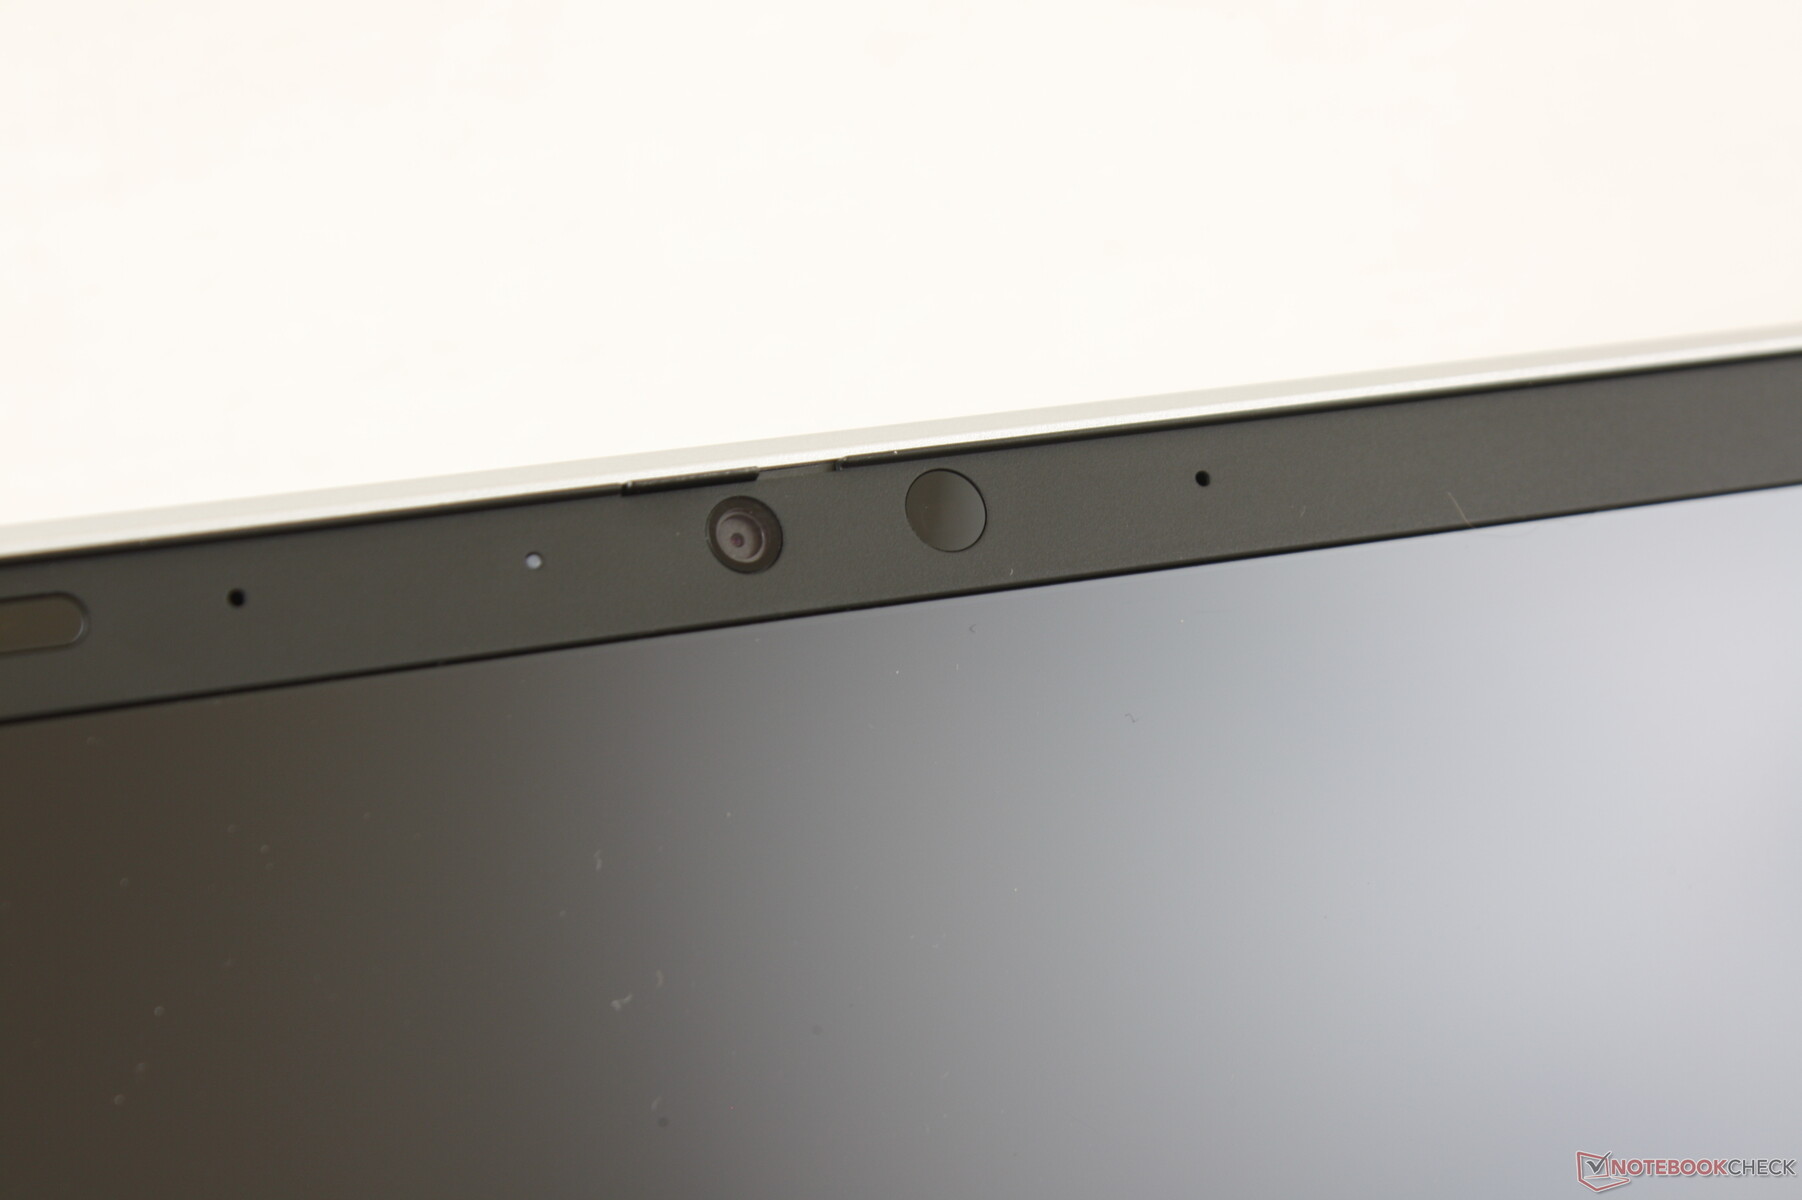


Security
The same suite of security features on the Elitebook 1030 series can be found here on the 830 G7 including HP Client Security. There is no proximity sensor for complete hands-free login unlike on the Latitude 7310.
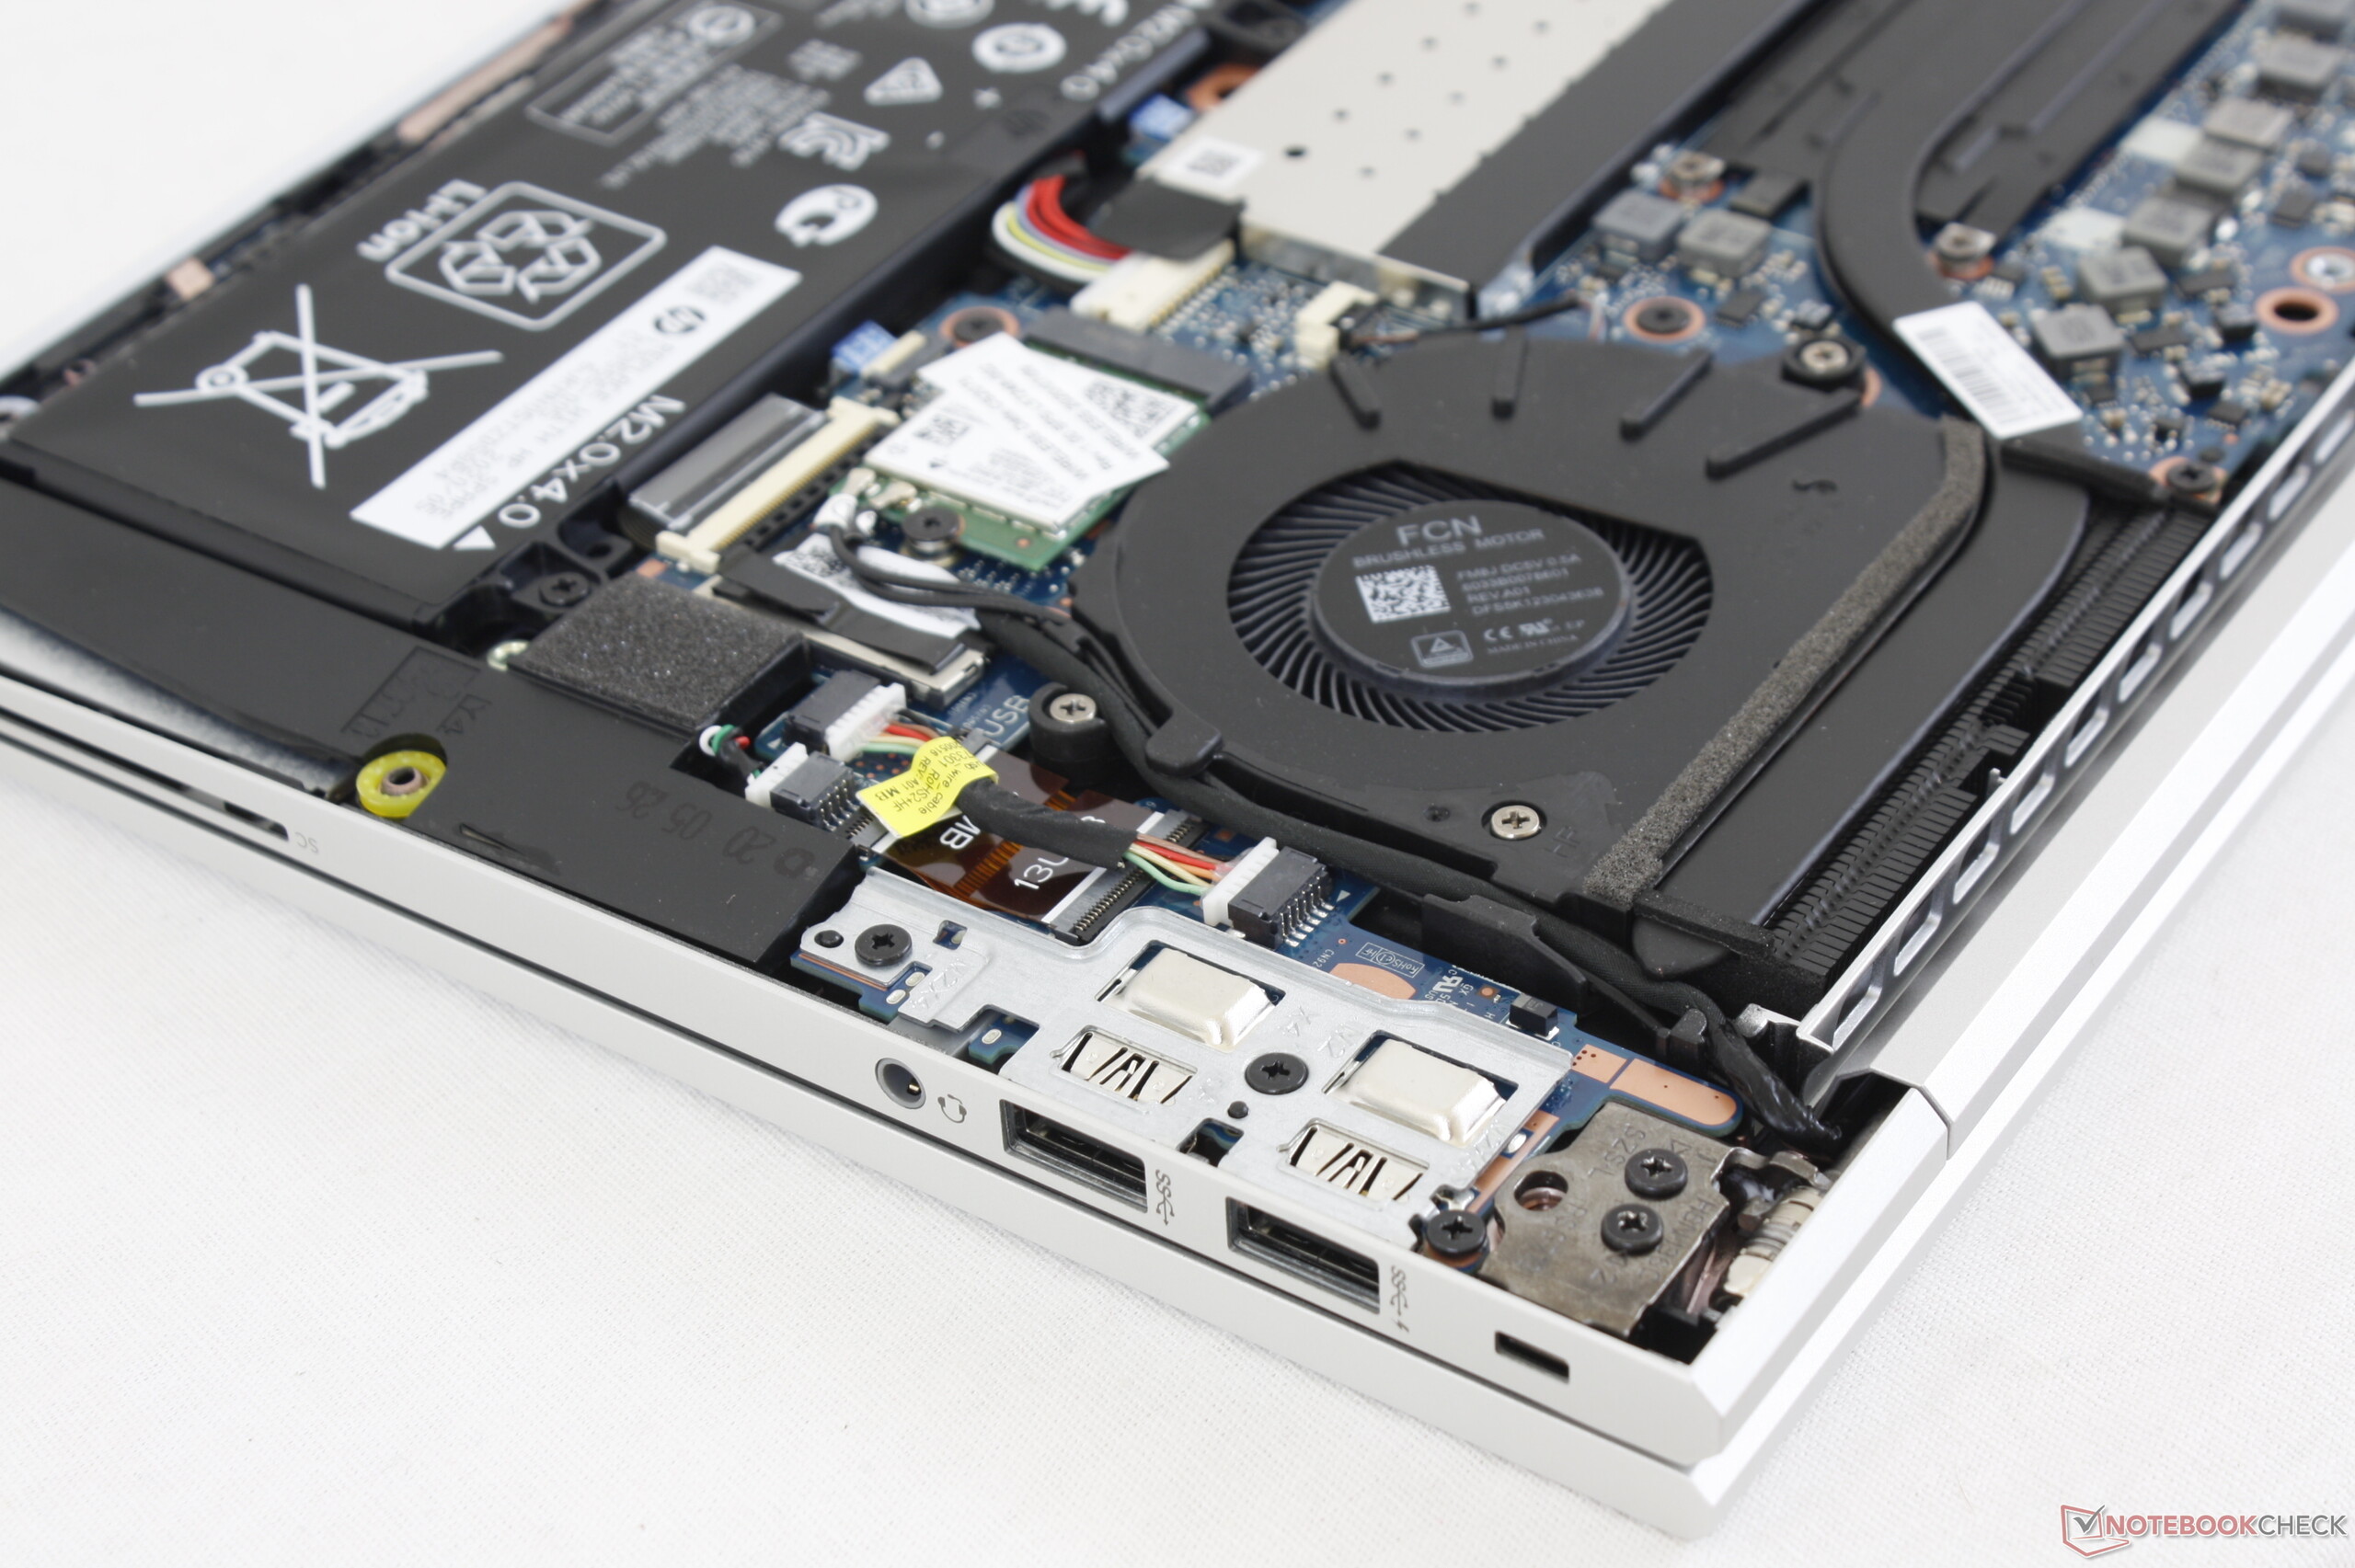
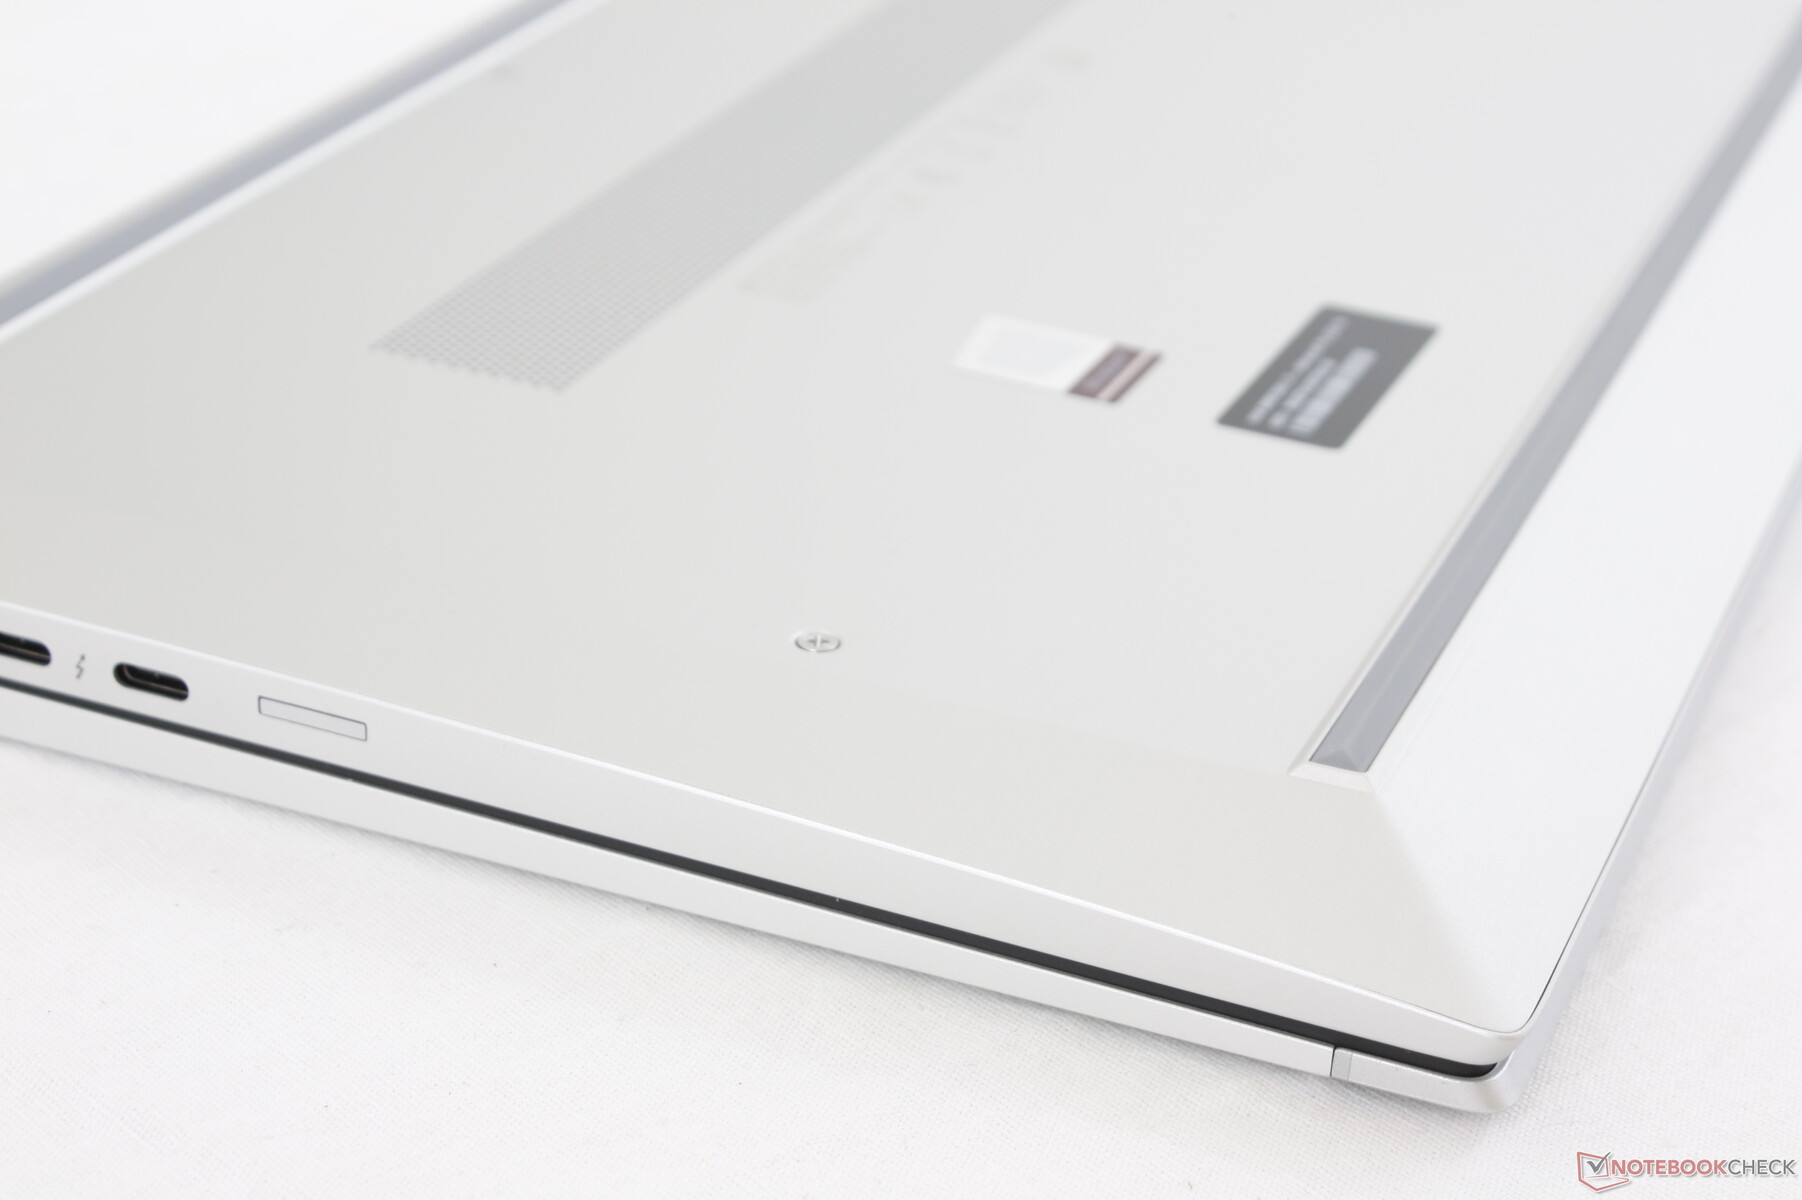
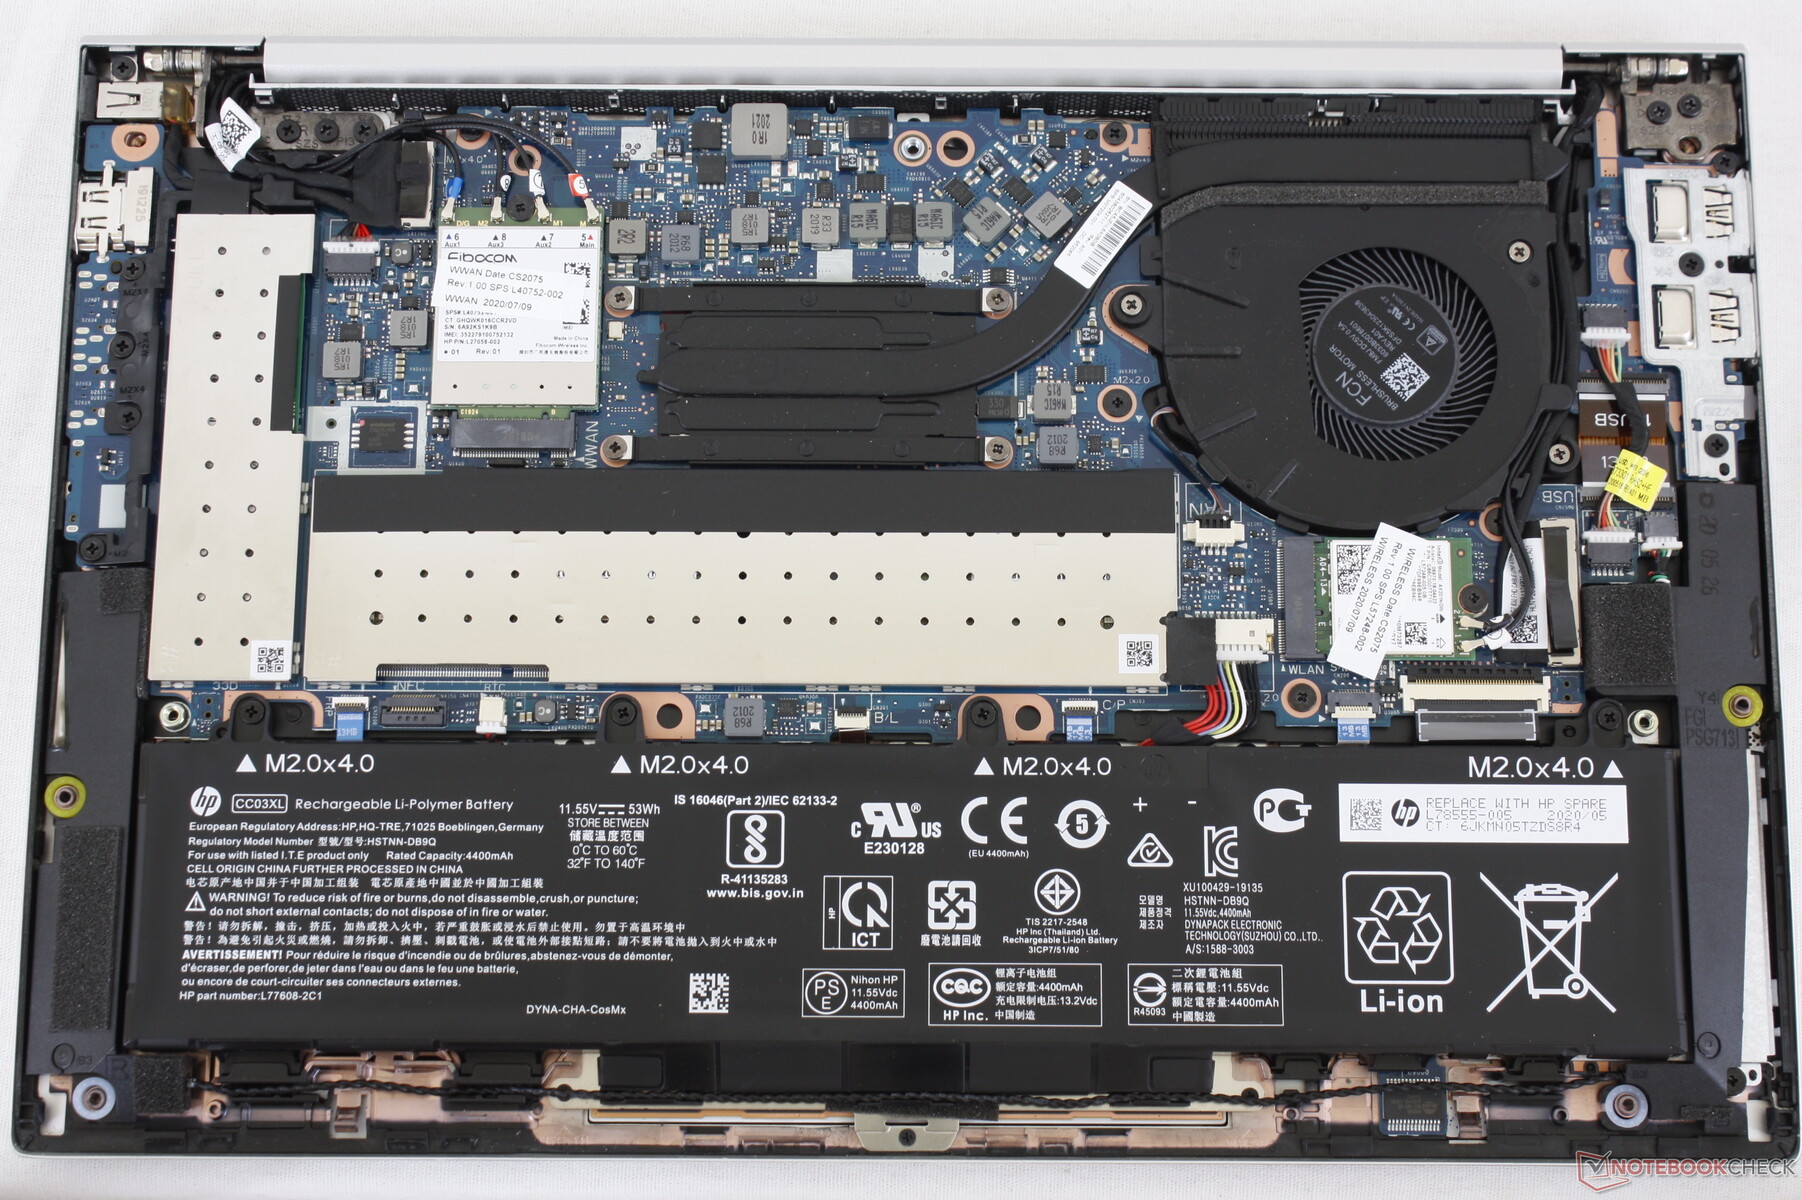
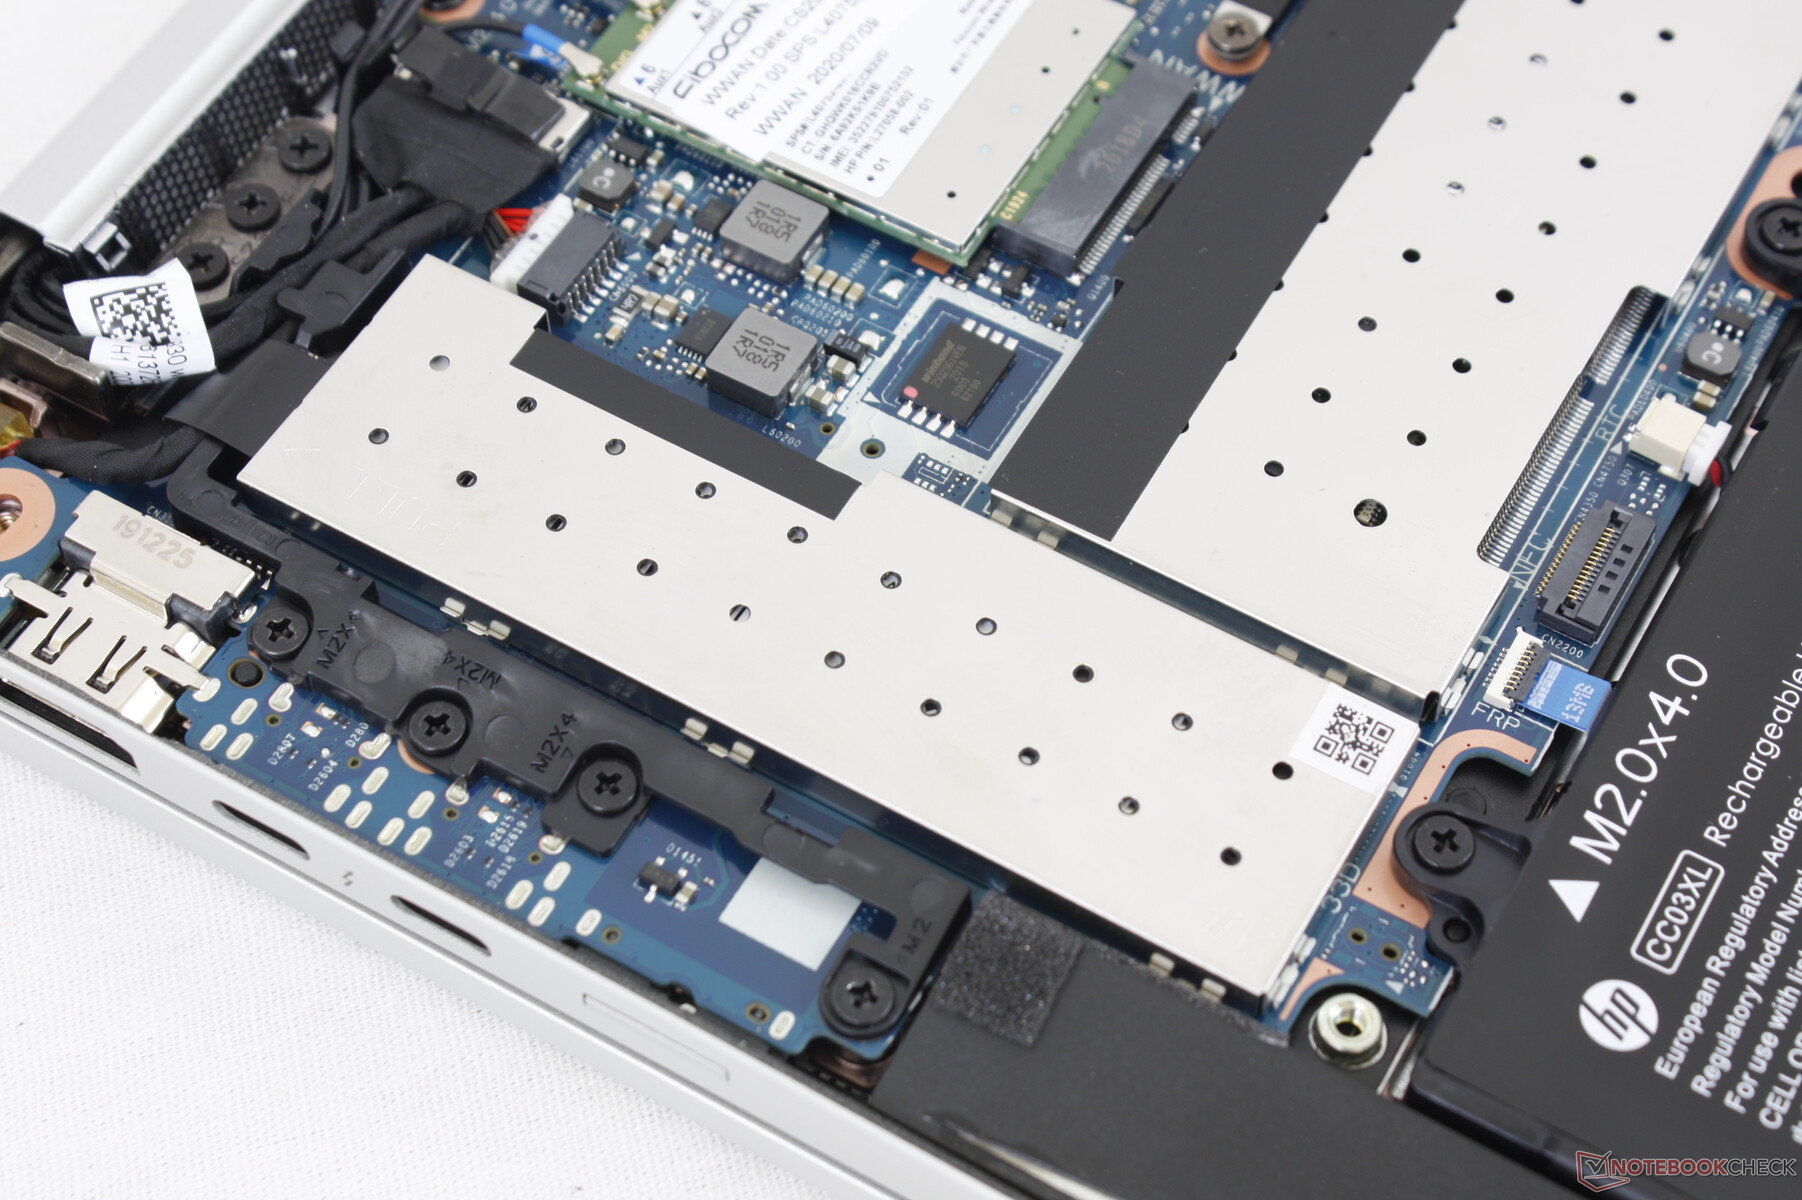
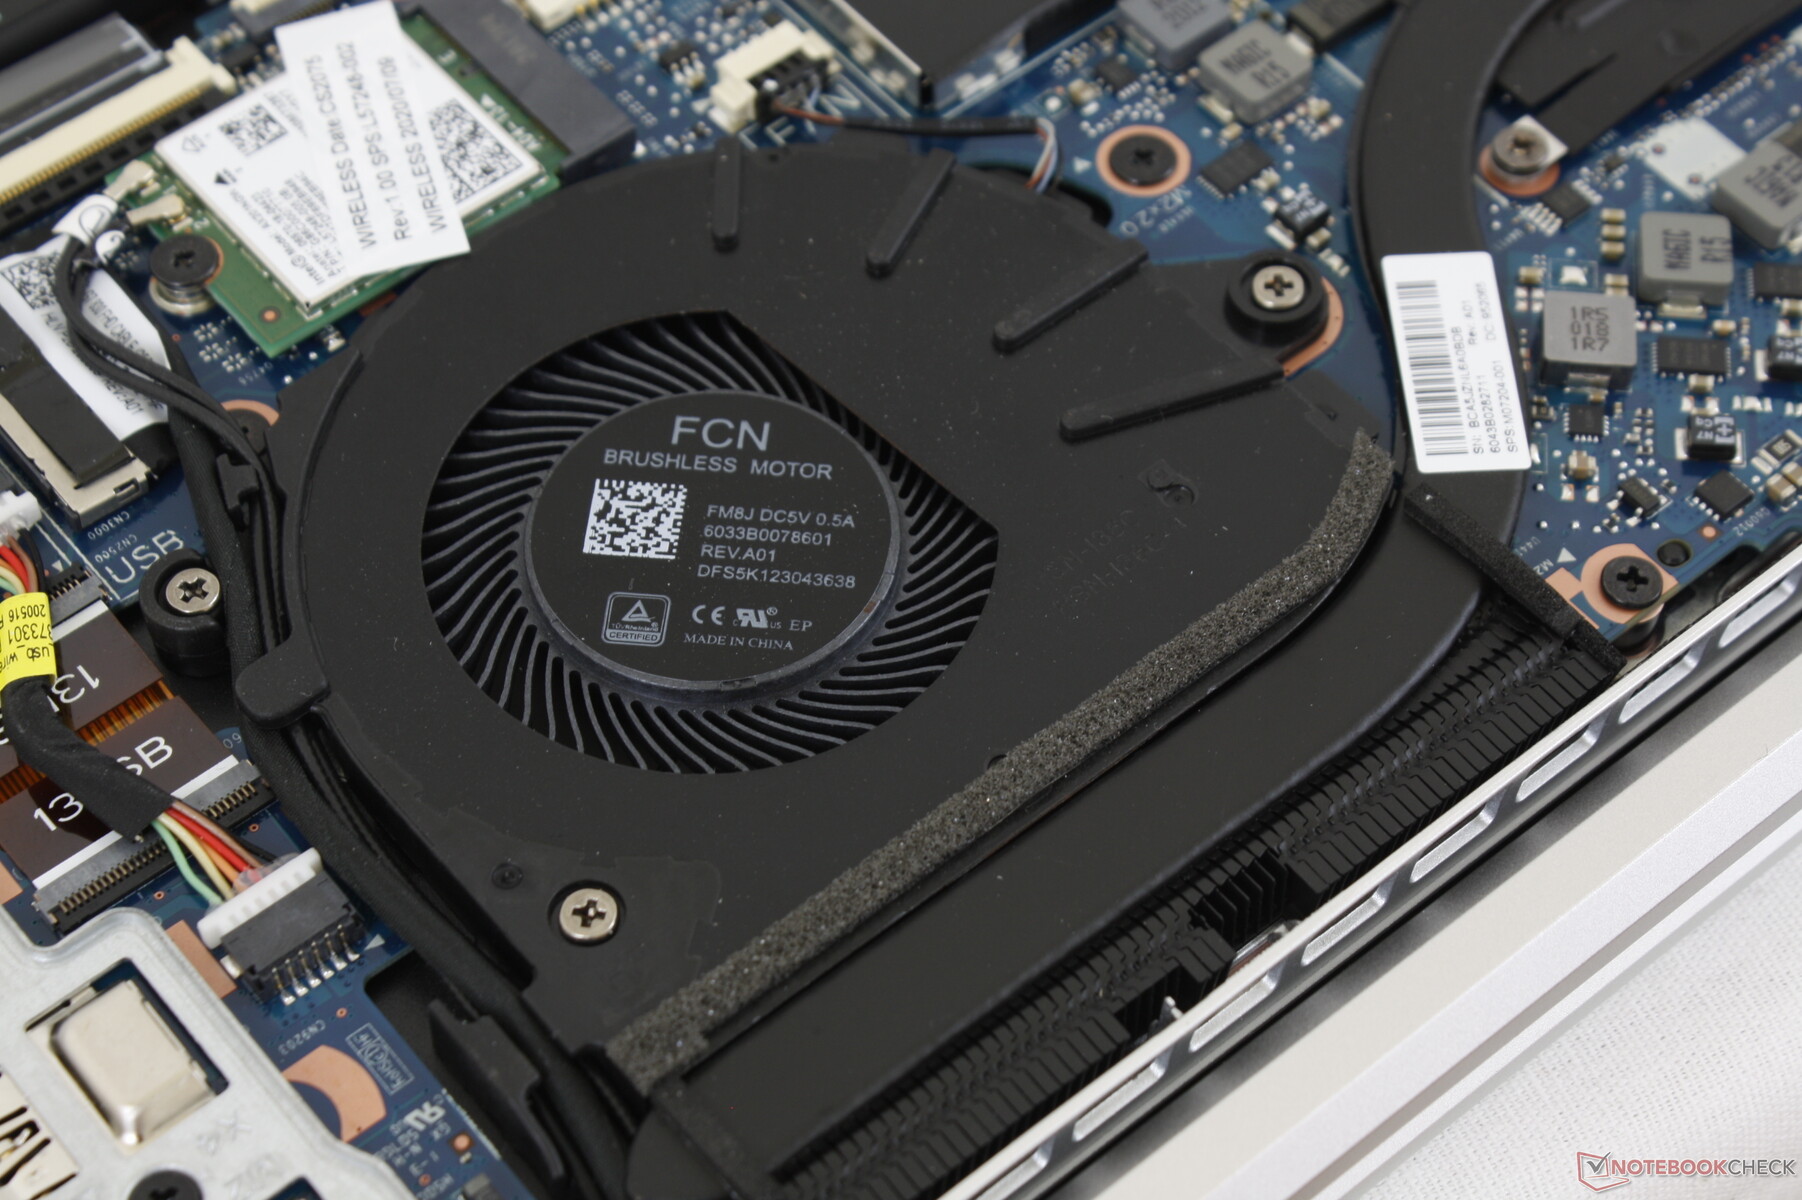
Maintenance
The bottom panel is secured by just 5 Philips screws with none hidden underneath the rubber feet. While easy to remove, the aluminum shields covering the M.2 SSD and 2x SODIMM slots will take more patience.
Accessories and Warranty
There are no extras in the box other than the usual paperwork and AC adapter. However, users have to option to choose between a proprietary barrel AC adapter or a universal USB-C AC adapter at checkout. A three-year limited warranty comes standard.
Input Devices
Keyboard
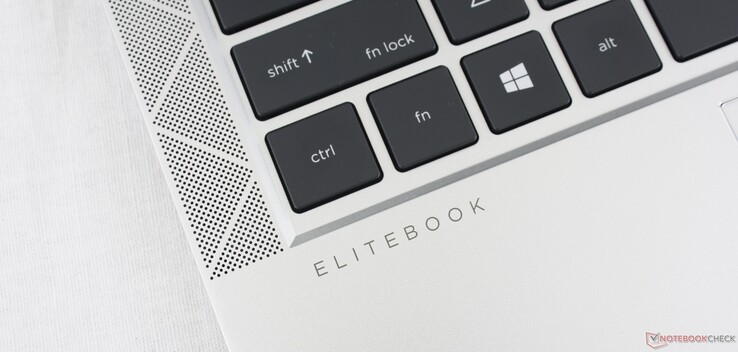
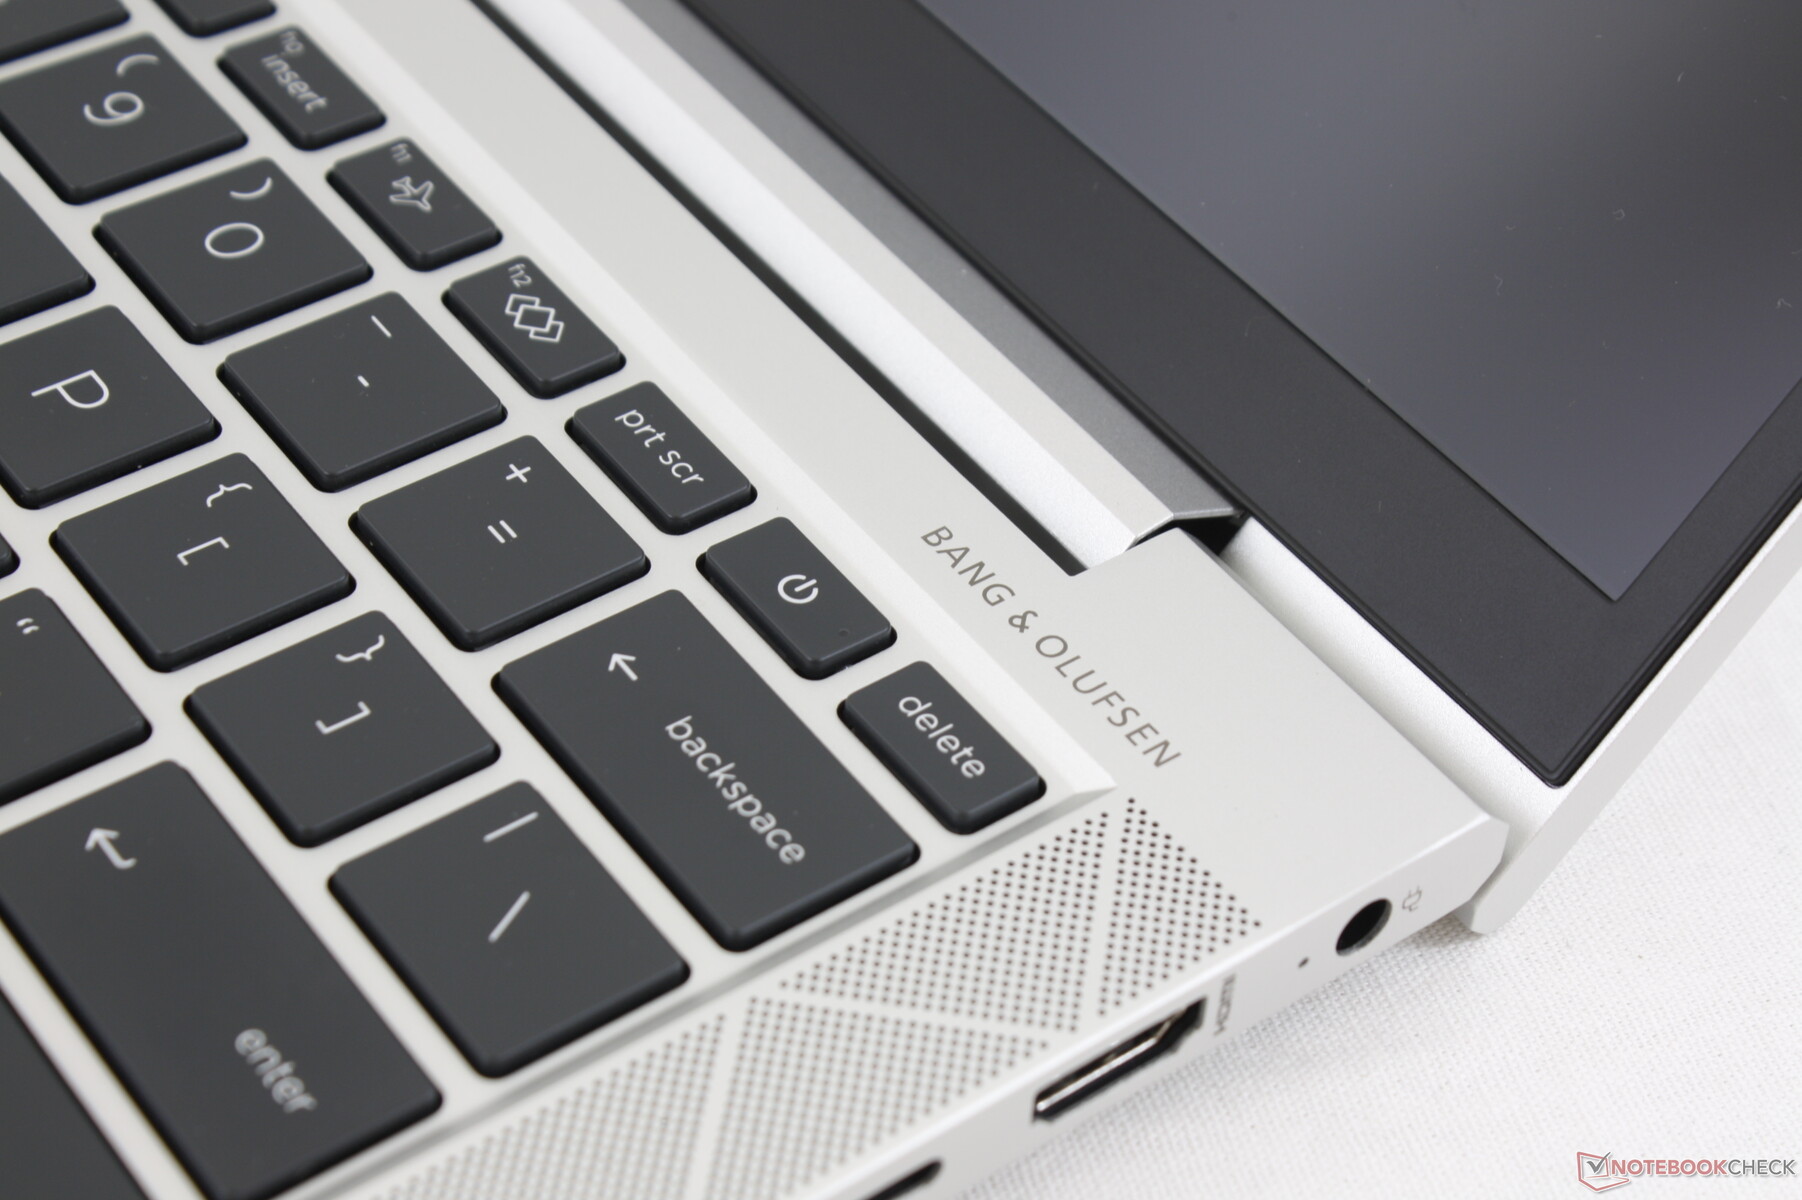
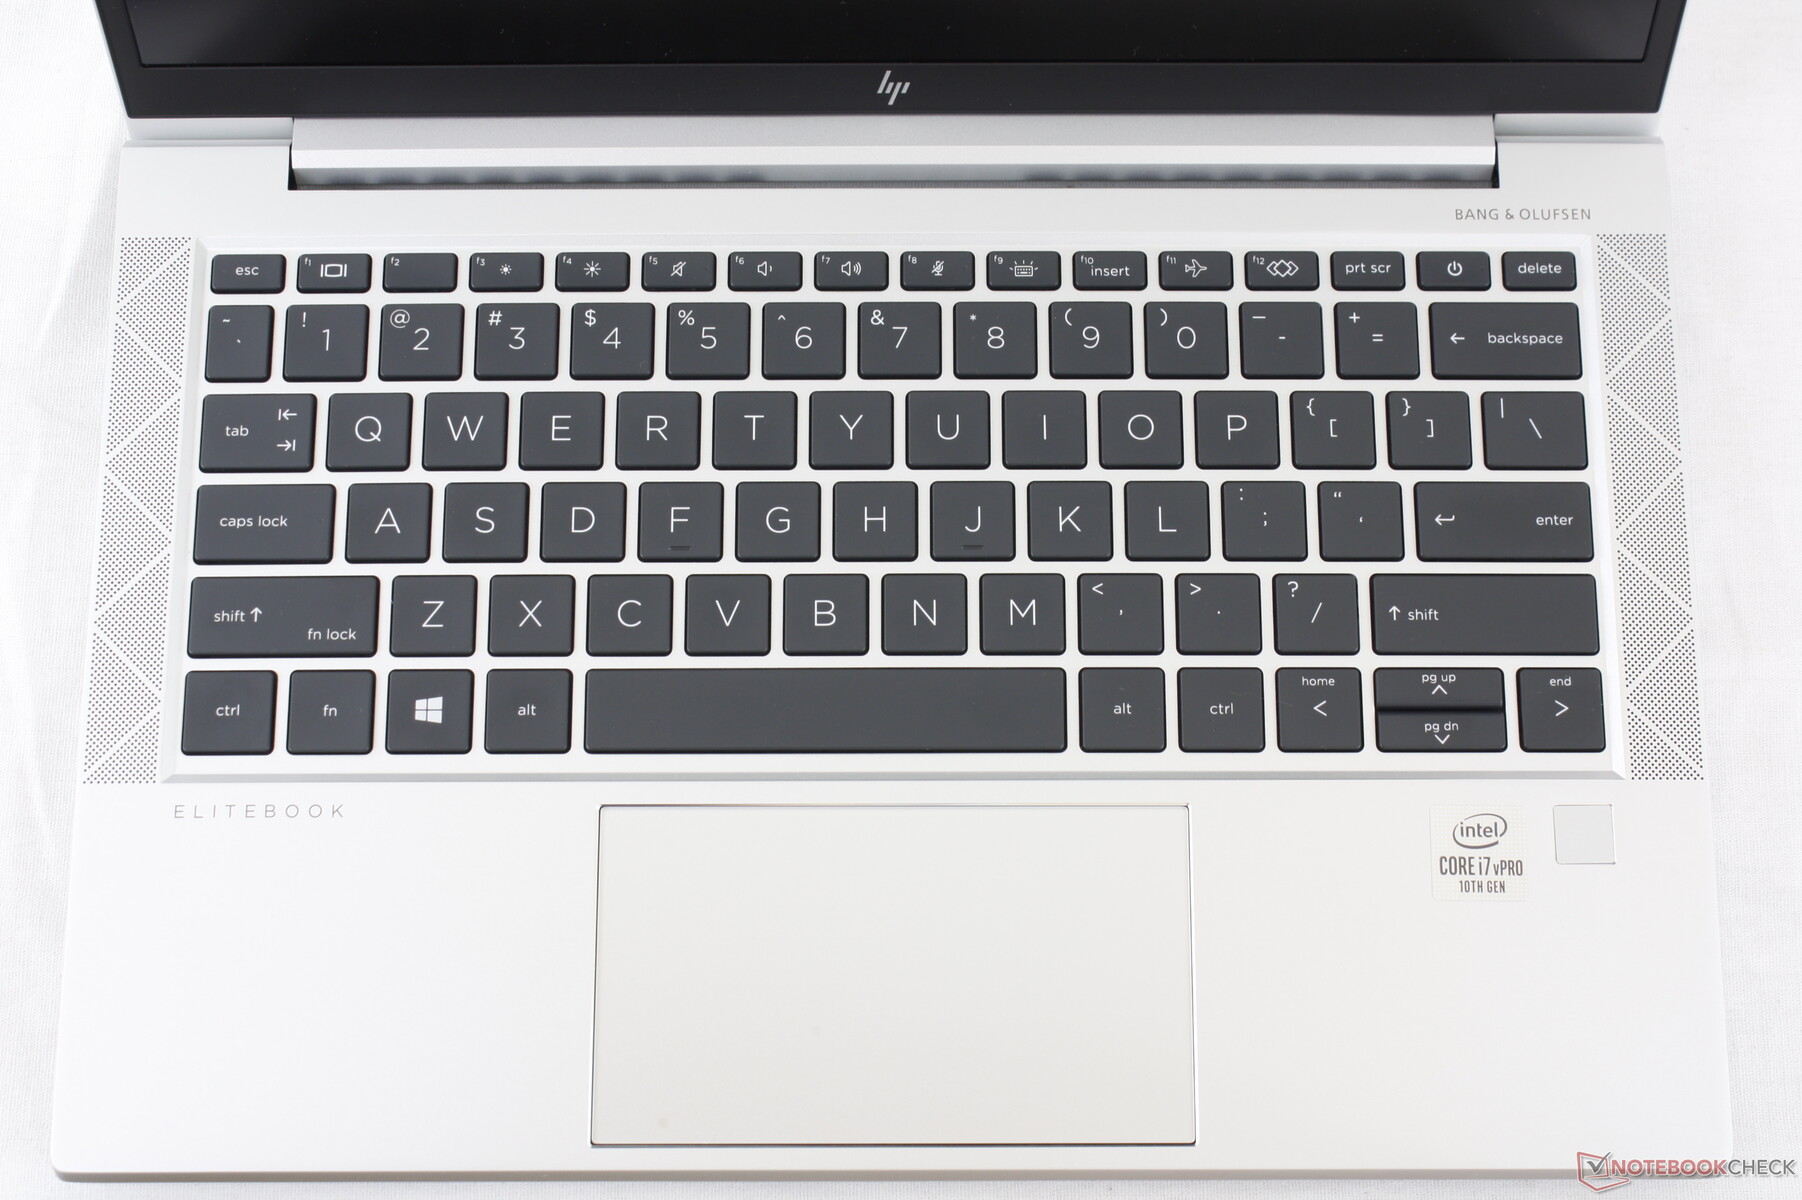
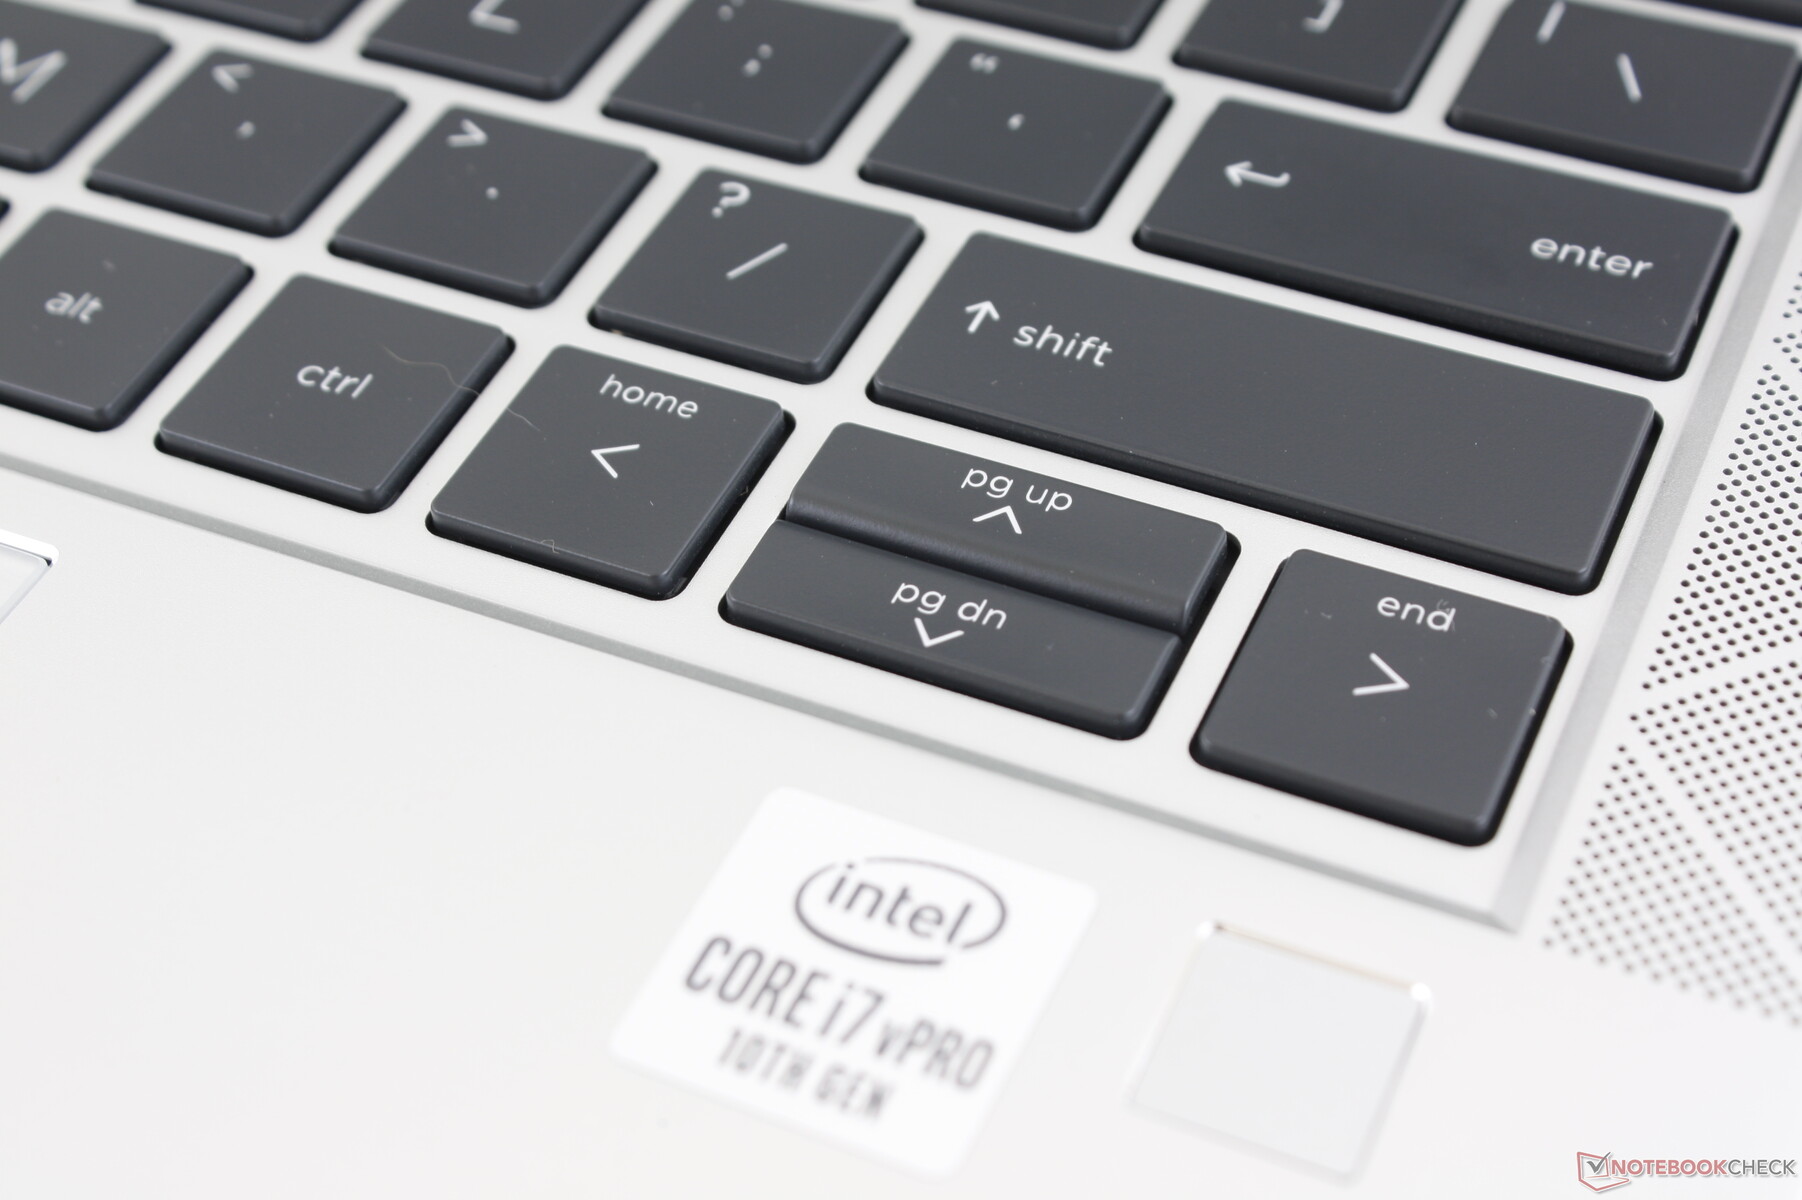
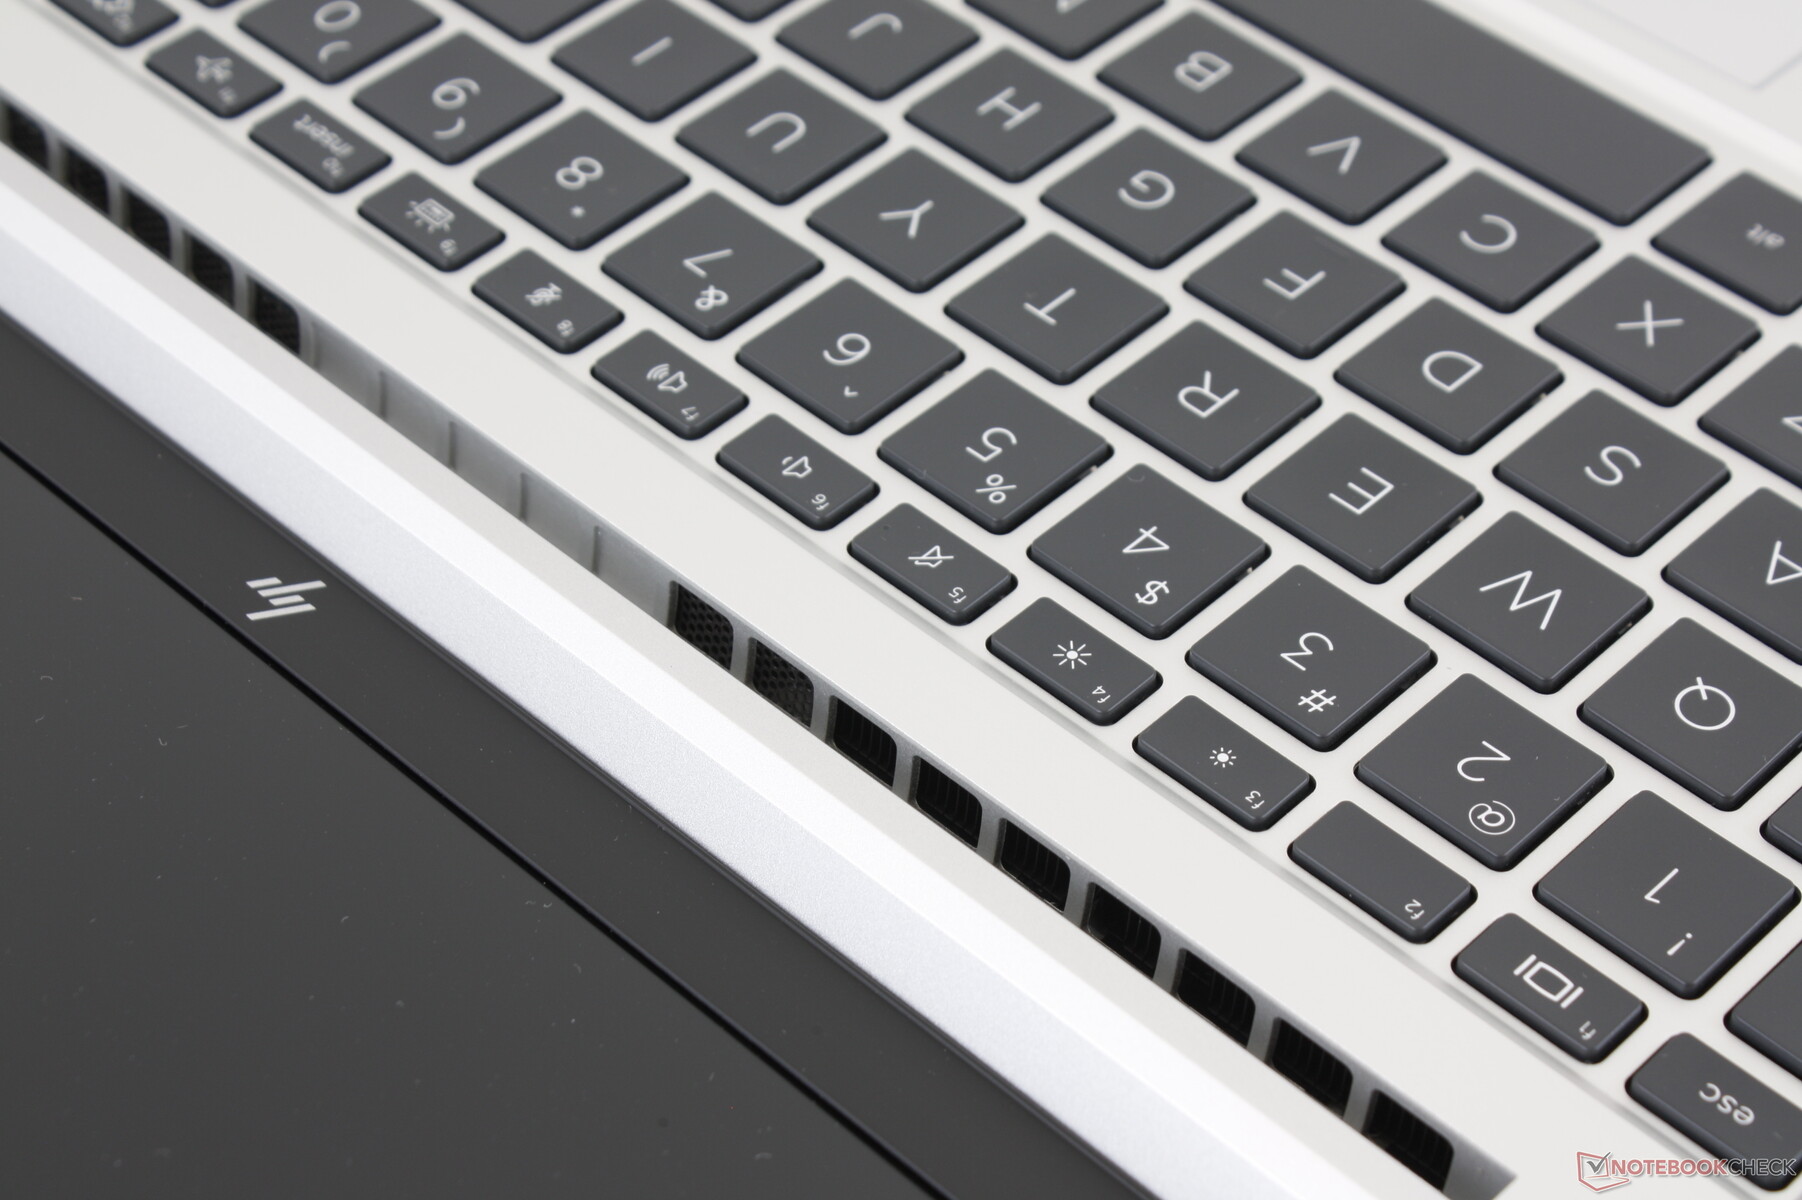
HP has redesigned the keyboard to be quieter than before without impacting key feedback. The Space and Enter keys, however, continue to be noticeably louder than the main QWERTY keys. Even so, the keyboards on Spectre and EliteBook laptops in particular have always been excellent for typing due to their firmer feedback when compared to the softer keys on the XPS series and most other Ultrabooks.
Key layout has changed a bit as well. The Power button is now near the top right corner of the keyboard squished in between the Print Screen and Delete keys. To prevent accidental presses, it requires slightly more force to depress and a longer stroke before the input is registered. We would like to see the fingerprint reader integrated onto the Power button on future models. Meanwhile, the F12 key now doubles as a handy customizable key for user-defined macros or applications.
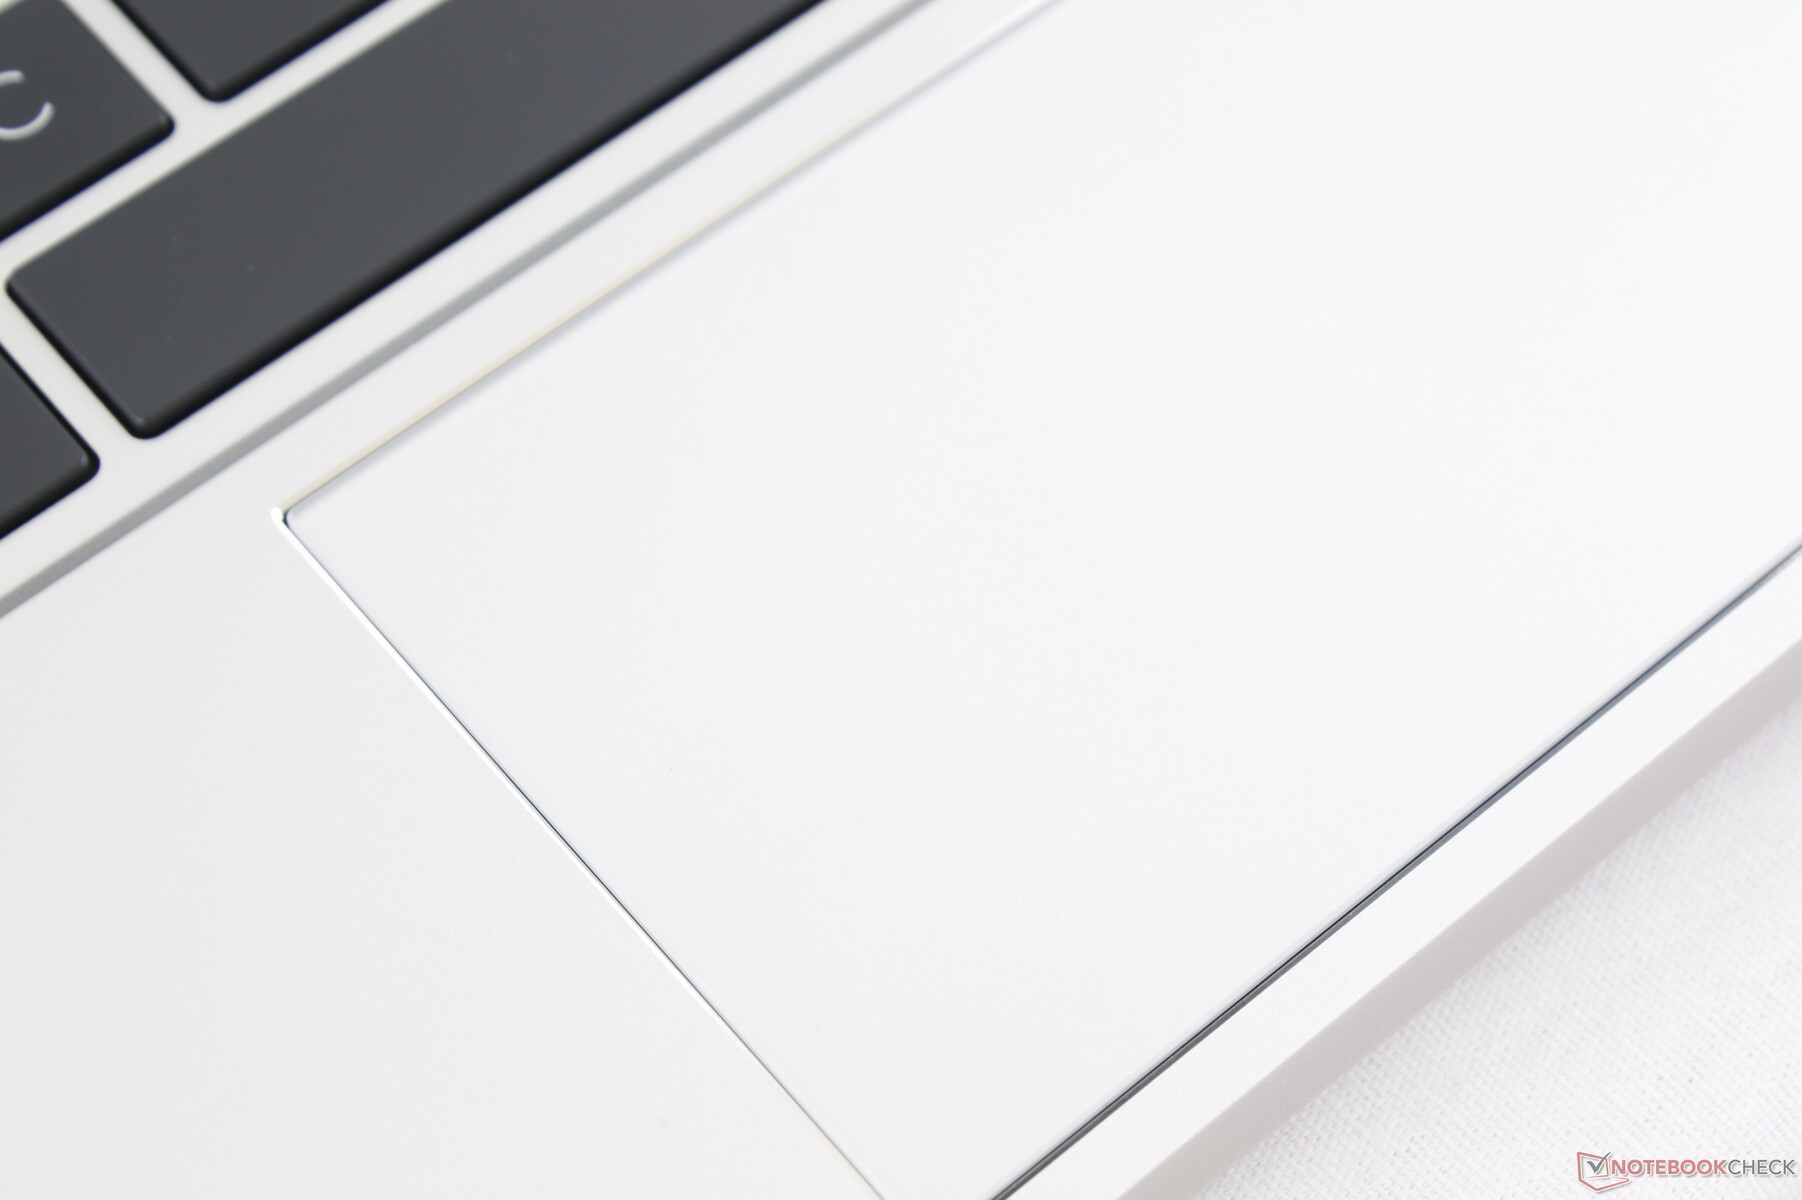
Touchpad
The smooth Precision clickpad is larger than the one on the Latitude 7310 (11 x 6.3 cm vs. 10.5 x 6.1 cm). Gliding, however, is stickier than expected which can make wide cursor movements tiring. Moving from one side of the screen to the other, for example, takes more effort from the finger than on most other Ultrabooks.
The integrated mouse clicks are shallow in travel with relatively weak feedback when pressed. Clatter is quiet as a result, but we would've preferred a firmer and more satisfying click or just regular dedicated mouse buttons instead.

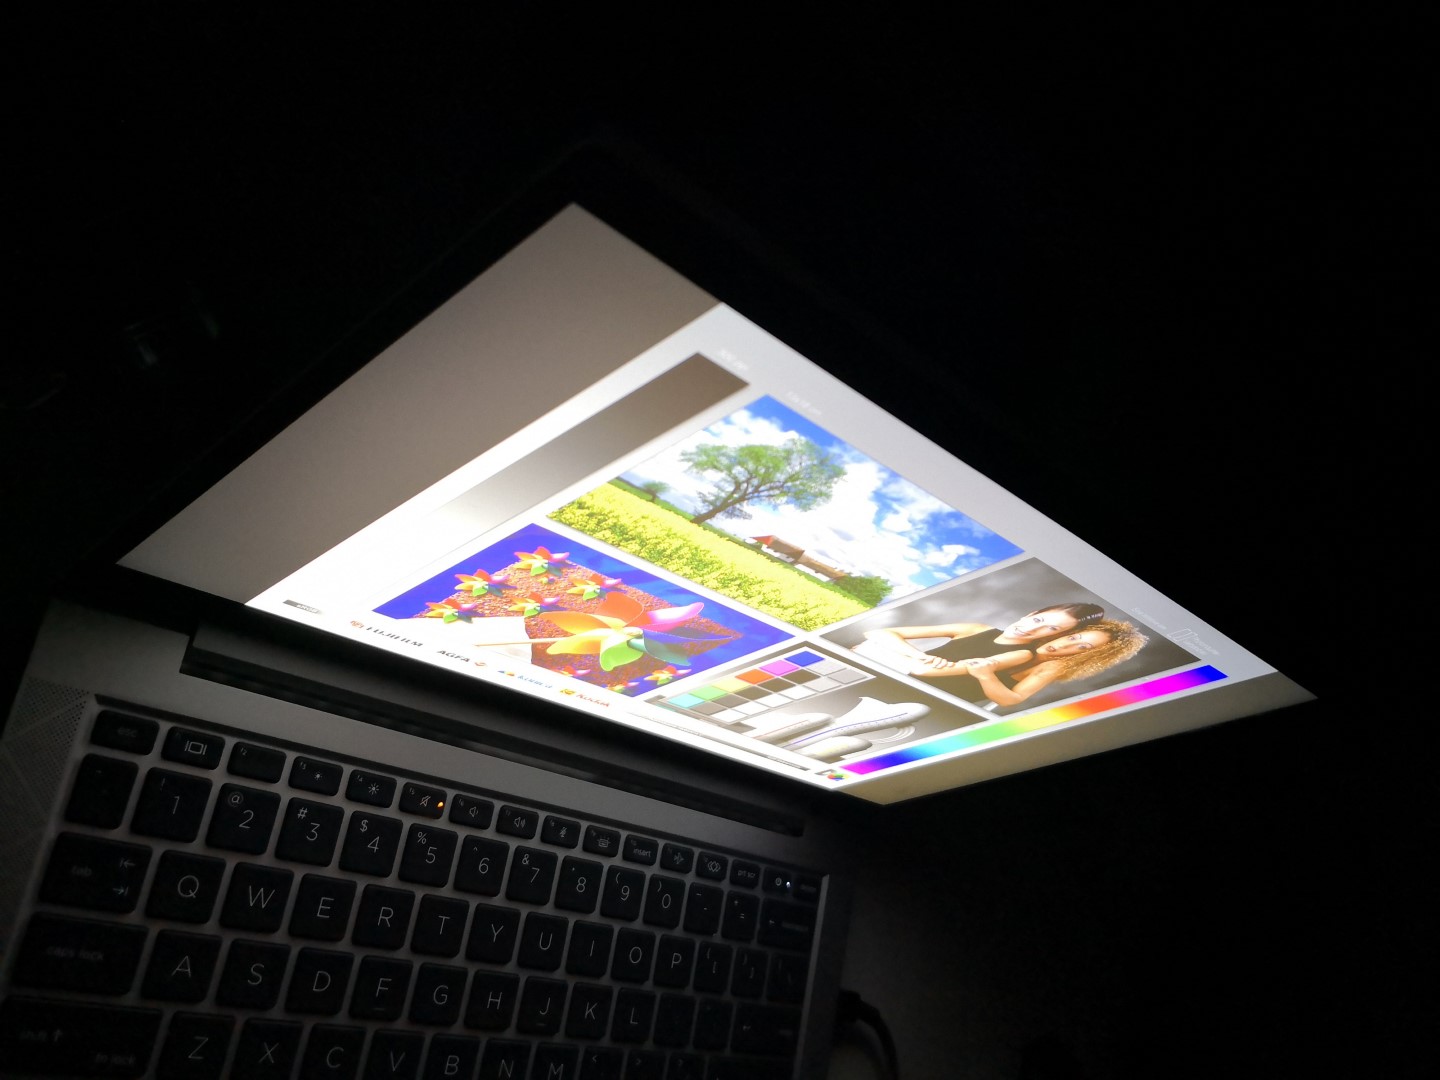
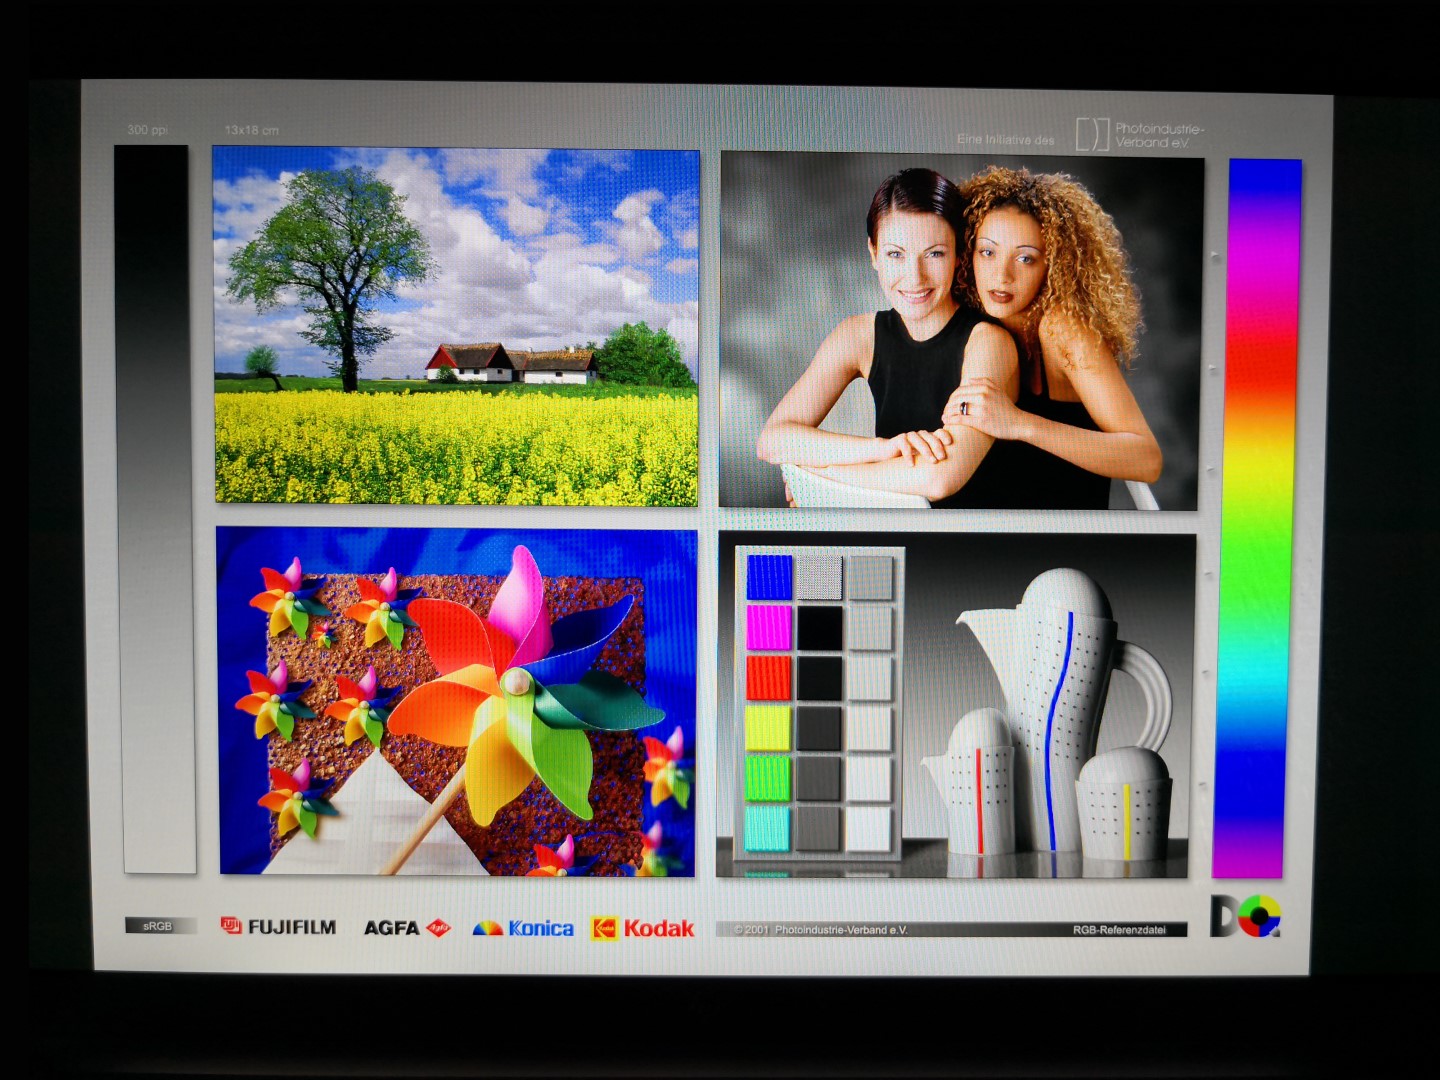
Display
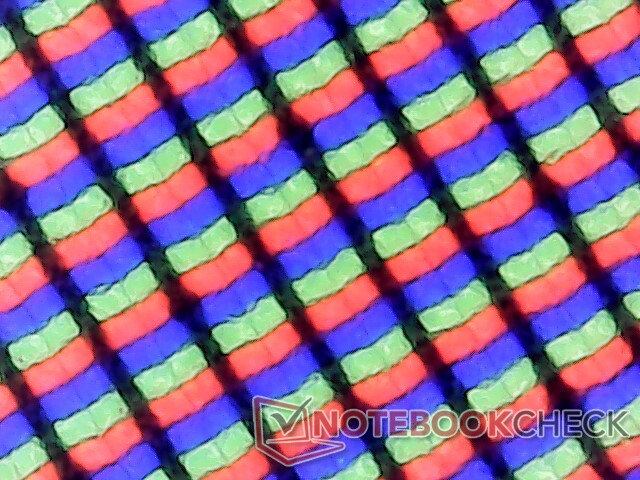
HWiNFO is unable to identify the panel name aside from its Chi Mei CMN13A9 controller. Display quality is excellent with its high contrast ratio and brighter backlight than both the ThinkPad X13 and Latitude 7310. Ghosting remains noticeable due to the average black-white response times which shouldn't be an issue for the target audience.
If optimal colors and contrast are important, then we recommend avoiding Sure View.
| |||||||||||||||||||||||||
Brightness Distribution: 91 %
Center on Battery: 454.5 cd/m²
Contrast: 1683:1 (Black: 0.27 cd/m²)
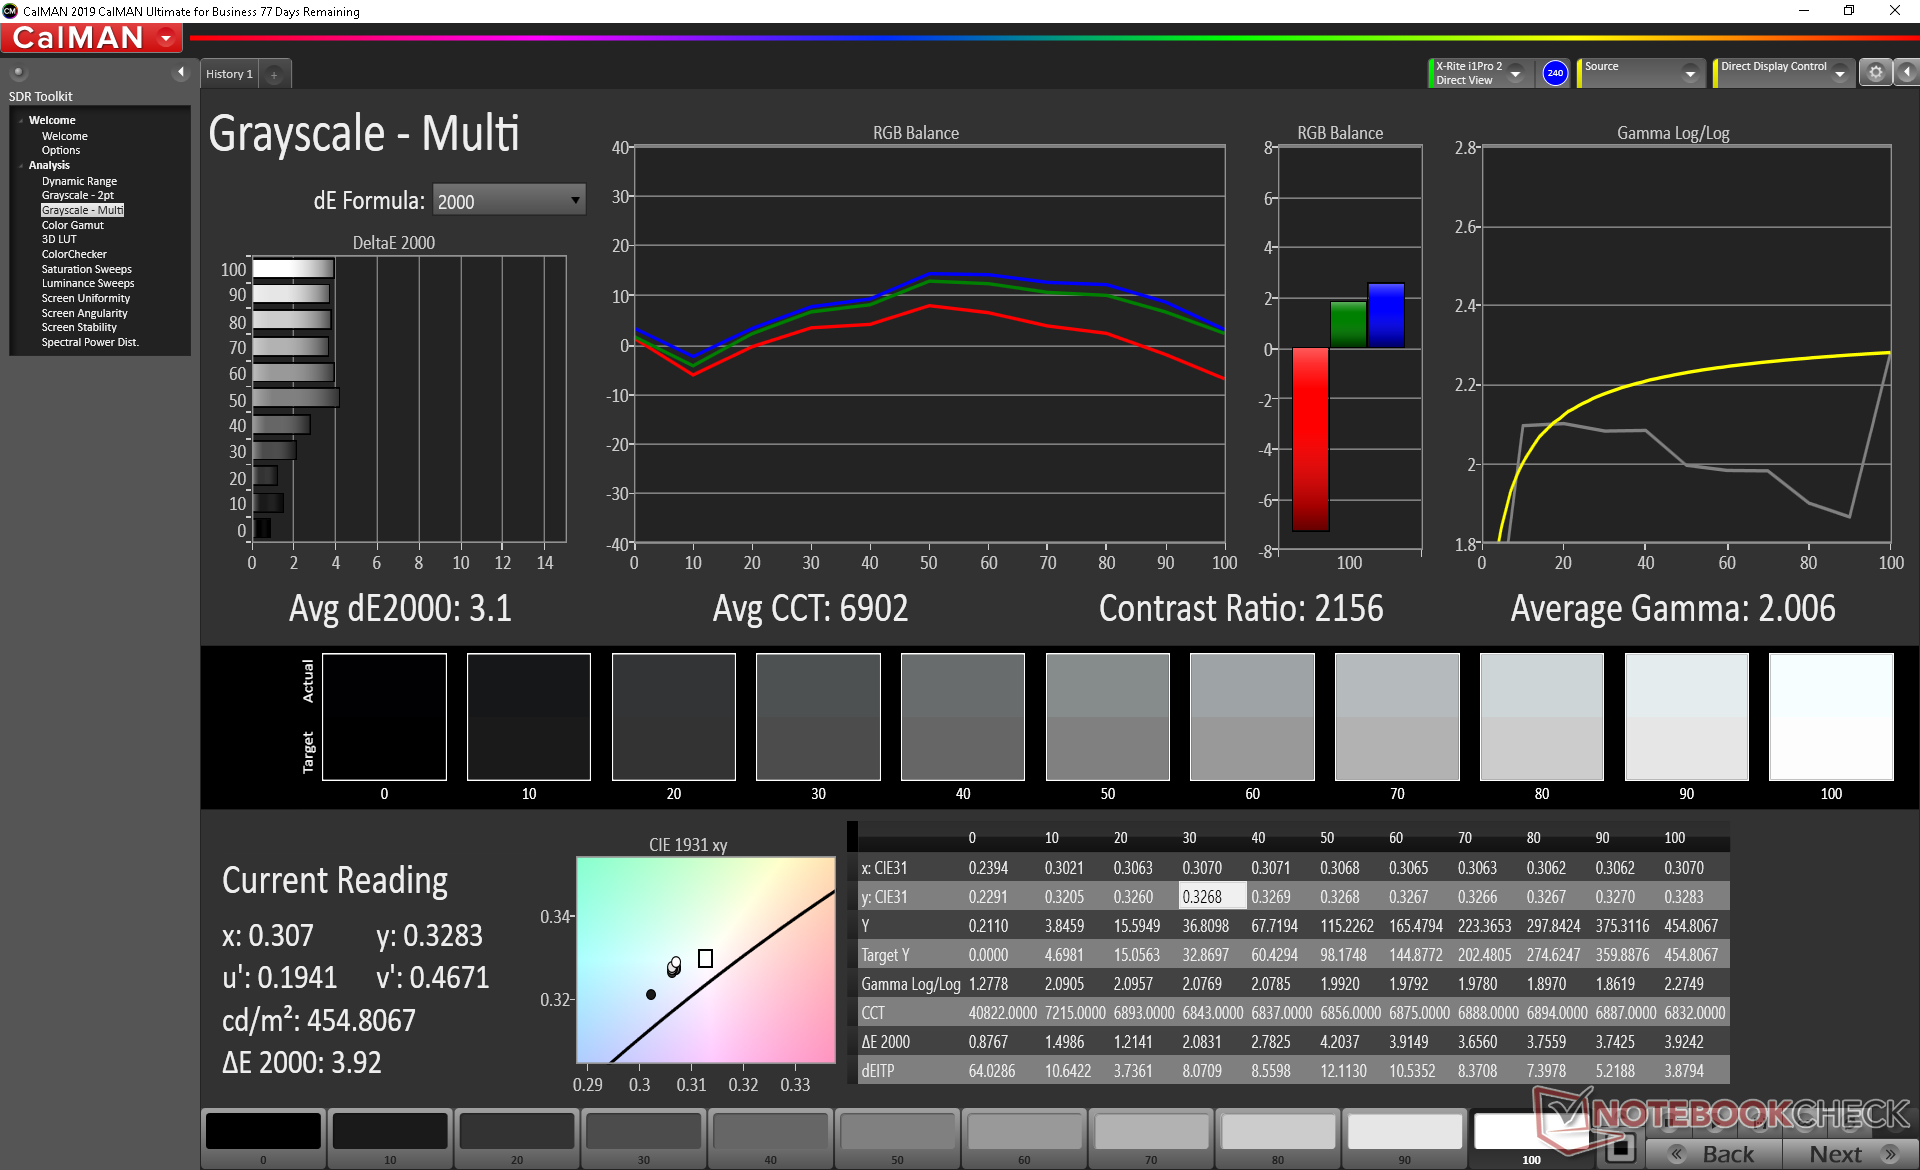
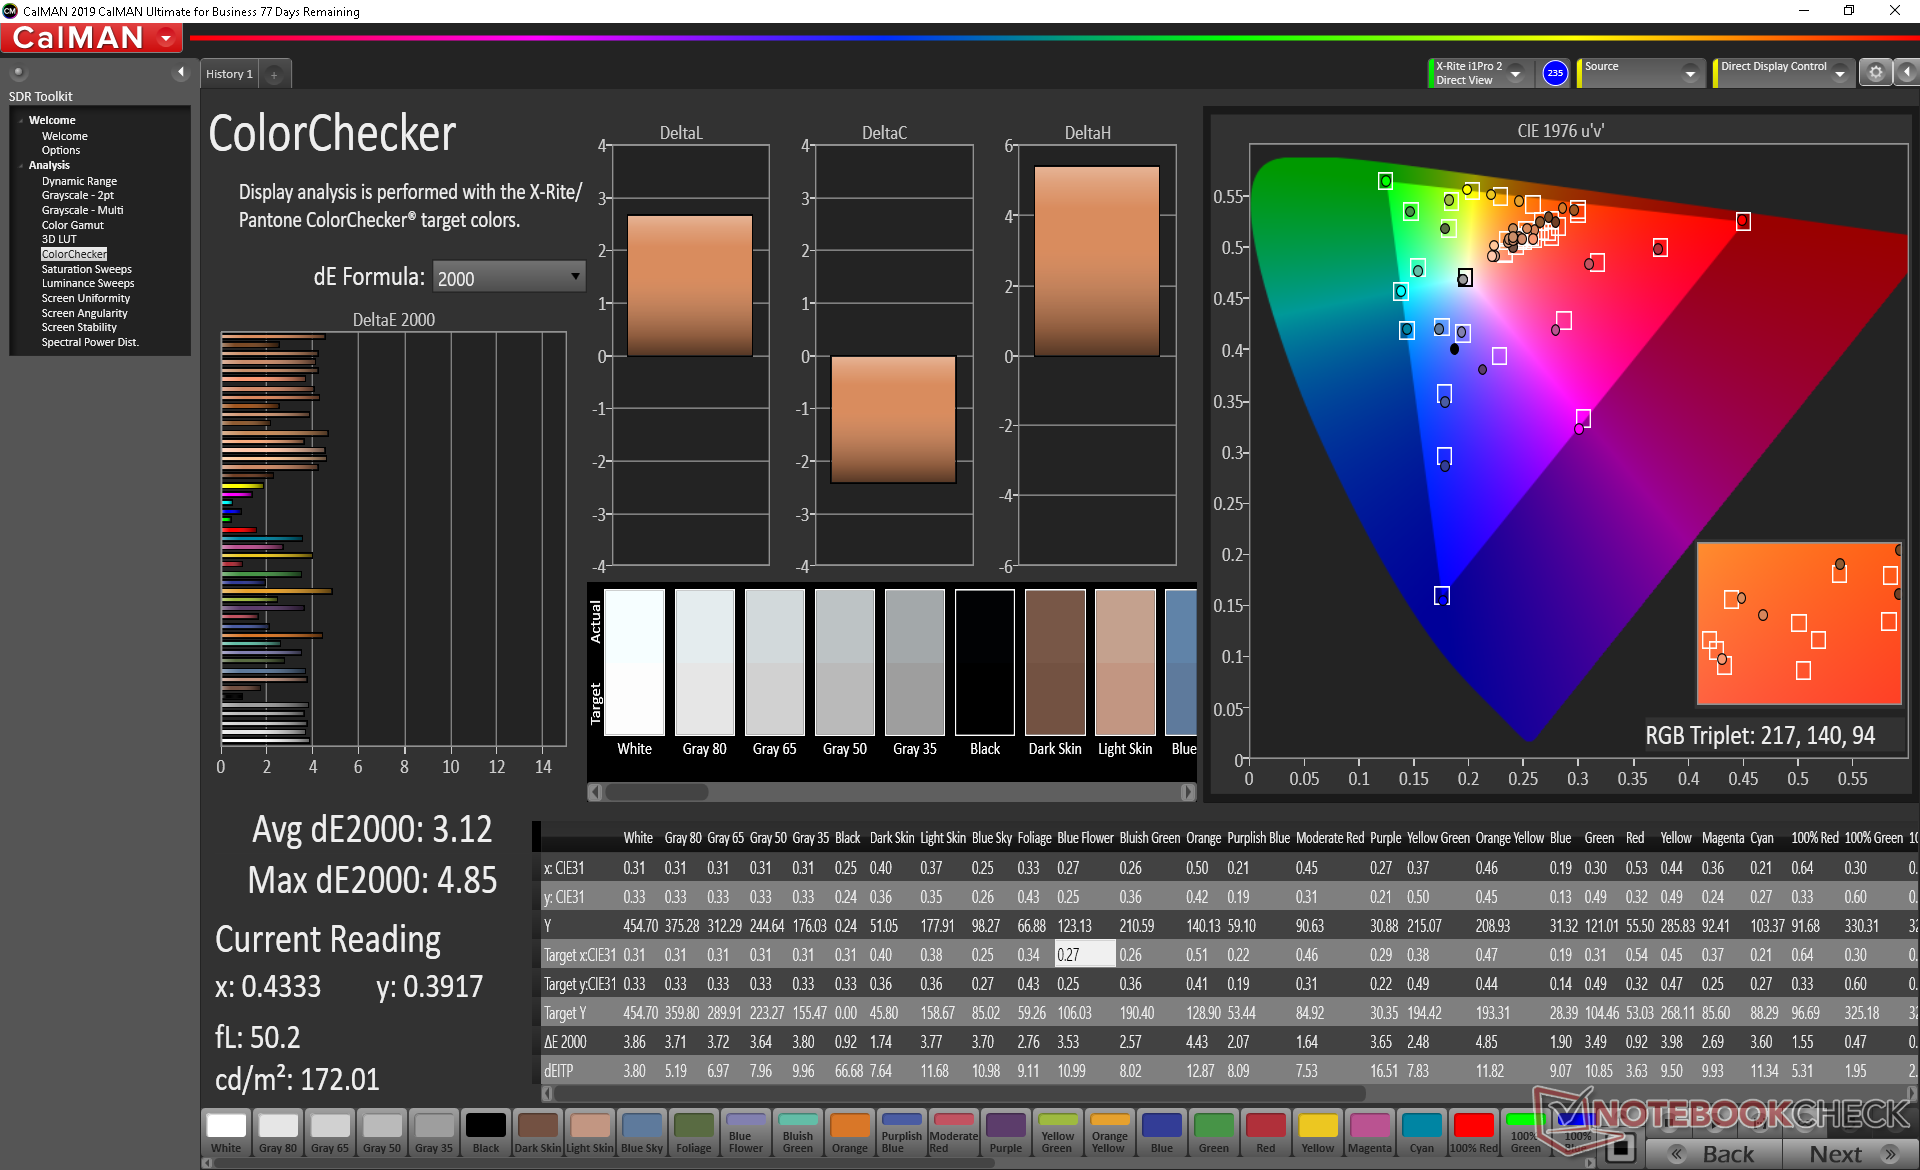
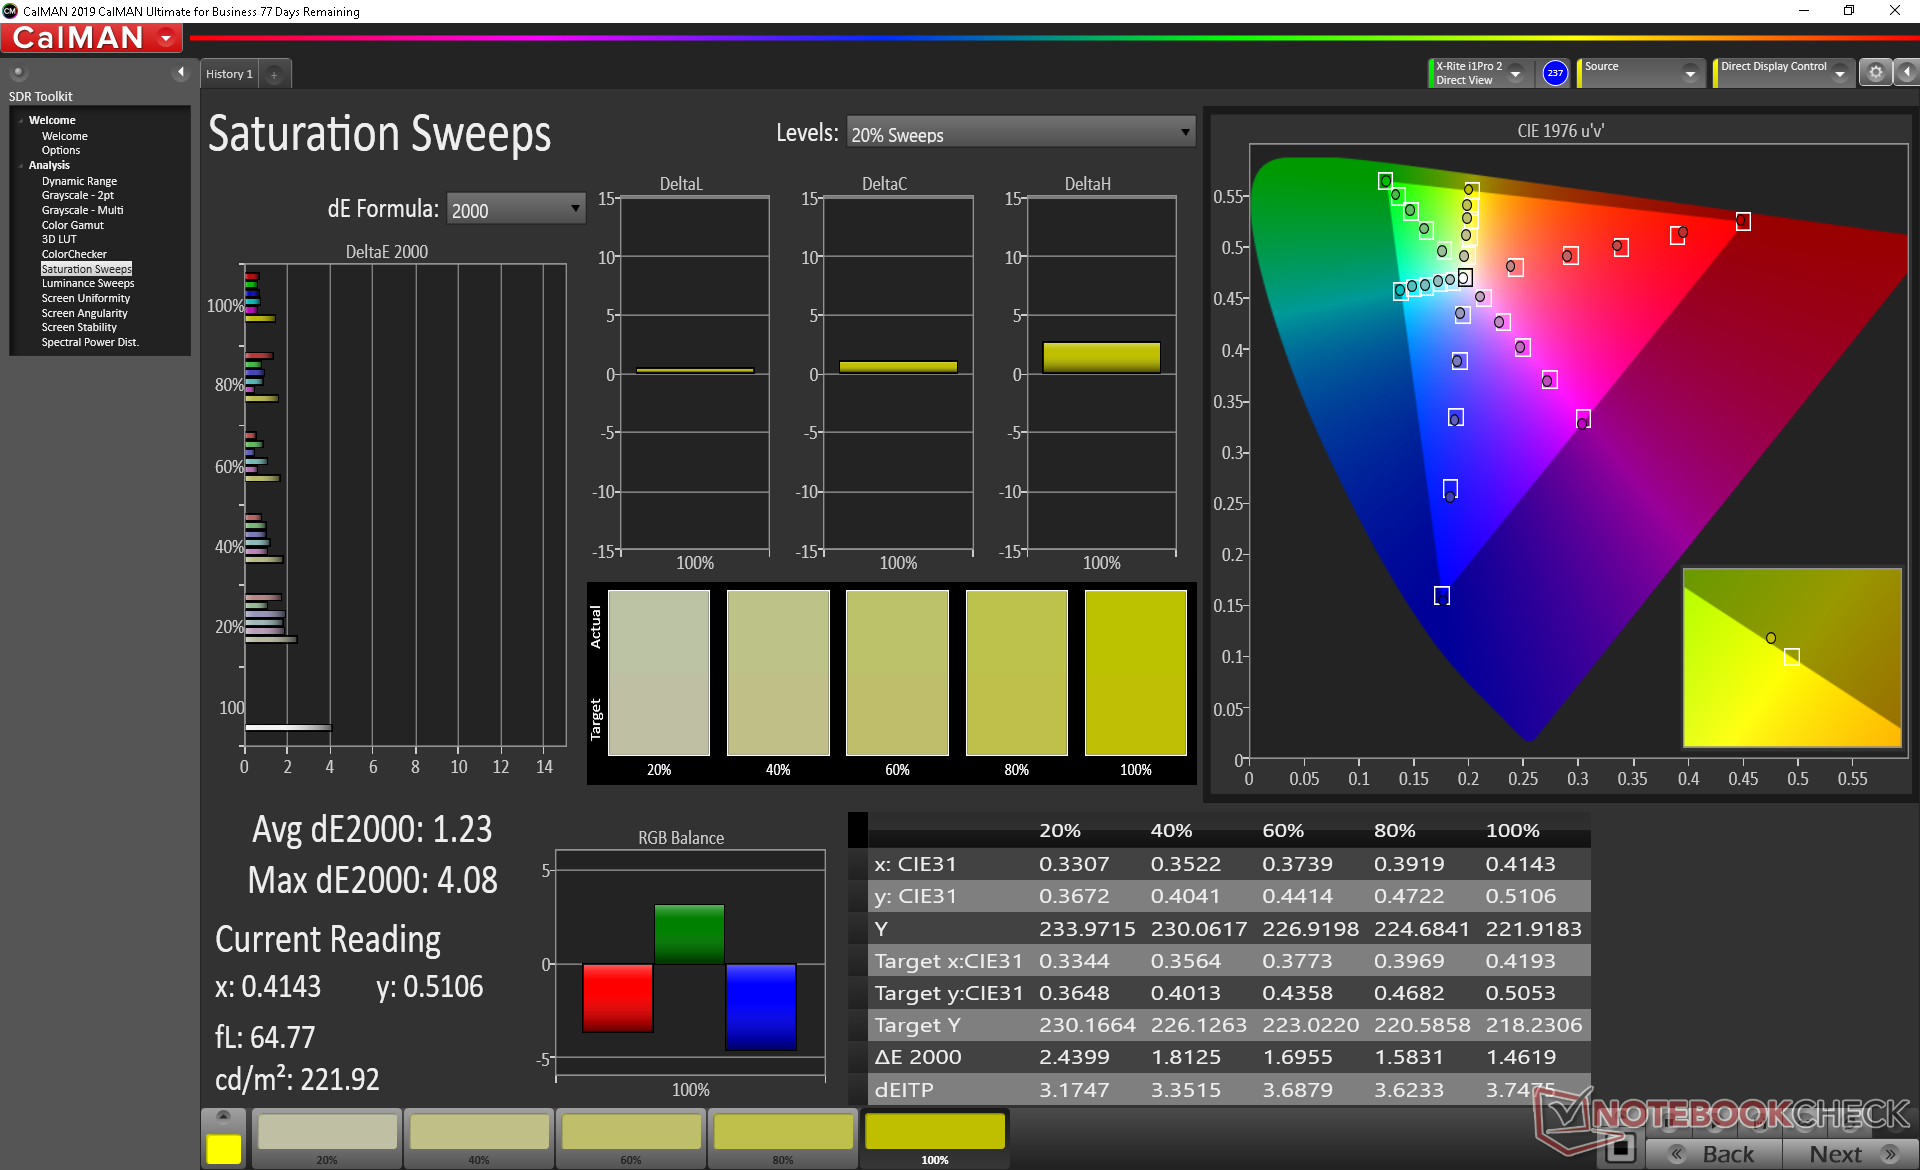
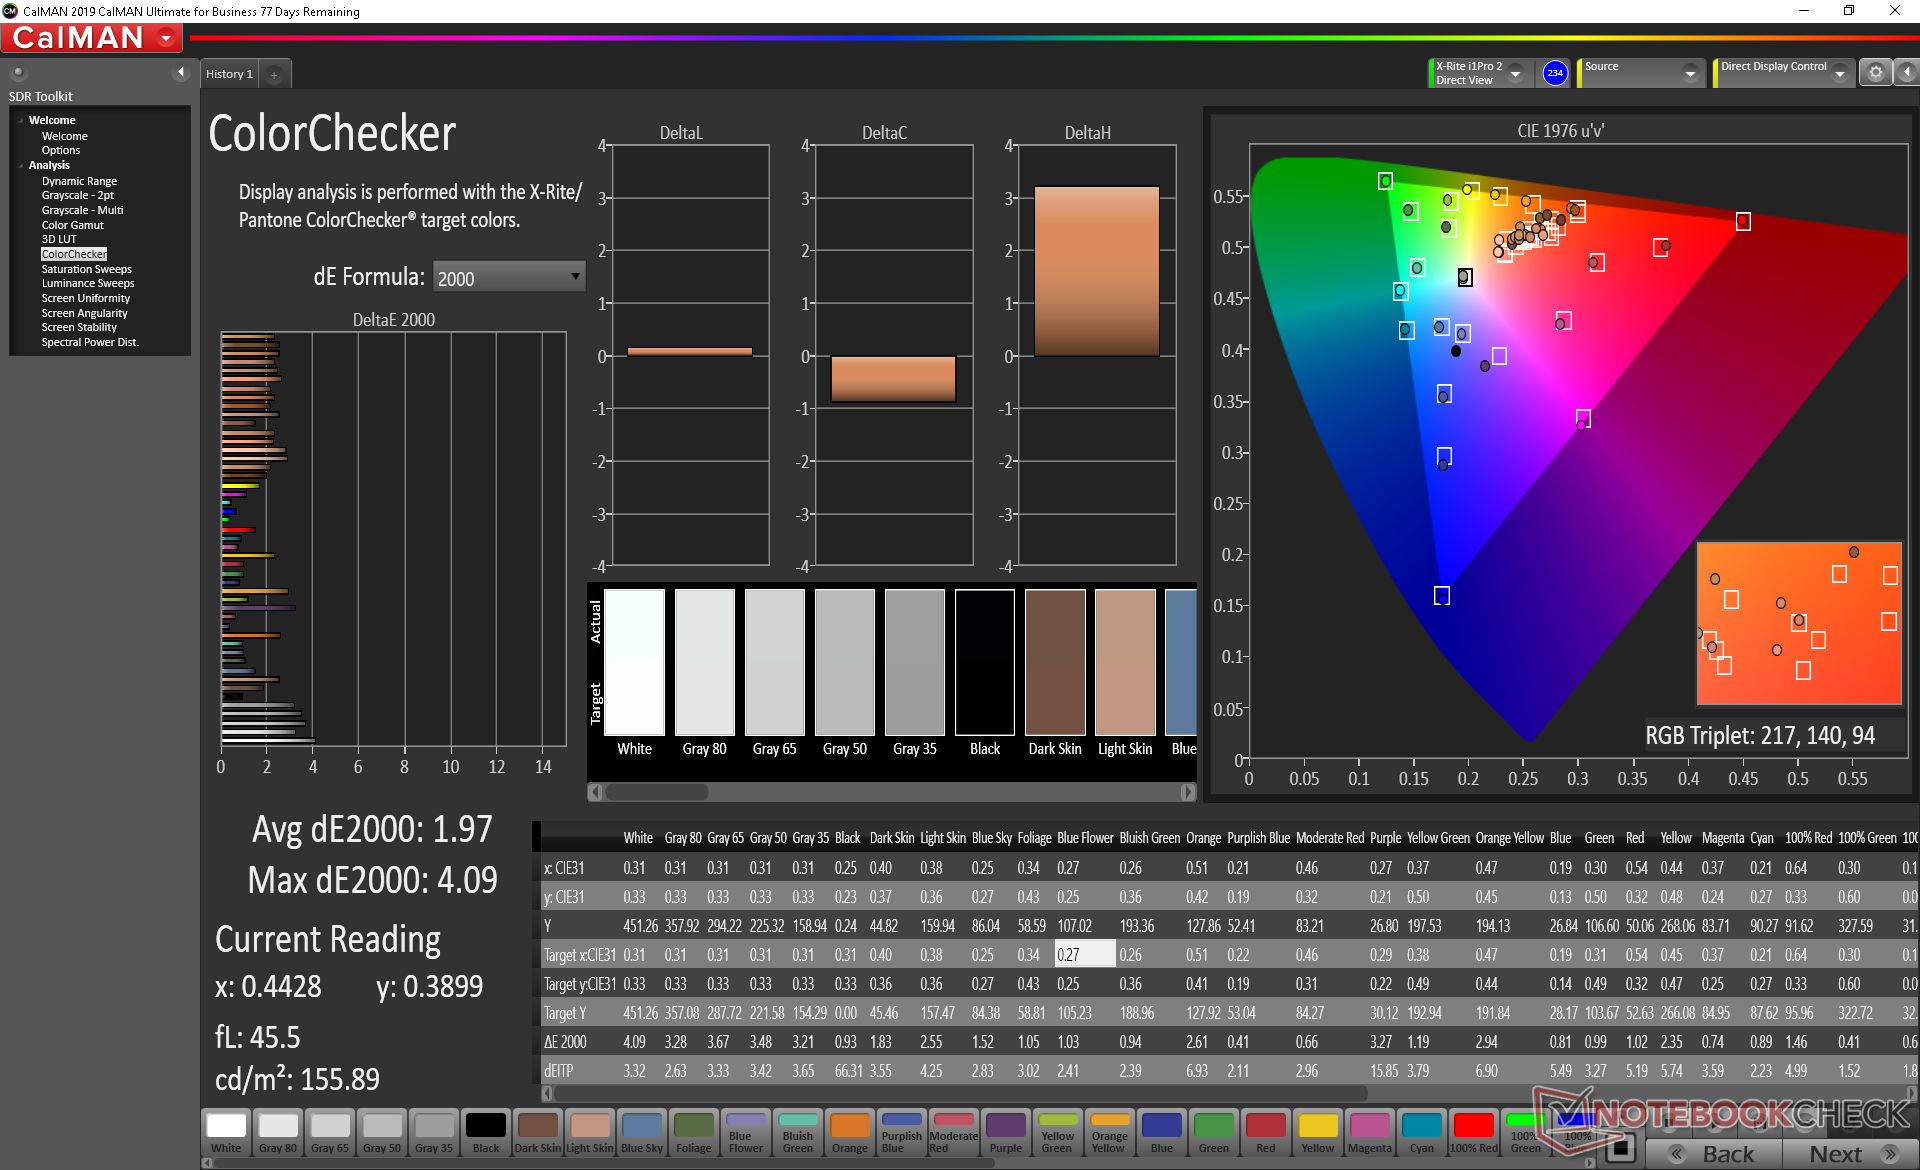
ΔE ColorChecker Calman: 3.12 | ∀{0.5-29.43 Ø4.71}
calibrated: 1.97
ΔE Greyscale Calman: 3.1 | ∀{0.09-98 Ø4.96}
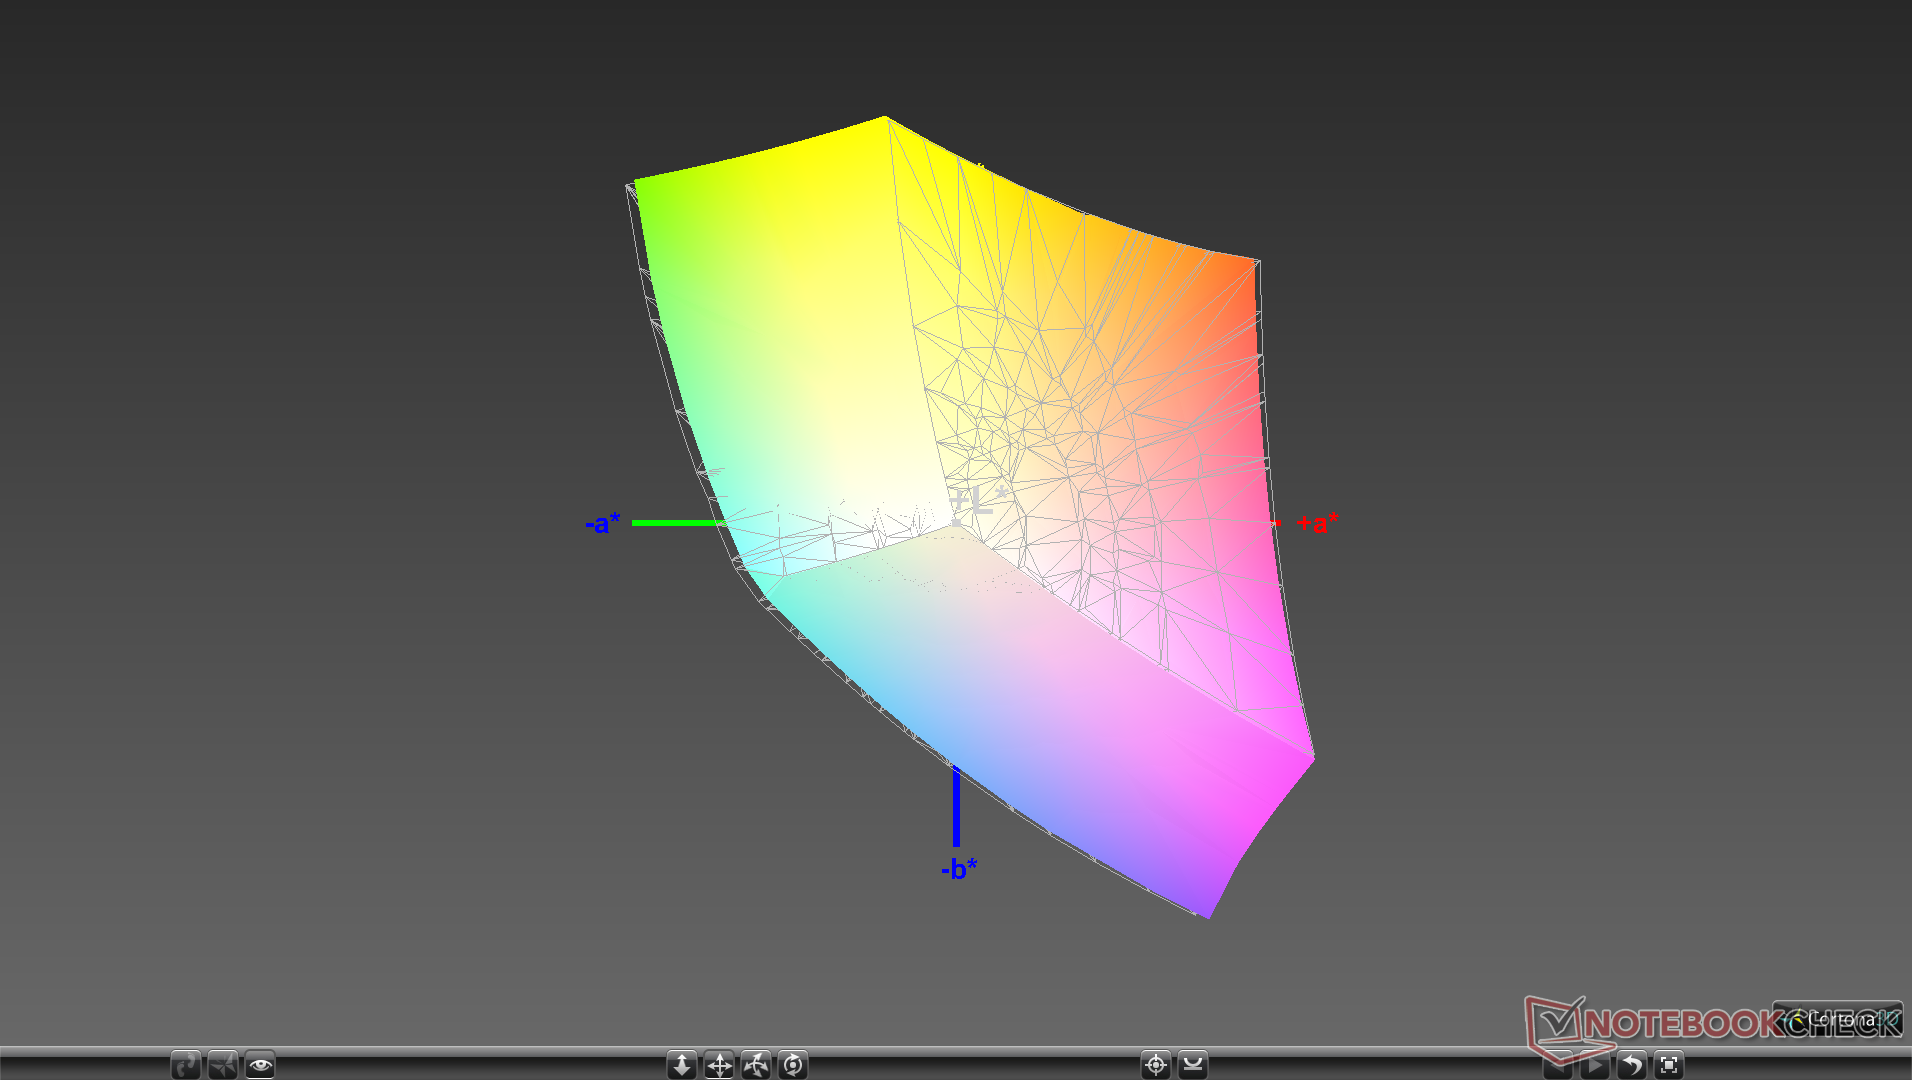
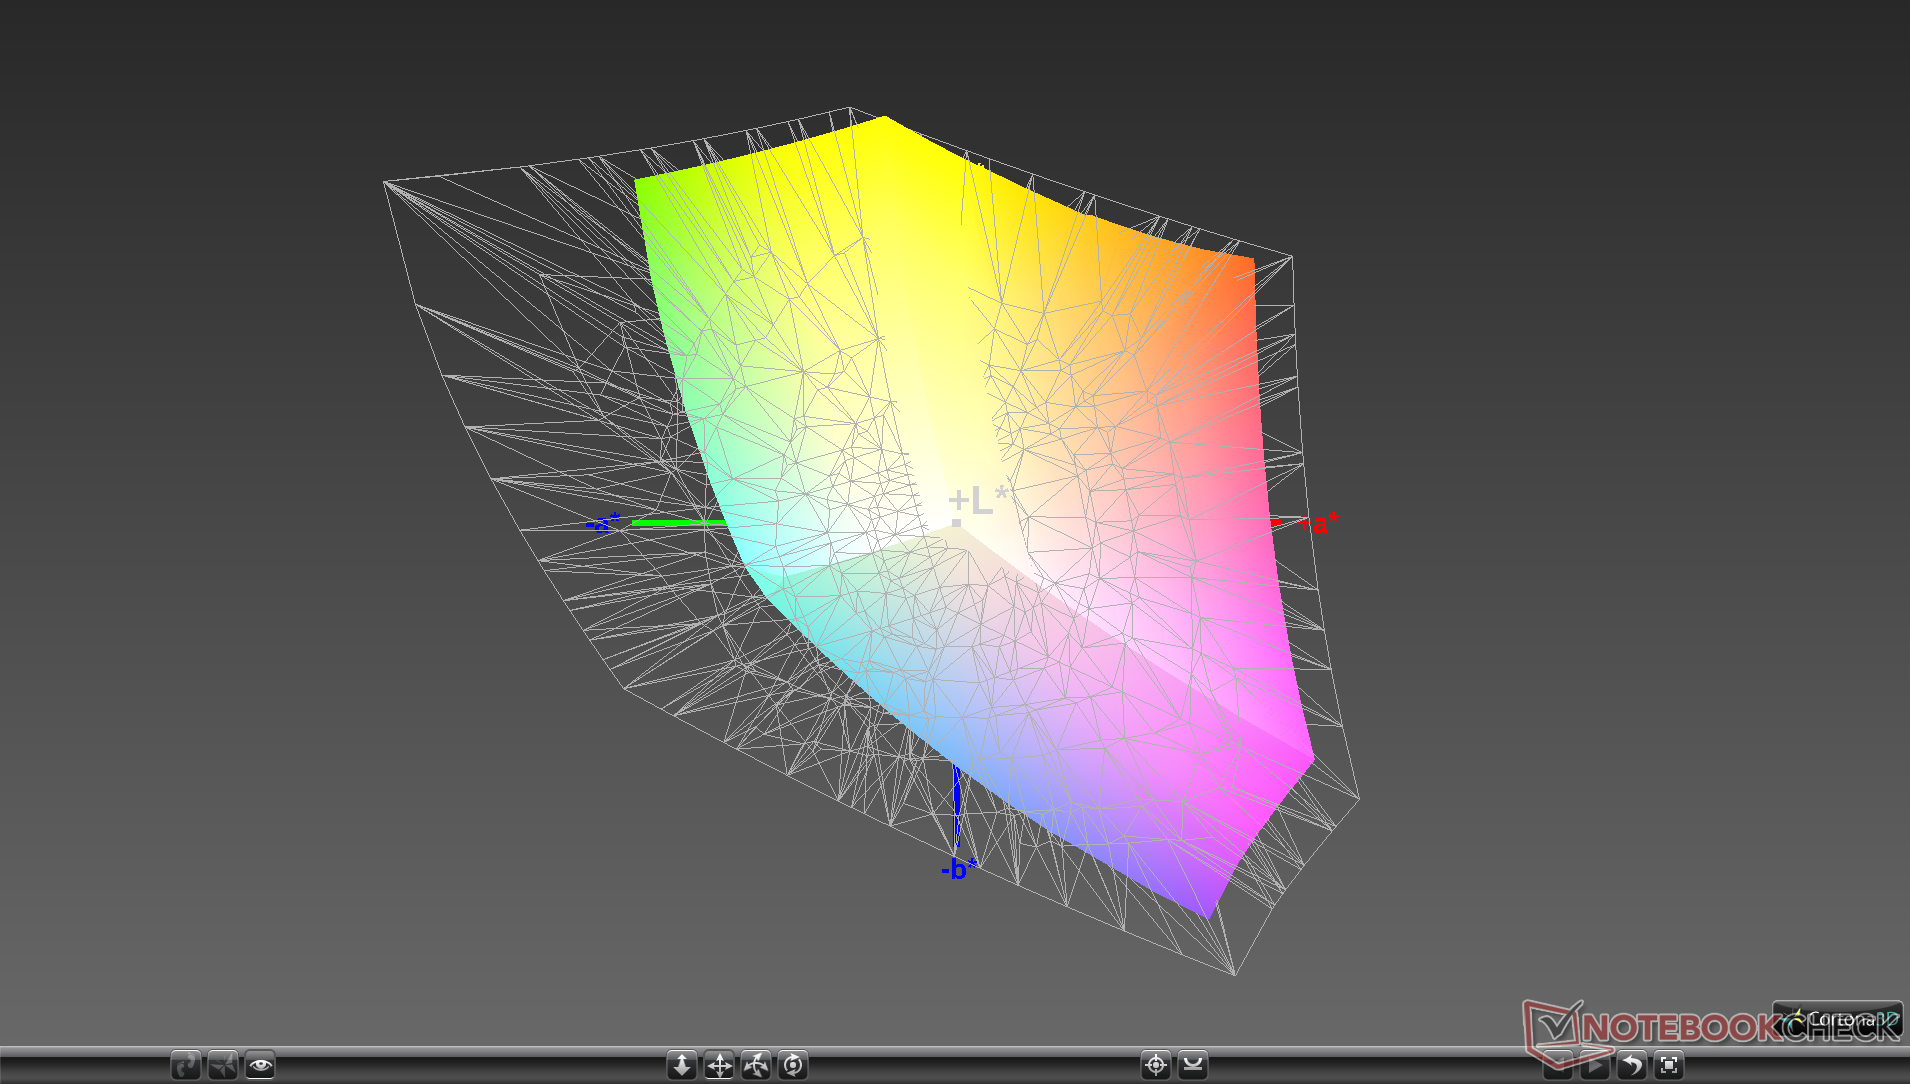
97% sRGB (Argyll 1.6.3 3D)
61.5% AdobeRGB 1998 (Argyll 1.6.3 3D)
67.4% AdobeRGB 1998 (Argyll 3D)
97.4% sRGB (Argyll 3D)
65.7% Display P3 (Argyll 3D)
Gamma: 2.01
CCT: 6902 K
| HP EliteBook 830 G7 Chi Mei CMN13A9, IPS, 13.3", 1920x1080 | HP EliteBook x360 830 G6 M133NVFC R5, IPS LED, 13.3", 1920x1080 | Lenovo ThinkPad X13-20T20033GE Lenovo B133HAK01.1, IPS, 13.3", 1920x1080 | Dell Latitude 7310 AU Optronics B133HAN, IPS, 13.3", 1920x1080 | Dynabook Portege X30L-G1331 Toshiba TOS508F, IPS, 13.3", 1920x1080 | Microsoft Surface Laptop 3 13 Core i5-1035G7 Sharp LQ135P1JX51, IPS, 13.5", 2256x1504 | |
|---|---|---|---|---|---|---|
| Display | -0% | -0% | 6% | 1% | 1% | |
| Display P3 Coverage (%) | 65.7 | 66.1 1% | 66 0% | 71.8 9% | 66.9 2% | 65.7 0% |
| sRGB Coverage (%) | 97.4 | 95.3 -2% | 96.2 -1% | 99.3 2% | 97.6 0% | 98.6 1% |
| AdobeRGB 1998 Coverage (%) | 67.4 | 67.5 0% | 67.2 0% | 72.4 7% | 67.8 1% | 67.8 1% |
| Response Times | 6% | -2% | 12% | -14% | -28% | |
| Response Time Grey 50% / Grey 80% * (ms) | 46.8 ? | 44 ? 6% | 52.8 ? -13% | 40.8 ? 13% | 54.8 ? -17% | 59.2 ? -26% |
| Response Time Black / White * (ms) | 32 ? | 30 ? 6% | 29.2 ? 9% | 28.8 ? 10% | 35.6 ? -11% | 41.6 ? -30% |
| PWM Frequency (Hz) | 26600 ? | 952 ? | 23810 ? | 21740 ? | ||
| Screen | 10% | -33% | 5% | 8% | 14% | |
| Brightness middle (cd/m²) | 454.5 | 603 33% | 359 -21% | 332.7 -27% | 482 6% | 403.4 -11% |
| Brightness (cd/m²) | 435 | 692 59% | 342 -21% | 329 -24% | 452 4% | 397 -9% |
| Brightness Distribution (%) | 91 | 69 -24% | 90 -1% | 89 -2% | 91 0% | 89 -2% |
| Black Level * (cd/m²) | 0.27 | 0.26 4% | 0.21 22% | 0.25 7% | 0.4 -48% | 0.34 -26% |
| Contrast (:1) | 1683 | 2319 38% | 1710 2% | 1331 -21% | 1205 -28% | 1186 -30% |
| Colorchecker dE 2000 * | 3.12 | 2.2 29% | 6.7 -115% | 2.15 31% | 1.85 41% | 0.94 70% |
| Colorchecker dE 2000 max. * | 4.85 | 7.7 -59% | 10.9 -125% | 3.89 20% | 3.08 36% | 2.92 40% |
| Colorchecker dE 2000 calibrated * | 1.97 | 1.5 24% | 1.3 34% | 1.09 45% | 1.2 39% | 0.99 50% |
| Greyscale dE 2000 * | 3.1 | 2.6 16% | 7.4 -139% | 2.5 19% | 2 35% | 0.9 71% |
| Gamma | 2.01 109% | 2.17 101% | 2.85 77% | 2.3 96% | 2.1 105% | 2.13 103% |
| CCT | 6902 94% | 6412 101% | 6309 103% | 6347 102% | 6822 95% | 6620 98% |
| Color Space (Percent of AdobeRGB 1998) (%) | 61.5 | 60.2 -2% | 61.7 0% | 64.1 4% | 62.5 2% | 62.3 1% |
| Color Space (Percent of sRGB) (%) | 97 | 93.6 -4% | 95.9 -1% | 99.4 2% | 97.7 1% | 98.7 2% |
| Total Average (Program / Settings) | 5% /
8% | -12% /
-23% | 8% /
6% | -2% /
4% | -4% /
6% |
* ... smaller is better
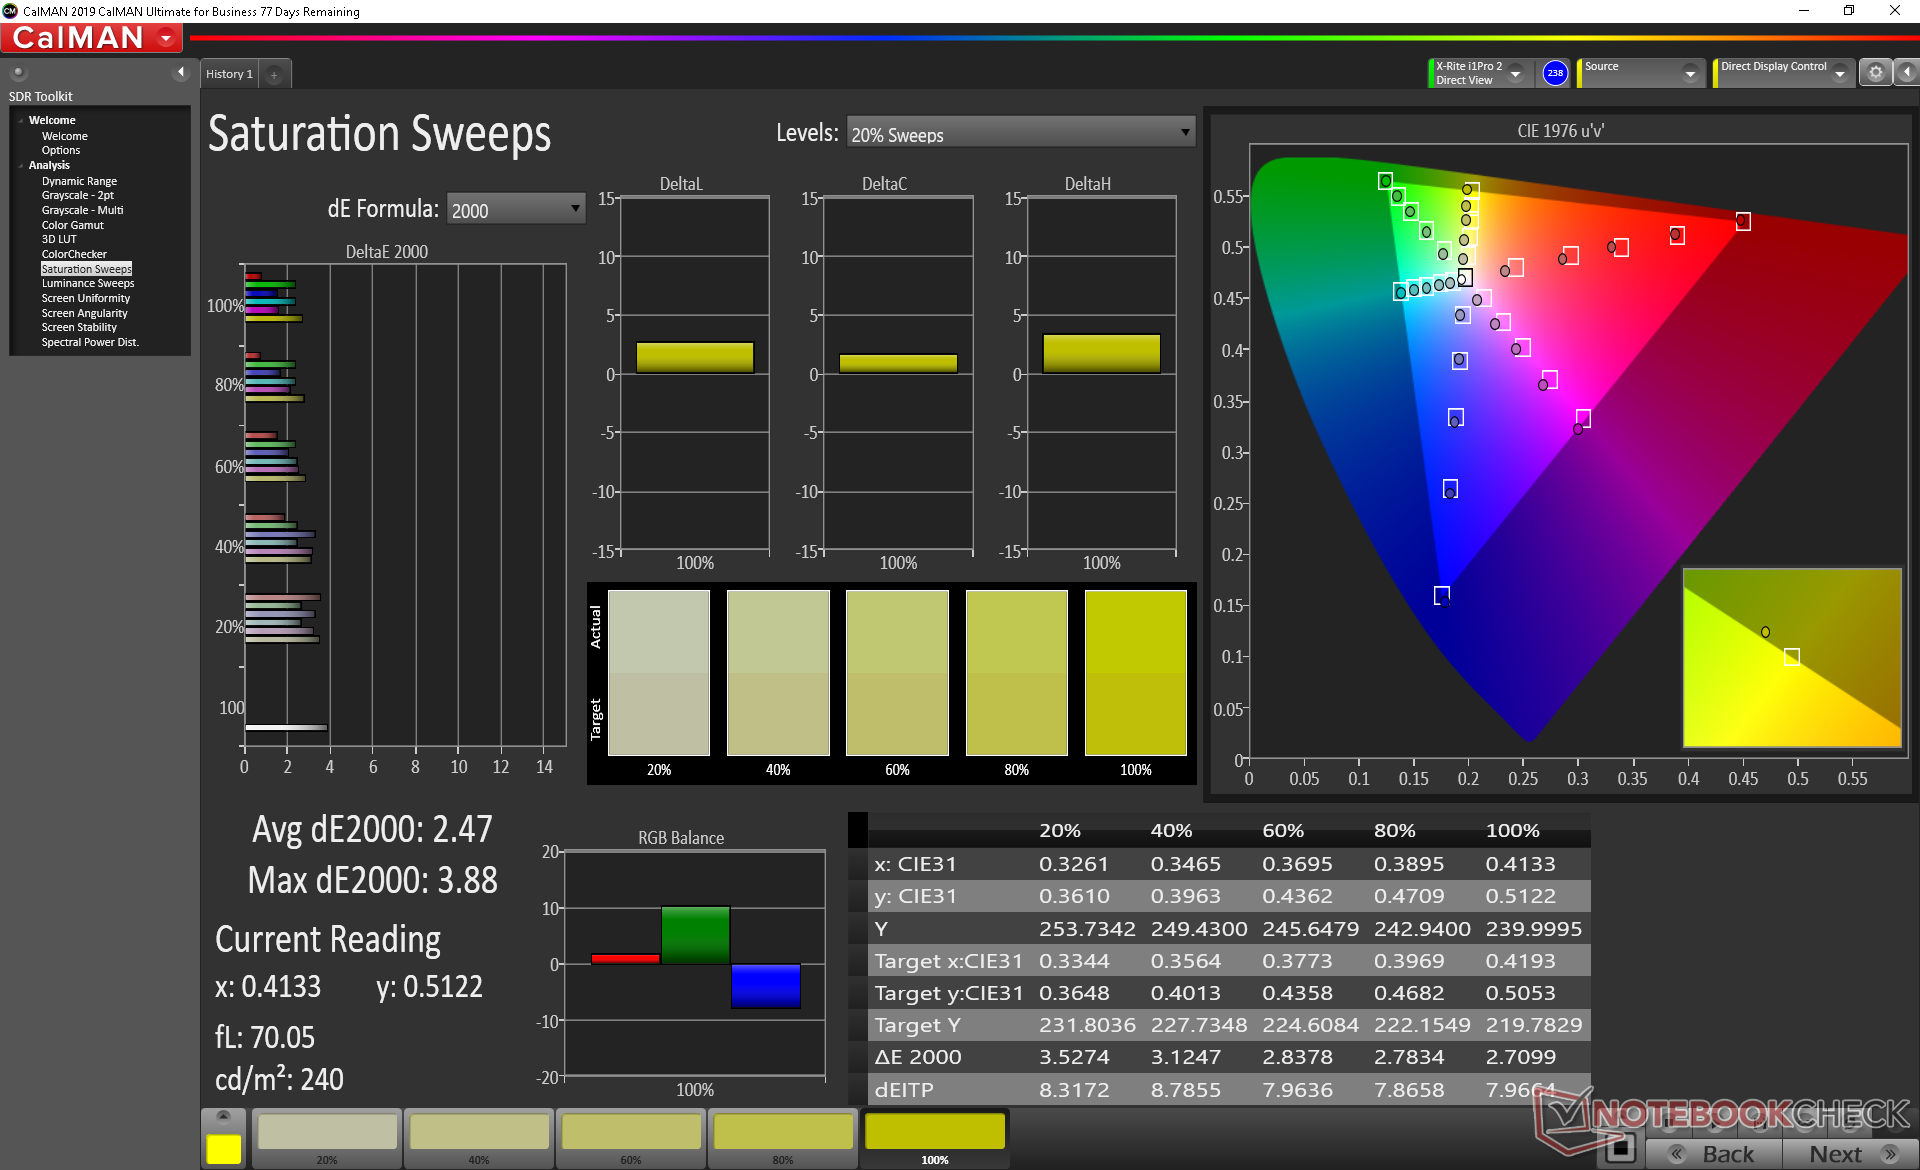
Color coverage is excellent at almost 100 percent of sRGB to be similar to high-end Ultrabooks and other business laptops in this price range. Users who want full AdobeRGB coverage or more may want to consider the Envy 15 series instead.
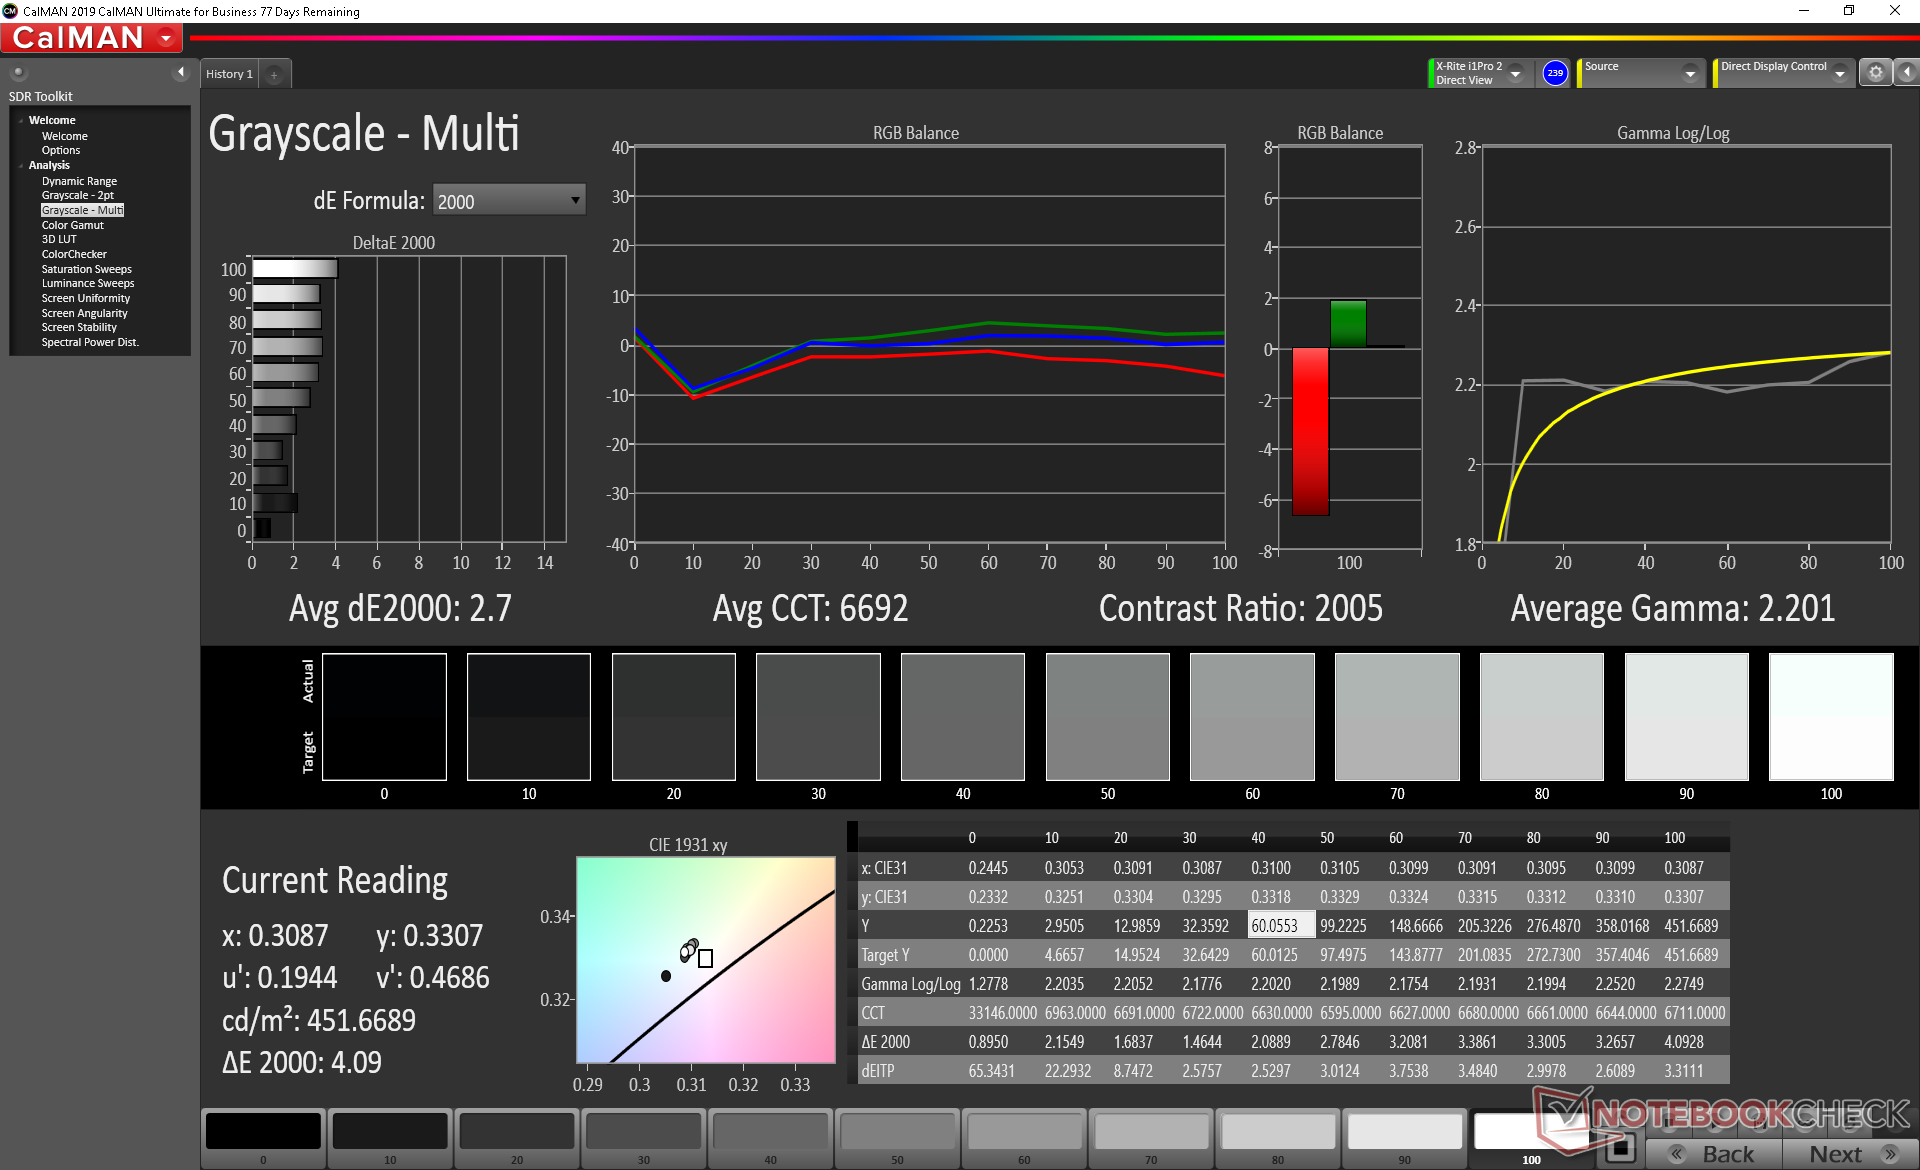
X-Rite colorimeter measurements show a decently calibrated display out of the box. Color temperature, however, is slightly too cool which we are able to fix with our colorimeter. Colors and grayscale improve marginally after calibrating the display ourselves with final average DeltaE values of just 1.97 and 2.7, respectively.
Display Response Times
| ↔ Response Time Black to White | ||
|---|---|---|
| 32 ms ... rise ↗ and fall ↘ combined | ↗ 15.6 ms rise | 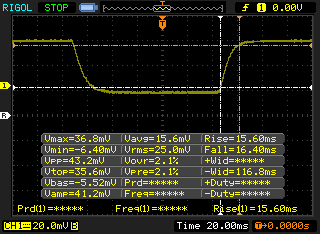 |
| ↘ 16.4 ms fall | ||
| The screen shows slow response rates in our tests and will be unsatisfactory for gamers. In comparison, all tested devices range from 0.1 (minimum) to 240 (maximum) ms. » 86 % of all devices are better. This means that the measured response time is worse than the average of all tested devices (19.8 ms). | ||
| ↔ Response Time 50% Grey to 80% Grey | ||
| 46.8 ms ... rise ↗ and fall ↘ combined | ↗ 24 ms rise | 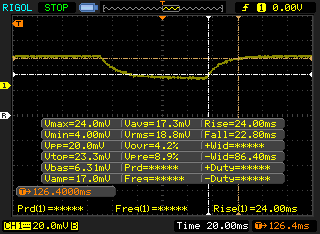 |
| ↘ 22.8 ms fall | ||
| The screen shows slow response rates in our tests and will be unsatisfactory for gamers. In comparison, all tested devices range from 0.165 (minimum) to 636 (maximum) ms. » 81 % of all devices are better. This means that the measured response time is worse than the average of all tested devices (30.9 ms). | ||
Screen Flickering / PWM (Pulse-Width Modulation)
| Screen flickering / PWM detected | 26600 Hz | ≤ 62 % brightness setting | 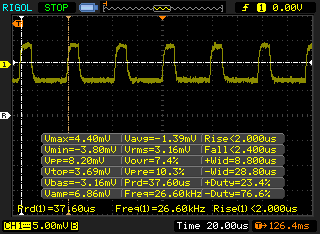 |
The display backlight flickers at 26600 Hz (worst case, e.g., utilizing PWM) Flickering detected at a brightness setting of 62 % and below. There should be no flickering or PWM above this brightness setting. The frequency of 26600 Hz is quite high, so most users sensitive to PWM should not notice any flickering. In comparison: 52 % of all tested devices do not use PWM to dim the display. If PWM was detected, an average of 7748 (minimum: 5 - maximum: 343500) Hz was measured. | |||
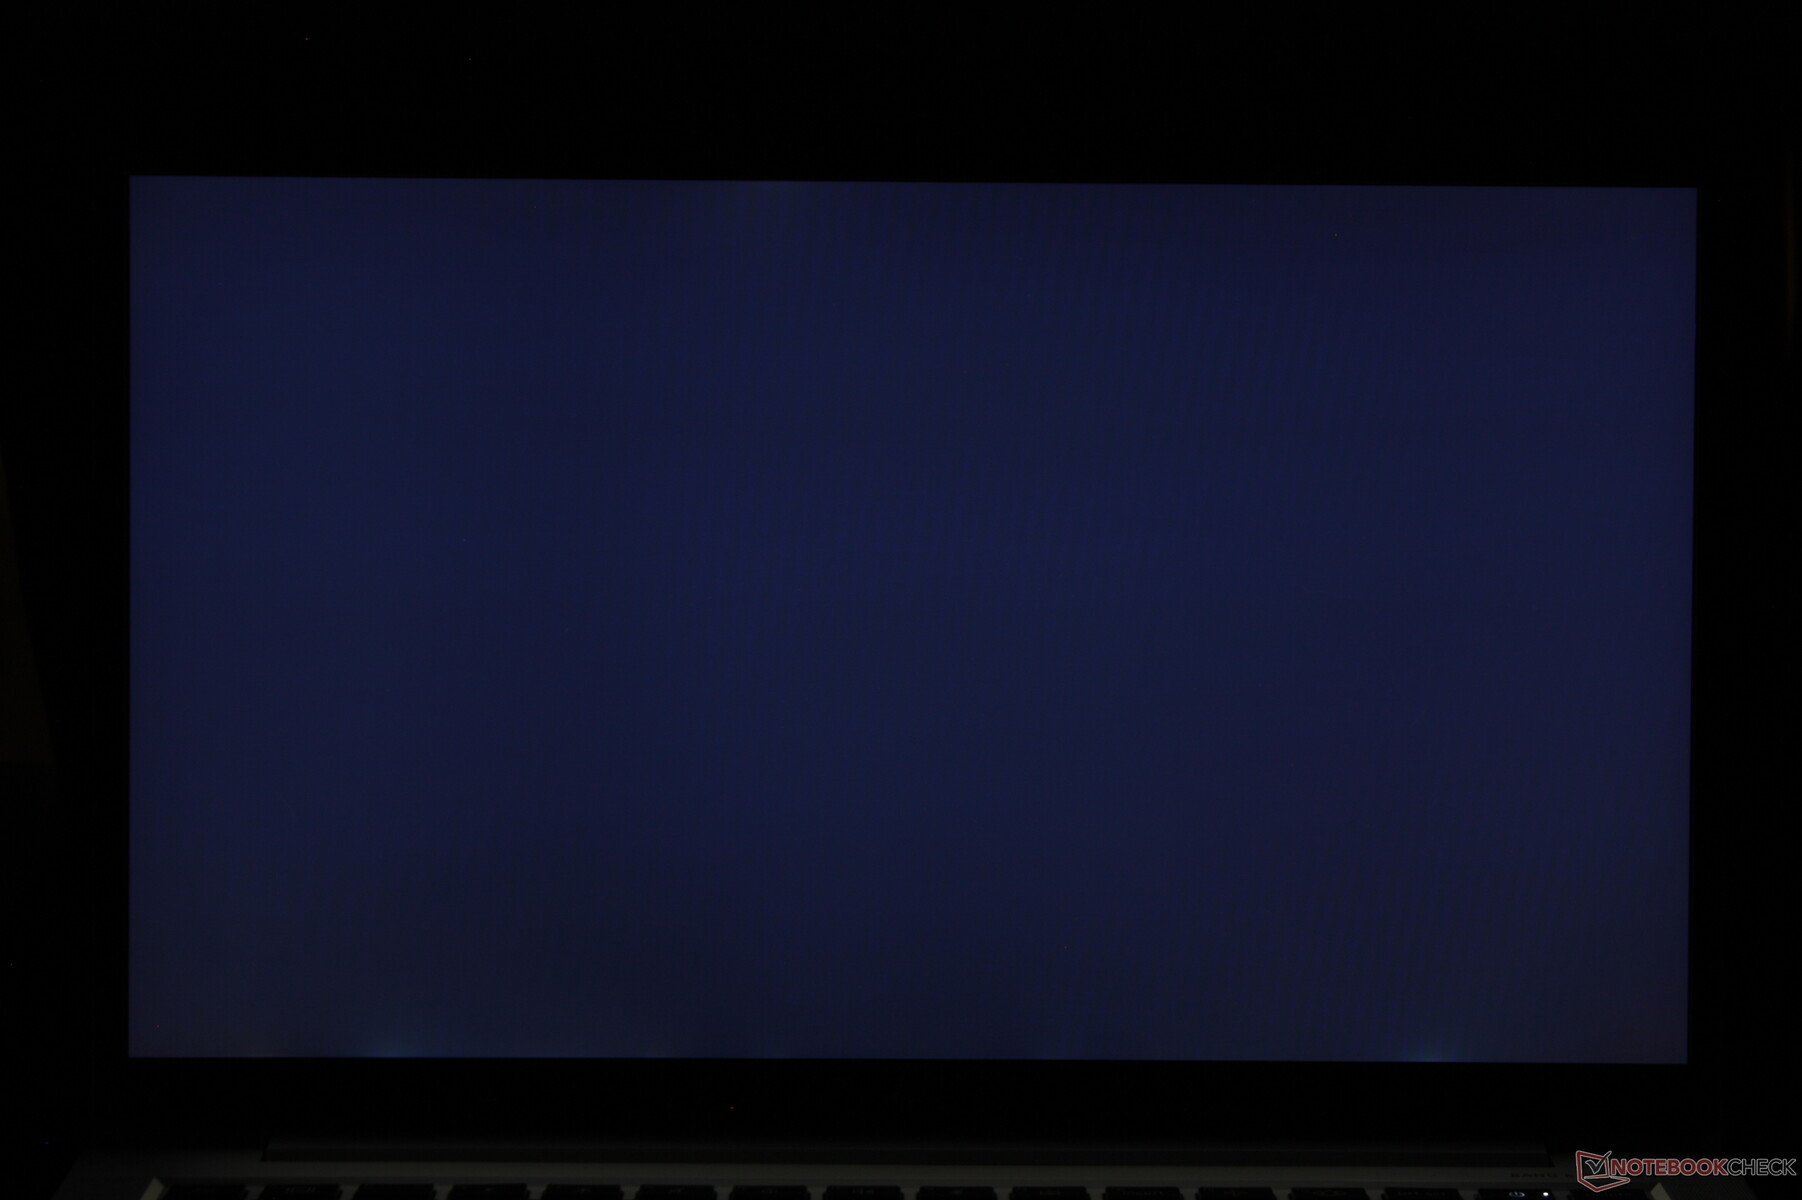
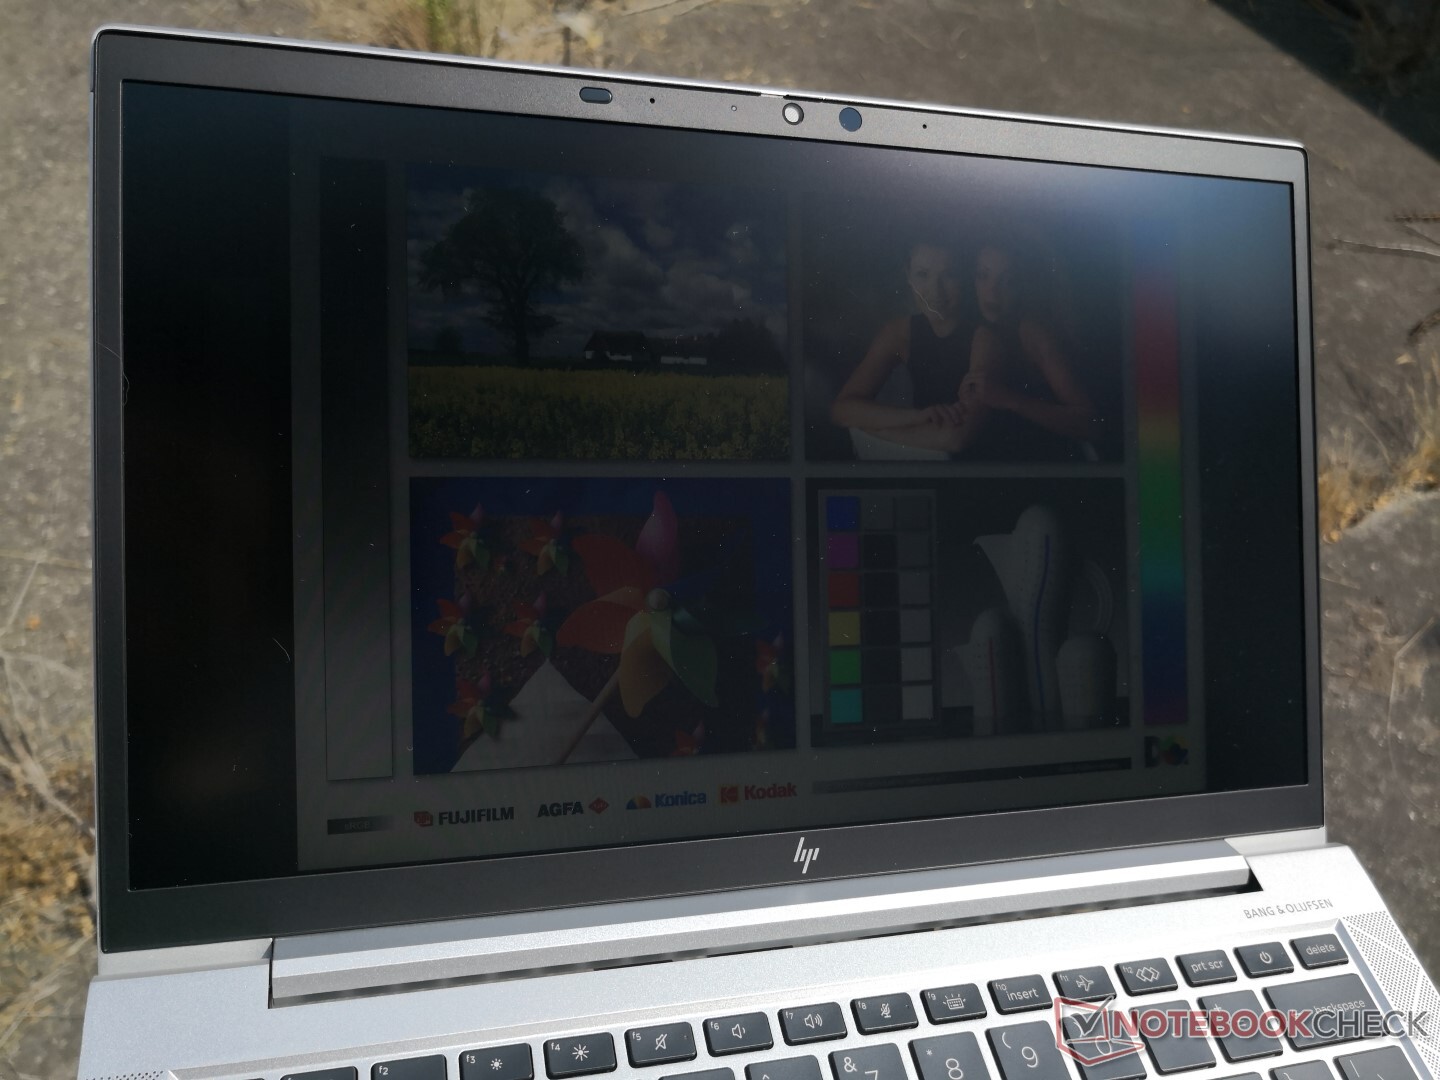
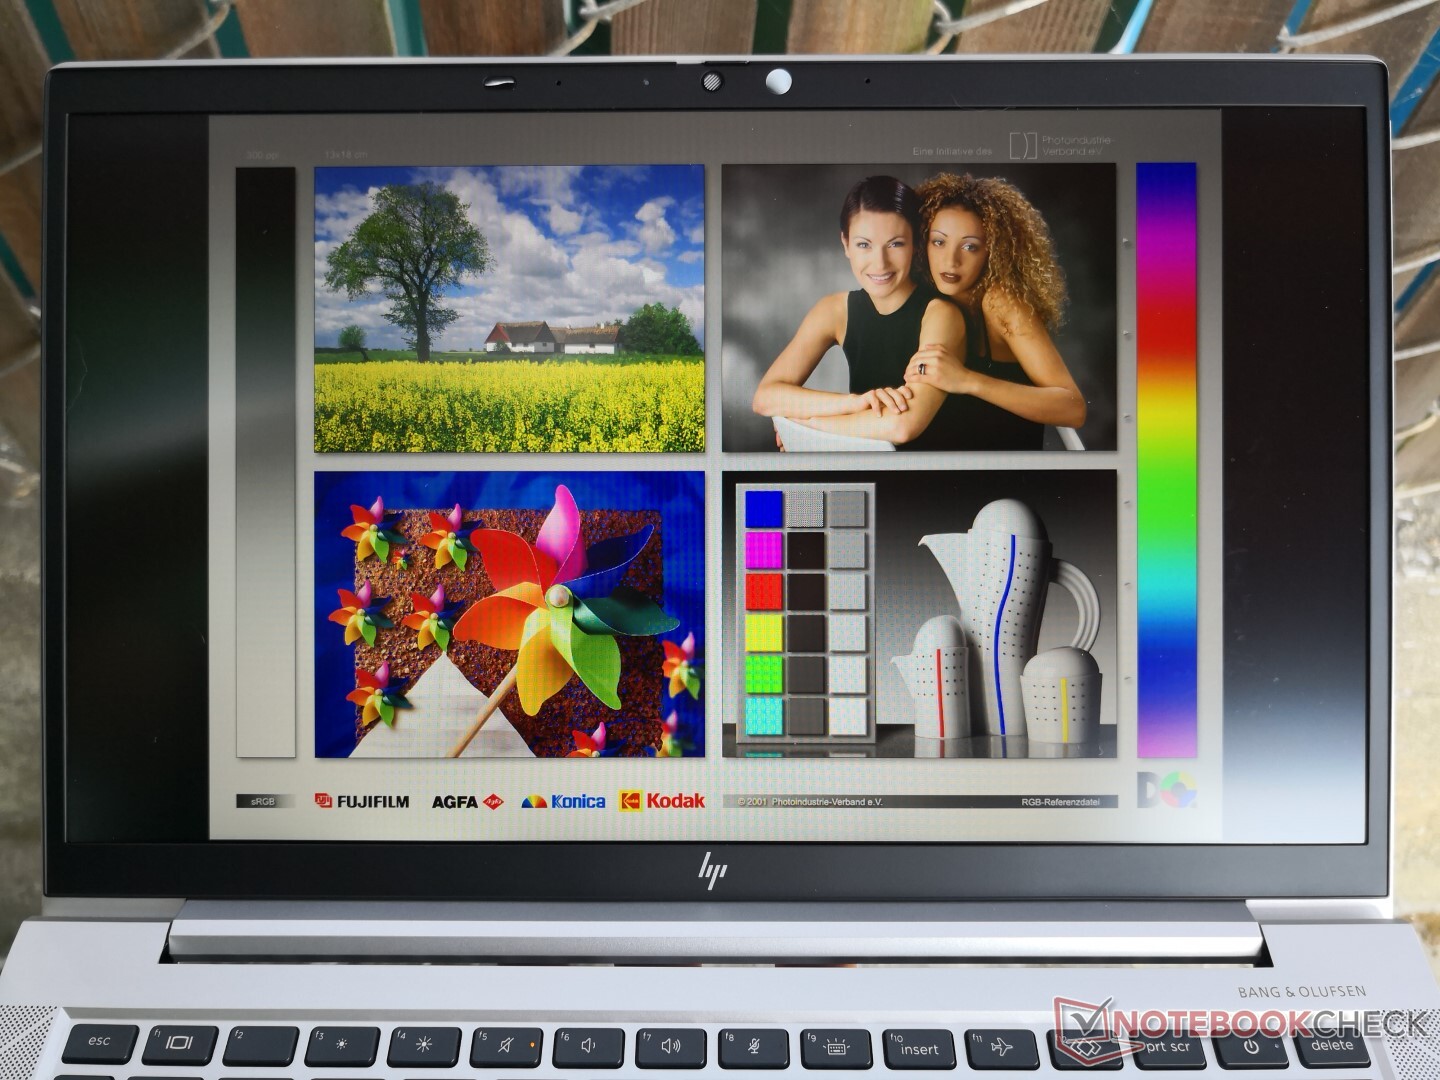
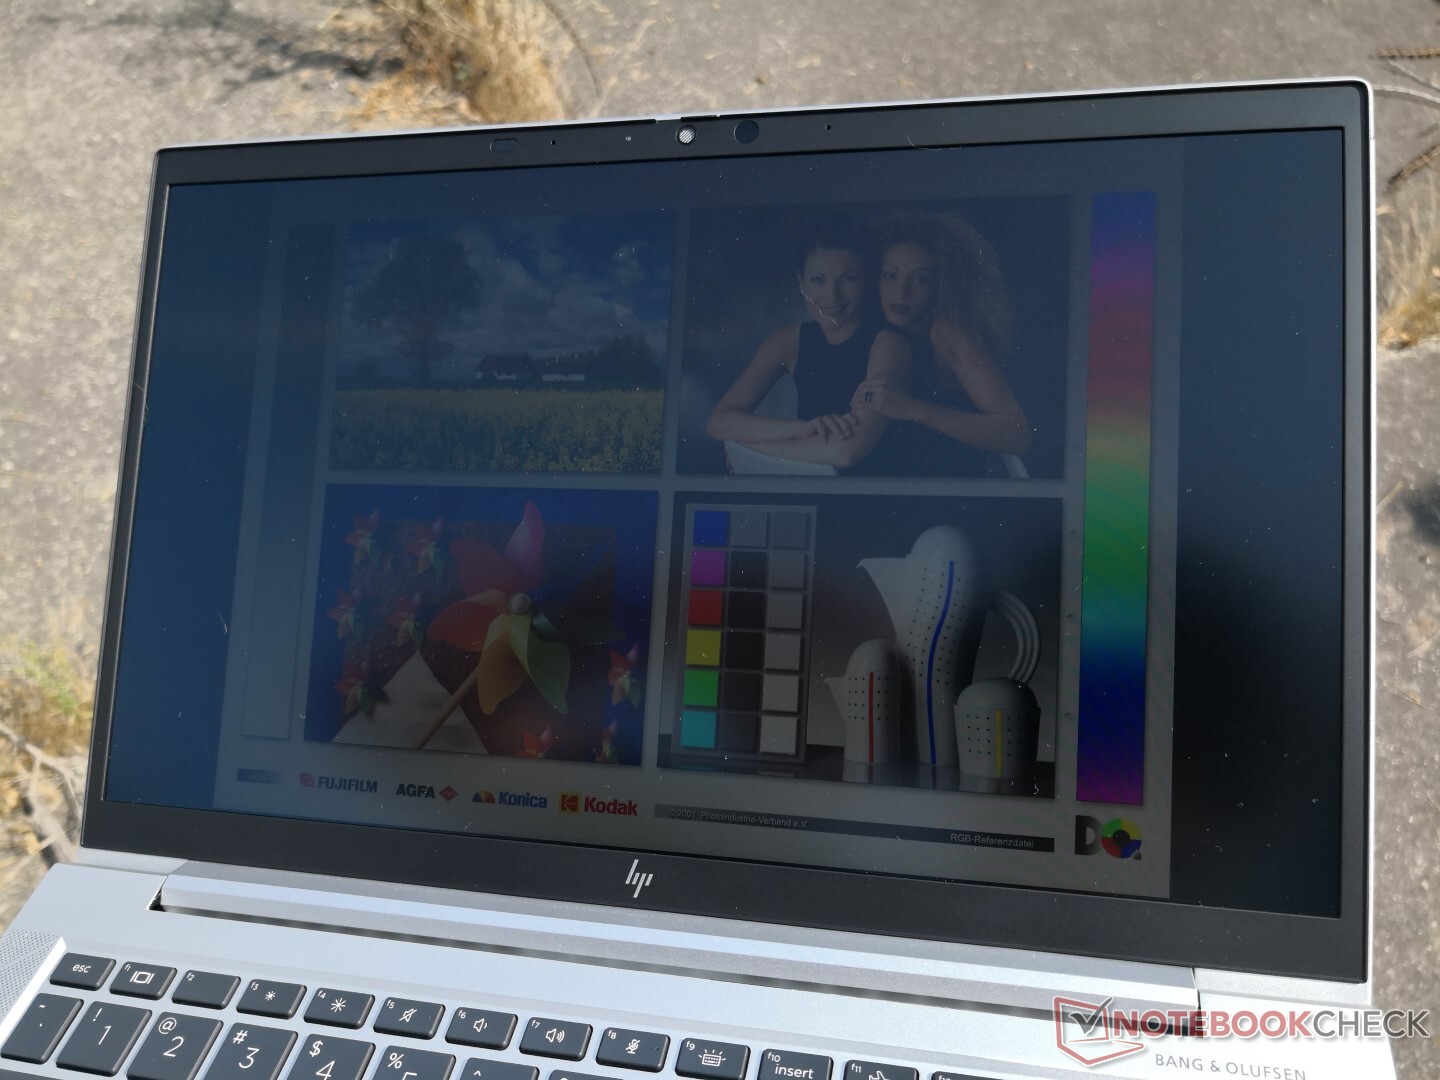
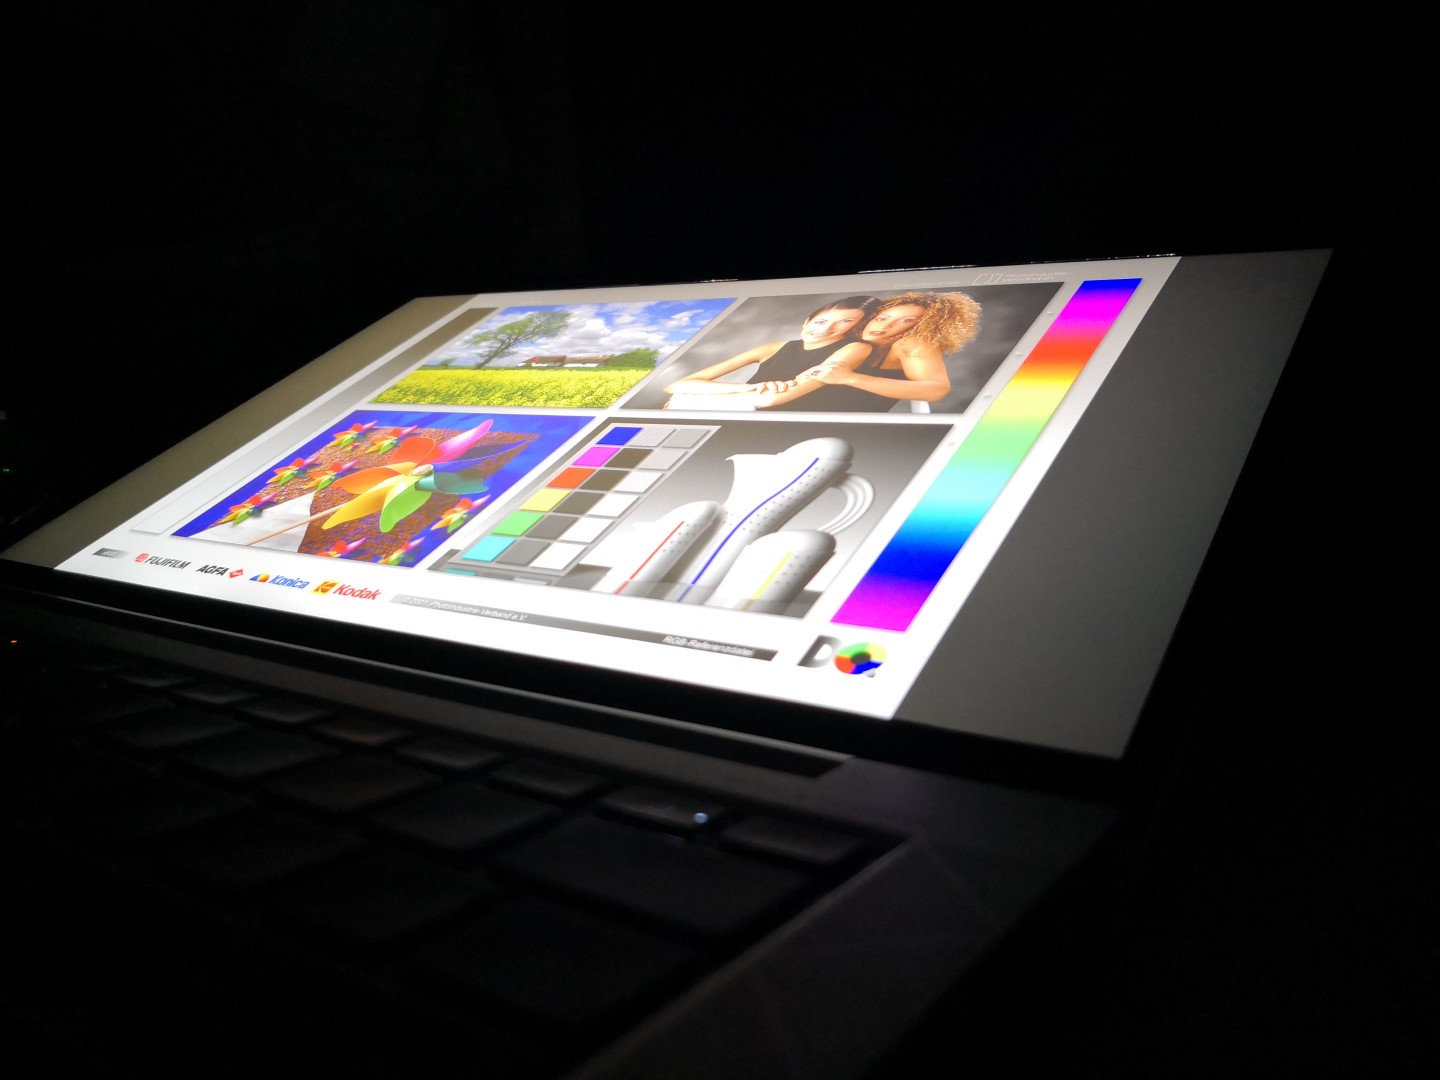
Outdoor visibility is acceptable when under shade but otherwise average at best when under brighter conditions. If you intend on using the laptop outdoors frequently, then we highly recommend the 1000-nit option while avoiding the lesser 250-nit option. Most high-end Ultrabooks top out at only 400 to 600 nits in comparison.
Performance
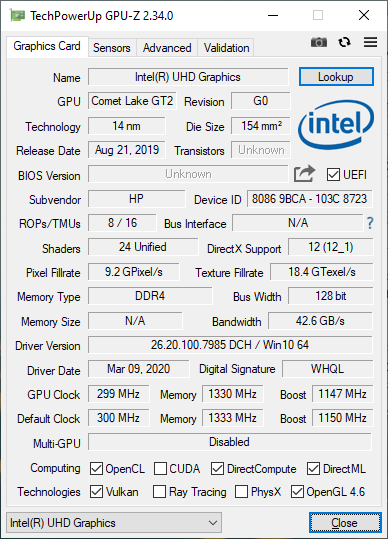
CPU options range from the Core i5-10210U all the way up to the vPro-enabled Core i7-10810U like the one we have here with no Ice Lake options to be seen. Keep in mind that the i7-10810U is not necessarily faster than the i7-10710U as they are mostly separated by vPro compatibility.
For AMD options, the EliteBook 835 series will fill that gap albeit without any Thunderbolt 3 support. AMD processors are recommended if you value the extra graphics horsepower over the usual Intel UHD Graphics 620.
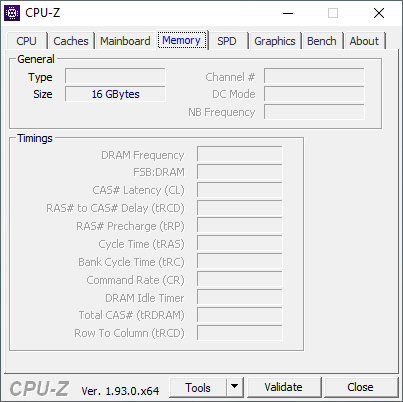
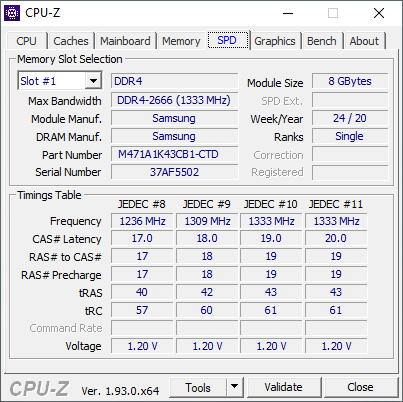
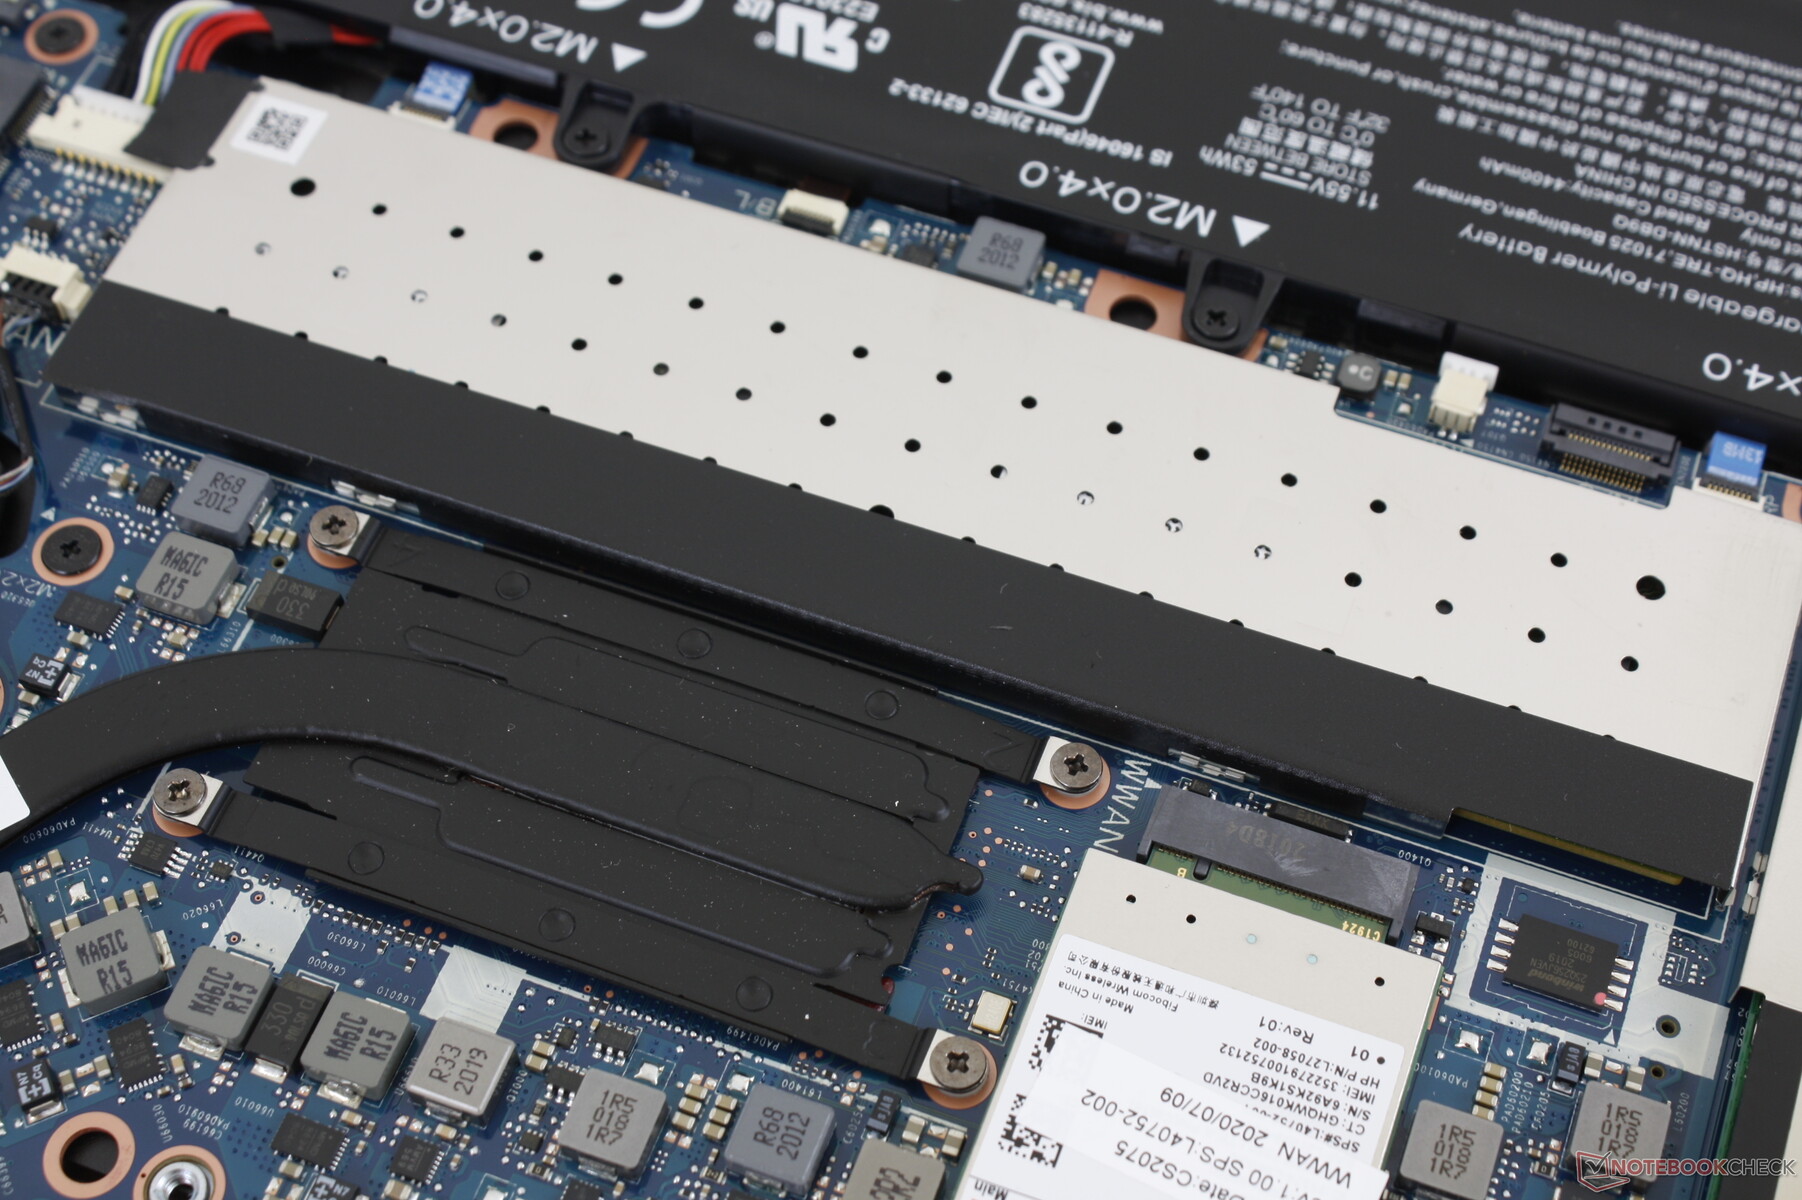
Both RAM and WLAN are user-upgradeable which is more than what we can say for the Latitude 7310 or ThinkPad X13. The two DDR4-2666 SODIMM slots support 32 GB each for a total of 64 GB.

Processor
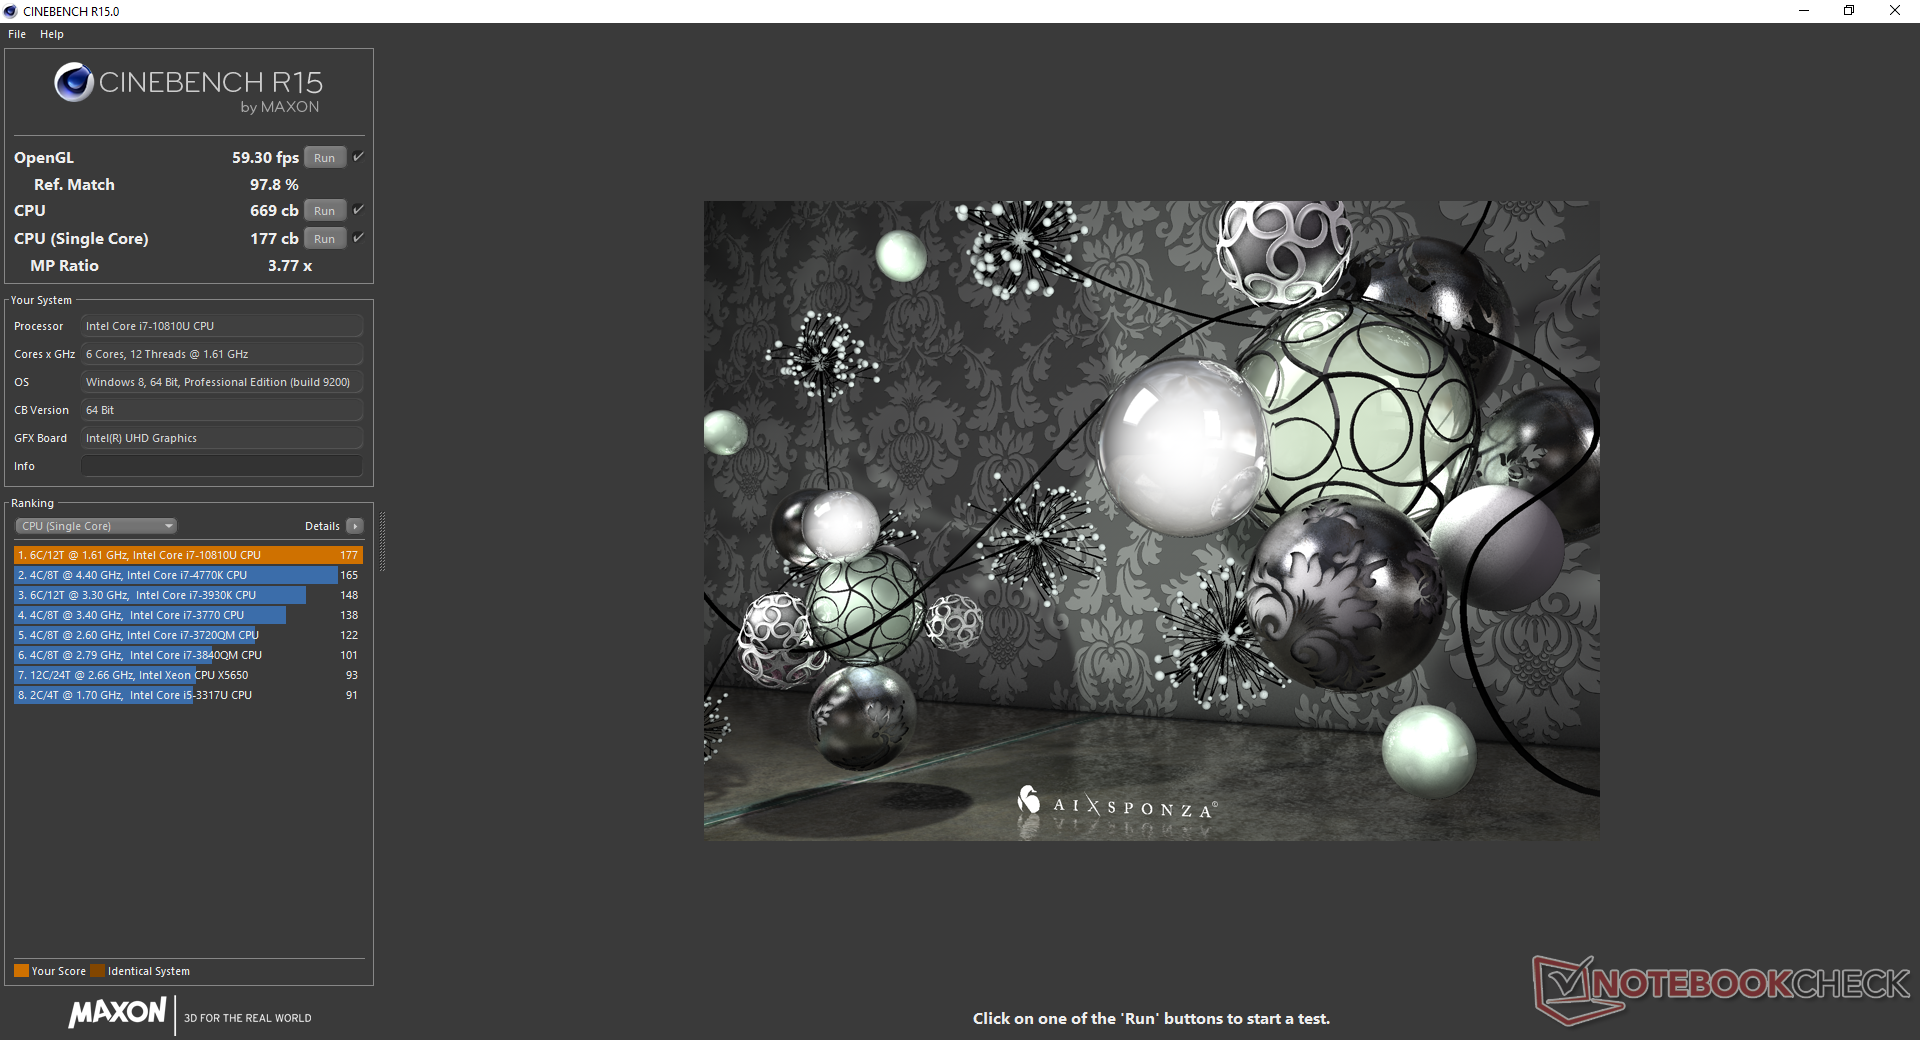
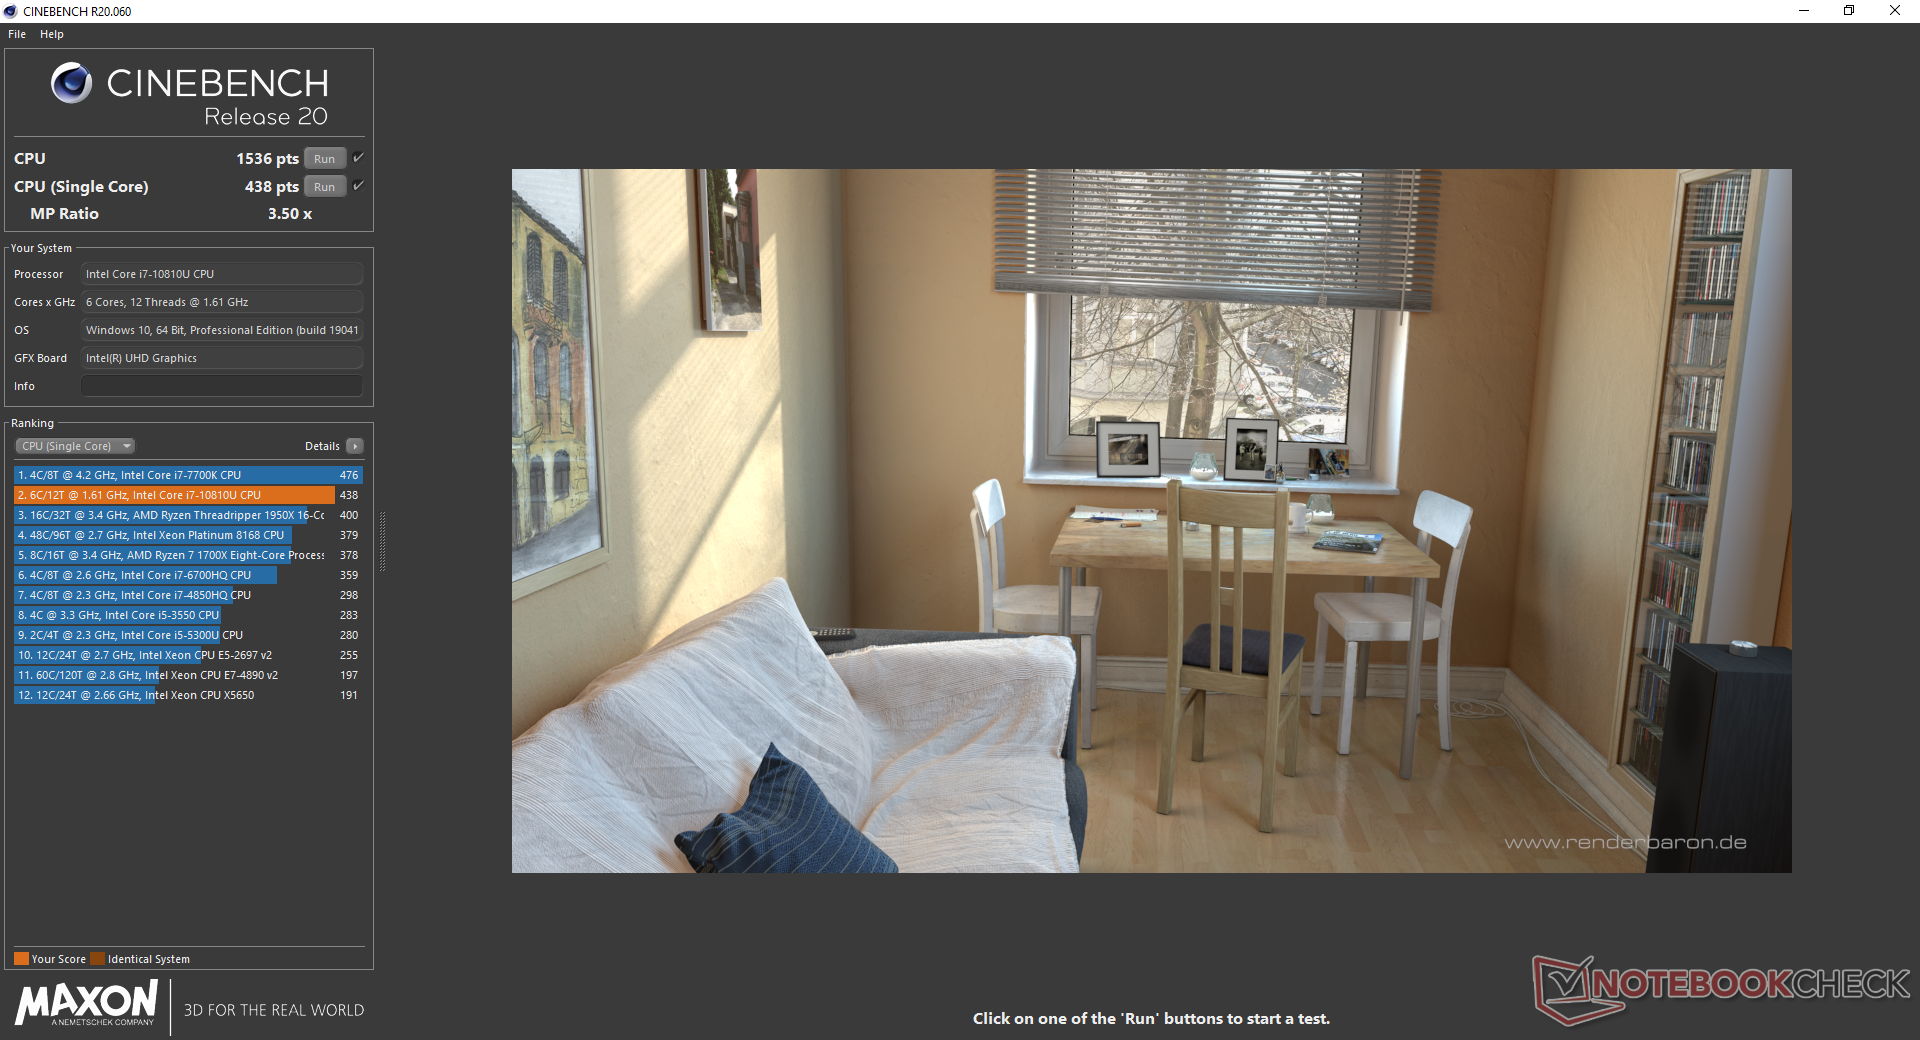
CPU performance is only good during the initial burst of Turbo Boost clock rates. When subjected to constant stress, performance begins to fall flat. Our CineBench R15 xT loop test below shows a performance dip of 22 percent over time because the system is unable to sustain high Turbo Boost clock rates for extended periods. This has a profound impact on long-running benchmarks like CineBench R20 where performance can be 35 percent slower than the Latitude 9510 equipped with the same Core i7-10810U CPU.
Clock rate behavior is explored further in our Stress Test section below.
Cinebench R15: CPU Multi 64Bit | CPU Single 64Bit
Blender: v2.79 BMW27 CPU
7-Zip 18.03: 7z b 4 -mmt1 | 7z b 4
Geekbench 5.5: Single-Core | Multi-Core
HWBOT x265 Benchmark v2.2: 4k Preset
LibreOffice : 20 Documents To PDF
R Benchmark 2.5: Overall mean
| LibreOffice / 20 Documents To PDF | |
| HP EliteBook 830 G7 | |
| Average Intel Core i7-10810U (60.6 - 68.2, n=5) | |
| Lenovo ThinkPad E14 Gen2-20T7S00W00 | |
| Microsoft Surface Book 3 15 | |
| Dell XPS 15 9500 Core i5 | |
| Lenovo ThinkPad X13-20UGS00800 | |
| Asus VivoBook Flip 14 TM420IA | |
| Acer TravelMate P6 P614-51T-G2-72ZU | |
| Lenovo ThinkPad X13-20T20033GE | |
* ... smaller is better
System Performance
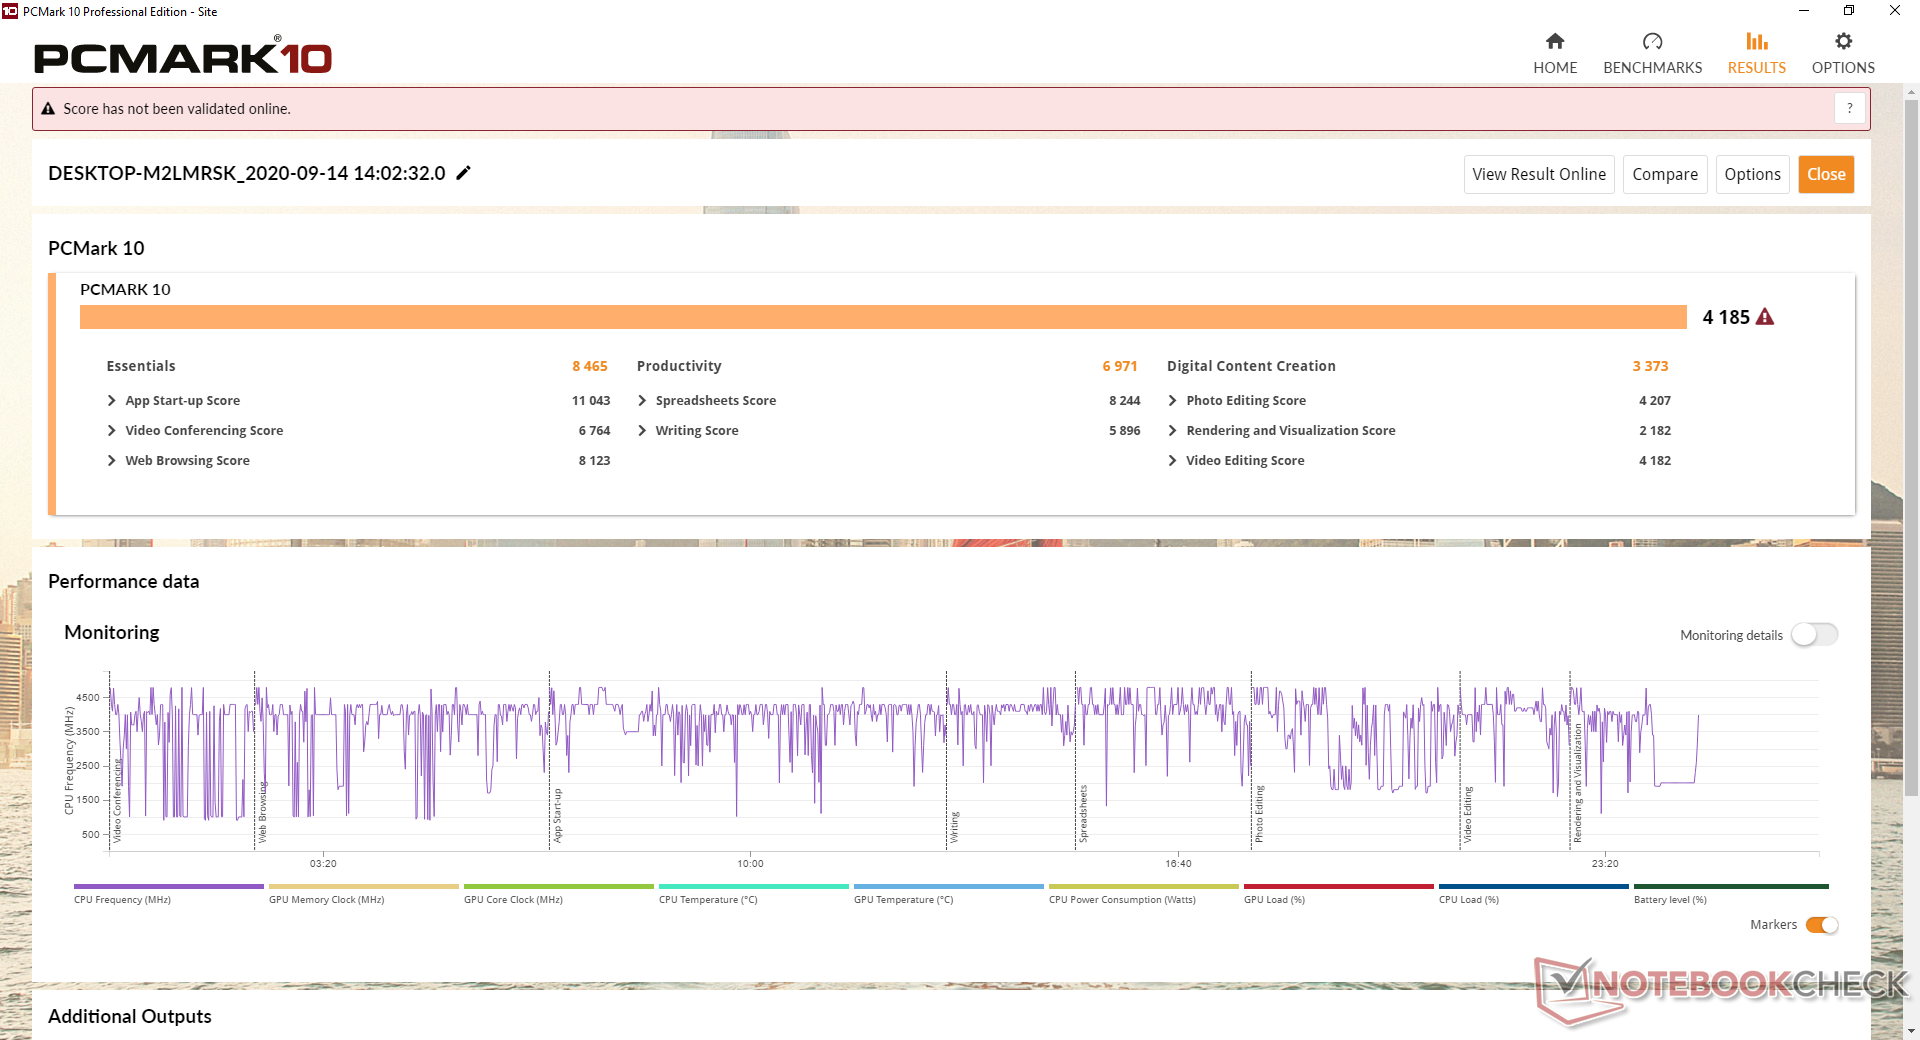
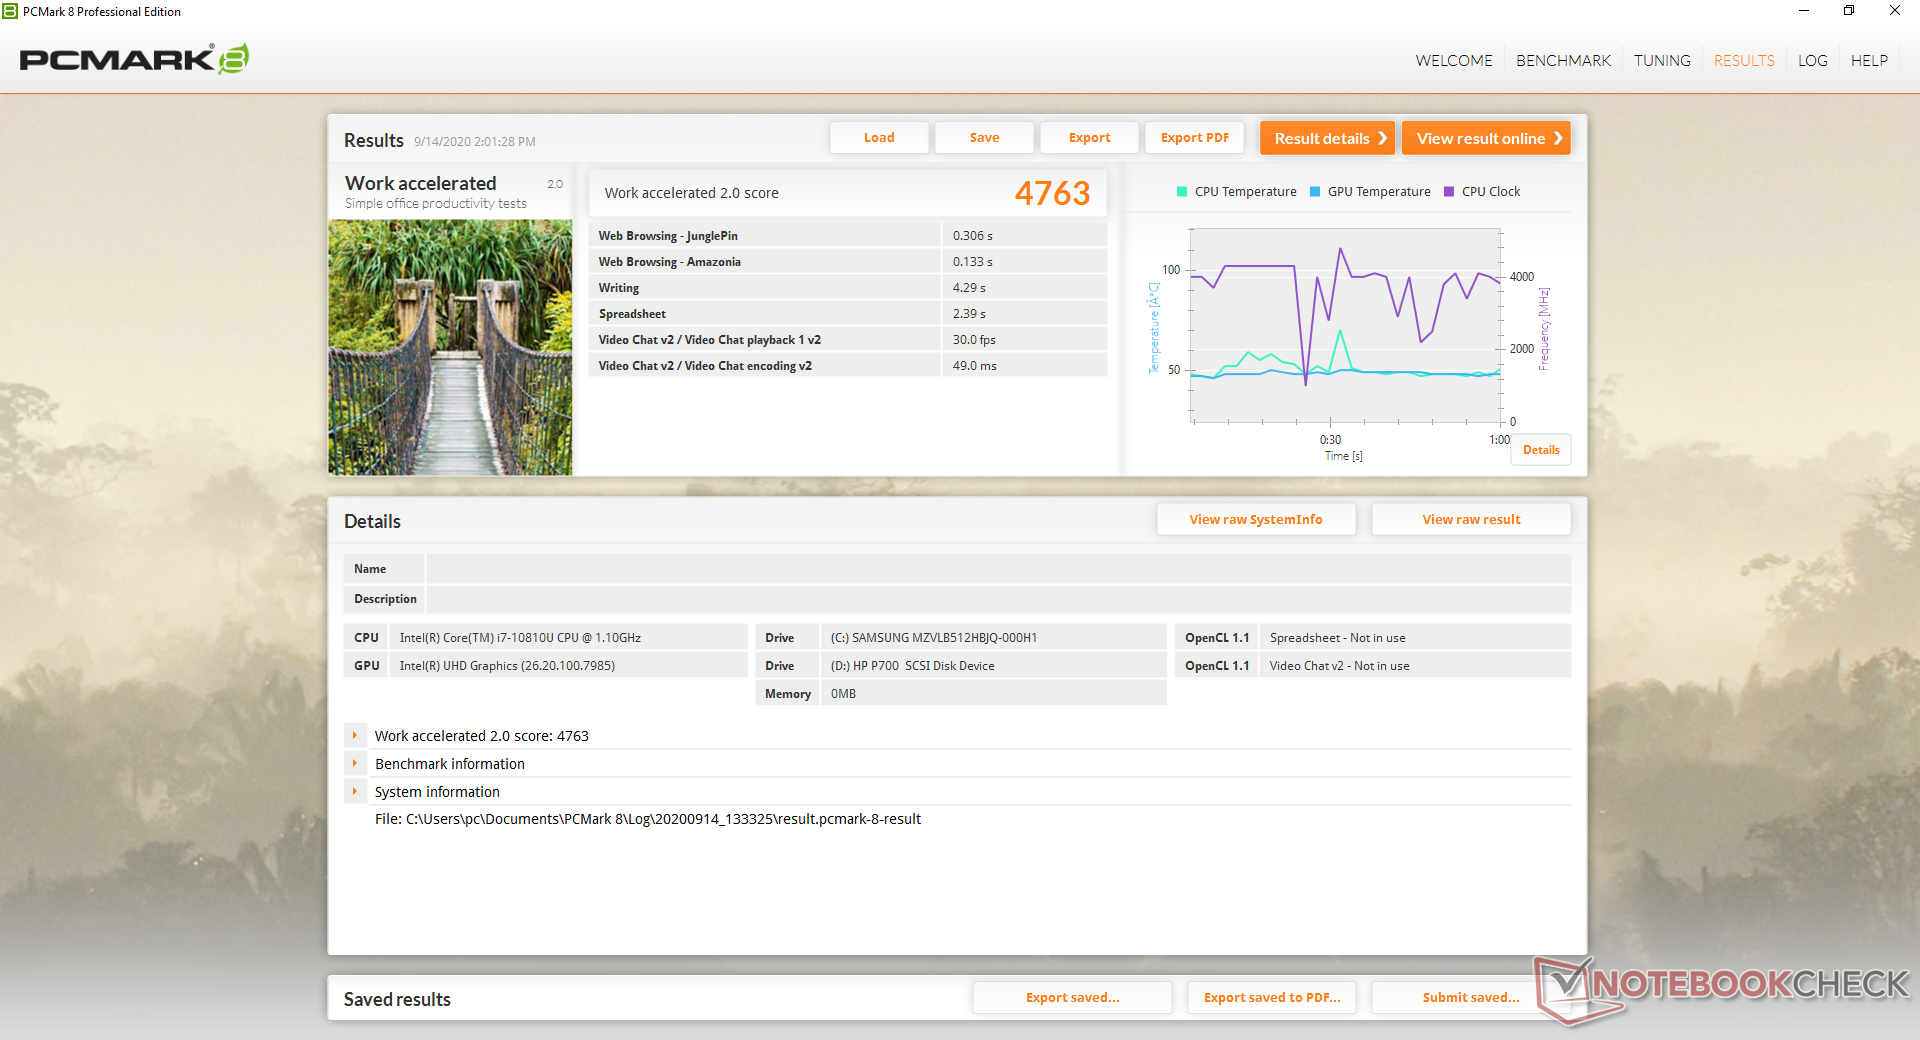
PCMark benchmarks are most similar to the Dell Latitude 9510 2-in-1 which comes equipped with the same Core i7-10810U CPU as our HP. The only exception is in PCMark 10 Essentials likely due to the superior Turbo Boost performance of the Dell.
We didn't experience any issues with our unit save for an instance where the brightness settings became unresponsive. A reboot was necessary to fix the issue.
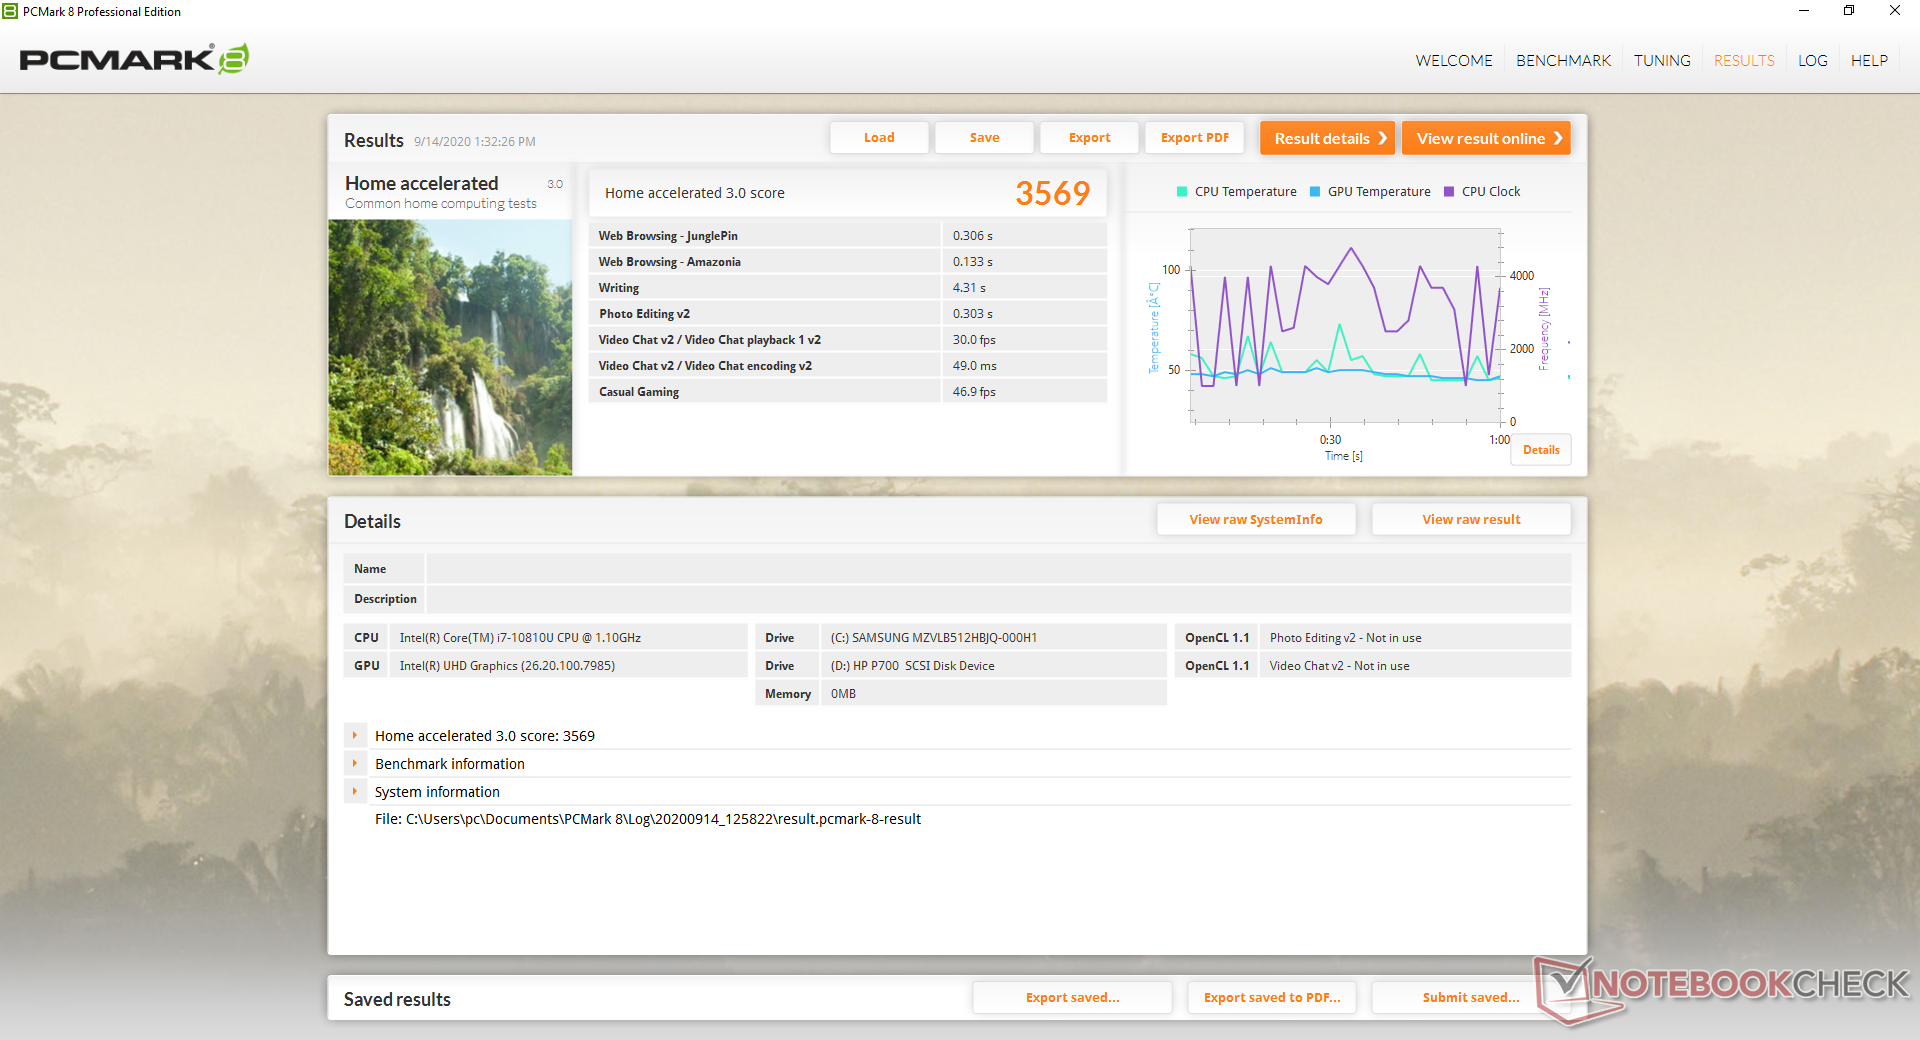
| PCMark 8 Home Score Accelerated v2 | 3569 points | |
| PCMark 8 Work Score Accelerated v2 | 4763 points | |
| PCMark 10 Score | 4185 points | |
Help | ||
DPC Latency
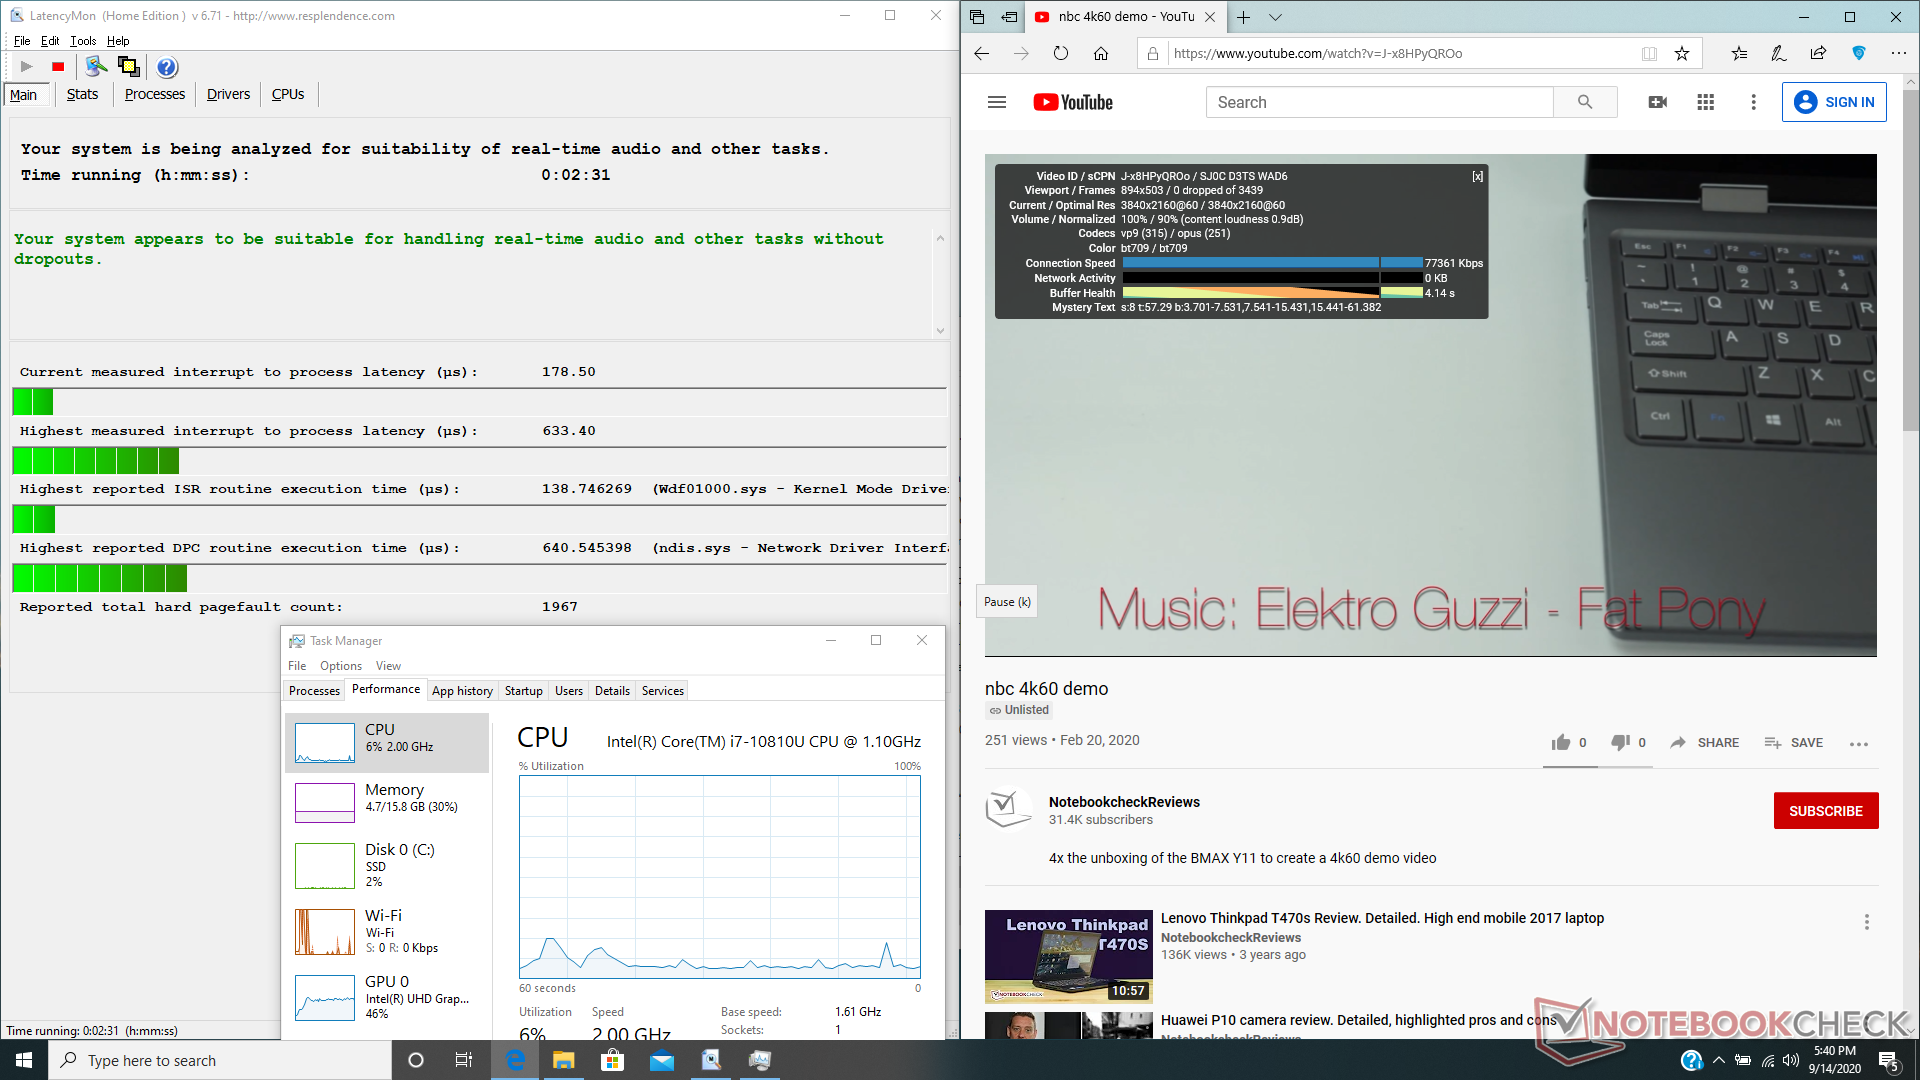
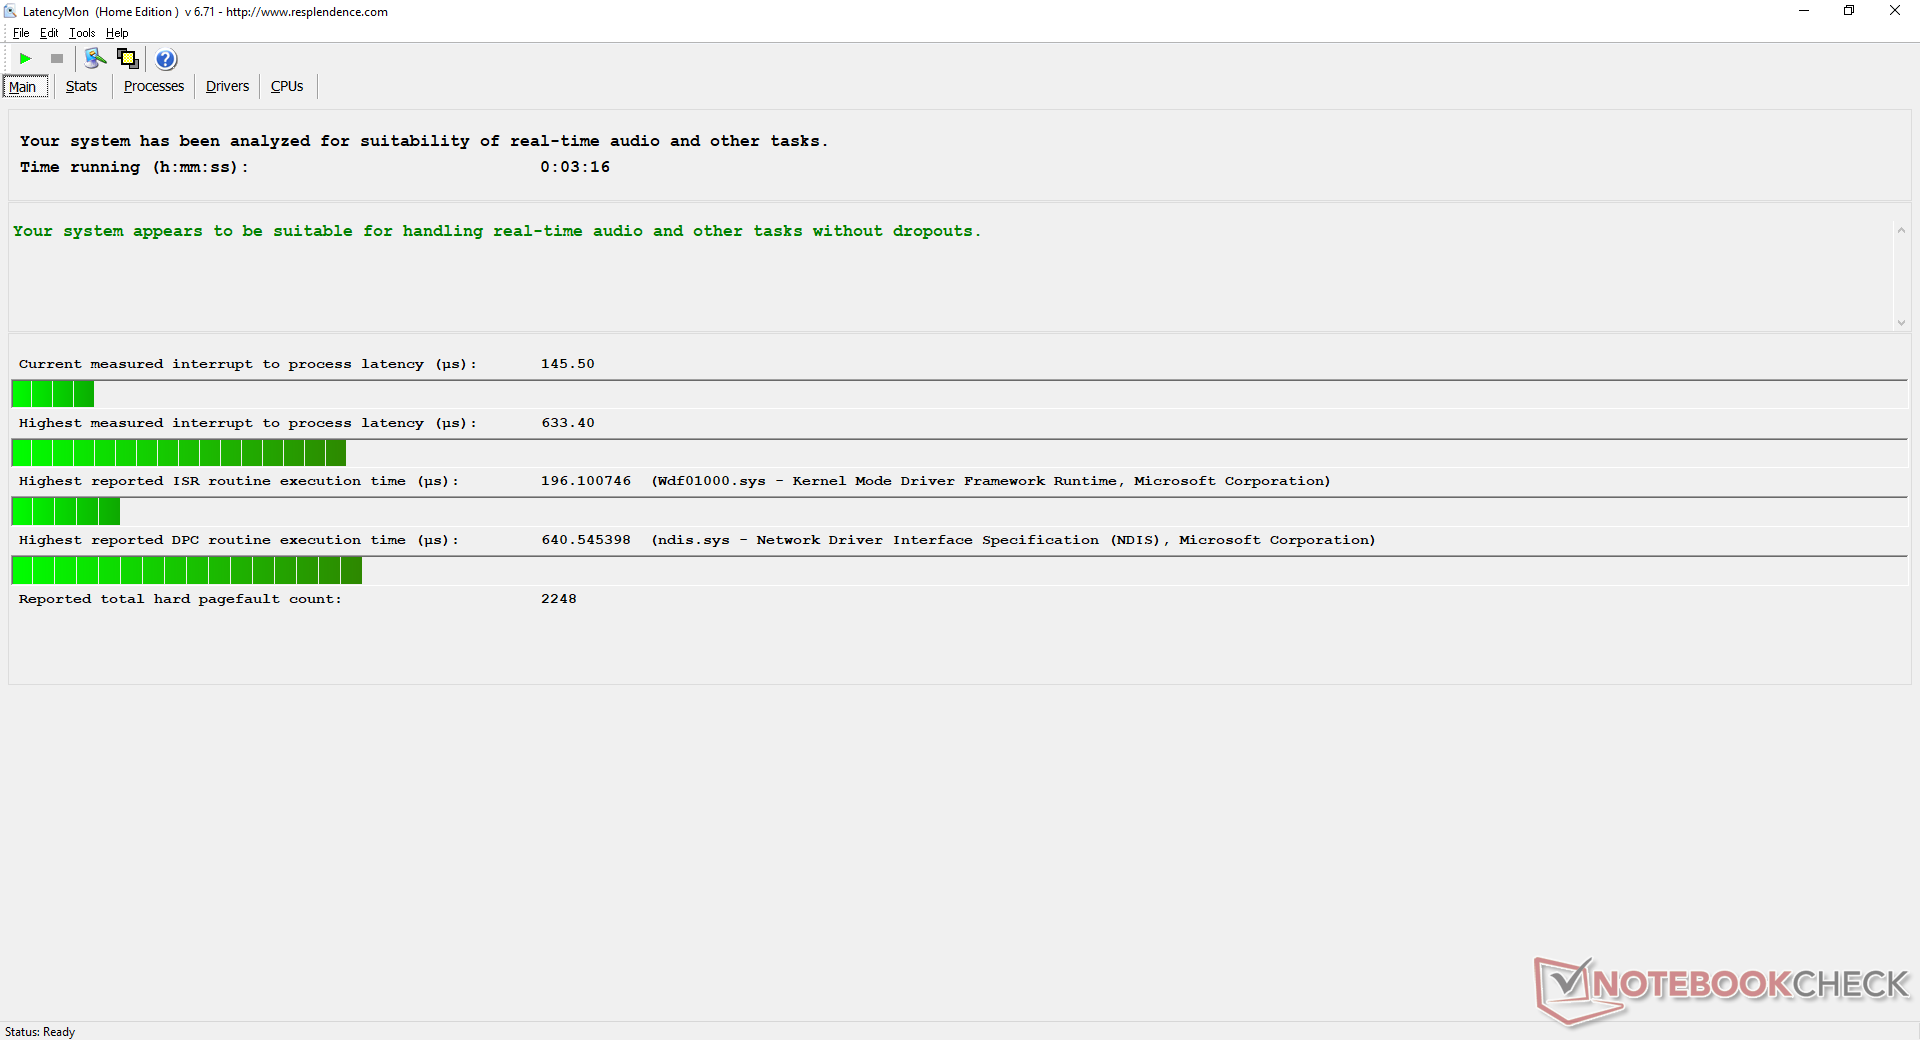
LatencyMon shows no DPC latency issues which is important for any business laptop. 4K60 video playback is smooth and with no dropped frames during our minute-long YouTube test.
| DPC Latencies / LatencyMon - interrupt to process latency (max), Web, Youtube, Prime95 | |
| Dell Latitude 9510 2-in-1 | |
| Acer TravelMate P6 P614-51T-G2-72ZU | |
| Dynabook Portege X30L-G1331 | |
| Lenovo ThinkPad X13-20UGS00800 | |
| Dell XPS 13 9300 i5 FHD | |
| Lenovo ThinkPad X13-20T20033GE | |
| Dell Latitude 7310 | |
| HP EliteBook 830 G7 | |
| Lenovo ThinkPad E14 Gen2-20T7S00W00 | |
| Asus VivoBook Flip 14 TM420IA | |
* ... smaller is better
Storage Devices
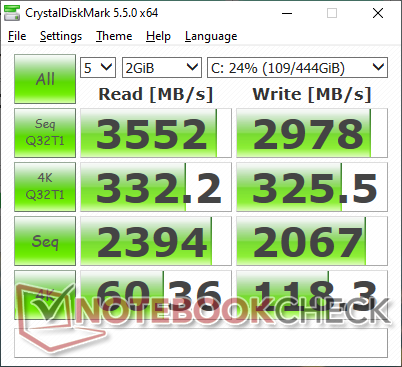
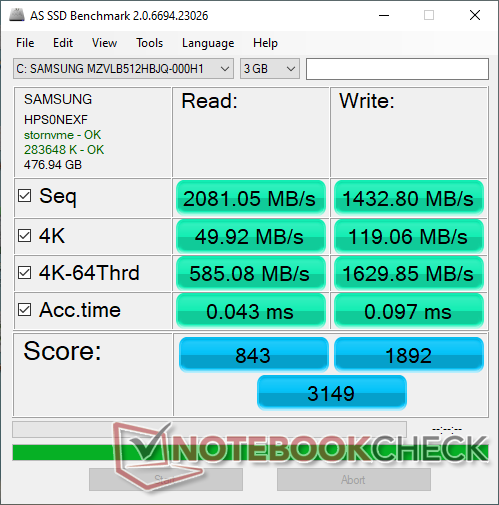
There is only one internal storage bay due to the small size of the laptop. The 512 GB Samsung PM981a SSD is one of the fastest consumer NVMe solutions at the moment to outclass the SK Hynix BC501/511 series as found on the Surface Book series. HP offers Xpoint and SATA III configurations for users who don't need NVMe speeds.
More benchmark comparisons can be found on our table of SSDs and HDDs.
| HP EliteBook 830 G7 Samsung SSD PM981a MZVLB512HBJQ | HP EliteBook x360 830 G6 WDC PC SN720 SDAPNTW-1T00 | Lenovo ThinkPad X13-20T20033GE Samsung SSD PM981a MZVLB512HBJQ | Dell Latitude 7310 Samsung SSD PM981a MZVLB512HBJQ | Microsoft Surface Laptop 3 13 Core i5-1035G7 SK hynix BC501 HFM256GDGTNG | |
|---|---|---|---|---|---|
| AS SSD | 9% | 20% | 62% | -14% | |
| Seq Read (MB/s) | 2081 | 2446 18% | 2714 30% | 2054 -1% | 1387 -33% |
| Seq Write (MB/s) | 1433 | 1319 -8% | 1374 -4% | 1575 10% | 504 -65% |
| 4K Read (MB/s) | 49.92 | 44.69 -10% | 51.2 3% | 52.1 4% | 42.35 -15% |
| 4K Write (MB/s) | 119.1 | 151.5 27% | 135.7 14% | 137.3 15% | 120 1% |
| 4K-64 Read (MB/s) | 585 | 603 3% | 962 64% | 618 6% | 497.4 -15% |
| 4K-64 Write (MB/s) | 1630 | 1410 -13% | 1420 -13% | 1317 -19% | 354.9 -78% |
| Access Time Read * (ms) | 0.043 | 0.052 -21% | 0.043 -0% | 0.044 -2% | 0.055 -28% |
| Access Time Write * (ms) | 0.097 | 0.026 73% | 0.028 71% | 0.083 14% | 0.093 4% |
| Score Read (Points) | 843 | 892 6% | 1284 52% | 876 4% | 678 -20% |
| Score Write (Points) | 1892 | 1693 -11% | 1693 -11% | 1611 -15% | 525 -72% |
| Score Total (Points) | 3149 | 2997 -5% | 3579 14% | 2927 -7% | 1520 -52% |
| Copy ISO MB/s (MB/s) | 2452 | 2990 22% | 2297 -6% | 764 -69% | |
| Copy Program MB/s (MB/s) | 72.2 | 106.5 48% | 540 648% | 256.1 255% | |
| Copy Game MB/s (MB/s) | 404 | 385.4 -5% | 1288 219% | 368.4 -9% | |
| CrystalDiskMark 5.2 / 6 | -13% | 3% | 6% | -32% | |
| Write 4K (MB/s) | 118.3 | 122.8 4% | 131.1 11% | 135.2 14% | 112.3 -5% |
| Read 4K (MB/s) | 60.4 | 46.89 -22% | 45.48 -25% | 50.7 -16% | 42.13 -30% |
| Write Seq (MB/s) | 2067 | 1801 -13% | 2042 -1% | 2155 4% | 630 -70% |
| Read Seq (MB/s) | 2394 | 1014 -58% | 2259 -6% | 2504 5% | 1023 -57% |
| Write 4K Q32T1 (MB/s) | 325.5 | 333.7 3% | 429.1 32% | 395.6 22% | 336.6 3% |
| Read 4K Q32T1 (MB/s) | 332.2 | 314.4 -5% | 370.7 12% | 394.5 19% | 399.6 20% |
| Write Seq Q32T1 (MB/s) | 2978 | 2784 -7% | 2963 -1% | 2987 0% | 821 -72% |
| Read Seq Q32T1 (MB/s) | 3552 | 3261 -8% | 3564 0% | 3564 0% | 2030 -43% |
| Write 4K Q8T8 (MB/s) | 300.6 | ||||
| Read 4K Q8T8 (MB/s) | 751 | ||||
| Total Average (Program / Settings) | -2% /
1% | 12% /
13% | 34% /
42% | -23% /
-20% |
* ... smaller is better

Disk Throttling: DiskSpd Read Loop, Queue Depth 8
GPU Performance
Aside from a few larger examples, most EliteBooks are limited to integrated graphics only due to their small designs. The AMD-based EliteBook 835 series, however, can provide over two times the graphics power over the aging Intel UHD Graphics 620 for those who need it.
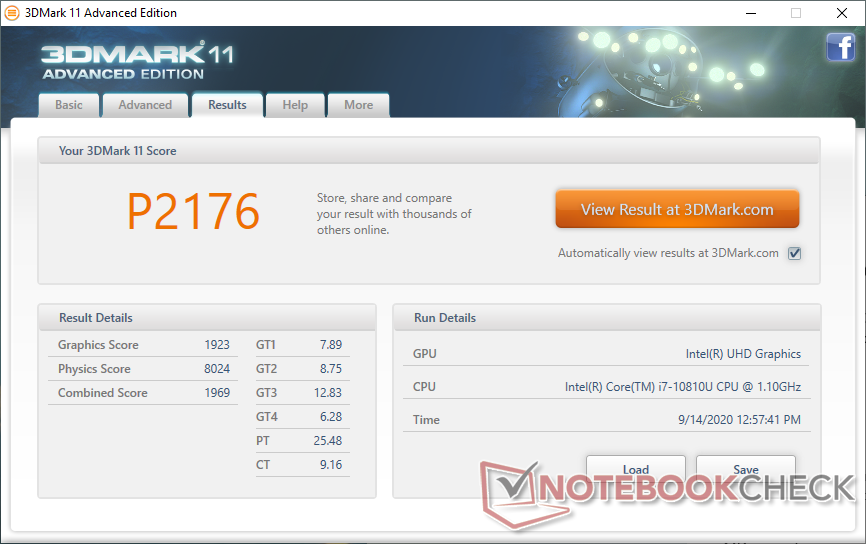
| 3DMark 11 Performance | 2176 points | |
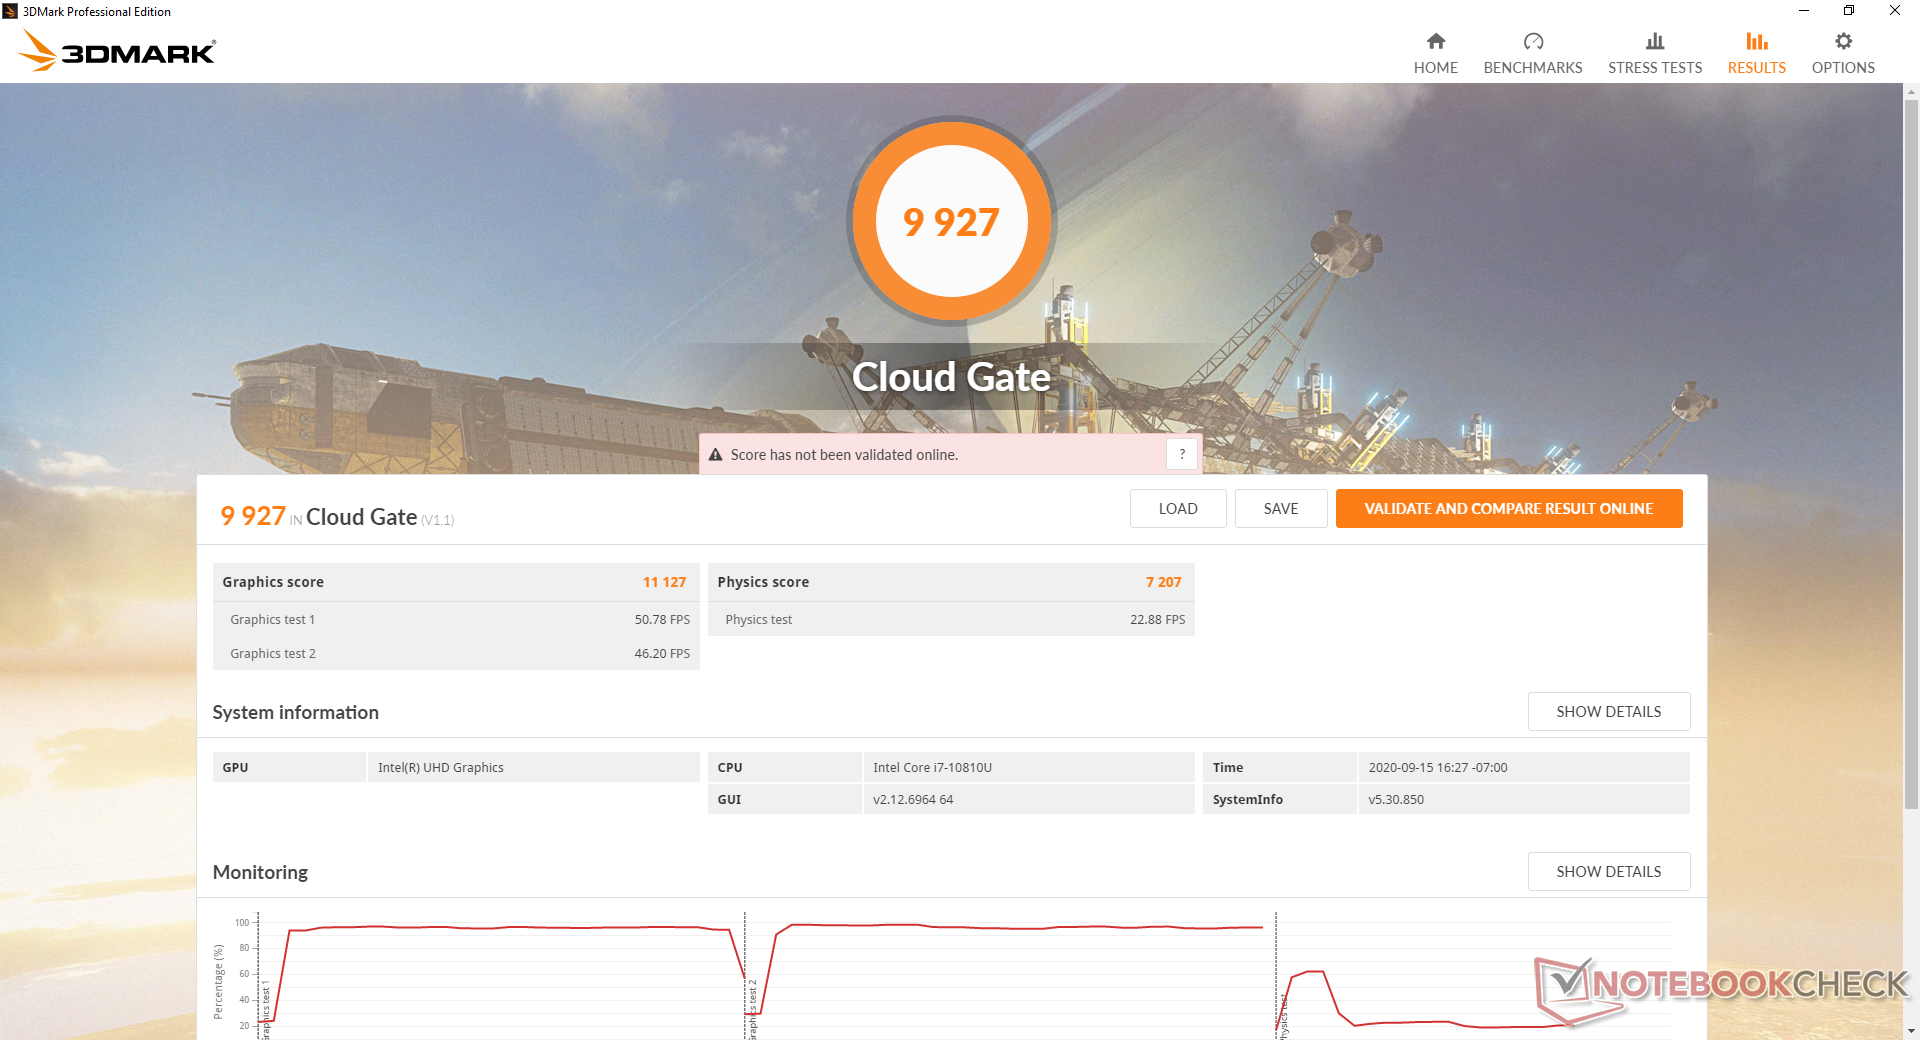
| 3DMark Cloud Gate Standard Score | 9927 points | |
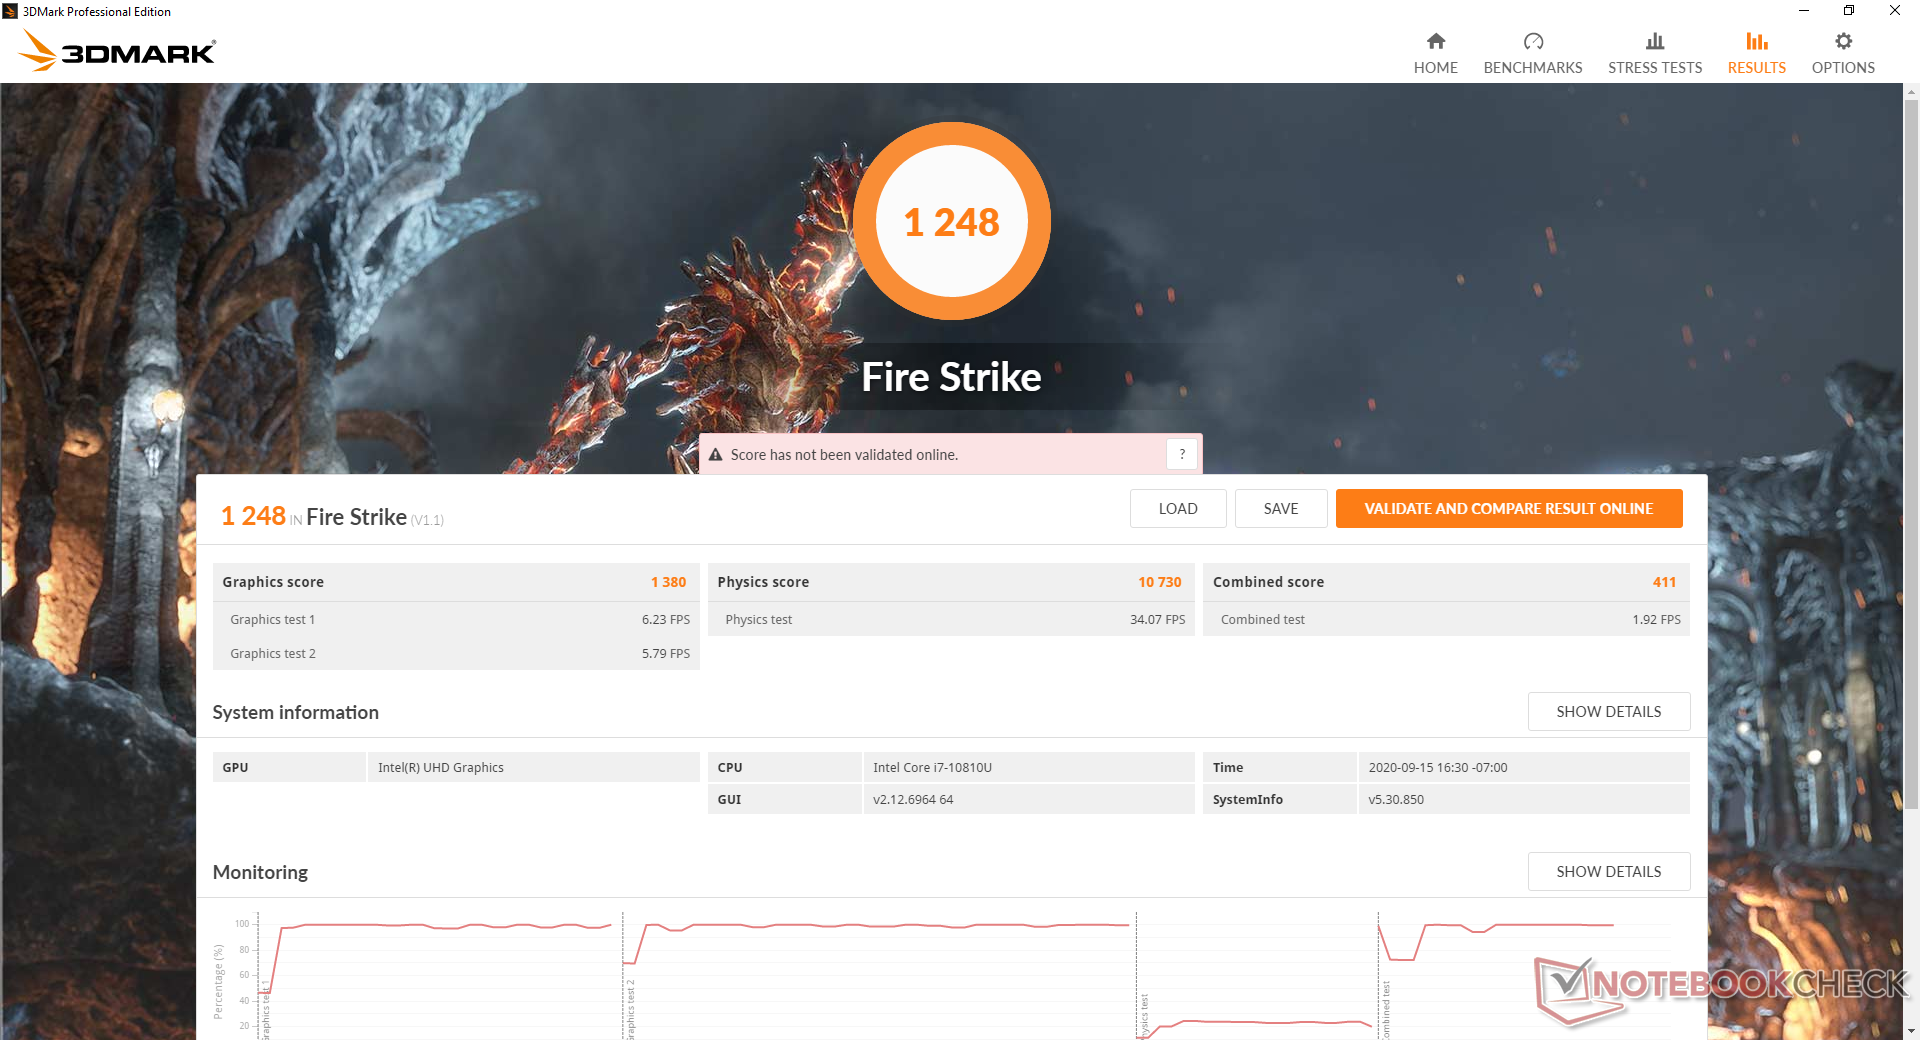
| 3DMark Fire Strike Score | 1248 points | |
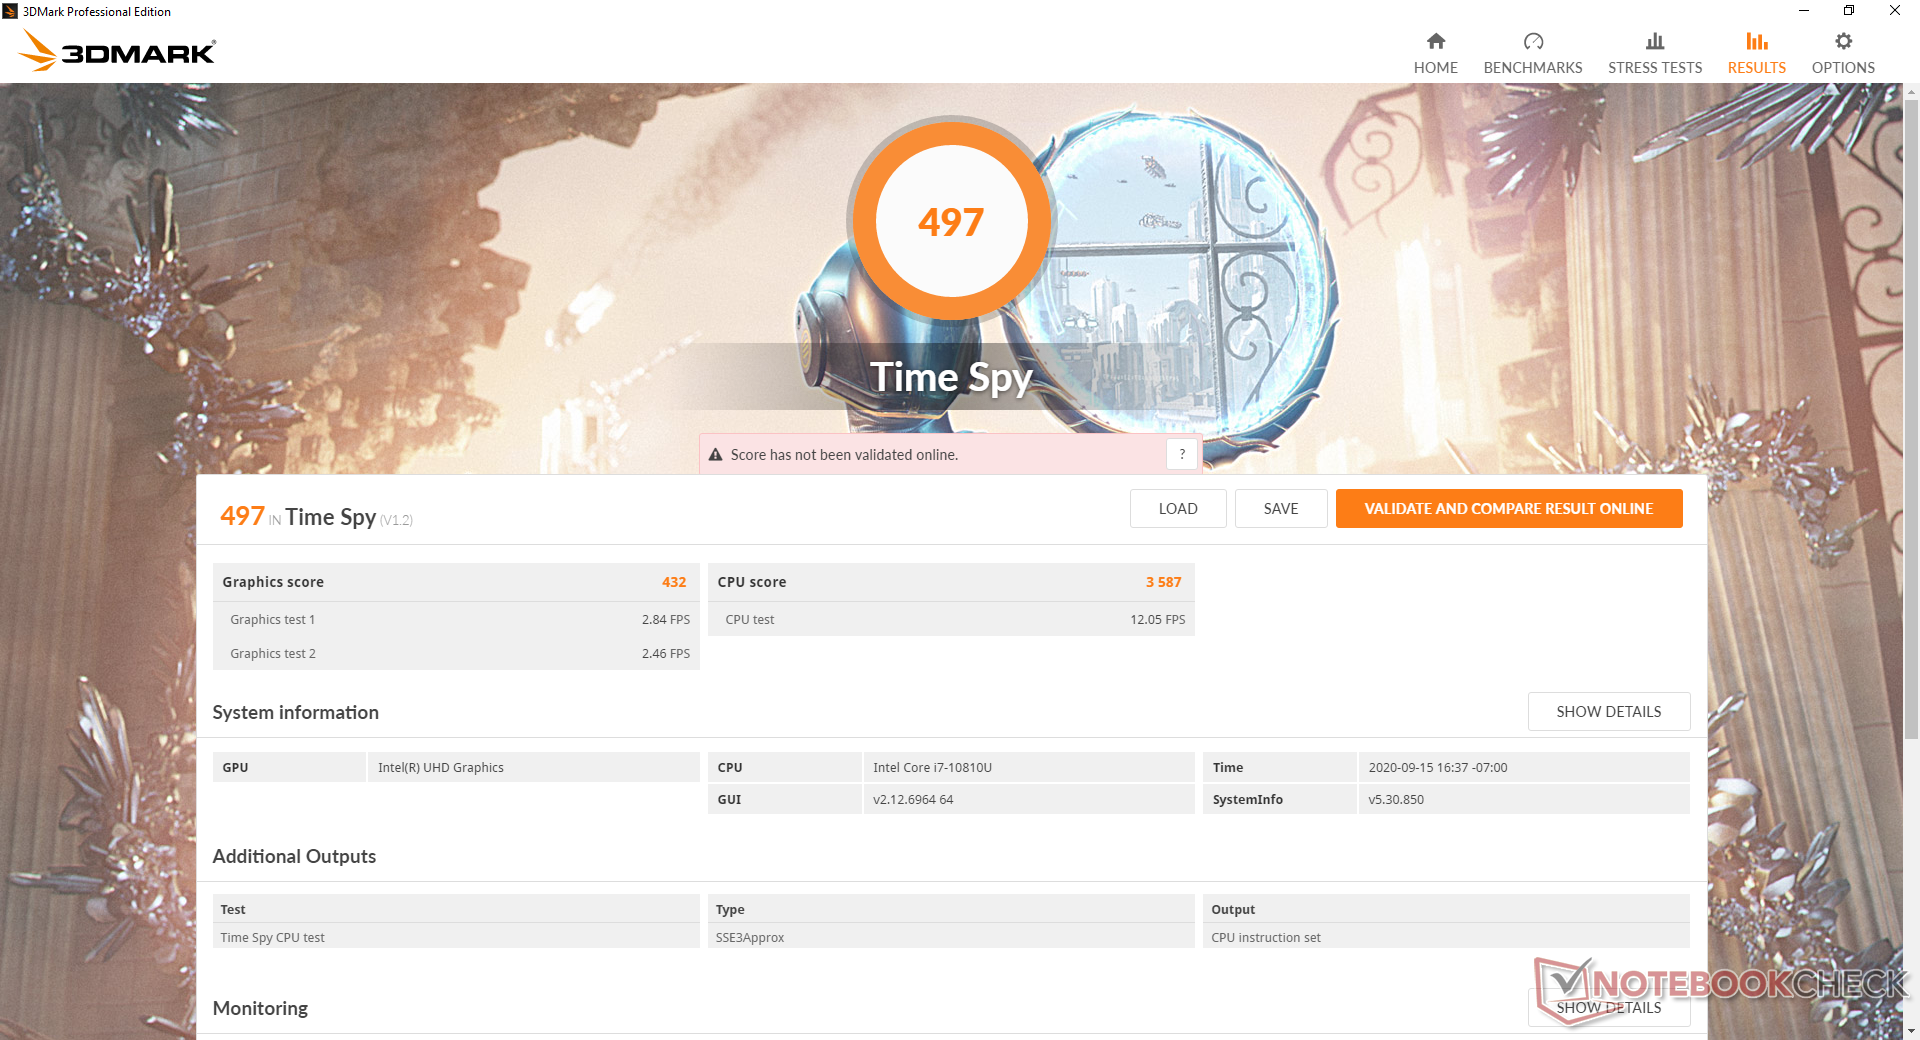
| 3DMark Time Spy Score | 497 points | |
Help | ||
| low | med. | high | ultra | |
|---|---|---|---|---|
| Dota 2 Reborn (2015) | 75.8 | 49.1 | 22.4 | 19.7 |
| X-Plane 11.11 (2018) | 11.9 | 10.6 | 10.1 |
Emissions
System Noise
The system is mostly silent during low to low-medium loads like web browsing or video streaming. The fan may slowly pick up to 31.4 dB(A) if running higher loads, but this is still almost inaudible in a typical office environment. Running extreme loads like Prime95 will cause the fan to run at up to 39 dB(A).
We noticed slight electronic noise or coil whine from our test unit which prevents it from being truly silent even when the fan is idle. It's thankfully minor and only audible when placing an ear closer to the keyboard keys.
| HP EliteBook 830 G7 UHD Graphics 620, i7-10810U, Samsung SSD PM981a MZVLB512HBJQ | HP EliteBook x360 830 G6 UHD Graphics 620, i7-8565U, WDC PC SN720 SDAPNTW-1T00 | Lenovo ThinkPad X13-20T20033GE UHD Graphics 620, i5-10210U, Samsung SSD PM981a MZVLB512HBJQ | Dell Latitude 7310 UHD Graphics 620, i7-10610U, Samsung SSD PM981a MZVLB512HBJQ | Dynabook Portege X30L-G1331 UHD Graphics 620, i5-10210U, Samsung SSD PM981a MZVLB512HBJQ | Microsoft Surface Laptop 3 13 Core i5-1035G7 Iris Plus Graphics G7 (Ice Lake 64 EU), i5-1035G7, SK hynix BC501 HFM256GDGTNG | |
|---|---|---|---|---|---|---|
| Noise | -5% | -3% | -5% | -3% | -3% | |
| off / environment * (dB) | 26.8 | 28.8 -7% | 29.3 -9% | 29 -8% | 28.5 -6% | 28.5 -6% |
| Idle Minimum * (dB) | 27.1 | 28.8 -6% | 29.3 -8% | 29 -7% | 28.5 -5% | 28.5 -5% |
| Idle Average * (dB) | 27.1 | 28.8 -6% | 29.3 -8% | 29 -7% | 28.5 -5% | 28.5 -5% |
| Idle Maximum * (dB) | 27.1 | 32.2 -19% | 29.3 -8% | 29 -7% | 28.5 -5% | 28.5 -5% |
| Load Average * (dB) | 31.4 | 32.2 -3% | 30.7 2% | 30.1 4% | 32 -2% | 28.5 9% |
| Load Maximum * (dB) | 39 | 34.4 12% | 34 13% | 41.3 -6% | 38 3% | 40.4 -4% |
| Witcher 3 ultra * (dB) | 40.4 |
* ... smaller is better
Noise level
| Idle |
| 27.1 / 27.1 / 27.1 dB(A) |
| Load |
| 31.4 / 39 dB(A) |
 | ||
30 dB silent 40 dB(A) audible 50 dB(A) loud |
||
min: | ||
Temperature
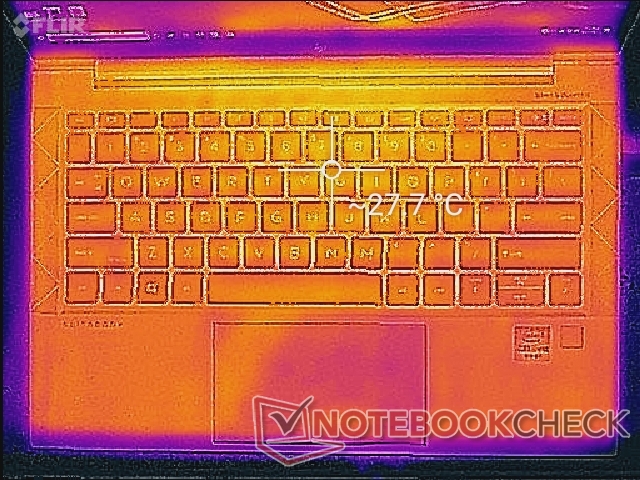
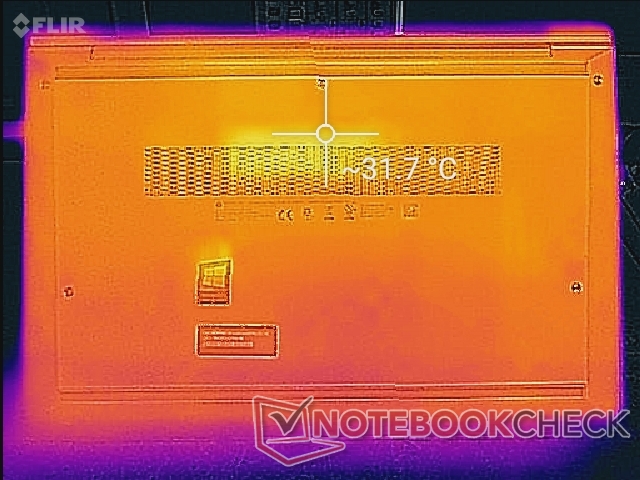
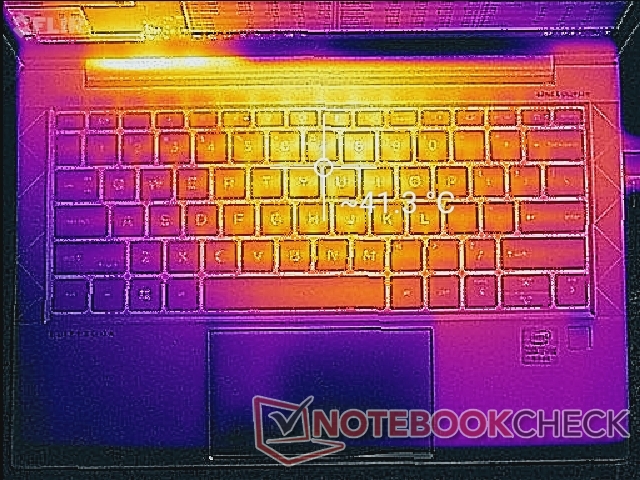
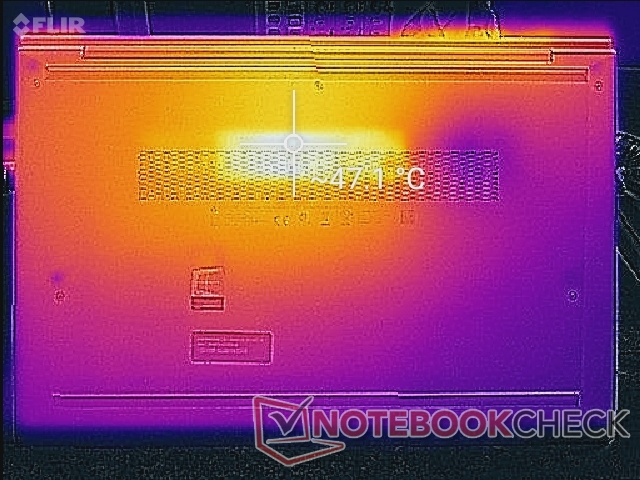
Surface temperature is largely symmetrical with hot spots near the keyboard center as shown by our temperature maps below. This symmetrical development is in contrast to the Latitude 7310 or ThinkPad X13 where one half will always feel warmer than the other. Be sure to not cover the ventilation grilles on the bottom of the system where it can reach 47 C or higher when running demanding loads.
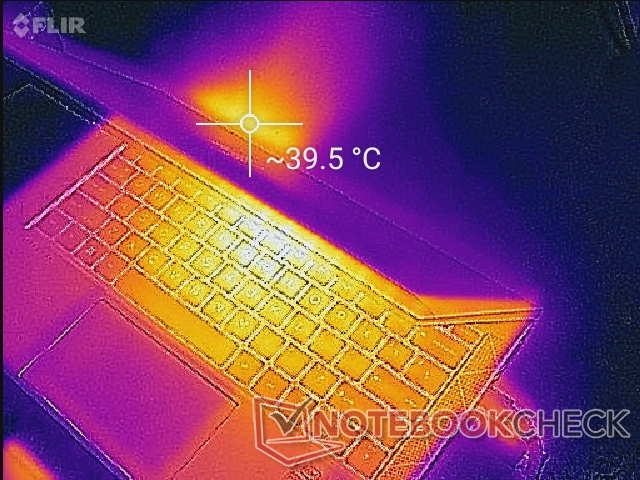
(±) The maximum temperature on the upper side is 41 °C / 106 F, compared to the average of 35.9 °C / 97 F, ranging from 21.4 to 59 °C for the class Subnotebook.
(-) The bottom heats up to a maximum of 47.2 °C / 117 F, compared to the average of 39.2 °C / 103 F
(+) In idle usage, the average temperature for the upper side is 27.4 °C / 81 F, compared to the device average of 30.8 °C / 87 F.
(+) The palmrests and touchpad are cooler than skin temperature with a maximum of 31.6 °C / 88.9 F and are therefore cool to the touch.
(-) The average temperature of the palmrest area of similar devices was 28.2 °C / 82.8 F (-3.4 °C / -6.1 F).
Stress Test
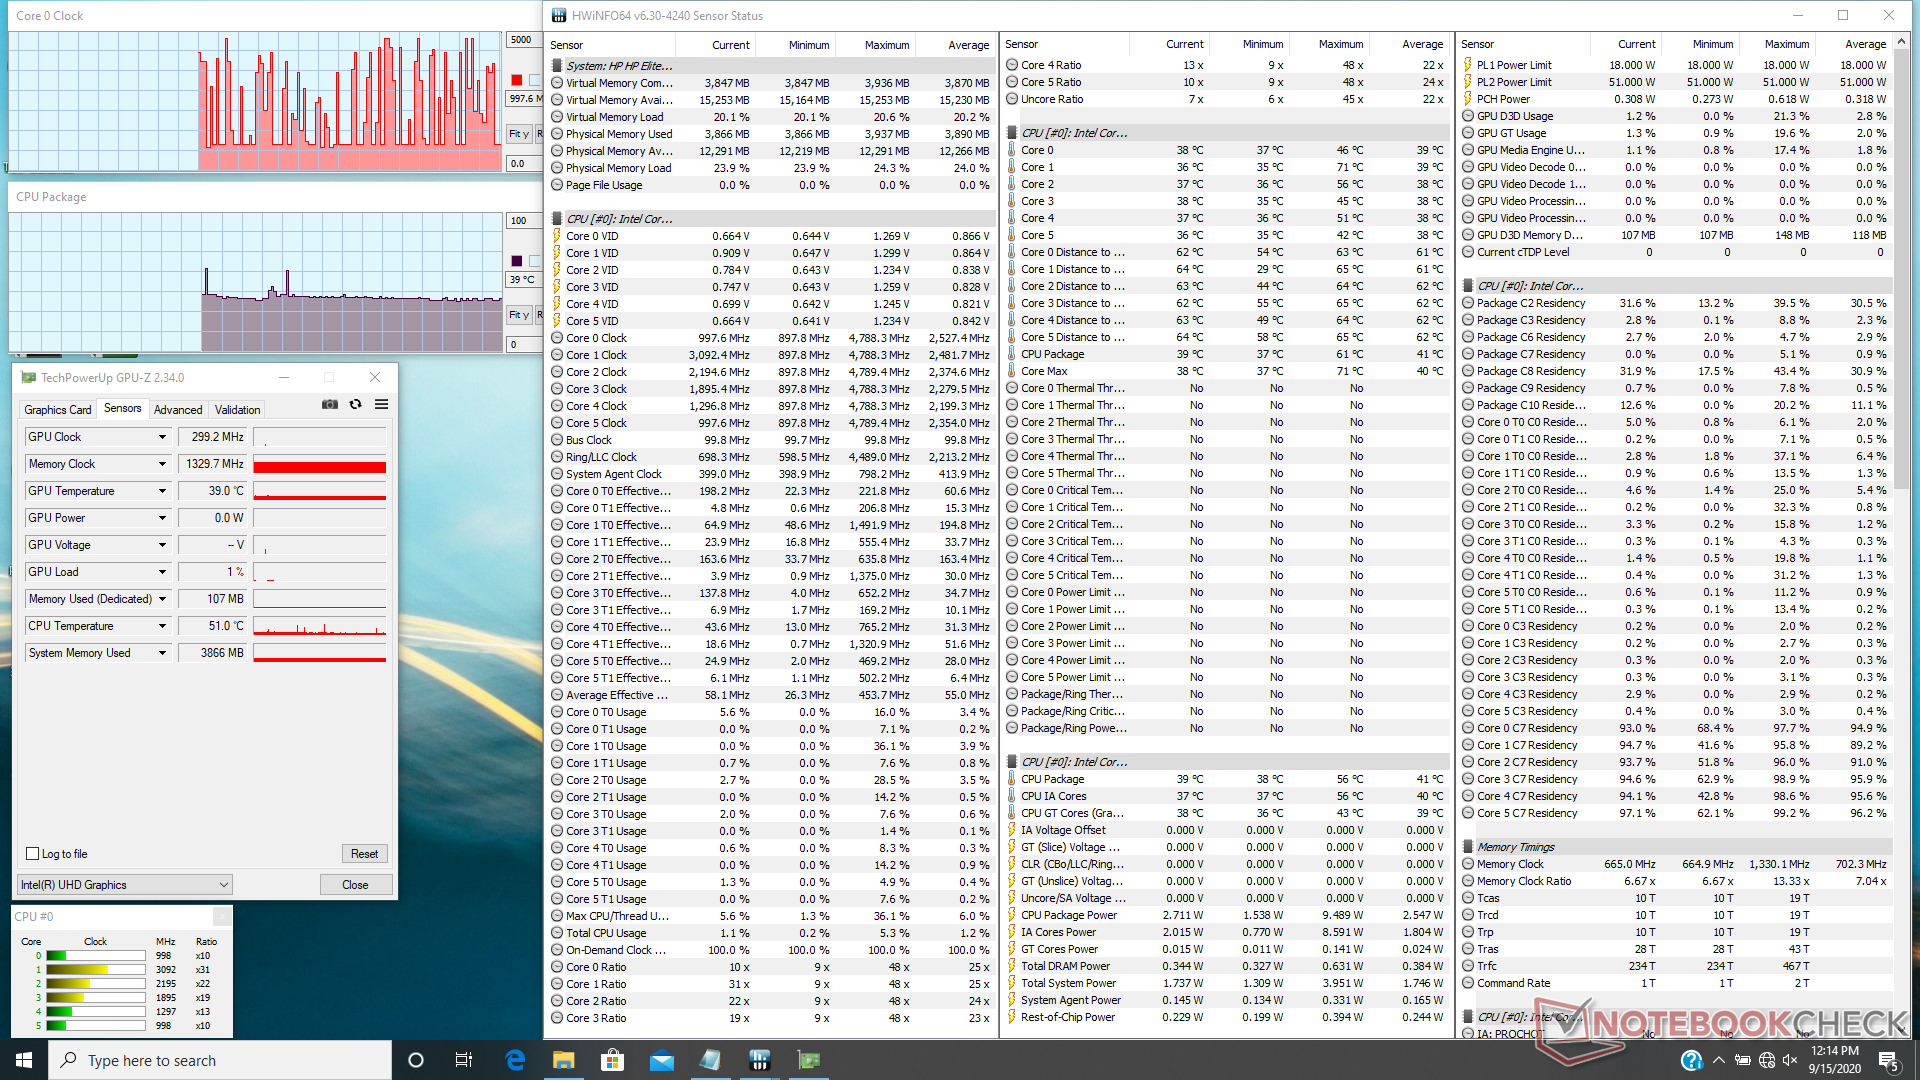
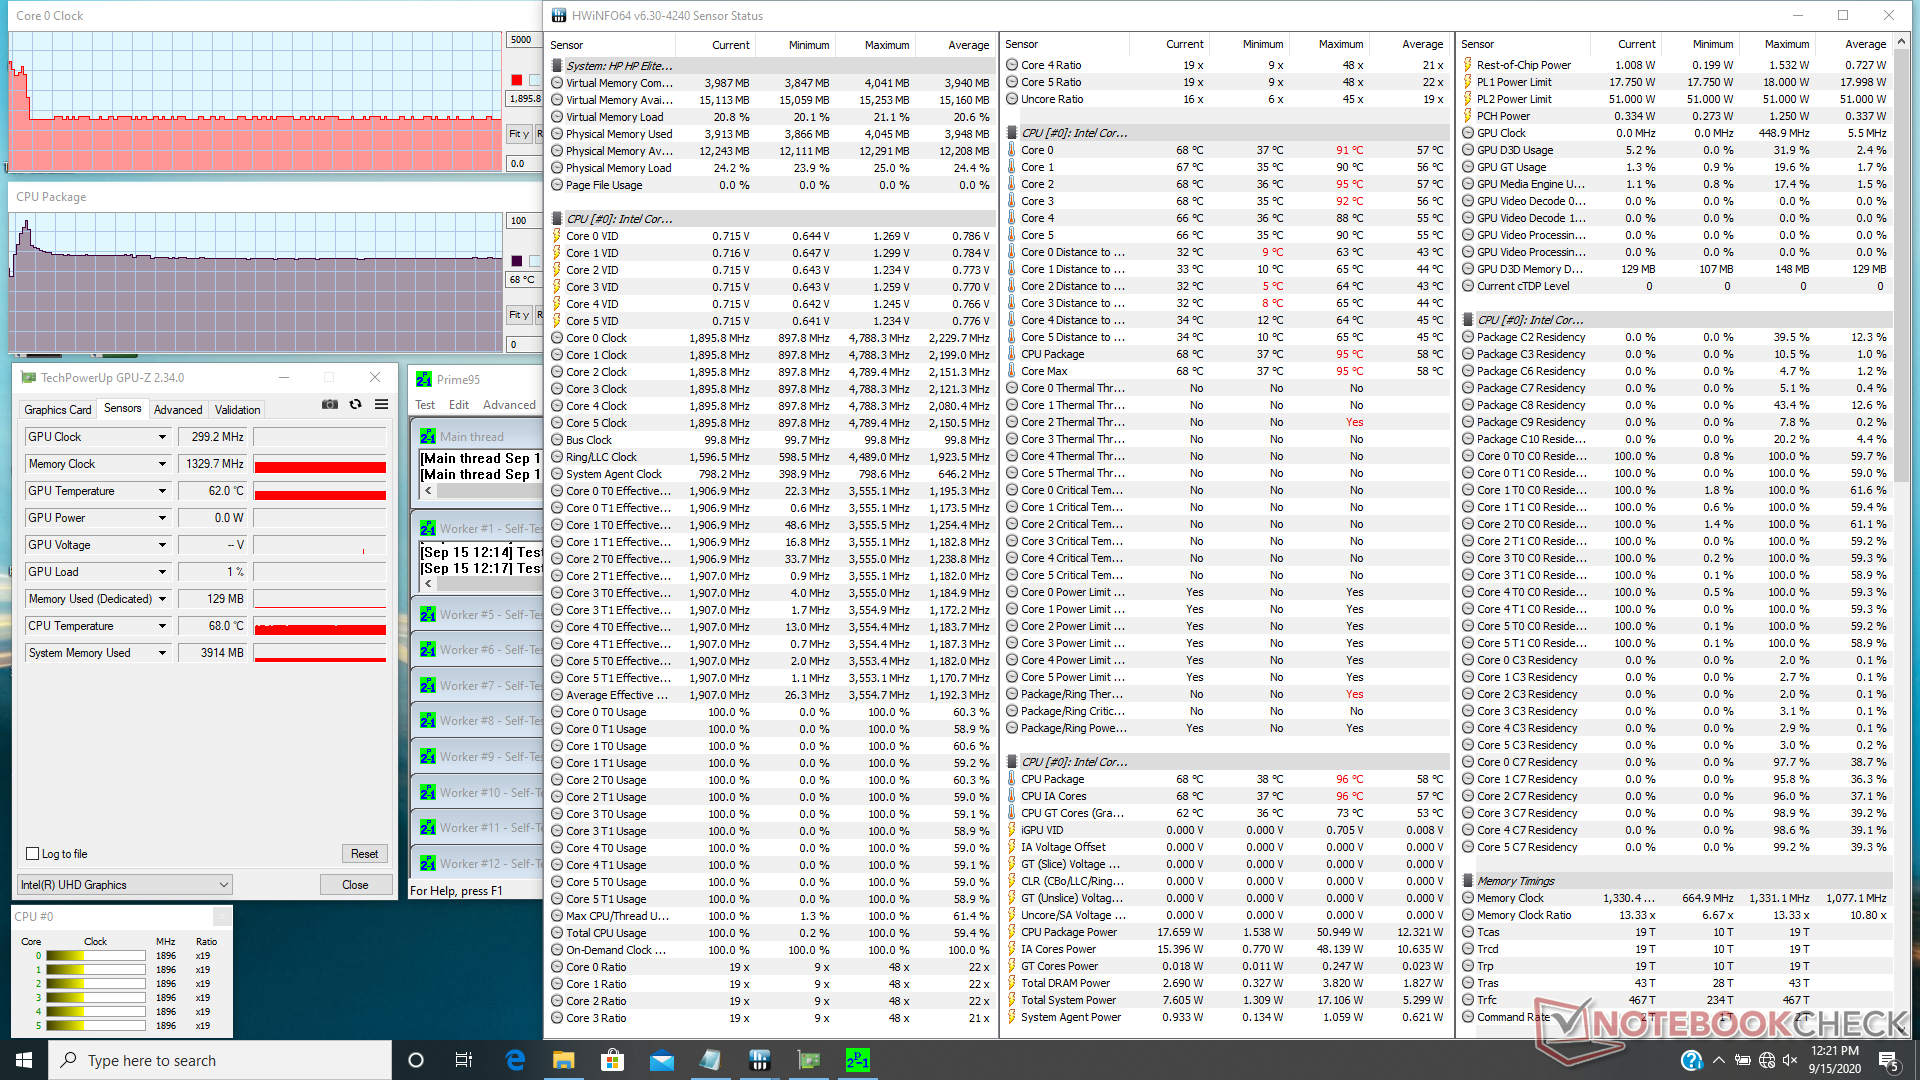
We stress the laptop to identify for any stability issues and observe clock rate behavior. When running Prime95, the CPU can be seen boosting to the 3.5 to 3.7 GHz range for only a few seconds until hitting a core temperature of 95 C. Once this ceiling is reached, clock rates would drop to just 1.9 to 2 GHz in order to maintain a cooler core temperature of 68 C. This steep dip in CPU performance matches our CineBench R15 loop test and power consumption observations.
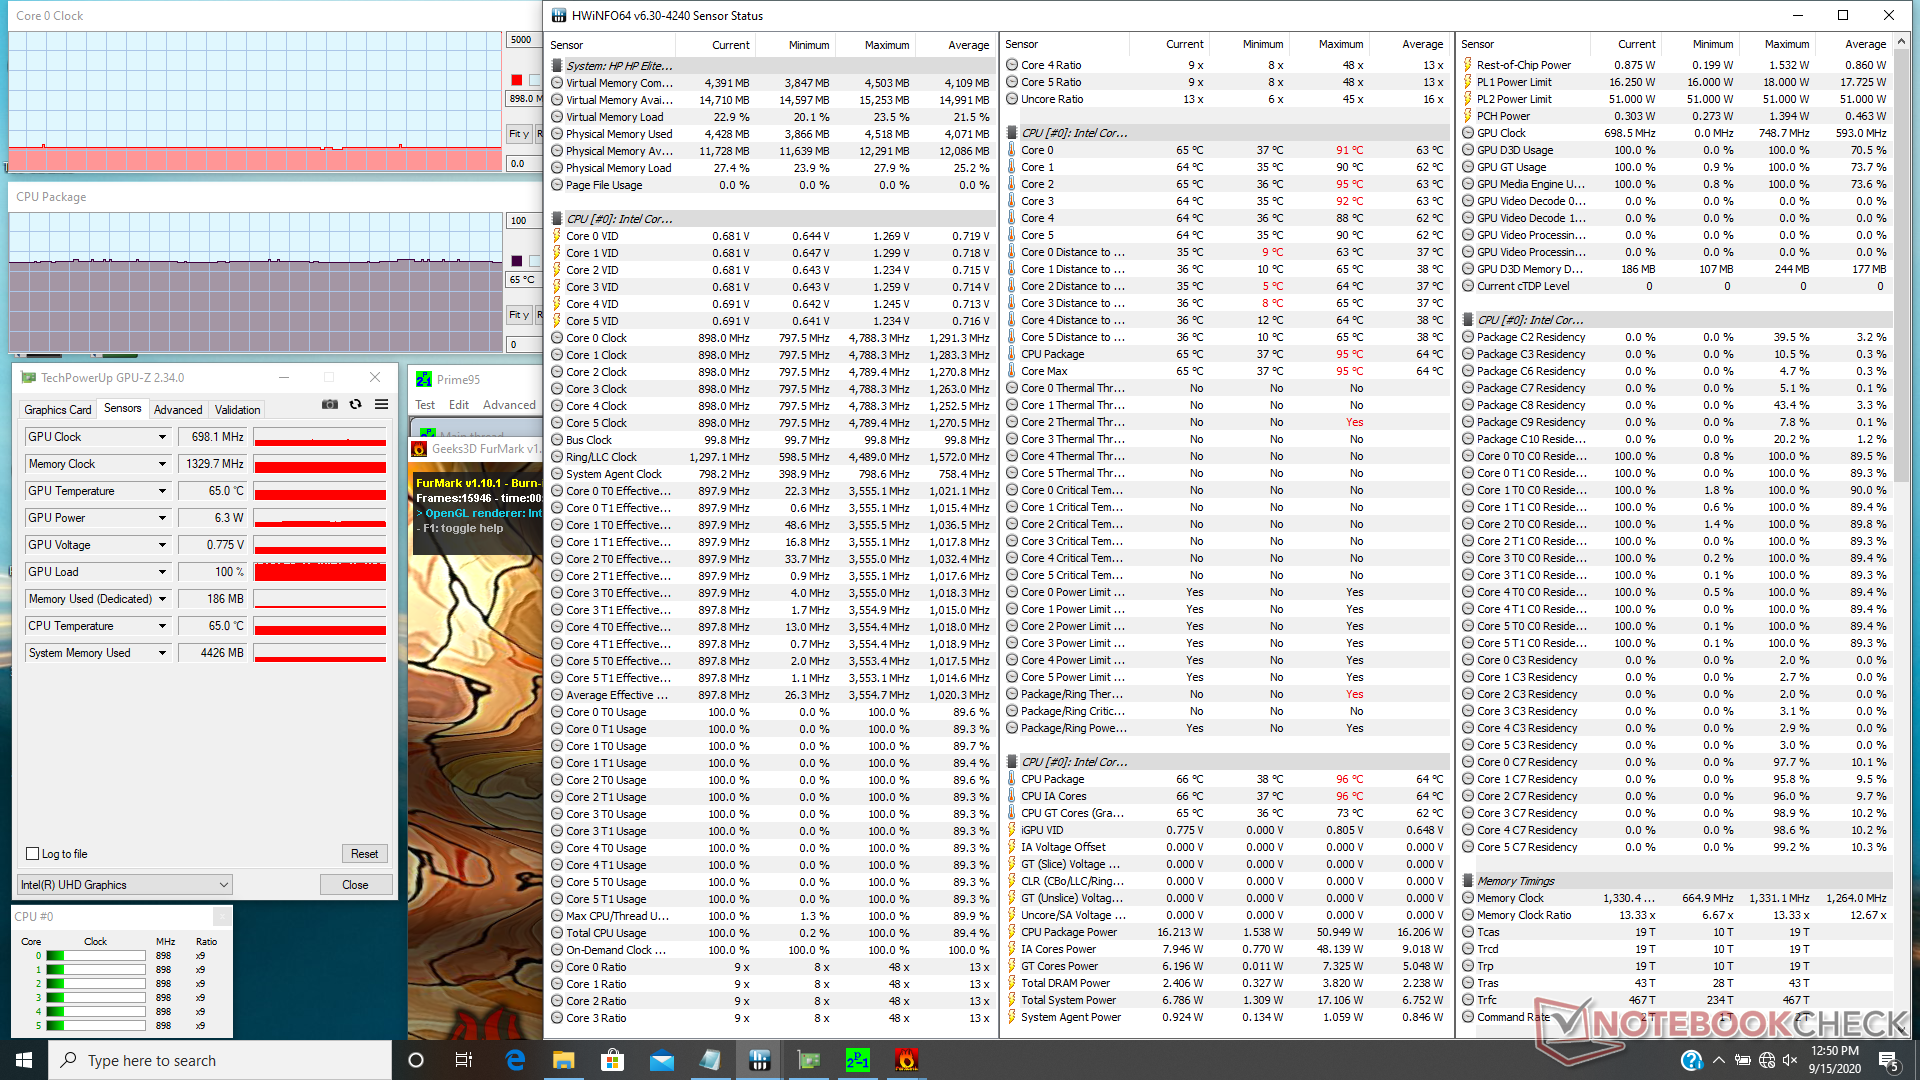
If running Prime95 and FurMark simultaneously, CPU and GPU clock rates throttle to just 900 MHz and 700 MHz, respectively.
Running on battery power will not limit performance. A 3DMark 11 test on batteries would return nearly the same Physics and Graphics scores.
| CPU Clock (GHz) | GPU Clock (MHz) | Average CPU Temperature (°C) | |
| System Idle | -- | -- | 39 |
| Prime95 Stress | 1.9 - 2.0 | -- | 68 |
| Prime95 + FurMark Stress | 0.9 | 698 | 65 |
Speakers

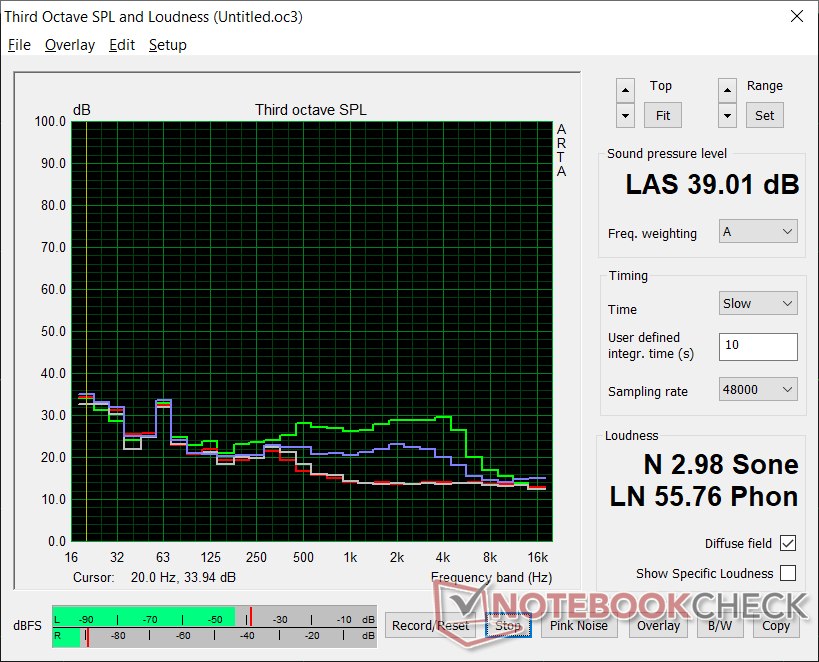
HP EliteBook 830 G7 audio analysis
(±) | speaker loudness is average but good (80.4 dB)
Bass 100 - 315 Hz
(±) | reduced bass - on average 14.5% lower than median
(±) | linearity of bass is average (12.9% delta to prev. frequency)
Mids 400 - 2000 Hz
(+) | balanced mids - only 1.6% away from median
(+) | mids are linear (2.5% delta to prev. frequency)
Highs 2 - 16 kHz
(+) | balanced highs - only 4.2% away from median
(+) | highs are linear (4.2% delta to prev. frequency)
Overall 100 - 16.000 Hz
(+) | overall sound is linear (14% difference to median)
Compared to same class
» 26% of all tested devices in this class were better, 6% similar, 68% worse
» The best had a delta of 5%, average was 18%, worst was 53%
Compared to all devices tested
» 16% of all tested devices were better, 4% similar, 80% worse
» The best had a delta of 4%, average was 23%, worst was 134%
Apple MacBook 12 (Early 2016) 1.1 GHz audio analysis
(+) | speakers can play relatively loud (83.6 dB)
Bass 100 - 315 Hz
(±) | reduced bass - on average 11.3% lower than median
(±) | linearity of bass is average (14.2% delta to prev. frequency)
Mids 400 - 2000 Hz
(+) | balanced mids - only 2.4% away from median
(+) | mids are linear (5.5% delta to prev. frequency)
Highs 2 - 16 kHz
(+) | balanced highs - only 2% away from median
(+) | highs are linear (4.5% delta to prev. frequency)
Overall 100 - 16.000 Hz
(+) | overall sound is linear (10.2% difference to median)
Compared to same class
» 7% of all tested devices in this class were better, 2% similar, 90% worse
» The best had a delta of 5%, average was 18%, worst was 53%
Compared to all devices tested
» 5% of all tested devices were better, 1% similar, 94% worse
» The best had a delta of 4%, average was 23%, worst was 134%
Energy Management
Power Consumption
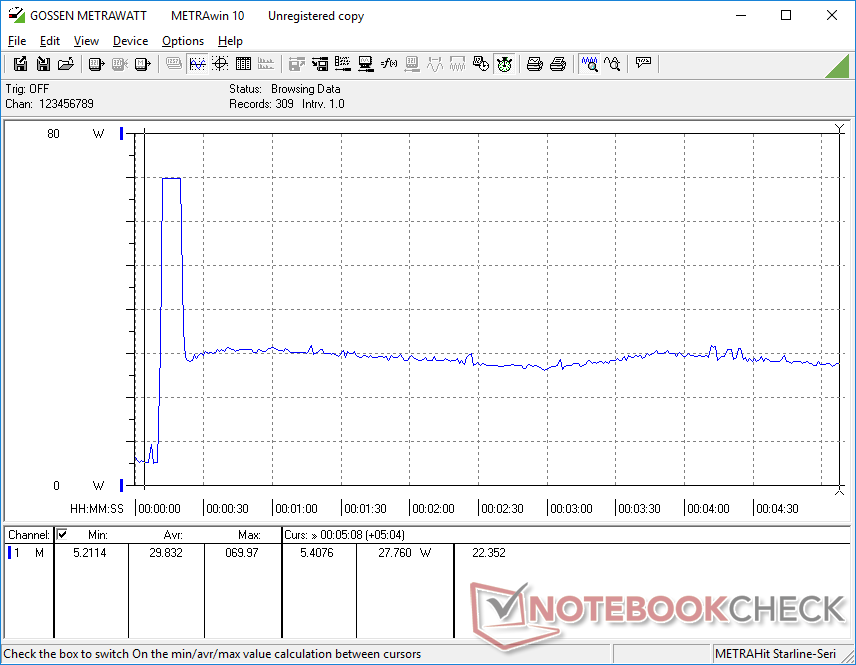
Power consumption is similar to what we observed on the ThinkPad X13 and Latitude 7310. Idling on desktop demands between 3 W and 6 W depending on the power profile and brightness setting which is excellent for a 400-nit display.
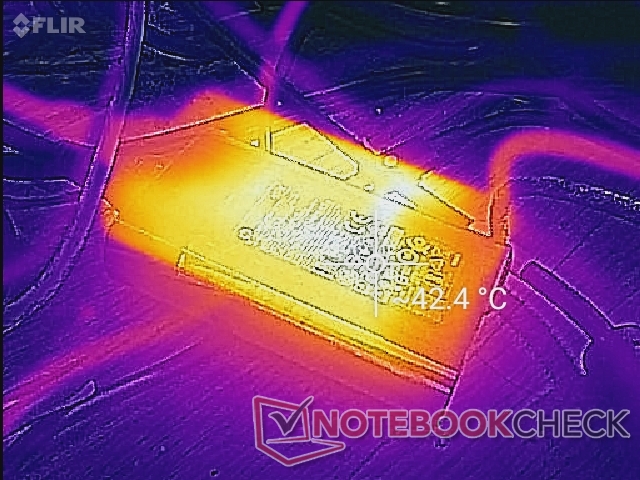
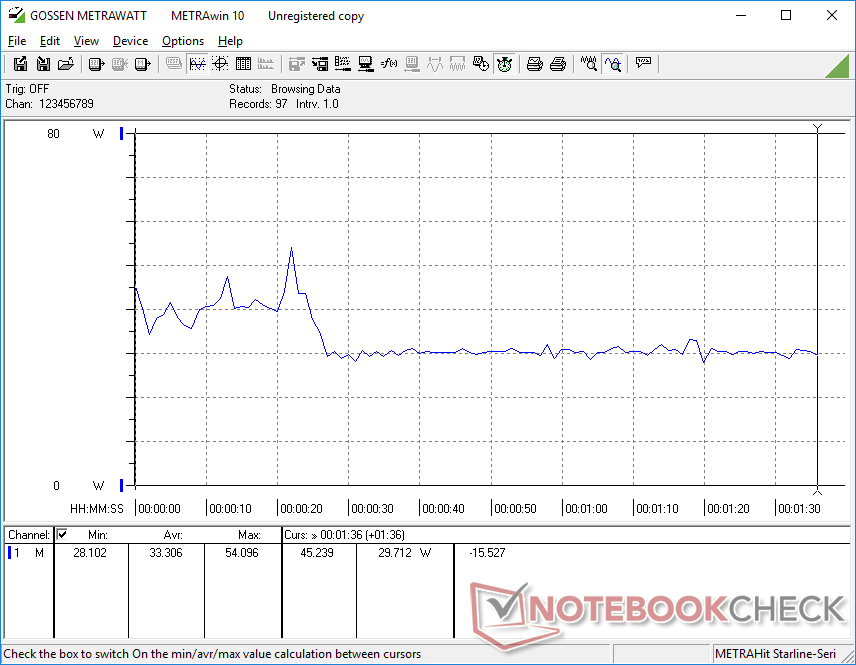
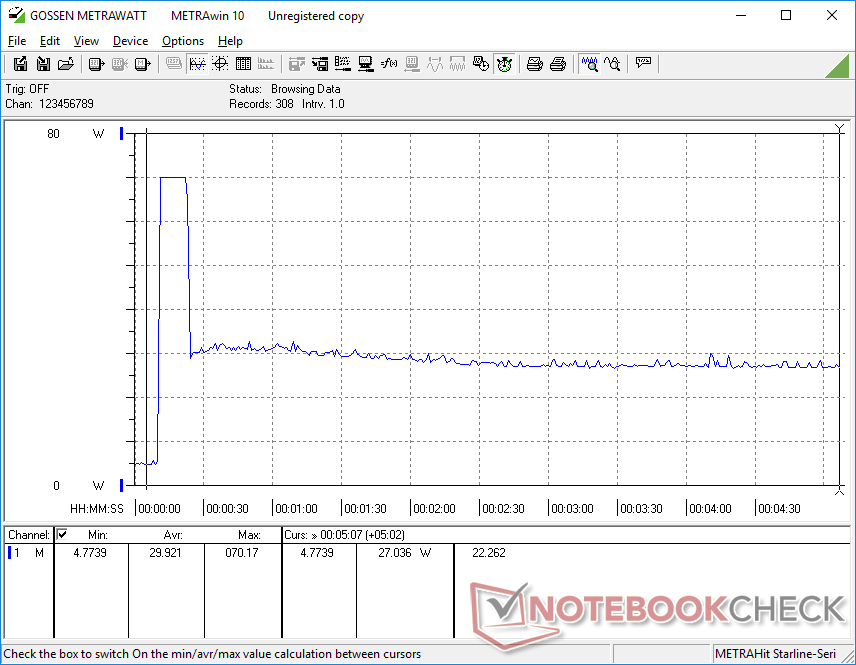
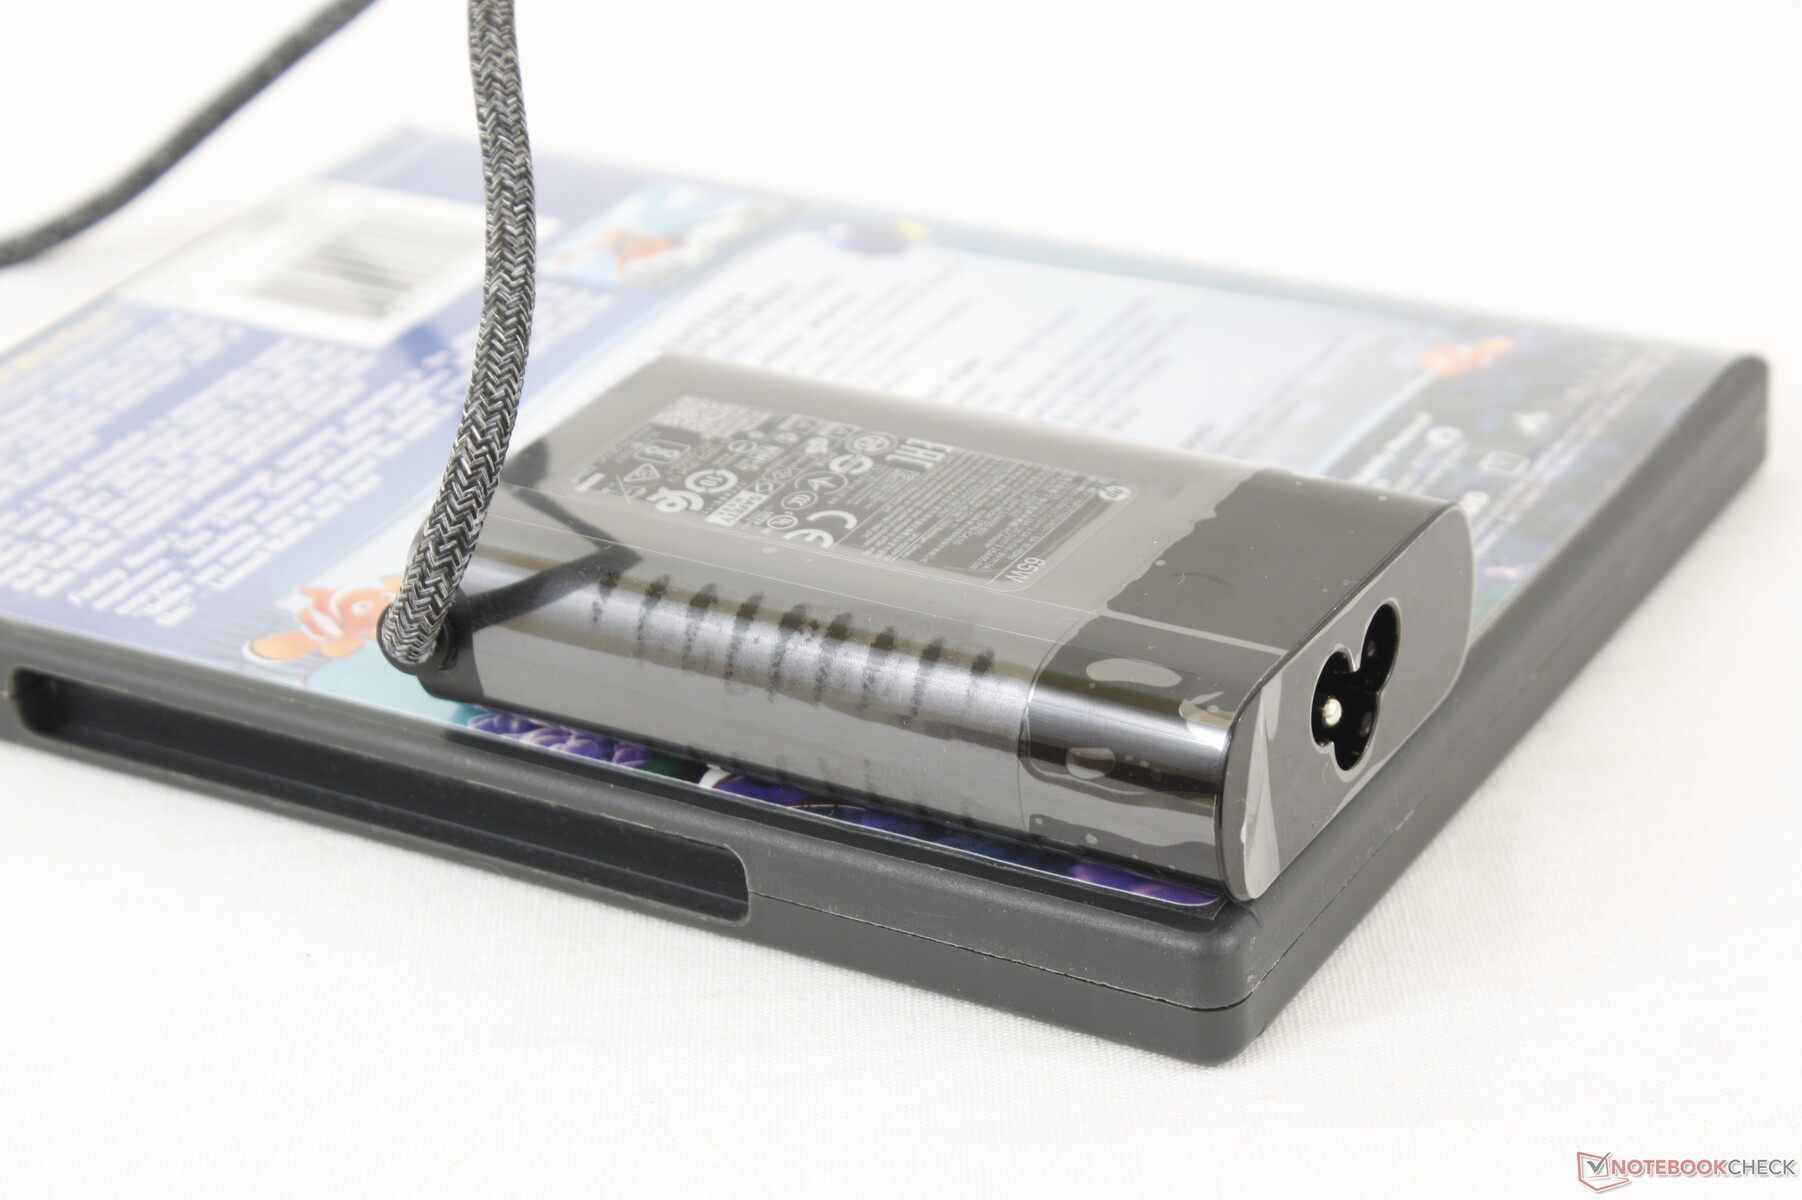
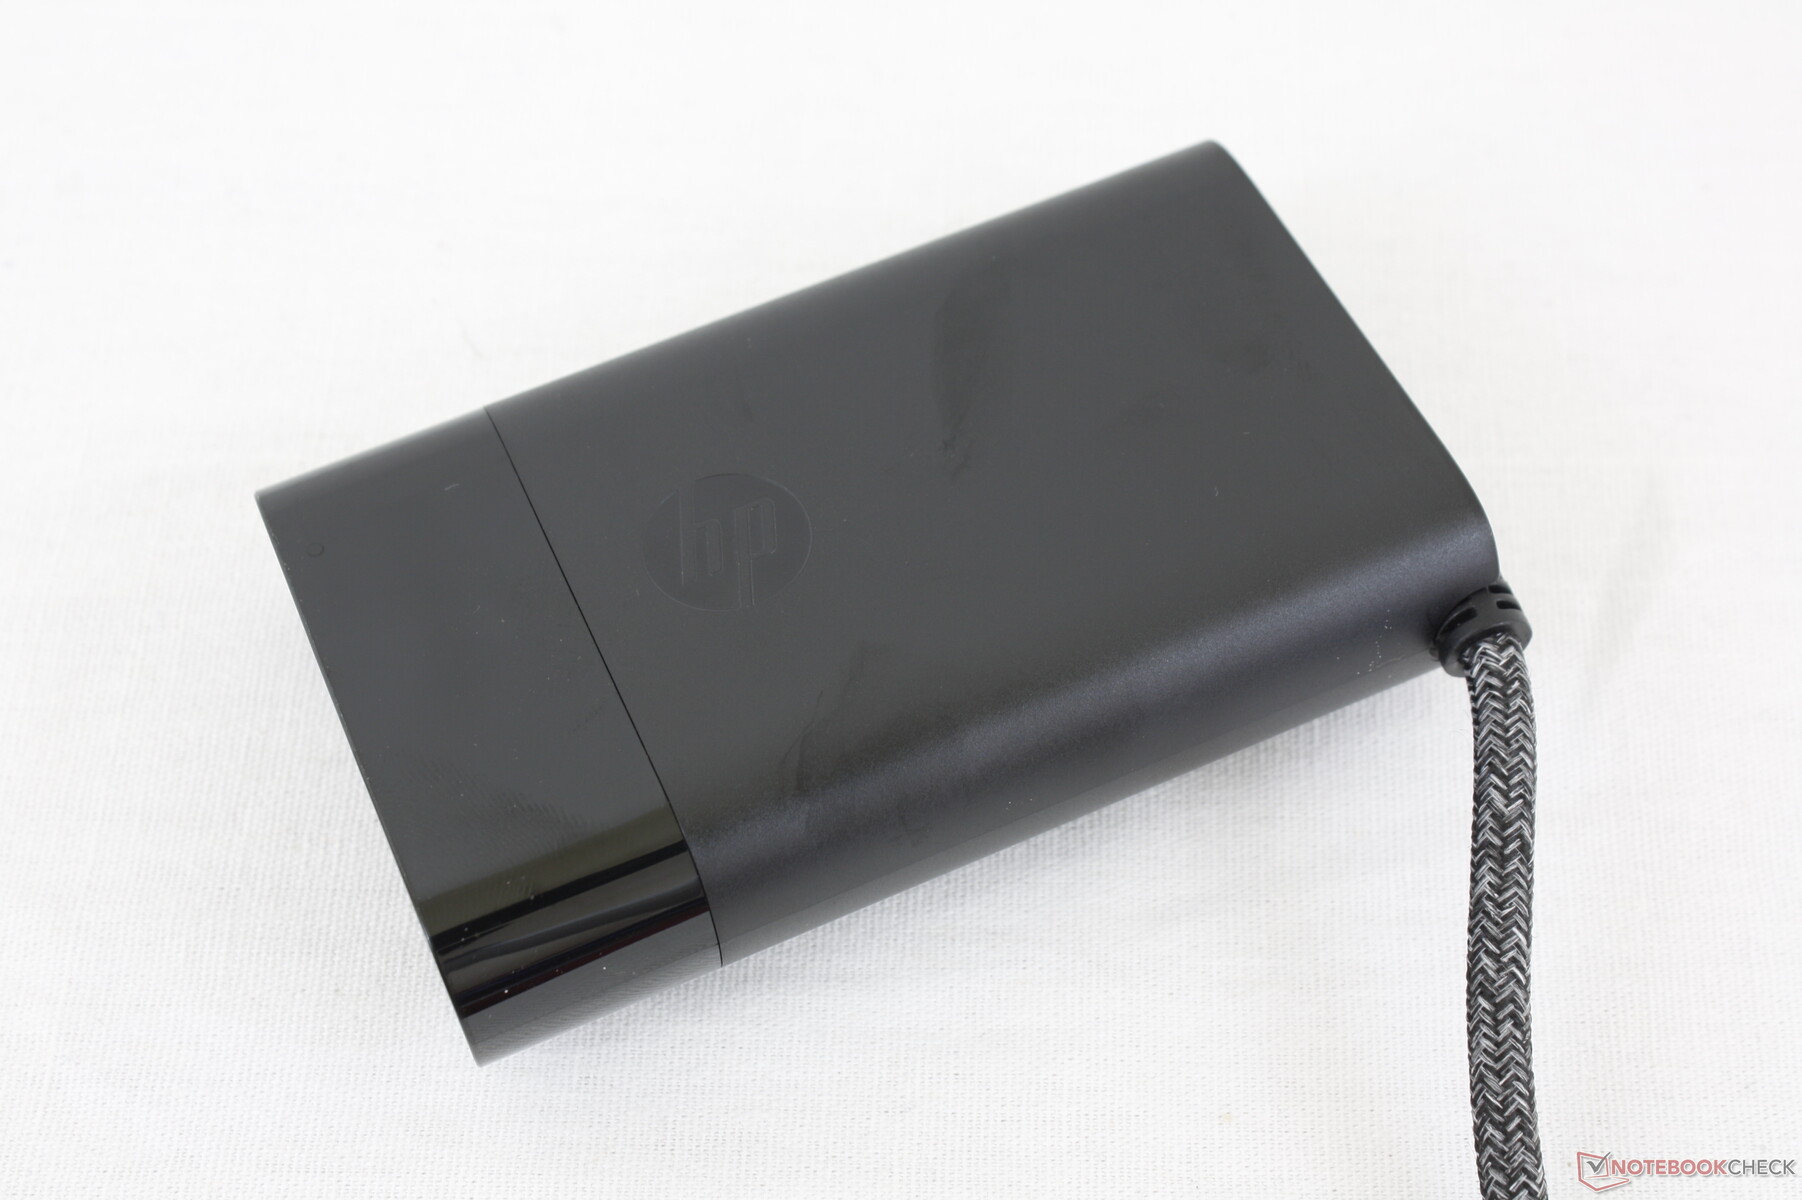
We're able to record a maximum draw of 70 W from the small 65 W (~8.8 x 6 x 2.1 cm) AC adapter when running Prime95. This rate is only temporary as shown by our graphs below which line up with the limited Turbo Boost potential as detailed in our stress test section above.
| Off / Standby | |
| Idle | |
| Load |
|
Key:
min: | |
| HP EliteBook 830 G7 i7-10810U, UHD Graphics 620, Samsung SSD PM981a MZVLB512HBJQ, IPS, 1920x1080, 13.3" | HP EliteBook x360 830 G6 i7-8565U, UHD Graphics 620, WDC PC SN720 SDAPNTW-1T00, IPS LED, 1920x1080, 13.3" | Lenovo ThinkPad X13-20T20033GE i5-10210U, UHD Graphics 620, Samsung SSD PM981a MZVLB512HBJQ, IPS, 1920x1080, 13.3" | Dell Latitude 7310 i7-10610U, UHD Graphics 620, Samsung SSD PM981a MZVLB512HBJQ, IPS, 1920x1080, 13.3" | Dynabook Portege X30L-G1331 i5-10210U, UHD Graphics 620, Samsung SSD PM981a MZVLB512HBJQ, IPS, 1920x1080, 13.3" | Microsoft Surface Laptop 3 13 Core i5-1035G7 i5-1035G7, Iris Plus Graphics G7 (Ice Lake 64 EU), SK hynix BC501 HFM256GDGTNG, IPS, 2256x1504, 13.5" | |
|---|---|---|---|---|---|---|
| Power Consumption | -40% | -11% | 7% | -5% | -30% | |
| Idle Minimum * (Watt) | 3.6 | 4.4 -22% | 2.9 19% | 2.7 25% | 2.8 22% | 4.4 -22% |
| Idle Average * (Watt) | 4.7 | 8 -70% | 5.6 -19% | 4.4 6% | 4.9 -4% | 7.5 -60% |
| Idle Maximum * (Watt) | 5.1 | 10.6 -108% | 8.9 -75% | 4.8 6% | 9 -76% | 7.8 -53% |
| Load Average * (Watt) | 33.3 | 34.6 -4% | 30.1 10% | 33.4 -0% | 31.2 6% | 41.9 -26% |
| Load Maximum * (Watt) | 70 | 68.2 3% | 61.3 12% | 69.7 -0% | 49.4 29% | 63.9 9% |
| Witcher 3 ultra * (Watt) | 40.8 |
* ... smaller is better
Battery Life
The 53 Wh battery capacity hasn't changed from last year's EliteBook 830 G6. Nonetheless, runtimes are slightly longer this time at about 11.5 hours compared to 10 hours on the older model when running our WLAN test.
Charging from empty to full capacity takes just under 1.5 hours. We appreciate that the AC adapter cable is braided for a higher quality feel unlike on most other chargers.
| HP EliteBook 830 G7 i7-10810U, UHD Graphics 620, 53 Wh | HP EliteBook x360 830 G6 i7-8565U, UHD Graphics 620, 53 Wh | Lenovo ThinkPad X13-20T20033GE i5-10210U, UHD Graphics 620, 48 Wh | Dell Latitude 7310 i7-10610U, UHD Graphics 620, 52 Wh | Dynabook Portege X30L-G1331 i5-10210U, UHD Graphics 620, 42 Wh | Microsoft Surface Laptop 3 13 Core i5-1035G7 i5-1035G7, Iris Plus Graphics G7 (Ice Lake 64 EU), 45 Wh | |
|---|---|---|---|---|---|---|
| Battery runtime | -25% | -23% | -11% | -28% | -26% | |
| Reader / Idle (h) | 34.6 | 37.4 8% | 34.4 -1% | |||
| WiFi v1.3 (h) | 11.5 | 9.8 -15% | 9.3 -19% | 12.6 10% | 8.3 -28% | 8.3 -28% |
| Load (h) | 3.7 | 2.4 -35% | 2.7 -27% | 1.8 -51% | 1.9 -49% |
Pros
Cons
Verdict
There weren't enough compelling reasons to upgrade from the EliteBook 830 G5 to the 830 G6, but the latest 830 G7 represents a significant jump in chassis design and portability to be a much easier recommendation over any of its predecessors. Its comfortable keyboard, super-bright display options, and user-upgradeable RAM/WLAN/SSD are not usually available on competing systems of this size category including the ThinkPad X13 or Latitude 7310.
While we love what's here, we're also disappointing to see some features omitted. TrackPoint, mouse buttons, SD card reader, Iris/GeForce MX graphics, fingerprint/power button hybrid, and proximity sensor are all not available no matter what configuration you choose. CPU performance continues to be below average which, while understandable for a subnotebook, will not be ideal for users who might have wanted to exploit the full potential of the processor.
The HP EliteBook 830 G7 is a mid-range business subnotebook that feels like a higher-end product. It's missing a few staple features common on traditional business laptops, but it makes up for the omissions with its rigid build, serviceability, bright screen, and excellent typing experience.
HP EliteBook 830 G7
- 09/19/2020 v7 (old)
Allen Ngo
Price comparison
