Dynabook Portege X30L-G Laptop Review: A New Lightweight Benchmark
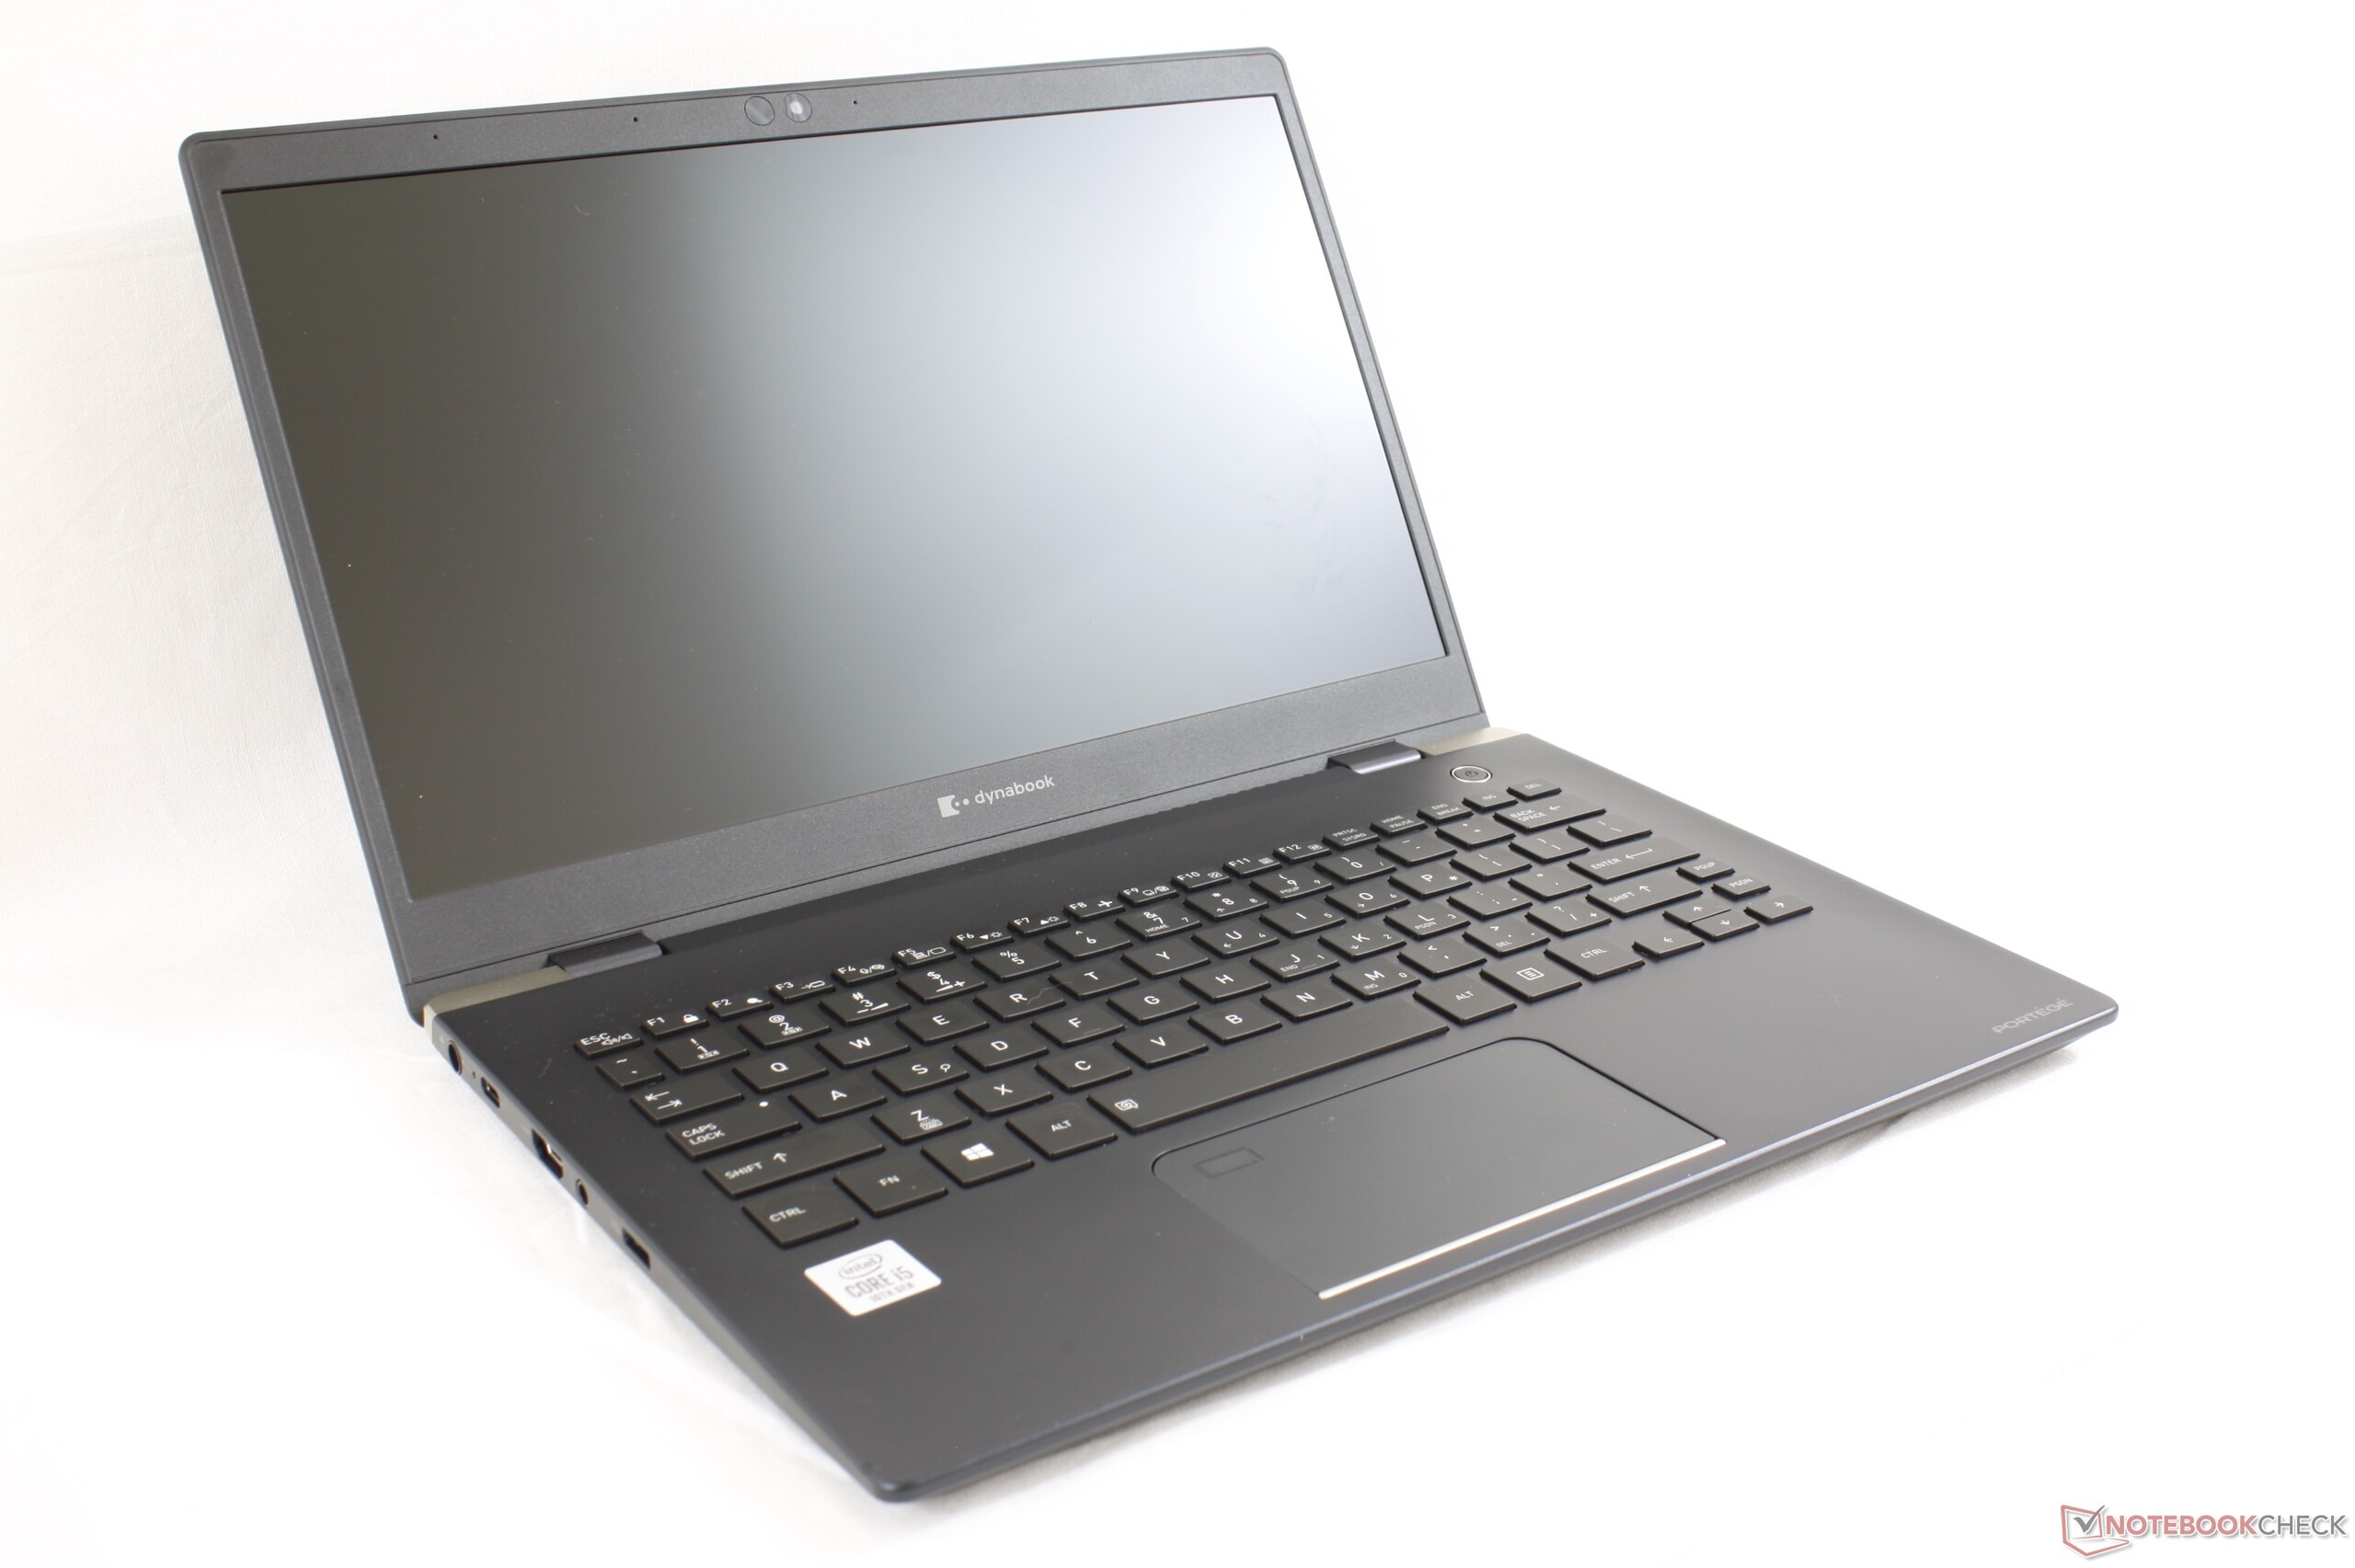
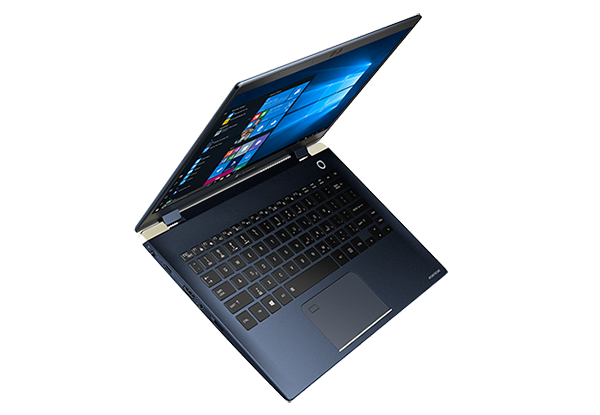
Unveiled at CES 2020, the Dynabook Portege X30L-G is the crown subnotebook model in the manufacturer's lineup of business-centric laptops. The model prioritizes weight more strongly than other competitors as evidenced by its very low weight of just 870 g.
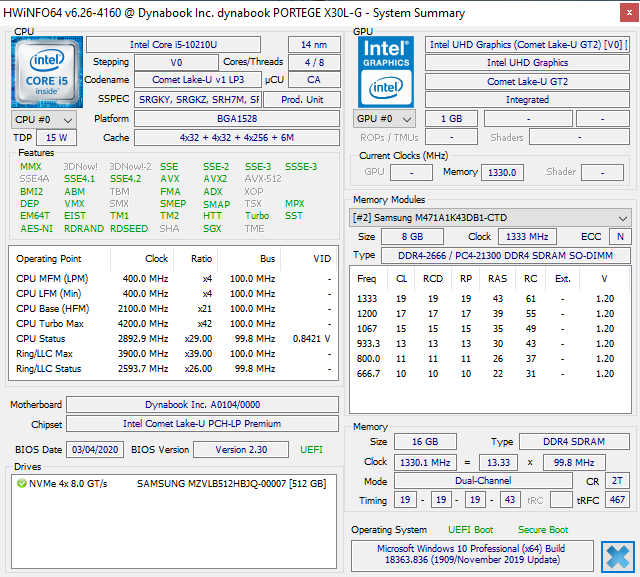
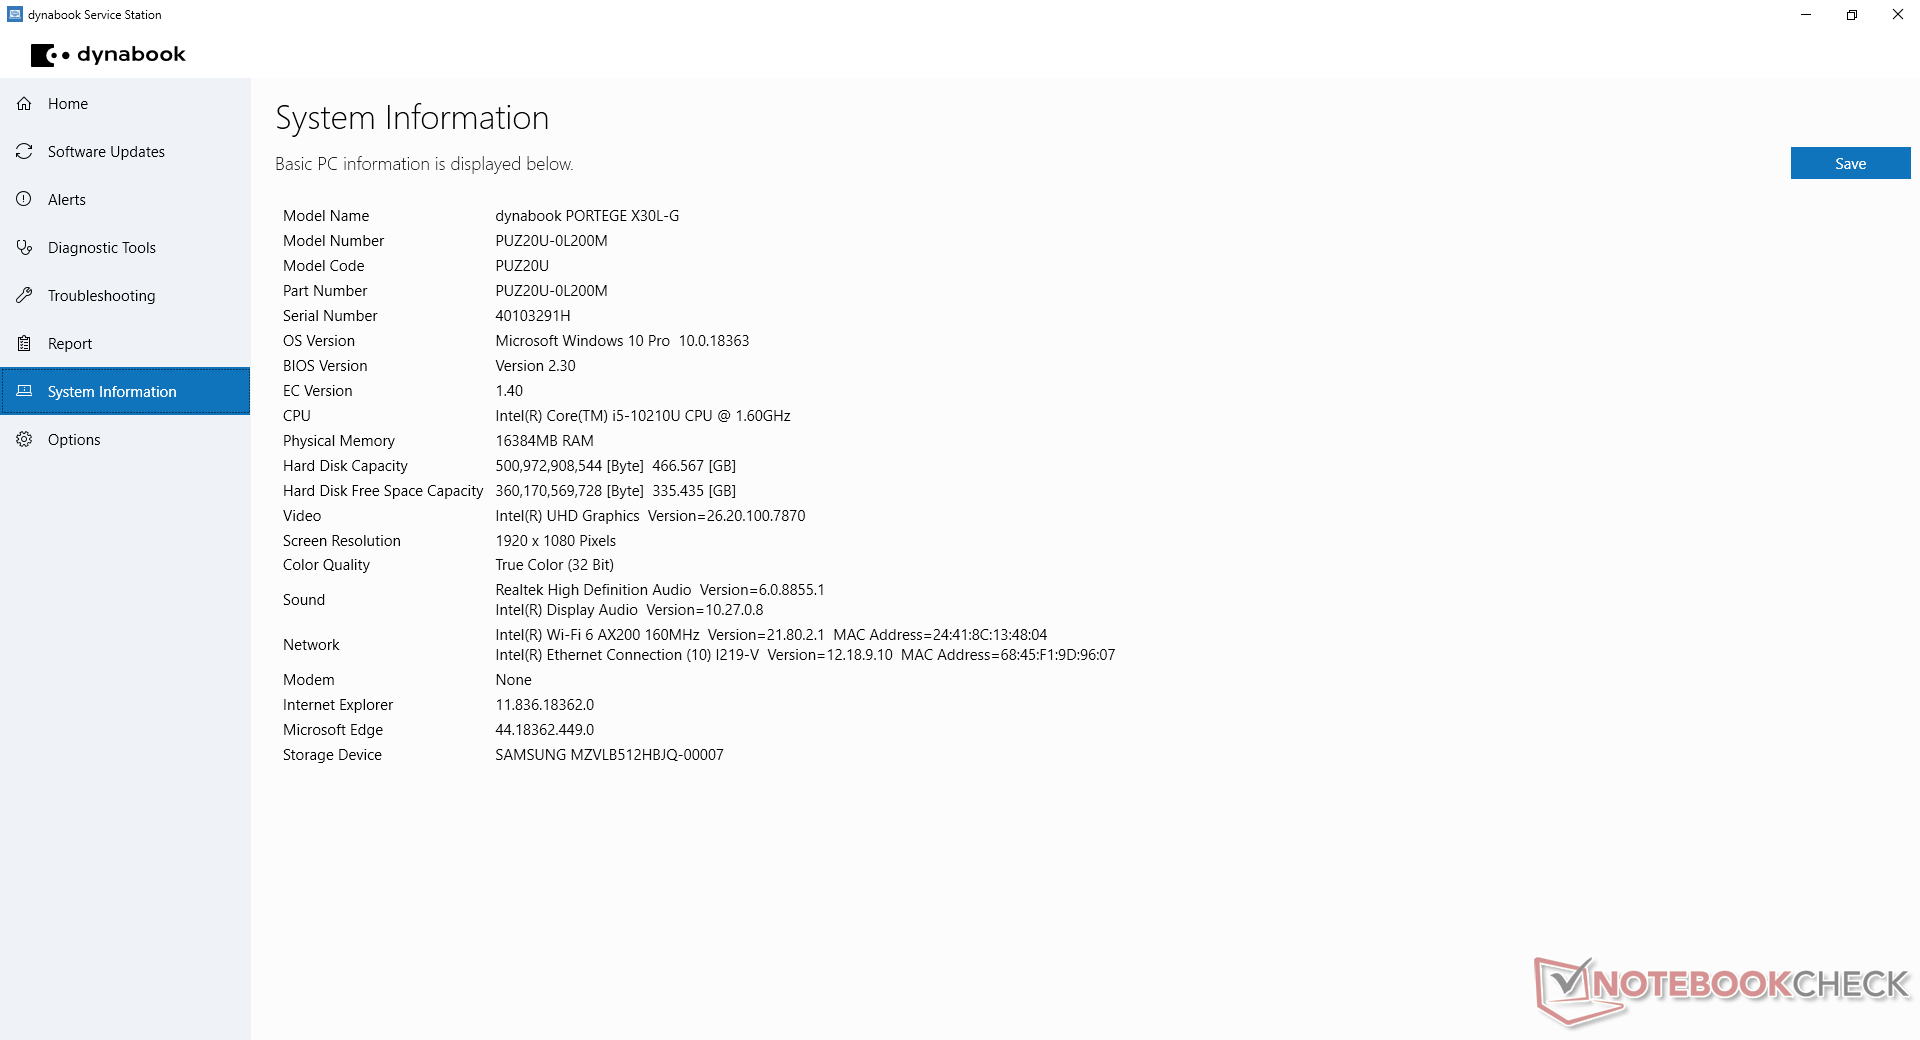
The configuration for this review comes equipped with the Core i5-10210U Comet Lake-U CPU, 16 GB of RAM, and a 512 GB PCIe NVMe SSD for approximately $1400 USD. Other SKUs may be available with varying storage capacities and a Core i7 CPU, but the matte 1080p resolution and integrated UHD Graphics 620 GPU remain fixed the same across the board.
Direct competitors to the Dynabook Portege X30L-G include other flagship subnotebooks catered to business users like the Microsoft Surface Laptop 3 13.5, HP EliteBook 1030 series, Lenovo ThinkBook 13 or the ThinkPad X series, and even the Dell XPS 13 and MacBook Pro 13 to a degree.
More Dynabook reviews:
Rating | Date | Model | Weight | Height | Size | Resolution | Price |
|---|---|---|---|---|---|---|---|
| 85.1 % v7 (old) | 05 / 2020 | Dynabook Portege X30L-G1331 i5-10210U, UHD Graphics 620 | 859 g | 17.9 mm | 13.30" | 1920x1080 | |
| 88.9 % v7 (old) | 03 / 2020 | Dell XPS 13 9300 Core i7-1065G7 i7-1065G7, Iris Plus Graphics G7 (Ice Lake 64 EU) | 1.2 kg | 14.8 mm | 13.40" | 1920x1200 | |
| 81.9 % v6 (old) | 04 / 2018 | LG Gram 13Z980-A i5-8250U, UHD Graphics 620 | 965 g | 15 mm | 13.30" | 1920x1080 | |
| 86 % v7 (old) | 07 / 2019 | Lenovo ThinkBook 13s-20R90071GE i5-8265U, UHD Graphics 620 | 1.3 kg | 15.9 mm | 13.30" | 1920x1080 | |
| 88.2 % v6 (old) | 05 / 2018 | HP EliteBook 830 G5-3JX74EA i5-8550U, UHD Graphics 620 | 1.3 kg | 17.7 mm | 13.30" | 1920x1080 |
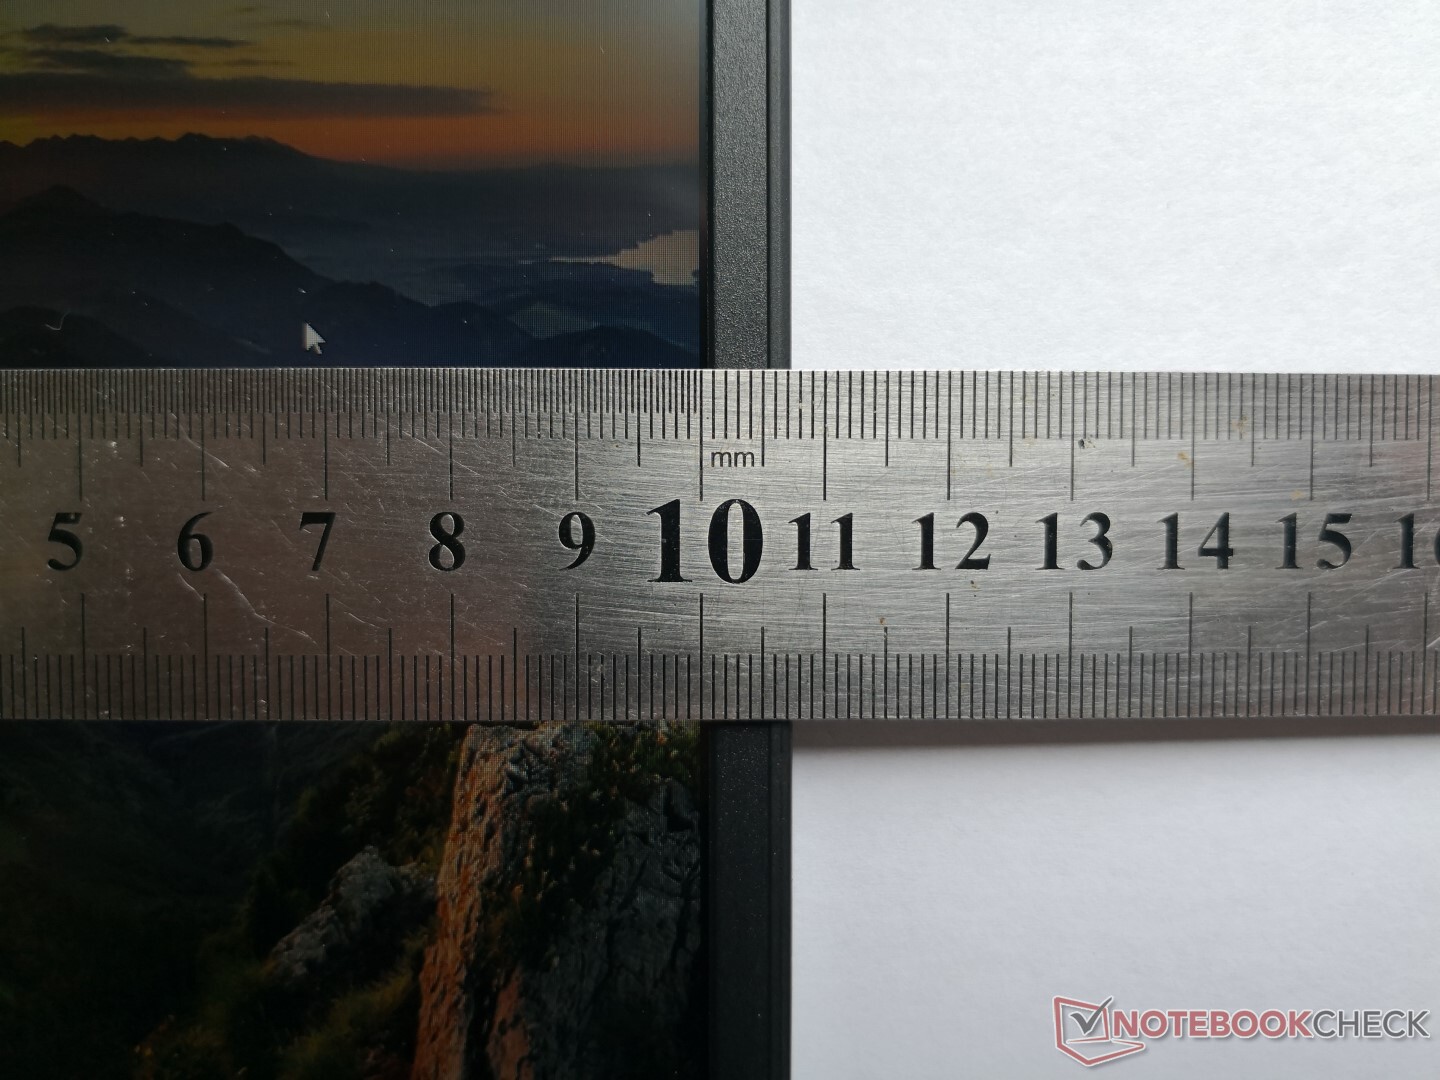
Case
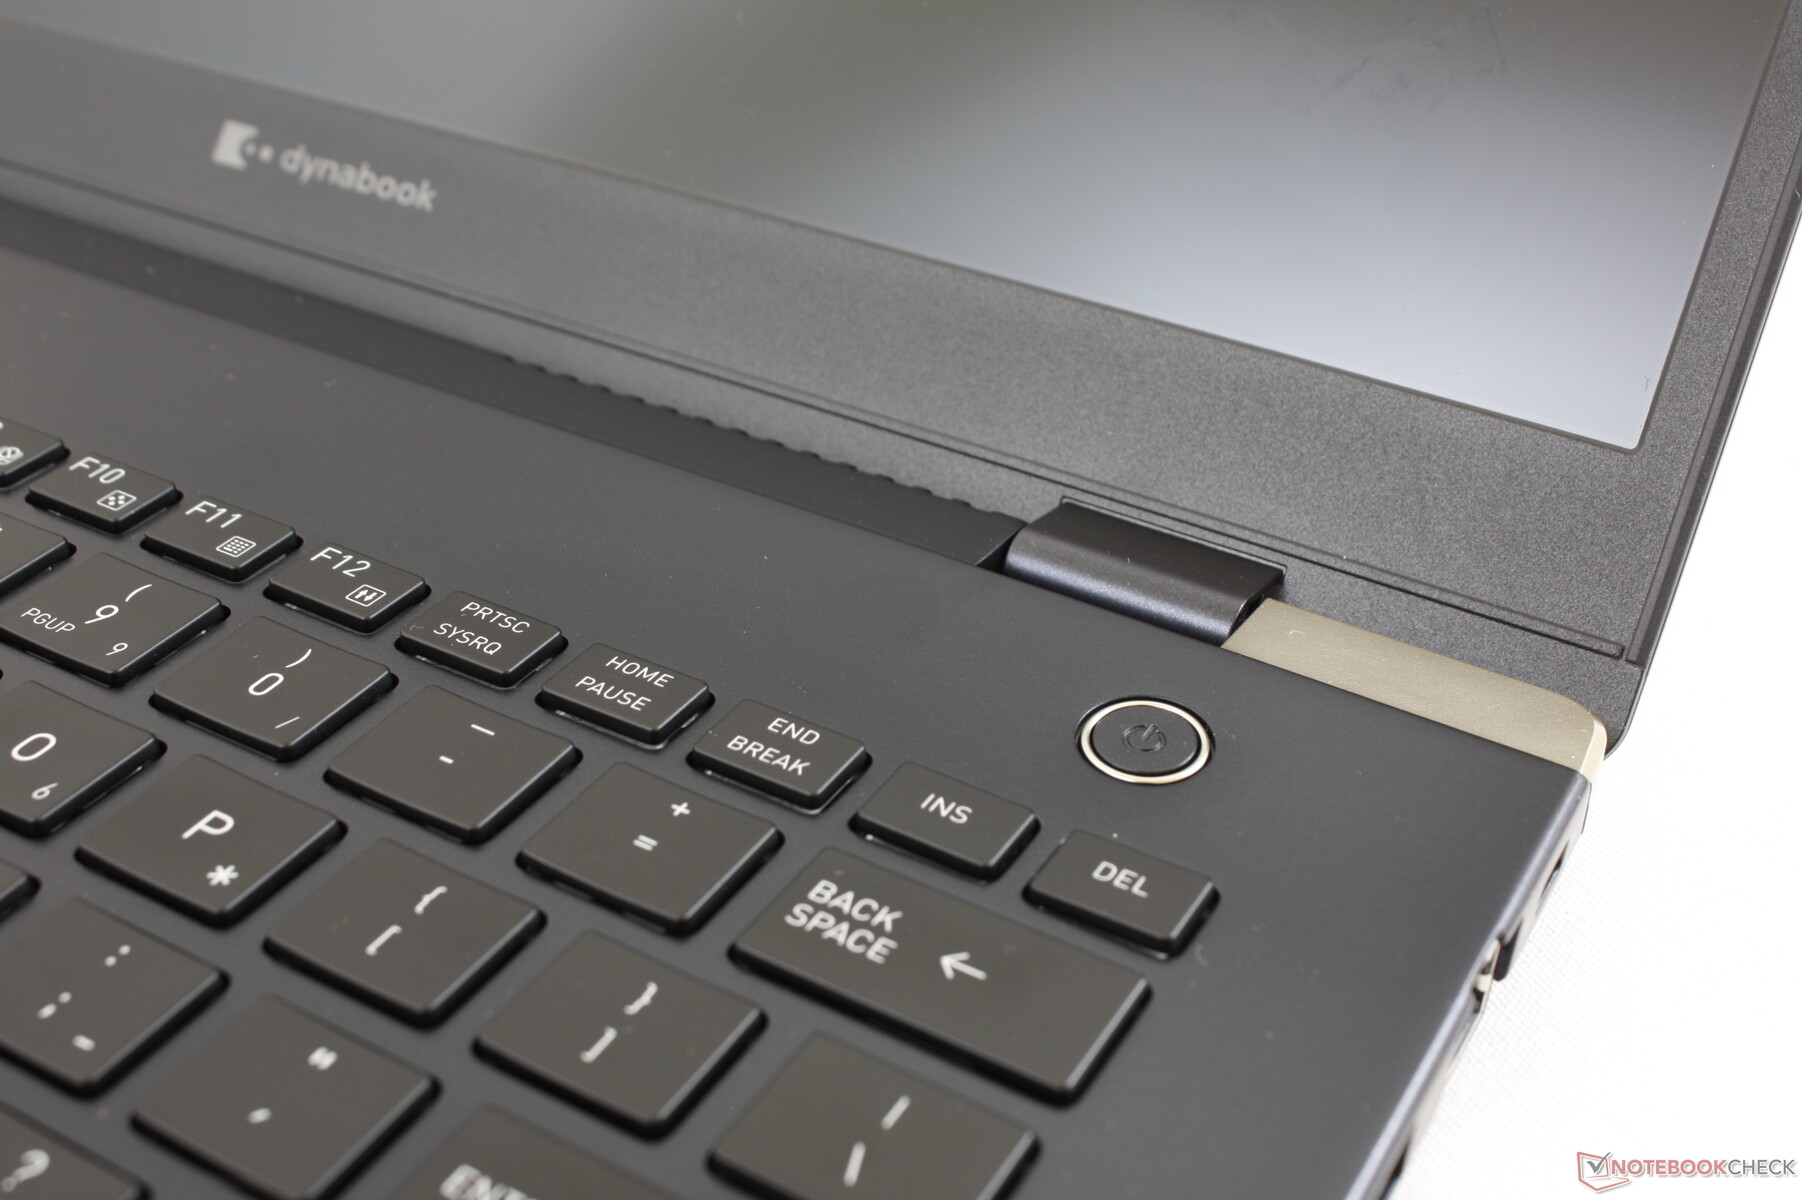
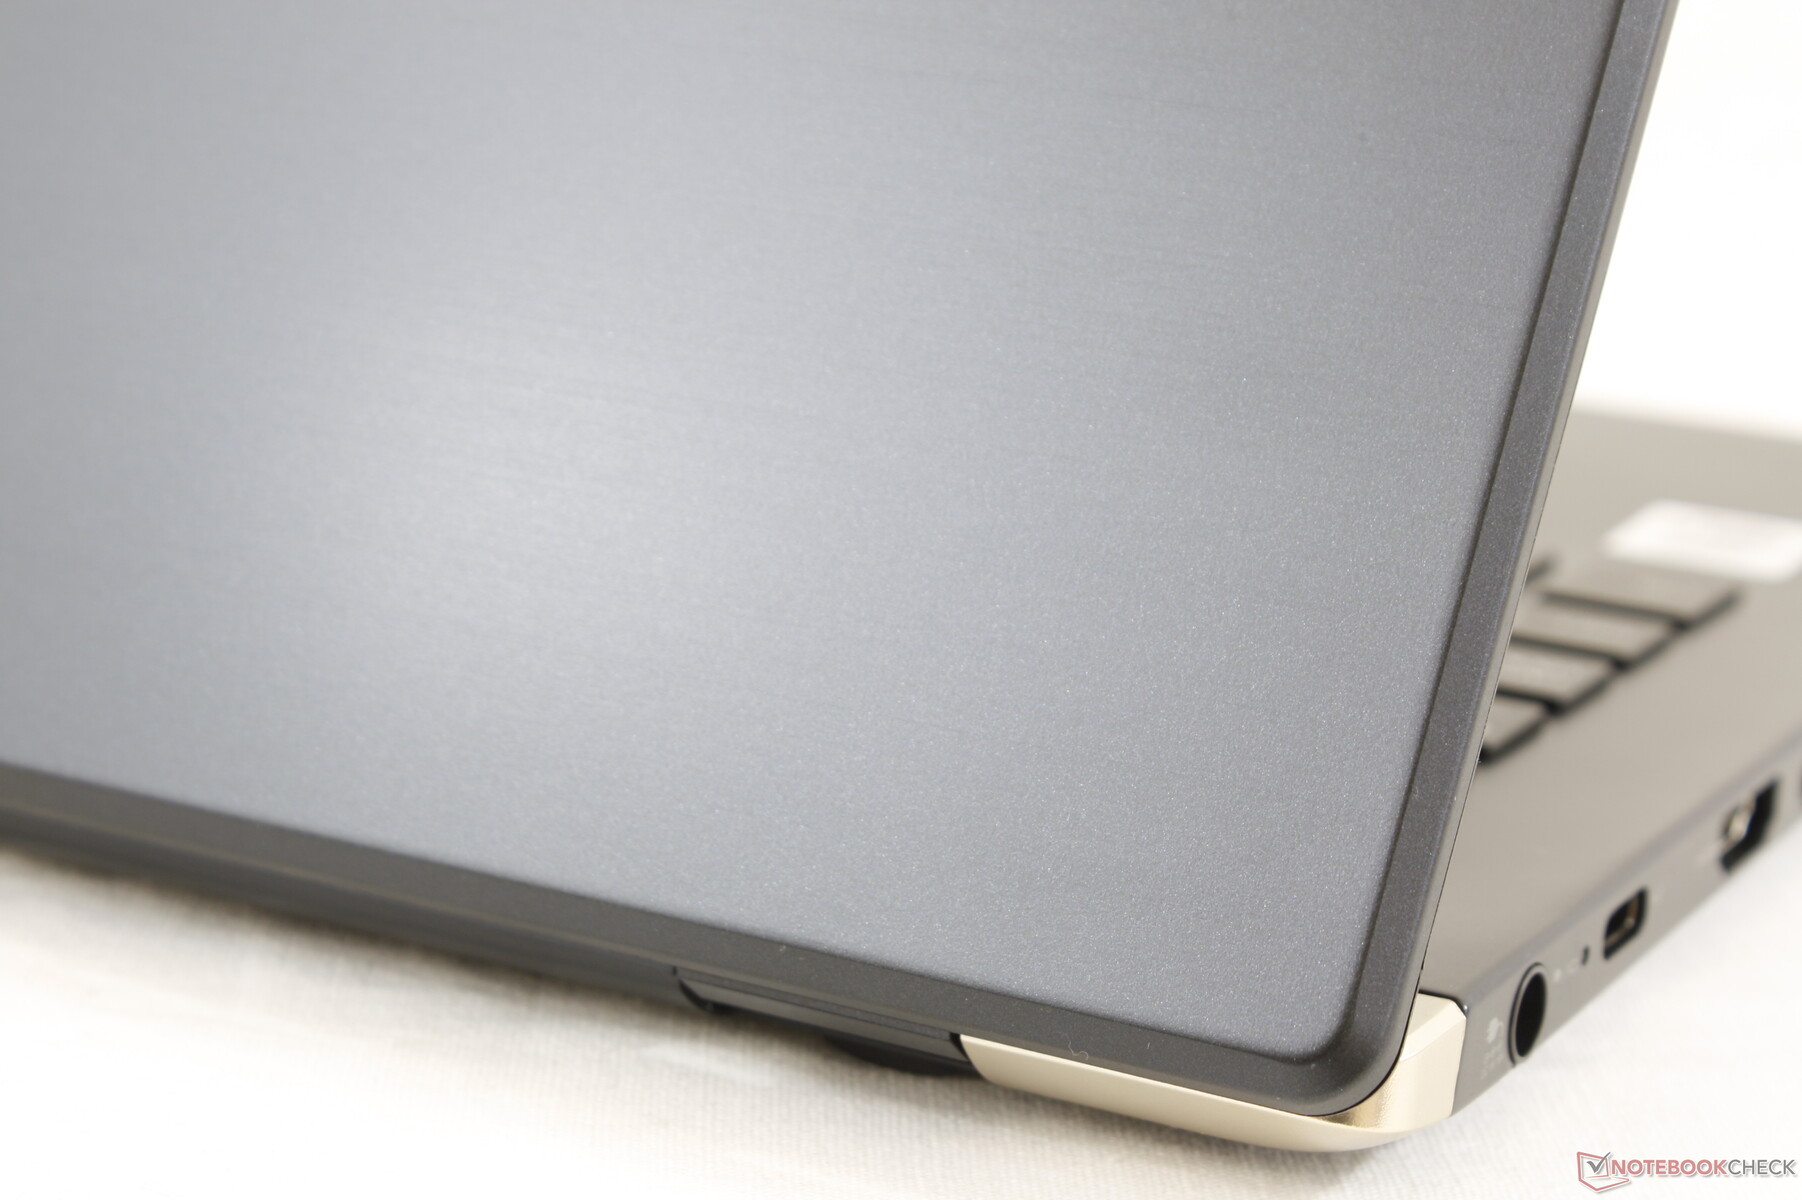
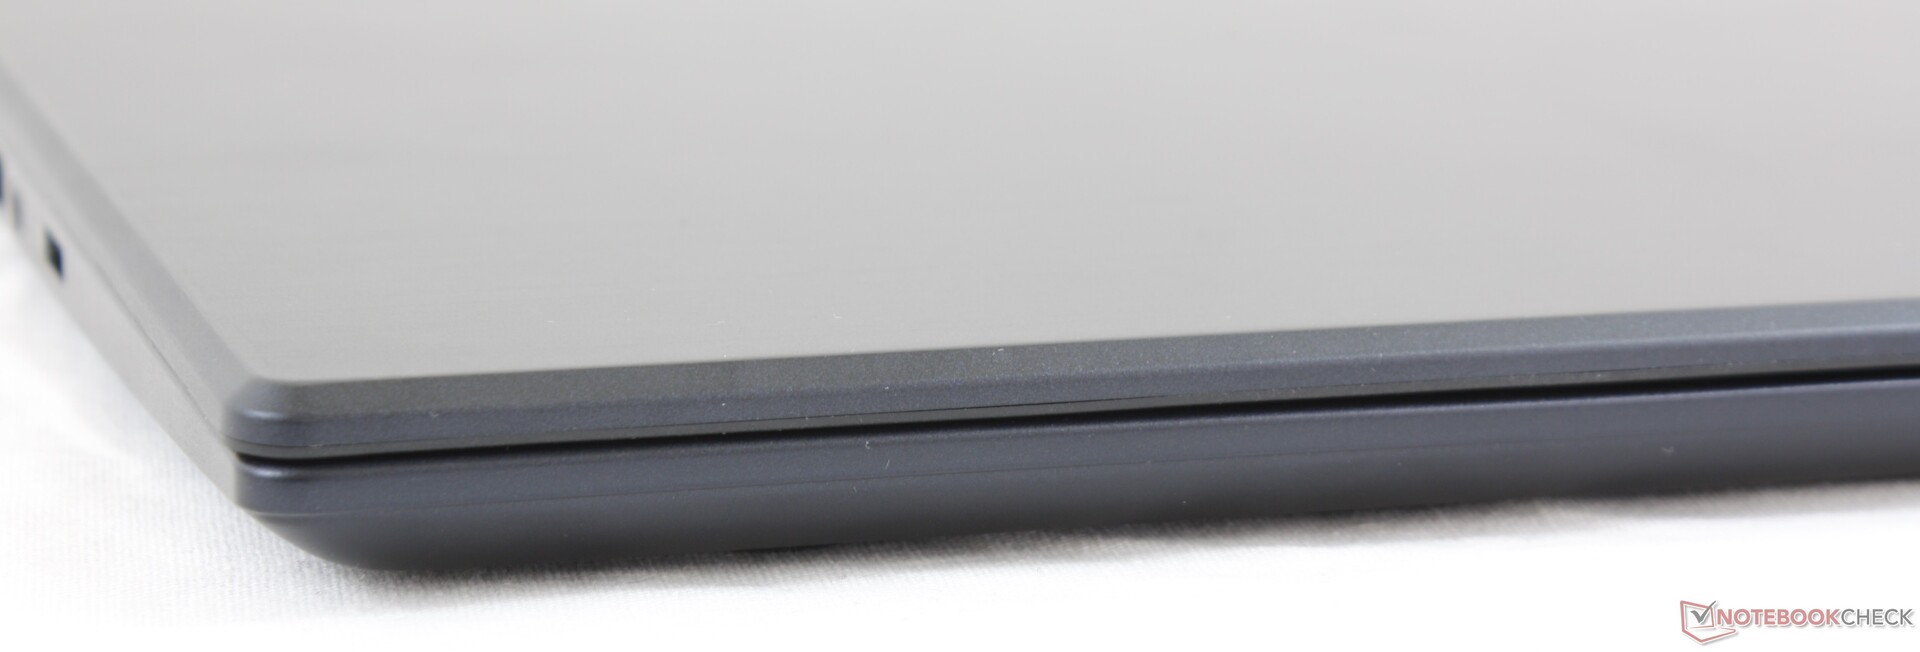
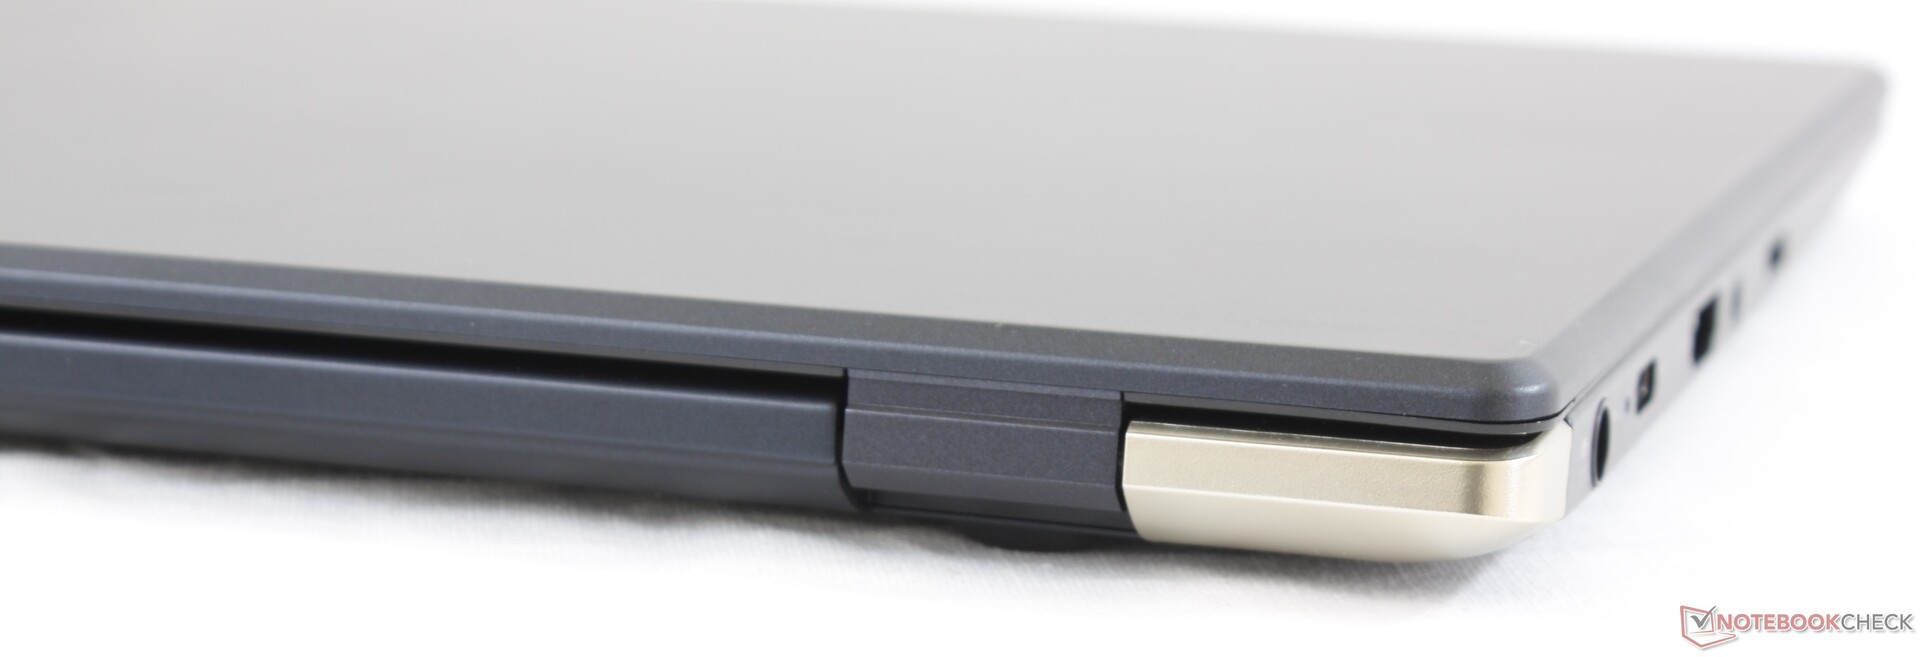
When compared to the Portégé X30-F, the X30L-G is slightly thicker but much smaller in footprint. Both systems otherwise share similar chassis materials for similar impressions. The lid is very flexible here especially when compared to the Gorilla Glass-reinforced displays of the XPS 13 or HP Spectre 13, but Dynabook has assured us that the flexing is by design and that it won't necessarily damage the display.
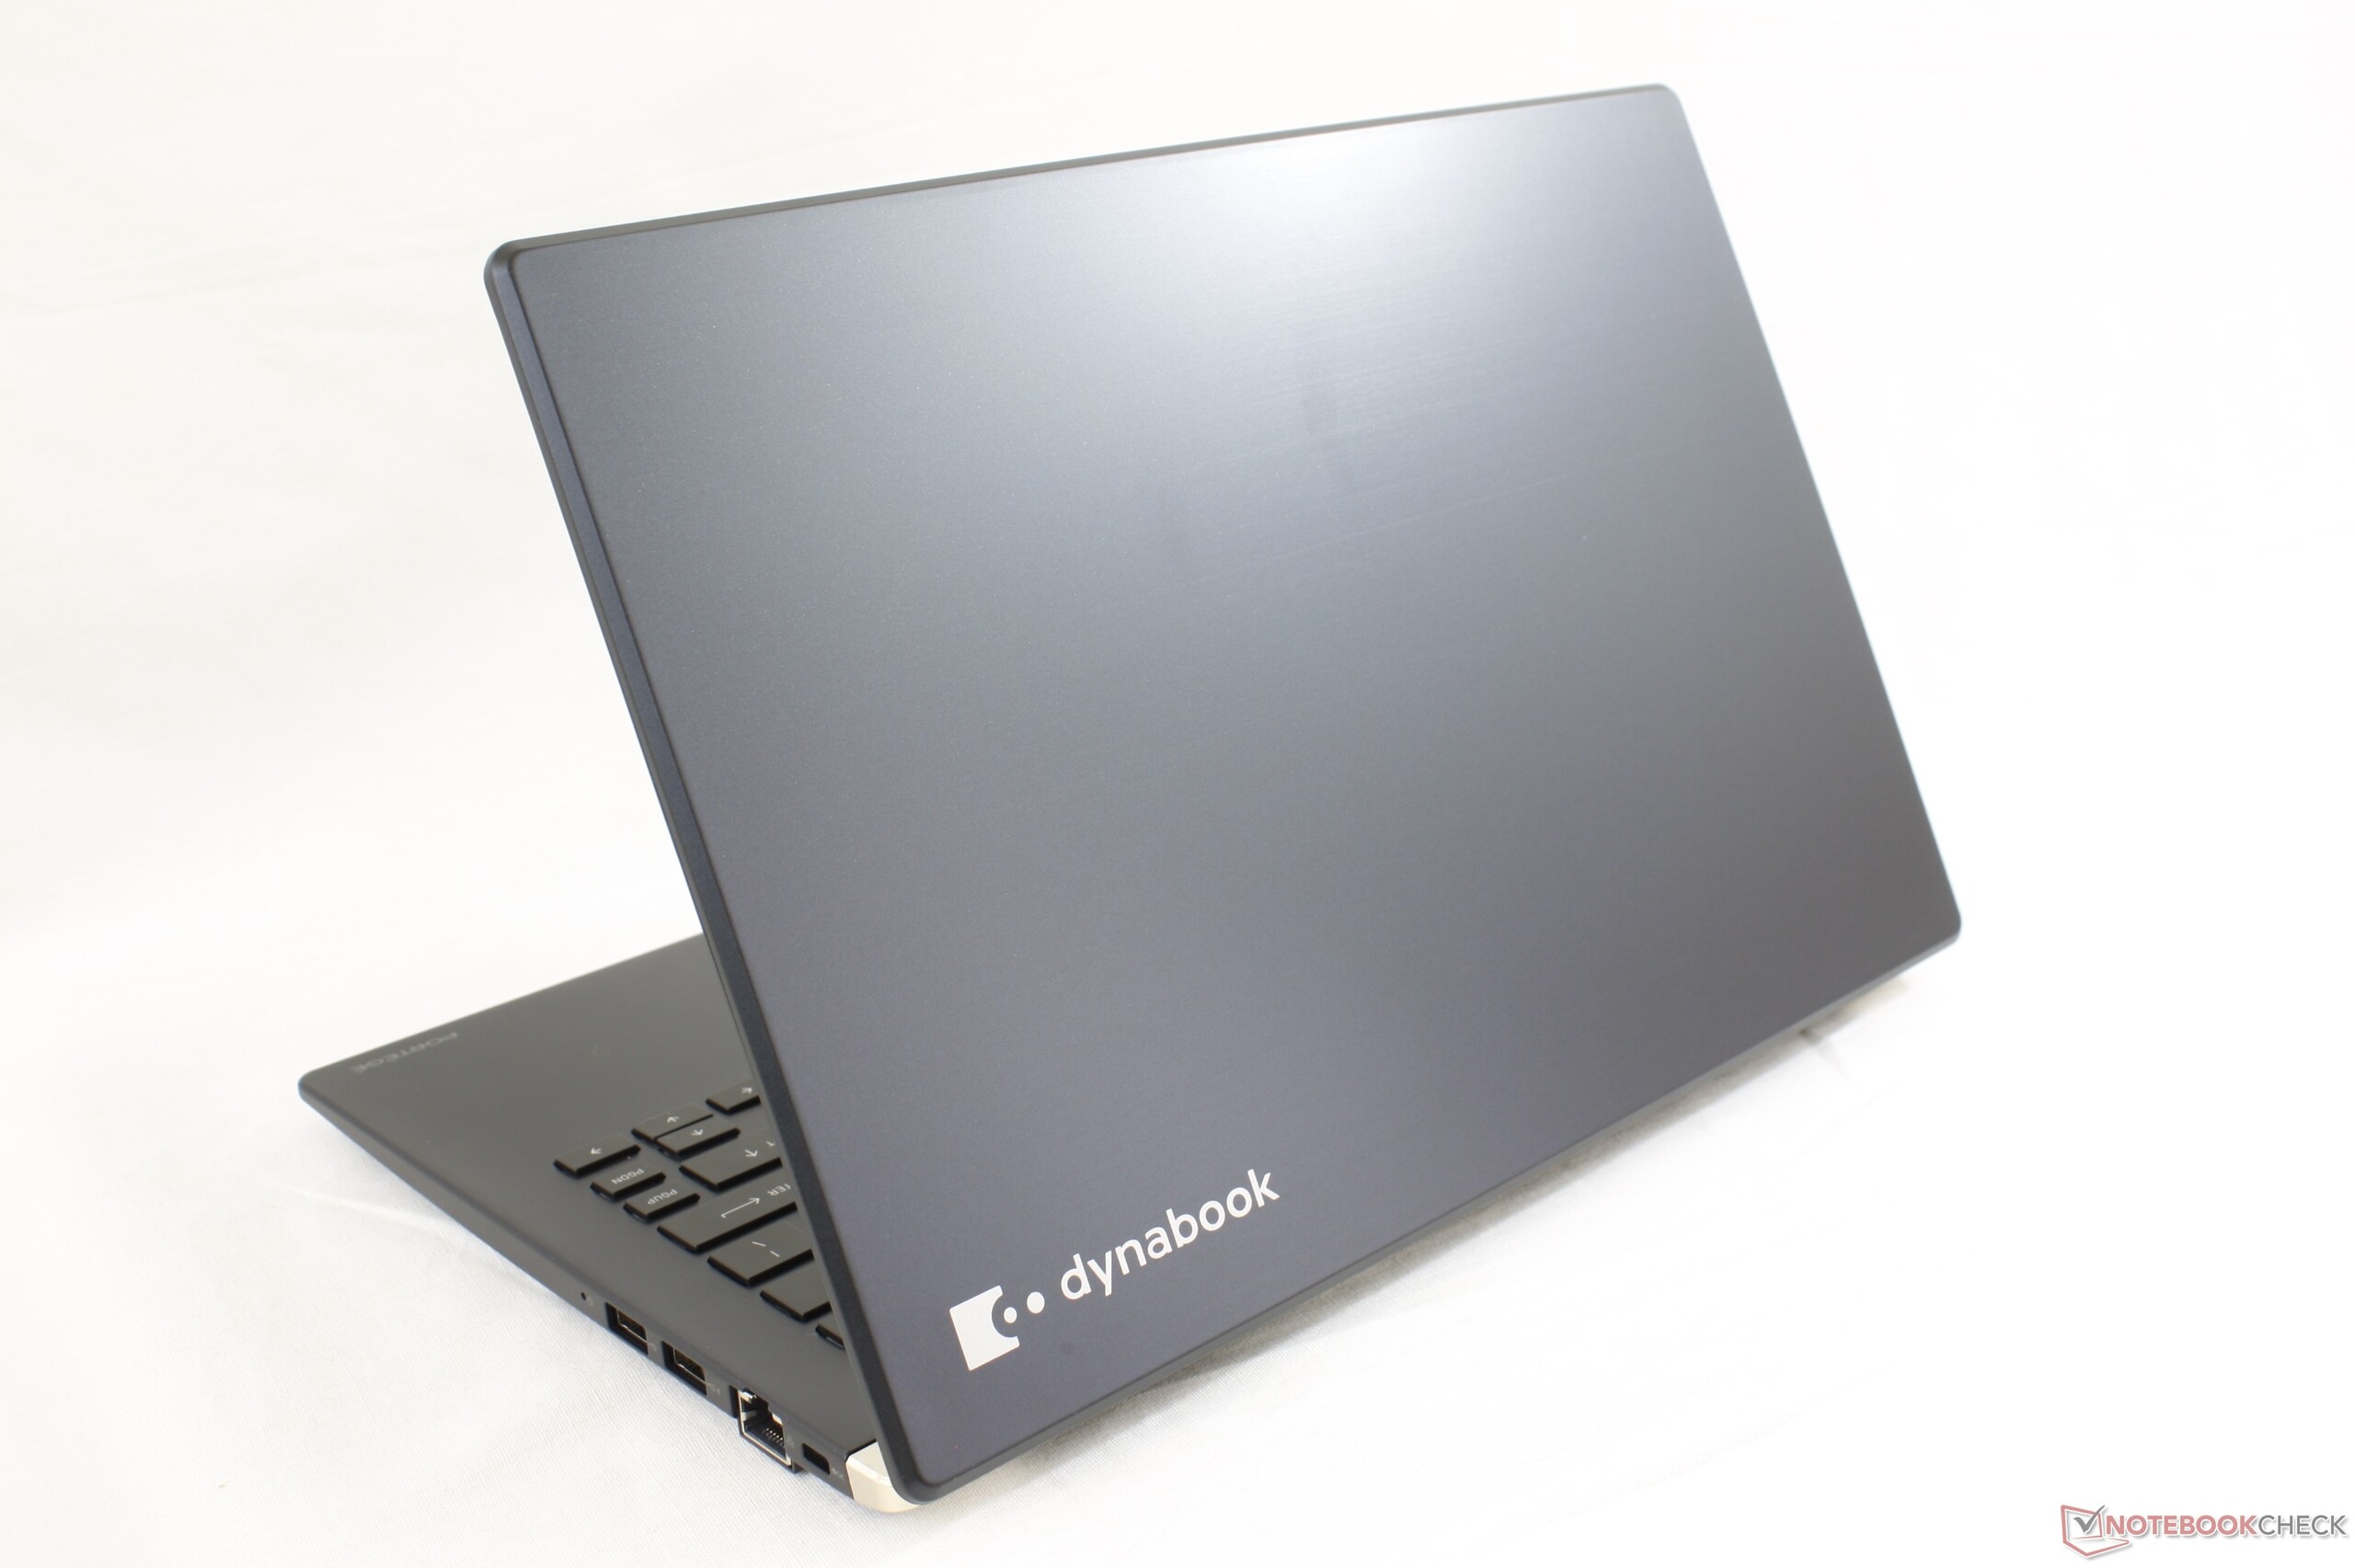
The low weight is the defining feature of the Portege X30L. The XPS 13 and MacBook Pro 13, for example, are about 300 g and 500 g heavier, respectively, than our Toshiba unit.
Connectivity
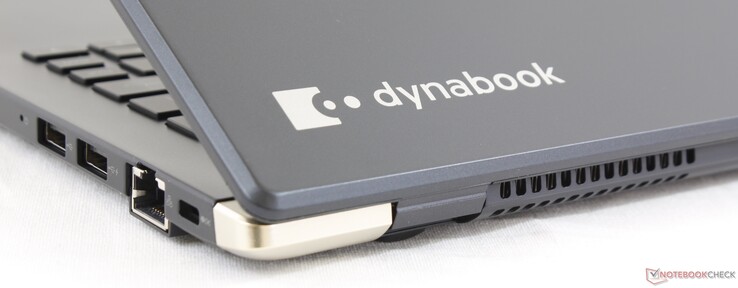
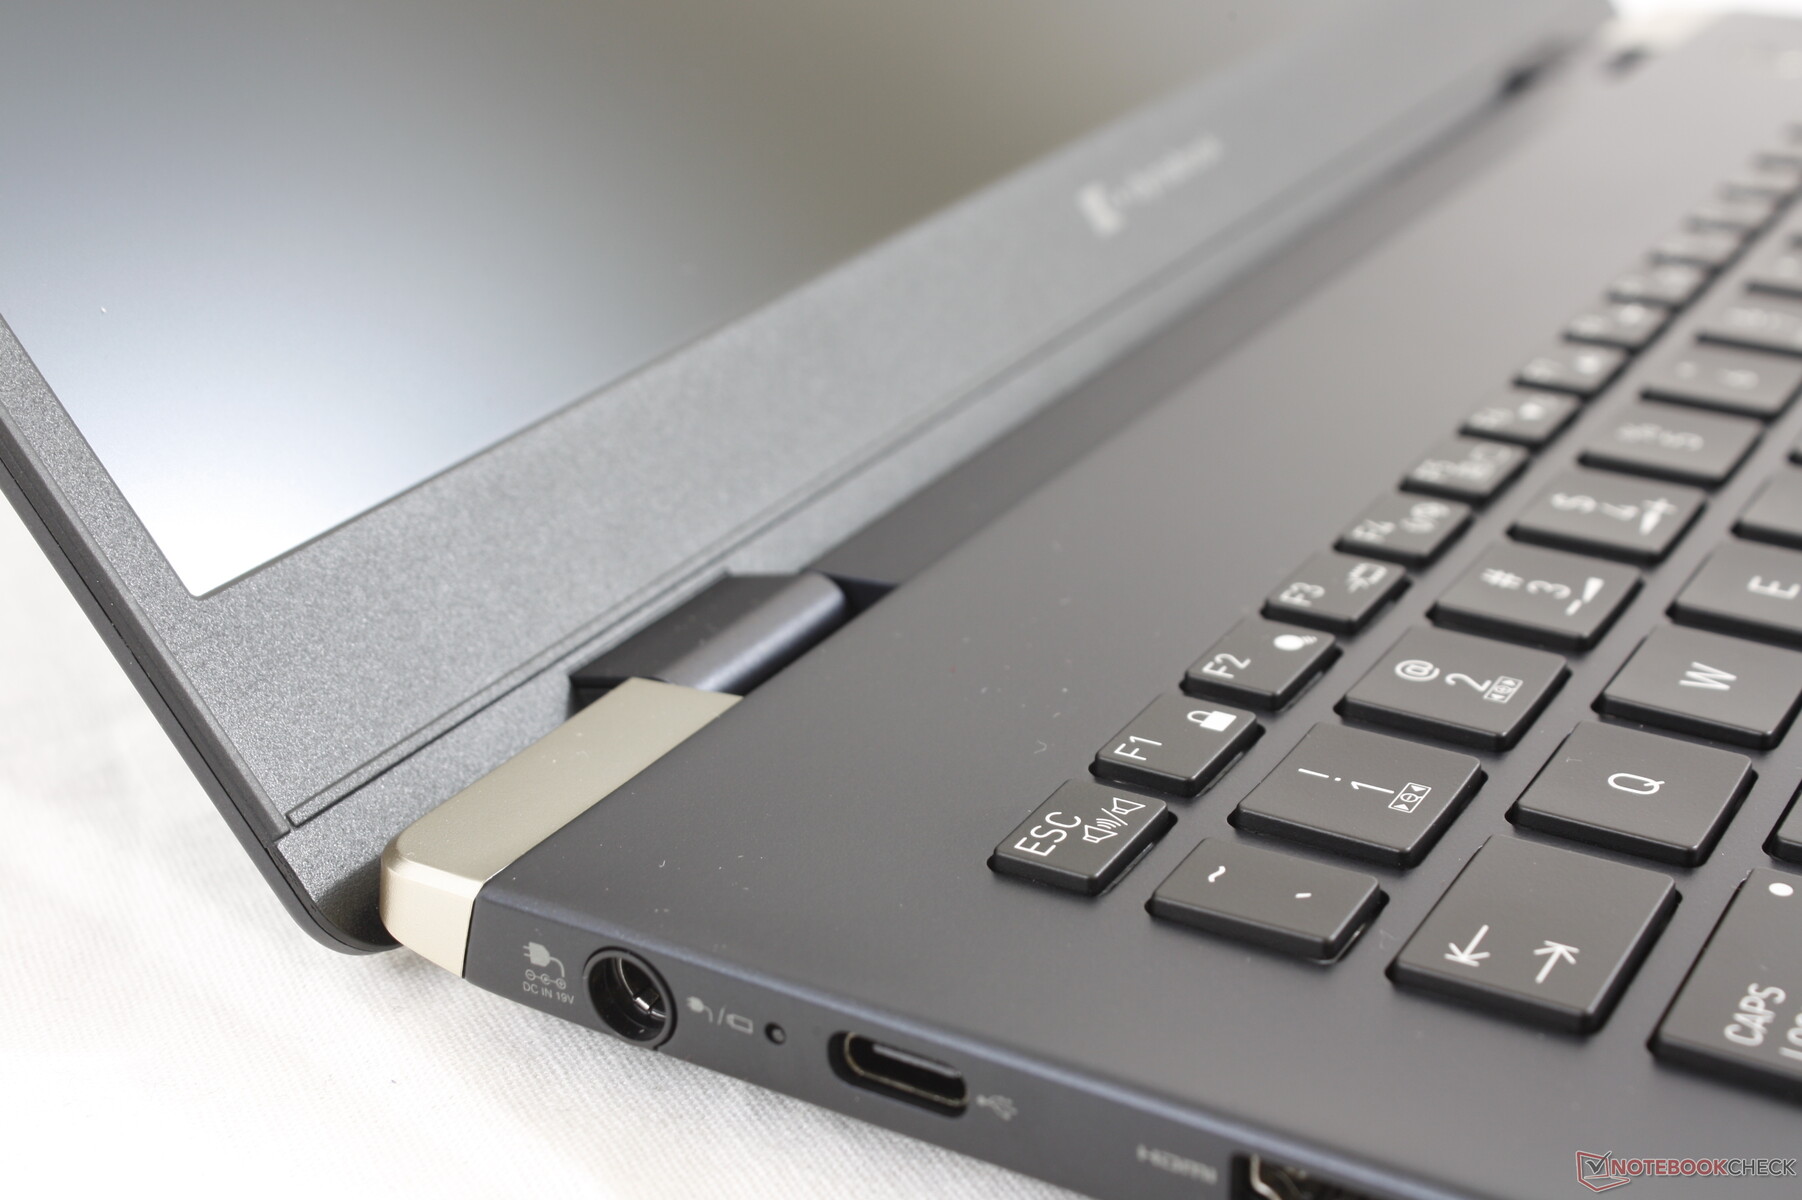
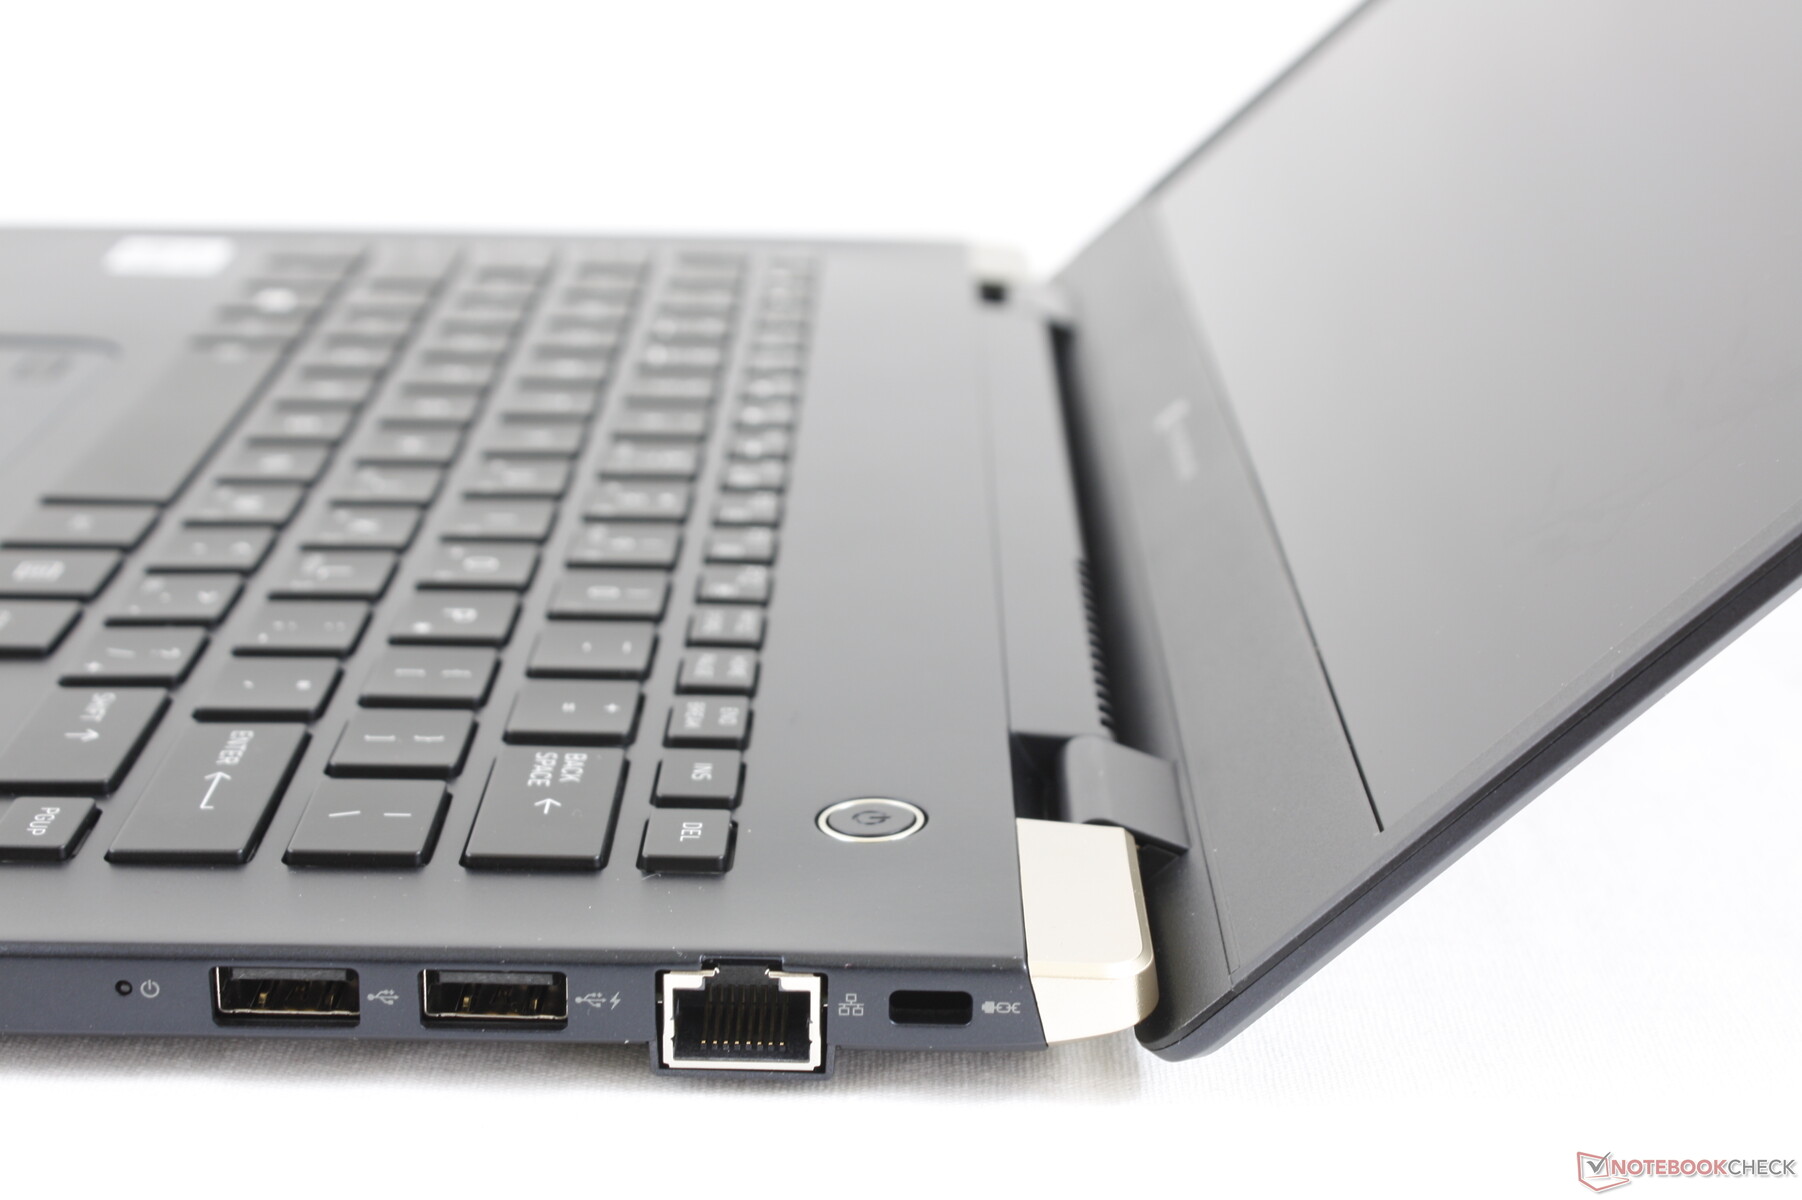
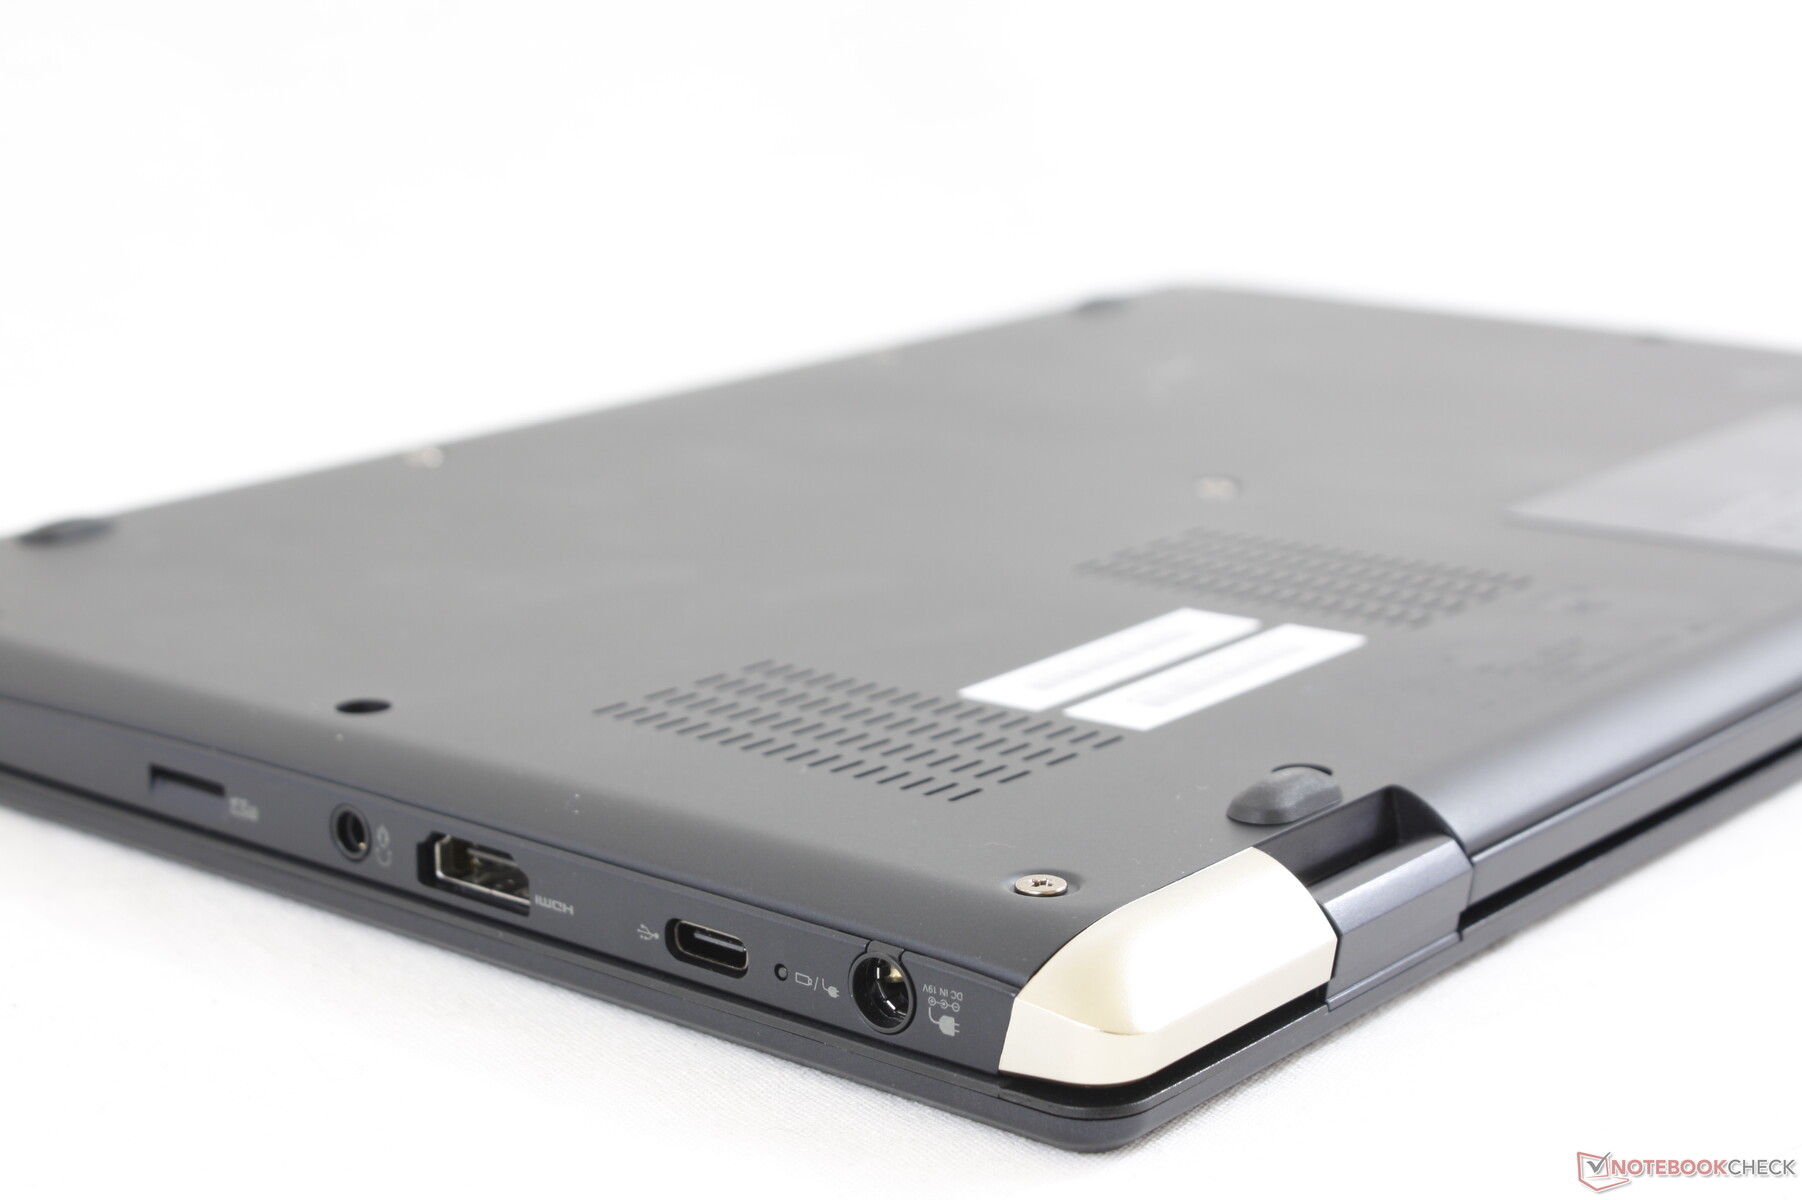
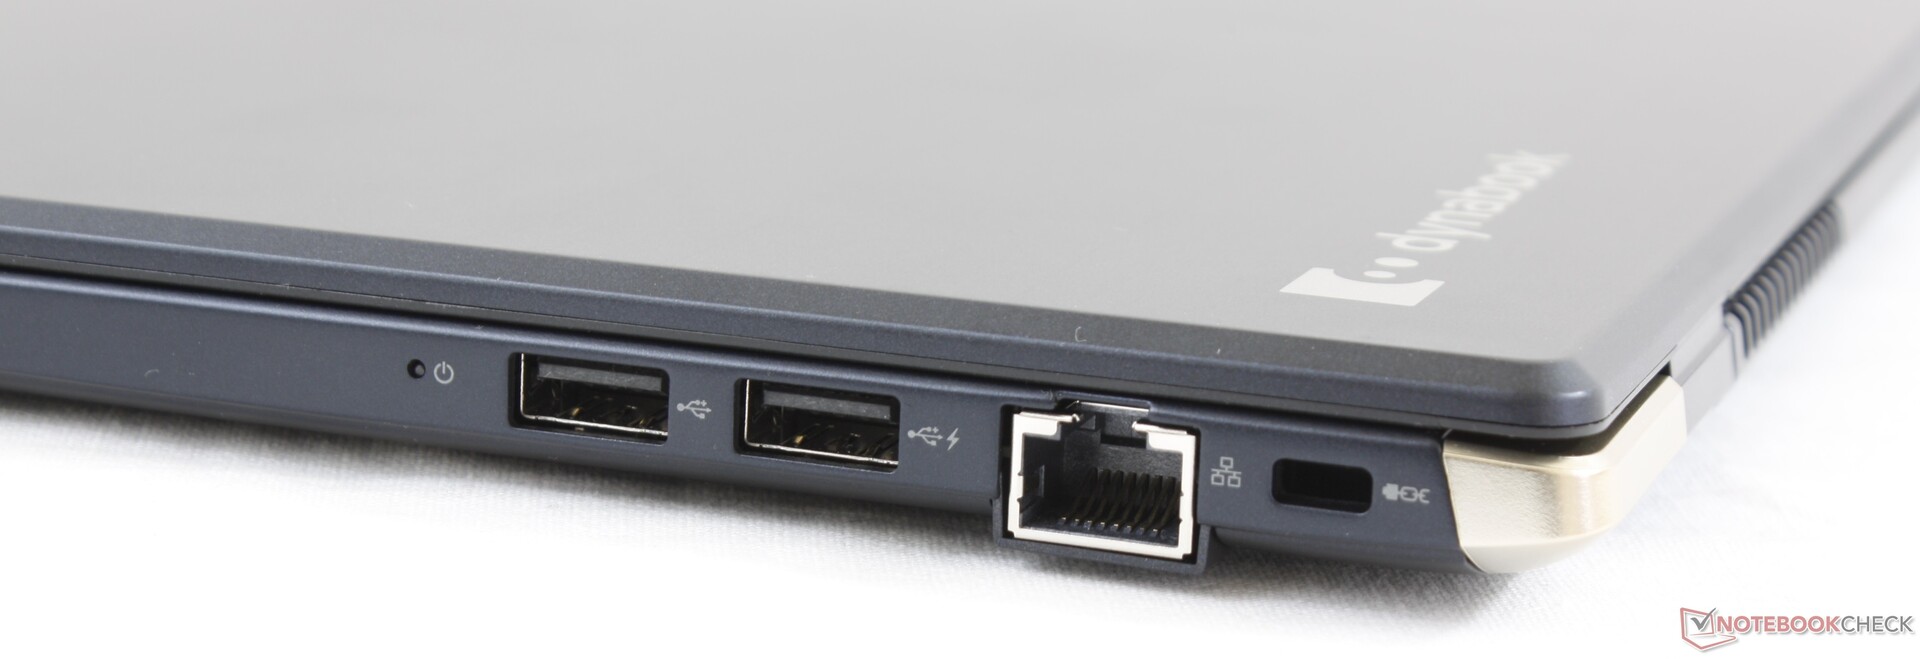
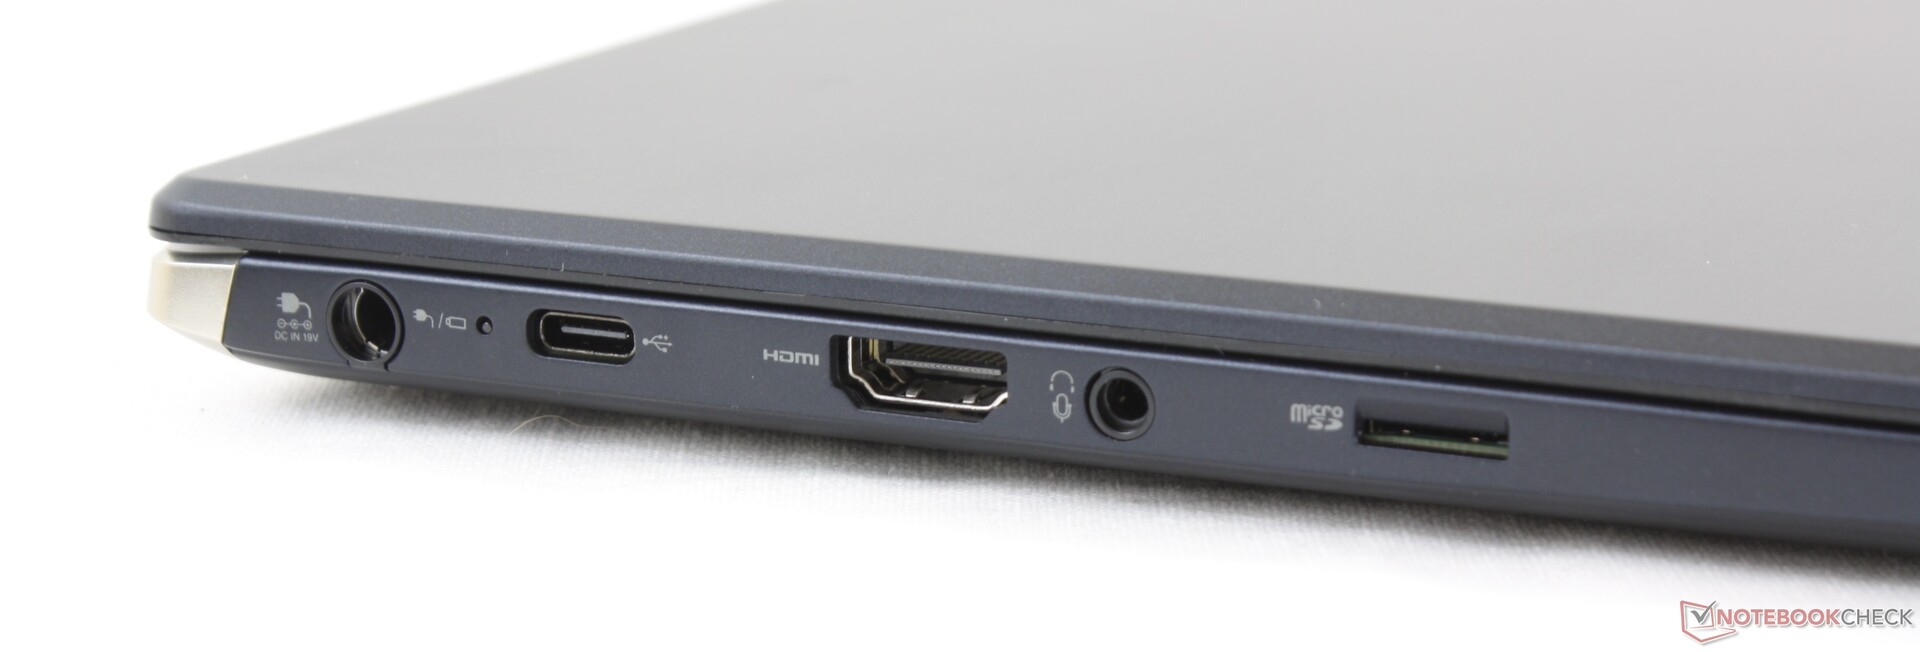
The system offers a wide variety of ports despite the small screen size and very low weight. Main drawbacks include the lack of both Thunderbolt 3 and WAN options which travelers and business users might rely on.
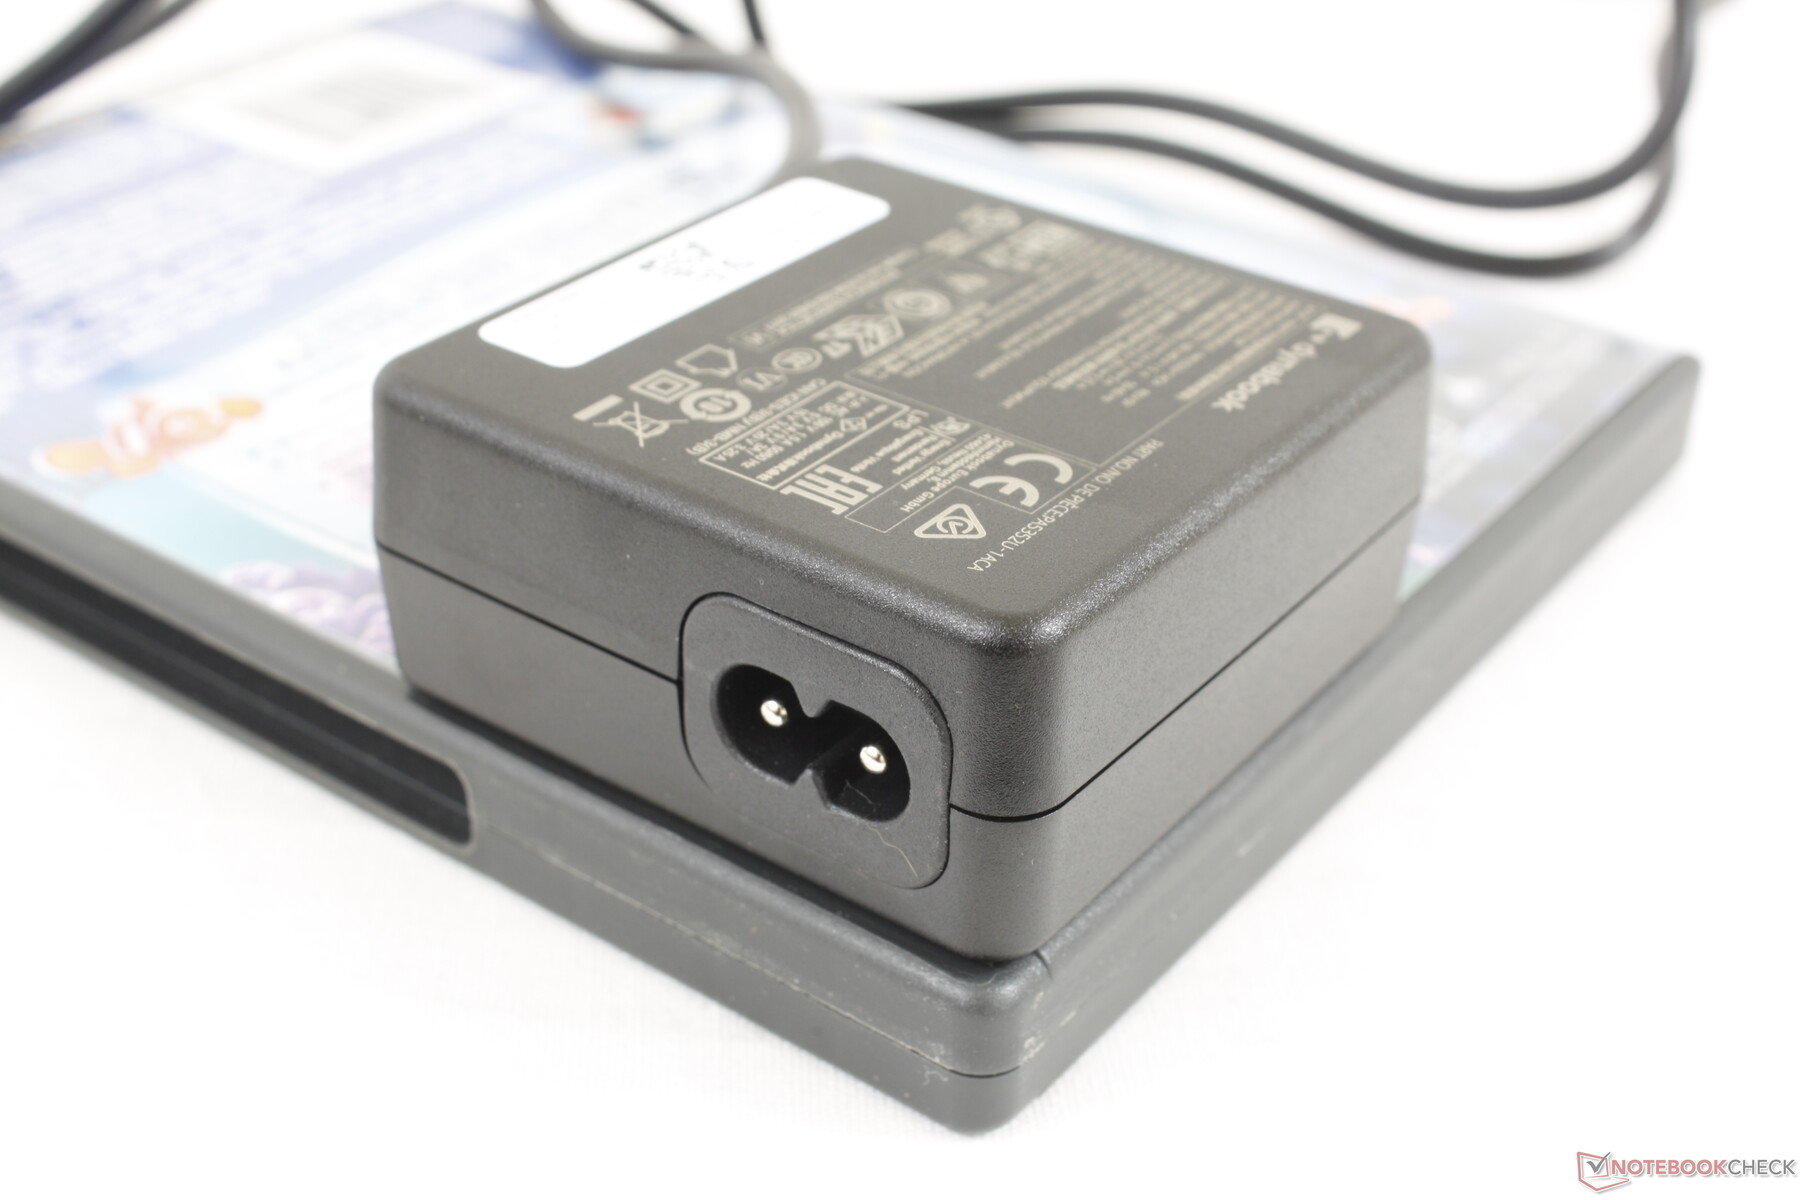
Recharging via USB Type-C is supported even though there is a proprietary AC adapter barrel port next to it. Dynabook says buyers can request either a USB Type-C or barrel charger before purchasing.
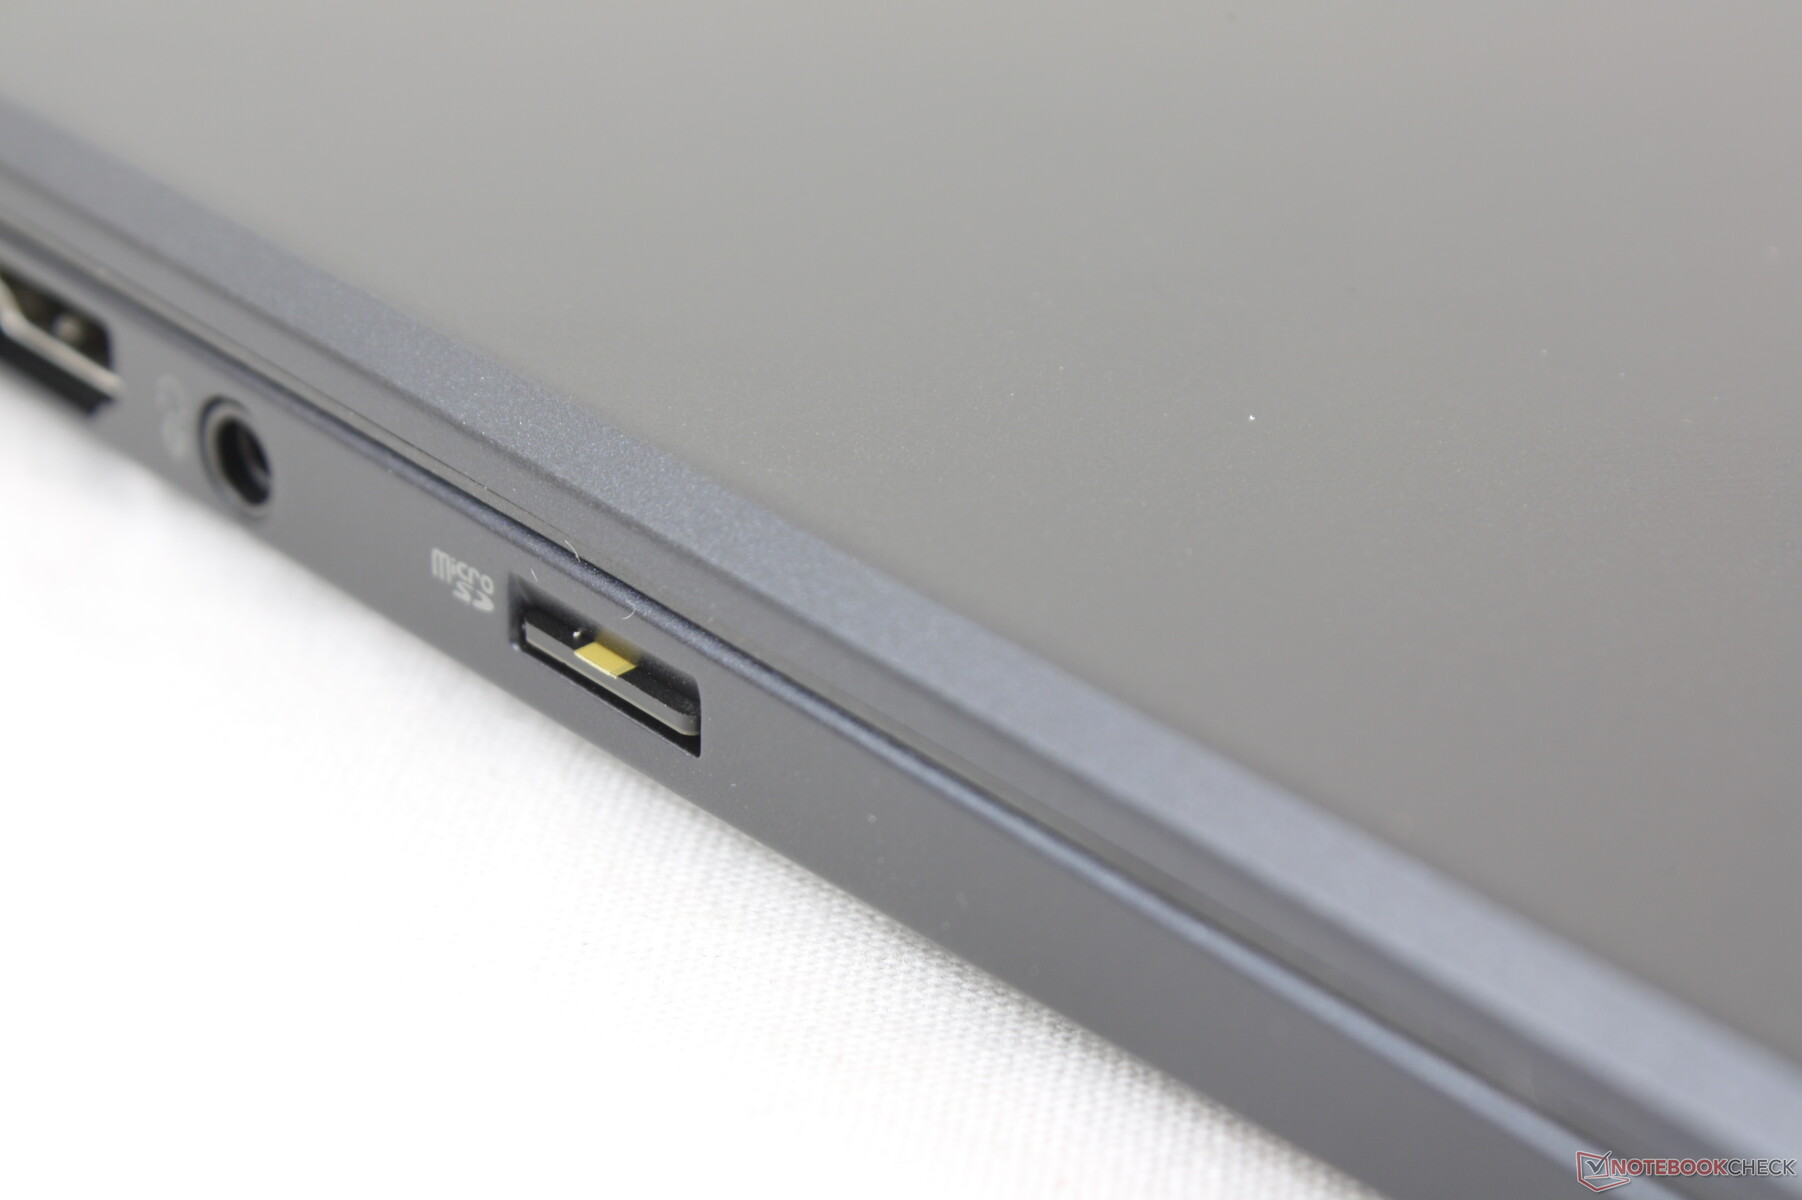
SD Card Reader
| SD Card Reader | |
| average JPG Copy Test (av. of 3 runs) | |
| HP EliteBook 1050 G1-4QY20EA (Toshiba Exceria Pro SDXC 64 GB UHS-II) | |
| Dell XPS 13 9300 Core i7-1065G7 (Toshiba Exceria Pro M501 64 GB UHS-II) | |
| Dynabook Portege X30L-G1331 (Toshiba Exceria Pro M501 64 GB UHS-II) | |
| LG Gram 13Z980-A (Toshiba Exceria Pro M501 UHS-II) | |
| maximum AS SSD Seq Read Test (1GB) | |
| HP EliteBook 1050 G1-4QY20EA (Toshiba Exceria Pro SDXC 64 GB UHS-II) | |
| Dell XPS 13 9300 Core i7-1065G7 (Toshiba Exceria Pro M501 64 GB UHS-II) | |
| LG Gram 13Z980-A (Toshiba Exceria Pro M501 UHS-II) | |
| Dynabook Portege X30L-G1331 (Toshiba Exceria Pro M501 64 GB UHS-II) | |
Communication
The Intel AX200 comes standard for Wi-Fi 6 connectivity and integrated Bluetooth 5. We experienced no issues when connected to our Netgear RAX200 test router.
Webcam


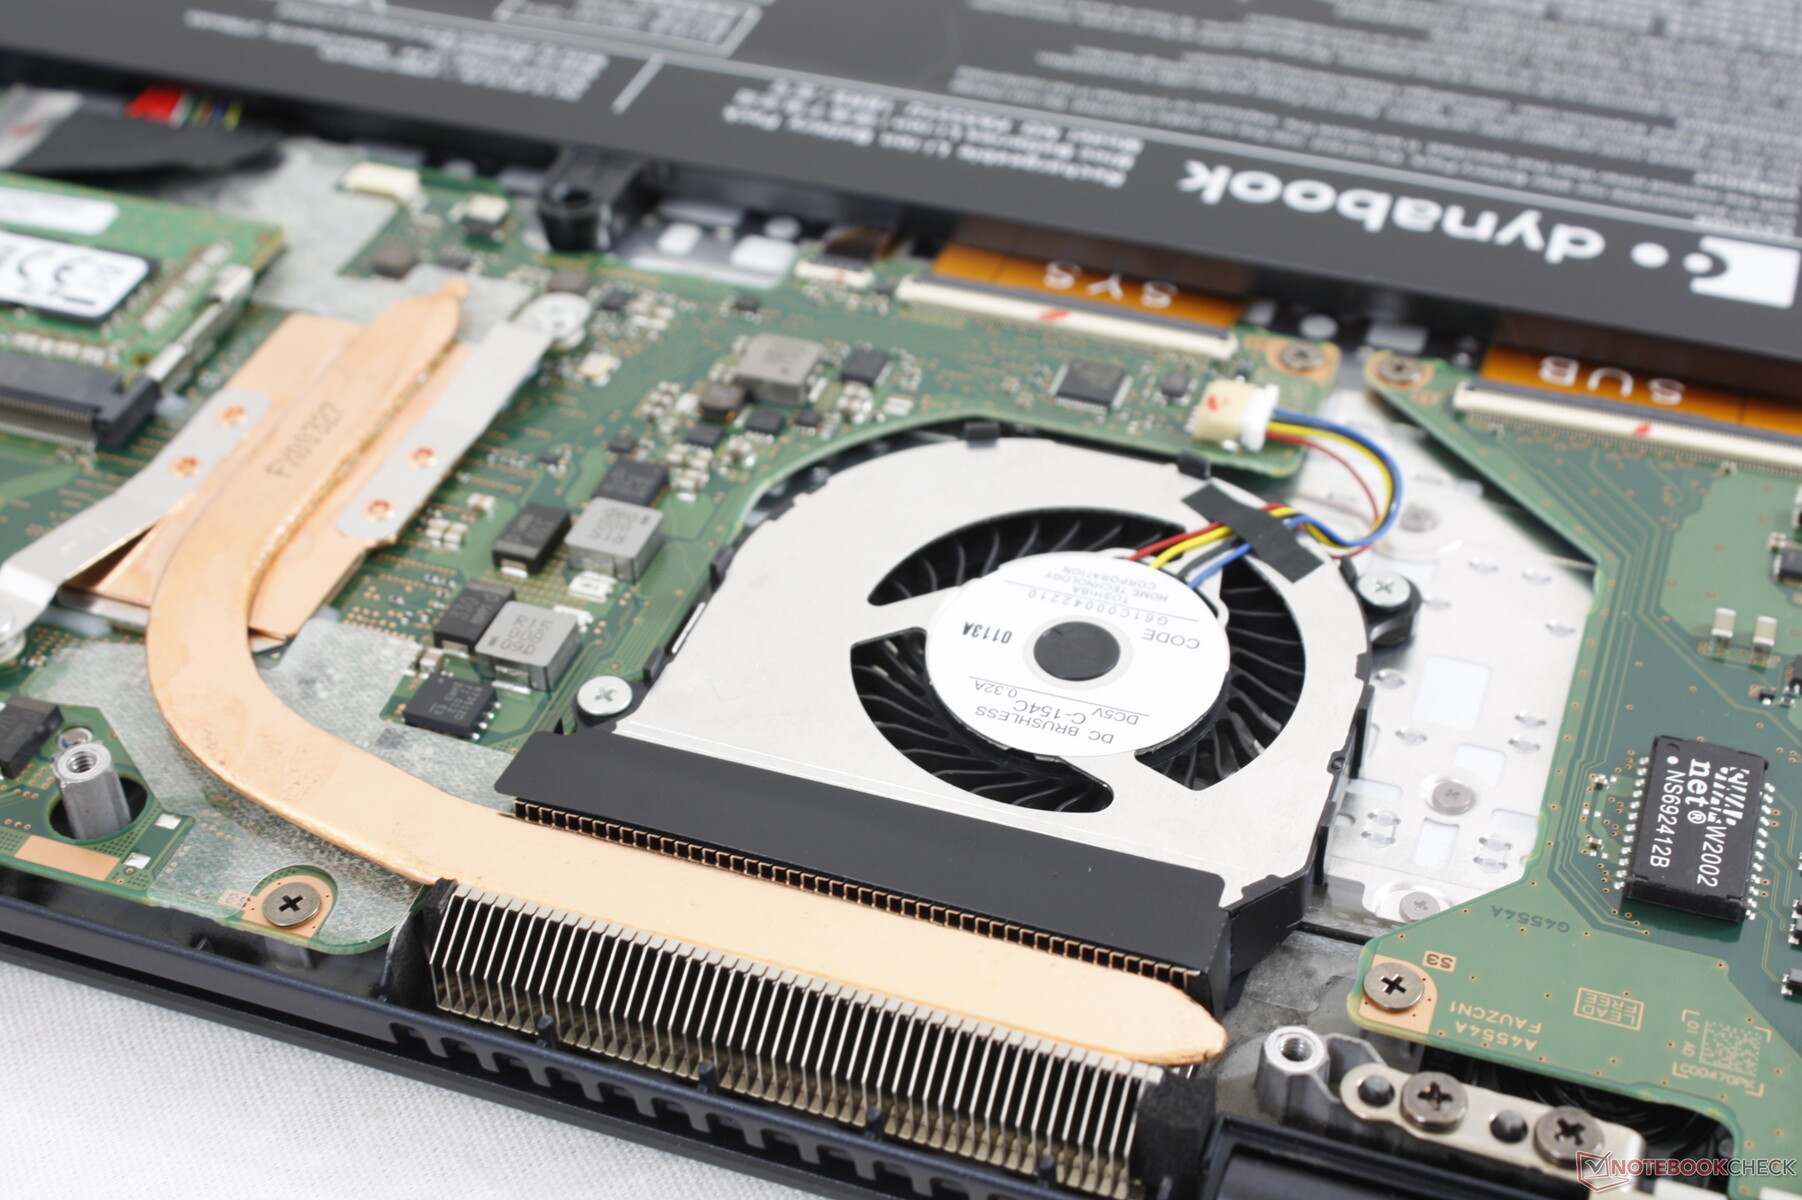
Maintenance
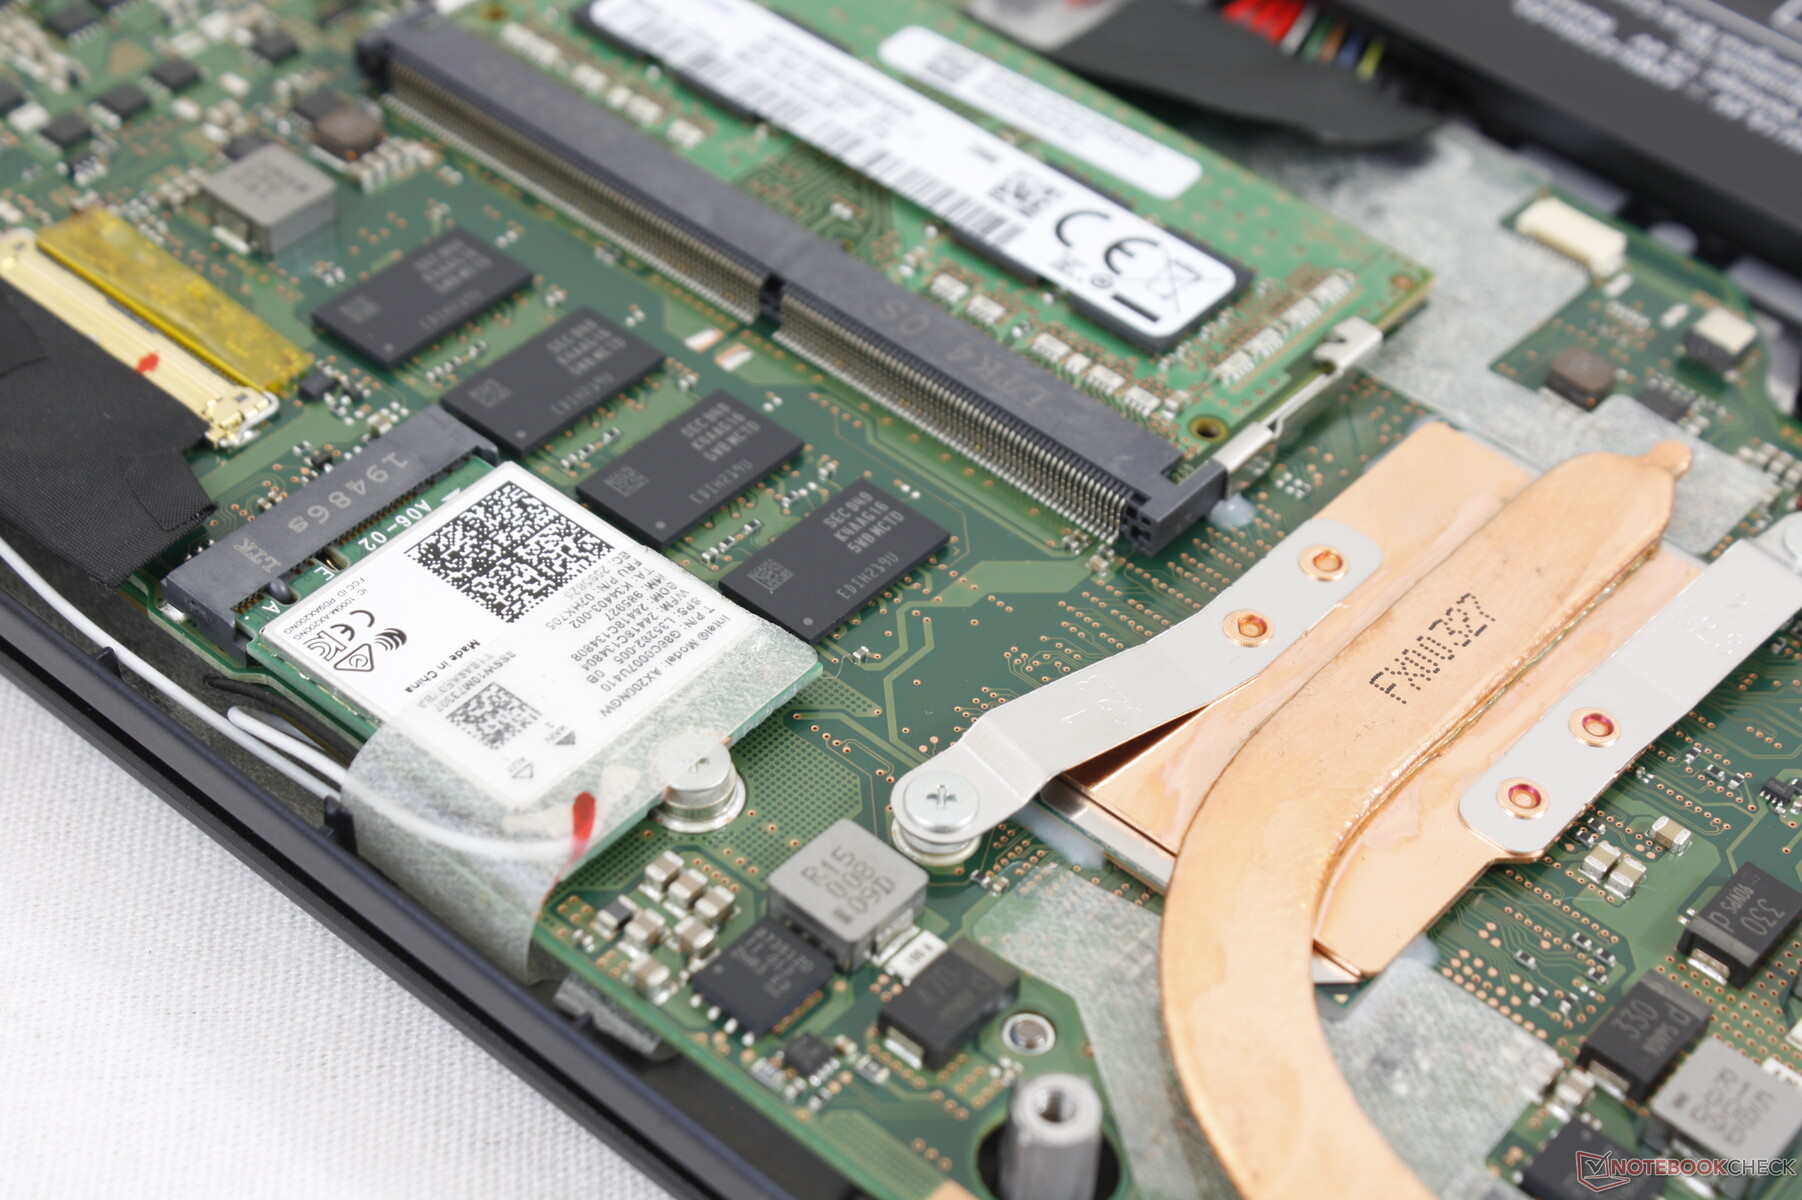
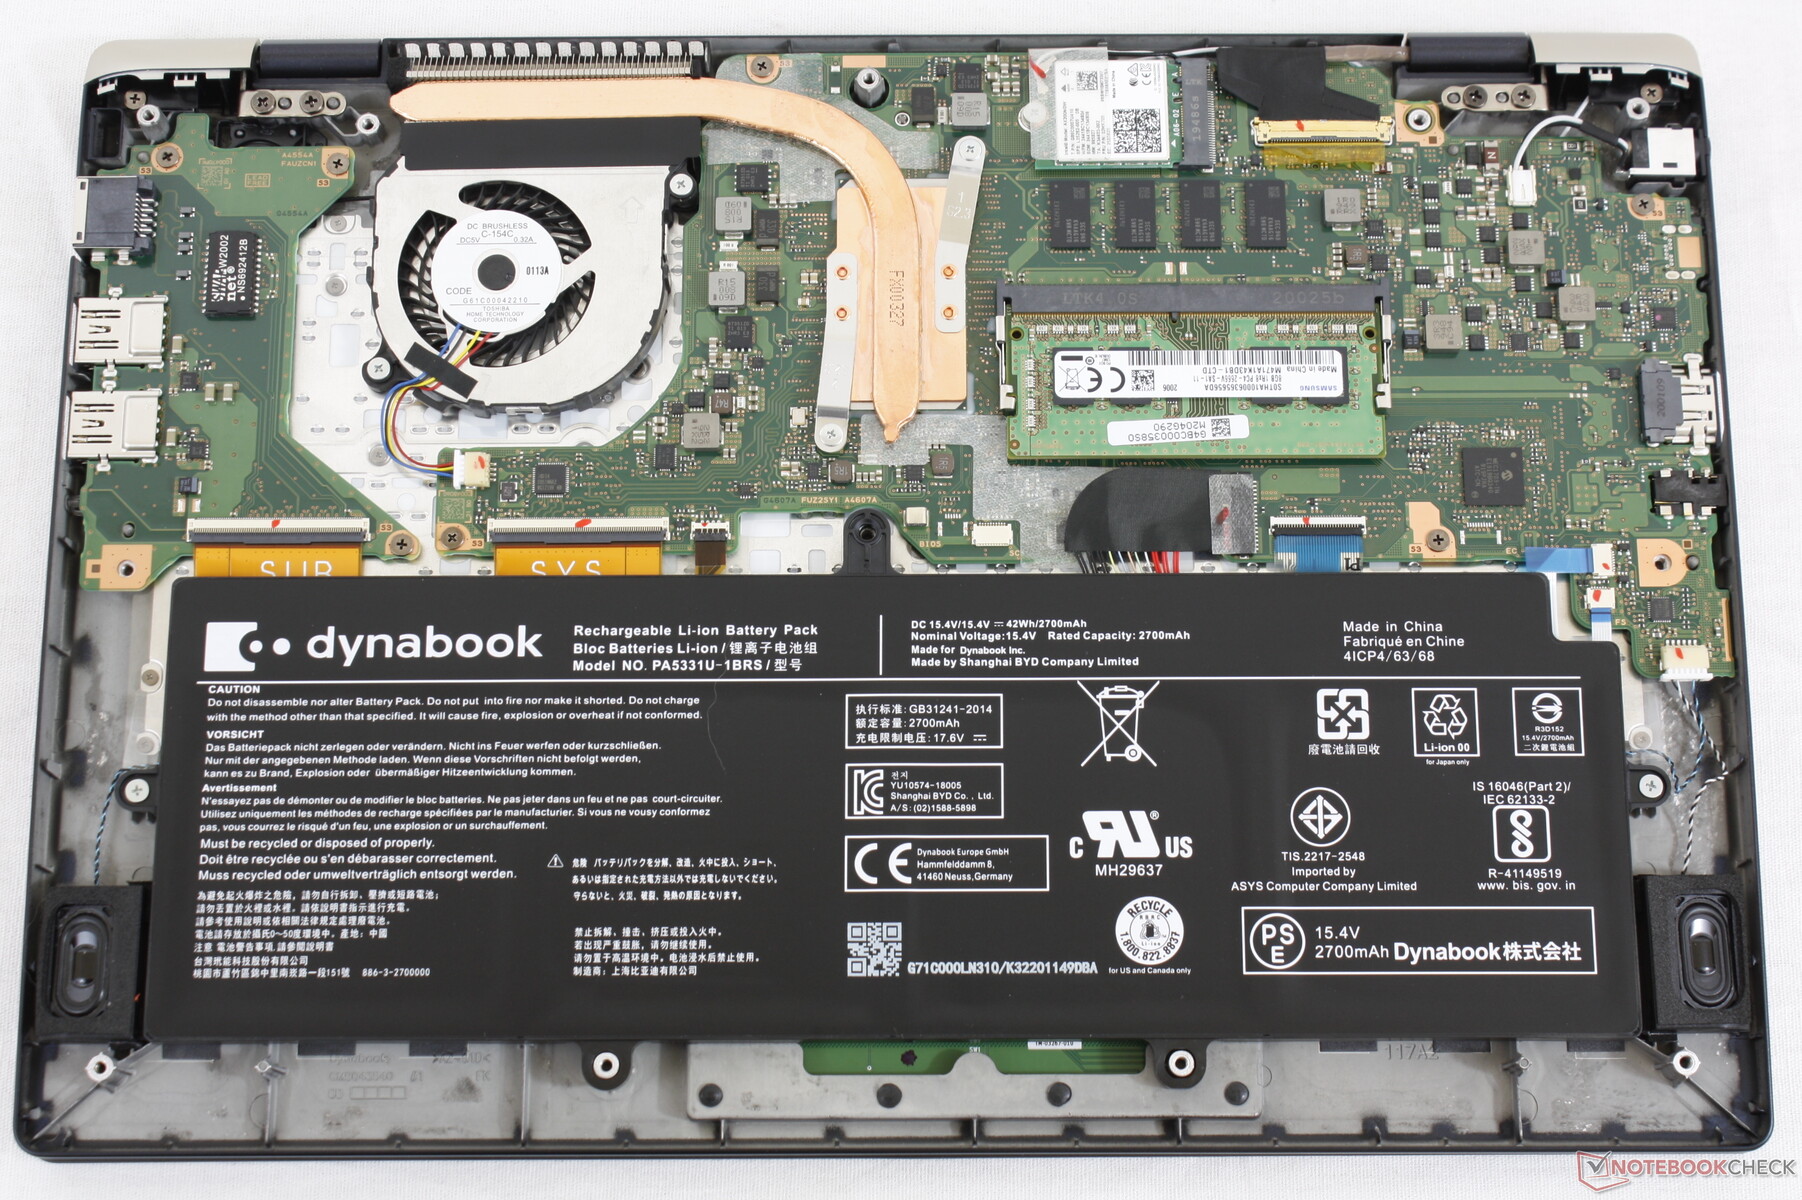
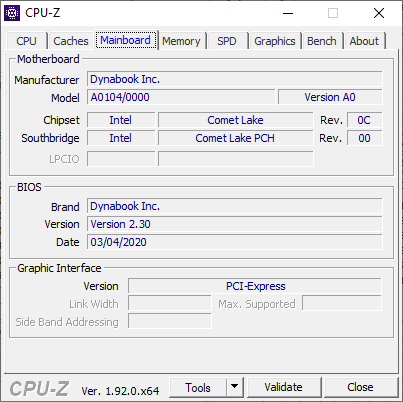
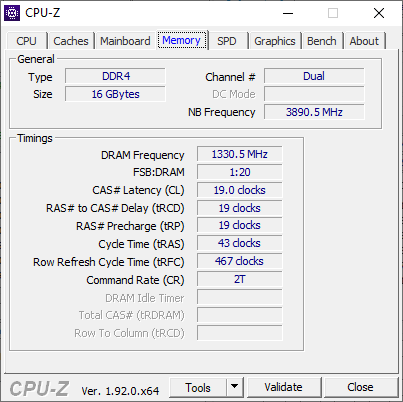
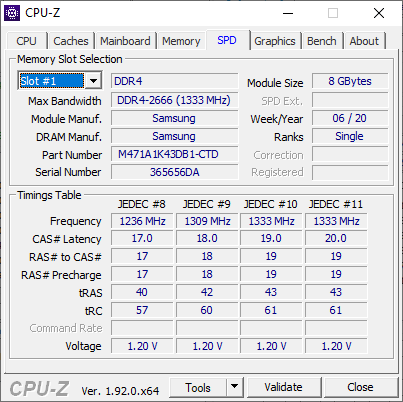
The bottom panel is secured by 12 Philips screws for easy accessibility. Once inside, users get direct access to one SODIMM slot, the M.2 WLAN module, and the internal battery. The primary M.2 2280 slot is unfortunately underneath the motherboard and more difficult to access.
Note that 8 GB of single-channel RAM comes soldered. Users can expand this to dual-channel up to 24 GB with a removable SODIMM module not unlike on the LG Gram 14.
Accessories and Warranty
The retail box includes a handy velvet cleaning cloth in addition to the usual paperwork. The manufacturer includes three years of +CARE warranty as standard or four years for build-to-order models.
Input Devices
Keyboard
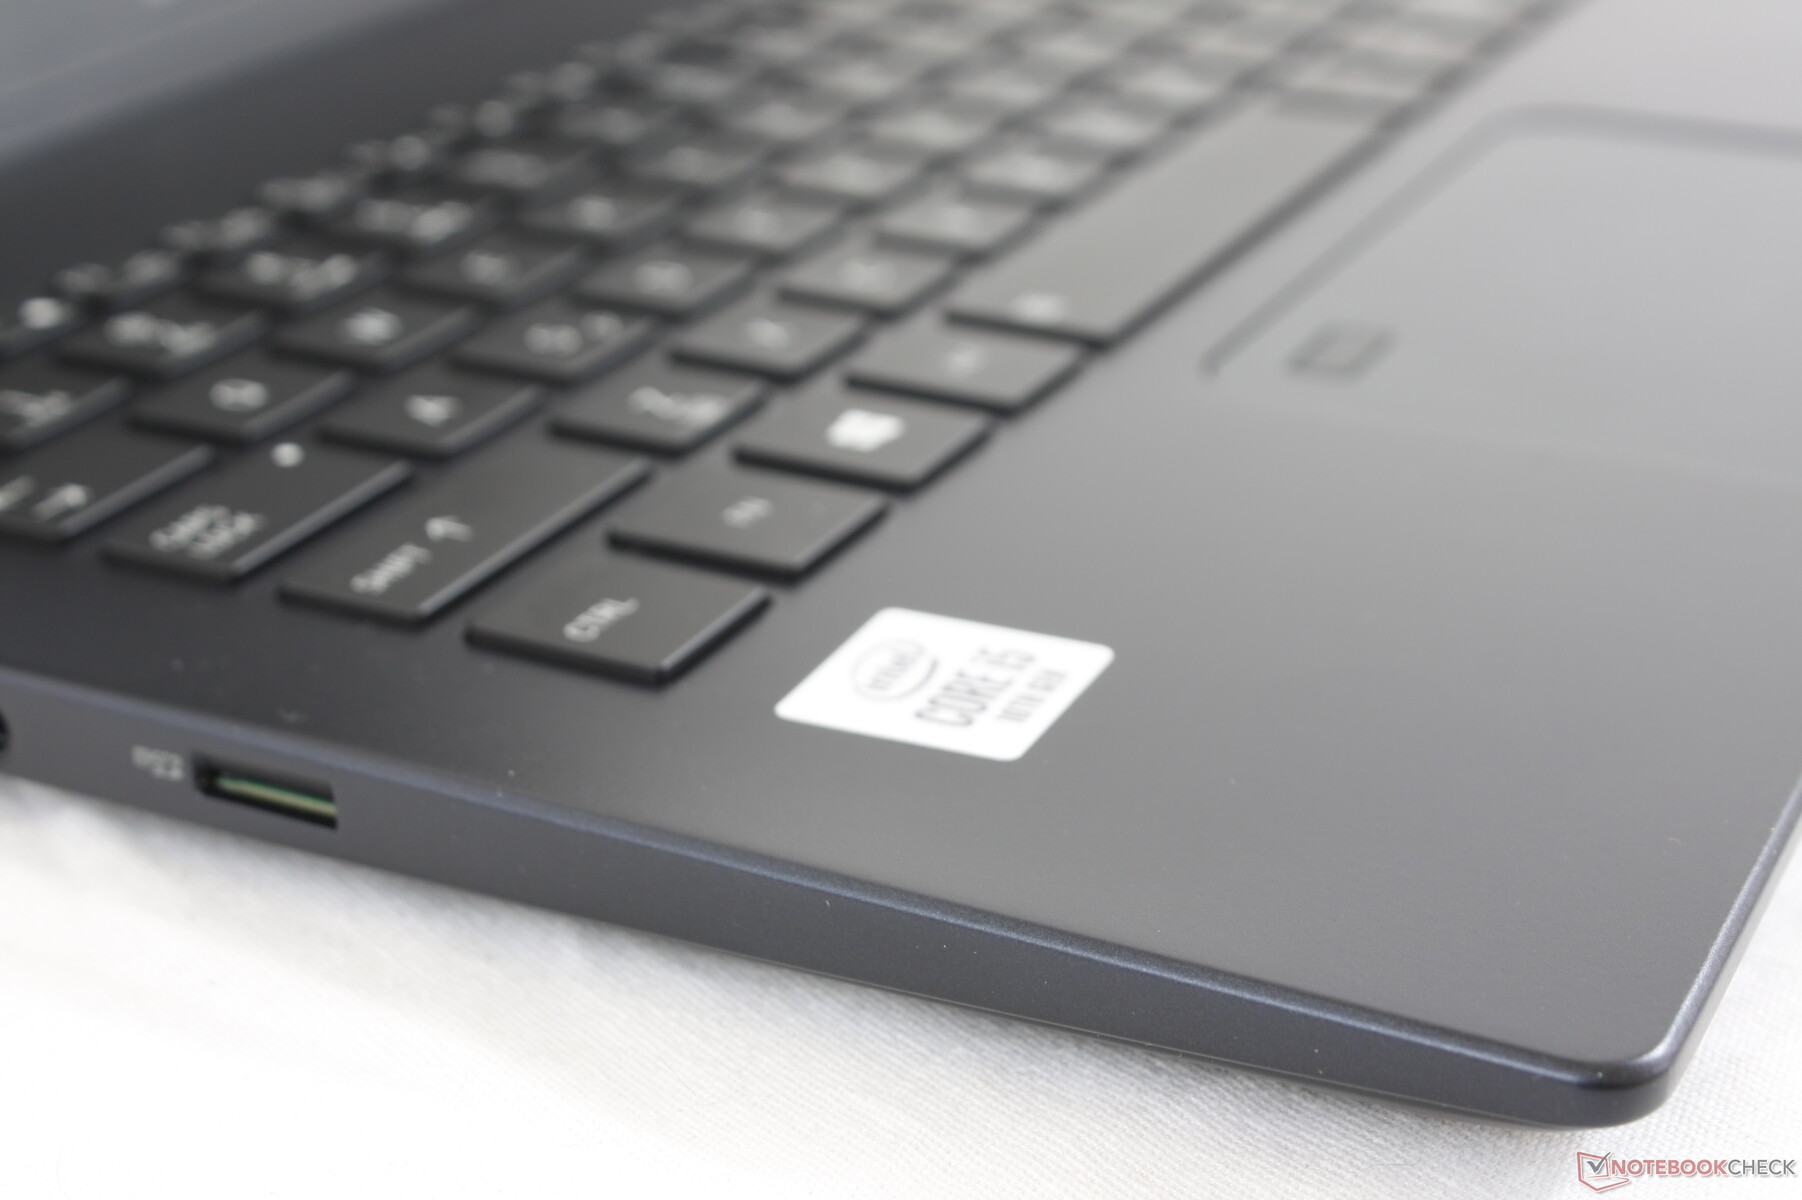
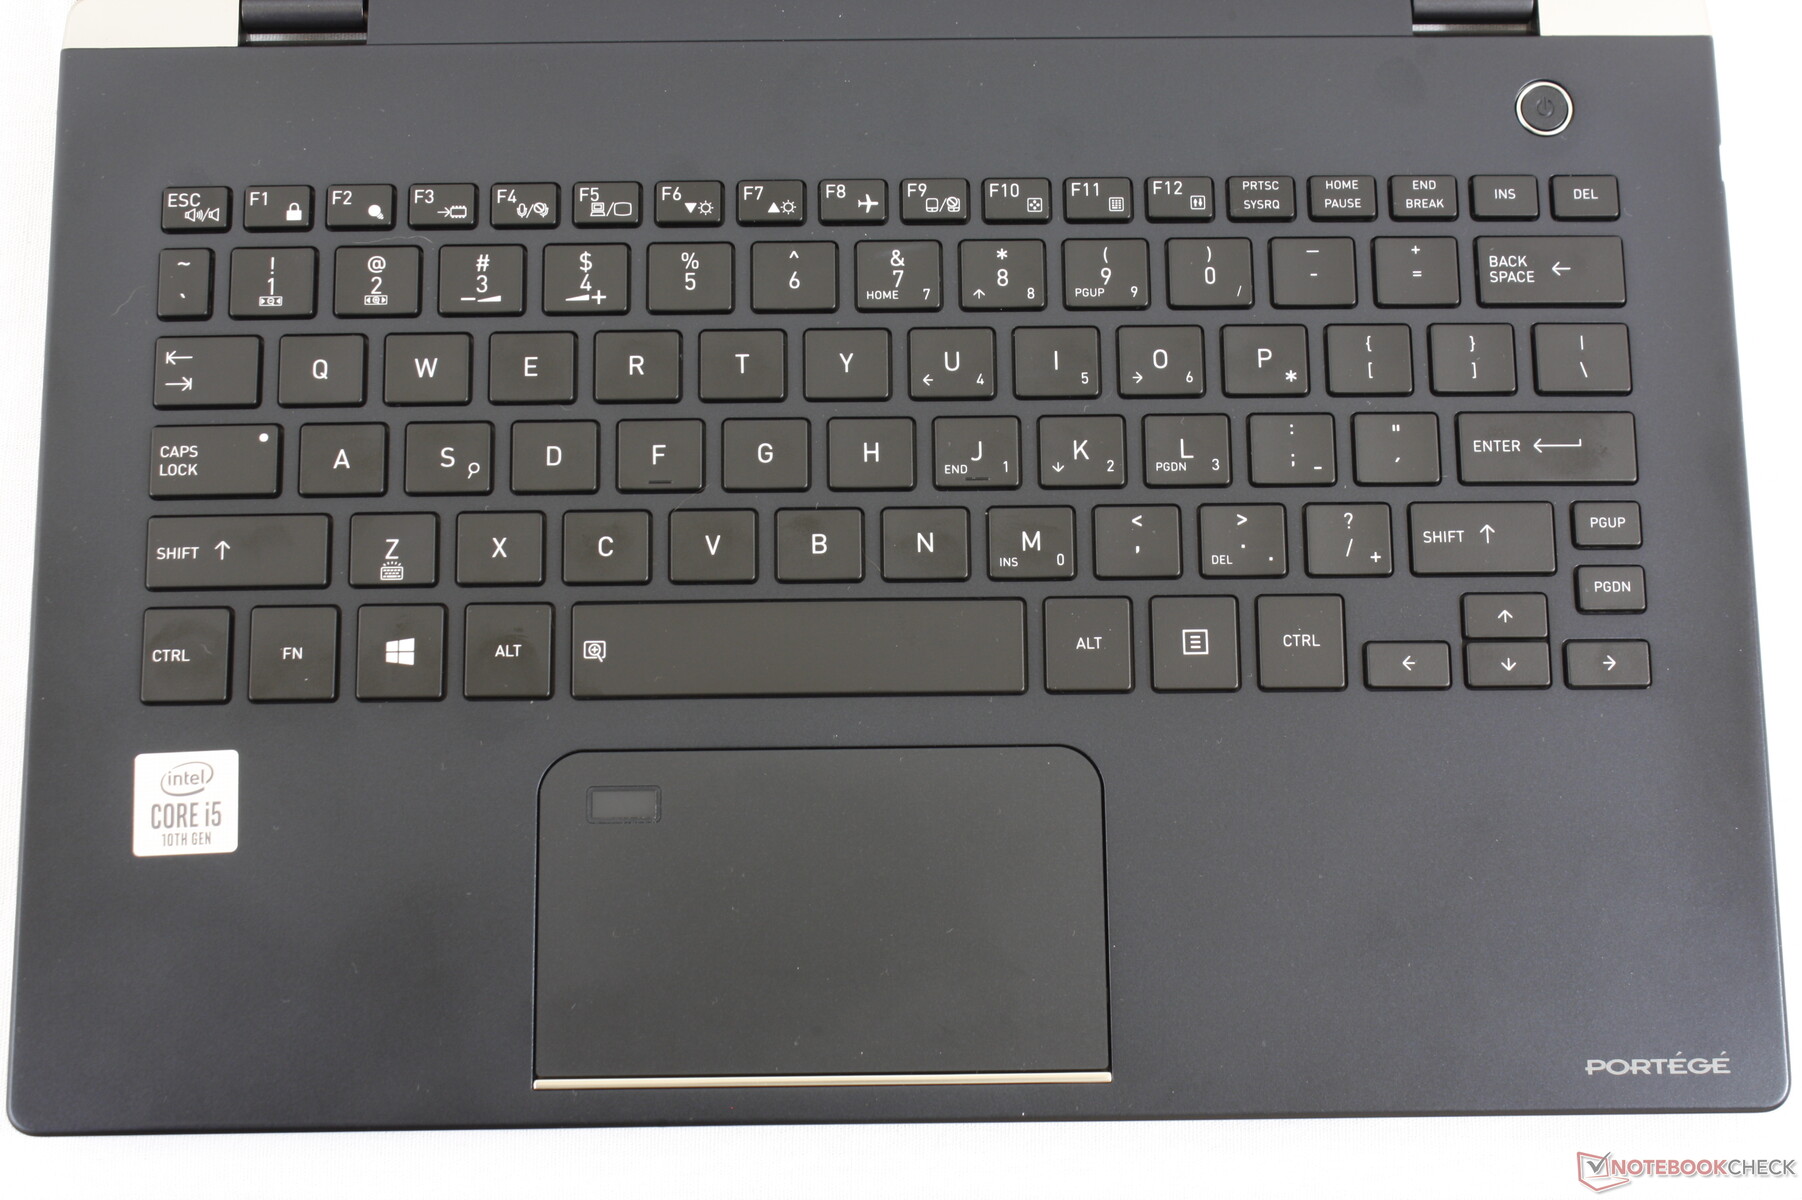
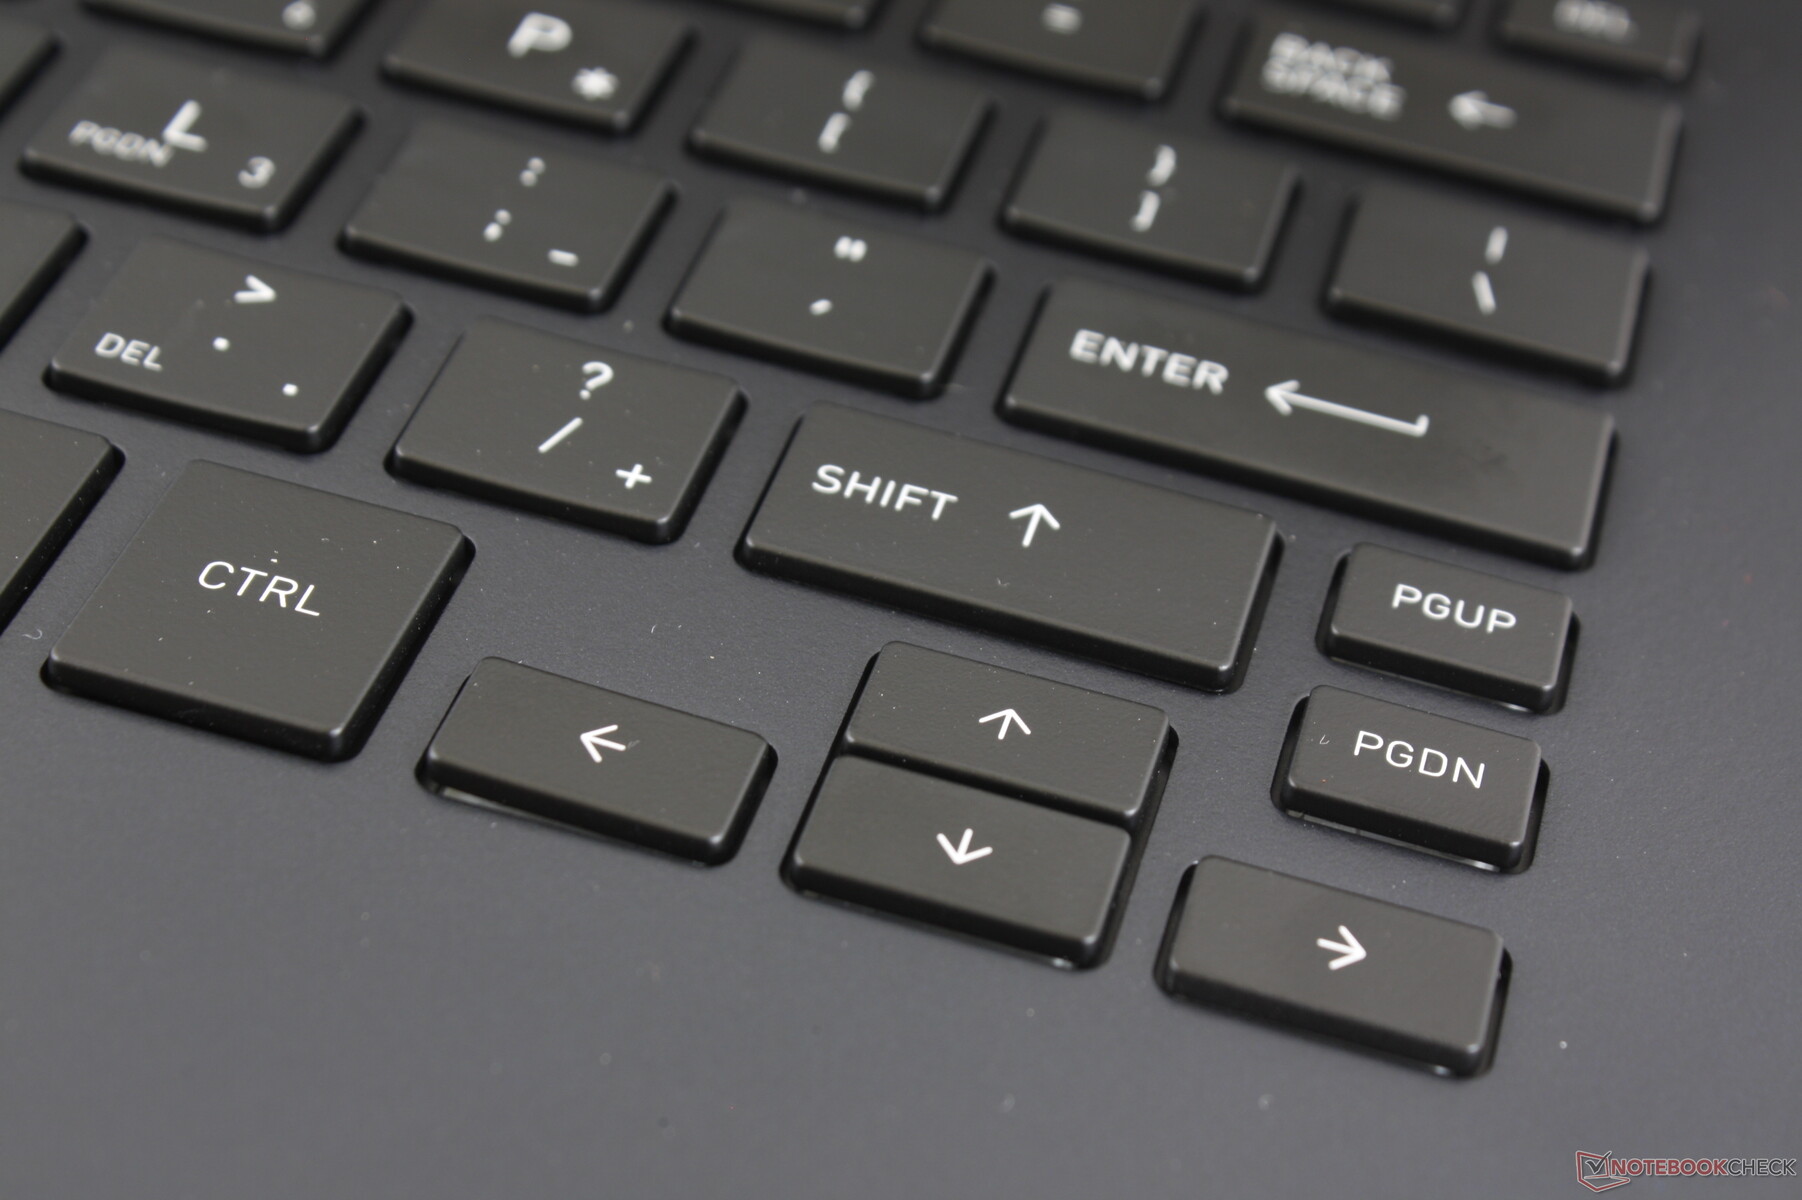
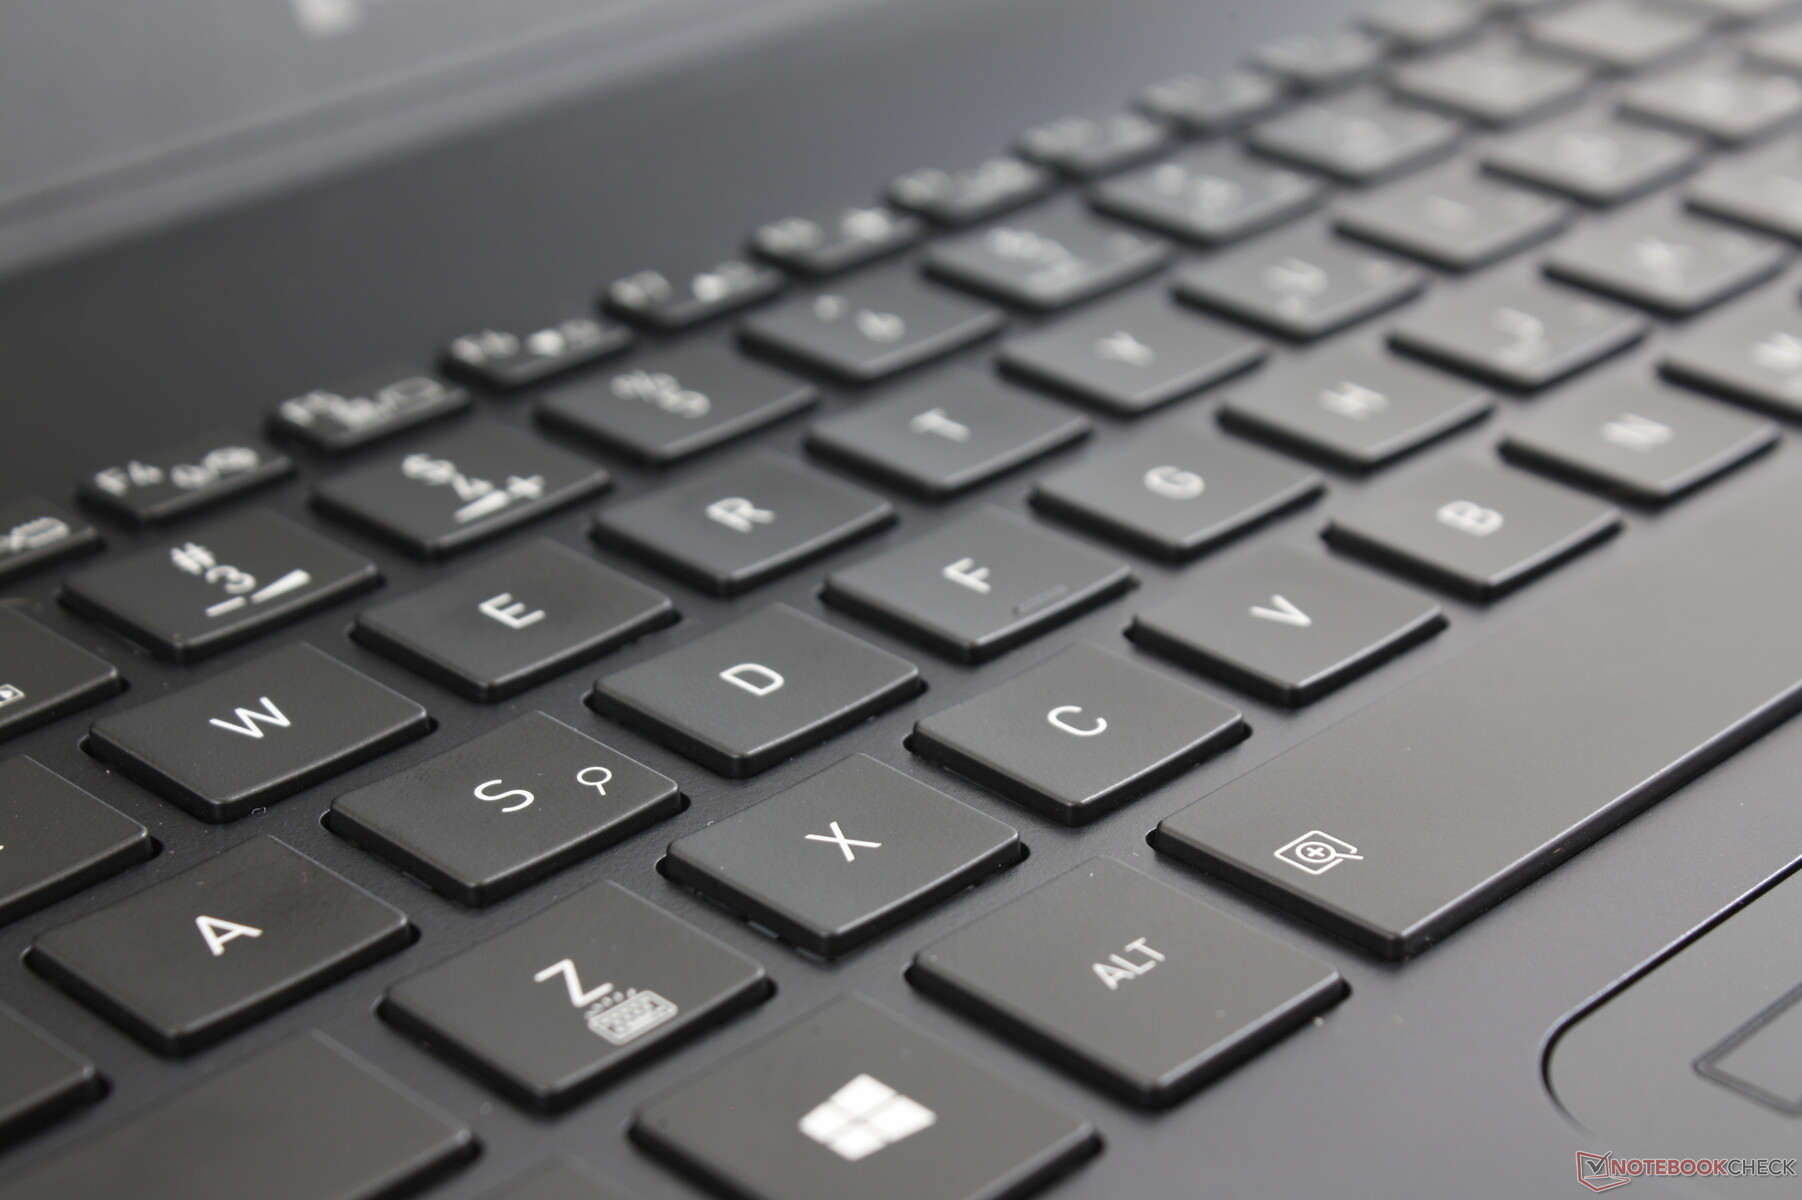
Key layout remains almost the same as the X30-F. Clatter is a bit louder than on most Ultrabooks including the XPS 13 or LG Gram 13 with weaker key feedback than on the HP EliteBook 1030. The individual keys are small as well and so there is a lot of empty space between each key. Making the keys larger would have made typing feel less cramped.
Touchpad
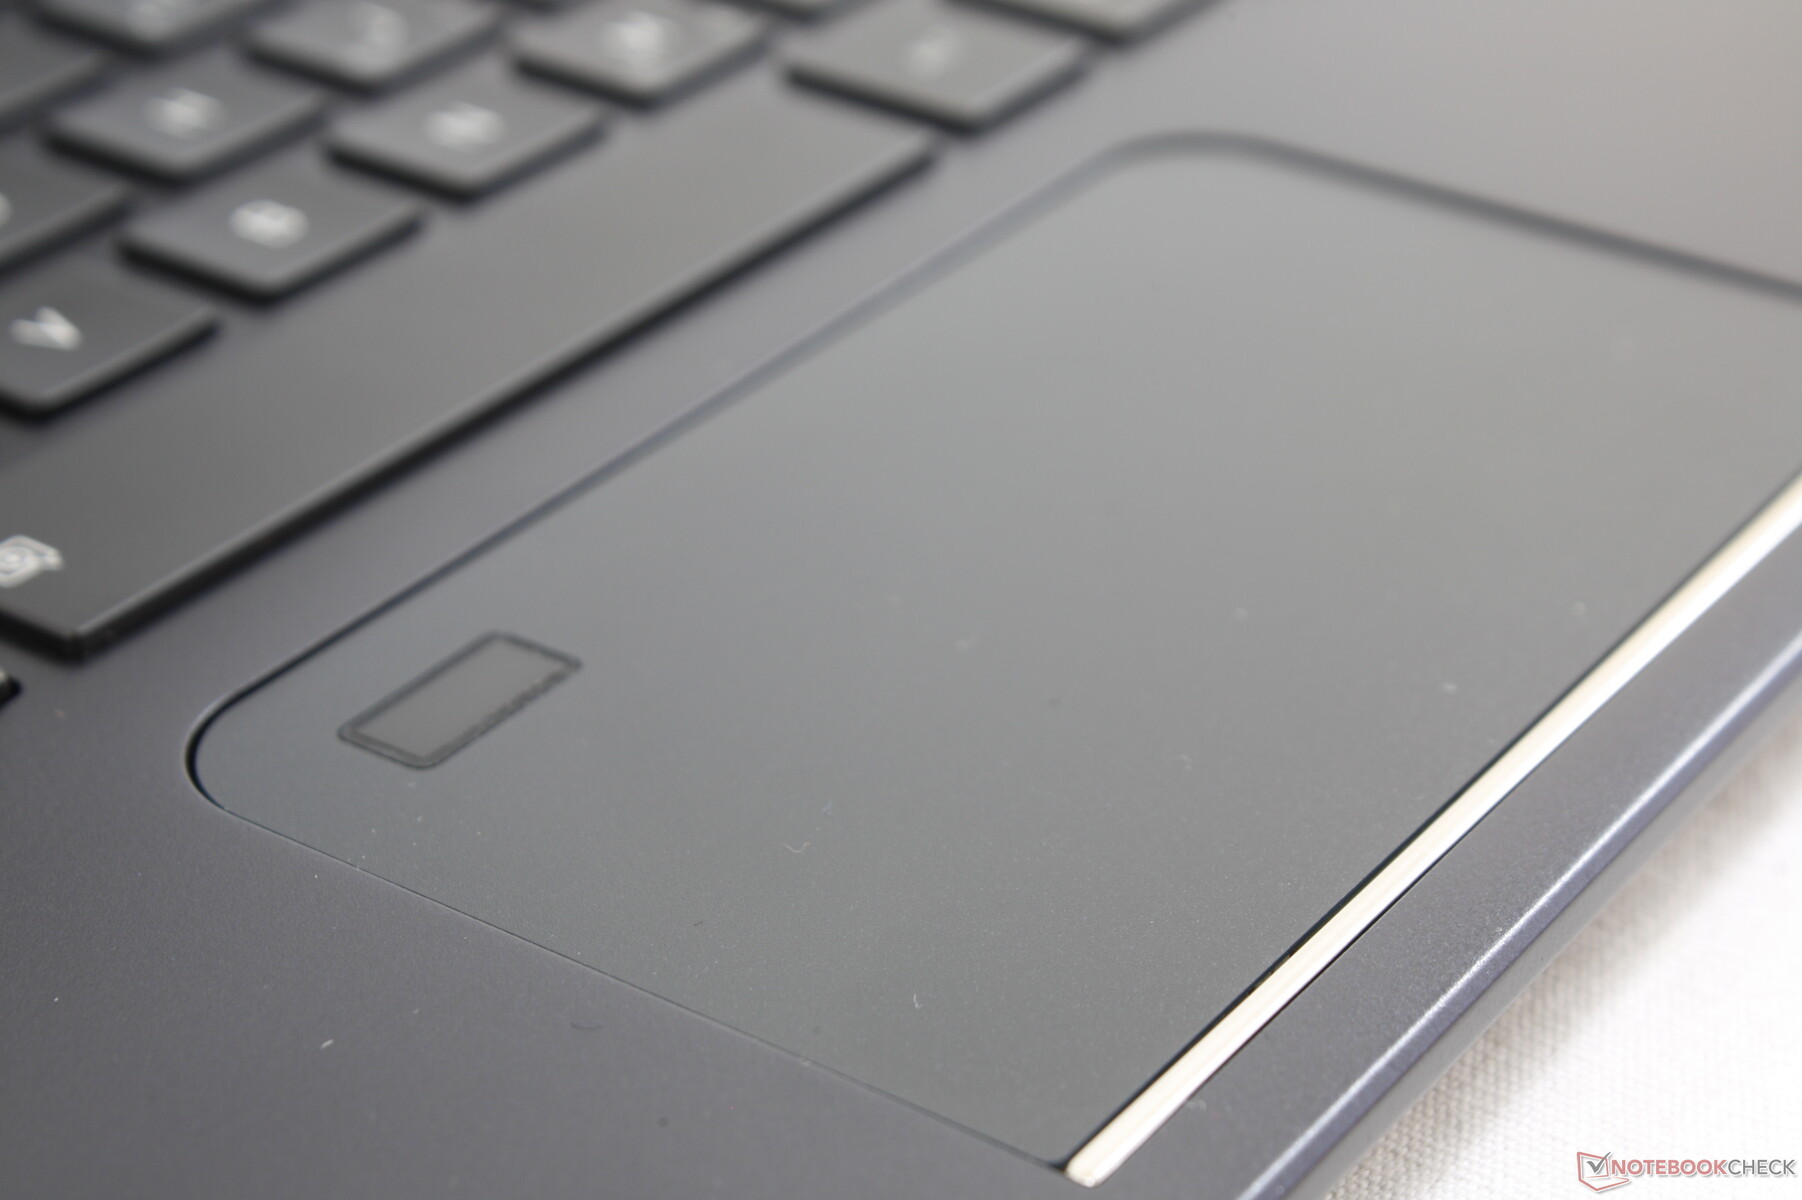
The Precision-enabled clickpad (10 x 5.8 cm) is smaller than the one on the LG Gram 13 (10.5 x 7 cm). Furthermore, the fingerprint reader continues to occupy space on the clickpad that could have otherwise been used for cursor control while most other laptops have re-positioned the fingerprint reader elsewhere.
Cursor control is smooth and reliable on the slightly roughened clickpad surface. Some sticking occurs at very slow speeds as expected. The integrated mouse click is very shallow in travel with somewhat spongy feedback. Seasoned business users will probably miss the dedicated mouse keys and the TrackPoint pointing stick as found on the Portege X30-F.
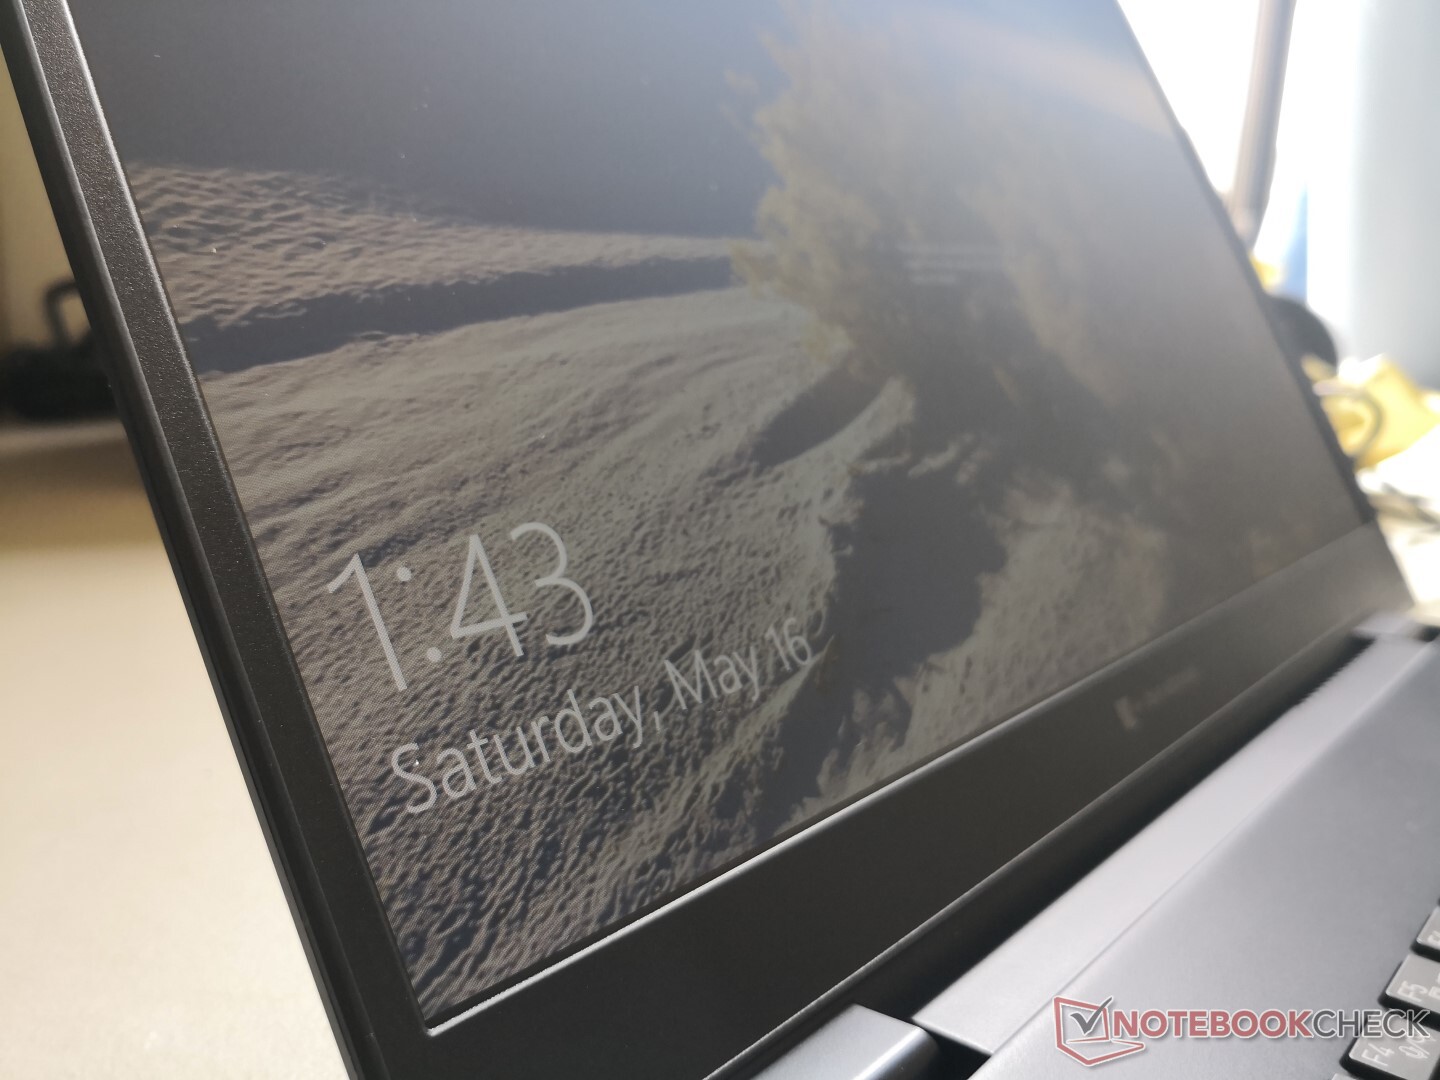
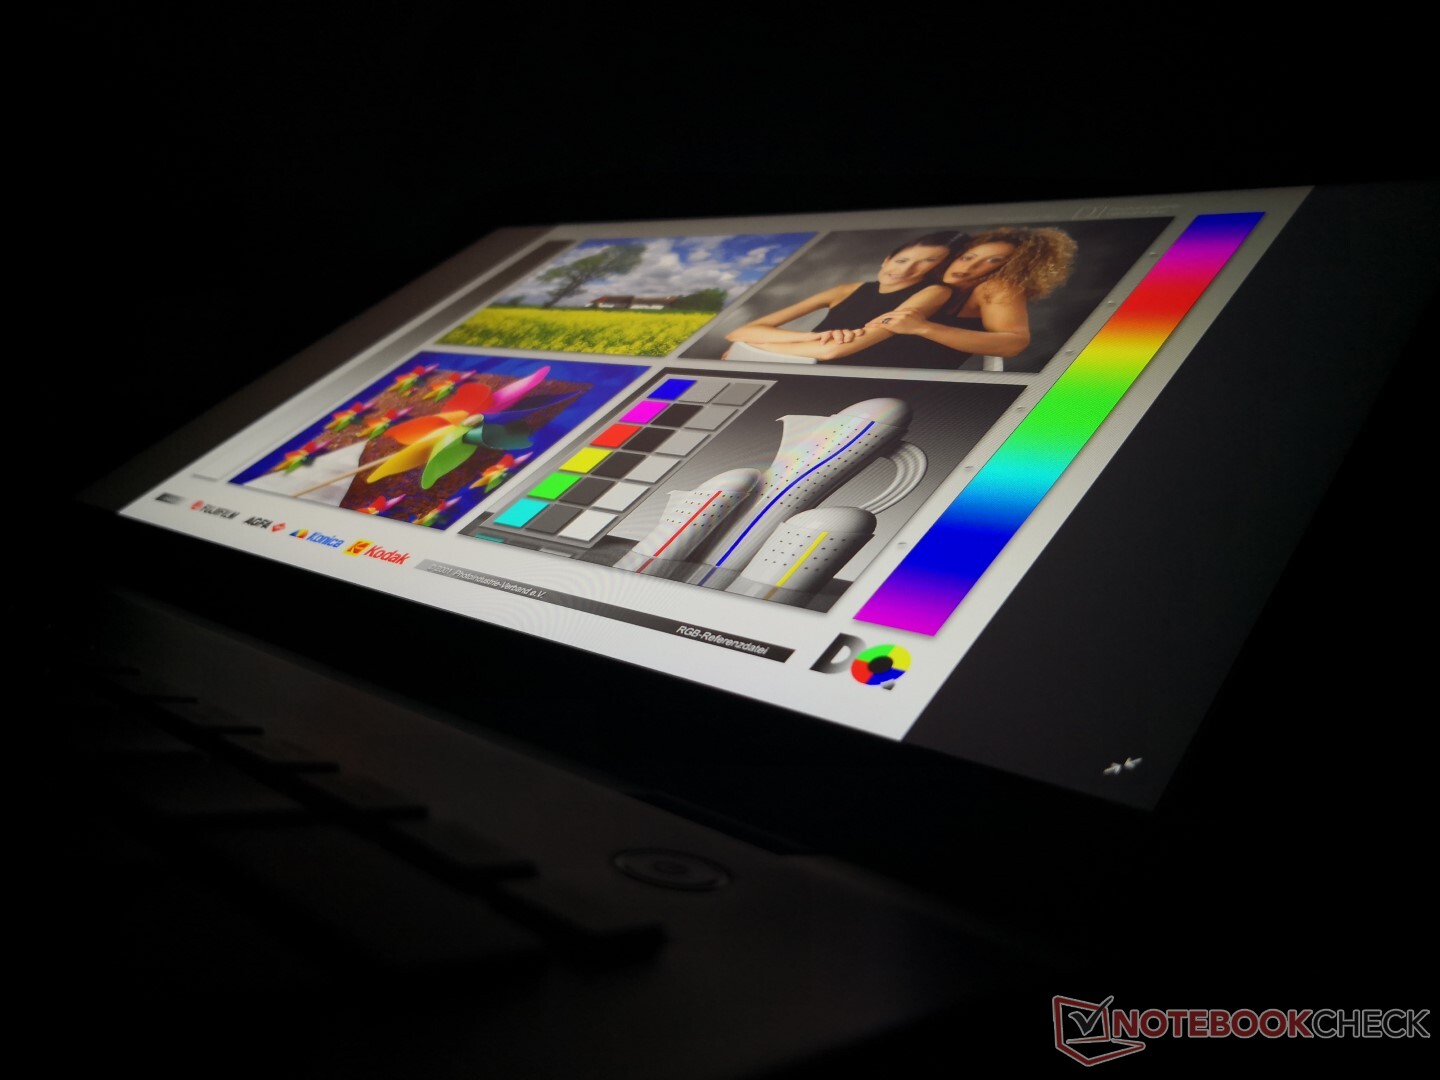
Display
Interestingly, HWiNFO cannot identify the exact Toshiba panel on our unit other than the TOS508F controller. This particular controller is shared between several other Portege laptops including the Z30t, X30T, and X20W.
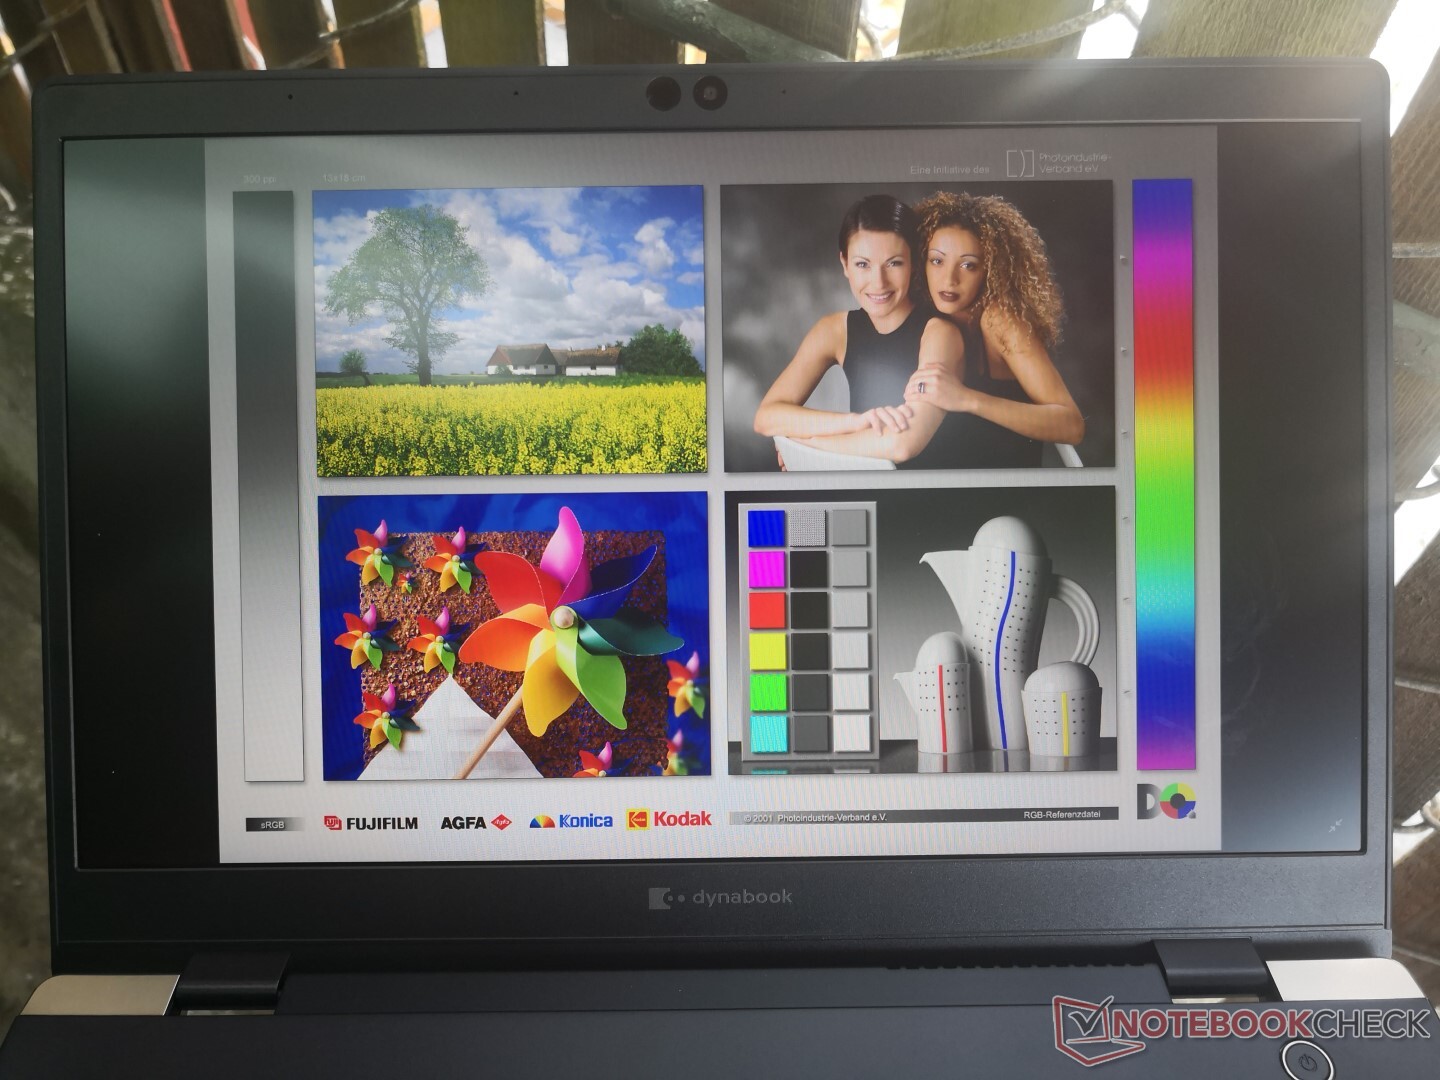
Display quality is excellent and comparable to high-end Ultrabooks. It's bright at about 450 nits with high contrast ratio and deep colors unlike the horrid 768p panels on some older Tecra systems.
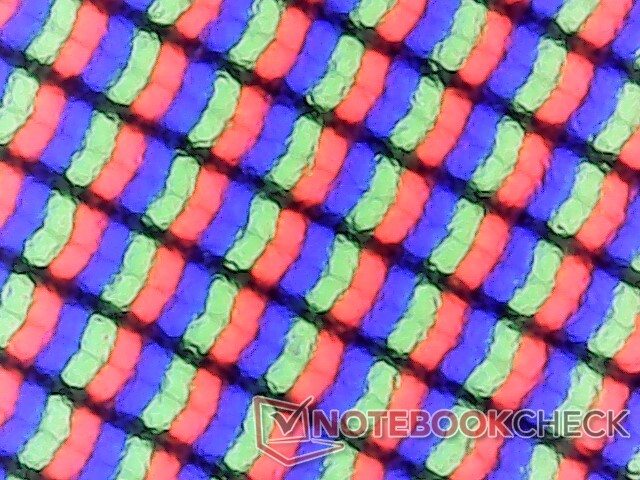
Onscreen texts and images are not as crisp as on a glossy laptop like the XPS 13 9300 due to the matte overlay as shown by our RGB microscope screenshot below. For a business-centric laptop, this likely won't bother the target audience.
| |||||||||||||||||||||||||
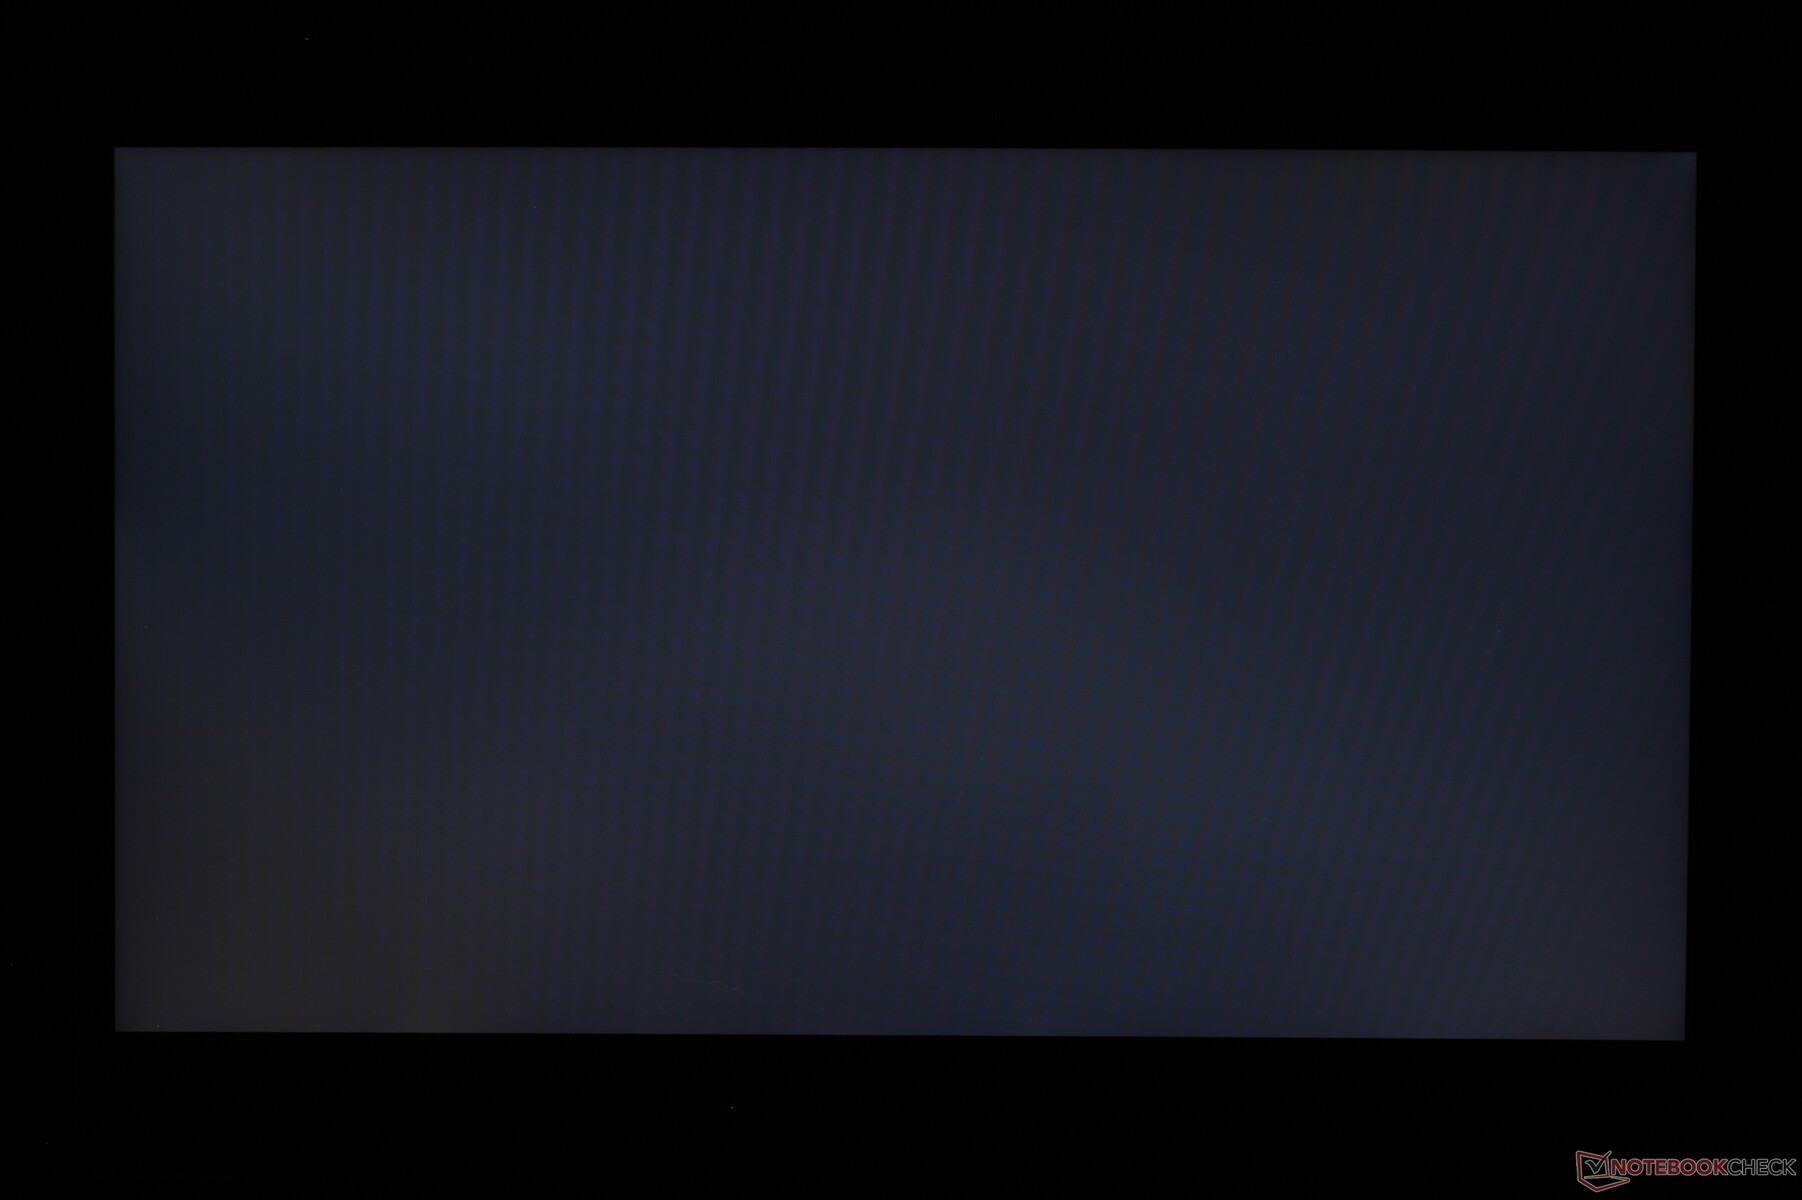
Brightness Distribution: 91 %
Center on Battery: 482 cd/m²
Contrast: 1205:1 (Black: 0.4 cd/m²)
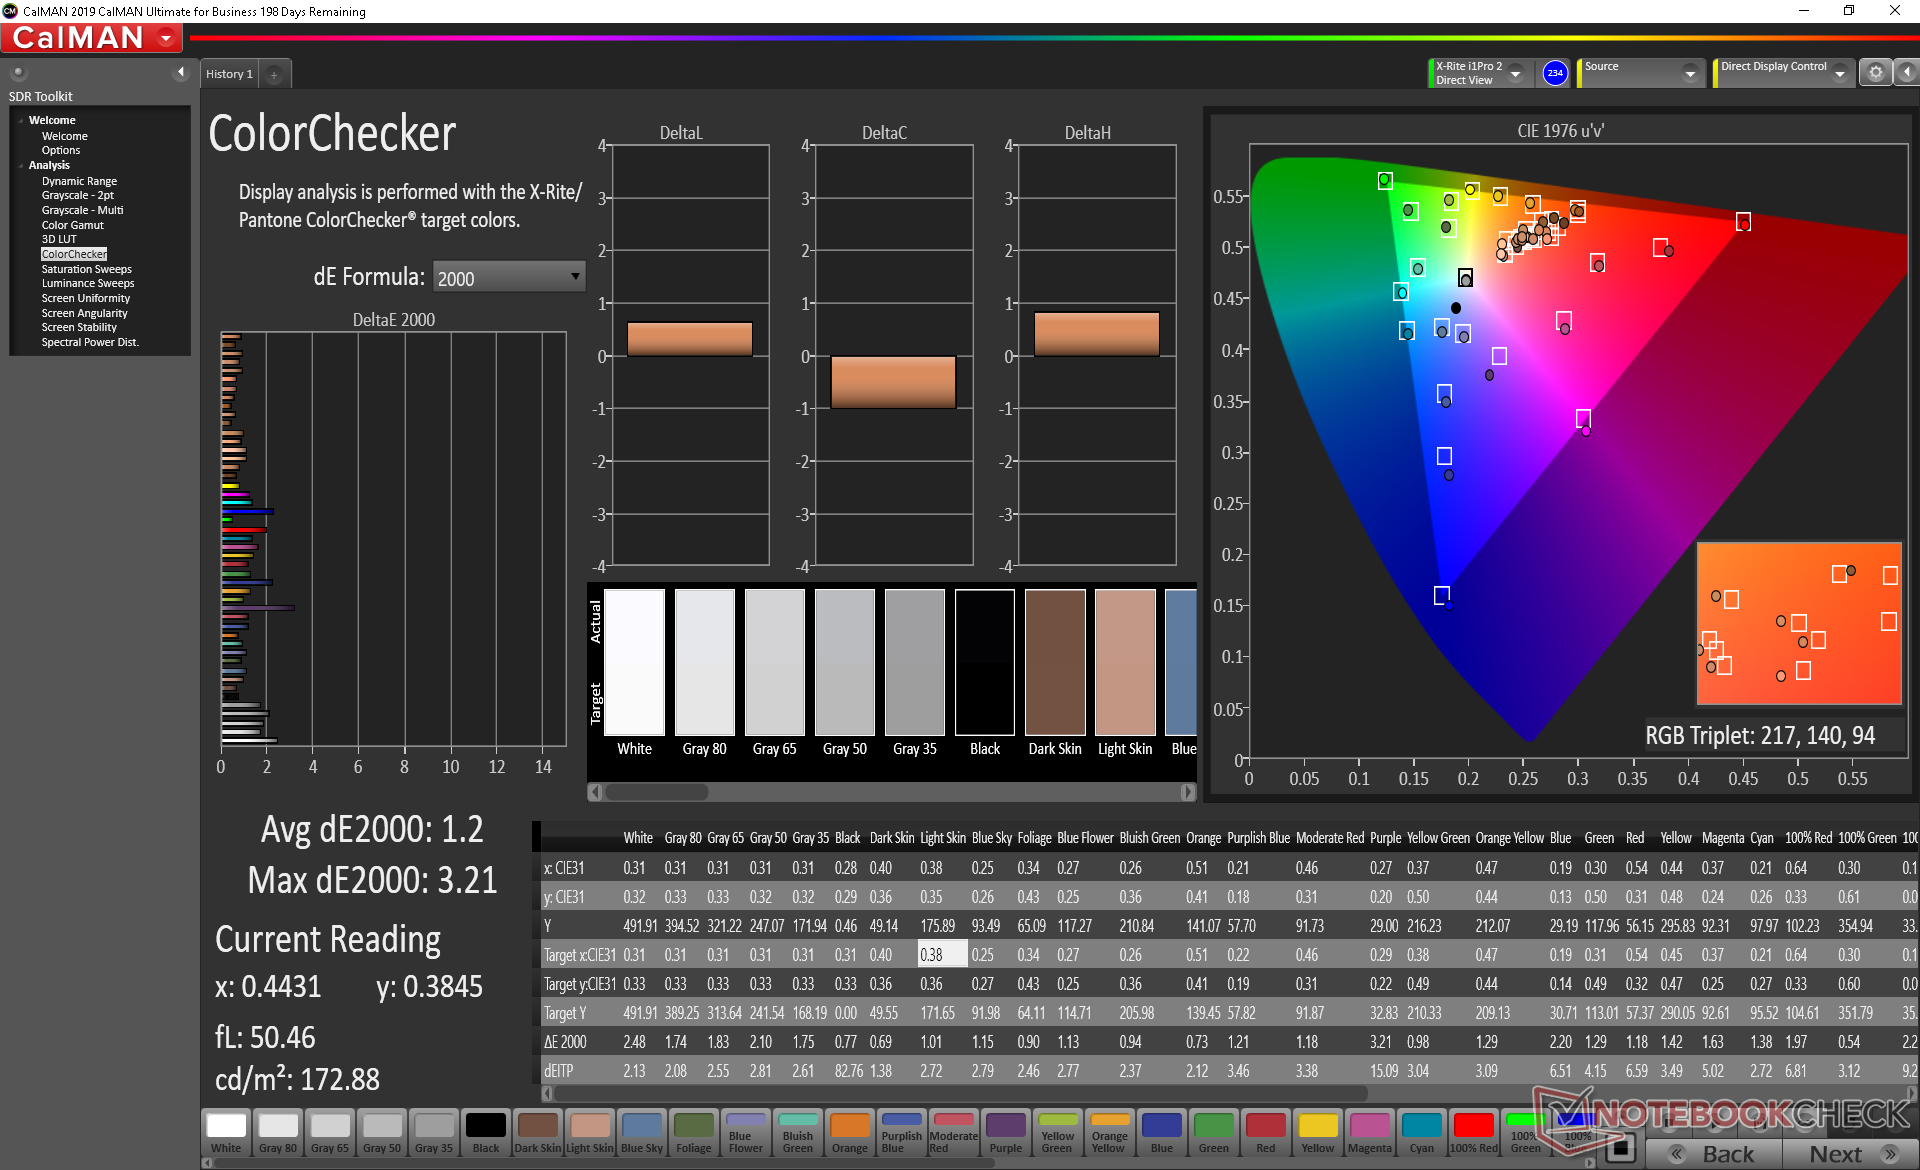
ΔE ColorChecker Calman: 1.85 | ∀{0.5-29.43 Ø4.71}
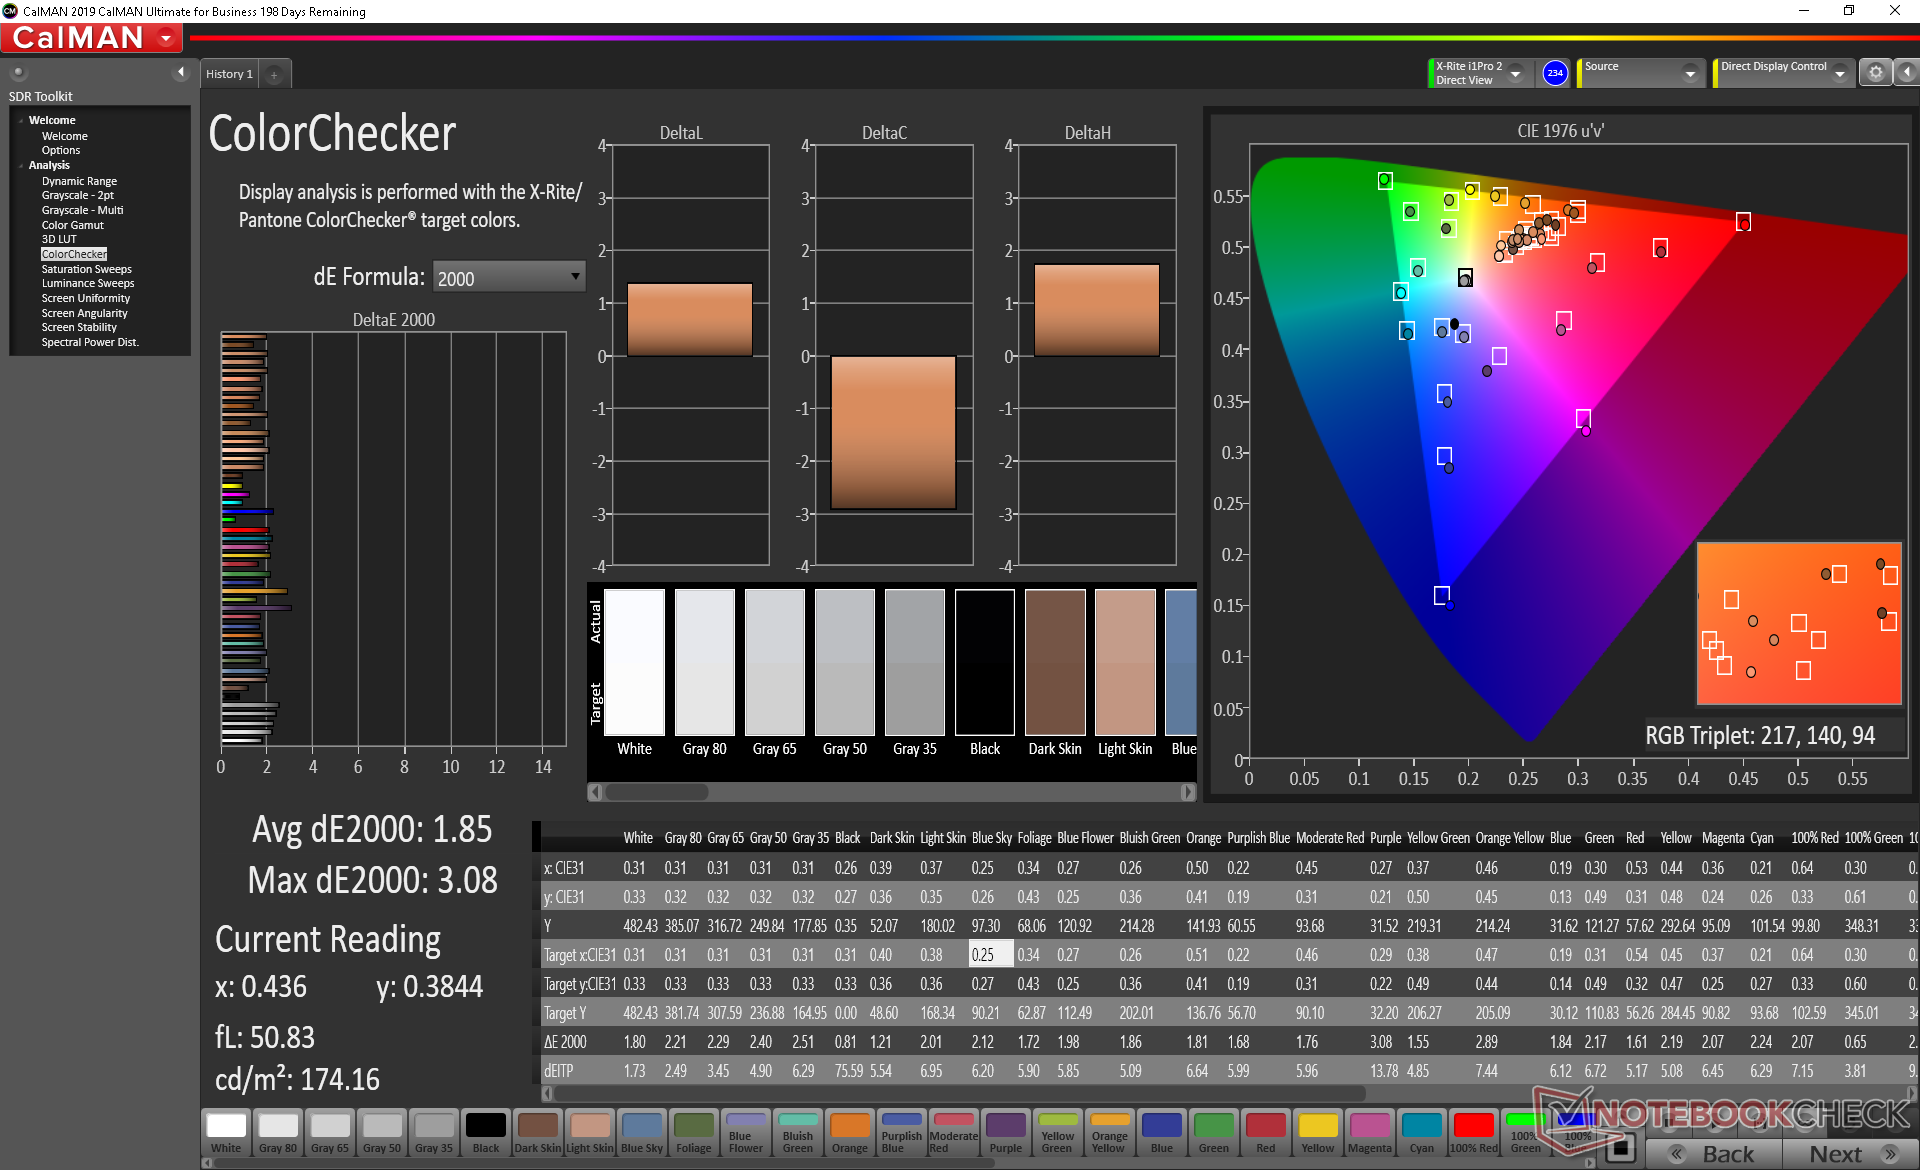
calibrated: 1.2
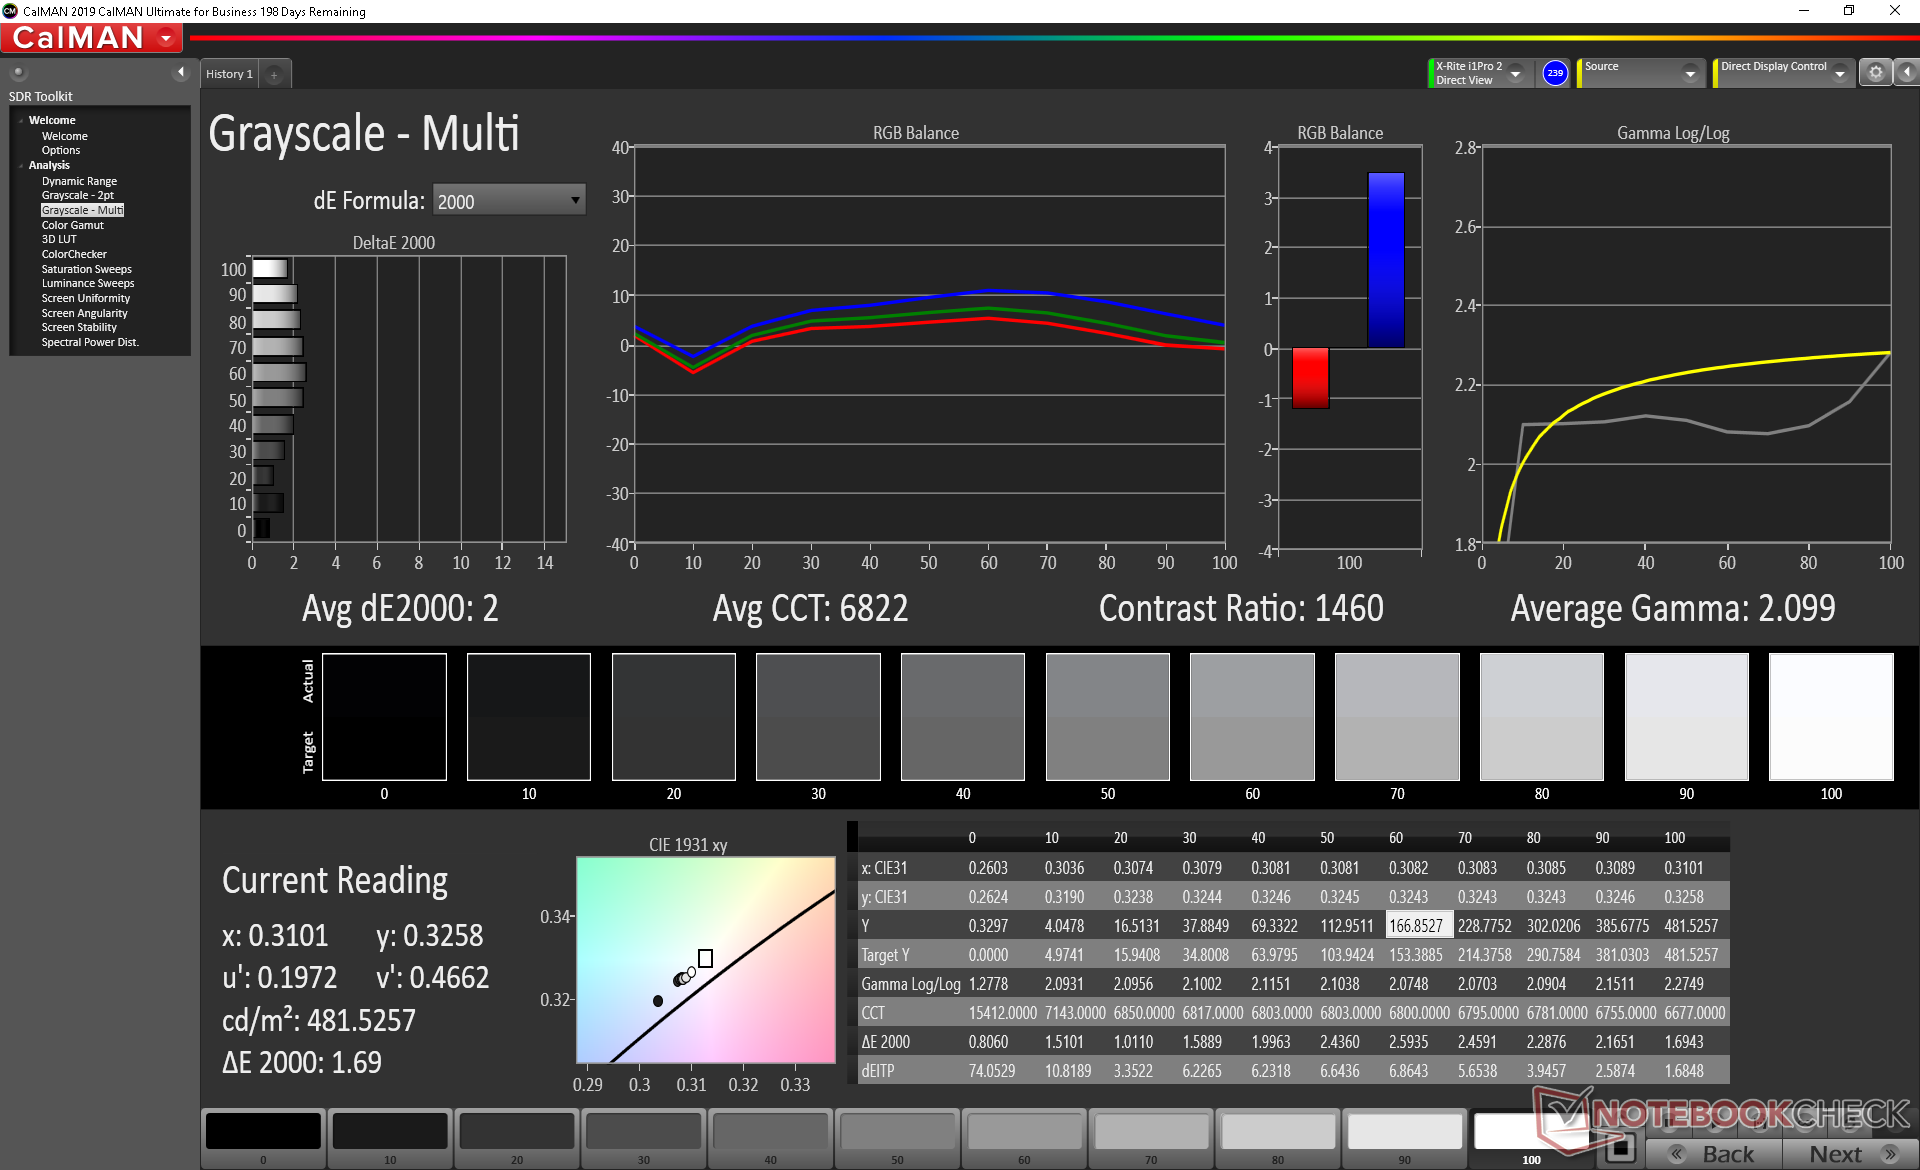
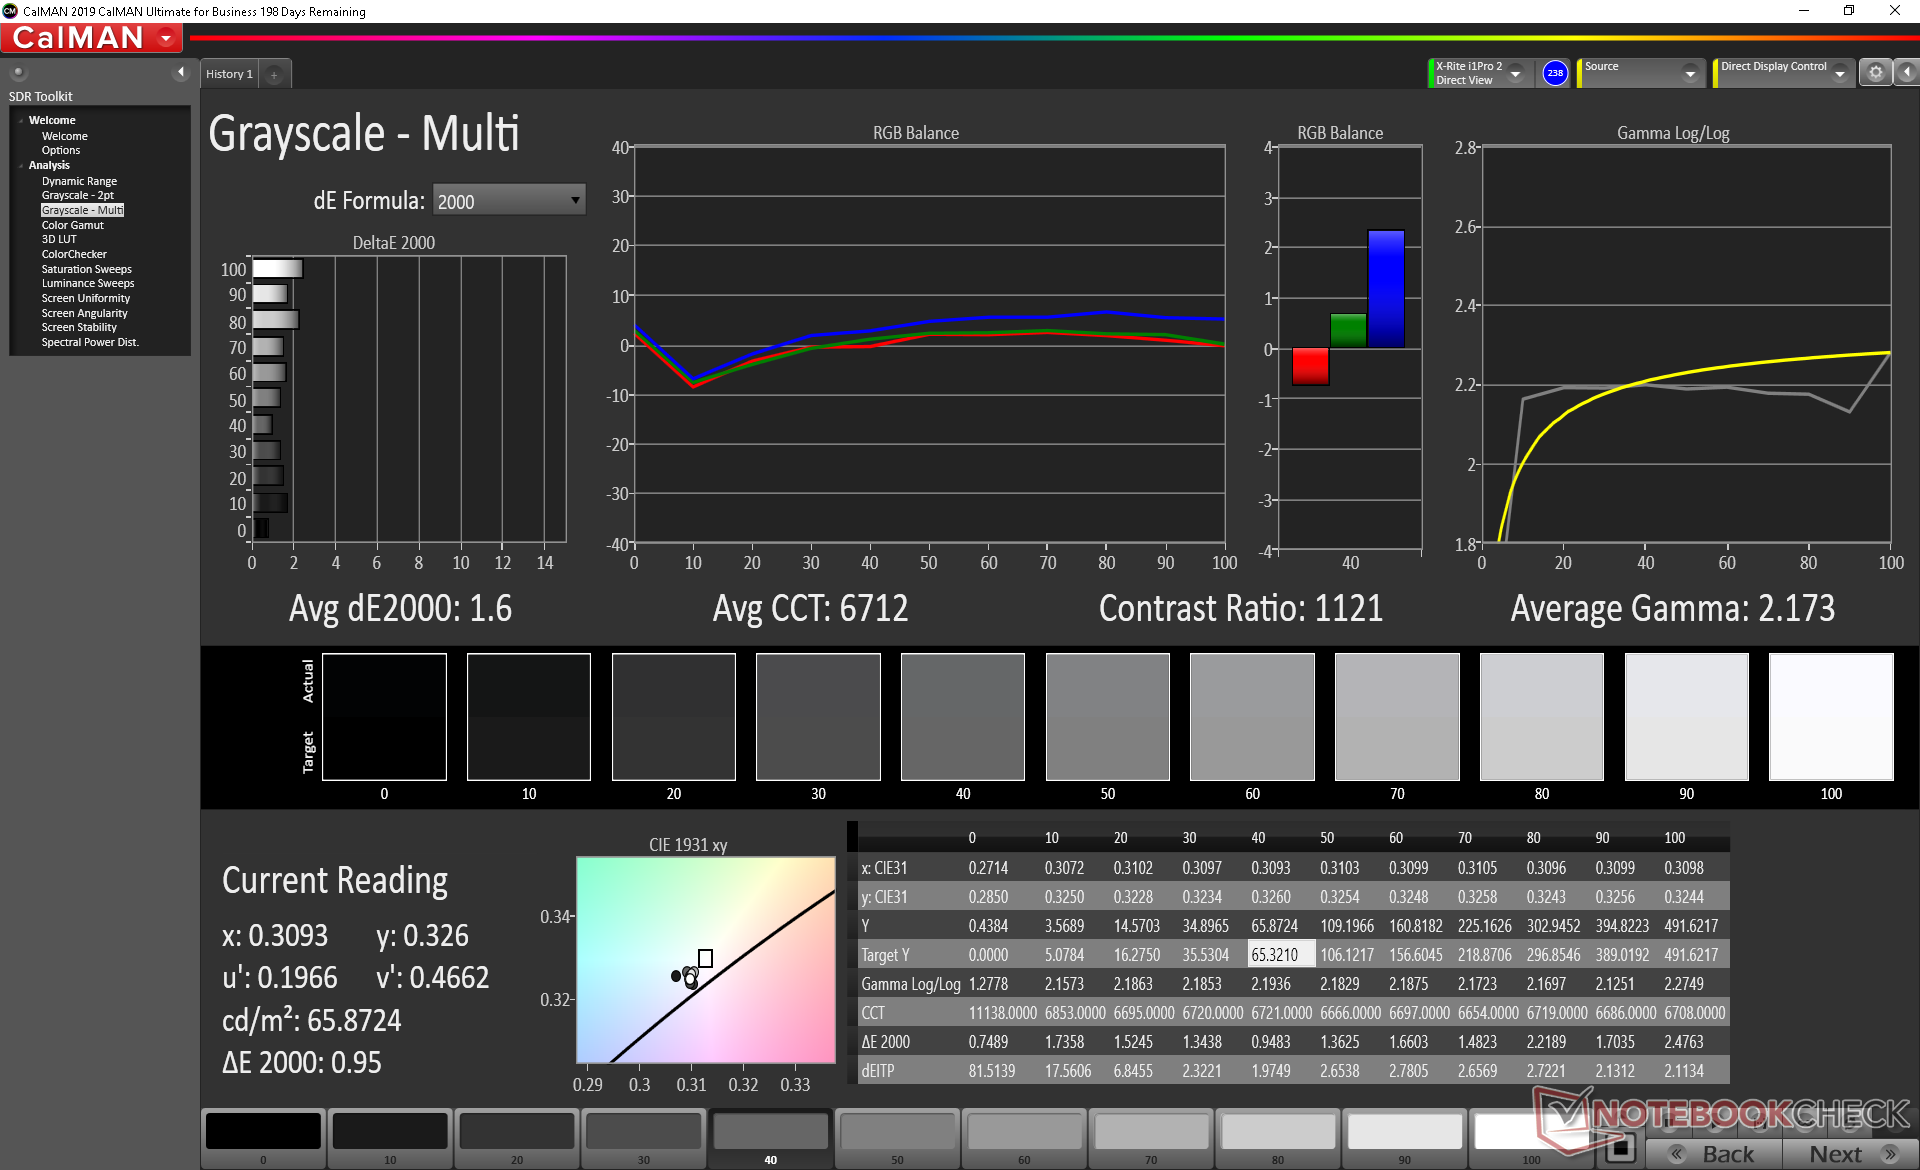
ΔE Greyscale Calman: 2 | ∀{0.09-98 Ø4.96}
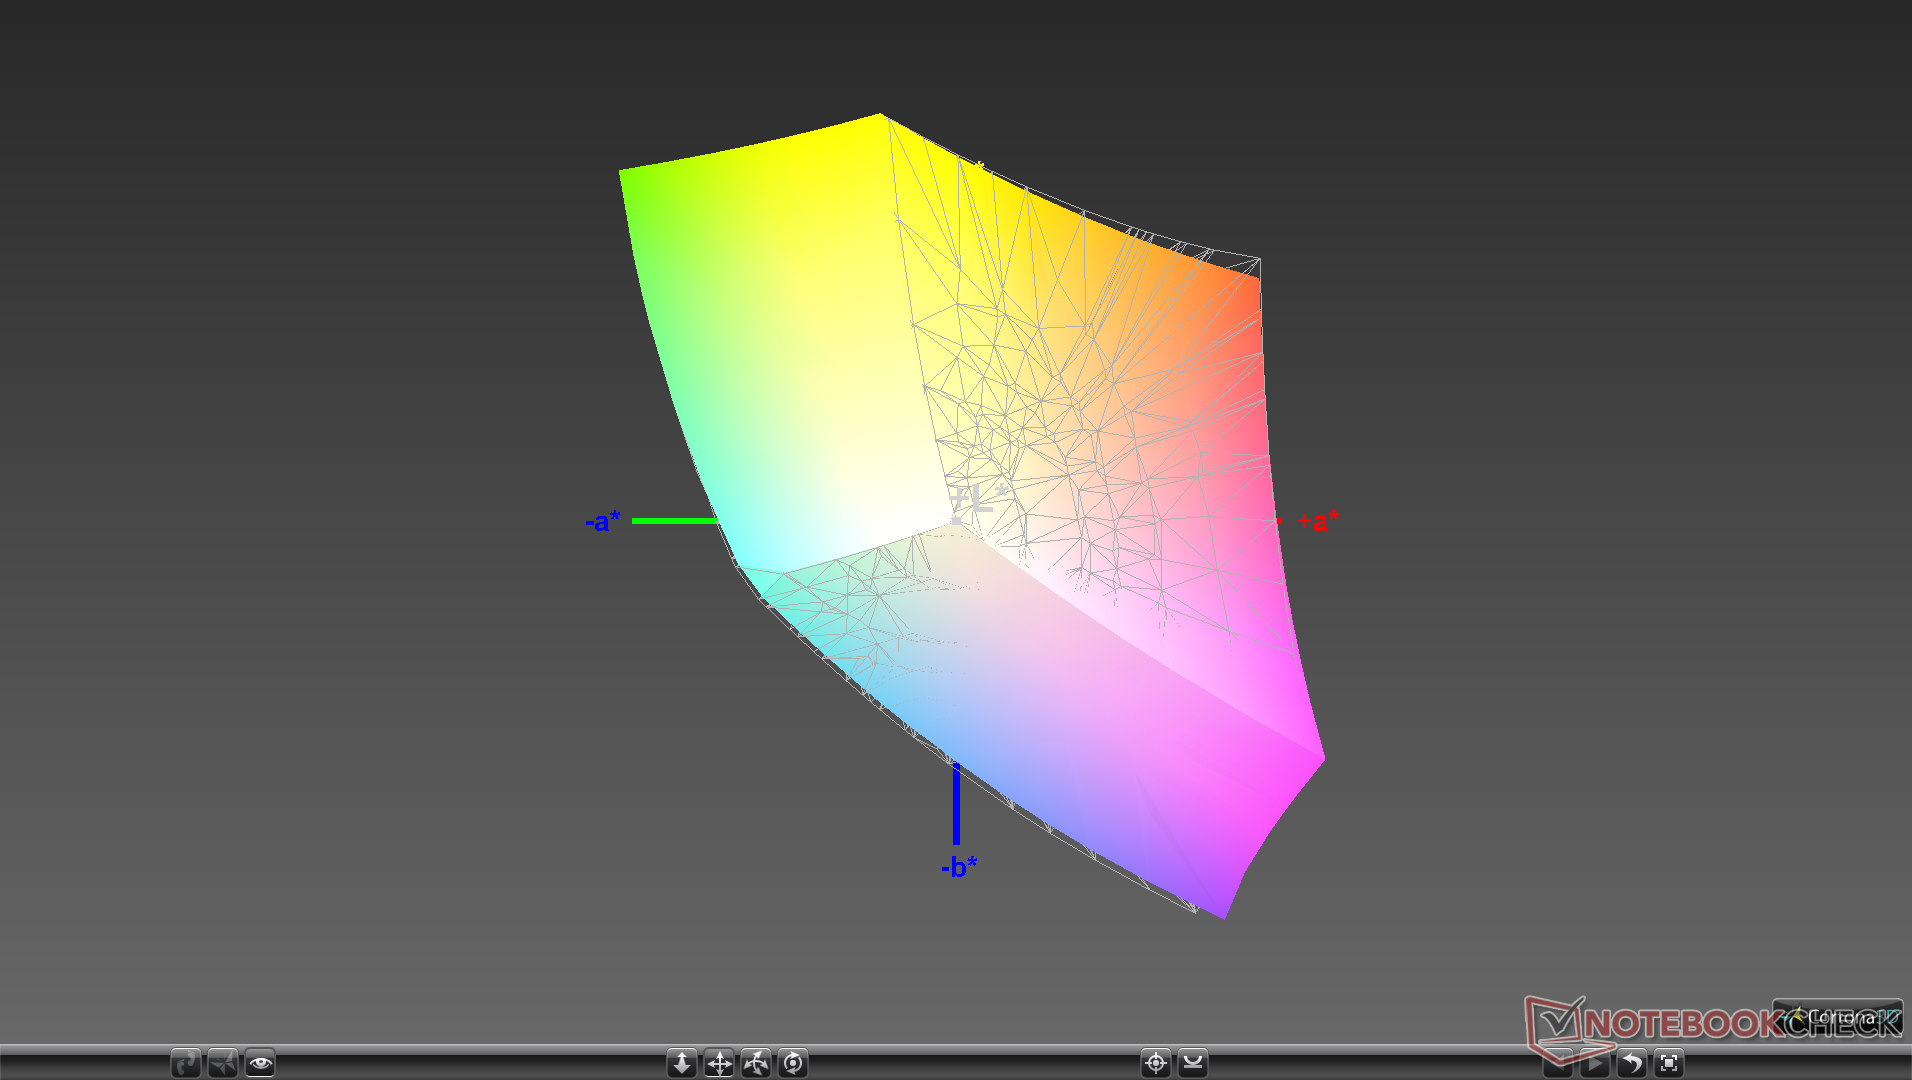
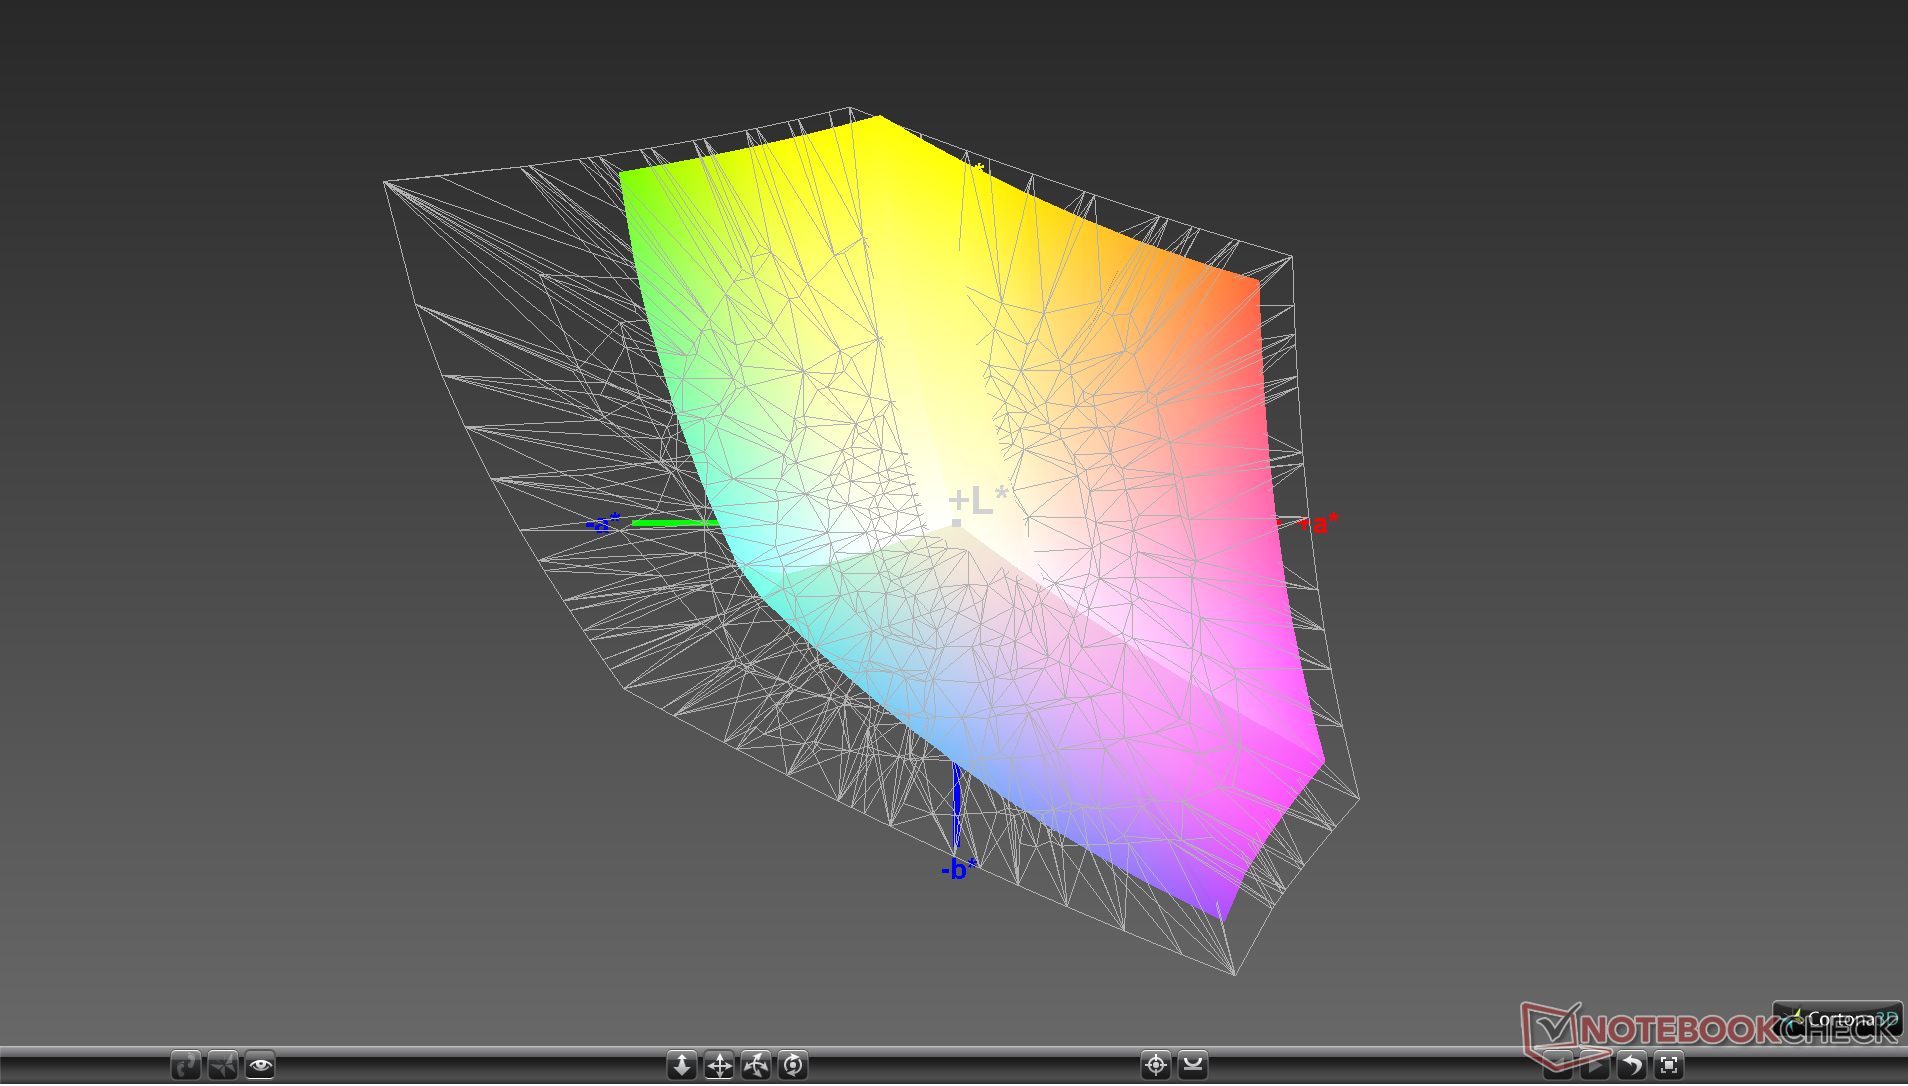
97.7% sRGB (Argyll 1.6.3 3D)
62.5% AdobeRGB 1998 (Argyll 1.6.3 3D)
67.8% AdobeRGB 1998 (Argyll 3D)
97.6% sRGB (Argyll 3D)
66.9% Display P3 (Argyll 3D)
Gamma: 2.1
CCT: 6822 K
| Dynabook Portege X30L-G1331 Toshiba TOS508F, IPS, 13.3", 1920x1080 | Dell XPS 13 9300 Core i7-1065G7 Sharp LQ134N1, IPS, 13.4", 1920x1200 | LG Gram 13Z980-A LG LP133WF6-SPC1, IPS, 13.3", 1920x1080 | Apple MacBook Pro 13 2019 2TB3 APPA03D, IPS, 13.3", 2560x1600 | Lenovo ThinkBook 13s-20R90071GE N133HCE-EN2, a-Si IPS LED, 13.3", 1920x1080 | HP EliteBook 830 G5-3JX74EA IVO M133NVF3-R0, IPS LED, 13.3", 1920x1080 | |
|---|---|---|---|---|---|---|
| Display | 0% | 0% | 24% | 1% | -6% | |
| Display P3 Coverage (%) | 66.9 | 66.3 -1% | 66.9 0% | 96.1 44% | 67 0% | 64.2 -4% |
| sRGB Coverage (%) | 97.6 | 97.3 0% | 97.3 0% | 99.4 2% | 99.1 2% | 89.2 -9% |
| AdobeRGB 1998 Coverage (%) | 67.8 | 68.5 1% | 67.9 0% | 85.6 26% | 69.2 2% | 65.2 -4% |
| Response Times | 8% | 27% | 5% | 23% | 32% | |
| Response Time Grey 50% / Grey 80% * (ms) | 54.8 ? | 50 ? 9% | 37.6 ? 31% | 50.4 ? 8% | 40.4 ? 26% | 36 ? 34% |
| Response Time Black / White * (ms) | 35.6 ? | 33.2 ? 7% | 27.6 ? 22% | 35.2 ? 1% | 28.8 ? 19% | 24.8 ? 30% |
| PWM Frequency (Hz) | 23810 ? | 2500 ? | 116300 ? | 25000 ? | 1020 ? | |
| Screen | -30% | -37% | 16% | -19% | -66% | |
| Brightness middle (cd/m²) | 482 | 607.6 26% | 347.8 -28% | 603 25% | 319 -34% | 316 -34% |
| Brightness (cd/m²) | 452 | 595 32% | 331 -27% | 577 28% | 309 -32% | 326 -28% |
| Brightness Distribution (%) | 91 | 96 5% | 89 -2% | 92 1% | 92 1% | 85 -7% |
| Black Level * (cd/m²) | 0.4 | 0.4 -0% | 0.36 10% | 0.35 13% | 0.28 30% | 0.19 52% |
| Contrast (:1) | 1205 | 1519 26% | 966 -20% | 1723 43% | 1139 -5% | 1663 38% |
| Colorchecker dE 2000 * | 1.85 | 3.23 -75% | 2.37 -28% | 1.7 8% | 2.4 -30% | 4.5 -143% |
| Colorchecker dE 2000 max. * | 3.08 | 8.67 -181% | 4.21 -37% | 3.1 -1% | 6.3 -105% | 12.1 -293% |
| Colorchecker dE 2000 calibrated * | 1.2 | 1.01 16% | 4.21 -251% | 0.7 42% | 0.6 50% | 2.9 -142% |
| Greyscale dE 2000 * | 2 | 5.5 -175% | 2.5 -25% | 2.1 -5% | 3.8 -90% | 5 -150% |
| Gamma | 2.1 105% | 2.12 104% | 2.15 102% | 2.18 101% | 2.16 102% | 2.22 99% |
| CCT | 6822 95% | 6413 101% | 6384 102% | 6843 95% | 7335 89% | 6018 108% |
| Color Space (Percent of AdobeRGB 1998) (%) | 62.5 | 63 1% | 62.5 0% | 76.7 23% | 63.5 2% | 57.9 -7% |
| Color Space (Percent of sRGB) (%) | 97.7 | 97.5 0% | 97 -1% | 99.4 2% | 99.1 1% | 87.3 -11% |
| Total Average (Program / Settings) | -7% /
-19% | -3% /
-22% | 15% /
16% | 2% /
-10% | -13% /
-42% |
* ... smaller is better
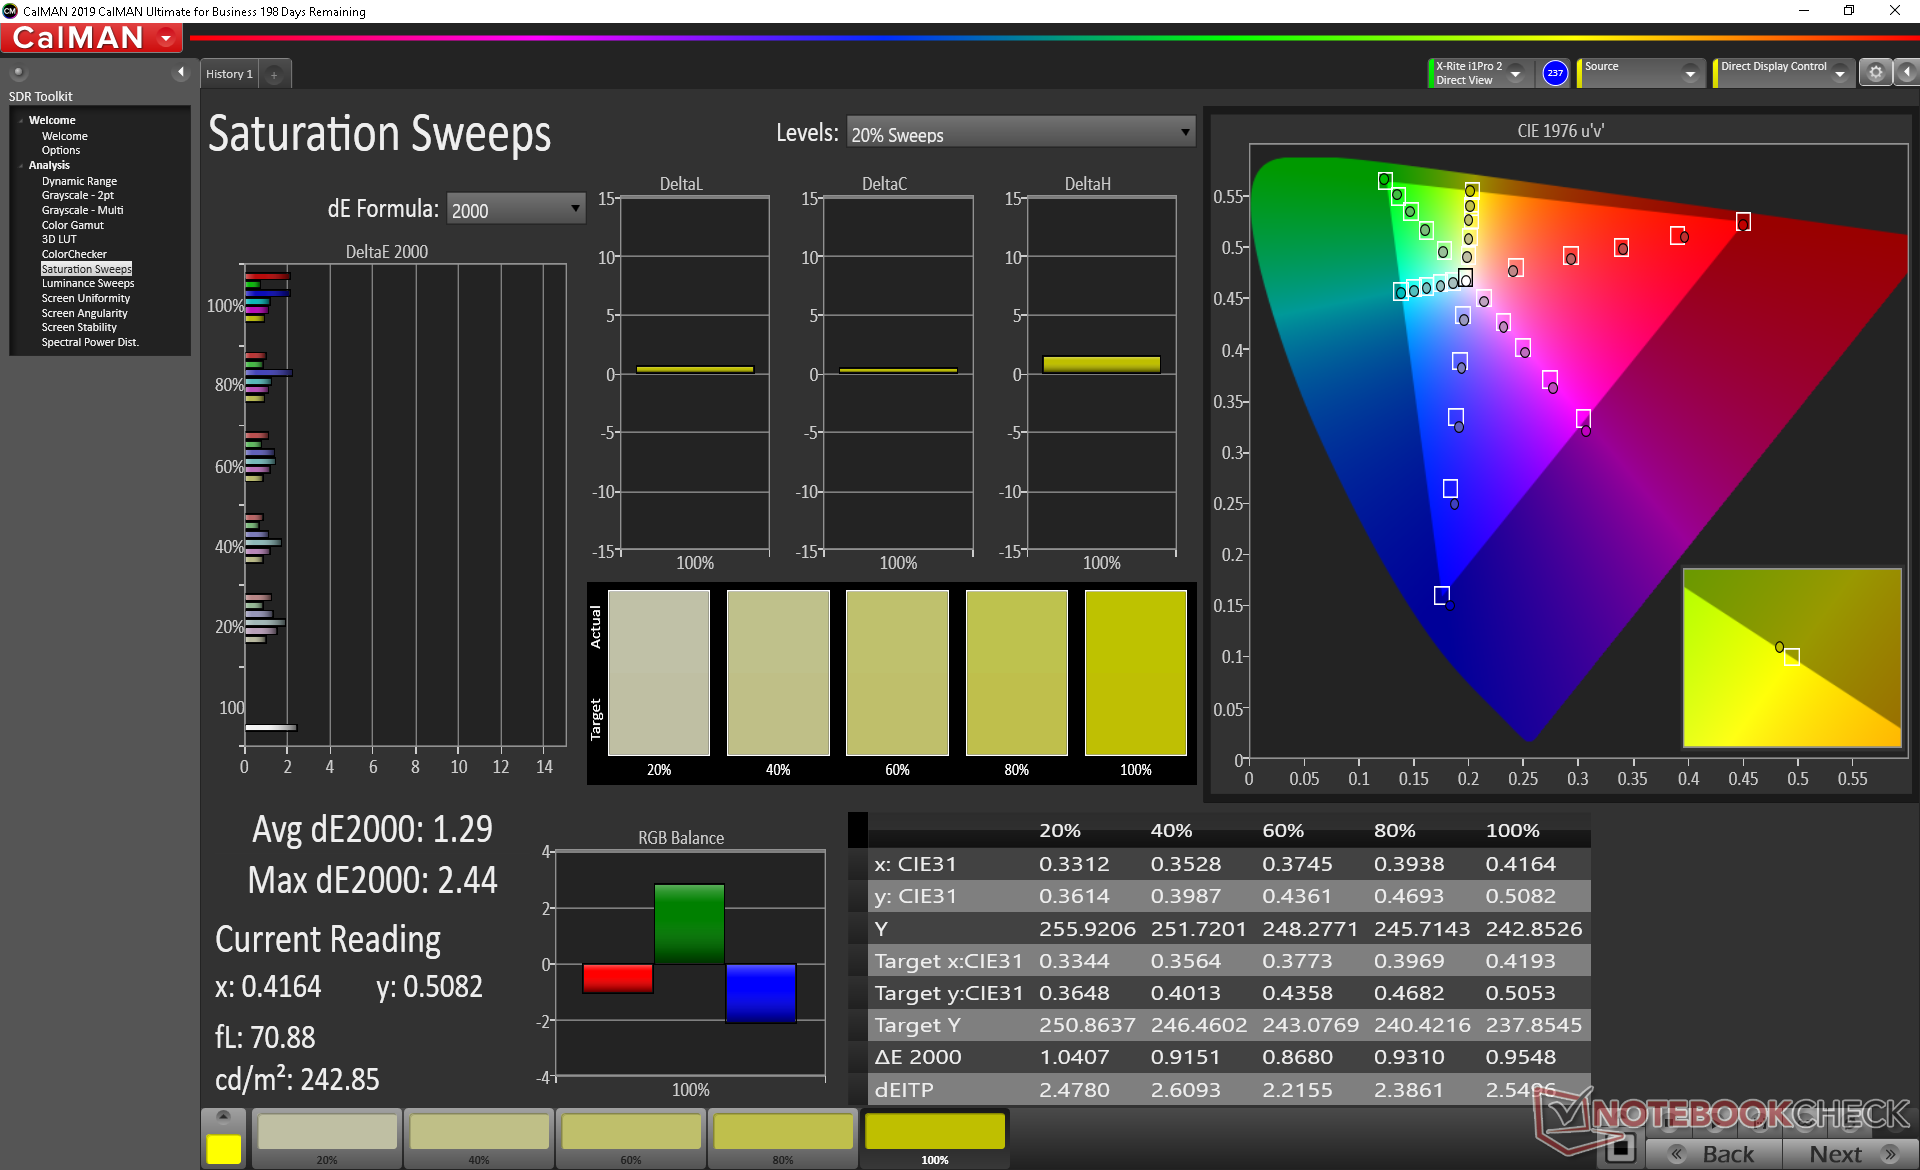
Color space covers approximately 98 percent and 63 percent of the sRGB and AdobeRGB standards, respectively, to be comparable to most other high-end Ultrabooks or business subnotebooks.
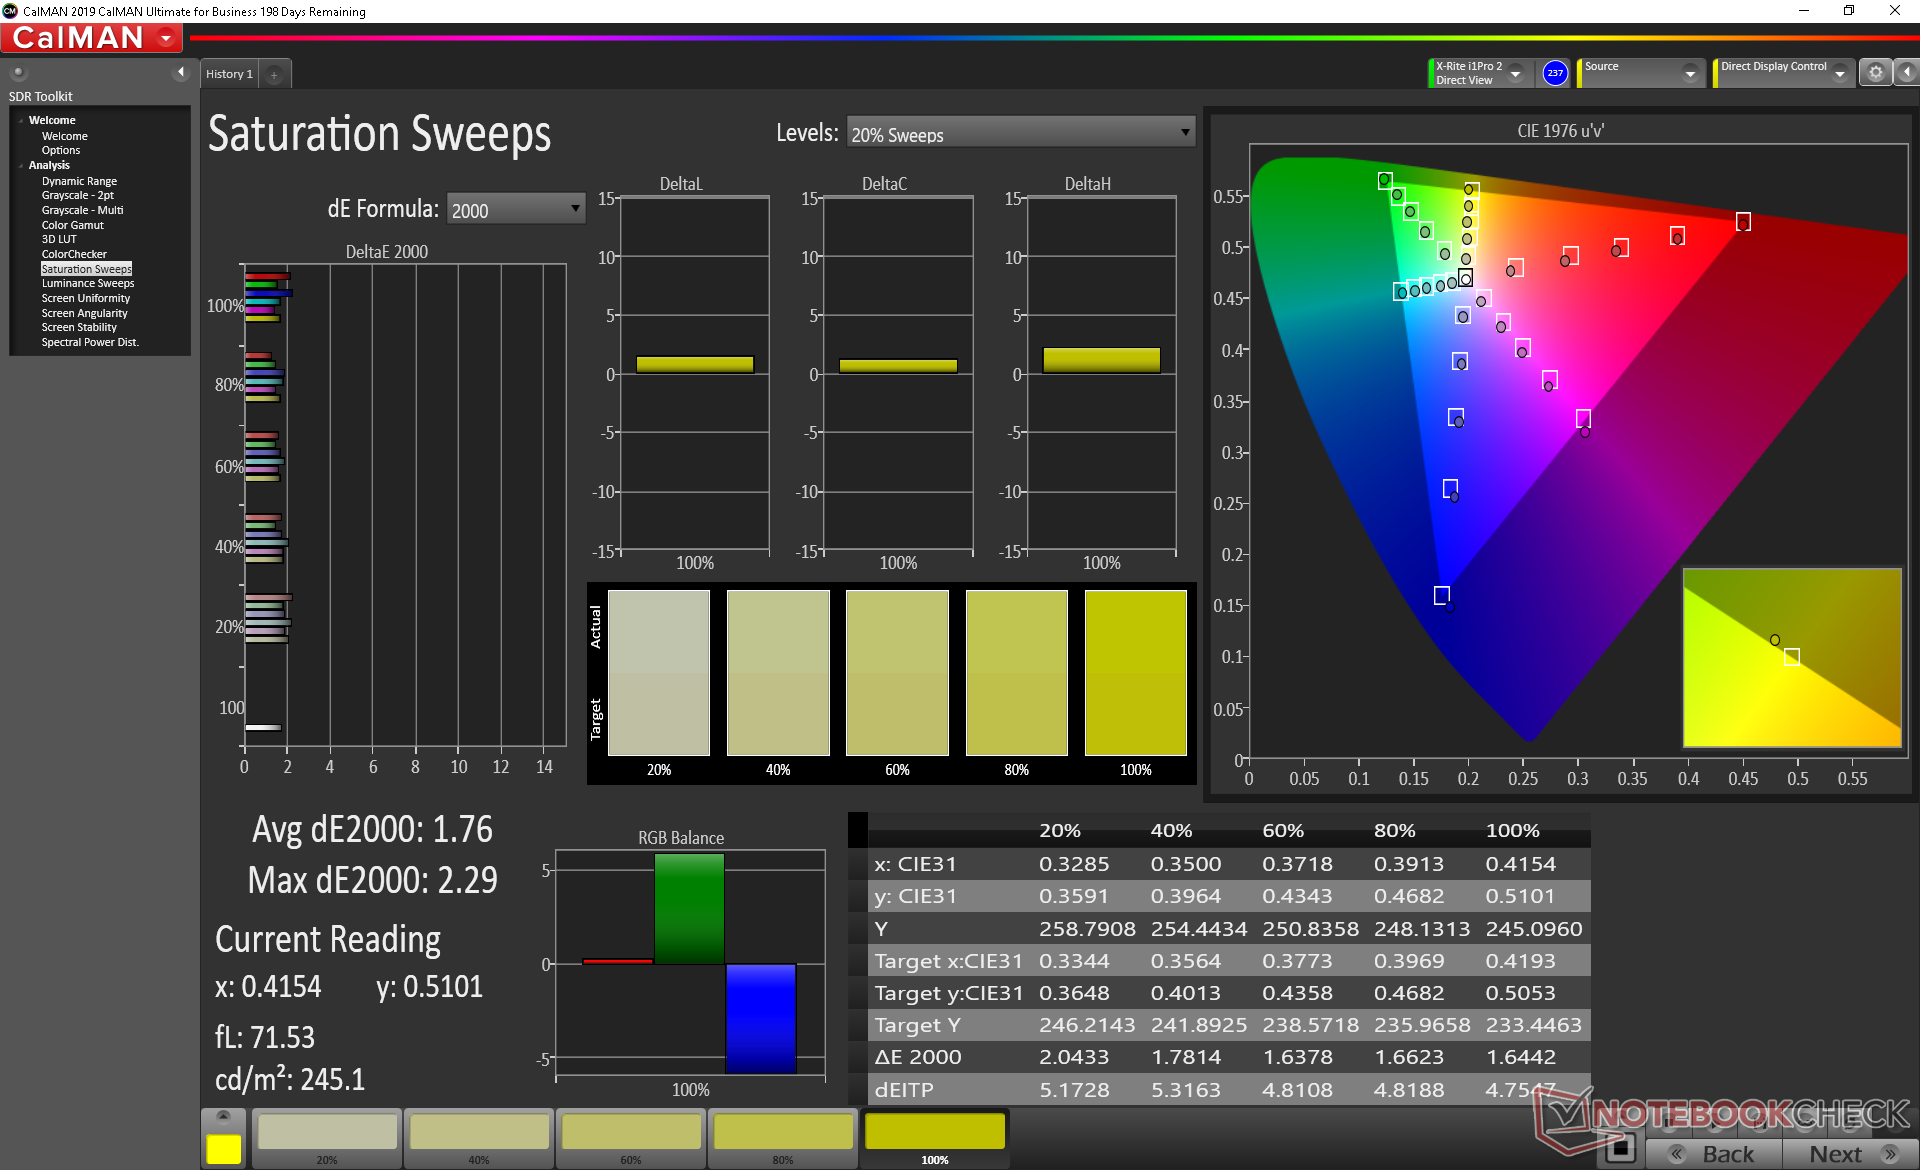
Further measurements with an X-Rite colorimeter reveal a well-calibrated display out of the box. Average grayscale and color DeltaE values sit at just 2 and 1.2, respectively, meaning further calibration from the end-user will not be necessary.
Display Response Times
| ↔ Response Time Black to White | ||
|---|---|---|
| 35.6 ms ... rise ↗ and fall ↘ combined | ↗ 19.2 ms rise | 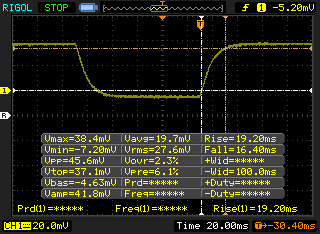 |
| ↘ 16.4 ms fall | ||
| The screen shows slow response rates in our tests and will be unsatisfactory for gamers. In comparison, all tested devices range from 0.1 (minimum) to 240 (maximum) ms. » 93 % of all devices are better. This means that the measured response time is worse than the average of all tested devices (19.8 ms). | ||
| ↔ Response Time 50% Grey to 80% Grey | ||
| 54.8 ms ... rise ↗ and fall ↘ combined | ↗ 26 ms rise | 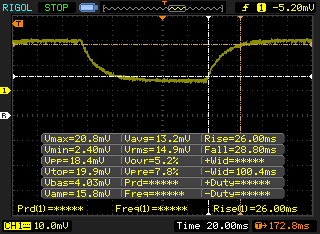 |
| ↘ 28.8 ms fall | ||
| The screen shows slow response rates in our tests and will be unsatisfactory for gamers. In comparison, all tested devices range from 0.165 (minimum) to 636 (maximum) ms. » 92 % of all devices are better. This means that the measured response time is worse than the average of all tested devices (30.9 ms). | ||
Screen Flickering / PWM (Pulse-Width Modulation)
| Screen flickering / PWM detected | 23810 Hz | ≤ 24 % brightness setting | 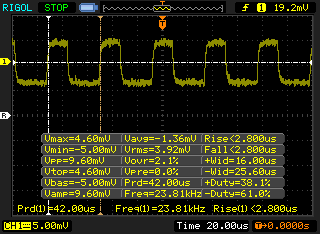 |
The display backlight flickers at 23810 Hz (worst case, e.g., utilizing PWM) Flickering detected at a brightness setting of 24 % and below. There should be no flickering or PWM above this brightness setting. The frequency of 23810 Hz is quite high, so most users sensitive to PWM should not notice any flickering. In comparison: 52 % of all tested devices do not use PWM to dim the display. If PWM was detected, an average of 7744 (minimum: 5 - maximum: 343500) Hz was measured. | |||
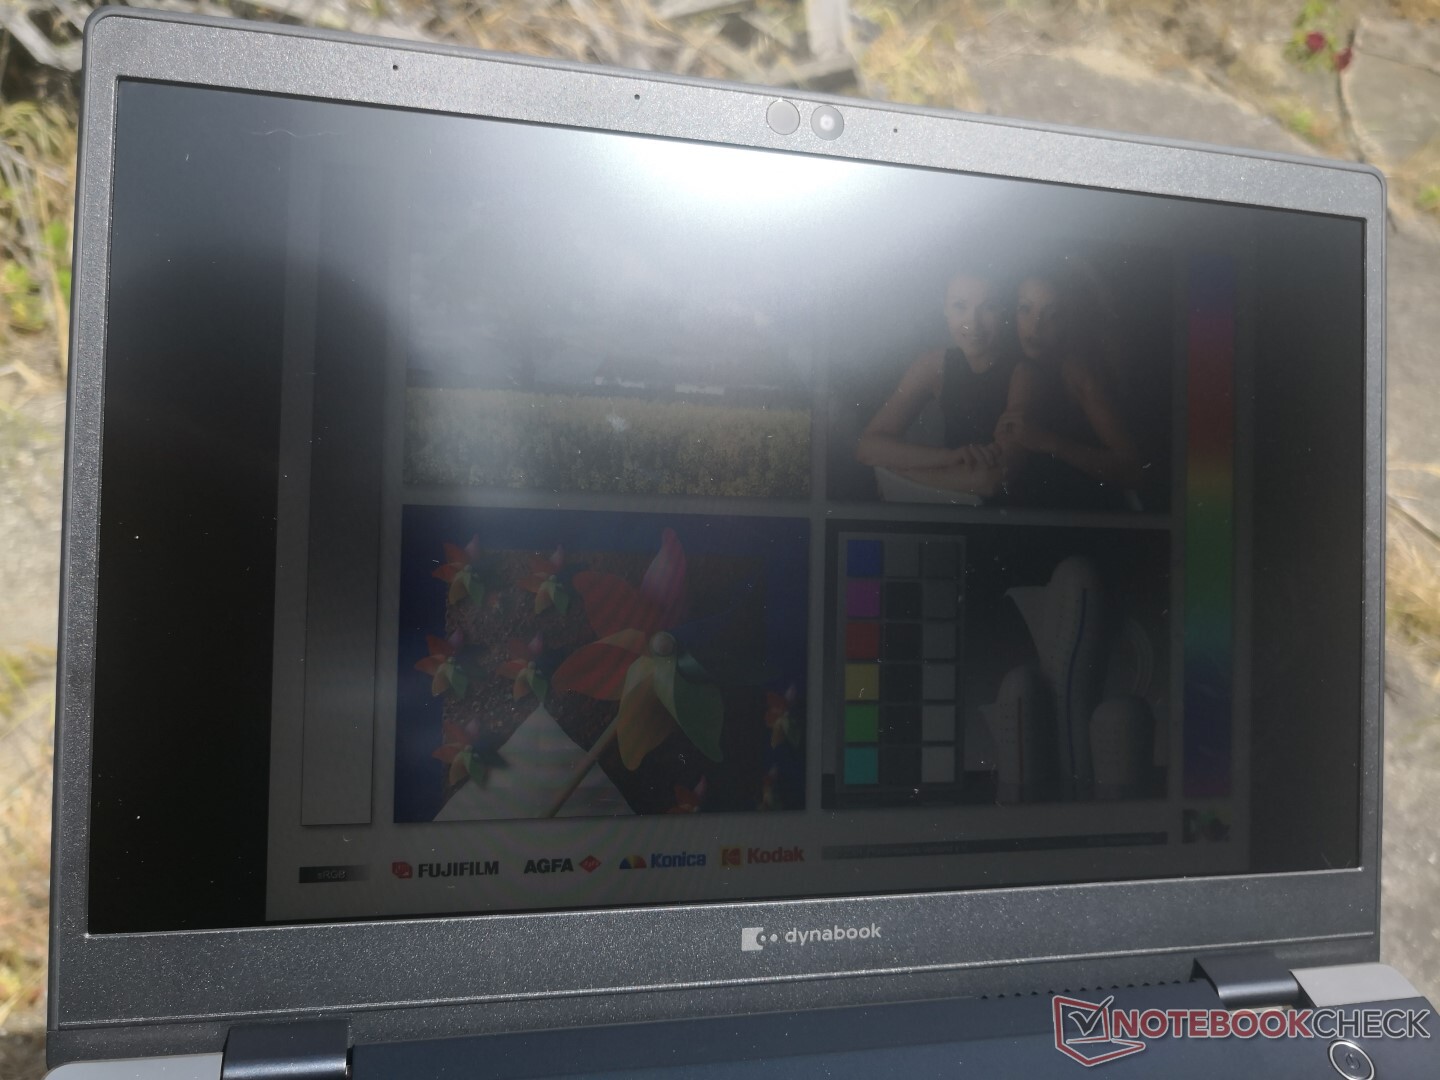
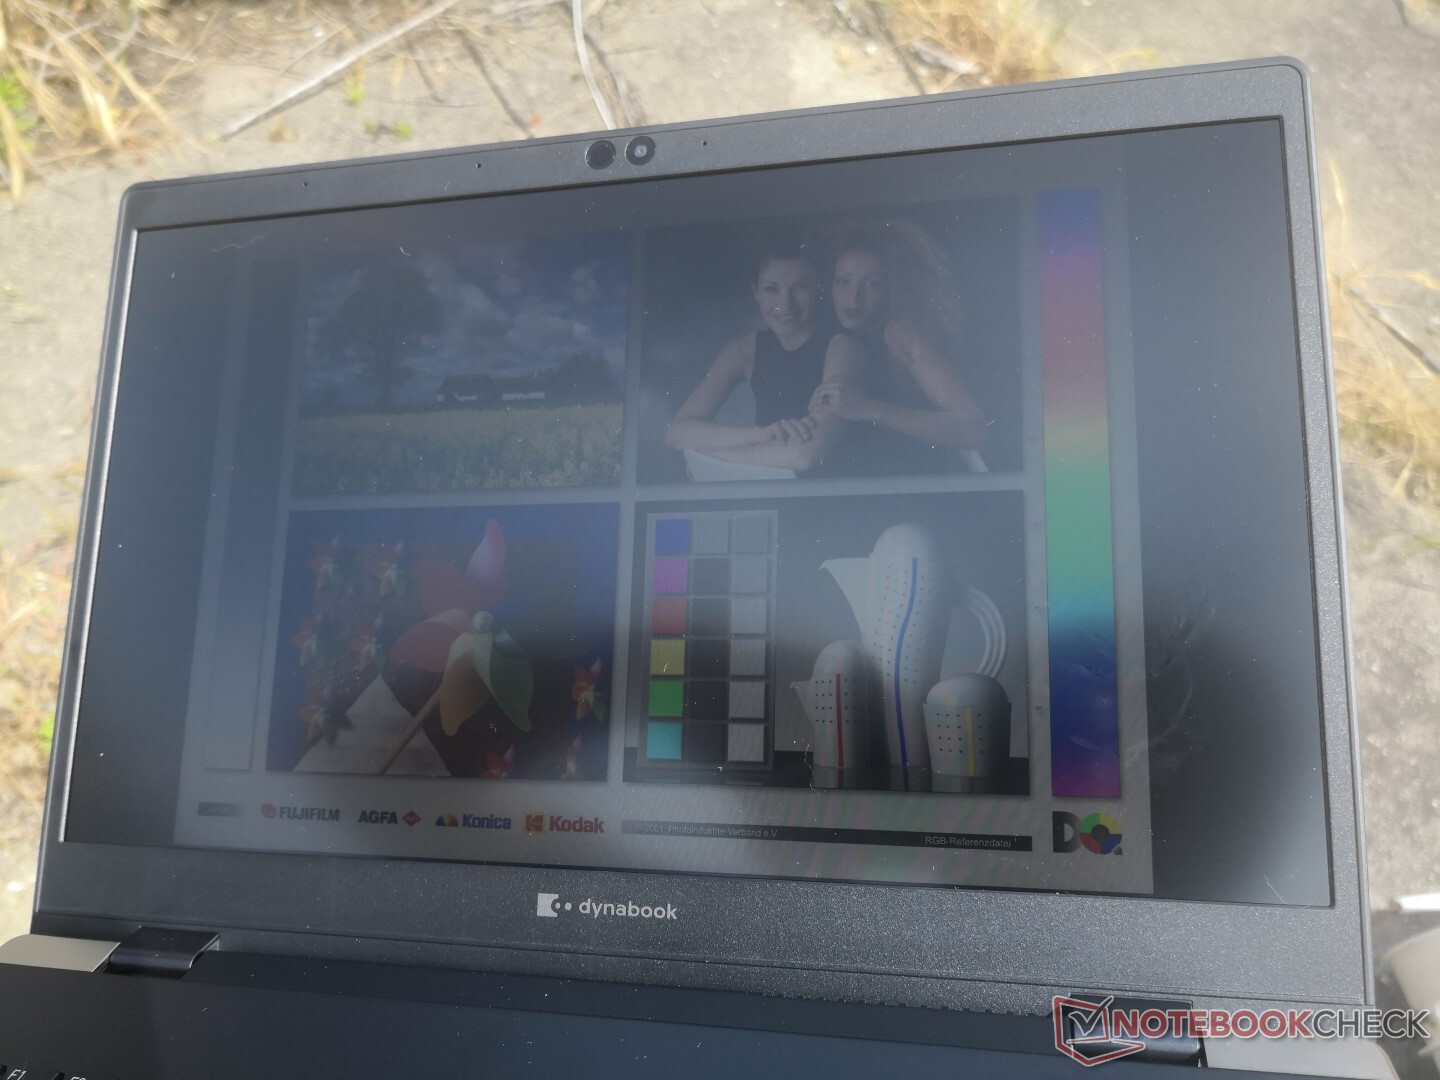
Outdoor visibility is decent under shade due to the relatively bright screen, wide viewing angles, and matte panel to reduce glare. Direct sunlight will still wash out colors.
Performance
Processor
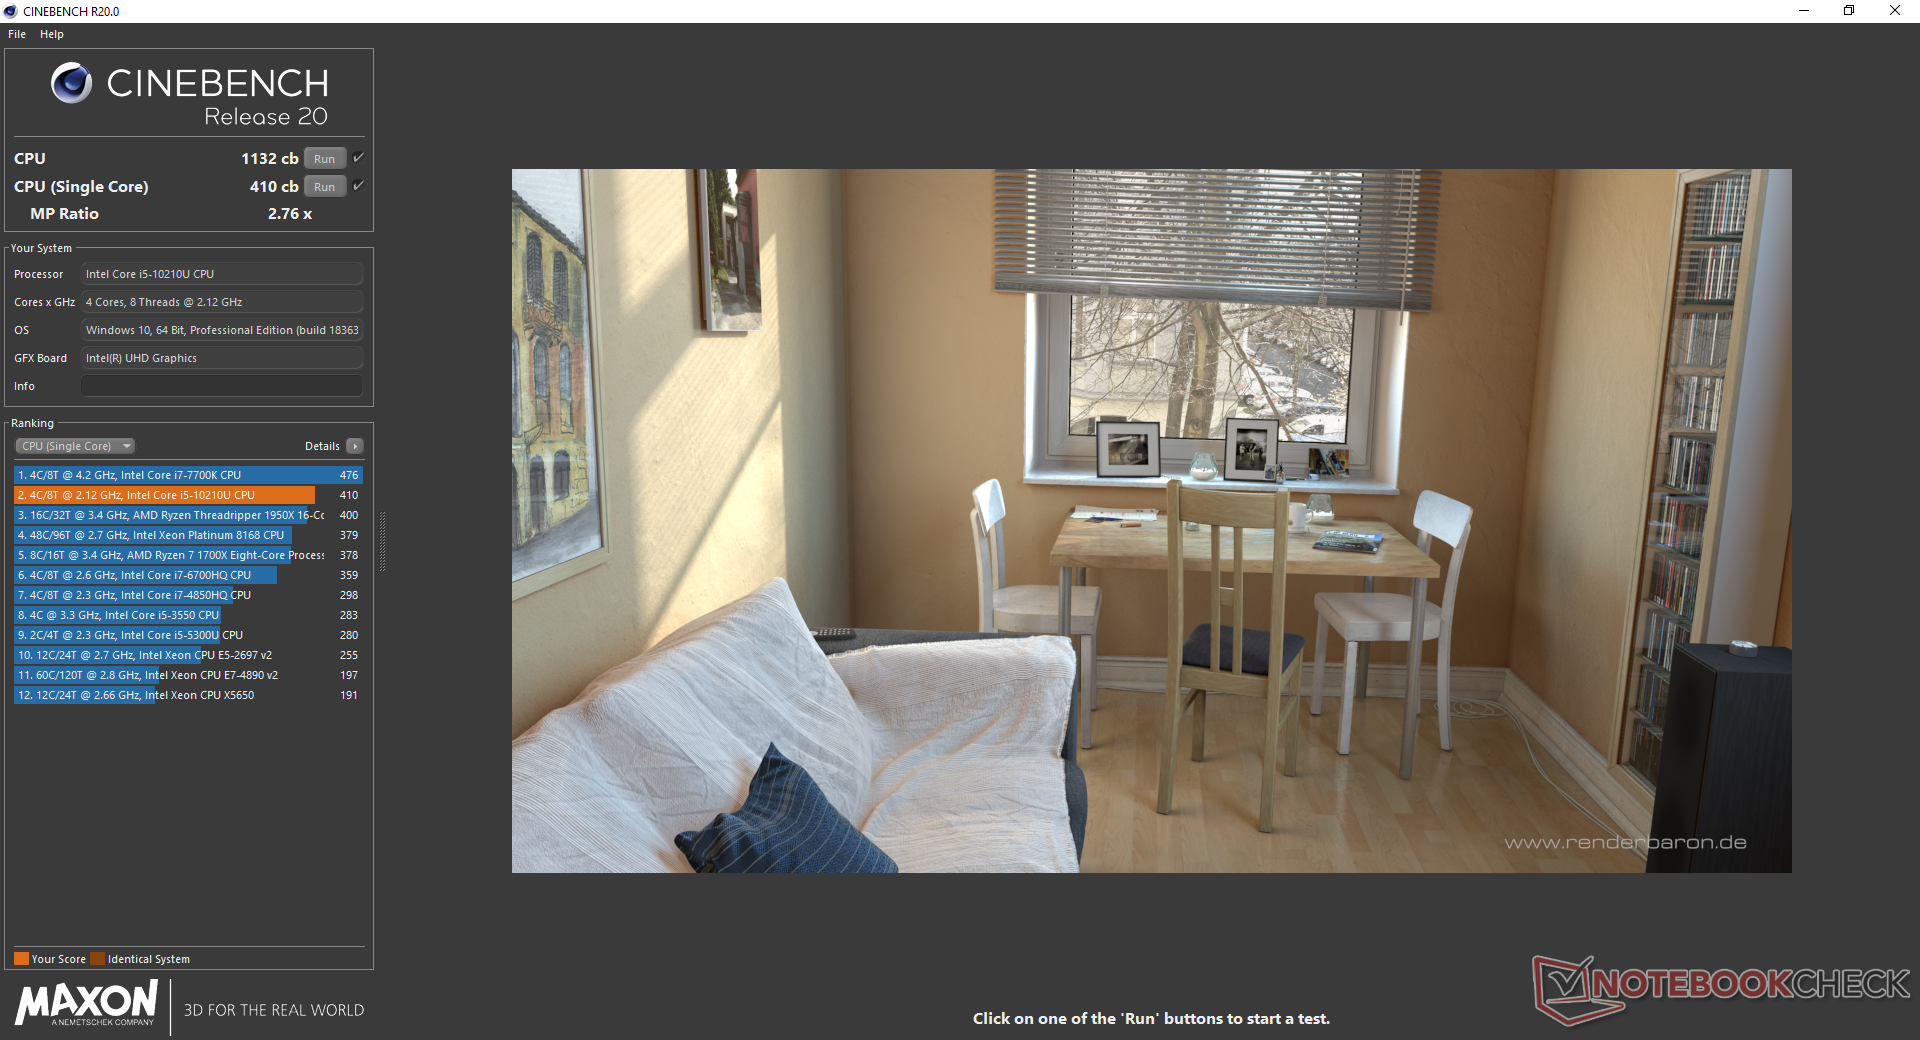
Multi-thread CPU performance is about 15 to 20 percent slower than the average Core i5-10210U in our database to be about as fast as the older Core i5-8250U. When running CineBench R15 Multi-Thread in a loop, final scores would be flat throughout the test whereas most other laptops have higher initial scores. We suspect that the manufacturer had to limit the Turbo Boost potential of the CPU because of the relatively small cooling solution. We explore clock rates in more detail in our Stress Test section below.
See our dedicated page on the Core i5-10210U for more technical information and benchmarks. Upgrading to the Core i7-10510U option should bring roughly 40 percent faster multi-thread performance — at least on paper.
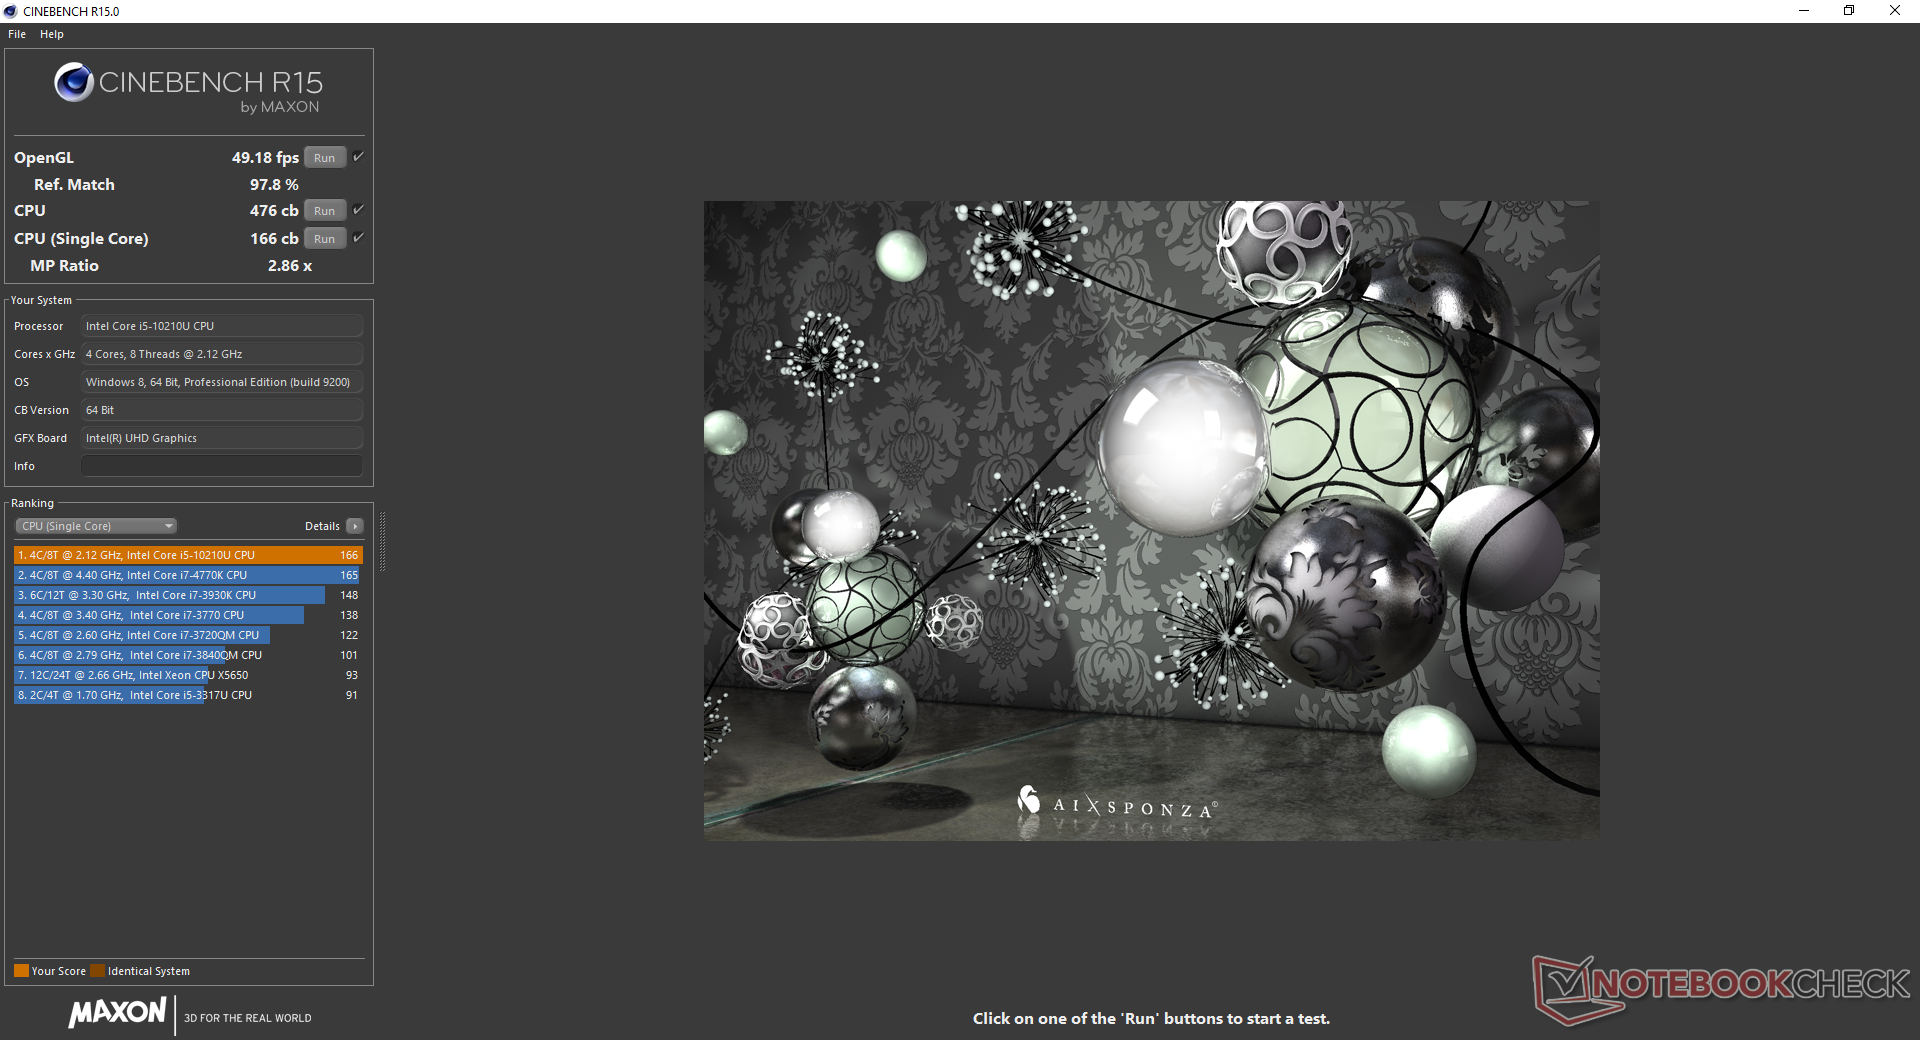
Cinebench R15: CPU Multi 64Bit | CPU Single 64Bit
Blender: v2.79 BMW27 CPU
7-Zip 18.03: 7z b 4 -mmt1 | 7z b 4
Geekbench 5.5: Single-Core | Multi-Core
HWBOT x265 Benchmark v2.2: 4k Preset
LibreOffice : 20 Documents To PDF
R Benchmark 2.5: Overall mean
| Blender / v2.79 BMW27 CPU | |
| Dell Latitude 13 3390 | |
| Dynabook Portege X30L-G1331 | |
| Average Intel Core i5-10210U (585 - 1339, n=24) | |
| Dell XPS 13 9300 i5 FHD | |
| Honor Magicbook 14 | |
| Dell XPS 13 9300 4K UHD | |
| Dell XPS 13 7390 Core i7-10710U | |
| 7-Zip 18.03 / 7z b 4 -mmt1 | |
| Dell XPS 13 9300 4K UHD | |
| Dell XPS 13 7390 Core i7-10710U | |
| Dynabook Portege X30L-G1331 | |
| Average Intel Core i5-10210U (3504 - 4467, n=24) | |
| Dell XPS 13 9300 i5 FHD | |
| Dell Latitude 13 3390 | |
| Honor Magicbook 14 | |
| 7-Zip 18.03 / 7z b 4 | |
| Dell XPS 13 7390 Core i7-10710U | |
| Dell XPS 13 9300 4K UHD | |
| Dell XPS 13 9300 i5 FHD | |
| Honor Magicbook 14 | |
| Average Intel Core i5-10210U (10920 - 21679, n=24) | |
| Dynabook Portege X30L-G1331 | |
| Dell Latitude 13 3390 | |
| Geekbench 5.5 / Single-Core | |
| Dell XPS 13 9300 4K UHD | |
| Dell XPS 13 9300 i5 FHD | |
| Dynabook Portege X30L-G1331 | |
| Average Intel Core i5-10210U (949 - 1133, n=27) | |
| Honor Magicbook 14 | |
| Geekbench 5.5 / Multi-Core | |
| Dell XPS 13 9300 4K UHD | |
| Dell XPS 13 9300 i5 FHD | |
| Dynabook Portege X30L-G1331 | |
| Average Intel Core i5-10210U (2079 - 4256, n=27) | |
| Honor Magicbook 14 | |
| HWBOT x265 Benchmark v2.2 / 4k Preset | |
| Dell XPS 13 9300 4K UHD | |
| Dell XPS 13 7390 Core i7-10710U | |
| Average Intel Core i5-10210U (2.36 - 6.28, n=24) | |
| Dell XPS 13 9300 i5 FHD | |
| Dynabook Portege X30L-G1331 | |
| Honor Magicbook 14 | |
| Dell Latitude 13 3390 | |
| LibreOffice / 20 Documents To PDF | |
| Dell XPS 13 9300 4K UHD | |
| Average Intel Core i5-10210U (49.6 - 80.3, n=18) | |
| Dynabook Portege X30L-G1331 | |
| R Benchmark 2.5 / Overall mean | |
| Honor Magicbook 14 | |
| Average Intel Core i5-10210U (0.658 - 0.901, n=24) | |
| Dell XPS 13 9300 i5 FHD | |
| Dynabook Portege X30L-G1331 | |
| Dell XPS 13 9300 4K UHD | |
* ... smaller is better
System Performance
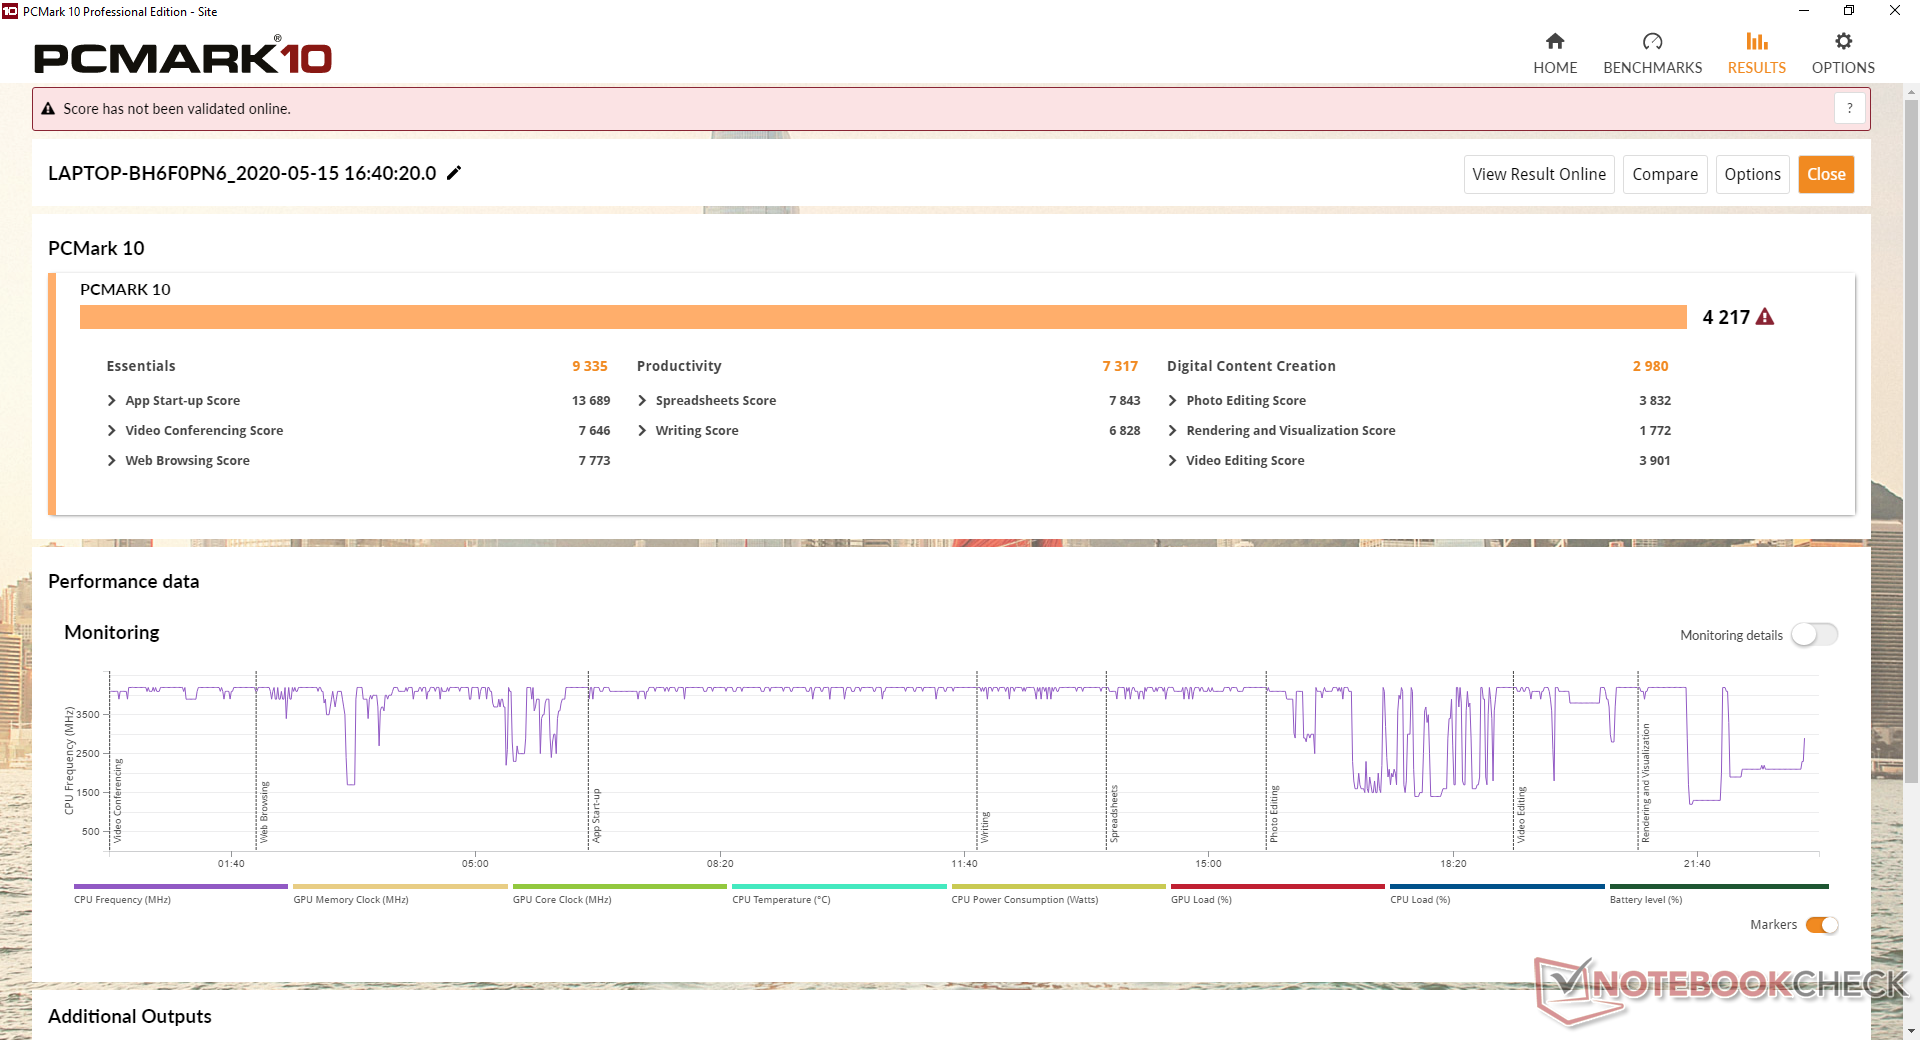
PCMark benchmarks rank our Dynabook higher than older subnotebooks running on 8th gen or 9th gen Core U series CPUs. The exception is the Digital Content Creation benchmark which favors laptops with faster GPUs.
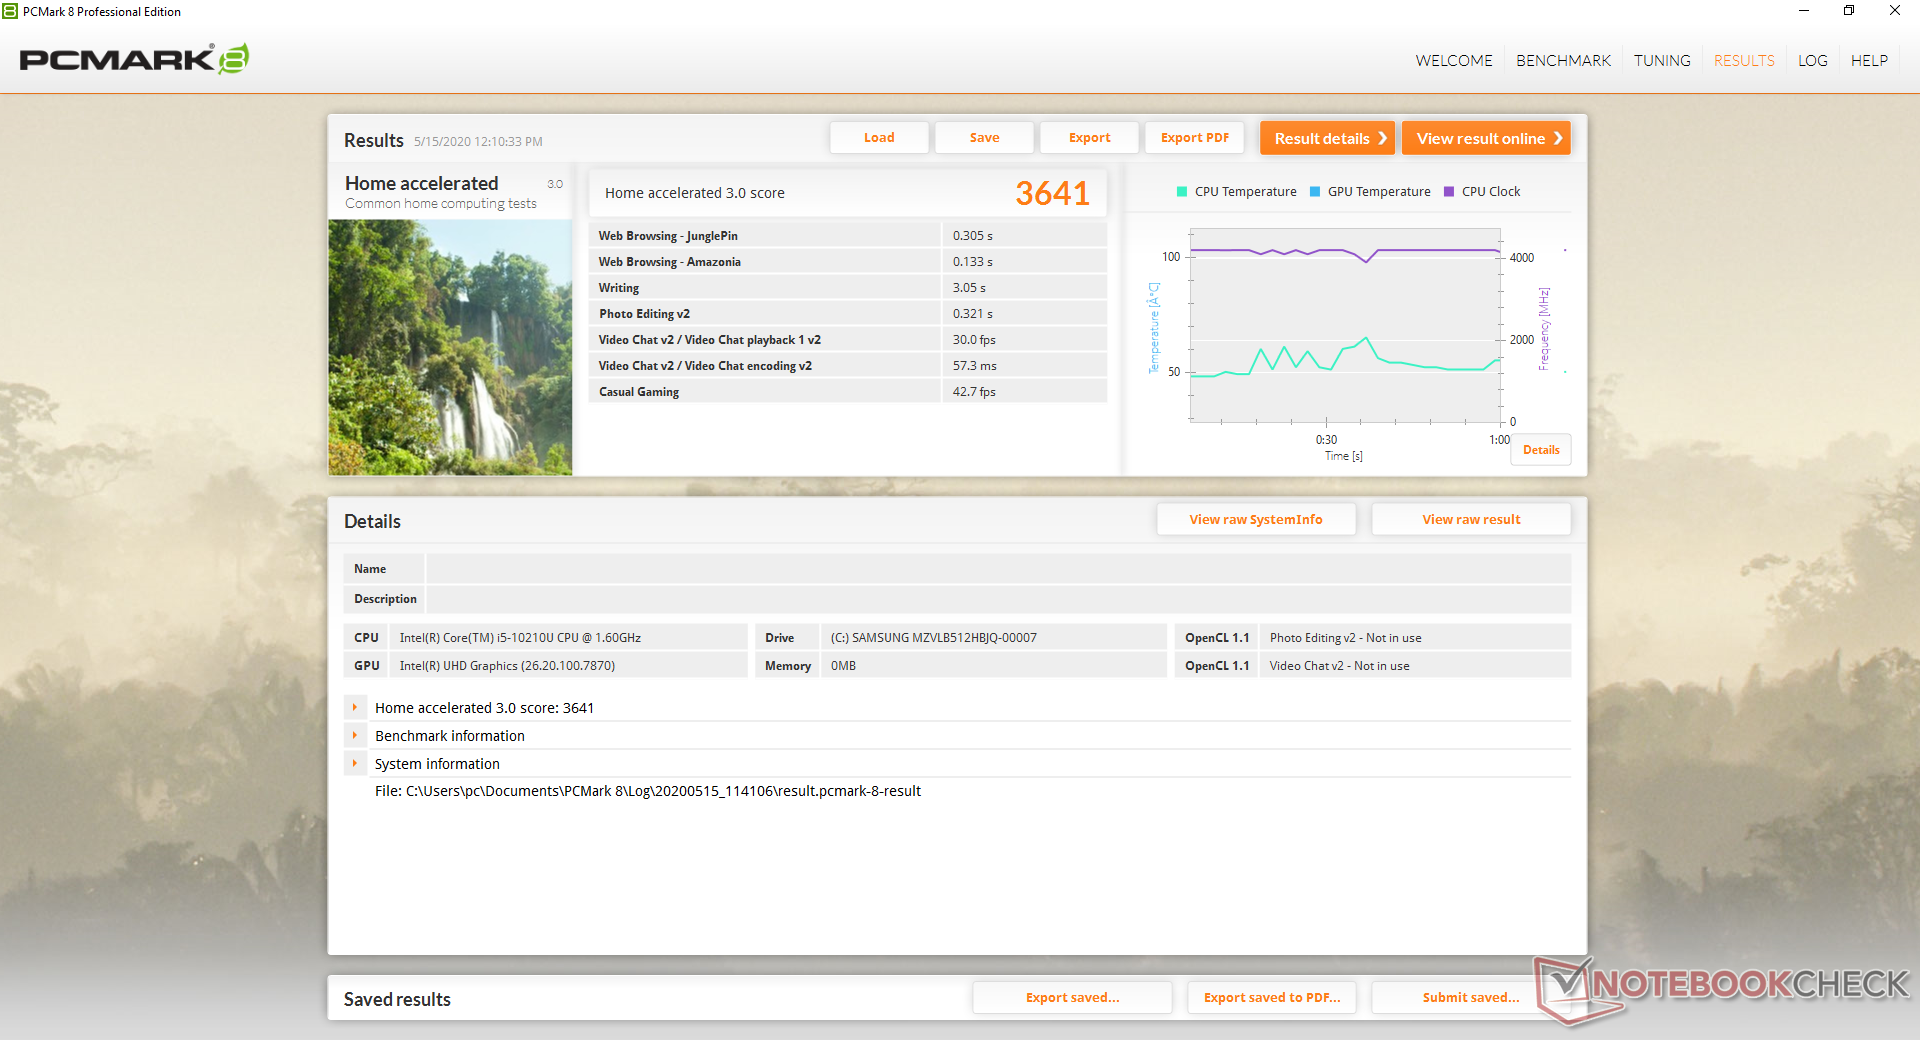
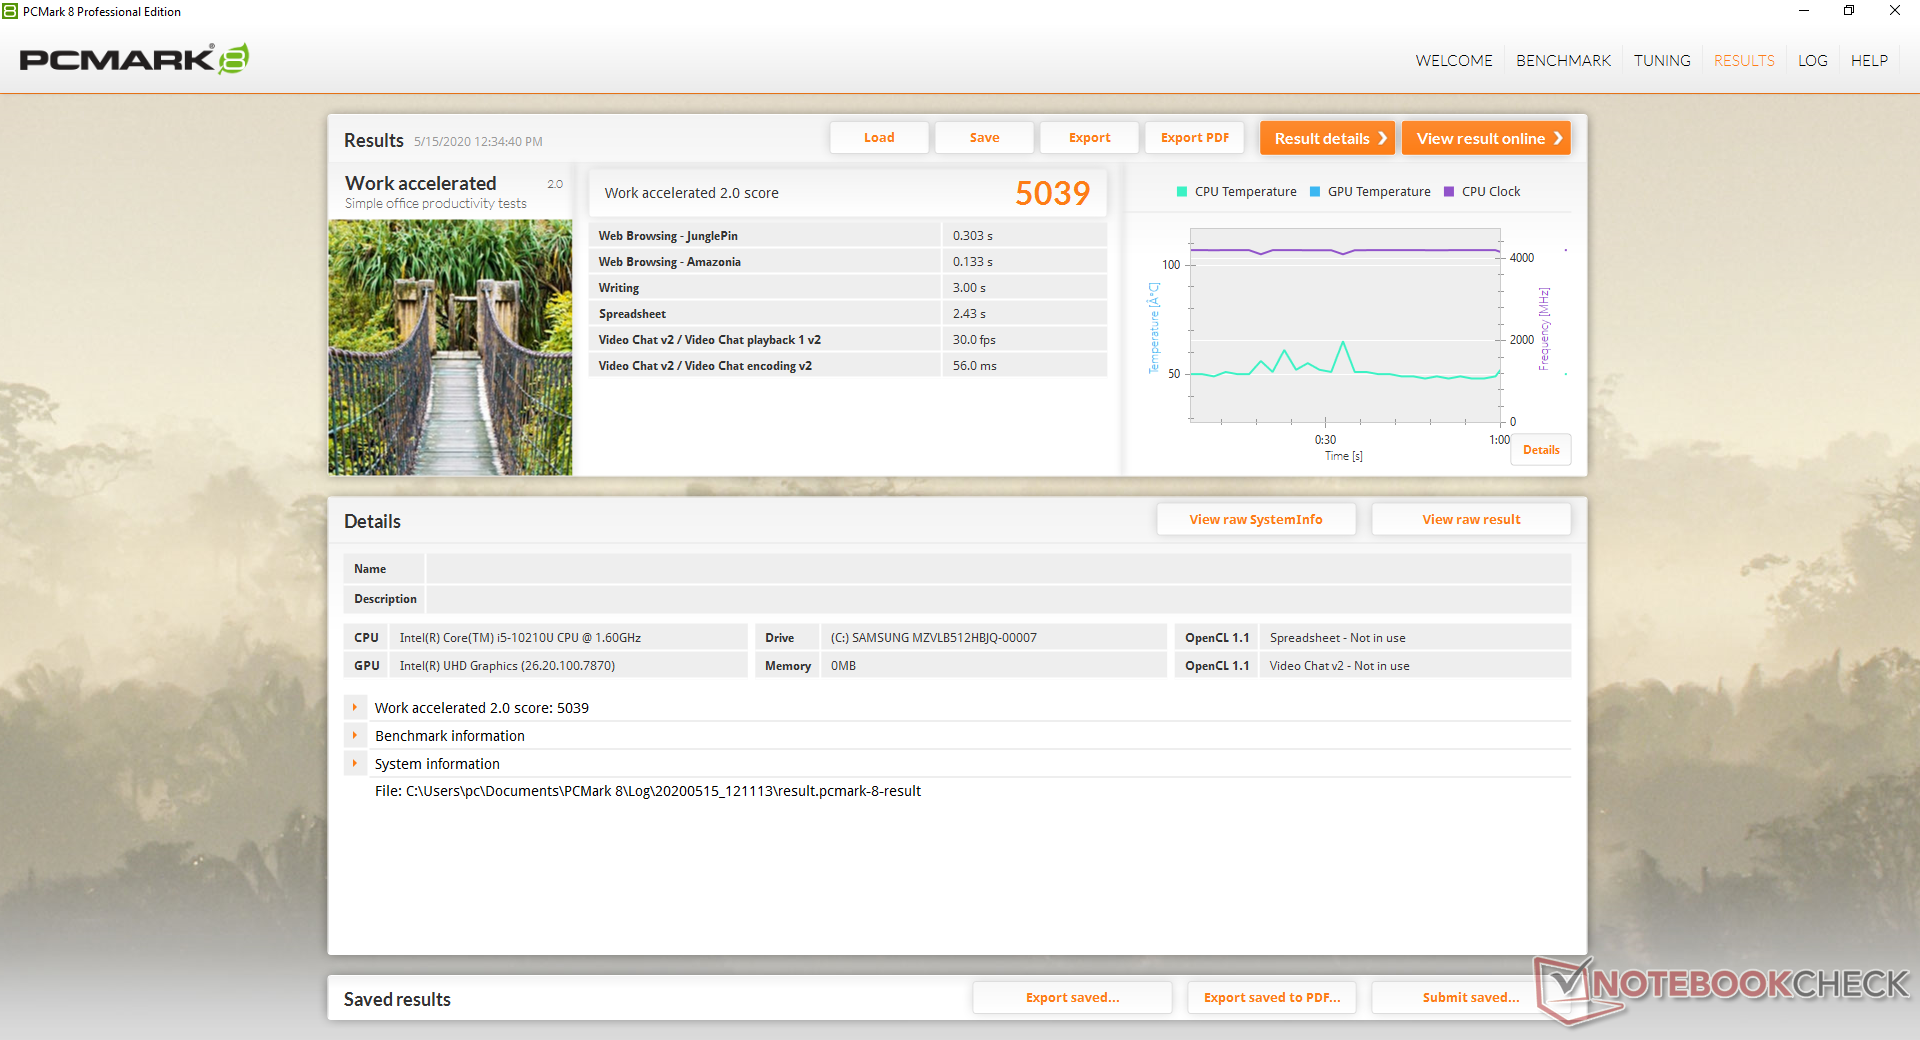
| PCMark 8 Home Score Accelerated v2 | 3641 points | |
| PCMark 8 Work Score Accelerated v2 | 5039 points | |
| PCMark 10 Score | 4217 points | |
Help | ||
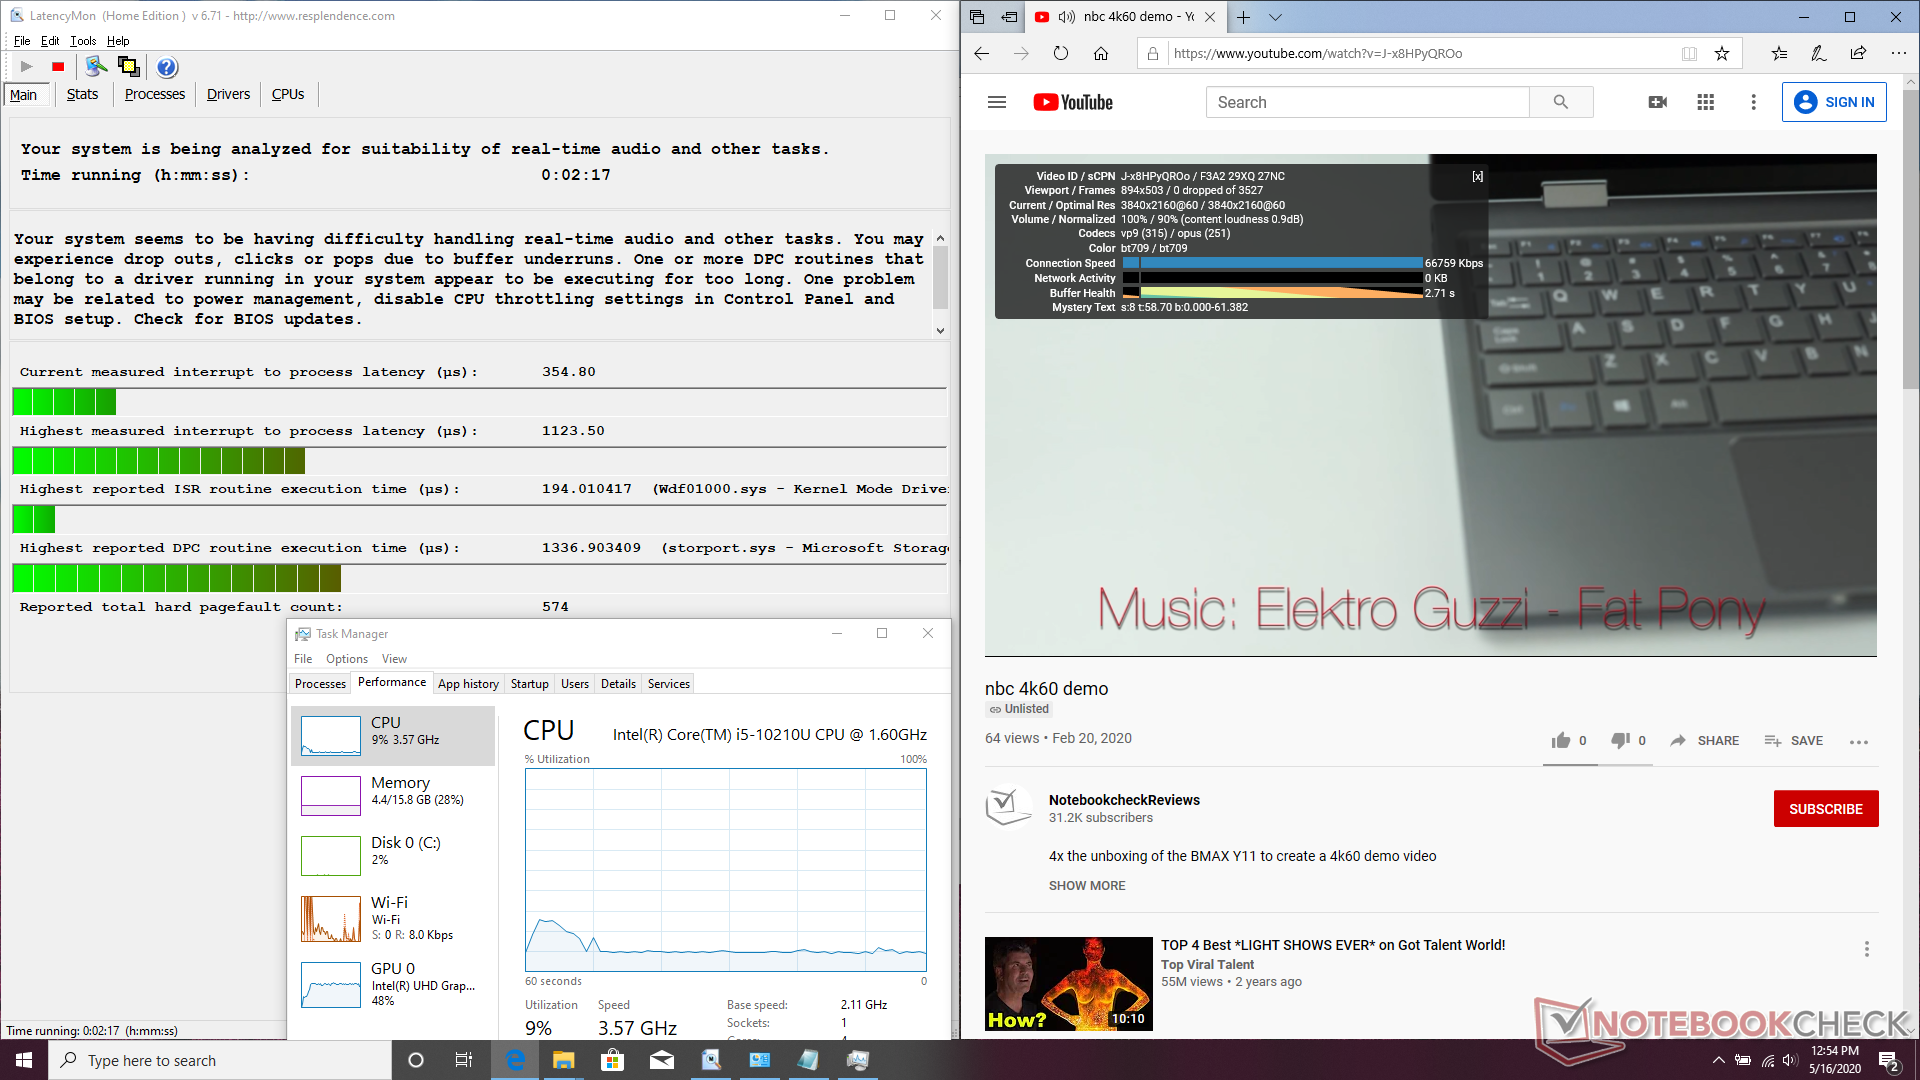
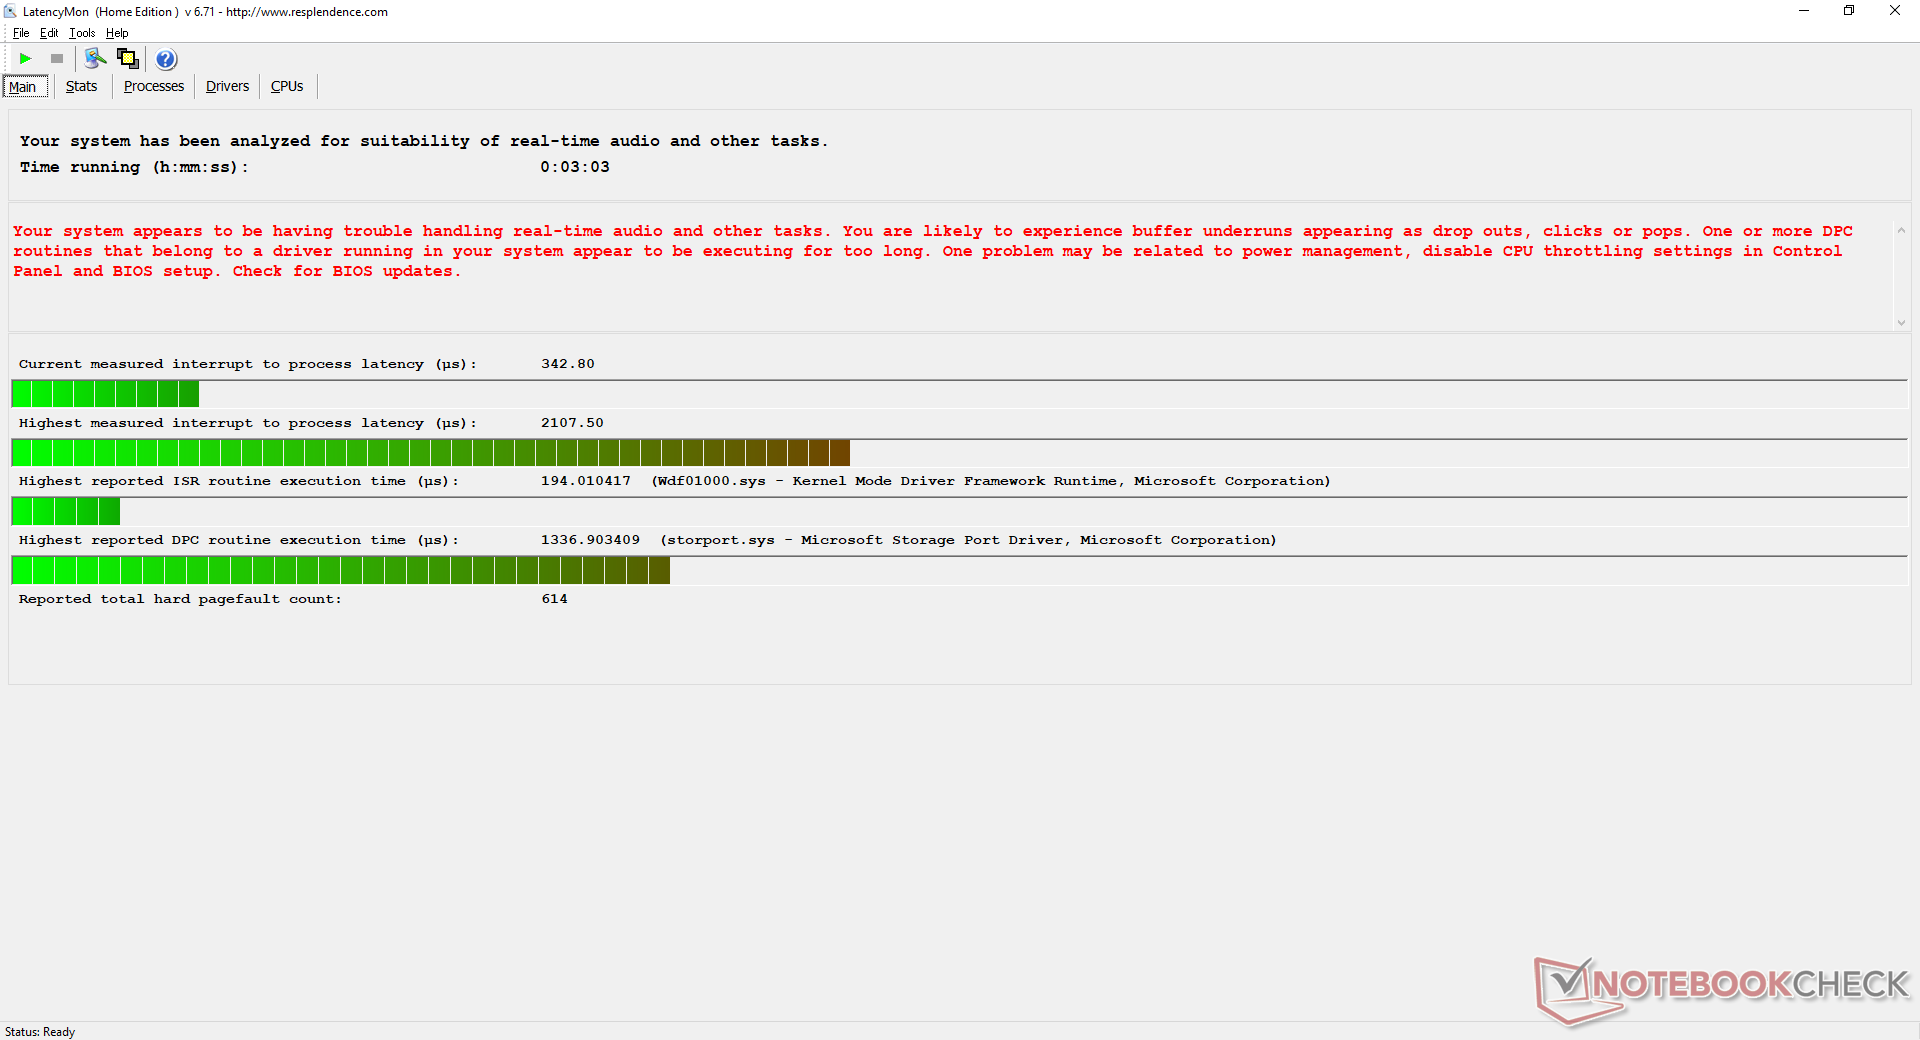
DPC Latency
LatencyMon shows DPC latency issues when opening multiple browser tabs on our homepage. Fortunately, we can record no dropped frames when playing 4K UHD video content on YouTube.
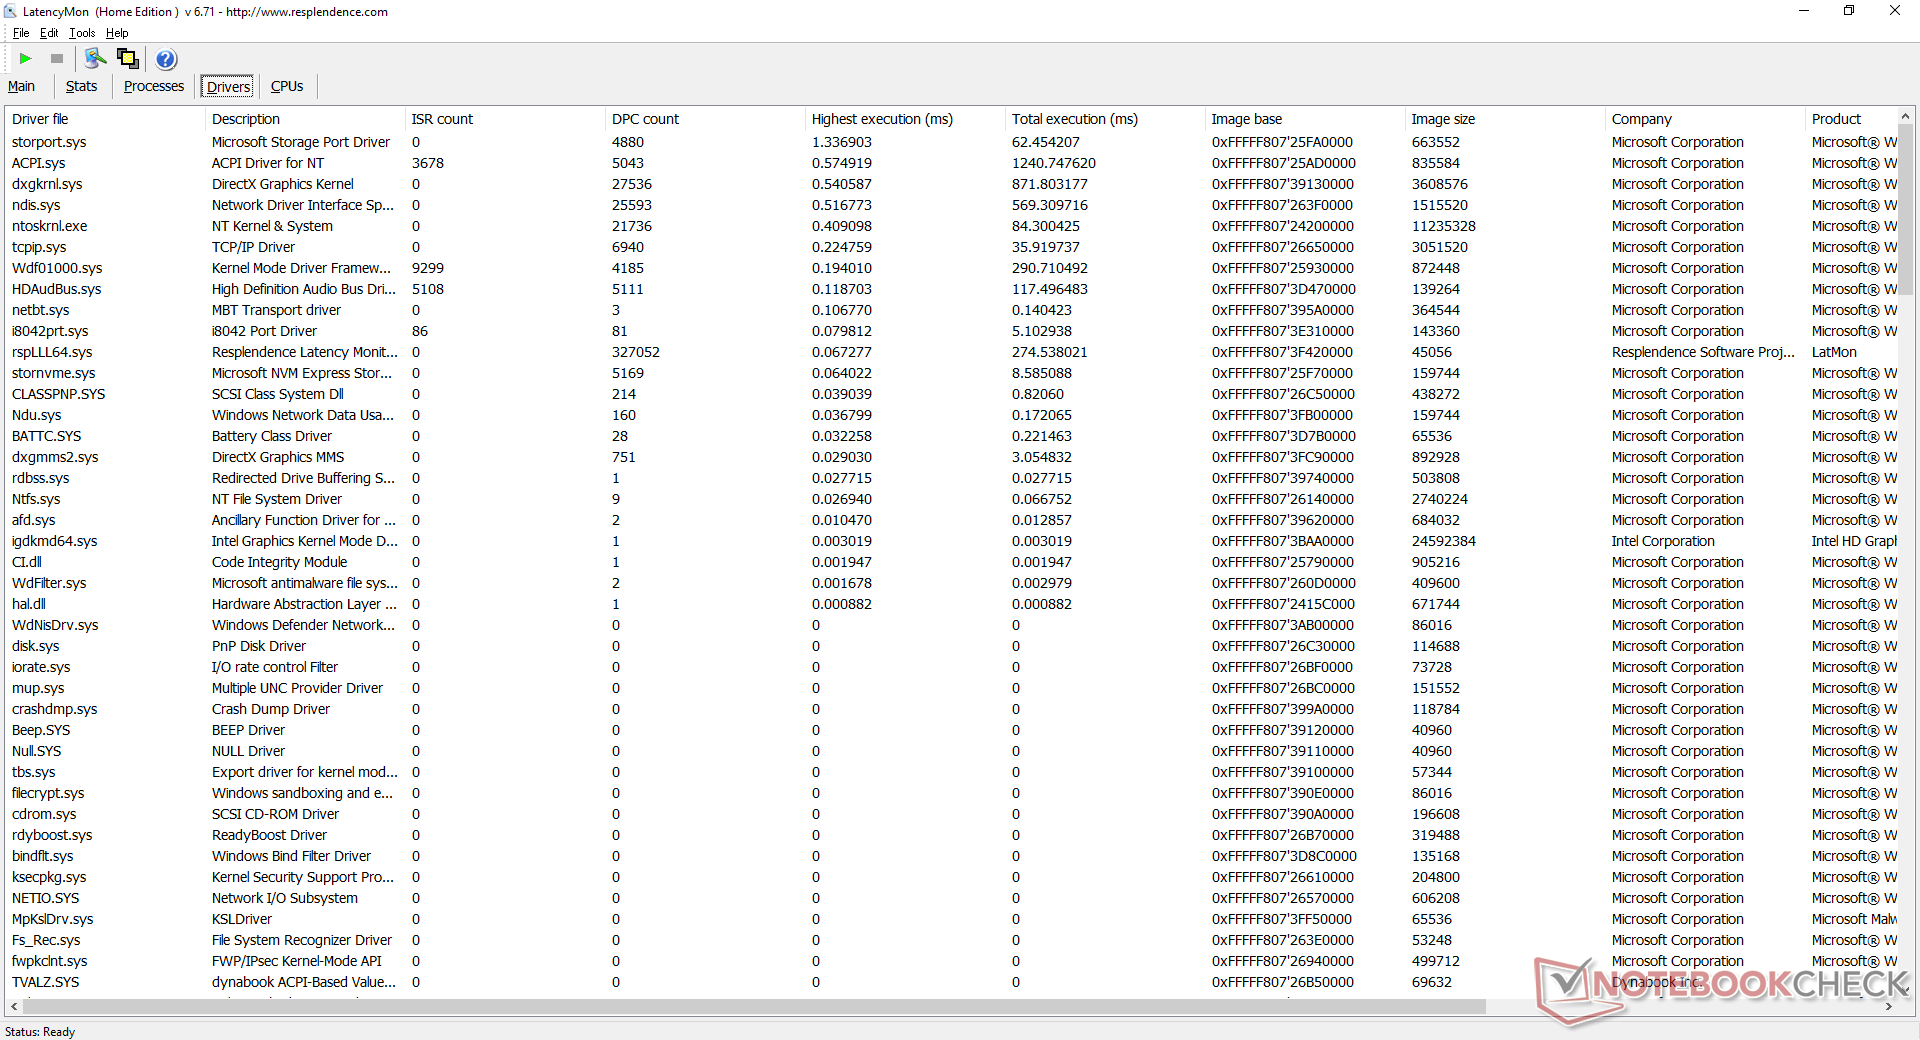
| DPC Latencies / LatencyMon - interrupt to process latency (max), Web, Youtube, Prime95 | |
| Dynabook Portege X30L-G1331 | |
* ... smaller is better
Storage Devices
There is just one internal storage bay to keep weight as low as possible. The manufacturer offers 256 GB and 512 GB options and our specific unit comes with a Samsung PM981a NVMe SSD. Samsung drives are generally faster than those from Intel, SK Hynix, or Toshiba.
| Dynabook Portege X30L-G1331 Samsung SSD PM981a MZVLB512HBJQ | Dell XPS 13 9300 Core i7-1065G7 Intel SSDPEMKF512G8 NVMe SSD | LG Gram 13Z980-A SK Hynix HFS256G39TND-N210A | Apple MacBook Pro 13 2019 2TB3 Apple SSD AP0256 | Lenovo ThinkBook 13s-20R90071GE SK hynix BC501 HFM512GDHTNG-8310A | |
|---|---|---|---|---|---|
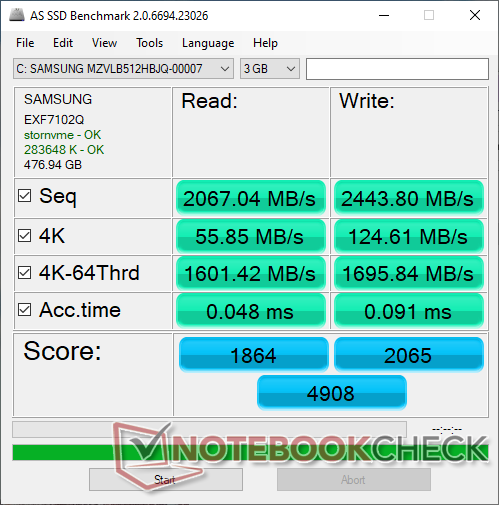
| AS SSD | -36% | -83% | -105% | -38% | |
| Seq Read (MB/s) | 2067 | 1956 -5% | 496.4 -76% | 974 -53% | 1264 -39% |
| Seq Write (MB/s) | 2444 | 1227 -50% | 241.7 -90% | 1340 -45% | 518 -79% |
| 4K Read (MB/s) | 55.8 | 63 13% | 27.16 -51% | 11.35 -80% | 40.31 -28% |
| 4K Write (MB/s) | 124.6 | 156.6 26% | 61 -51% | 15.95 -87% | 119.1 -4% |
| 4K-64 Read (MB/s) | 1601 | 475.6 -70% | 376.7 -76% | 643 -60% | 772 -52% |
| 4K-64 Write (MB/s) | 1696 | 539 -68% | 231.3 -86% | 163 -90% | 672 -60% |
| Access Time Read * (ms) | 0.048 | 0.042 12% | 0.084 -75% | 0.316 -558% | 0.046 4% |
| Access Time Write * (ms) | 0.091 | 0.105 -15% | 0.235 -158% | 0.258 -184% | 0.031 66% |
| Score Read (Points) | 1864 | 734 -61% | 453 -76% | 752 -60% | 939 -50% |
| Score Write (Points) | 2065 | 818 -60% | 316 -85% | 313 -85% | 843 -59% |
| Score Total (Points) | 4908 | 1915 -61% | 997 -80% | 1465 -70% | 2234 -54% |
| Copy ISO MB/s (MB/s) | 2051 | 1022 -50% | 204.5 -90% | 1404 -32% | 943 -54% |
| Copy Program MB/s (MB/s) | 572 | 302.8 -47% | 127.6 -78% | 406.9 -29% | 292.2 -49% |
| Copy Game MB/s (MB/s) | 1447 | 491.4 -66% | 191.7 -87% | 850 -41% | 374.1 -74% |
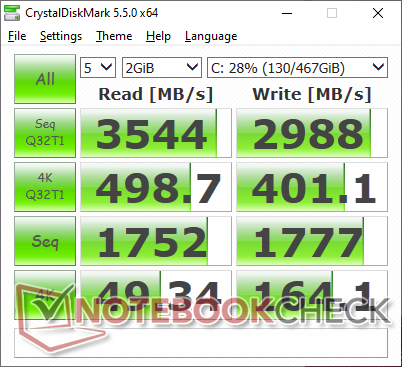
| CrystalDiskMark 5.2 / 6 | 3% | -68% | -41% | ||
| Write 4K (MB/s) | 164.1 | 186.8 14% | 73.9 -55% | 89.3 -46% | |
| Read 4K (MB/s) | 49.34 | 71.4 45% | 25.67 -48% | 37.4 -24% | |
| Write Seq (MB/s) | 1777 | 1203 -32% | 255.2 -86% | 608 -66% | |
| Read Seq (MB/s) | 1752 | 2600 48% | 480.7 -73% | 1019 -42% | |
| Write 4K Q32T1 (MB/s) | 401.1 | 514 28% | 197.2 -51% | 487.9 22% | |
| Read 4K Q32T1 (MB/s) | 498.7 | 570 14% | 214.4 -57% | 284.8 -43% | |
| Write Seq Q32T1 (MB/s) | 2988 | 786 -74% | 254.9 -91% | 872 -71% | |
| Read Seq Q32T1 (MB/s) | 3544 | 2947 -17% | 554 -84% | 1635 -54% | |
| Write 4K Q8T8 (MB/s) | 387.3 | ||||
| Read 4K Q8T8 (MB/s) | 757 | ||||
| Total Average (Program / Settings) | -17% /
-22% | -76% /
-77% | -105% /
-105% | -40% /
-39% |
* ... smaller is better

Disk Throttling: DiskSpd Read Loop, Queue Depth 8
GPU Performance
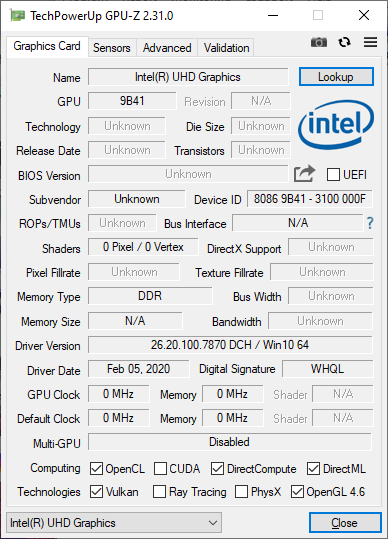
The Comet Lake-U series still uses the same UHD Graphics 620 as the older Whiskey Lake-U series and so there are no surprises here. If more graphics power is needed, we recommend going for a laptop with Iris graphics or discrete GeForce MX graphics instead like the Huawei MateBook X Pro.
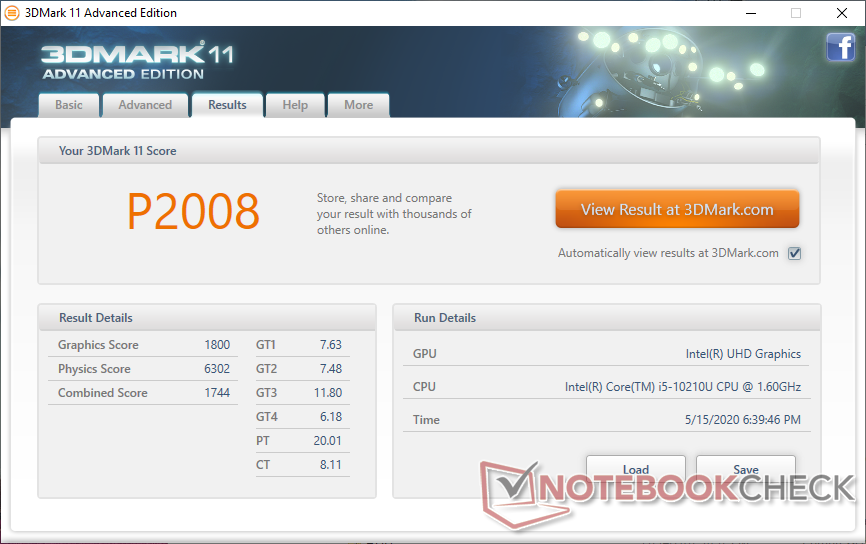
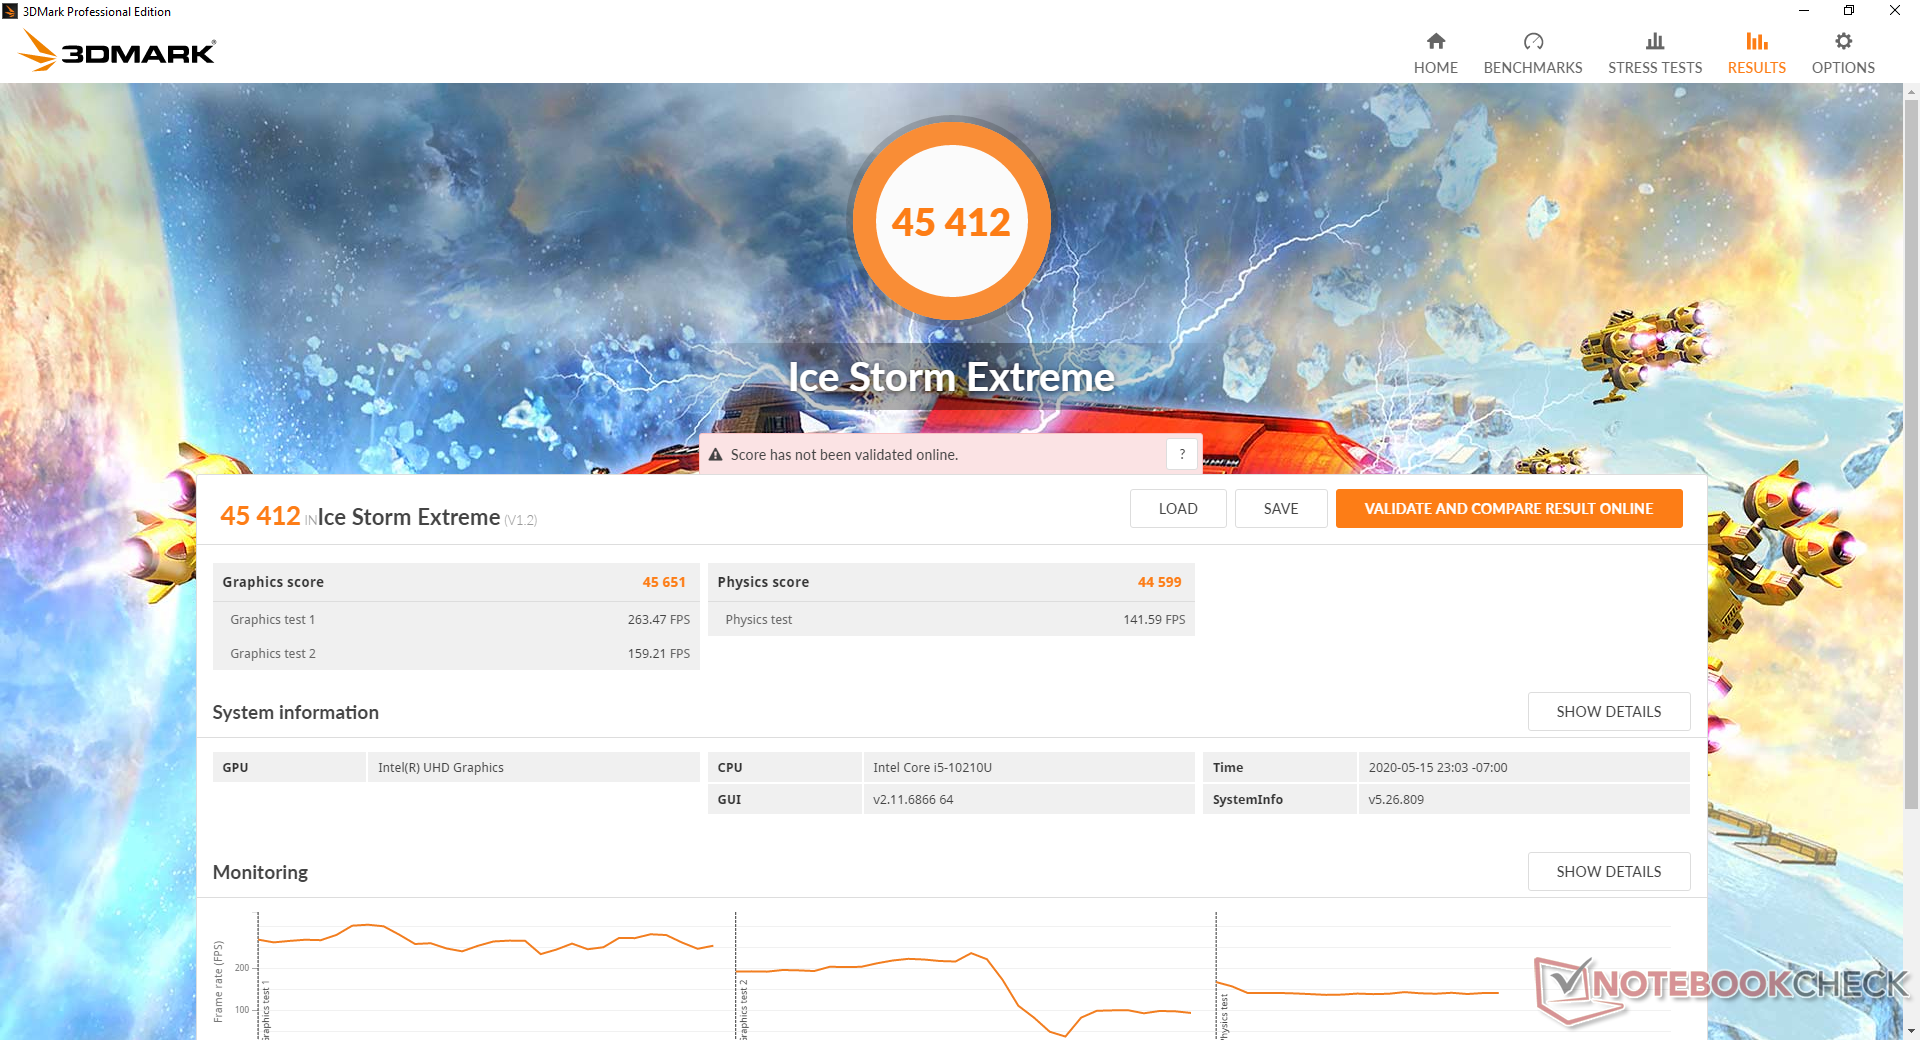
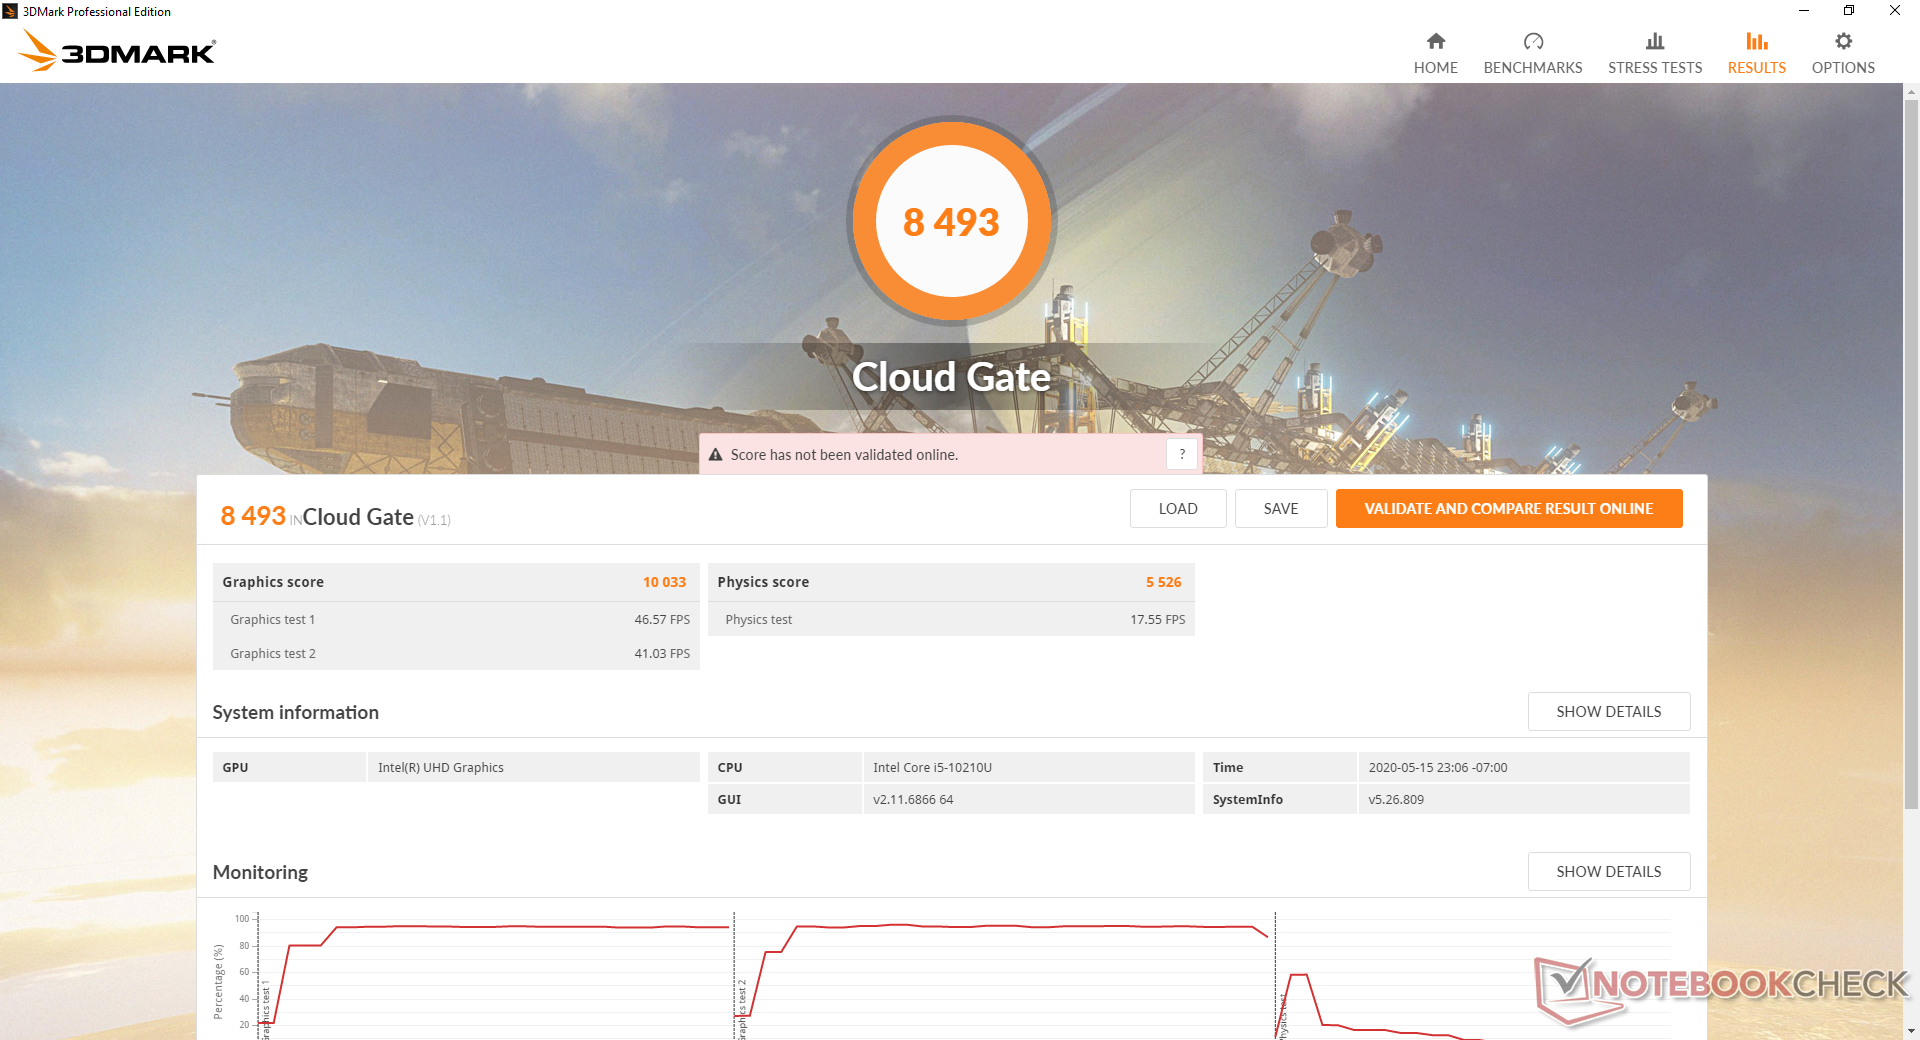
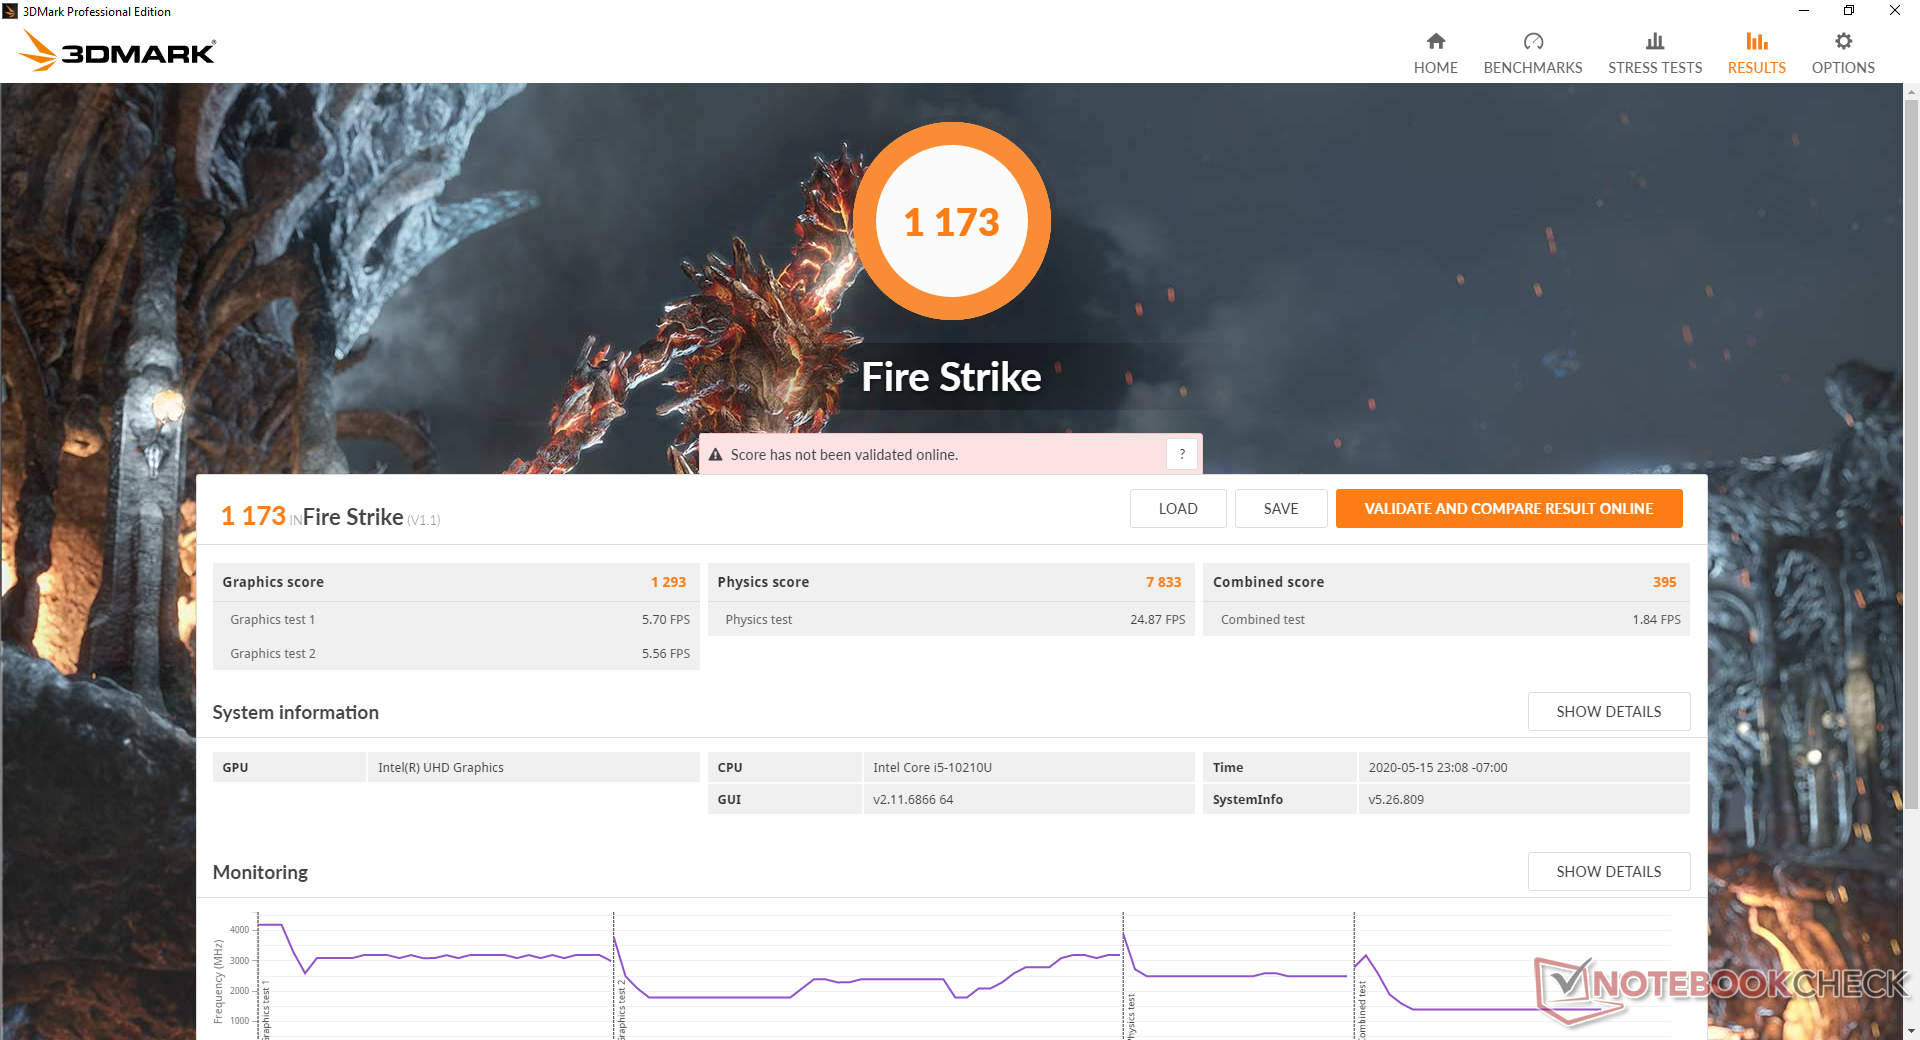
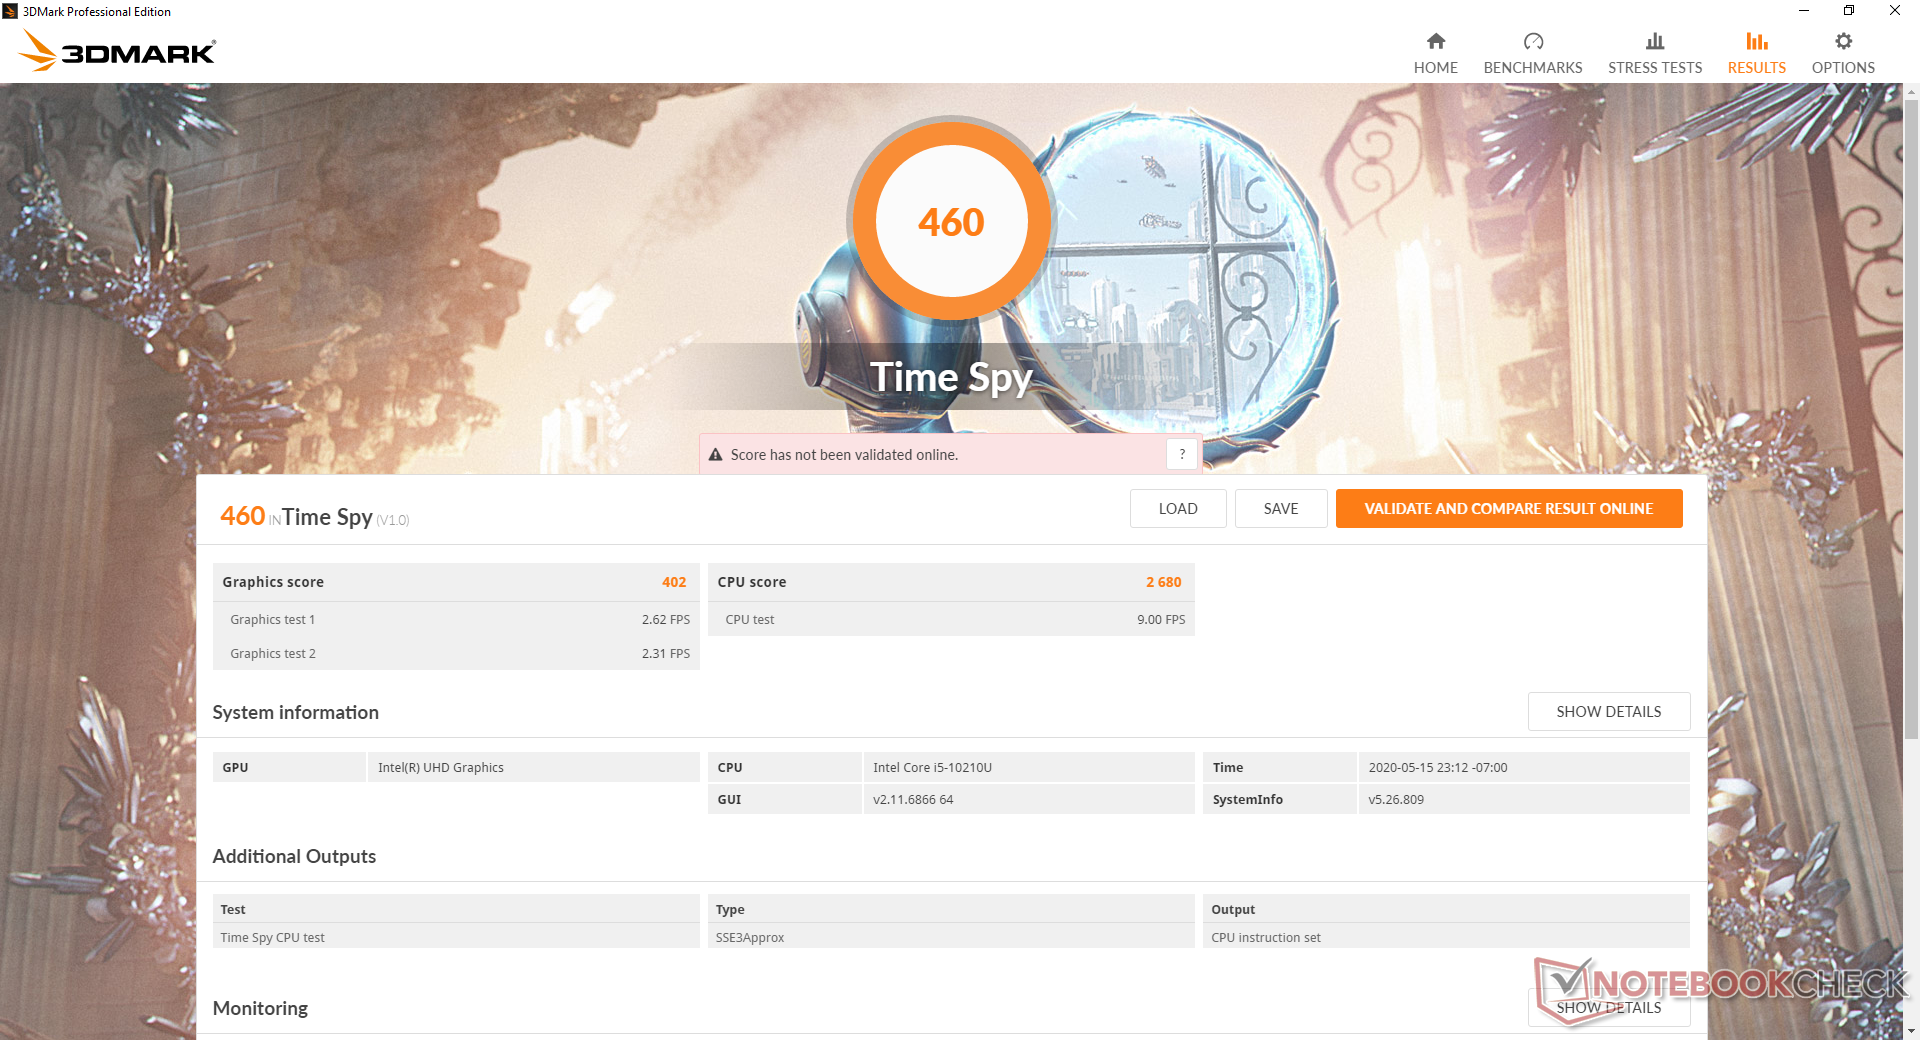
| 3DMark 11 Performance | 2008 points | |
| 3DMark Fire Strike Score | 1173 points | |
| 3DMark Time Spy Score | 460 points | |
Help | ||
| low | med. | high | ultra | |
|---|---|---|---|---|
| Dota 2 Reborn (2015) | 71.5 | 45.3 | 21.1 | 18.8 |
| X-Plane 11.11 (2018) | 21.9 | 14.9 | 13.2 |
Emissions
System Noise
The system is almost silent during low to low-medium loads. When running the first benchmarks scene of 3DMark 06, for example, fan noise doesn't pick up until halfway through the 90-second test. Running extreme loads for long periods will induce a fan noise of 38 dB(A) for results that are not unlike the XPS 13.
We're able to notice minor electronic noise when placing an ear near the keyboard keys. Thankfully, it's not loud or noticeable enough to be of any concern.

| Dynabook Portege X30L-G1331 UHD Graphics 620, i5-10210U, Samsung SSD PM981a MZVLB512HBJQ | Dell XPS 13 9300 Core i7-1065G7 Iris Plus Graphics G7 (Ice Lake 64 EU), i7-1065G7, Intel SSDPEMKF512G8 NVMe SSD | LG Gram 13Z980-A UHD Graphics 620, i5-8250U, SK Hynix HFS256G39TND-N210A | Apple MacBook Pro 13 2019 2TB3 Iris Plus Graphics 645, i5-8257U, Apple SSD AP0256 | Lenovo ThinkBook 13s-20R90071GE UHD Graphics 620, i5-8265U, SK hynix BC501 HFM512GDHTNG-8310A | HP EliteBook 830 G5-3JX74EA UHD Graphics 620, i5-8550U, Samsung SSD PM961 1TB M.2 PCIe 3.0 x4 NVMe (MZVLW1T0) | |
|---|---|---|---|---|---|---|
| Noise | -0% | 1% | -3% | -1% | -2% | |
| off / environment * (dB) | 28.5 | 28.3 1% | 28.1 1% | 29.5 -4% | 28.8 -1% | 29.3 -3% |
| Idle Minimum * (dB) | 28.5 | 28.3 1% | 28.1 1% | 29.5 -4% | 28.8 -1% | 29.3 -3% |
| Idle Average * (dB) | 28.5 | 28.3 1% | 28.1 1% | 29.5 -4% | 28.8 -1% | 29.3 -3% |
| Idle Maximum * (dB) | 28.5 | 28.3 1% | 28.1 1% | 29.5 -4% | 29.7 -4% | 29.3 -3% |
| Load Average * (dB) | 32 | 32.5 -2% | 34.3 -7% | 31.1 3% | 30.7 4% | 33.2 -4% |
| Load Maximum * (dB) | 38 | 39.3 -3% | 34.3 10% | 39.3 -3% | 38.3 -1% | 36.1 5% |
| Witcher 3 ultra * (dB) | 39.3 |
* ... smaller is better
Noise level
| Idle |
| 28.5 / 28.5 / 28.5 dB(A) |
| Load |
| 32 / 38 dB(A) |
 | ||
30 dB silent 40 dB(A) audible 50 dB(A) loud |
||
min: | ||
Temperature
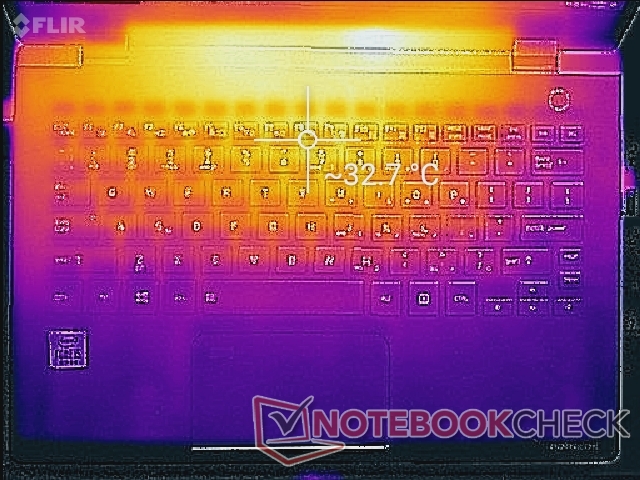
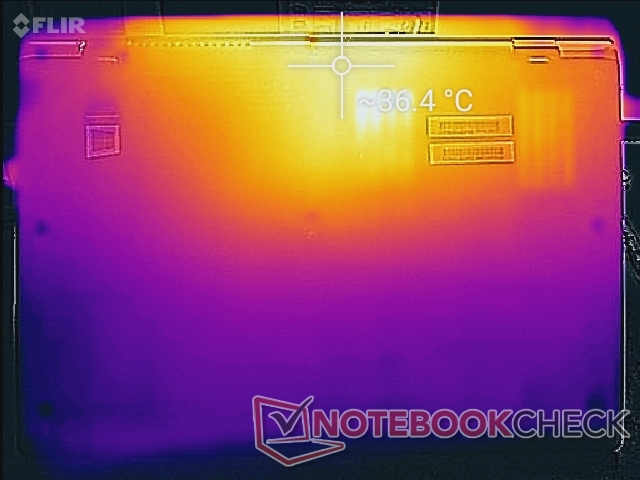
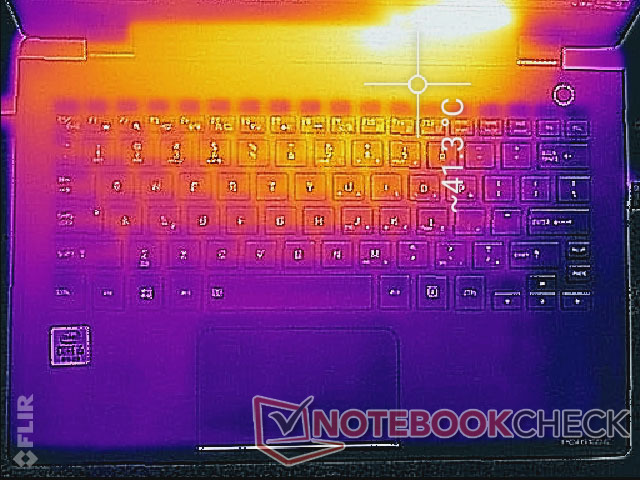
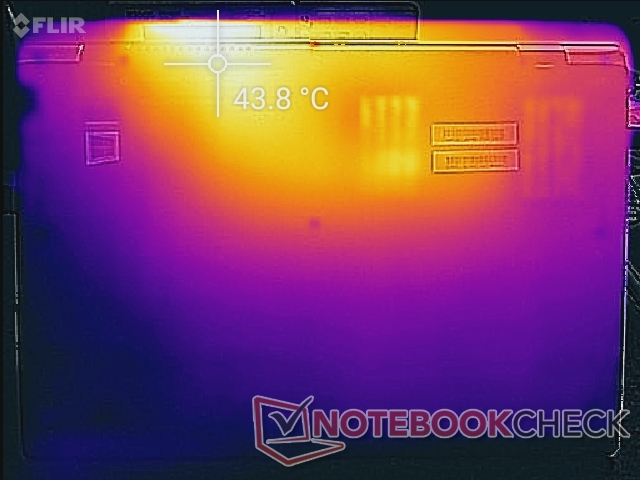
The palm rests, clickpad, and keyboard keys never become uncomfortably warm as the hot spots are toward the rear of the system instead. At worst, these areas can be as warm as 42 C as shown by the temperature maps below which is typical of ultra-thin laptops with Core U-class CPUs.
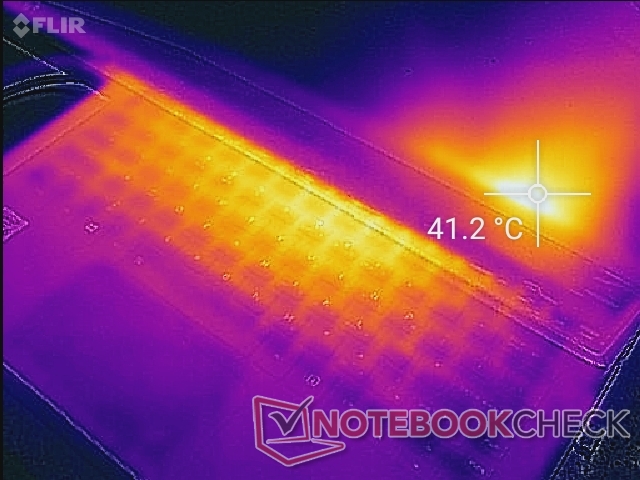
(±) The maximum temperature on the upper side is 41.2 °C / 106 F, compared to the average of 34.3 °C / 94 F, ranging from 21.2 to 62.5 °C for the class Office.
(±) The bottom heats up to a maximum of 44 °C / 111 F, compared to the average of 36.8 °C / 98 F
(+) In idle usage, the average temperature for the upper side is 28.5 °C / 83 F, compared to the device average of 29.5 °C / 85 F.
(+) The palmrests and touchpad are cooler than skin temperature with a maximum of 26 °C / 78.8 F and are therefore cool to the touch.
(±) The average temperature of the palmrest area of similar devices was 27.6 °C / 81.7 F (+1.6 °C / 2.9 F).
Stress Test
We stress the system with synthetic loads to identify for any potential throttling issues. When running Prime95, the CPU would immediately become stable at 2.1 GHz whereas most other Intel laptops would boost to 3.0+ GHz for at least the first few seconds. These results mirror our CineBench R15 Multi-Thread loop test results above. Core temperature can indeed reach 100 C albeit only for a short while at the start of the test before falling and stabilizing at 74 C.
Performance is limited if running on battery power. A 3DMark 11 test on batteries returns Physics and graphics scores of 5430 and 1417 points, respectively, compared to 6302 and 1800 points when on mains.
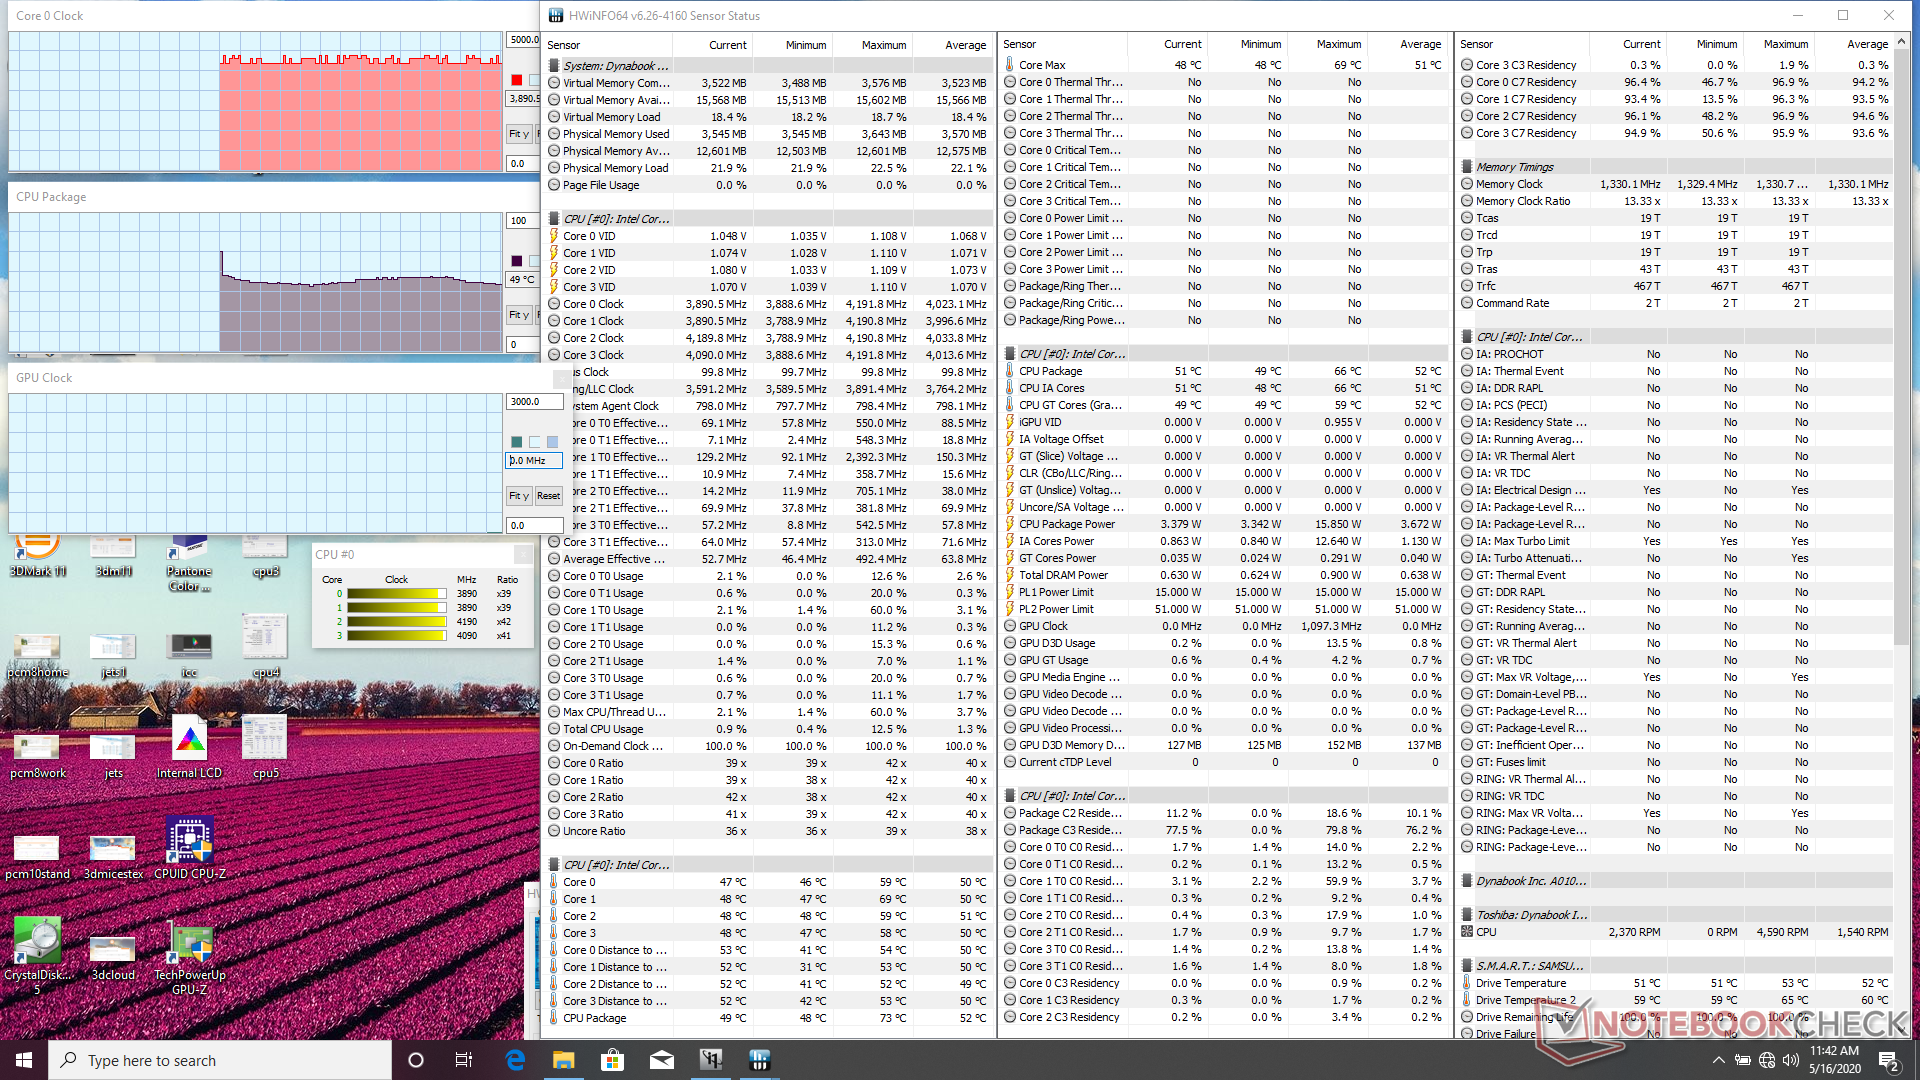
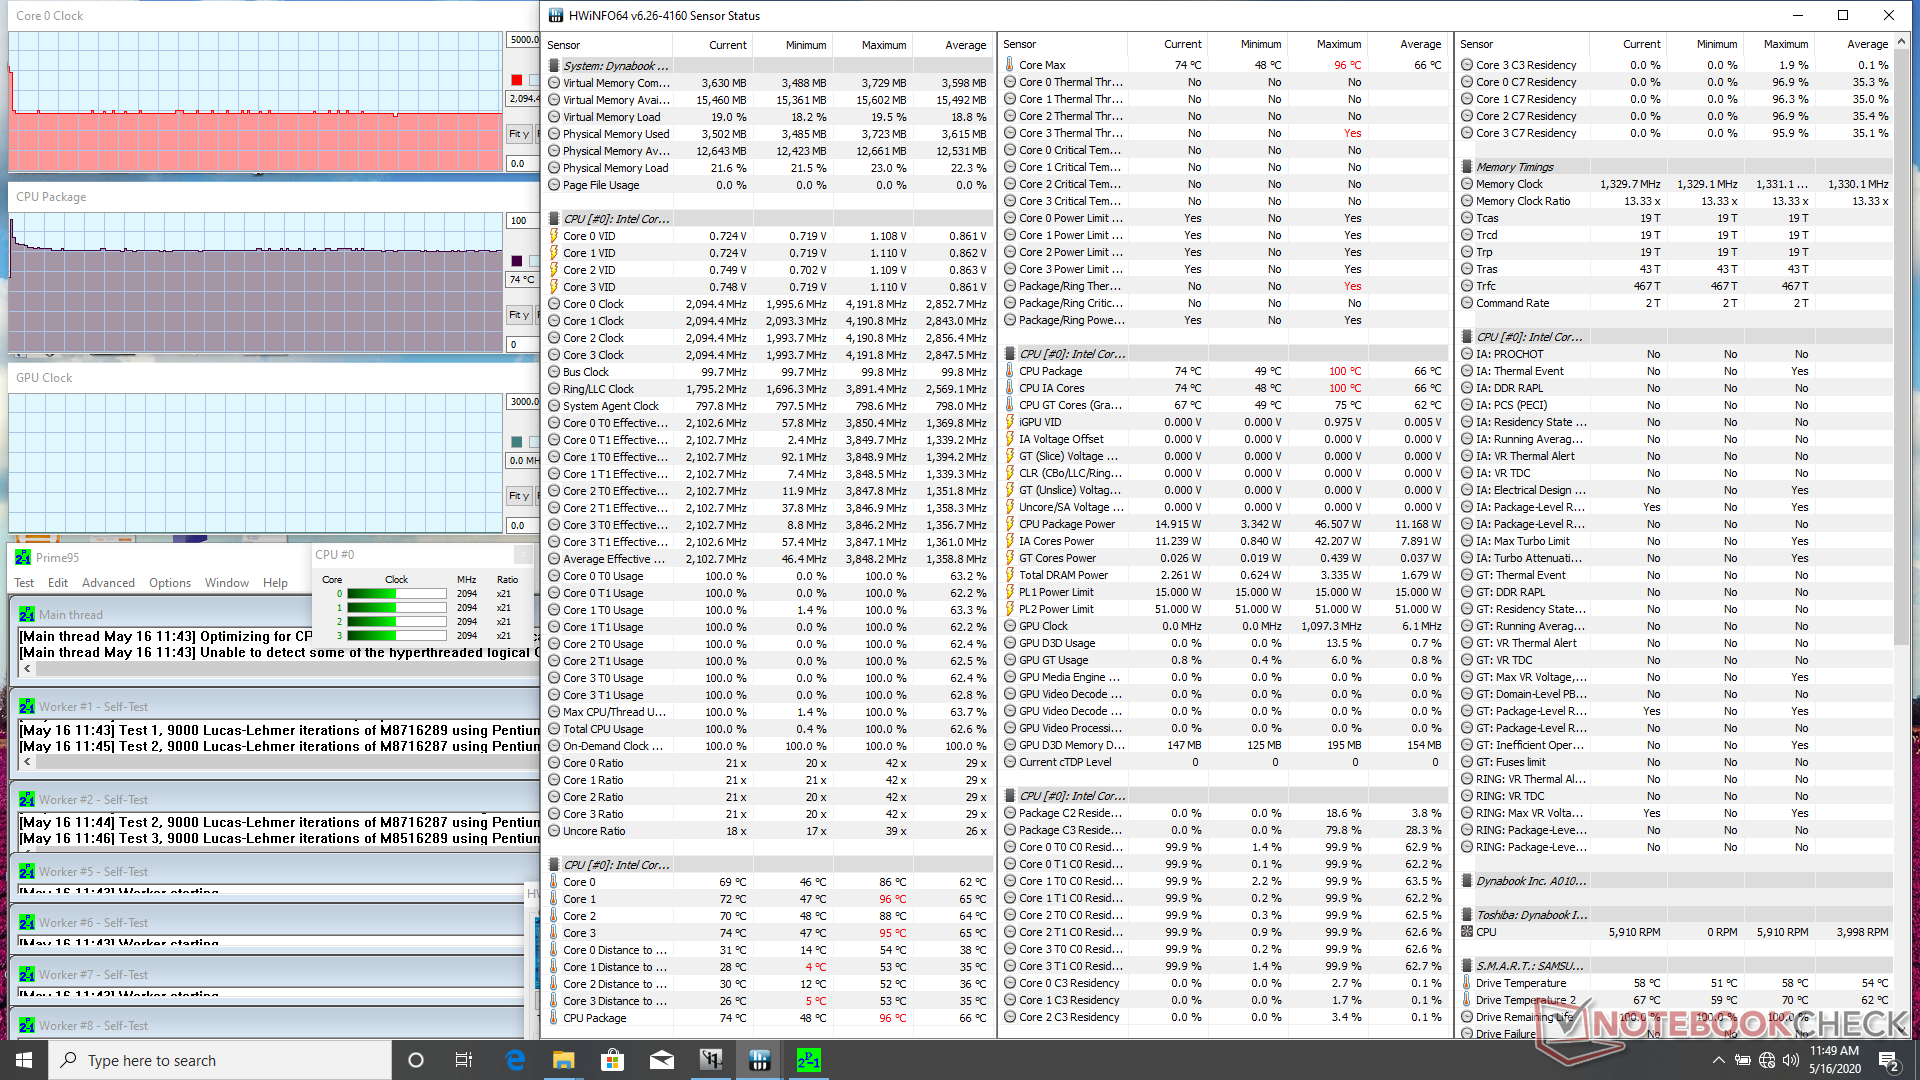
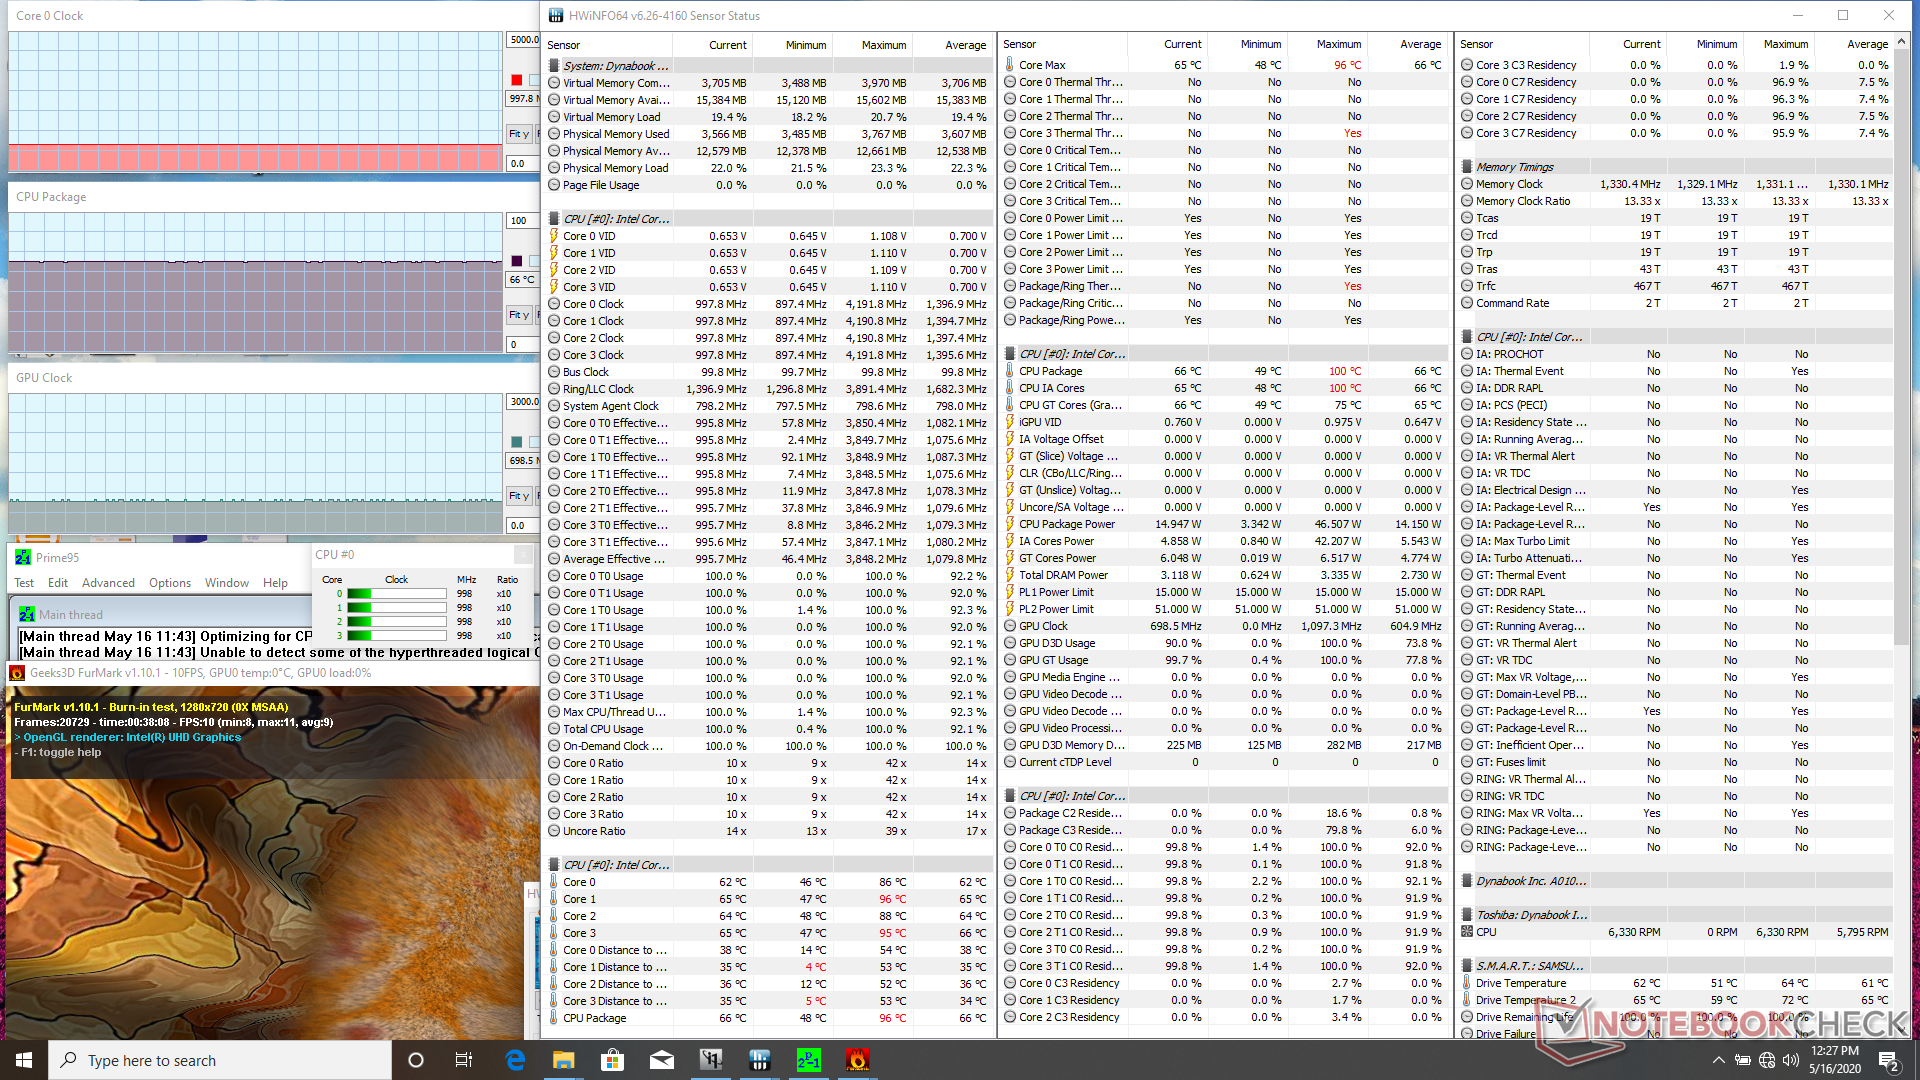
| CPU Clock (GHz) | GPU Clock (MHz) | Average CPU Temperature (°C) | |
| System Idle | -- | -- | 49 |
| Prime95 Stress | 2.1 | -- | 74 |
| Prime95 + FurMark Stress | 1.0 | 699 | 66 |
Speakers


Dynabook Portege X30L-G1331 audio analysis
(+) | speakers can play relatively loud (83.1 dB)
Bass 100 - 315 Hz
(-) | nearly no bass - on average 29.8% lower than median
(±) | linearity of bass is average (8.6% delta to prev. frequency)
Mids 400 - 2000 Hz
(±) | reduced mids - on average 6.8% lower than median
(±) | linearity of mids is average (8.5% delta to prev. frequency)
Highs 2 - 16 kHz
(+) | balanced highs - only 3.2% away from median
(+) | highs are linear (5.4% delta to prev. frequency)
Overall 100 - 16.000 Hz
(±) | linearity of overall sound is average (26% difference to median)
Compared to same class
» 79% of all tested devices in this class were better, 7% similar, 14% worse
» The best had a delta of 7%, average was 21%, worst was 53%
Compared to all devices tested
» 80% of all tested devices were better, 4% similar, 16% worse
» The best had a delta of 4%, average was 23%, worst was 134%
Apple MacBook 12 (Early 2016) 1.1 GHz audio analysis
(+) | speakers can play relatively loud (83.6 dB)
Bass 100 - 315 Hz
(±) | reduced bass - on average 11.3% lower than median
(±) | linearity of bass is average (14.2% delta to prev. frequency)
Mids 400 - 2000 Hz
(+) | balanced mids - only 2.4% away from median
(+) | mids are linear (5.5% delta to prev. frequency)
Highs 2 - 16 kHz
(+) | balanced highs - only 2% away from median
(+) | highs are linear (4.5% delta to prev. frequency)
Overall 100 - 16.000 Hz
(+) | overall sound is linear (10.2% difference to median)
Compared to same class
» 7% of all tested devices in this class were better, 2% similar, 90% worse
» The best had a delta of 5%, average was 18%, worst was 53%
Compared to all devices tested
» 5% of all tested devices were better, 1% similar, 94% worse
» The best had a delta of 4%, average was 23%, worst was 134%
Energy Management
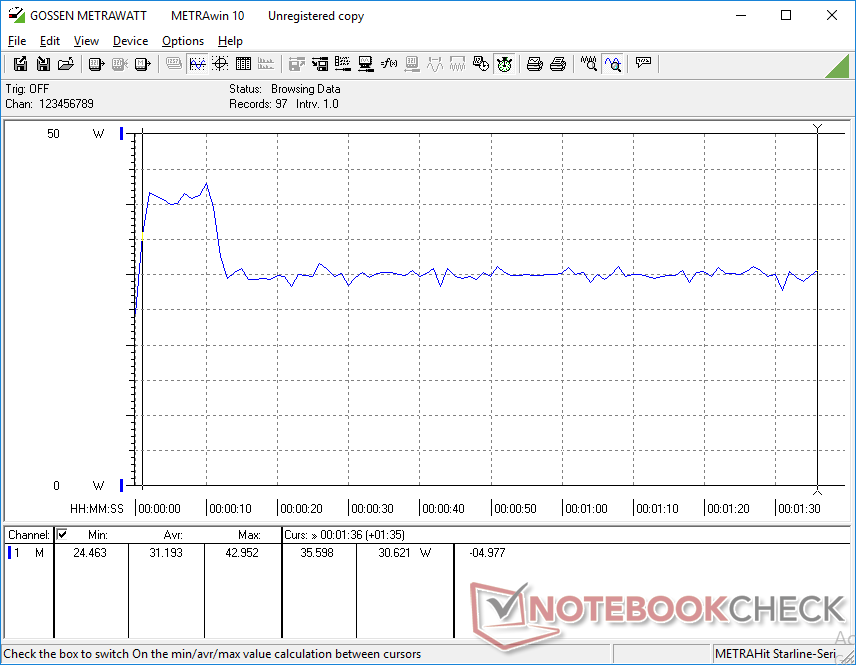
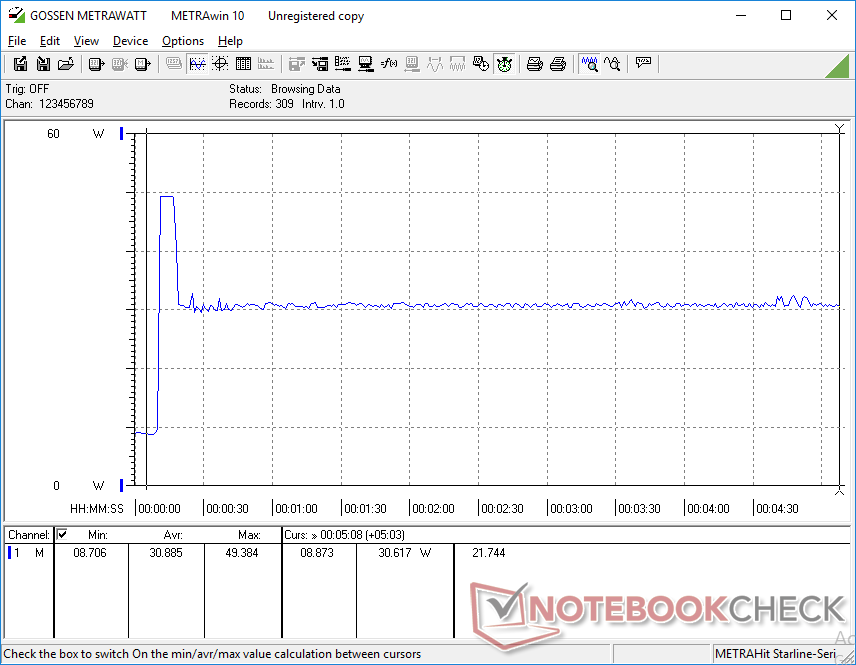
Power Consumption
Idling on desktop demands between 3 W and 9 W on average depending on the brightness setting and power profile. Running the first benchmark scene of 3DMark 06 consumes about 31 W to be slightly more efficient than the Lenovo ThinkBook 13s or HP EliteBook 830 G5 equipped with older Core U-series CPUs.
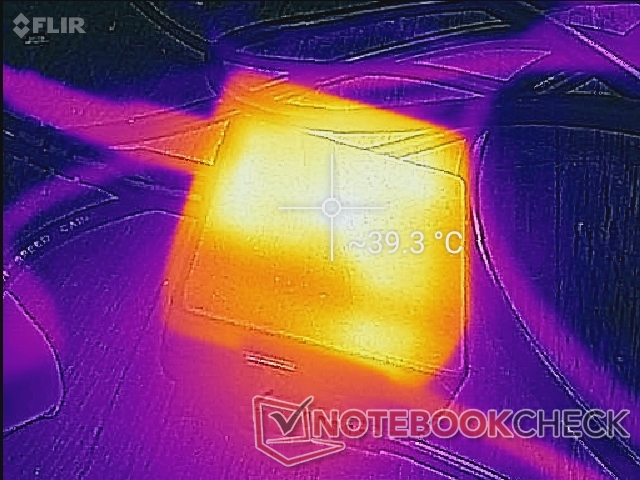
We're able to measure a temporary maximum of 49.4 W from the small (~6.2 x 6.2 x 2.8 cm) AC adapter when running Prime95 as shown by our graphs below.
| Off / Standby | |
| Idle | |
| Load |
|
Key:
min: | |
| Dynabook Portege X30L-G1331 i5-10210U, UHD Graphics 620, Samsung SSD PM981a MZVLB512HBJQ, IPS, 1920x1080, 13.3" | Dell XPS 13 9300 Core i7-1065G7 i7-1065G7, Iris Plus Graphics G7 (Ice Lake 64 EU), Intel SSDPEMKF512G8 NVMe SSD, IPS, 1920x1200, 13.4" | LG Gram 13Z980-A i5-8250U, UHD Graphics 620, SK Hynix HFS256G39TND-N210A, IPS, 1920x1080, 13.3" | Apple MacBook Pro 13 2019 2TB3 i5-8257U, Iris Plus Graphics 645, Apple SSD AP0256, IPS, 2560x1600, 13.3" | Lenovo ThinkBook 13s-20R90071GE i5-8265U, UHD Graphics 620, SK hynix BC501 HFM512GDHTNG-8310A, a-Si IPS LED, 1920x1080, 13.3" | HP EliteBook 830 G5-3JX74EA i5-8550U, UHD Graphics 620, Samsung SSD PM961 1TB M.2 PCIe 3.0 x4 NVMe (MZVLW1T0), IPS LED, 1920x1080, 13.3" | |
|---|---|---|---|---|---|---|
| Power Consumption | -16% | -12% | -14% | -2% | -28% | |
| Idle Minimum * (Watt) | 2.8 | 4.2 -50% | 3.9 -39% | 2.1 25% | 3.1 -11% | 4.5 -61% |
| Idle Average * (Watt) | 4.9 | 6.9 -41% | 7.3 -49% | 6.9 -41% | 5.87 -20% | 6.4 -31% |
| Idle Maximum * (Watt) | 9 | 7.5 17% | 7.4 18% | 7.8 13% | 6.6 27% | 9.2 -2% |
| Load Average * (Watt) | 31.2 | 33.3 -7% | 36.1 -16% | 42 -35% | 35.3 -13% | 35.7 -14% |
| Load Maximum * (Watt) | 49.4 | 48.4 2% | 35.8 28% | 64.5 -31% | 46.5 6% | 65.4 -32% |
| Witcher 3 ultra * (Watt) | 37.1 |
* ... smaller is better
Battery Life
Battery capacity is small likely to keep the weight as low as possible. Users can expect around 8 hours of real-world WLAN use when on the Balanced profile at 150 nits brightness.
Recharging from empty to full capacity takes about 1.5 hours compared to twice that on the LG Gram 14.
| Dynabook Portege X30L-G1331 i5-10210U, UHD Graphics 620, 42 Wh | Dell XPS 13 9300 Core i7-1065G7 i7-1065G7, Iris Plus Graphics G7 (Ice Lake 64 EU), 52 Wh | LG Gram 13Z980-A i5-8250U, UHD Graphics 620, 72 Wh | Apple MacBook Pro 13 2019 2TB3 i5-8257U, Iris Plus Graphics 645, 58.2 Wh | Lenovo ThinkBook 13s-20R90071GE i5-8265U, UHD Graphics 620, 45 Wh | HP EliteBook 830 G5-3JX74EA i5-8550U, UHD Graphics 620, 49 Wh | |
|---|---|---|---|---|---|---|
| Battery runtime | 53% | 46% | 57% | 10% | -14% | |
| WiFi v1.3 (h) | 8.3 | 12.7 53% | 12.1 46% | 13 57% | 9.1 10% | 7.1 -14% |
| Load (h) | 1.4 | 2.3 | ||||
| Reader / Idle (h) | 12.8 |
Pros
Cons
Verdict
The biggest reason for owning a Dynabook Portege X30L over alternatives like the HP EliteBook, Dell Latitude, or Lenovo ThinkPad X series would be for its very low weight. We can't stress how much of a difference a few hundred grams can be especially if you like to lug your laptop around everywhere you go. Even the LG Gram 13 isn't as light as our Portege and it's marketed as being one of the lightest subnotebooks you can buy.
If weight isn't your primary concern, then other laptops tend to offer faster CPU and GPU performance, firmer keyboard keys, additional connectivity options like Thunderbolt and WAN, more rigid chassis, longer battery life, and easier access to the internal SSD. The HP EliteBook x360 1030, for example, is brighter, thinner, and more versatile when on the road although at the cost of some extra weight.
The Dynabook Portege X30L works best when you're always moving and want a lightweight companion that doesn't skimp on port options or quality. If you spend most of your day working in one place, however, then there are better options out there as you wouldn't be exploiting the main selling point of the system.
Dynabook Portege X30L-G1331
- 05/18/2020 v7 (old)
Allen Ngo
Price comparison
