Sayonara, Alcantara: Microsoft Surface Laptop 3 13.5-inch Core i5 Review
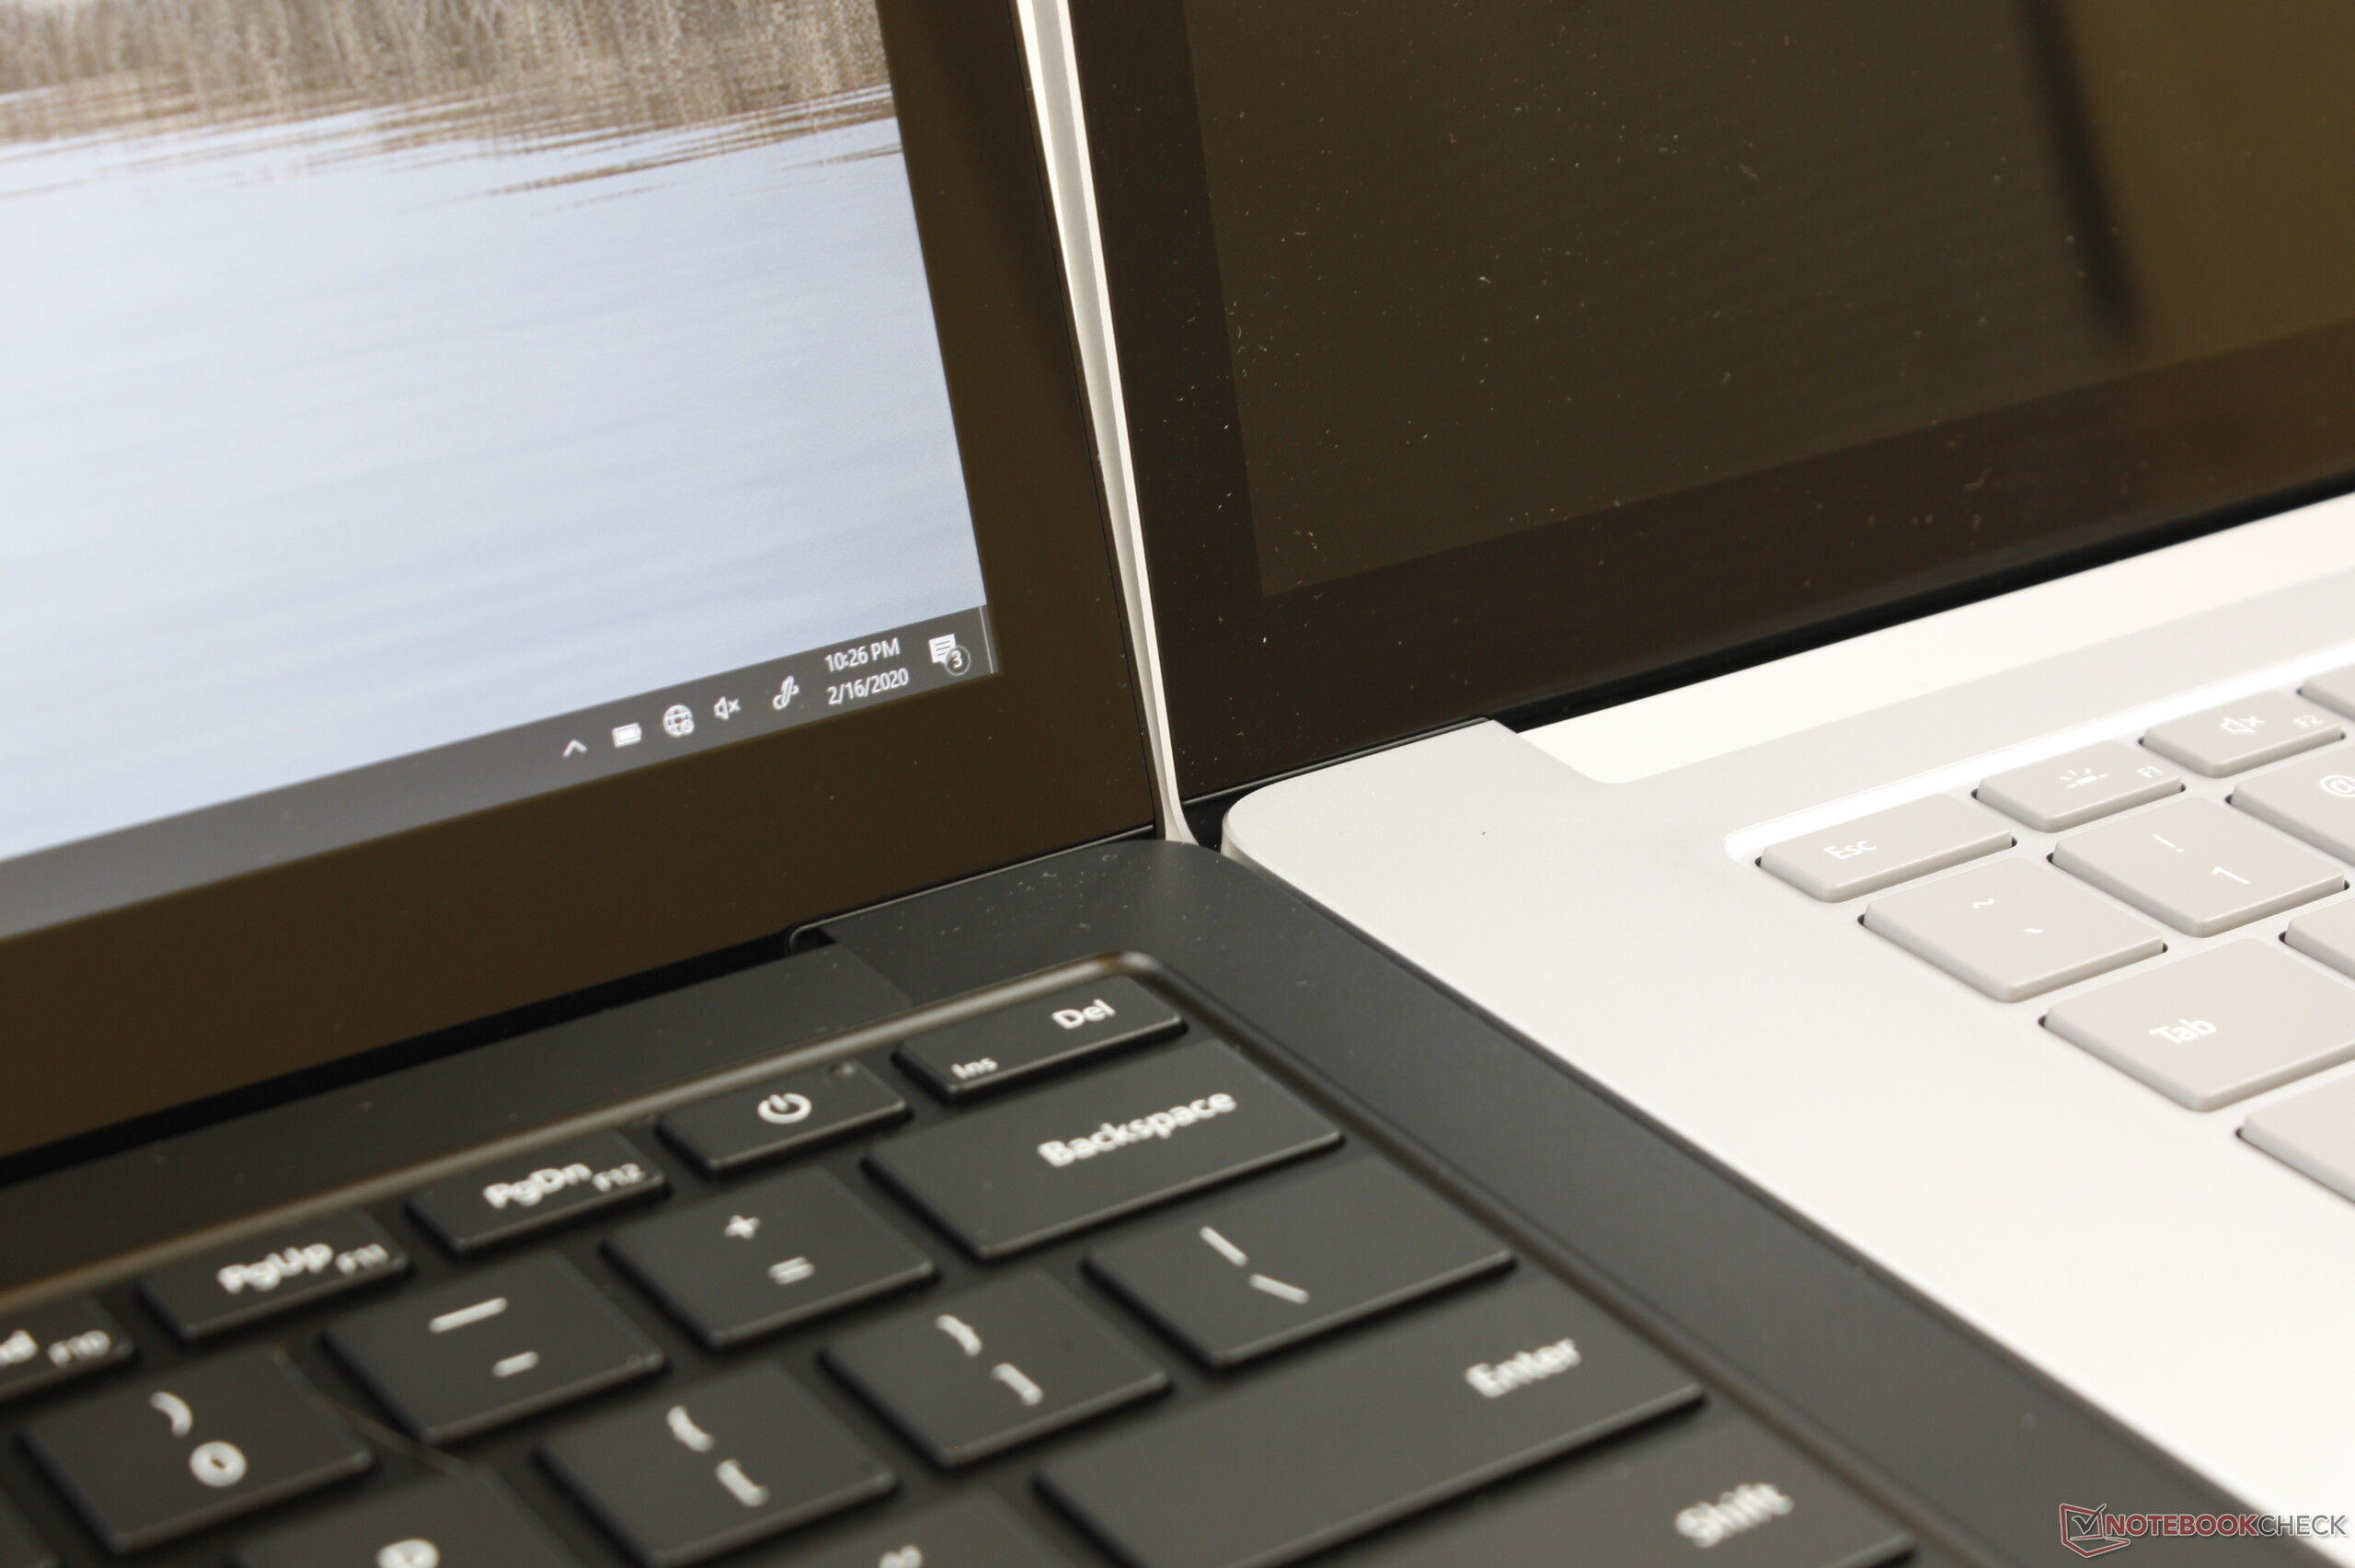
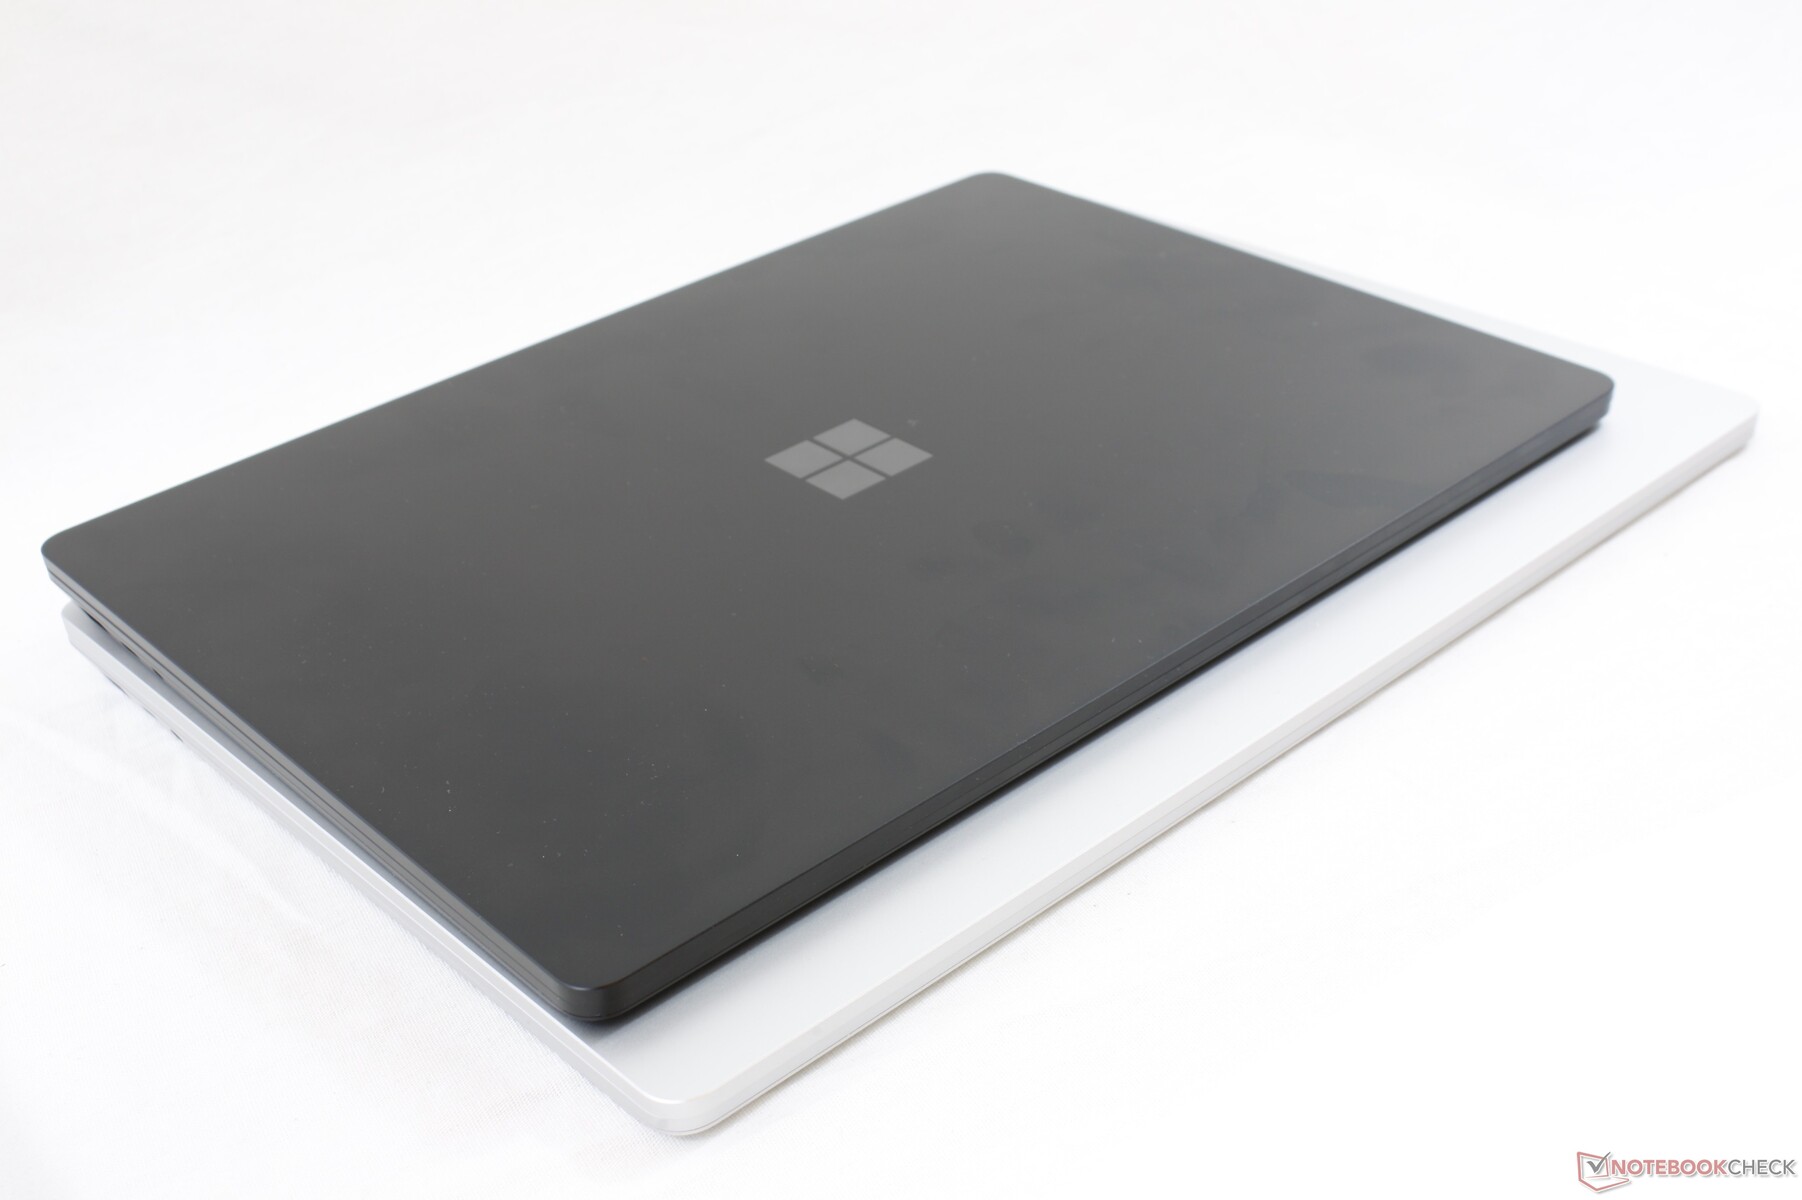
 vs. White 15-inch Surface Laptop 3 (bottom)")
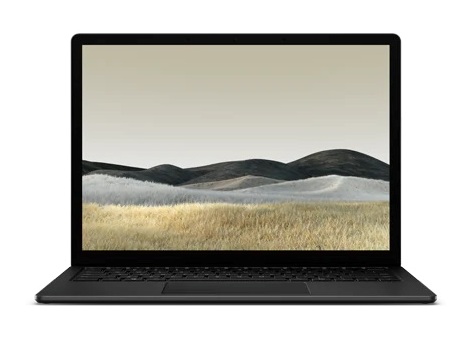
The Surface Laptop 2 launched on October 2018 with 14 nm Intel Kaby Lake-R CPUs and an identical chassis design to the original 2017 Surface Laptop. The Surface Laptop 3 launched a year later with 10 nm Ice Lake CPUs and an identical chassis design to the original model yet again. This time, however, users get to choose between the classic Alcantara finish or a new metal finish for a more "MacBook-like" feel.
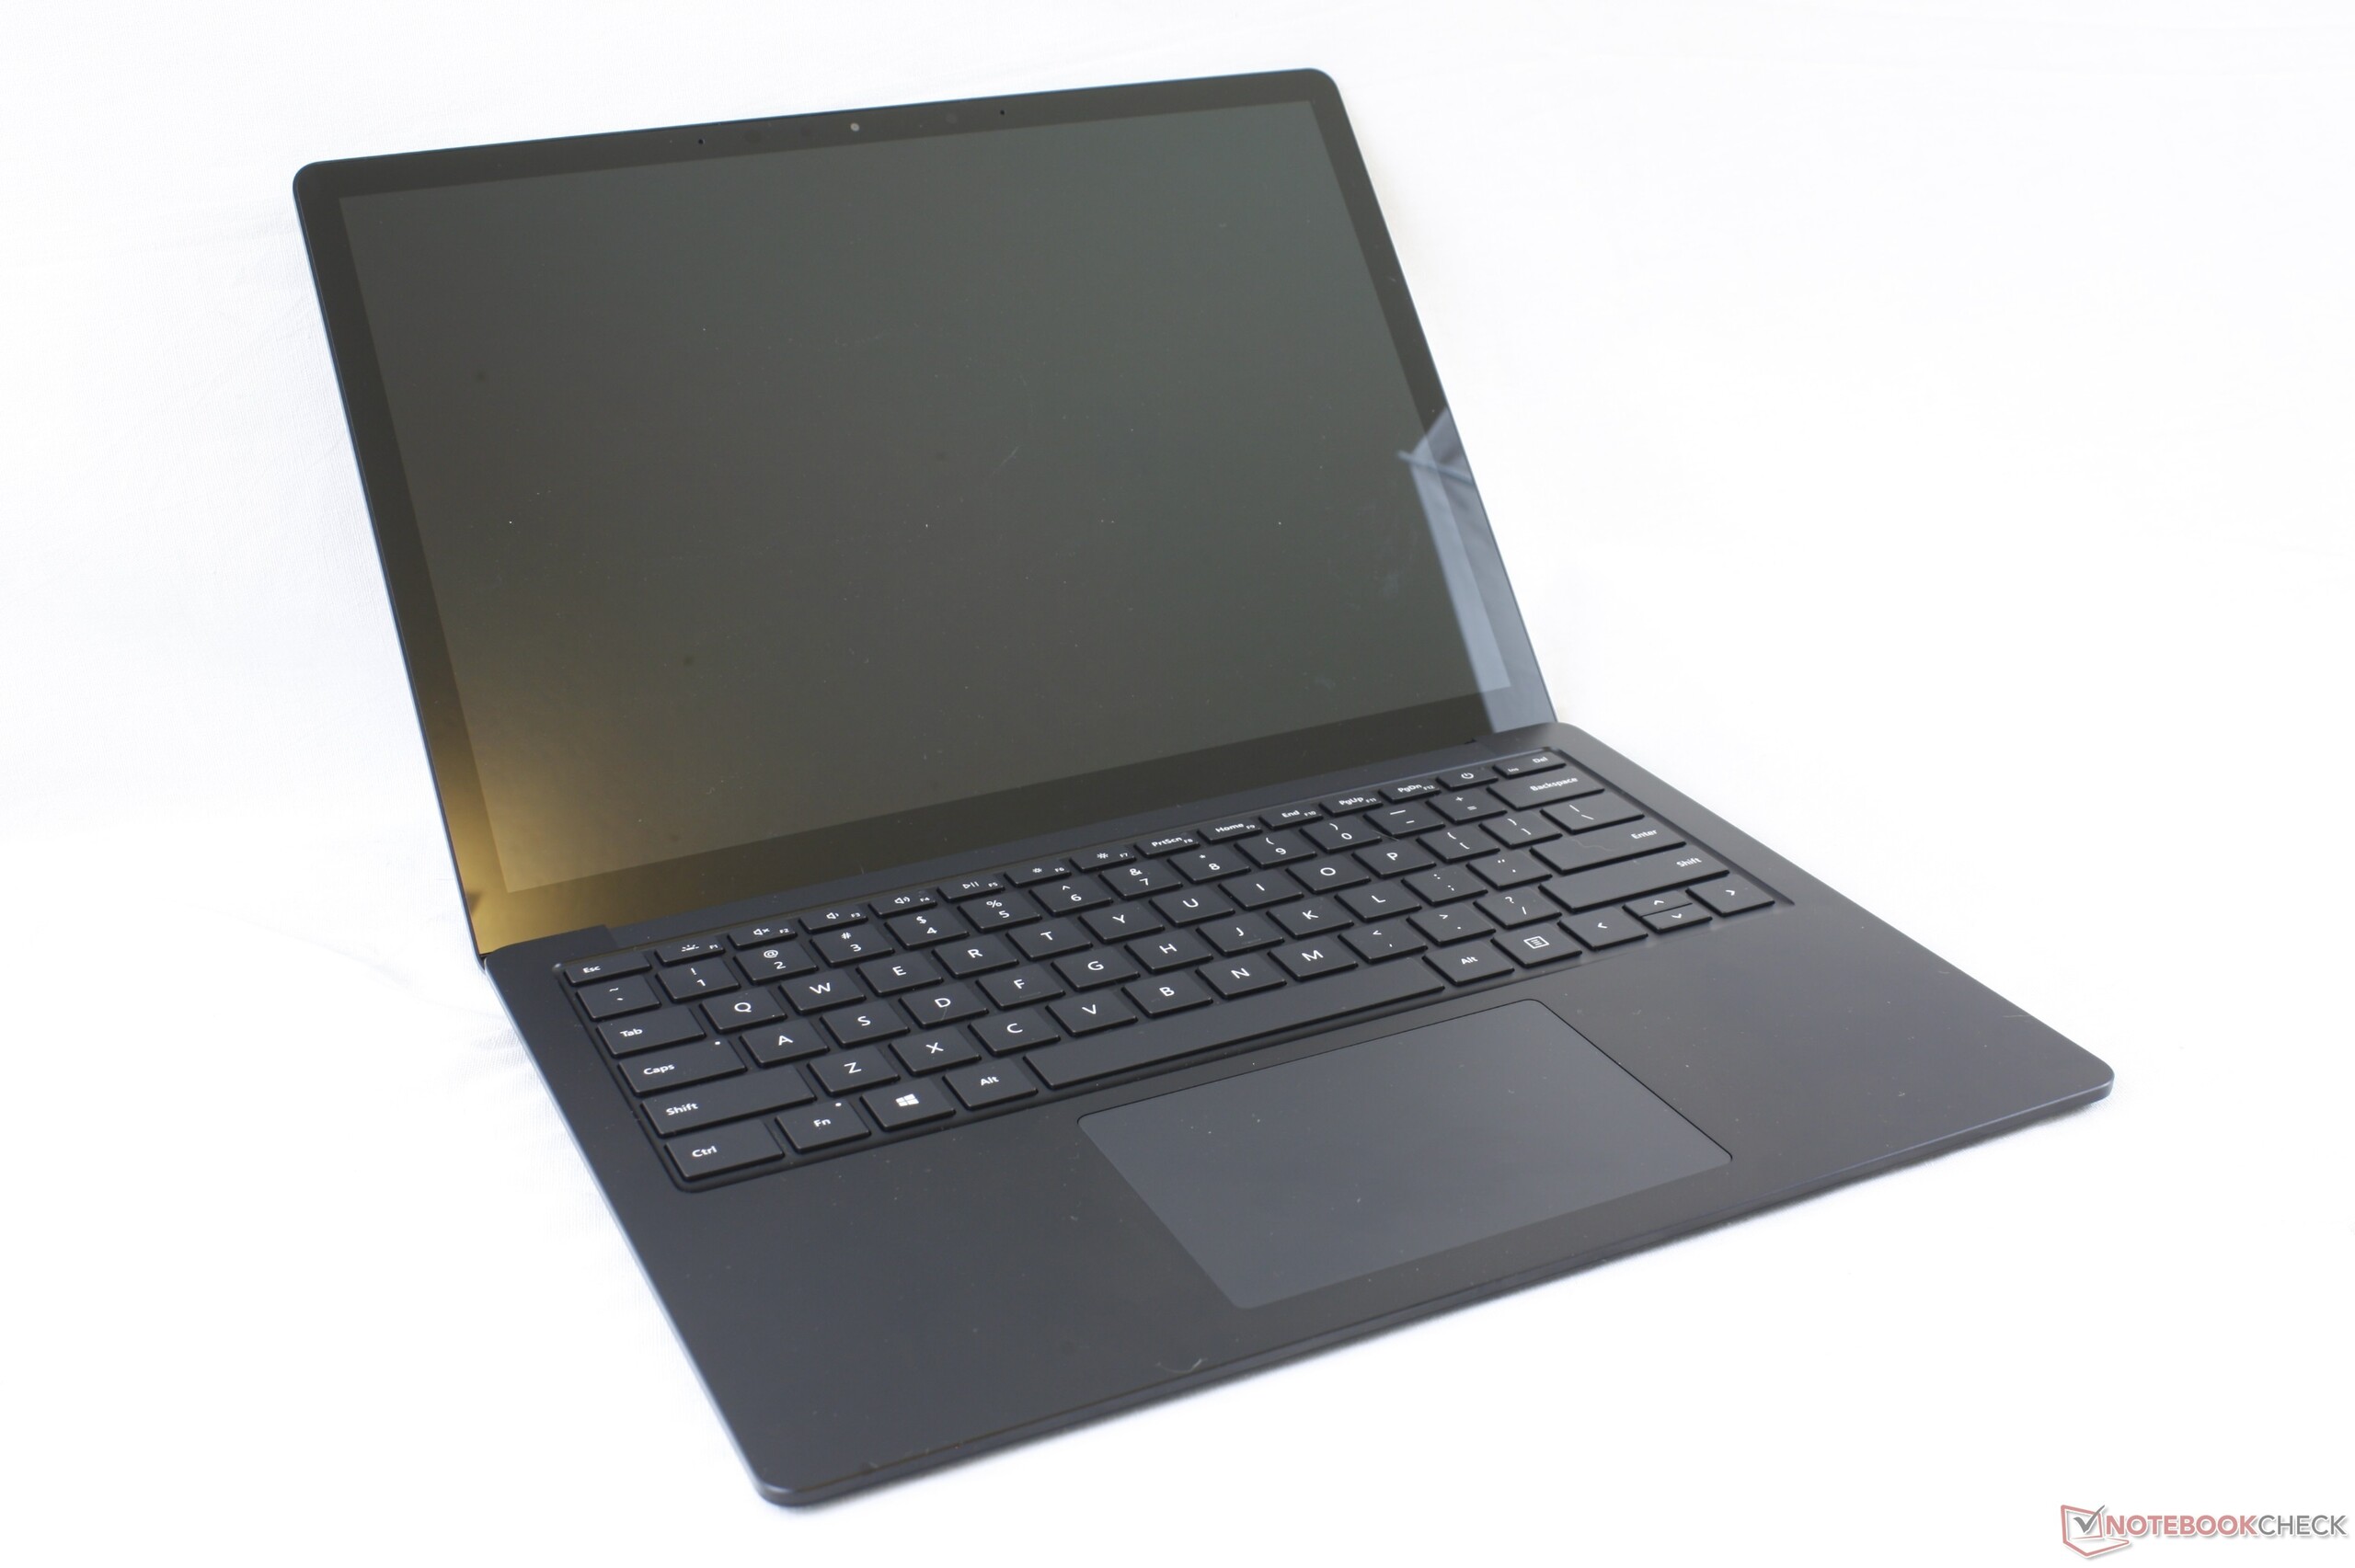
Our unit here is the black metal Surface Laptop 3 13.5 equipped with the Core i5-1035G7 CPU, 8 GB of LPDDR4x RAM, and 256 GB SSD for a retail price of $1000 USD. AMD Ryzen options are only available for the 15-inch Surface Laptop 3 15 as of this writing. The unique selling point of the Surface Laptop continues to be its uncommon 3:2 2256 x 1504 display in contrast to the typical 16:9 Ultrabook or 16:10 MacBook. While the native resolution has not changed from the Surface Laptop 2, there are still display differences that we will note below.
The Surface Laptop 3 13.5 competes directly with other high-end subnotebooks including the Dell XPS 13, Asus ZenBook S13, or Lenovo Yoga S940 and some 3:2 alternatives like the Huawei MateBook X Pro or Acer Swift 3 SF313.
More Microsoft Surface reviews:
Rating | Date | Model | Weight | Height | Size | Resolution | Price |
|---|---|---|---|---|---|---|---|
| 84 % v7 (old) | 02 / 2020 | Microsoft Surface Laptop 3 13 Core i5-1035G7 i5-1035G7, Iris Plus Graphics G7 (Ice Lake 64 EU) | 1.3 kg | 14.5 mm | 13.50" | 2256x1504 | |
| 90.6 % v7 (old) | 02 / 2020 | Apple MacBook Pro 13 2019 2TB3 i5-8257U, Iris Plus Graphics 645 | 1.4 kg | 14.9 mm | 13.30" | 2560x1600 | |
| 86.3 % v7 (old) | 10 / 2019 | Dell XPS 13 7390 2-in-1 Core i7 i7-1065G7, Iris Plus Graphics G7 (Ice Lake 64 EU) | 1.3 kg | 13 mm | 13.40" | 1920x1200 | |
| 90.1 % v7 (old) | 07 / 2019 | Lenovo ThinkPad X1 Carbon 2019-20QE000VGE i7-8665U, UHD Graphics 620 | 1.1 kg | 14.9 mm | 14.00" | 2560x1440 | |
| 83.9 % v7 (old) | 12 / 2019 | Microsoft Surface Laptop 3 15 i7-1065G7 i7-1065G7, Iris Plus Graphics G7 (Ice Lake 64 EU) | 1.5 kg | 14.7 mm | 15.00" | 2496x1664 |
Case
When Microsoft introduced the first Surface Laptop three years ago, they vaunted the Alcantara surface as a unique selling point over traditional metal Ultrabooks. Alcantara is softer in texture and easier to make available in different colors than anodized magnesium or aluminum alloy. The problem, however, is that Alcantara is easier to damage and more difficult to clean with a tendency to collect unsightly grease over time.
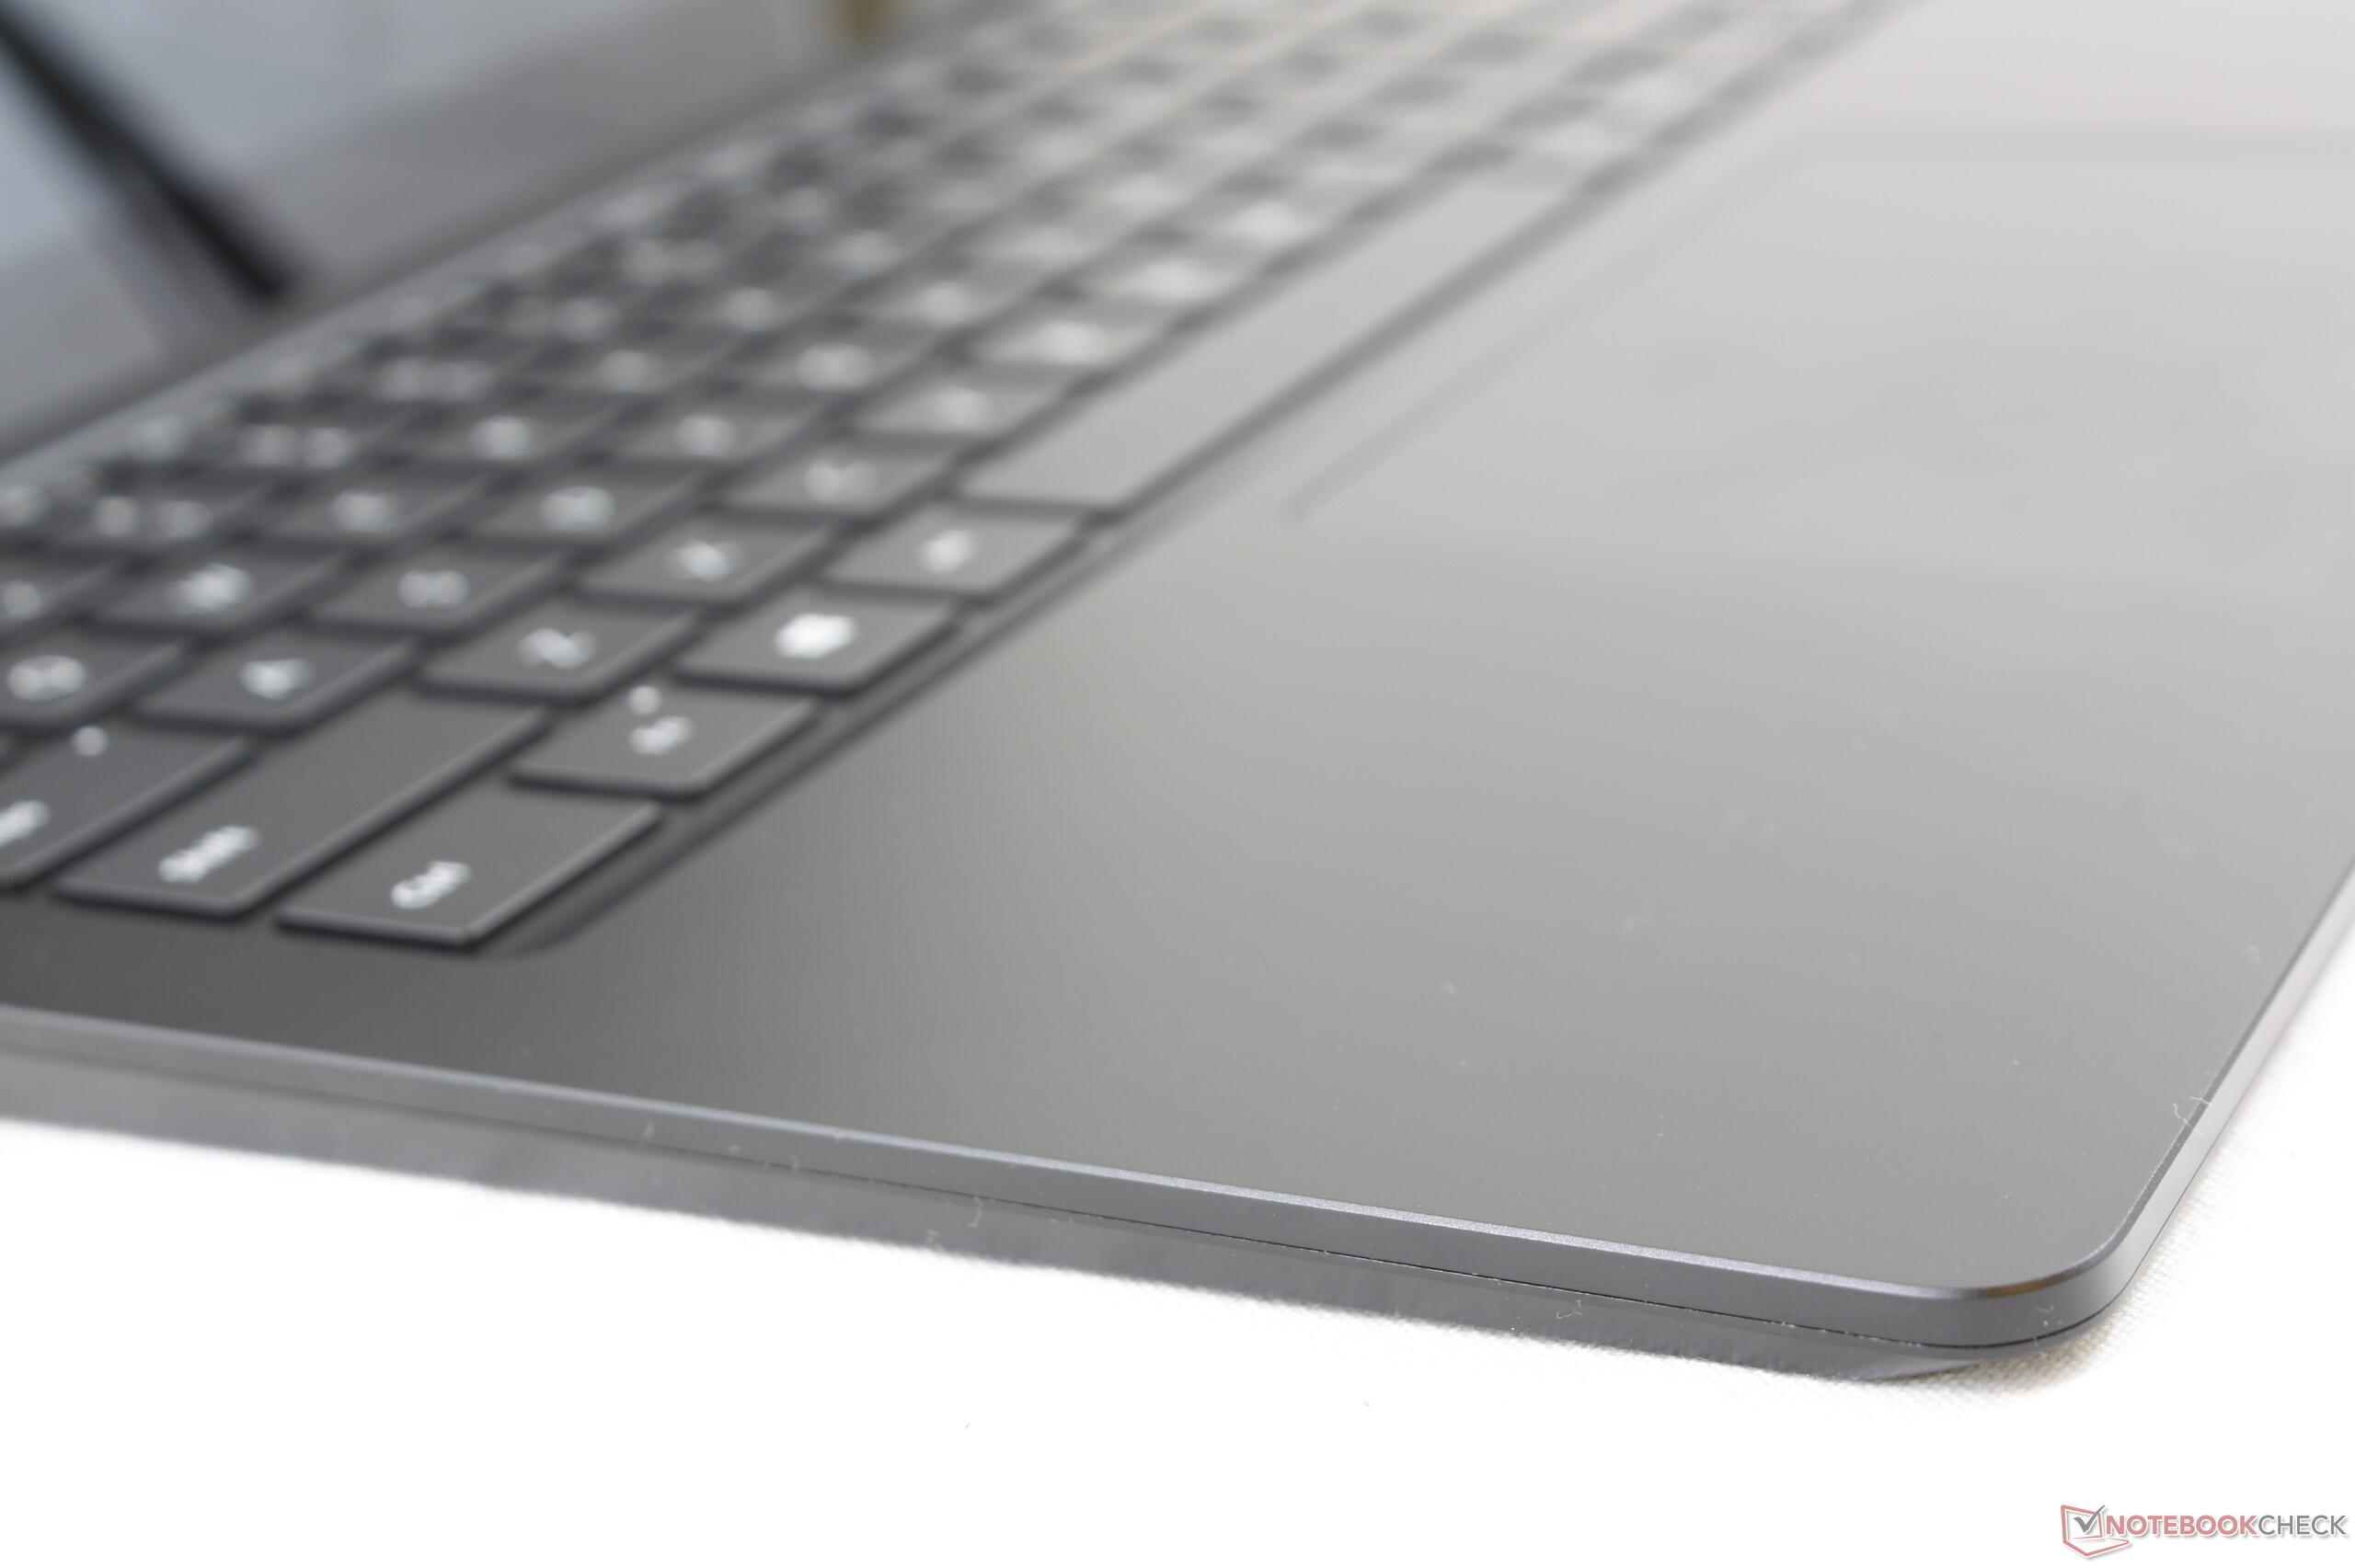
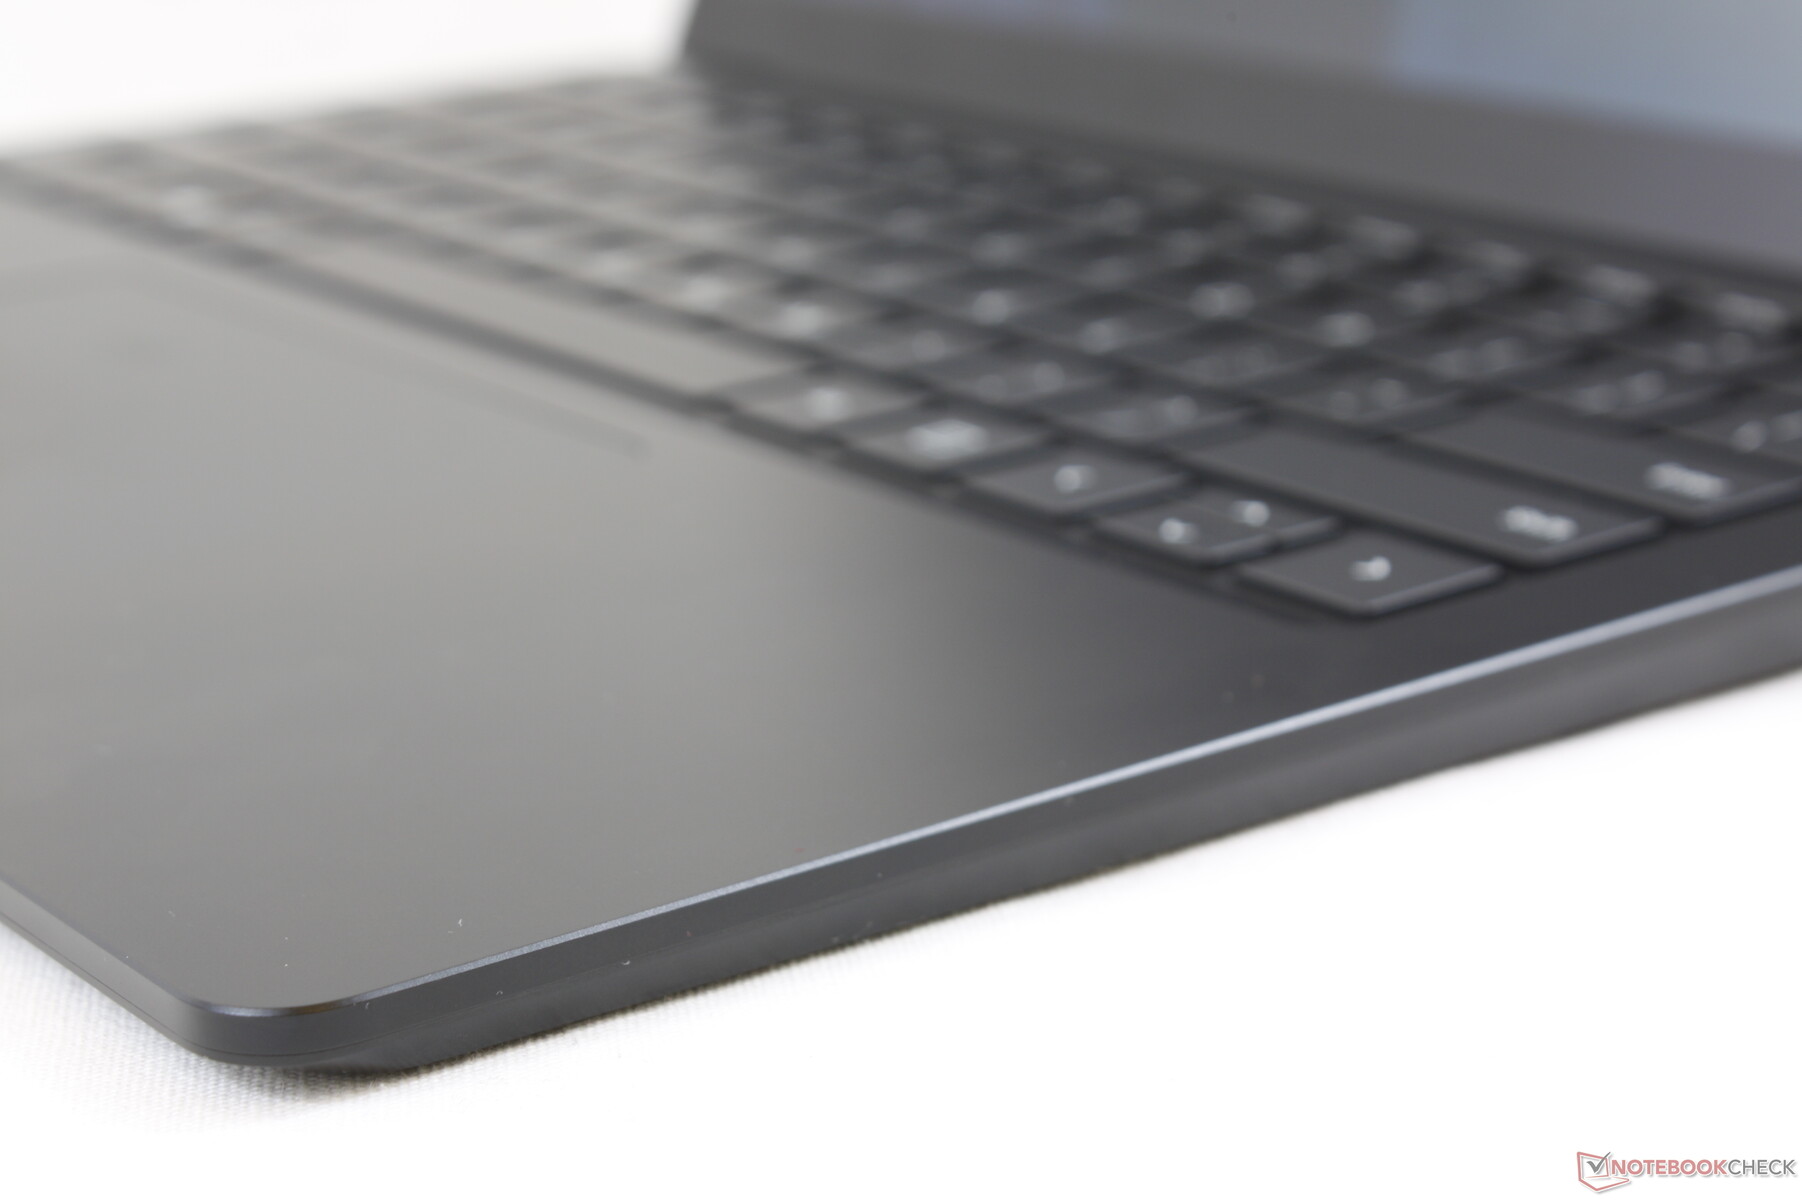
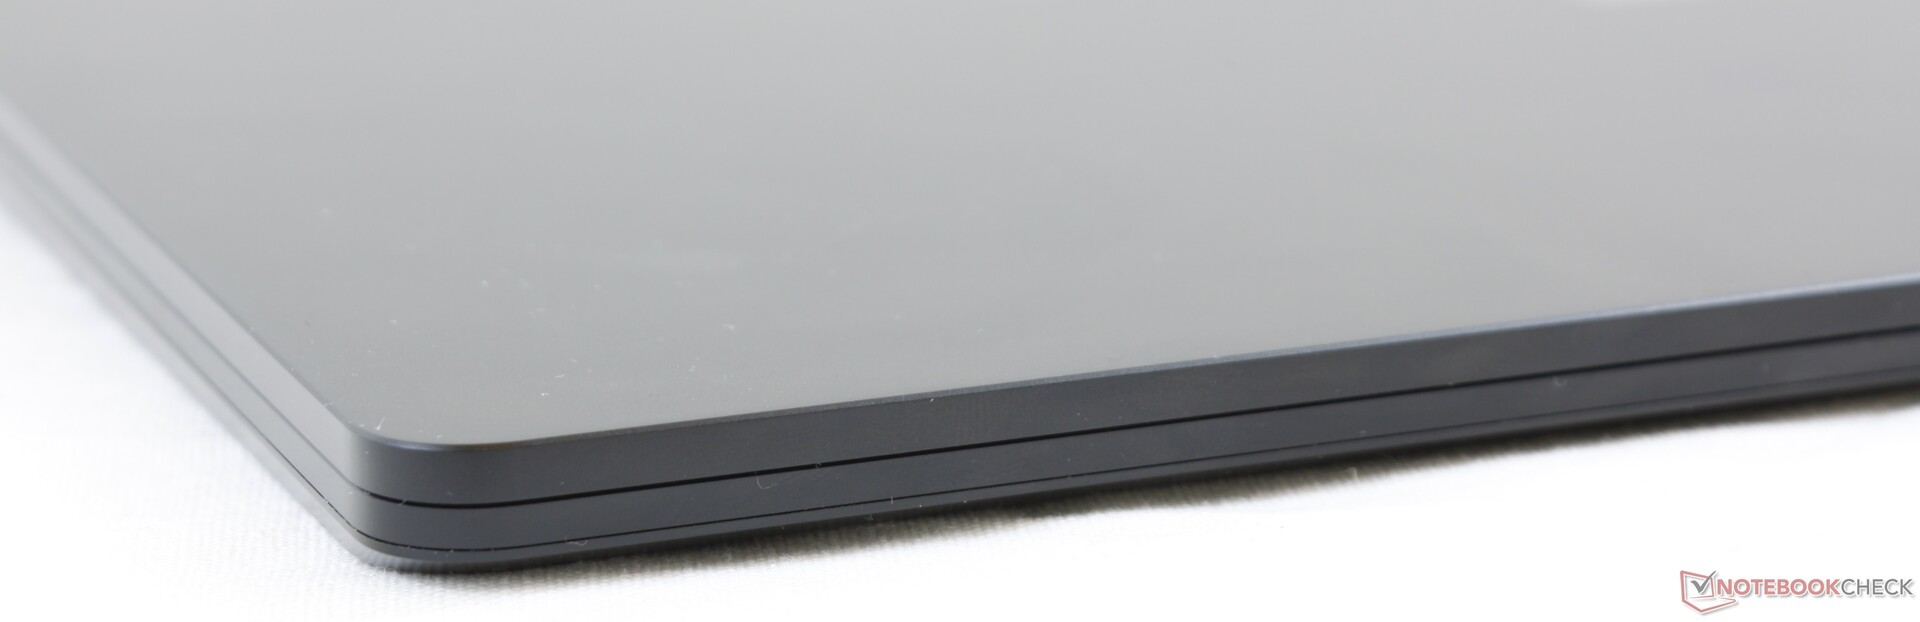
Surface Laptop fans clamoring for a metal option now have their wish on the 13.5-inch Surface Laptop 3. The smooth matte aluminum texture now feels more like the metal Apple MacBook, Razer Blade, or Huawei MateBook X Pro that we're all already accustomed to. When compared to Alcantara, the system feels stiffer and more like a high-quality unibody design. Both the base and lid warp very little when attempting to twist them. Nonetheless, our test unit would creak slightly around the hinges when adjusting the angle of the display to suggest that the manufacturing could be better.
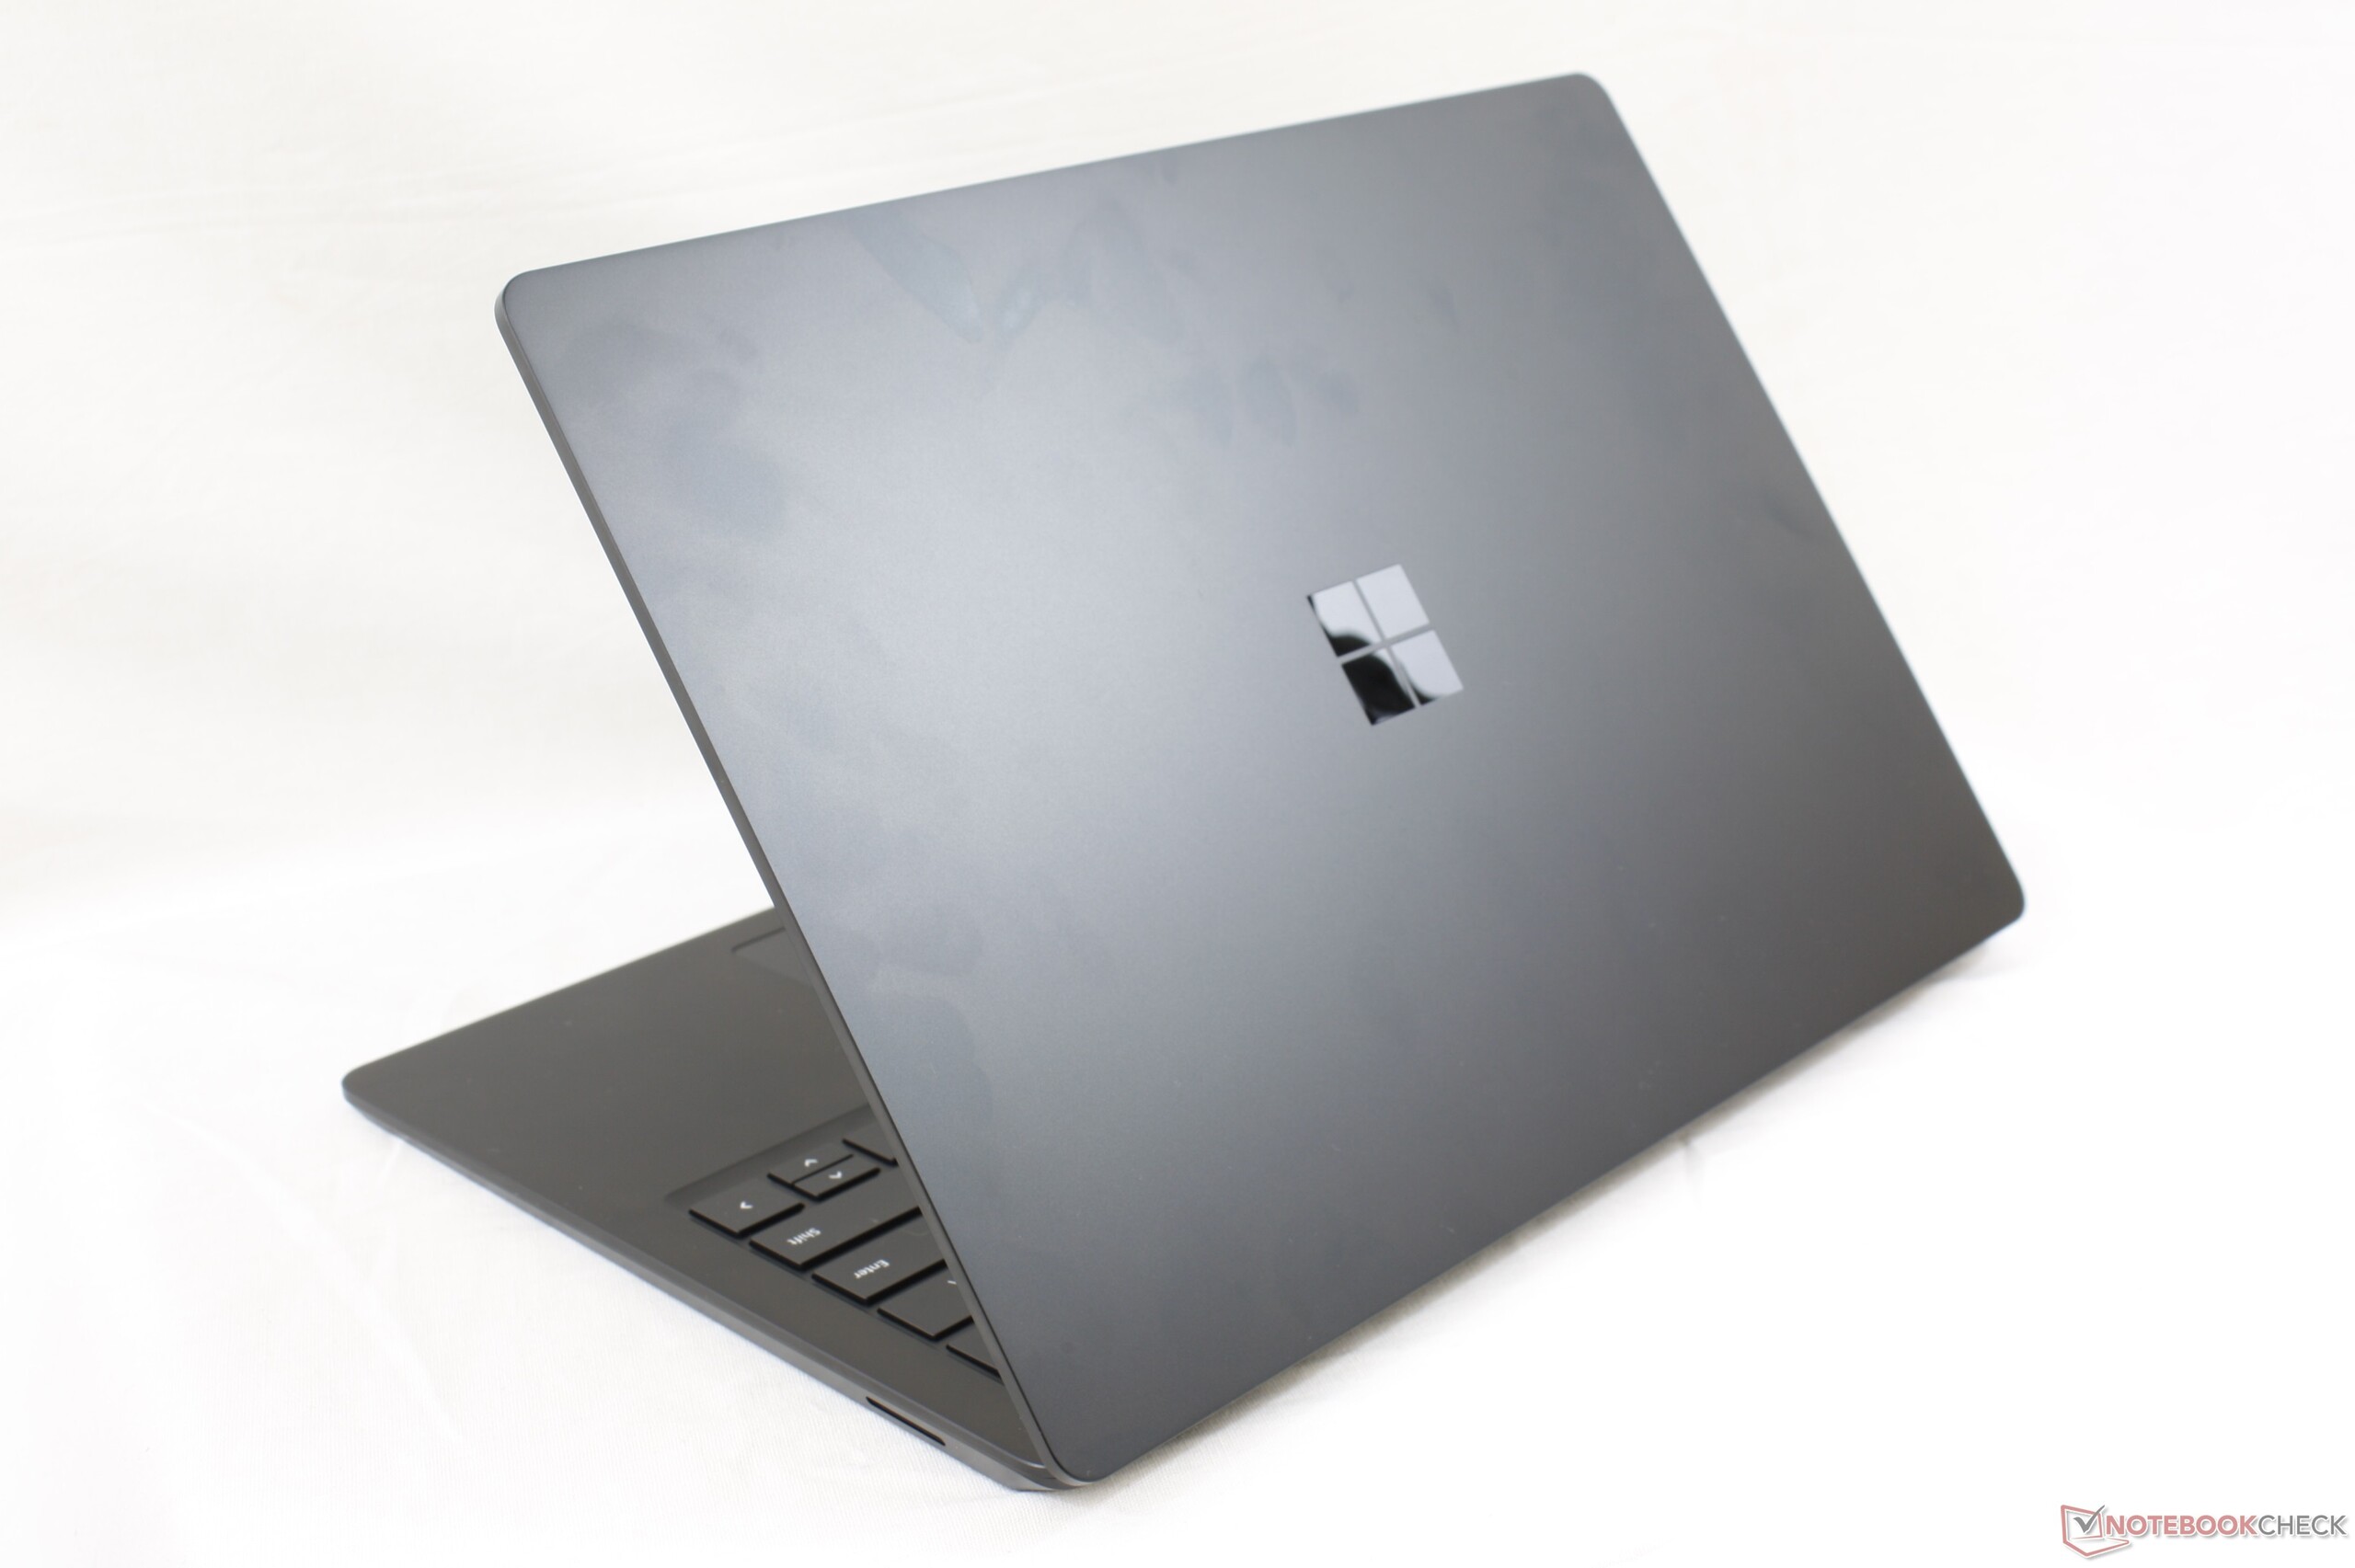
The drawback to the new metal chassis is largely superficial. By dropping what makes the Surface Laptop visually unique, the aluminum Surface Laptop 3 looks a lot like most other Ultrabooks already in the market. This is especially true if comparing the system to the Huawei MateBook X Pro since both are ultra-thin 3:2 Windows Ultrabooks. Still, it's a small price to pay considering you get a physically stronger chassis that will almost indubitably outlive the classic Alcantara version.
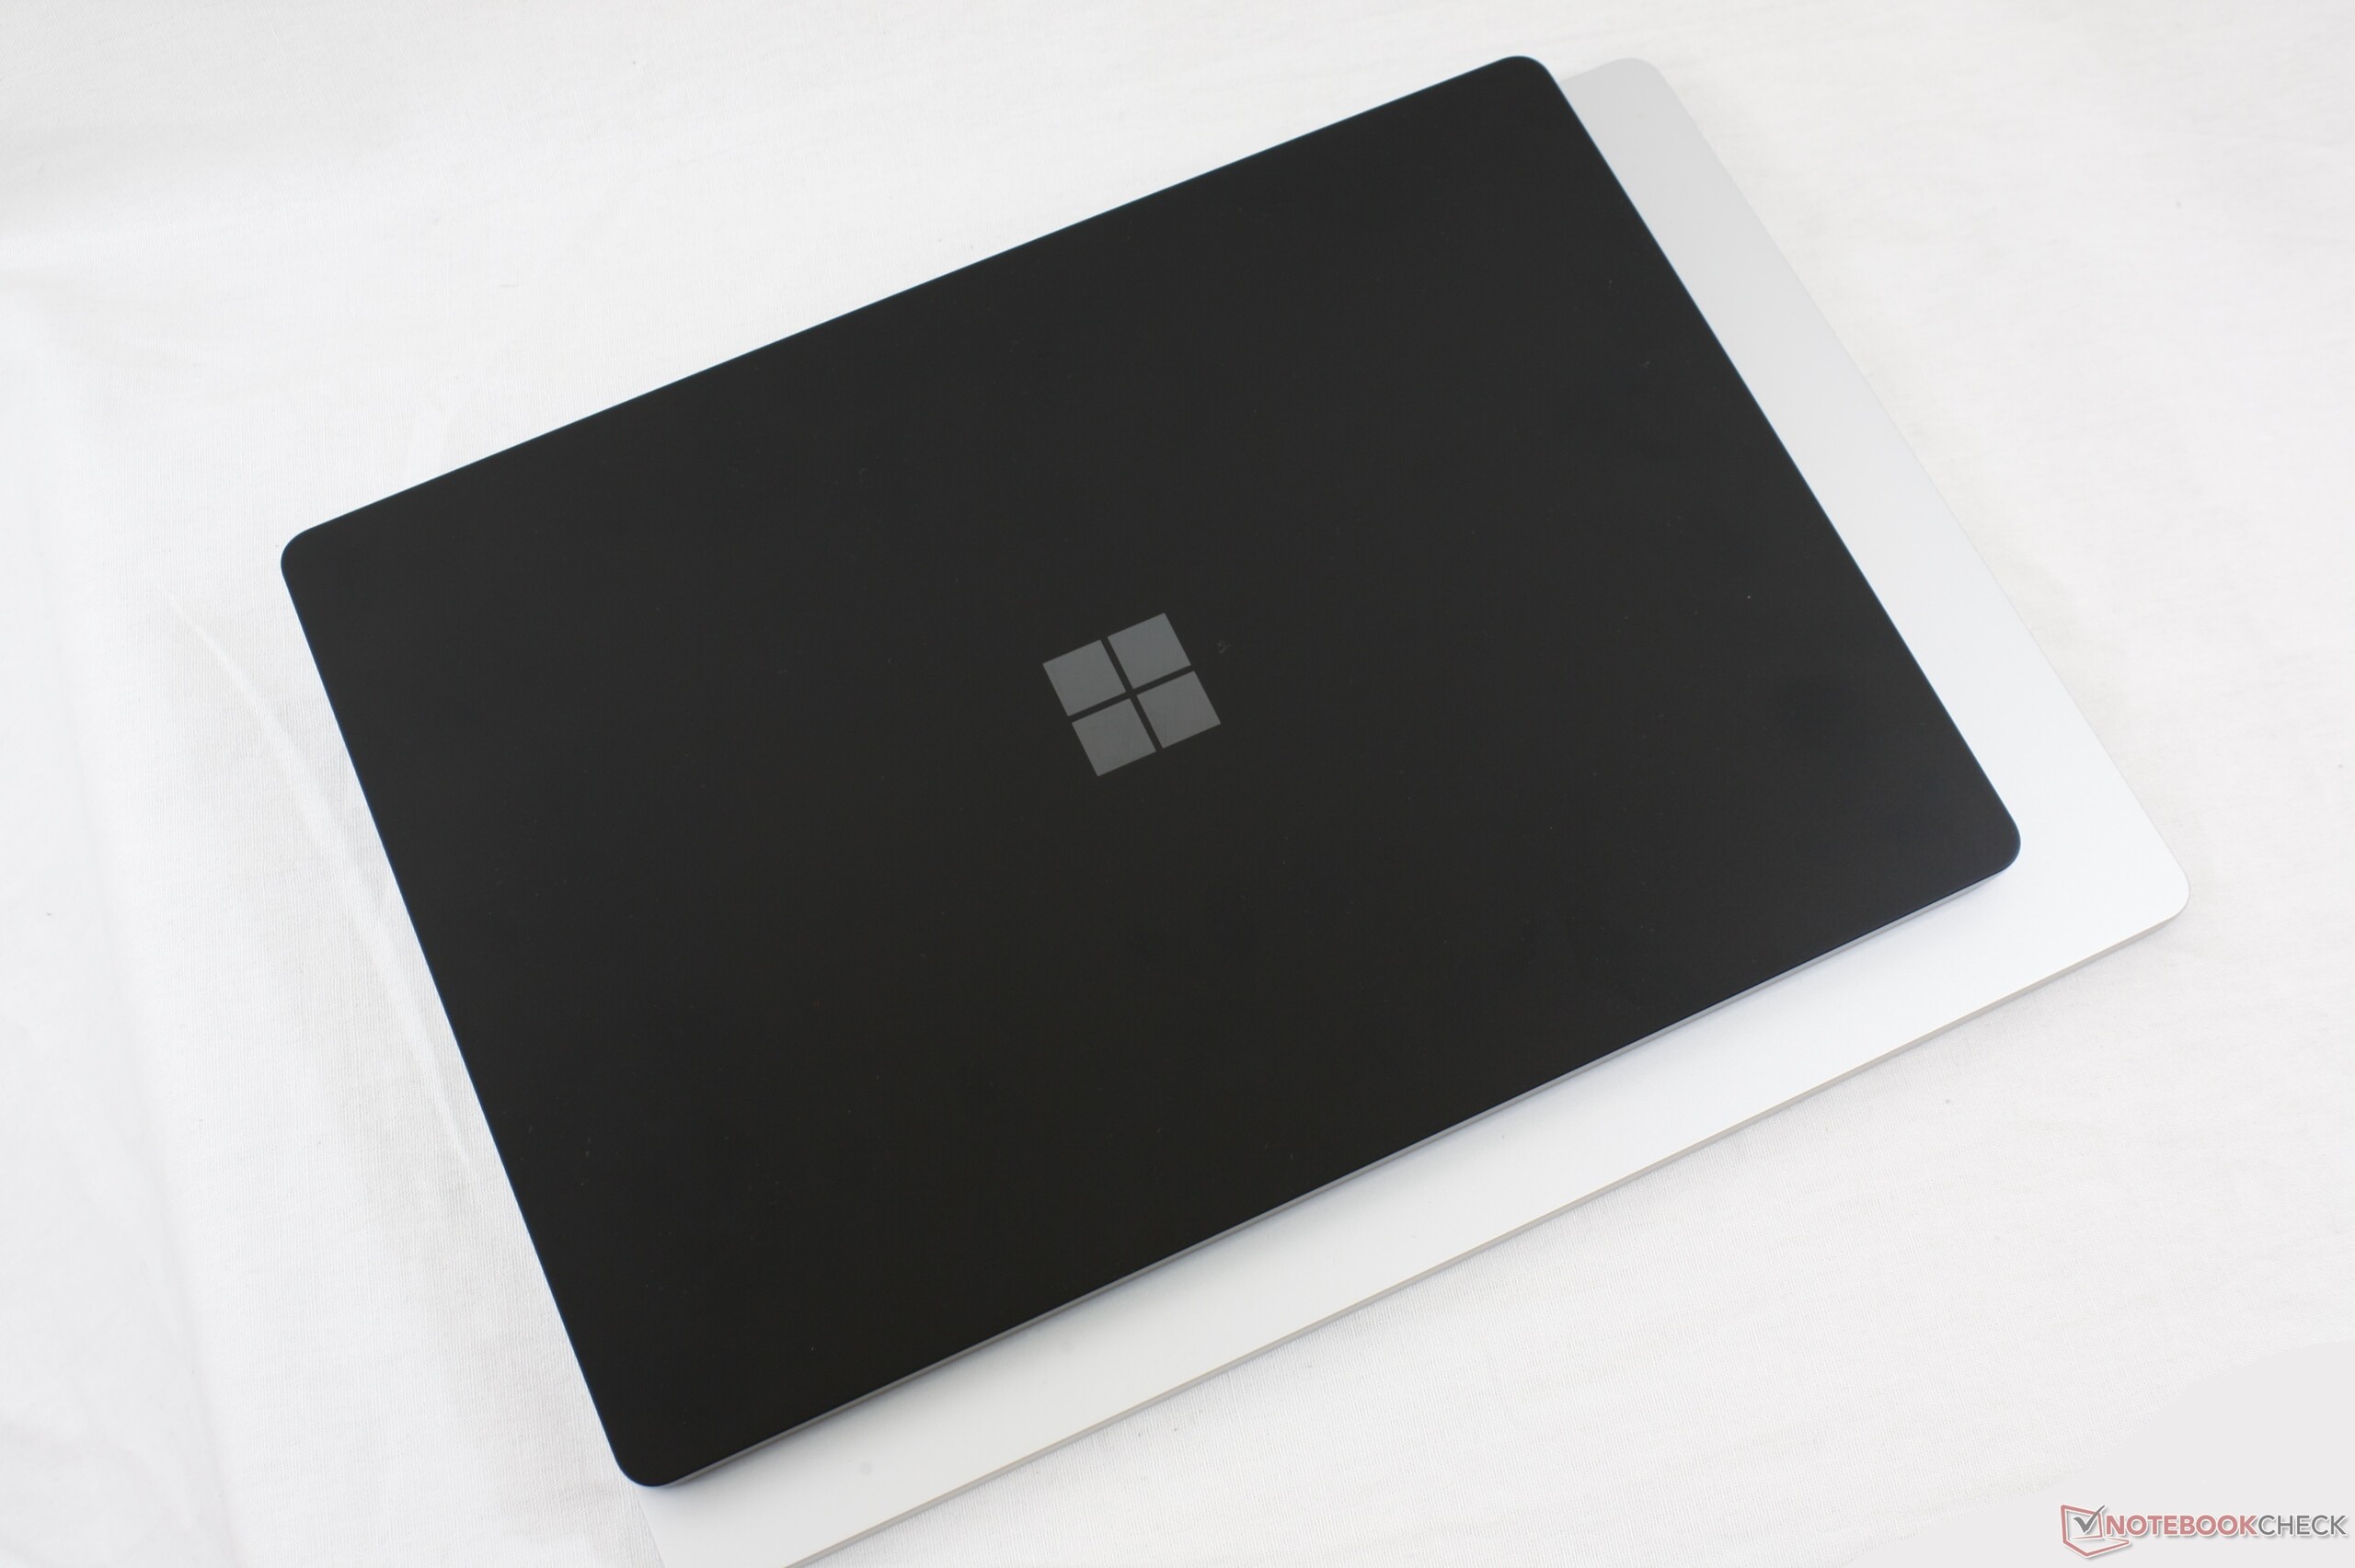
Chassis dimensions are identical between the Alcantara and metal options despite their dissimilar material makeup. Microsoft says the metal SKUs will be slightly heavier than the Alcantara SKUs (1.288 kg vs. 1.265 kg), but the difference is so small that it is essentially negligible during day-to-day use. The Microsoft laptop is still larger than both the 3:2 Huawei MateBook X Pro and Dell XPS 13 2-in-1 due in part to the thicker bezels of the Surface Laptop 3.
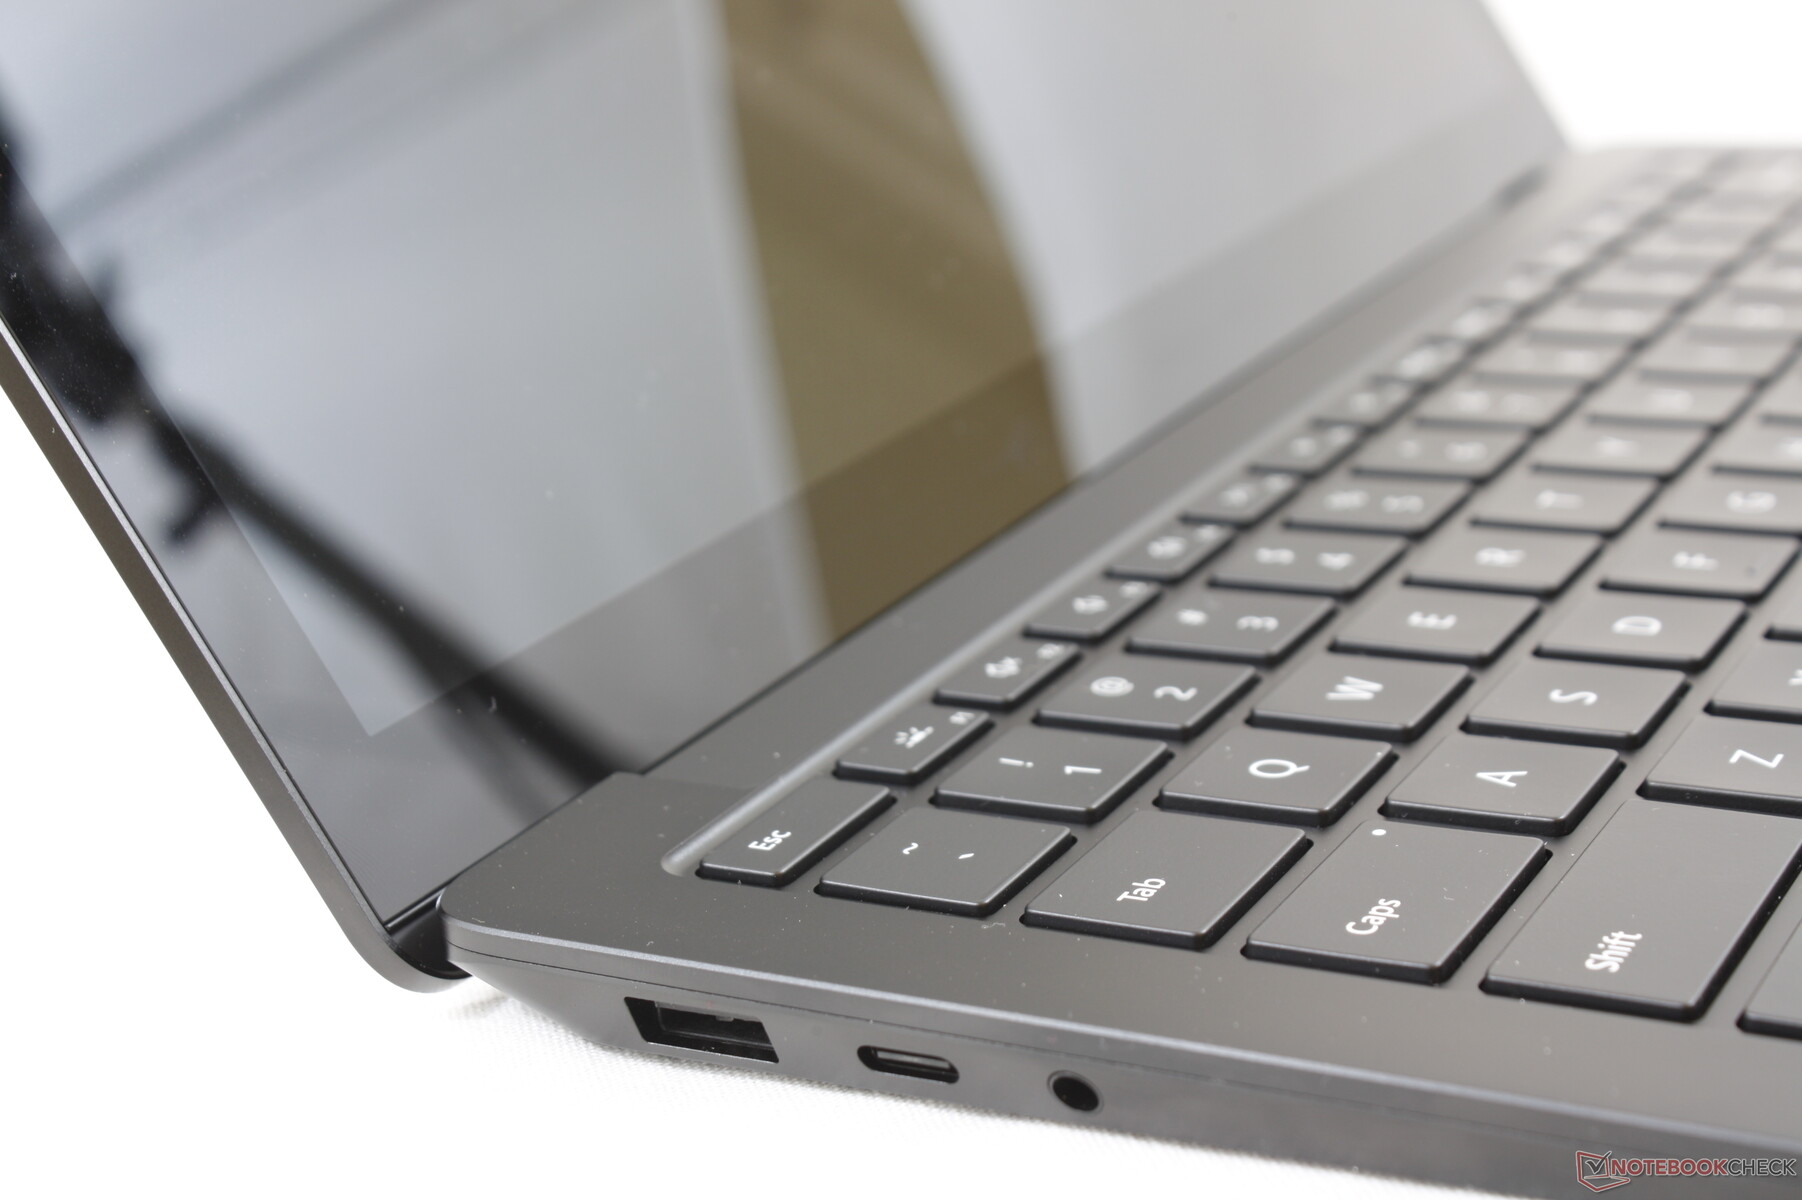
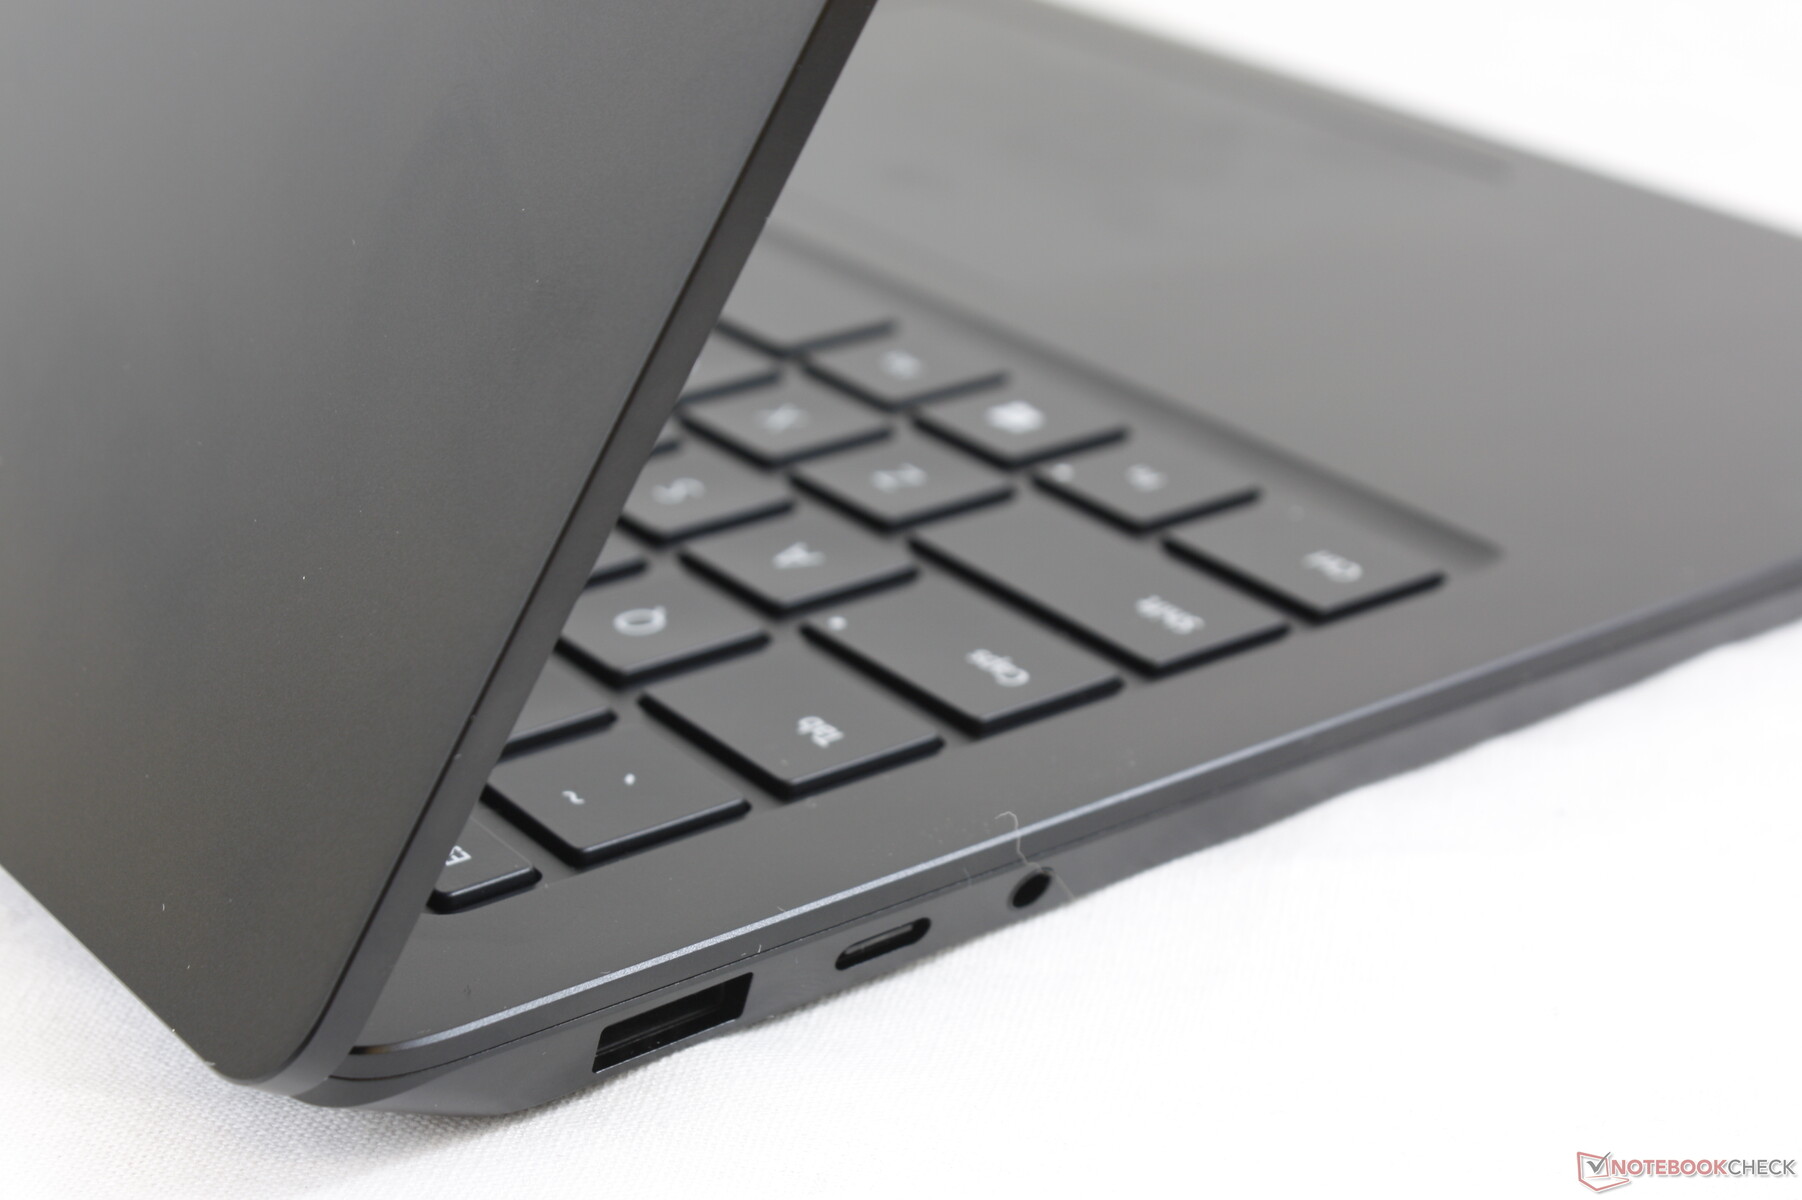
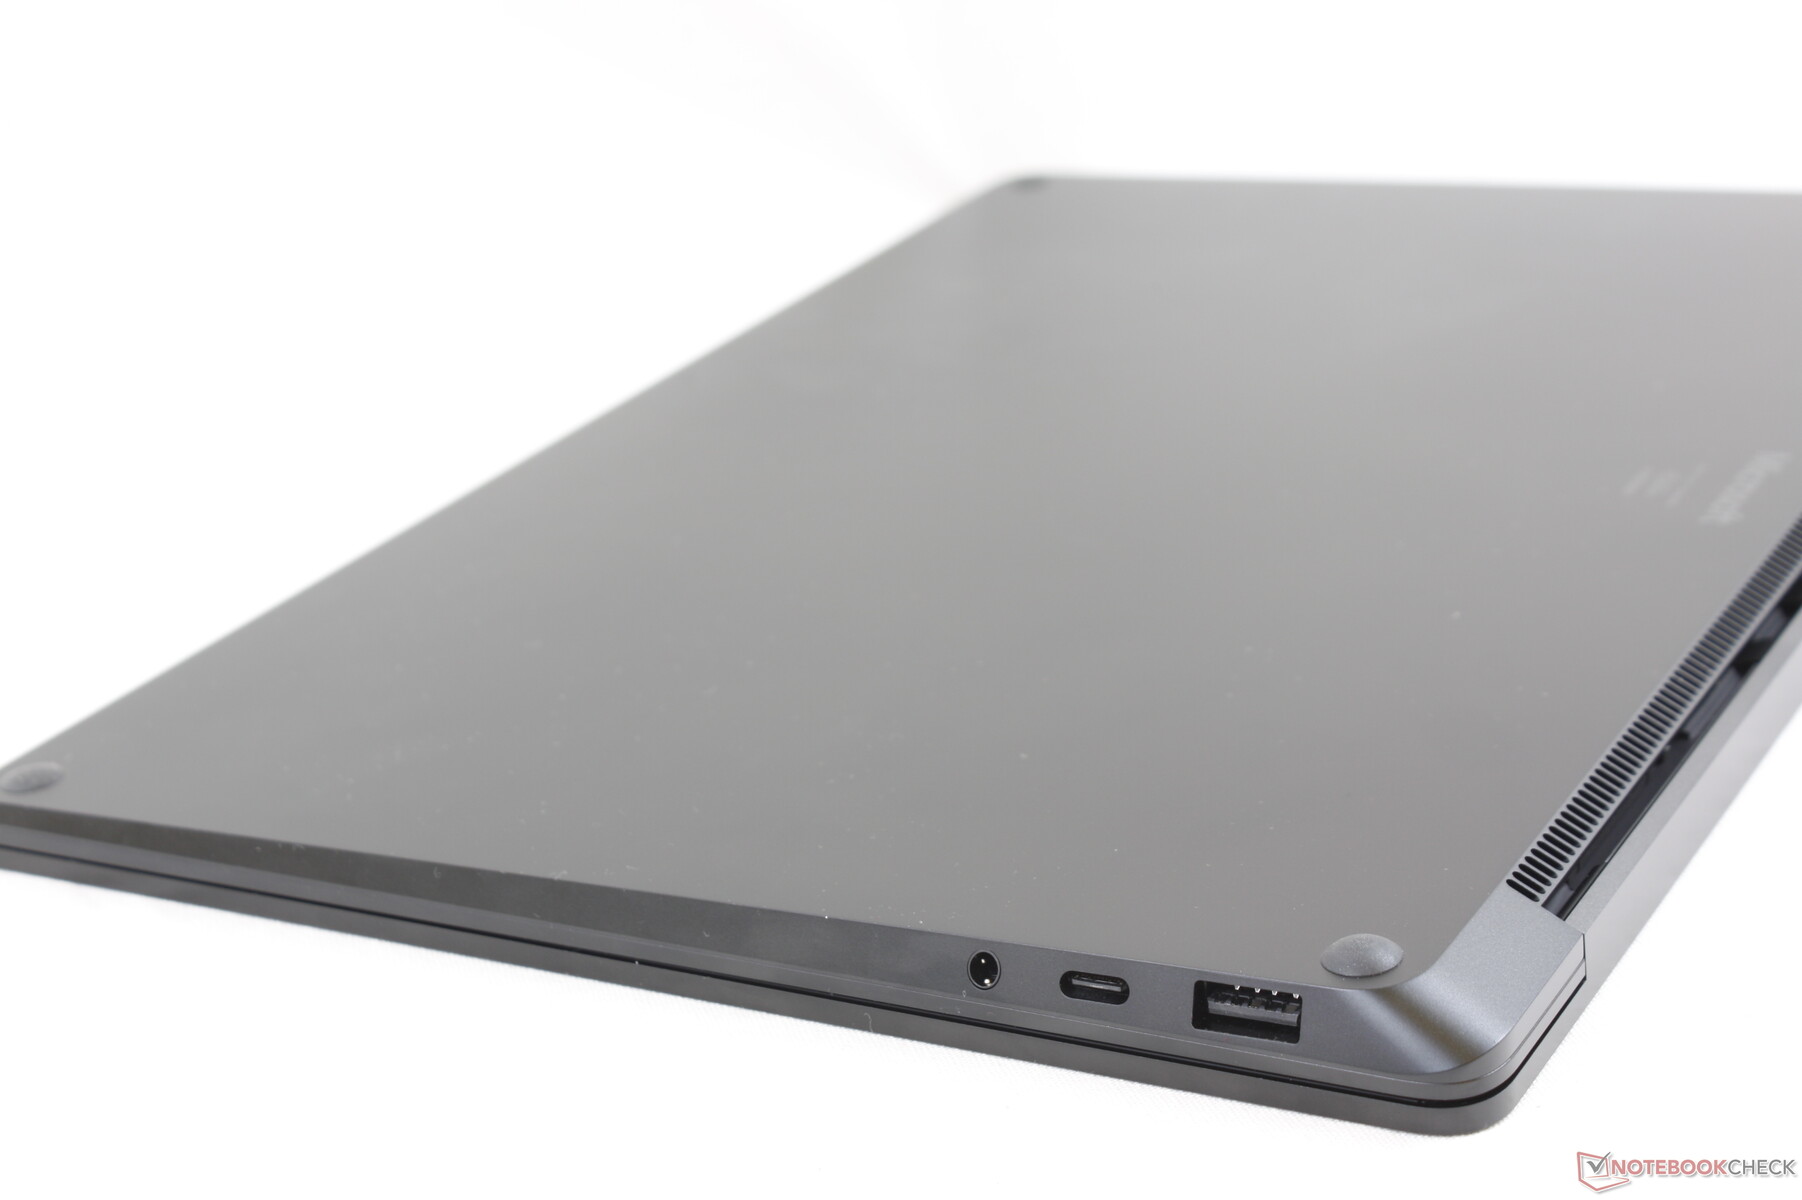
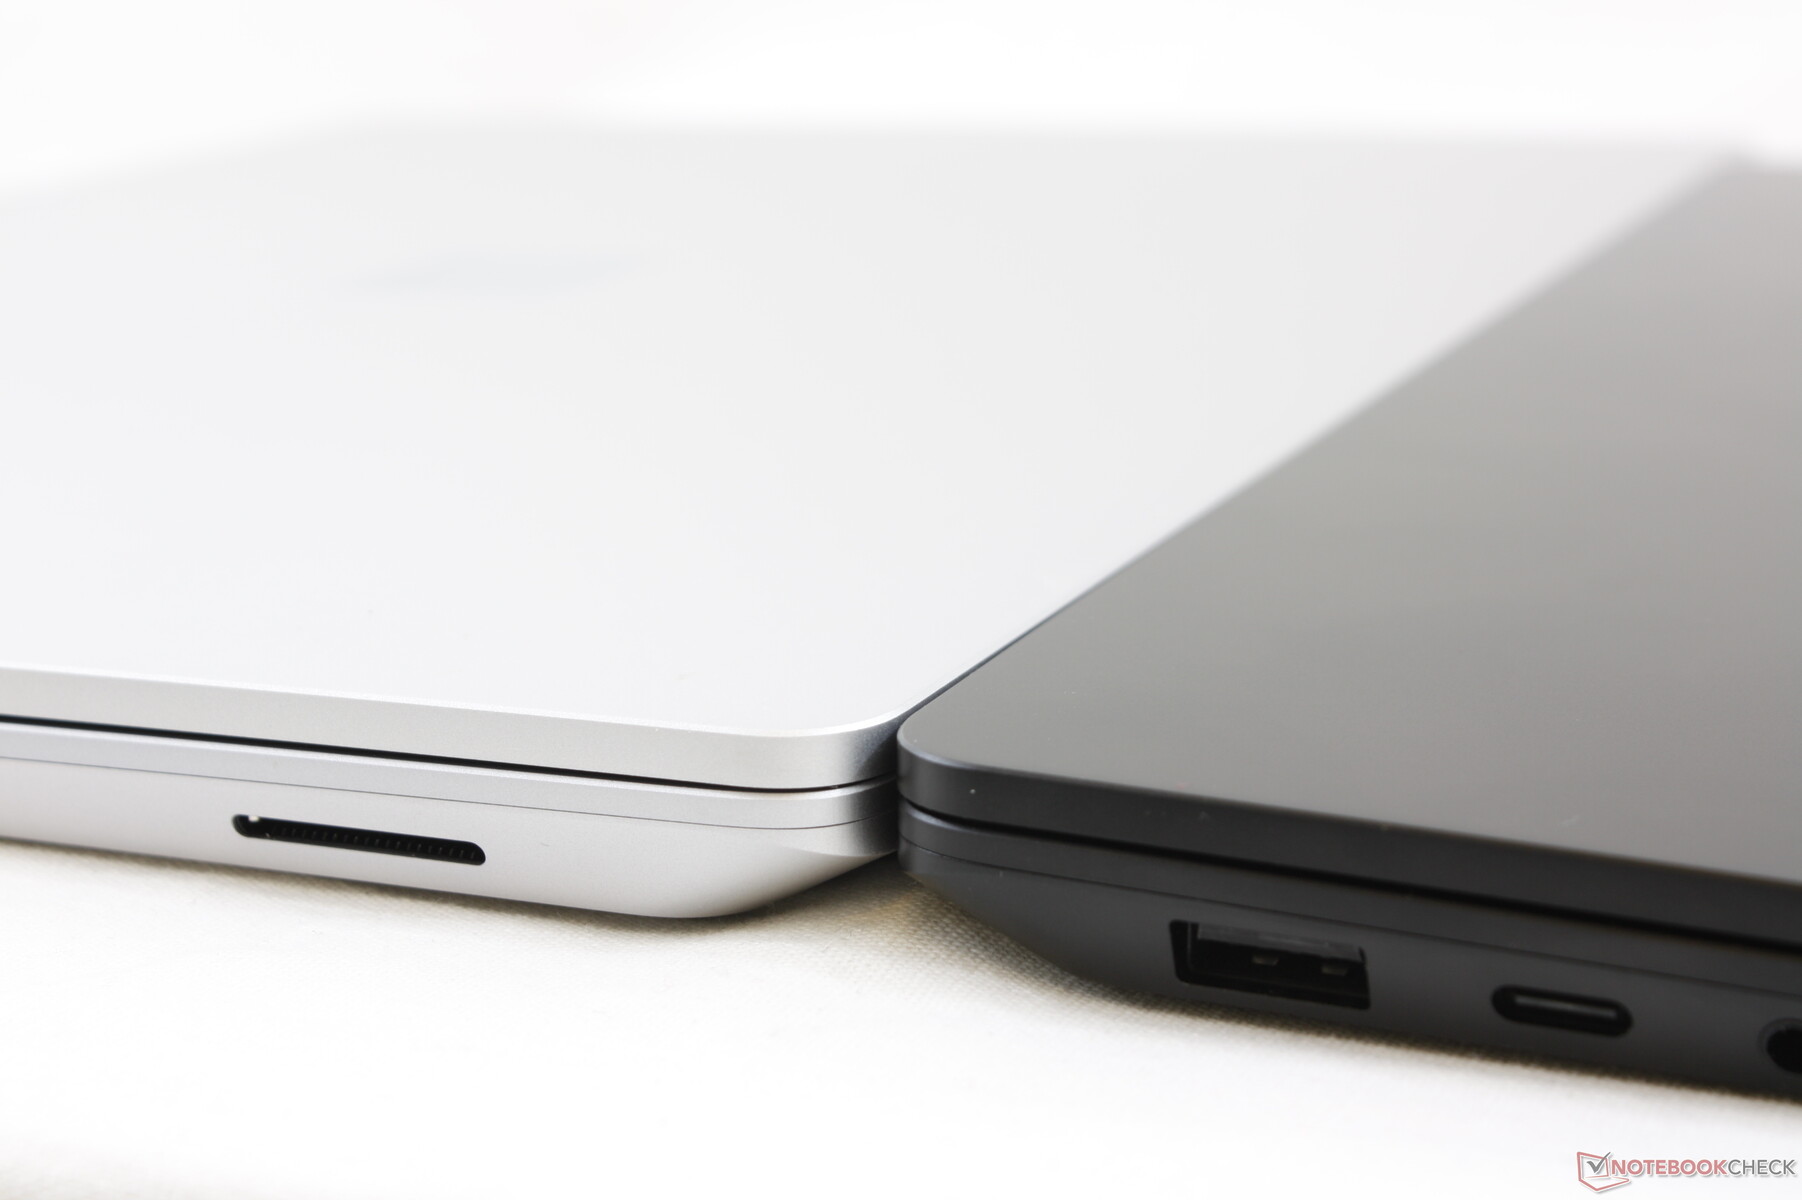
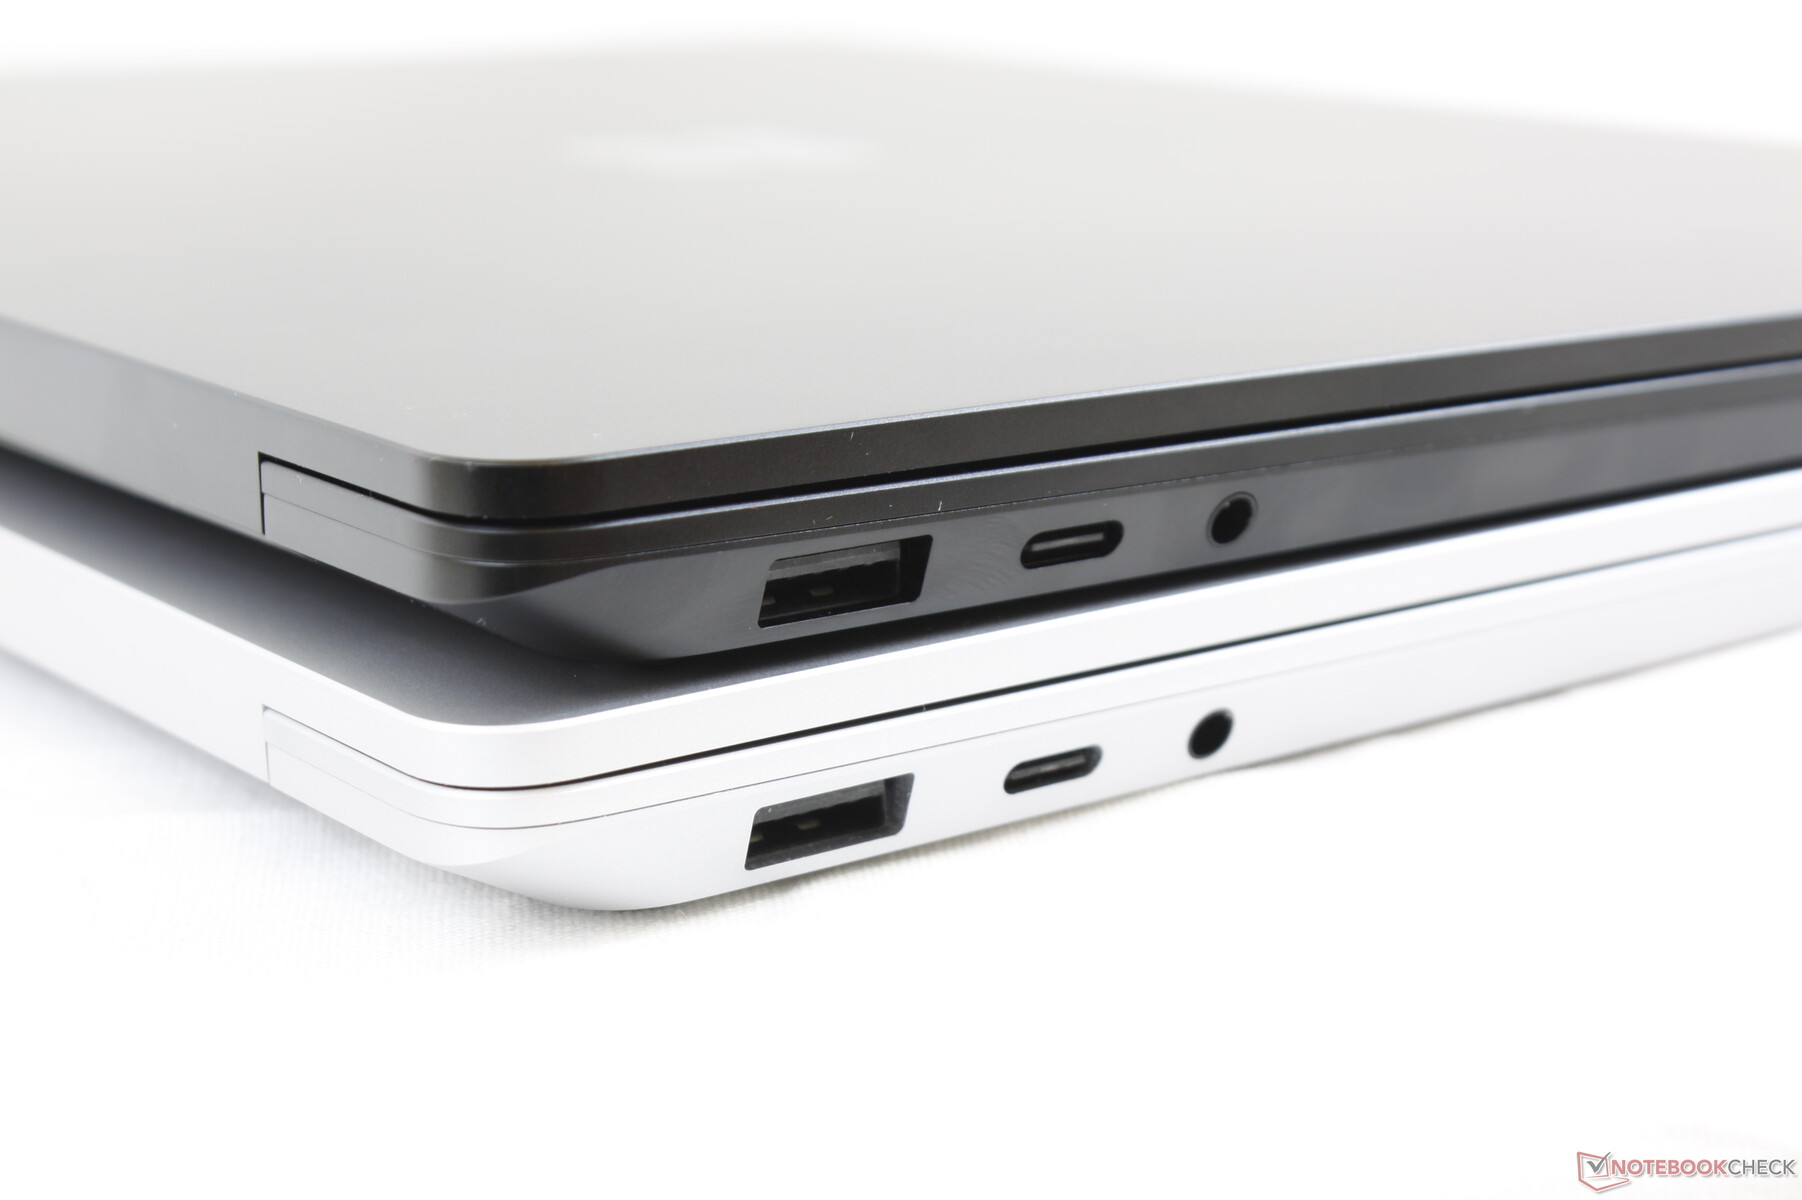
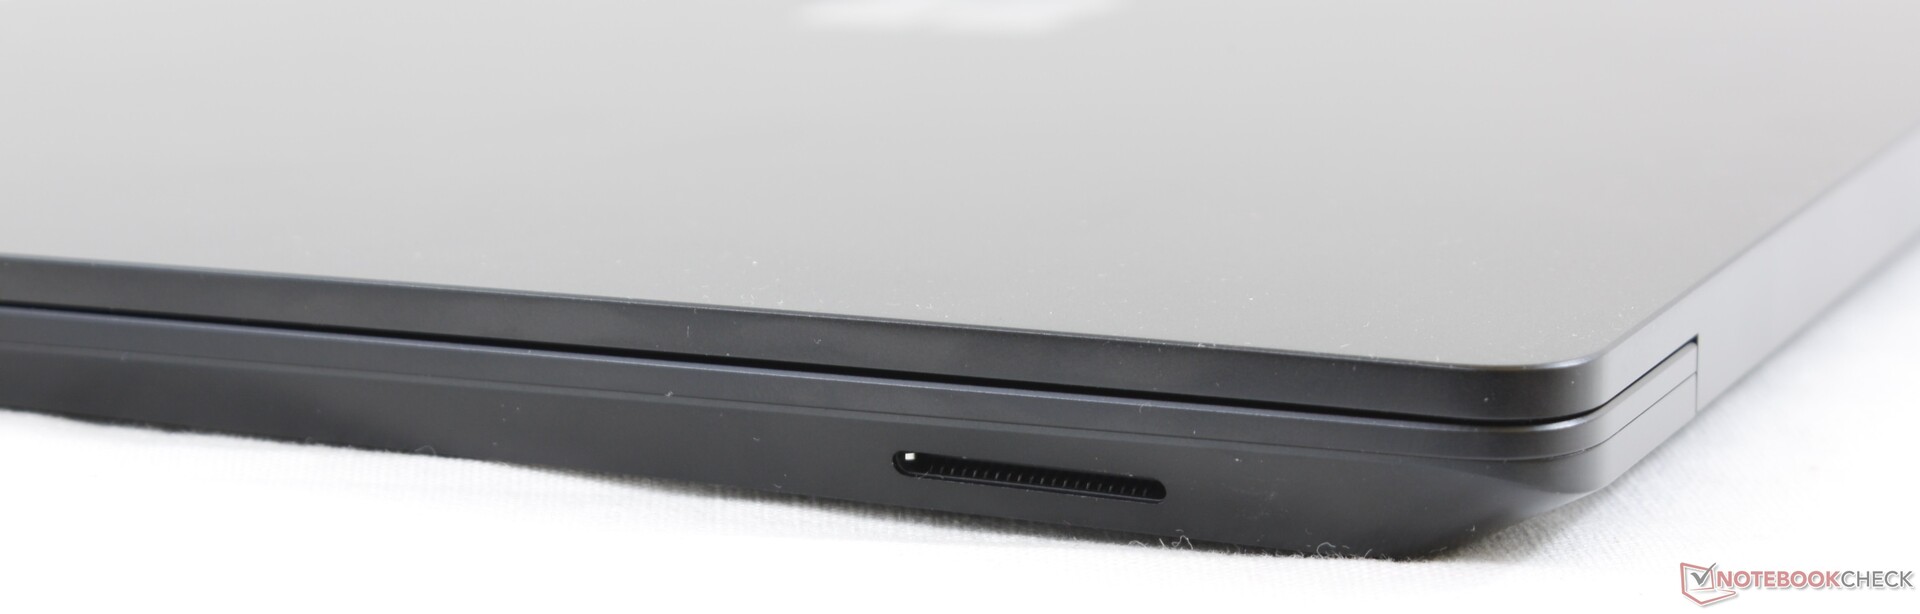
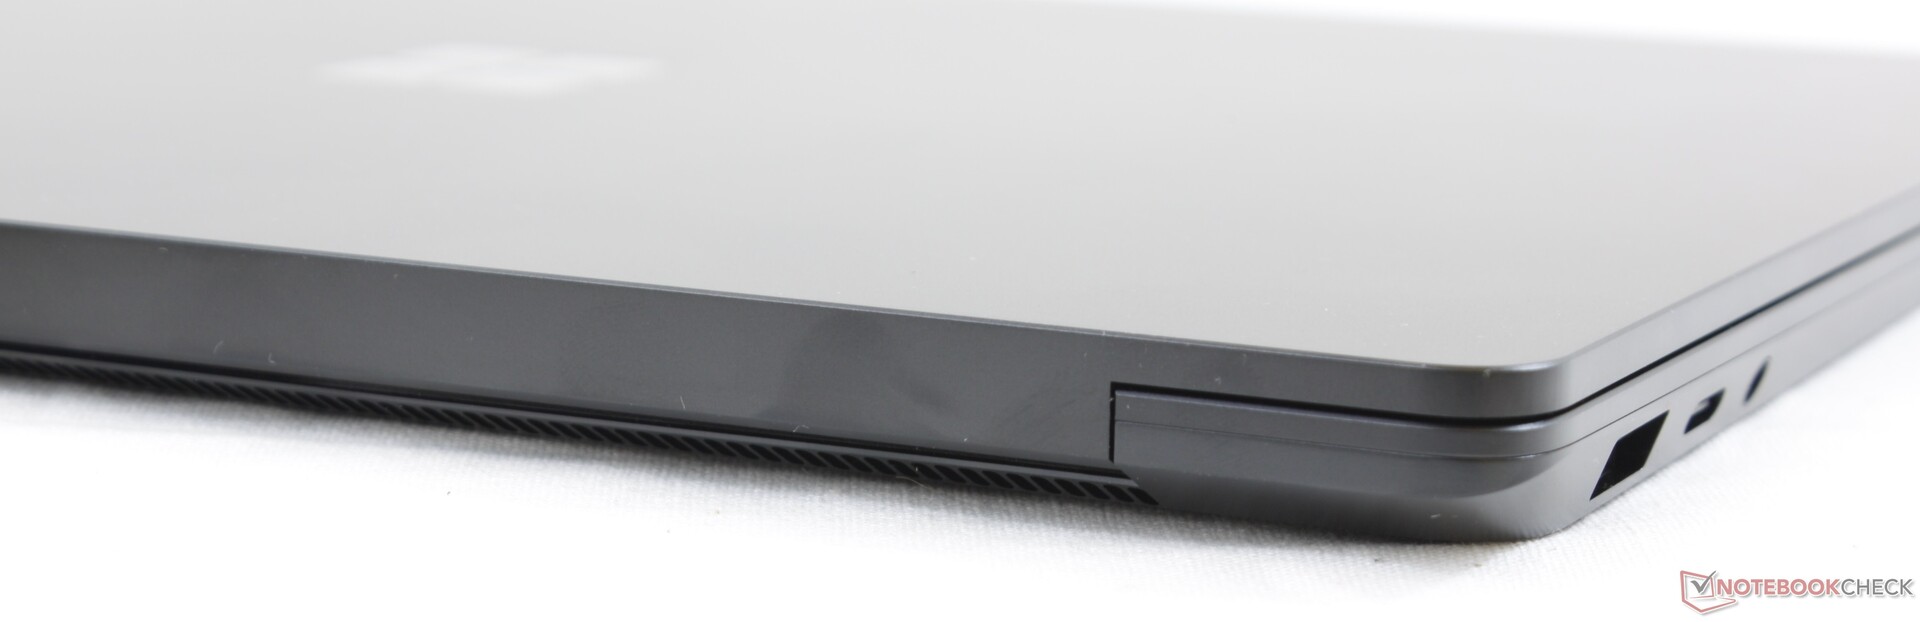
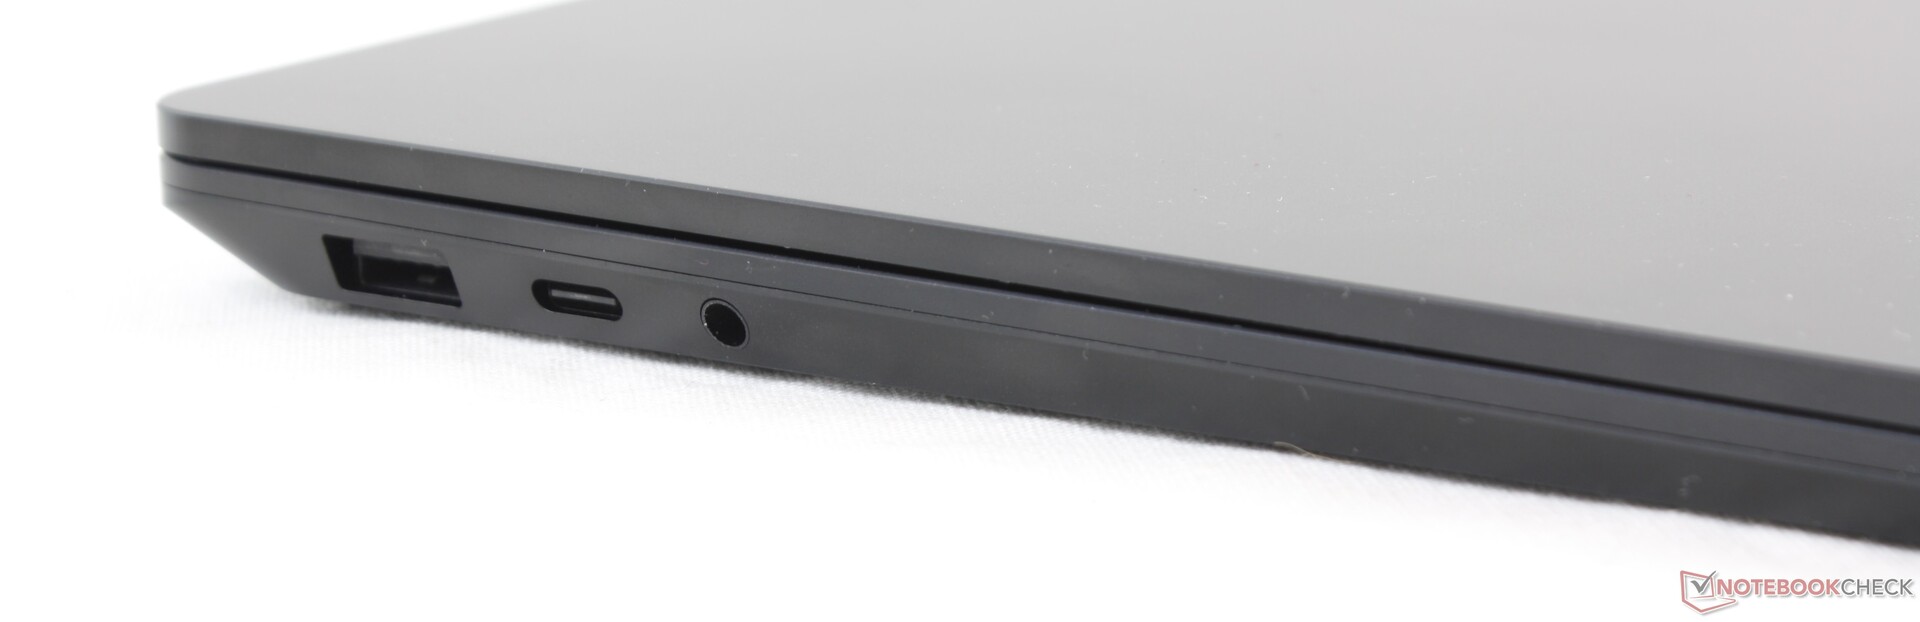
Connectivity
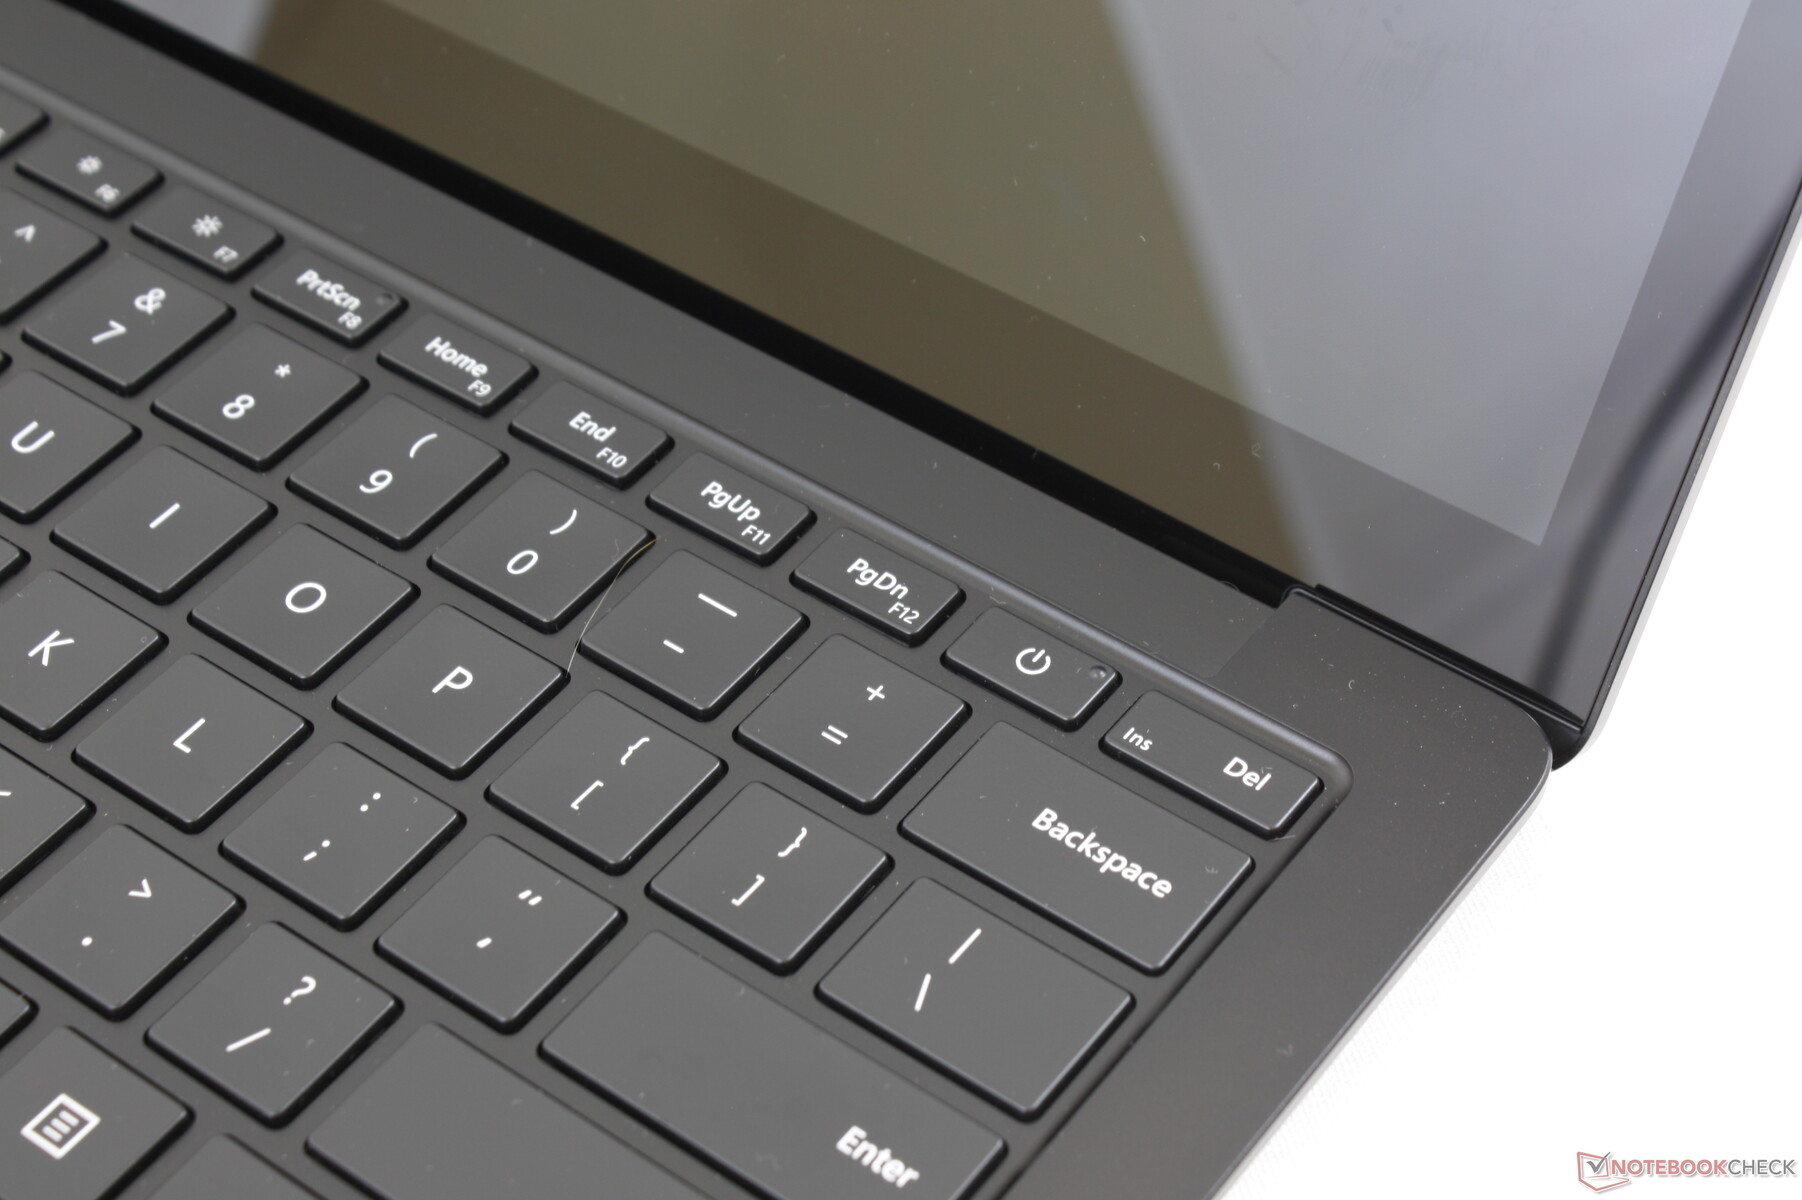
Port options are the same as the 15-inch Surface Laptop 3. We've already ranted about the uselessness of Surface Connect as we'd much rather see Thunderbolt 3, HDMI, or even an SD card reader instead. Other subnotebooks like the Huawei MateBook X Pro or Razer Blade Stealth have an advantage over the Surface Laptop 3 in this regard.
Communication
All Surface Laptop Intel SKUs come with 802.11ax or Wi-Fi 6 Intel AX201 cards including on the larger 15-inch Surface Laptop 3. Meanwhile, the AMD SKUs are stuck with "only" 802.11ac or Wi-Fi 5 modules. Either option will be more than sufficient for the everyday home or office worker. We're able to record average transfer rates of about 1.4 Gbps when standing one meter away from our Netgear RAX200 router connected to a 2.5 Gbps server line.
Webcam

Maintenance
The bottom panel is secured by four screws hidden underneath the tightly glued rubber pads. RAM is soldered while storage is upgradeable albeit only in the uncommon M.2 2230 form factor. iFixit has a handy disassembly video on the model, but overall serviceability is still more difficult than it needs to be especially for a professional laptop.
Accessories and Warranty
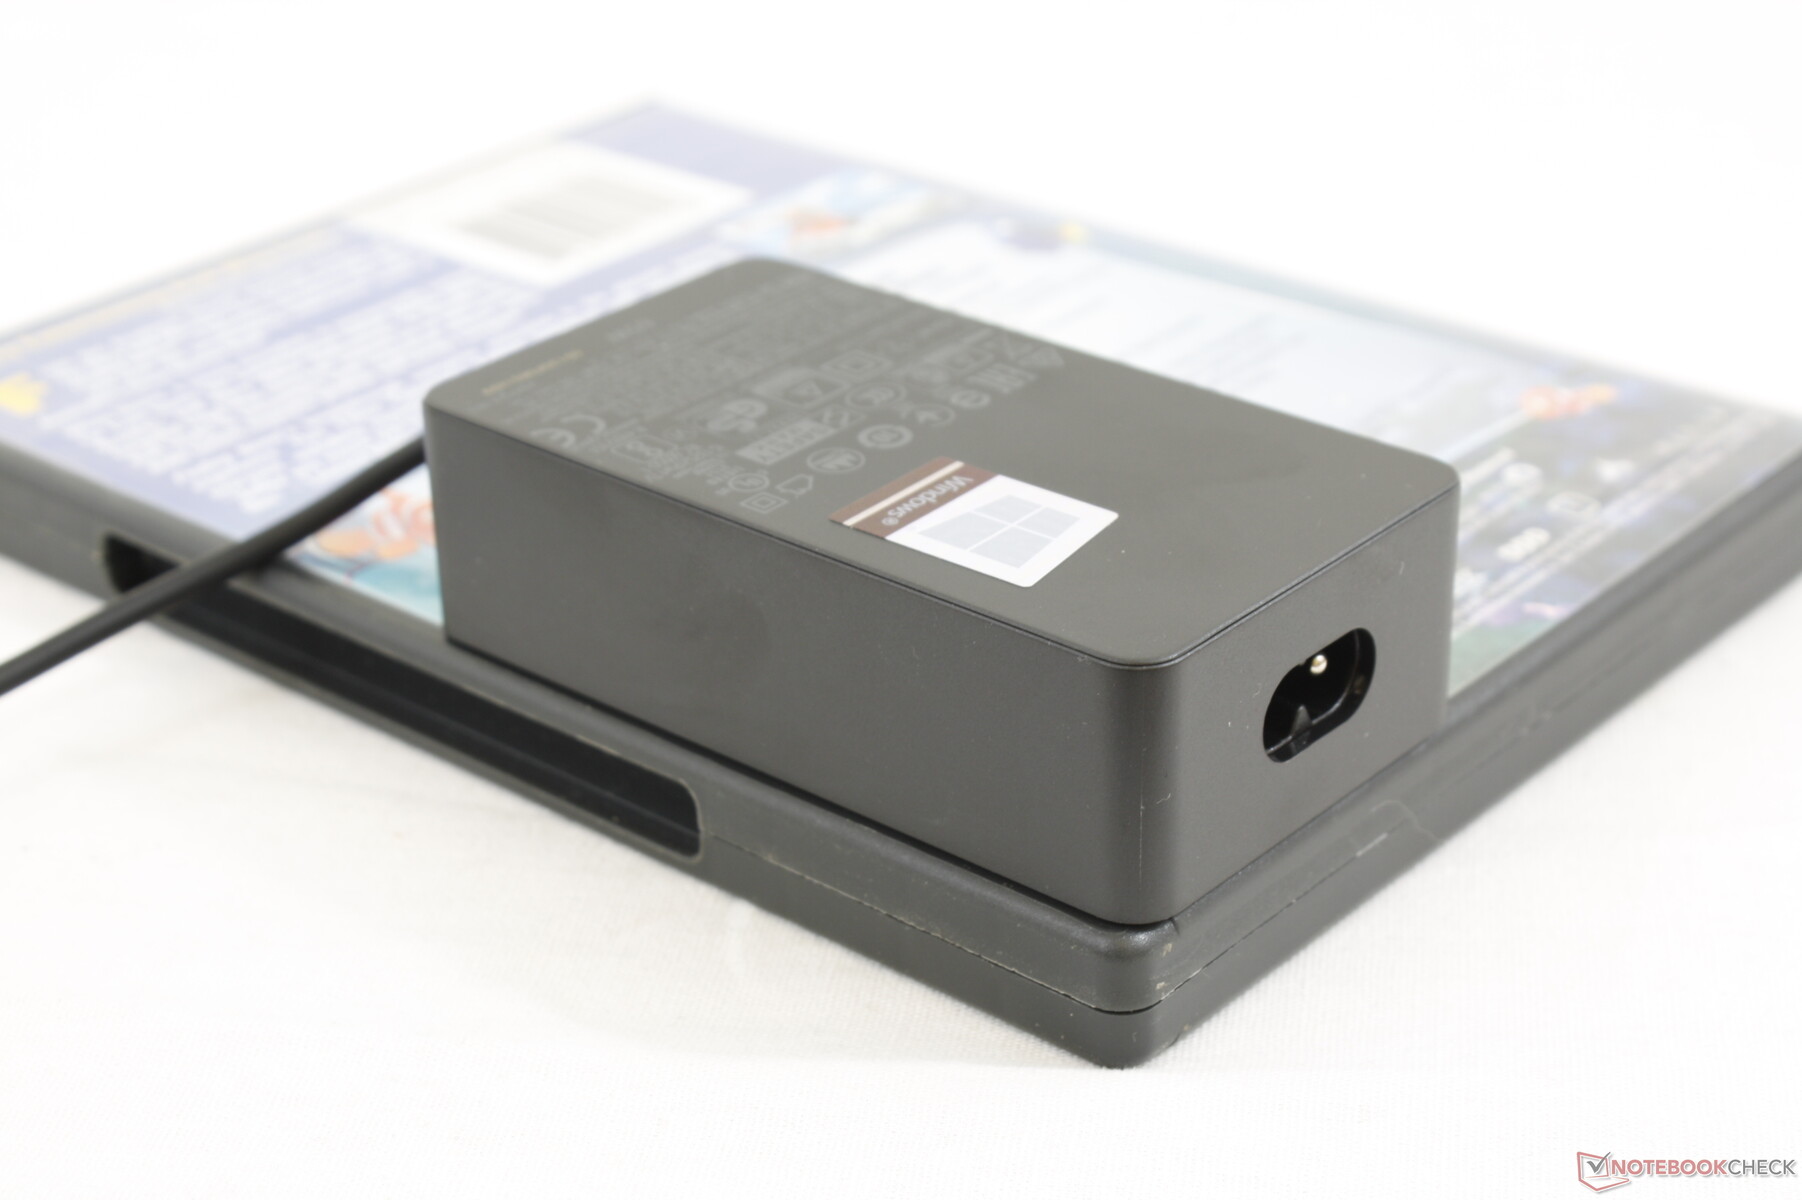
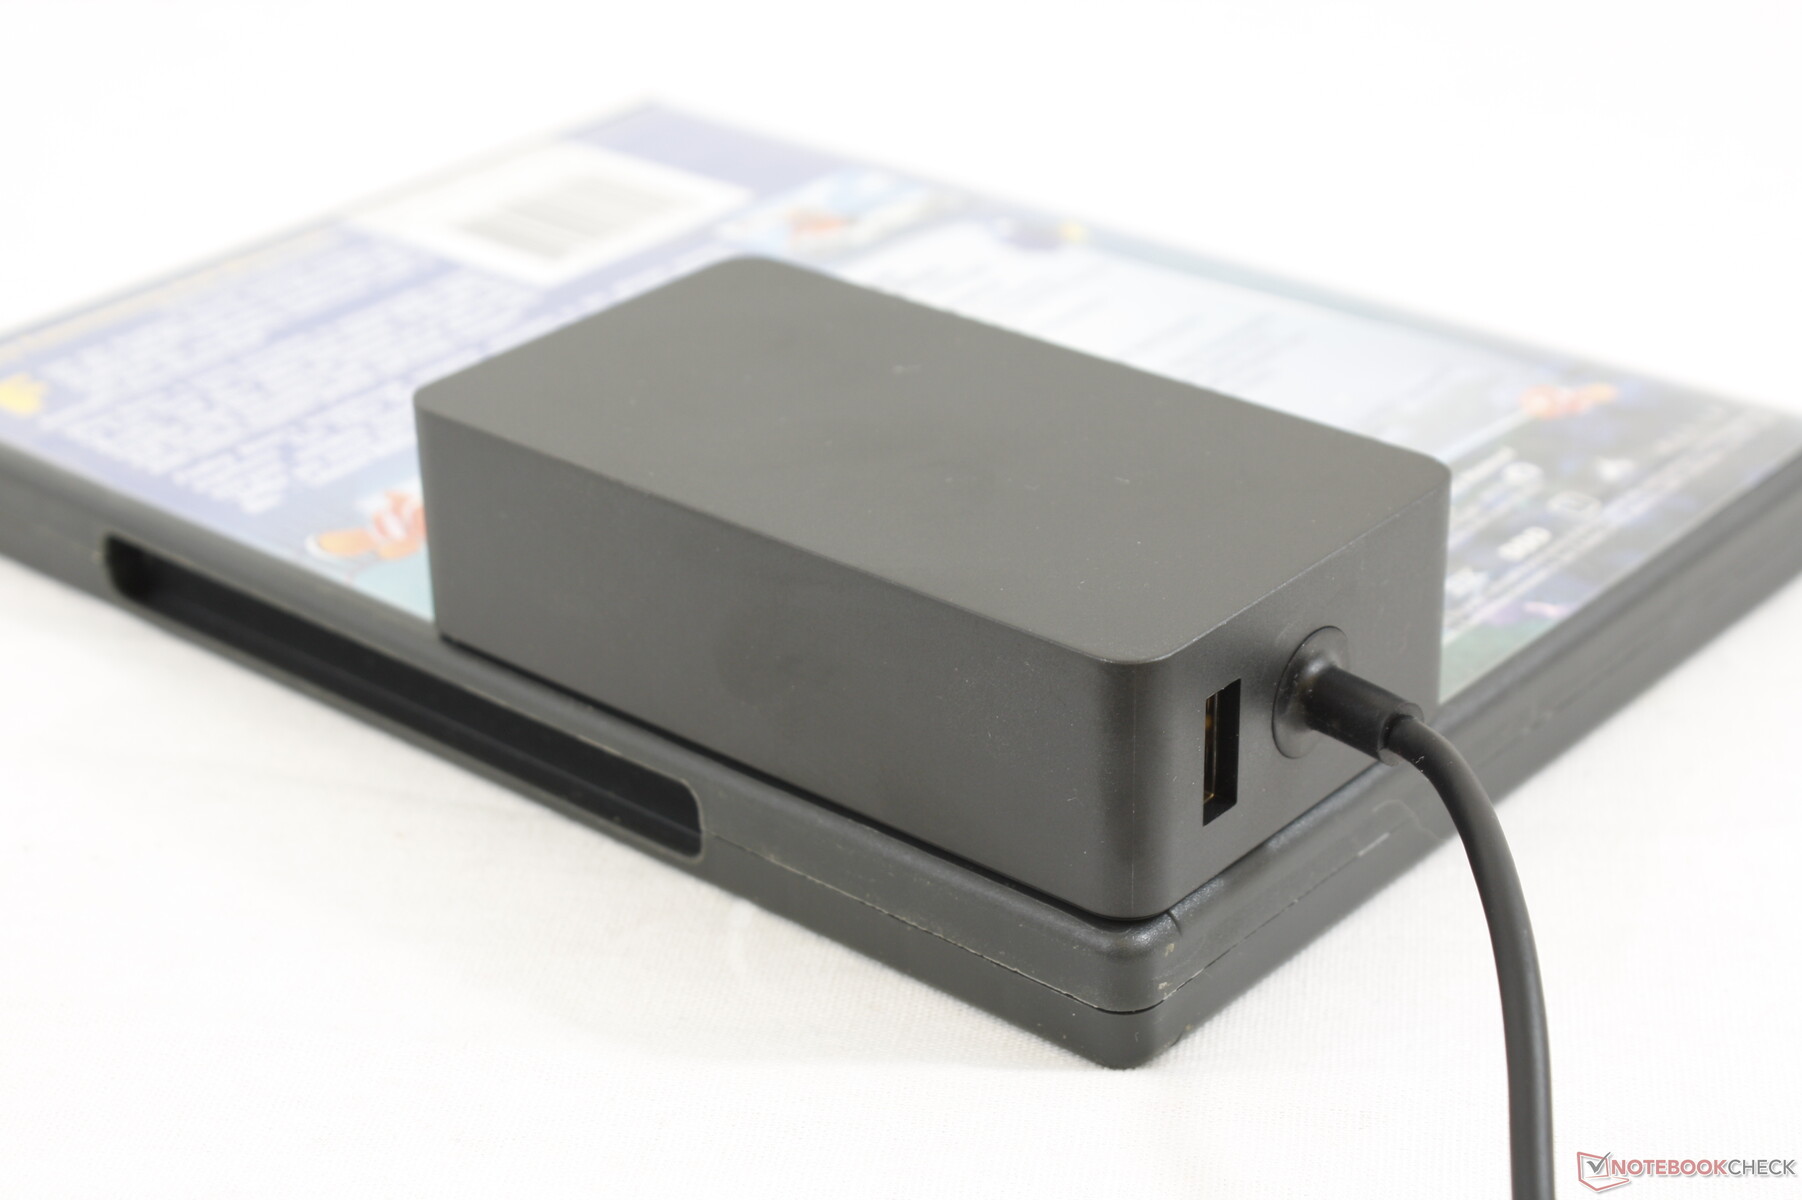
There are no extras included in the box other than some paperwork and the AC adapter. In comparison, the Asus ZenBook S13 and HP Spectre 13 each come with faux leather carrying sleeves. Additional ports can be expanded via USB Type-C docks or Microsoft's proprietary Surface Dock.
The standard one-year limited warranty applies.
Input Devices
Keyboard and Touchpad
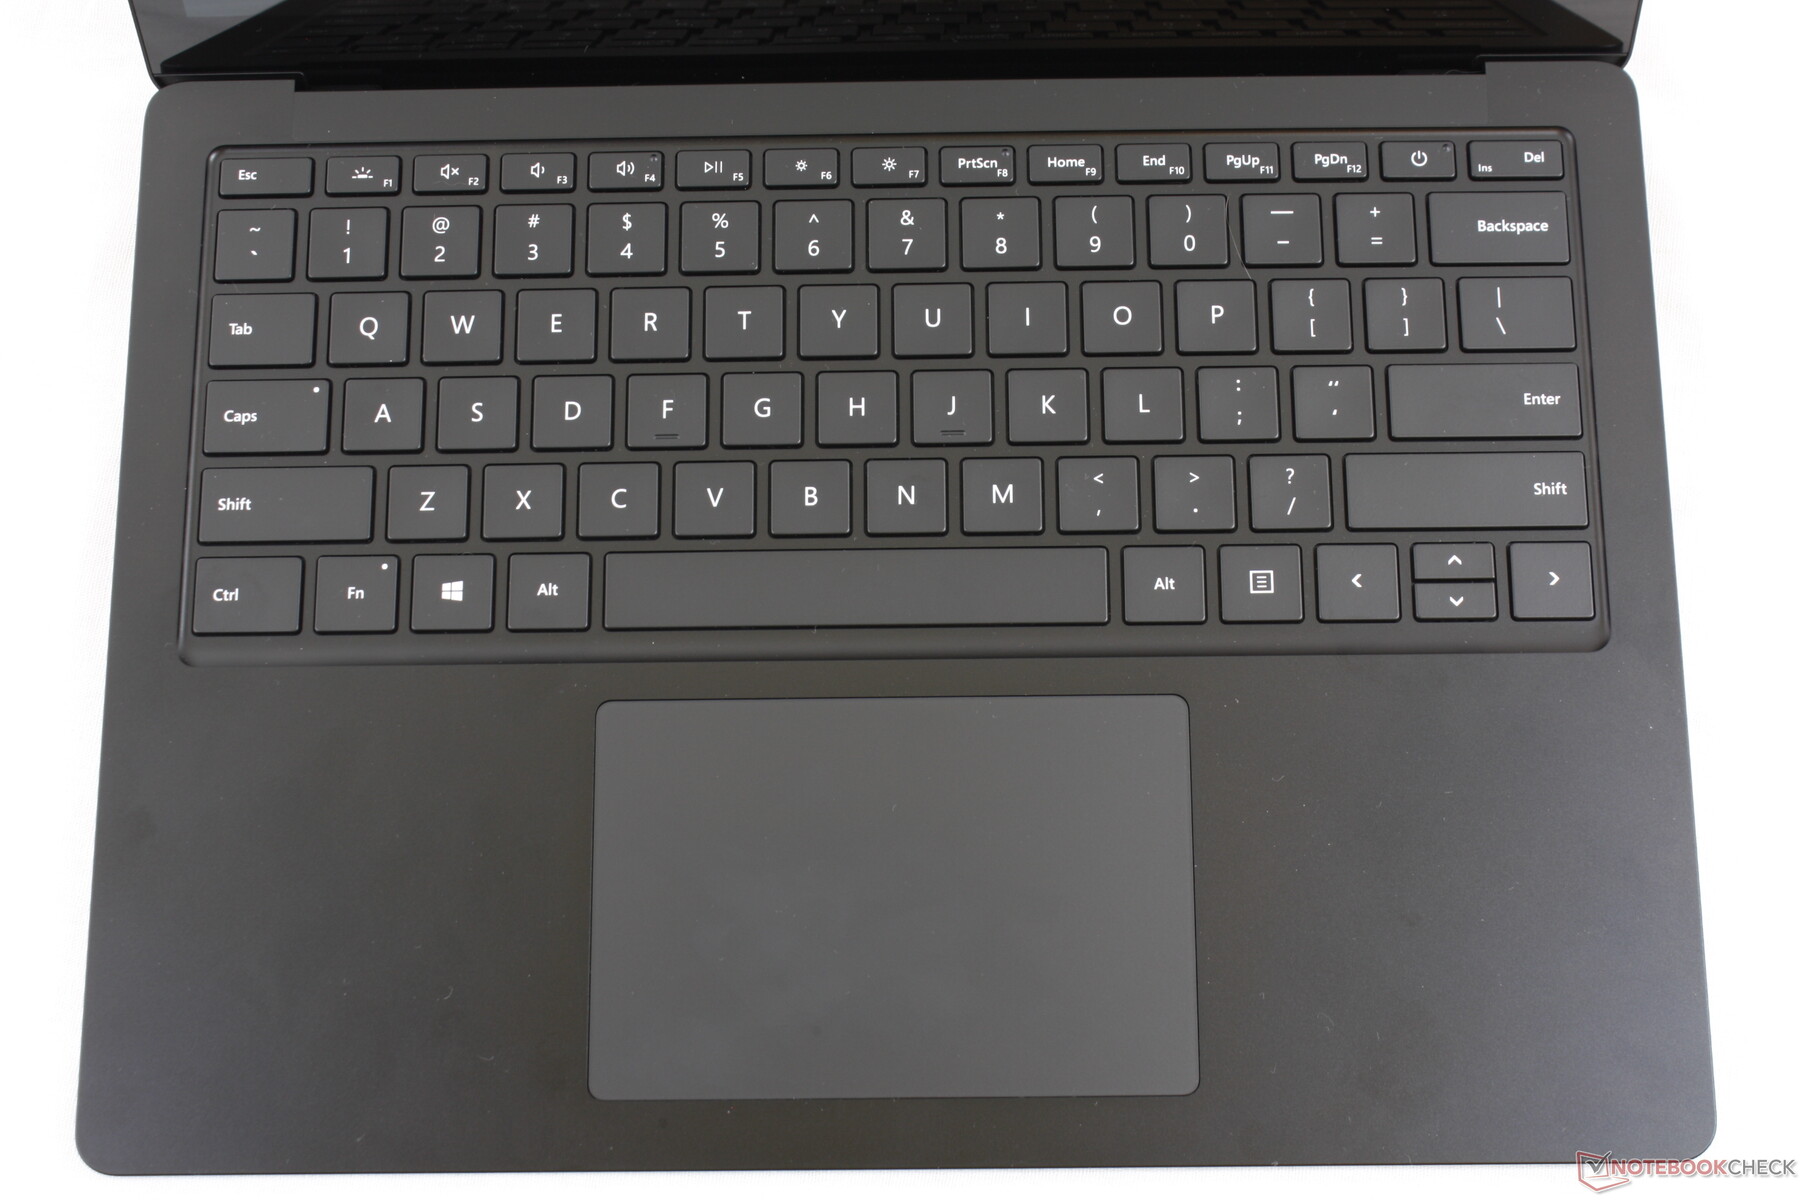
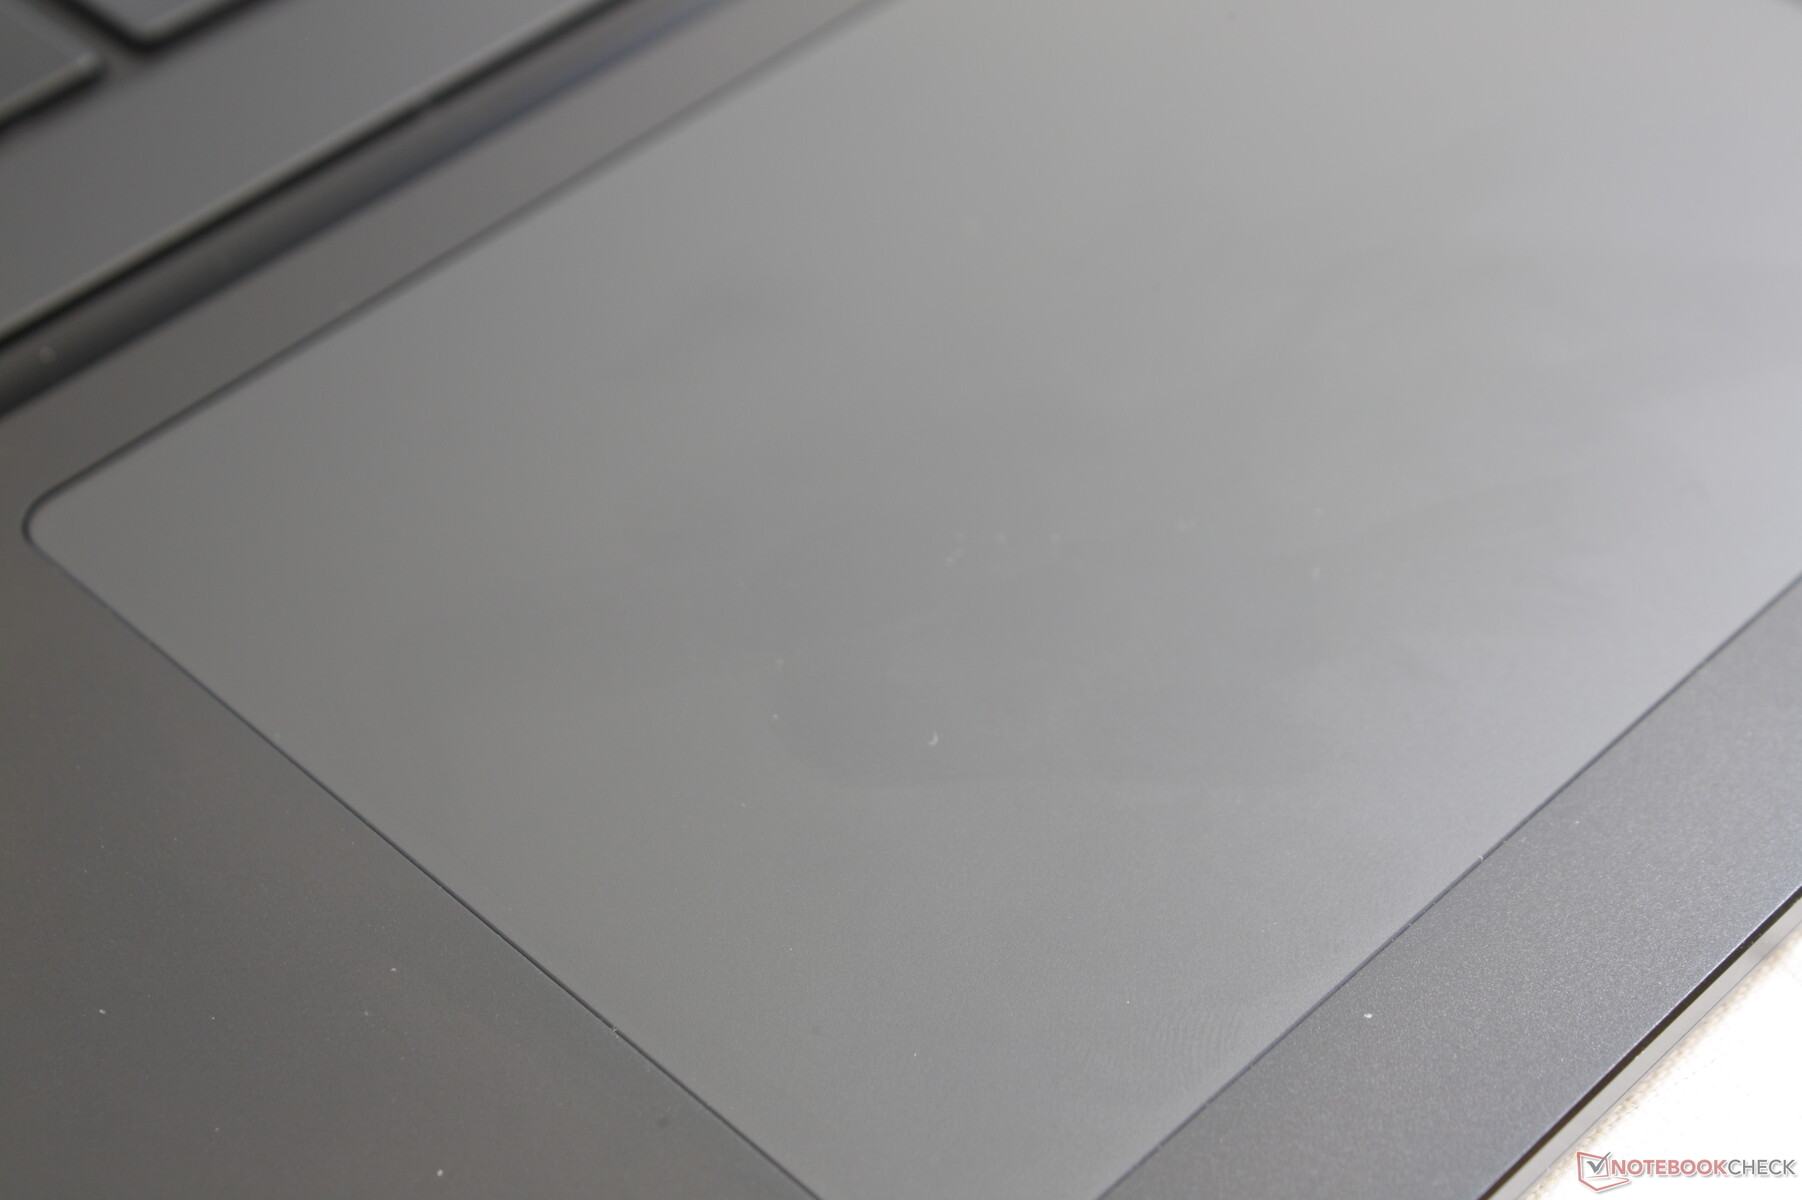
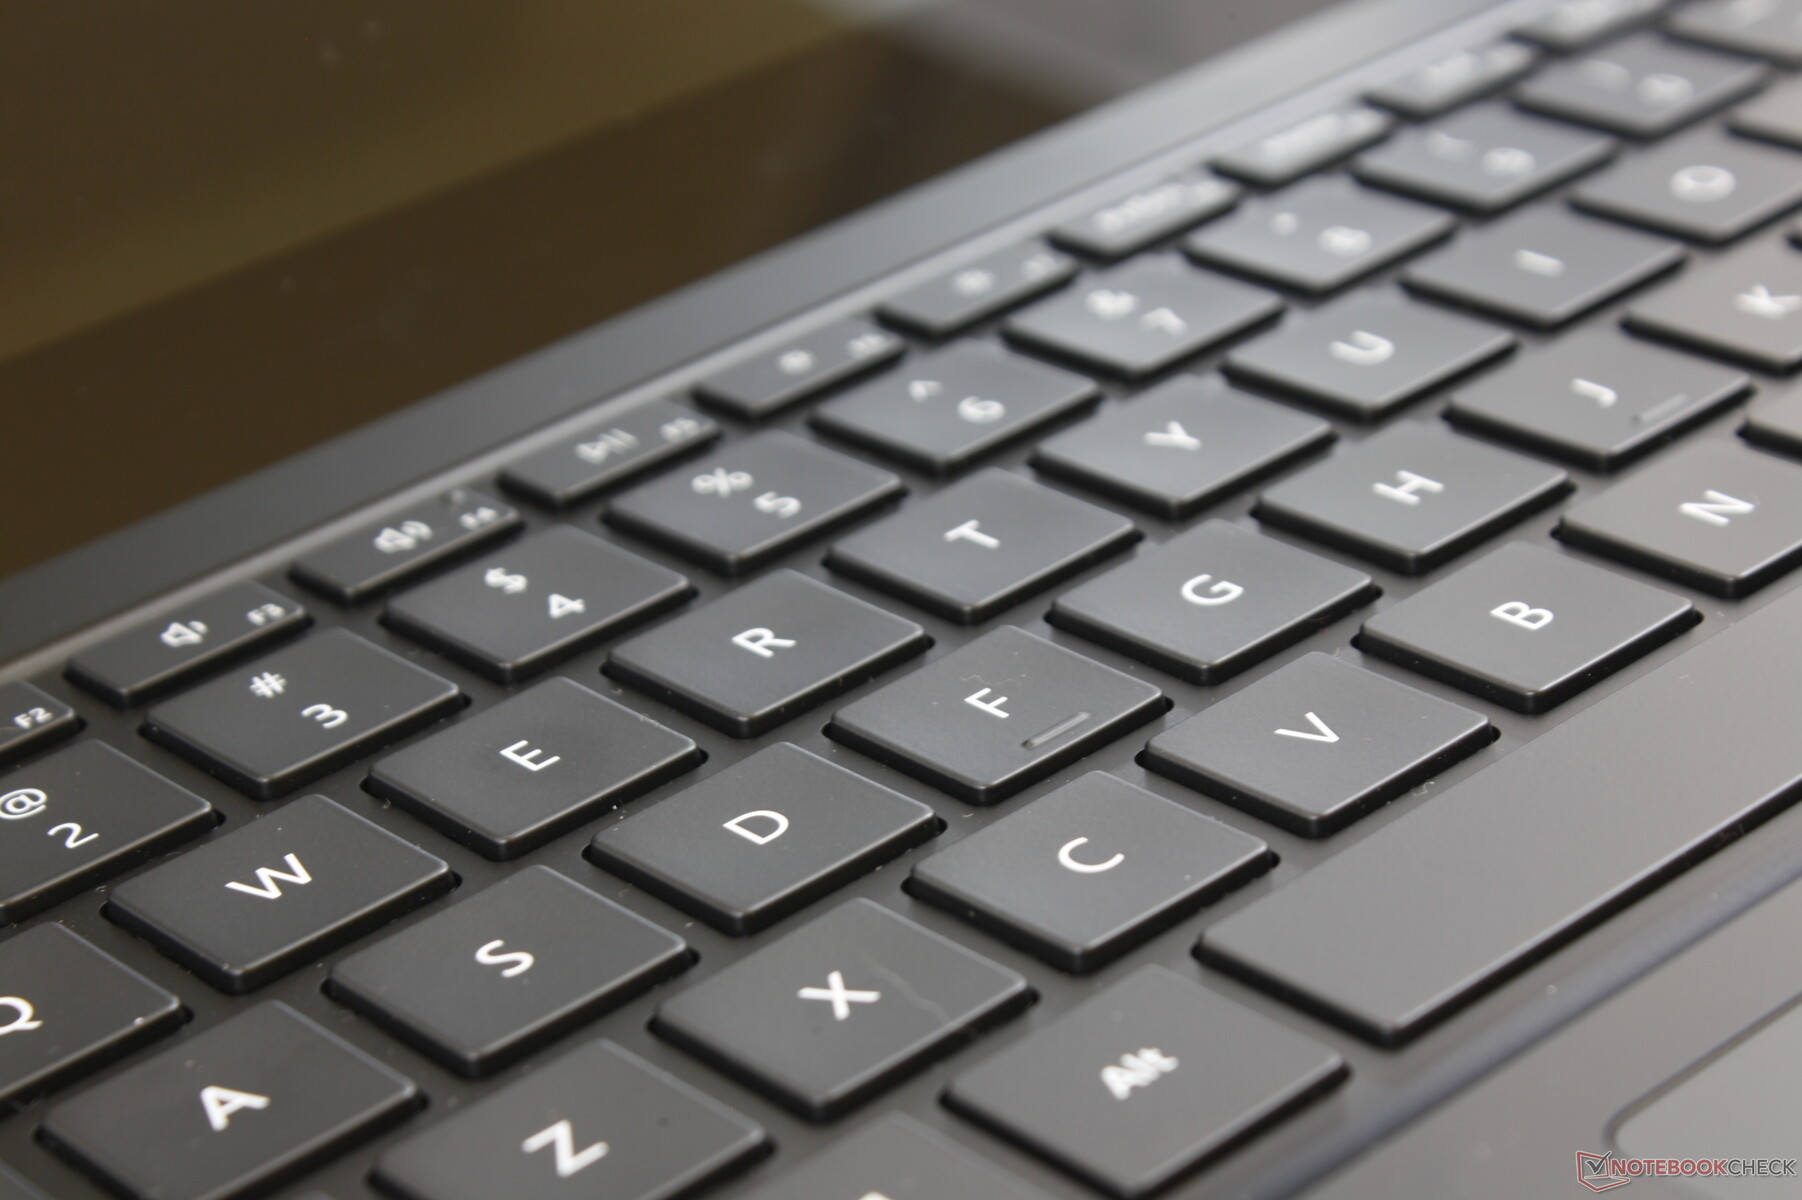
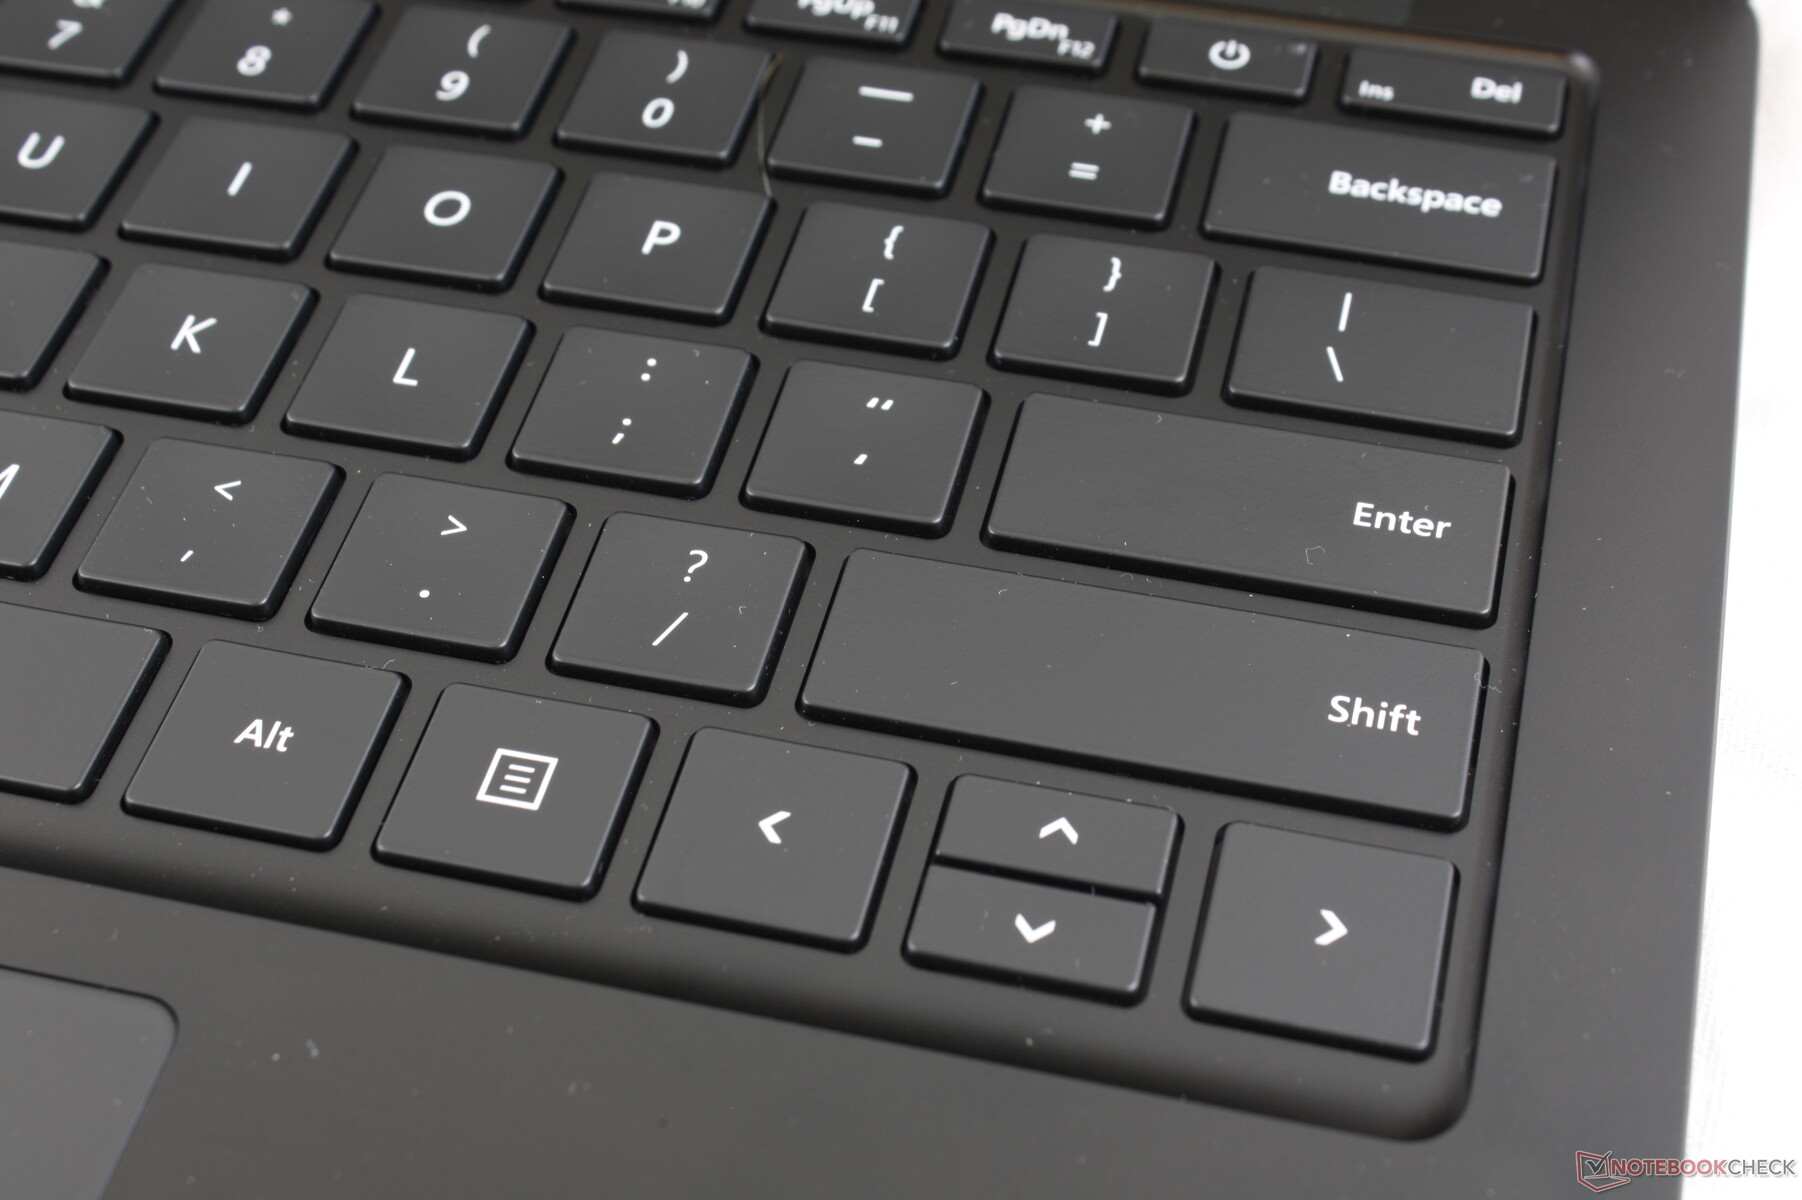
The keyboard and clickpad are the same as on the larger 15-inch Surface Laptop 3 15. Even the size of the keys and and clickpad surface (~11.5 x 7.6 cm) are identical between them. Thus, our existing comments about the input devices on the Surface Laptop 3 15 apply here on the 13.5-inch model including the satisfactory feedback, moderate clatter, and cramped Arrow keys. We still find the typing experience on the HP Spectre or Lenovo ThinkPad T series to be firmer and with deeper feedback.
Display
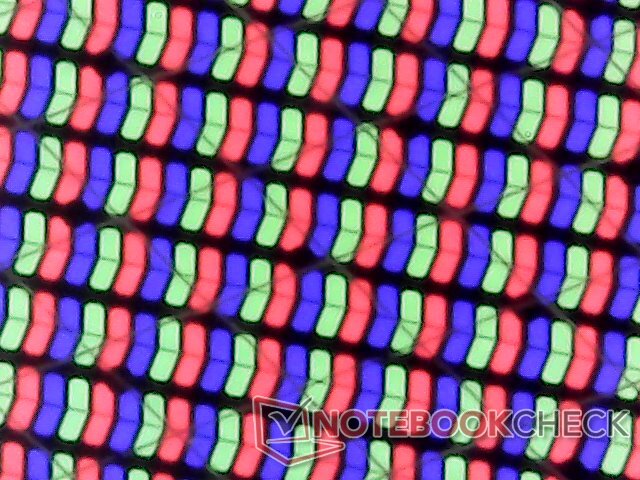
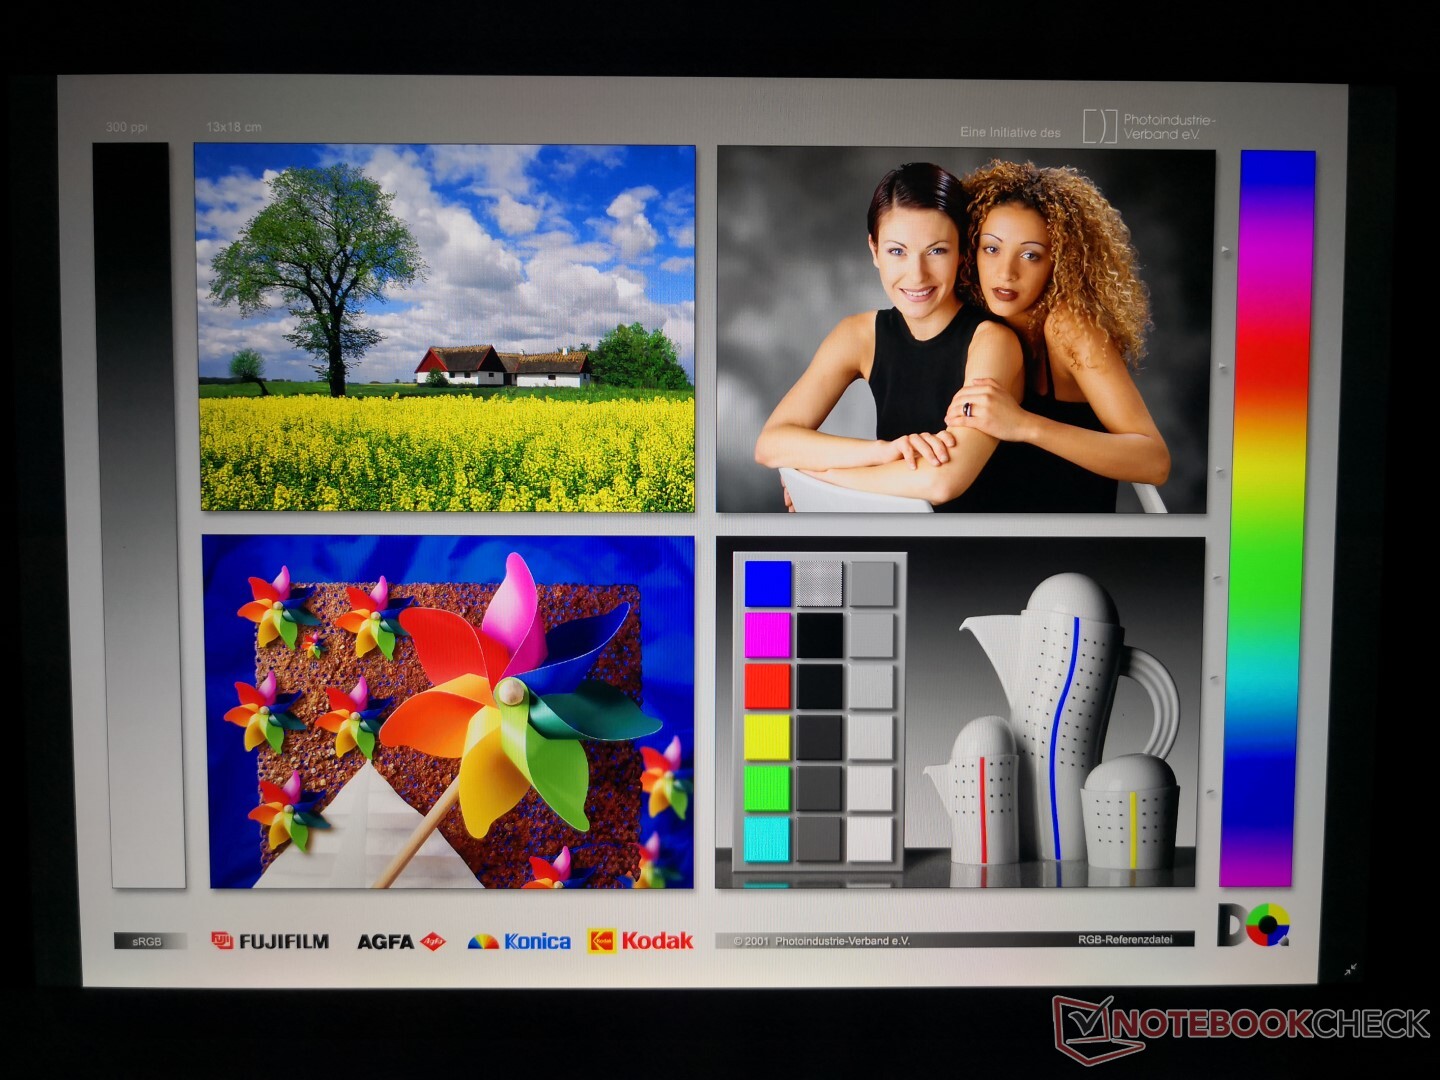
Microsoft has apparently switched panel providers for its latest Surface Laptop. Whereas the Surface Laptop 2 comes with a Panasonic VVX14T092N00 panel, our Surface Laptop 3 uses a Sharp LQ135P1JX51 instead. Response times are slightly faster on the Sharp panel, but both displays are otherwise nearly the same when it comes to brightness and gamut. Sharpness and overall visual quality rival that of flagship Ultrabooks like the XPS 13, Yoga C940, Spectre 13, or ZenBook S13.
If we are to nitpick, display response times are still on the slow side meaning that ghosting is noticeable. Both pulse-width modulation and slight uneven backlight bleeding are present as well. A number of alternatives have even brighter displays for better outdoor visibility including the MacBook Pro 13, XPS 13 2-in-1, Samsung Notebook 9, and the HP EliteBook x360 1040.


| |||||||||||||||||||||||||
Brightness Distribution: 89 %
Center on Battery: 403.4 cd/m²
Contrast: 1186:1 (Black: 0.34 cd/m²)
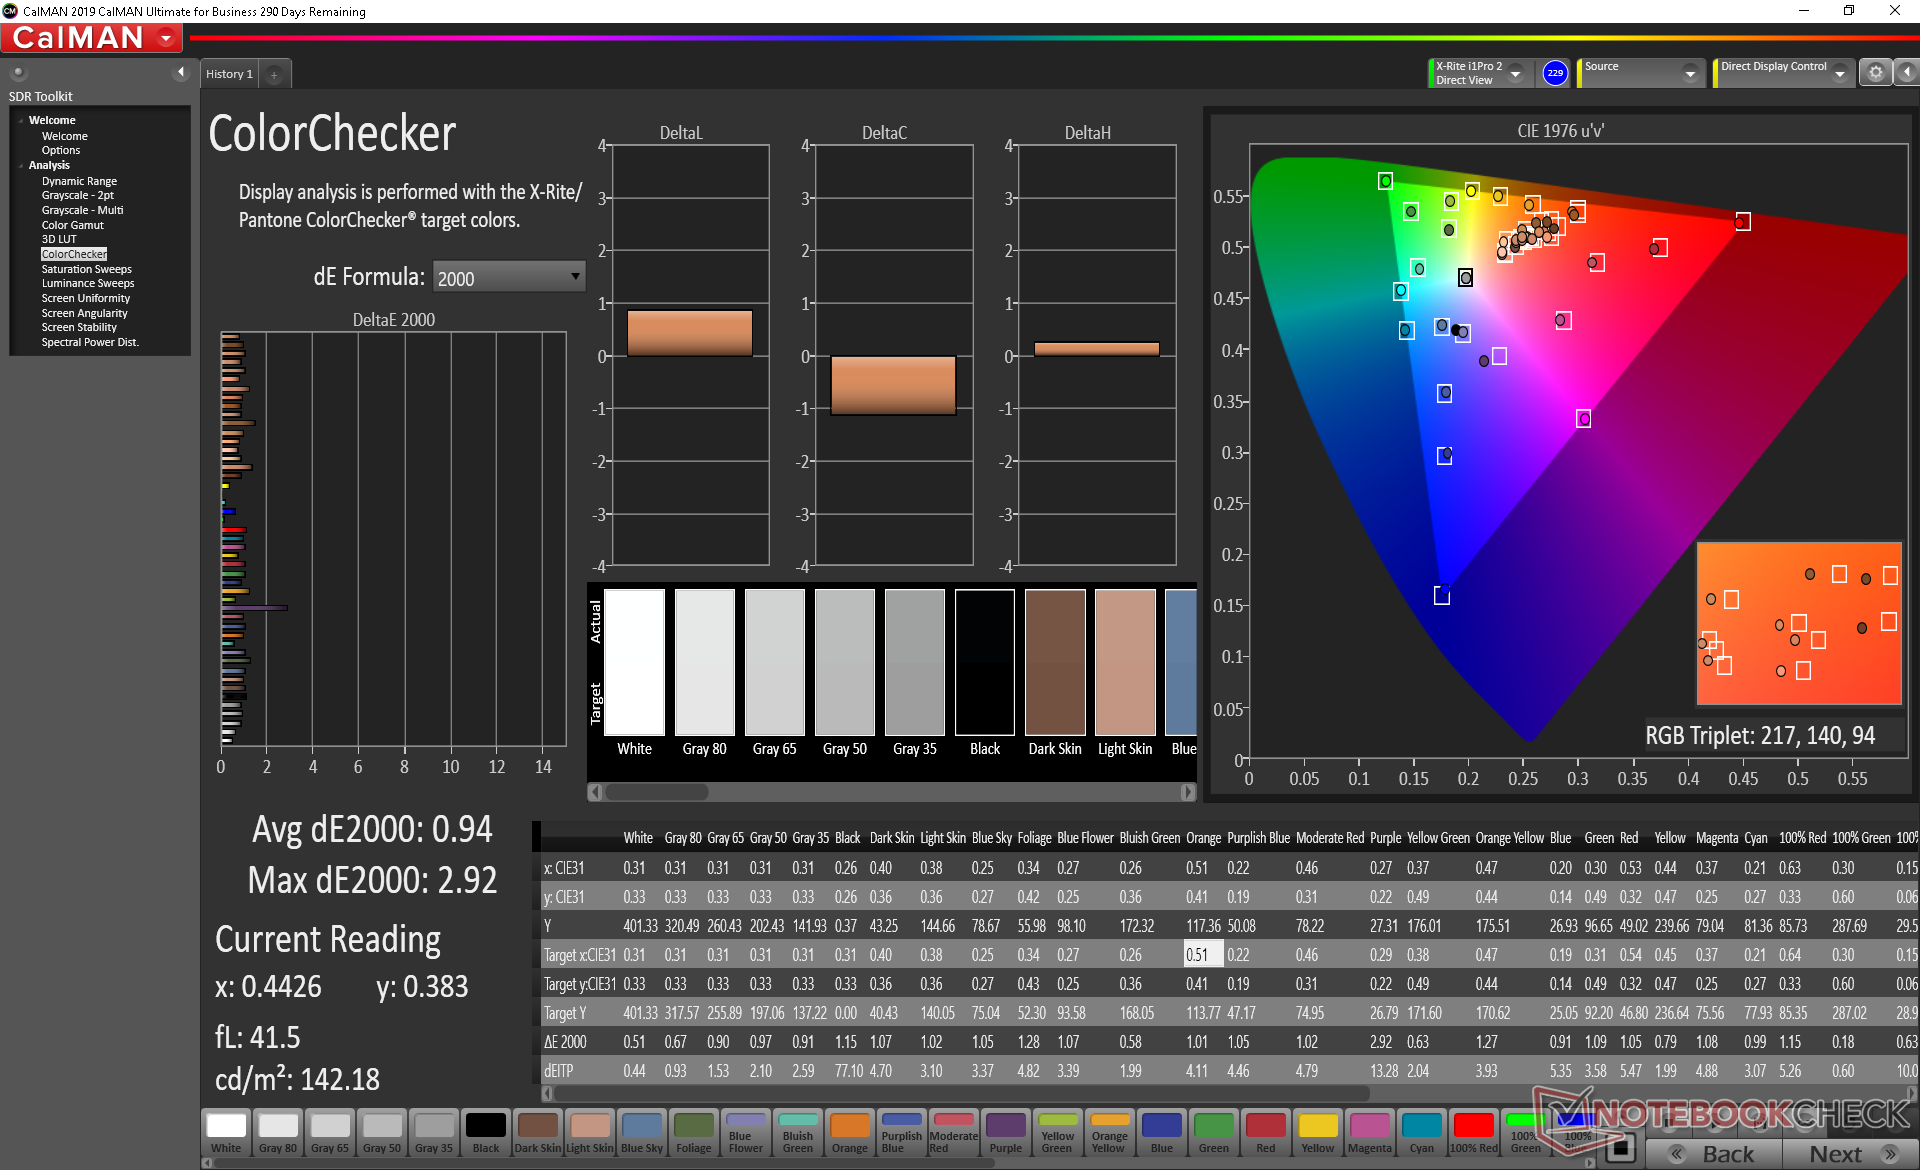
ΔE ColorChecker Calman: 0.94 | ∀{0.5-29.43 Ø4.71}
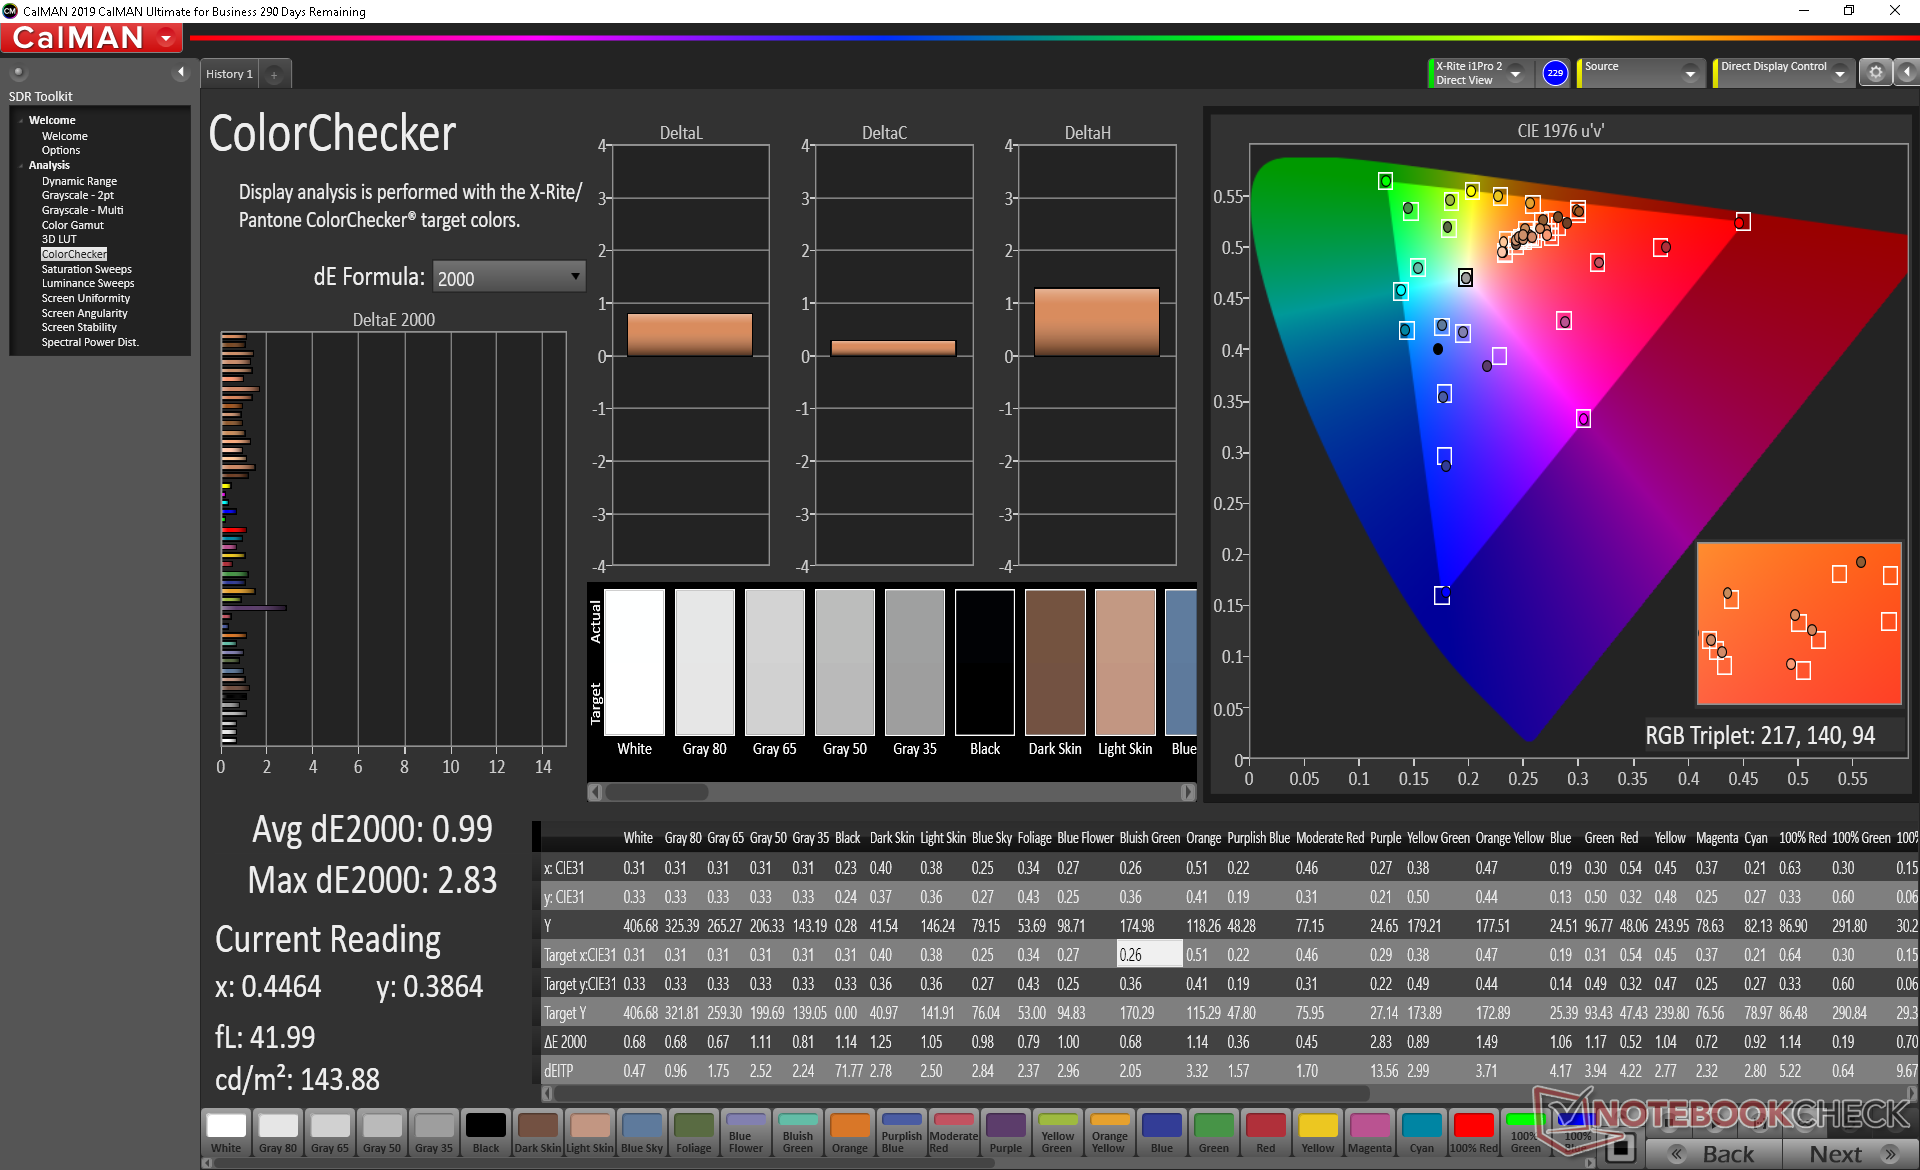
calibrated: 0.99
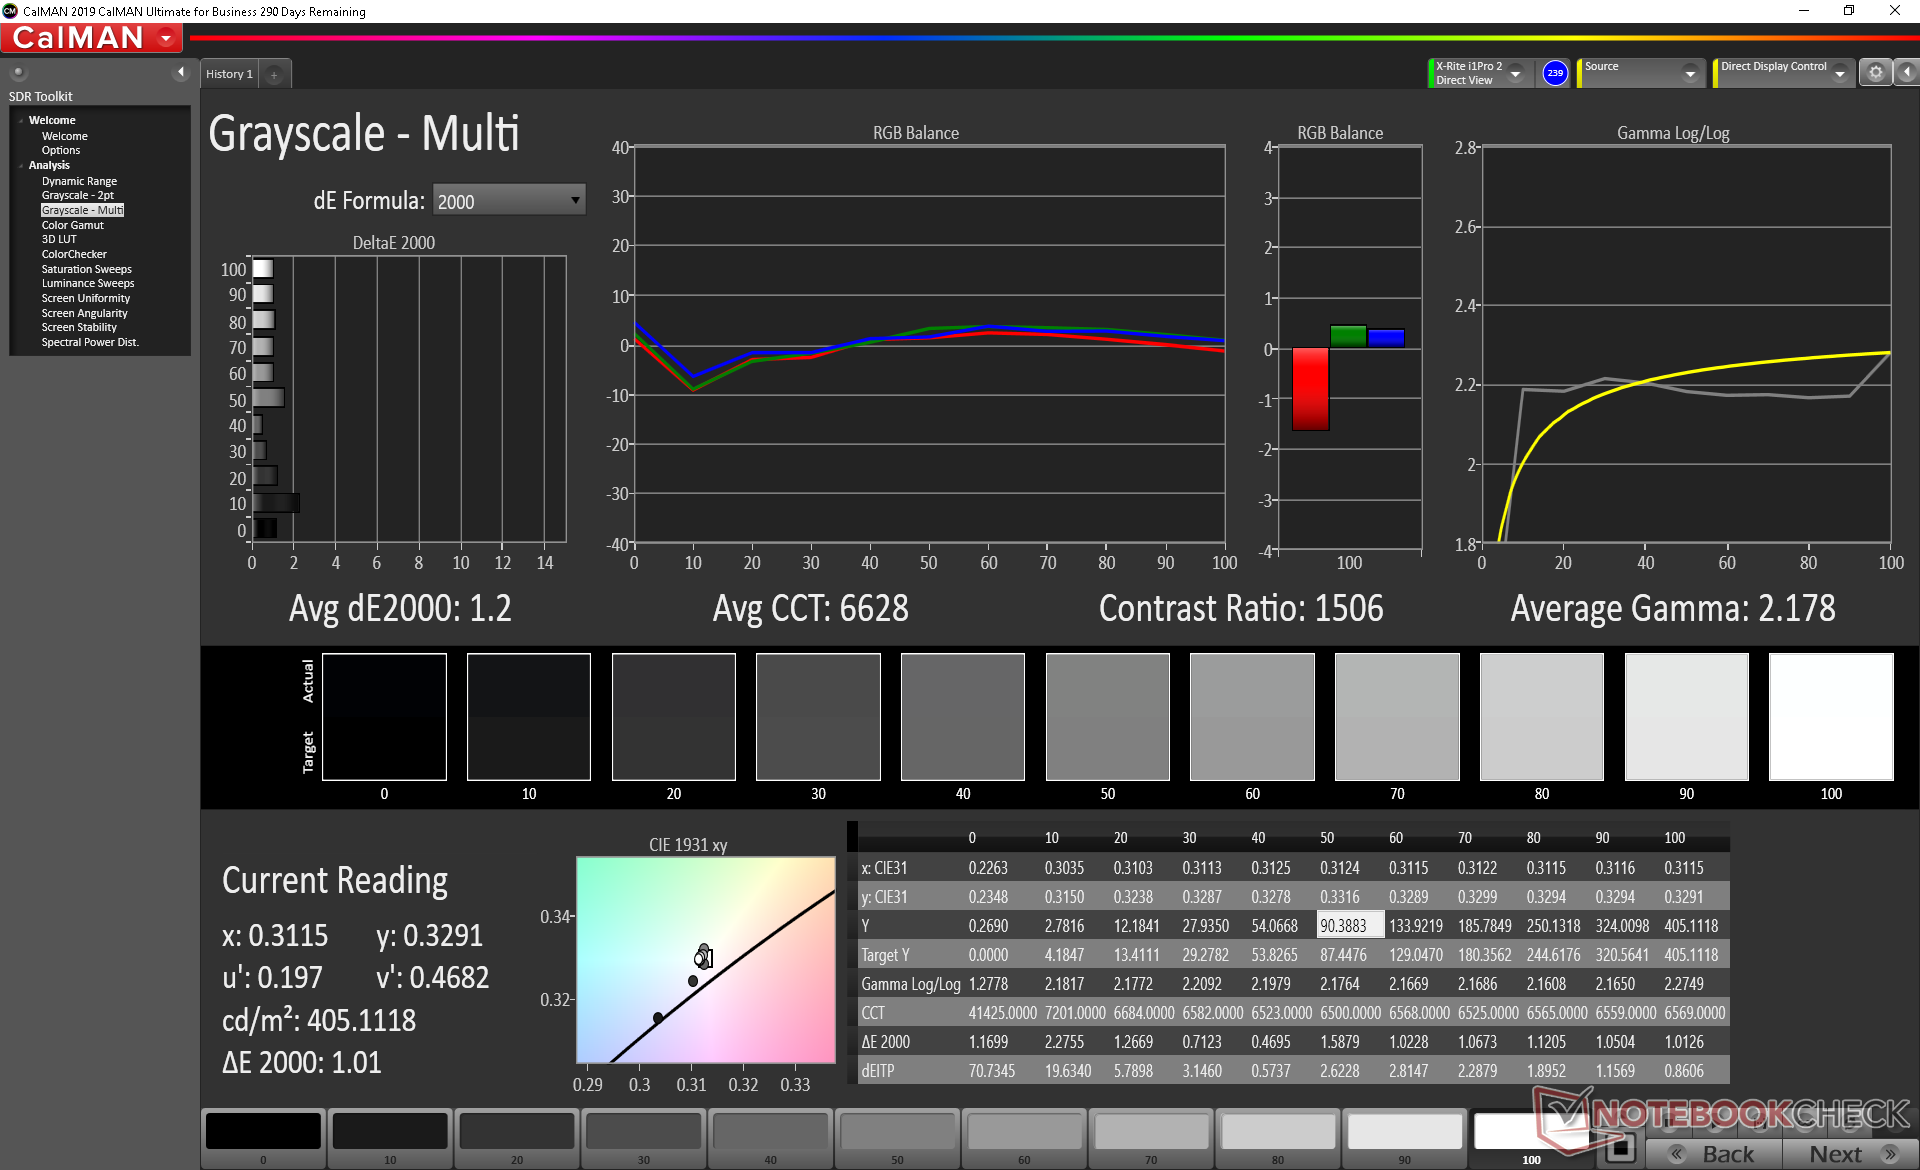
ΔE Greyscale Calman: 0.9 | ∀{0.09-98 Ø4.96}
98.7% sRGB (Argyll 1.6.3 3D)
62.3% AdobeRGB 1998 (Argyll 1.6.3 3D)
67.8% AdobeRGB 1998 (Argyll 3D)
98.6% sRGB (Argyll 3D)
65.7% Display P3 (Argyll 3D)
Gamma: 2.13
CCT: 6620 K
| Microsoft Surface Laptop 3 13 Core i5-1035G7 Sharp LQ135P1JX51, IPS, 13.5", 2256x1504 | Apple MacBook Pro 13 2019 2TB3 APPA03D, IPS, 13.3", 2560x1600 | Huawei Matebook X Pro i5 Tianma XM, IPS, 13.9", 3000x2000 | Microsoft Surface Laptop 2-LQN-00004 VVX14T092N00, IPS, 13.5", 2256x1504 | Dell XPS 13 7390 2-in-1 Core i7 Sharp LQ134N1, IPS, 13.4", 1920x1200 | Lenovo ThinkPad X1 Carbon 2019-20QE000VGE LP140QH2-SPD1, IPS, 14", 2560x1440 | |
|---|---|---|---|---|---|---|
| Display | 24% | -1% | 1% | 4% | 6% | |
| Display P3 Coverage (%) | 65.7 | 96.1 46% | 65.9 0% | 68 4% | 69.9 6% | 72.5 10% |
| sRGB Coverage (%) | 98.6 | 99.4 1% | 95.2 -3% | 94.7 -4% | 99.2 1% | 97.8 -1% |
| AdobeRGB 1998 Coverage (%) | 67.8 | 85.6 26% | 67.6 0% | 69.2 2% | 71.5 5% | 73.8 9% |
| Response Times | 15% | 35% | -15% | 25% | 43% | |
| Response Time Grey 50% / Grey 80% * (ms) | 59.2 ? | 50.4 ? 15% | 40.4 ? 32% | 69.2 ? -17% | 47.6 ? 20% | 33.6 ? 43% |
| Response Time Black / White * (ms) | 41.6 ? | 35.2 ? 15% | 25.6 ? 38% | 46.4 ? -12% | 29.2 ? 30% | 24 ? 42% |
| PWM Frequency (Hz) | 21740 ? | 116300 ? | 2500 ? | |||
| Screen | -3% | -113% | -67% | -28% | -113% | |
| Brightness middle (cd/m²) | 403.4 | 603 49% | 442.7 10% | 392 -3% | 549.8 36% | 338 -16% |
| Brightness (cd/m²) | 397 | 577 45% | 428 8% | 390 -2% | 520 31% | 315 -21% |
| Brightness Distribution (%) | 89 | 92 3% | 84 -6% | 89 0% | 86 -3% | 88 -1% |
| Black Level * (cd/m²) | 0.34 | 0.35 -3% | 0.31 9% | 0.24 29% | 0.39 -15% | 0.43 -26% |
| Contrast (:1) | 1186 | 1723 45% | 1428 20% | 1633 38% | 1410 19% | 786 -34% |
| Colorchecker dE 2000 * | 0.94 | 1.7 -81% | 2.24 -138% | 3.2 -240% | 2.12 -126% | 4 -326% |
| Colorchecker dE 2000 max. * | 2.92 | 3.1 -6% | 7.19 -146% | 6.3 -116% | 3.66 -25% | 7.9 -171% |
| Colorchecker dE 2000 calibrated * | 0.99 | 0.7 29% | 1.11 -12% | 1.4 -41% | 1.37 -38% | 1.7 -72% |
| Greyscale dE 2000 * | 0.9 | 2.1 -133% | 9.7 -978% | 4.5 -400% | 2.6 -189% | 6.2 -589% |
| Gamma | 2.13 103% | 2.18 101% | 1.42 155% | 2.2 100% | 2.3 96% | 2.13 103% |
| CCT | 6620 98% | 6843 95% | 6227 104% | 7556 86% | 6884 94% | 6787 96% |
| Color Space (Percent of AdobeRGB 1998) (%) | 62.3 | 76.7 23% | 61.6 -1% | 63.9 3% | 65.4 5% | 68.1 9% |
| Color Space (Percent of sRGB) (%) | 98.7 | 99.4 1% | 95 -4% | 95 -4% | 99.7 1% | 97.8 -1% |
| Total Average (Program / Settings) | 12% /
5% | -26% /
-73% | -27% /
-48% | 0% /
-15% | -21% /
-72% |
* ... smaller is better
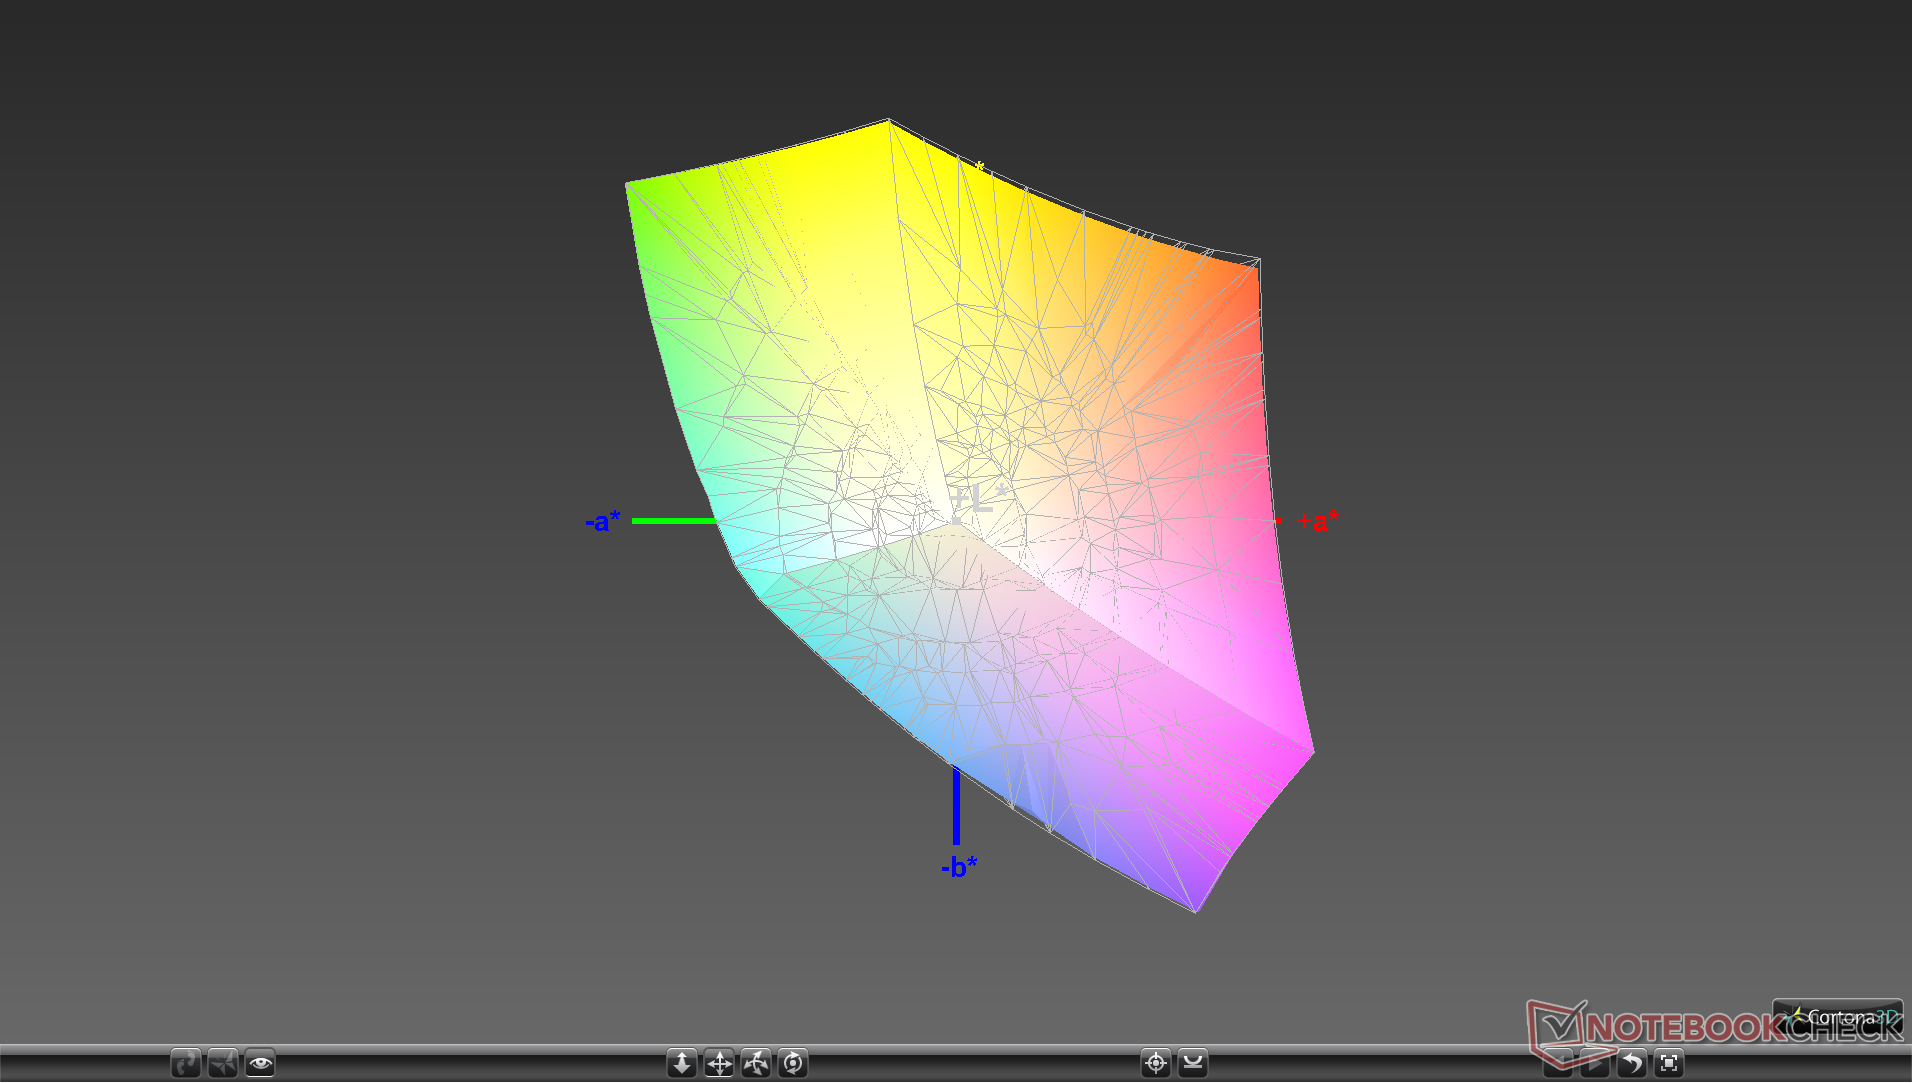
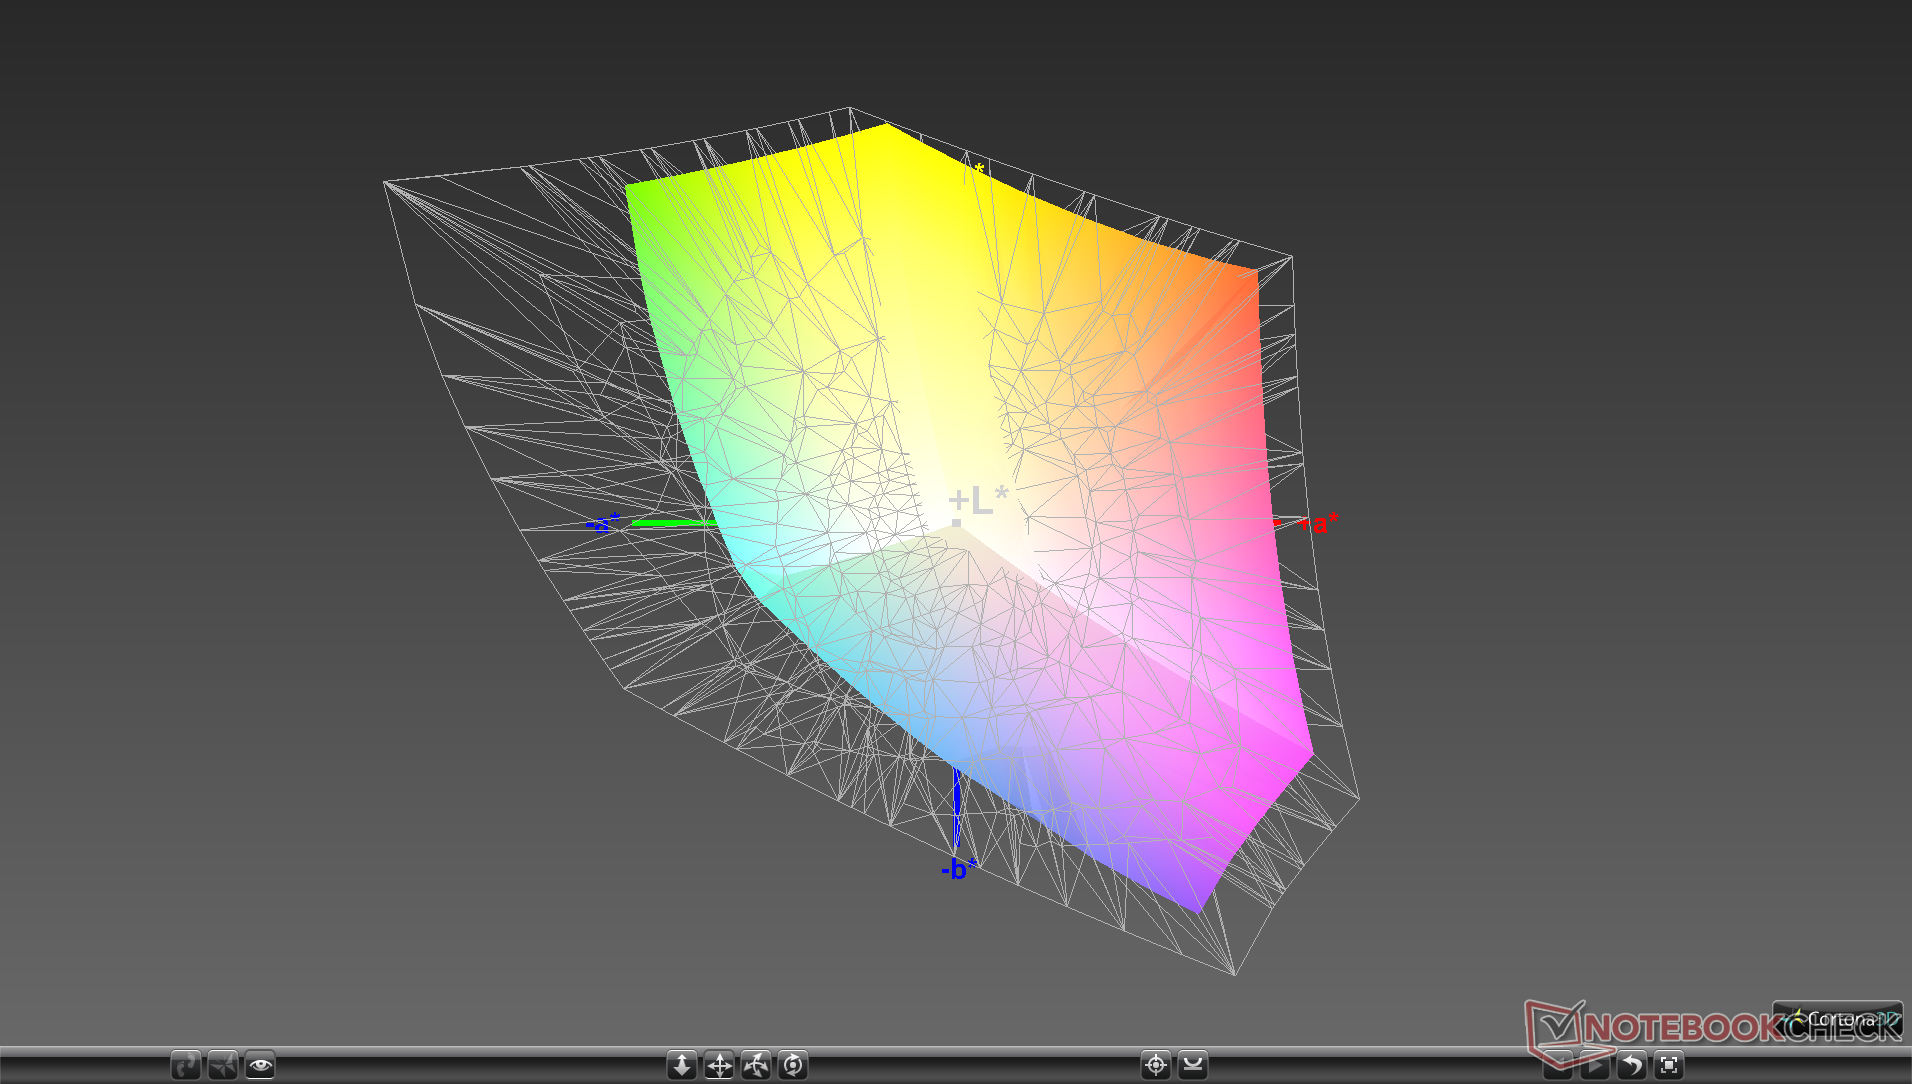
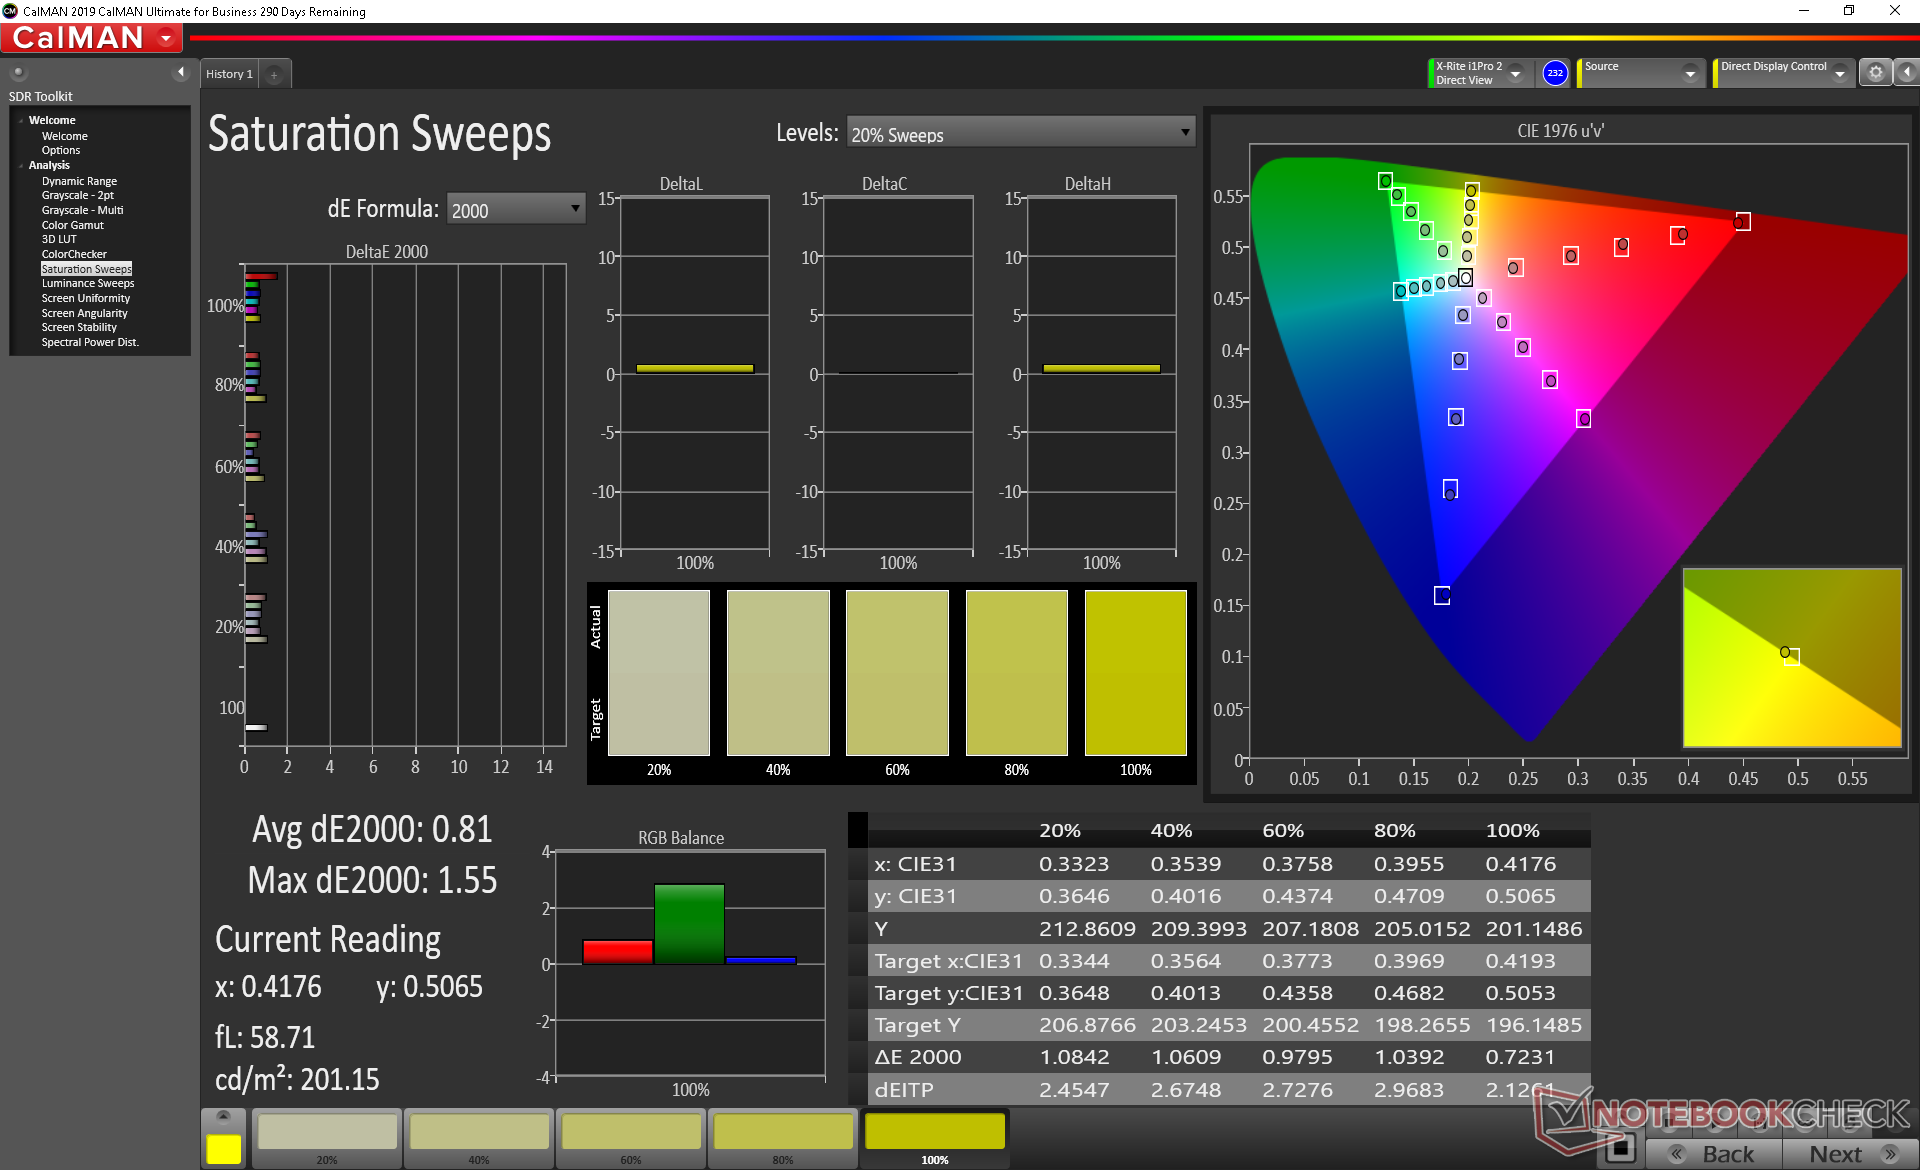
Color space covers approximately 99 percent and 62 percent of sRGB and AdobeRGB, respectively, not unlike the Dell XPS 13 2-in-1 or older Surface Laptop 2. Other laptops like the MacBook Pro 13 or those with OLED options like the Dell XPS 15 are able to offer deeper colors.
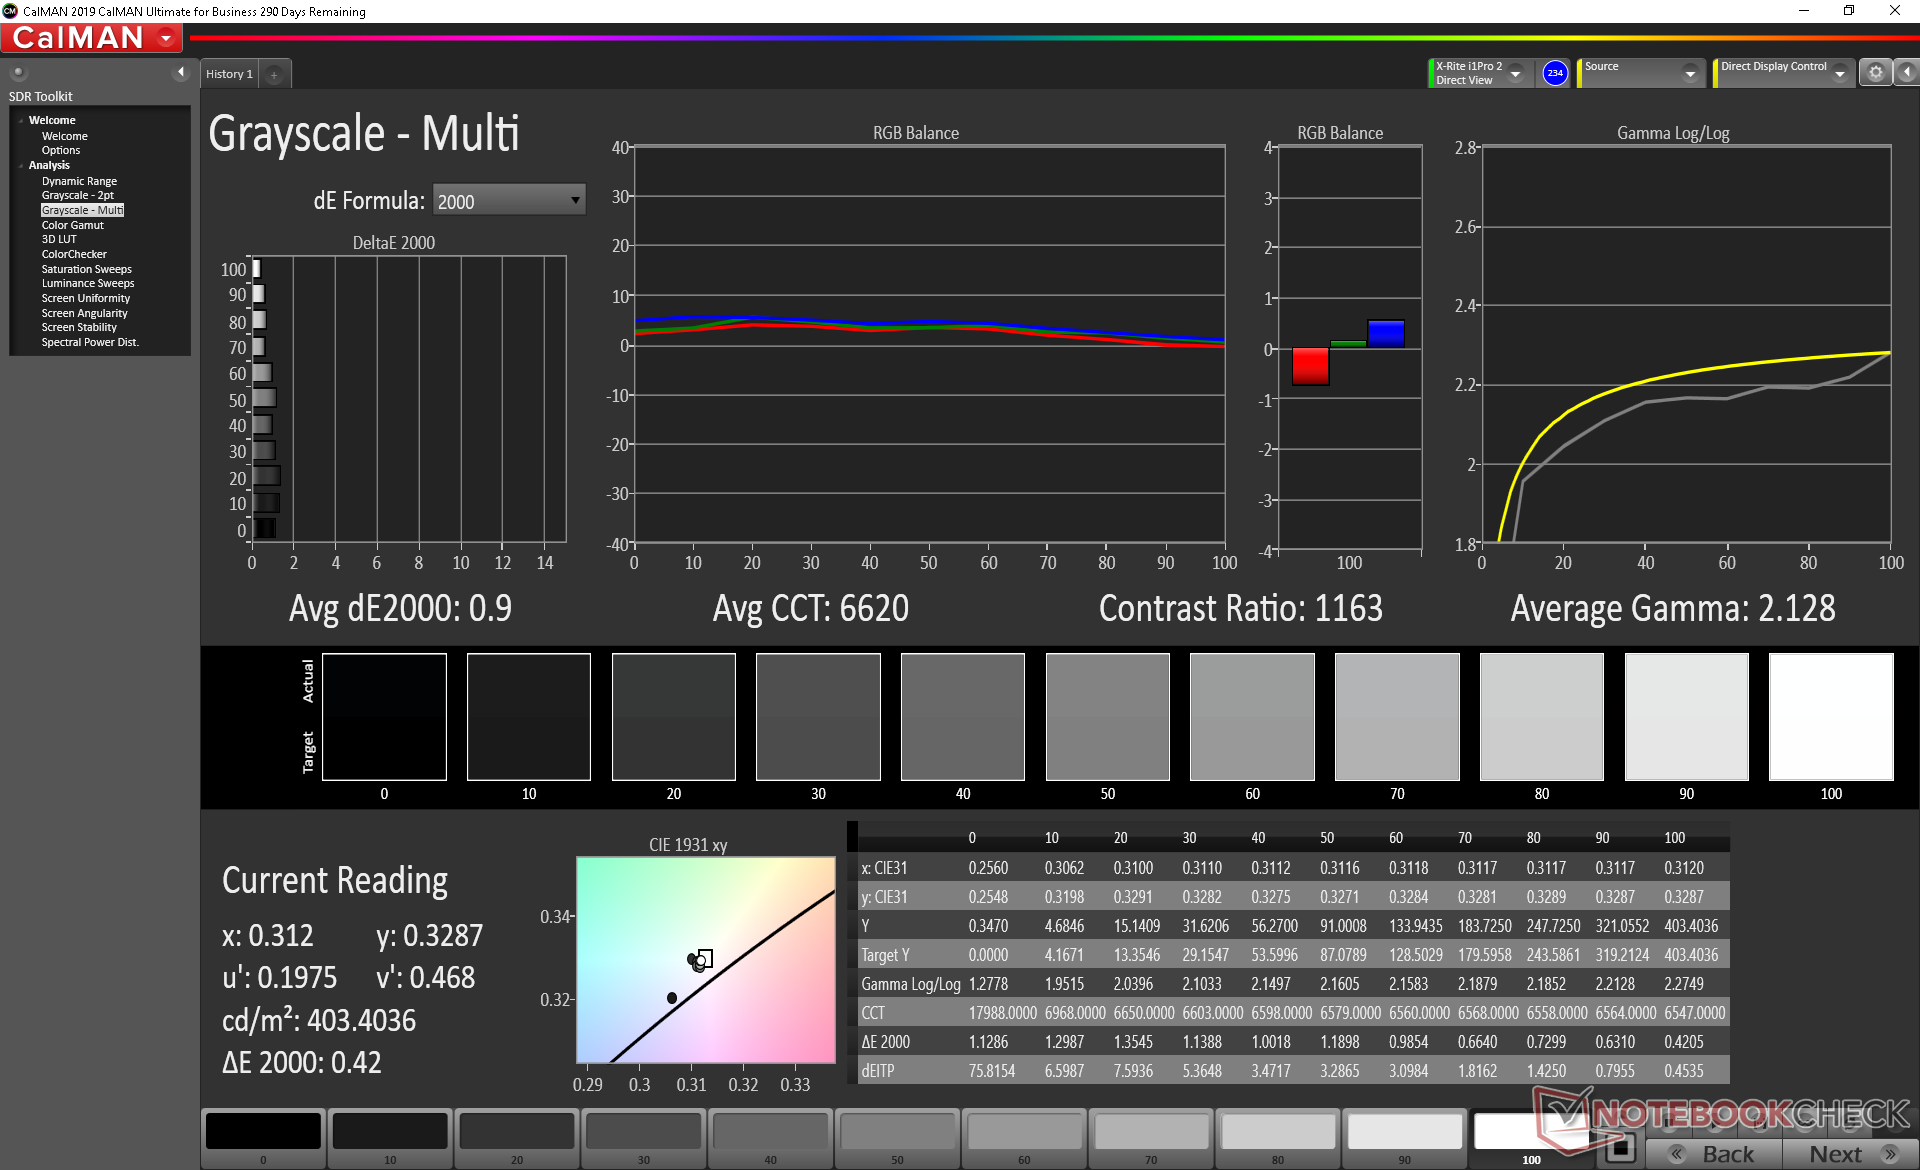
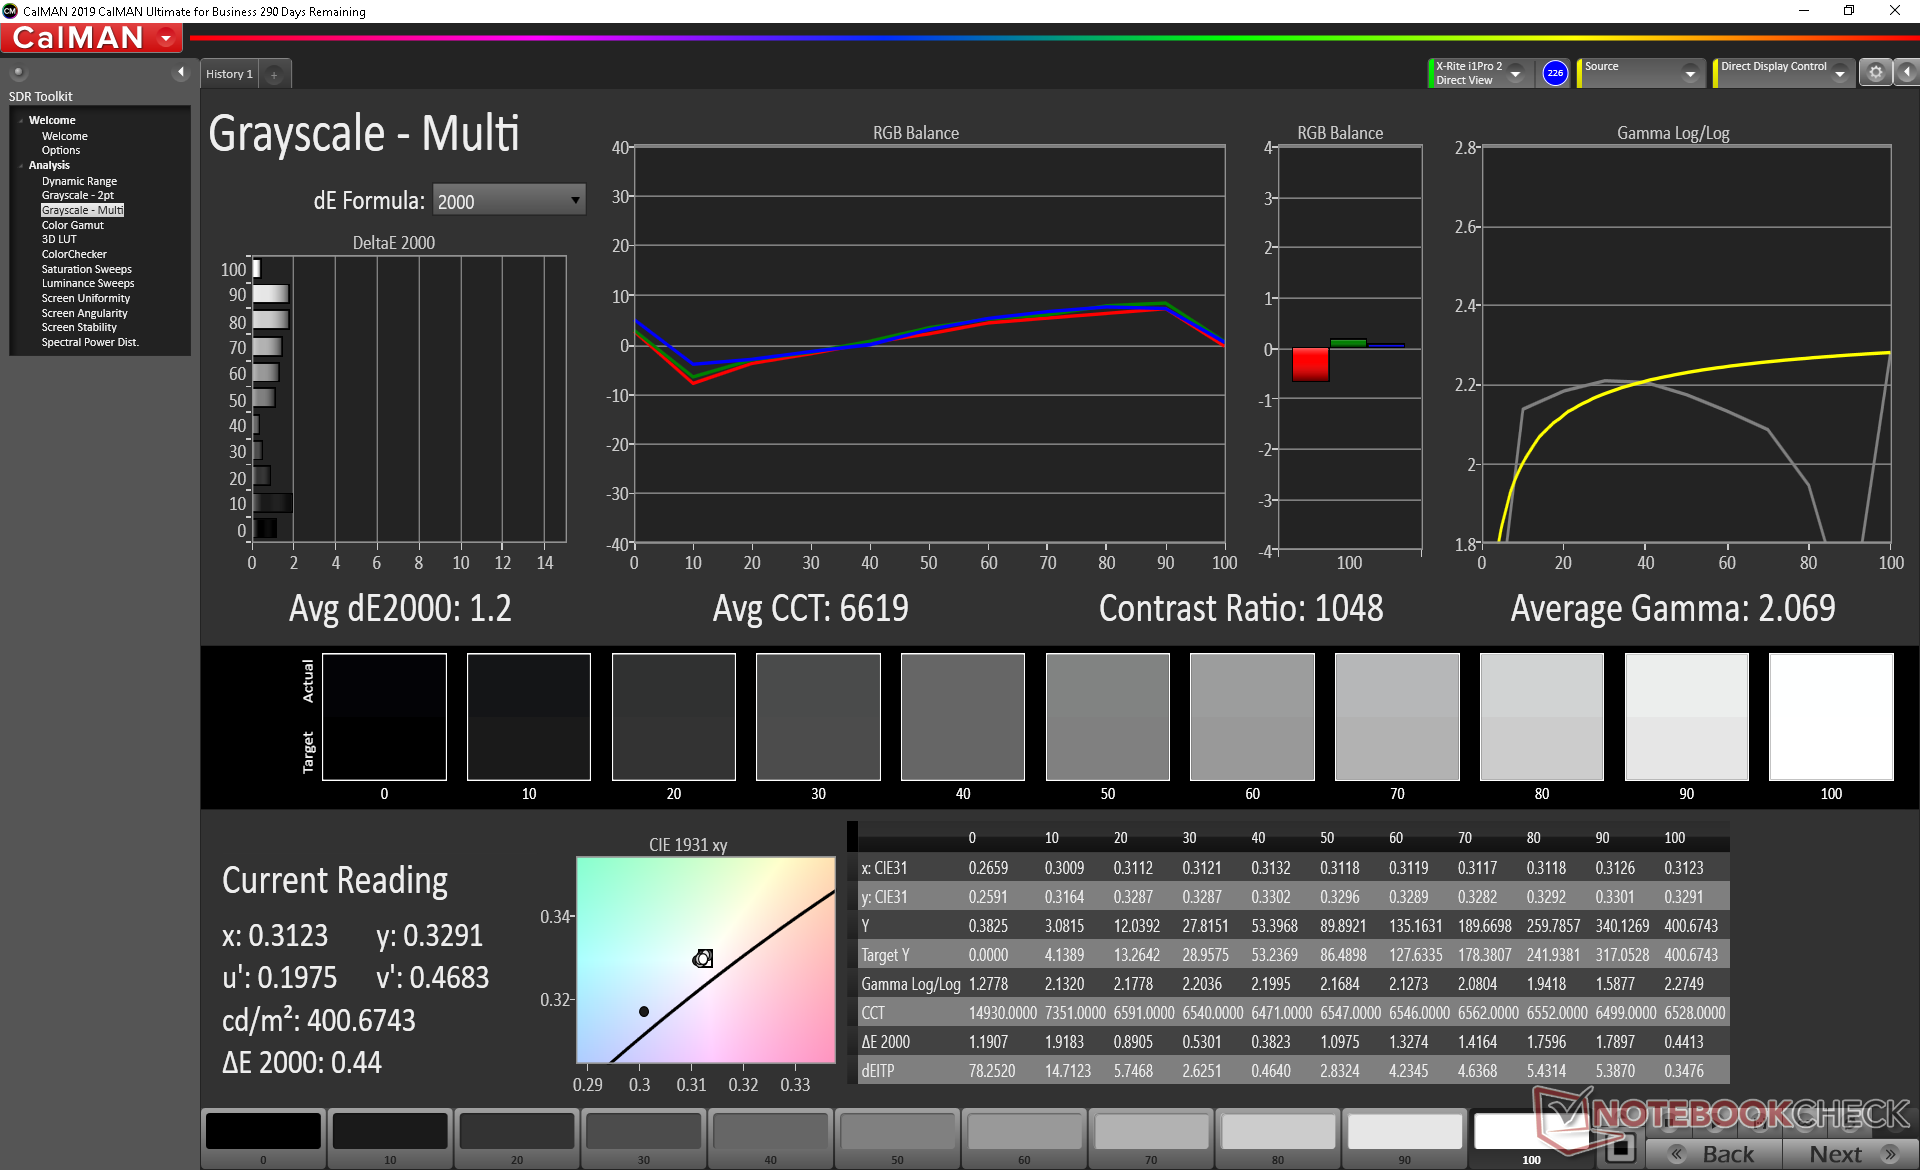
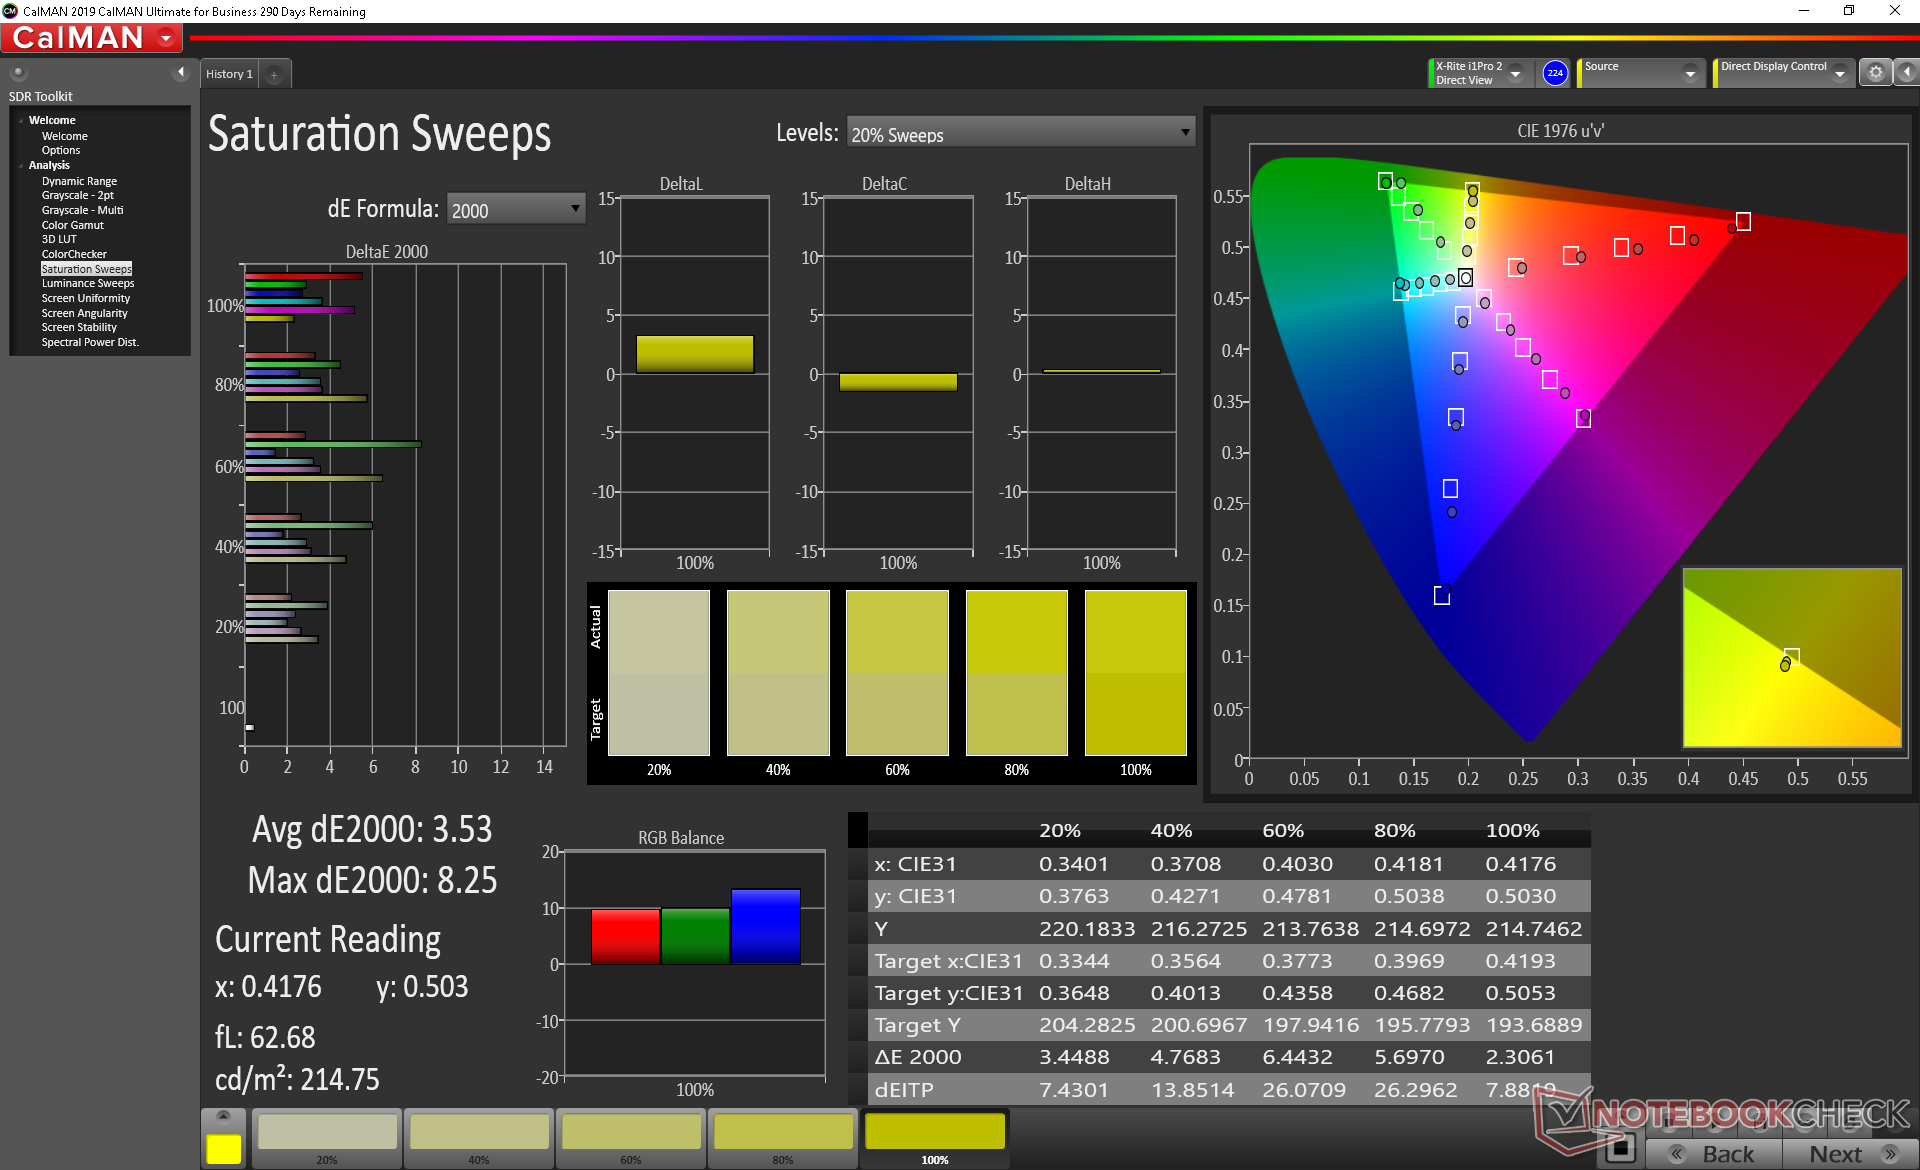
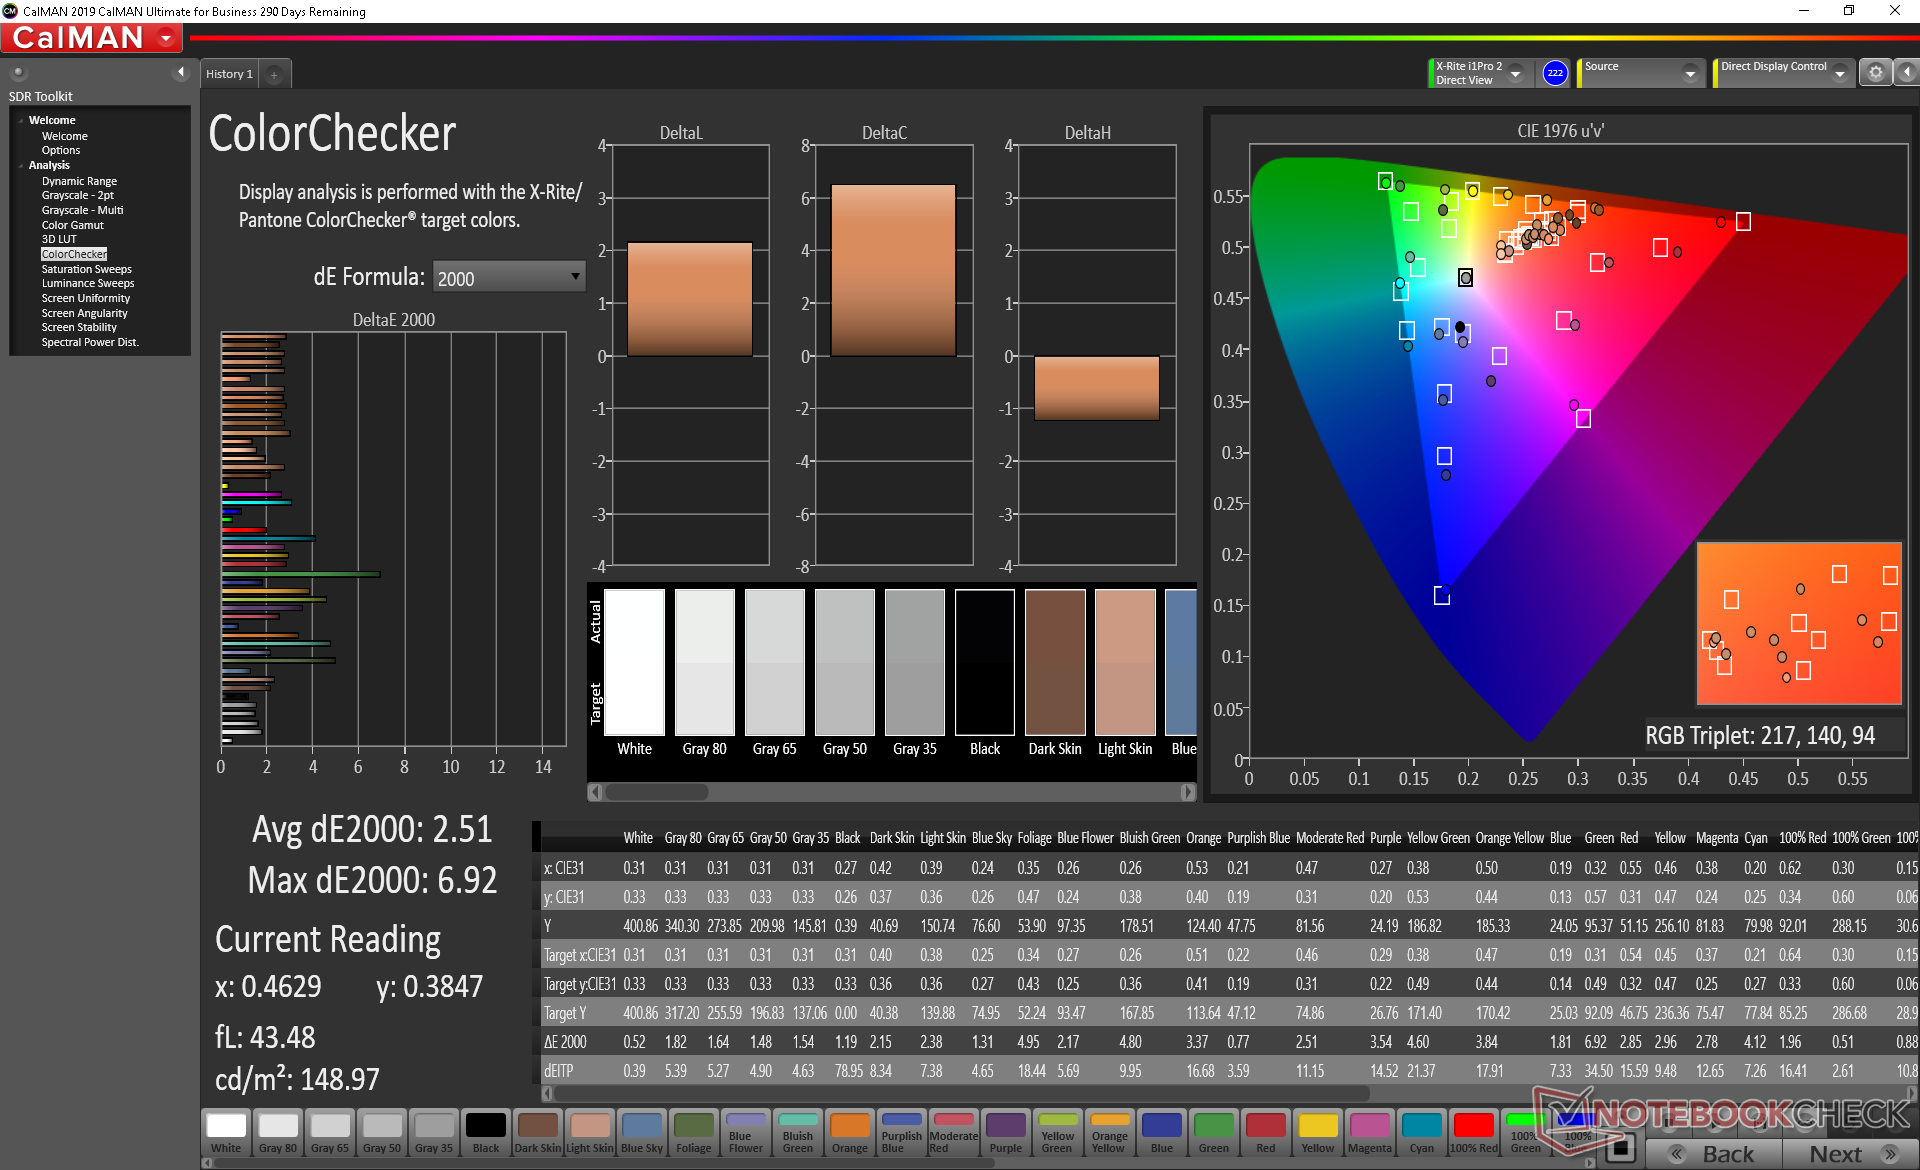
Further measurements with an X-Rite colorimeter reveal a well-calibrated display out of the box in contrast to what we discovered on the Surface Laptop 2. Average grayscale and color deltaE values sit at just 0.9 and 0.8, respectively, so no end-user calibration is necessary to get the most out of the display. This is perhaps the biggest advantage over the Surface Laptop 2 in regards to display quality. Attempting to calibrate the panel even further ourselves would result in no major improvements.
Much like on the 15-inch Surface Laptop 3, the 13.5-inch model includes an "Enhanced" color mode option alongside standard sRGB. This mode appears to saturate colors for livelier video playback and image viewing at the cost of sRGB accuracy. We recommend leaving this off whenever possible.

Display Response Times
| ↔ Response Time Black to White | ||
|---|---|---|
| 41.6 ms ... rise ↗ and fall ↘ combined | ↗ 23.6 ms rise | 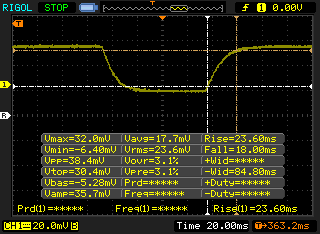 |
| ↘ 18 ms fall | ||
| The screen shows slow response rates in our tests and will be unsatisfactory for gamers. In comparison, all tested devices range from 0.1 (minimum) to 240 (maximum) ms. » 98 % of all devices are better. This means that the measured response time is worse than the average of all tested devices (19.8 ms). | ||
| ↔ Response Time 50% Grey to 80% Grey | ||
| 59.2 ms ... rise ↗ and fall ↘ combined | ↗ 28.4 ms rise | 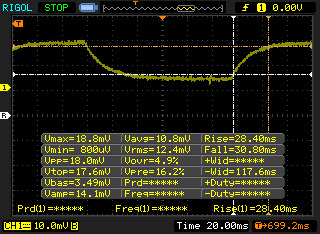 |
| ↘ 30.8 ms fall | ||
| The screen shows slow response rates in our tests and will be unsatisfactory for gamers. In comparison, all tested devices range from 0.165 (minimum) to 636 (maximum) ms. » 95 % of all devices are better. This means that the measured response time is worse than the average of all tested devices (31 ms). | ||
Screen Flickering / PWM (Pulse-Width Modulation)
| Screen flickering / PWM detected | 21740 Hz | ≤ 51 % brightness setting | 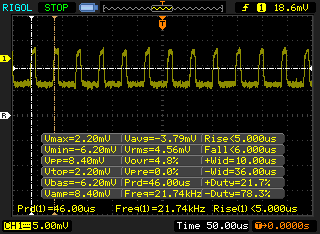 |
The display backlight flickers at 21740 Hz (worst case, e.g., utilizing PWM) Flickering detected at a brightness setting of 51 % and below. There should be no flickering or PWM above this brightness setting. The frequency of 21740 Hz is quite high, so most users sensitive to PWM should not notice any flickering. In comparison: 52 % of all tested devices do not use PWM to dim the display. If PWM was detected, an average of 7754 (minimum: 5 - maximum: 343500) Hz was measured. | |||
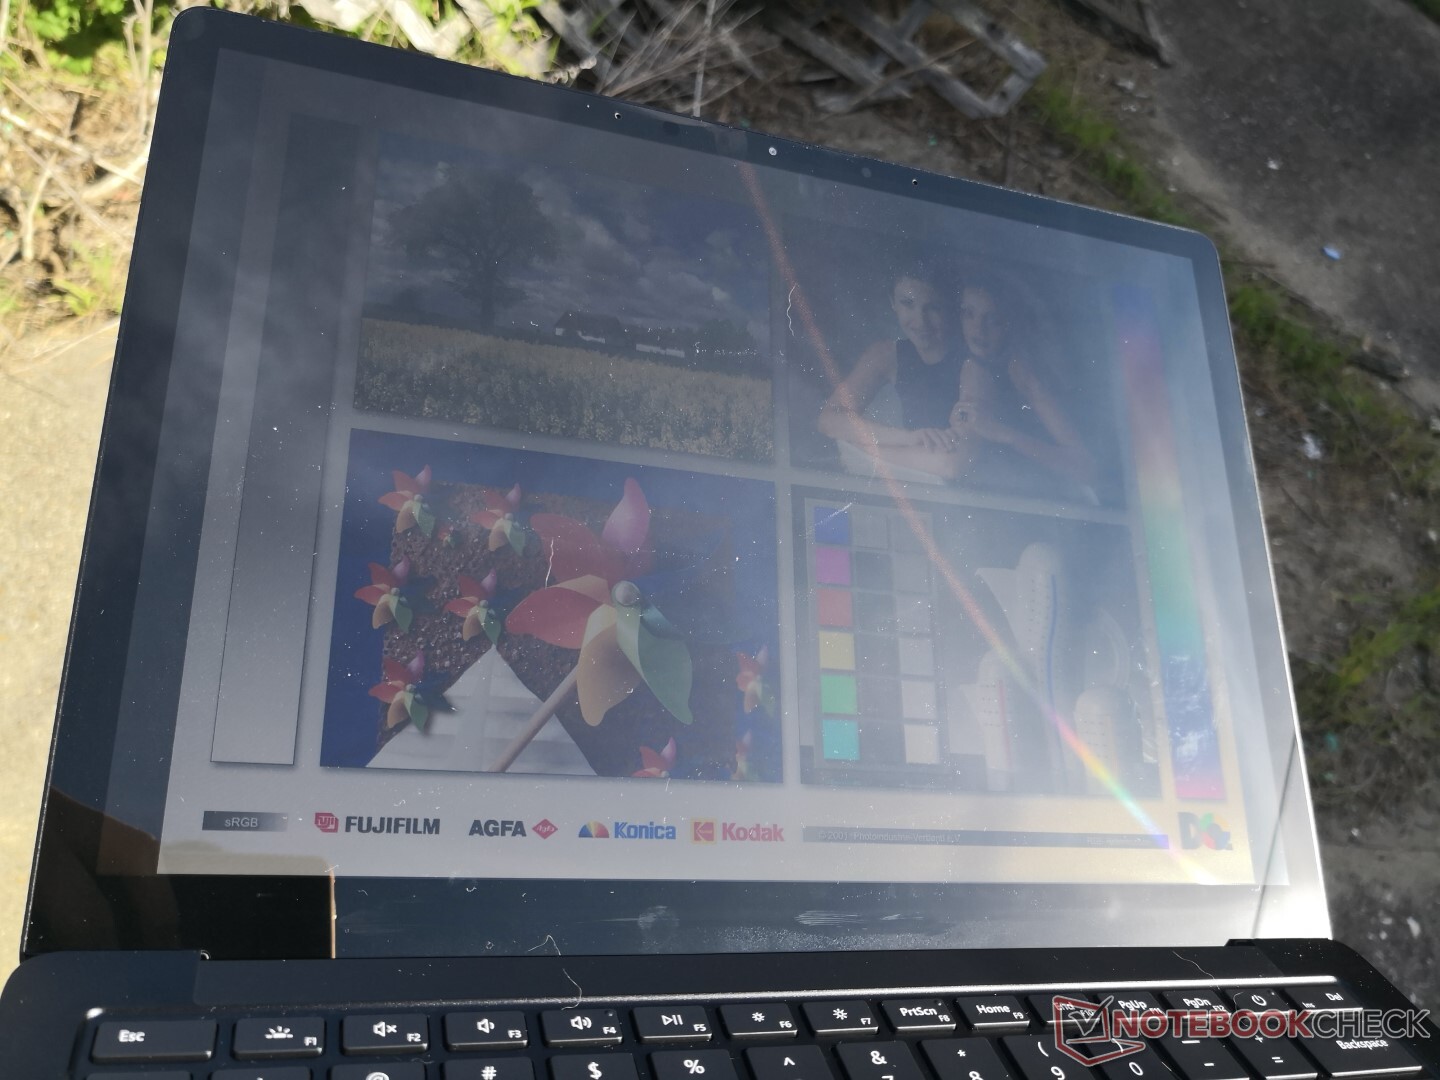
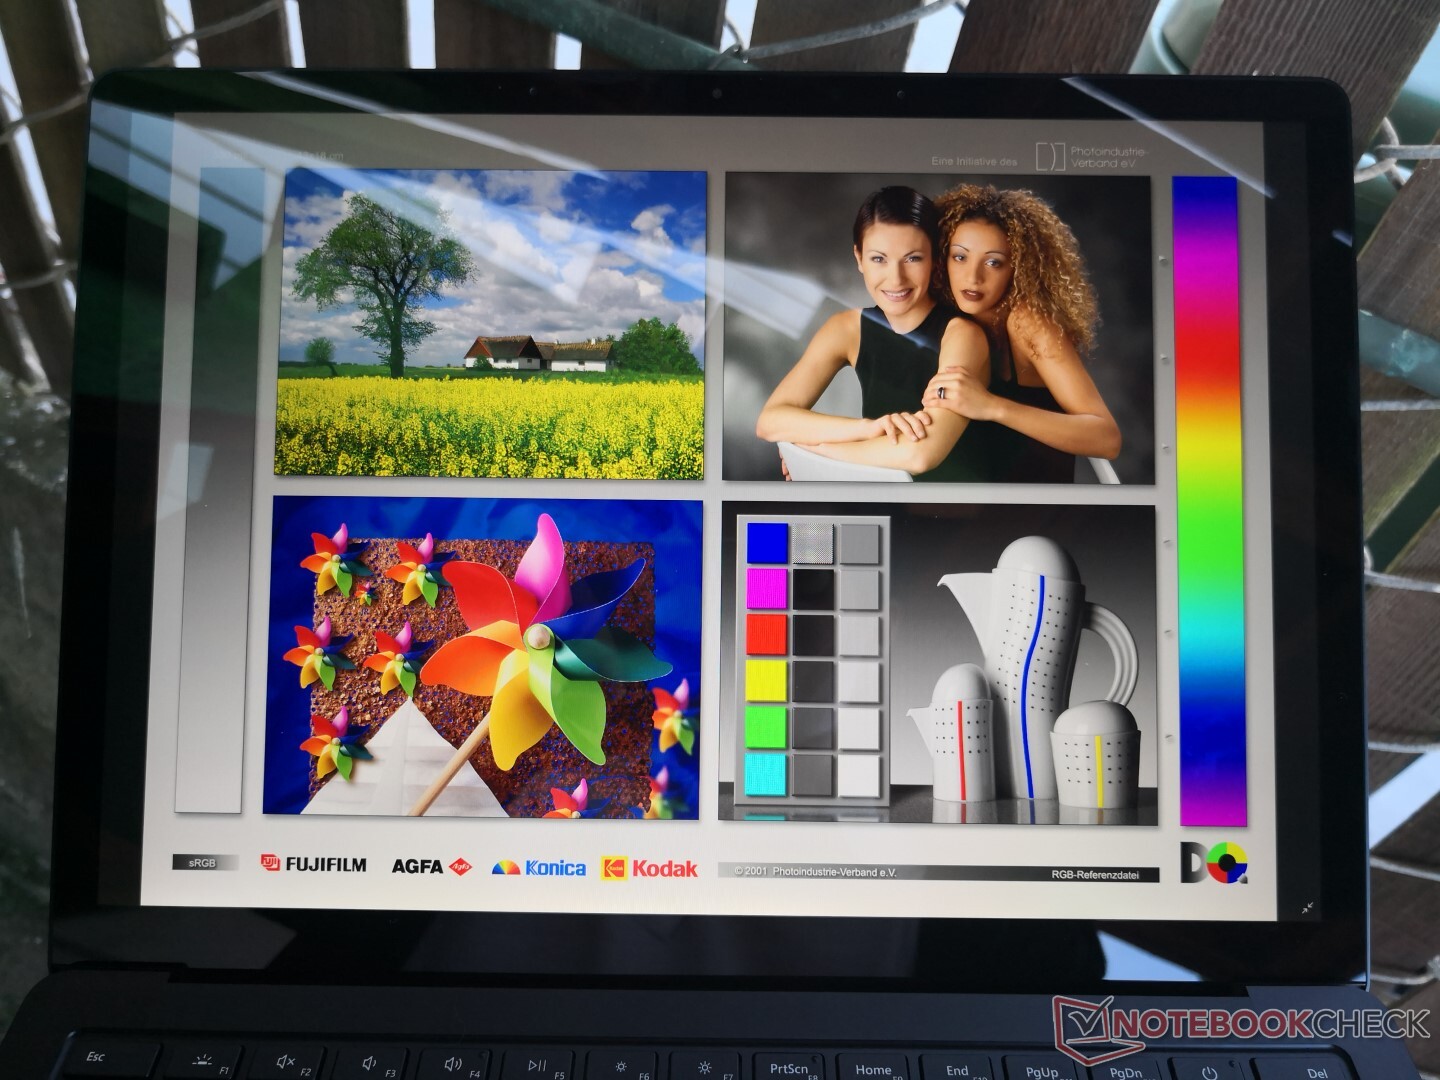
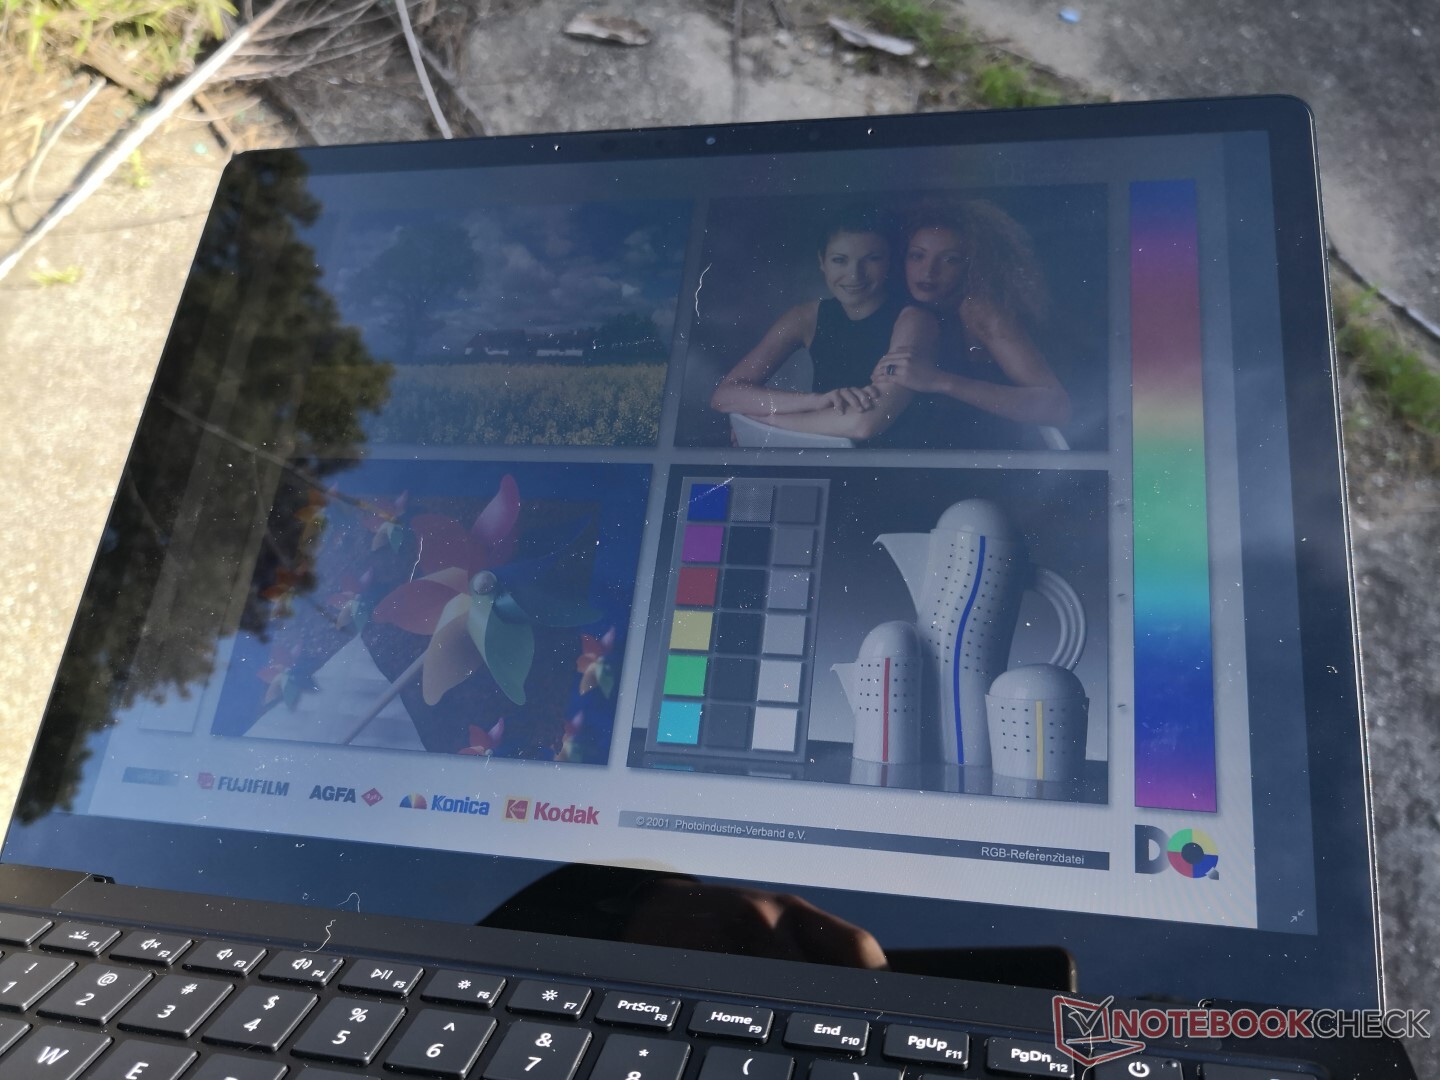
Outdoor visibility is not any different from the Surface Laptop 2 since brightness and contrast have remained relatively constant gen-to-gen. Though not necessarily bad, it's still disappointing because Microsoft is offering no improvements over the last model in this regard. Expect glare yet again from the glossy panel.
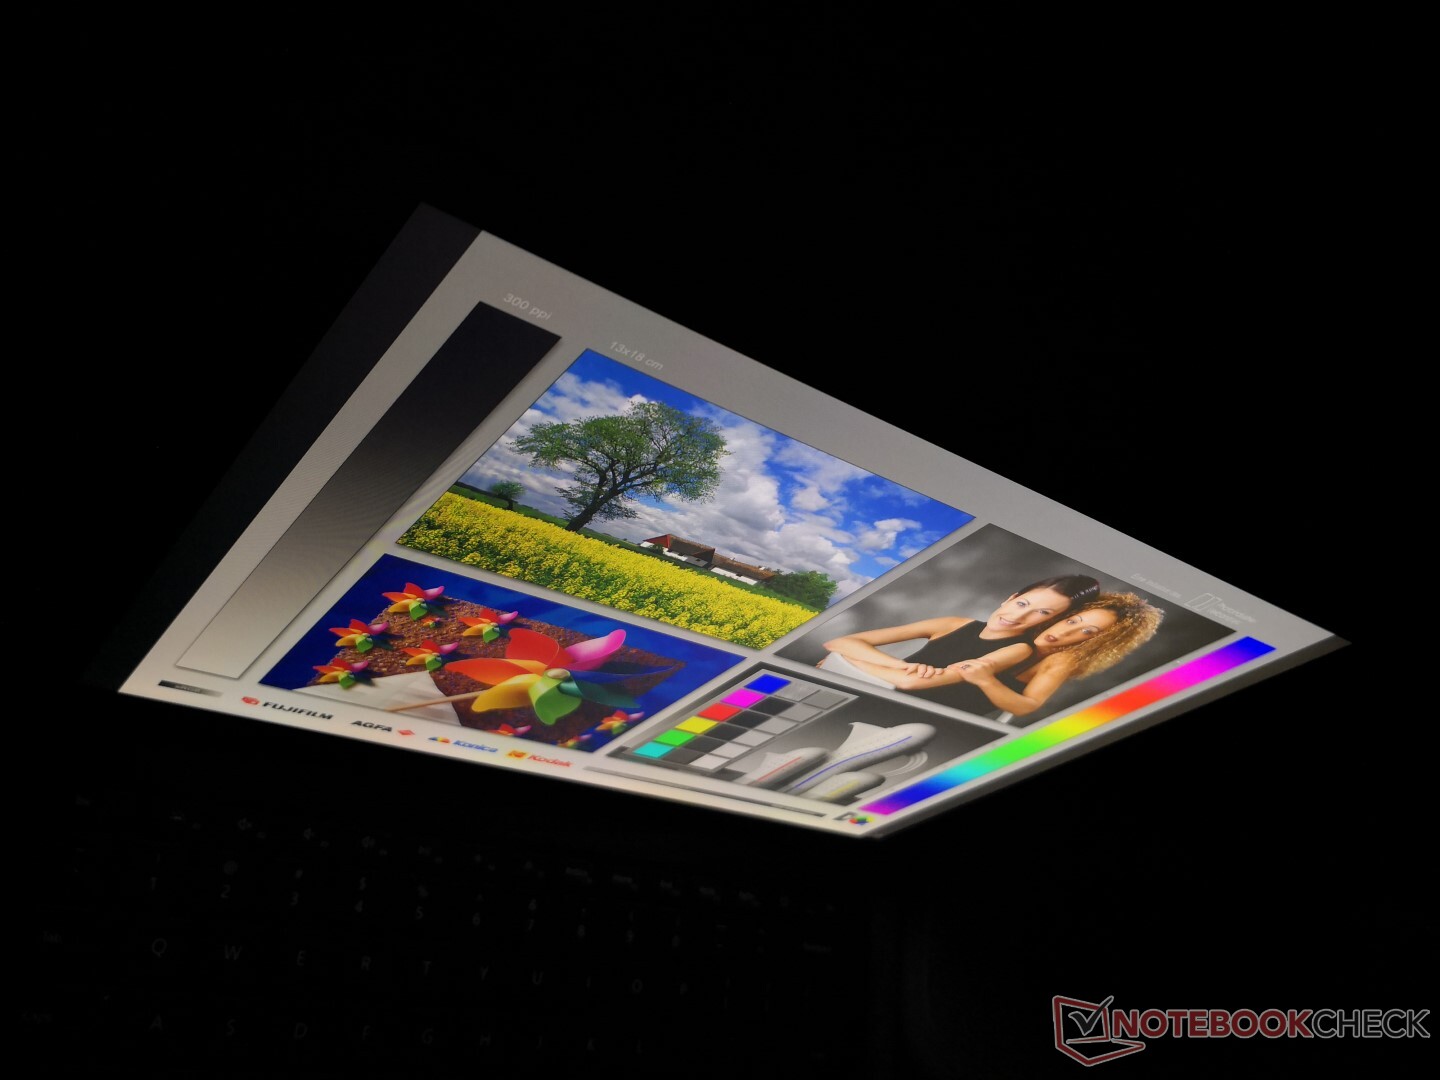
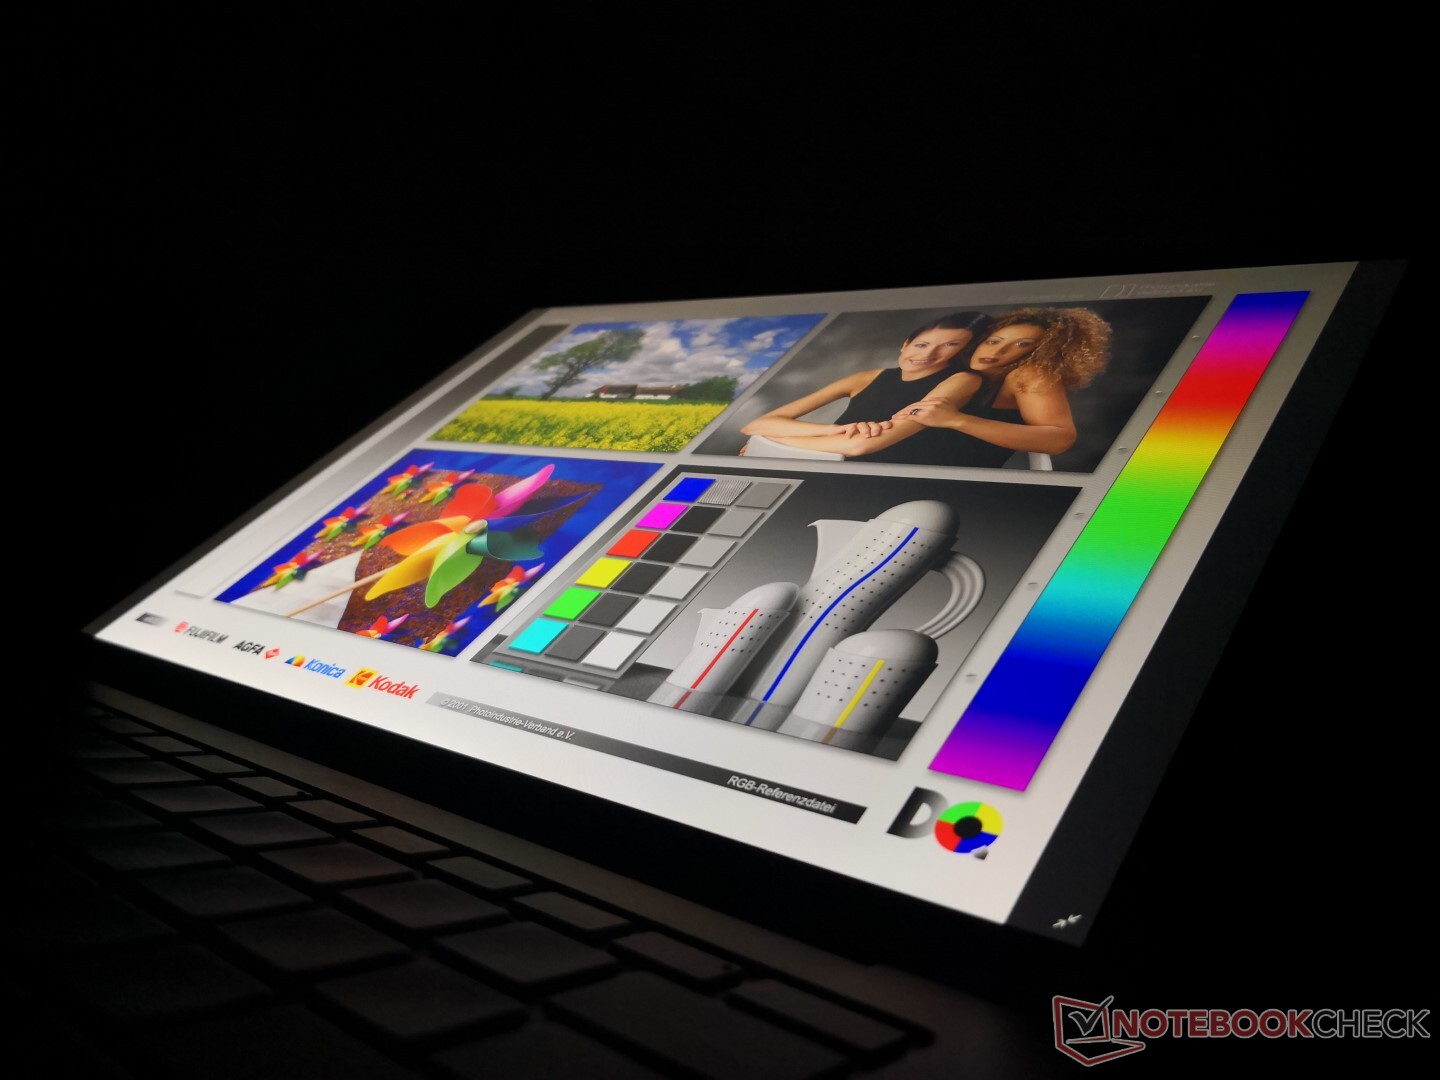
Viewing angles are excellent with just minimal contrast and color degradation if viewing from extreme angles. Interestingly, picture quality appears to be more stable for longer when compared to most other IPS panels. It's too bad that the Surface Laptop is not a convertible as this display would have also been excellent as a tablet.
Performance
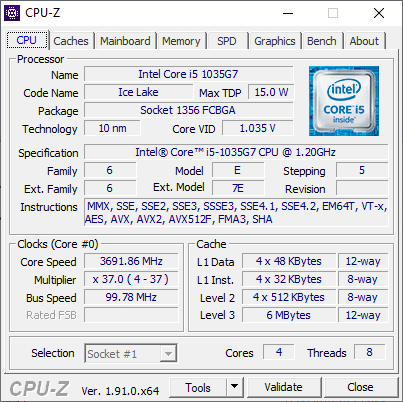
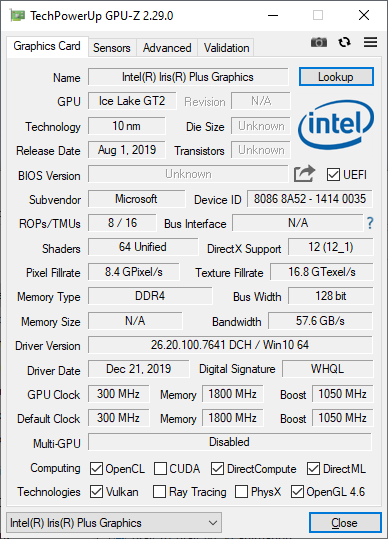
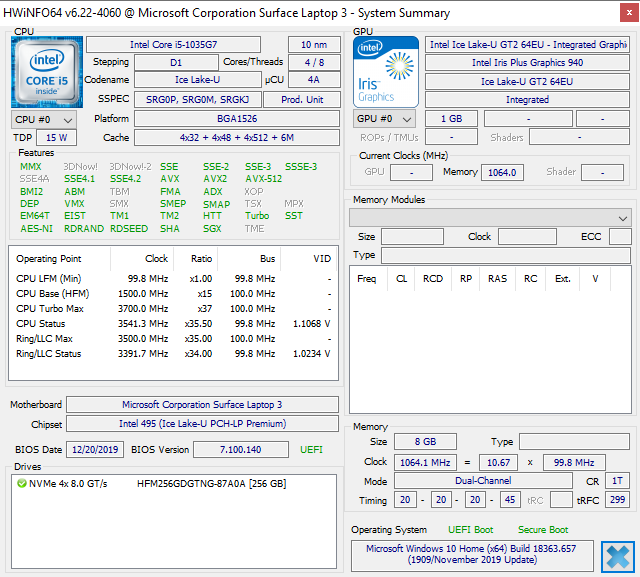
All 13.5-inch Surface Laptop 3 SKUs at the moment come with either the Intel quad-core Core i5-1035G7 or Core i7-1065G7 CPU. It's interesting to see Microsoft opt for the 10 nm Ice Lake parts instead of the faster 14 nm hexa-core Comet Lake-U parts, but we're guessing Microsoft probably preferred the faster graphics potential of the Ice Lake Iris Plus GPU especially since the Surface Laptop offers no dedicated GeForce MX options
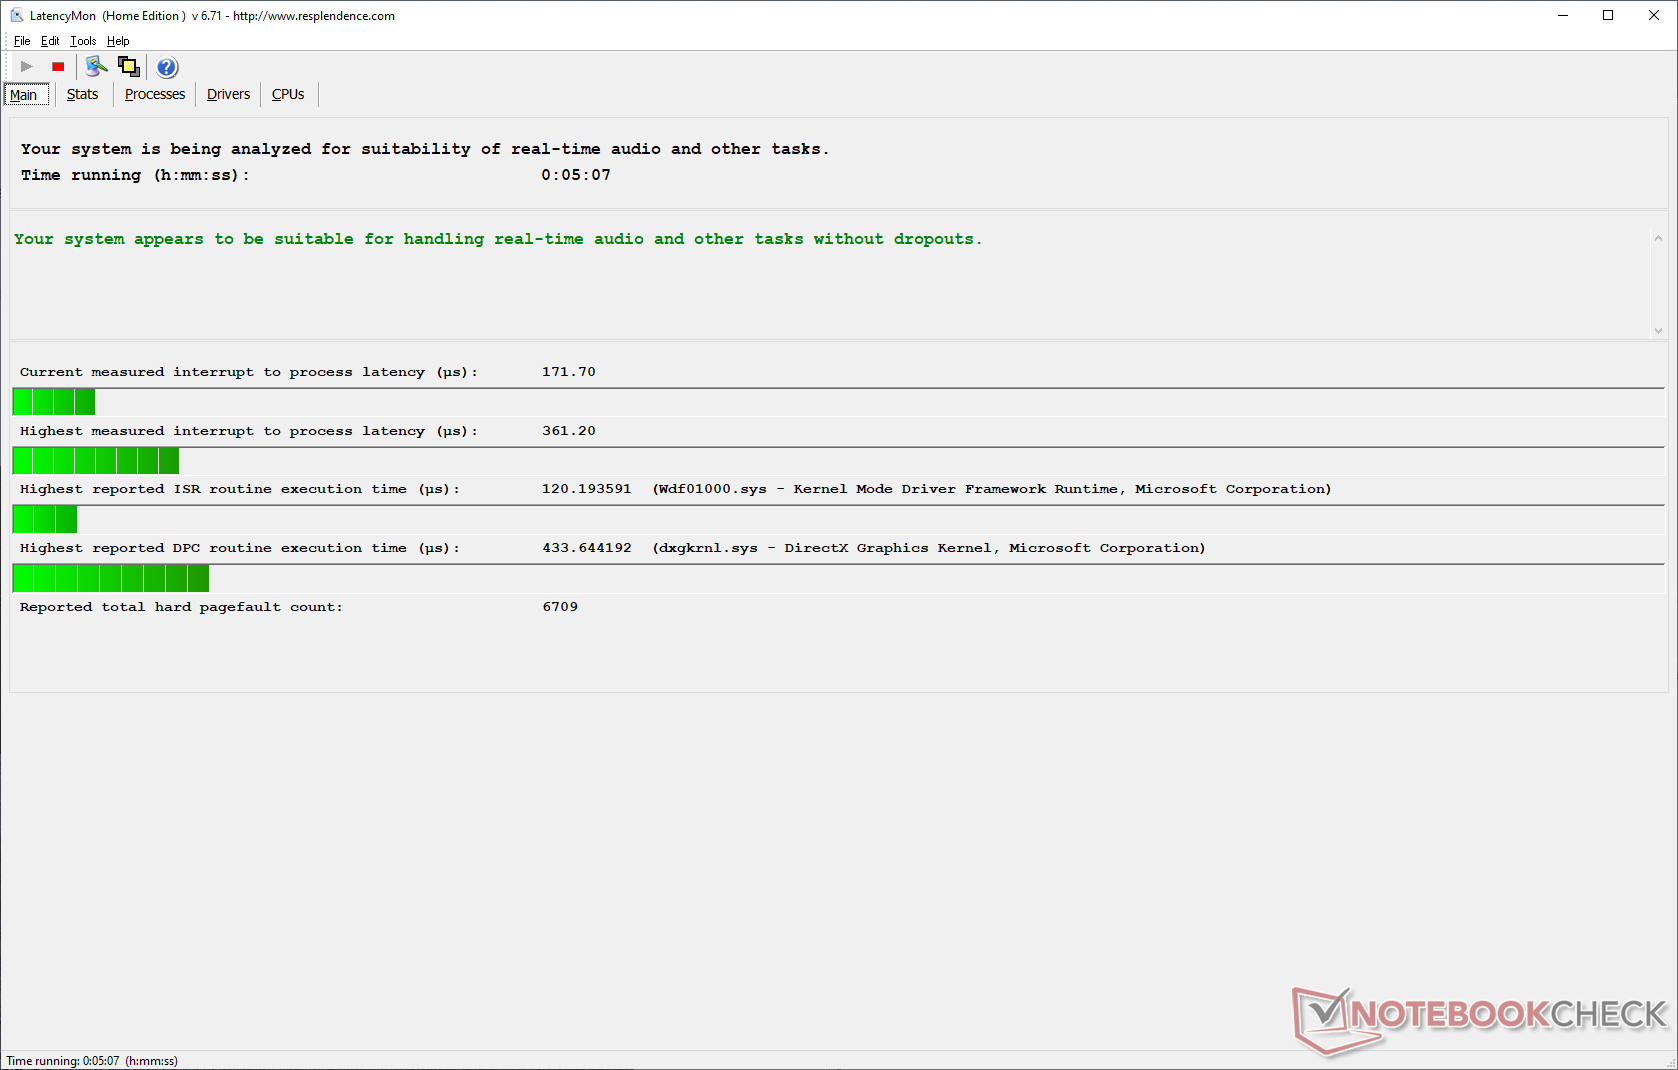
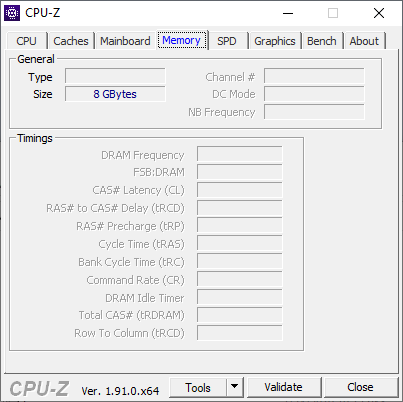
RAM is fixed at either 8 GB or 16 GB of soldered LPDDR4x. LatencyMon shows no recurring DPC latency issues even if the wireless is enabled.

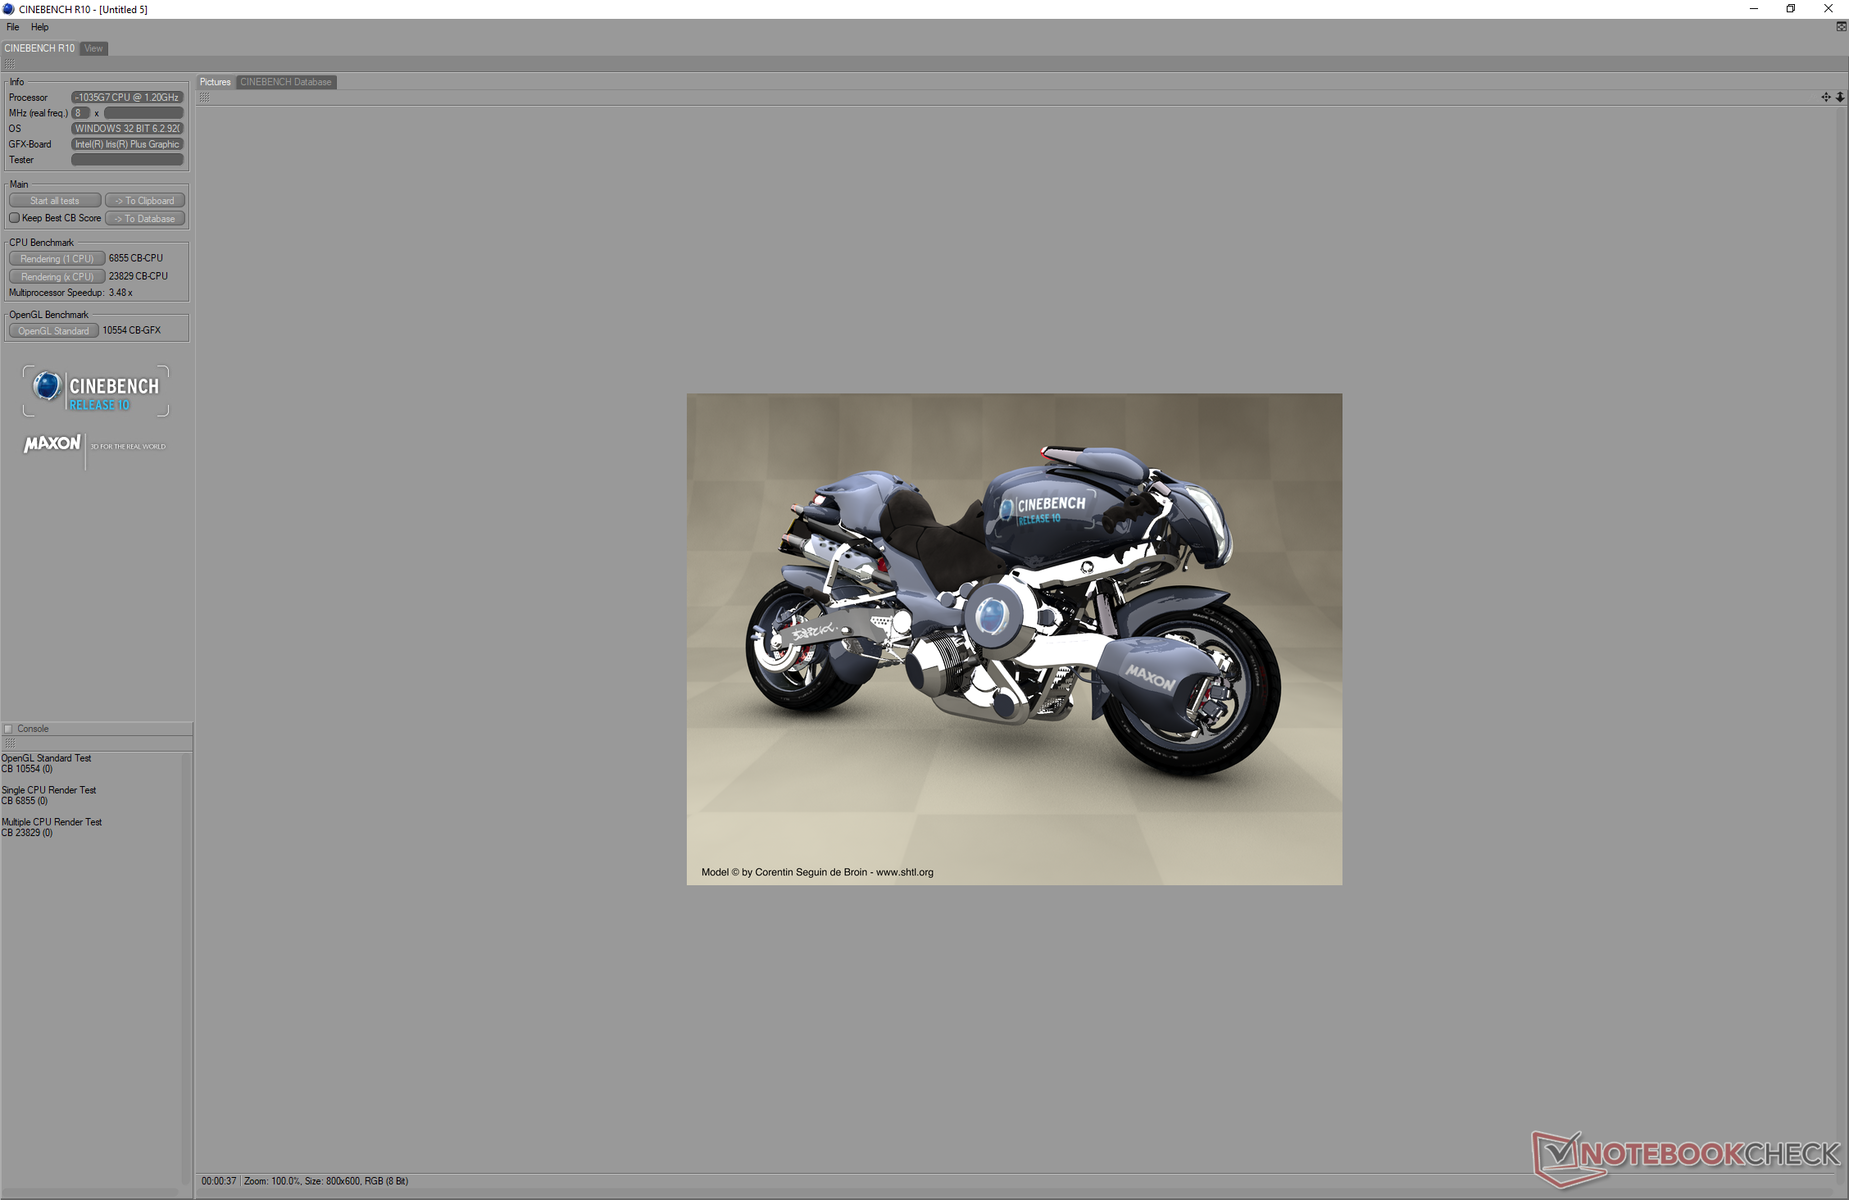
Processor
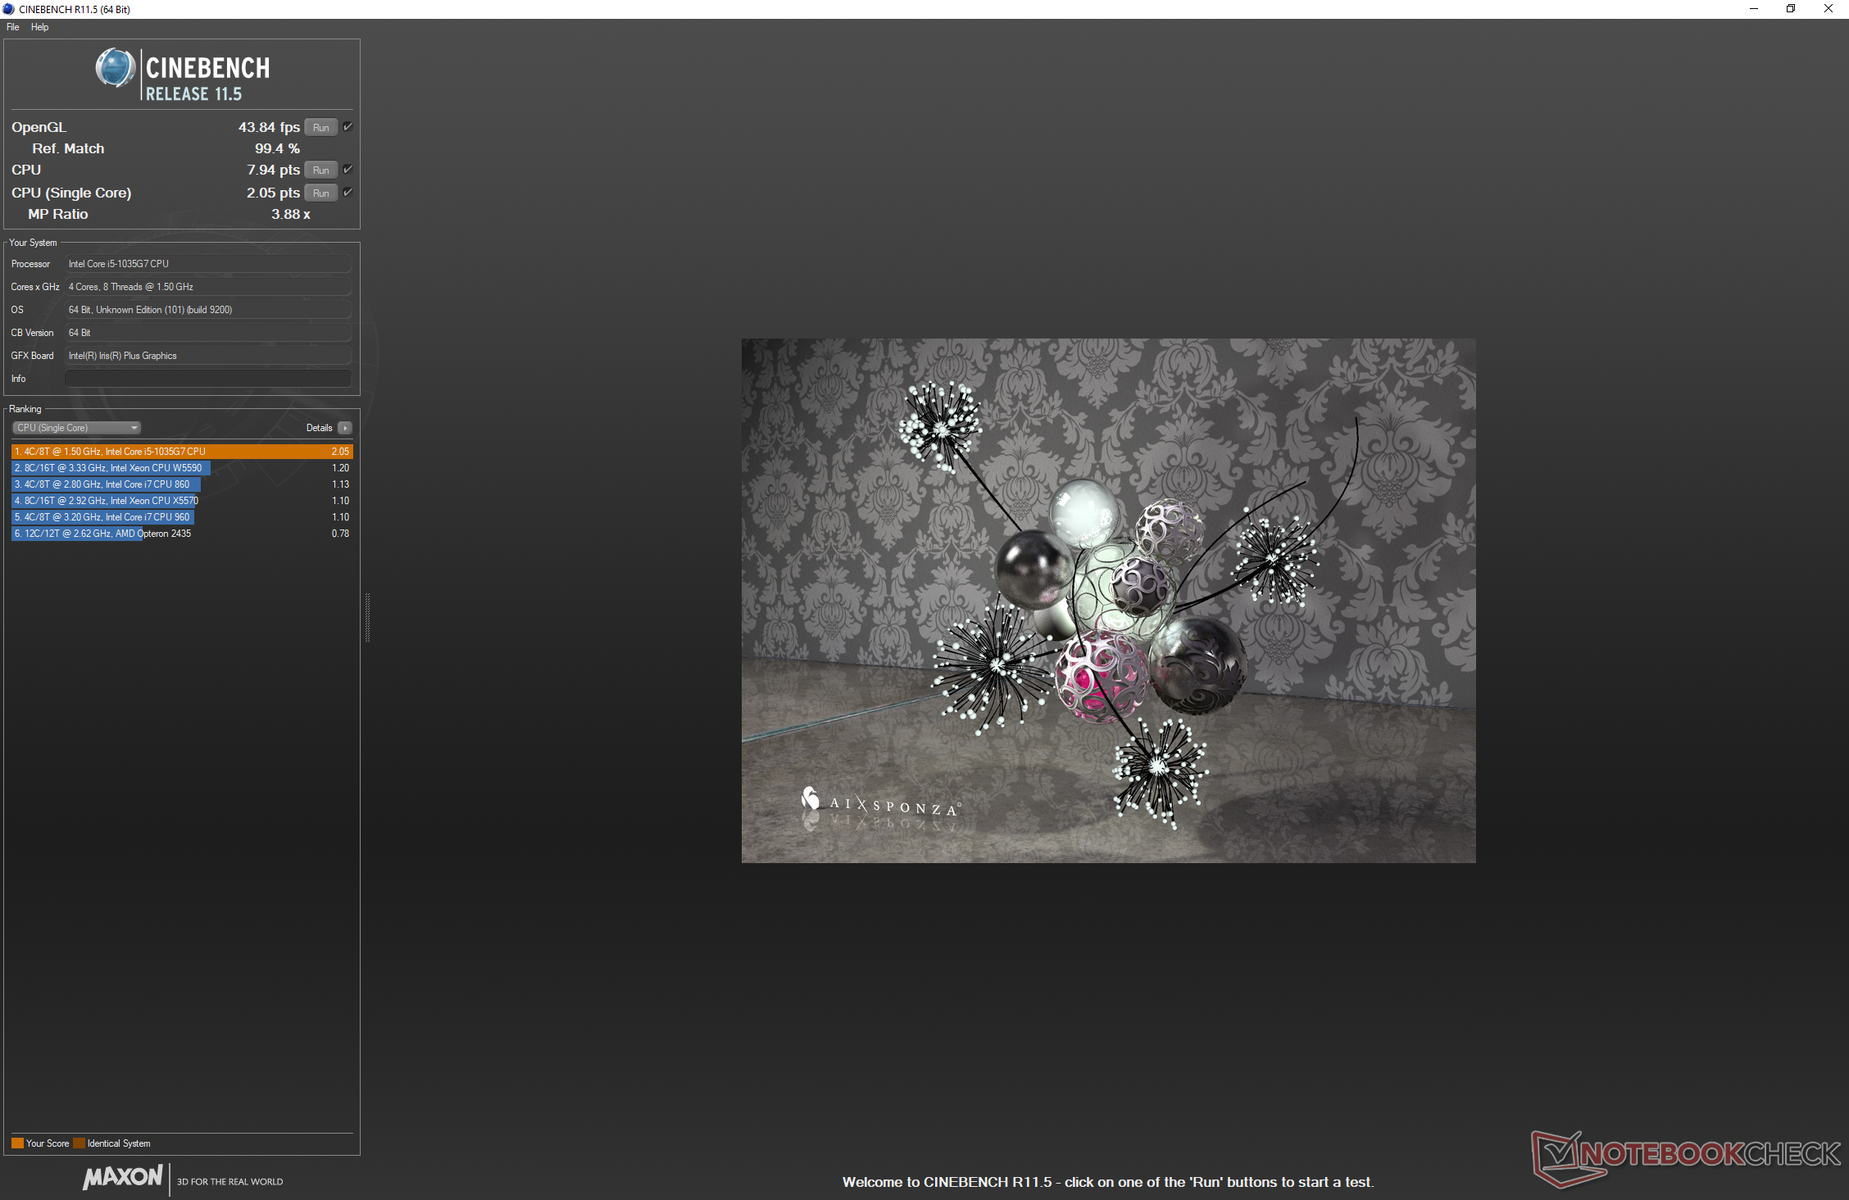
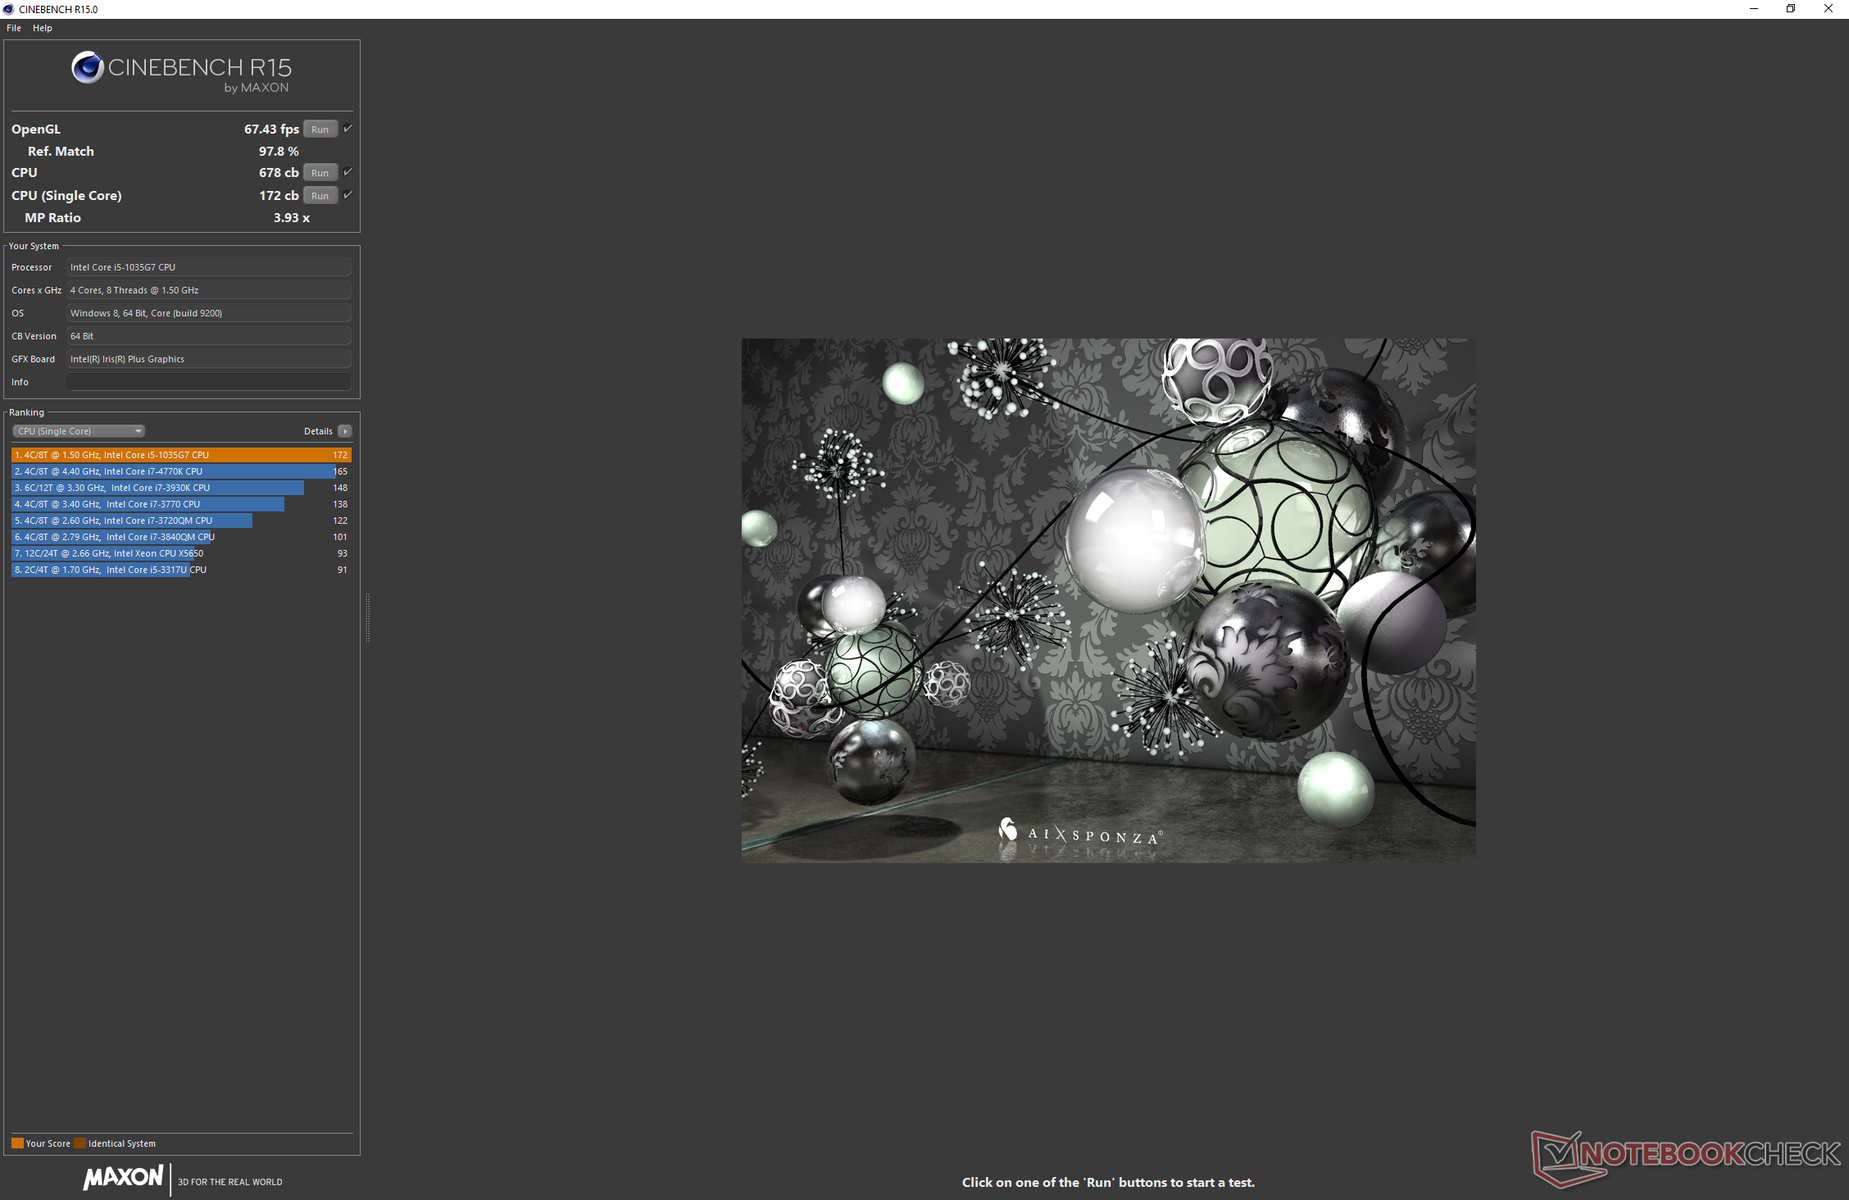
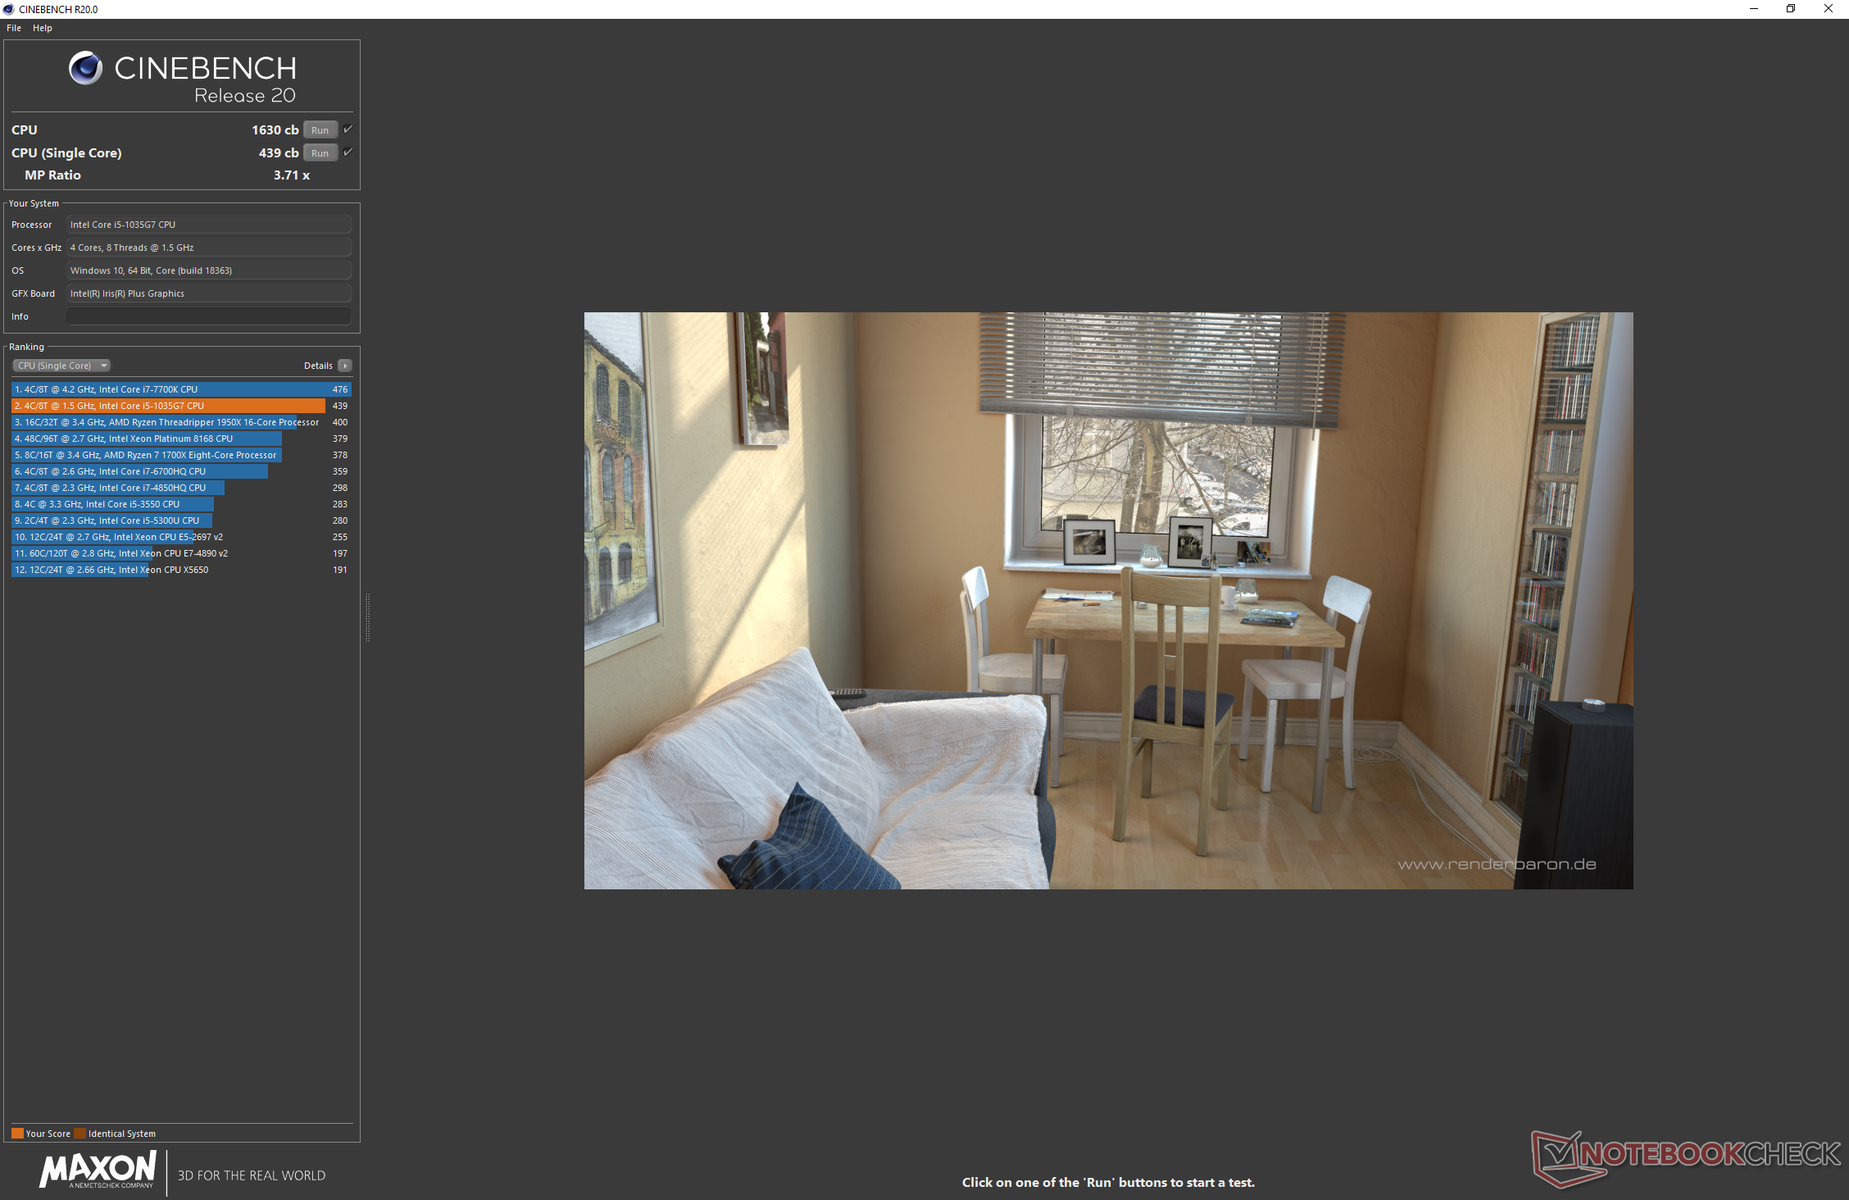
CPU performance is faster than the Core i5-1035G4 in the Surface Pro 7 tablet due to better Turbo Boost sustainability in the Surface Laptop even though both have nearly identical base clock rates (1.1 GHz vs. 1.2 GHz). CineBench R20, for example, is 16 percent higher on the Surface Laptop. Even so, Turbo Boost sustainability could have been better. When running CineBench R15 Multi-Thread in a loop as shown below, the initial score of 738 points drops to ~655 points by the second loop to represent a performance dip of 11 percent. This drops even further over time to ~592 points for an overall dip of 20 percent.
Raw processor performance is comparable to the Comet Lake-U Core i5-10210U while being faster than the Ryzen 5 3580U in the larger 15-inch Surface Laptop 3 by 25 percent in single-threaded workloads.
The highest-end Core i7-1065G7 configuration offers about 10 percent faster CPU performance over the Core i5-1035G7. See our dedicated page on the Core i5-1035G7 for more technical information and benchmark comparisons.
* ... smaller is better
System Performance
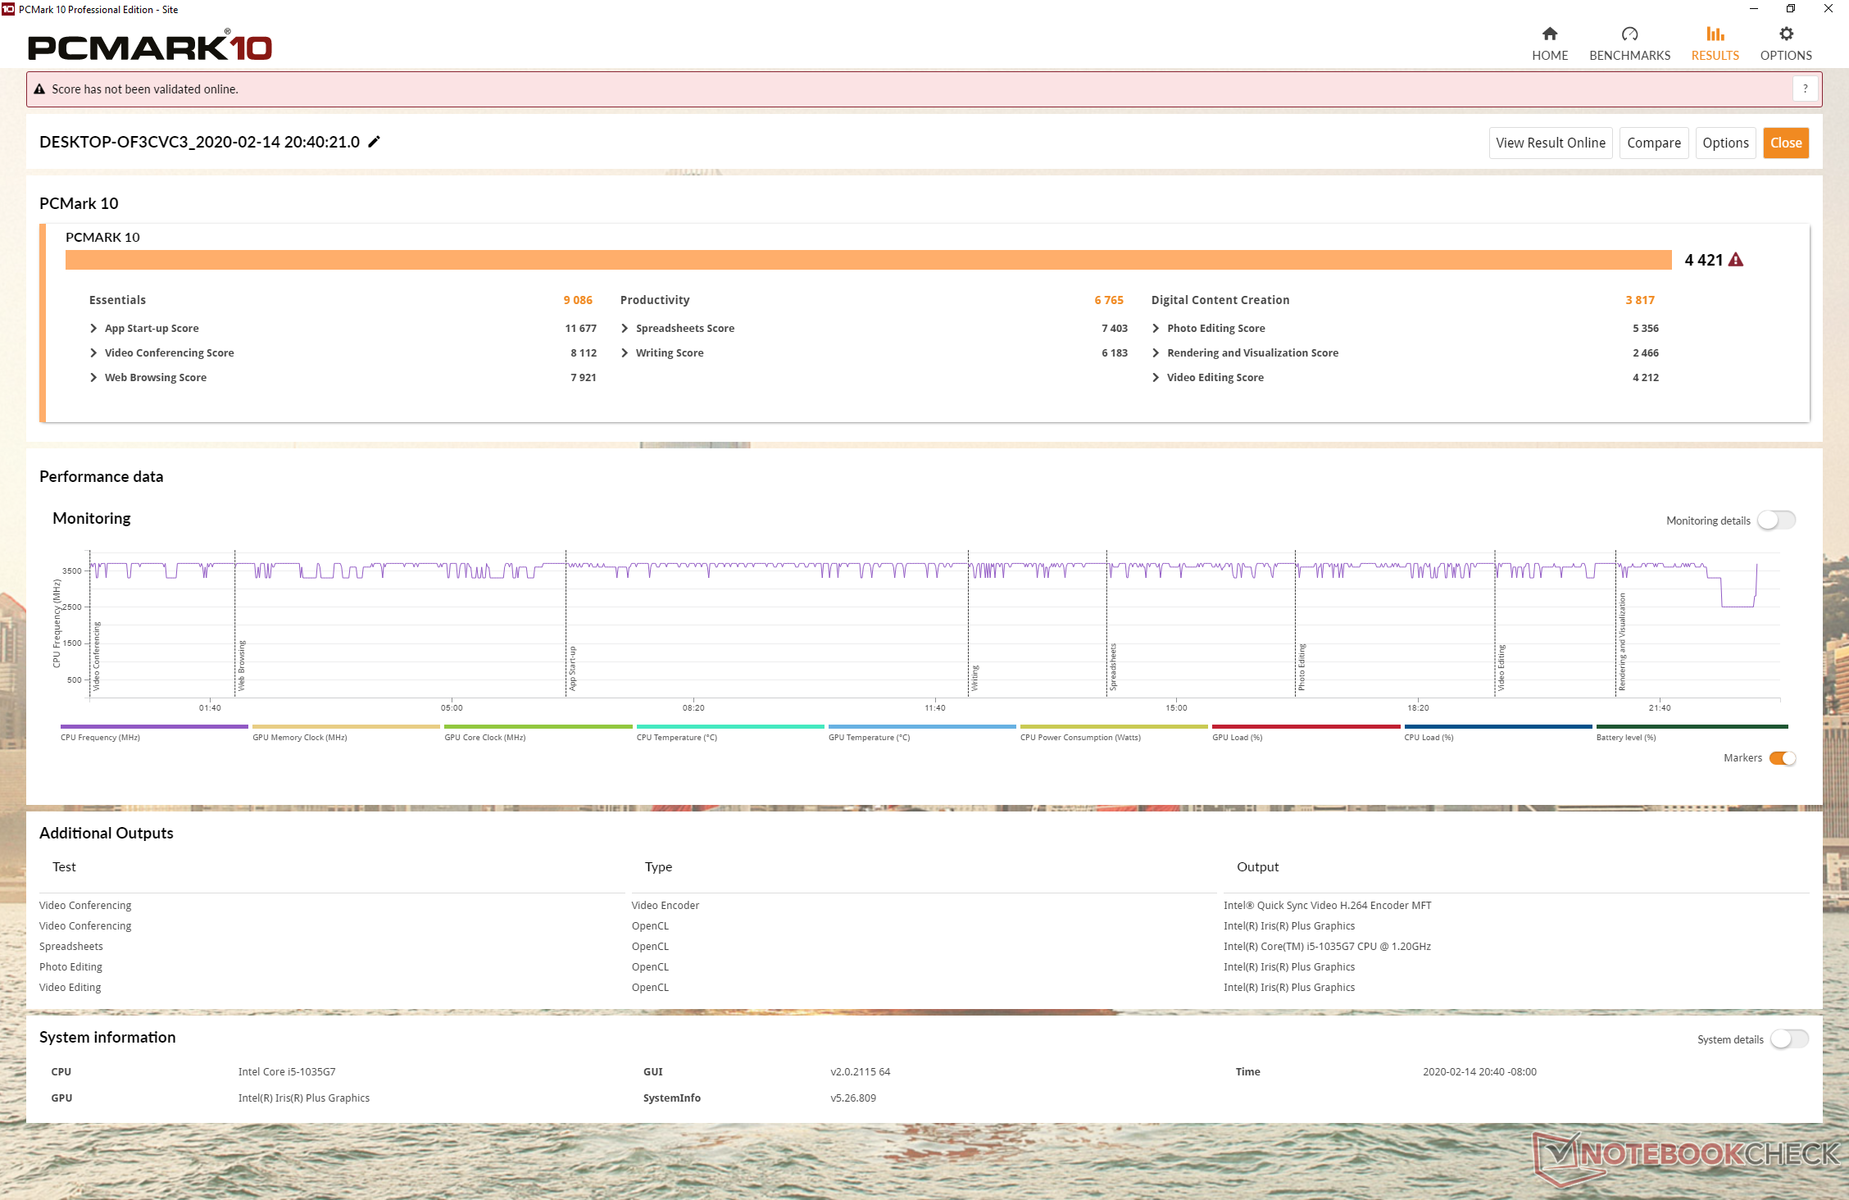
PCMark benchmarks sit firmly in between the Dell XPS 13 2-in-1 with the Core i7-1065G7 and the least expensive 15-inch Surface Laptop 3 SKU equipped with the Ryzen 5 3580U. The clean barebones feel and lack of any bloatware on the Surface series are definite pluses when compared to Ultrabooks from Lenovo, HP, or Dell.
We experienced no software issues during our time with the test unit. We appreciate the bloat-free experience of Surface devices when compared to more typical Ultrabooks.
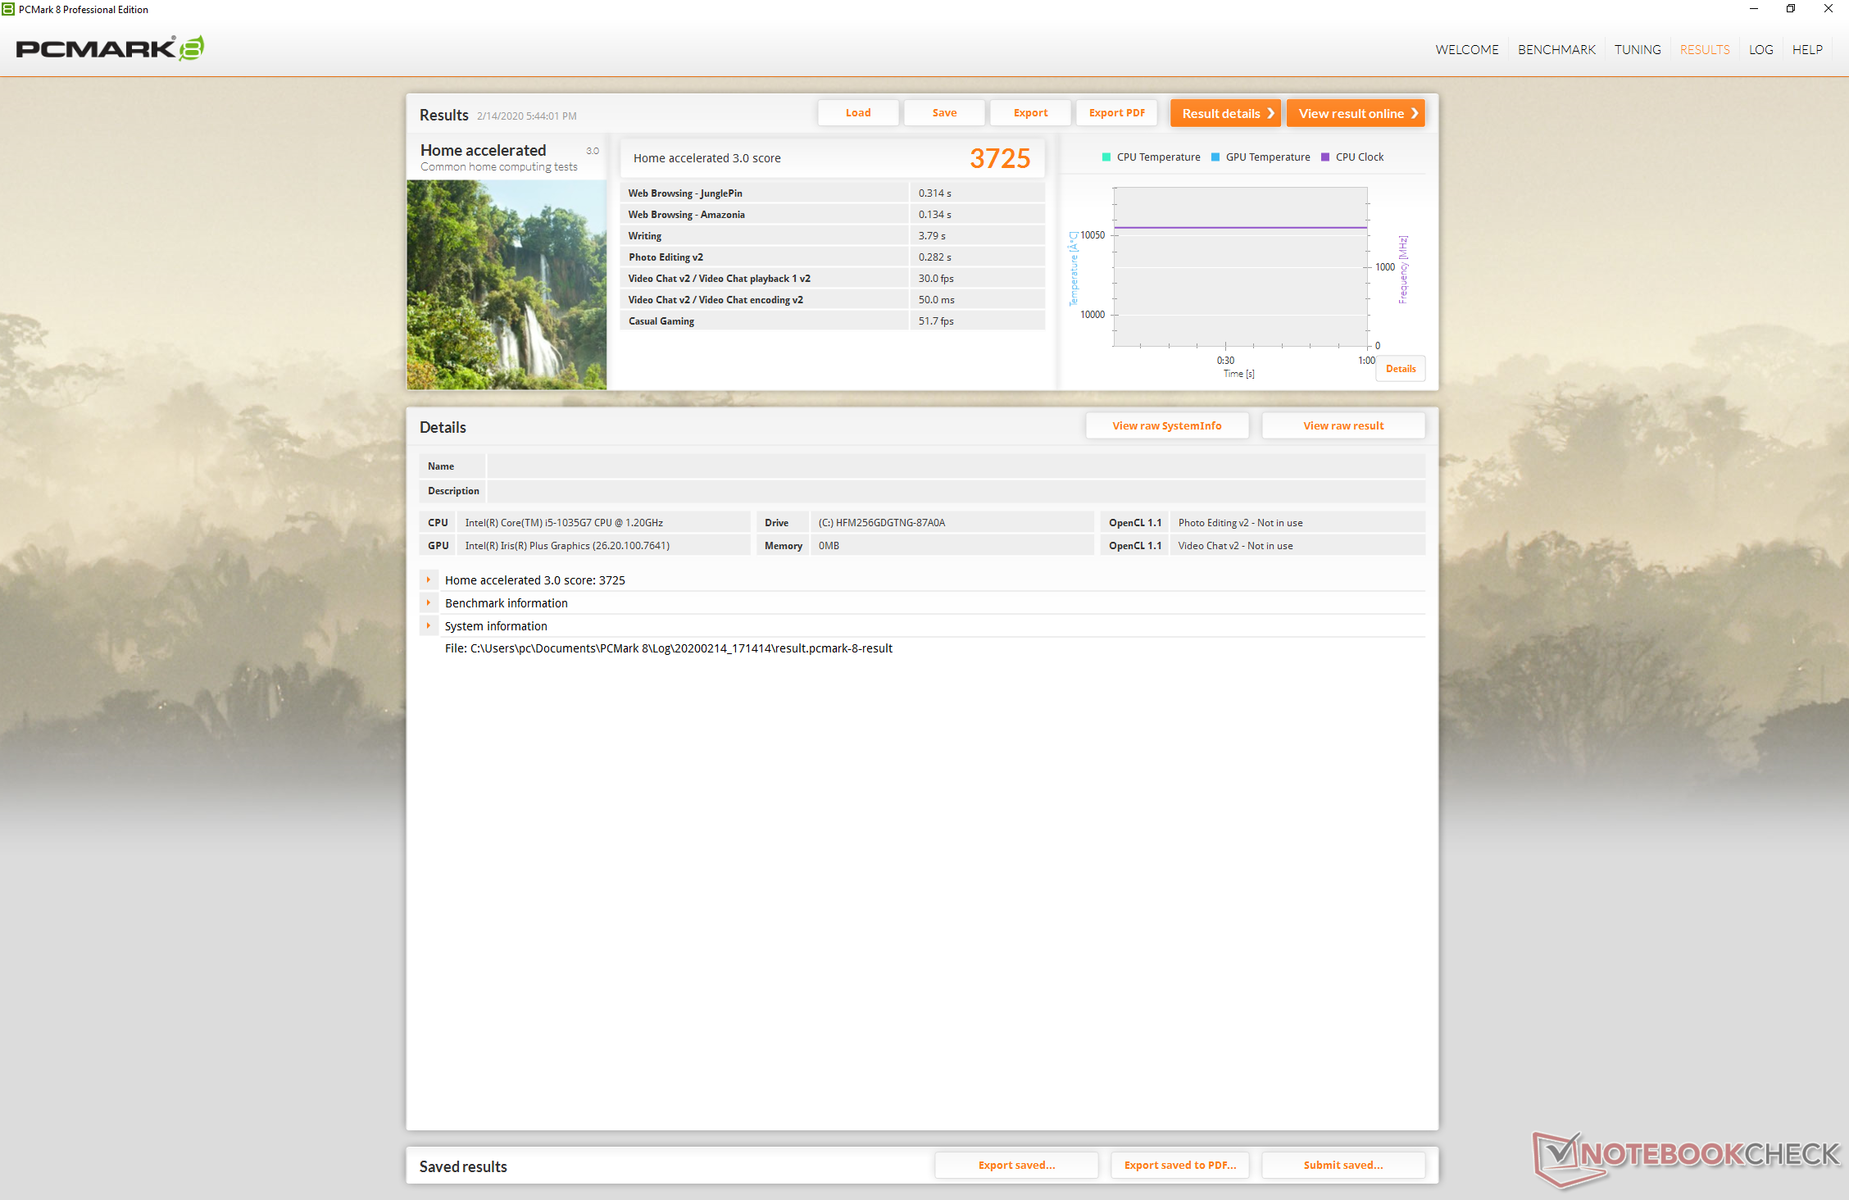
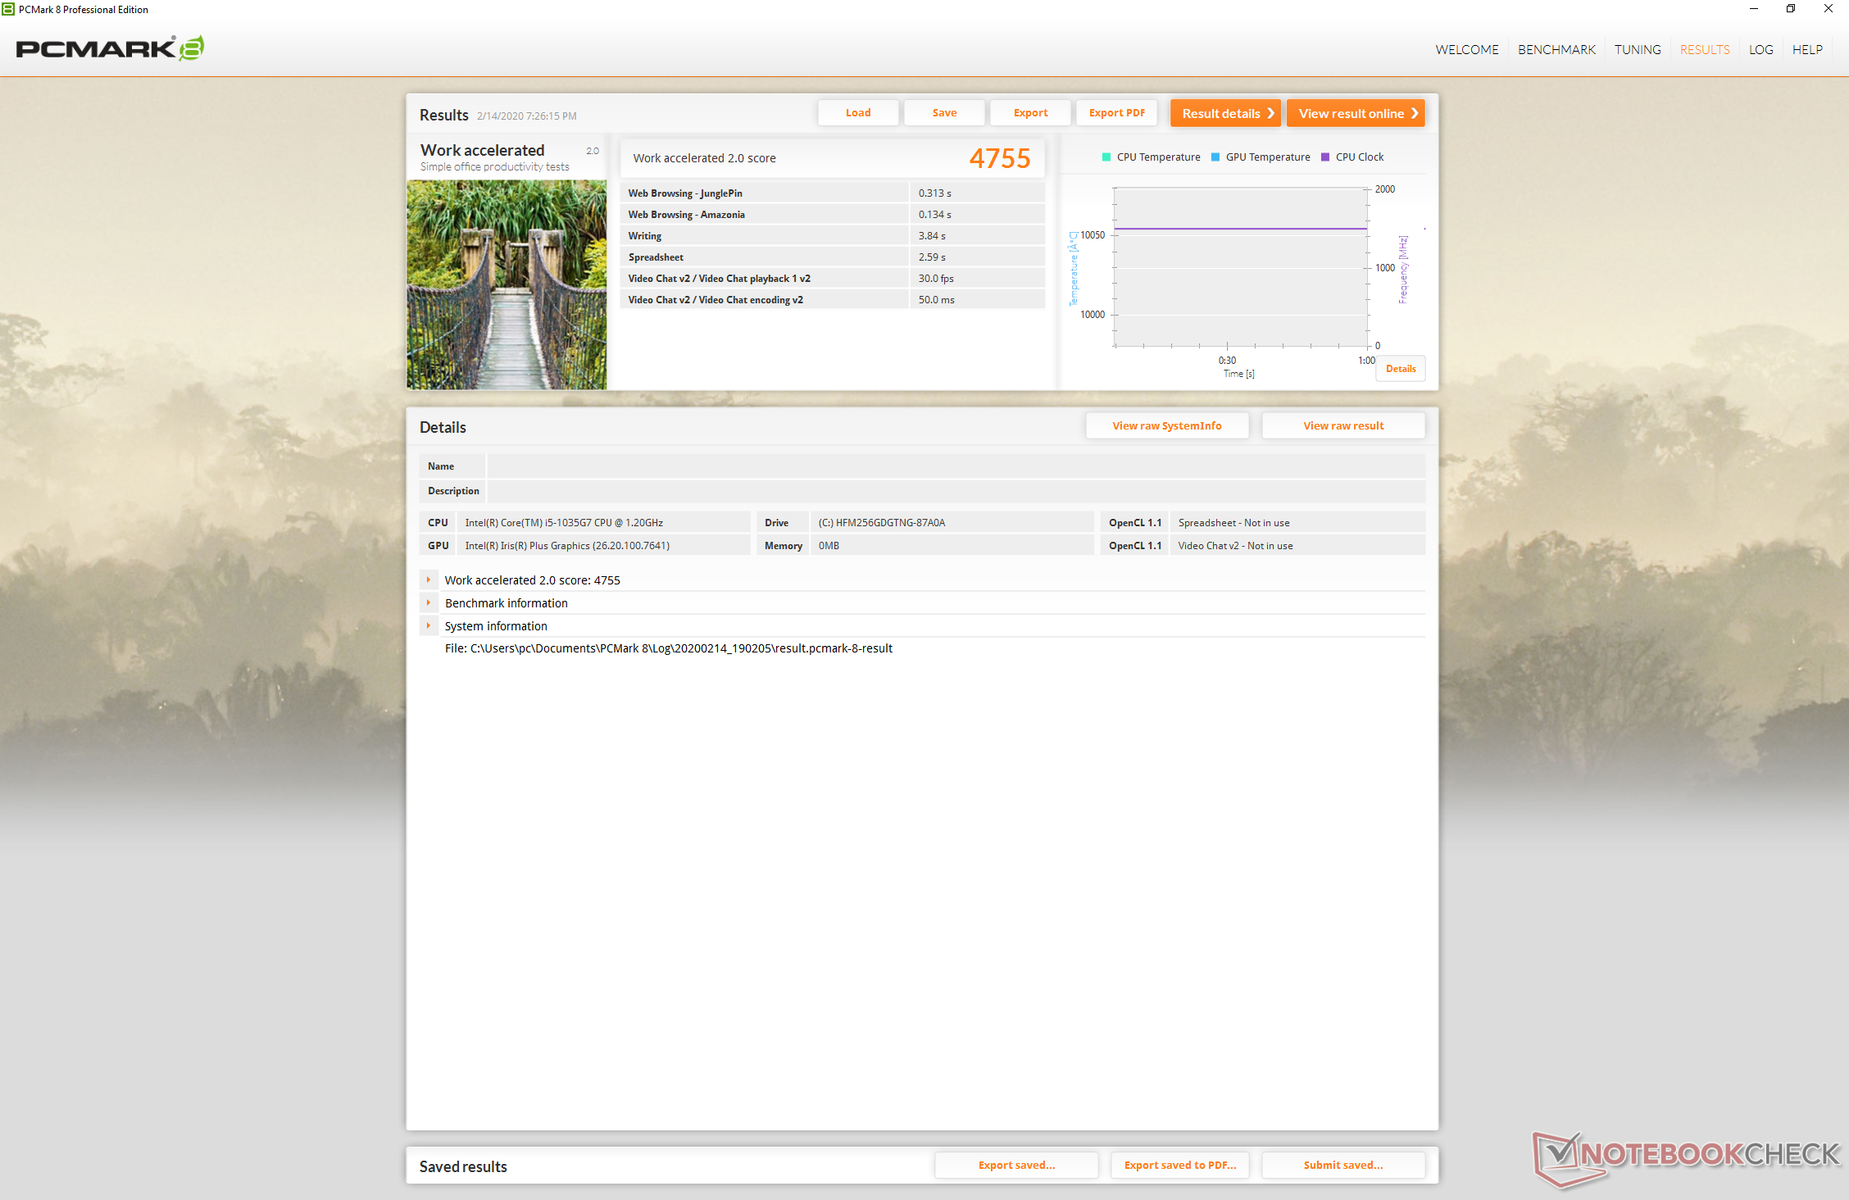
| PCMark 8 Home Score Accelerated v2 | 3725 points | |
| PCMark 8 Work Score Accelerated v2 | 4755 points | |
| PCMark 10 Score | 4421 points | |
Help | ||
Storage Devices
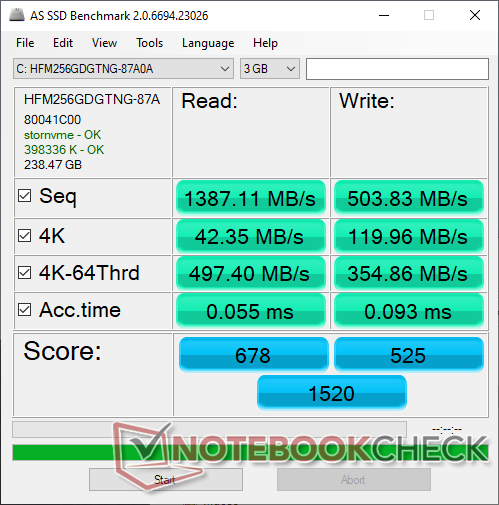
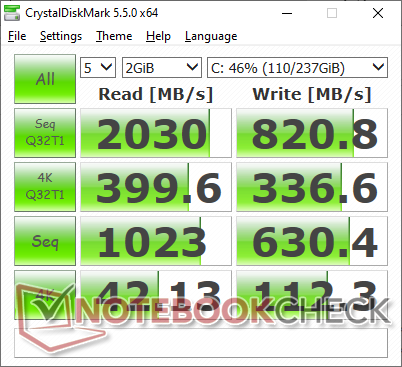
Microsoft has equipped the exact same 256 GB SK Hynix BC501 HFM256GDGTNG drive as found on the least expensive Surface Laptop 3 15 for our Surface Laptop 3 13.5. Thus, drive performance is essentially identical between the two Surface Laptop 3 SKUs. The SK Hynix BC501 is a budget NVMe drive as exemplified by the relatively slow sequential read and write rates of around 1400 MB/s and 500 MB/s, respectively, compared to ~2500 MB/s on the pricier Samsung PM981 series. Costlier Surface Laptop configurations may come with faster Toshiba drives instead, but it is difficult confirm prior to purchasing.
See our table of SSDs and HDDs for more benchmark comparisons.
| Microsoft Surface Laptop 3 13 Core i5-1035G7 SK hynix BC501 HFM256GDGTNG | Apple MacBook Pro 13 2019 2TB3 Apple SSD AP0256 | Huawei Matebook X Pro i5 Samsung PM961 MZVLW256HEHP | Microsoft Surface Laptop 2-LQN-00004 SK Hynix BC501 NVMe 256 GB | Dell XPS 13 7390 2-in-1 Core i7 Toshiba BG4 KBG40ZPZ512G | |
|---|---|---|---|---|---|
| AS SSD | -33% | 44% | 3% | 8% | |
| Seq Read (MB/s) | 1387 | 974 -30% | 2416 74% | 826 -40% | 1801 30% |
| Seq Write (MB/s) | 504 | 1340 166% | 1170 132% | 555 10% | 1125 123% |
| 4K Read (MB/s) | 42.35 | 11.35 -73% | 48.33 14% | 33.39 -21% | 39.7 -6% |
| 4K Write (MB/s) | 120 | 15.95 -87% | 103.1 -14% | 95.3 -21% | 67 -44% |
| 4K-64 Read (MB/s) | 497.4 | 643 29% | 1039 109% | 447 -10% | 1253 152% |
| 4K-64 Write (MB/s) | 354.9 | 163 -54% | 399.6 13% | 370.4 4% | 209 -41% |
| Access Time Read * (ms) | 0.055 | 0.316 -475% | 0.058 -5% | 0.048 13% | 0.069 -25% |
| Access Time Write * (ms) | 0.093 | 0.258 -177% | 0.036 61% | 0.048 48% | 0.625 -572% |
| Score Read (Points) | 678 | 752 11% | 1329 96% | 563 -17% | 1472 117% |
| Score Write (Points) | 525 | 313 -40% | 620 18% | 521 -1% | 388 -26% |
| Score Total (Points) | 1520 | 1465 -4% | 2575 69% | 1369 -10% | 2583 70% |
| Copy ISO MB/s (MB/s) | 764 | 1404 84% | 739 -3% | 755 -1% | 1293 69% |
| Copy Program MB/s (MB/s) | 256.1 | 406.9 59% | 312.3 22% | 325.1 27% | 560 119% |
| Copy Game MB/s (MB/s) | 368.4 | 850 131% | 486.3 32% | 577 57% | 927 152% |
| CrystalDiskMark 5.2 / 6 | 16% | -11% | 36% | ||
| Write 4K (MB/s) | 112.3 | 116.5 4% | 87.3 -22% | 106.7 -5% | |
| Read 4K (MB/s) | 42.13 | 42.18 0% | 36.52 -13% | 49.94 19% | |
| Write Seq (MB/s) | 630 | 1079 71% | 716 14% | 1223 94% | |
| Read Seq (MB/s) | 1023 | 1030 1% | 1009 -1% | 1801 76% | |
| Write 4K Q32T1 (MB/s) | 336.6 | 225.7 -33% | 324.1 -4% | 325.3 -3% | |
| Read 4K Q32T1 (MB/s) | 399.6 | 302.9 -24% | 249 -38% | 551 38% | |
| Write Seq Q32T1 (MB/s) | 821 | 1174 43% | 811 -1% | 1224 49% | |
| Read Seq Q32T1 (MB/s) | 2030 | 3394 67% | 1631 -20% | 2350 16% | |
| Total Average (Program / Settings) | -33% /
-33% | 30% /
34% | -4% /
-2% | 22% /
18% |
* ... smaller is better

GPU Performance
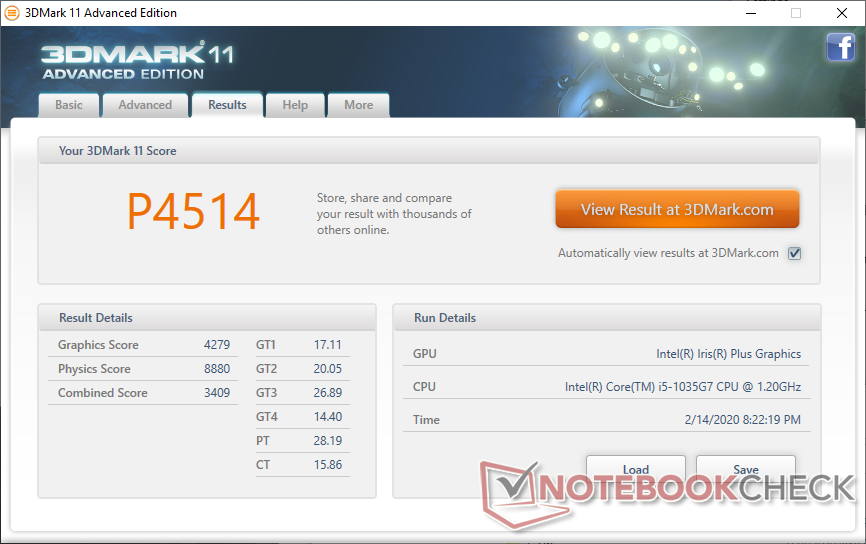
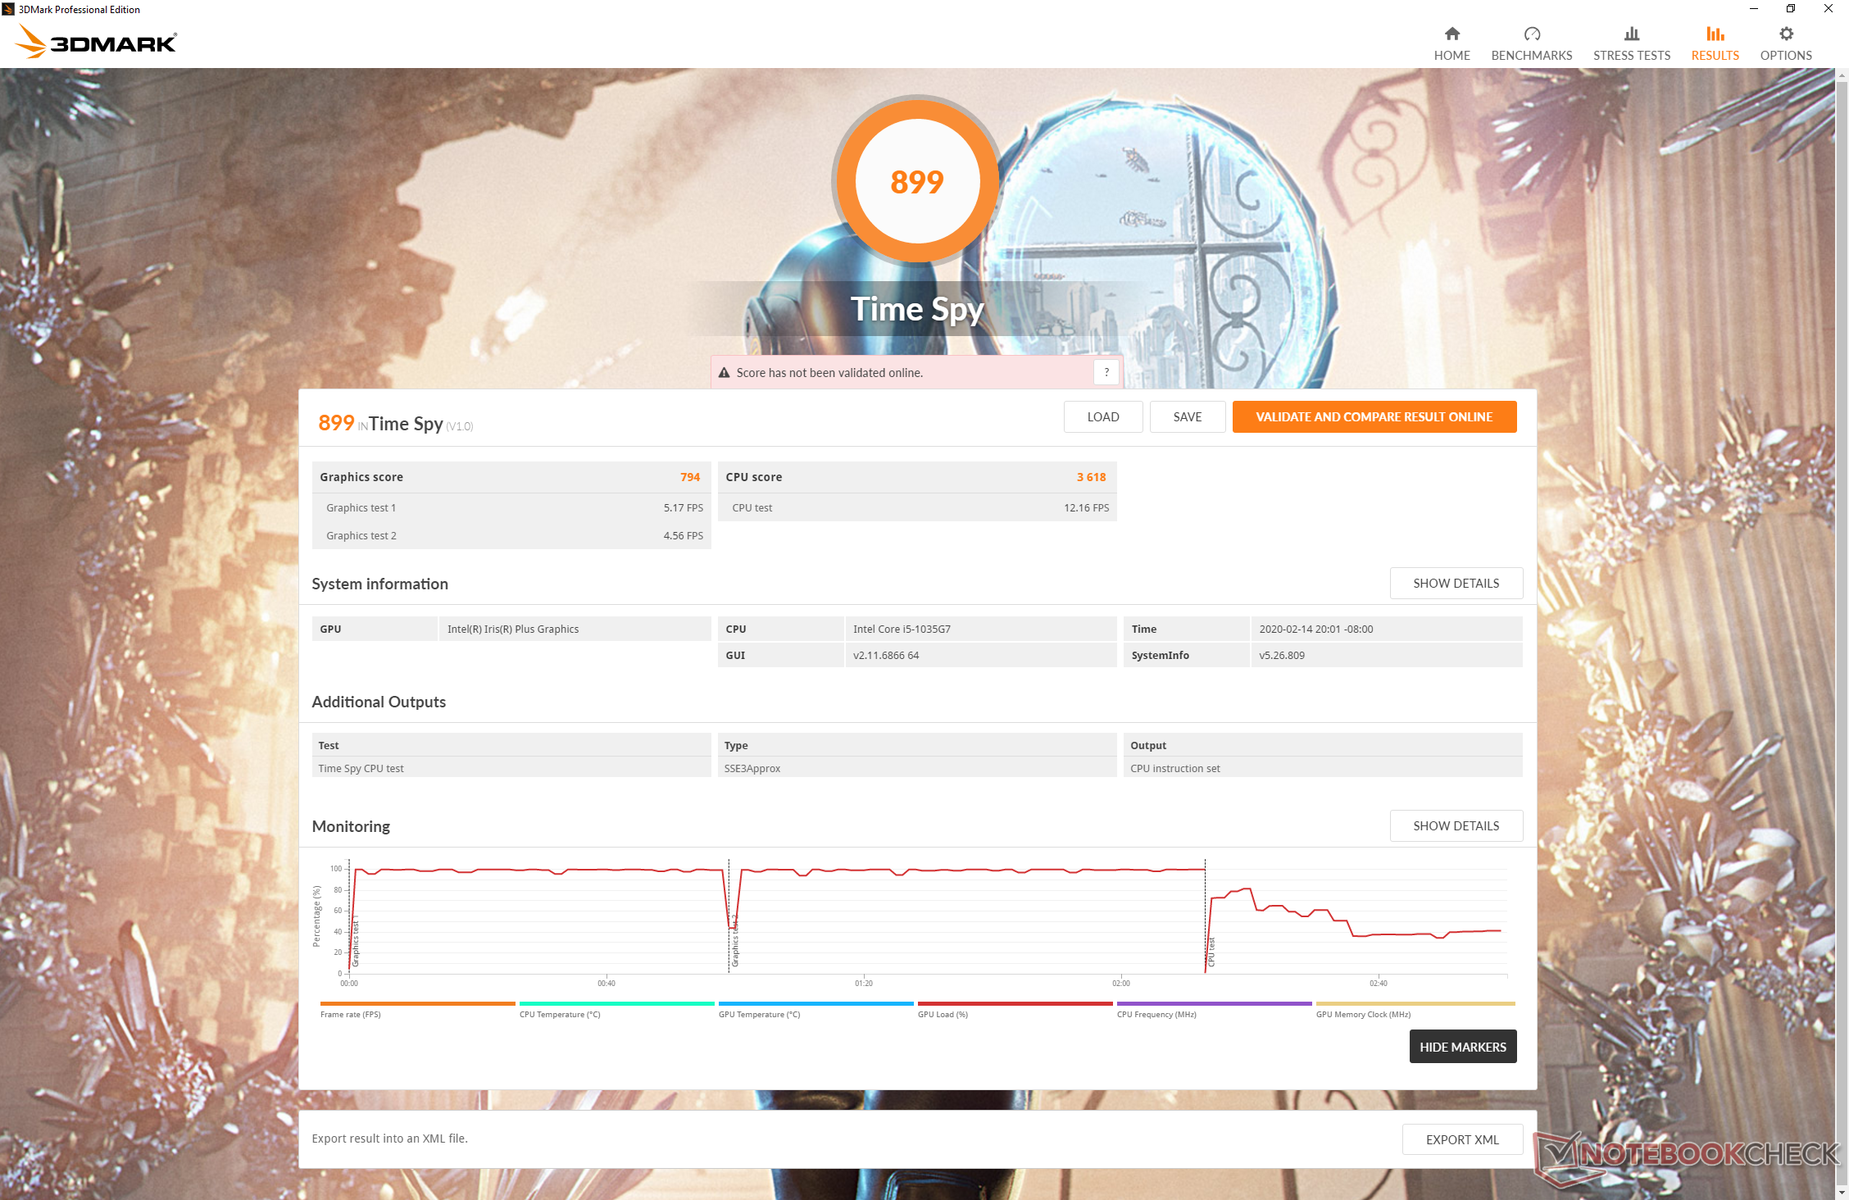
The Core i5-1035G7 may have the same integrated Iris Plus G7 GPU as the Core i7-1065G7, but overall performance in real-world games is not the same between them despite what the 3DMark benchmark results say. Rocket League, for example, returns consistently slower average frame rates than almost every other Iris Plus G7 laptops we've tested thus far. Meanwhile, more demanding games like Witcher 3 and Shadow of the Tomb Raider perform where we expect them to be. These mixed results suggest that the Core i5-1035G7 has issues maintaining very high frame rates on undemanding games with low settings. We suspect that the low TDP is a bottleneck to both the CPU and GPU portions of the chip when both are stressed.
Nonetheless, it's still possible to play most modern titles including Borderlands 3 albeit at only 720p with all settings reduced. See our dedicated page on the Iris Plus G7 GPU for more technical information and benchmark comparisons.
| 3DMark 06 Standard Score | 15227 points | |
| 3DMark Vantage P Result | 14442 points | |
| 3DMark 11 Performance | 4514 points | |
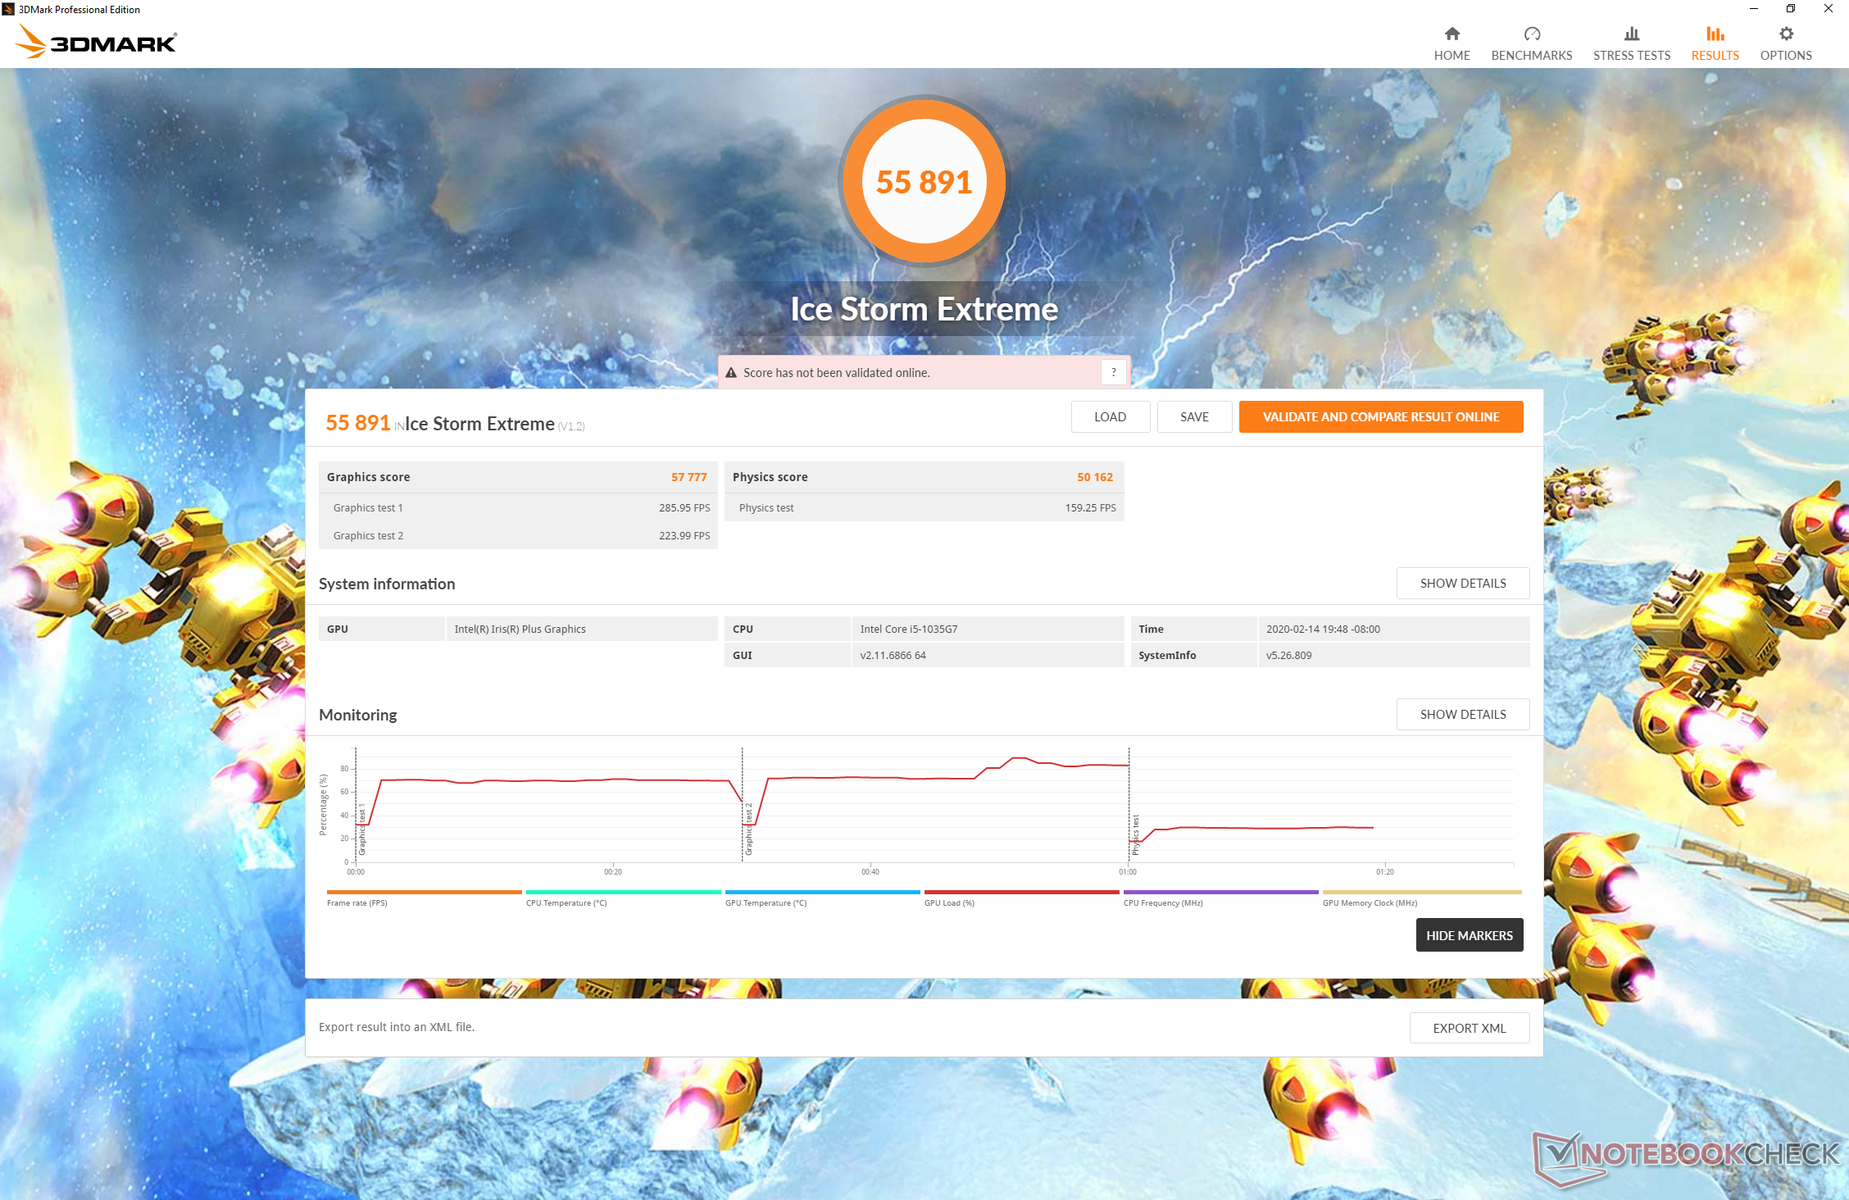
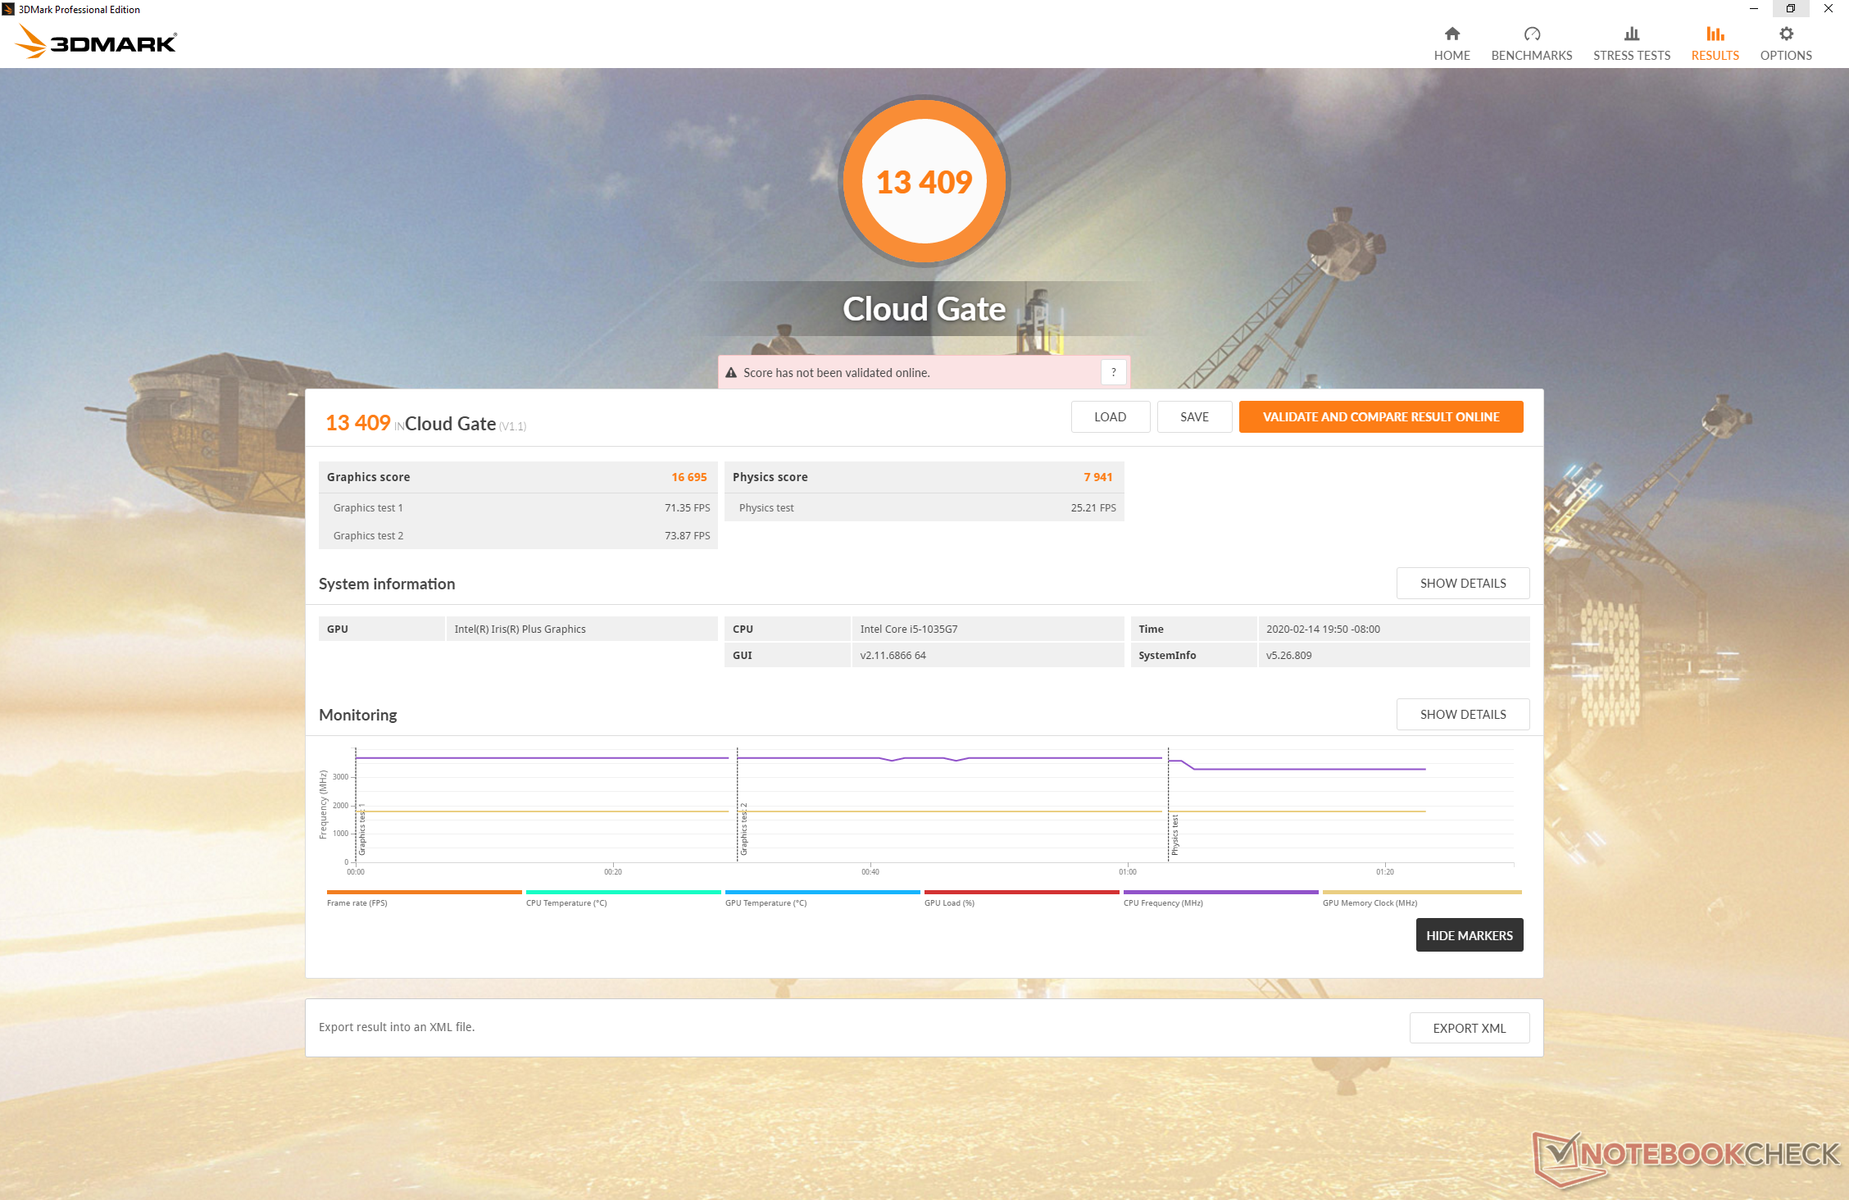
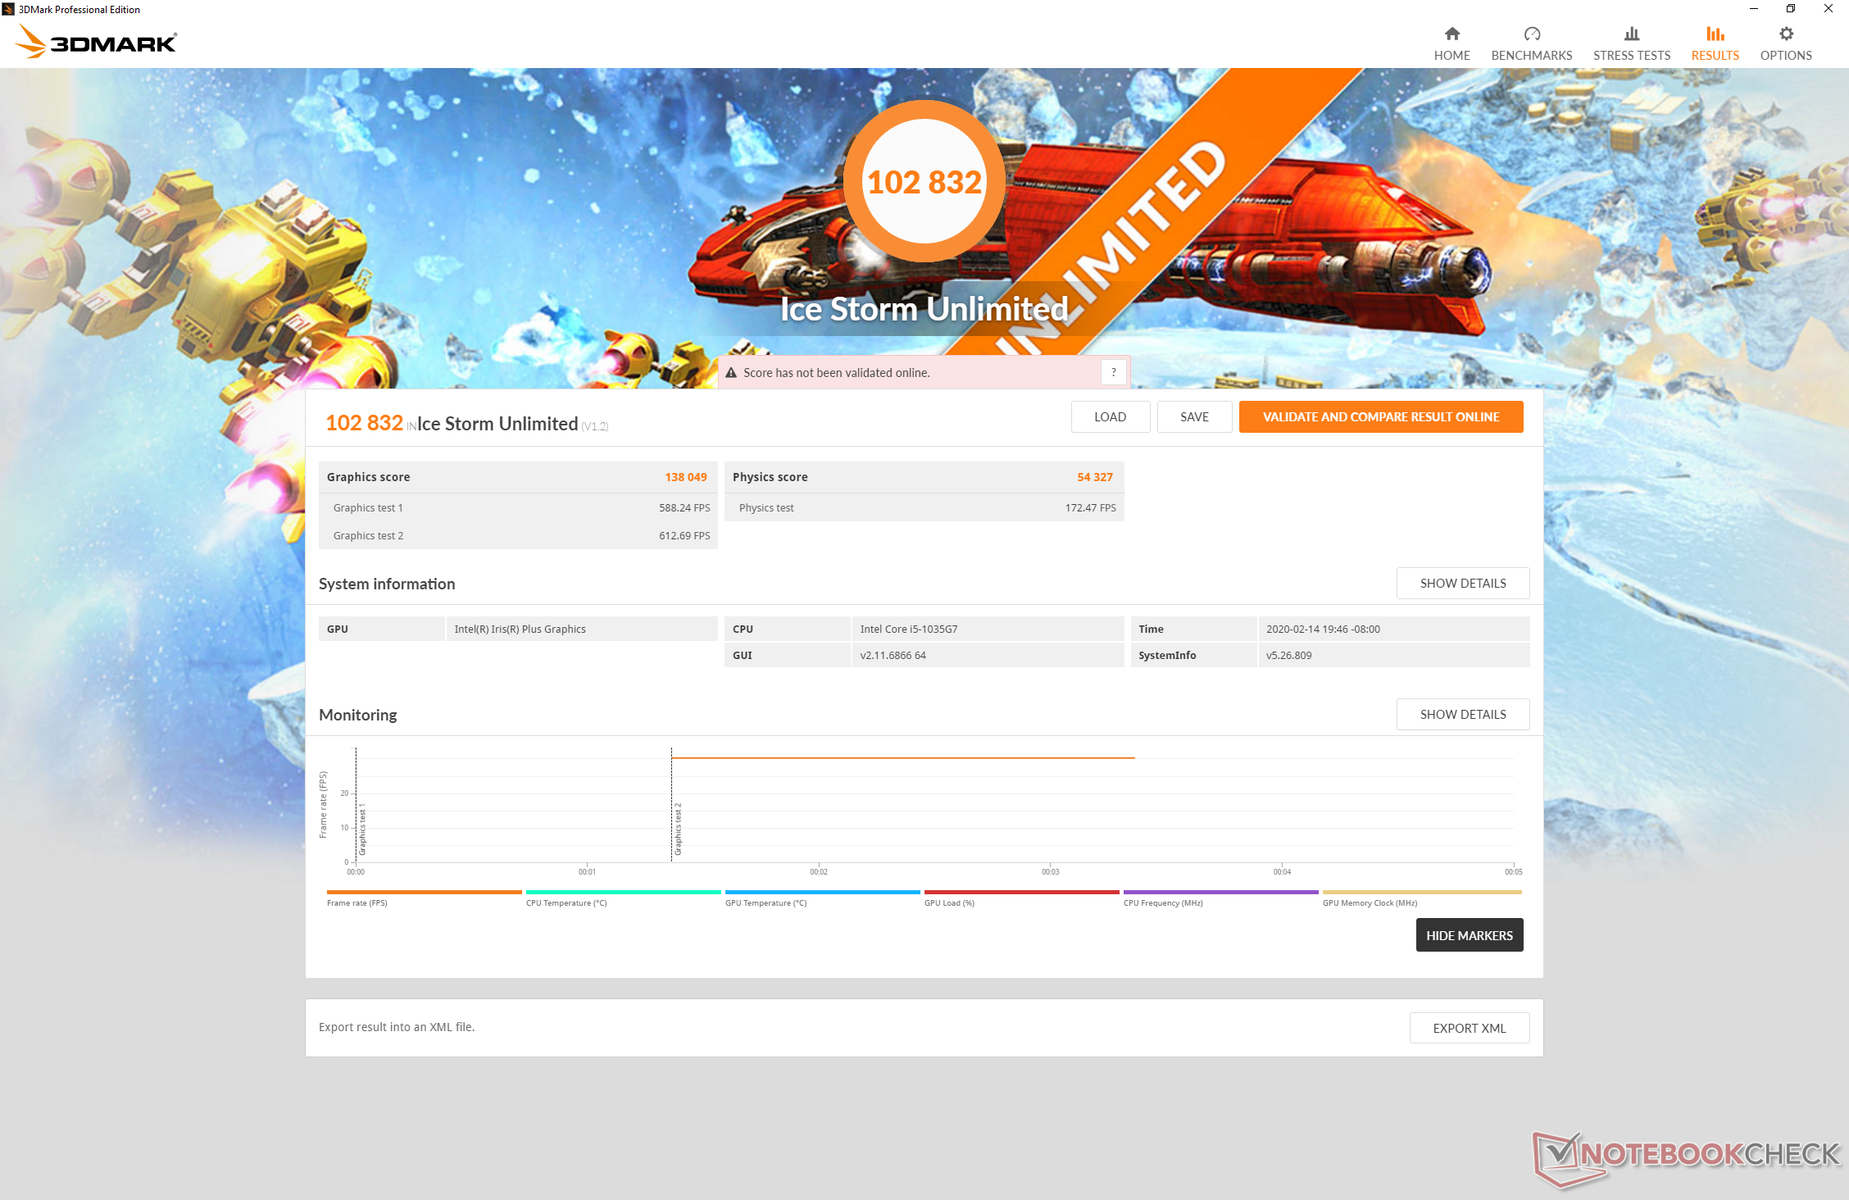
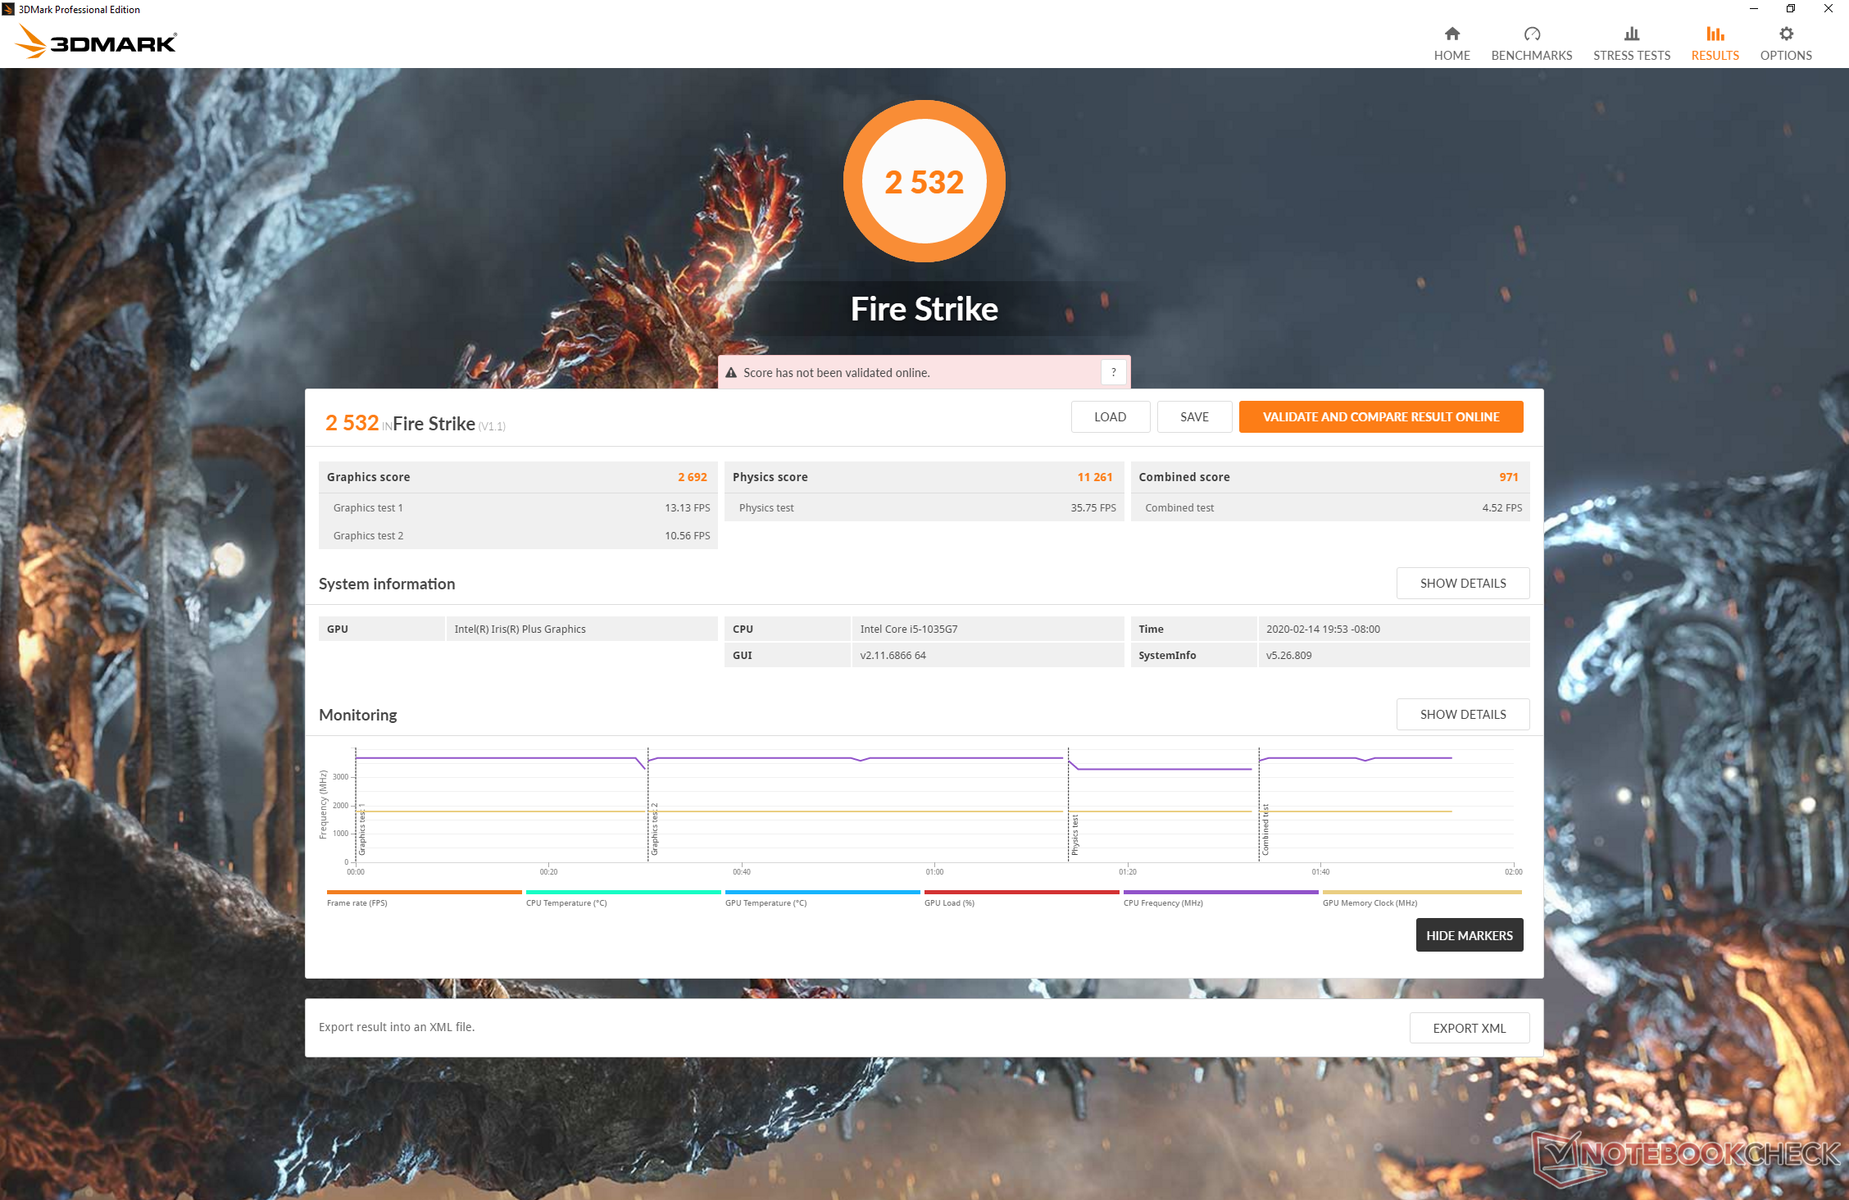
| 3DMark Ice Storm Standard Score | 66232 points | |
| 3DMark Cloud Gate Standard Score | 13409 points | |
| 3DMark Fire Strike Score | 2532 points | |
| 3DMark Time Spy Score | 899 points | |
Help | ||
| low | med. | high | ultra | |
|---|---|---|---|---|
| BioShock Infinite (2013) | 89.8 | 60.4 | 50.4 | 19.2 |
| The Witcher 3 (2015) | 49 | 31 | 17 | 8.8 |
| Overwatch (2016) | 62.6 | 44.1 | 30.5 | 19 |
| Rocket League (2017) | 79 | 45.6 | 31.4 | |
| Shadow of the Tomb Raider (2018) | 26 | |||
| Borderlands 3 (2019) | 30.1 |
Emissions
System Noise
Surface Laptop models are generally quiet machines for their category and this latest iteration is no different. Low processing loads like browsing or video streaming illicit no fan activity for a quiet experience. Even running the first benchmark scene of 3DMark 06, which would almost always kick start the fans on most other laptops, resulted in no fan noise from the Surface Laptop 3.
Running higher loads like Witcher 3 or Prime95 for extended periods will finally cause fan noise to climb steadily until a maximum of 40.4 dB(A). This is comparable to the MacBook Pro 13 while being louder than many other Windows Ultrabooks including the Lenovo ThinkPad X1 Carbon and HP EliteBook x360 1040.
We can notice slight electronic noise or coil whine when placing an ear near the keyboard keys on our test unit.
| Microsoft Surface Laptop 3 13 Core i5-1035G7 Iris Plus Graphics G7 (Ice Lake 64 EU), i5-1035G7, SK hynix BC501 HFM256GDGTNG | Apple MacBook Pro 13 2019 2TB3 Iris Plus Graphics 645, i5-8257U, Apple SSD AP0256 | Huawei Matebook X Pro i5 GeForce MX150, i5-8250U, Samsung PM961 MZVLW256HEHP | Microsoft Surface Laptop 2-LQN-00004 UHD Graphics 620, i5-8250U, SK Hynix BC501 NVMe 256 GB | Dell XPS 13 7390 2-in-1 Core i7 Iris Plus Graphics G7 (Ice Lake 64 EU), i7-1065G7, Toshiba BG4 KBG40ZPZ512G | Lenovo ThinkPad X1 Carbon 2019-20QE000VGE UHD Graphics 620, i7-8665U, WDC PC SN720 SDAQNTW-512G | |
|---|---|---|---|---|---|---|
| Noise | -4% | -6% | 2% | -3% | 1% | |
| off / environment * (dB) | 28.5 | 29.5 -4% | 27.9 2% | 28.7 -1% | 28.1 1% | 28.4 -0% |
| Idle Minimum * (dB) | 28.5 | 29.5 -4% | 27.9 2% | 28.7 -1% | 28.1 1% | 28.4 -0% |
| Idle Average * (dB) | 28.5 | 29.5 -4% | 27.9 2% | 28.7 -1% | 28.1 1% | 28.4 -0% |
| Idle Maximum * (dB) | 28.5 | 29.5 -4% | 27.9 2% | 28.7 -1% | 28.1 1% | 28.6 -0% |
| Load Average * (dB) | 28.5 | 31.1 -9% | 36.2 -27% | 30 -5% | 31.7 -11% | 31.5 -11% |
| Witcher 3 ultra * (dB) | 40.4 | 45 -11% | 43.4 -7% | |||
| Load Maximum * (dB) | 40.4 | 39.3 3% | 45.2 -12% | 32.9 19% | 43.4 -7% | 33.1 18% |
* ... smaller is better
Noise level
| Idle |
| 28.5 / 28.5 / 28.5 dB(A) |
| Load |
| 28.5 / 40.4 dB(A) |
 | ||
30 dB silent 40 dB(A) audible 50 dB(A) loud |
||
min: | ||
Temperature
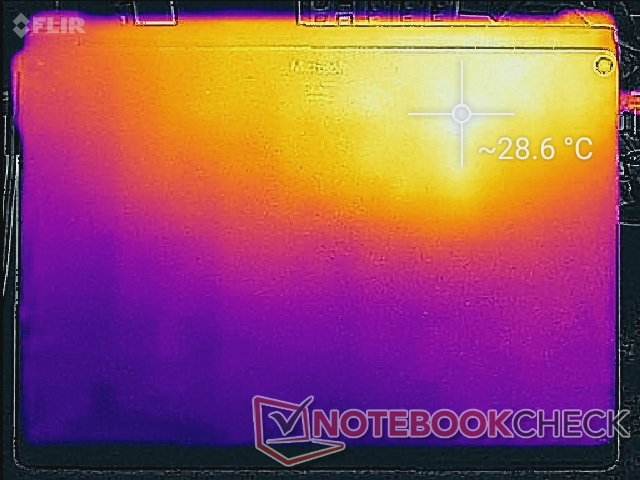
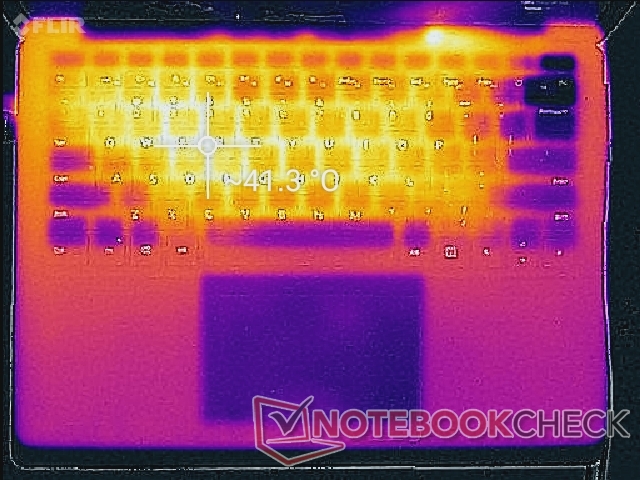
Are surface temperatures on the metal Surface Laptop 3 13.5 warmer than the surfaces of the Alcantara Surface Laptop 2? Yes. When idling, average surface temperature on the top and bottom of the metal Surface Laptop 3 is about 26 C to 27 C compared to 23 C on the Surface Laptop 2. When subjected to extreme processing loads, average surface temperatures on the metal Surface Laptop 3 are again warmer. The palm rests, for example, can become as warm as 35 C compared to only 29 C on the Surface Laptop 2. Cooler temperatures would be preferable especially since the hot spots on the keyboard keys and bottom panel are so large as shown by our temperature maps below. Microsoft's insistence on having as few ventilation grilles as possible is a likely culprit.
The Dell XPS 13 2-in-1 runs even warmer than our Surface at 46 C to 51 C when under similar heavy loads. It's even smaller and thinner than the Microsoft laptop, after all.

(±) The maximum temperature on the upper side is 42.6 °C / 109 F, compared to the average of 34.3 °C / 94 F, ranging from 21.2 to 62.5 °C for the class Office.
(-) The bottom heats up to a maximum of 45.4 °C / 114 F, compared to the average of 36.8 °C / 98 F
(+) In idle usage, the average temperature for the upper side is 25.5 °C / 78 F, compared to the device average of 29.5 °C / 85 F.
(±) Playing The Witcher 3, the average temperature for the upper side is 34.8 °C / 95 F, compared to the device average of 29.5 °C / 85 F.
(+) The palmrests and touchpad are reaching skin temperature as a maximum (35.2 °C / 95.4 F) and are therefore not hot.
(-) The average temperature of the palmrest area of similar devices was 27.5 °C / 81.5 F (-7.7 °C / -13.9 F).


Stress Test
We stress the system with synthetic loads to identify for any potential throttling or stability issues. When running Prime95 to stress the CPU, core clock rates can be observed running at 3.3 GHz for about 20 seconds until hitting a core temperature of 82 C. Thereafter, clock rates and core temperature would drop to 2.4 GHz and 69 C, respectively. Core temperature slowly rises again until hitting 80 C where clock rates will then drop further to a stable 2.2 to 2.3 GHz range in order to maintain a final core temperature of 75 C.
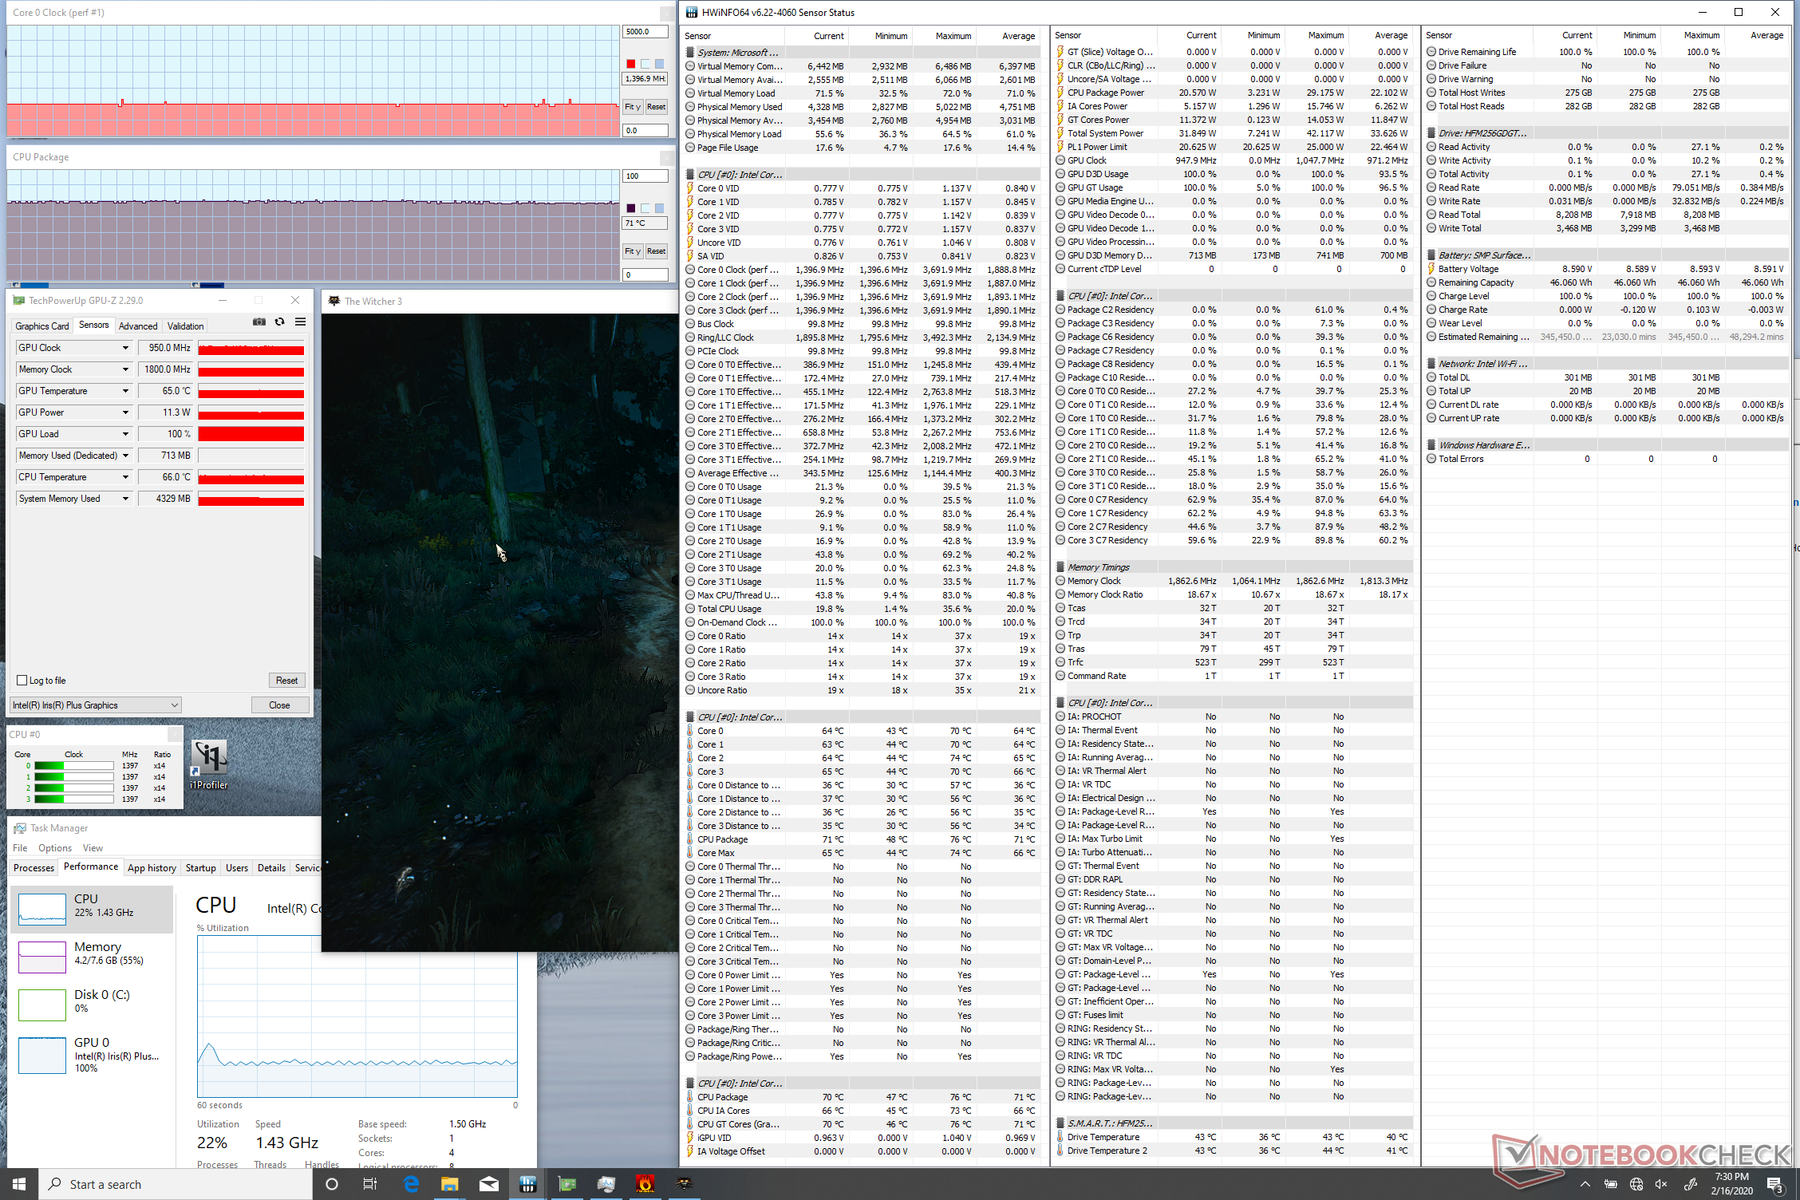
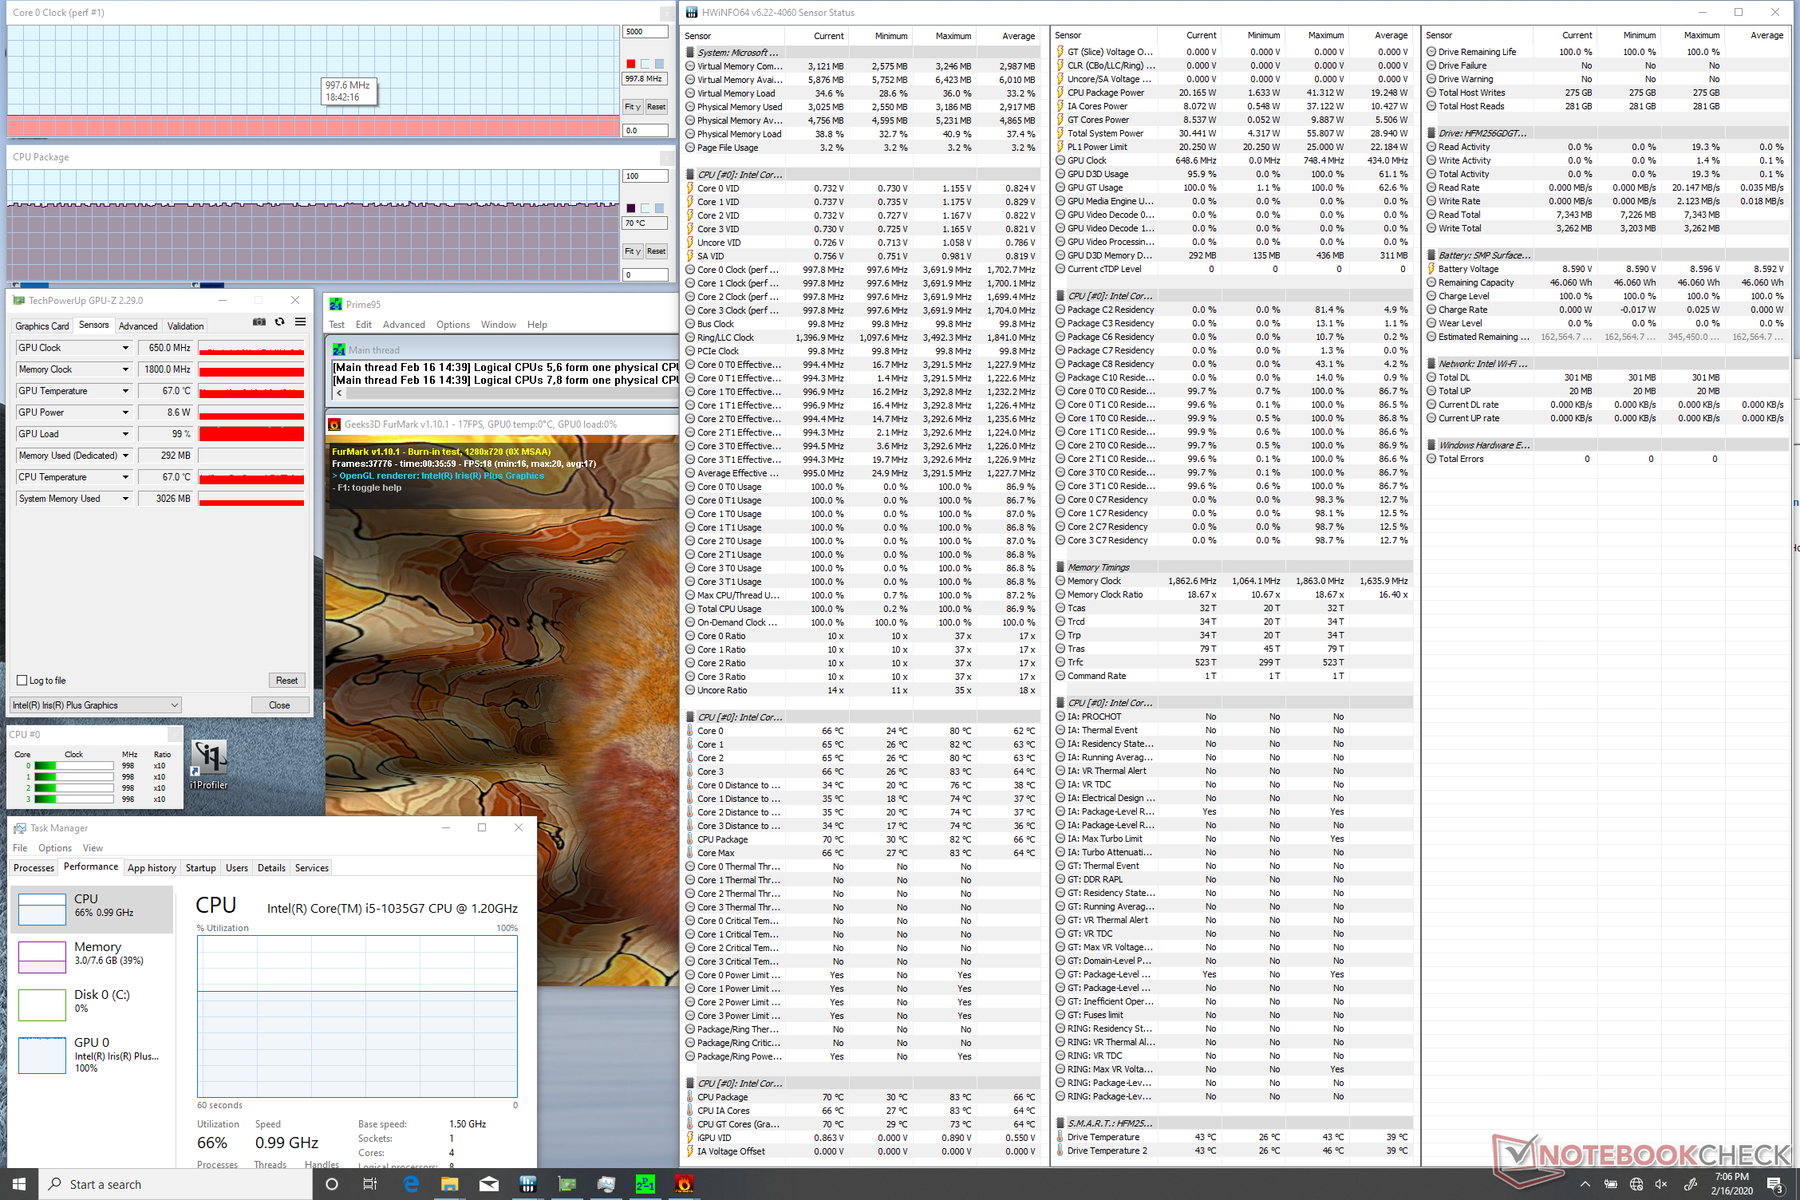
Running Prime95 and FurMark simultaneously will throttle the CPU and GPU to 1.0 GHz and 650 MHz, respectively. When running Witcher 3, GPU clock rate and CPU temperature stabilize at 950 MHz and 71 C, respectively, compared to 1100 MHz and 79 C on the Dell XPS 13 2-in-1 with the faster Core i7-1065G7.
Performance will not be reduced if running on battery power. A 3DMark 11 run on batteries returns Physics and Graphics scores of 9031 and 4287 points, respectively, compared to 8880 and 4279 points when on mains.
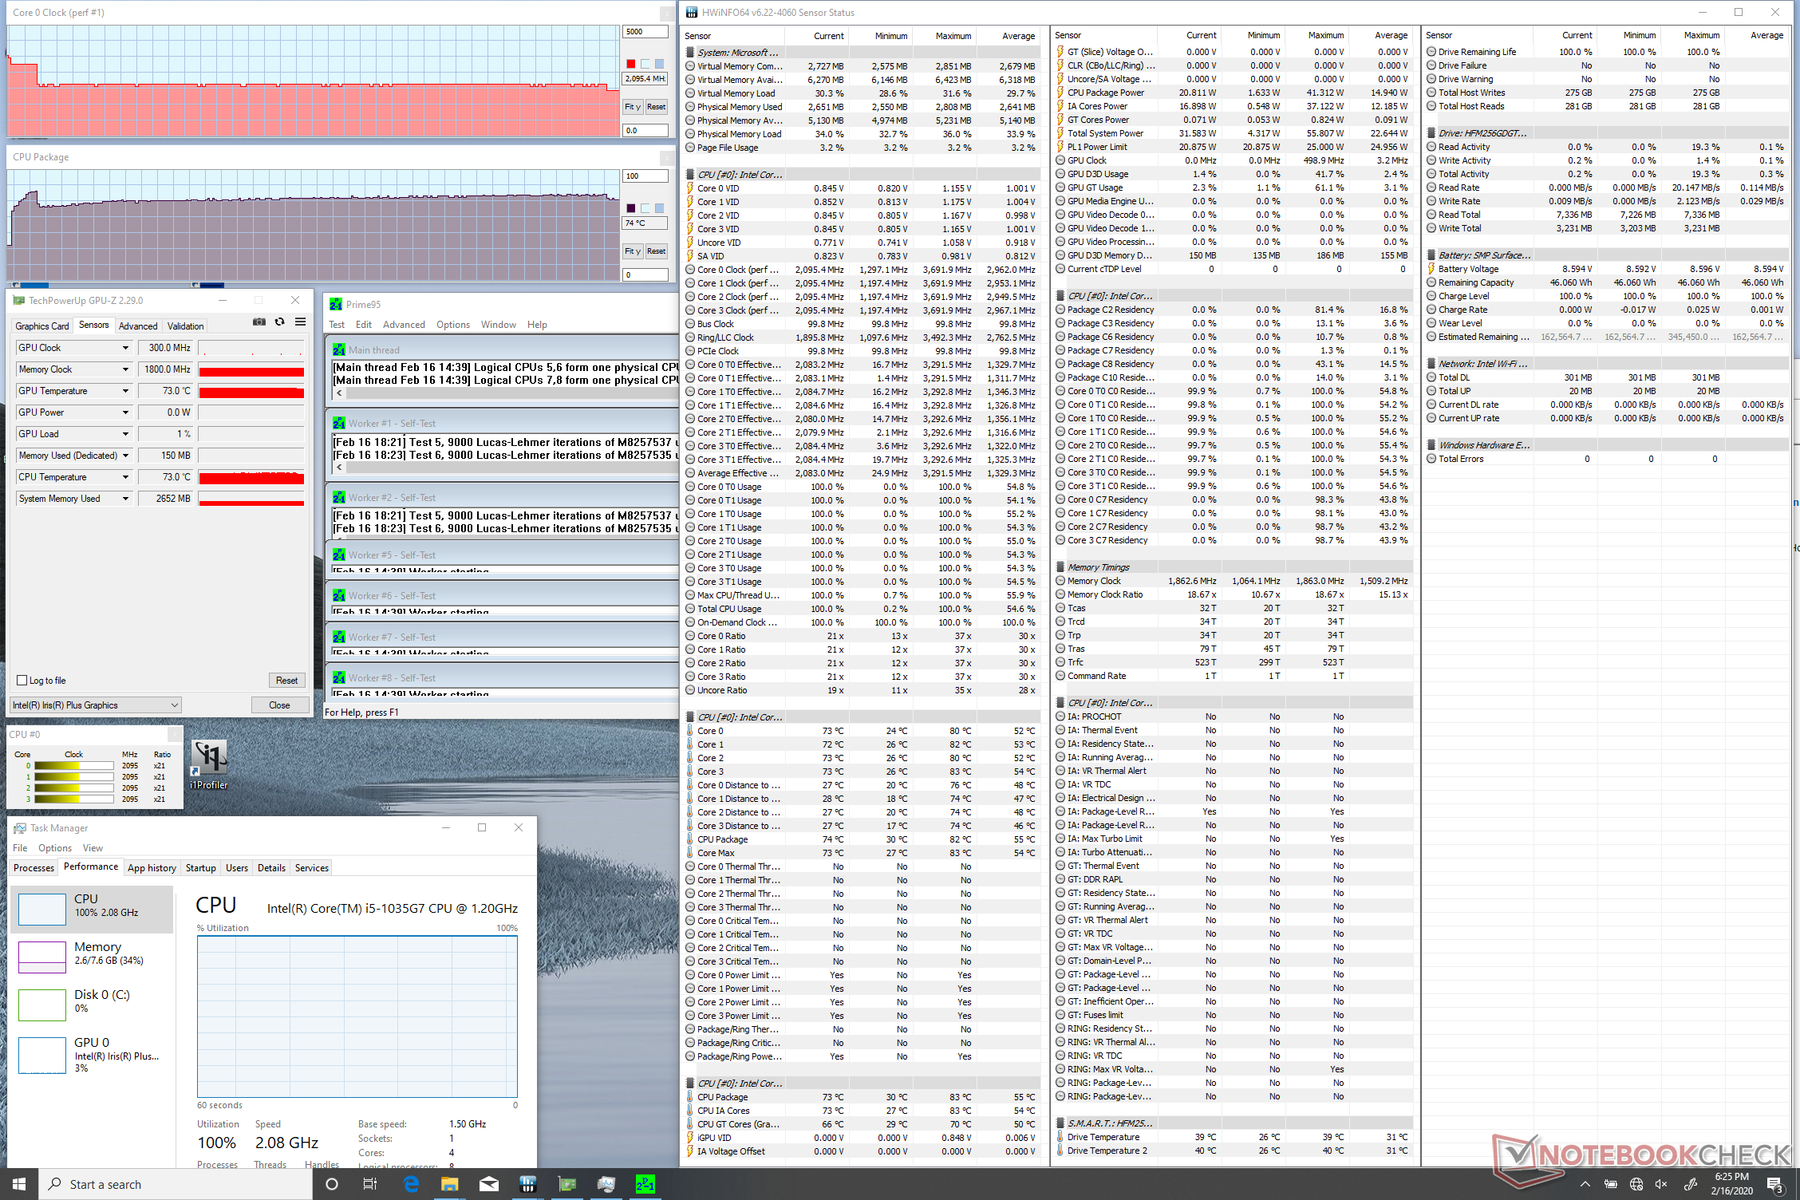

| CPU Clock (GHz) | GPU Clock (MHz) | Average CPU Temperature (°C) | Average GPU Temperature (°C) | |
| System Idle | -- | -- | 32 | 28 |
| Prime95 Stress | 2.2 - 2.3 | -- | 75 | -- |
| Prime95 + FurMark Stress | 1.0 | 650 | 70 | 67 |
| Witcher 3 Stress | 1.4 | 950 | 71 | 65 |
Speakers
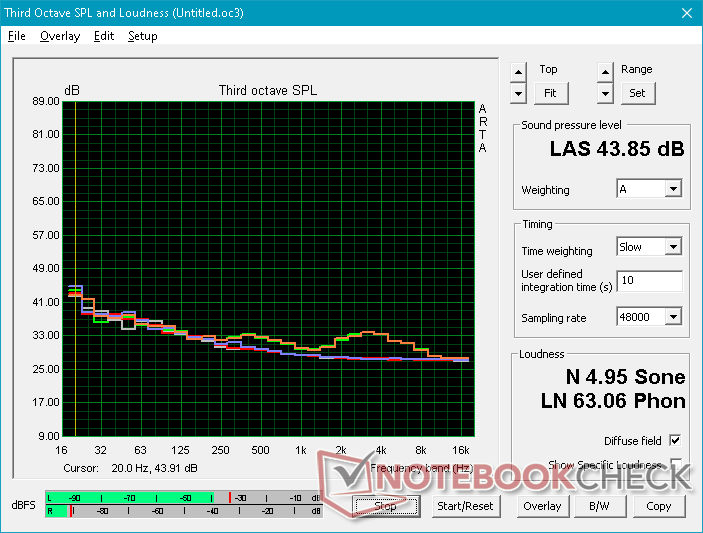
Audio quality is identical to the larger 15-inch Surface Laptop 3 as exemplified by their near-identical pink noise graphs below. Even their maximum volumes are about the same. Playback is relatively balanced and better than expected from a subnotebook with only slight vibrations on the palm rests at high volume settings.
")
")
Microsoft Surface Laptop 3 13 Core i5-1035G7 audio analysis
(±) | speaker loudness is average but good (79 dB)
Bass 100 - 315 Hz
(+) | good bass - only 4.2% away from median
(±) | linearity of bass is average (10.5% delta to prev. frequency)
Mids 400 - 2000 Hz
(+) | balanced mids - only 3.6% away from median
(±) | linearity of mids is average (7.1% delta to prev. frequency)
Highs 2 - 16 kHz
(+) | balanced highs - only 1.8% away from median
(+) | highs are linear (6.5% delta to prev. frequency)
Overall 100 - 16.000 Hz
(+) | overall sound is linear (11.4% difference to median)
Compared to same class
» 3% of all tested devices in this class were better, 2% similar, 95% worse
» The best had a delta of 7%, average was 21%, worst was 53%
Compared to all devices tested
» 7% of all tested devices were better, 2% similar, 90% worse
» The best had a delta of 4%, average was 23%, worst was 134%
Apple MacBook 12 (Early 2016) 1.1 GHz audio analysis
(+) | speakers can play relatively loud (83.6 dB)
Bass 100 - 315 Hz
(±) | reduced bass - on average 11.3% lower than median
(±) | linearity of bass is average (14.2% delta to prev. frequency)
Mids 400 - 2000 Hz
(+) | balanced mids - only 2.4% away from median
(+) | mids are linear (5.5% delta to prev. frequency)
Highs 2 - 16 kHz
(+) | balanced highs - only 2% away from median
(+) | highs are linear (4.5% delta to prev. frequency)
Overall 100 - 16.000 Hz
(+) | overall sound is linear (10.2% difference to median)
Compared to same class
» 7% of all tested devices in this class were better, 2% similar, 90% worse
» The best had a delta of 5%, average was 18%, worst was 53%
Compared to all devices tested
» 5% of all tested devices were better, 1% similar, 94% worse
» The best had a delta of 4%, average was 23%, worst was 134%
Energy Management
Power Consumption
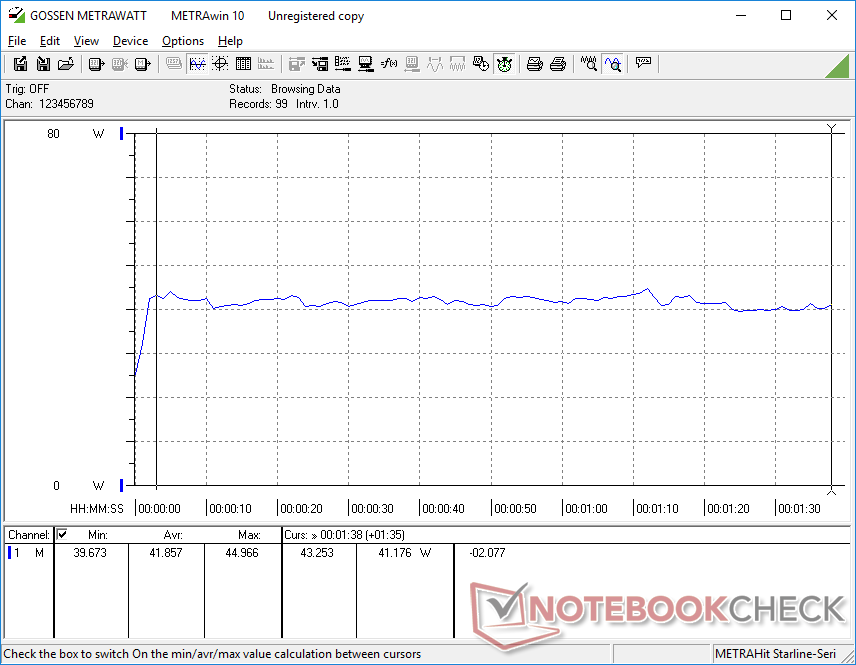
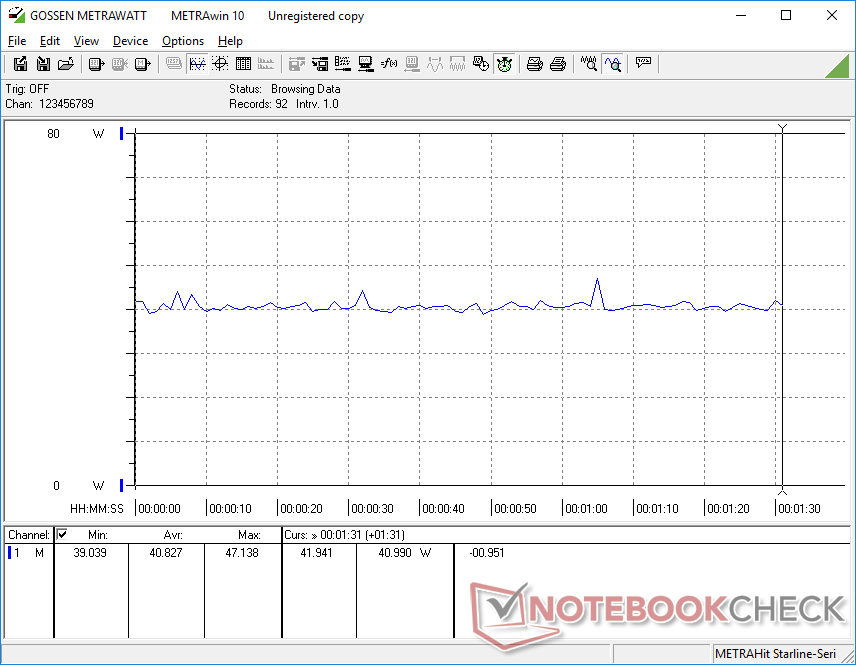
The system consumes about the same power as the Surface Laptop 3 15 Core i7 while being more power-hungry than the Surface Laptop 2. Idling on desktop consumes around 4 W when the brightness is set to minimum or almost 8 W when the brightness is set to maximum. Running 3DMark 06 averages 42 W to be nearly the same as the MacBook Pro 13 or Lenovo ThinkPad X1 Carbon while offering much faster GPU performance than both.
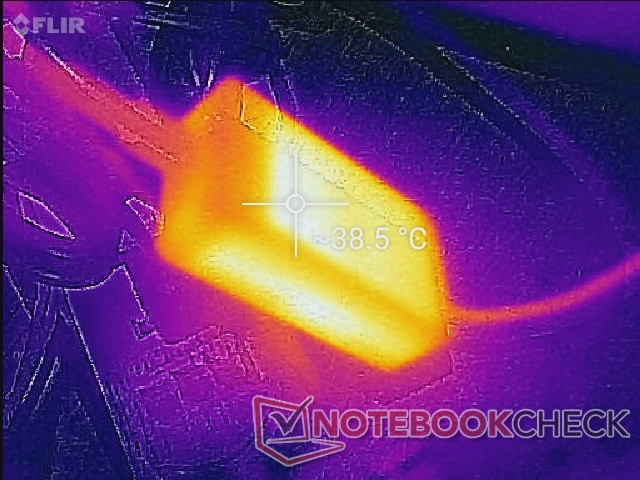
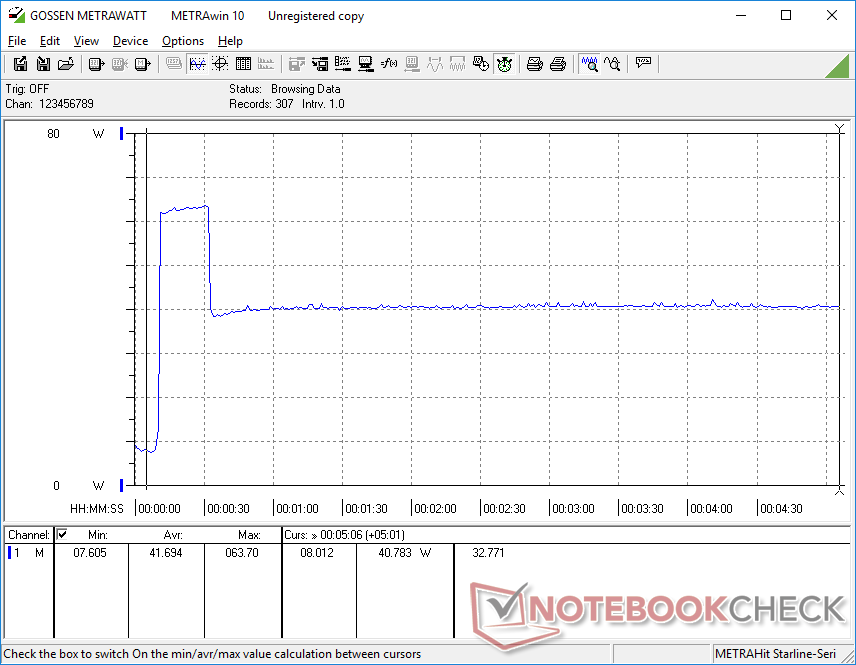
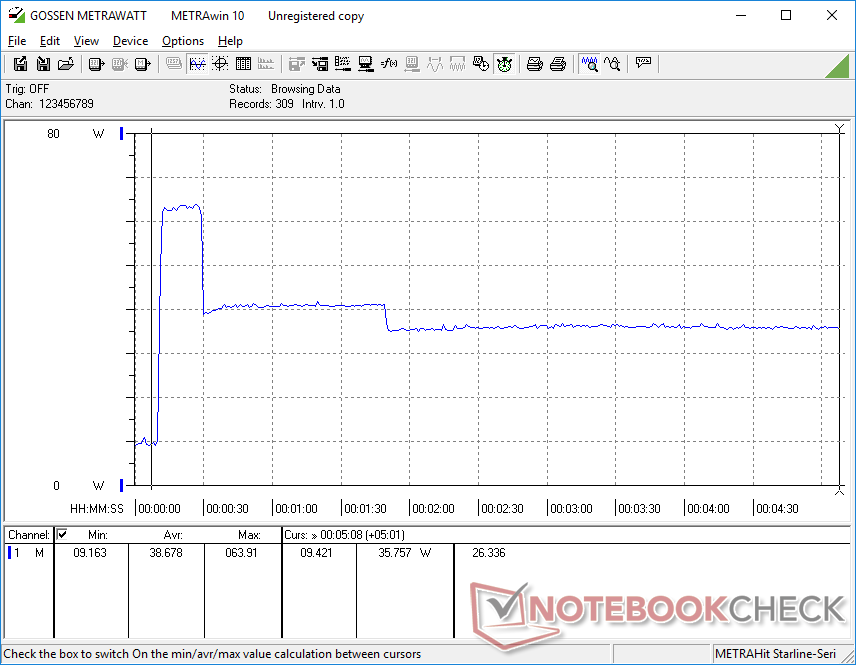
We're able to record a maximum consumption of 63.9 W from the small (~9 x 5 x 2.5 cm) 65 W AC adapter when running both Prime95 and FurMark simultaneously. However, this high of a consumption rate lasts for only about 20 seconds before falling and stabilizing at just 35.8 W instead due to thermal limits as shown by our graphs below.
| Off / Standby | |
| Idle | |
| Load |
|
Key:
min: | |
| Microsoft Surface Laptop 3 13 Core i5-1035G7 i5-1035G7, Iris Plus Graphics G7 (Ice Lake 64 EU), SK hynix BC501 HFM256GDGTNG, IPS, 2256x1504, 13.5" | Apple MacBook Pro 13 2019 2TB3 i5-8257U, Iris Plus Graphics 645, Apple SSD AP0256, IPS, 2560x1600, 13.3" | Huawei Matebook X Pro i5 i5-8250U, GeForce MX150, Samsung PM961 MZVLW256HEHP, IPS, 3000x2000, 13.9" | Microsoft Surface Laptop 2-LQN-00004 i5-8250U, UHD Graphics 620, SK Hynix BC501 NVMe 256 GB, IPS, 2256x1504, 13.5" | Dell XPS 13 7390 2-in-1 Core i7 i7-1065G7, Iris Plus Graphics G7 (Ice Lake 64 EU), Toshiba BG4 KBG40ZPZ512G, IPS, 1920x1200, 13.4" | Lenovo ThinkPad X1 Carbon 2019-20QE000VGE i7-8665U, UHD Graphics 620, WDC PC SN720 SDAQNTW-512G, IPS, 2560x1440, 14" | |
|---|---|---|---|---|---|---|
| Power Consumption | 12% | -12% | 16% | 16% | 6% | |
| Idle Minimum * (Watt) | 4.4 | 2.1 52% | 3.5 20% | 3 32% | 2.6 41% | 3 32% |
| Idle Average * (Watt) | 7.5 | 6.9 8% | 8.9 -19% | 6.8 9% | 5.3 29% | 6.3 16% |
| Idle Maximum * (Watt) | 7.8 | 7.8 -0% | 12.3 -58% | 8.76 -12% | 7 10% | 8.9 -14% |
| Load Average * (Watt) | 41.9 | 42 -0% | 54.2 -29% | 35.1 16% | 43.1 -3% | 40.8 3% |
| Witcher 3 ultra * (Watt) | 40.8 | 42.4 -4% | 43.1 -6% | |||
| Load Maximum * (Watt) | 63.9 | 64.5 -1% | 52.1 18% | 42.6 33% | 49 23% | 67.5 -6% |
* ... smaller is better
Battery Life
Internal battery capacity remains at 45 Wh to be the same as it was on the Surface Laptop 2. Runtimes aren't necessarily longer this time around at just over 8 hours of real-world WLAN use compared to 9 hours on the last gen model. If simply idling on desktop, however, the system can last for almost 35 hours not unlike what we discovered on the Ice Lake-powered 15-inch Surface Laptop 3. The MacBook Pro 13, Huawei MateBook X Pro, and Dell XPS 13 2-in-1 can all last for longer than the Surface Laptop 3 13.5 when under real-world browsing loads.
Recharging from empty to full capacity with the included Surface Connect adapter takes about 1.5 hours. Connecting our third party USB Type-C charger also works.
| Microsoft Surface Laptop 3 13 Core i5-1035G7 i5-1035G7, Iris Plus Graphics G7 (Ice Lake 64 EU), 45 Wh | Apple MacBook Pro 13 2019 2TB3 i5-8257U, Iris Plus Graphics 645, 58.2 Wh | Huawei Matebook X Pro i5 i5-8250U, GeForce MX150, 57.4 Wh | Microsoft Surface Laptop 2-LQN-00004 i5-8250U, UHD Graphics 620, 45 Wh | Dell XPS 13 7390 2-in-1 Core i7 i7-1065G7, Iris Plus Graphics G7 (Ice Lake 64 EU), 51 Wh | Lenovo ThinkPad X1 Carbon 2019-20QE000VGE i7-8665U, UHD Graphics 620, 51 Wh | |
|---|---|---|---|---|---|---|
| Battery runtime | 57% | -4% | -15% | 8% | -14% | |
| Reader / Idle (h) | 34.4 | 20.7 -40% | 20.8 -40% | |||
| WiFi v1.3 (h) | 8.3 | 13 57% | 9.3 12% | 9.1 10% | 9 8% | 8.2 -1% |
| Load (h) | 1.9 | 2.2 16% | 1.6 -16% | 1.4 -26% |
Pros
Cons
Verdict
The Surface Laptop 3 is stuck between a generalist consumer Ultrabook and a professional laptop as it doesn't excel in any particular category. More well-known Ultrabooks like the Dell XPS 13 2-in-1, HP Spectre 13, or Huawei MateBook X Pro have brighter displays or faster dedicated GPUs than the Microsoft laptop while "proper" professional laptops like the Lenovo ThinkPad X1 Carbon or HP EliteBook x360 1040 are easier to service and have more integrated ports. The system feels barebones and even outdated as a result despite sporting the latest 10th gen Intel CPU.
On the other hand, what's here is excellent considering the $1000 price tag. The metal chassis is stronger than Alcantara, the glossy display is well-calibrated, audio quality is good for the size, and fan noise is minimal under most conditions. You might like the Surface Laptop 3 if you don't mind its laundry list of missing features commonly found on most other Windows Ultrabooks.
Perhaps it's time for Microsoft to fully refresh the three-year old chassis design and incorporate more compelling hardware features. The Huawei MateBook X Pro is an excellent alternative to the 13.5-inch Surface Laptop 3 as it offers better serviceability, a larger 3:2 screen size, GeForce MX graphics, and Thunderbolt 3 connectivity all in a smaller chassis.
Microsoft Surface Laptop 3 13 Core i5-1035G7
- 02/23/2020 v7 (old)
Allen Ngo
Price comparison
