HP ZBook 14u G6 laptop review: The mobile workstation has problems with performance

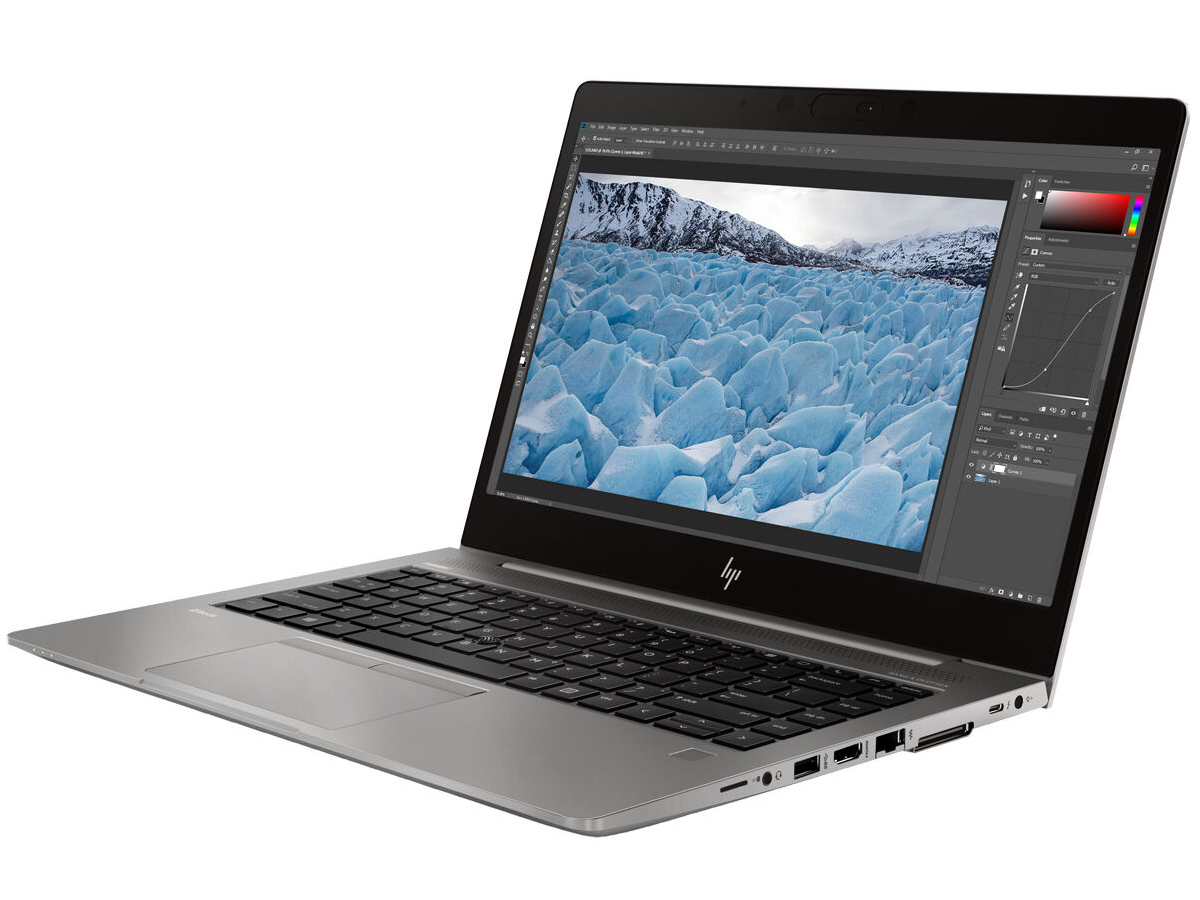
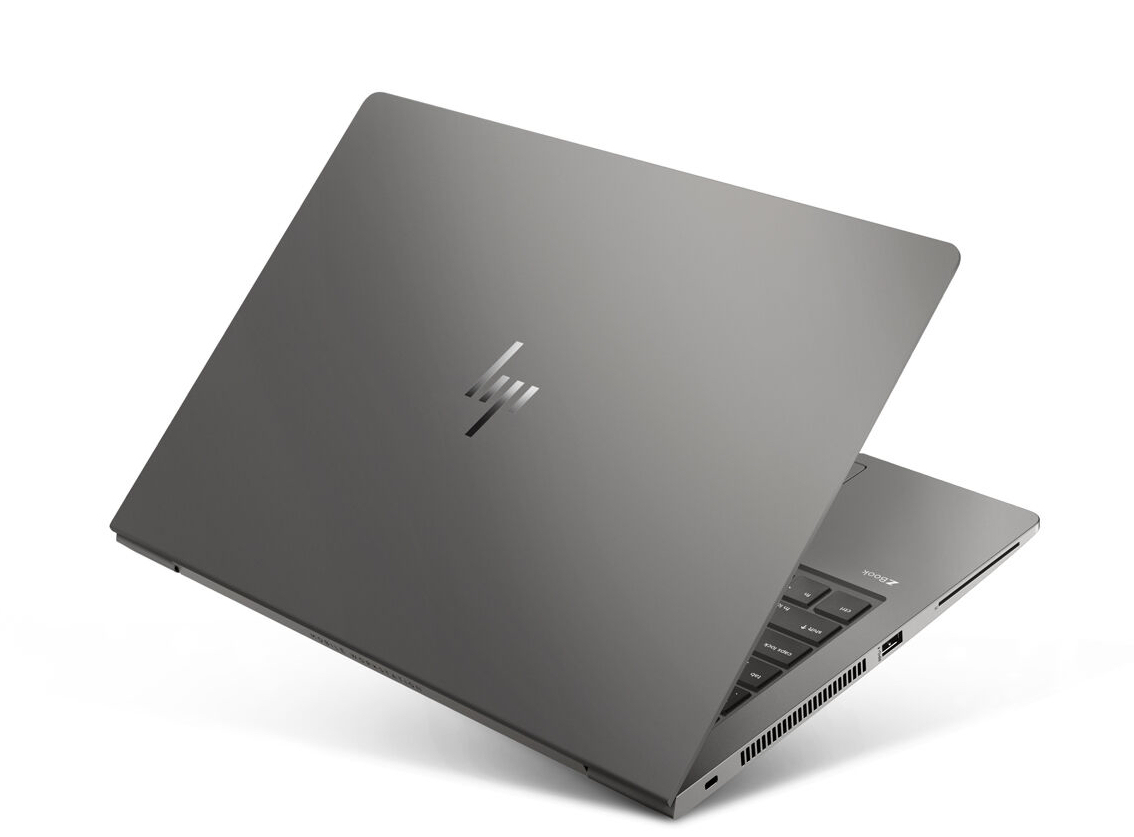
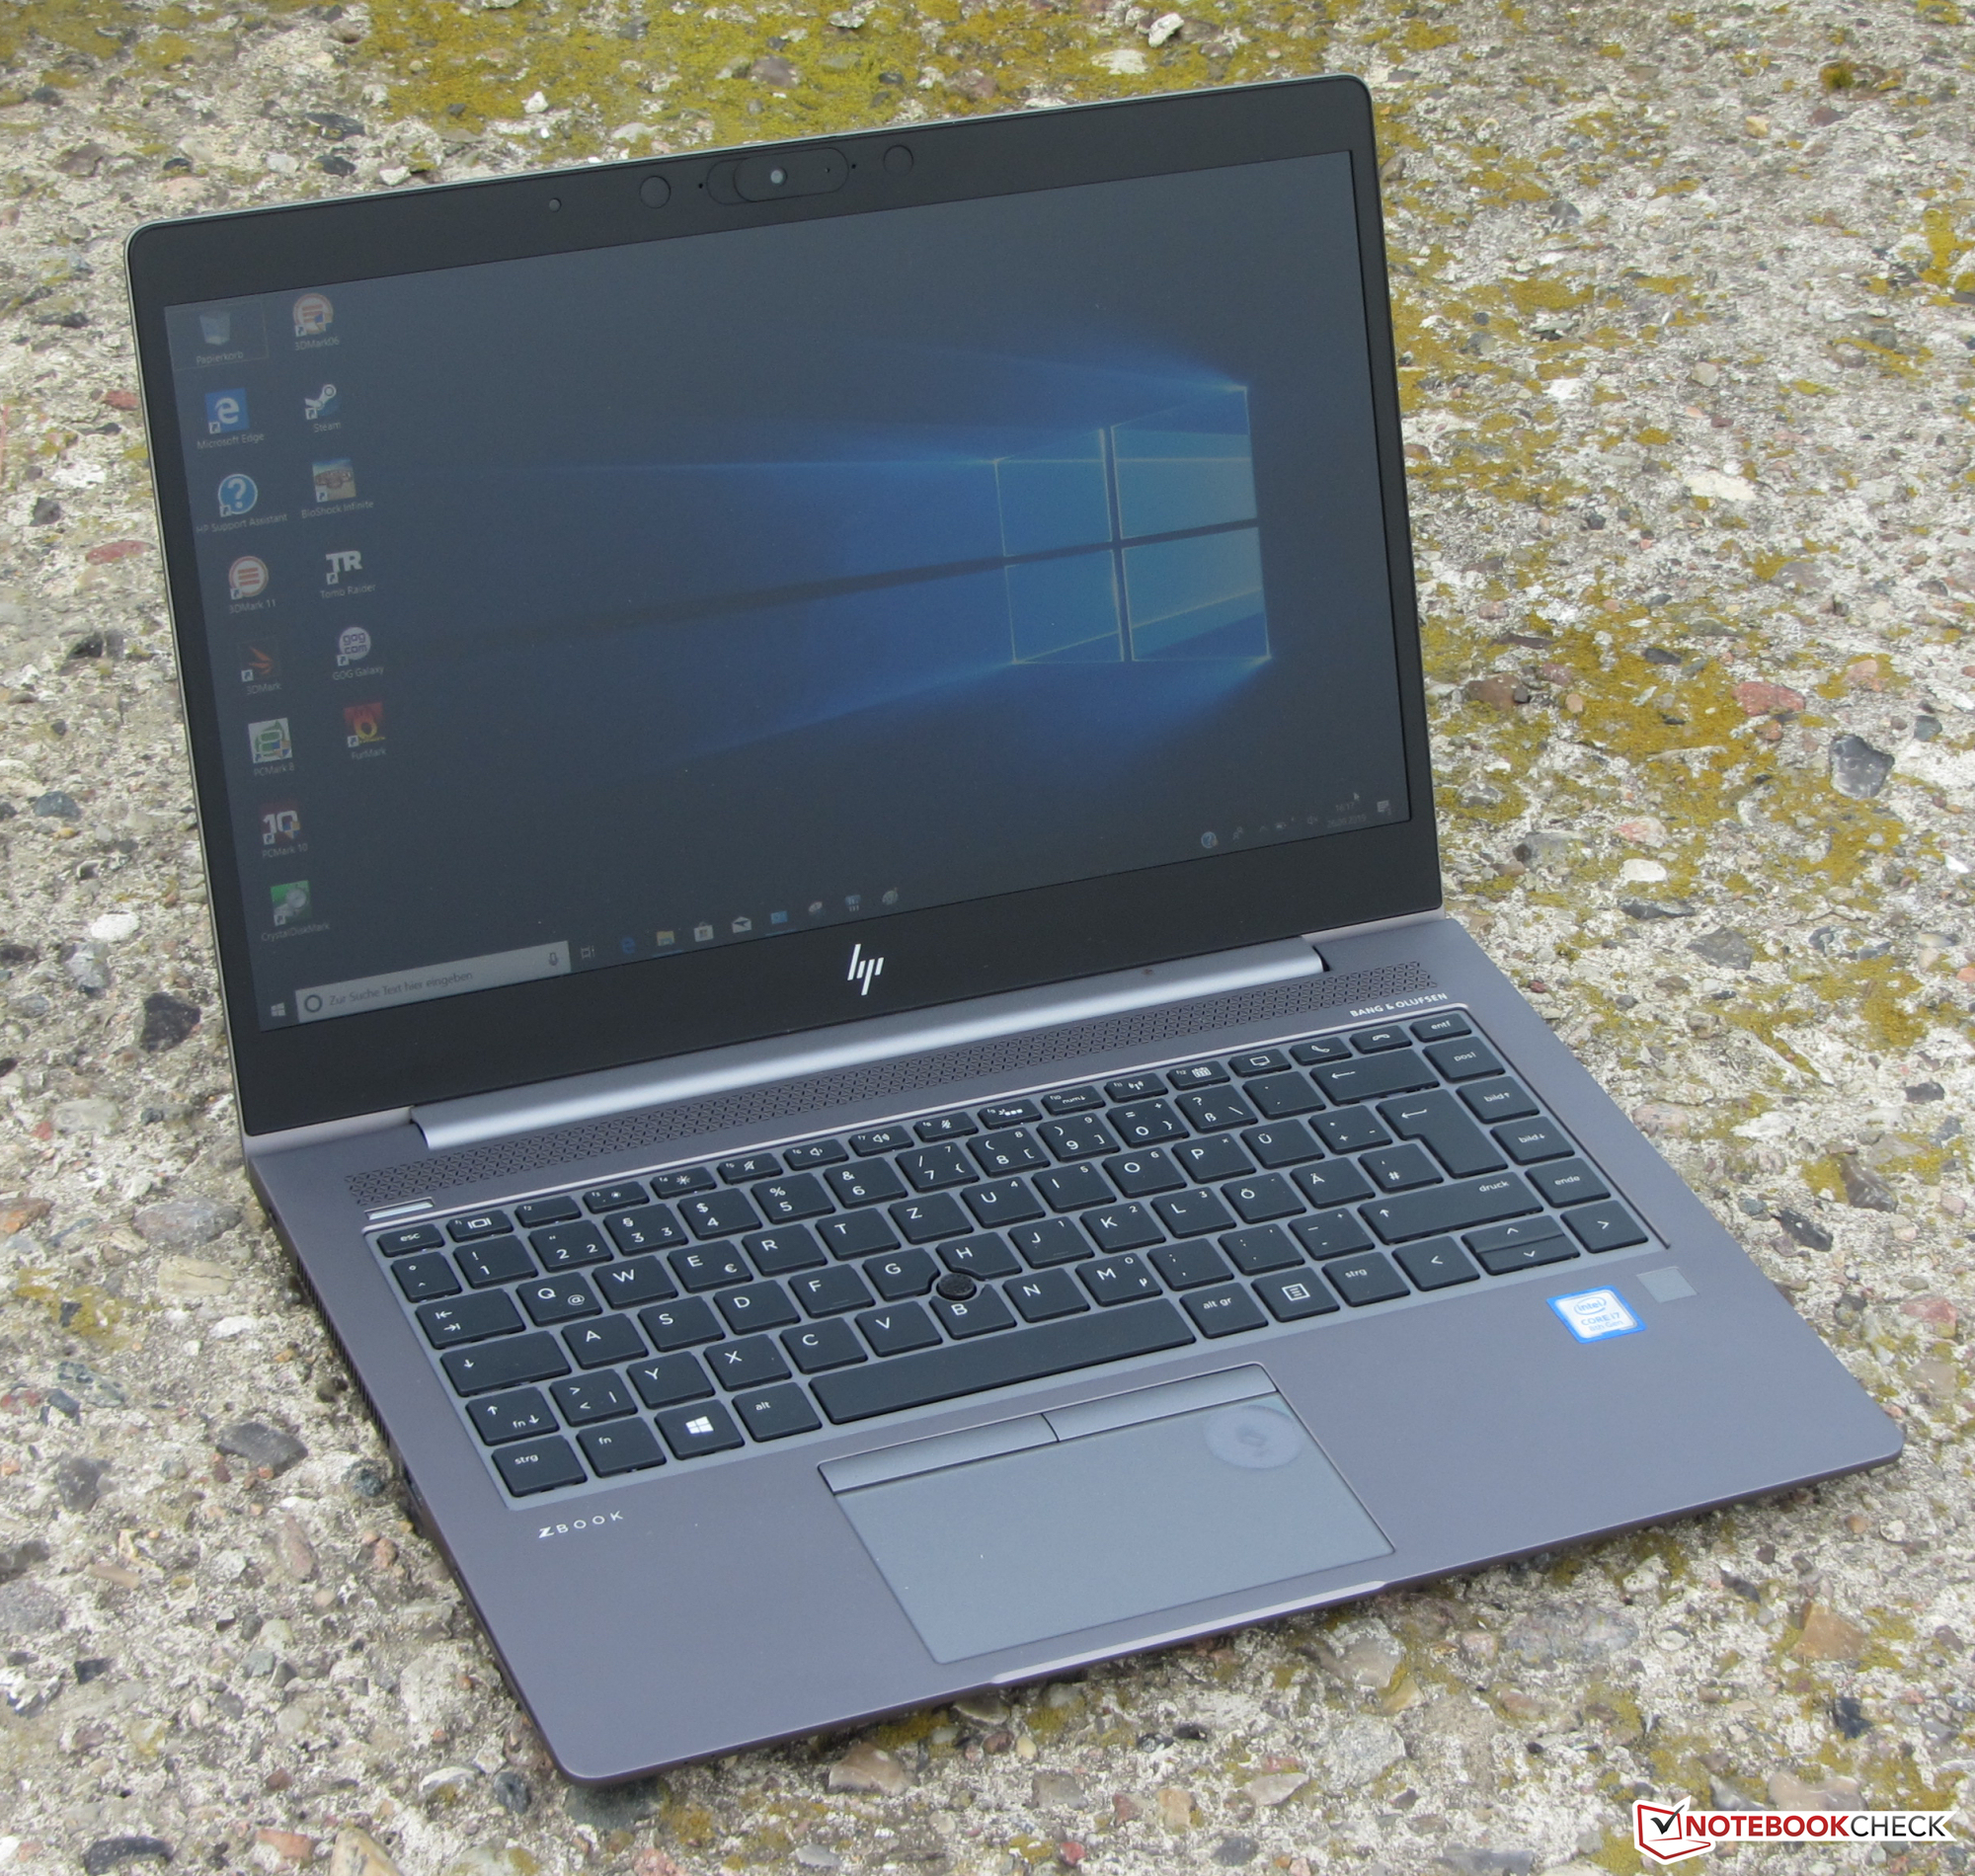
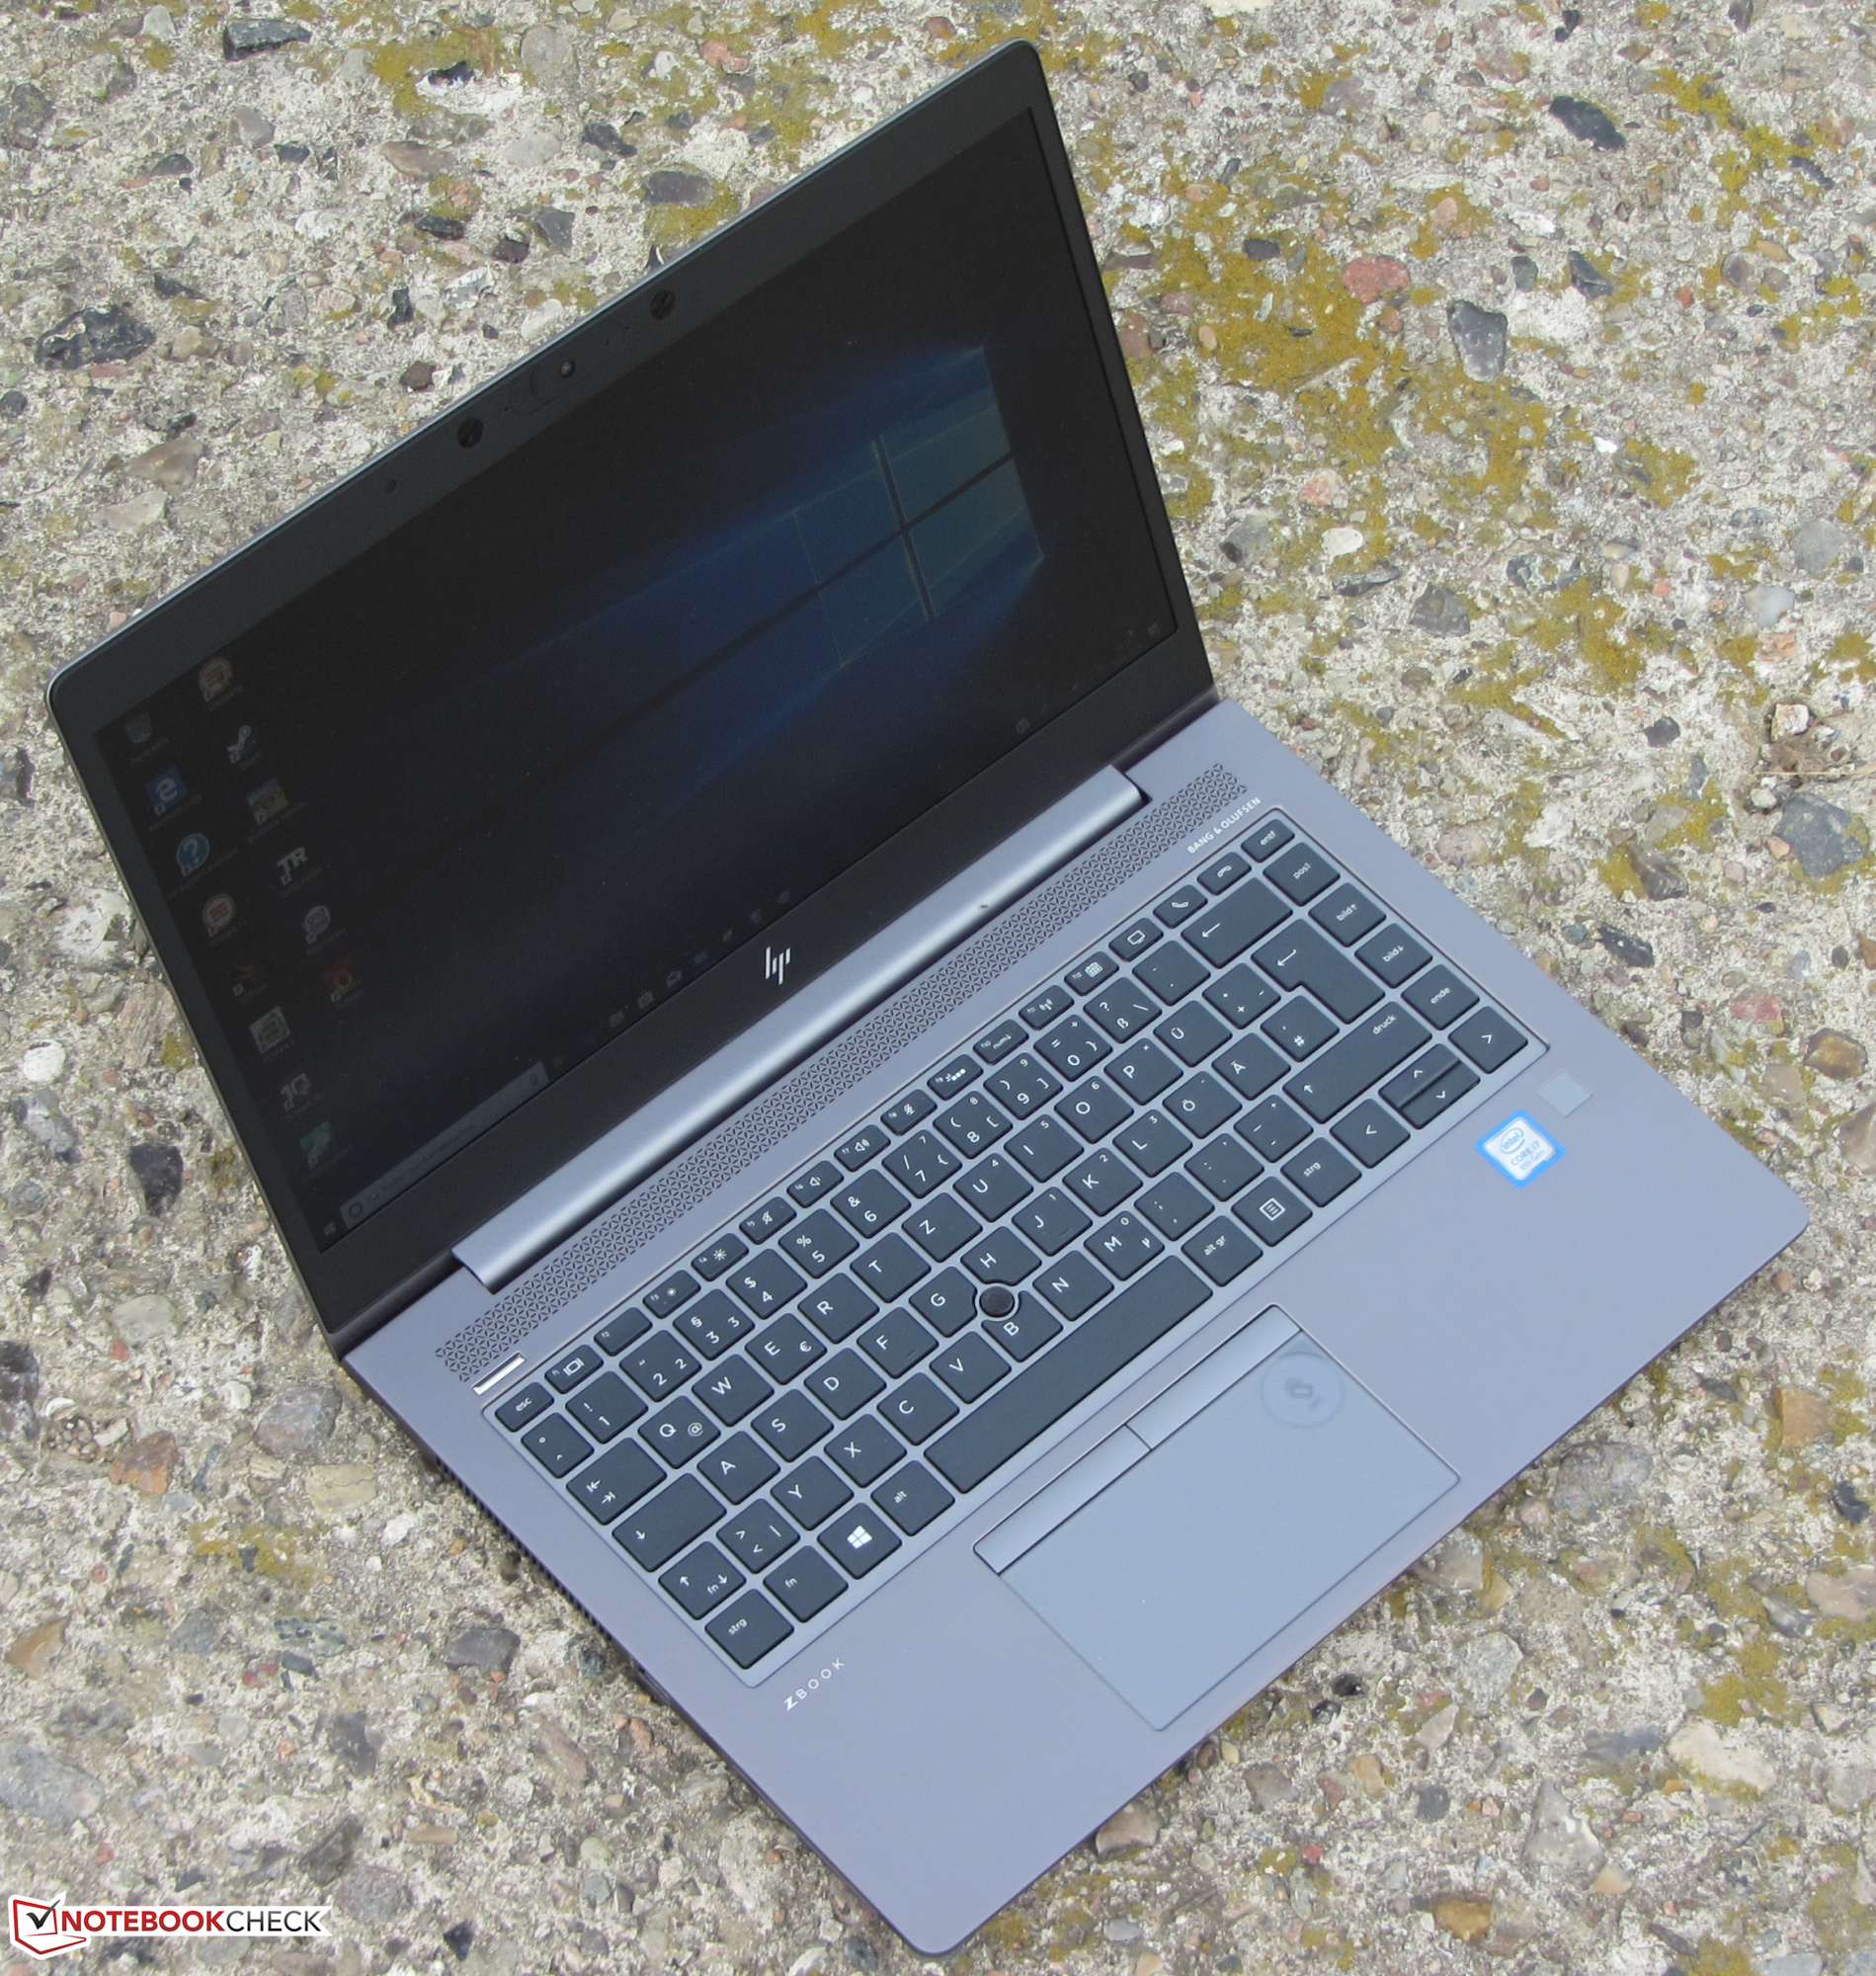
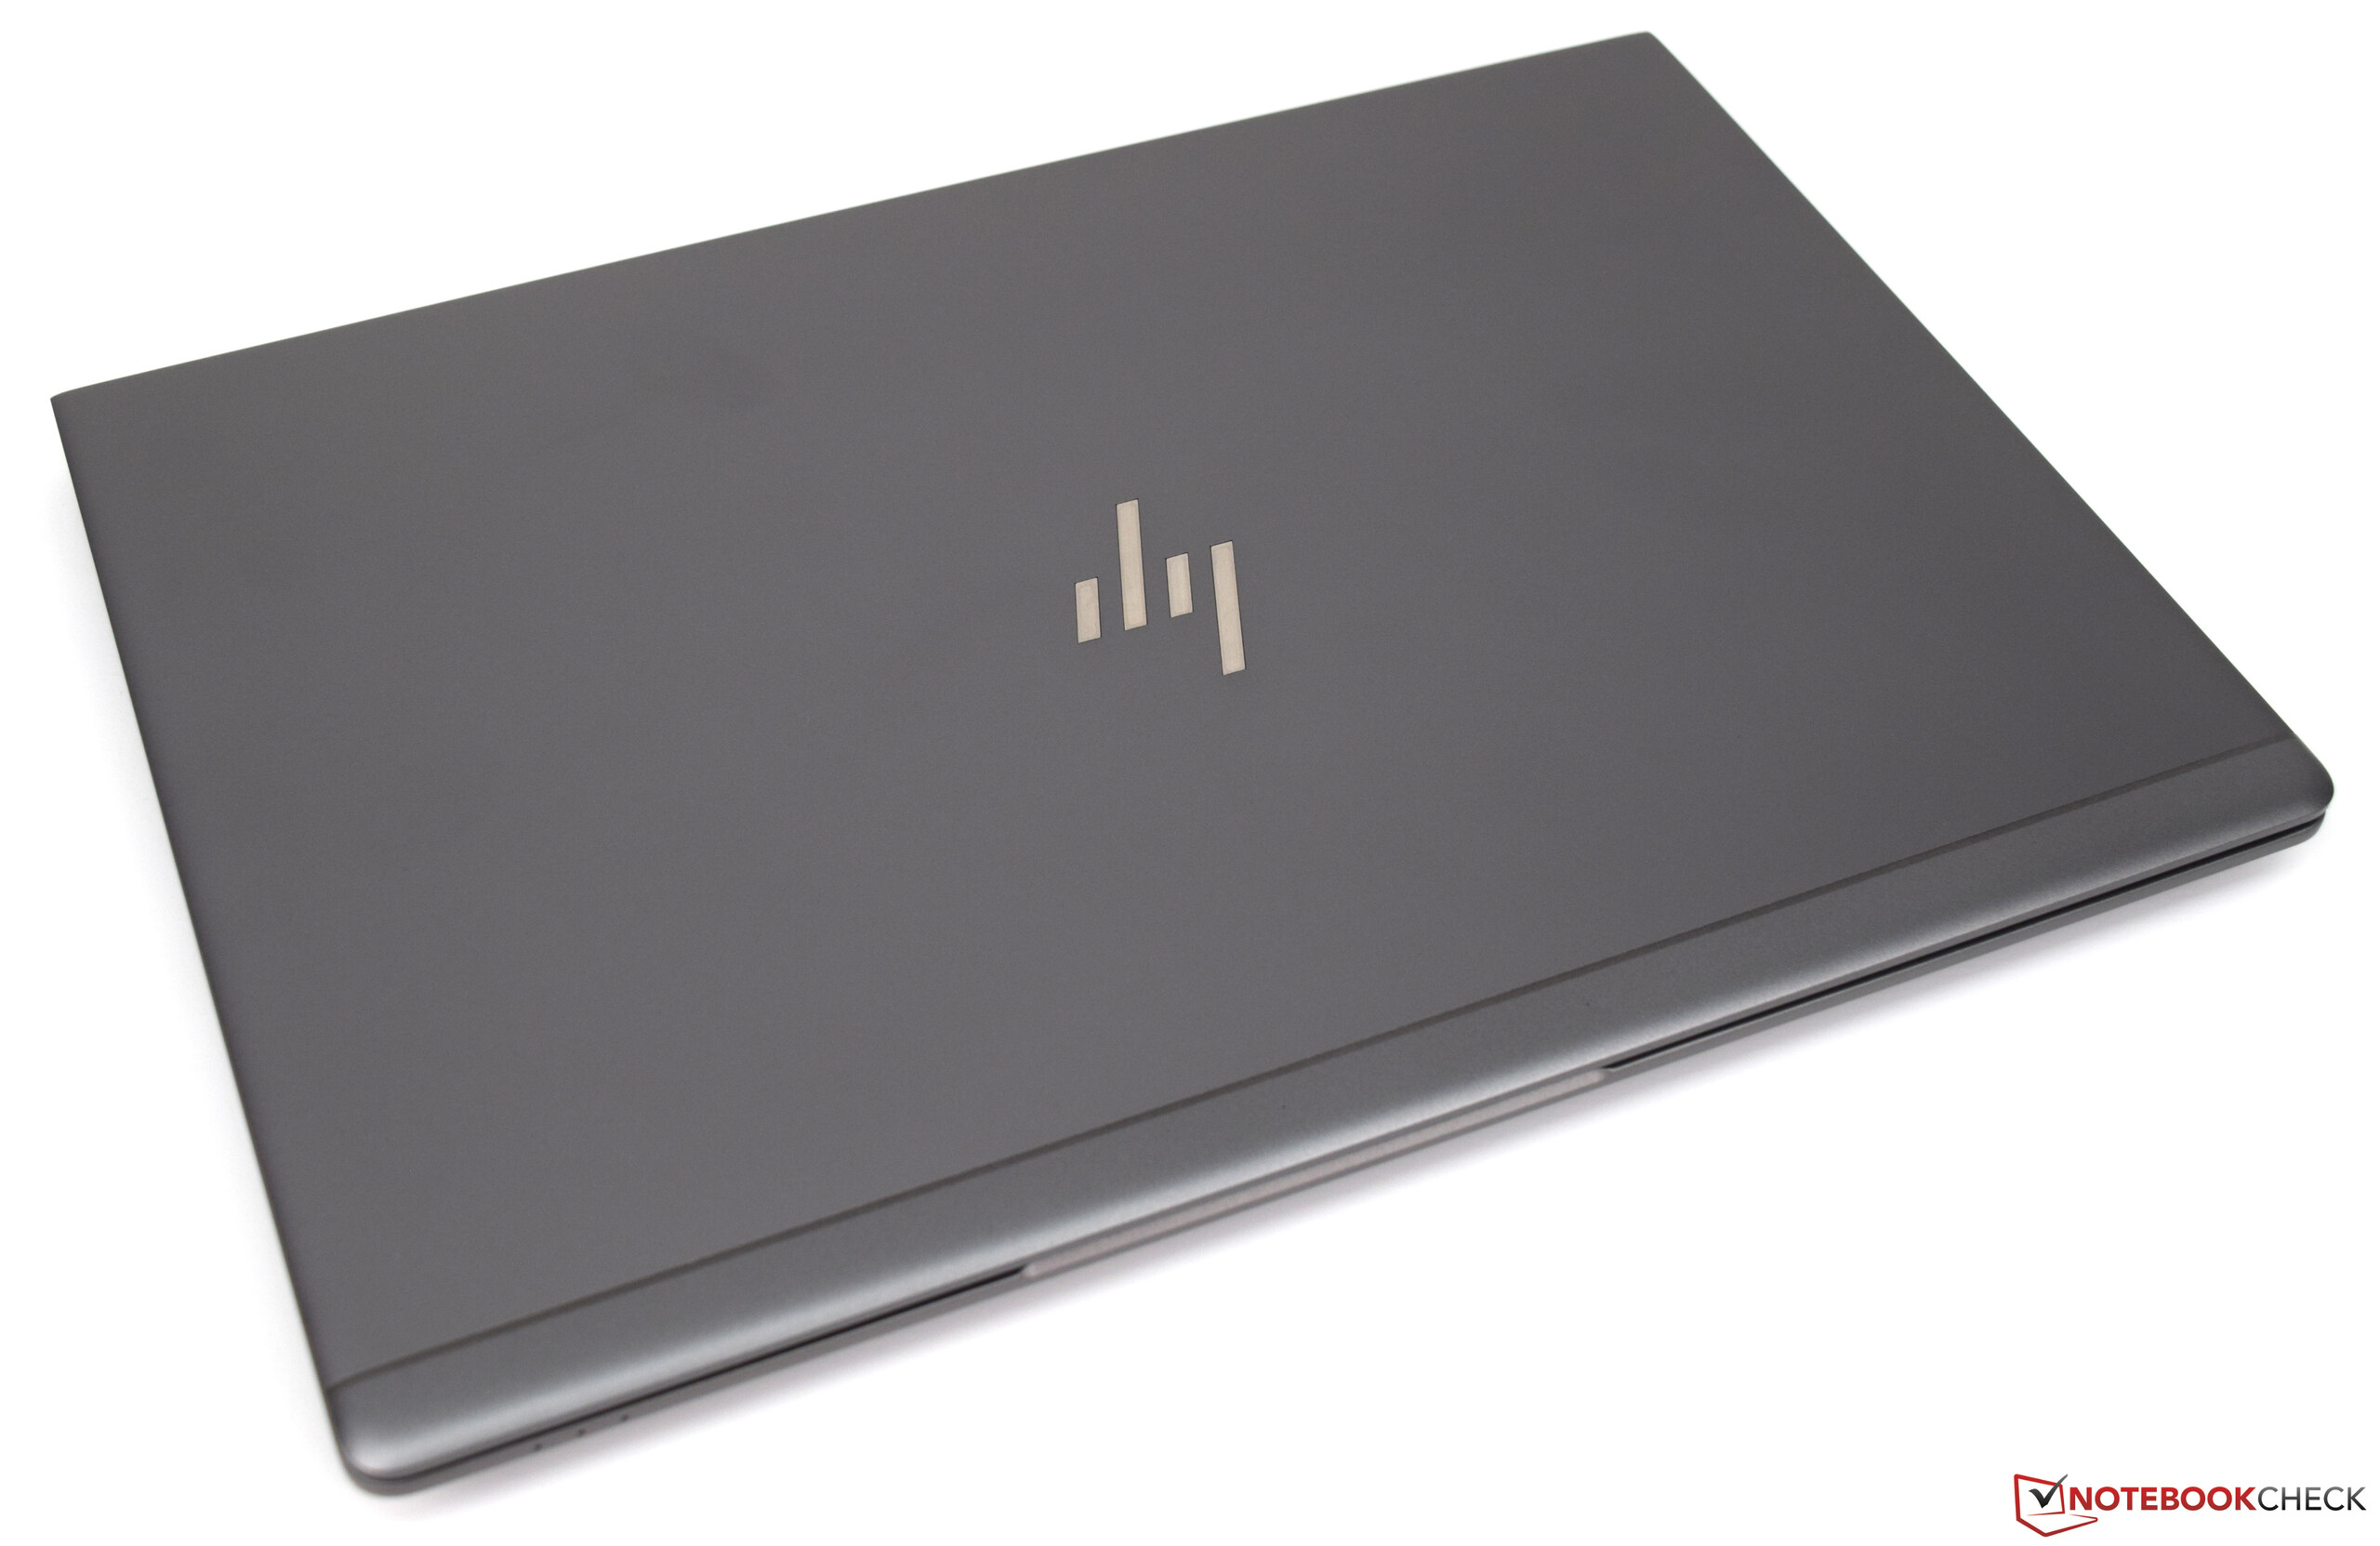
The HP ZBook 14u G6 is a sleek, 14-inch mobile workstation. The device is not unknown to us. This is the identically constructed successor of the ZBook 14u G5. HP is carrying out primarily a model revision with the new version and has updated the core components. Our review device is powered by a Core i7-8565U processor and a Radeon Pro WX 3200 graphics core.
Direct competitors are not currently available in our database. This includes, for example, the Lenovo ThinkPad P43s. A review of this workstation will follow in the next weeks. That's why we're using the Dell Precision 5530 and Lenovo ThinkPad P52s to grade the ZBook. These devices are at a similar price level.
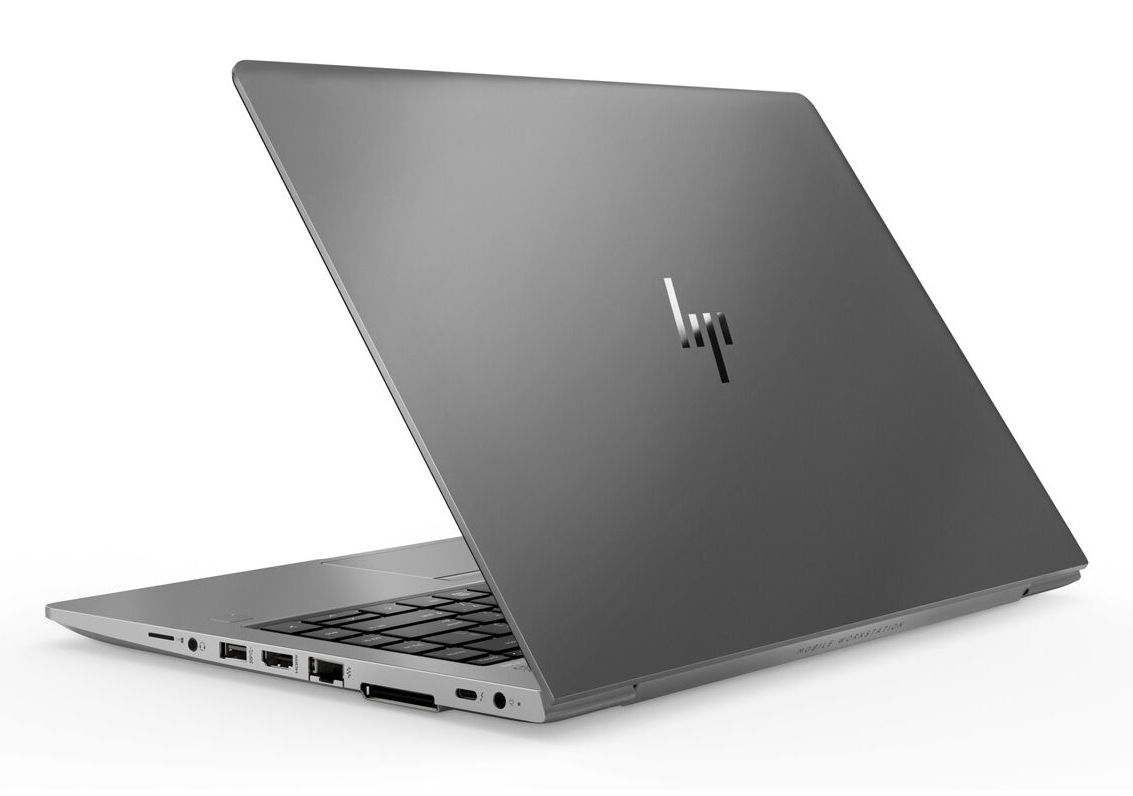
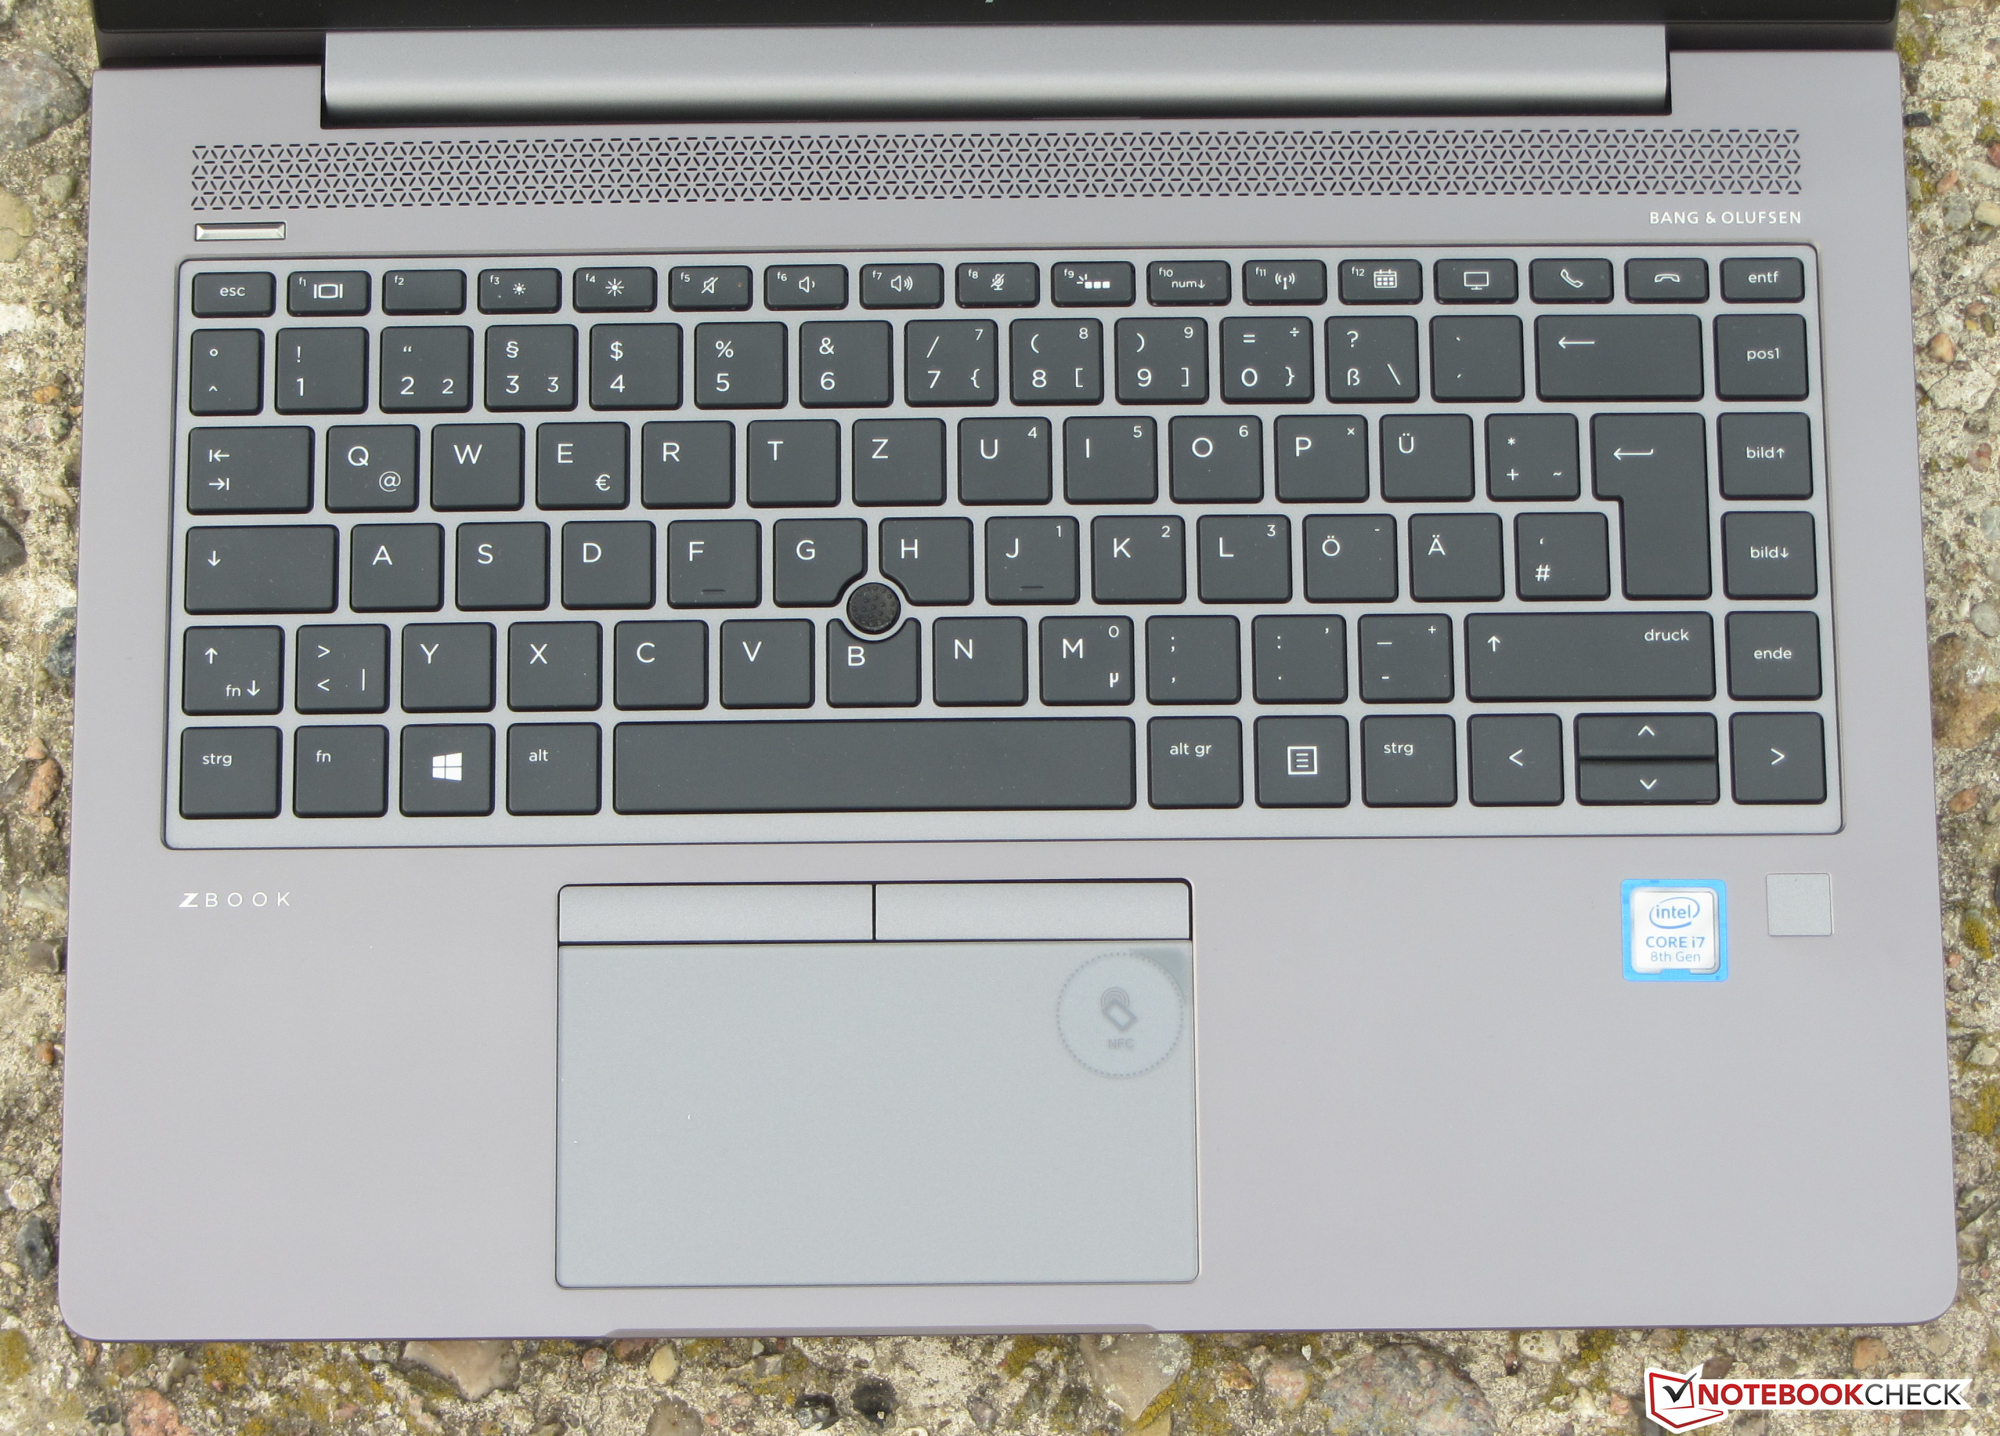
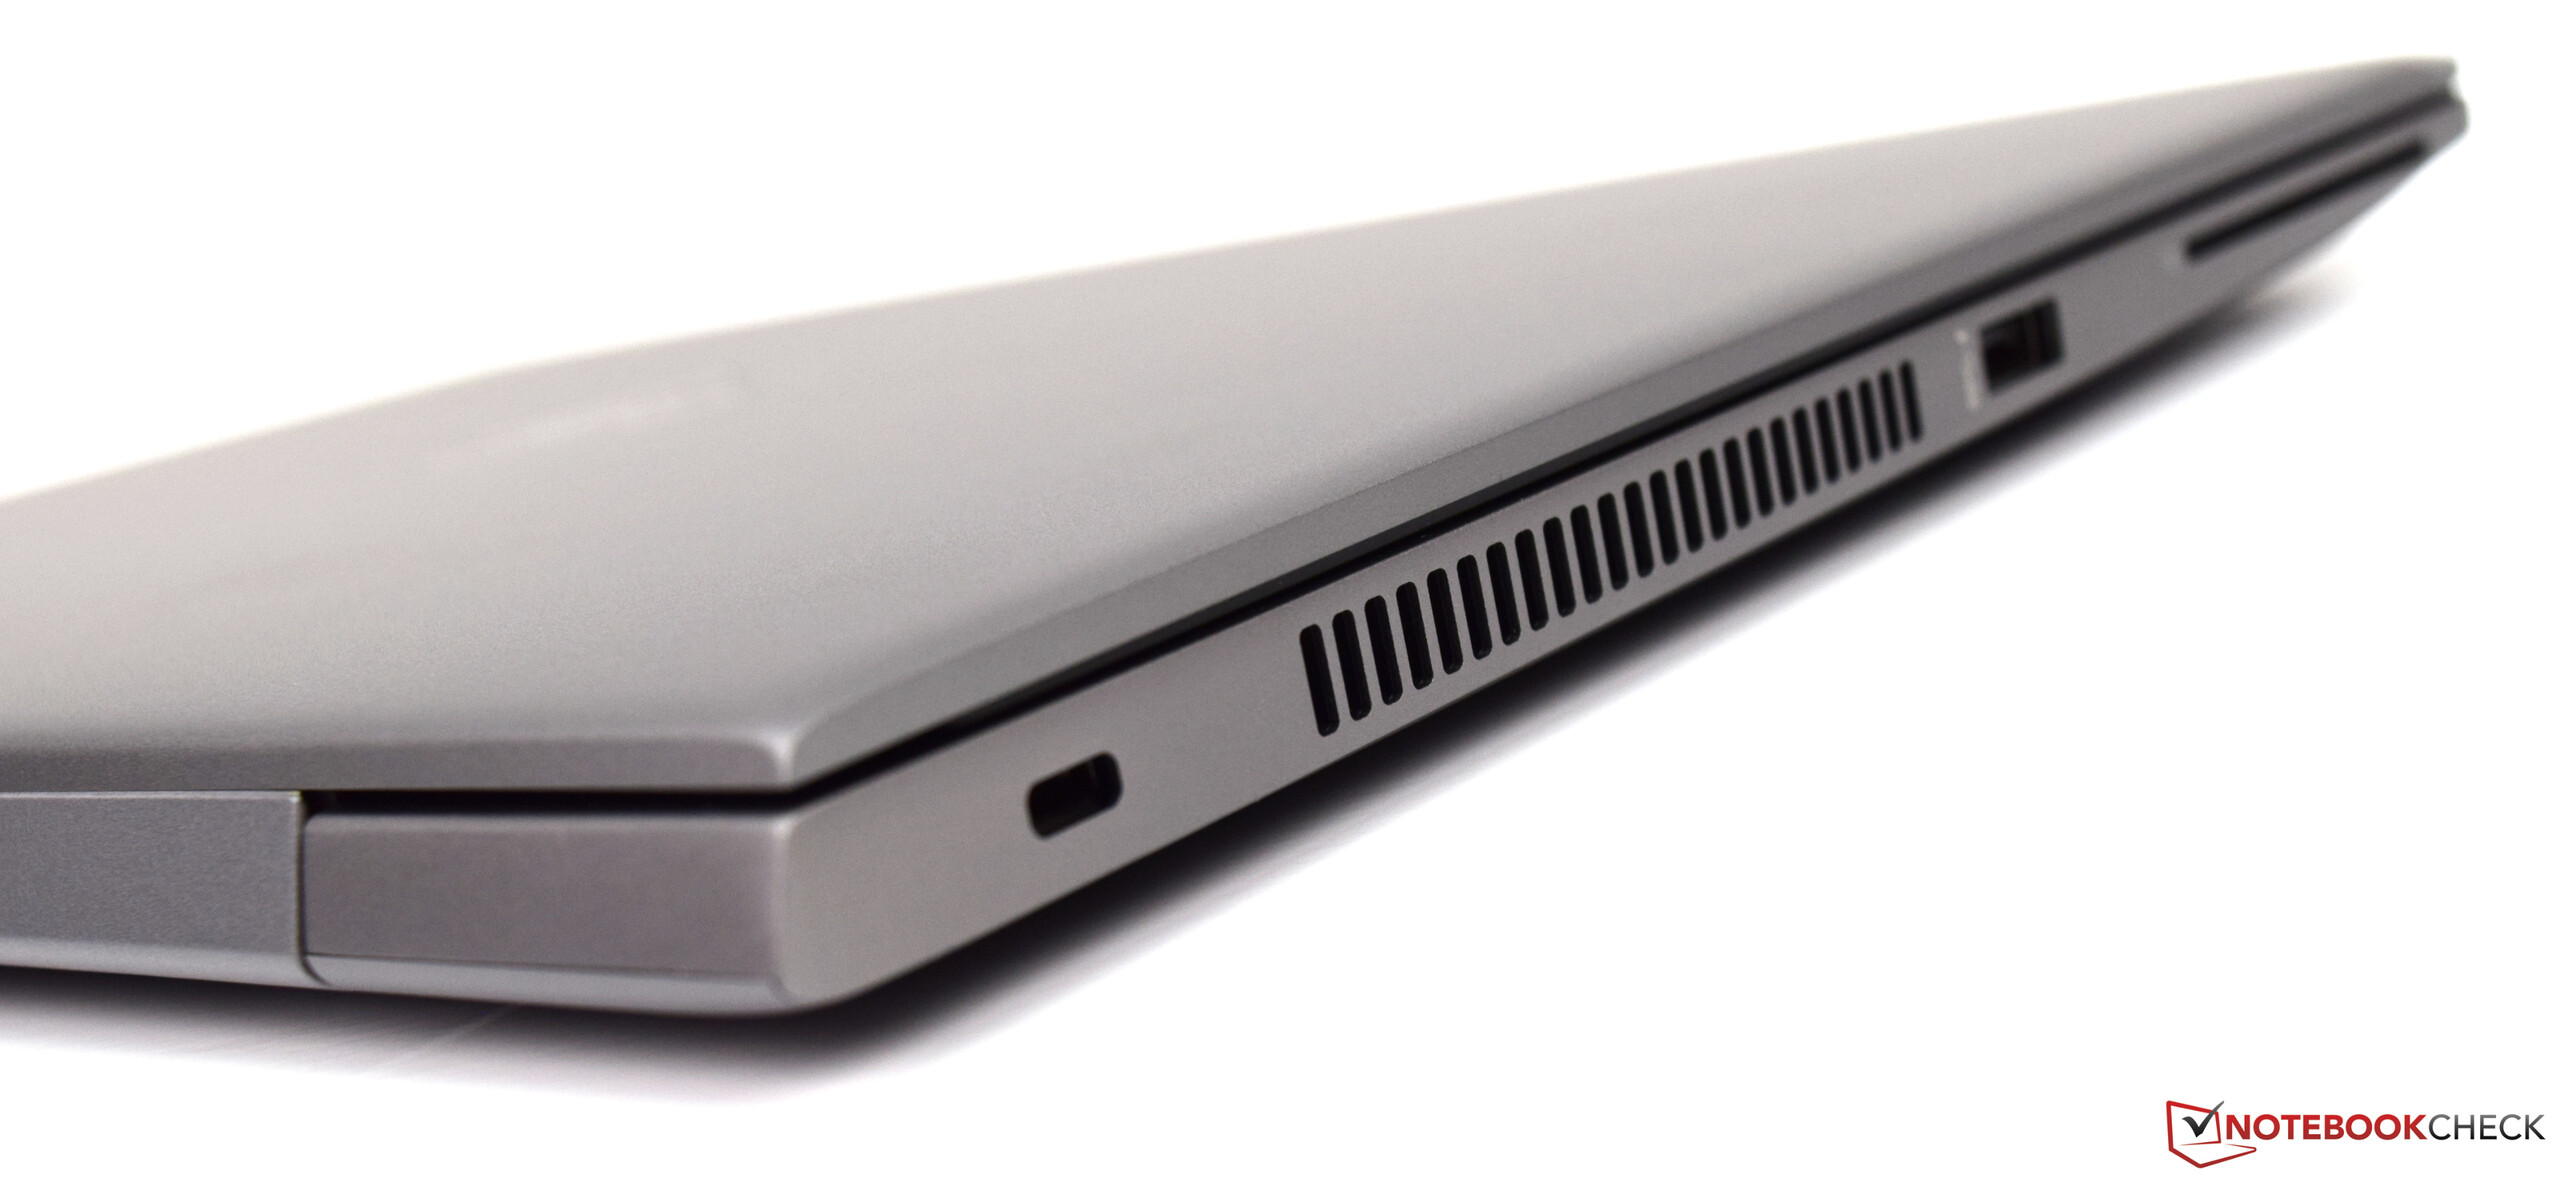
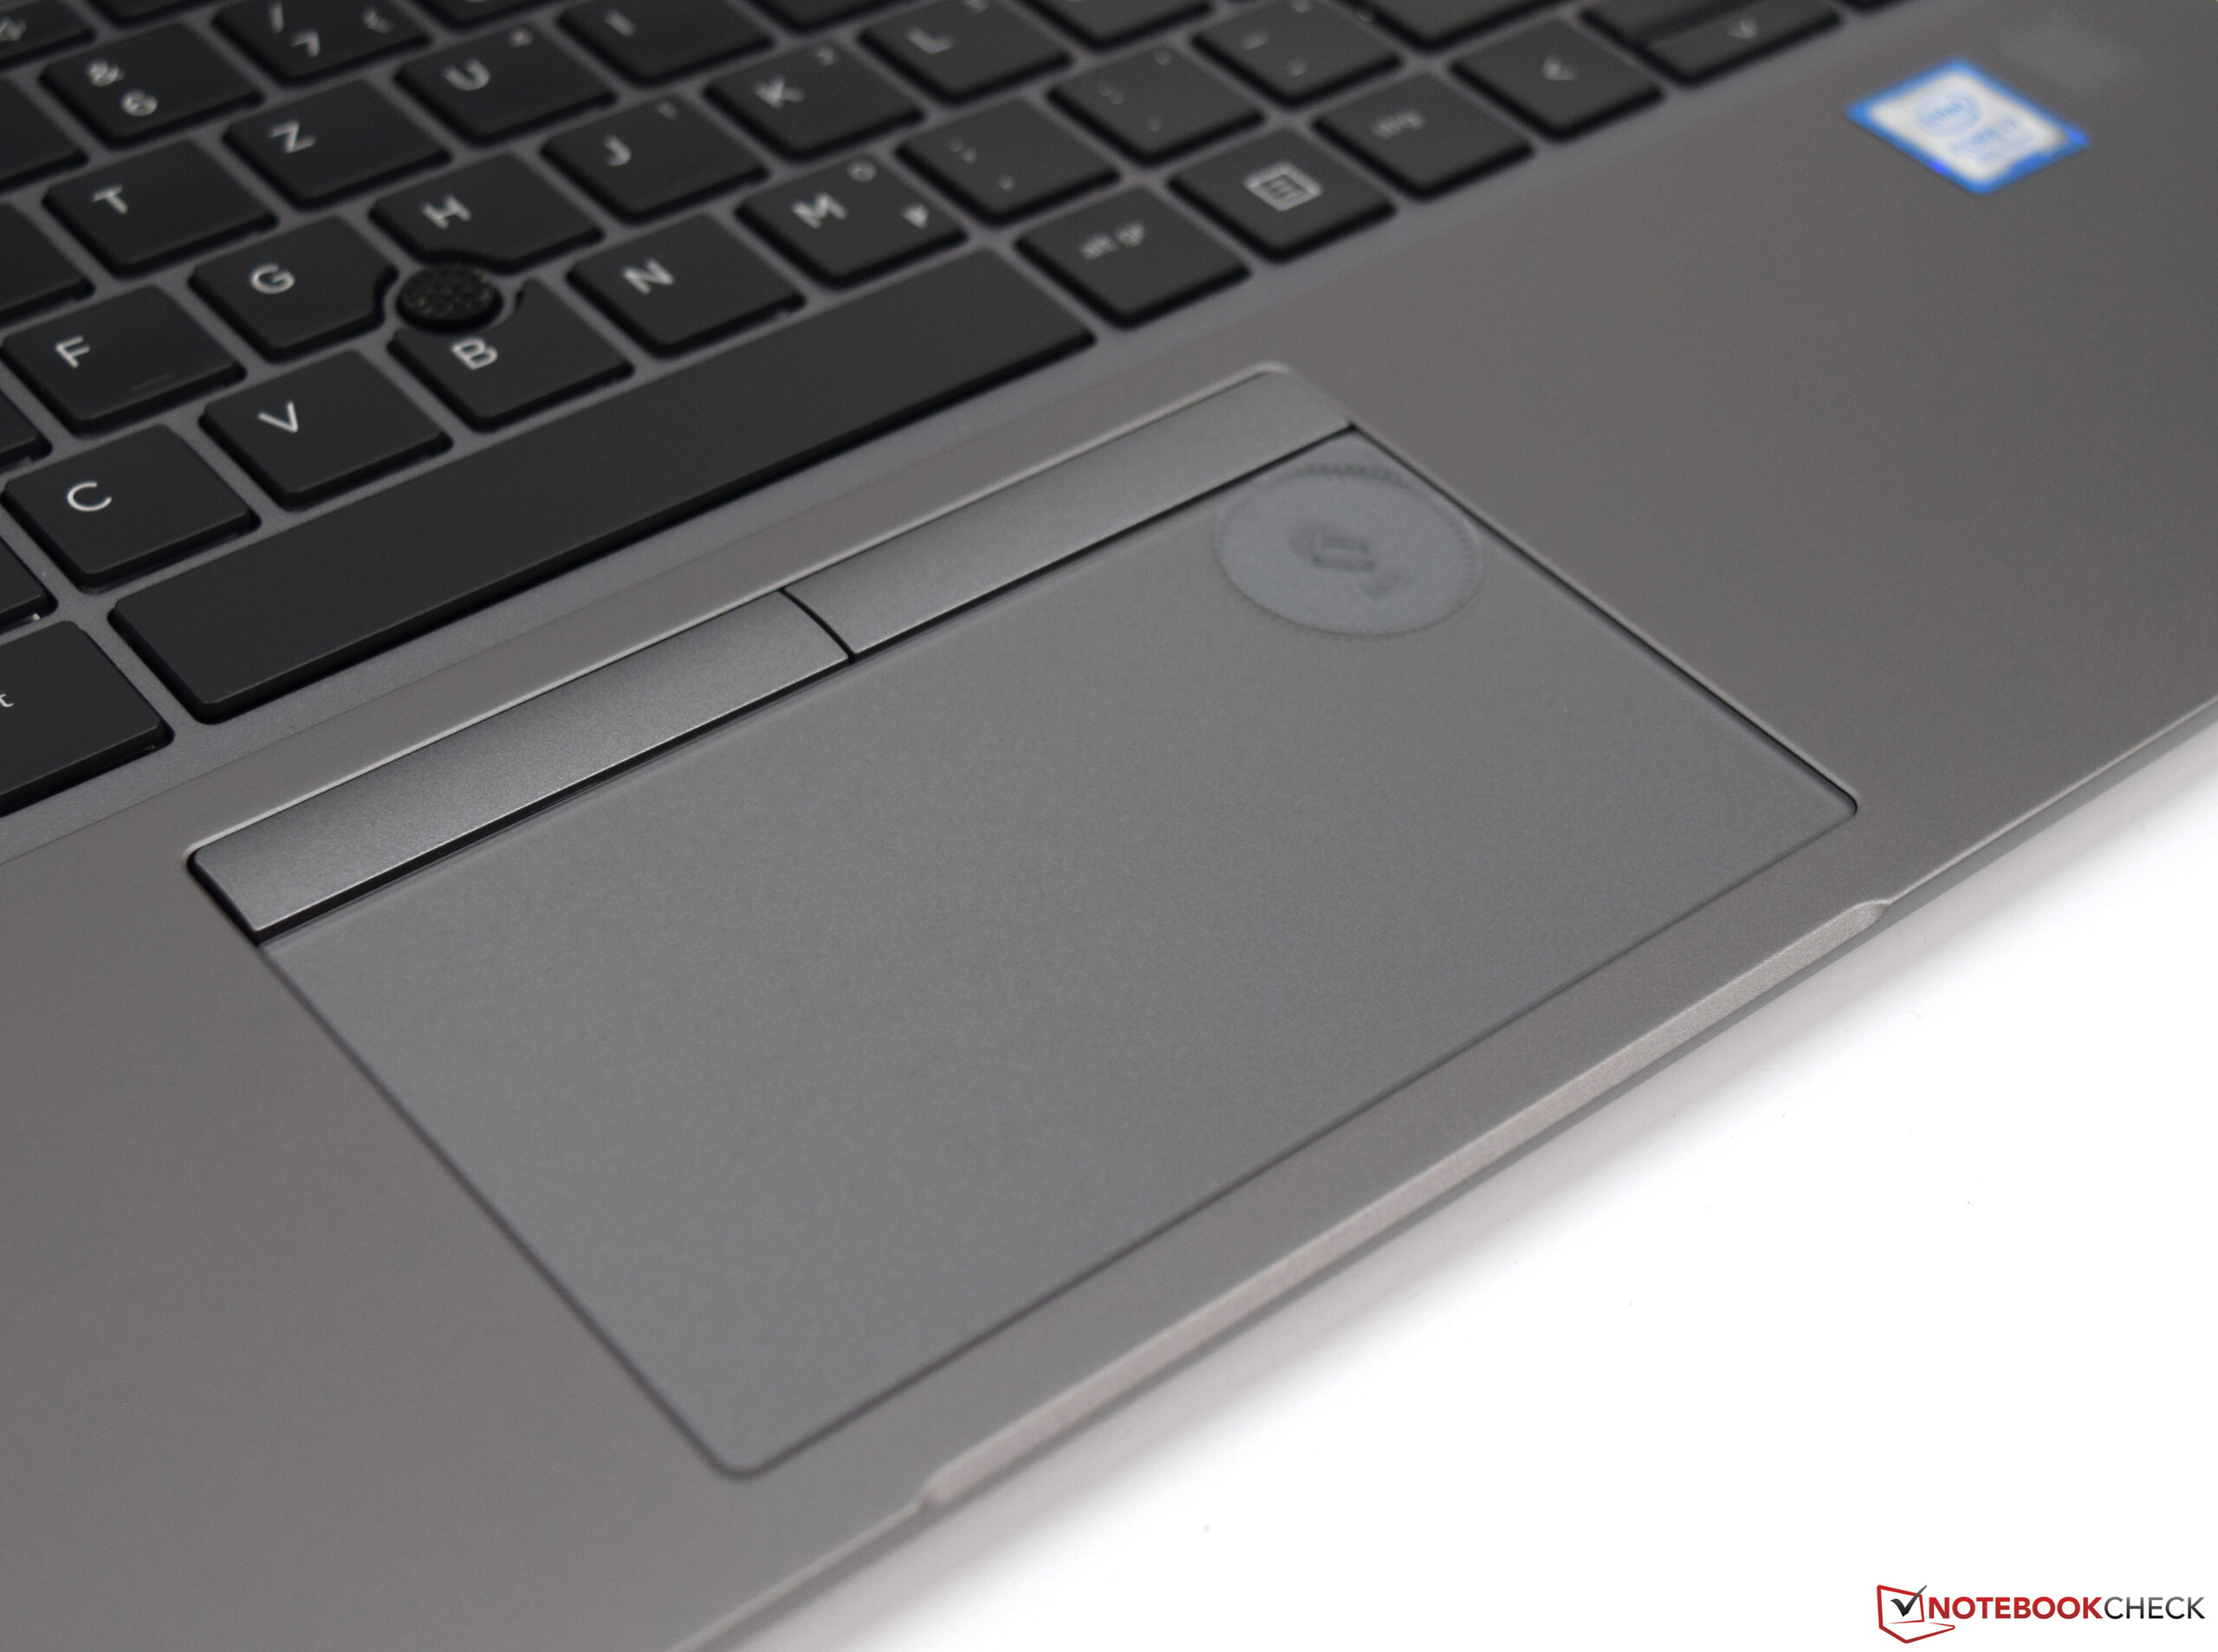
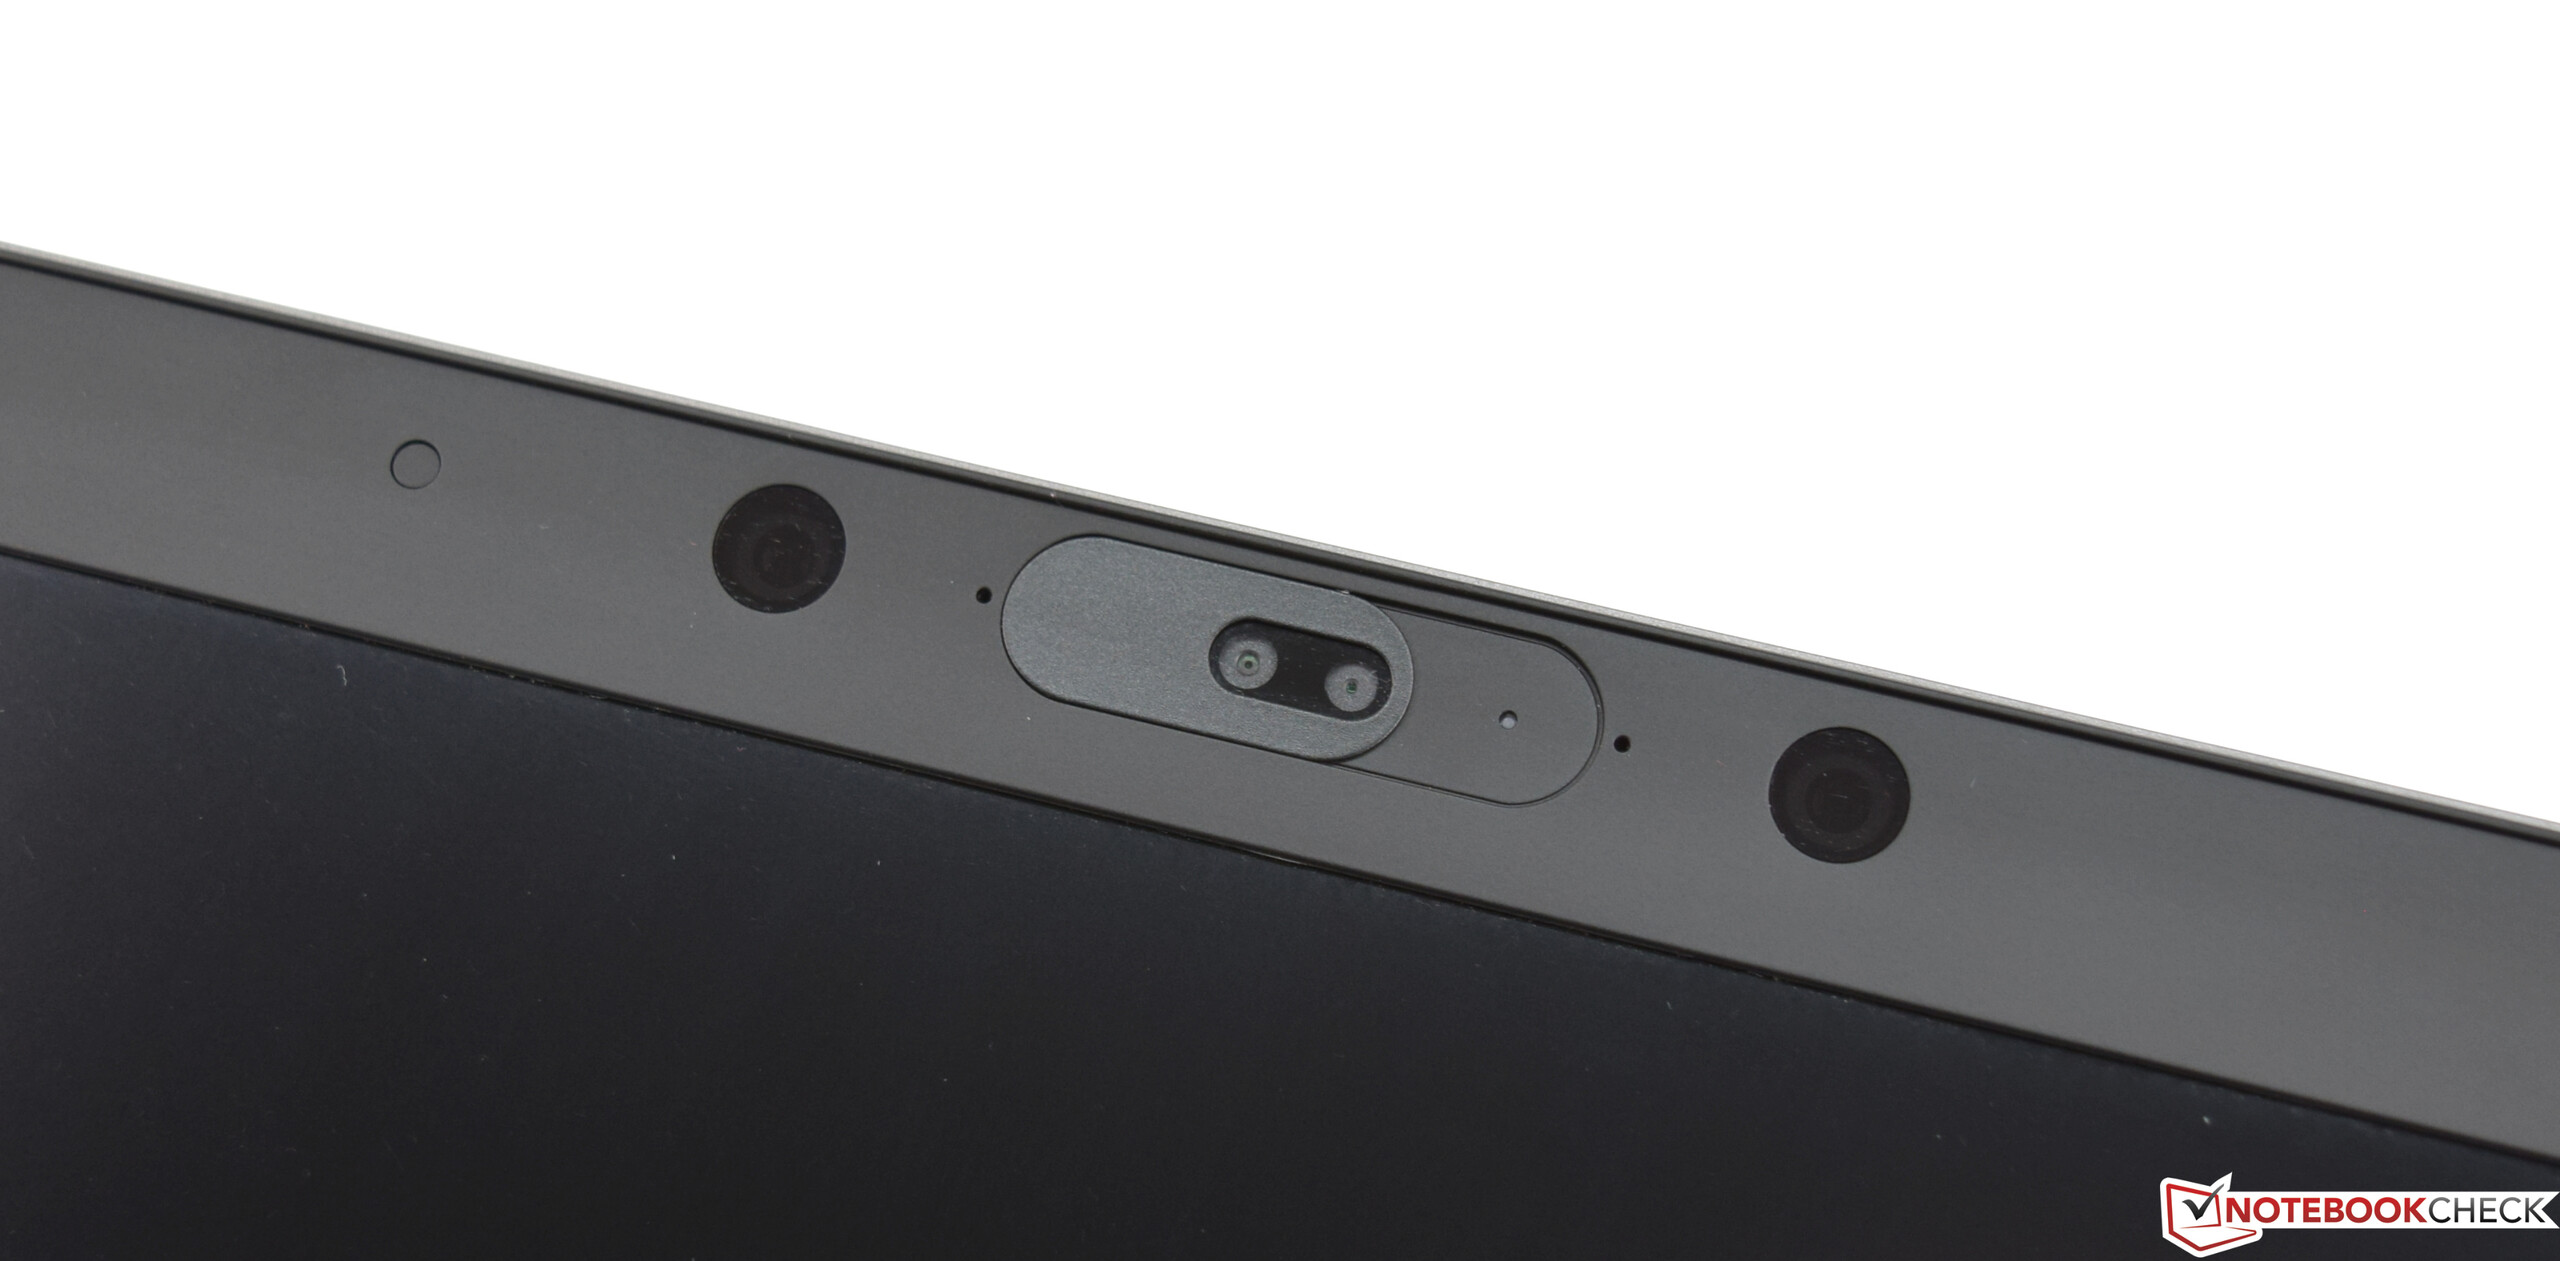
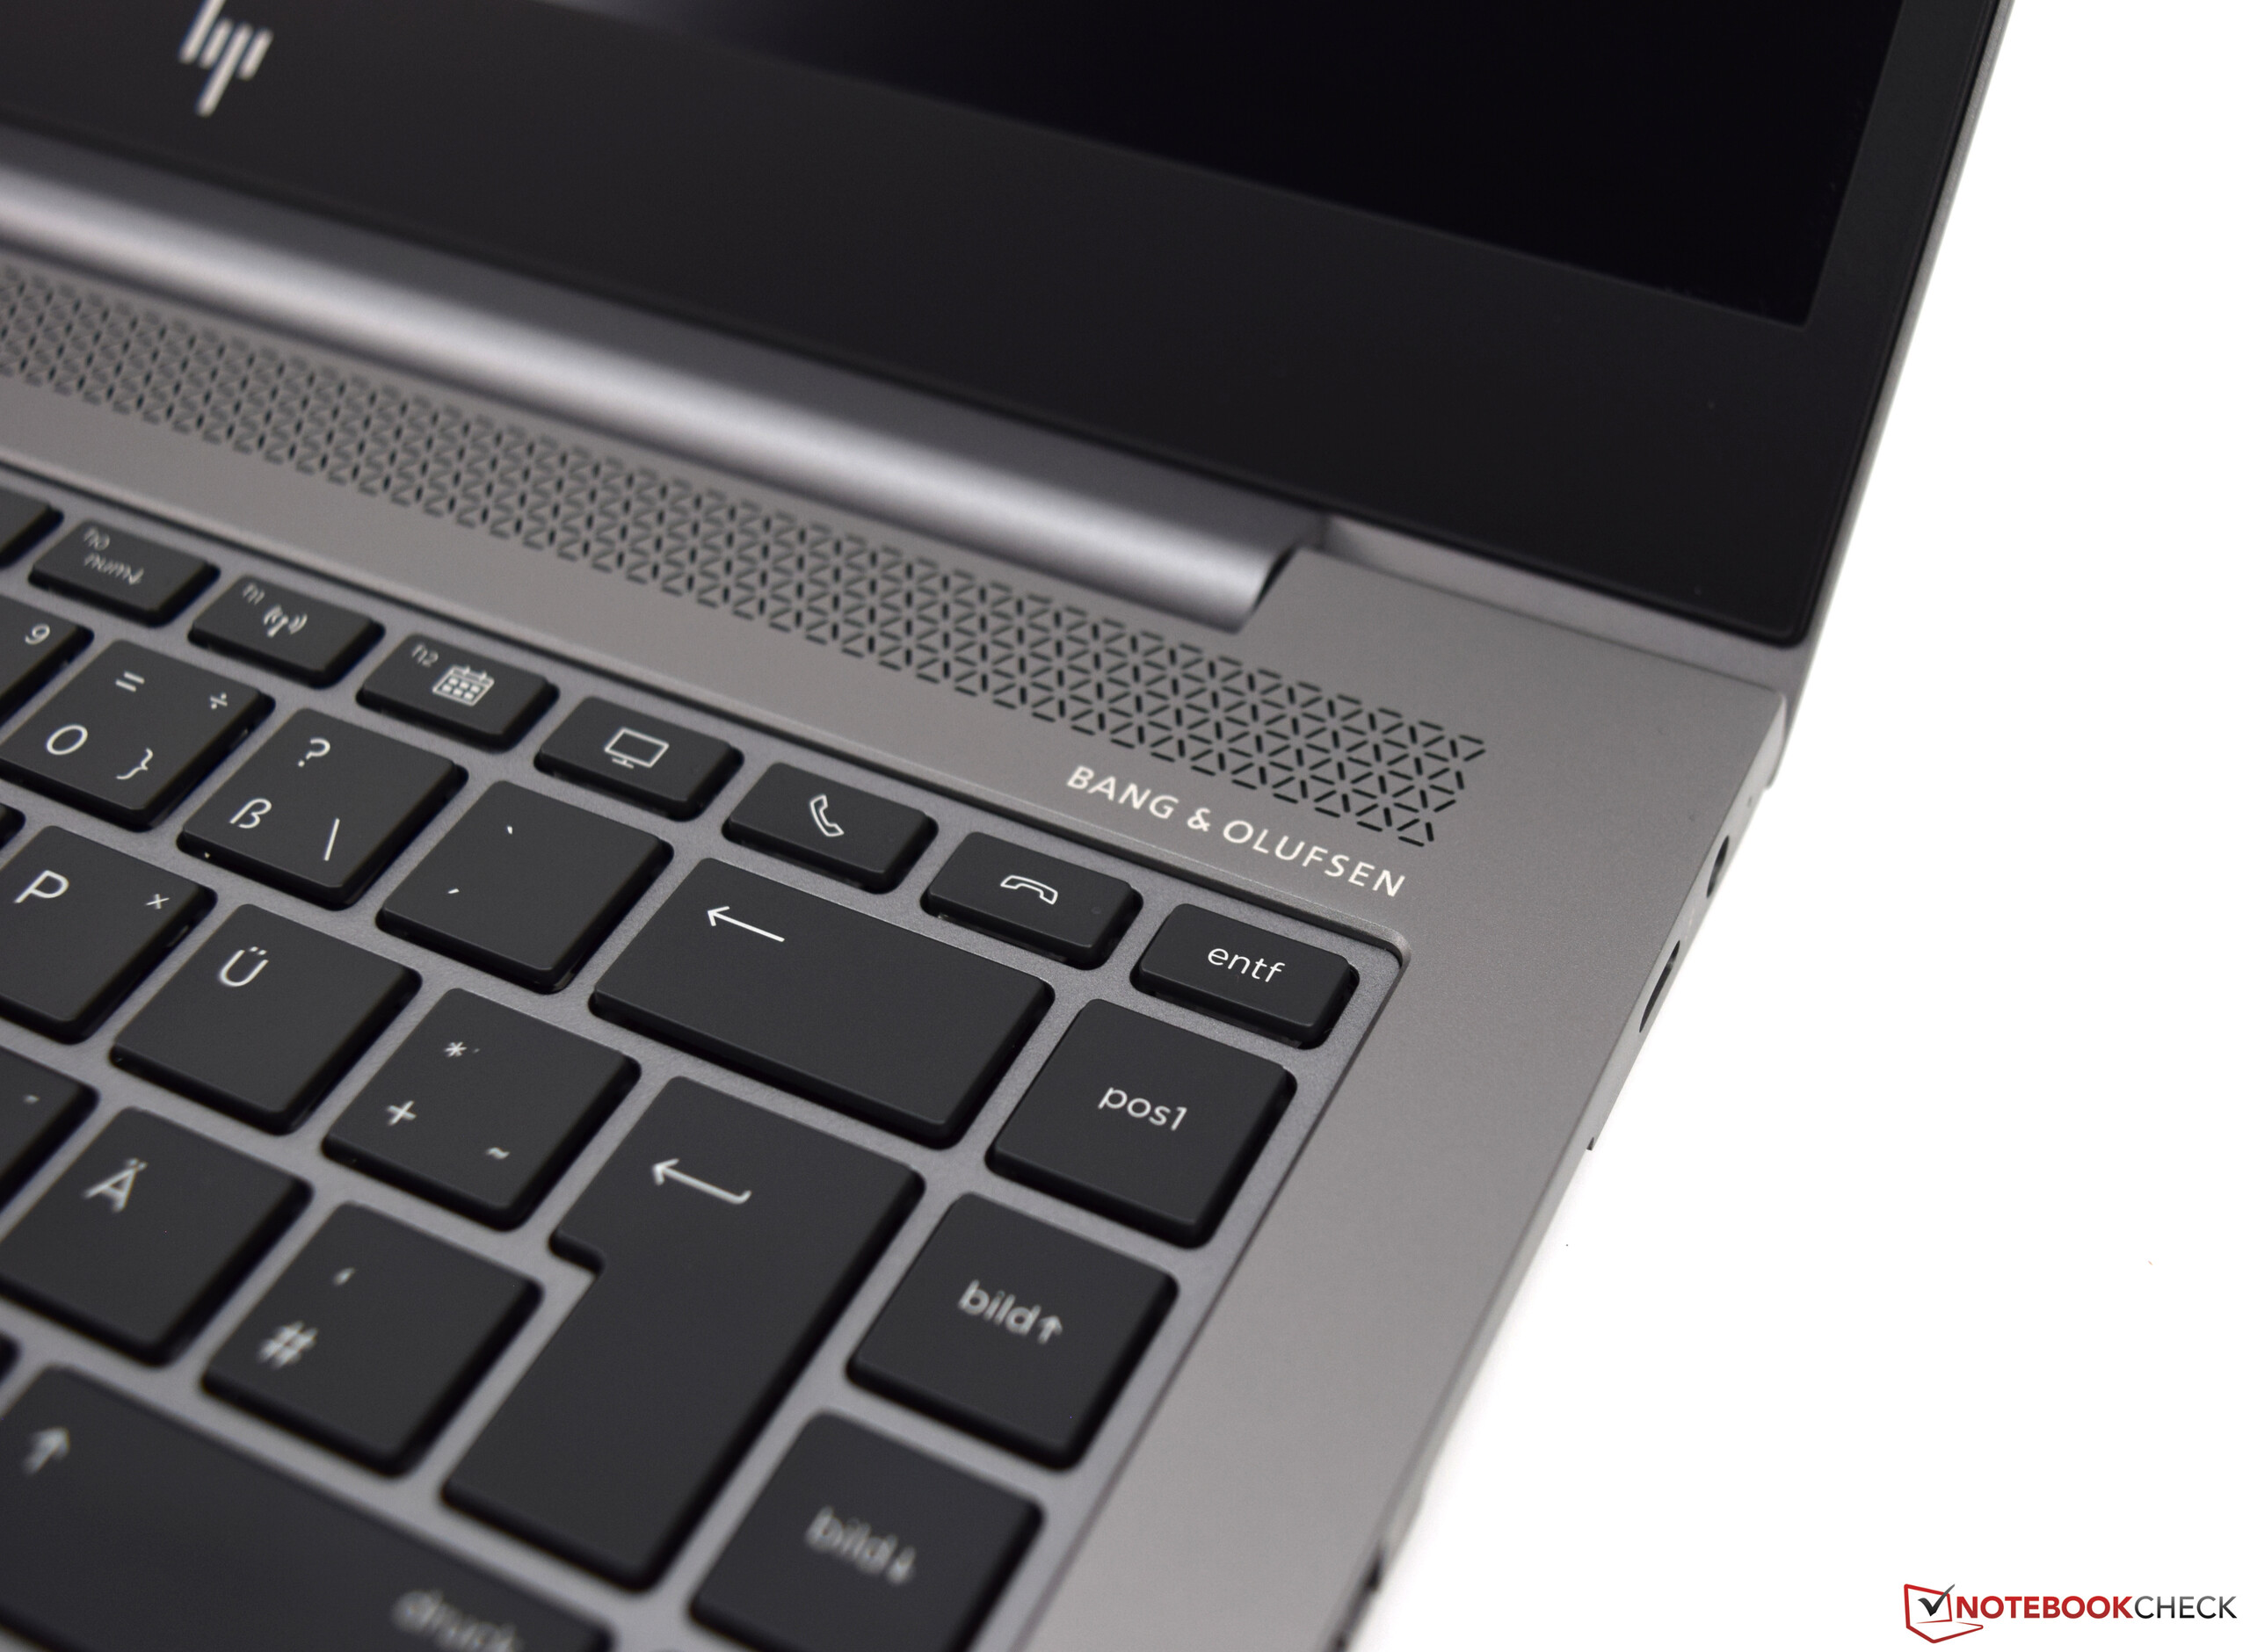
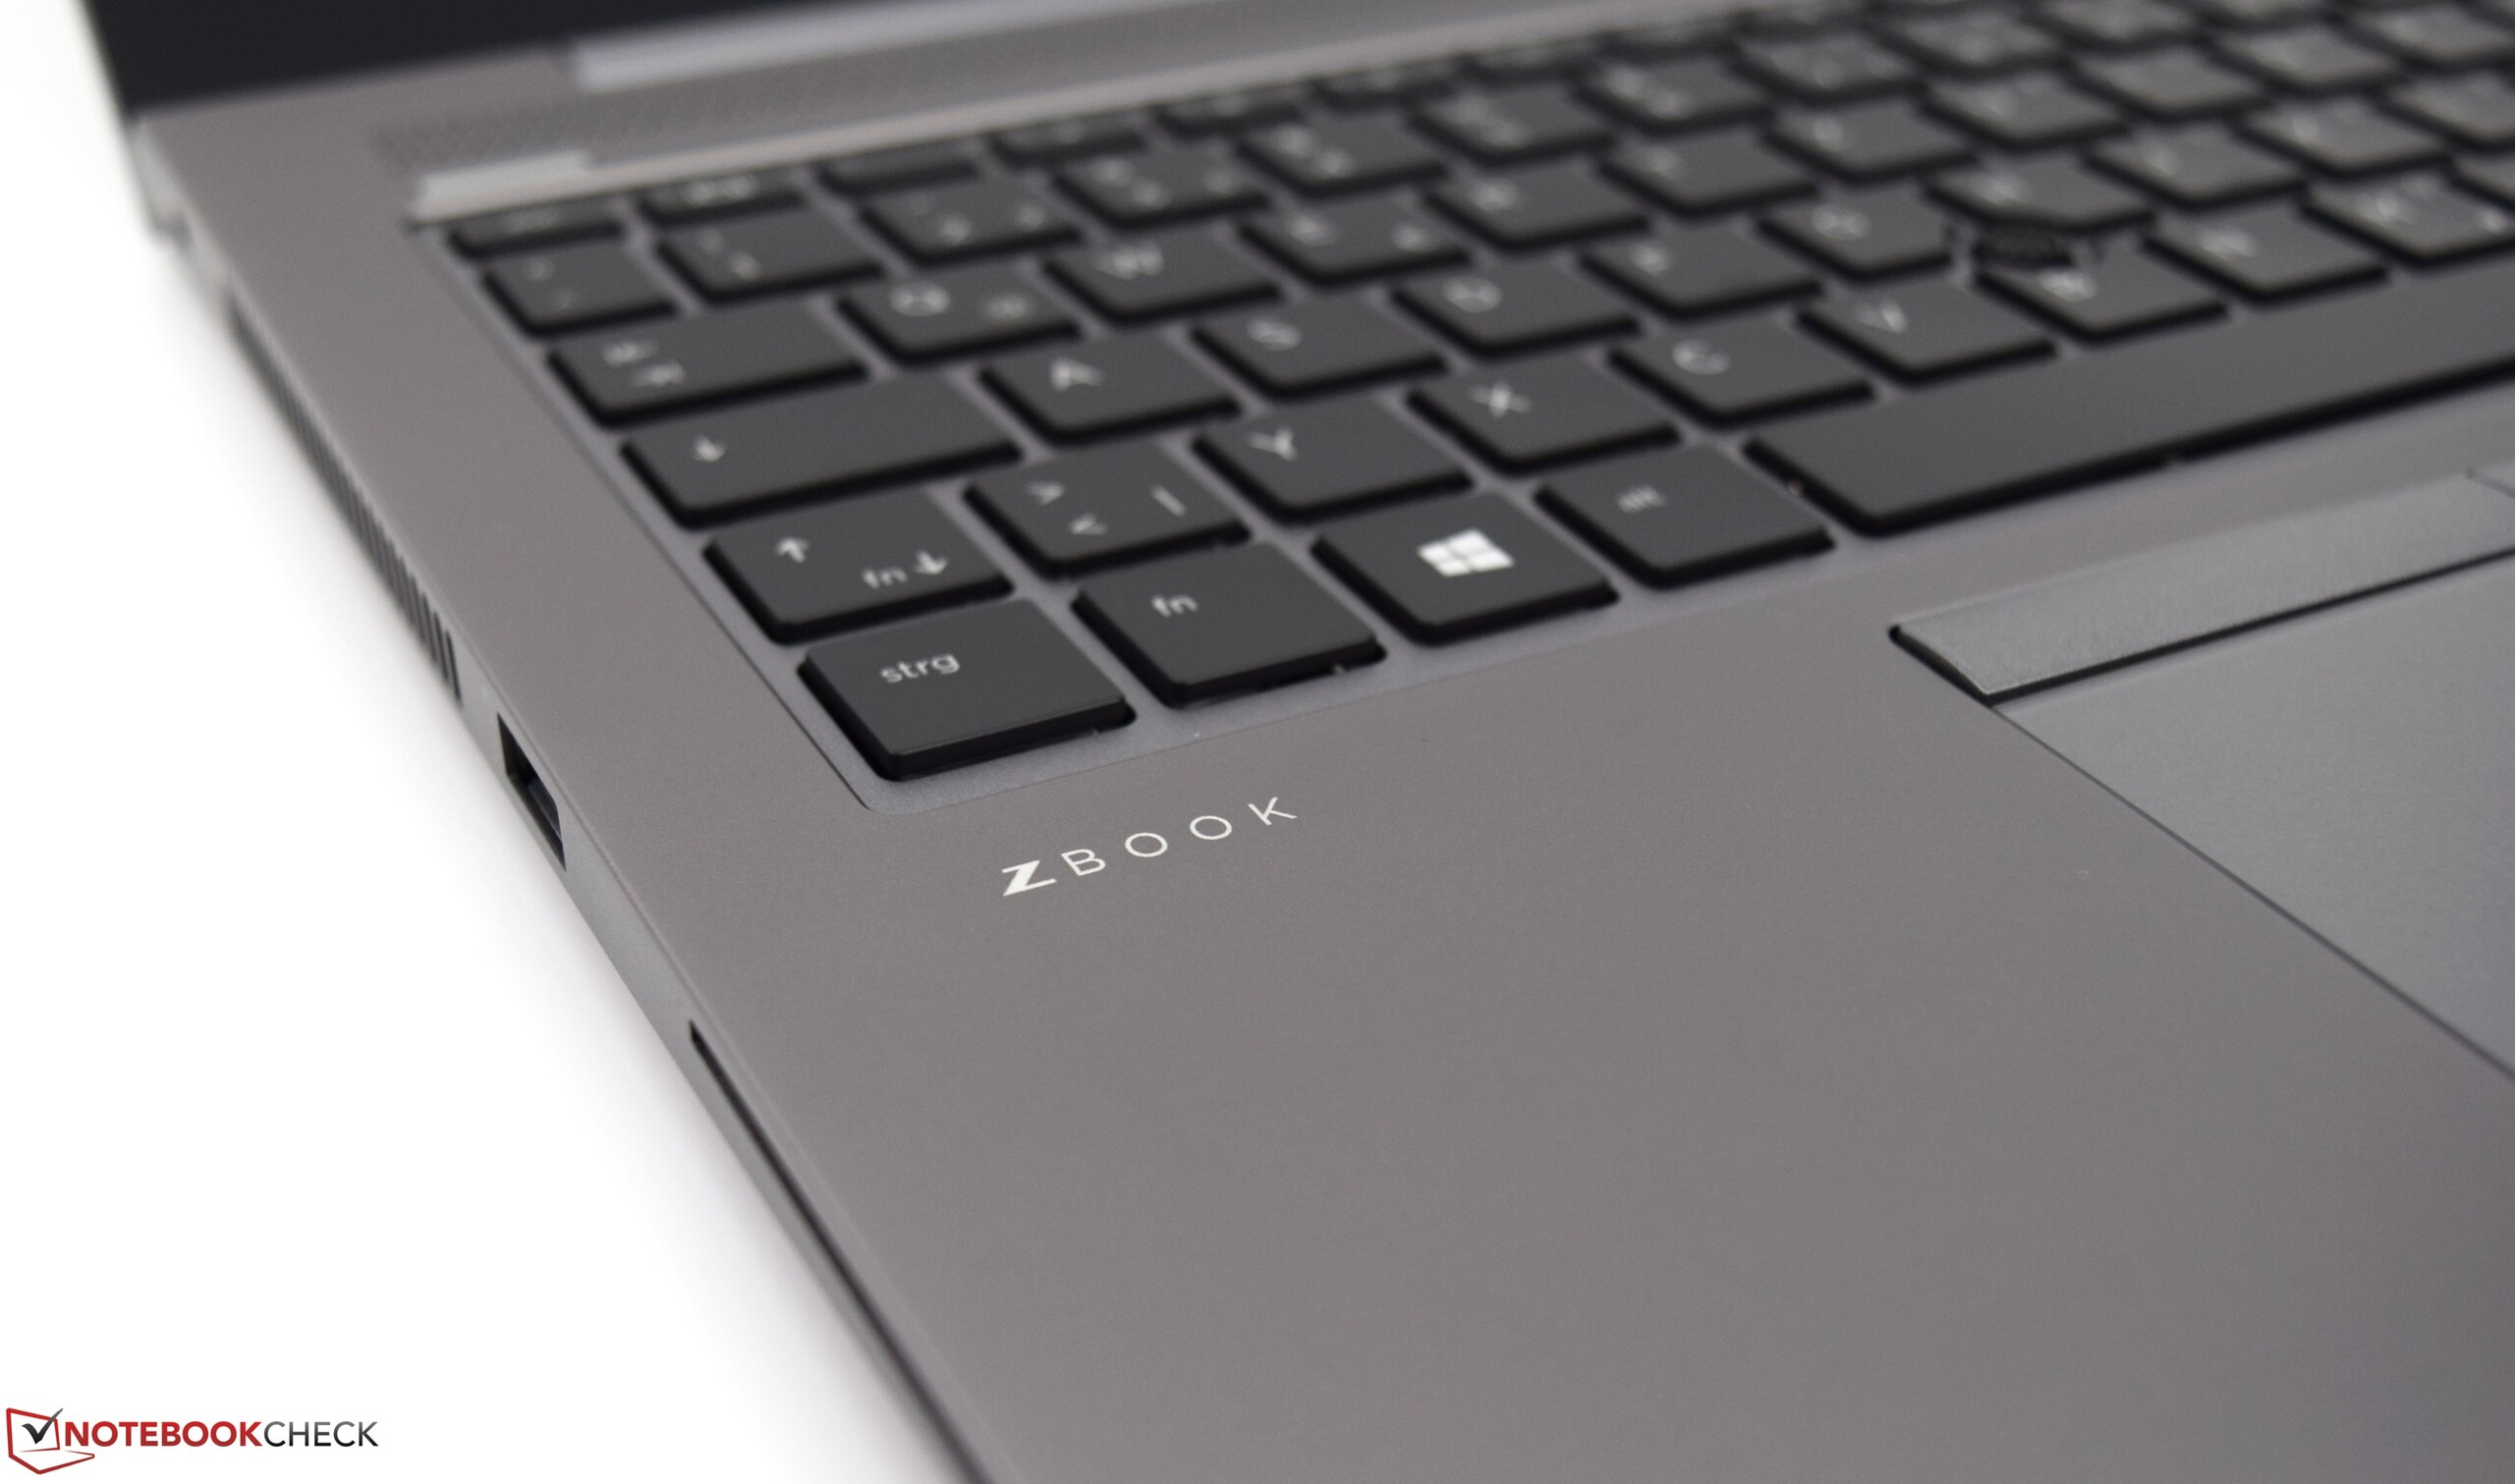
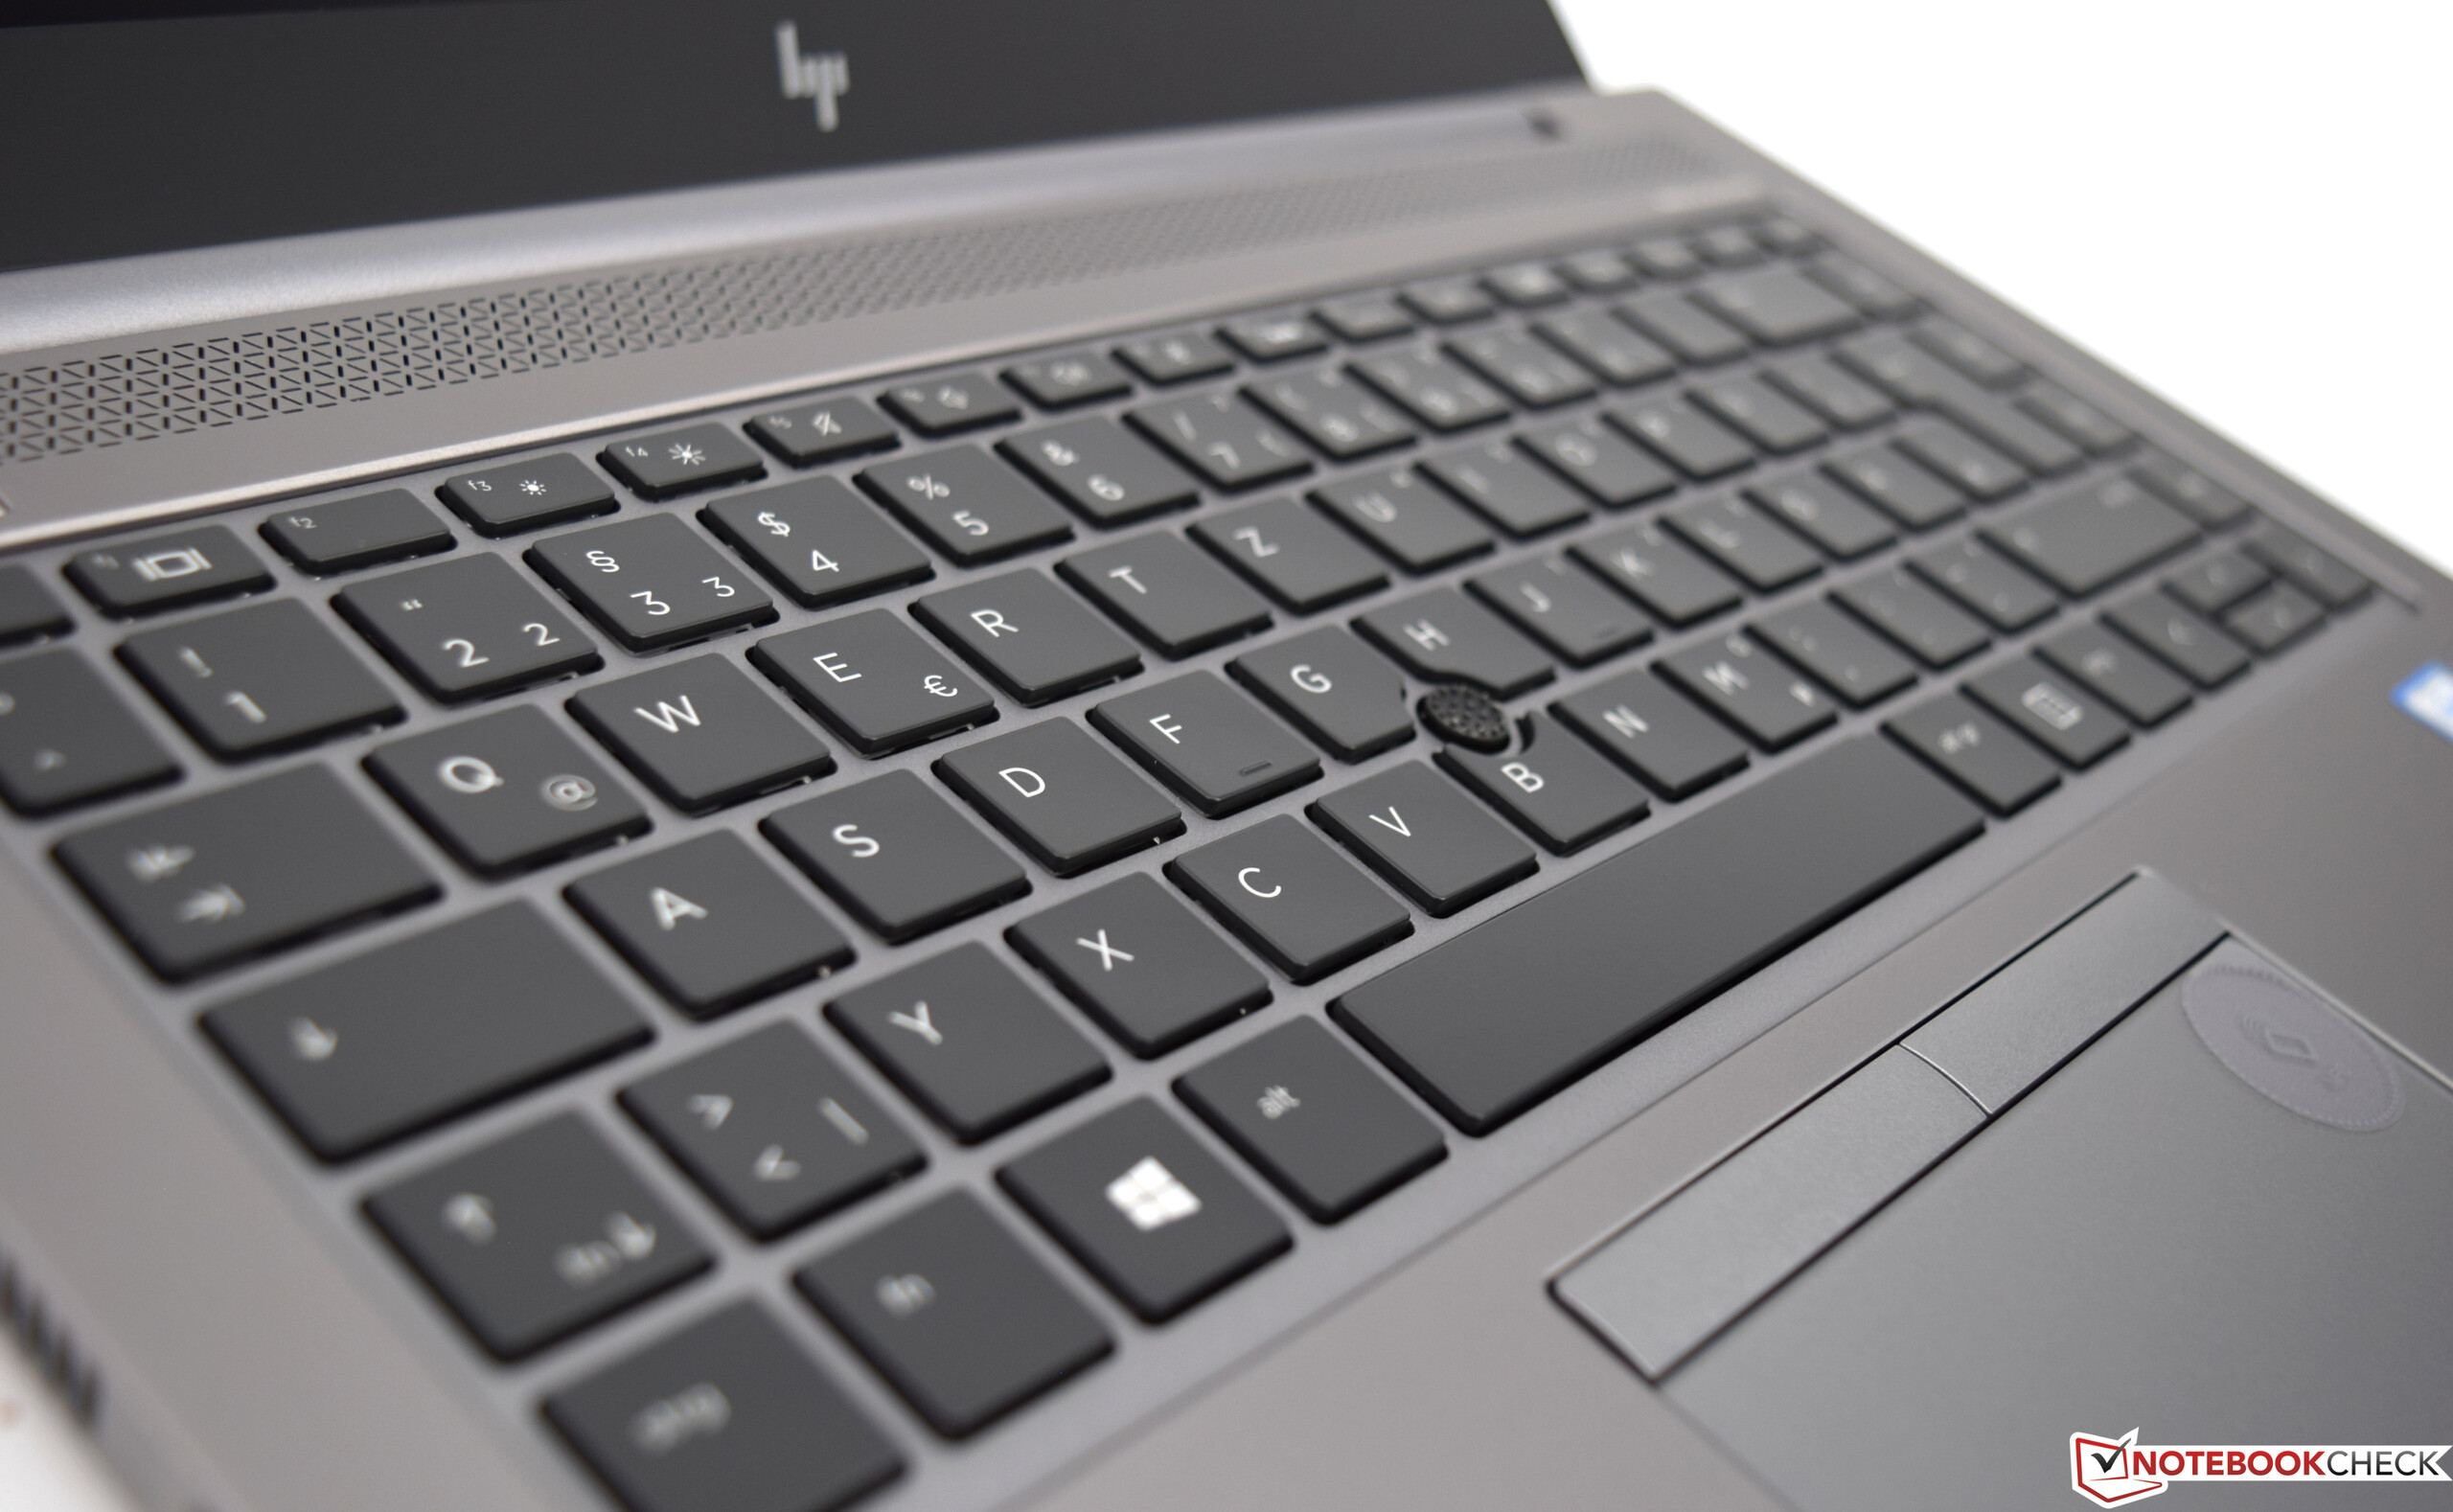
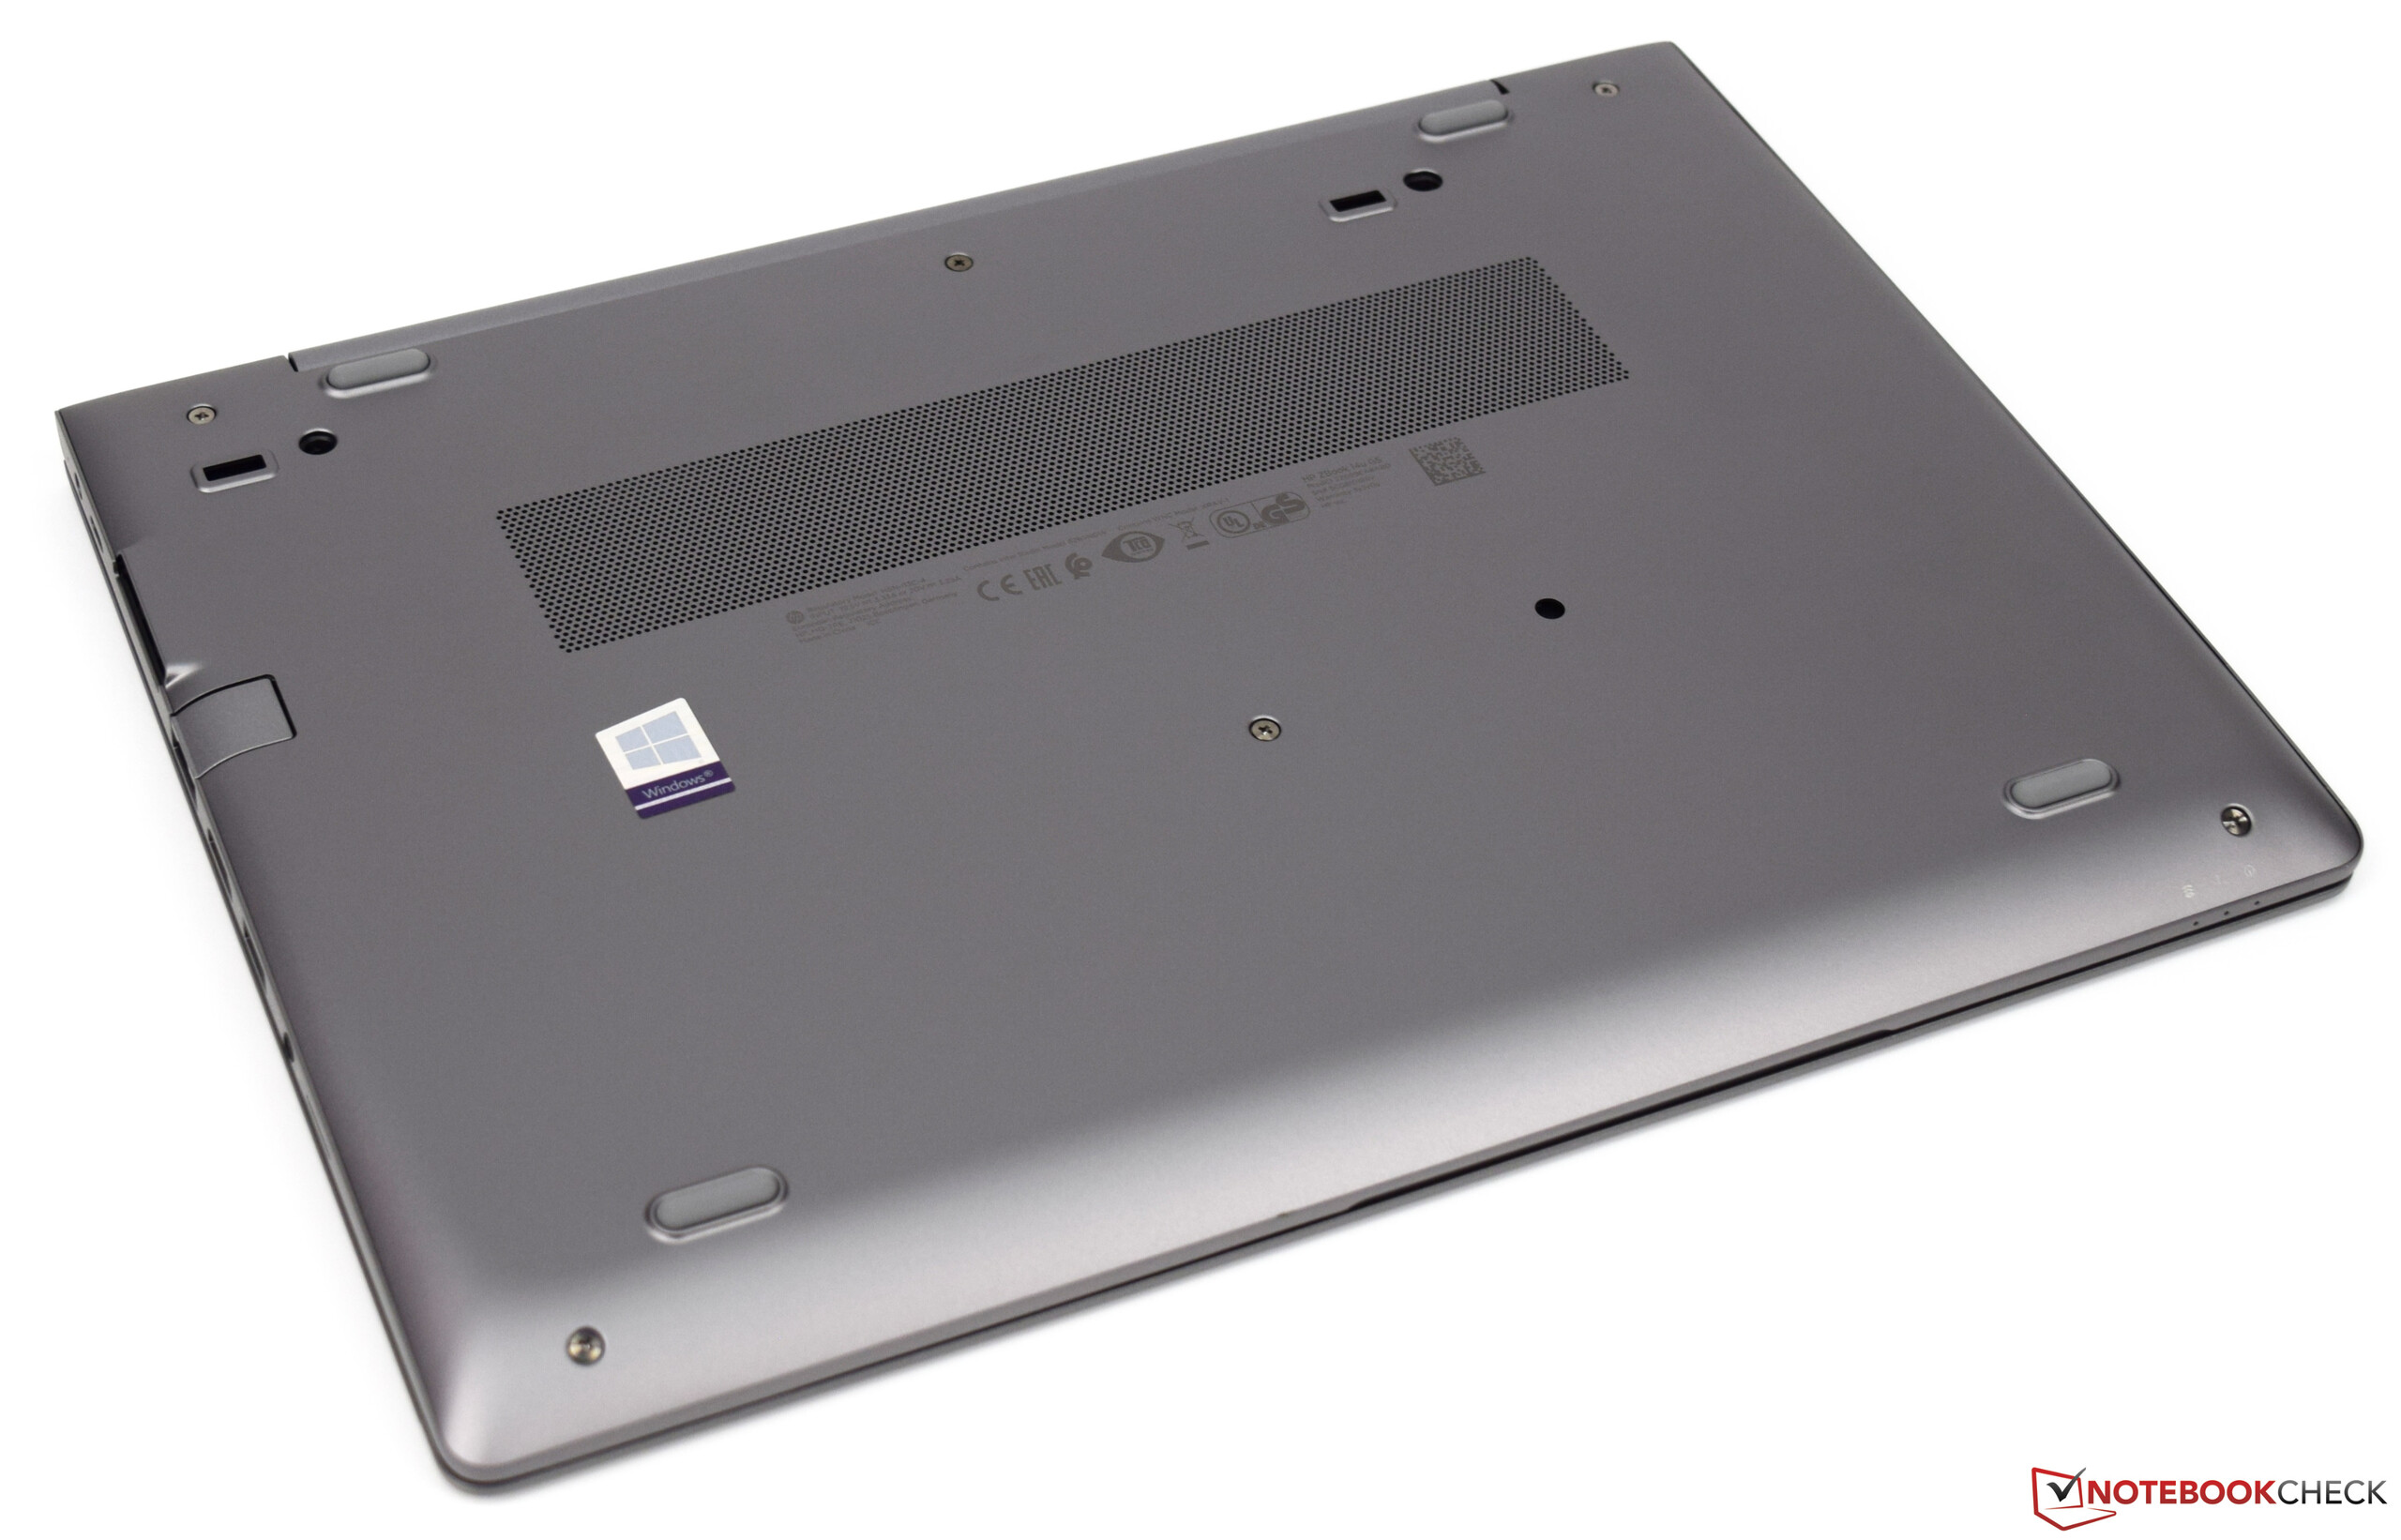
Since the ZBook 14u G6 is identical in construction to the ZBook 14u G5 and the EliteBook 840 G5, we won't go into the case, the connectivity, the input devices and the speakers. The corresponding information can be found in our reviews for the ZBook 14u G5 and the EliteBook 840 G5.
#compare_competitor
Rating | Date | Model | Weight | Height | Size | Resolution | Price |
|---|---|---|---|---|---|---|---|
| 81 % v7 (old) | 10 / 2019 | HP ZBook 14u G6 6TP71EA i7-8565U, Radeon Pro WX 3200 | 1.5 kg | 17.9 mm | 14.00" | 1920x1080 | |
| 81 % v6 (old) | 05 / 2018 | HP ZBook 14u G5-2ZB99EA i5-8550U, Radeon Pro WX 3100 | 1.6 kg | 18 mm | 14.00" | 1920x1080 | |
| 83 % v6 (old) | 10 / 2018 | Dell Precision 5530 2-in-1 i7-8706G, WX Vega M GL | 2 kg | 16 mm | 15.60" | 3840x2160 | |
| 83.2 % v6 (old) | 06 / 2018 | Lenovo ThinkPad P52s-20LB000HGE i5-8550U, Quadro P500 | 2.2 kg | 20.2 mm | 15.60" | 1920x1080 |
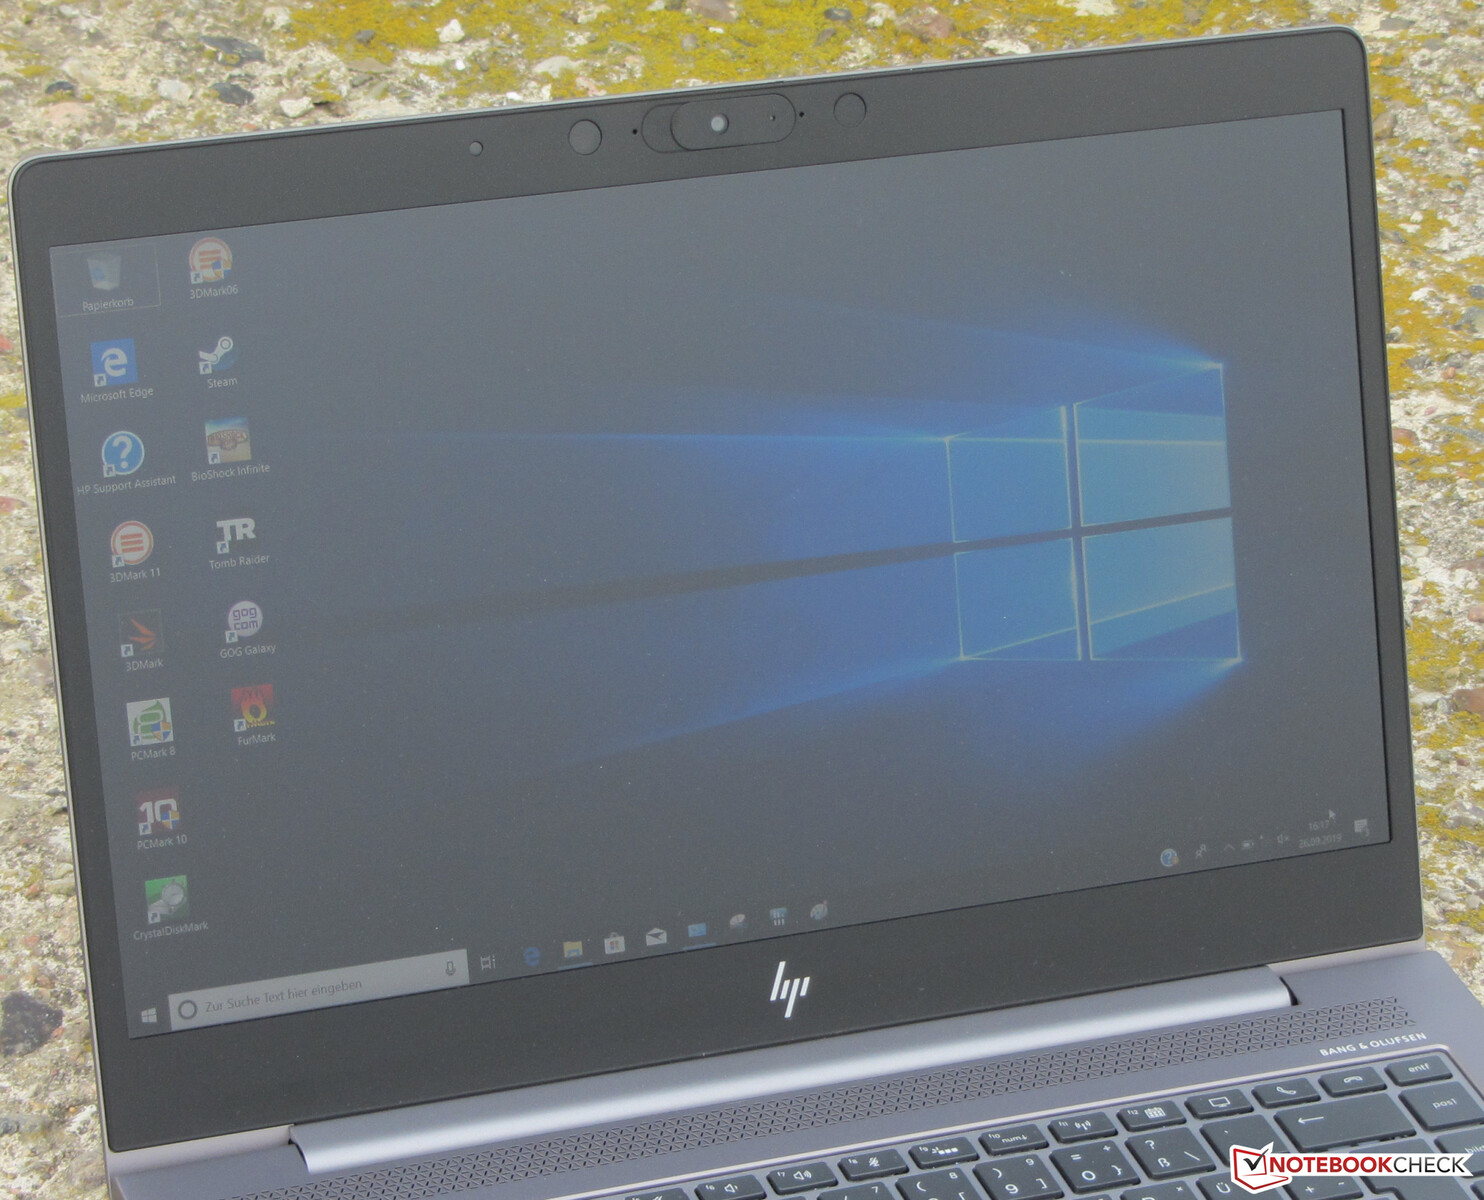
Display - The ZBook G6 comes with a great display
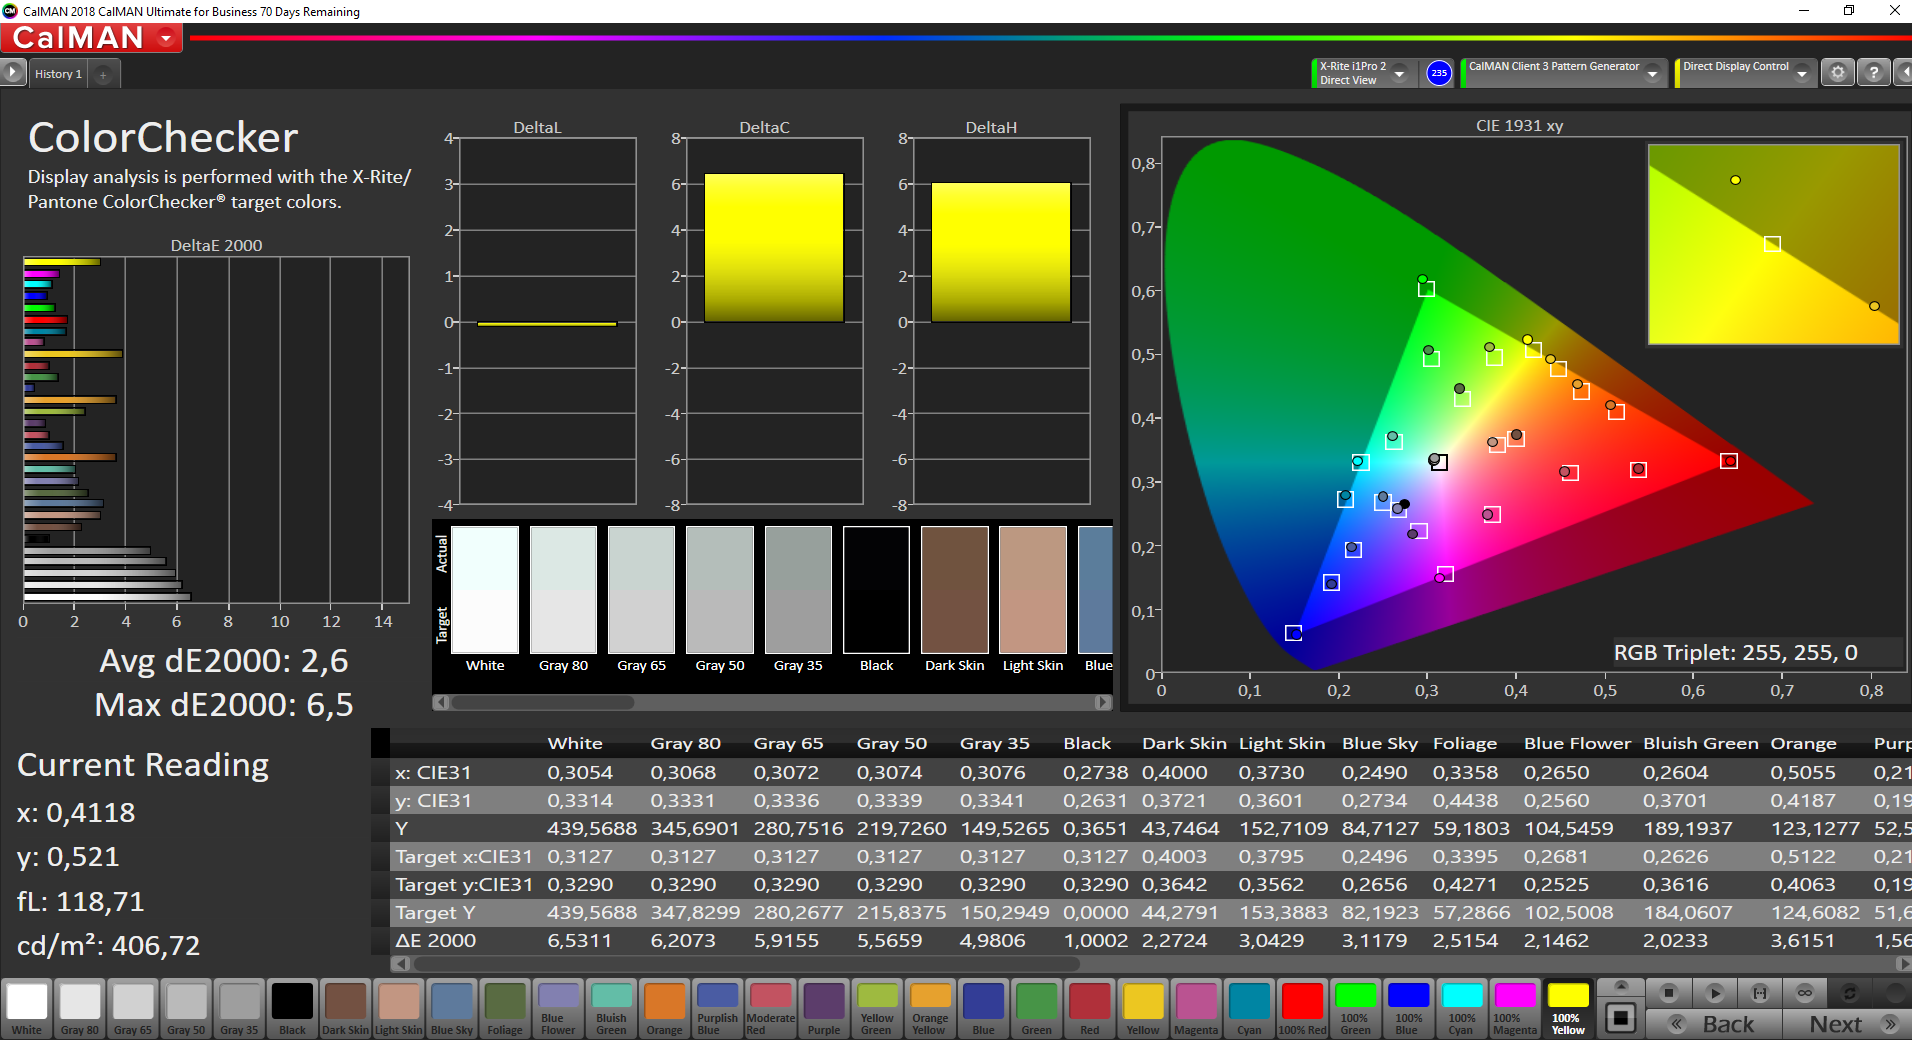
The matte 14-inch display of the ZBook 14 has a native resolution of 1920x1080 pixels. Brightness (420.2 cd/m²) and contrast (1410:1) are good. The display offers a significantly higher maximum brightness than the display installed in the previous model. The brightness distribution is also pleasing at a value of 92%. Positive: The display doesn't show PWM flickering.
| |||||||||||||||||||||||||
Brightness Distribution: 92 %
Center on Battery: 439 cd/m²
Contrast: 1410:1 (Black: 0.31 cd/m²)
ΔE ColorChecker Calman: 2.6 | ∀{0.5-29.43 Ø4.72}
calibrated: 0.8
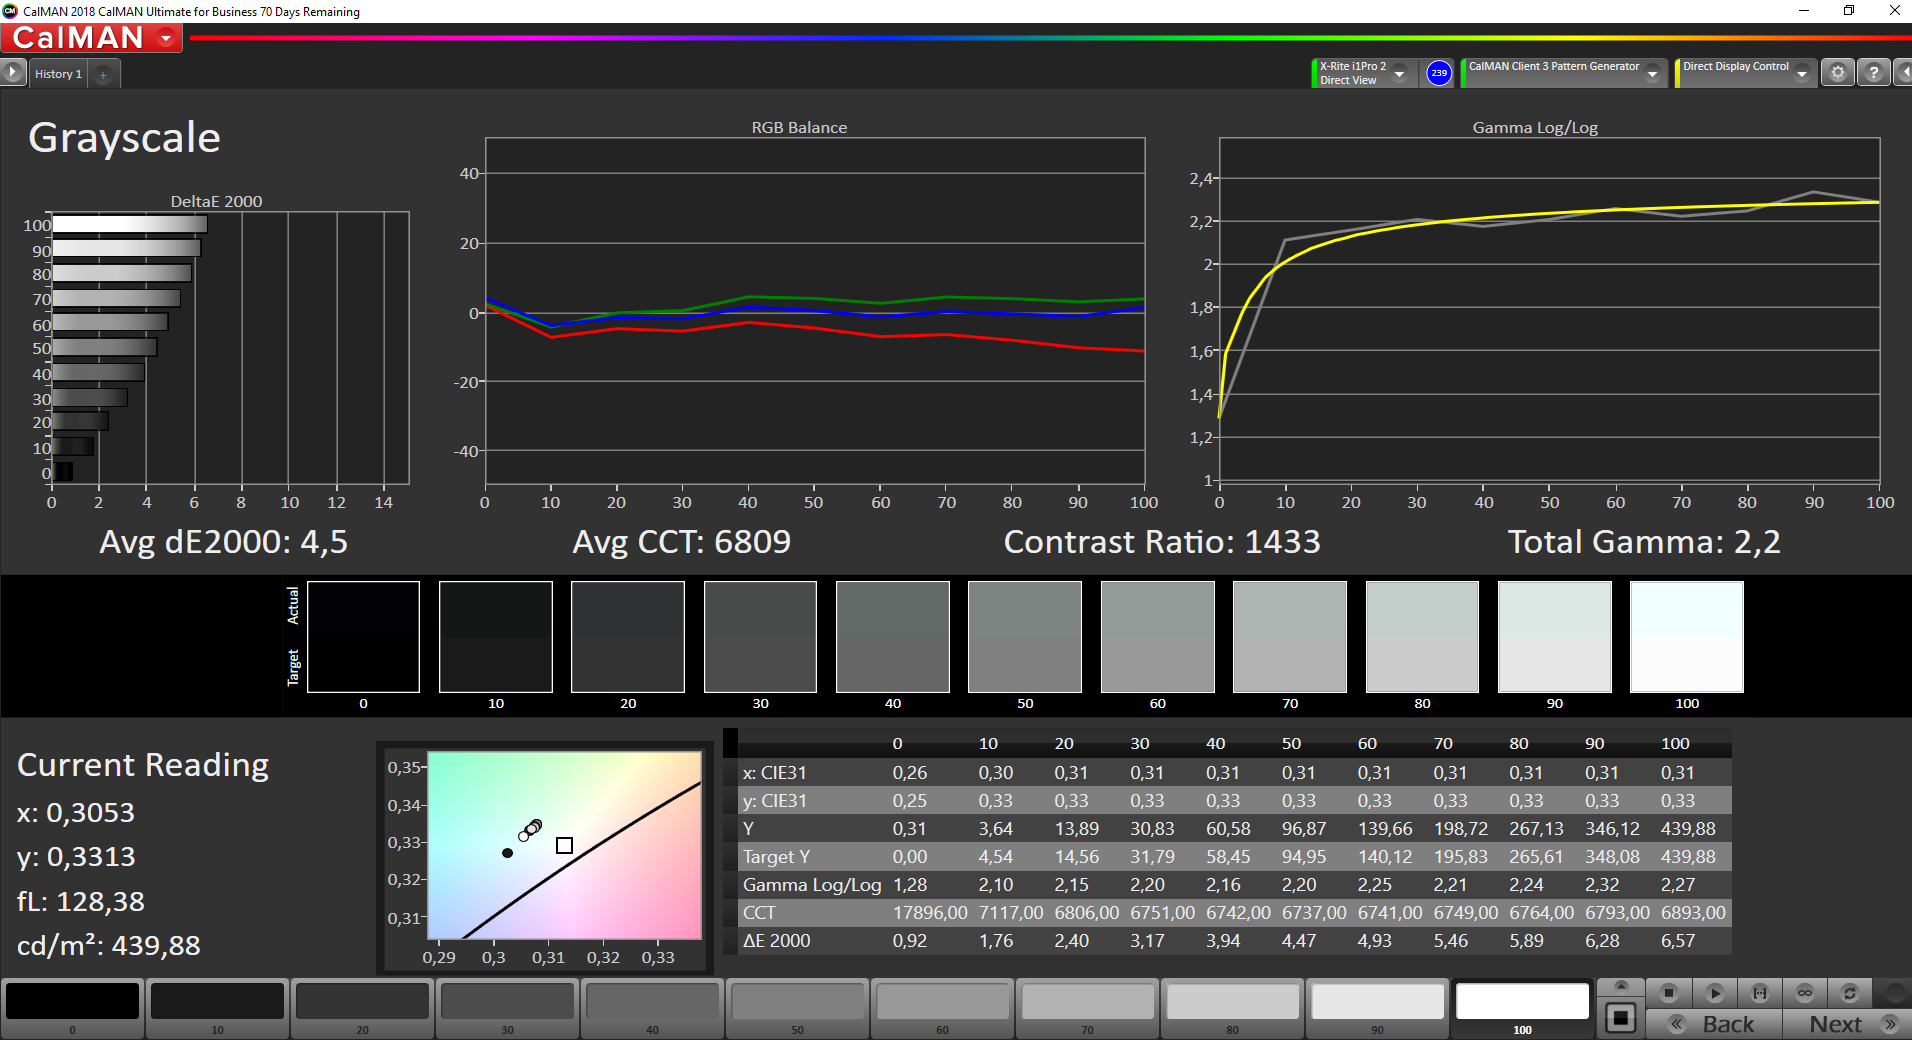
ΔE Greyscale Calman: 4.5 | ∀{0.09-98 Ø4.97}
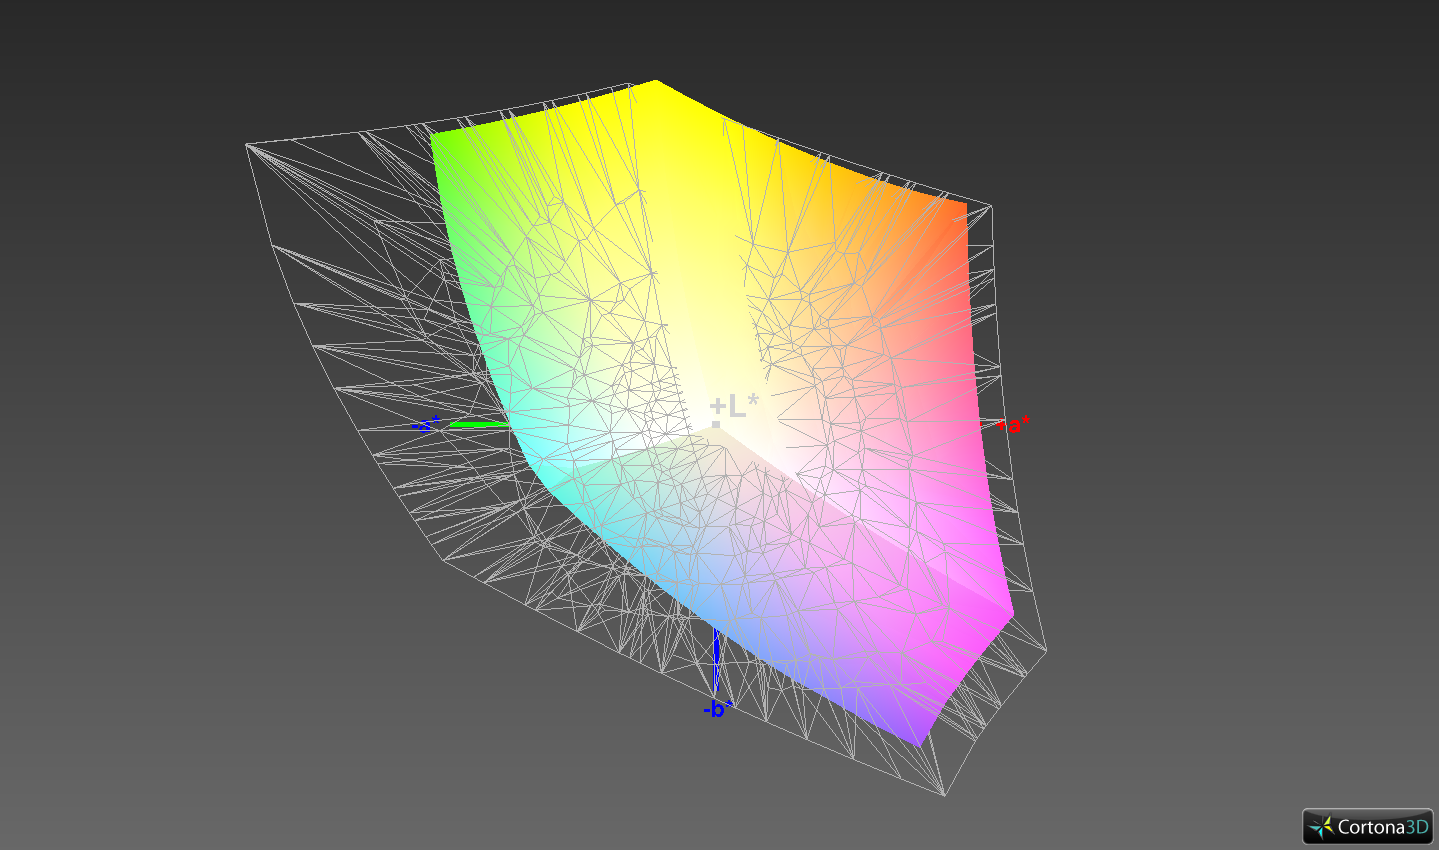
99.6% sRGB (Argyll 1.6.3 3D)
65.4% AdobeRGB 1998 (Argyll 1.6.3 3D)
71.9% AdobeRGB 1998 (Argyll 3D)
99.6% sRGB (Argyll 3D)
69.7% Display P3 (Argyll 3D)
Gamma: 2.2
CCT: 6809 K
| HP ZBook 14u G6 6TP71EA IPS, 1920x1080, 14" | HP ZBook 14u G5-2ZB99EA IPS, 1920x1080, 14" | Dell Precision 5530 2-in-1 IPS, 3840x2160, 15.6" | Lenovo ThinkPad P52s-20LB000HGE IPS LED, 1920x1080, 15.6" | |
|---|---|---|---|---|
| Display | -41% | 23% | -39% | |
| Display P3 Coverage (%) | 69.7 | 40.25 -42% | 91.2 31% | 41.83 -40% |
| sRGB Coverage (%) | 99.6 | 60.6 -39% | 99.9 0% | 62.1 -38% |
| AdobeRGB 1998 Coverage (%) | 71.9 | 41.59 -42% | 99.4 38% | 43.22 -40% |
| Response Times | -20% | -60% | -59% | |
| Response Time Grey 50% / Grey 80% * (ms) | 40.4 ? | 39.6 ? 2% | 49.6 ? -23% | 47.2 ? -17% |
| Response Time Black / White * (ms) | 19.2 ? | 27.2 ? -42% | 37.6 ? -96% | 38.4 ? -100% |
| PWM Frequency (Hz) | 990 ? | 21550 ? | ||
| Screen | -78% | -33% | -75% | |
| Brightness middle (cd/m²) | 437 | 234 -46% | 430.9 -1% | 291 -33% |
| Brightness (cd/m²) | 420 | 215 -49% | 398 -5% | 284 -32% |
| Brightness Distribution (%) | 92 | 85 -8% | 79 -14% | 91 -1% |
| Black Level * (cd/m²) | 0.31 | 0.16 48% | 0.35 -13% | 0.11 65% |
| Contrast (:1) | 1410 | 1463 4% | 1231 -13% | 2645 88% |
| Colorchecker dE 2000 * | 2.6 | 5.7 -119% | 3.29 -27% | 6.7 -158% |
| Colorchecker dE 2000 max. * | 6.5 | 18.4 -183% | 7.46 -15% | 20.2 -211% |
| Colorchecker dE 2000 calibrated * | 0.8 | 4.2 -425% | 3.58 -347% | 4.5 -463% |
| Greyscale dE 2000 * | 4.5 | 4.7 -4% | 2.6 42% | 4.5 -0% |
| Gamma | 2.2 100% | 2.38 92% | 2.19 100% | 2.28 96% |
| CCT | 6809 95% | 6730 97% | 6870 95% | 7503 87% |
| Color Space (Percent of AdobeRGB 1998) (%) | 65.4 | 38.3 -41% | 87.2 33% | 39.6 -39% |
| Color Space (Percent of sRGB) (%) | 99.6 | 60.4 -39% | 100 0% | 61.7 -38% |
| Total Average (Program / Settings) | -46% /
-64% | -23% /
-26% | -58% /
-66% |
* ... smaller is better
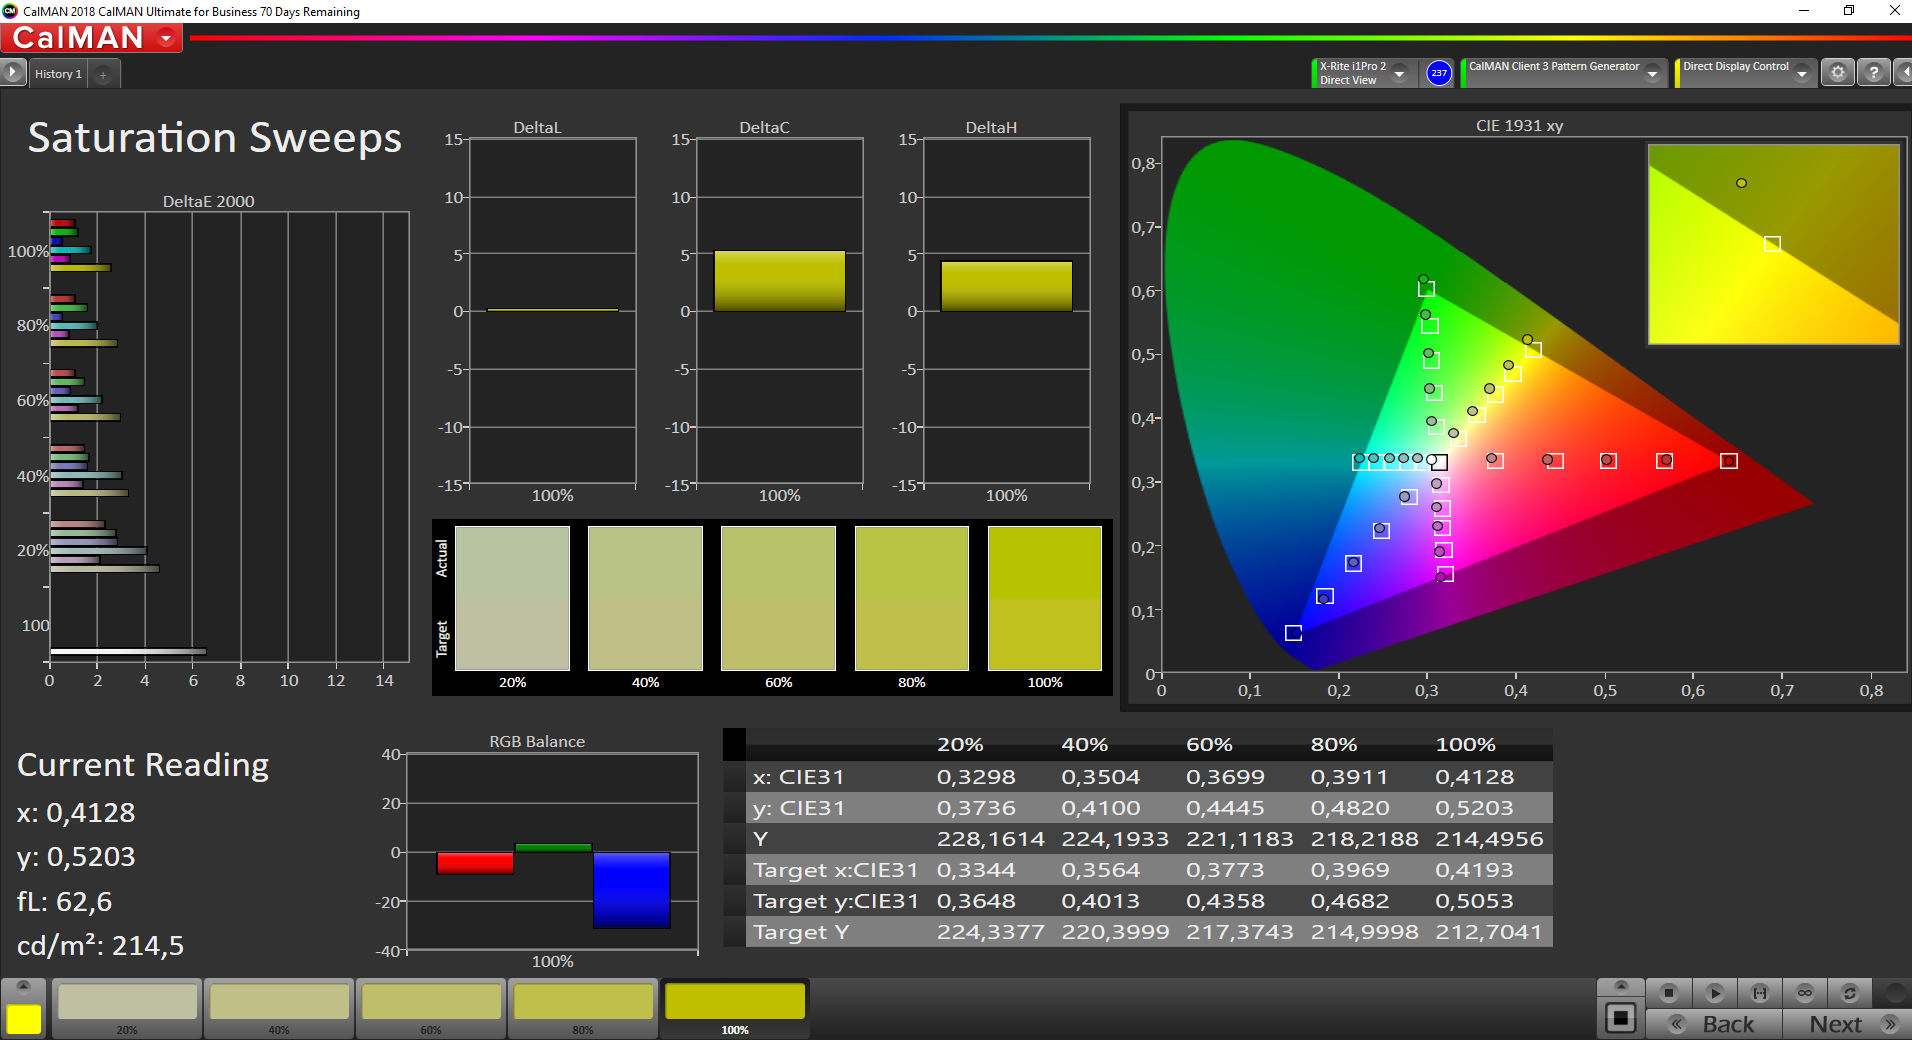
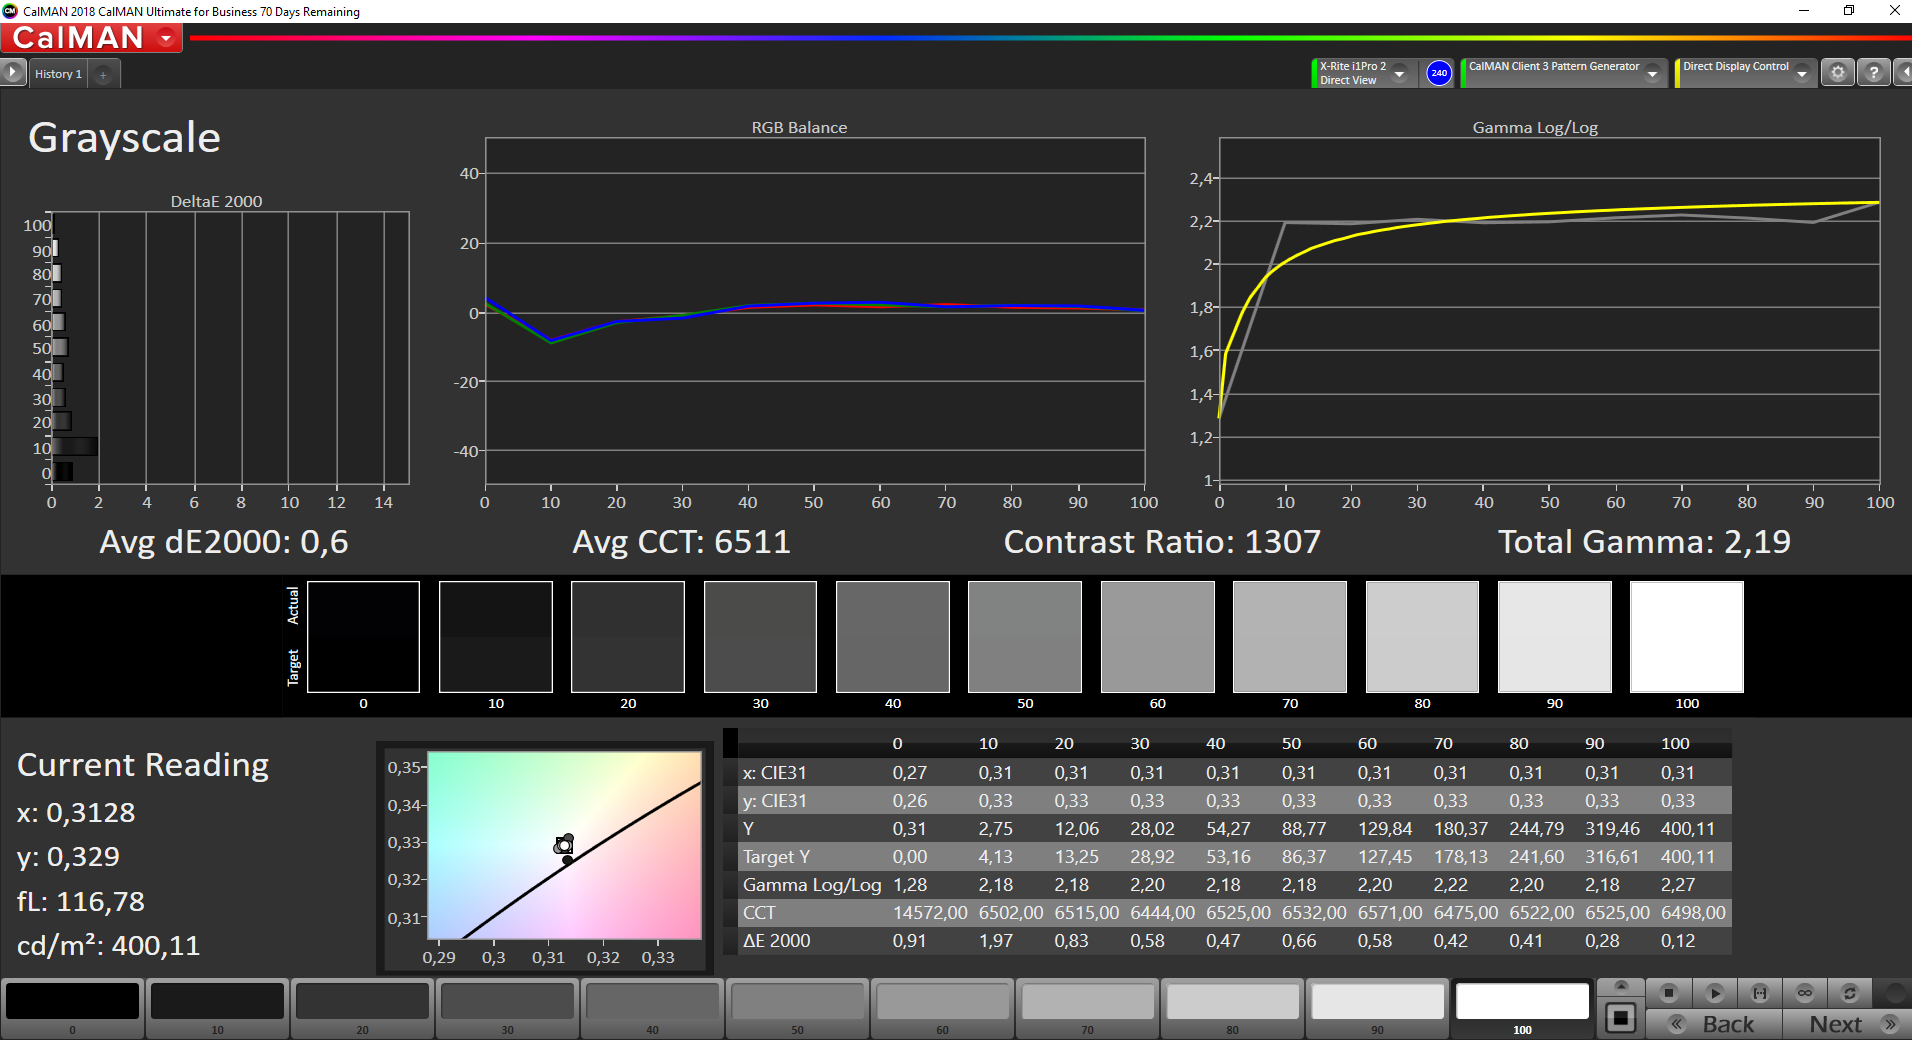
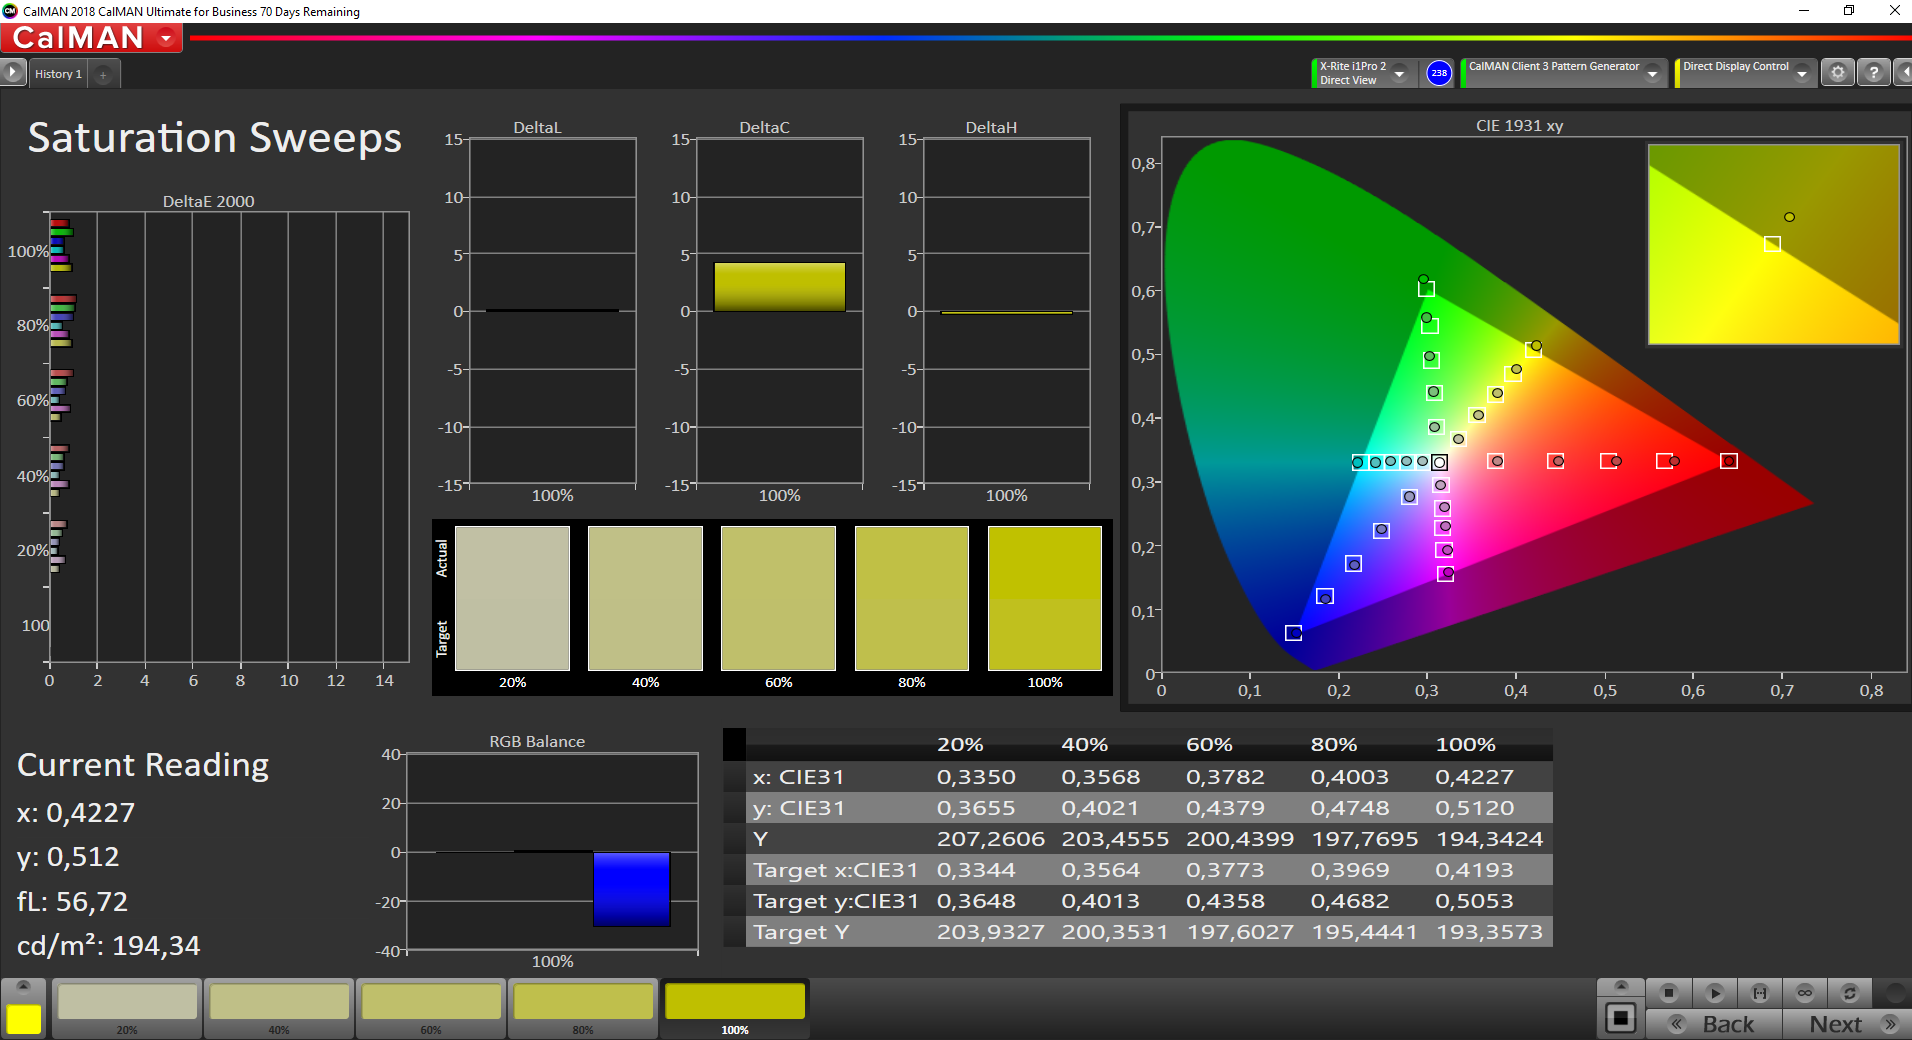
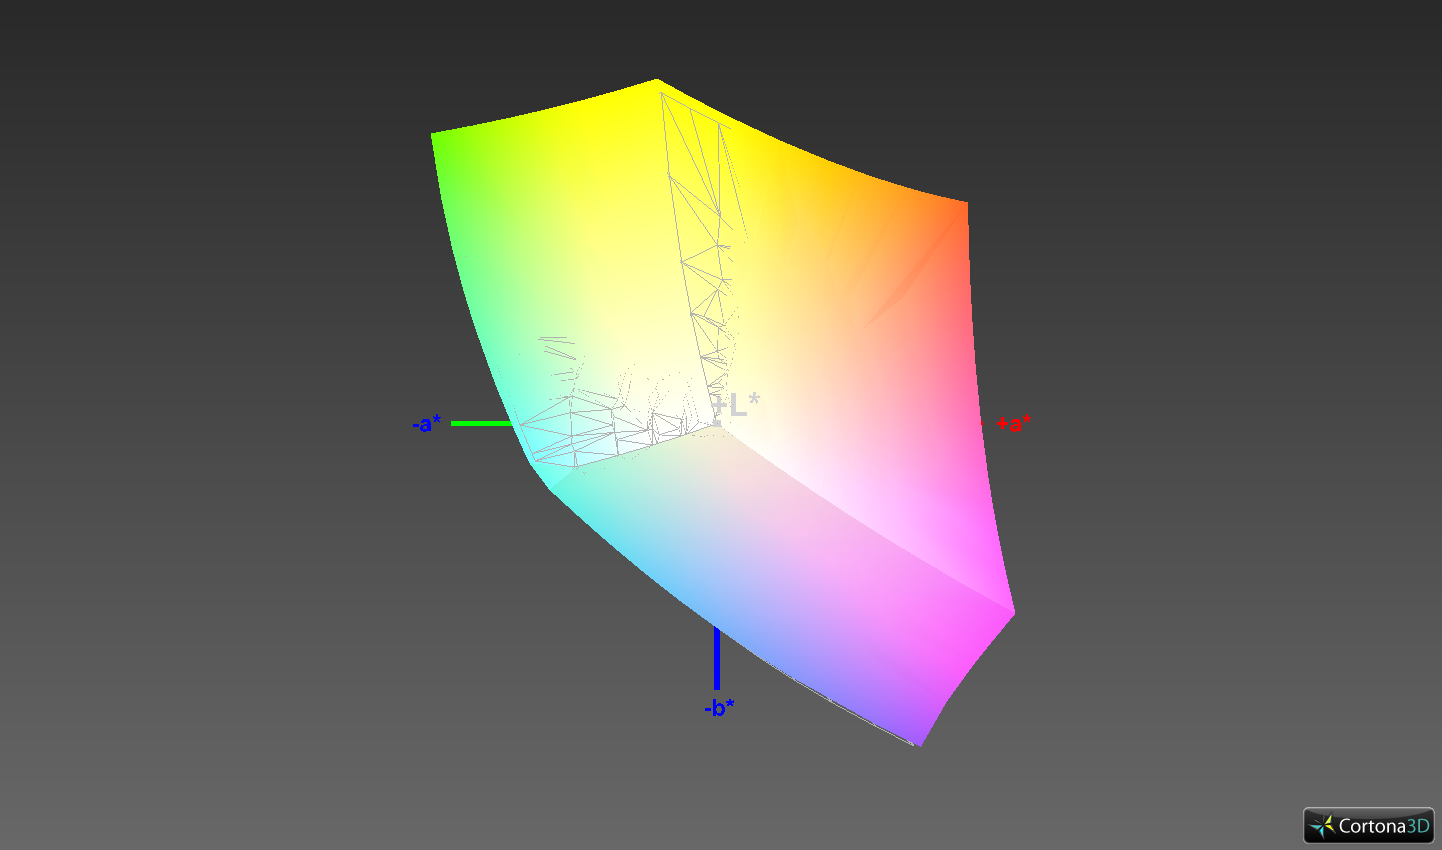
The screen shows a good color reproduction out of the box. With a Delta E 2000 color deviation of 2.6, the target (Delta E less than 3) is reached. The display doesn't suffer from a blue tint. An improvement can be achieved by calibrating the screen. This reduces the color deviation to 0.8, and the grayscales are displayed in a more balanced way. Good: Almost 100% of the sRGB color space is covered (99.6%). With the AdobeRGB color space, the rate is 65.4%.
The color profile provided by us can improve the display's color reproduction according to the calibration we perform. It's important to make sure that the same display model (manufacturer + model number) as in our review device is installed. Otherwise, the color reproduction may become worse instead of improving. Panels from different manufacturers are often used within the same laptop model series.

Display Response Times
| ↔ Response Time Black to White | ||
|---|---|---|
| 19.2 ms ... rise ↗ and fall ↘ combined | ↗ 8.4 ms rise | 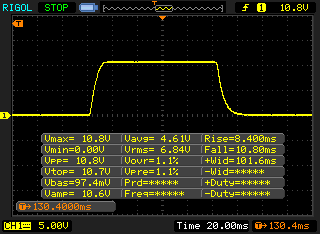 |
| ↘ 10.8 ms fall | ||
| The screen shows good response rates in our tests, but may be too slow for competitive gamers. In comparison, all tested devices range from 0.1 (minimum) to 240 (maximum) ms. » 43 % of all devices are better. This means that the measured response time is similar to the average of all tested devices (19.8 ms). | ||
| ↔ Response Time 50% Grey to 80% Grey | ||
| 40.4 ms ... rise ↗ and fall ↘ combined | ↗ 20.4 ms rise | 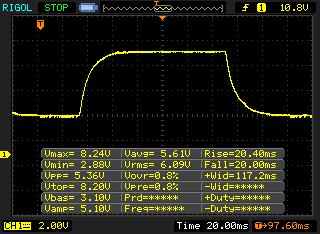 |
| ↘ 20 ms fall | ||
| The screen shows slow response rates in our tests and will be unsatisfactory for gamers. In comparison, all tested devices range from 0.165 (minimum) to 636 (maximum) ms. » 63 % of all devices are better. This means that the measured response time is worse than the average of all tested devices (31 ms). | ||
Screen Flickering / PWM (Pulse-Width Modulation)
| Screen flickering / PWM not detected | ≤ 50 % brightness setting | 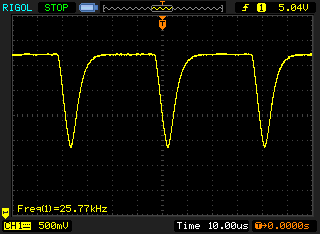 | |
In comparison: 52 % of all tested devices do not use PWM to dim the display. If PWM was detected, an average of 7781 (minimum: 5 - maximum: 343500) Hz was measured. | |||
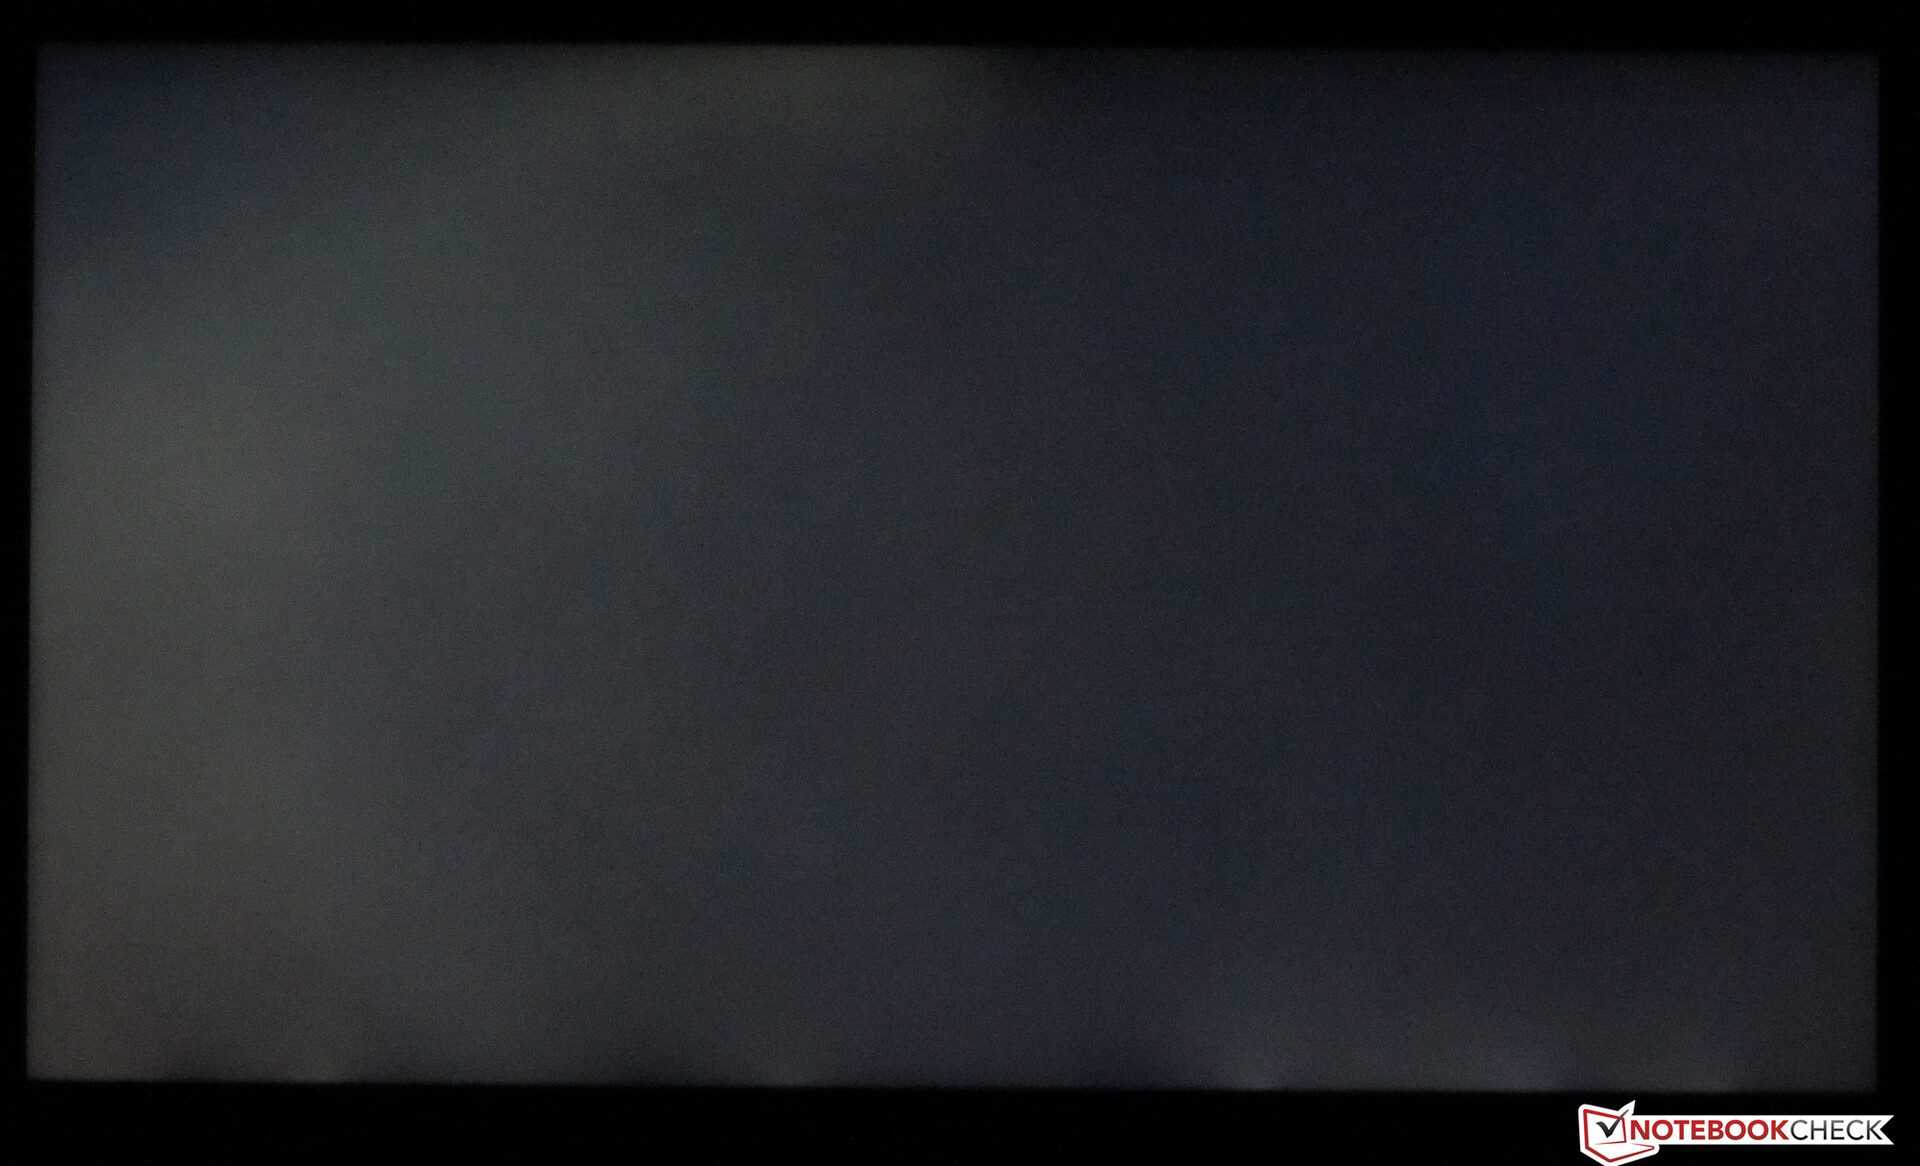
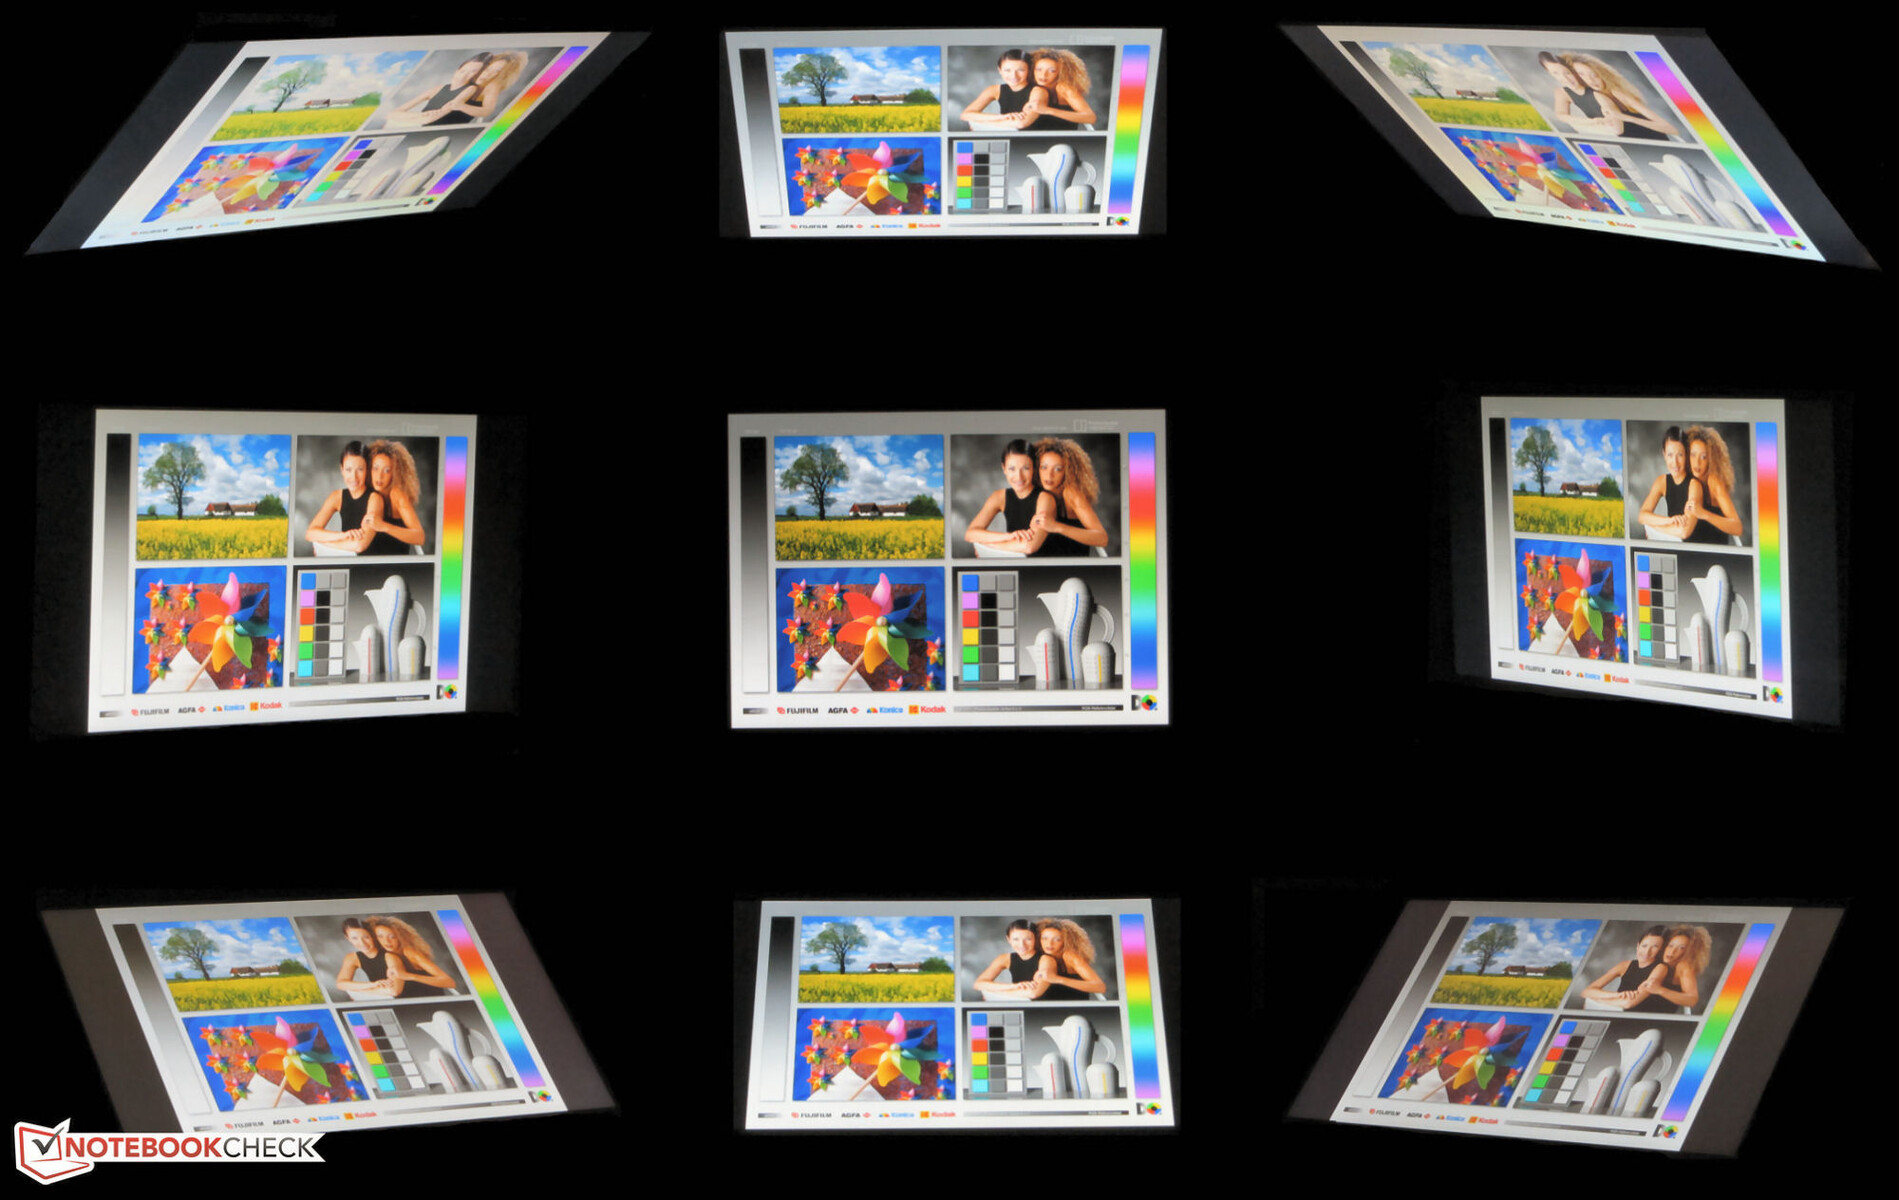
HP has equipped the ZBook with an IPS panel that shows stable viewing angles. Thus, the screen can be read from any position. Due to the high maximum brightness of the display, it can also be read outdoors.
Performance - The HP workstation can't unfold its full performance in a stable way
With the ZBook 14u G6, Hewlett Packard has a 14-inch workstation in its range. The review device provided to us is available for about 1,700 Euros (~$1,865). Other configuration options are available. Prices start at around 1,350 Euros (~$1,481).
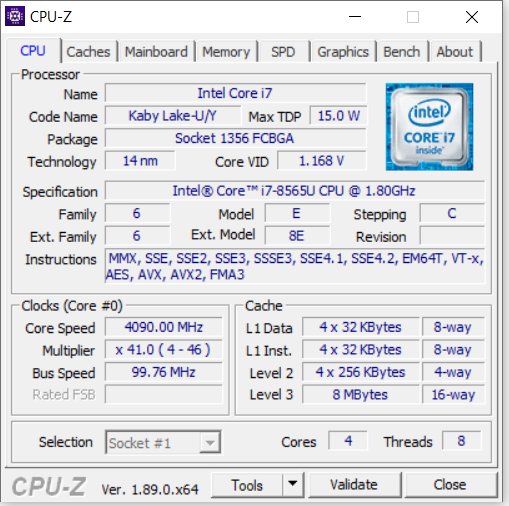
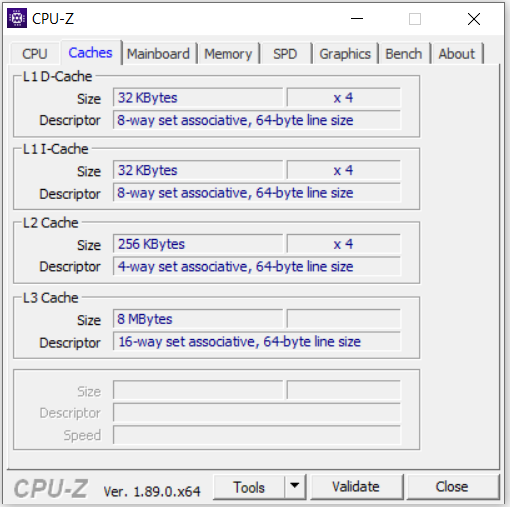
Processor
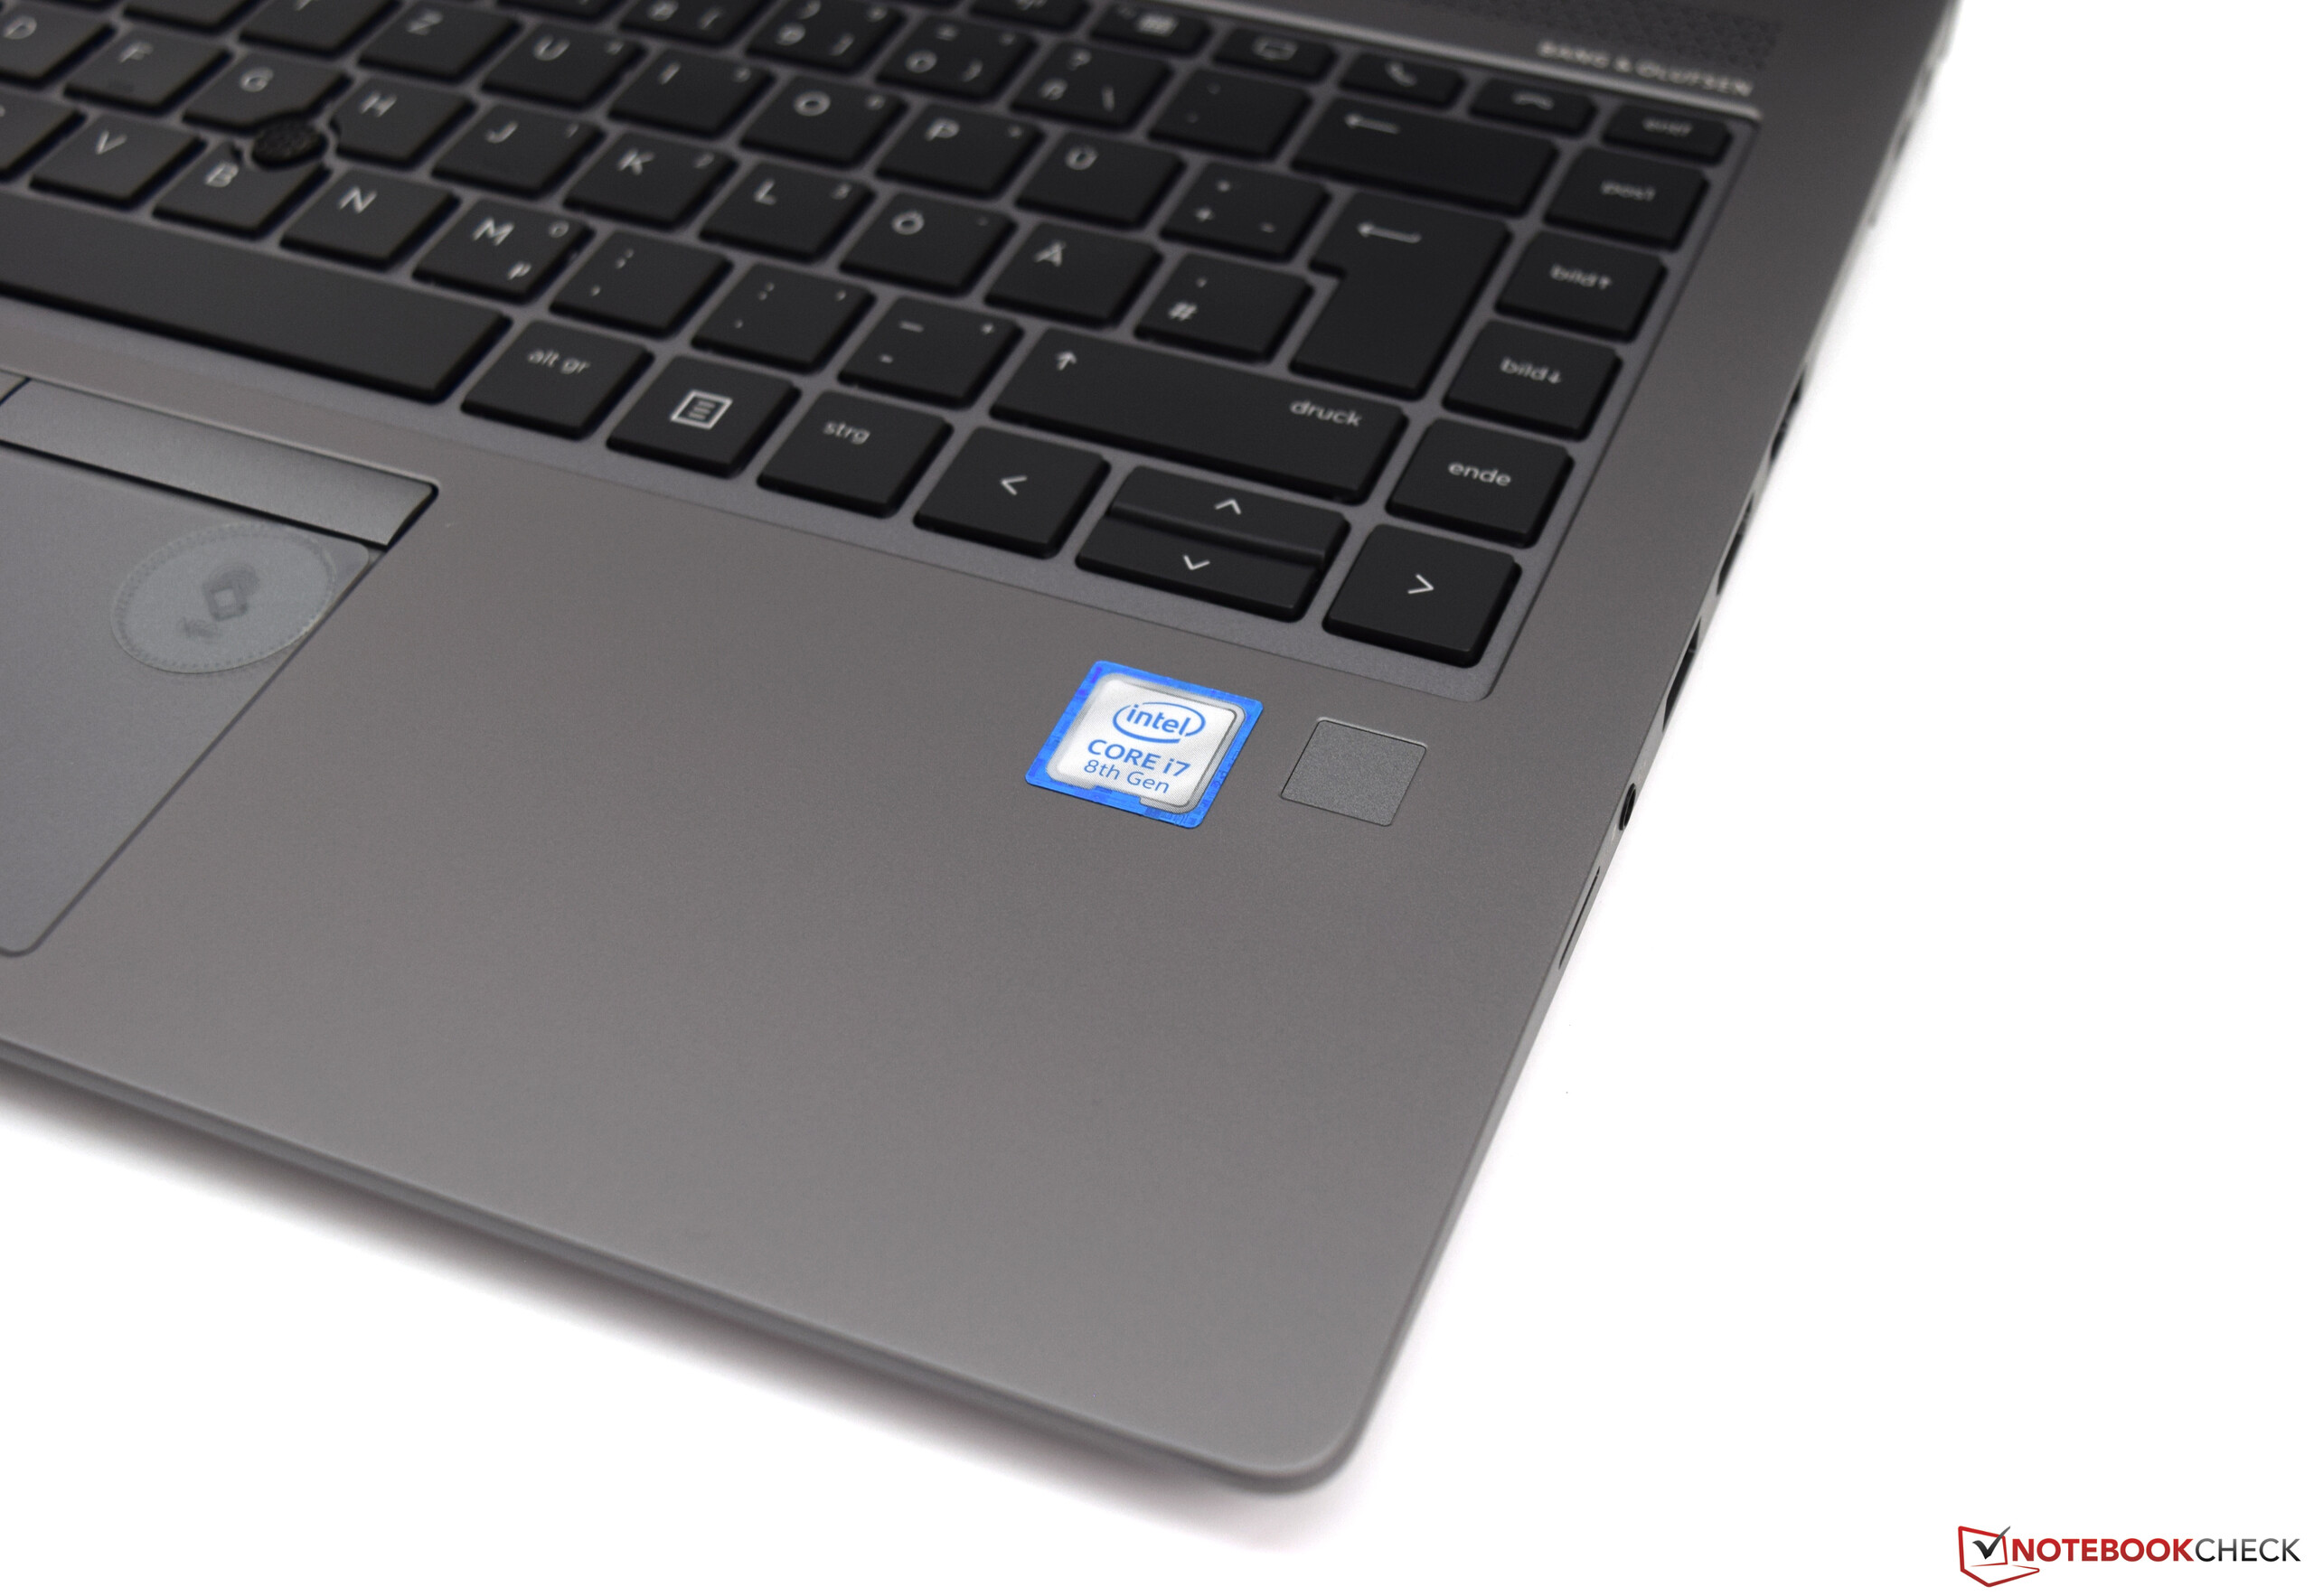
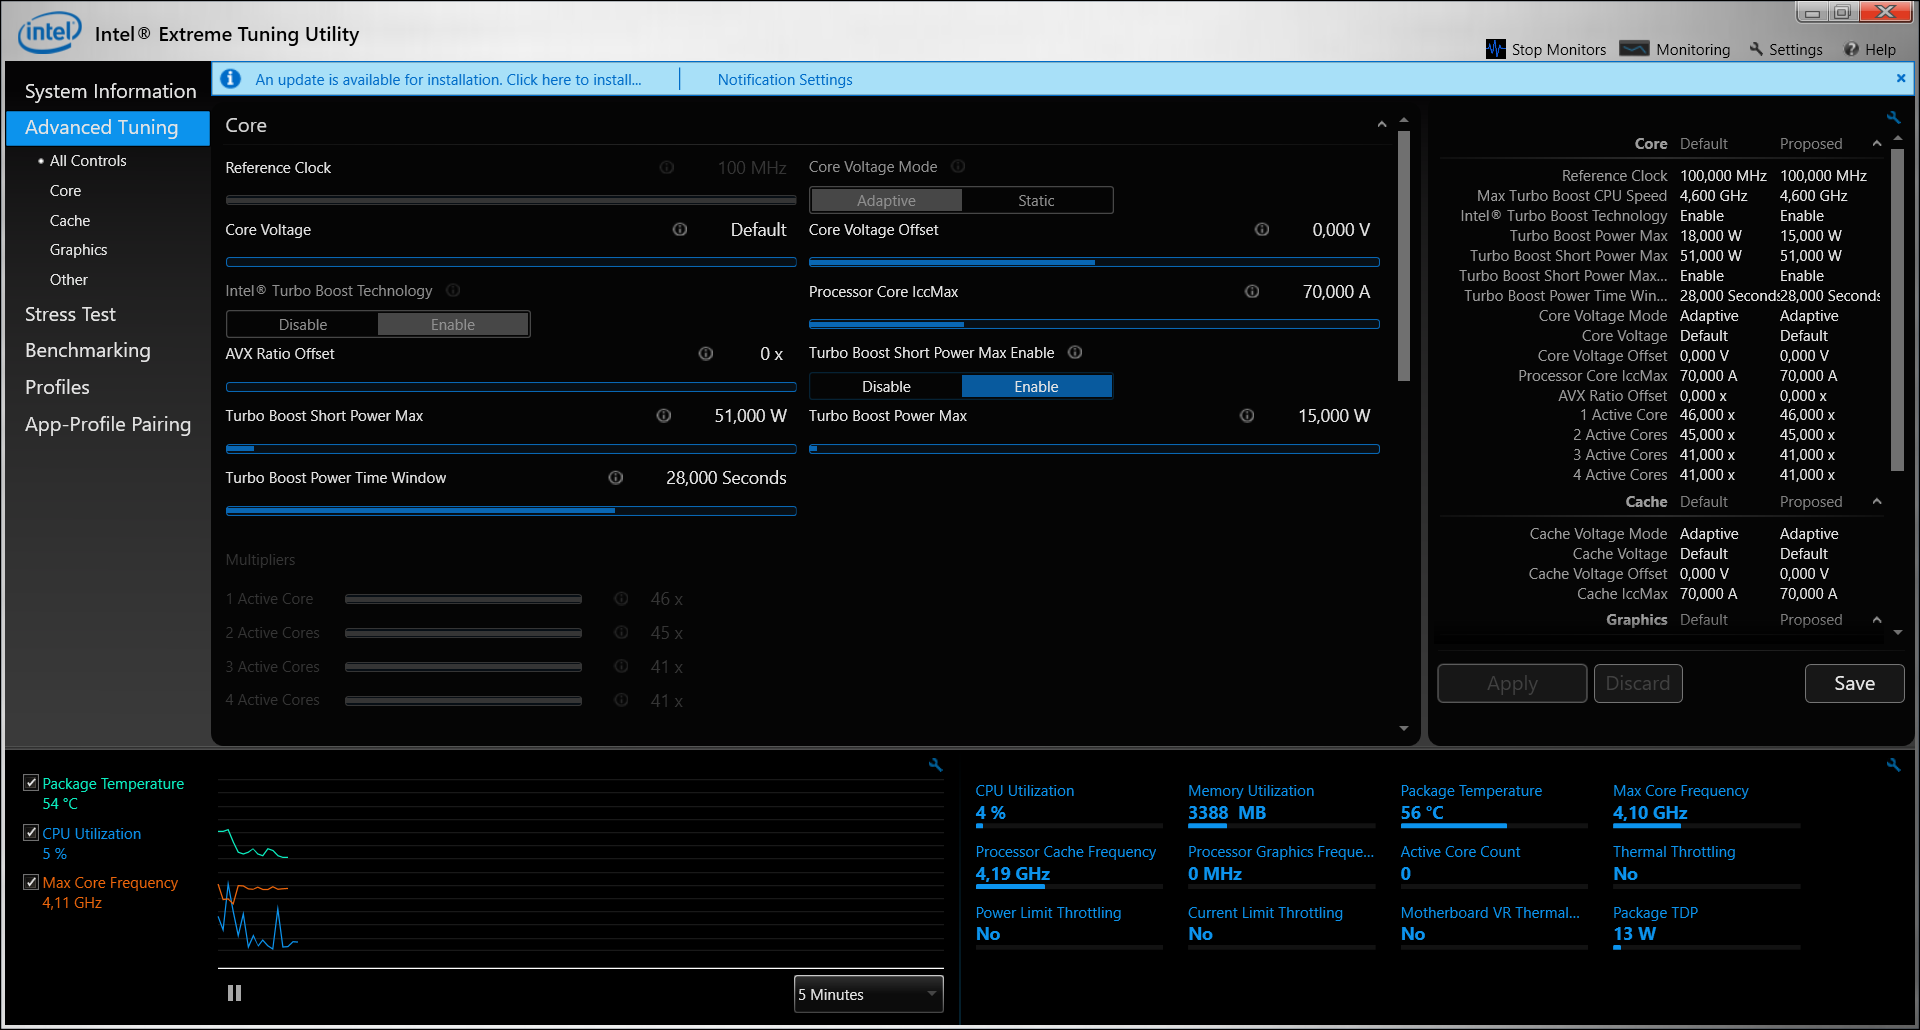
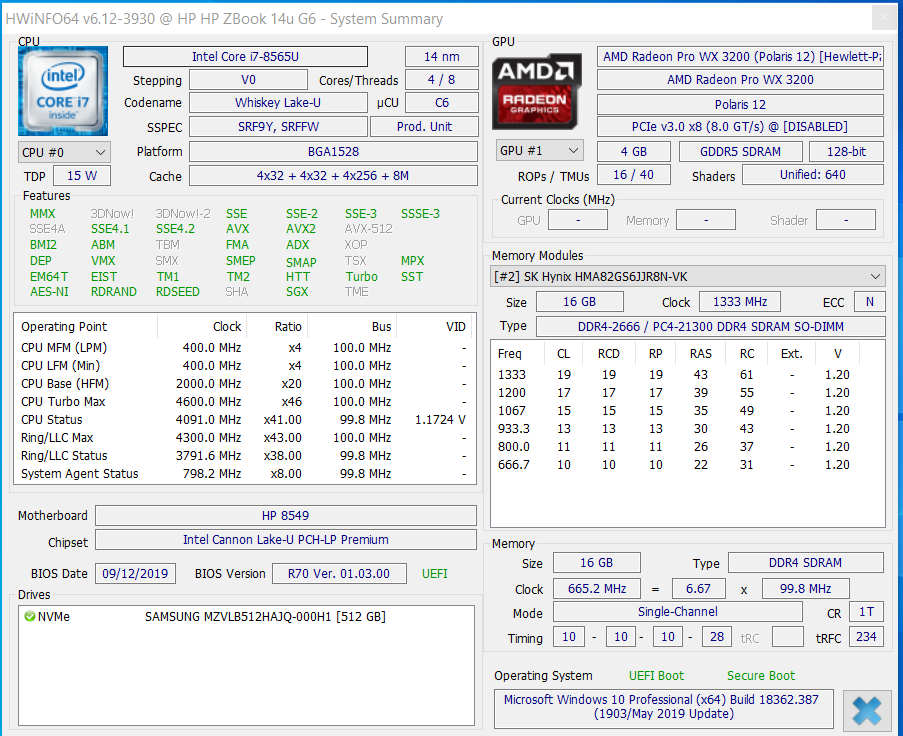
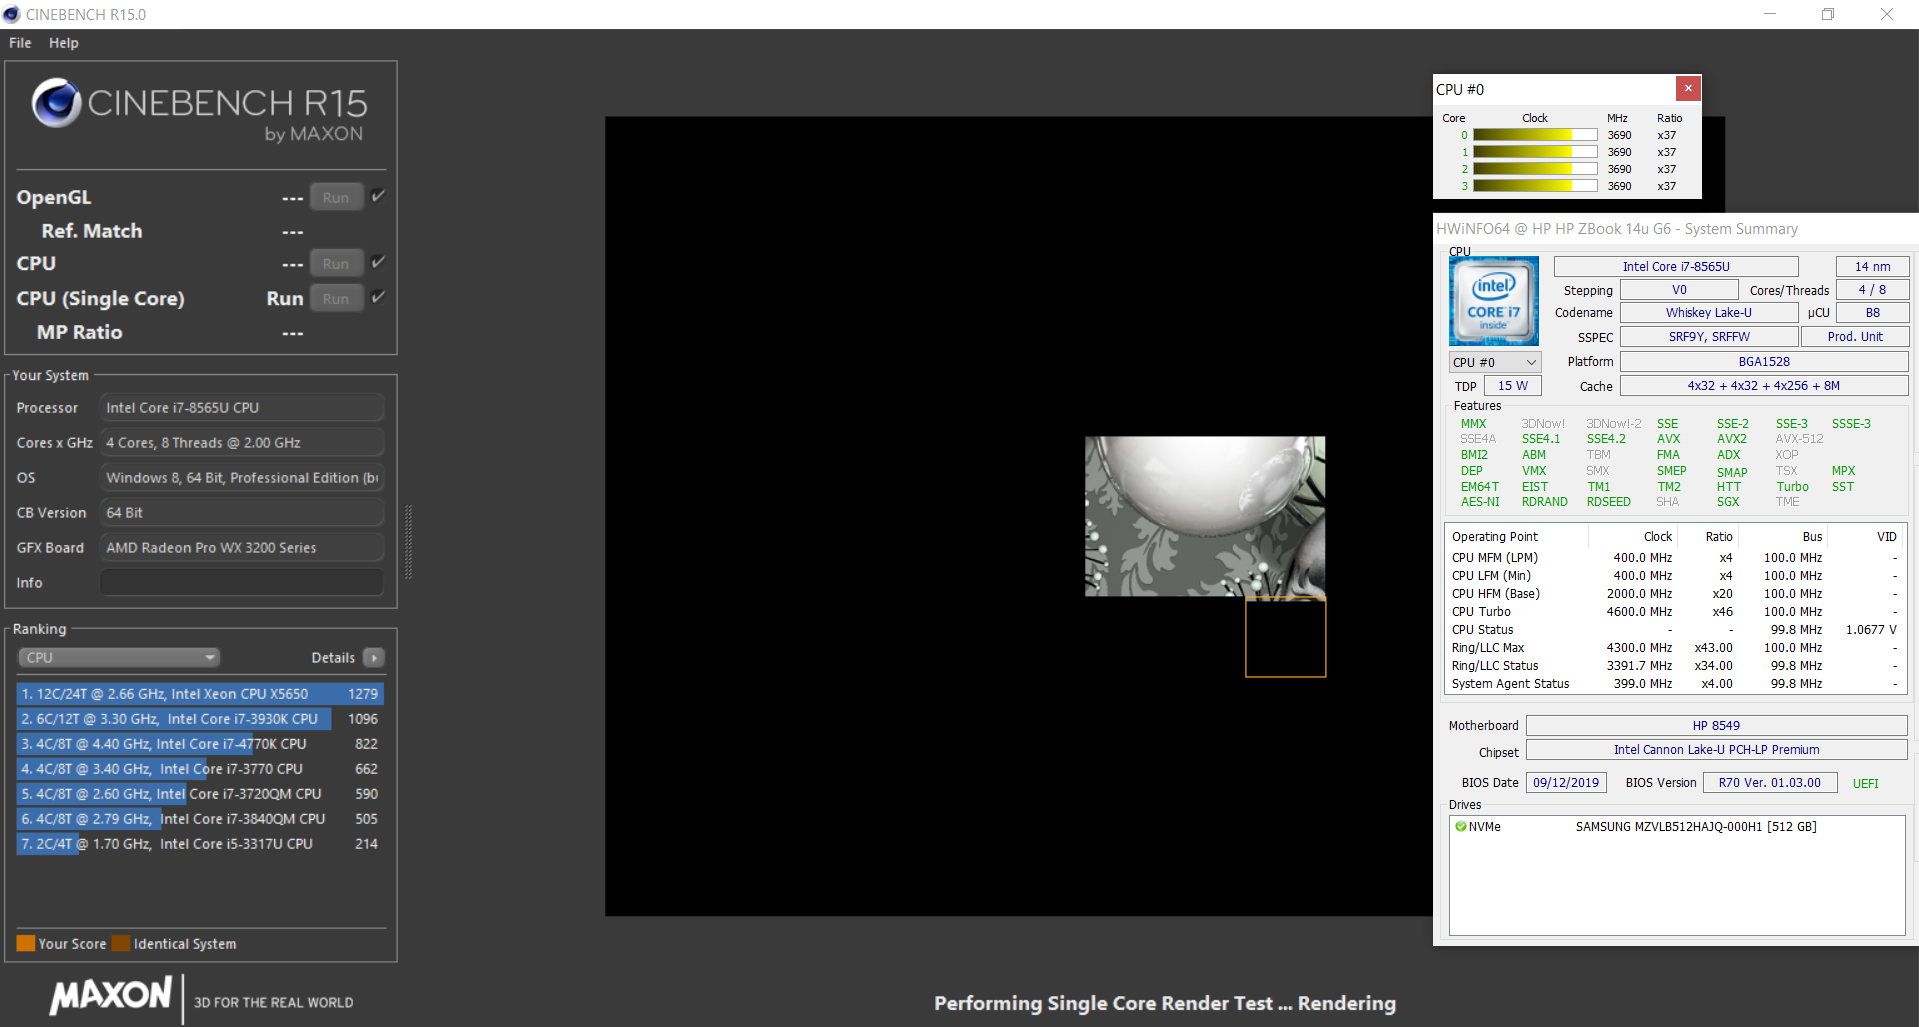
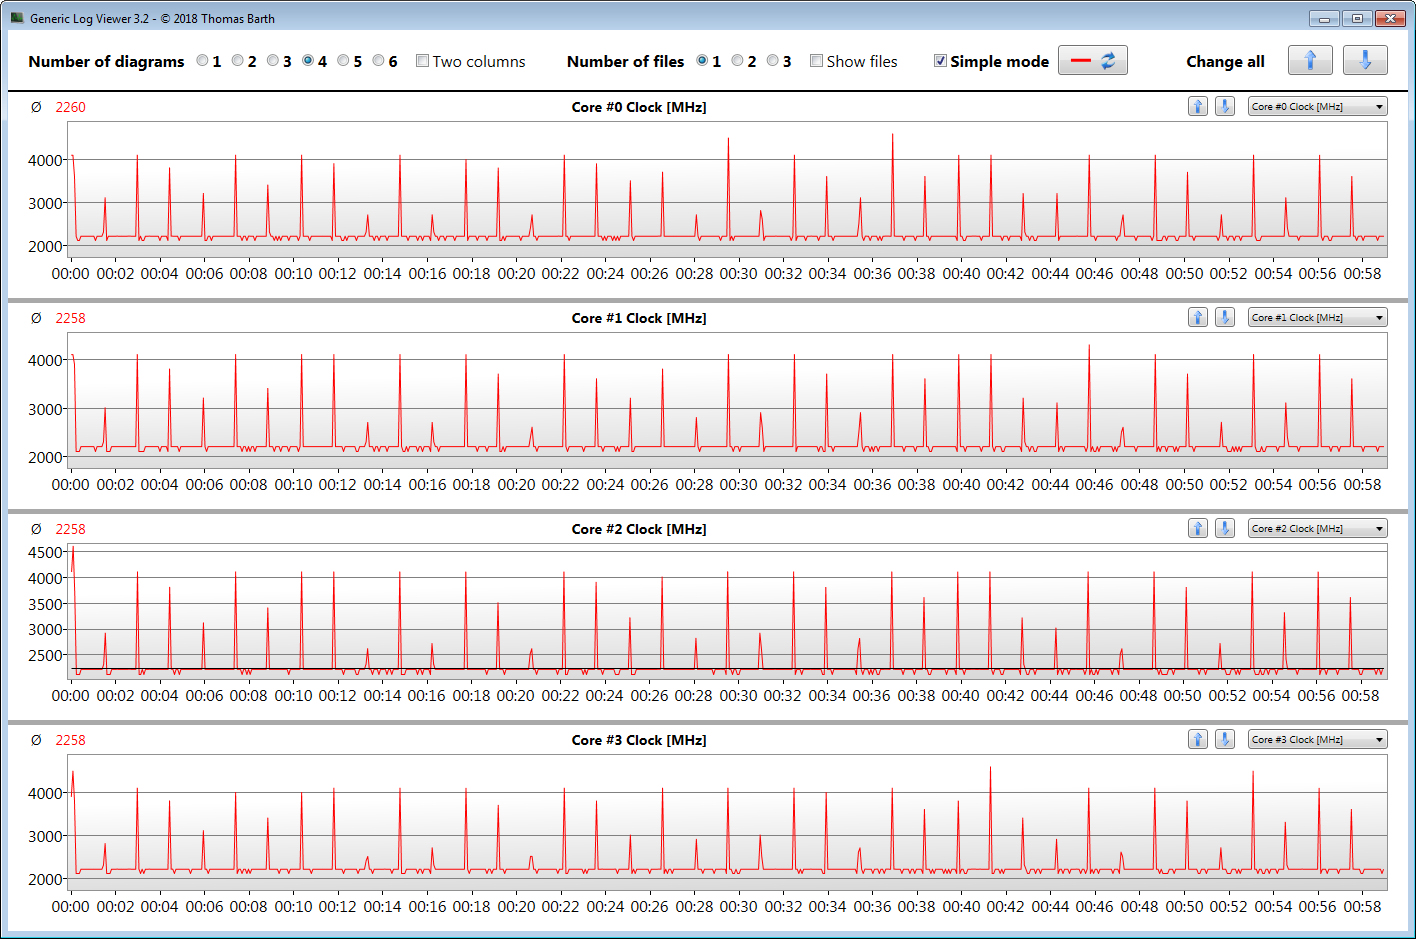
The ZBook has a Core i7-8565U (Whiskey Lake) quad-core processor on board. The Core i7 operates at a base speed of 1.8 GHz. Through Turbo, an increase to 4.1 GHz (all four cores), 4.5 GHz (two cores) and 4.6 GHz (one core) is possible, respectively.
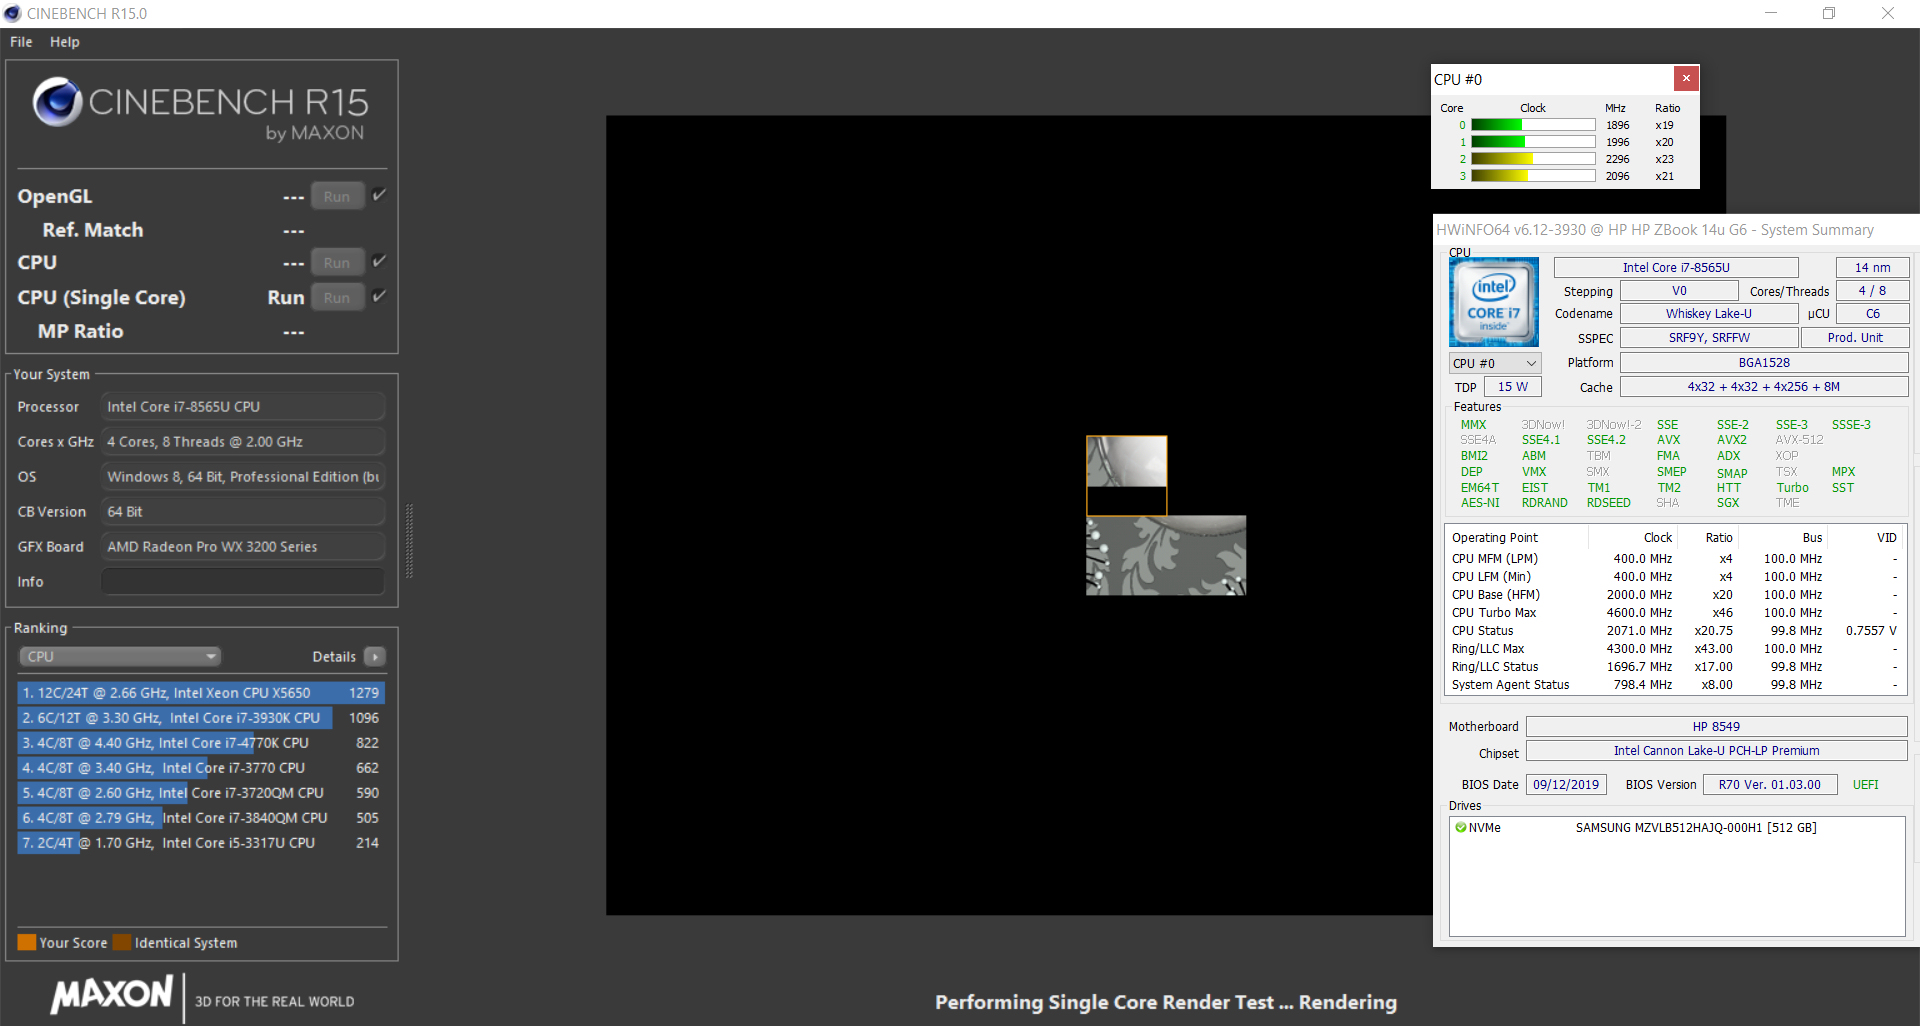
The multithread tests of the Cinebench benchmarks are run for a short time at 3.2 to 4.1 GHz. The clock speed then drops to 2.1 to 2.2 GHz. The single-thread tests are processed at 3.7 to 3.8 GHz. On battery power, the speeds range from 1.6 to 1.8 GHz (multithread) and 1.6 to 2.3 GHz (single-thread), respectively.
Many HP laptops - including the ZBook - have a BIOS option that specifies that the CPU should also run at high speeds on battery power. HP has removed this option with the current BIOS version, 01.03.00 Rev.A, from September 27, 2019. This BIOS update shouldn't be omitted since it fixes many security vulnerabilities as well.
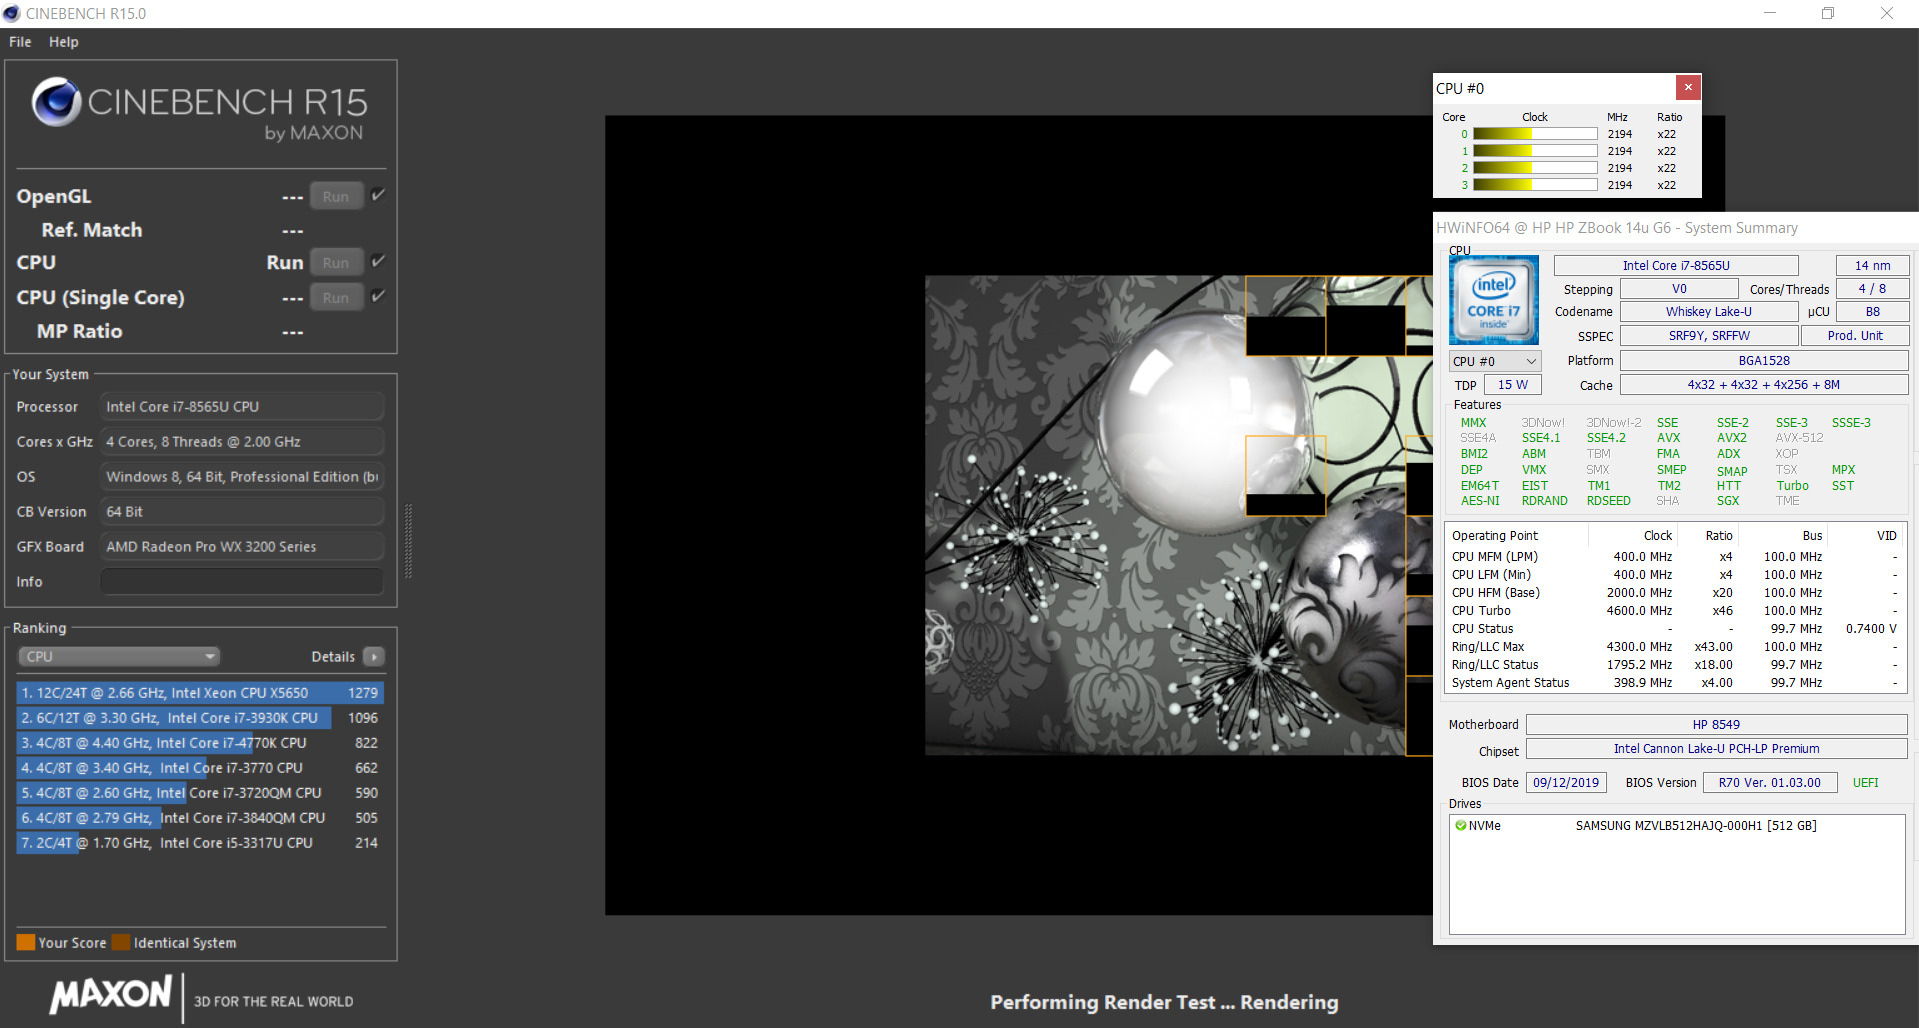
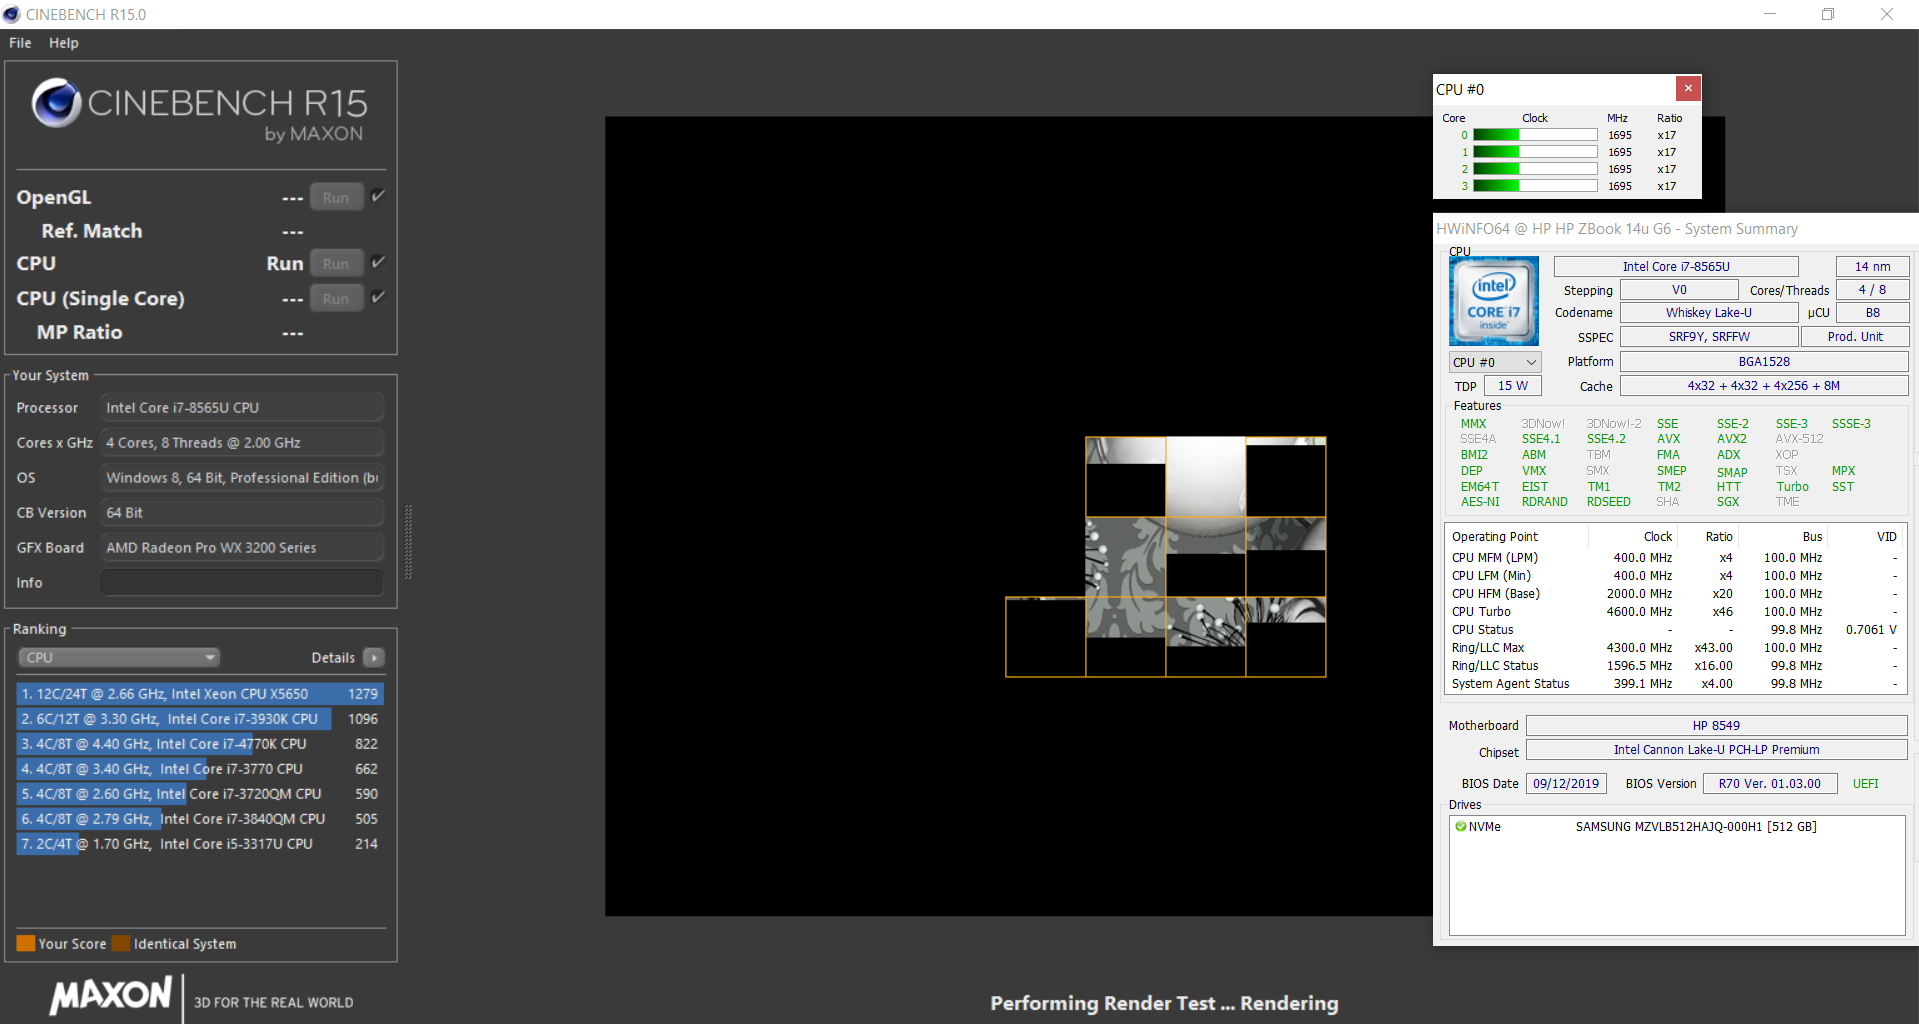
We test whether Turbo is used consistently when plugged in by running the Cinebench R15 benchmark's multithread test continuously in a loop for a minimum of 30 minutes. The results fall slightly from the first to the second pass and then remain at a constant level. Turbo is used to a very small extent.
| Geekbench 3 | |
| 32 Bit Multi-Core Score | |
| HP ZBook 14u G6 6TP71EA | |
| Average Intel Core i7-8565U (10521 - 13703, n=12) | |
| 32 Bit Single-Core Score | |
| Average Intel Core i7-8565U (3340 - 4820, n=12) | |
| HP ZBook 14u G6 6TP71EA | |
| Geekbench 4.4 | |
| 64 Bit Multi-Core Score | |
| Average of class Workstation (n=1last 2 years) | |
| Dell Precision 5530 2-in-1 | |
| HP ZBook 14u G6 6TP71EA | |
| Average Intel Core i7-8565U (8142 - 16968, n=30) | |
| 64 Bit Single-Core Score | |
| Average of class Workstation (n=1last 2 years) | |
| HP ZBook 14u G6 6TP71EA | |
| Average Intel Core i7-8565U (2357 - 5547, n=30) | |
| Dell Precision 5530 2-in-1 | |
| Geekbench 5.0 | |
| 5.0 Multi-Core | |
| Average of class Workstation (n=1last 2 years) | |
| Average Intel Core i7-8565U (2643 - 3803, n=5) | |
| HP ZBook 14u G6 6TP71EA | |
| 5.0 Single-Core | |
| Average of class Workstation (n=1last 2 years) | |
| HP ZBook 14u G6 6TP71EA | |
| Average Intel Core i7-8565U (1103 - 1229, n=5) | |
| Mozilla Kraken 1.1 - Total | |
| HP ZBook 14u G6 6TP71EA (Edge 44) | |
| Lenovo ThinkPad P52s-20LB000HGE (Edge 41.16299.402.0) | |
| Dell Precision 5530 2-in-1 (Edge 42.17134.1.0) | |
| Average Intel Core i7-8565U (730 - 2622, n=43) | |
| HP ZBook 14u G5-2ZB99EA (EDGE: 41.16299.15.0) | |
| Average of class Workstation (411 - 538, n=25, last 2 years) | |
| Octane V2 - Total Score | |
| Average of class Workstation (92715 - 129420, n=4, last 2 years) | |
| HP ZBook 14u G5-2ZB99EA (EDGE: 41.16299.15.0) | |
| Average Intel Core i7-8565U (13935 - 49795, n=42) | |
| Lenovo ThinkPad P52s-20LB000HGE (Edge 41.16299.402.0) | |
| HP ZBook 14u G6 6TP71EA (Edge 44) | |
| Dell Precision 5530 2-in-1 (Edge 42.17134.1.0) | |
| JetStream 1.1 - 1.1 Total | |
| HP ZBook 14u G5-2ZB99EA (EDGE: 41.16299.15.0) | |
| Dell Precision 5530 2-in-1 (Edge 42.17134.1.0) | |
| HP ZBook 14u G6 6TP71EA (Edge 44) | |
| Lenovo ThinkPad P52s-20LB000HGE (Edge 41.16299.402.0) | |
| Average Intel Core i7-8565U (107.6 - 277, n=37) | |
* ... smaller is better
System performance
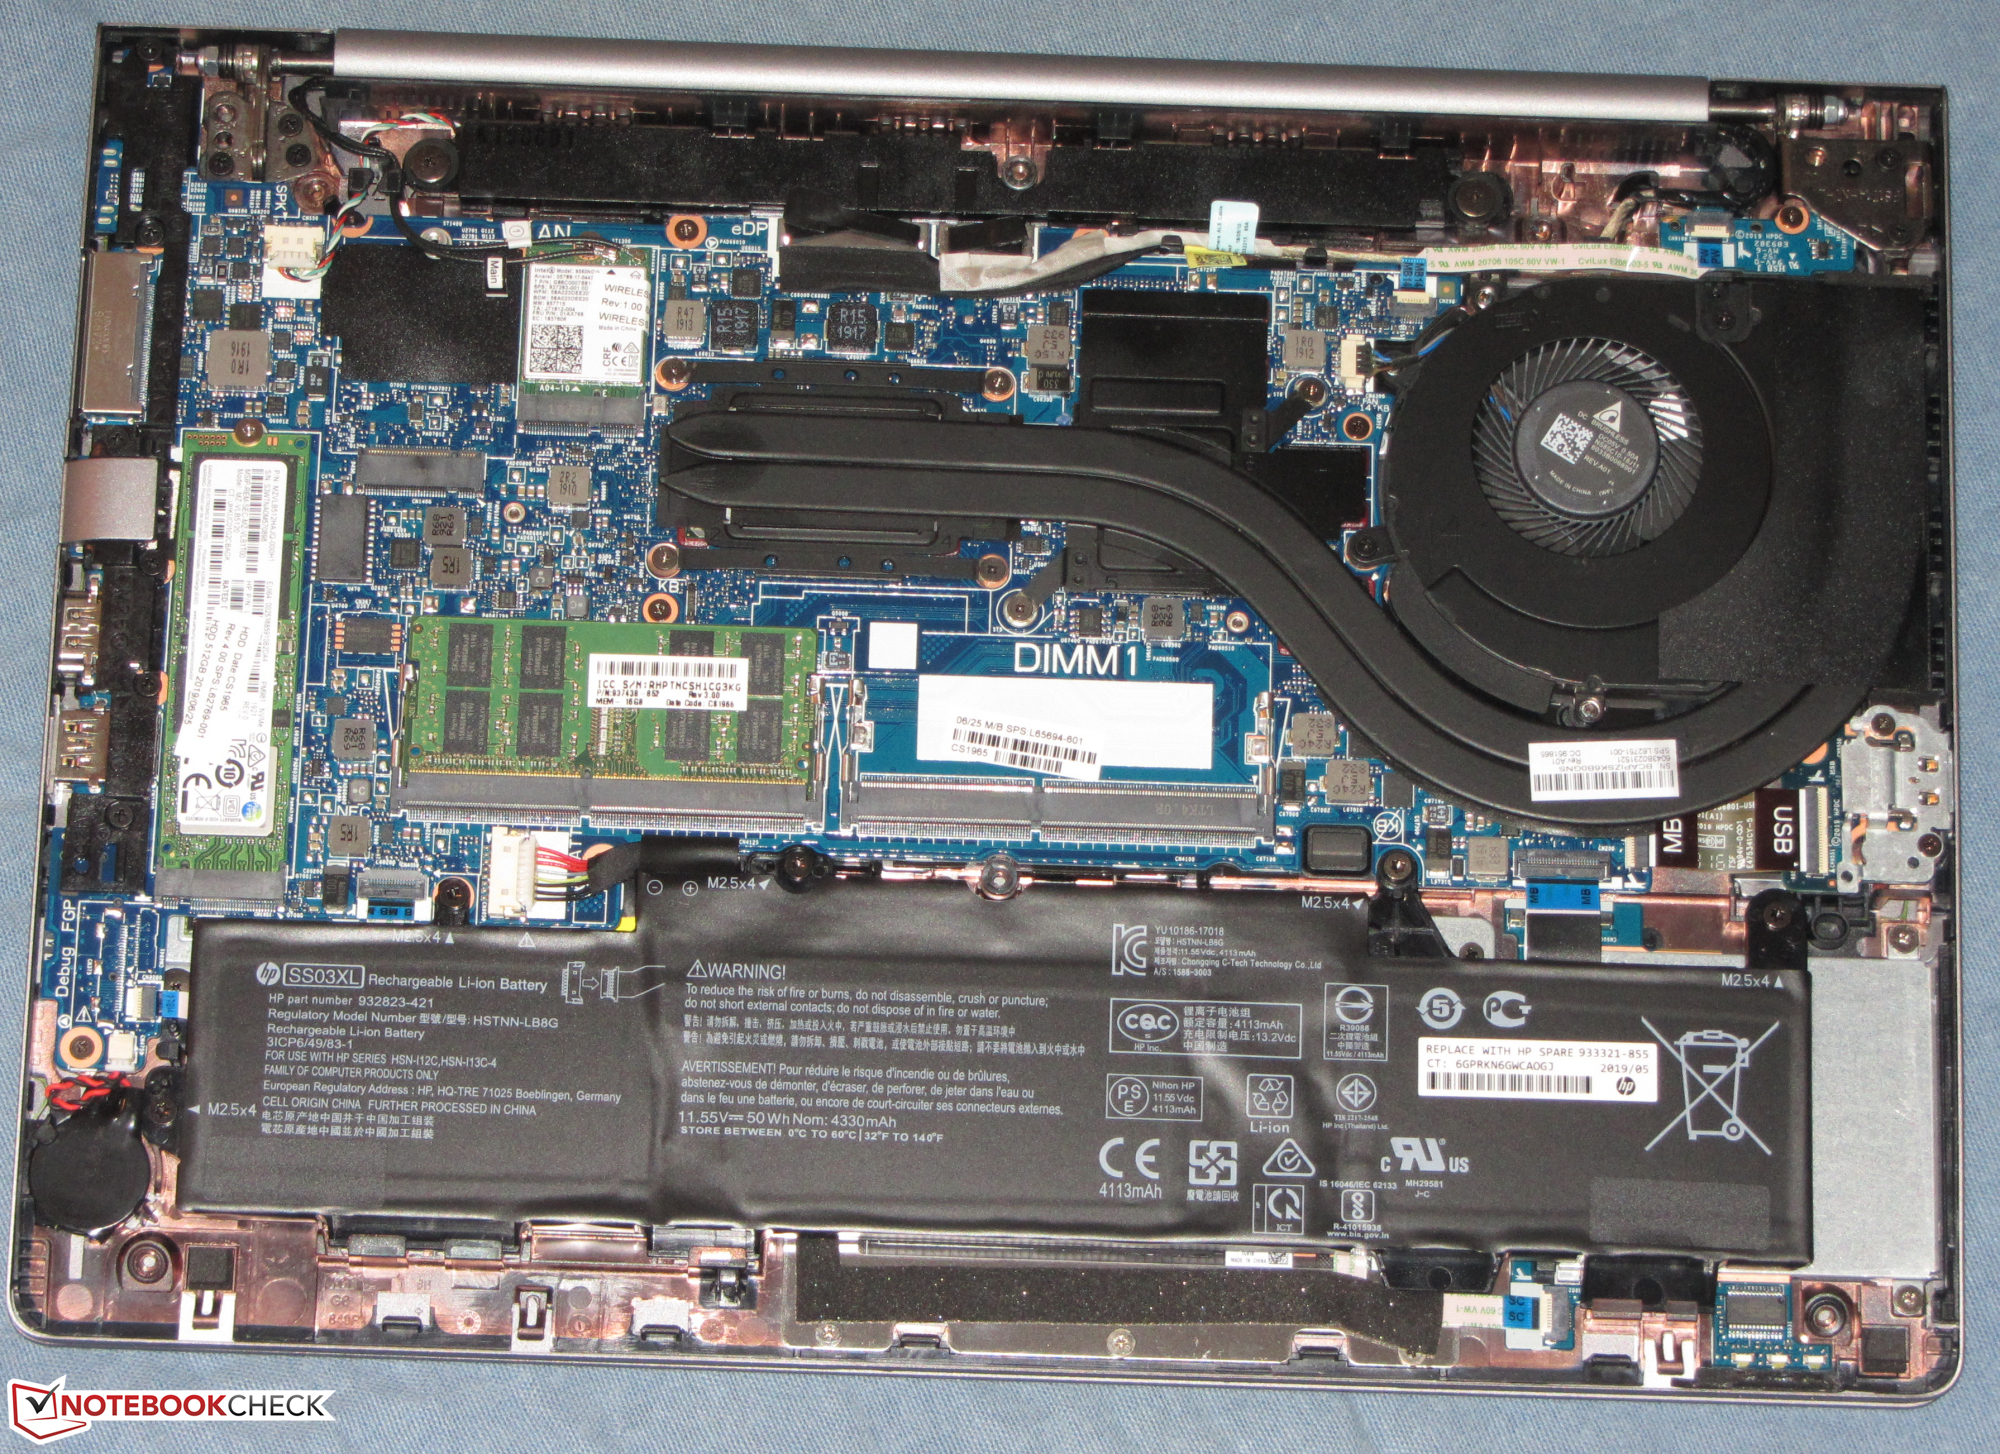
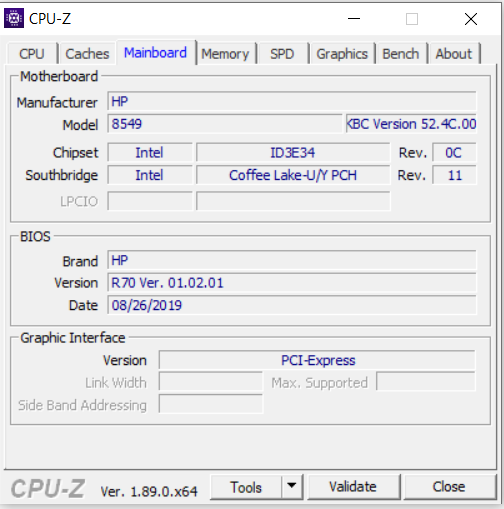
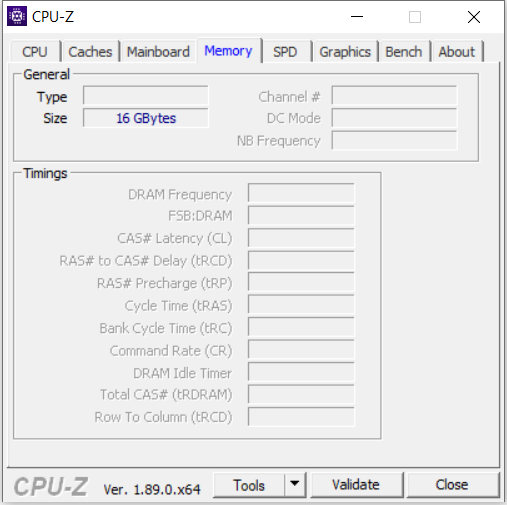
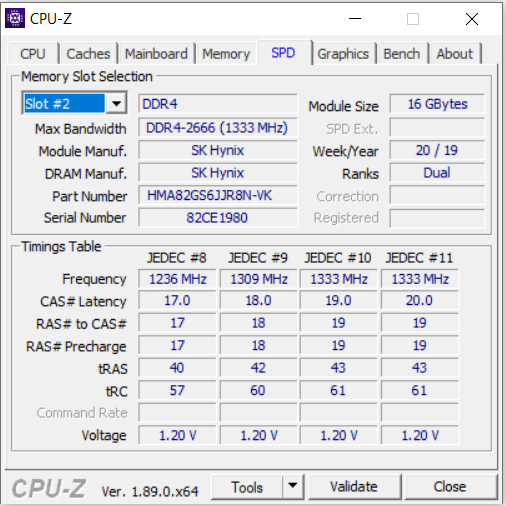
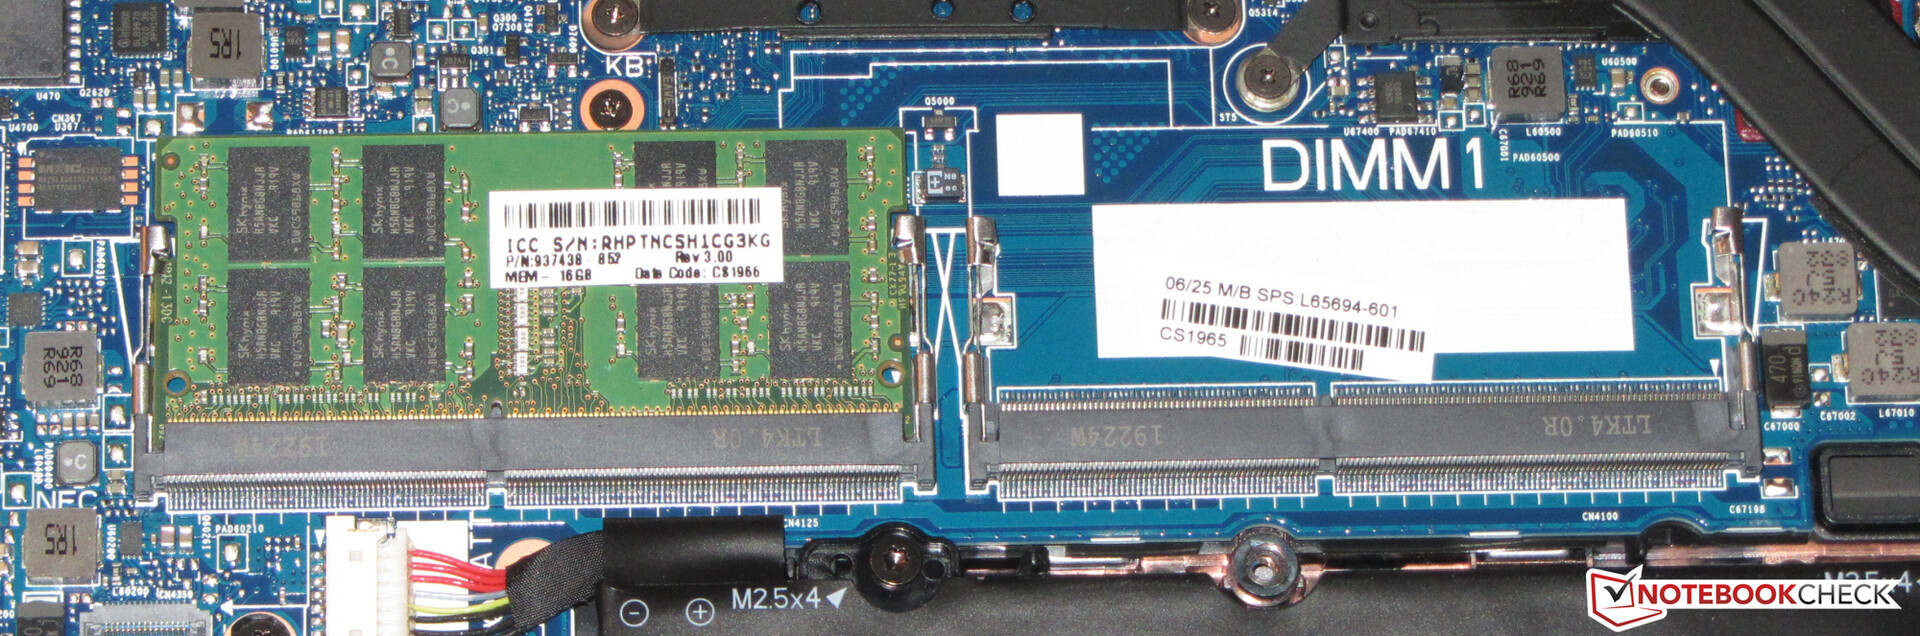
The good results in the PCMark benchmarks confirm that the laptop has sufficient computing power for all common applications. A slight increase in overall performance would be possible by activating dual-channel mode. For this purpose, a second memory module would have to be installed into the computer.
| PCMark 8 Home Score Accelerated v2 | 3954 points | |
| PCMark 8 Creative Score Accelerated v2 | 3901 points | |
| PCMark 8 Work Score Accelerated v2 | 4885 points | |
| PCMark 10 Score | 4413 points | |
Help | ||
Storage
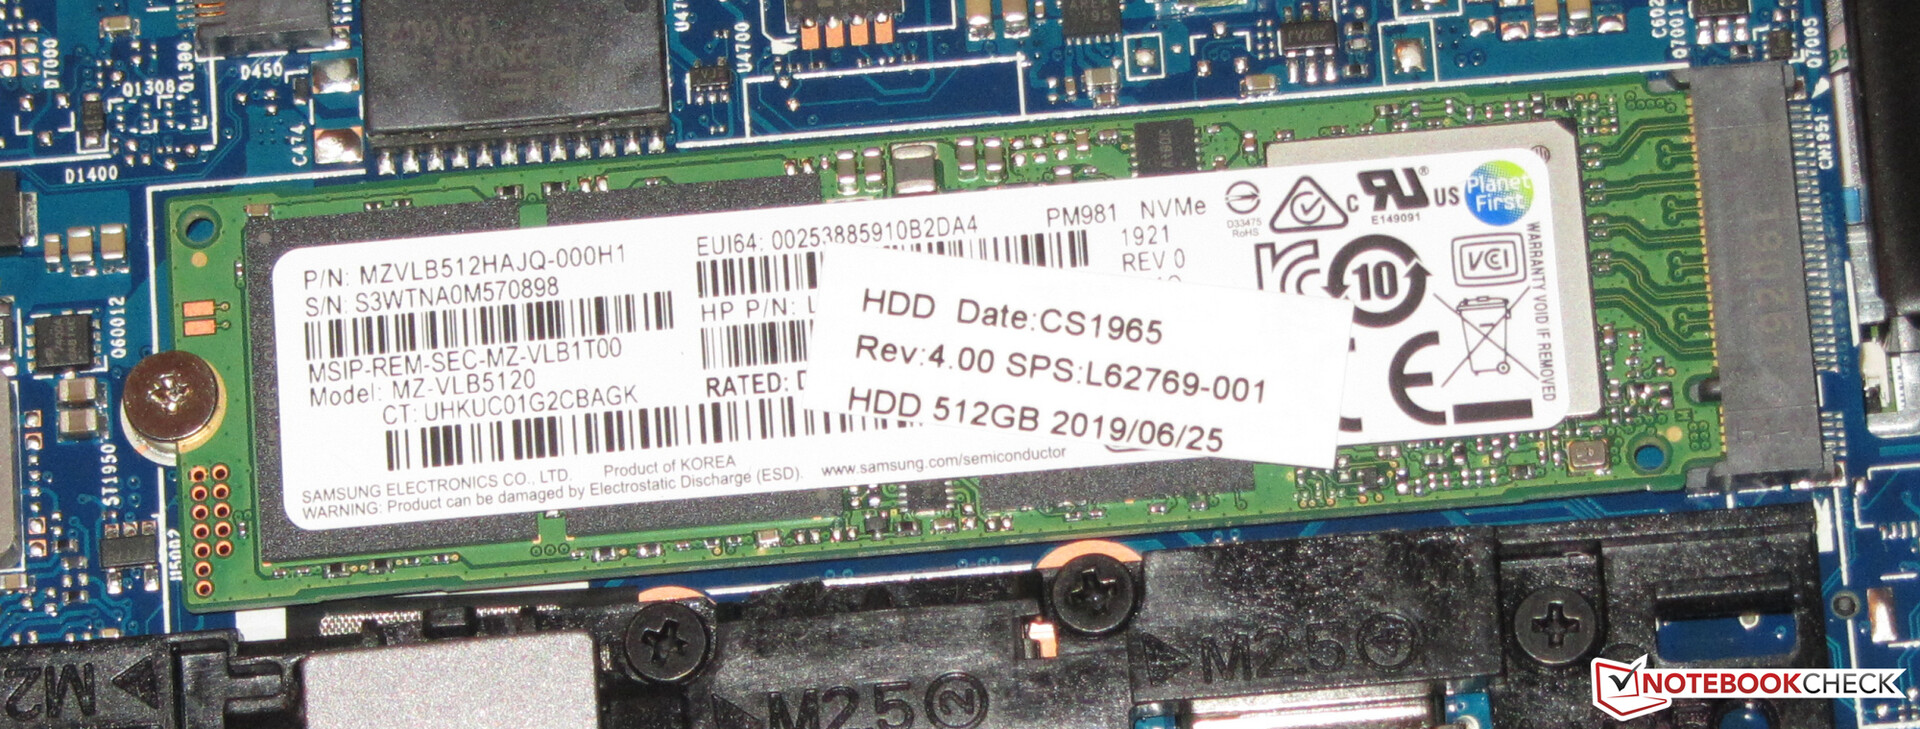
The system drive is an NVMe SSD from Samsung. This M.2 2280 model has a total capacity of 512 GB, out of which about 439 GB can be used out of the box. The remaining storage space is distributed between the Windows installation and the recovery partition. Moreover, the transfer rates are good.

| HP ZBook 14u G6 6TP71EA Samsung SSD PM981 MZVLB512HAJQ | HP ZBook 14u G5-2ZB99EA Toshiba XG5 KXG50ZNV256G | Dell Precision 5530 2-in-1 SK Hynix PC401 512GB M.2 (HFS512GD9TNG) | Lenovo ThinkPad P52s-20LB000HGE Samsung PM961 MZVLW256HEHP | Average Samsung SSD PM981 MZVLB512HAJQ | |
|---|---|---|---|---|---|
| CrystalDiskMark 5.2 / 6 | -51% | -18% | -22% | 2% | |
| Write 4K (MB/s) | 173.7 | 128.9 -26% | 159.2 -8% | 126.7 ? -27% | |
| Read 4K (MB/s) | 50.6 | 45.7 -10% | 45.8 -9% | 44 ? -13% | |
| Write Seq (MB/s) | 1100 | 635 -42% | 852 -23% | 1617 ? 47% | |
| Read Seq (MB/s) | 1072 | 2065 93% | 786 -27% | 1716 ? 60% | |
| Write 4K Q32T1 (MB/s) | 555 | 359.6 -35% | 336.6 -39% | 468.6 -16% | 413 ? -26% |
| Read 4K Q32T1 (MB/s) | 625 | 271.8 -57% | 393.6 -37% | 566 -9% | 420 ? -33% |
| Write Seq Q32T1 (MB/s) | 1892 | 342 -82% | 662 -65% | 1242 -34% | 2076 ? 10% |
| Read Seq Q32T1 (MB/s) | 3233 | 2281 -29% | 2664 -18% | 1761 -46% | 3130 ? -3% |
Graphics card
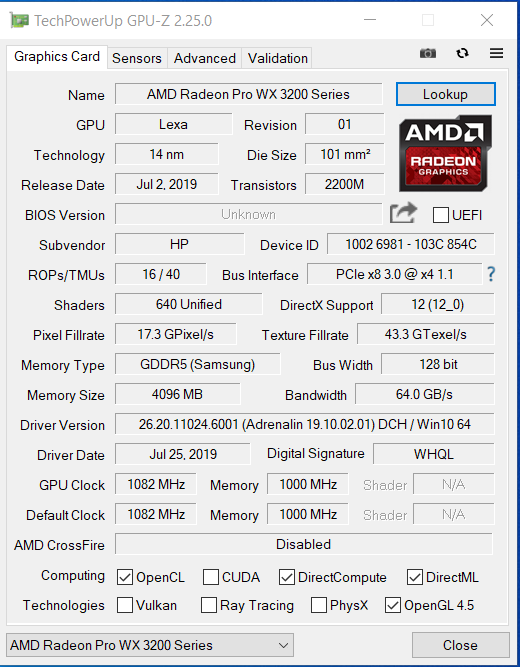
The ZBook is equipped with a Radeon Pro WX 3200 graphics core from AMD. The GPU is based on the Polaris architecture and represents the professional version of the Radeon RX 550 GPU. The WX 3200 supports DirectX 12 and reaches speeds of up to 1082 MHz. The GPU is supported by the faster GDDR5 memory (4,096 MB). Results in the 3DMark benchmarks are at the expected level.
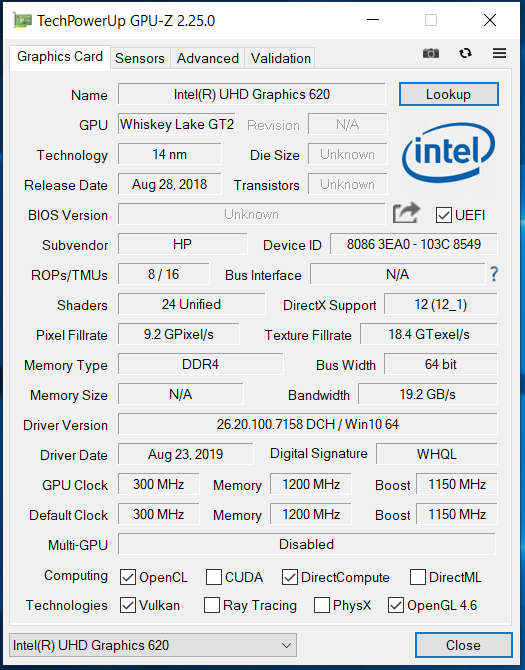
The UHD Graphics 620 GPU that's integrated into the processor is active, and the laptop works with AMD's Enduro graphics-switching solution. The dedicated GPU can be disabled in the BIOS if necessary. The iGPU would then be used permanently.
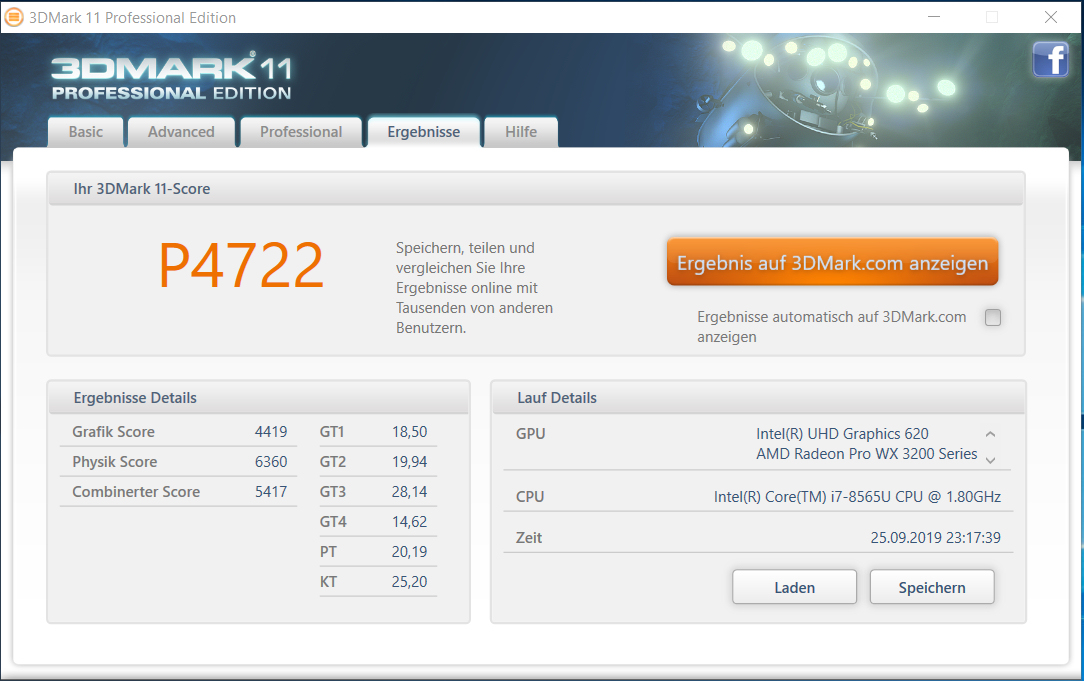
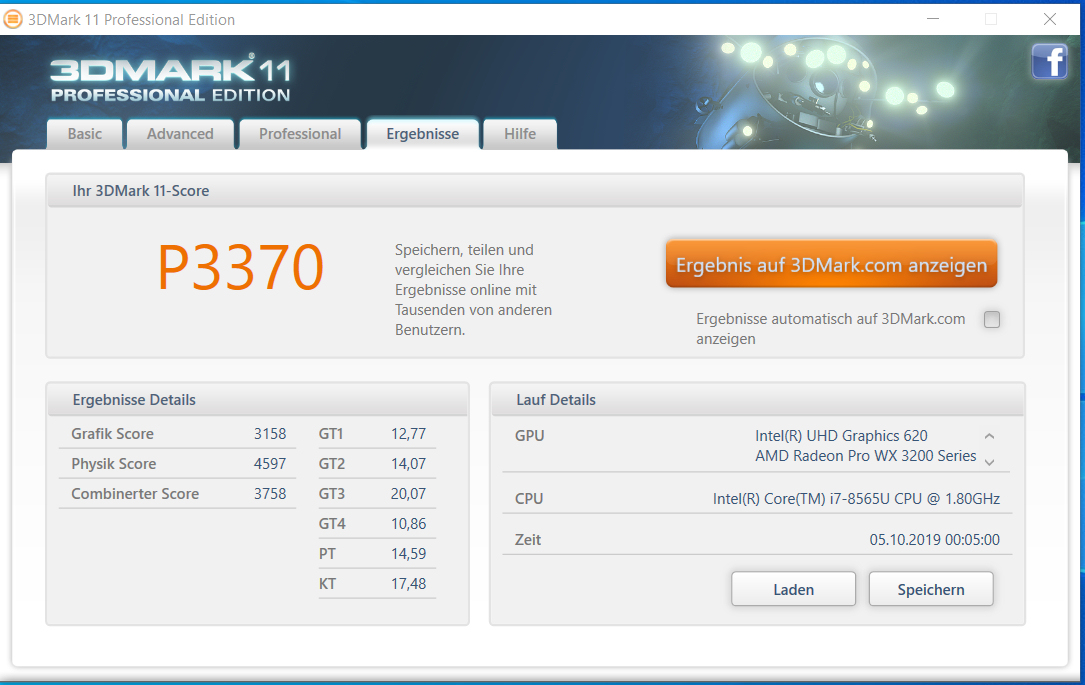
| 3DMark 06 Standard Score | 16054 points | |
| 3DMark 11 Performance | 4722 points | |
| 3DMark Ice Storm Standard Score | 65682 points | |
| 3DMark Cloud Gate Standard Score | 11941 points | |
| 3DMark Fire Strike Score | 2920 points | |
| 3DMark Time Spy Score | 1079 points | |
Help | ||
Gaming performance
The ability to run games isn't a part of the ZBook's job description. Nevertheless, the graphics core makes it possible, but only with restrictions. Our The Witcher 3 test illustrates the problem.
The latter checks whether the frame rates remain largely constant over a longer period of time. For this we run the game The Witcher 3 for about 60 minutes at Full HD resolution and maximum quality settings. The character embodied by the player isn't moved during the entire period.
The GPU is significantly throttled after just a few minutes. Only speeds around 500 MHz are reached then. As a result, the frame rates are cut by half and remain at a constant level.
In order to be able to play games, the resolution and quality level would have to be chosen so low that playable frame rates could still be achieved, even after the throttling of the GPU.
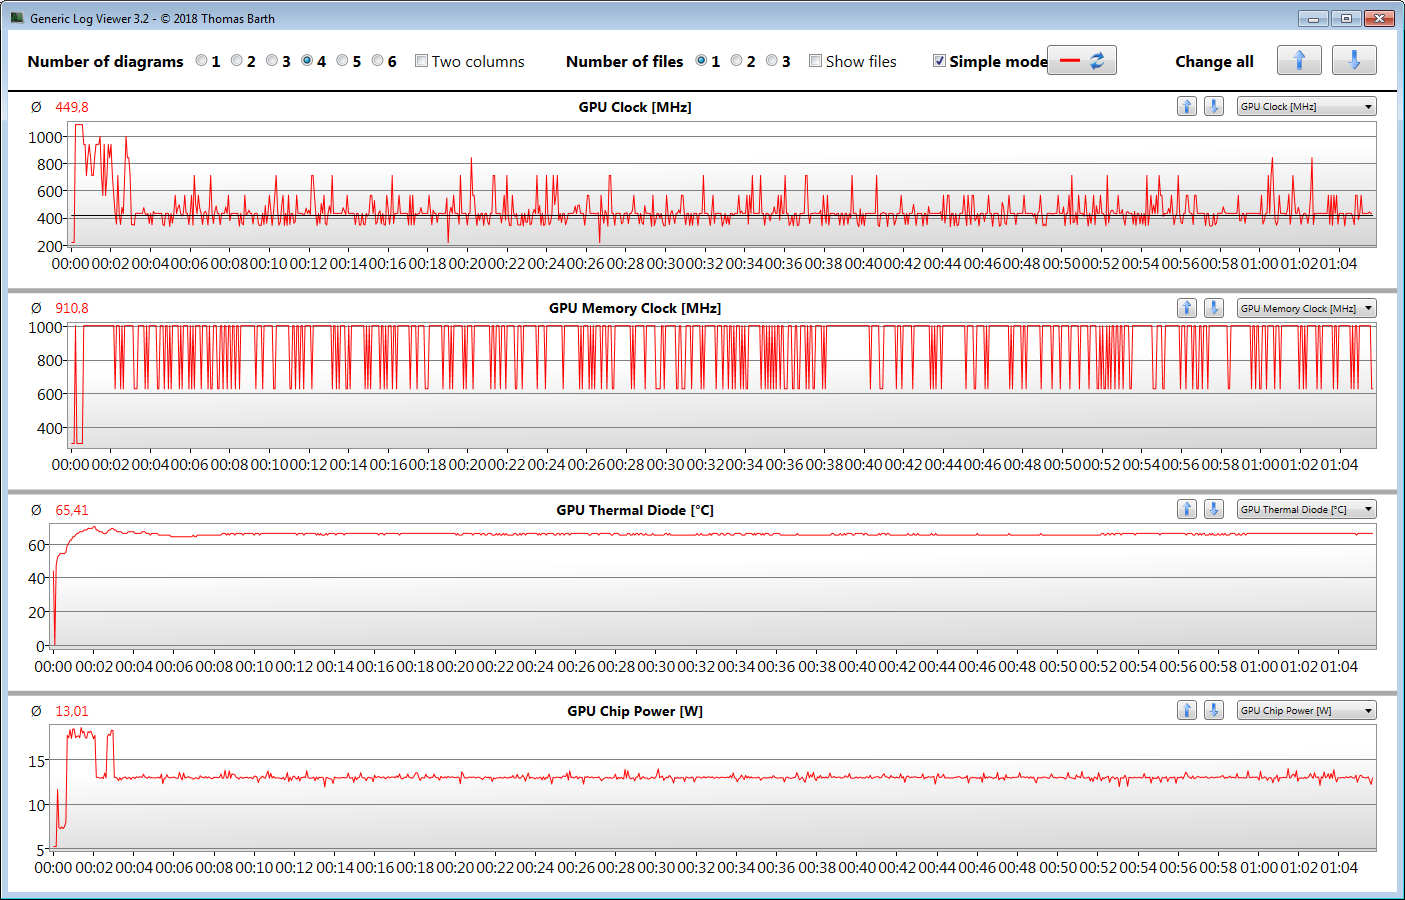
We could also observe the throttling when running our game benchmarks. Therefore, we performed the individual tests with intervals so that the hardware could cool down enough.
| Tomb Raider - 1366x768 Normal Preset AA:FX AF:4x | |
| HP Pavilion Power 15t-cb2000 | |
| HP ZBook 14u G6 6TP71EA | |
| Average AMD Radeon Pro WX 3200 (n=1) | |
| Lenovo ThinkPad E590-20NB0012GE | |
| Acer Swift 3 SF315-41G-R6BR | |
| low | med. | high | ultra | |
|---|---|---|---|---|
| Tomb Raider (2013) | 184.6 | 98.5 | 71.8 | 35 |
| BioShock Infinite (2013) | 186.6 | 90.4 | 83.1 | 30 |
| The Witcher 3 (2015) | 58.1 | 35.6 | 18 | 11.2 |
| Dota 2 Reborn (2015) | 103 | 86 | 49.1 | 24.7 |
| Final Fantasy XV Benchmark (2018) | 26.3 | 9.7 | 6.3 | |
| X-Plane 11.11 (2018) | 25 | 16.6 | 15.1 | |
| Apex Legends (2019) | 65.9 | 24.3 | 15.1 | 13.2 |
| Metro Exodus (2019) | 31.1 | 14 | 10 | 7 |
| Rage 2 (2019) | 40.9 | 16.8 | 14.1 | 10 |
| Total War: Three Kingdoms (2019) | 55.5 | 15.3 | 9.9 | 4 |
| F1 2019 (2019) | 59 | 33 | 25 | 15 |
| Control (2019) | 42.4 | 12.5 | 8.3 |
Emissions - The emission values of the ZBook 14 are in the green area
Noise emissions
The ZBook 14u doesn't produce a lot of noise over the entire load range. When idle, the fan is often off, and silence prevails. Under full load, the fan turns up a little. During the stress test, we measure a sound level of 35.9 dB(A).
Noise level
| Idle |
| 29.7 / 29.7 / 30.4 dB(A) |
| Load |
| 32.7 / 35.9 dB(A) |
 | ||
30 dB silent 40 dB(A) audible 50 dB(A) loud |
||
min: | ||
| HP ZBook 14u G6 6TP71EA i7-8565U, Radeon Pro WX 3200 | HP ZBook 14u G5-2ZB99EA i5-8550U, Radeon Pro WX 3100 | Dell Precision 5530 2-in-1 i7-8706G, WX Vega M GL | Lenovo ThinkPad P52s-20LB000HGE i5-8550U, Quadro P500 | Average AMD Radeon Pro WX 3200 | Average of class Workstation | |
|---|---|---|---|---|---|---|
| Noise | -0% | -10% | 1% | 0% | 0% | |
| off / environment * (dB) | 29.7 | 29.8 -0% | 28.6 4% | 29 2% | 29.7 ? -0% | 24.1 ? 19% |
| Idle Minimum * (dB) | 29.7 | 29.8 -0% | 28.6 4% | 29 2% | 29.7 ? -0% | 24.8 ? 16% |
| Idle Average * (dB) | 29.7 | 29.8 -0% | 28.6 4% | 29 2% | 29.7 ? -0% | 25.4 ? 14% |
| Idle Maximum * (dB) | 30.4 | 29.8 2% | 29.1 4% | 31.2 -3% | 30.4 ? -0% | 26.7 ? 12% |
| Load Average * (dB) | 32.7 | 33.5 -2% | 39.8 -22% | 32.5 1% | 32.7 ? -0% | 39.2 ? -20% |
| Witcher 3 ultra * (dB) | 35.3 | 34.2 3% | 47 -33% | 32.5 8% | ||
| Load Maximum * (dB) | 35.9 | 37.3 -4% | 47 -31% | 37.5 -4% | 36 ? -0% | 50.4 ? -40% |
* ... smaller is better
Temperature
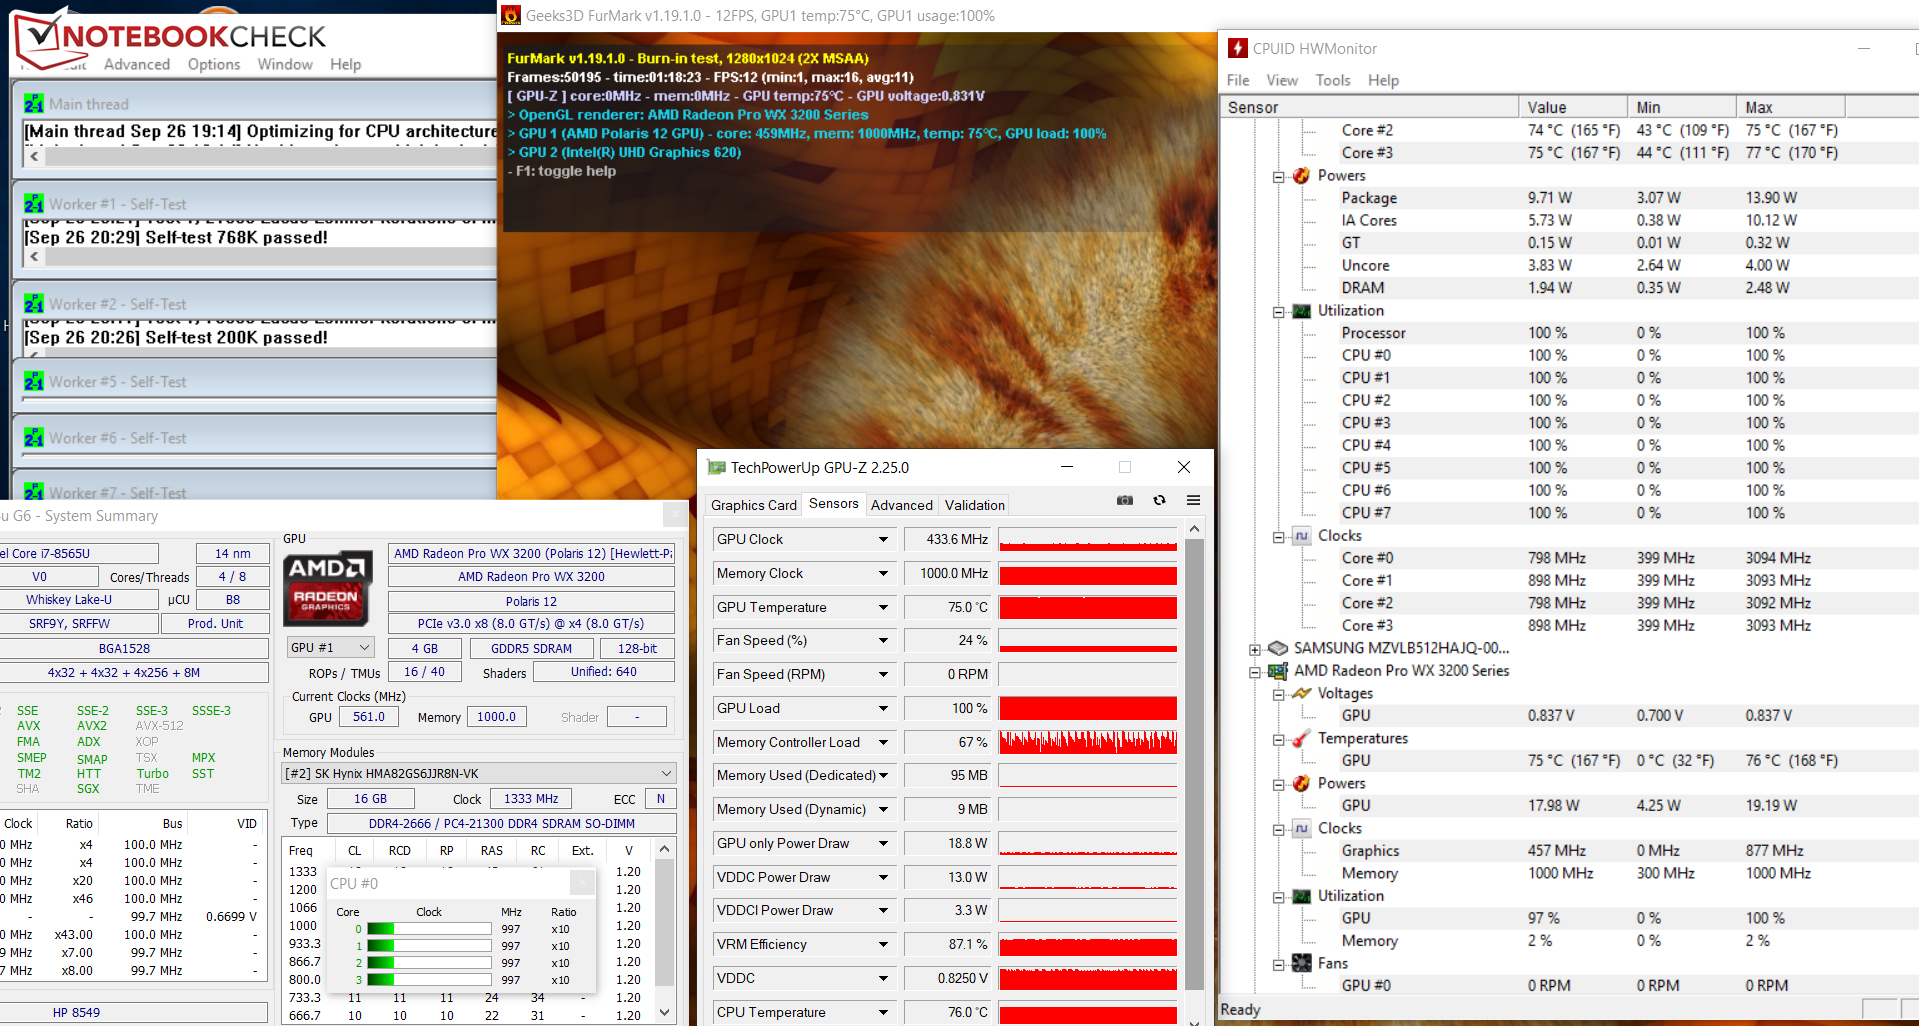
Our stress test (Prime95 and FurMark run for at least an hour) is carried out in the same way by the ZBook both when plugged in and on battery power. The CPU initially runs at 1.4 to 1.5 GHz. In the next run, the clock speed gradually drops to 1 GHz and remains at this level. The graphics core runs at 400 to 500 MHz. The stress test represents an extreme scenario that doesn't occur in everyday life. With this test, we check whether the system is stable, even under full load.
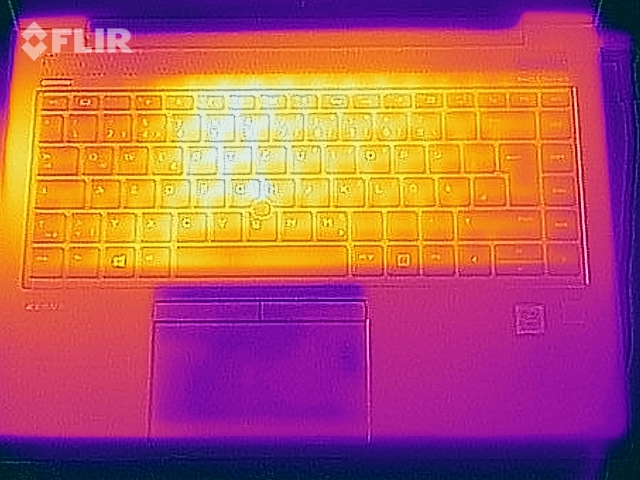
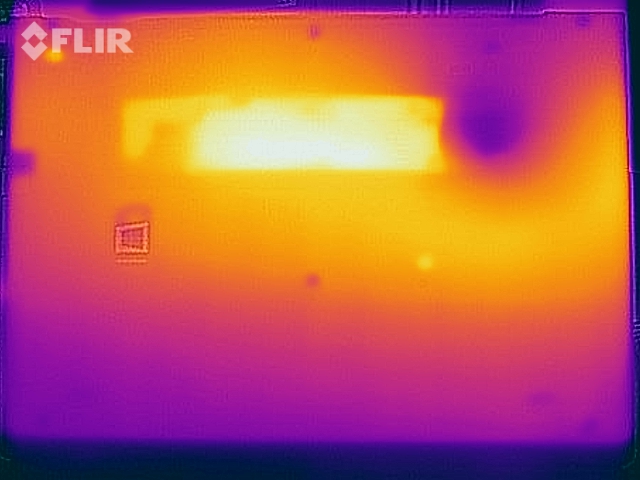
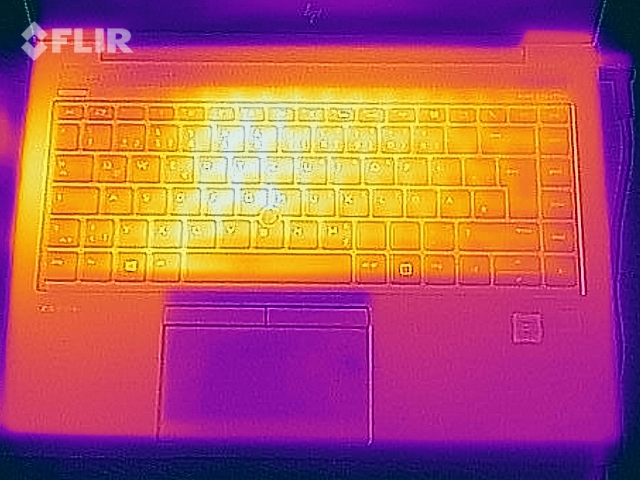
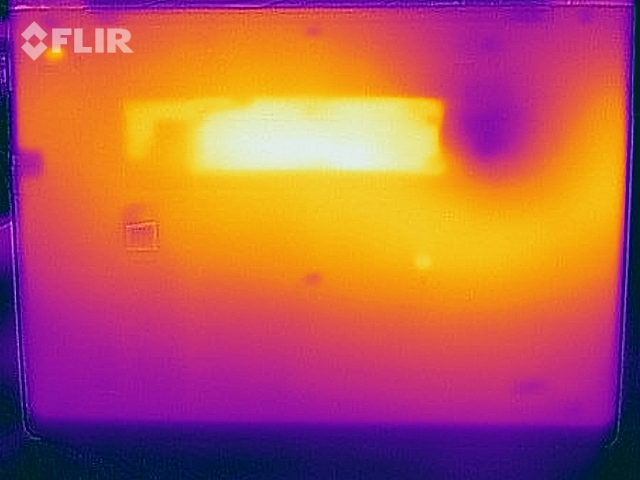
HP's 14-incher doesn't become excessively warm. We registered temperatures just above 40 °C (~104 °F) at several measuring points during the stress test. Heat development is at the same level when conducting our The Witcher 3 test. When idle, the temperatures are in the green area.
(±) The maximum temperature on the upper side is 40.8 °C / 105 F, compared to the average of 38.2 °C / 101 F, ranging from 22.2 to 69.8 °C for the class Workstation.
(±) The bottom heats up to a maximum of 43 °C / 109 F, compared to the average of 41.1 °C / 106 F
(+) In idle usage, the average temperature for the upper side is 23.6 °C / 74 F, compared to the device average of 32 °C / 90 F.
(±) Playing The Witcher 3, the average temperature for the upper side is 35.1 °C / 95 F, compared to the device average of 32 °C / 90 F.
(+) The palmrests and touchpad are cooler than skin temperature with a maximum of 29.9 °C / 85.8 F and are therefore cool to the touch.
(-) The average temperature of the palmrest area of similar devices was 27.8 °C / 82 F (-2.1 °C / -3.8 F).
| HP ZBook 14u G6 6TP71EA i7-8565U, Radeon Pro WX 3200 | HP ZBook 14u G5-2ZB99EA i5-8550U, Radeon Pro WX 3100 | Dell Precision 5530 2-in-1 i7-8706G, WX Vega M GL | Lenovo ThinkPad P52s-20LB000HGE i5-8550U, Quadro P500 | Average AMD Radeon Pro WX 3200 | Average of class Workstation | |
|---|---|---|---|---|---|---|
| Heat | 1% | -21% | -14% | -1% | -17% | |
| Maximum Upper Side * (°C) | 40.8 | 39.7 3% | 48.6 -19% | 41.8 -2% | 40.7 ? -0% | 43.8 ? -7% |
| Maximum Bottom * (°C) | 43 | 42.7 1% | 42.2 2% | 55.9 -30% | 44 ? -2% | 45 ? -5% |
| Idle Upper Side * (°C) | 24.1 | 24.2 -0% | 31.6 -31% | 26.3 -9% | 24.3 ? -1% | 30.6 ? -27% |
| Idle Bottom * (°C) | 24.4 | 24.6 -1% | 33.2 -36% | 27.7 -14% | 24.9 ? -2% | 31.6 ? -30% |
* ... smaller is better
Speakers
HP ZBook 14u G6 6TP71EA audio analysis
(±) | speaker loudness is average but good (78.4 dB)
Bass 100 - 315 Hz
(-) | nearly no bass - on average 20.4% lower than median
(±) | linearity of bass is average (11.9% delta to prev. frequency)
Mids 400 - 2000 Hz
(+) | balanced mids - only 1.5% away from median
(+) | mids are linear (5.3% delta to prev. frequency)
Highs 2 - 16 kHz
(+) | balanced highs - only 4.3% away from median
(+) | highs are linear (2.8% delta to prev. frequency)
Overall 100 - 16.000 Hz
(±) | linearity of overall sound is average (18.8% difference to median)
Compared to same class
» 65% of all tested devices in this class were better, 6% similar, 29% worse
» The best had a delta of 7%, average was 17%, worst was 35%
Compared to all devices tested
» 43% of all tested devices were better, 8% similar, 49% worse
» The best had a delta of 4%, average was 24%, worst was 134%
Lenovo ThinkPad P52s-20LB000HGE audio analysis
(±) | speaker loudness is average but good (80.6 dB)
Bass 100 - 315 Hz
(-) | nearly no bass - on average 15% lower than median
(±) | linearity of bass is average (11.7% delta to prev. frequency)
Mids 400 - 2000 Hz
(±) | higher mids - on average 5.6% higher than median
(+) | mids are linear (5.7% delta to prev. frequency)
Highs 2 - 16 kHz
(+) | balanced highs - only 3.1% away from median
(+) | highs are linear (5.7% delta to prev. frequency)
Overall 100 - 16.000 Hz
(±) | linearity of overall sound is average (17.8% difference to median)
Compared to same class
» 55% of all tested devices in this class were better, 11% similar, 34% worse
» The best had a delta of 7%, average was 17%, worst was 35%
Compared to all devices tested
» 36% of all tested devices were better, 8% similar, 56% worse
» The best had a delta of 4%, average was 24%, worst was 134%
Energy management - HP's 14-incher delivers good battery life
Energy consumption
In idle usage, we register a maximum requirement of 10.9 watts (9.36 watts when key lighting is deactivated). During our stress test, the value briefly rises to 70.5 watts and then settles at 61 watts. We measure an average power consumption of 50.4 watts while running our The Witcher 3 test. The included power adapter has a rated output of 65 watts.
| Off / Standby | |
| Idle | |
| Load |
|
Key:
min: | |
| HP ZBook 14u G6 6TP71EA i7-8565U, Radeon Pro WX 3200 | HP ZBook 14u G5-2ZB99EA i5-8550U, Radeon Pro WX 3100 | Dell Precision 5530 2-in-1 i7-8706G, WX Vega M GL | Lenovo ThinkPad P52s-20LB000HGE i5-8550U, Quadro P500 | Average AMD Radeon Pro WX 3200 | Average of class Workstation | |
|---|---|---|---|---|---|---|
| Power Consumption | 14% | -48% | 8% | -7% | -92% | |
| Idle Minimum * (Watt) | 4.2 | 3.4 19% | 7.4 -76% | 4.1 2% | 4.85 ? -15% | 8.94 ? -113% |
| Idle Average * (Watt) | 7.93 | 5.6 29% | 12.4 -56% | 7.7 3% | 8.87 ? -12% | 13.8 ? -74% |
| Idle Maximum * (Watt) | 10.9 | 8.5 22% | 13.3 -22% | 10.7 2% | 11.5 ? -6% | 17.5 ? -61% |
| Load Average * (Watt) | 59.1 | 55.2 7% | 79.2 -34% | 52 12% | 59.1 ? -0% | 95 ? -61% |
| Witcher 3 ultra * (Watt) | 50.4 | 46 9% | 82.2 -63% | 38.8 23% | ||
| Load Maximum * (Watt) | 70.5 | 71.4 -1% | 96.5 -37% | 65 8% | 70.3 ? -0% | 175.2 ? -149% |
* ... smaller is better
Battery life
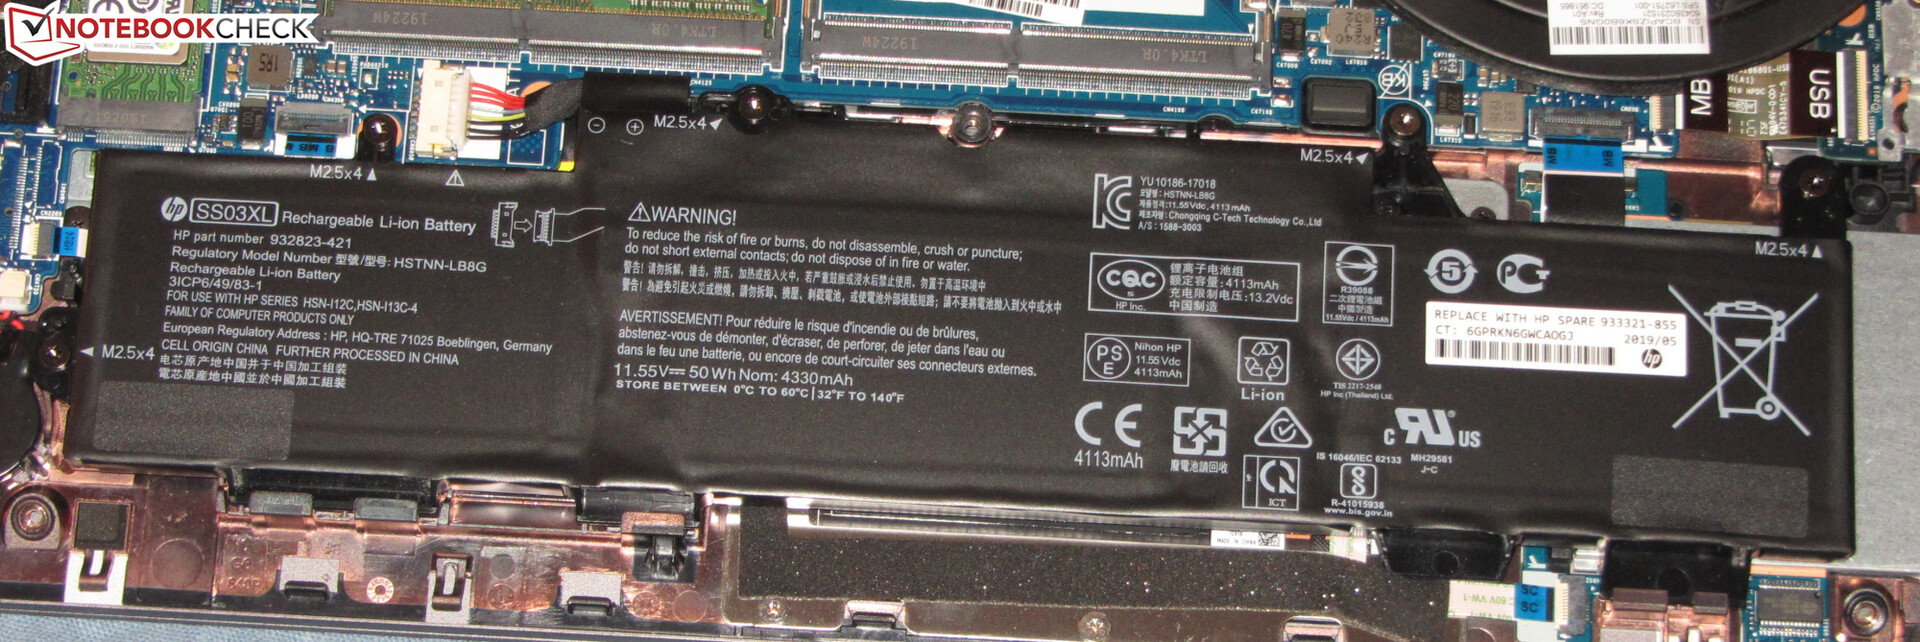
The HP laptop reaches a runtime of 8:32 hours in our practical Wi-Fi test. We use a script to simulate the load caused by accessing websites here. The "balanced" profile is activated, and the display brightness is set to about 150 cd/m². At maximum display brightness, the device turns off after 5:56 hours.
The 14-incher finishes our video test after 11:00 hours. For this test, we play the short film Big Buck Bunny (H.264-encoded, 1920x1080 pixels) in a loop. The network module is turned off, and the display brightness is lowered to 150 cd/m².
| HP ZBook 14u G6 6TP71EA i7-8565U, Radeon Pro WX 3200, 50 Wh | HP ZBook 14u G5-2ZB99EA i5-8550U, Radeon Pro WX 3100, 50 Wh | Dell Precision 5530 2-in-1 i7-8706G, WX Vega M GL, 75 Wh | Lenovo ThinkPad P52s-20LB000HGE i5-8550U, Quadro P500, 104 Wh | Average of class Workstation | |
|---|---|---|---|---|---|
| Battery runtime | 30% | -20% | 112% | 9% | |
| Reader / Idle (h) | 17.7 | 19.2 8% | 12.3 -31% | 39.3 122% | 26.1 ? 47% |
| H.264 (h) | 11 | 8.4 -24% | 18.9 72% | 9.51 ? -14% | |
| WiFi v1.3 (h) | 8.5 | 9.6 13% | 7.3 -14% | 16.2 91% | 8.53 ? 0% |
| Load (h) | 1.4 | 3.1 121% | 1.2 -14% | 3.7 164% | 1.429 ? 2% |
Pros
Cons
Verdict
With the ZBook 14u G6, Hewlett Packard delivers a compact, 14-inch mobile workstation. A Core i7-8565U processor and a Radeon Pro WX 3200 graphics core provide the necessary computing power. However, there's a weakness in terms of performance development. In this way, the processor is only able to deliver its single-thread performance fully to a large extent; the multithread performance remains well below full potential.
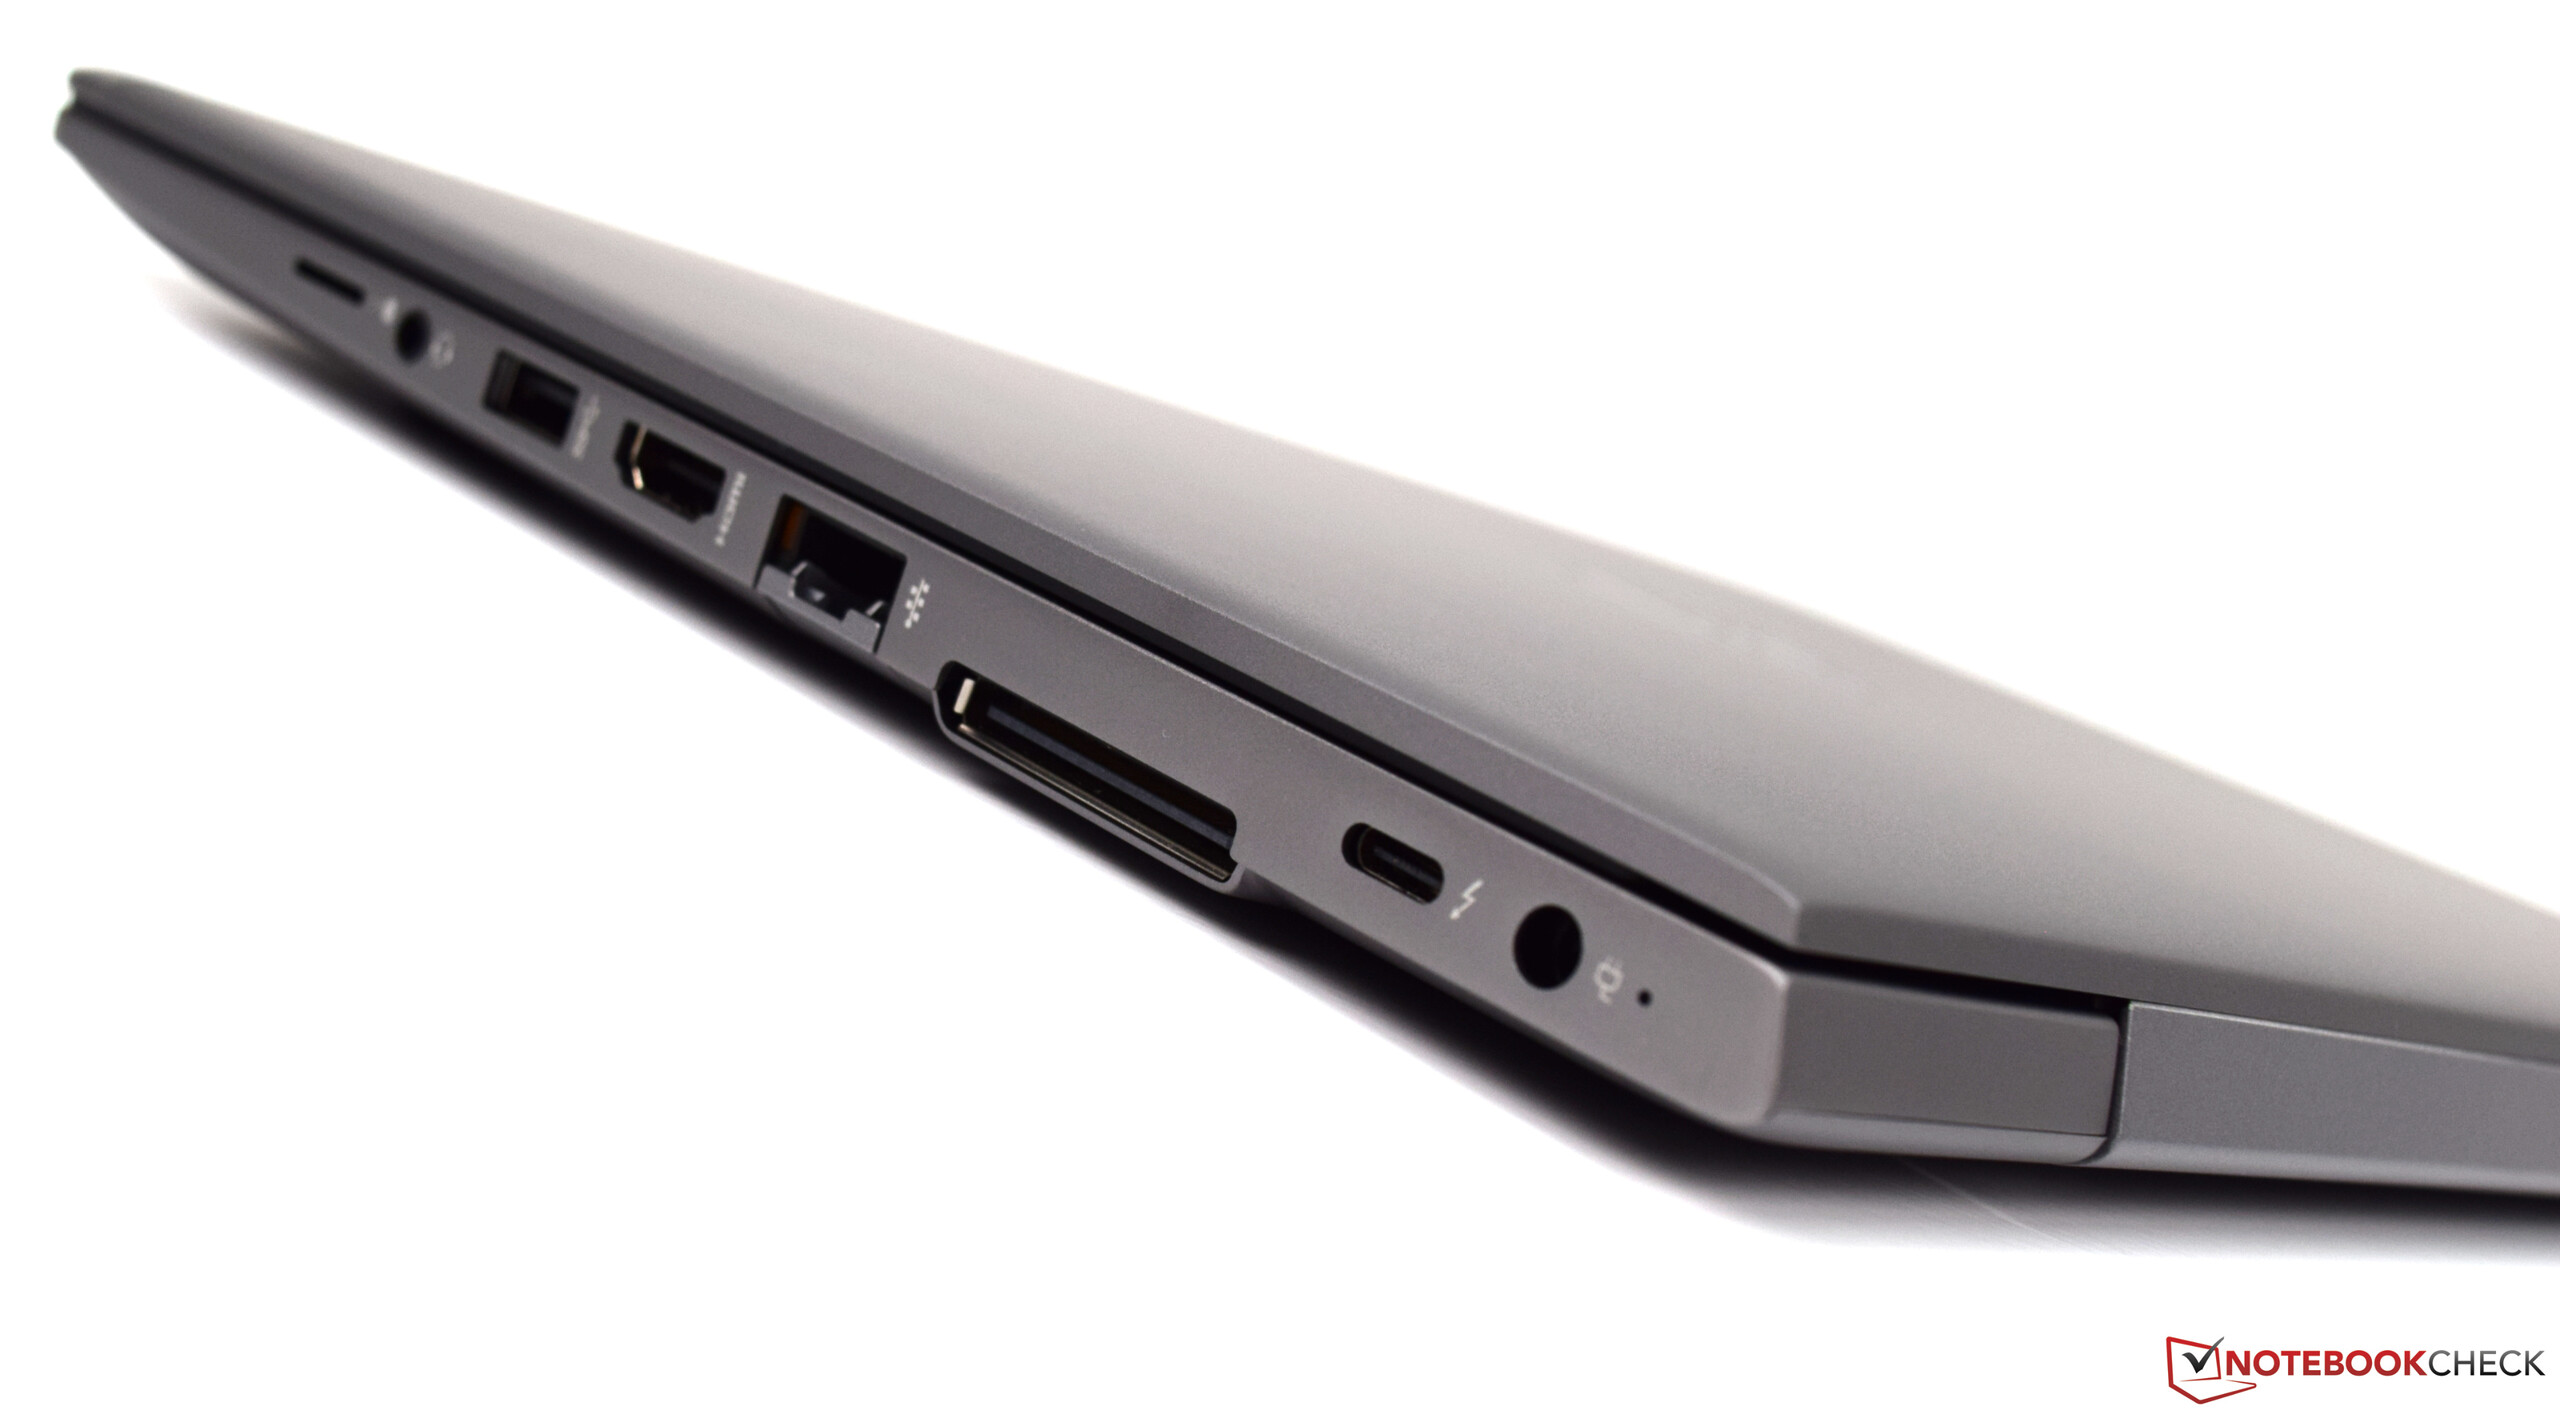
Users who also want to run games on the laptop won't be happy with the ZBook. The laptop is made for applications that only put a light load on the graphics core. After a short time, the GPU is already significantly throttled. If necessary, a more powerful external GPU could be plugged into the Thunderbolt 3 port.
With the ZBook 14u G6, HP delivers a high-quality mobile workstation.
The laptop's cooling system doesn't produce much noise. In addition, the computer's heat development stays a lot within the limits. An NVMe SSD ensures a fast system. Swapping the SSD would be possible, and this would require the case to be opened. The keyboard (backlit) left a very good impression and the battery life is good.
The matte Full HD IPS display scores points with high brightness, stable viewing angles, good contrast and great color reproduction. Furthermore, the sRGB color space is covered to almost 100%.
HP ZBook 14u G6 6TP71EA
- 10/06/2019 v7 (old)
Sascha Mölck
Price comparison
