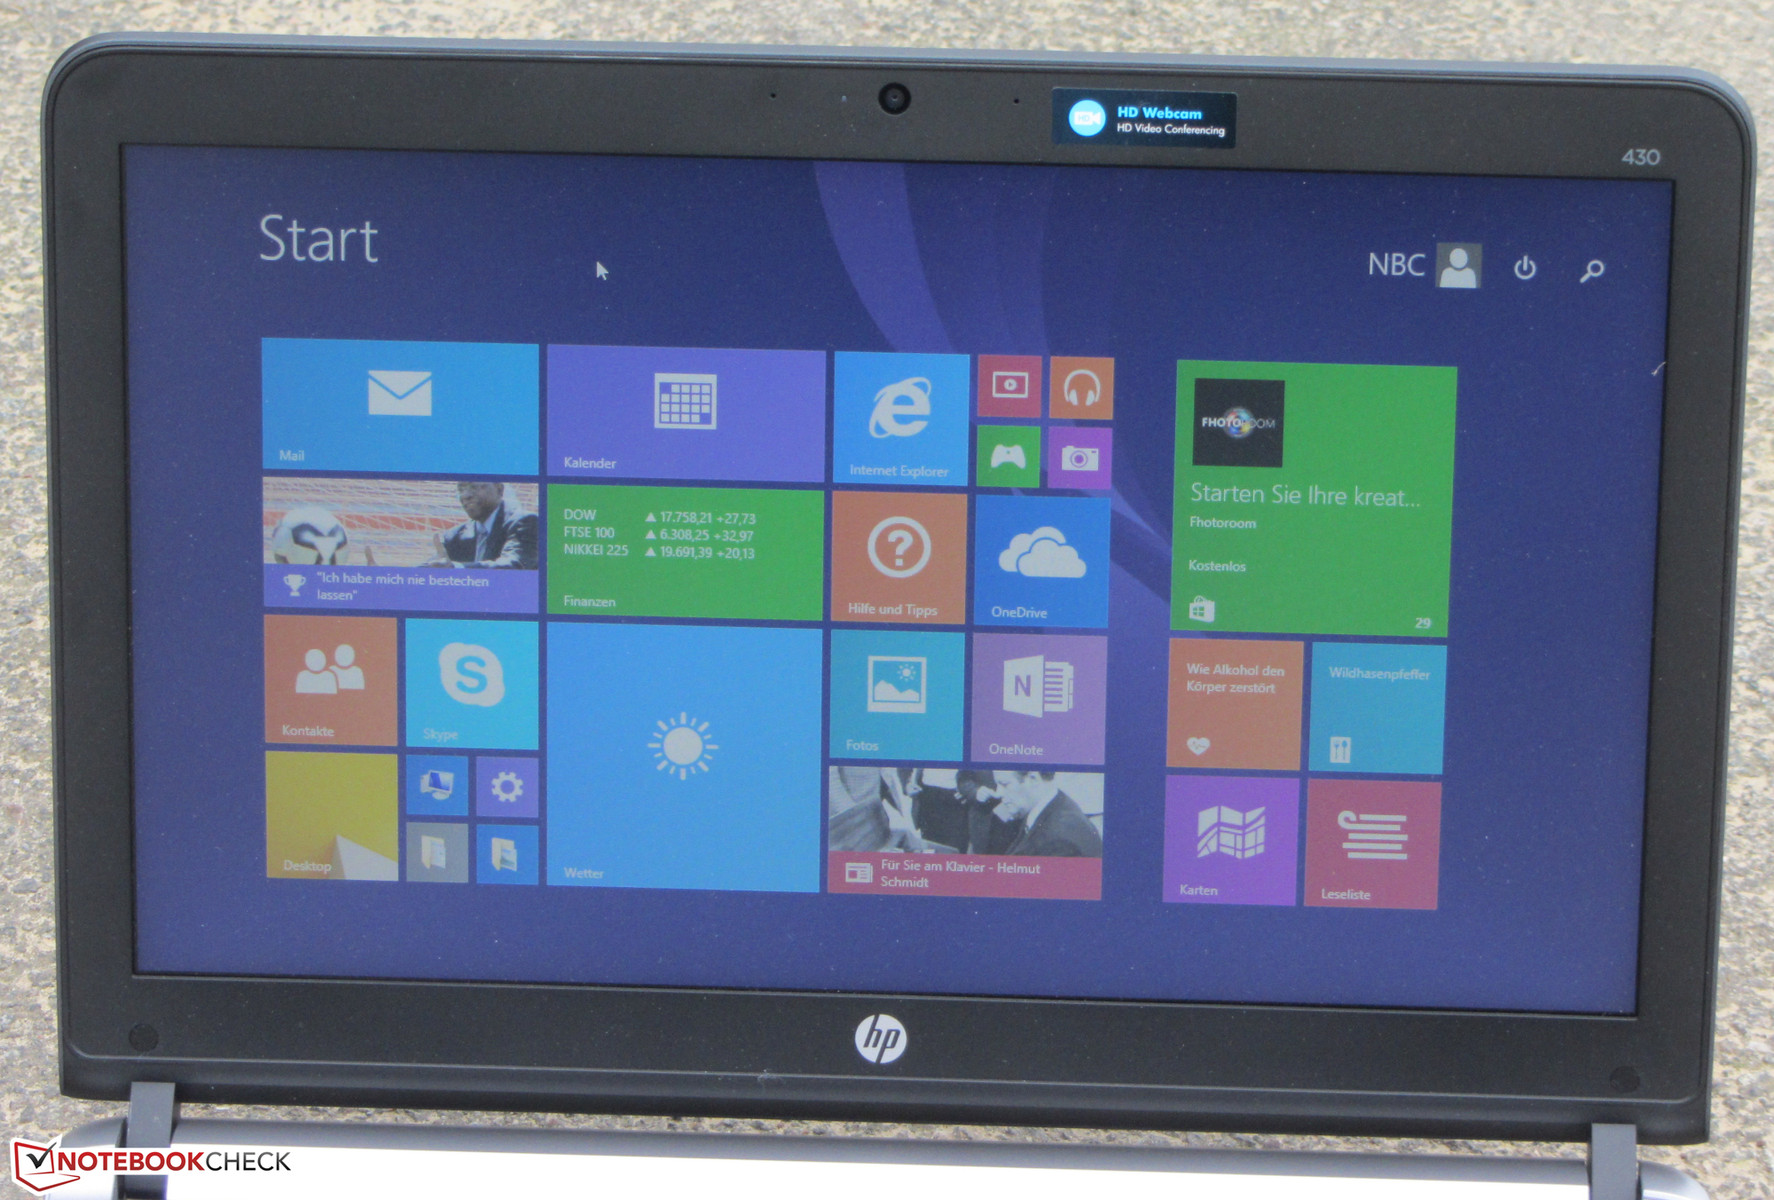
HP ProBook 430 G3 Notebook Review

For the original German review, see here.
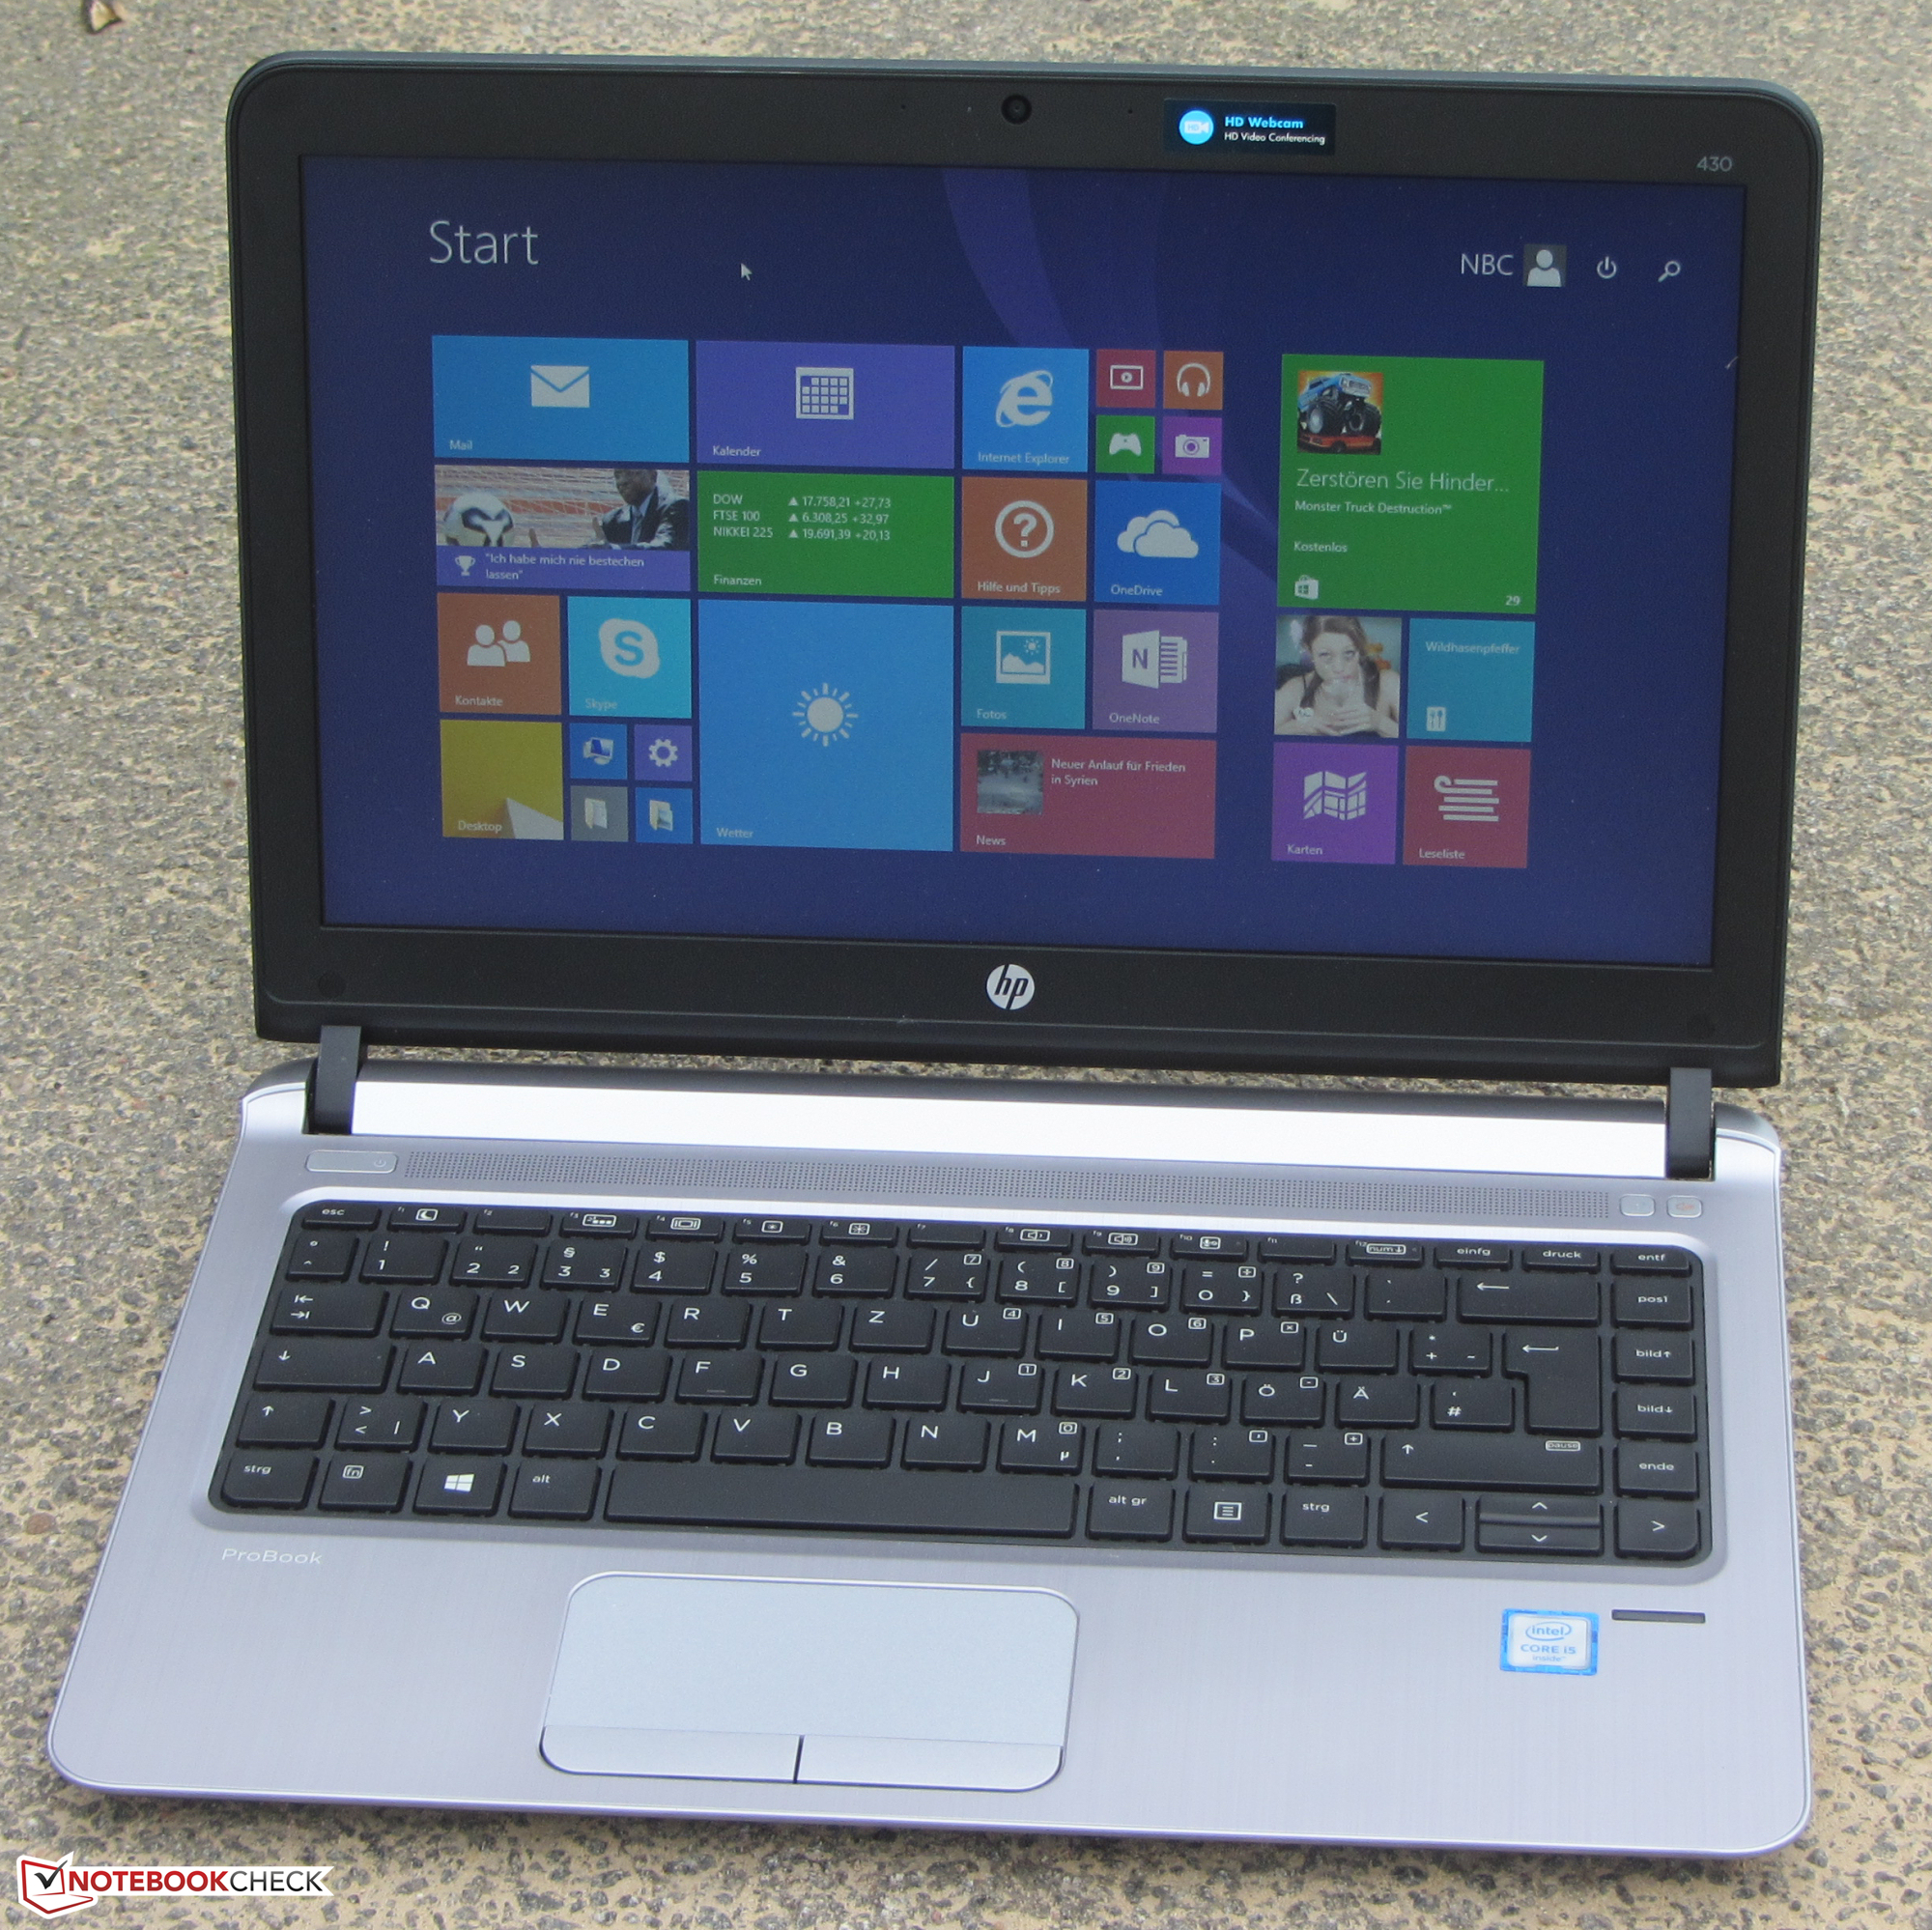
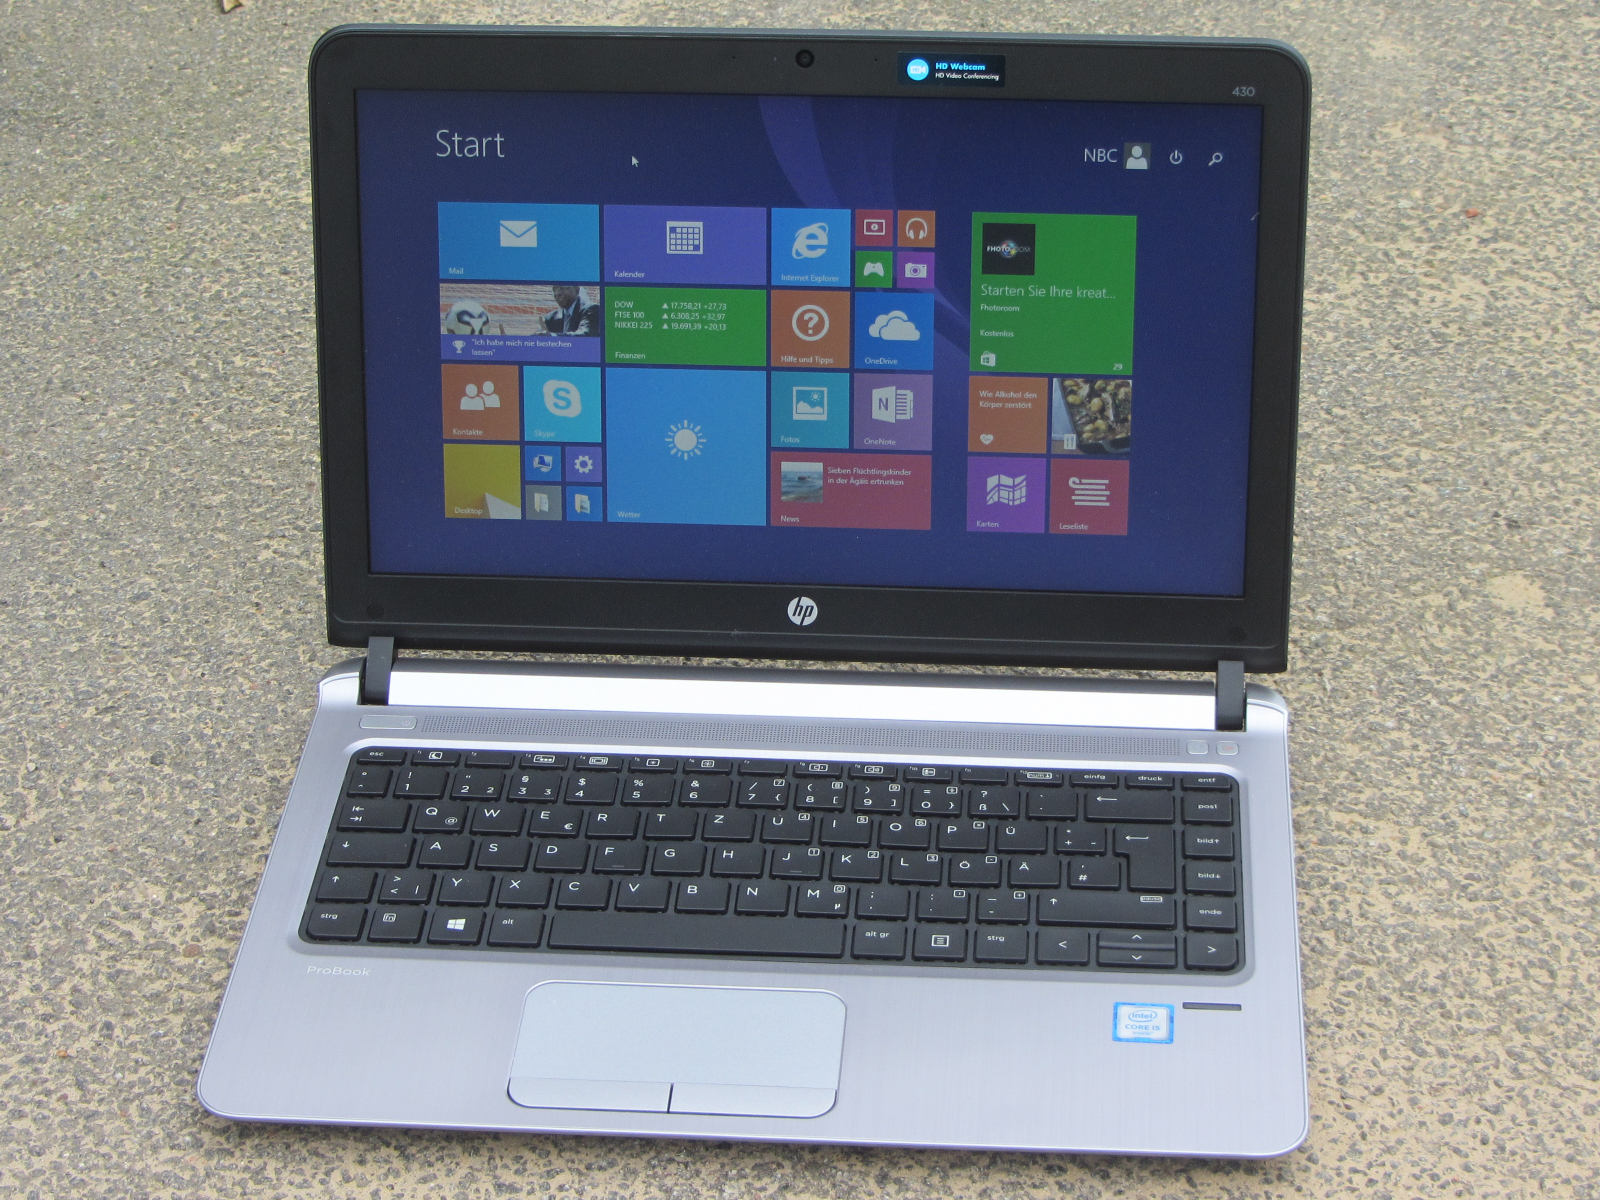
HP's ProBook 4X0 series represent cheap entry-level notebooks in the business sector. With the ProBook 430 G3, we have the 13.3-inch model of the series under review. Apart from several other adjustments, the most important change in the third ProBook generation is the Skylake processor. The competition includes the Lenovo ThinkPad E450, the Acer TravelMate P236-M, the Dell Latitude 3340, and the Fujitsu LifeBook E544.
What is new?
Although there are many changes, he biggest change is the new Skylake processor. At a first glance, the computer looks like its predecessor, but on closer inspection you will find several differences.
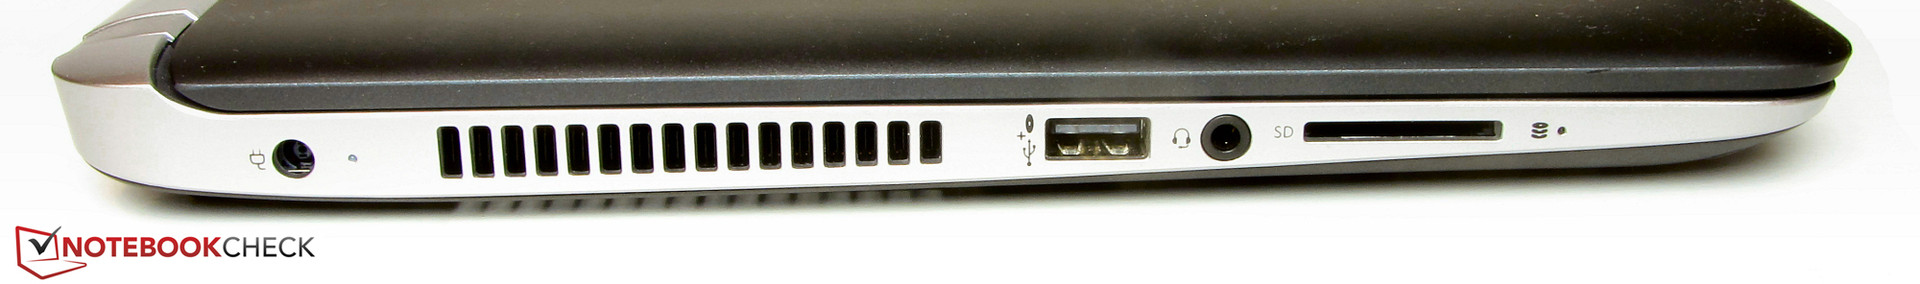
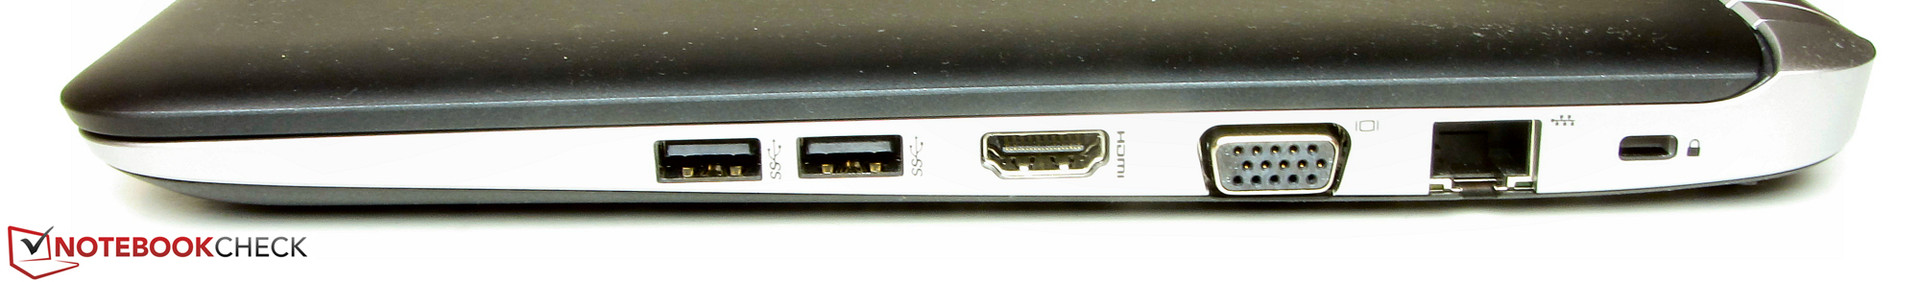
- Number and selection of interfaces have remained the same, but their layout is different.
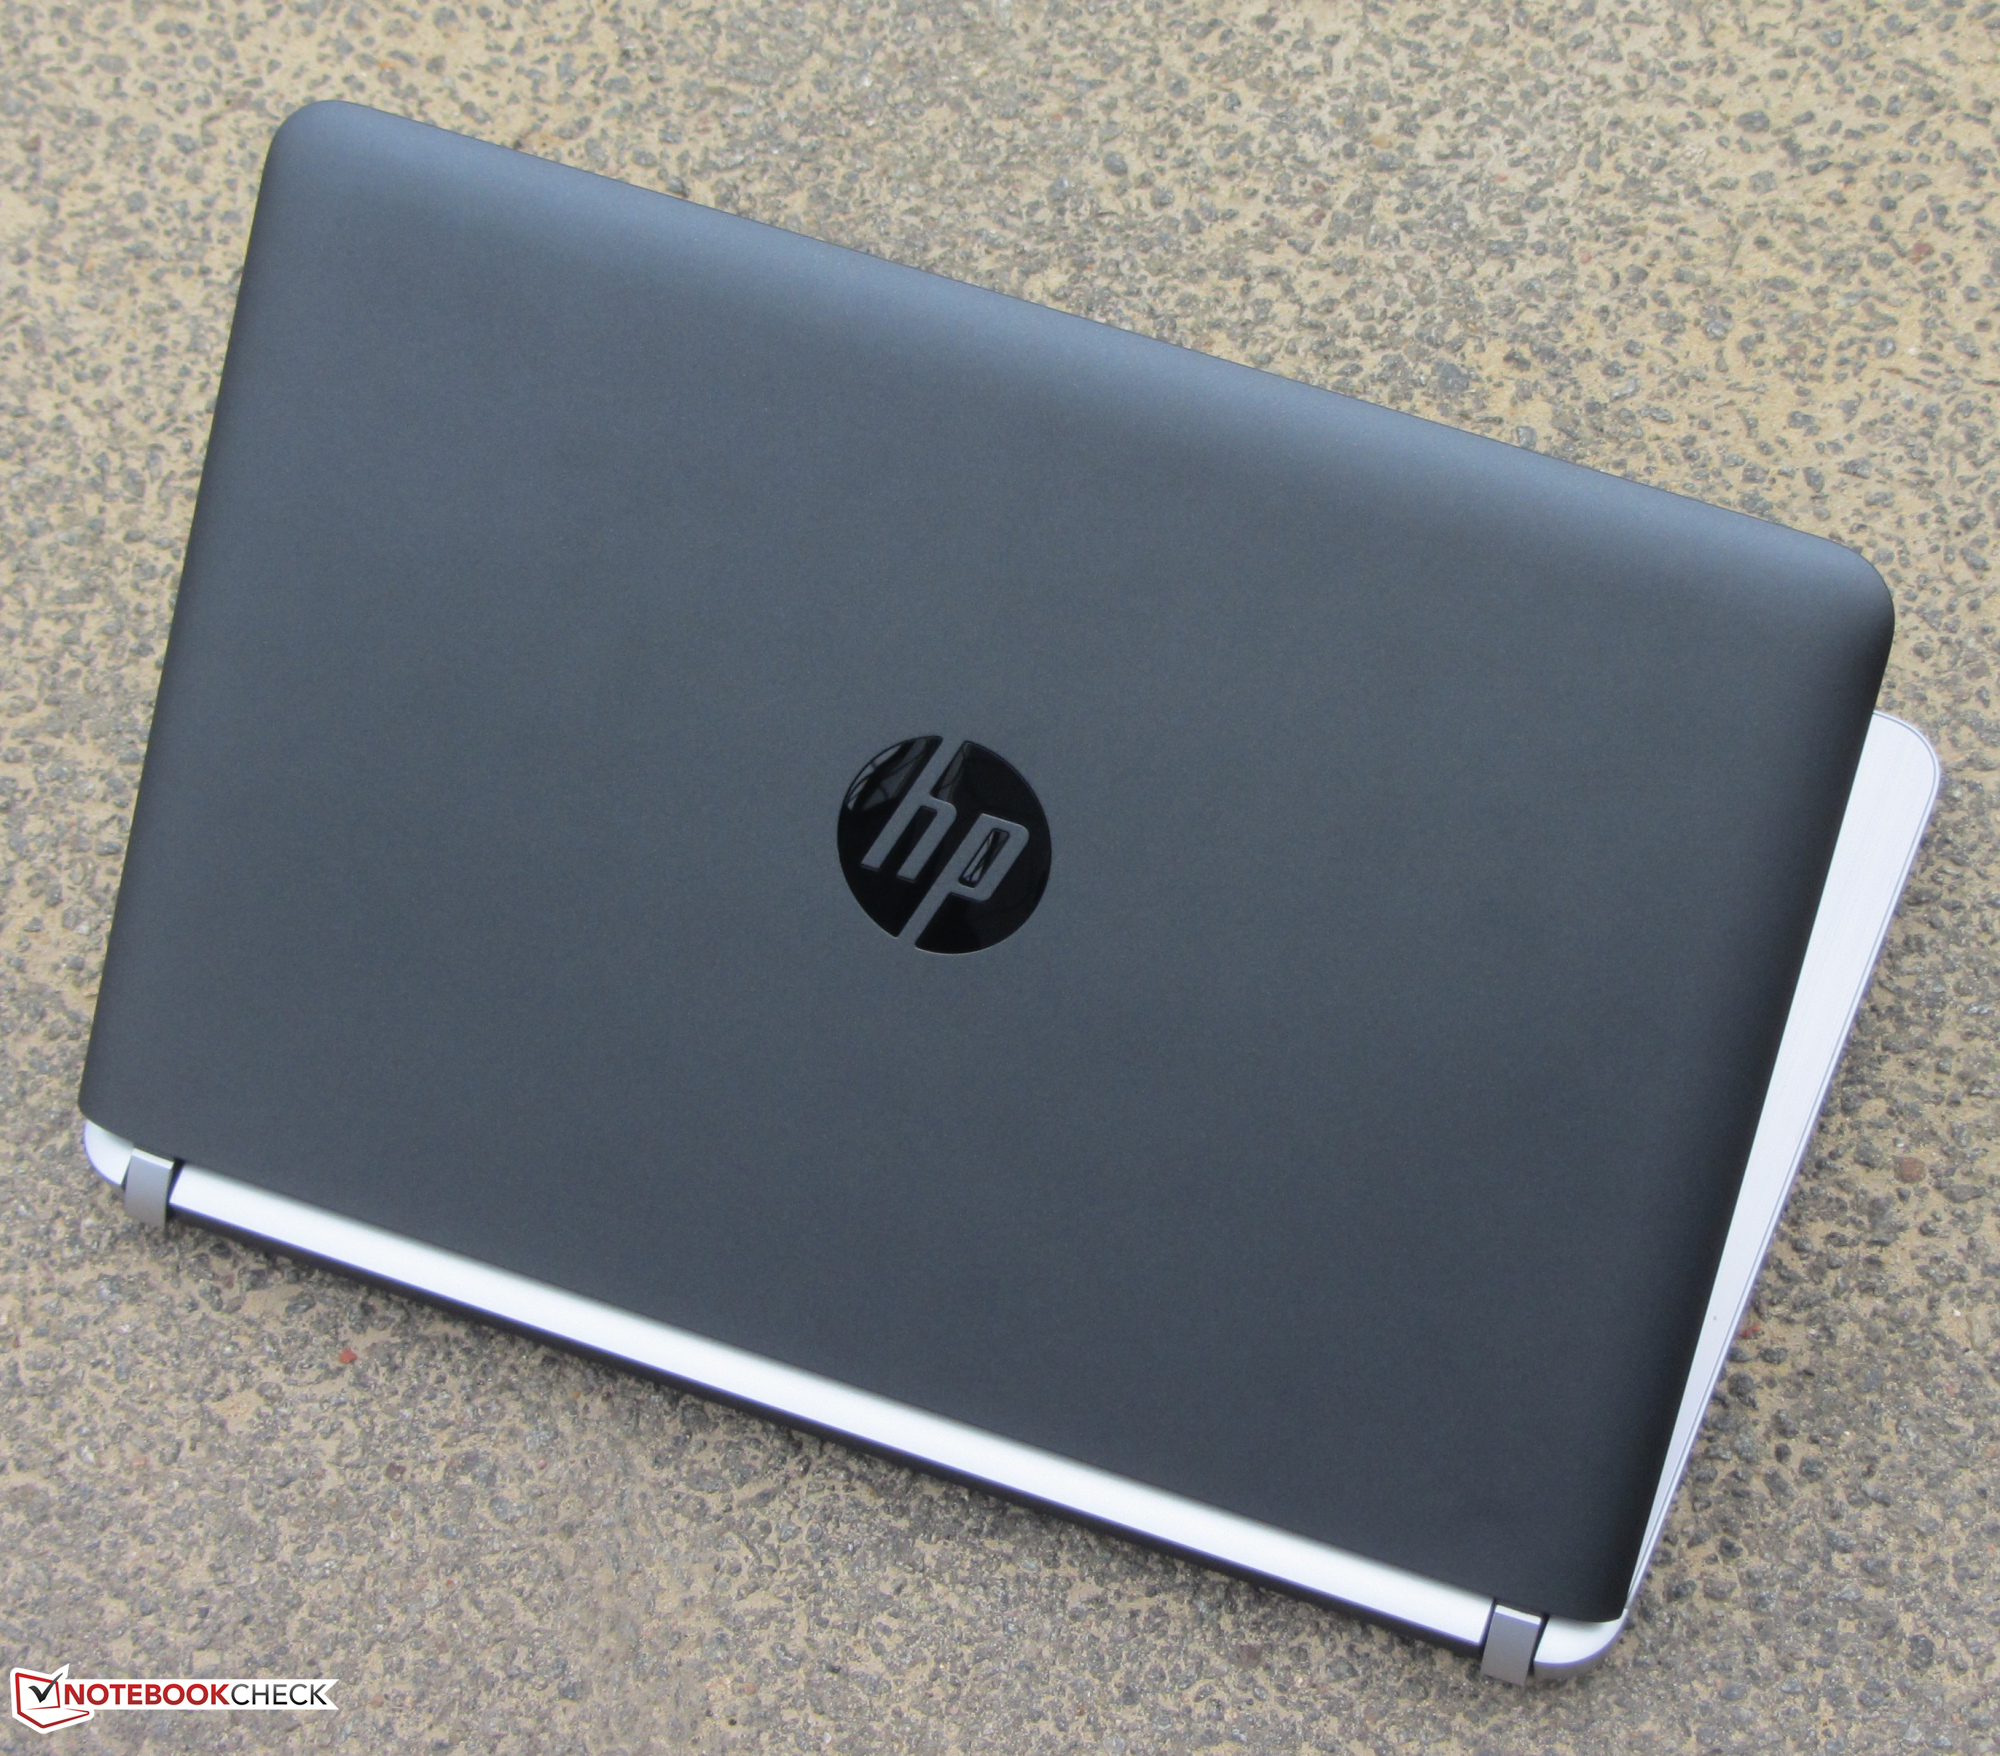
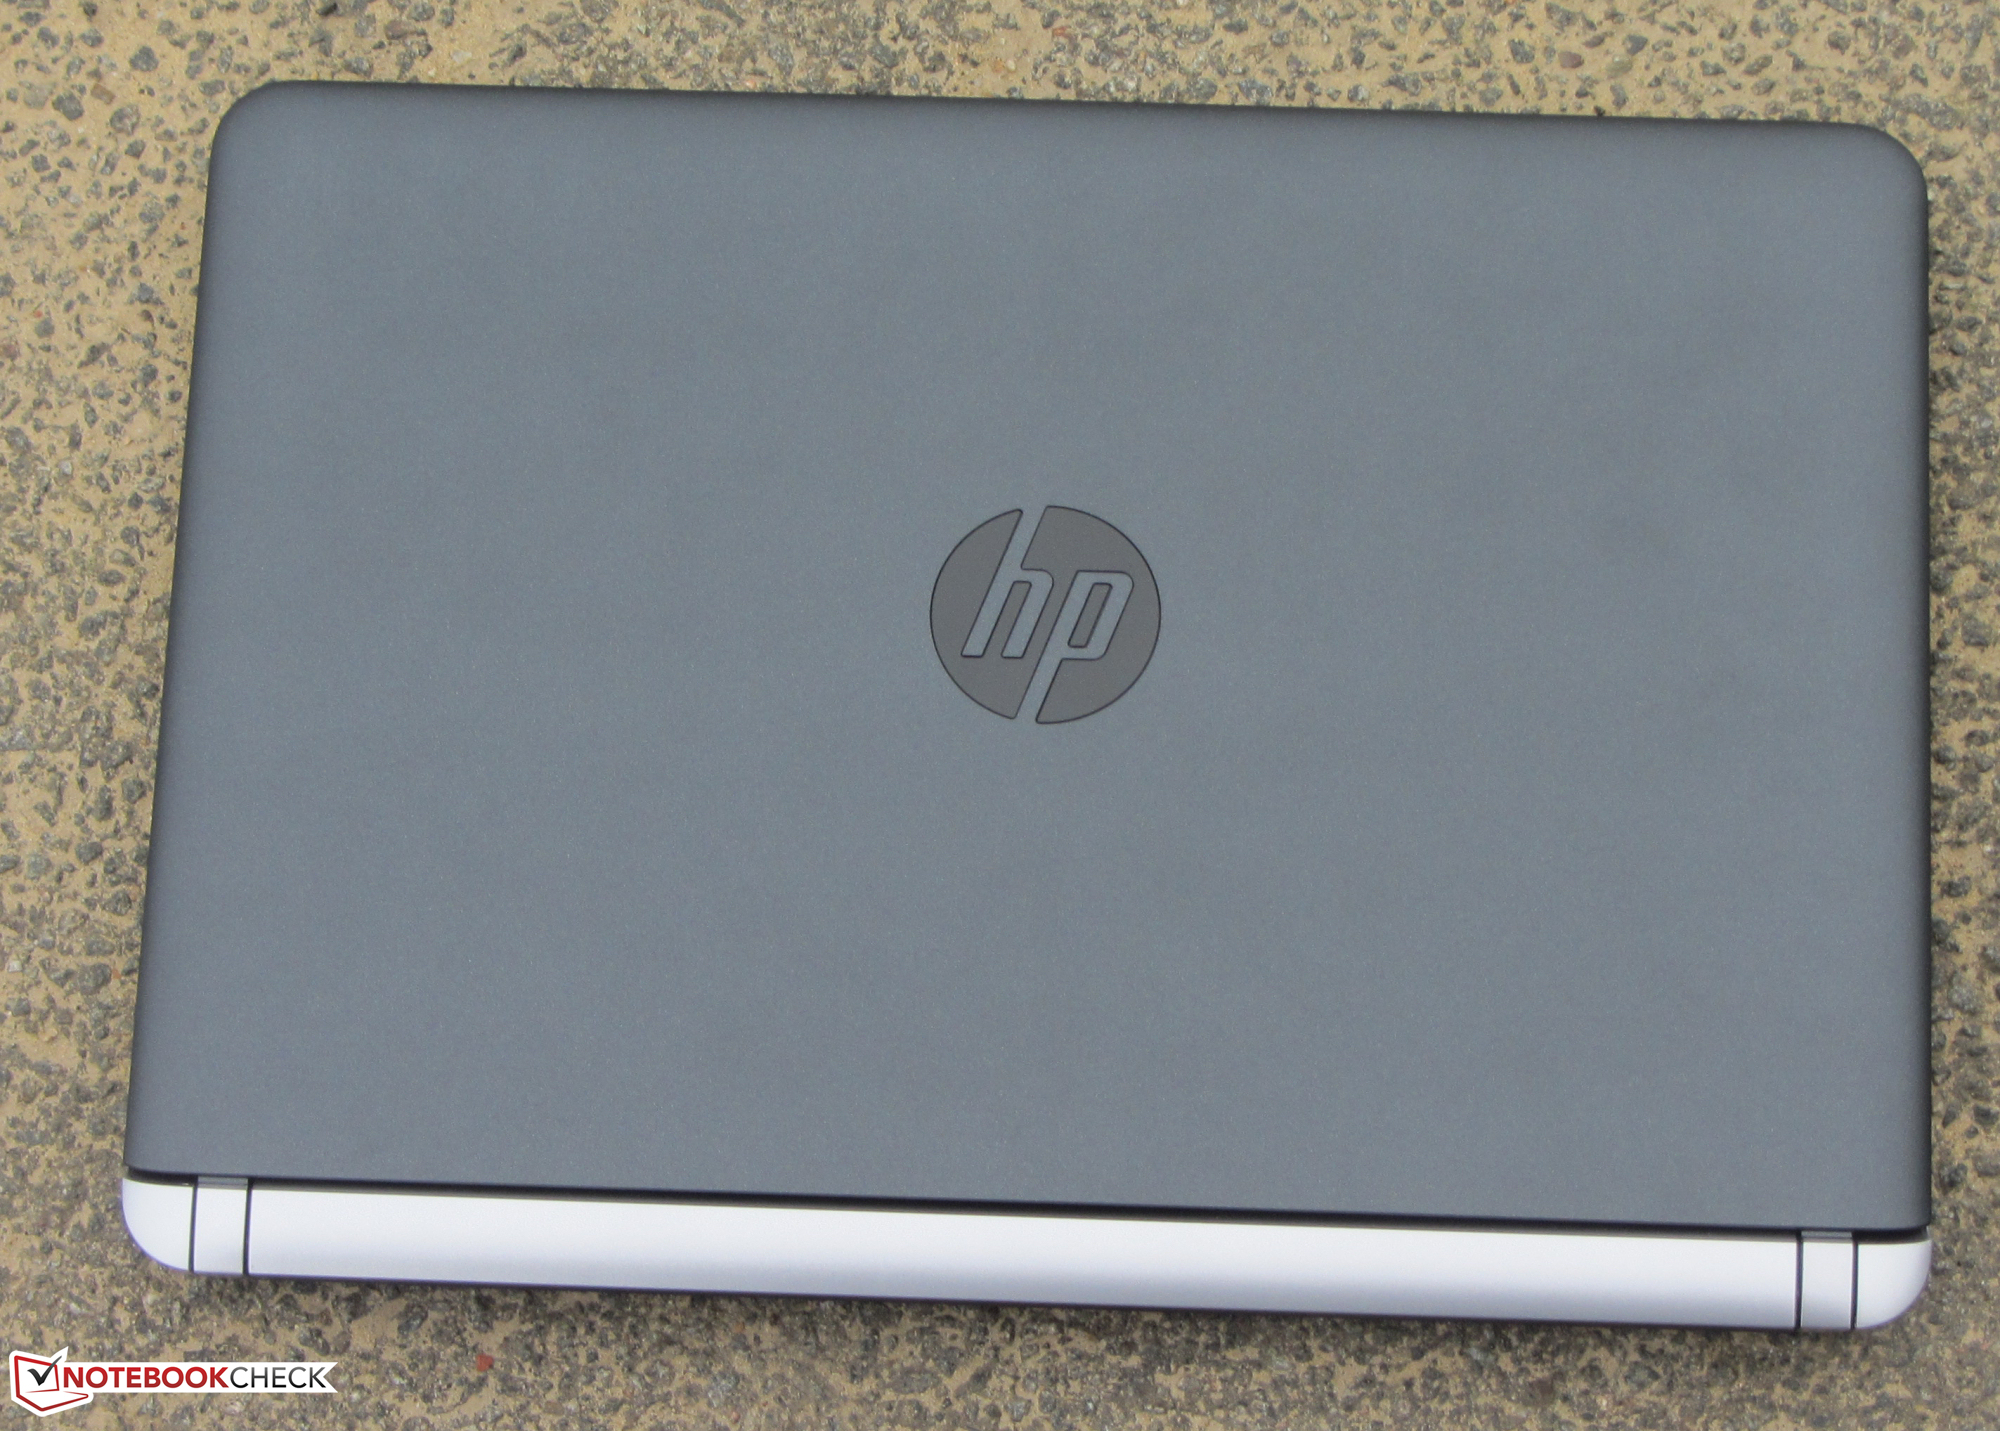
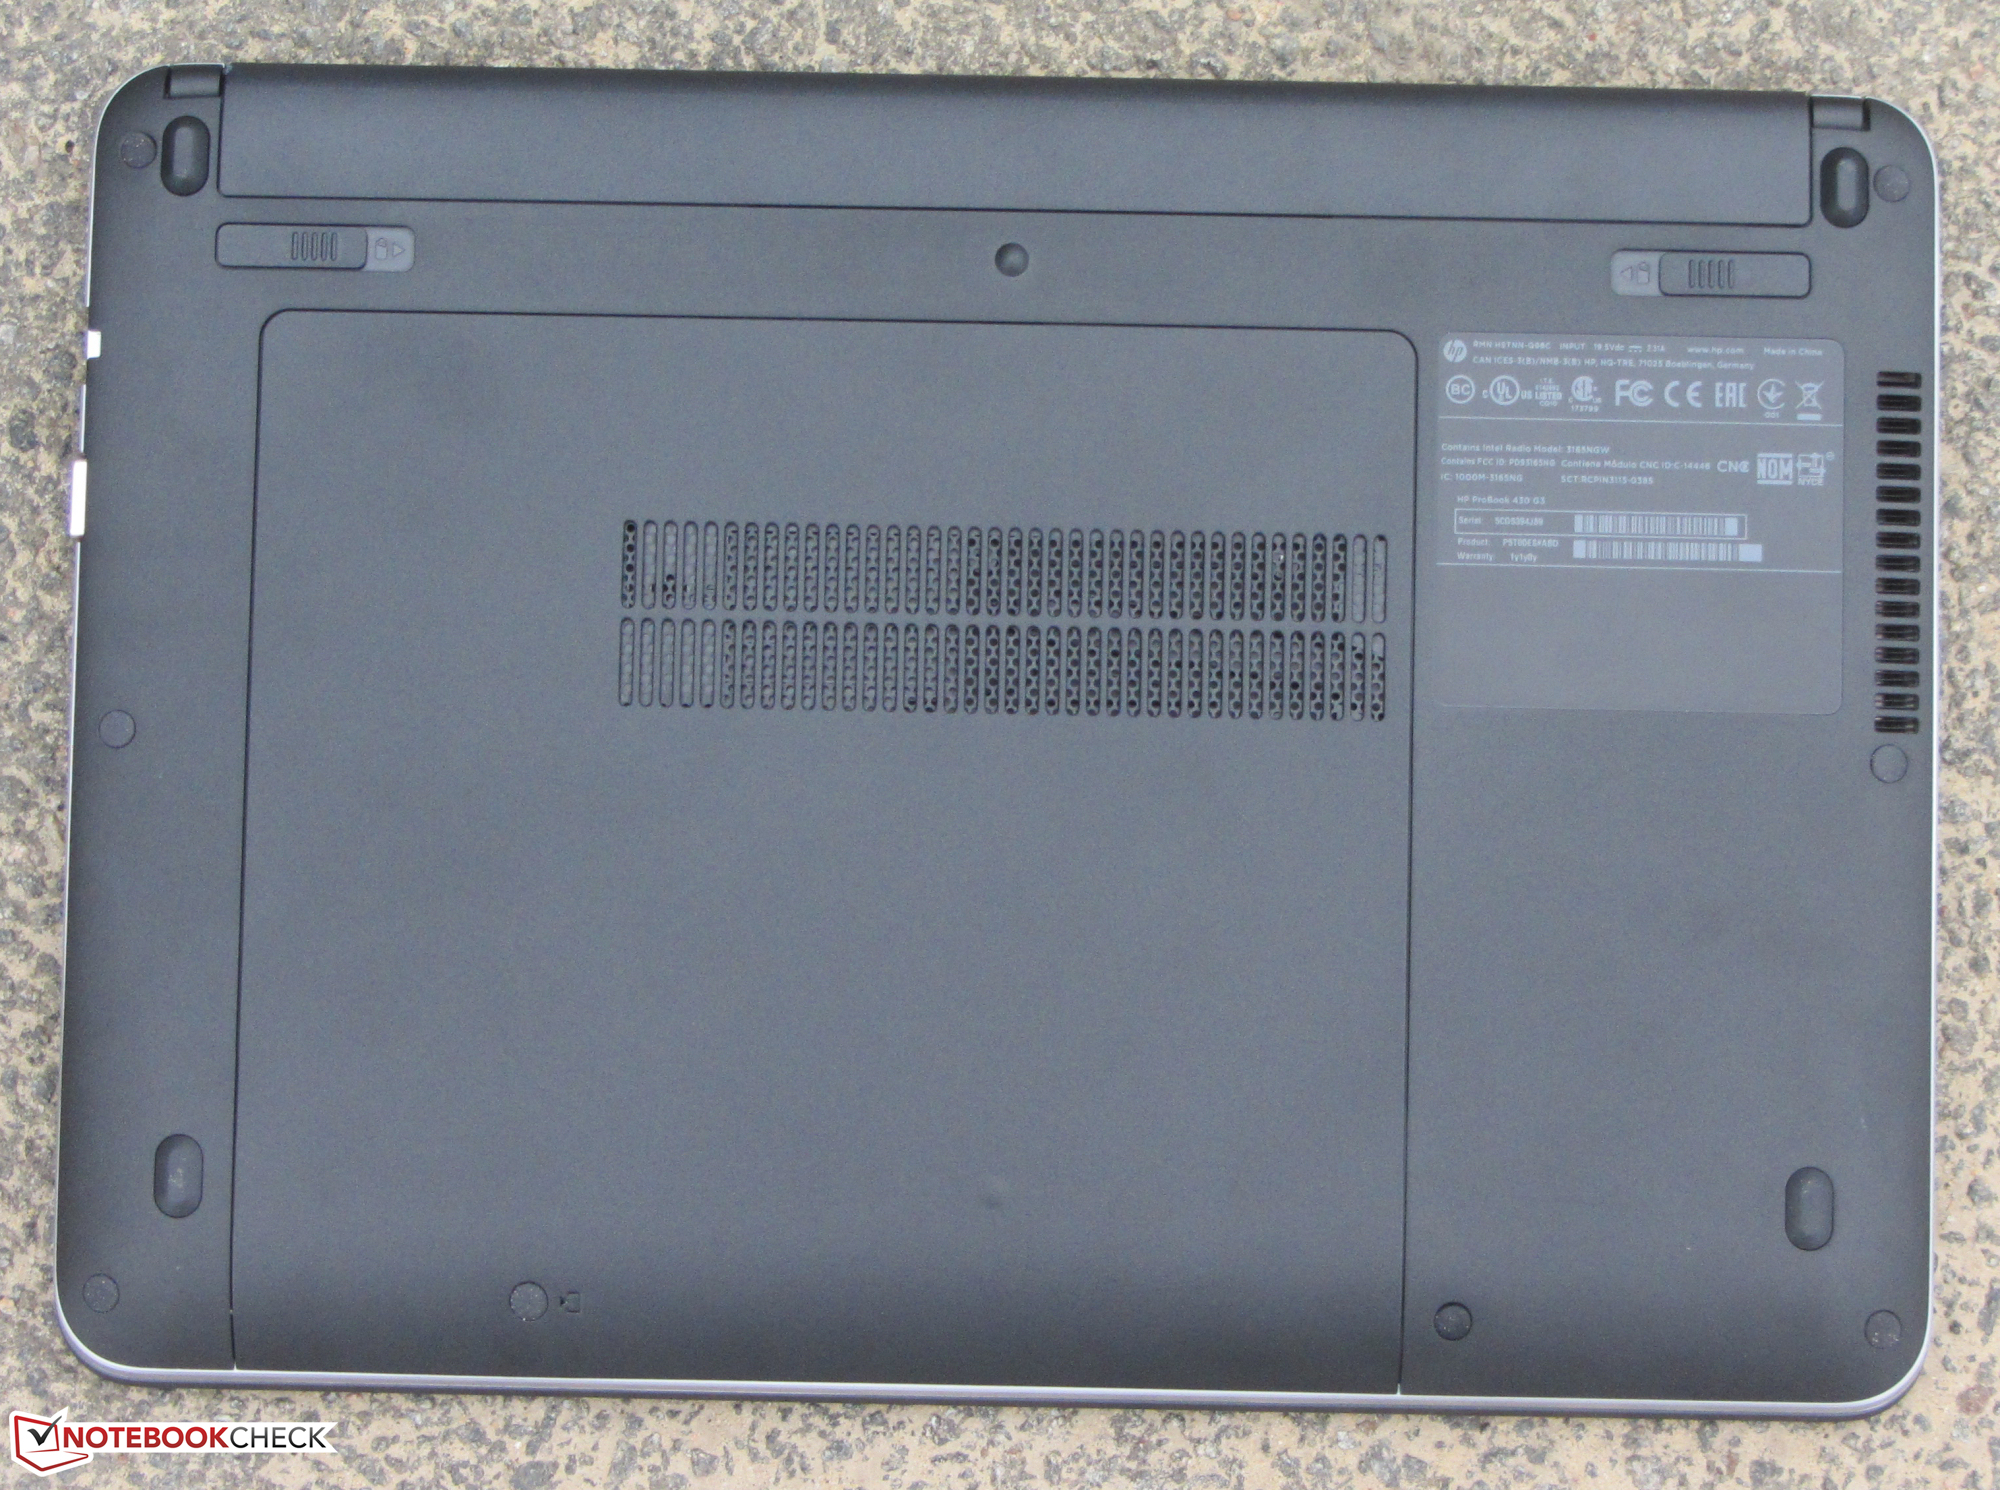
- HP has changed the design of the rear part of the base unit slightly.
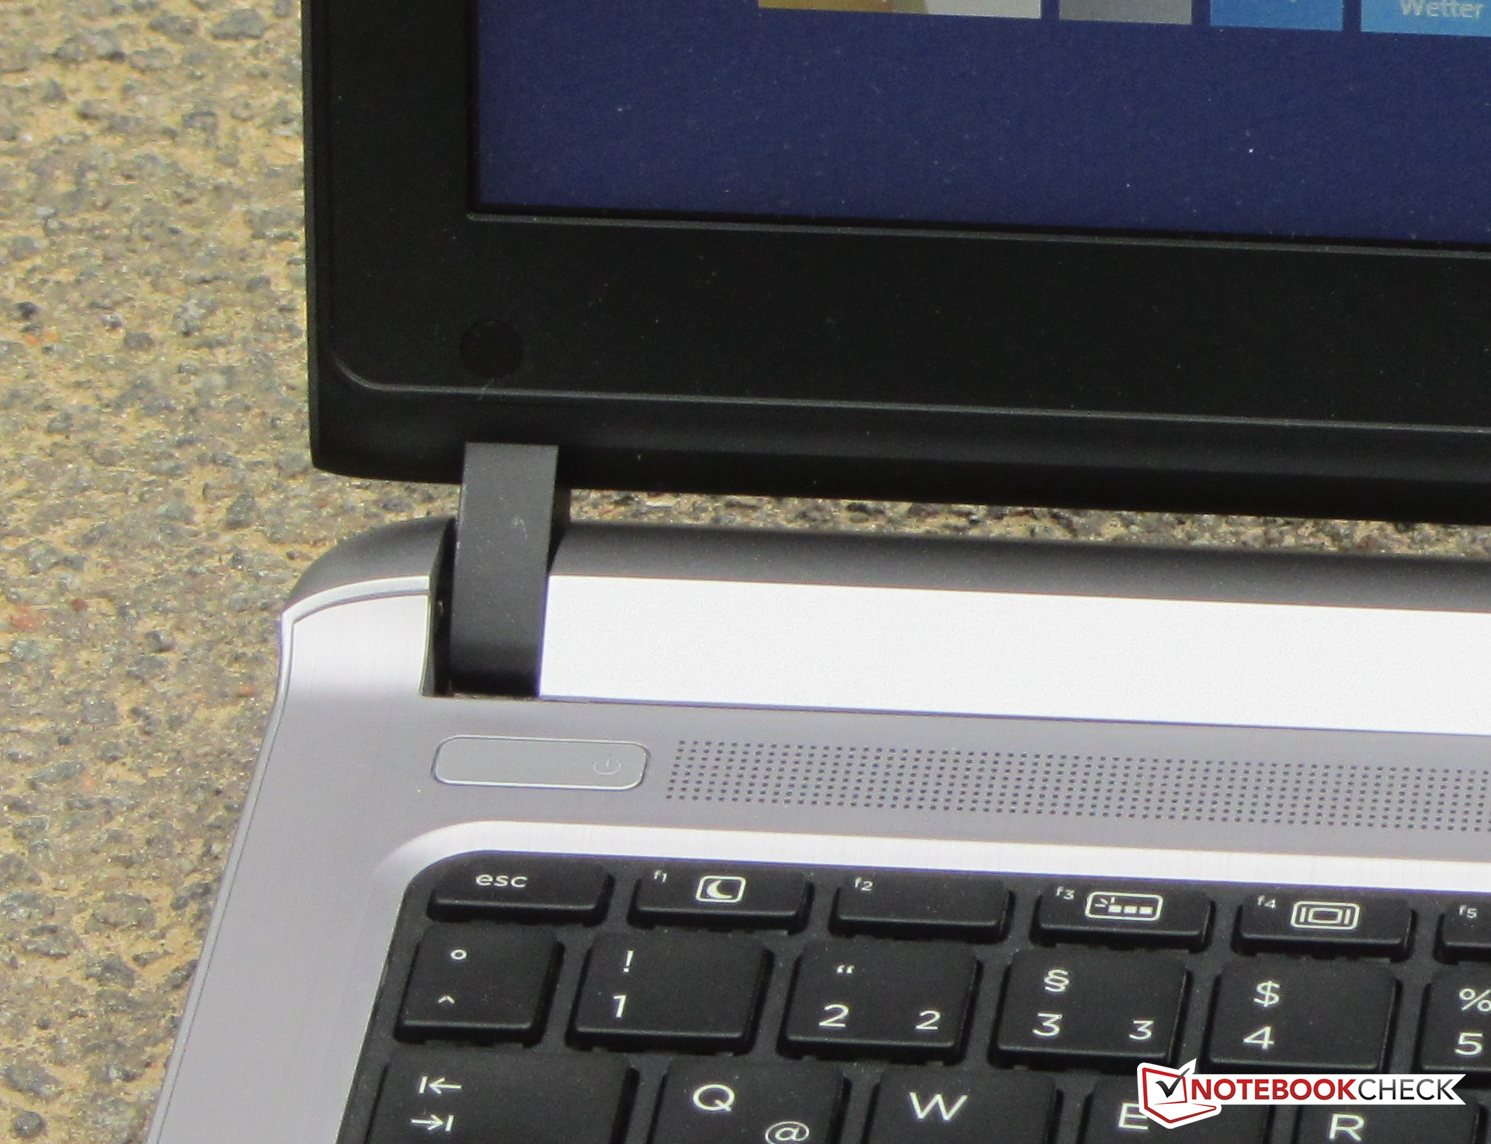
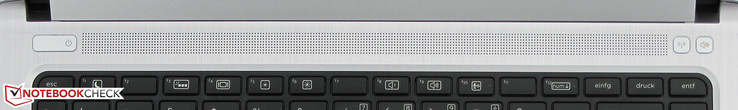
- The speaker grille is now slightly thinner.
- The Wi-Fi and the speaker buttons have shrunk.
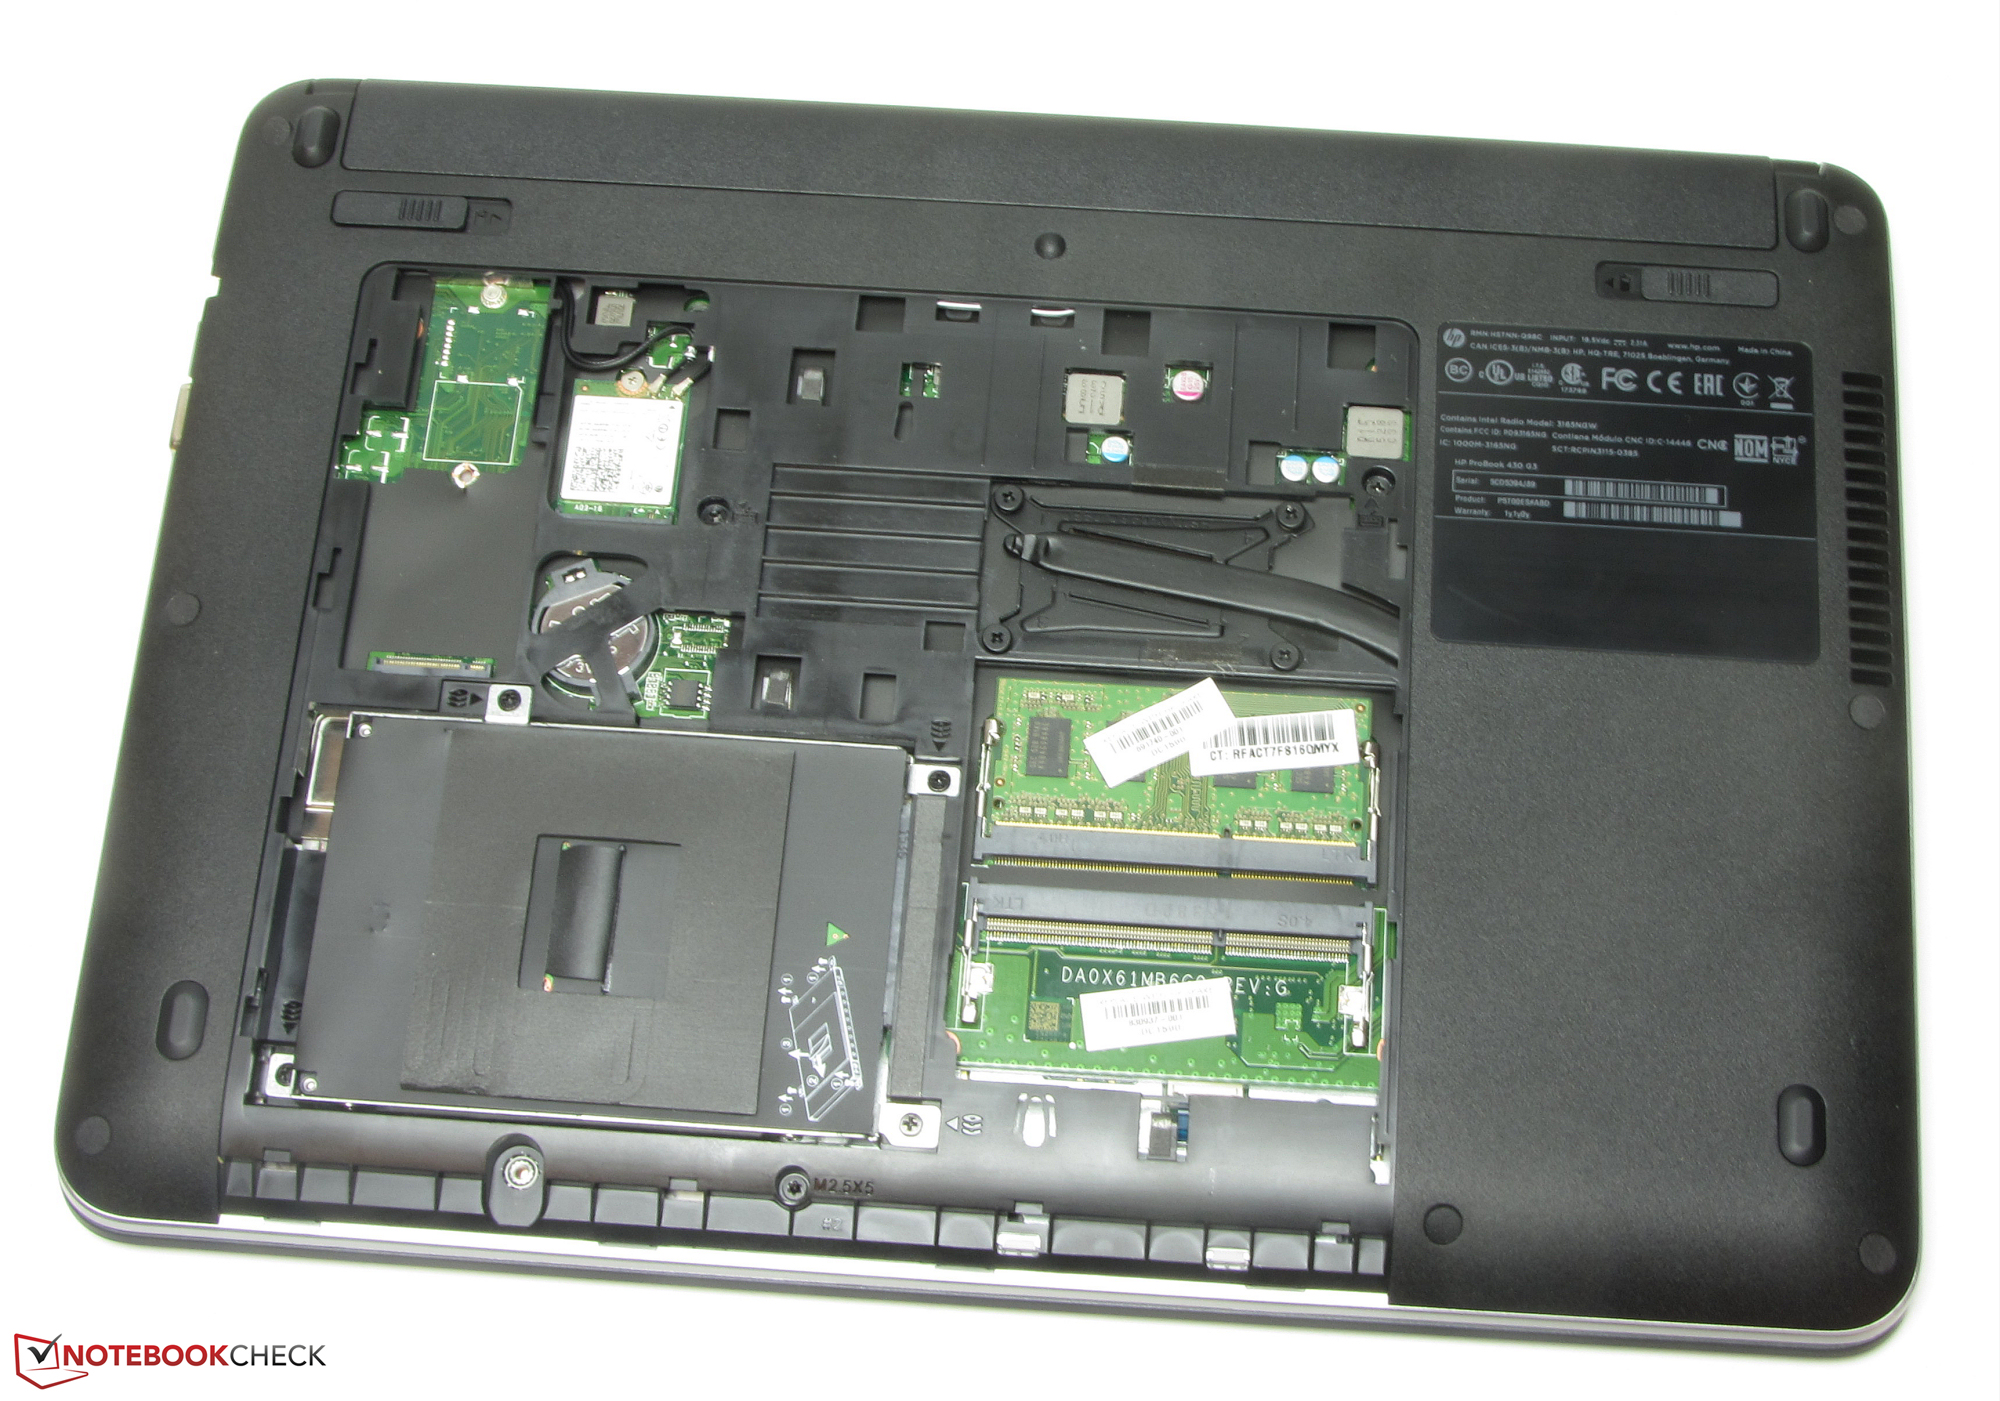
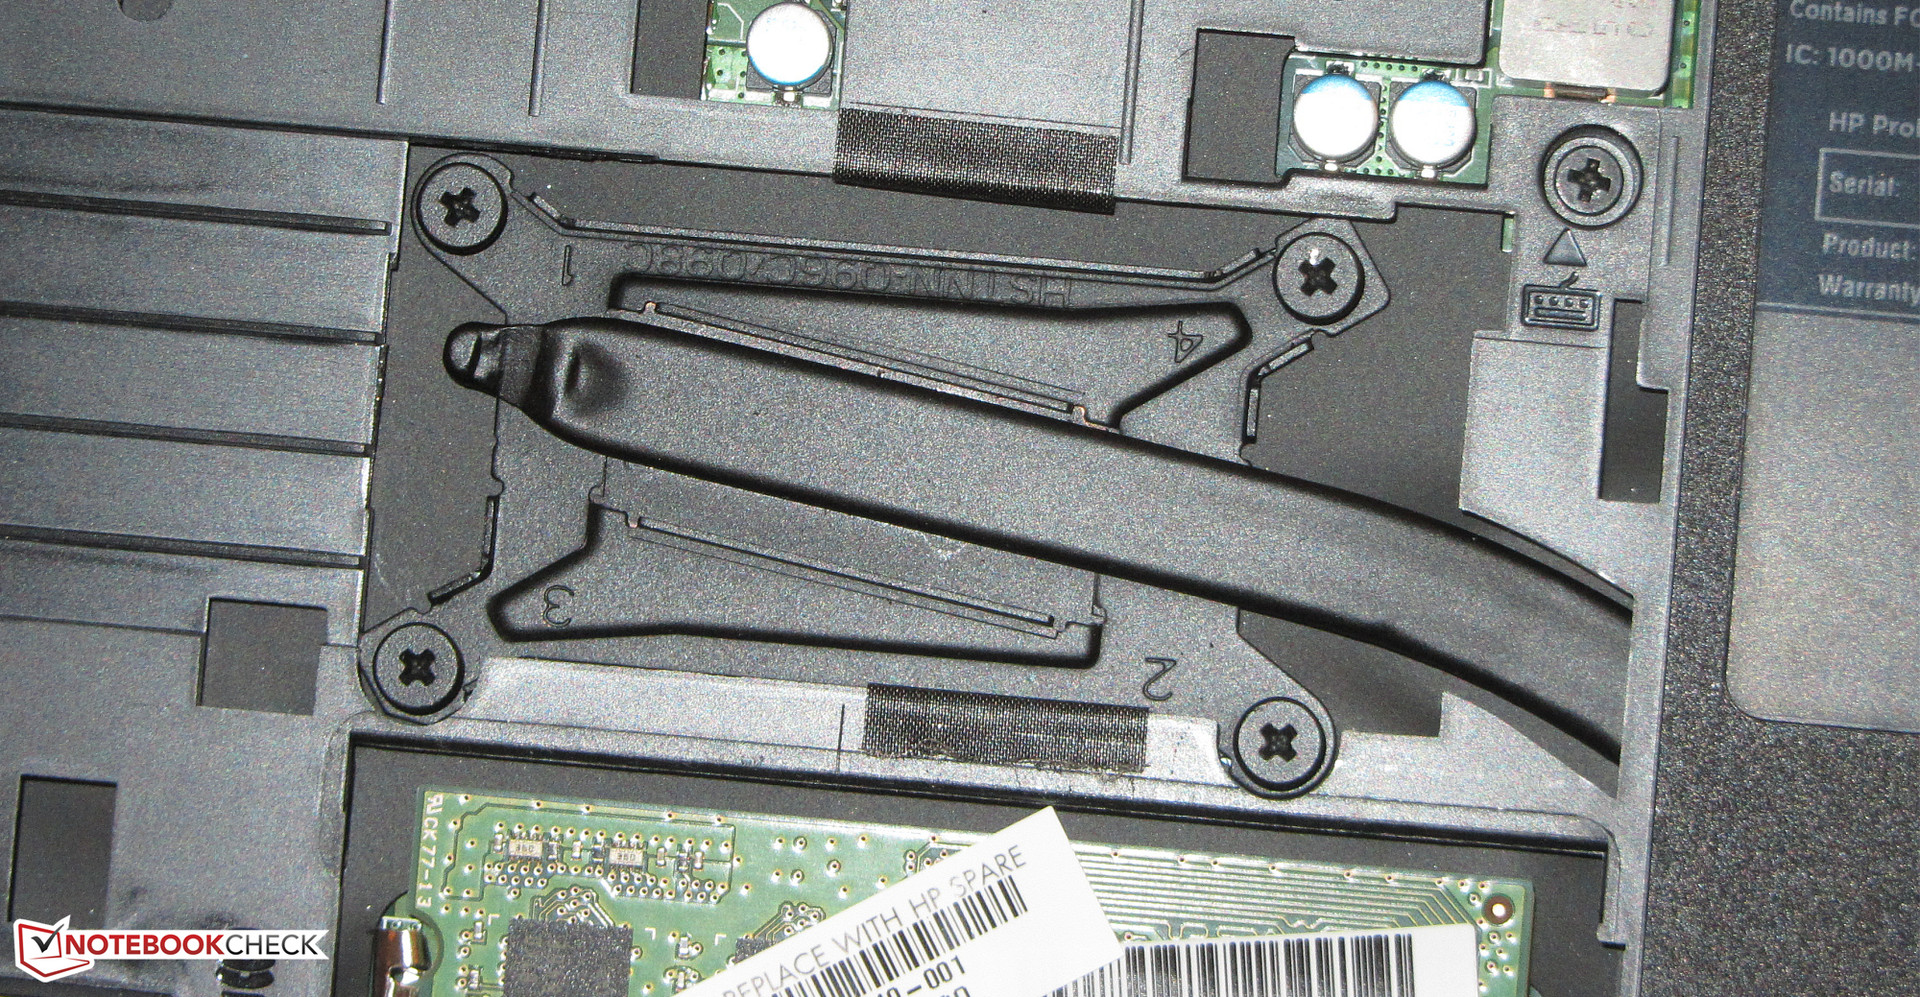
- The maintenance hatch on the underside has a different shape and the inner components are positioned differently.
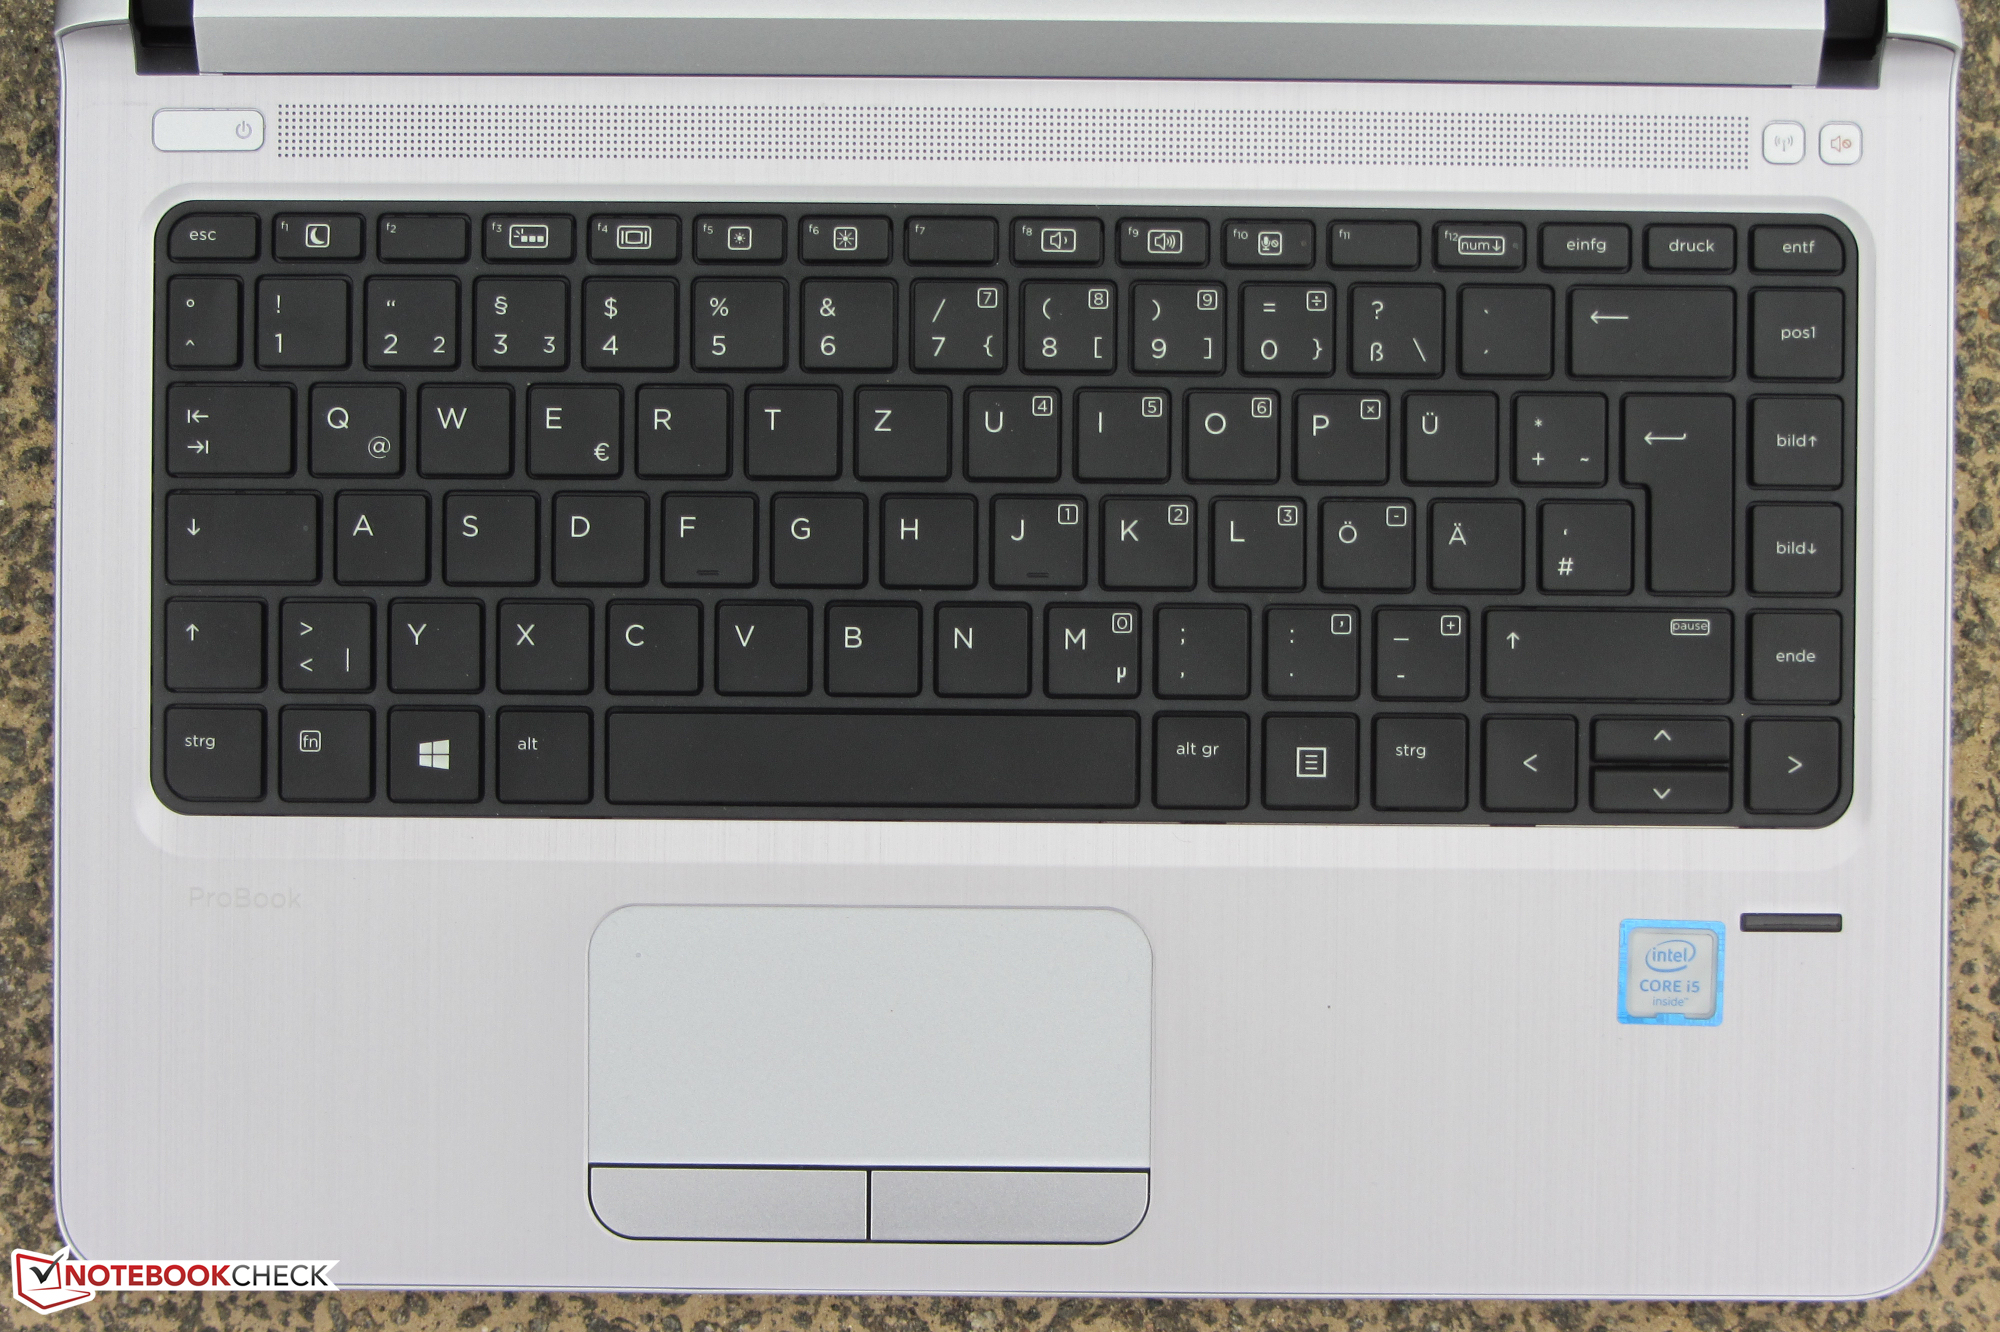
- There is a new keyboard in the ProBook 430 G3. Slightly concave ones with a smooth surface have replaced the flat keys of the predecessor. Overall, we feel that the stroke of the new keyboard is slightly crisper.
Display
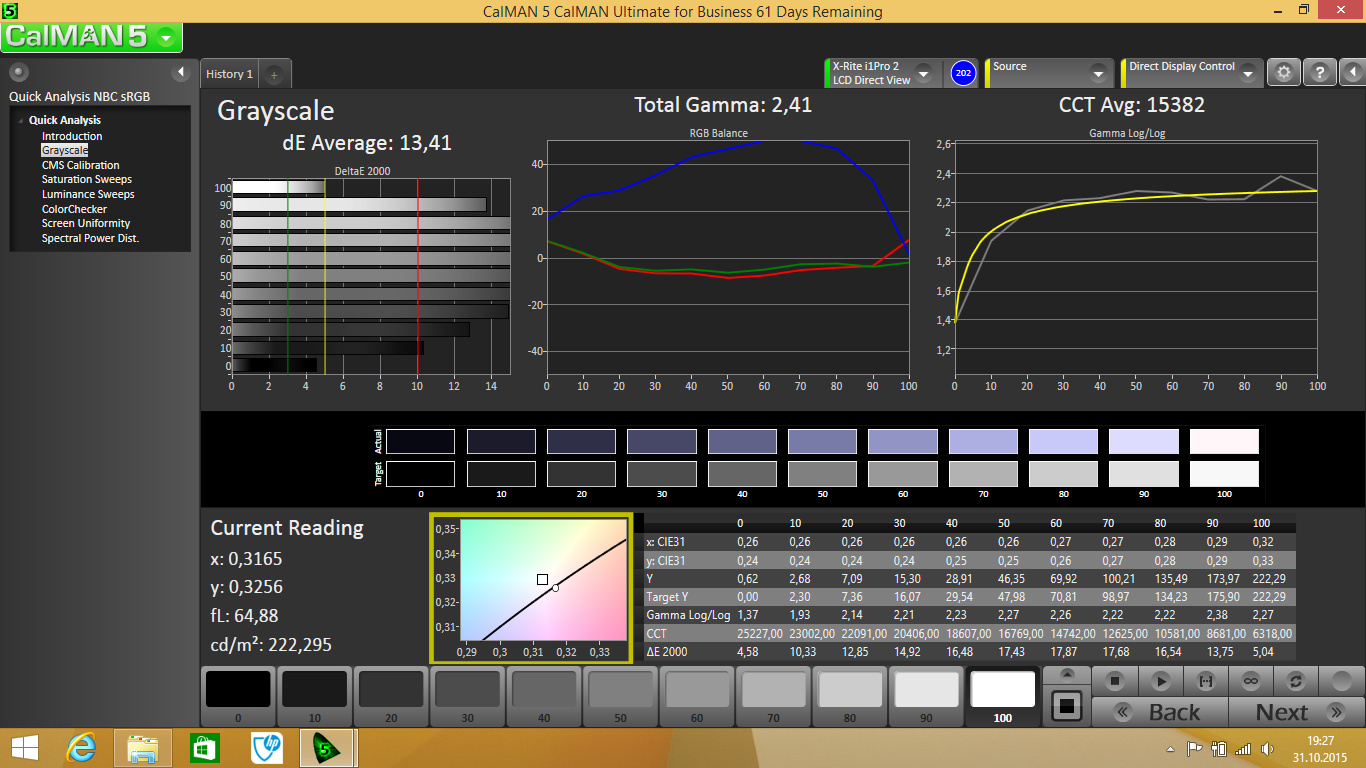
The G3 model of the ProBook 430 comes with a matte 13.3-inch display and a native resolution of 1366x768 pixels. Brightness (205 cd/m²) and contrast (299:1) are too low. We expect more from a mobile computer for work. Finally, it is to be expected that the ambient light varies. HP does not offer other display options.
| |||||||||||||||||||||||||
Brightness Distribution: 90 %
Center on Battery: 212 cd/m²
Contrast: 299:1 (Black: 0.71 cd/m²)
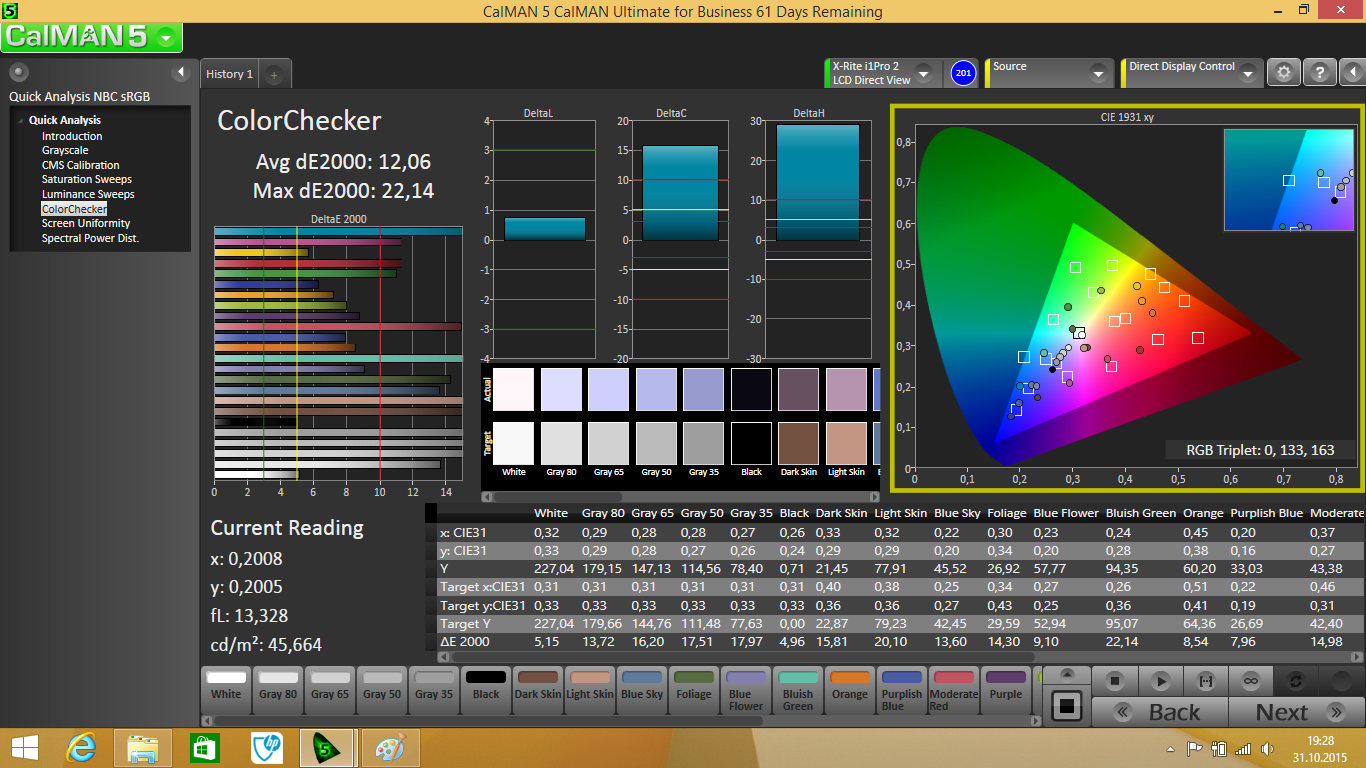
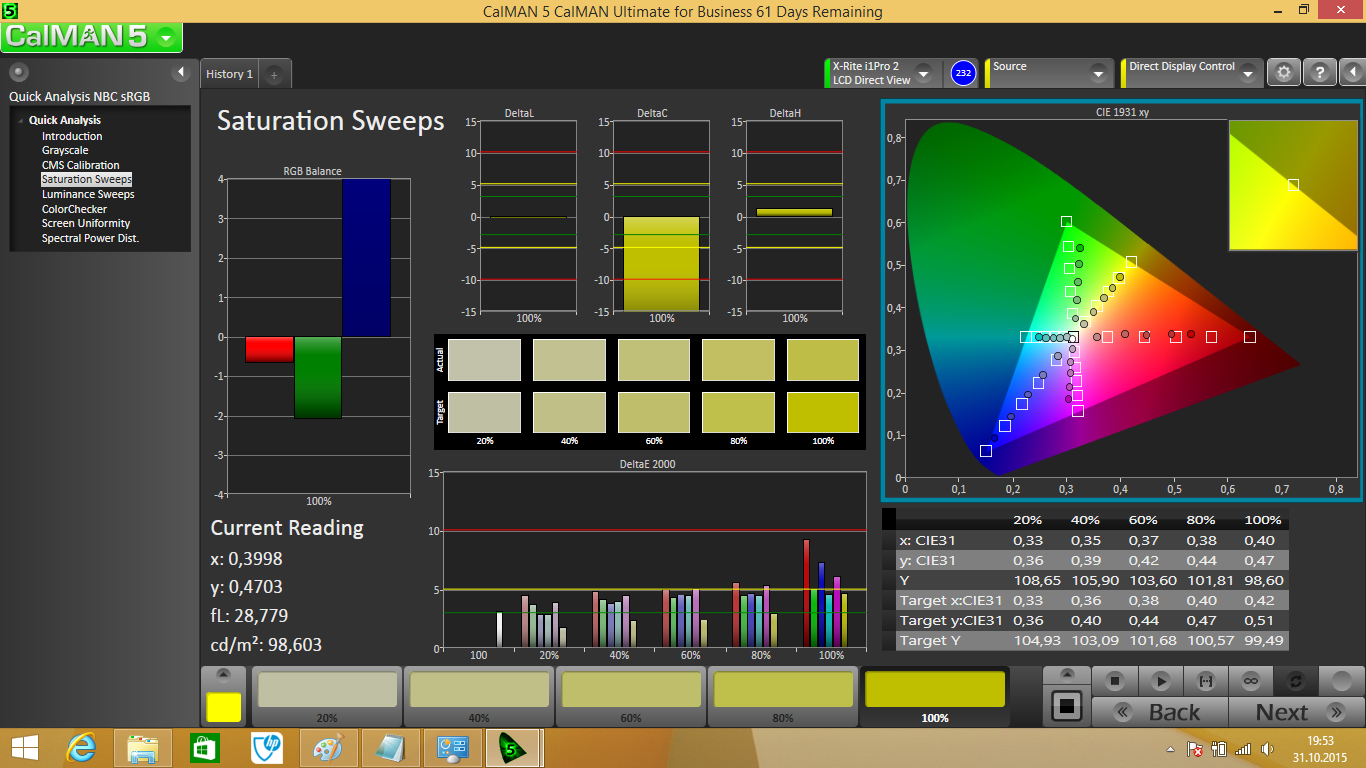
ΔE ColorChecker Calman: 12.06 | ∀{0.5-29.43 Ø4.75}
ΔE Greyscale Calman: 13.41 | ∀{0.09-98 Ø5}
54.2% sRGB (Argyll 1.6.3 3D)
34.3% AdobeRGB 1998 (Argyll 1.6.3 3D)
37.06% AdobeRGB 1998 (Argyll 3D)
54% sRGB (Argyll 3D)
35.87% Display P3 (Argyll 3D)
Gamma: 2.41
CCT: 15382 K
Screen Flickering / PWM (Pulse-Width Modulation)
| Screen flickering / PWM detected | 192 Hz | ≤ 90 % brightness setting | 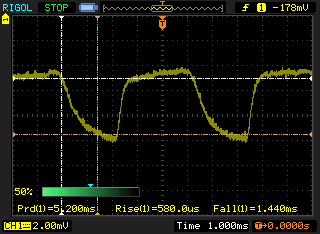 |
| ≤ 176 cd/m² brightness | |||
The display backlight flickers at 192 Hz (worst case, e.g., utilizing PWM) Flickering detected at a brightness setting of 90 % (176 cd/m²) and below. There should be no flickering or PWM above this brightness setting. The frequency of 192 Hz is relatively low, so sensitive users will likely notice flickering and experience eyestrain at the stated brightness setting and below. Flickering occurs even at high brightness setting and may have an effect on the user during everyday use. In comparison: 53 % of all tested devices do not use PWM to dim the display. If PWM was detected, an average of 7979 (minimum: 5 - maximum: 343500) Hz was measured. | |||
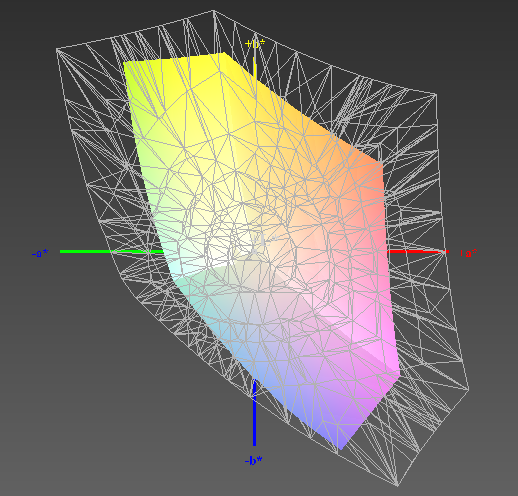
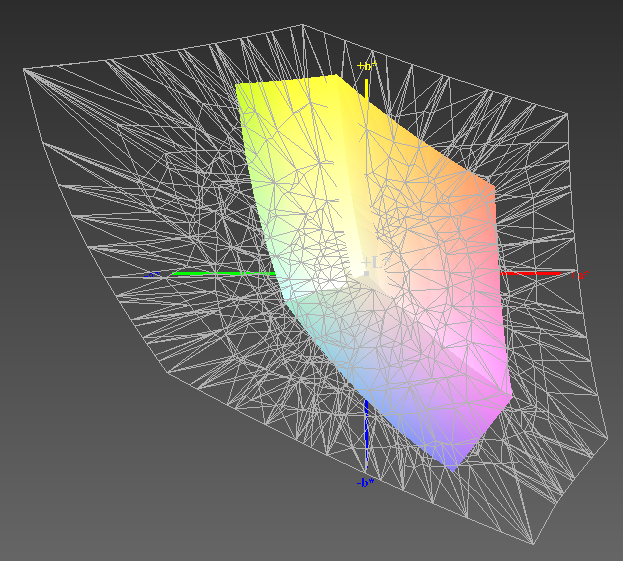
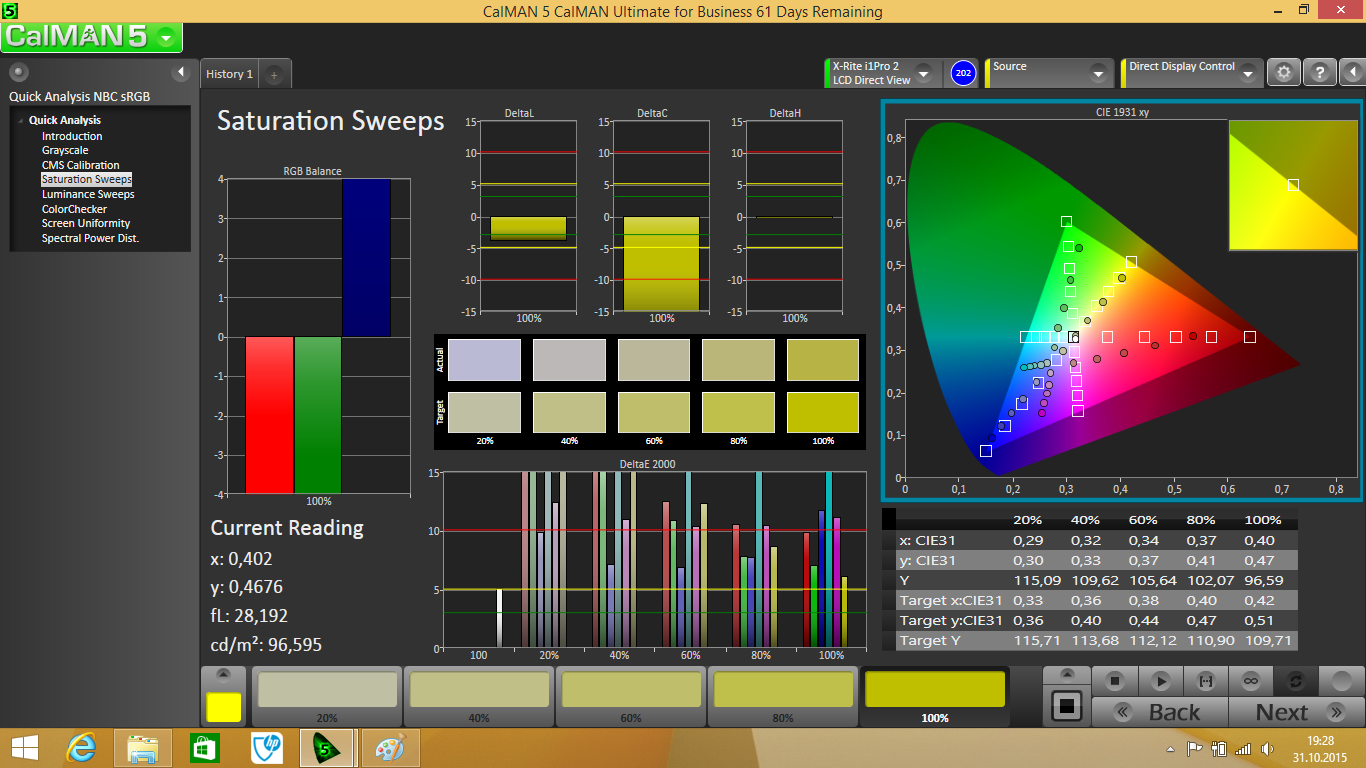
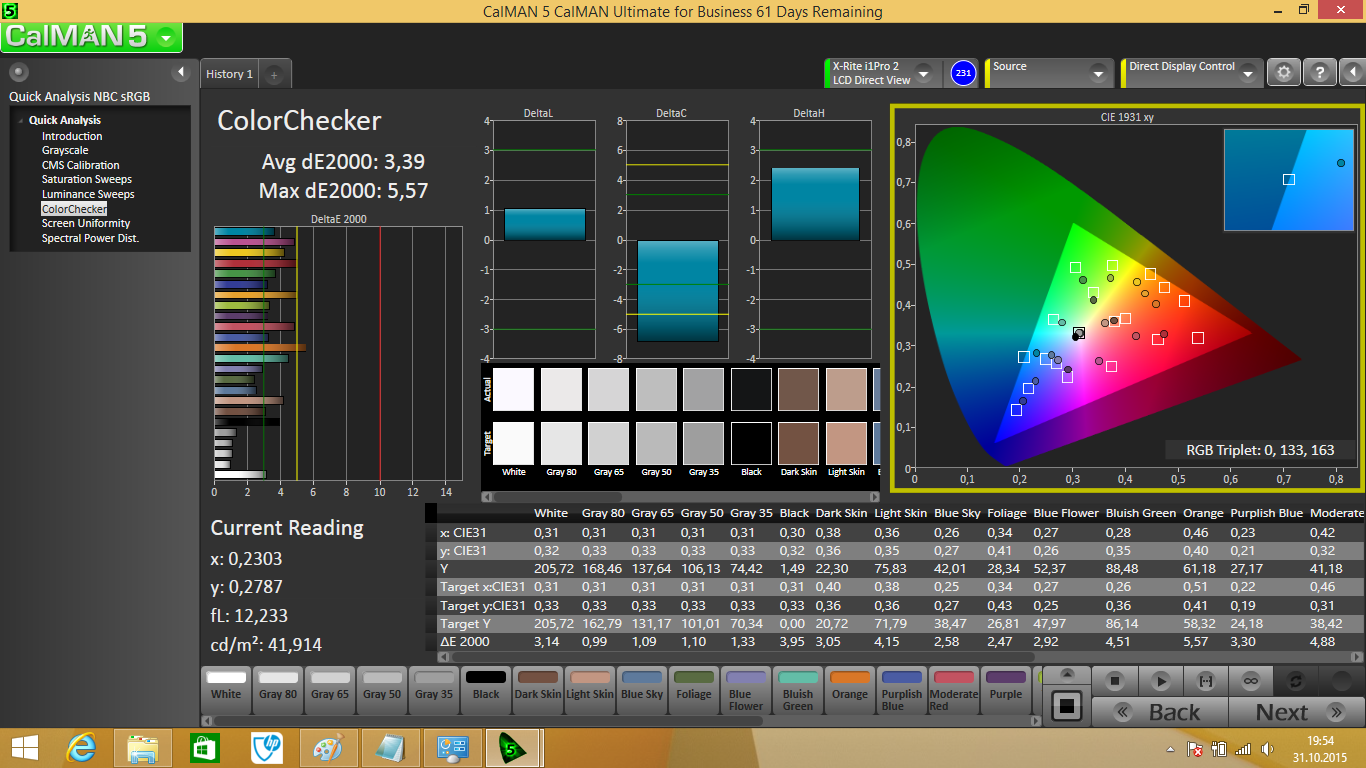
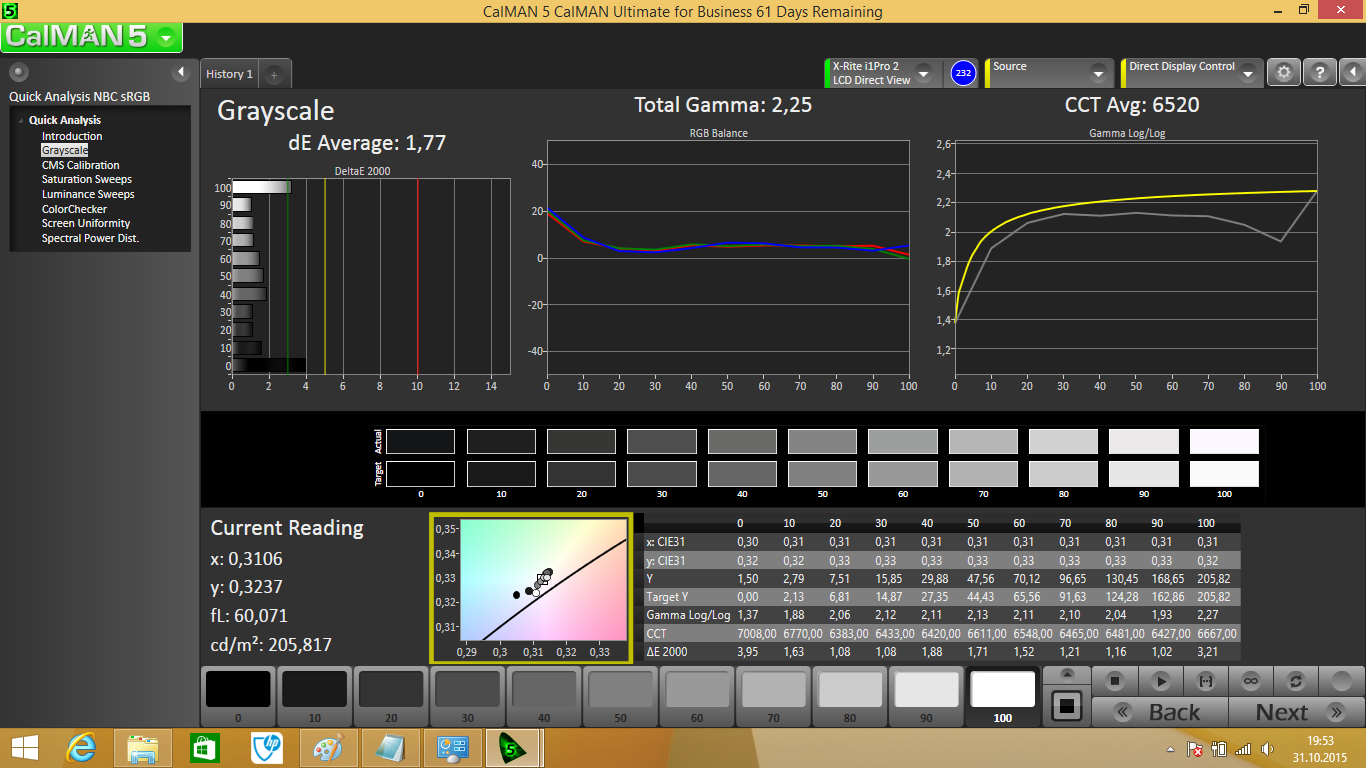
The display cannot cover sRGB or AdobeRGB. The coverage is about 54% (sRGB) and 34% (AdobeRBG). The colors are normal for the budget segment. With a DeltaE 2000 shift of 12.06, the display clearly misses the target range (DeltaE smaller than 3). In addition, the display has a distinct bluish tint. Calibration can improve the colors significantly. For example, the color deviation reduces to 3.39, the gray levels become more balanced and the blue tint disappears.
Display Response Times
| ↔ Response Time Black to White | ||
|---|---|---|
| 32.8 ms ... rise ↗ and fall ↘ combined | ↗ 18 ms rise | 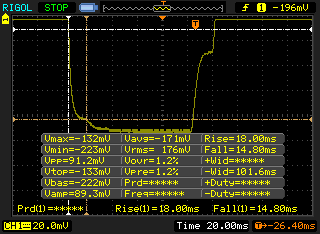 |
| ↘ 14.8 ms fall | ||
| The screen shows slow response rates in our tests and will be unsatisfactory for gamers. In comparison, all tested devices range from 0.1 (minimum) to 240 (maximum) ms. » 88 % of all devices are better. This means that the measured response time is worse than the average of all tested devices (20 ms). | ||
| ↔ Response Time 50% Grey to 80% Grey | ||
| 54.4 ms ... rise ↗ and fall ↘ combined | ↗ 33.2 ms rise | 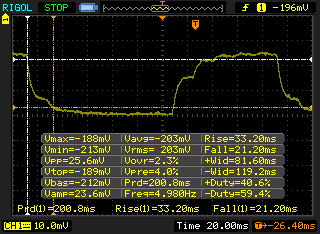 |
| ↘ 21.2 ms fall | ||
| The screen shows slow response rates in our tests and will be unsatisfactory for gamers. In comparison, all tested devices range from 0.165 (minimum) to 636 (maximum) ms. » 91 % of all devices are better. This means that the measured response time is worse than the average of all tested devices (31.4 ms). | ||
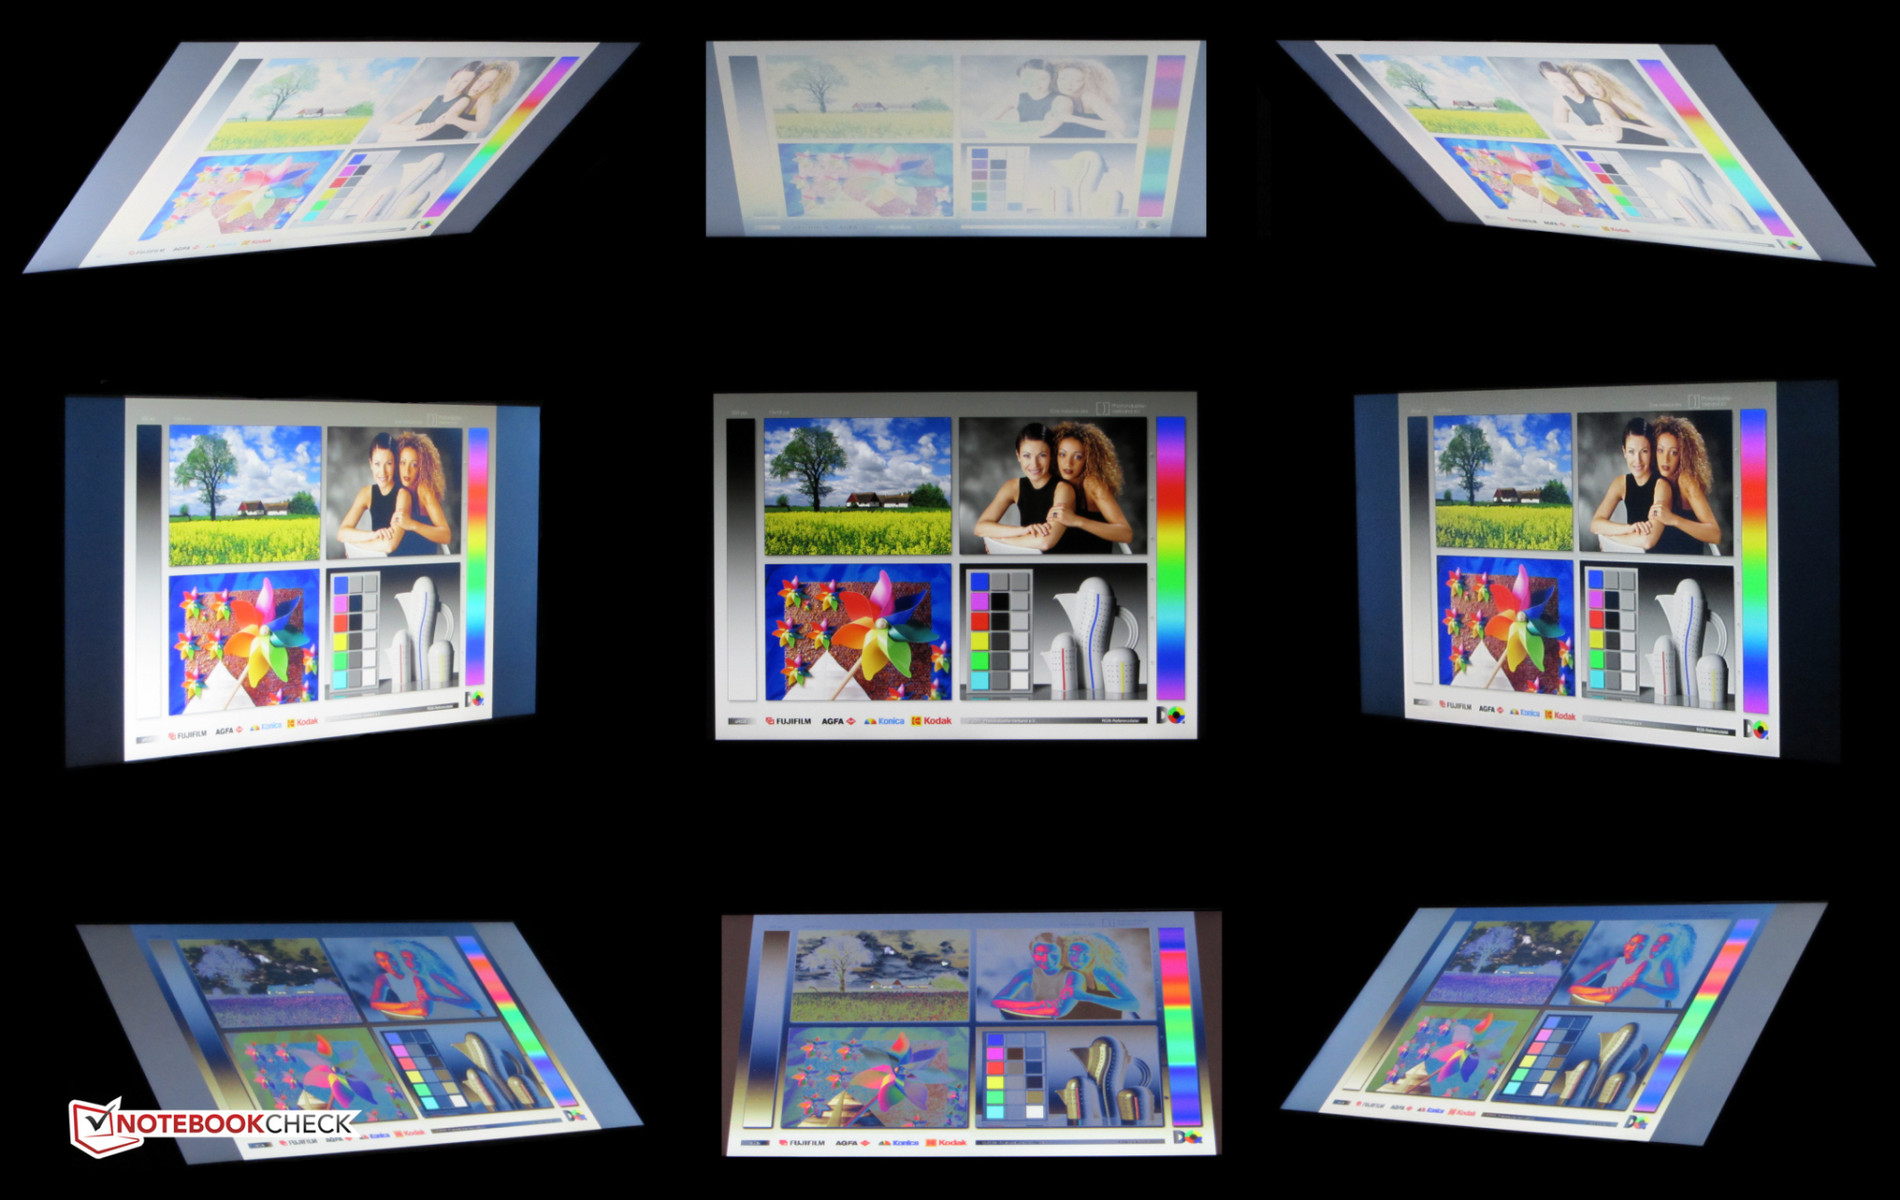
The integrated TN panel features narrow viewing angles. Thus, it is not possible to read from the screen from every position. It is possible to use the ProBook outdoors, albeit in the shade or when the sky is overcast. Otherwise, brightness and contrast of the display are too low.
| HP ProBook 430 G3 P5T00ES TN LED, 1366x768 | HP ProBook 430 G2 L3Q21EA TN LED, 1366x768 | HP ProBook 430-G1 TN LED, 1366x768 | Dell Latitude 13 3340 Education Series TN LED, 1366x768 | Lenovo ThinkPad E450 20DDS01E00 TN, 1920x1080 | Dell Latitude 3450-9723 IPS, 1920x1080 | Lenovo Thinkpad L450 20DS0001GE IPS, 1920x1080 | Fujitsu Lifebook E544 TN, 1600x900 | |
|---|---|---|---|---|---|---|---|---|
| Display | -2% | 9% | 23% | 13% | 80% | 9% | 13% | |
| Display P3 Coverage (%) | 35.87 | 35.31 -2% | 39.15 9% | 43.98 23% | 40.37 13% | 66.3 85% | 39.24 9% | 40.58 13% |
| sRGB Coverage (%) | 54 | 53.2 -1% | 58.5 8% | 65.9 22% | 60.8 13% | 93.4 73% | 58.9 9% | 60.6 12% |
| AdobeRGB 1998 Coverage (%) | 37.06 | 36.48 -2% | 40.52 9% | 45.47 23% | 41.71 13% | 67.9 83% | 40.56 9% | 42 13% |
| Response Times | ||||||||
| Response Time Grey 50% / Grey 80% * (ms) | 54.4 ? | |||||||
| Response Time Black / White * (ms) | 32.8 ? | |||||||
| PWM Frequency (Hz) | 192 ? | |||||||
| Screen | -18% | -4% | 1% | 10% | 53% | 28% | 14% | |
| Brightness middle (cd/m²) | 212 | 176 -17% | 228 8% | 232 9% | 218 3% | 303 43% | 206 -3% | 252 19% |
| Brightness (cd/m²) | 205 | 171 -17% | 202 -1% | 211 3% | 211 3% | 273 33% | 202 -1% | 255 24% |
| Brightness Distribution (%) | 90 | 87 -3% | 72 -20% | 85 -6% | 76 -16% | 83 -8% | 91 1% | 67 -26% |
| Black Level * (cd/m²) | 0.71 | 1 -41% | 1.029 -45% | 0.94 -32% | 0.53 25% | 0.445 37% | 0.39 45% | 0.696 2% |
| Contrast (:1) | 299 | 176 -41% | 222 -26% | 247 -17% | 411 37% | 681 128% | 528 77% | 362 21% |
| Colorchecker dE 2000 * | 12.06 | 13.62 -13% | 9.81 19% | 10.35 14% | 11.16 7% | 3.94 67% | 6.63 45% | 9.1 25% |
| Greyscale dE 2000 * | 13.41 | 14.51 -8% | 9.94 26% | 11.79 12% | 12.58 6% | 4.28 68% | 6.29 53% | 9.44 30% |
| Gamma | 2.41 91% | 2.8 79% | 2.33 94% | 2.38 92% | 2.34 94% | 2.5 88% | 2.48 89% | 2.56 86% |
| CCT | 15382 42% | 18849 34% | 11631 56% | 14957 43% | 14940 44% | 7325 89% | 5823 112% | 10890 60% |
| Color Space (Percent of AdobeRGB 1998) (%) | 34.3 | 33.8 -1% | 37.5 9% | 42 22% | 39 14% | 37.3 9% | 38.6 13% | |
| Color Space (Percent of sRGB) (%) | 54.2 | 61 13% | ||||||
| Total Average (Program / Settings) | -10% /
-13% | 3% /
-0% | 12% /
7% | 12% /
11% | 67% /
61% | 19% /
23% | 14% /
13% |
* ... smaller is better
Performance
The ProBook 430 G3 is a 13.3-inch office notebook aimed at private and business users alike. Our test model costs about 630 Euros (~$673) without Windows OS. Anyone wishing to save money can select a model of the ProBook 430 G2 series. For example, the HP ProBook 430 G2 K9J77EA (Core i3-5010U, Windows 7 Pro + Windows 8.1 Pro) was available for about 430 Euros (~$459) at the time of testing. In addition, there are ProBook variants with a built-in LTE/3G modem. However, our test model is not one of them. Furthermore, it is not possible to retrofit such a modem, since both the slot and the antennas are missing.

Processor
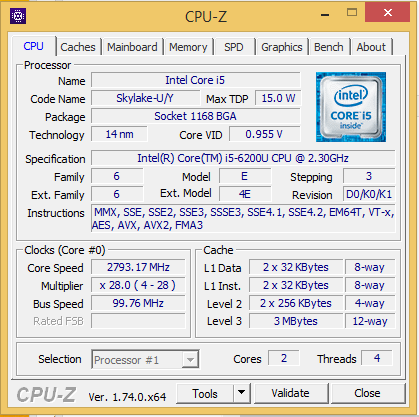
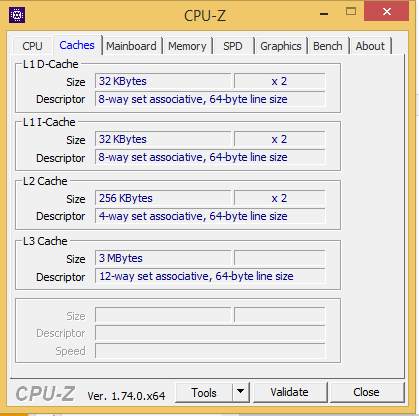
The G3 models of the ProBook 430 series are equipped with new generation Skylake processors from Intel. Our test model is equipped with a Core i5-6200U dual core processor. This is a mid-range CPU, which delivers sufficient CPU performance for most application scenarios. The processor features a base clock of 2.3 GHz. Using Turbo, the clock rate can increase to 2.7 GHz (both cores) or 2.8 GHz (one core). The Turbo is used in mains operation. However, the CPU works at 2.3 GHz on battery. If the Turbo is also required in battery mode, you have to enable the option "Enable Turbo Boost on DC" in the BIOS.
According to Intel's naming scheme, the Core i5-5200U (Broadwell) processor is the predecessor of the used Skylake CPU. The latter delivers up to 13% better results in our CPU tests. This is due to the improvements in the Skylake architecture and slightly higher clock rates.
| Geekbench 3 | |
| 32 Bit Single-Core Score (sort by value) | |
| HP ProBook 430 G3 P5T00ES | |
| HP ProBook 430 G2 L3Q21EA | |
| Lenovo Thinkpad L450 20DS0001GE | |
| 32 Bit Multi-Core Score (sort by value) | |
| HP ProBook 430 G3 P5T00ES | |
| HP ProBook 430 G2 L3Q21EA | |
| Lenovo Thinkpad L450 20DS0001GE | |
| JetStream 1.1 - Total Score (sort by value) | |
| HP ProBook 430 G3 P5T00ES | |
| Mozilla Kraken 1.1 - Total (sort by value) | |
| HP ProBook 430 G3 P5T00ES | |
| HP ProBook 430 G2 L3Q21EA | |
| Lenovo ThinkPad E450 20DDS01E00 | |
| Lenovo Thinkpad L450 20DS0001GE | |
| Fujitsu Lifebook E544 | |
| Octane V2 - Total Score (sort by value) | |
| HP ProBook 430 G3 P5T00ES | |
| HP ProBook 430 G2 L3Q21EA | |
| Lenovo ThinkPad E450 20DDS01E00 | |
| Lenovo Thinkpad L450 20DS0001GE | |
| Fujitsu Lifebook E544 | |
| Peacekeeper - --- (sort by value) | |
| HP ProBook 430 G3 P5T00ES | |
| HP ProBook 430 G2 L3Q21EA | |
| Lenovo Thinkpad L450 20DS0001GE | |
* ... smaller is better
System Performance
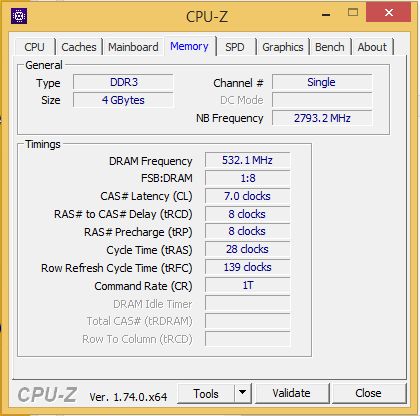
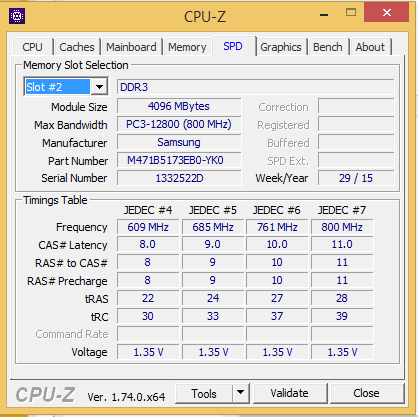
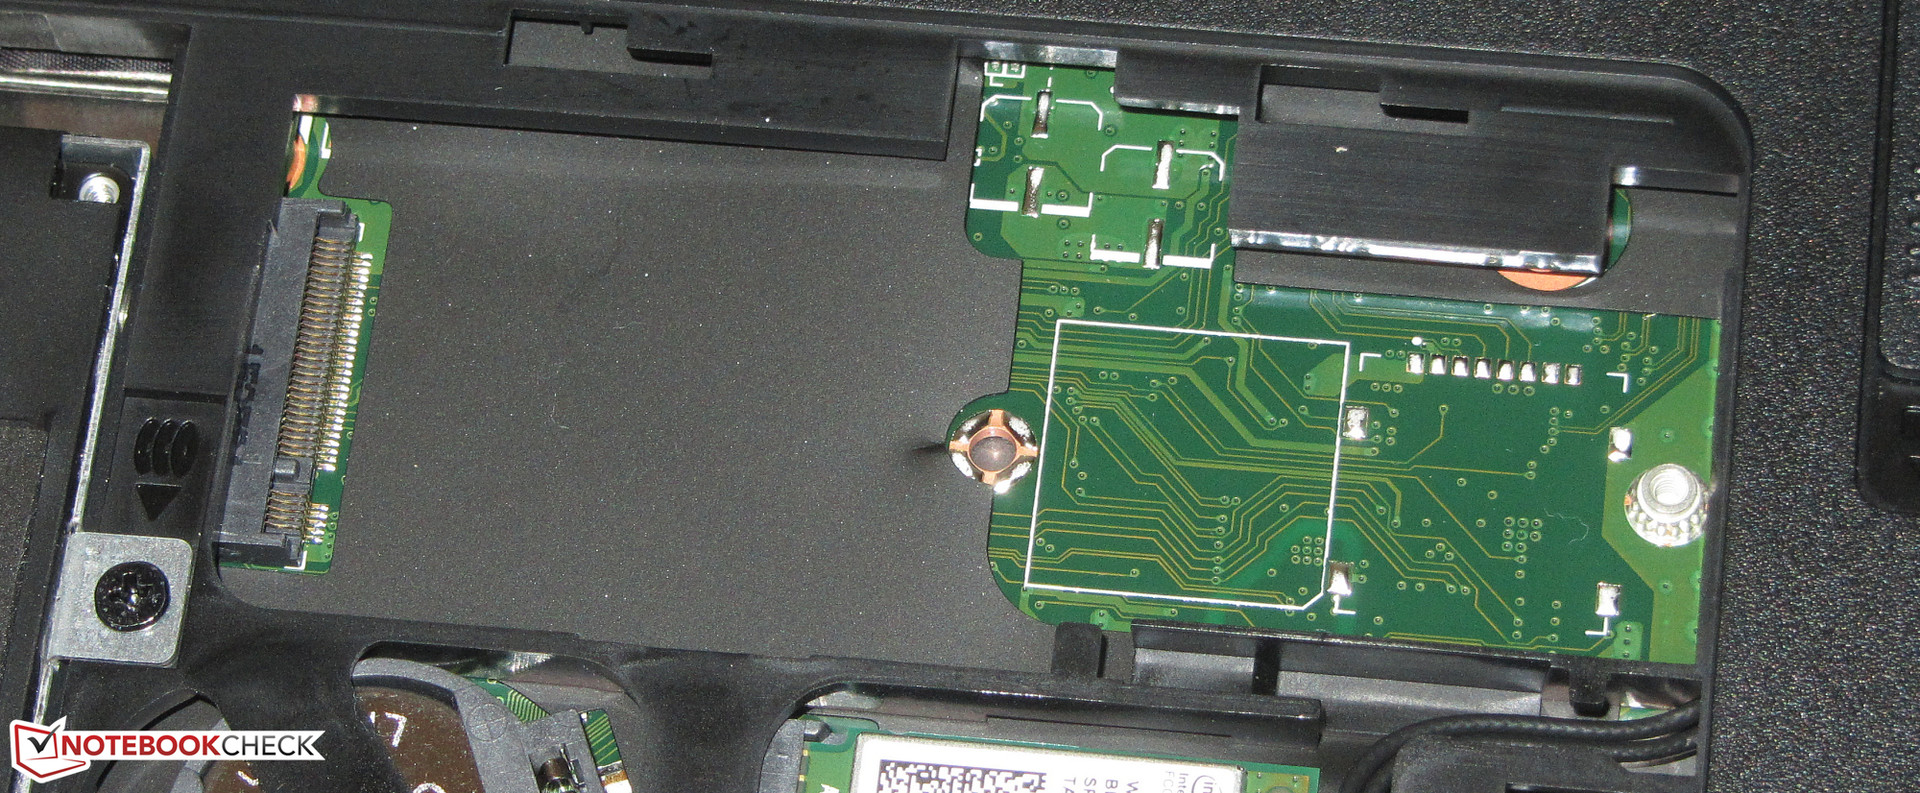
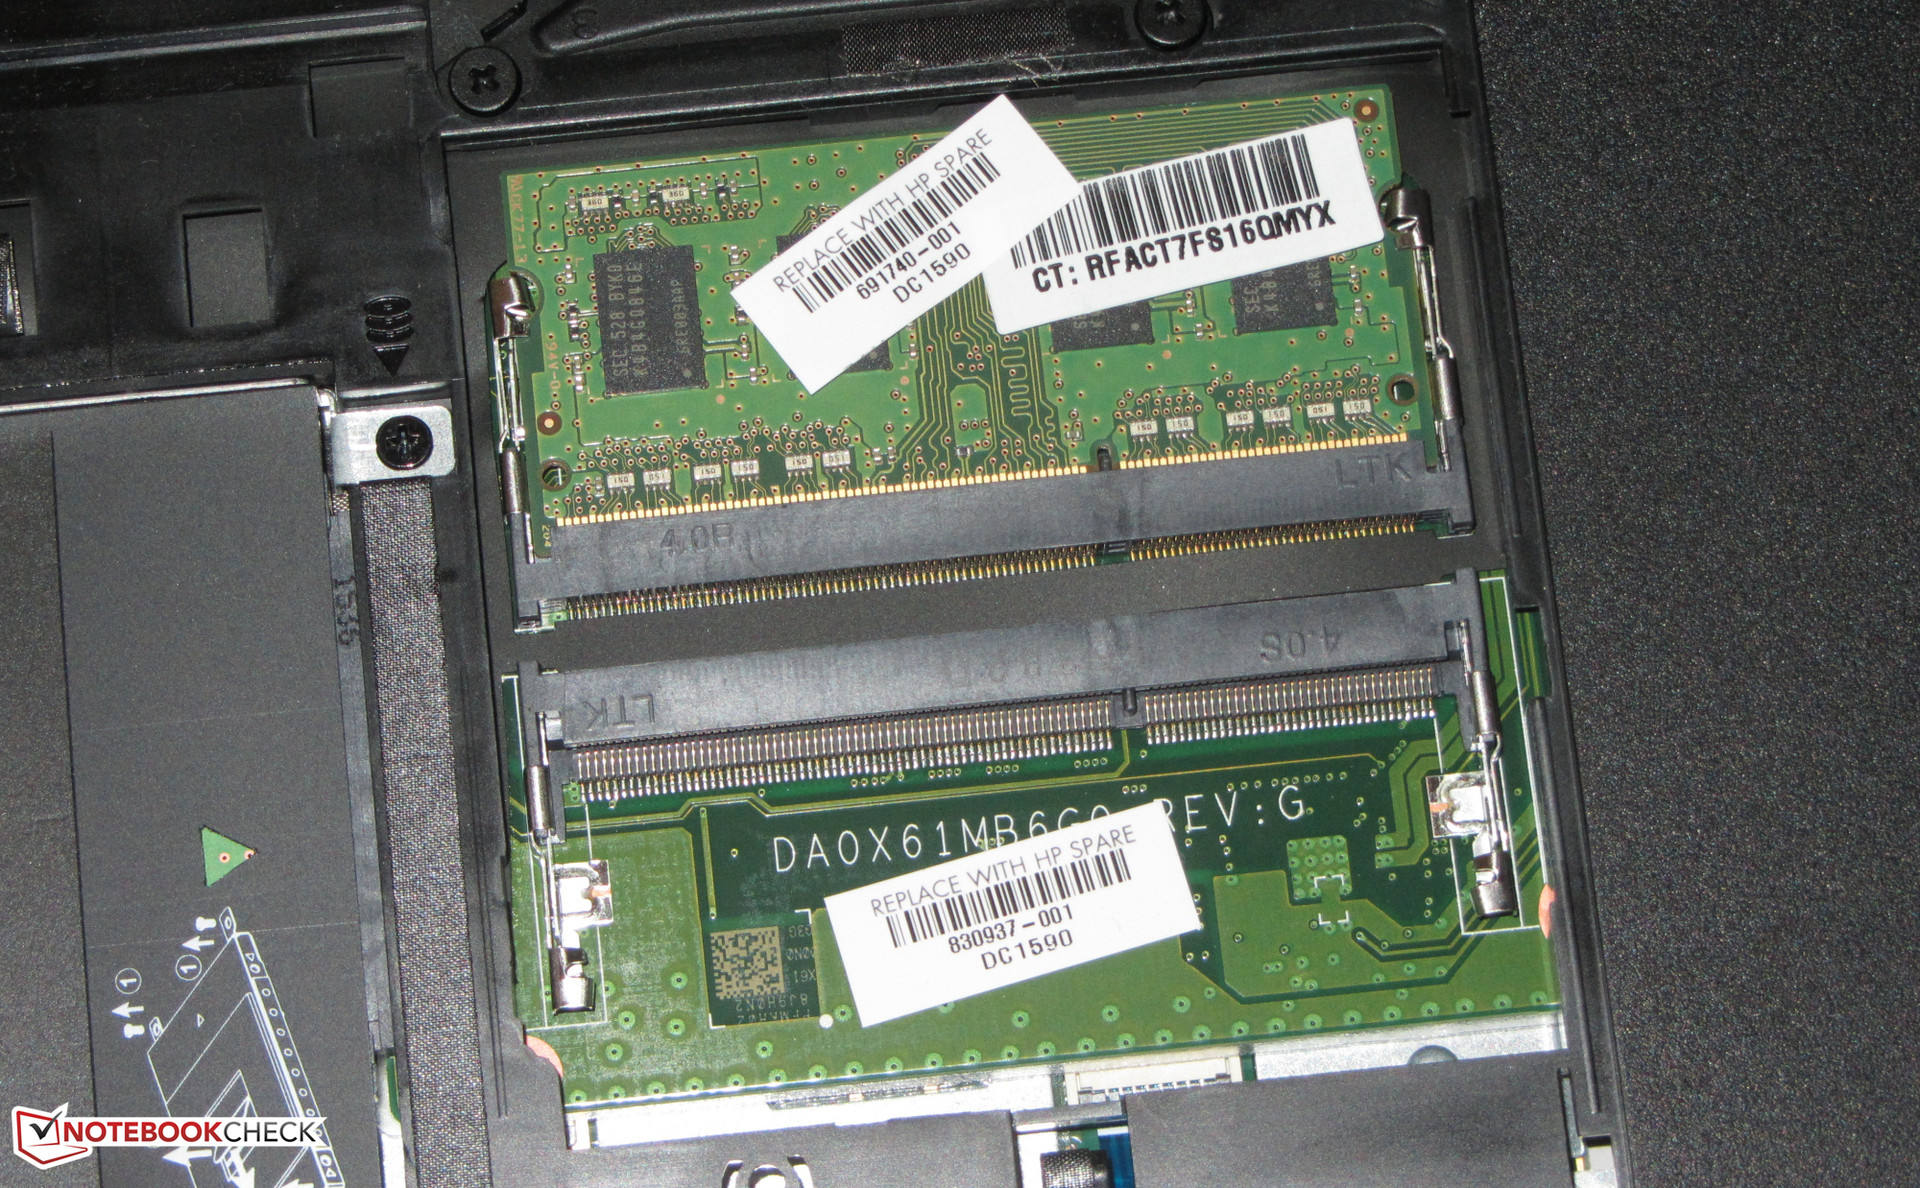
The system runs smoothly and the results of the PC Mark benchmarks are very good. However, owners of the ProBook can further increase the performance. For example, the GPU would benefit most from a second RAM module for activating dual channel mode. It could deliver more performance as it is used more efficiently. However, an SSD would increase the system performance even more significantly. Windows would boot faster and the system would be more responsive overall. Thanks to a free M.2 slot, it is easy and quick to do so.
| PCMark 7 Score | 2984 points | |
| PCMark 8 Home Score Accelerated v2 | 3043 points | |
| PCMark 8 Creative Score Accelerated v2 | 3390 points | |
| PCMark 8 Work Score Accelerated v2 | 4106 points | |
Help | ||
Storage Device
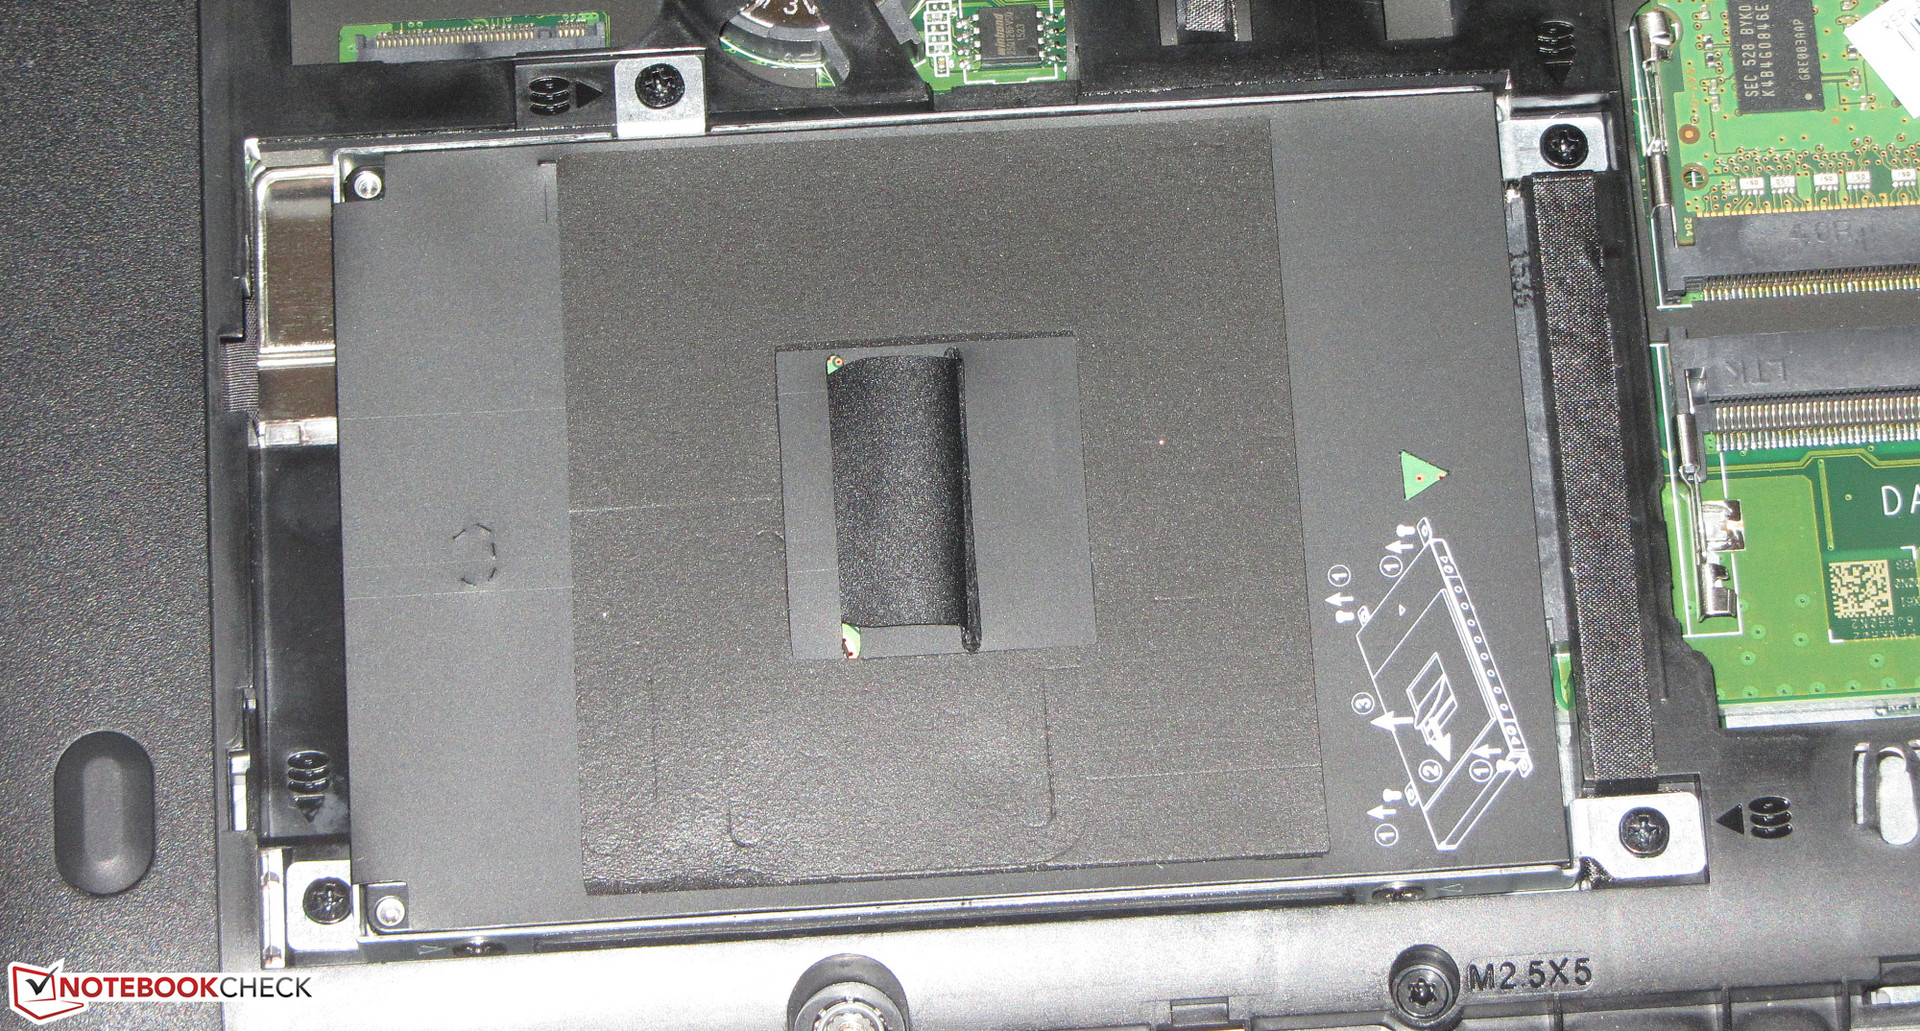
The ProBook uses a conventional 2.5-inch hard drive from Hitachi as the system drive. It has a capacity of 500 GB and works at 7200 rpm. The transfer rates are on par with 7200 rpm drives. In addition, the ProBook provides a free M.2 slots (2280) for a compatible SSD.
The memory card reader of the ProBook achieves a maximum transfer rate of 85.7 MB/s when copying large data blocks. Moving 250 jpg files (about 5 MB each) is done at about 72.3 MB/s. In this test, we always use our reference SD card (Toshiba Exceria Pro SDXC 64 GB UHS-II) to compare the memory card readers of different notebooks .

Graphics Card
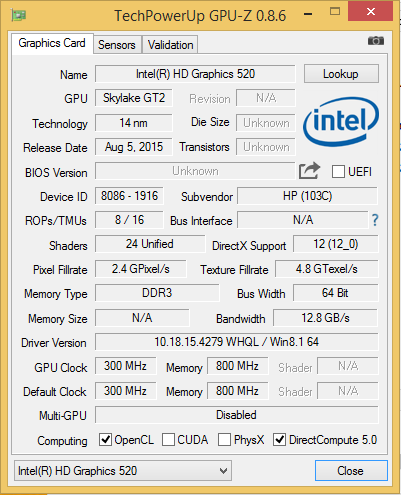
Apart from the Skylake processor, the ProBook also has a new GPU. The HD Graphics 520 supports DirectX 12 and works at a speed of up to 950 MHz. It performs significantly better than its HD Graphics 5550 predecessor in the 3D Mark benchmarks with a performance gain of up to 30%. It is possible to further increase the graphics performance by adding a second RAM module (= active dual channel mode). The following table lists the 3D Mark results of the HP in single and dual channel mode.
However, the new graphics core brings further advantages: For example, it is able to play 4k streams and decode videos in H.265 format (successor of the H.264). H.264 coded streams will be replaced by H.265 coded streams in the coming years, since videos in this format require less space at the same quality. For example, Netflix already uses H.265 for transferring 4k streams. Thus, the ProBook is future-proof in this respect.
Currently, not every media player supports hardware accelerated playback of H.265 streams. Under Windows 10, the Film & TV app does, while the Windows Media Player does not. Under Windows 8.1 and Windows 7, an alternative program is required - for example the DivX Player. During playback of a 4k H.265 video on the ProBook with the DivX Players, the CPU load was below 20%.
| 3DMark 06 Standard Score | 6472 points | |
| 3DMark 11 Performance | 1222 points | |
| 3DMark Ice Storm Standard Score | 44992 points | |
| 3DMark Cloud Gate Standard Score | 4932 points | |
| 3DMark Fire Strike Score | 589 points | |
Help | ||
| 3DMark 06 - 1280x1024 Standard Score AA:0x AF:0x (sort by value) | |
| HP ProBook 430 G3 P5T00ES | |
| HP ProBook 430 G3 P5T00ES | |
| HP ProBook 430-G1 | |
Gaming Performance
Although the ProBook is primarily a device for work, the new Skylake processor and its integrated graphics chip make it gaming capable to some extent. In real world gaming, this combination achieves on average 30% higher frame rates than the predecessor. With active dual channel mode, the ProBook can partially achieve the results of notebooks with dedicated graphics cores of the lower mid-range, for example the Radeon R5 M240.
| low | med. | high | ultra | |
|---|---|---|---|---|
| Diablo III (2012) | 68.2 | 45.1 | 36.1 | 21.5 |
| Counter-Strike: GO (2012) | 71 | 45.3 | 30.8 | 16.7 |
| Tomb Raider (2013) | 50.1 | 26.6 | 15.3 | 7.5 |
| GRID: Autosport (2014) | 73.4 | 28.7 | 14 | 12.5 |
| Sims 4 (2014) | 164.8 | 40.5 | 16.6 | 11.3 |
| Alien: Isolation (2014) | 32.8 | 20.7 | ||
| F1 2014 (2014) | 48 | 31 | 16 | 12.5 |
| Dragon Age: Inquisition (2014) | 17.2 | 11.7 | 4.5 | 2.1 |
| Evolve (2015) | 11.1 | 8 | ||
| Battlefield Hardline (2015) | 30.6 | 21.7 | 7.3 | 3.9 |
| Dirt Rally (2015) | 70.6 | 19.9 | 12.5 | 12.5 |
| Metal Gear Solid V (2015) | 28.6 | 18.3 | ||
| World of Warships (2015) | 45.2 | 32.1 | 15.9 | 11.8 |
| FIFA 16 (2015) | 36.9 | 25 | ||
| Anno 2205 (2015) | 8.2 | 5.3 | ||
| Call of Duty: Black Ops 3 (2015) | 17.2 | 9.7 | ||
| Fallout 4 (2015) | 13.6 | 9.1 |
| GRID: Autosport | |
| 1024x768 Ultra Low Preset (sort by value) | |
| HP ProBook 430 G3 P5T00ES | |
| HP ProBook 430 G3 P5T00ES | |
| Lenovo Thinkpad L450 20DS0001GE | |
| Dell Inspiron 15 3542-2293 | |
| Asus F555LJ-XX110H | |
| HP 350 G2 L8B05ES | |
| Lenovo IdeaPad 305-15IBD | |
| 1366x768 Medium Preset (sort by value) | |
| HP ProBook 430 G3 P5T00ES | |
| HP ProBook 430 G3 P5T00ES | |
| Lenovo Thinkpad L450 20DS0001GE | |
| Dell Inspiron 15 3542-2293 | |
| Asus F555LJ-XX110H | |
| HP 350 G2 L8B05ES | |
| Lenovo IdeaPad 305-15IBD | |
| Dirt Rally | |
| 1024x768 Ultra Low Preset (sort by value) | |
| HP ProBook 430 G3 P5T00ES | |
| HP ProBook 430 G3 P5T00ES | |
| Dell Inspiron 15-5558 | |
| Asus F555LJ-XX110H | |
| HP 350 G2 L8B05ES | |
| Lenovo IdeaPad 305-15IBD | |
| 1366x768 Medium Preset (sort by value) | |
| HP ProBook 430 G3 P5T00ES | |
| HP ProBook 430 G3 P5T00ES | |
| Dell Inspiron 15-5558 | |
| Asus F555LJ-XX110H | |
| HP 350 G2 L8B05ES | |
| Lenovo IdeaPad 305-15IBD | |
| World of Warships | |
| 1366x768 Low Preset AF:Trilinear (sort by value) | |
| HP ProBook 430 G3 P5T00ES | |
| HP ProBook 430 G3 P5T00ES | |
| HP 350 G2 L8B05ES | |
| Lenovo IdeaPad 305-15IBD | |
| 1366x768 Medium Preset AF:Trilinear (sort by value) | |
| HP ProBook 430 G3 P5T00ES | |
| HP ProBook 430 G3 P5T00ES | |
| HP 350 G2 L8B05ES | |
| Lenovo IdeaPad 305-15IBD | |
| Battlefield Hardline - 1024x768 Low Graphics Quality (DX11) (sort by value) | |
| HP ProBook 430 G3 P5T00ES | |
| HP ProBook 430 G3 P5T00ES | |
| Lenovo ThinkPad E450 20DDS01E00 | |
| Dell Inspiron 15-5558 | |
| Asus F555LJ-XX110H | |
| HP 350 G2 L8B05ES | |
Emissions
System Noise
A work device like the ProBook should produce low or even no noise at all. HP does not disappoint in this respect: While idling, often the fan stops and only the quiet noise of the hard drive is audible. Even during our stress test (Prime95 and FurMark run for at least one hour), the fan does not have to do much. Although the graphics core works at full speed and the CPU at very high speed, the system noise is only 37.4 dB(A). During medium load such as computer games, the noise is about 33.3 dB(A). Many notebooks reach such a value while idling. All things considered, the noise has remained unchanged compared to the Broadwell ProBook.
Noise level
| Idle |
| 29.8 / 29.8 / 30.9 dB(A) |
| HDD |
| 29.8 dB(A) |
| Load |
| 33.3 / 37.4 dB(A) |
 | ||
30 dB silent 40 dB(A) audible 50 dB(A) loud |
||
min: | ||
| HP ProBook 430 G3 P5T00ES 6200U, HD Graphics 520 | HP ProBook 430 G2 L3Q21EA 5200U, HD Graphics 5500 | HP ProBook 430-G1 4200U, HD Graphics 4400 | Dell Latitude 13 3340 Education Series 4200U, HD Graphics 4400 | Lenovo ThinkPad E450 20DDS01E00 5200U, Radeon R7 M260 | Dell Latitude 3450-9723 5200U, HD Graphics 5500 | Lenovo Thinkpad L450 20DS0001GE 5300U, HD Graphics 5500 | Fujitsu Lifebook E544 4210M, HD Graphics 4600 | |
|---|---|---|---|---|---|---|---|---|
| Noise | -1% | -1% | -0% | -11% | -8% | -0% | -6% | |
| Idle Minimum * (dB) | 29.8 | 29.2 2% | 30.8 -3% | 31.3 -5% | 29.6 1% | 32.7 -10% | 30.8 -3% | 30.3 -2% |
| Idle Average * (dB) | 29.8 | 29.2 2% | 30.8 -3% | 31.3 -5% | 34.5 -16% | 32.7 -10% | 30.8 -3% | 30.3 -2% |
| Idle Maximum * (dB) | 30.9 | 31.6 -2% | 30.8 -0% | 31.3 -1% | 34.8 -13% | 32.7 -6% | 30.8 -0% | 32.5 -5% |
| Load Average * (dB) | 33.3 | 36 -8% | 34.6 -4% | 31.6 5% | 40.3 -21% | 34.4 -3% | 34.3 -3% | 36.2 -9% |
| Load Maximum * (dB) | 37.4 | 37.1 1% | 34.6 7% | 35.7 5% | 40.3 -8% | 41.9 -12% | 34.3 8% | 41.5 -11% |
* ... smaller is better
Temperature
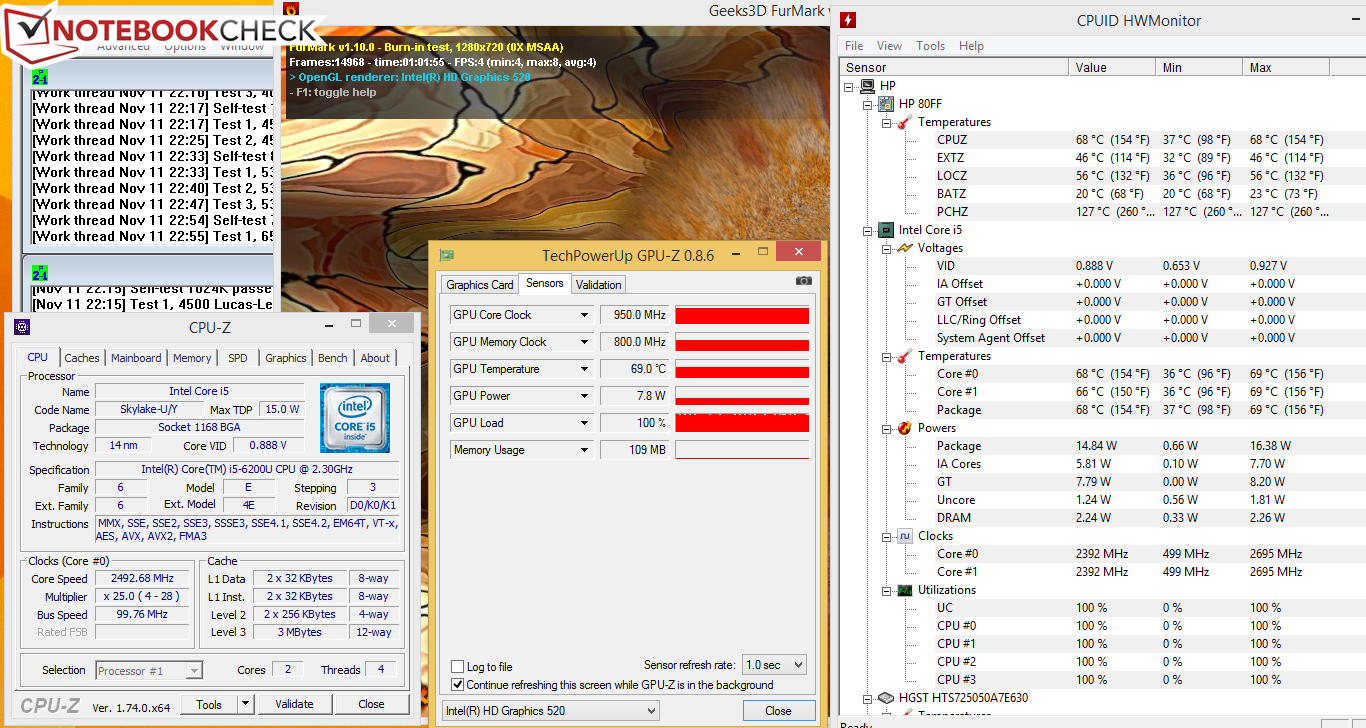
During our stress test (Prime95 and FurMark run for at least one hour), the graphics core runs at full speed (950 MHz) in mains operation as well as on battery. The processor works at 2.3 GHz (on battery) and 2.4 to 2.5 GHz (mains operated). The computer does not get too hot, but the 40 °C (~104 °F) mark is exceeded on several spots. The ProBook gets slightly warmer than its Broadwell predecessor, since the latter's CPU and GPU throttle significantly during the stress test. Thus, the Skylake ProBook is able to deliver its full performance for a longer period.
(±) The maximum temperature on the upper side is 42.1 °C / 108 F, compared to the average of 34.3 °C / 94 F, ranging from 21.2 to 62.5 °C for the class Office.
(±) The bottom heats up to a maximum of 44.1 °C / 111 F, compared to the average of 36.8 °C / 98 F
(+) In idle usage, the average temperature for the upper side is 29.6 °C / 85 F, compared to the device average of 29.5 °C / 85 F.
(+) The palmrests and touchpad are cooler than skin temperature with a maximum of 29.5 °C / 85.1 F and are therefore cool to the touch.
(±) The average temperature of the palmrest area of similar devices was 27.5 °C / 81.5 F (-2 °C / -3.6 F).
| HP ProBook 430 G3 P5T00ES 6200U, HD Graphics 520 | HP ProBook 430 G2 L3Q21EA 5200U, HD Graphics 5500 | HP ProBook 430-G1 4200U, HD Graphics 4400 | Dell Latitude 13 3340 Education Series 4200U, HD Graphics 4400 | Lenovo ThinkPad E450 20DDS01E00 5200U, Radeon R7 M260 | Dell Latitude 3450-9723 5200U, HD Graphics 5500 | Lenovo Thinkpad L450 20DS0001GE 5300U, HD Graphics 5500 | Fujitsu Lifebook E544 4210M, HD Graphics 4600 | |
|---|---|---|---|---|---|---|---|---|
| Heat | 1% | 9% | 7% | -1% | 6% | 10% | 14% | |
| Maximum Upper Side * (°C) | 42.1 | 39.1 7% | 33.2 21% | 41.1 2% | 48.9 -16% | 41.1 2% | 36.9 12% | 32.6 23% |
| Maximum Bottom * (°C) | 44.1 | 46.2 -5% | 44.4 -1% | 43.5 1% | 54.3 -23% | 41.4 6% | 39.6 10% | 34.6 22% |
| Idle Upper Side * (°C) | 31.1 | 30.2 3% | 26.8 14% | 26.8 14% | 25.6 18% | 28.5 8% | 28.7 8% | 28.7 8% |
| Idle Bottom * (°C) | 32.9 | 33 -0% | 32.9 -0% | 30.1 9% | 26.6 19% | 30.1 9% | 30.1 9% | 31.6 4% |
* ... smaller is better
Speakers
The stereo speakers still sit above the keyboard behind a perforated cover. The sound is not impressive. However, this does not matter, since it is an office device. The sound lacks bass and tends to clank. However, voice is clearly understandable.
Energy Management
Power Consumption
While idling, the power consumption of the ProBook is up to 8.3 watts and therefore it is higher than that of the Broadwell sibling. This is because the latter has been equipped with a darker display and an SSD. In addition, we used a new gauge for the ProBook 430 G3. Under full load, the Skylake ProBook performs better: It requires just under 6 watts less energy. The power adapter is rated at 45 watts.
| Off / Standby | |
| Idle | |
| Load |
|
Key:
min: | |
| HP ProBook 430 G3 P5T00ES 6200U, HD Graphics 520 | HP ProBook 430 G2 L3Q21EA 5200U, HD Graphics 5500 | HP ProBook 430-G1 4200U, HD Graphics 4400 | Dell Latitude 13 3340 Education Series 4200U, HD Graphics 4400 | Lenovo ThinkPad E450 20DDS01E00 5200U, Radeon R7 M260 | Dell Latitude 3450-9723 5200U, HD Graphics 5500 | Lenovo Thinkpad L450 20DS0001GE 5300U, HD Graphics 5500 | Fujitsu Lifebook E544 4210M, HD Graphics 4600 | |
|---|---|---|---|---|---|---|---|---|
| Power Consumption | 22% | 13% | 5% | -14% | -17% | 3% | -37% | |
| Idle Minimum * (Watt) | 4.7 | 2.7 43% | 3.9 17% | 4.7 -0% | 2.6 45% | 6.1 -30% | 3.4 28% | 5.4 -15% |
| Idle Average * (Watt) | 7.2 | 4.4 39% | 6 17% | 6.3 12% | 7.7 -7% | 8.4 -17% | 6.1 15% | 9.3 -29% |
| Idle Maximum * (Watt) | 8.3 | 5 40% | 8.3 -0% | 7.1 14% | 8.7 -5% | 9.4 -13% | 7 16% | 10.2 -23% |
| Load Average * (Watt) | 26.4 | 25.4 4% | 23.9 9% | 28.8 -9% | 43.1 -63% | 32.2 -22% | 29 -10% | 41 -55% |
| Load Maximum * (Watt) | 32 | 37.6 -18% | 25 22% | 28.8 10% | 45.4 -42% | 33.6 -5% | 42.4 -33% | 52.4 -64% |
* ... smaller is better
Battery Life
Overall, the battery runtimes of the ProBook 430 G3 are decent. In our realistic Wi-Fi test, the ProBook lasts 6:17 h, and therefore on par with its Broadwell predecessor (6:05 h). The ProBook also lasts just under 6 hours during video playback. Therefore, it is possible to watch several videos or several episodes of your favorite show during a train ride. We tested the battery runtime during video playback by running the short film Big Buck Bunny (H.264 coded, 1920x1080 pixels) in a loop. The Wi-Fi modules are disabled and the display brightness is set to about 150 cd/m².
| HP ProBook 430 G3 P5T00ES 44 Wh | HP ProBook 430 G2 L3Q21EA 44 Wh | HP ProBook 430-G1 44 Wh | Dell Latitude 13 3340 Education Series 65 Wh | Lenovo ThinkPad E450 20DDS01E00 47 Wh | Dell Latitude 3450-9723 58 Wh | Lenovo Thinkpad L450 20DS0001GE 48 Wh | Fujitsu Lifebook E544 72 Wh | |
|---|---|---|---|---|---|---|---|---|
| Battery runtime | 27% | 70% | 42% | 29% | 3% | 26% | ||
| Reader / Idle (h) | 7.5 | 11.2 49% | 19.1 155% | 16.7 123% | 13.3 77% | 12.9 72% | ||
| H.264 (h) | 5.6 | 9 61% | 4.4 -21% | |||||
| WiFi v1.3 (h) | 6.3 | 6.8 8% | 8.1 29% | 4.8 -24% | ||||
| Load (h) | 2 | 2.1 5% | 1.9 -5% | 1.9 -5% | 1.6 -20% | 1.6 -20% | ||
| WiFi (h) | 6.1 | 4.3 | 14.5 | 4.4 |
Pros
Cons
Verdict
The new Skylake processor of the HP ProBook 430 G3 provides a decent performance gain.
Thereby, the GPU performance has increased more than the CPU performance. However, the computer does not require more energy under load. Thus, the battery runtimes in our practical scenarios did not change compared to those of the Broadwell ProBook. Only the idle battery life is relatively short due to a rather too high-energy demand while idling.
The G3 model has inherited the advantages of its predecessor: For example, the computer works quietly and gets only moderately warm. The integrated hard drive is one of the fastest of its kind. Unfortunately, 7200-rpm drives are quite rare. If you want to incorporate an SSD, you need not do without the hard drive - thanks to a free M.2 slot. The new keyboard features a slightly crisper stroke.
Unfortunately, HP has also carried over the weaknesses of the predecessor. For example, once again, HP has incorporated a poor display. It is dark, low-contrast and viewing-angle dependent. Hewlett Packard does not appear to realize that a 13.3-inch notebook is used on the move and under all kinds of lighting condition. The warranty of only 1 year is also a point of critique. Unfortunately, the latter is normal in the budget segment.
HP ProBook 430 G3 P5T00ES
- 02/25/2016 v5 (old)
Sascha Mölck
Price comparison
