Notebookcheck Logo

F1 2014 Benchmarked

Technical stagnation. You snooze, you lose: This saying goes perfectly with the Formula 1 simulation from Codemasters. Even in 2014, users crazy for motor sports have to accept second-rate graphics. Learn here what this means for performance.
F1 2014 Logo

For the original German article, see here.

Technology

Instead of raising technology to the level of Dirt or GRID, the developer uses the graphics of the predecessor. You'll look for optical changes and improved performance in vain. The latter is not necessary since F1 does not have high hardware requirements, anyway. A simple update of the database (current season) for just under 50 Euros (~$63) will displease some buyers. However, we already know this approach from other sport games (e.g. FIFA). 

Low Settings
Low Settings
Medium Settings
Medium Settings
High Settings
High Settings
Ultra Settings
Ultra Settings

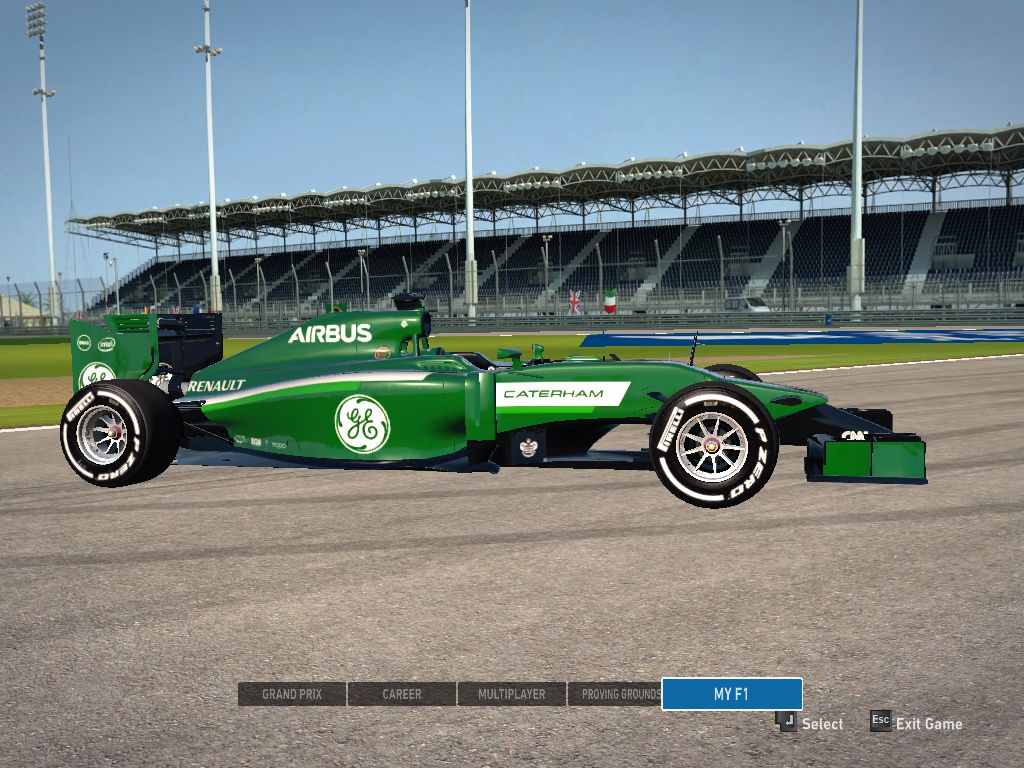
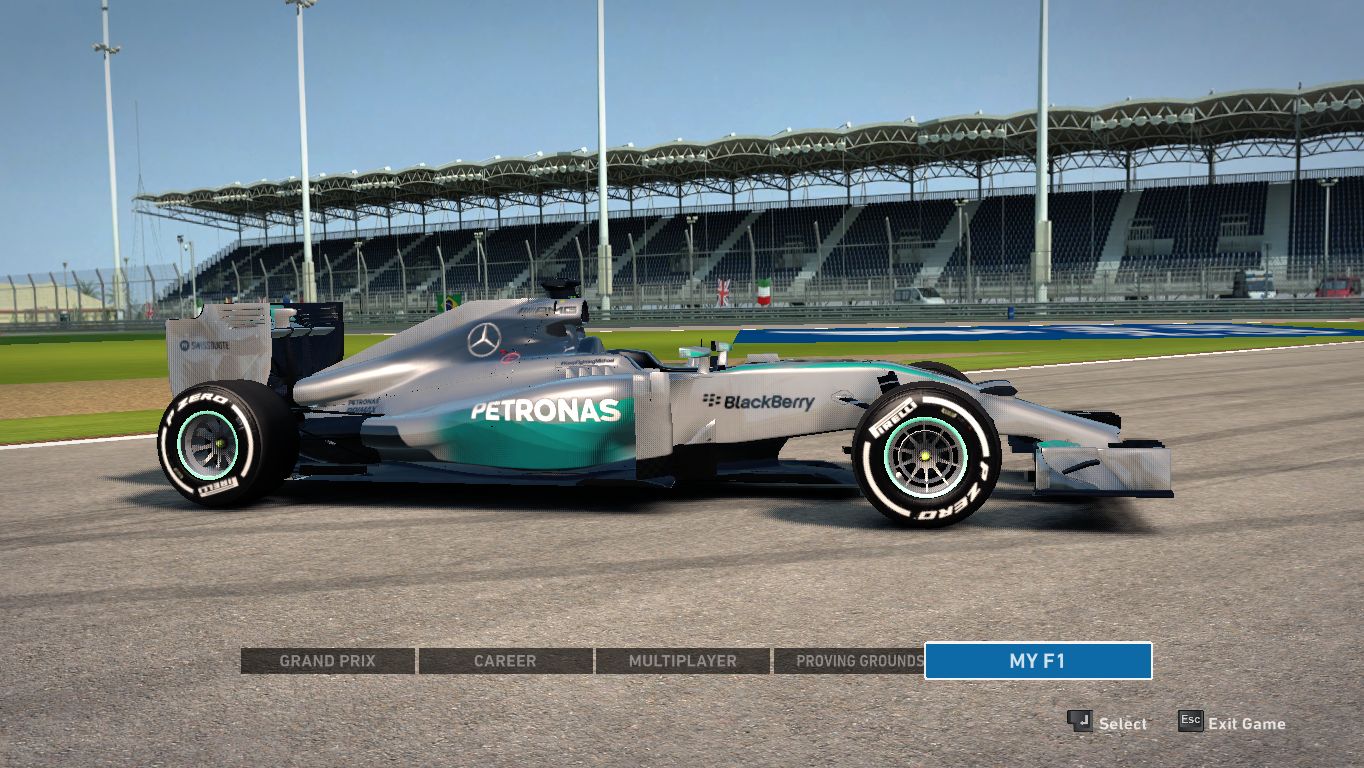
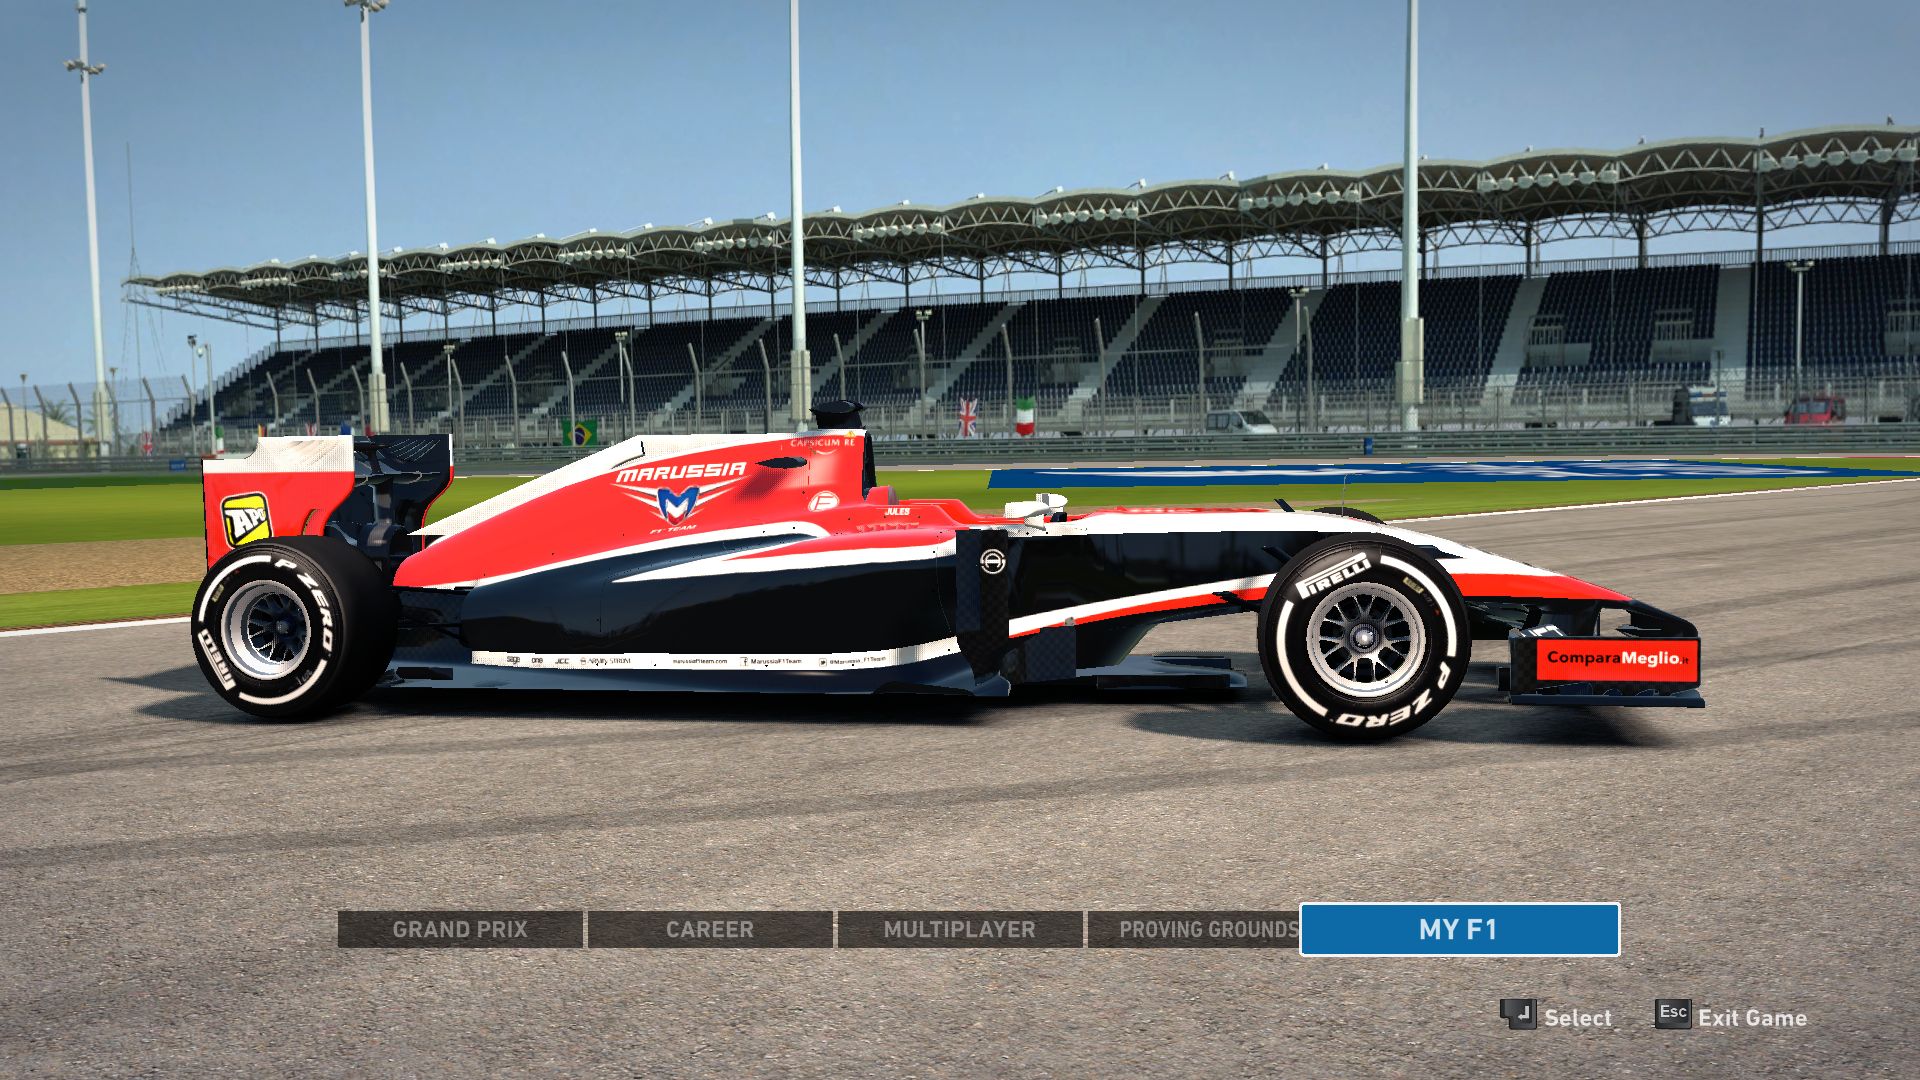
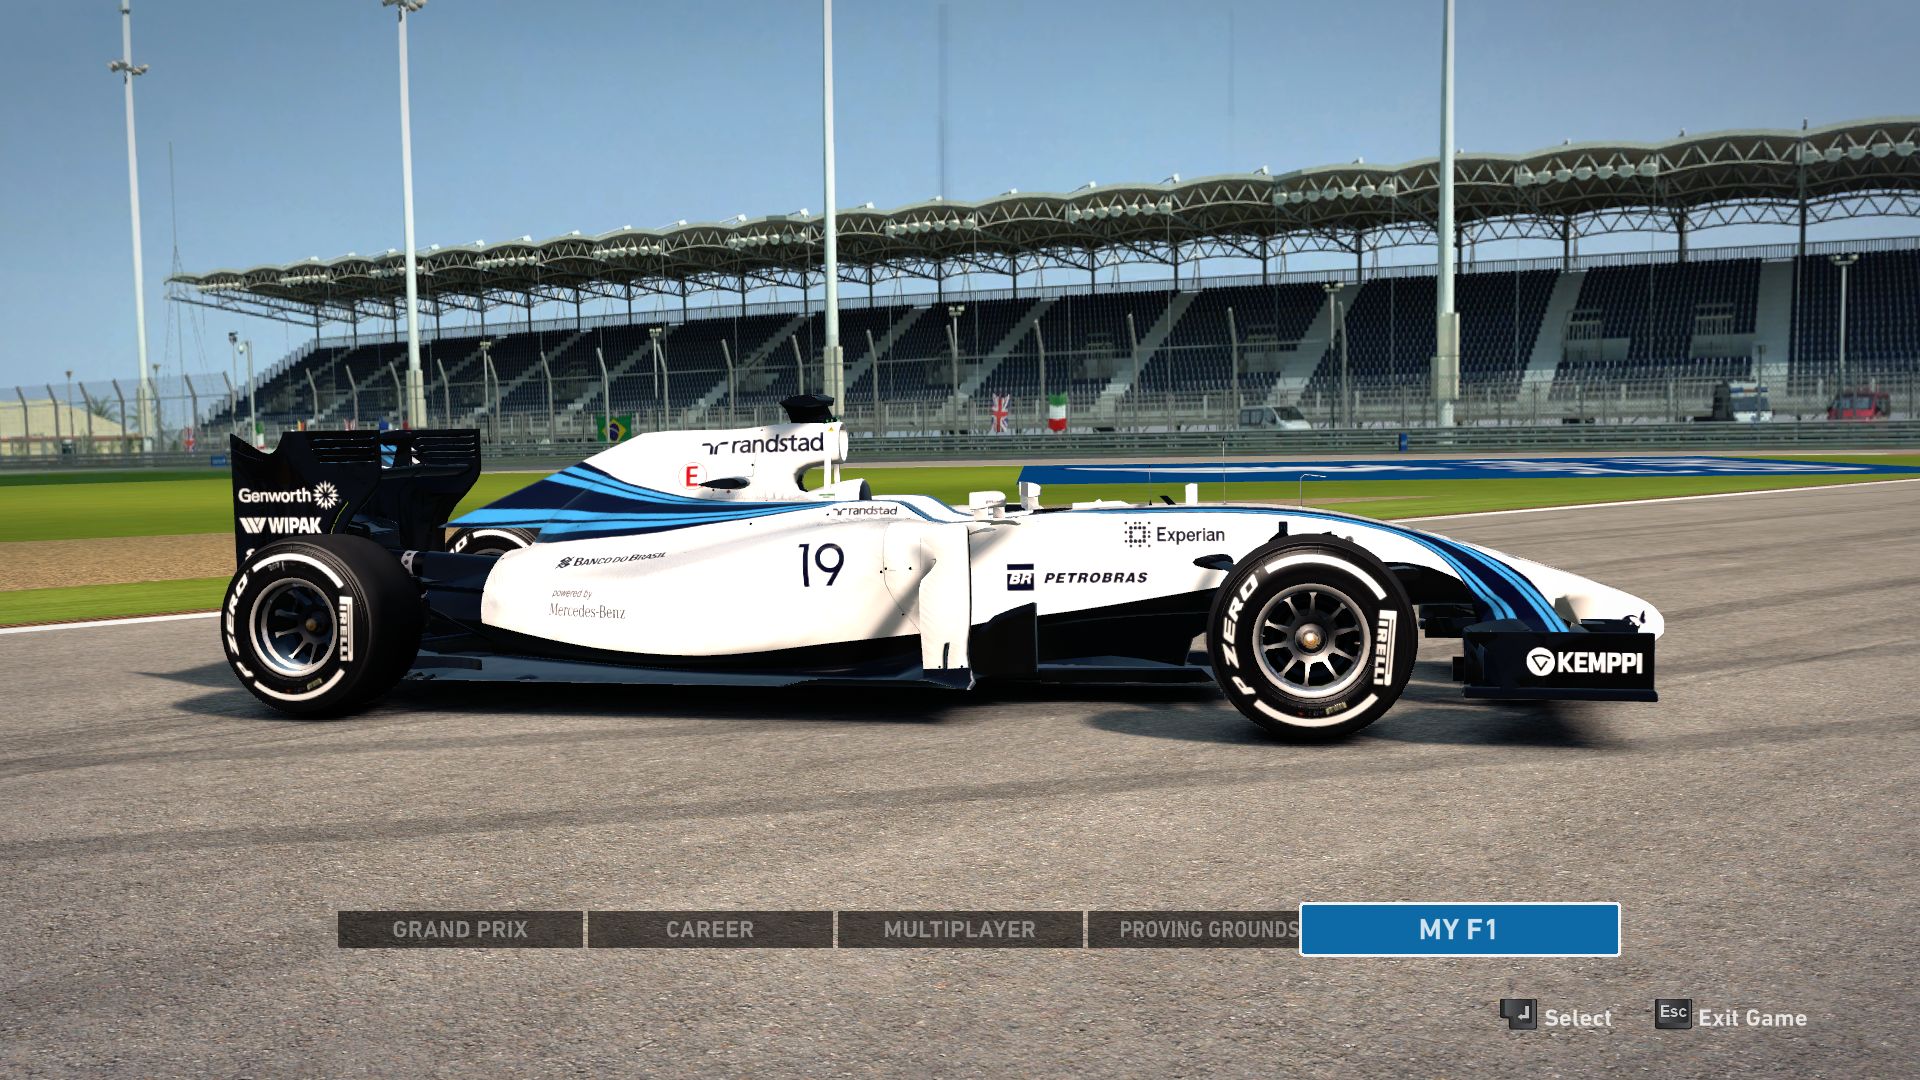
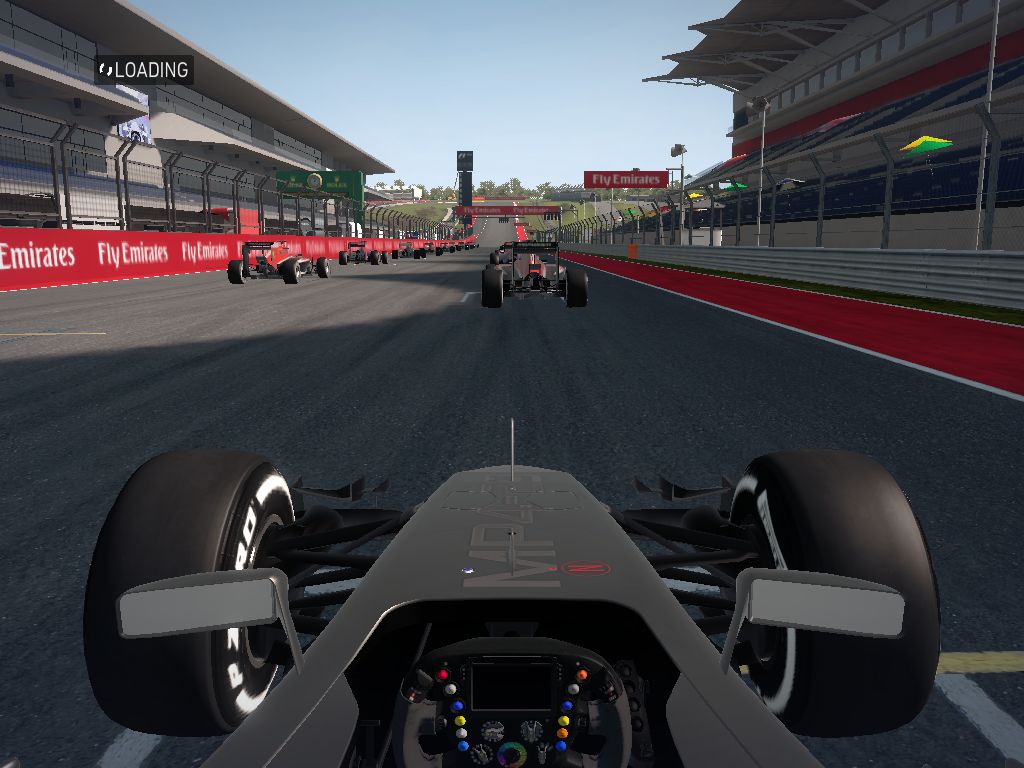
While the cars still look nice, the environment of the route is highly disappointing in F1 2014. Despite spectators, it looks very dull and lifeless. Some parts look like a ghost town. Is there high-end "3D grass"? No. Is there busy bustle beside the pit lane? No. But, the sound is quite convincing and you can get kind of a Formula One feel. However, the atmosphere of the race simulation is not fantastic. While F1 2014 looks quite nice at a first glance, squishy textures, a low number of polygons and low detail level are striking at a closer look. Lighting and other effects are also no longer "up-to-date."

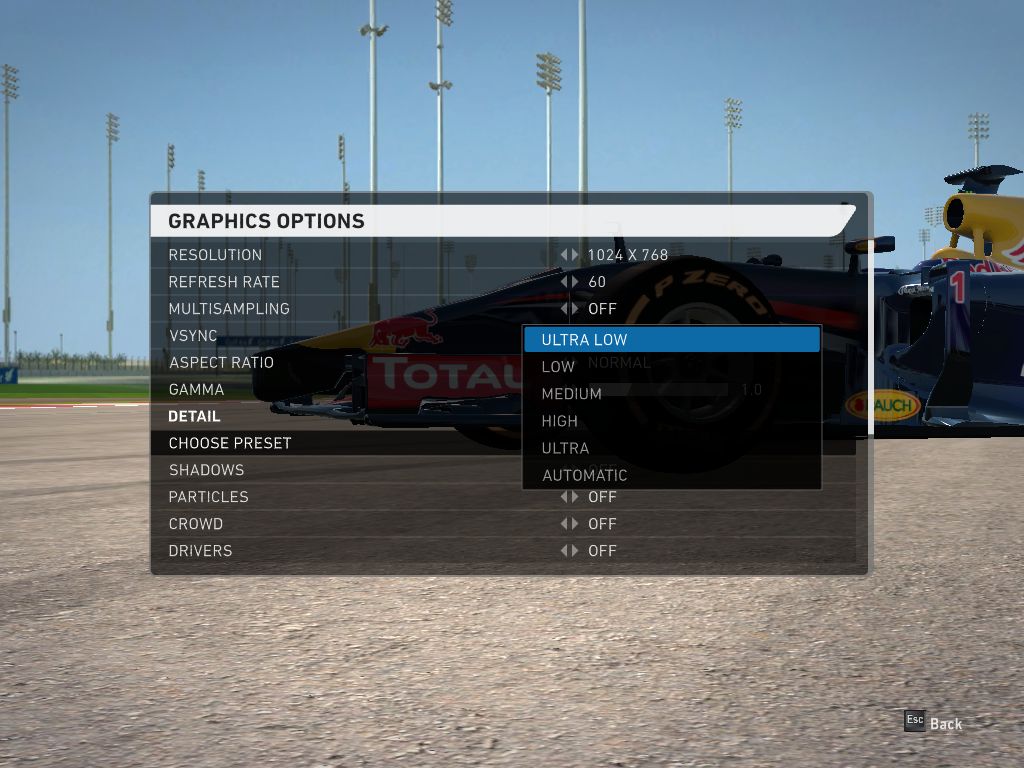
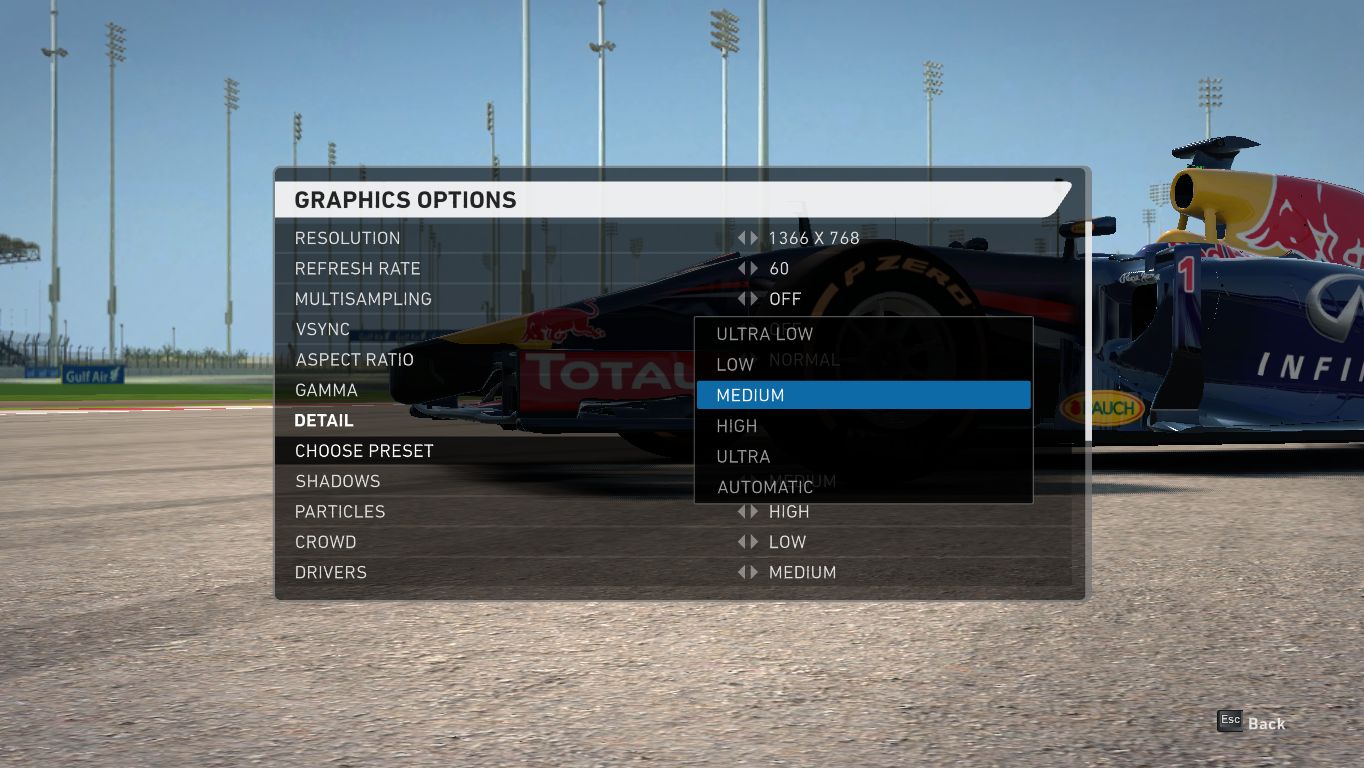
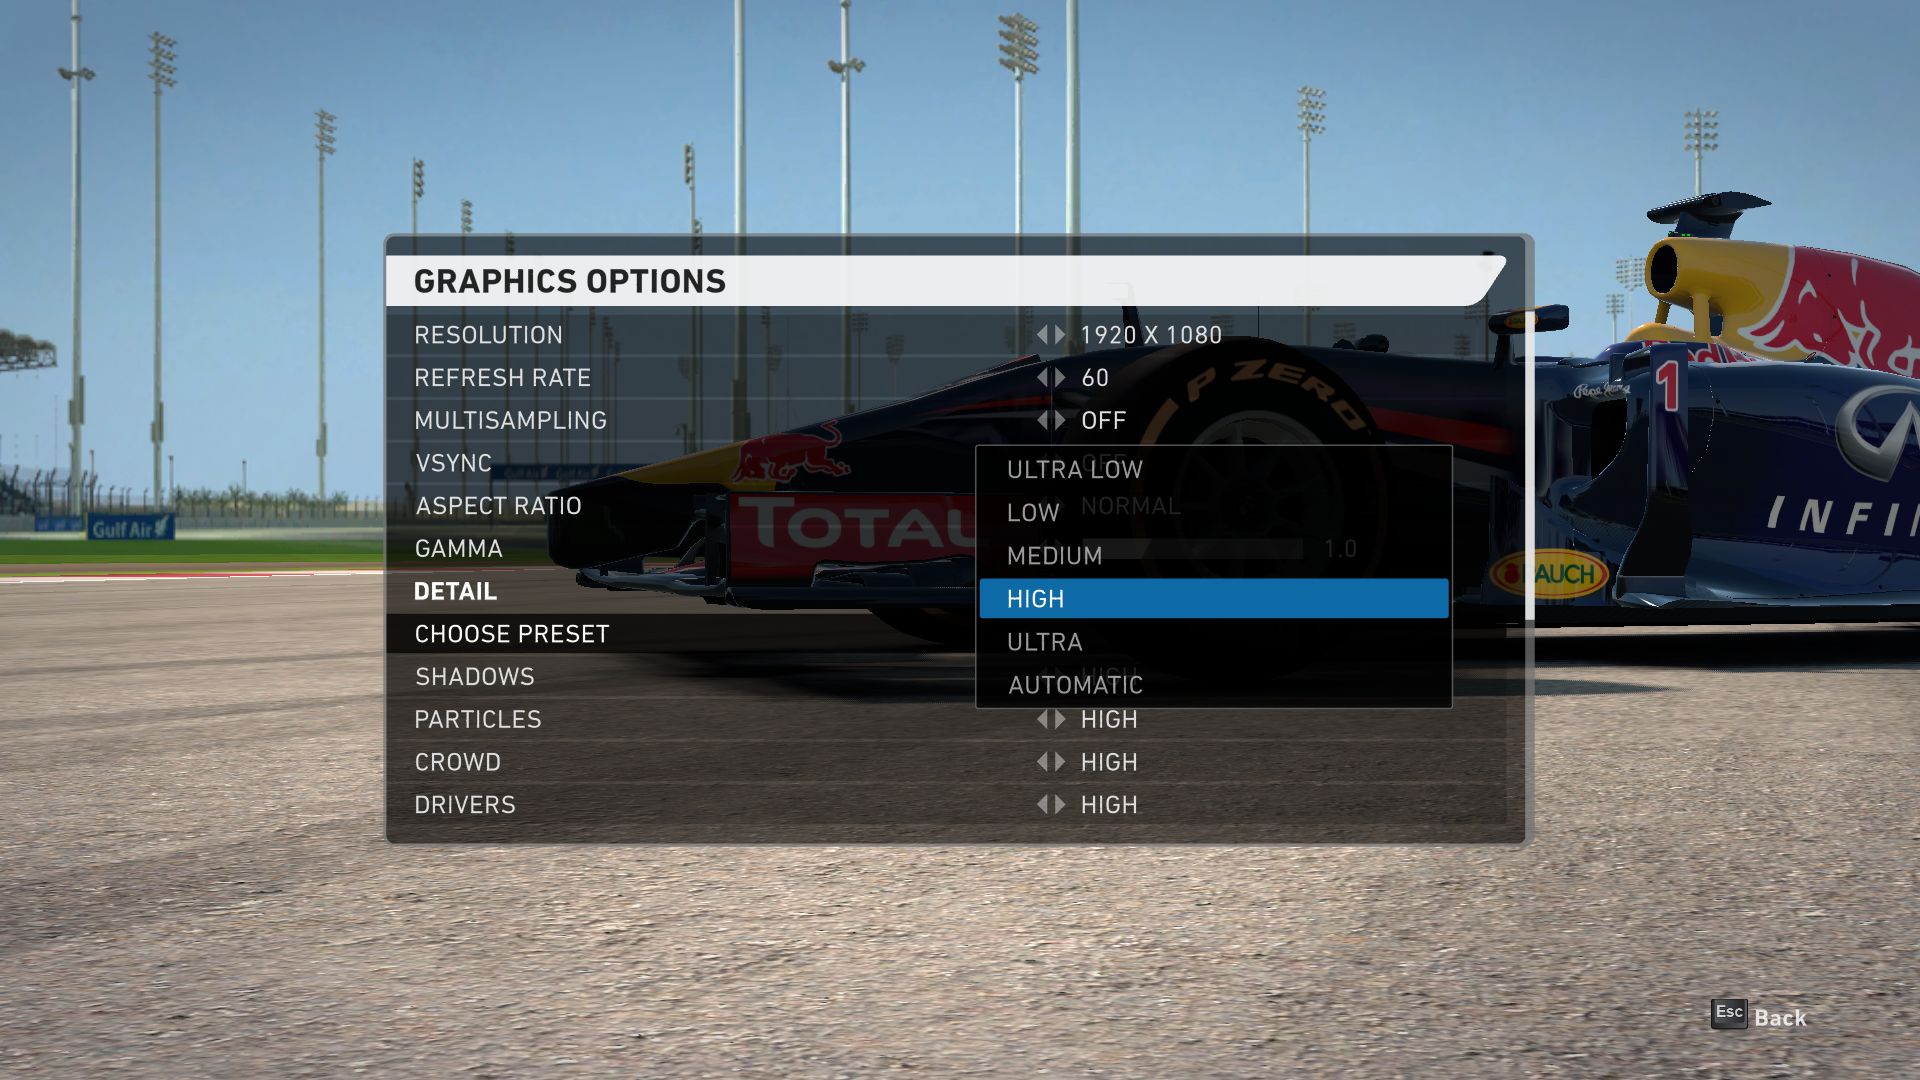
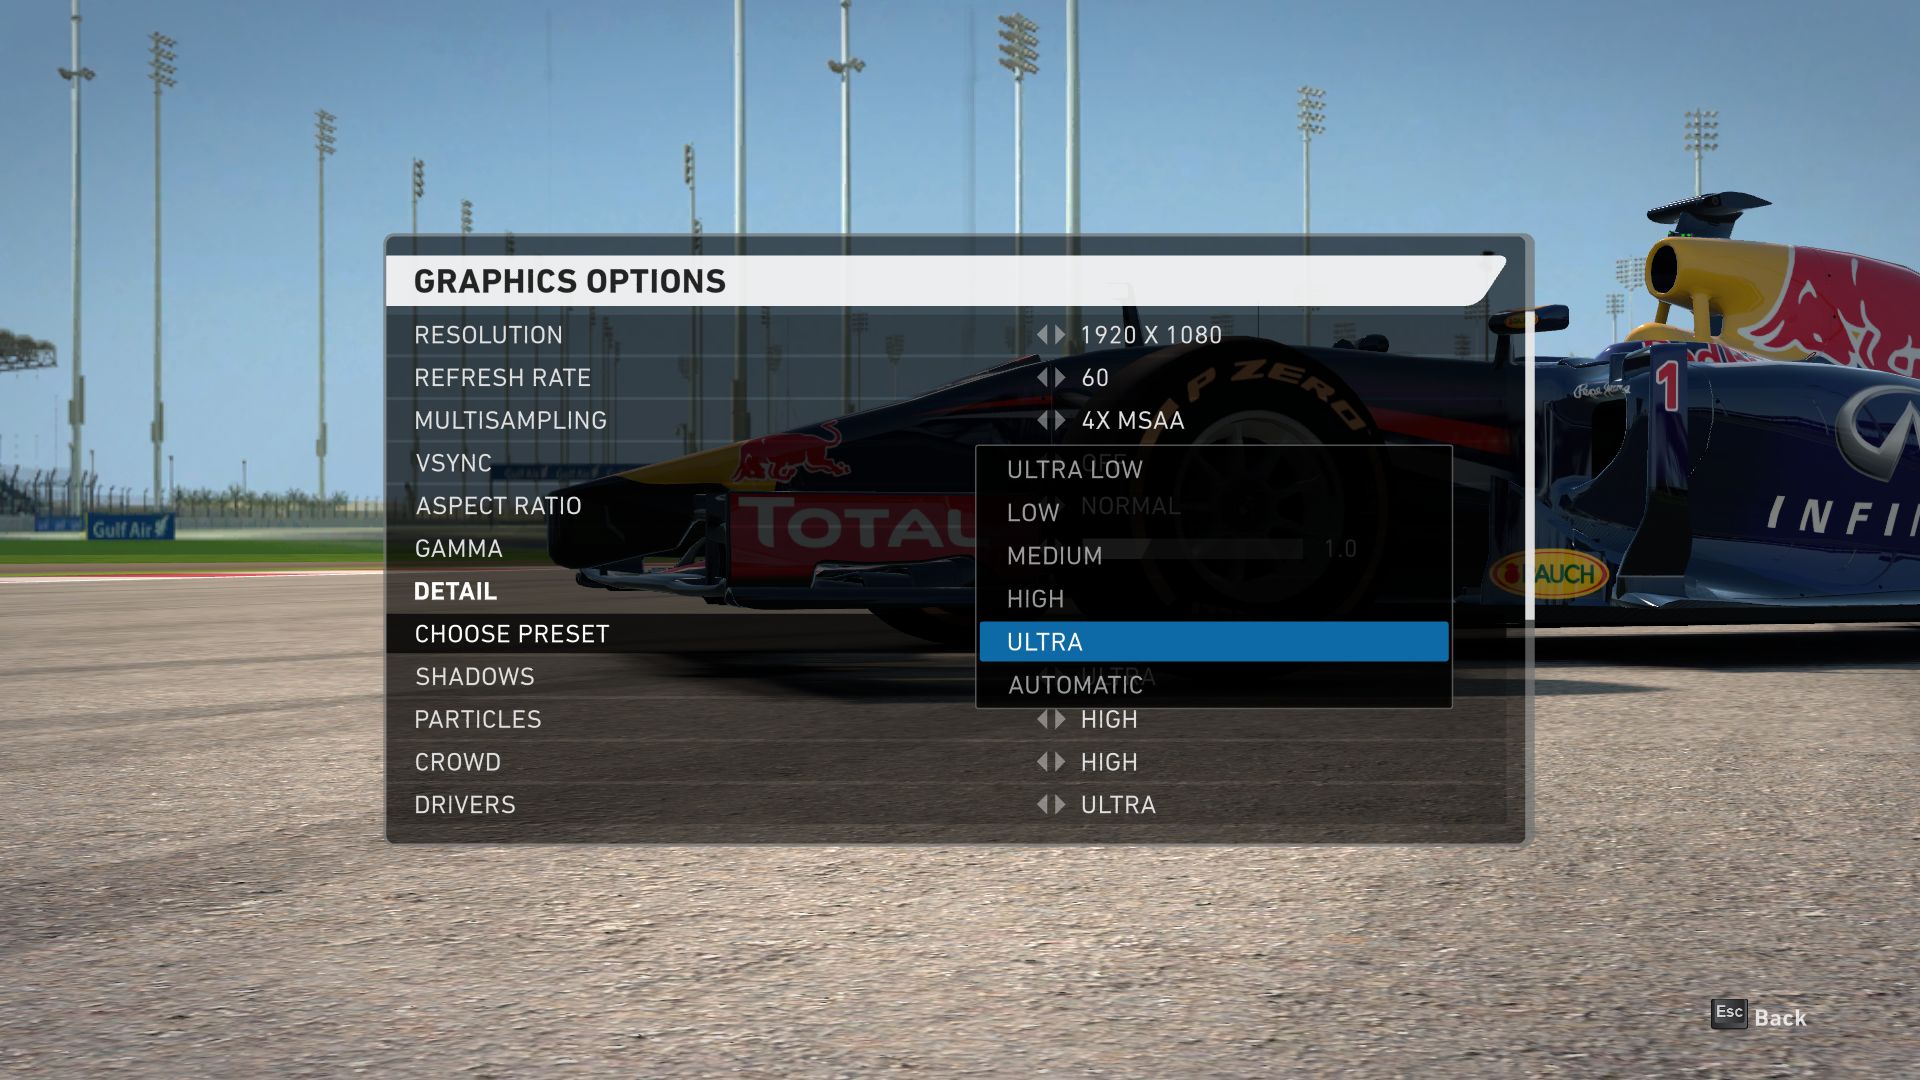
Alike previously, Codemasters scores points with a comprehensive graphics menu with five presets, several anti-aliasing modes and 10 details options. Warning: Although the settings are changed on-the-fly, a restart is required for these to take effect. This problem has already been known for several years.

Low Settings
Low Settings
Medium Settings
Medium Settings
High Settings
High Settings
Ultra Settings
Ultra Settings

Speaking about problems: The Radeon HD 8970M aka R9 M290X could not run the 2014 version. While the .exe file was executed according to the task manager, it did not bring a picture (we assume that this is caused by the Enduro graphics switch). In addition, it is incomprehensible for PC purists that the tutorials only display controller buttons, but no keyboard commands. At least, F1 2014 only requires just 5 GB of hard drive space. Other games from 2014 (The Evil Within, Shadow of Mordor, etc.) need above 30 GB or even 40 GB.

Low Settings
Low Settings
Medium Settings
Medium Settings
High Settings
High Settings
Ultra Settings
Ultra Settings

Benchmark

Users can run the integrated benchmark from the options menu. It is completely identical with the one from the 2013 version and so displays very similar results. Small performance differences of some percent between runs are caused by the varying sequence. Since it is a rather fast game, which requires fast reflexes, we recommend a frame rate of at least 40 fps.

Results

As already mentioned above, the results are very similar to the predecessor's. Even low-end GPUs with a performance like the HD Graphics 4600 do not have problems with 1366x768 pixels and normal details. A cheap multimedia notebook is sufficient for the high preset and 1920x1080 pixels. For example, the GeForce GT 740M achieved just under 50 fps in the benchmark. Ultra settings and 4x MSAA require slightly more performance, but the GeForce GT 750M is (almost) sufficient. Fortunately, only owners of very weak or extremely old notebooks have to live with low graphics settings. 

Speaking of low details: The processor is the main limiting factor (becomes apparent in the GPU comparison) with low settings. We can only hope that Codemasters will widely improve the technology with the next generation in 2015.

F1 2014
    1920x1080 Ultra Preset AA:4x MS     1920x1080 High Preset     1366x768 Medium Preset     1024x768 Ultra Low Preset
GeForce GTX 780 Ti, 3770K
Desktop-PC
118 (89min) fps ∼98%
127 (94min) fps ∼95%
131 (100min) fps ∼98%
133 (128min) fps ∼99%
GeForce GTX 760, 3770K
Desktop-PC
111 (85min) fps ∼93%
128 (95min) fps ∼96%
131 (101min) fps ∼98%
132 (127min) fps ∼98%
Radeon R9 280X, 3770K
Desktop-PC
105 (76min) fps ∼88%
123 (82min) fps ∼92%
127 (91min) fps ∼95%
132 (125min) fps ∼98%
GeForce GTX 880M, 4700MQ
Schenker W504
102 (74min) fps ∼85%
120 (84min) fps ∼90%
127 (93min) fps ∼95%
132 (128min) fps ∼98%
GeForce GTX 750 Ti, 3770K
Desktop-PC
98 (81min) fps ∼82%
125 (91min) fps ∼94%
130 (103min) fps ∼98%
133 (128min) fps ∼99%
GeForce GTX 870M, 4700MQ
Schenker W504
98 (75min) fps ∼82%
121 (85min) fps ∼91%
124 (88min) fps ∼93%
132 (129min) fps ∼98%
GeForce GTX 780M, 4700MQ
Schenker W503
96 (69min) fps ∼80%
119 (90min) fps ∼89%
121 (87min) fps ∼91%
132 (129min) fps ∼98%
GeForce GTX 770M, 4700MQ
Schenker W503
86 (71min) fps ∼72%
119 (84min) fps ∼89%
122 (88min) fps ∼92%
132 (127min) fps ∼98%
GeForce GTX 860M, 4700MQ
Schenker W504
83 (69min) fps ∼69%
118 (84min) fps ∼89%
126 (91min) fps ∼95%
133 (127min) fps ∼99%
GeForce GTX 850M, 4340M
Schenker M504
71 (58min) fps ∼59%
96 (71min) fps ∼72%
114 (82min) fps ∼86%
132 (121min) fps ∼98%
GeForce GTX 765M, 4700MQ
Schenker W503
67 (55min) fps ∼56%
111 (82min) fps ∼83%
126 (90min) fps ∼95%
132 (128min) fps ∼98%
GeForce GT 750M, 4702MQ
Schenker M503
39 (32min) fps ∼33%
67 (56min) fps ∼50%
104 (73min) fps ∼78%
130 (112min) fps ∼96%
GeForce GT 740M, 4200M
HP Envy 15-j011sg
28 (22min) fps ∼23%
47 (36min) fps ∼35%
81 (63min) fps ∼61%
115 (99min) fps ∼85%
Iris Pro Graphics 5200, 4750HQ, Intel SSD 525 Series SSDMCEAC180B3
SCHENKER S413
23 (20min) fps ∼19%
43 (27min) fps ∼32%
55 (35min) fps ∼41%
80 (54min) fps ∼59%
GeForce GT 720M, 4200M, WDC Scorpio Blue WD10JPVX-22JC3T0
MSI CX61-i572M
20 (0min) fps ∼17%
38 (0min) fps ∼29%
66 (0min) fps ∼50%
55 (0min) fps ∼41%
GeForce GT 630M, 3720QM, Seagate Momentus 7200.5 ST9750420AS
Asus N56VM
15 (13min) fps ∼13%
30 (24min) fps ∼23%
54 (40min) fps ∼41%
83 (71min) fps ∼61%
HD Graphics 4600, 4700MQ
Schenker W503
13 (12min) fps ∼11%
28 (24min) fps ∼21%
54 (36min) fps ∼41%
81 (56min) fps ∼60%
Radeon HD 8650G, A10-5750M, Samsung SSD 470 Series MZ-5PA256/EU
Pumori Test Platform (A10-5750M)
18 (14min) fps ∼15%
29 (21min) fps ∼22%
40 (28min) fps ∼30%
62 (42min) fps ∼46%
HD Graphics 4000, 3720QM
Asus N56VM
12 (12min) fps ∼10%
18 (12min) fps ∼14%
33 (16min) fps ∼25%
55 (26min) fps ∼41%

Test Systems

Four of our test devices stem from Schenker Technologies (mysn.de):

  • W504 (Core i7-4700MQ, 8 GB DDR3, GeForce GTX 860M, GTX 870M, GTX 880M, Radeon R9 M290X)
  • W503 (Core i7-4700MQ, 8 GB DDR3, GeForce GTX 765M, GTX 770M, GTX 780M)
  • M504 (Core i5-4340M, 8 GB DDR3, GeForce GTX 850M)
  • M503 (Core i7-4702MQ, 8 GB DDR3, GeForce GT 750M)

All these notebooks used Windows 7 64-bit. Many thanks to Micron for the 480 GB Crucial M500.

Another test device was provided by Nvidia:

  • HP Envy 15-j011sg (Core i5-4200M, 12 GB DDR3, GeForce GT 740M)

Used GPU drivers: Nvidia 344.11, AMD 14.9, Intel 10.18.10.3907

In addition, we used benchmarks from other notebooks possibly with different drivers.

Overview

Show Restrictions
PosModel< PrevNext >F1 2014
 F1 2014 (2014)
low
1024x768
Ultra Low Preset
med.
1366x768
Medium Preset
high
1920x1080
High Preset
ultra
1920x1080
Ultra Preset
4x MSAA
NVIDIA GeForce GTX 980M SLI
118
118
117.5n2
110n2
AMD Radeon R9 Fury
113
NVIDIA GeForce GTX 980
133
130
127
116
NVIDIA GeForce GTX 980 (Laptop)
117
104
NVIDIA GeForce GTX 970M SLI
118
118
118n2
111.5n2
NVIDIA GeForce GTX 780 Ti
133
131
127
118
NVIDIA GeForce GTX 970
118
118
118
118
AMD Radeon R9 290X
117
117
118
113
NVIDIA GeForce GTX 965M SLI
115
90
NVIDIA GeForce GTX 980M
118.5n2
118n2
118n5
110n5
NVIDIA Quadro M5000M
121
121
122
120
AMD Radeon R9 280X
132
127
123
105
NVIDIA GeForce GTX 960
117
118
118
114
NVIDIA GeForce GTX 970M
114n2
116n3
111.5n8
95.5n8
AMD Radeon R9 M295X
119
100
86
70
NVIDIA Quadro M3000M
122
122
122
120
AMD FirePro W7170M
132
111
95
74
NVIDIA GeForce GTX 880M
132
127
120
102
NVIDIA GeForce GTX 760
132
131
128
111
PosModel< PrevNext >F1 2014
low med. high ultra
NVIDIA GeForce GTX 780M
132
121
119
96
NVIDIA Quadro K5100M
120
119
119
108
NVIDIA GeForce GTX 965M
118n2
116.5n2
109n2
93n2
NVIDIA GeForce GTX 870M
132
124
121
98
NVIDIA GeForce GTX 960M
118.5n2
110n4
108n7
87n7
NVIDIA GeForce GTX 750 Ti
133
130
125
98
NVIDIA Quadro K4100M
133
133
133
92
NVIDIA GeForce GTX 770M
132
122
119
86
NVIDIA GeForce GTX 860M
133
120n2
111n3
83n3
NVIDIA GeForce GTX 950M
116.5n4
99n6
87n7
69n7
NVIDIA GeForce GTX 850M
132n3
113n3
96n3
67n3
NVIDIA Quadro M1000M
133
128
123
84
AMD Radeon R9 M280X
58
47
43
34
NVIDIA GeForce GTX 765M
132
126
111
67
NVIDIA Quadro K3100M
120
119
108
60
AMD Radeon R9 M370X
119
113
84
50
NVIDIA Maxwell GPU Surface Book
117
94
76
49
NVIDIA GeForce 845M
62
48
AMD Radeon R9 M265X
64
37
NVIDIA GeForce GT 750M
130
104
67
39
PosModel< PrevNext >F1 2014
low med. high ultra
NVIDIA GeForce 940MX
99
85
48
29
NVIDIA Quadro K1100M
119
101
55
35
NVIDIA GeForce 940M
101n2
77n2
51n2
29n2
NVIDIA GeForce 840M
102.5n2
78.5n2
58.5n2
33.5n2
AMD Radeon R7 M275DX
64
48
37
30
Intel Iris Pro Graphics 5200
80
55
43
23
NVIDIA GeForce GT 740M
115
81
47
28
NVIDIA GeForce 930M
90
73.5n2
52n2
32n2
NVIDIA GeForce 830M
107n2
80n2
53.5n2
33n2
NVIDIA GeForce 920MX
96
79
46
25
AMD Radeon R7 M260X
70
49
31
23
AMD Radeon R7 M270
93n2
62n2
36n2
23n2
AMD Radeon R7 M265
33
27
23
17
AMD Radeon R7 (Bristol Ridge)
62
41
31
AMD Radeon R7 (Kaveri)
42n2
33.5n2
29.5n2
17n2
AMD Radeon R8 M365DX
39
31
26
20
AMD Radeon R7 M460
100
75
44
25
AMD Radeon R7 M360
49
36
27
19
NVIDIA GeForce 920M
86n2
69n2
40n2
23.5n2
AMD Radeon R8 M445DX
59
42
39
24
PosModel< PrevNext >F1 2014
low med. high ultra
AMD Radeon R7 M260
64n2
28n3
26.5n2
16.5n2
AMD Radeon R7 M340
105
72
41
24
AMD Radeon R6 M340DX
55
37
33
18
Intel HD Graphics 630
101
70
42
23
AMD Radeon R5 (Bristol Ridge)
54
34
Intel UHD Graphics 620
65
45
34
19
Intel HD Graphics 620
60
39
31
16
AMD Radeon R6 (Carrizo)
43
33
25
15
Intel HD Graphics 5600
74
49
25
15
AMD Radeon HD 8670M
56
37
31
19
AMD Radeon R6 M255DX
37
29
22
15
AMD Radeon HD 8650G
62
40
29
18
NVIDIA GeForce GT 630M
83
54
30
15
AMD Radeon R5 M335
83
56
31
12.5
AMD Radeon R5 M330
72
40
20
16
AMD Radeon R5 M430
75
52
AMD Radeon R5 M255
64
42
30
20
NVIDIA GeForce 910M
41
32
24
16
NVIDIA GeForce 820M
92.5n2
64.5n2
38
21
Intel HD Graphics 520
54.5n2
41n2
24n2
14.25n2
PosModel< PrevNext >F1 2014
low med. high ultra
Intel Iris Graphics 6100
59n2
37.5n2
25n2
16n2
NVIDIA GeForce GT 720M
55
66
38
20
AMD Radeon R5 M240
48n2
34n2
25
AMD Radeon R5 M230
77
52
29
16
AMD Radeon R5 (Stoney Ridge)
39
30
Intel HD Graphics 6000
55
37
21
13
Intel Iris Graphics 5100
44.5n2
29.5n2
18n2
14
Intel HD Graphics 4600
61.5n2
42n2
23.5n2
12.5n2
Intel HD Graphics 5500
47n7
32n7
22n7
13n7
Intel HD Graphics 615
55
34
AMD Radeon R5 (Kaveri)
34
25
Intel HD Graphics 5000
51
35
20
13
Intel HD Graphics 515
41n2
27.5n2
16n2
12.5
Intel HD Graphics 610
61
42
Intel HD Graphics 4400
44.5n2
28.5n2
18
AMD Radeon HD 8610G
33
23
16
Intel HD Graphics 510
72
47
Intel UHD Graphics 605
31
20
13
Intel HD Graphics 505
28
14
Intel HD Graphics 5300
34n3
20n3
13n3
12
PosModel< PrevNext >F1 2014
low med. high ultra
Intel HD Graphics 4000
46.5n2
28n2
17n2
12.25n2
AMD Radeon R4 (Stoney Ridge)
30
26
AMD Radeon R5 (Beema/Carrizo-L)
34
25
19
AMD Radeon R4 (Beema)
35.5n2
26n2
19
12
AMD Radeon R3 (Mullins/Beema)
33
24
17
AMD Radeon R2 (Stoney Ridge)
28
18
Intel HD Graphics (Broadwell)
34
24
Intel HD Graphics 4200
16
12
12
AMD Radeon HD 8350G
31
22
17
12
AMD Radeon HD 8330
28
20
Intel HD Graphics 500
22
16
Intel HD Graphics 405 (Braswell)
28
17
Intel HD Graphics (Braswell)
13n2
12.25n2
Intel HD Graphics 400 (Braswell)
27
16
Intel HD Graphics (Haswell)
31
20
AMD Radeon R2 (Mullins/Beema/Carrizo-L)
37
26
Intel HD Graphics (Cherry Trail)
16
12
Intel HD Graphics (Bay Trail)
13n2
12
(-) * Smaller values are better. / n123 Number of benchmarks for this median value / * Approximate position


Legend
5Stutters – This game is very likely to stutter and have poor frame rates. Based on all known benchmarks using the specified graphical settings, average frame rates are expected to fall below 25fps
May Stutter – This graphics card has not been explicitly tested on this game. Based on interpolated information from surrounding graphics cards of similar performance levels, stutters and poor frame rates are expected.
30Fluent – Based on all known benchmarks using the specified graphical settings, this game should run at or above 25fps
40Fluent – Based on all known benchmarks using the specified graphical settings, this game should run at or above 35fps
60Fluent – Based on all known benchmarks using the specified graphical settings, this game should run at or above 58fps
May Run Fluently – This graphics card has not been explicitly tested on this game. Based on interpolated information from surrounding graphics cards of similar performance levels, fluent frame rates are expected.
?Uncertain – This graphics card experienced unexpected performance issues during testing for this game. A slower card may be able to achieve better and more consistent frame rates than this particular GPU running the same benchmark scene.
Uncertain – This graphics card has not been explicitly tested on this game and no reliable interpolation can be made based on the performances of surrounding cards of the same class or family.
The value in the fields displays the average frame rate of all values in the database. Move your cursor over the value to see individual results.
static version load dynamic
Loading Comments
Comment on this article
Please share our article, every link counts!
Florian Glaser, 2014-10-24 (Update: 2021-05-18)