Notebook reviews with NVIDIA GeForce GT 740M graphics card
Review Asus AsusPro P750LB-T2057G Notebook
Gigantic ultrabook. The Asus P750LB relies on power- and space-efficient ultrabook components. How well will this concept work out when combined with an extraordinarily large 17.3-inch display? Can it compete against its competitors that rely on standard, higher-powered Intel chips?
Intel Core i3-4010U, NVIDIA GeForce GT 740M, 17.3", 2.7 kgReview Asus VivoBook S451LB Notebook
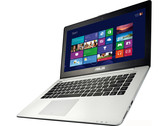
Lookalike. Asus introduces a new 14-inch laptop with a touchscreen, upper-range configuration, and stylish looks dubbed VivoBook S451LB-CA072H. The bundle made a good impression in the test, though we expected more from the screen and storage device.
Intel Core i5-4200U, NVIDIA GeForce GT 740M, 14", 2.2 kgReview Clevo W650SH (Wortmann Terra Mobile 1548) Barebones Notebook
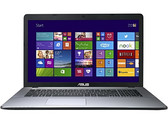
Maintenance-friendly all-rounder. The Terra Mobile 1548 is Wortmann's promising attempt to challenge the all-purpose notebooks of the big manufacturers. In addition to a very bright Full HD display and a GPU that is fit for games, the computer offers a lot of memory space. A treat: The computer can be fitted with a 3G module.
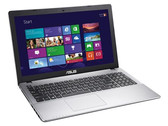
Intel Core i3-4000M, NVIDIA GeForce GT 740M, 15.6", 2.5 kgReview Asus X550LB-NH52 Notebook
Non-touchscreen multimedia. The Asus X550LB is a 15.6-inch gaming-capable notebook designed for everyday multitasking. A Haswell-generation CPU and GeForce GPU are paired up with a non-touch, standard HD-resolution display. How well the combo works is the subject of our review.
Intel Core i5-4200U, NVIDIA GeForce GT 740M, 15.6", 2.3 kgReview Lenovo ThinkPad Edge E540 20C6003AGE Notebook
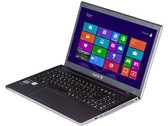
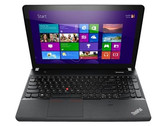
Workhorse. Lenovo updated its devices with the latest hardware but did not change the concept of the cheap Edge series. The company offers many different models and our review will reveal whether the surcharge for the top model is justified.
Intel Core i7-4702MQ, NVIDIA GeForce GT 740M, 15.6", 2.4 kgHP Pavilion 15-n213eg: Intel Core i5-4200U, 15.60", 2.3 kg
Review » Review Update HP Pavilion 15-n213eg Notebook
Lenovo IdeaPad Z710 59393211: Intel Core i5-4200M, 17.30", 2.9 kg
Review » Review Lenovo IdeaPad Z710 59393211 Notebook
HP Envy 15-j011sg: Intel Core i5-4200M, 15.60", 2.3 kg
Review » Review HP Envy 15-j011sg Notebook
Toshiba Satellite M50-A-11L: Intel Core i5-4200U, 15.60", 2.2 kg
Review » Review Toshiba Satellite M50-A-11L Notebook
Sony Vaio SV-F1521V6EB: Intel Core i7-3537U, 15.50", 2.5 kg
Review » Review Sony Vaio Fit SV-F1521V6EB Notebook
Dell Latitude 3440: Intel Core i5-4200U, 14.00", 2.1 kg
Review » Review Dell Latitude 3440 Notebook
MSI GP60-i740M245FD: Intel Core i7-4700MQ, 15.60", 2.4 kg
Review » Review MSI GP60-i740M245FD Notebook
HP Pavilion TouchSmart 15-n010sg: Intel Core i7-4500U, 15.60", 2.3 kg
Review » Review HP Pavilion TouchSmart 15-n010sg Notebook
Lenovo IdeaPad Z510: Intel Core i5-4200M, 15.60", 2.2 kg
Review » Review Lenovo IdeaPad Z510 Notebook
Toshiba Satellite S70-A-10F: Intel Core i7-4700MQ, 17.30", 2.8 kg
Review » Review Toshiba Satellite S70-A-10F Notebook
Toshiba Satellite C55-A-1D5: Intel Core i5-3230M, 15.60", 2.3 kg
Review » Review Toshiba Satellite C55-A-1D5 Notebook
Toshiba Satellite L70-A-10T: Intel Core i7-4700MQ, 17.30", 2.8 kg
Review » Review Toshiba Satellite L70-A-10T Notebook
Toshiba L50-A-10Q: Intel Core i7-4700MQ, 15.60", 2.3 kg
Review » Review Toshiba Satellite L50-A-10Q Notebook
MSI CX70-i740M281W7H: Intel Core i7-4702MQ, 17.30", 3 kg
Review » Review MSI CX70-i740M281W7H Notebook
HP Envy 17t-j000: Intel Core i7-4700MQ, 17.30", 2.9 kg
Review » Review HP Envy 17t-j003 Notebook
Toshiba Satellite S50-A-10H: Intel Core i7-4700MQ, 15.60", 2.4 kg
Review » Review Toshiba Satellite S50-A-10H Notebook
Asus VivoBook V551LB-DB71T: Intel Core i7-4500U, 15.60", 2.5 kg
Review » Review Asus VivoBook V551LB-DB71T Ultrabook
Asus VivoBook S551LB-CJ026H : Intel Core i7-4500U, 15.60", 2.5 kg
Review » Review Asus VivoBook S551LB-CJ026H Ultrabook
Asus Pro P56CB-XO193G Ultrabook: Intel Core i3-3217U, 15.60", 2.3 kg
Review » Review AsusPro P56CB-XO193G Ultrabook
Nexoc M512: Intel Core i7-3540M, 15.60", 2.5 kg
Review » Review Nexoc M512 (Clevo W650EH) Notebook
Asus N56VB-S4050H: Intel Core i7-3630QM, 15.60", 2.7 kg
Review » Review Asus N56VB-S4050H Notebook
Asus A56CB-XX053H: Intel Core i3-3217U, 15.60", 2.3 kg
Review » Review Asus A56CB-XX053H Notebook
Lenovo IdeaPad Z510: Intel Core i5-4200M, 15.60", 2.2 kg
External Review » Lenovo IdeaPad Z510
Toshiba Satellite L50-A-1CE: Intel Core i5-4200M, 15.60", 2.4 kg
External Review » Toshiba Satellite L50-A-1CE
Lenovo ThinkPad Edge E540 20C60071BM: Intel Core i5-4200M, 15.60", 2.5 kg
External Review » Lenovo ThinkPad Edge E540 20C60071BM
Asus K550LB-XX182D: Intel Core i5-4200U, 15.60", 2.3 kg
External Review » Asus K550LB-XX182D
Acer Aspire E1-570G: Intel Core i3-3217U, 15.60", 2.3 kg
External Review » Acer Aspire E1-570G
Toshiba Satellite U50-A-L4M: Intel Core i5-4200U, 15.60", 2.1 kg
External Review » Toshiba Satellite U50-A-L4M
Lenovo Ideapad Z500A: Intel Core i5-3230M, 15.60", 2.2 kg
External Review » Lenovo Ideapad Z500A
Asus K56CB: Intel Pentium 2117U, 15.60", 2.3 kg
External Review » Asus K56CB
Lenovo Ideapad Z510-59395102: Intel Core i3-4000M, 15.60", 2.2 kg
External Review » Lenovo Ideapad Z510-59395102
Lenovo ThinkPad Edge E540-20C6006JGE: Intel Core i5-4200U, 15.60", 2.5 kg
External Review » Lenovo ThinkPad Edge E540-20C6006JGE
HP Pavilion TouchSmart 15-n232sa: Intel Core i5-4200U, 15.60", 2.5 kg
External Review » HP Pavilion TouchSmart 15-n232sa
Lenovo Thinkpad Edge E540 20C6003AGE: Intel Core i7-4702MQ, 15.60", 2.4 kg
External Review » Lenovo Thinkpad Edge E540 20C6003AGE
Asus X750JB: Intel Core i7-4700HQ, 17.30", 2.8 kg
External Review » Asus X750JB
Toshiba Satellite M50-A-11C: Intel Core i5-4200U, 15.60", 2.2 kg
External Review » Toshiba Satellite M50-A-11C
Lenovo Essential M5400: Intel Core i5-4200M, 15.60", 2.3 kg
External Review » Lenovo Essential M5400
Lenovo ThinkPad Edge E531-N4I9WGE: Intel Core i3-3110M, 15.60", 2.5 kg
External Review » Lenovo ThinkPad Edge E531-N4I9WGE
HP Pavilion 15-n213eg: Intel Core i5-4200U, 15.60", 2.3 kg
External Review » HP Pavilion 15-n213eg
Sony Vaio SV-F1521V6EB: Intel Core i7-3537U, 15.50", 2.5 kg
External Review » Sony Vaio SV-F1521V6EB
Toshiba Satellite M50T-A-10G: Intel Core i5-4200U, 15.60", 2.3 kg
External Review » Toshiba Satellite M50T-A-10G
Sony Vaio SV-F1521K1EB: Intel Core i3-3227U, 15.60", 2.3 kg
External Review » Sony Vaio SV-F1521K1EB
Toshiba Satellite M50-A-11L: Intel Core i5-4200U, 15.60", 2.2 kg
External Review » Toshiba Satellite M50-A-11L
MSI Adora24G 2NC-001EU: Intel Core i5-4200M, 23.60", 9.2 kg
External Review » MSI Adora24G 2NC-001EU
Asus Pro P56CB-XO193G Ultrabook: Intel Core i3-3217U, 15.60", 2.3 kg
External Review » Asus Pro P56CB-XO193G Ultrabook
Asus X550VB-XX047H: Intel Core i5-3230M, 15.60", 2.3 kg
External Review » Asus X550VB-XX047H
HP Pavilion 15-n007sg: Intel Core i5-4200U, 15.60", 2.3 kg
External Review » HP Pavilion 15-n007sg
Sony Vaio SV-F1521S2EB: Intel Core i5-3337U, 15.60", 2.7 kg
External Review » Sony Vaio SV-F1521S2EB
Sony Vaio SV-F1521C6EW: Intel Pentium 2117U, 15.60", 2.5 kg
External Review » Sony Vaio SV-F1521C6EW
Asus X550VB-XO003D: Intel Core i5-3230M, 15.60", 2.3 kg
External Review » Asus X550VB-XO003D
Toshiba Satellite S50-AST3GX1: Intel Core i7-4700MQ, 15.60", 2.4 kg
External Review » Toshiba Satellite S50-AST3GX1
HP Envy 15-j001tx: Intel Core i7-4700MQ, 15.60", 2.2 kg
External Review » HP Envy 15-j001tx
Toshiba Satellite P50T-A-125: Intel Core i7-4700MQ, 15.60", 2.6 kg
External Review » Toshiba Satellite P50T-A-125
Toshiba Satellite P50-A-K9M: Intel Core i7-4500U, 15.60", 2.2 kg
External Review » Toshiba Satellite P50-A-K9M
Toshiba Satellite M50-A-110: Intel Core i5-4200U, 15.60", 2.2 kg
External Review » Toshiba Satellite M50-A-110
Dell Latitude 3440: Intel Core i5-4200U, 14.00", 2.1 kg
External Review » Dell Latitude 3440
HP Envy TouchSmart 15t-j100: Intel Core i7-4700MQ, 15.60", 2.5 kg
External Review » HP Envy TouchSmart 15t-j100
Toshiba Satellite S70t-A-108: Intel Core i7-4700MQ, 17.30", 3.1 kg
External Review » Toshiba Satellite S70t-A-108
Toshiba Satellite M50-A-108: Intel Core i5-4200U, 15.60", 2.1 kg
External Review » Toshiba Satellite M50-A-108
Asus VivoBook S551LB-CJ081H: Intel Core i7-4500U, 15.60", 2.5 kg
External Review » Asus VivoBook S551LB-CJ081H
HP Pavilion 15-n020tx: Intel Core i5-4200U, 15.60", 2.4 kg
External Review » HP Pavilion 15-n020tx
Dell Vostro 5470: Intel Core i3-4010U, 14.00", 1.8 kg
External Review » Dell Vostro 5470
Toshiba L50-A-10Q: Intel Core i7-4700MQ, 15.60", 2.3 kg
External Review » Toshiba L50-A-10Q
Toshiba Satellite L50-A-11X: Intel Core i7-3630QM, 15.60", 2.3 kg
External Review » Toshiba Satellite L50-A-11X
HP Envy TouchSmart 15-j035tx: Intel Core i7-4700MQ, 15.60", 2.6 kg
External Review » HP Envy TouchSmart 15-j035tx
Acer Aspire V5-472G-53334G50app: Intel Core i5-3337U, 14.00", 1.8 kg
External Review » Acer Aspire V5-472G-53334G50app
HP Envy 15-j059nr: Intel Core i7-4700MQ, 15.60", 2.2 kg
External Review » HP Envy 15-j059nr
HP Envy 14-k008tx Sleekbook: Intel Core i5-4200U, 14.00", 1.7 kg
External Review » HP Envy 14-k008tx Sleekbook
Dell Inspiron 14R-5437: Intel Core i5-4200U, 14.00", 2.8 kg
External Review » Dell Inspiron 14R-5437
HP Envy TouchSmart 14-k031tx: Intel Core i5-4200U, 14.00", 2 kg
External Review » HP Envy TouchSmart 14-k031tx
Asus X75VB-TY045: Intel Core i5-3320M, 17.30", 3.1 kg
External Review » Asus X75VB-TY045
Asus VivoBook S551LB-CJ025H: Intel Core i5-4200U, 15.60", 2.5 kg
External Review » Asus VivoBook S551LB-CJ025H
Toshiba Satellite C55-A-1D5: Intel Core i5-3230M, 15.60", 2.3 kg
External Review » Toshiba Satellite C55-A-1D5
HP Envy TouchSmart 15-j091ef: Intel Core i7-4700MQ, 15.60", 2.6 kg
External Review » HP Envy TouchSmart 15-j091ef
Toshiba Satellite P50t-A-10U: Intel Core i7-4700MQ, 15.60", 2.6 kg
External Review » Toshiba Satellite P50t-A-10U
Toshiba Satellite S50t-A-118: Intel Core i7-4700MQ, 15.60", 2.6 kg
External Review » Toshiba Satellite S50t-A-118
Lenovo ThinkPad Edge E531-68853SG: Intel Core i5-3230M, 15.60", 2.4 kg
External Review » Lenovo ThinkPad Edge E531-68853SG
Toshiba Satellite S50-A-10H: Intel Core i7-4700MQ, 15.60", 2.4 kg
External Review » Toshiba Satellite S50-A-10H
Sony Vaio SV-F1521F4EB: Intel Core i5-3337U, 15.60", 2.7 kg
External Review » Sony Vaio SV-F1521F4EB
Toshiba Satellite L70-A-11C: Intel Core i7-4700MQ, 17.30", 2.8 kg
External Review » Toshiba Satellite L70-A-11C
Asus K56CB-X0319H: Intel Core i3-3217U, 15.60", 2.3 kg
External Review » Asus K56CB-X0319H
Asus S56CB-XX372H: Intel Core i7-3537U, 15.60", 2.3 kg
External Review » Asus S56CB-XX372H
HP Envy TouchSmart 15-j003sg: Intel Core i7-4700MQ, 15.60", 2.6 kg
External Review » HP Envy TouchSmart 15-j003sg
Lenovo ThinkPad Edge E531-N4I7APB: Intel Core i7-3632QM, 15.60", 2.5 kg
External Review » Lenovo ThinkPad Edge E531-N4I7APB
Asus VivoBook S551LB-CJ024H: Intel Core i3-4010U, 15.60", 2.4 kg
External Review » Asus VivoBook S551LB-CJ024H
HP Envy TouchSmart 15-j004ea: Intel Core i7-4700MQ, 15.60", 2.6 kg
External Review » HP Envy TouchSmart 15-j004ea
Asus VivoBook S551LB-CJ005H: Intel Core i5-4200M, 15.60", 2.4 kg
External Review » Asus VivoBook S551LB-CJ005H
Lenovo ThinkPad Edge E531-N4I29GE: Intel Core i5-3230M, 15.60", 2.5 kg
External Review » Lenovo ThinkPad Edge E531-N4I29GE
Asus VivoBook S550CB-CJ050H: Intel Core i5-3317U, 15.60", 2.7 kg
External Review » Asus VivoBook S550CB-CJ050H
Sony Vaio SV-F1521H1EW: Intel Core i3-3227U, 15.60", 2.5 kg
External Review » Sony Vaio SV-F1521H1EW
Asus VivoBook V551LB-DB71T: Intel Core i7-4500U, 15.60", 2.5 kg
External Review » Asus VivoBook V551LB-DB71T
Toshiba Satellite S55t-A5277: Intel Core i7-4700MQ, 15.60", 2.4 kg
External Review » Toshiba Satellite S55t-A5277
Asus K56CB-XX102H: Intel Core i5-3317U, 15.60", 2.3 kg
External Review » Asus K56CB-XX102H
Sony Vaio SV-F1421V1EW: Intel Core i3-3227U, 14.00", 2.4 kg
External Review » Sony Vaio SV-F1421V1EW
Sony Vaio SV-F1521Z1EB: Intel Core i7-3537U, 15.50", 2.5 kg
External Review » Sony Vaio SV-F1521Z1EB
Asus VivoBook S551LB-CJ045H: Intel Core i7-4500U, 15.60", 2.4 kg
External Review » Asus VivoBook S551LB-CJ045H
HP Envy 17t-j000: Intel Core i7-4700MQ, 17.30", 2.9 kg
External Review » HP Envy 17t-j000
Asus K56CB-X0100H: Intel Core i7-3537U, 15.60", 2.3 kg
External Review » Asus K56CB-X0100H
Asus VivoBook S550CB-CJ084H: Intel Core i7-3517U, 15.60", 2.5 kg
External Review » Asus VivoBook S550CB-CJ084H
Toshiba Satellite P70-ABT2G22: Intel Core i7-4700MQ, 17.30", 3 kg
External Review » Toshiba Satellite P70-ABT2G22
Medion Akoya P6640-MD99220: Intel Core i3-3120M, 15.60", 2.6 kg
External Review » Medion Akoya P6640-MD99220