Notebook reviews with NVIDIA GeForce RTX 5090 Laptop graphics card
MSI Stealth 18 HX AI laptop review: Most portable 18-inch gamer yet
The Stealth 18 takes almost everything we love about the Titan 18 including a Core Ultra 9 processor, GeForce RTX 5090 graphics, and a 4K UHD mini-LED display a...
Intel Core Ultra 9 275HX | NVIDIA GeForce RTX 5090 Laptop | 18.00" | 3 kgAsus ProArt P16 5090 review - Tandem OLED and RTX 5090 up against the Apple MacBook Pro 16
Asus is on the upgrade march, and its ProArt P16 is now available with an extremely bright tandem OLED panel and the mobile GeForce RTX 5090 with 24 GB of VRAM....
AMD Ryzen AI 9 HX 370 | NVIDIA GeForce RTX 5090 Laptop | 16.00" | 2 kgLenovo Legion 9 18 with RTX 5090 Review: The most powerful gaming laptop on the market
Lenovo has effortlessly conquered the 18-inch gaming laptop segment with the Legion 9 18. After recently testing the RTX 5080 version, we now take a look at the...
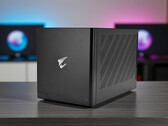
Intel Core Ultra 9 275HX | NVIDIA GeForce RTX 5090 Laptop | 18.00" | 3.5 kgLaptop power boost: Gigabyte Aorus RTX 5090 AI Box - External Nvidia GeForce RTX 5090 GPU via Thunderbolt 5 review
With the AORUS RTX 5090 AI Box, Gigabyte presents an external GPU solution based on the fastest consumer graphics card currently available. This makes it easy t...
Intel Core Ultra 9 275HX | NVIDIA GeForce RTX 5090 Laptop | 18.00"Schenker Key 18 Pro E25 review: High-end workstation with RTX 5090 and 256 GB RAM
With the Key 18 Pro, Schenker has a mobile workstation on offer that is aimed at enthusiasts and can be configured extensively. We tested the top model with the...
Intel Core Ultra 9 275HX | NVIDIA GeForce RTX 5090 Laptop | 18.00" | 4.1 kgRazer Blade 18 2025 RTX 5090 Laptop: Intel Core Ultra 9 275HX, 18.00", 3.2 kg
Review » Extremely fast, but comparatively quiet gamer - Razer Blade 18 2025 RTX 5090 laptop review
Alienware 18 Area-51: Intel Core Ultra 9 275HX, 18.00", 4.2 kg
Review » Alienware 18 Area-51 laptop review: Performance above all else
MSI Titan 18 HX AI A2XWJG: Intel Core Ultra 9 285HX, 18.00", 3.6 kg
Review » MSI Titan 18 HX AI A2XWJG Review: No-holds-barred Core Ultra 9 285HX and 175 W RTX 5090 Laptop performance
Aorus MASTER 16 AM6H: Intel Core Ultra 9 275HX, 16.00", 2.5 kg
Review » Competing against ROG, Legion and co with an RTX 5090 and 240 Hz OLED - Gigabyte Aorus Master 16 gaming laptop review
Medion Erazer Beast 16 X1 Ultimate: Intel Core Ultra 9 275HX, 16.00", 2.8 kg
Review » Medion Erazer Beast 16 X1 laptop review: RTX 5090 gamer with optional water cooling
Schenker XMG Neo 16 A25 5090: AMD Ryzen 9 9955HX3D, 16.00", 2.9 kg
Review » AMD Ryzen 9 9955HX3D and RTX 5090 Laptop for maximum gaming performance - XMG Neo 16 A25 review
Tuxedo Stellaris 16 Gen7 Engineering Sample: AMD Ryzen 9 9955HX3D
Review » AMD is the gaming leader with its Fire Range HX3D - Ryzen 9 9955HX3D vs. Intel Core Ultra 275HX review
Schenker XMG Neo 16 E25 RTX 5090 Laptop: Intel Core Ultra 9 275HX, 16.00", 2.9 kg
Review » The fastest gaming laptop is now even better thanks to 300 Hz mini LED - XMG Neo 16 E25 RTX 5090 laptop review
Asus ROG Strix Scar 16 2025: Intel Core Ultra 9 275HX, 16.00", 2.8 kg
Review » The RTX 5090 Laptop and mini LED inside a gaming laptop - Asus ROG Strix SCAR 16 2025 review
HP Omen Max 16 ah000: Intel Core Ultra 9 275HX, 16.00", 2.8 kg
Review » HP Omen Max 16 laptop review: Super fast but a little bit too hot
Aorus Master 18 AM8H: Intel Core Ultra 9 275HX, 18.00", 3.4 kg
Review » Aorus Master 18 gaming laptop review: The RTX 5090 takes its toll
Asus ROG Zephyrus G16 GU605CX: Intel Core Ultra 9 285H, 16.00", 1.9 kg
Review » The slimmest gaming notebooks with the RTX 5090 Laptop - Asus ROG Zephyrus G16 vs. Razer Blade 16
Razer Blade 16 2025 RTX 5090: AMD Ryzen AI 9 HX 370, 16.00", 2.1 kg
Review » The slimmest gaming notebooks with the RTX 5090 Laptop - Asus ROG Zephyrus G16 vs. Razer Blade 16
Asus ROG Zephyrus G16 GU605CX: Intel Core Ultra 9 285H, 16.00", 1.9 kg
Review » A slim gaming laptop now with an RTX 5090 and 64 GB of RAM - Asus ROG Zephyrus G16 2025 review
Asus Strix Scar 18 G835LX: Intel Core Ultra 9 275HX, 18.00", 3.3 kg
Review » AMD Ryzen 9 9955HX vs. Intel Core Ultra 9 275HX Analysis: The battle for the fastest gaming CPU
Schenker Neo 16 A25 5090 Engineering Sample: AMD Ryzen 9 9955HX
Review » AMD Ryzen 9 9955HX vs. Intel Core Ultra 9 275HX Analysis: The battle for the fastest gaming CPU
Asus Strix Scar 18 G835LX: Intel Core Ultra 9 275HX, 18.00", 3.3 kg
Review » The 18-inch gamer with great mini LED and an RTX 5090 Laptop - Asus Strix SCAR 18 G835LX review
Schenker Neo 16 A25 5090 Engineering Sample: AMD Ryzen 9 9955HX
Review » XMG Neo 16 2025 Preview - The fastest gaming notebook now with AMD, RTX 5000 and 300 Hz Mini-LED
Razer Blade 16 2025 RTX 5090: AMD Ryzen AI 9 HX 370, 16.00", 2.1 kg
Review » Razer Blade 16 2025 review - Gaming laptop now with GeForce RTX 5090 Laptop and an even slimmer case
Review » Nvidia GeForce RTX 5090 Laptop Analysis - Faster, but there is more to come
Schenker Neo 16 A25 5090 Engineering Sample: AMD Ryzen 9 9955HX
Review » Nvidia GeForce RTX 5090 Laptop Analysis - Faster, but there is more to come
MSI Raider 18 HX AI A2XWJG: Intel Core Ultra 9 285HX, 18.00", 3.6 kg
External Review » MSI Raider 18 HX AI A2XWJG
Nubia RedMagic Titan 16 Pro 2026: Intel Core Ultra 9 275HX, 16.00", 3.4 kg
External Review » Nubia RedMagic Titan 16 Pro 2026
MSI Vector 17 HX AI A2XWJG: Intel Core Ultra 9 275HX, 17.00", 3 kg
External Review » MSI Vector 17 HX AI A2XWJG
Asus ProArt P16 H7606WX: AMD Ryzen AI 9 HX 370, 16.00", 1.9 kg
External Review » Asus ProArt P16 H7606WX
MSI Stealth 18 HX AI A2XWJG: Intel Core Ultra 9 275HX, 18.00", 2.9 kg
External Review » MSI Stealth 18 HX AI A2XWJG
MSI Raider A18 HX A9WJG: AMD Ryzen 9 9955HX3D, 18.00", 3.6 kg
External Review » MSI Raider A18 HX A9WJG
Acer Predator Helios 16 AI PH16-73: Intel Core Ultra 9 275HX, 16.00", 2.7 kg
External Review » Acer Predator Helios 16 AI PH16-73
Lenovo Legion 9 18IAX10: Intel Core Ultra 9 275HX, 18.00", 3.5 kg
External Review » Lenovo Legion 9 18IAX10
Acer Predator Helios 18 AI PH18-73: Intel Core Ultra 9 275HX, 18.00", 3.2 kg
External Review » Acer Predator Helios 18 AI PH18-73
Razer Blade 18 2025 RTX 5090 Laptop: Intel Core Ultra 9 275HX, 18.00", 3.2 kg
External Review » Razer Blade 18 2025 RTX 5090 Laptop
Medion Erazer Beast 16 X1 Ultimate: Intel Core Ultra 9 275HX, 16.00", 2.8 kg
External Review » Medion Erazer Beast 16 X1 Ultimate
Lenovo Legion Pro 7 16IAX10H, RTX 5090: Intel Core Ultra 9 275HX, 16.00", 2.3 kg
External Review » Lenovo Legion Pro 7 16IAX10H, RTX 5090
HP Omen Max 16 ah000: Intel Core Ultra 9 275HX, 16.00", 2.8 kg
External Review » HP Omen Max 16 ah000
Asus ROG Zephyrus G16 GU605CX: Intel Core Ultra 9 285H, 16.00", 1.9 kg
External Review » Asus ROG Zephyrus G16 GU605CX
Asus ROG Strix Scar 16 2025: Intel Core Ultra 9 275HX, 16.00", 2.8 kg
External Review » Asus ROG Strix Scar 16 2025
Alienware 18 Area-51: Intel Core Ultra 9 275HX, 18.00", 4.2 kg
External Review » Alienware 18 Area-51
Asus Strix Scar 18 G835LX: Intel Core Ultra 9 275HX, 18.00", 3.3 kg
External Review » Asus Strix Scar 18 G835LX
MSI Titan 18 HX AI A2XWJG: Intel Core Ultra 9 285HX, 18.00", 3.6 kg
External Review » MSI Titan 18 HX AI A2XWJG
Aorus MASTER 16 AM6H: Intel Core Ultra 9 275HX, 16.00", 2.5 kg
External Review » Aorus MASTER 16 AM6H
Aorus Master 18 AM8H: Intel Core Ultra 9 275HX, 18.00", 3.4 kg
External Review » Aorus Master 18 AM8H
Razer Blade 16 2025 RTX 5090: AMD Ryzen AI 9 HX 370, 16.00", 2.1 kg
External Review » Razer Blade 16 2025 RTX 5090
MSI Stealth 18 HX AI A2XW: Intel Core Ultra 9 275HX, 18.00", 3 kg
» Super loud Cooler Boost mode on MSI Stealth 18 HX isn't necessary for most gaming scenarios
» MSI Stealth 18 HX or Razer Blade 18: Thinner and lighter isn't always better
» MSI Stealth 18 HX 280 W AC adapter reaches almost 70 C to be one of the warmest we've seen
Asus ProArt P16 RTX 5090: AMD Ryzen AI 9 HX 370, 16.00", 2 kg
» Asus vs. Lenovo: Who has the best tandem OLED display?
» The new Asus ProArt P16 with the Tandem OLED is the best multimedia laptop you can buy right now
Asus ROG Xbox Ally X: AMD Ryzen Z2 Extreme
» Weak Asus ROG Xbox Ally X supply leaks suggesting Microsoft doesn't have lot of confidence in handheld console
Asus ProArt P16 RTX 5090: AMD Ryzen AI 9 HX 370, 16.00", 2 kg
» Asus ProArt P16 Preview - Now with RTX 5090 Laptop and Lumina Pro OLED
Schenker XMG Neo 16 E25 RTX 5090 Laptop: Intel Core Ultra 9 275HX, 16.00", 2.9 kg
» XMG's NEO 16 & PRO 16 do not get G-Sync and Advanced Optimus support after all
Schenker Key 18 Pro M25 RTX 5090: Intel Core Ultra 9 275HX, 18.00", 4.1 kg
» Schenker's mobile workstation Key 18 Pro offers high-end features and excellent maintenance options
Razer Blade 18 2025 RTX 5090 Laptop: Intel Core Ultra 9 275HX, 18.00", 3.2 kg
» Do you really need 440 Hz? Why the new dual-mode display of the Razer Blade 18 is a downgrade for many users
» Razer's new Blade 18 is 1 kg lighter than the Alienware 18, but just as fast and even a bit quieter
Alienware 18 Area-51: Intel Core Ultra 9 275HX, 18.00", 4.2 kg
» Alienware 18 Area-51 is missing one key feature against the MSI Titan 18 HX
» Alienware 18 Area-51 outperforms nearly all other gaming laptops and we have the benchmarks to prove it
Aorus MASTER 16 AM6H: Intel Core Ultra 9 275HX, 16.00", 2.5 kg
» RTX 5090 laptops in comparison: Where does the Gigabyte Aorus Master 16 rank?
Schenker XMG Neo 16 A25 5090: AMD Ryzen 9 9955HX3D, 16.00", 2.9 kg
» Intel is beaten - AMD's Ryzen 9 9955HX3D with 3D V-Cache is the best choice for gaming
Schenker XMG Neo 16 E25 RTX 5090 Laptop: Intel Core Ultra 9 275HX, 16.00", 2.9 kg
» XMG Neo 16 E25: Still one of the best gaming laptops but Advanced Optimus/G-Sync is lacking
Asus Strix Scar 18 G835LX: Intel Core Ultra 9 275HX, 18.00", 3.3 kg
» Asus ROG Strix Scar 18 (2025) with RTX 5090, mini-LED screen and Thunderbolt 5 now available for preorder
Razer Blade 16 2025 RTX 5090: AMD Ryzen AI 9 HX 370, 16.00", 2.1 kg
» The 2025 Razer Blade 16 with the RTX 5090 Laptop looks like a downgrade