The RTX 5090 Laptop and mini LED inside a gaming laptop - Asus ROG Strix SCAR 16 2025 review
Asus' fastest 16-incher.
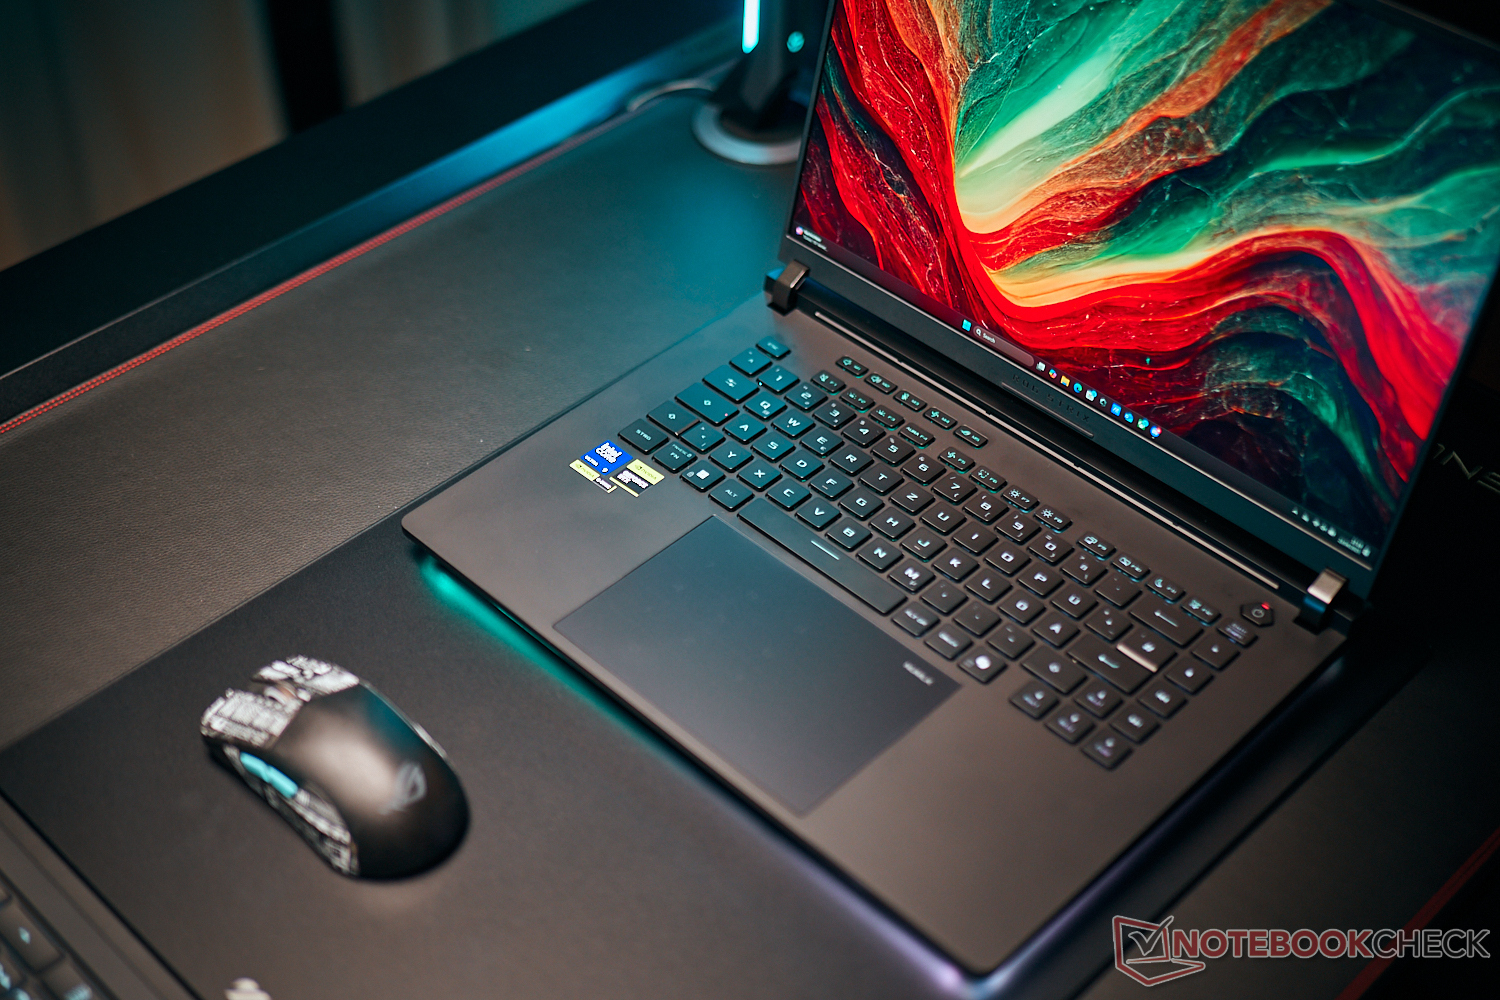
The ROG Strix SCAR 16 is Asus' 16-inch gaming flagship fitted with the Core Ultra 275HX, the GeForce RTX 5090 Laptop with 24 GB VRAM and a 240 Hz mini LED display.Andreas Osthoff, 👁 Andreas Osthoff (translated by Daisy Dickson) Published 🇩🇪 🇫🇷 ...
Verdict - Full performance and a great display
As with the larger Strix SCAR 18, the gaming performance of the smaller Strix SCAR 16 is excellent, especially as there is no loss of performance compared to the 18-inch model. Even so, its performance advantage over the RTX 5080 Laptop isn't huge, especially in the laptop's native WQHD resolution, and if you can't benefit from its larger VRAM in any other way, then we recommend going for the configuration with the RTX 5080 Laptop. The device's mini LED display is impressive, offers extensive features and operating modes, achieved very good values during our test and features precise color profiles straight out of the box.
The quality of its case is good and it has extensive lighting elements, but unfortunately, it's made entirely of plastic and its black surfaces are very susceptible to dirt marks. The laptop's maintenance options are good and you can access its components easily—plus, it already has Thunderbolt 5. Most of the ports are on the left side of the device and none are on the back.
All-in-all, the new ROG Strix SCAR 16 is an impressive gaming laptop with powerful components. Compared to the regular ROG Strix G16, the Strix SCAR 16 benefits above all from its mini LED panel—but this comes at a price of around $550 more.
Pros
Cons
Price and availability
At the time of writing, the ROG Strix SCAR 16 G635 is not yet available to purchase in the USA. It will retail for approximately $4,300.
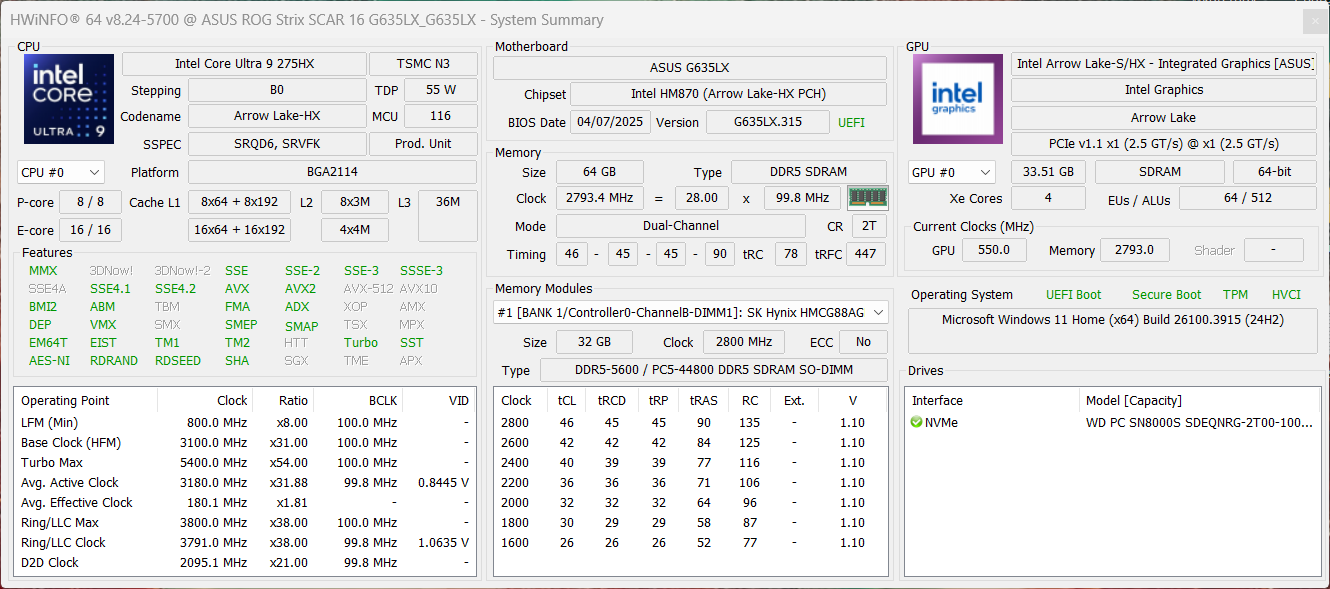
The Strix SCAR 16 is the fastest 16-inch gamer from Asus, combining high-end components with a mini LED screen as well as extensive lighting elements. We tested the variant with the Core Ultra 9 275HX, the GeForce RTX 5090 Laptop, 64 GB RAM, a 2-TB SSD and a 240 Hz mini LED panel for an price of approximately $5,630.
Specifications
Case & connectivity
In general, the laptop's case design, with its black surfaces and AniME vision display on the lid, is the same as the larger SCAR 18. Its quality is good (both build and stability) but given the price point, you might expect to see some metal. Moreover, its black surfaces are extremely susceptible to dirt marks. On the flip side, its lighting options are extensive and the new wraparound LED strip looks impressive.
Asus has installed two modern Thunderbolt 5 ports and enough USB ports, although all the ports are located on its two sides (more on the left). The device's 1080p camera (without a mechanical shutter) does its job and its WLAN module already supports the Wi-Fi 7 standard. During our test, its transfer rates were stable and fast. It's not a Copilot+ laptop, but it supports the webcam's Studio Effects and live subtitling.


| Networking | |
| Asus ROG Strix Scar 16 2025 | |
| iperf3 transmit AXE11000 | |
| iperf3 receive AXE11000 | |
| Asus ROG Strix G16 G615 | |
| iperf3 transmit AXE11000 | |
| iperf3 receive AXE11000 | |
| Lenovo Legion Pro 7i 16 Gen 10 | |
| iperf3 transmit AXE11000 | |
| iperf3 receive AXE11000 | |
| iperf3 transmit AXE11000 6GHz | |
| iperf3 receive AXE11000 6GHz | |
| HP Omen Max 16 ah000 | |
| iperf3 transmit AXE11000 | |
| iperf3 receive AXE11000 | |
| iperf3 transmit AXE11000 6GHz | |
| iperf3 receive AXE11000 6GHz | |
| Aorus MASTER 16 AM6H | |
| iperf3 transmit AXE11000 | |
| iperf3 receive AXE11000 | |
| iperf3 transmit AXE11000 6GHz | |
| iperf3 receive AXE11000 6GHz | |
| Asus ROG Strix Scar 16 G634JZR | |
| iperf3 transmit AXE11000 | |
| iperf3 receive AXE11000 | |
| iperf3 transmit AXE11000 6GHz | |
| iperf3 receive AXE11000 6GHz | |


Maintenance

To unlock the base plate, all you have to do is push a slider. It couldn't be easier and on the inside, you can access the two RAM slots, two M.2 2280 SSDs, battery and the fans. However, the WLAN module is soldered on.


Sustainability
Asus has provided no information on the device's CO2 footprint or environmental certifications. Its packaging consists almost entirely of cardboard.
Input devices - Comfortable keyboard
The 16-inch version of the Strix SCAR does without a number pad, but otherwise features the same comfortable typing experience as the larger SCAR 18. As a replacement, a number pad can be displayed on the ClickPad. This feels nice and smooth and emits muffled, high-quality mechanical clicks. The keyboard backlighting can be adjusted individually for each key, but can't be activated by a sensor.


Display - Mini LED at 240 Hz
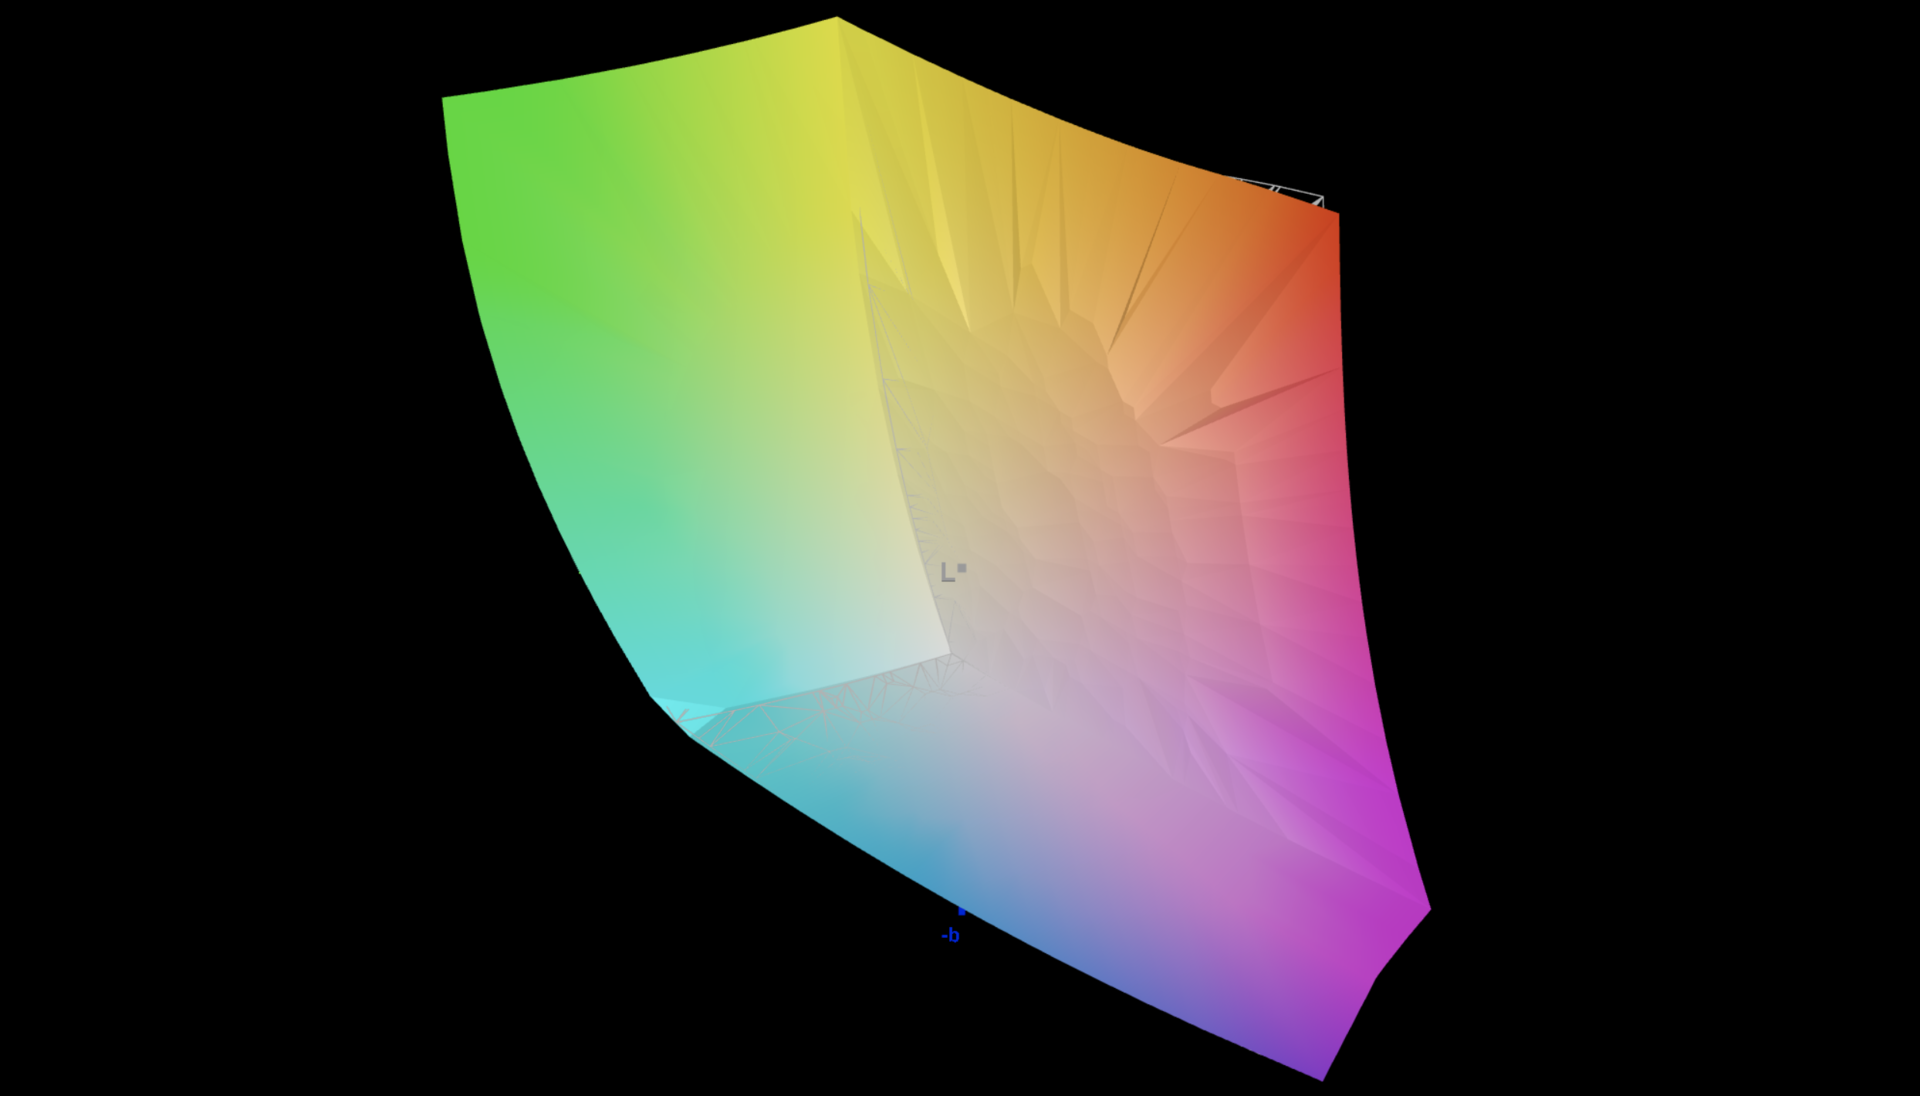
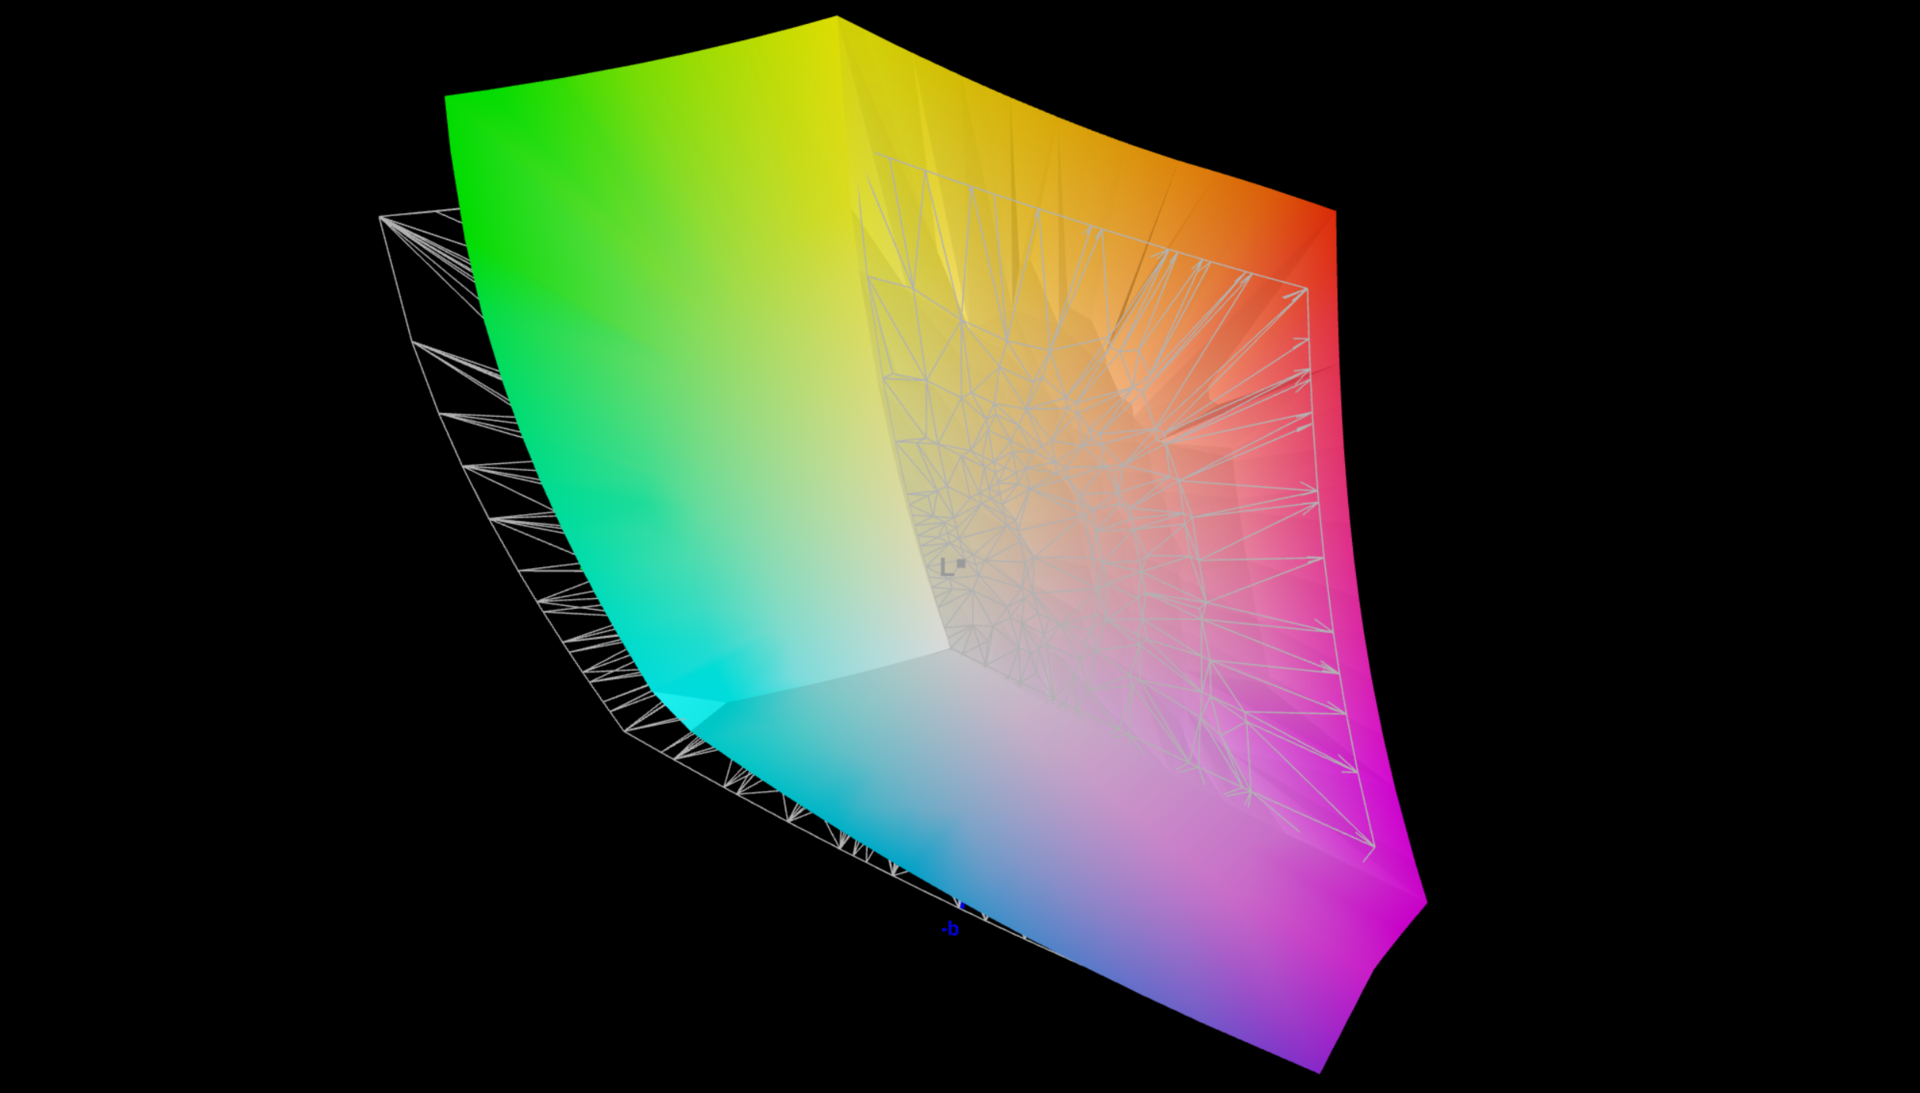
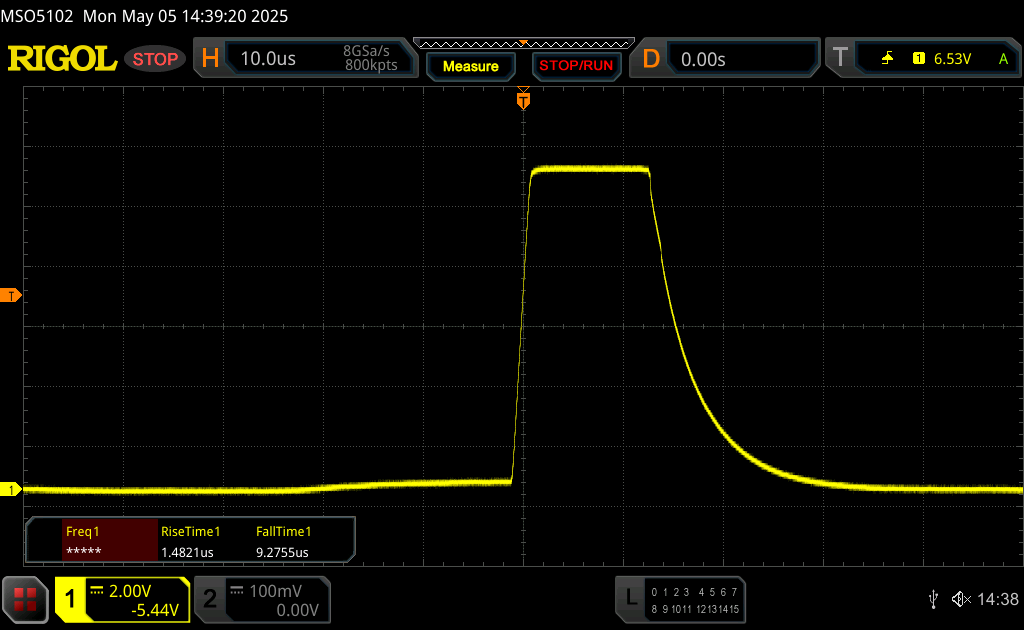
While the Strix G16 is equipped with an IPS panel, the Strix SCAR 16 still has a matte mini LED panel (2,560 x 1,600 pixels, 240 Hz). We reported on the extensive features of this panel in our review of the larger SCAR 18 and overall, its picture quality is simply outstanding. Its response times are fast and although PWM flickering is present, it's at an extremely high frequency of 20 kHz.
In SDR mode, its brightness is more than 770 cd/m² and in HDR mode, we even noted over 1,400 cd/m². However, its black level isn't 0 in SDR mode (only in HDR mode), but its contrast ratio is nevertheless very high. Asus also offers very accurate color profiles for the P3/sRGB color spaces straight out of the box, and we were unable to reduce the display's deviations even further with our own calibration. Local dimming can be deactivated, so the panel is also suitable for image editing without any restrictions.


| |||||||||||||||||||||||||
Brightness Distribution: 91 %
Center on Battery: 719 cd/m²
Contrast: 10771:1 (Black: 0.07 cd/m²)
ΔE ColorChecker Calman: 1 | ∀{0.5-29.43 Ø4.73}
ΔE Greyscale Calman: 1 | ∀{0.09-98 Ø4.97}
88.4% AdobeRGB 1998 (Argyll 3D)
100% sRGB (Argyll 3D)
99.9% Display P3 (Argyll 3D)
Gamma: 2.14
CCT: 6493 K
| Asus ROG Strix Scar 16 2025 NE160QDM-NM8, Mini-LED, 2560x1600, 16", 240 Hz | Asus ROG Strix G16 G615 NE160QDM-NZC, IPS, 2560x1600, 16", 240 Hz | Lenovo Legion Pro 7i 16 Gen 10 Samsung ATNA60HU01-0, OLED, 2560x1600, 16", 240 Hz | HP Omen Max 16 ah000 Samsung ATNA60DL02-0, OLED, 2560x1600, 16", 240 Hz | Aorus MASTER 16 AM6H ATNA60DL03-0 (SDC41AB), OLED, 2560x1600, 16", 240 Hz | Asus ROG Strix Scar 16 G634JZR BOE NE160QDM-NM7, Mini LED, 2560x1600, 16", 240 Hz | |
|---|---|---|---|---|---|---|
| Display | 0% | 2% | 4% | 0% | 1% | |
| Display P3 Coverage (%) | 99.9 | 99.1 -1% | 99.5 0% | 99.7 0% | 95.3 -5% | 99.8 0% |
| sRGB Coverage (%) | 100 | 99.9 0% | 100 0% | 100 0% | 98.8 -1% | 100 0% |
| AdobeRGB 1998 Coverage (%) | 88.4 | 89.1 1% | 94.4 7% | 98.2 11% | 94.1 6% | 90.8 3% |
| Response Times | 31% | 96% | 95% | 96% | 3% | |
| Response Time Grey 50% / Grey 80% * (ms) | 7 ? | 4.6 ? 34% | 0.28 ? 96% | 0.29 ? 96% | 0.24 ? 97% | 5 ? 29% |
| Response Time Black / White * (ms) | 8.4 ? | 6.1 ? 27% | 0.43 ? 95% | 0.47 ? 94% | 0.43 ? 95% | 10.4 ? -24% |
| PWM Frequency (Hz) | 20555 ? | 1438 ? | 960 ? | 960 | 2040 ? | |
| PWM Amplitude * (%) | 29 | 31 | 47 | |||
| Screen | -117% | -81% | -106% | -80% | -83% | |
| Brightness middle (cd/m²) | 754 | 545 -28% | 490.4 -35% | 376.5 -50% | 435 -42% | 490 -35% |
| Brightness (cd/m²) | 773 | 536 -31% | 498 -36% | 382 -51% | 437 -43% | 487 -37% |
| Brightness Distribution (%) | 91 | 89 -2% | 97 7% | 96 5% | 96 5% | 94 3% |
| Black Level * (cd/m²) | 0.07 | 0.41 -486% | 0.08 -14% | 0.4 -471% | ||
| Contrast (:1) | 10771 | 1329 -88% | 5438 -50% | 1225 -89% | ||
| Colorchecker dE 2000 * | 1 | 1.6 -60% | 3.2 -220% | 3.67 -267% | 2.42 -142% | 1.08 -8% |
| Colorchecker dE 2000 max. * | 2 | 4 -100% | 6.04 -202% | 7.24 -262% | 4.81 -140% | 2.38 -19% |
| Greyscale dE 2000 * | 1 | 2.4 -140% | 1 -0% | 1.1 -10% | 3.11 -211% | 1.1 -10% |
| Gamma | 2.14 103% | 2.25 98% | 2.24 98% | 2.25 98% | 2.48 89% | 2.13 103% |
| CCT | 6493 100% | 6737 96% | 6373 102% | 6319 103% | 6270 104% | 6724 97% |
| Colorchecker dE 2000 calibrated * | 0.8 | 0.84 | 0.94 | 2.03 | 0.9 | |
| Total Average (Program / Settings) | -29% /
-67% | 6% /
-26% | -2% /
-39% | 5% /
-34% | -26% /
-51% |
* ... smaller is better


Display Response Times
| ↔ Response Time Black to White | ||
|---|---|---|
| 8.4 ms ... rise ↗ and fall ↘ combined | ↗ 4 ms rise | 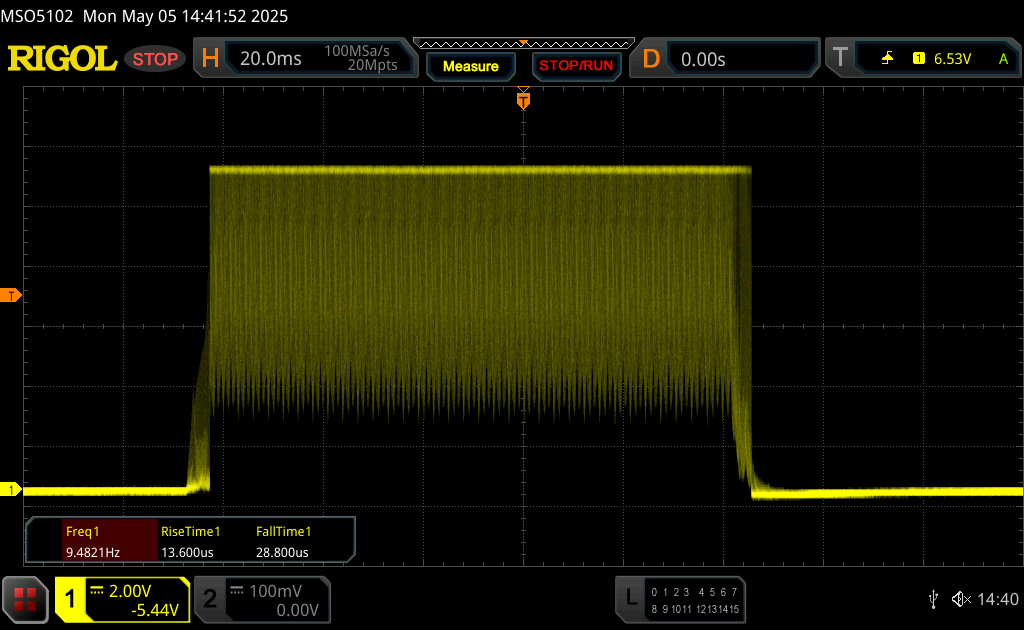 |
| ↘ 4.4 ms fall | ||
| The screen shows fast response rates in our tests and should be suited for gaming. In comparison, all tested devices range from 0.1 (minimum) to 240 (maximum) ms. » 24 % of all devices are better. This means that the measured response time is better than the average of all tested devices (19.9 ms). | ||
| ↔ Response Time 50% Grey to 80% Grey | ||
| 7 ms ... rise ↗ and fall ↘ combined | ↗ 5 ms rise | 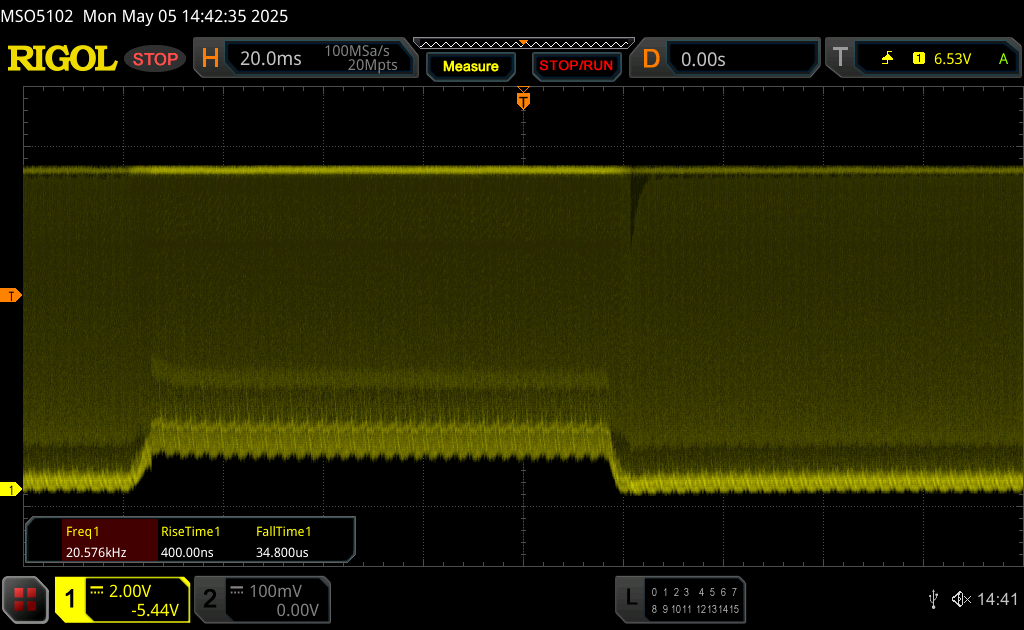 |
| ↘ 2 ms fall | ||
| The screen shows very fast response rates in our tests and should be very well suited for fast-paced gaming. In comparison, all tested devices range from 0.165 (minimum) to 636 (maximum) ms. » 20 % of all devices are better. This means that the measured response time is better than the average of all tested devices (31.1 ms). | ||
Screen Flickering / PWM (Pulse-Width Modulation)
| Screen flickering / PWM detected | 20555 Hz | ≤ 100 % brightness setting |  |
The display backlight flickers at 20555 Hz (worst case, e.g., utilizing PWM) Flickering detected at a brightness setting of 100 % and below. There should be no flickering or PWM above this brightness setting. The frequency of 20555 Hz is quite high, so most users sensitive to PWM should not notice any flickering. In comparison: 52 % of all tested devices do not use PWM to dim the display. If PWM was detected, an average of 7798 (minimum: 5 - maximum: 343500) Hz was measured. | |||


Performance - Arrow Lake-HX & RTX 5090 Laptop


Testing conditions
The ROG Strix SCAR 16 offers all the usual energy profiles. We carried out the following benchmarks and measurements in Turbo mode. In battery mode, the maximum available mode is Performance.
| Energy profile | TDP | CB2024 Multi | TGP | Time Spy Graphics | CP 2077 QHD Ultra | max. fan noise emissions |
|---|---|---|---|---|---|---|
| Quiet | 75/45 watts | 1,517 points | 55 watts | 10,442 points | 46.2fps | 35.3 dB(A) |
| Performance | 165/100 watts | 1,972 points | 160 watts | 22,787 points | 99.9fps | 48.8 dB(A) |
| Turbo | 165/145 watts | 2,196 points | 175 watts | 23,600 points | 107.7fps | 53.6 dB(A) |
| Battery | 65/50 watts | 1,584 points | 55 watts | 9,712 points | 46.5fps | 34.5 dB(A) |
Processor - Core Ultra 9 275HX
Intel's new high-end Core Ultra 9 275HX processor can almost reach its full potential in the Strix SCAR 16 thanks to its high power limits, coming just ahead of the 16-inch competitors in all CPU benchmarks. It was only 9% ahead of the old SCAR 16, while only the larger ROG Strix SCAR 18 was slightly faster still. In addition, its performance remained very stable.
Cinebench R15 Multi continuous test
Cinebench 2024: CPU Multi Core | CPU Single Core
Cinebench R23: Multi Core | Single Core
Cinebench R20: CPU (Multi Core) | CPU (Single Core)
Cinebench R15: CPU Multi 64Bit | CPU Single 64Bit
Blender: v2.79 BMW27 CPU
7-Zip 18.03: 7z b 4 | 7z b 4 -mmt1
Geekbench 6.7: Multi-Core | Single-Core
Geekbench 5.5: Multi-Core | Single-Core
HWBOT x265 Benchmark v2.2: 4k Preset
LibreOffice : 20 Documents To PDF
R Benchmark 2.5: Overall mean
| CPU Performance rating | |
| Asus Strix Scar 18 G835LX | |
| Asus ROG Strix Scar 16 2025 | |
| Asus ROG Strix G16 G615 | |
| Lenovo Legion Pro 7i 16 Gen 10 | |
| Average Intel Core Ultra 9 275HX | |
| Aorus MASTER 16 AM6H -2! | |
| Asus ROG Strix Scar 16 G634JZR | |
| HP Omen Max 16 ah000 | |
| Average of class Gaming | |
| Cinebench 2024 / CPU Multi Core | |
| Asus Strix Scar 18 G835LX | |
| Asus ROG Strix G16 G615 | |
| Asus ROG Strix Scar 16 2025 | |
| Lenovo Legion Pro 7i 16 Gen 10 | |
| Average Intel Core Ultra 9 275HX (1547 - 2288, n=27) | |
| HP Omen Max 16 ah000 | |
| Asus ROG Strix Scar 16 G634JZR | |
| Average of class Gaming (486 - 2298, n=92, last 2 years) | |
| Cinebench 2024 / CPU Single Core | |
| Asus Strix Scar 18 G835LX | |
| Asus ROG Strix G16 G615 | |
| Lenovo Legion Pro 7i 16 Gen 10 | |
| Average Intel Core Ultra 9 275HX (123.1 - 138.2, n=27) | |
| HP Omen Max 16 ah000 | |
| Asus ROG Strix Scar 16 2025 | |
| Asus ROG Strix Scar 16 G634JZR | |
| Average of class Gaming (95 - 138.2, n=92, last 2 years) | |
| Cinebench R23 / Multi Core | |
| Asus Strix Scar 18 G835LX | |
| Asus ROG Strix Scar 16 2025 | |
| Lenovo Legion Pro 7i 16 Gen 10 | |
| Aorus MASTER 16 AM6H | |
| Average Intel Core Ultra 9 275HX (30712 - 40970, n=31) | |
| Asus ROG Strix G16 G615 | |
| HP Omen Max 16 ah000 | |
| Asus ROG Strix Scar 16 G634JZR | |
| Average of class Gaming (10488 - 40970, n=113, last 2 years) | |
| Cinebench R23 / Single Core | |
| Asus Strix Scar 18 G835LX | |
| Aorus MASTER 16 AM6H | |
| Lenovo Legion Pro 7i 16 Gen 10 | |
| Average Intel Core Ultra 9 275HX (2009 - 2267, n=31) | |
| Asus ROG Strix Scar 16 G634JZR | |
| Asus ROG Strix G16 G615 | |
| Asus ROG Strix Scar 16 2025 | |
| HP Omen Max 16 ah000 | |
| Average of class Gaming (1166 - 2356, n=113, last 2 years) | |
| Cinebench R20 / CPU (Multi Core) | |
| Asus Strix Scar 18 G835LX | |
| Asus ROG Strix Scar 16 2025 | |
| Aorus MASTER 16 AM6H | |
| Lenovo Legion Pro 7i 16 Gen 10 | |
| Average Intel Core Ultra 9 275HX (12026 - 16108, n=30) | |
| Asus ROG Strix G16 G615 | |
| HP Omen Max 16 ah000 | |
| Asus ROG Strix Scar 16 G634JZR | |
| Average of class Gaming (4029 - 16108, n=112, last 2 years) | |
| Cinebench R20 / CPU (Single Core) | |
| Asus Strix Scar 18 G835LX | |
| Asus ROG Strix G16 G615 | |
| Aorus MASTER 16 AM6H | |
| Average Intel Core Ultra 9 275HX (774 - 870, n=30) | |
| Asus ROG Strix Scar 16 2025 | |
| Asus ROG Strix Scar 16 G634JZR | |
| Lenovo Legion Pro 7i 16 Gen 10 | |
| HP Omen Max 16 ah000 | |
| Average of class Gaming (442 - 895, n=112, last 2 years) | |
| Cinebench R15 / CPU Multi 64Bit | |
| Asus Strix Scar 18 G835LX | |
| Asus ROG Strix G16 G615 | |
| Asus ROG Strix Scar 16 2025 | |
| Lenovo Legion Pro 7i 16 Gen 10 | |
| Aorus MASTER 16 AM6H | |
| Average Intel Core Ultra 9 275HX (4737 - 6271, n=30) | |
| HP Omen Max 16 ah000 | |
| Asus ROG Strix Scar 16 G634JZR | |
| Average of class Gaming (1578 - 6271, n=113, last 2 years) | |
| Cinebench R15 / CPU Single 64Bit | |
| Asus Strix Scar 18 G835LX | |
| Asus ROG Strix Scar 16 2025 | |
| Asus ROG Strix G16 G615 | |
| Lenovo Legion Pro 7i 16 Gen 10 | |
| Aorus MASTER 16 AM6H | |
| Average Intel Core Ultra 9 275HX (306 - 343, n=31) | |
| HP Omen Max 16 ah000 | |
| Asus ROG Strix Scar 16 G634JZR | |
| Average of class Gaming (188.8 - 343, n=112, last 2 years) | |
| Blender / v2.79 BMW27 CPU | |
| Average of class Gaming (80 - 330, n=110, last 2 years) | |
| Asus ROG Strix Scar 16 G634JZR | |
| HP Omen Max 16 ah000 | |
| Average Intel Core Ultra 9 275HX (82 - 116, n=29) | |
| Aorus MASTER 16 AM6H | |
| Lenovo Legion Pro 7i 16 Gen 10 | |
| Asus Strix Scar 18 G835LX | |
| Asus ROG Strix Scar 16 2025 | |
| Asus ROG Strix G16 G615 | |
| 7-Zip 18.03 / 7z b 4 | |
| Asus Strix Scar 18 G835LX | |
| Asus ROG Strix Scar 16 G634JZR | |
| Asus ROG Strix Scar 16 2025 | |
| Asus ROG Strix G16 G615 | |
| Lenovo Legion Pro 7i 16 Gen 10 | |
| Average Intel Core Ultra 9 275HX (98236 - 124155, n=30) | |
| Aorus MASTER 16 AM6H | |
| HP Omen Max 16 ah000 | |
| Average of class Gaming (33491 - 148086, n=111, last 2 years) | |
| 7-Zip 18.03 / 7z b 4 -mmt1 | |
| Asus ROG Strix Scar 16 G634JZR | |
| Asus ROG Strix G16 G615 | |
| Asus Strix Scar 18 G835LX | |
| Average Intel Core Ultra 9 275HX (6026 - 7149, n=30) | |
| Aorus MASTER 16 AM6H | |
| Asus ROG Strix Scar 16 2025 | |
| Lenovo Legion Pro 7i 16 Gen 10 | |
| Average of class Gaming (4199 - 7436, n=111, last 2 years) | |
| HP Omen Max 16 ah000 | |
| Geekbench 6.7 / Multi-Core | |
| Asus Strix Scar 18 G835LX | |
| Asus ROG Strix Scar 16 2025 | |
| Asus ROG Strix G16 G615 | |
| Average Intel Core Ultra 9 275HX (16033 - 21668, n=33) | |
| Aorus MASTER 16 AM6H | |
| Lenovo Legion Pro 7i 16 Gen 10 | |
| Asus ROG Strix Scar 16 G634JZR | |
| HP Omen Max 16 ah000 | |
| Average of class Gaming (6625 - 22104, n=112, last 2 years) | |
| Geekbench 6.7 / Single-Core | |
| Asus Strix Scar 18 G835LX | |
| Asus ROG Strix Scar 16 2025 | |
| Lenovo Legion Pro 7i 16 Gen 10 | |
| Aorus MASTER 16 AM6H | |
| Average Intel Core Ultra 9 275HX (2843 - 3160, n=33) | |
| Asus ROG Strix Scar 16 G634JZR | |
| Asus ROG Strix G16 G615 | |
| HP Omen Max 16 ah000 | |
| Average of class Gaming (1490 - 3259, n=112, last 2 years) | |
| Geekbench 5.5 / Multi-Core | |
| Asus Strix Scar 18 G835LX | |
| Asus ROG Strix Scar 16 2025 | |
| Asus ROG Strix G16 G615 | |
| Average Intel Core Ultra 9 275HX (19105 - 25855, n=31) | |
| Lenovo Legion Pro 7i 16 Gen 10 | |
| Aorus MASTER 16 AM6H | |
| Asus ROG Strix Scar 16 G634JZR | |
| HP Omen Max 16 ah000 | |
| Average of class Gaming (6460 - 27010, n=111, last 2 years) | |
| Geekbench 5.5 / Single-Core | |
| Asus Strix Scar 18 G835LX | |
| Asus ROG Strix Scar 16 2025 | |
| Aorus MASTER 16 AM6H | |
| Asus ROG Strix Scar 16 G634JZR | |
| Average Intel Core Ultra 9 275HX (2033 - 2292, n=31) | |
| Lenovo Legion Pro 7i 16 Gen 10 | |
| Asus ROG Strix G16 G615 | |
| Average of class Gaming (986 - 2474, n=111, last 2 years) | |
| HP Omen Max 16 ah000 | |
| HWBOT x265 Benchmark v2.2 / 4k Preset | |
| Asus Strix Scar 18 G835LX | |
| Asus ROG Strix Scar 16 2025 | |
| Asus ROG Strix G16 G615 | |
| Lenovo Legion Pro 7i 16 Gen 10 | |
| Average Intel Core Ultra 9 275HX (30.7 - 43.8, n=30) | |
| Aorus MASTER 16 AM6H | |
| HP Omen Max 16 ah000 | |
| Asus ROG Strix Scar 16 G634JZR | |
| Average of class Gaming (11.5 - 44.3, n=111, last 2 years) | |
| LibreOffice / 20 Documents To PDF | |
| Average of class Gaming (19 - 88.8, n=111, last 2 years) | |
| Asus ROG Strix Scar 16 G634JZR | |
| Average Intel Core Ultra 9 275HX (33.2 - 62.1, n=30) | |
| HP Omen Max 16 ah000 | |
| Asus Strix Scar 18 G835LX | |
| Asus ROG Strix Scar 16 2025 | |
| Aorus MASTER 16 AM6H | |
| Asus ROG Strix G16 G615 | |
| Lenovo Legion Pro 7i 16 Gen 10 | |
| R Benchmark 2.5 / Overall mean | |
| HP Omen Max 16 ah000 | |
| Aorus MASTER 16 AM6H | |
| Average of class Gaming (0.3439 - 0.759, n=112, last 2 years) | |
| Average Intel Core Ultra 9 275HX (0.3943 - 0.4568, n=30) | |
| Asus ROG Strix Scar 16 2025 | |
| Lenovo Legion Pro 7i 16 Gen 10 | |
| Asus ROG Strix G16 G615 | |
| Asus Strix Scar 18 G835LX | |
| Asus ROG Strix Scar 16 G634JZR | |
* ... smaller is better
AIDA64: FP32 Ray-Trace | FPU Julia | CPU SHA3 | CPU Queen | FPU SinJulia | FPU Mandel | CPU AES | CPU ZLib | FP64 Ray-Trace | CPU PhotoWorxx
| Performance rating | |
| Asus ROG Strix Scar 16 2025 | |
| Asus ROG Strix G16 G615 | |
| Aorus MASTER 16 AM6H | |
| Lenovo Legion Pro 7i 16 Gen 10 | |
| Average Intel Core Ultra 9 275HX | |
| HP Omen Max 16 ah000 | |
| Asus ROG Strix Scar 16 G634JZR | |
| Average of class Gaming | |
| AIDA64 / FP32 Ray-Trace | |
| Asus ROG Strix Scar 16 2025 | |
| Asus ROG Strix G16 G615 | |
| Aorus MASTER 16 AM6H | |
| Lenovo Legion Pro 7i 16 Gen 10 | |
| Average Intel Core Ultra 9 275HX (28039 - 39895, n=30) | |
| HP Omen Max 16 ah000 | |
| Average of class Gaming (10227 - 85542, n=110, last 2 years) | |
| Asus ROG Strix Scar 16 G634JZR | |
| AIDA64 / FPU Julia | |
| Asus ROG Strix G16 G615 | |
| Asus ROG Strix Scar 16 2025 | |
| Aorus MASTER 16 AM6H | |
| Lenovo Legion Pro 7i 16 Gen 10 | |
| Average Intel Core Ultra 9 275HX (140254 - 200744, n=30) | |
| HP Omen Max 16 ah000 | |
| Average of class Gaming (51376 - 238426, n=110, last 2 years) | |
| Asus ROG Strix Scar 16 G634JZR | |
| AIDA64 / CPU SHA3 | |
| Asus ROG Strix Scar 16 2025 | |
| Asus ROG Strix G16 G615 | |
| Aorus MASTER 16 AM6H | |
| Lenovo Legion Pro 7i 16 Gen 10 | |
| Average Intel Core Ultra 9 275HX (6710 - 9817, n=30) | |
| HP Omen Max 16 ah000 | |
| Asus ROG Strix Scar 16 G634JZR | |
| Average of class Gaming (2180 - 9817, n=110, last 2 years) | |
| AIDA64 / CPU Queen | |
| Asus ROG Strix Scar 16 G634JZR | |
| Asus ROG Strix Scar 16 2025 | |
| Asus ROG Strix G16 G615 | |
| Lenovo Legion Pro 7i 16 Gen 10 | |
| Aorus MASTER 16 AM6H | |
| Average Intel Core Ultra 9 275HX (113887 - 140937, n=30) | |
| HP Omen Max 16 ah000 | |
| Average of class Gaming (49785 - 173351, n=101, last 2 years) | |
| AIDA64 / FPU SinJulia | |
| Asus ROG Strix Scar 16 G634JZR | |
| Average of class Gaming (4424 - 33636, n=110, last 2 years) | |
| Lenovo Legion Pro 7i 16 Gen 10 | |
| Asus ROG Strix Scar 16 2025 | |
| Asus ROG Strix G16 G615 | |
| Aorus MASTER 16 AM6H | |
| Average Intel Core Ultra 9 275HX (11172 - 14425, n=30) | |
| HP Omen Max 16 ah000 | |
| AIDA64 / FPU Mandel | |
| Asus ROG Strix G16 G615 | |
| Asus ROG Strix Scar 16 2025 | |
| Aorus MASTER 16 AM6H | |
| Lenovo Legion Pro 7i 16 Gen 10 | |
| Average Intel Core Ultra 9 275HX (72596 - 104508, n=30) | |
| HP Omen Max 16 ah000 | |
| Average of class Gaming (25115 - 128721, n=110, last 2 years) | |
| Asus ROG Strix Scar 16 G634JZR | |
| AIDA64 / CPU AES | |
| Asus ROG Strix Scar 16 G634JZR | |
| Asus ROG Strix G16 G615 | |
| Lenovo Legion Pro 7i 16 Gen 10 | |
| Asus ROG Strix Scar 16 2025 | |
| Average Intel Core Ultra 9 275HX (105608 - 247074, n=30) | |
| Aorus MASTER 16 AM6H | |
| HP Omen Max 16 ah000 | |
| Average of class Gaming (39258 - 247074, n=110, last 2 years) | |
| AIDA64 / CPU ZLib | |
| Asus ROG Strix G16 G615 | |
| Asus ROG Strix Scar 16 2025 | |
| Aorus MASTER 16 AM6H | |
| Lenovo Legion Pro 7i 16 Gen 10 | |
| Average Intel Core Ultra 9 275HX (1582 - 2263, n=30) | |
| HP Omen Max 16 ah000 | |
| Asus ROG Strix Scar 16 G634JZR | |
| Average of class Gaming (574 - 2531, n=110, last 2 years) | |
| AIDA64 / FP64 Ray-Trace | |
| Asus ROG Strix Scar 16 2025 | |
| Asus ROG Strix G16 G615 | |
| Aorus MASTER 16 AM6H | |
| Lenovo Legion Pro 7i 16 Gen 10 | |
| Average Intel Core Ultra 9 275HX (14847 - 21854, n=30) | |
| HP Omen Max 16 ah000 | |
| Average of class Gaming (5509 - 45446, n=110, last 2 years) | |
| Asus ROG Strix Scar 16 G634JZR | |
| AIDA64 / CPU PhotoWorxx | |
| Asus ROG Strix Scar 16 2025 | |
| Lenovo Legion Pro 7i 16 Gen 10 | |
| Average Intel Core Ultra 9 275HX (37482 - 62916, n=30) | |
| Asus ROG Strix Scar 16 G634JZR | |
| HP Omen Max 16 ah000 | |
| Aorus MASTER 16 AM6H | |
| Asus ROG Strix G16 G615 | |
| Average of class Gaming (12271 - 89891, n=110, last 2 years) | |
System performance
As expected, the Strix SCAR 16 is a super fast device and we had no problems with system stability during our test. There was only a slight hitch when switching graphics, but this is in line with the current state of the technology.
CrossMark: Overall | Productivity | Creativity | Responsiveness
WebXPRT 3: Overall
WebXPRT 4: Overall
Mozilla Kraken 1.1: Total
| PCMark 10 / Score | |
| Lenovo Legion Pro 7i 16 Gen 10 | |
| Asus ROG Strix G16 G615 | |
| Asus ROG Strix Scar 16 2025 | |
| HP Omen Max 16 ah000 | |
| Average Intel Core Ultra 9 275HX, NVIDIA GeForce RTX 5090 Laptop (7474 - 9497, n=11) | |
| Average of class Gaming (5828 - 11574, n=96, last 2 years) | |
| Aorus MASTER 16 AM6H | |
| Asus ROG Strix Scar 16 G634JZR | |
| PCMark 10 / Essentials | |
| Asus ROG Strix Scar 16 G634JZR | |
| Lenovo Legion Pro 7i 16 Gen 10 | |
| Asus ROG Strix G16 G615 | |
| Asus ROG Strix Scar 16 2025 | |
| HP Omen Max 16 ah000 | |
| Average Intel Core Ultra 9 275HX, NVIDIA GeForce RTX 5090 Laptop (9994 - 11369, n=12) | |
| Average of class Gaming (8810 - 12600, n=100, last 2 years) | |
| Aorus MASTER 16 AM6H | |
| PCMark 10 / Productivity | |
| Average of class Gaming (6845 - 18766, n=98, last 2 years) | |
| Average Intel Core Ultra 9 275HX, NVIDIA GeForce RTX 5090 Laptop (9122 - 10925, n=11) | |
| Lenovo Legion Pro 7i 16 Gen 10 | |
| Aorus MASTER 16 AM6H | |
| Asus ROG Strix G16 G615 | |
| Asus ROG Strix Scar 16 2025 | |
| HP Omen Max 16 ah000 | |
| Asus ROG Strix Scar 16 G634JZR | |
| PCMark 10 / Digital Content Creation | |
| Lenovo Legion Pro 7i 16 Gen 10 | |
| HP Omen Max 16 ah000 | |
| Asus ROG Strix G16 G615 | |
| Asus ROG Strix Scar 16 2025 | |
| Average Intel Core Ultra 9 275HX, NVIDIA GeForce RTX 5090 Laptop (9952 - 19234, n=11) | |
| Aorus MASTER 16 AM6H | |
| Asus ROG Strix Scar 16 G634JZR | |
| Average of class Gaming (7602 - 19657, n=98, last 2 years) | |
| CrossMark / Overall | |
| Aorus MASTER 16 AM6H | |
| Average Intel Core Ultra 9 275HX, NVIDIA GeForce RTX 5090 Laptop (1995 - 2339, n=12) | |
| Asus ROG Strix G16 G615 | |
| Asus ROG Strix Scar 16 2025 | |
| Asus ROG Strix Scar 16 G634JZR | |
| Lenovo Legion Pro 7i 16 Gen 10 | |
| HP Omen Max 16 ah000 | |
| Average of class Gaming (1366 - 2409, n=98, last 2 years) | |
| CrossMark / Productivity | |
| Aorus MASTER 16 AM6H | |
| Average Intel Core Ultra 9 275HX, NVIDIA GeForce RTX 5090 Laptop (1847 - 2211, n=12) | |
| Asus ROG Strix G16 G615 | |
| Asus ROG Strix Scar 16 2025 | |
| Lenovo Legion Pro 7i 16 Gen 10 | |
| Asus ROG Strix Scar 16 G634JZR | |
| Average of class Gaming (1386 - 2254, n=98, last 2 years) | |
| HP Omen Max 16 ah000 | |
| CrossMark / Creativity | |
| Asus ROG Strix Scar 16 2025 | |
| Average Intel Core Ultra 9 275HX, NVIDIA GeForce RTX 5090 Laptop (2170 - 2642, n=12) | |
| Aorus MASTER 16 AM6H | |
| Asus ROG Strix G16 G615 | |
| Asus ROG Strix Scar 16 G634JZR | |
| Lenovo Legion Pro 7i 16 Gen 10 | |
| HP Omen Max 16 ah000 | |
| Average of class Gaming (1343 - 2729, n=98, last 2 years) | |
| CrossMark / Responsiveness | |
| Aorus MASTER 16 AM6H | |
| Average Intel Core Ultra 9 275HX, NVIDIA GeForce RTX 5090 Laptop (1673 - 2217, n=12) | |
| Asus ROG Strix G16 G615 | |
| Asus ROG Strix Scar 16 G634JZR | |
| Average of class Gaming (1226 - 2334, n=98, last 2 years) | |
| Asus ROG Strix Scar 16 2025 | |
| HP Omen Max 16 ah000 | |
| Lenovo Legion Pro 7i 16 Gen 10 | |
| WebXPRT 3 / Overall | |
| HP Omen Max 16 ah000 | |
| Lenovo Legion Pro 7i 16 Gen 10 | |
| Asus ROG Strix G16 G615 | |
| Average Intel Core Ultra 9 275HX, NVIDIA GeForce RTX 5090 Laptop (315 - 372, n=12) | |
| Aorus MASTER 16 AM6H | |
| Asus ROG Strix Scar 16 2025 | |
| Average of class Gaming (242 - 532, n=101, last 2 years) | |
| Asus ROG Strix Scar 16 G634JZR | |
| WebXPRT 4 / Overall | |
| Asus ROG Strix Scar 16 2025 | |
| Asus ROG Strix G16 G615 | |
| Aorus MASTER 16 AM6H | |
| Lenovo Legion Pro 7i 16 Gen 10 | |
| Average Intel Core Ultra 9 275HX, NVIDIA GeForce RTX 5090 Laptop (301 - 341, n=11) | |
| Asus ROG Strix Scar 16 G634JZR | |
| Average of class Gaming (176.4 - 354, n=101, last 2 years) | |
| Mozilla Kraken 1.1 / Total | |
| Average of class Gaming (391 - 590, n=106, last 2 years) | |
| Asus ROG Strix Scar 16 G634JZR | |
| HP Omen Max 16 ah000 | |
| Asus ROG Strix Scar 16 2025 | |
| Average Intel Core Ultra 9 275HX, NVIDIA GeForce RTX 5090 Laptop (402 - 424, n=12) | |
| Aorus MASTER 16 AM6H | |
| Lenovo Legion Pro 7i 16 Gen 10 | |
| Asus ROG Strix G16 G615 | |
* ... smaller is better
| PCMark 10 Score | 8819 points | |
Help | ||
| AIDA64 / Memory Copy | |
| Asus ROG Strix G16 G615 | |
| Lenovo Legion Pro 7i 16 Gen 10 | |
| Asus ROG Strix Scar 16 2025 | |
| Average Intel Core Ultra 9 275HX (56003 - 94460, n=30) | |
| Asus ROG Strix Scar 16 G634JZR | |
| HP Omen Max 16 ah000 | |
| Aorus MASTER 16 AM6H | |
| Average of class Gaming (21750 - 129946, n=110, last 2 years) | |
| AIDA64 / Memory Read | |
| Lenovo Legion Pro 7i 16 Gen 10 | |
| Asus ROG Strix Scar 16 2025 | |
| Asus ROG Strix Scar 16 G634JZR | |
| Average Intel Core Ultra 9 275HX (55795 - 97151, n=30) | |
| HP Omen Max 16 ah000 | |
| Asus ROG Strix G16 G615 | |
| Aorus MASTER 16 AM6H | |
| Average of class Gaming (22956 - 118858, n=110, last 2 years) | |
| AIDA64 / Memory Write | |
| Lenovo Legion Pro 7i 16 Gen 10 | |
| Asus ROG Strix Scar 16 2025 | |
| Average Intel Core Ultra 9 275HX (55663 - 116129, n=30) | |
| HP Omen Max 16 ah000 | |
| Asus ROG Strix Scar 16 G634JZR | |
| Average of class Gaming (22297 - 135096, n=110, last 2 years) | |
| Asus ROG Strix G16 G615 | |
| Aorus MASTER 16 AM6H | |
| AIDA64 / Memory Latency | |
| HP Omen Max 16 ah000 | |
| Average Intel Core Ultra 9 275HX (105.8 - 161.6, n=30) | |
| Aorus MASTER 16 AM6H | |
| Asus ROG Strix G16 G615 | |
| Asus ROG Strix Scar 16 2025 | |
| Lenovo Legion Pro 7i 16 Gen 10 | |
| Average of class Gaming (75.3 - 259, n=110, last 2 years) | |
| Asus ROG Strix Scar 16 G634JZR | |
* ... smaller is better
DPC latencies
In our standardized latency test (surfing the web, 4K YouTube playback, CPU load), the test device with the current BIOS version showed slight limitations when using real-time audio applications.


| DPC Latencies / LatencyMon - interrupt to process latency (max), Web, Youtube, Prime95 | |
| Asus ROG Strix Scar 16 G634JZR | |
| Asus ROG Strix Scar 16 2025 | |
| Aorus MASTER 16 AM6H | |
| HP Omen Max 16 ah000 | |
| Asus ROG Strix G16 G615 | |
| Lenovo Legion Pro 7i 16 Gen 10 | |
* ... smaller is better
Storage device
The ROG Strix SCAR 16 features two M.2 2280 SSD slots, but they don't yet support PCIe 5.0. Our test device is fitted with a 2-TB drive (1.73 TB free for the user) from Western Digital, which delivered high and stable transfer rates during our test.

* ... smaller is better
Reading continuous performance: DiskSpd Read Loop, Queue Depth 8
GPU performance
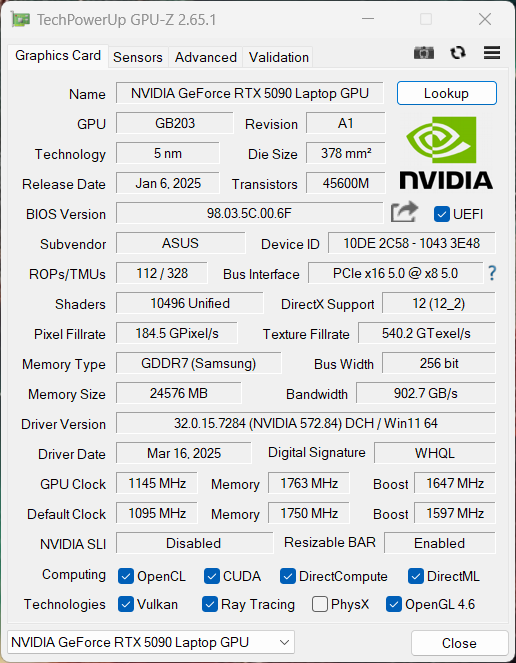
Our test device uses the new GeForce RTX 5090 Laptop with 24 GB VRAM (Advanced Optimus). It is the 175-watt version (150 watts + 25 watts Dynamic Boost), and its benchmark results were very good. We noted no disadvantage here compared to the larger ROG Strix SCAR 18.
Its performance is similarly good when gaming, although the 5090 Laptop couldn't yet show its strengths in our standard 1080p tests. In QHD resolution, the 5090 Laptop almost always outperformed the 5080 Laptop, but as we saw in our GPU analysis, the 5090 Laptop is particularly suitable for 4K resolution. If you only want to play on the device's internal display and won't benefit from the additional VRAM in any other way (e.g. for video editing), then the RTX 5080 Laptop is perfectly adequate.
| 3DMark 11 Performance | 47965 points | |
| 3DMark Fire Strike Score | 38818 points | |
| 3DMark Time Spy Score | 22241 points | |
| 3DMark Steel Nomad Score | 6008 points | |
Help | ||
| Blender / v3.3 Classroom OPTIX/RTX | |
| Average of class Gaming (9 - 32, n=112, last 2 years) | |
| Asus ROG Strix Scar 16 2025 | |
| Asus ROG Strix Scar 16 G634JZR | |
| HP Omen Max 16 ah000 | |
| Lenovo Legion Pro 7i 16 Gen 10 | |
| Average NVIDIA GeForce RTX 5090 Laptop (9 - 18, n=21) | |
| Asus ROG Strix G16 G615 | |
| Aorus MASTER 16 AM6H | |
| Blender / v3.3 Classroom CUDA | |
| Average of class Gaming (15 - 228, n=112, last 2 years) | |
| Asus ROG Strix Scar 16 G634JZR | |
| Asus ROG Strix G16 G615 | |
| Asus ROG Strix Scar 16 2025 | |
| Lenovo Legion Pro 7i 16 Gen 10 | |
| Average NVIDIA GeForce RTX 5090 Laptop (15 - 37, n=20) | |
| Aorus MASTER 16 AM6H | |
| HP Omen Max 16 ah000 | |
| Blender / v3.3 Classroom CPU | |
| Average of class Gaming (122 - 565, n=108, last 2 years) | |
| Asus ROG Strix Scar 16 G634JZR | |
| Average NVIDIA GeForce RTX 5090 Laptop (123 - 282, n=21) | |
| HP Omen Max 16 ah000 | |
| Aorus MASTER 16 AM6H | |
| Lenovo Legion Pro 7i 16 Gen 10 | |
| Asus ROG Strix Scar 16 2025 | |
| Asus ROG Strix G16 G615 | |
* ... smaller is better
| F1 24 - 2560x1440 Ultra High Preset AA:T AF:16x | |
| HP Omen Max 16 ah000 | |
| Asus ROG Strix Scar 16 2025 | |
| Average NVIDIA GeForce RTX 5090 Laptop (72.5 - 106.9, n=22) | |
| Aorus MASTER 16 AM6H | |
| Asus ROG Strix G16 G615 | |
| Average of class Gaming (29.8 - 106.9, n=60, last 2 years) | |
| Call of Duty Black Ops 6 - 2560x1440 Extreme Preset | |
| Average NVIDIA GeForce RTX 5090 Laptop (92 - 151, n=8) | |
| Average of class Gaming (60 - 151, n=15, last 2 years) | |
| Asus ROG Strix Scar 16 2025 | |
Cyberpunk 2077 ultra FPS diagram
| low | med. | high | ultra | QHD | |
|---|---|---|---|---|---|
| GTA V (2015) | 162.8 | 158 | |||
| Dota 2 Reborn (2015) | 223 | 184.1 | 177.5 | 167.2 | |
| Final Fantasy XV Benchmark (2018) | 234 | 230 | 194.6 | 157 | |
| X-Plane 11.11 (2018) | 158 | 143.3 | 115.9 | ||
| Strange Brigade (2018) | 553 | 398 | 397 | 375 | 315 |
| Baldur's Gate 3 (2023) | 250 | 218.2 | 196.7 | 193.3 | 141.7 |
| Cyberpunk 2077 (2023) | 191.2 | 187.9 | 168.9 | 153.6 | 107.7 |
| Alan Wake 2 (2023) | 130.5 | 129.6 | 120.6 | 83.4 | |
| F1 24 (2024) | 324 | 144.2 | 97.8 | ||
| Call of Duty Black Ops 6 (2024) | 201 | 186 | 135 | 128 | 92 |
| Indiana Jones and the Great Circle (2024) | 187.5 | 138.2 | 121.9 | 99.1 |
Emissions & energy management
Noise emissions

The laptop's cooling consists of a big vapor chamber and three fans. We would always recommend using Quiet mode for simple tasks, as the fans are then often deactivated. In Turbo mode, on the other hand, we noted a constant background noise of 29 dB(A). When gaming, it also quickly reached a loud 53.6 dB(A). The rivals get a little louder, but here, too, you can't really avoid headphones. There were no other electronic noises coming from our test device.
Noise level
| Idle |
| 29 / 29 / 29 dB(A) |
| Load |
| 40.5 / 53.6 dB(A) |
 | ||
30 dB silent 40 dB(A) audible 50 dB(A) loud |
||
min: | ||
| Asus ROG Strix Scar 16 2025 GeForce RTX 5090 Laptop, Ultra 9 275HX, WD PC SN8000S 2TB | Asus ROG Strix G16 G615 GeForce RTX 5080 Laptop, Ultra 9 275HX, Micron 2500 1TB MTFDKBA1T0QGN | Lenovo Legion Pro 7i 16 Gen 10 GeForce RTX 5080 Laptop, Ultra 9 275HX, SK Hynix HFS001TEJ9X115N | HP Omen Max 16 ah000 GeForce RTX 5090 Laptop, Ultra 9 275HX, WDC PC SN810 2TB | Aorus MASTER 16 AM6H GeForce RTX 5090 Laptop, Ultra 9 275HX, Kingston OM8PGP41024Q-A0 | Asus ROG Strix Scar 16 G634JZR GeForce RTX 4080 Laptop GPU, i9-14900HX, SK hynix PC801 HFS002TEJ9X101N | |
|---|---|---|---|---|---|---|
| Noise | 1% | 12% | -4% | 6% | -7% | |
| off / environment * (dB) | 23.8 | 24 -1% | 22.9 4% | 22.8 4% | 23 3% | 21.07 11% |
| Idle Minimum * (dB) | 29 | 24 17% | 22.9 21% | 29 -0% | 23 21% | 29.75 -3% |
| Idle Average * (dB) | 29 | 30.1 -4% | 22.9 21% | 29 -0% | 23 21% | 29.75 -3% |
| Idle Maximum * (dB) | 29 | 30.1 -4% | 26.3 9% | 29 -0% | 23 21% | 29.75 -3% |
| Load Average * (dB) | 40.5 | 41.1 -1% | 27.8 31% | 47.7 -18% | 40.46 -0% | 54.85 -35% |
| Cyberpunk 2077 ultra * (dB) | 53.6 | 54.2 -1% | 54.2 -1% | 54.8 -2% | 59.75 -11% | |
| Load Maximum * (dB) | 53.6 | 54.2 -1% | 53.9 -1% | 61.1 -14% | 59.75 -11% | 58 -8% |
| Witcher 3 ultra * (dB) | 57.8 |
* ... smaller is better
Temperature
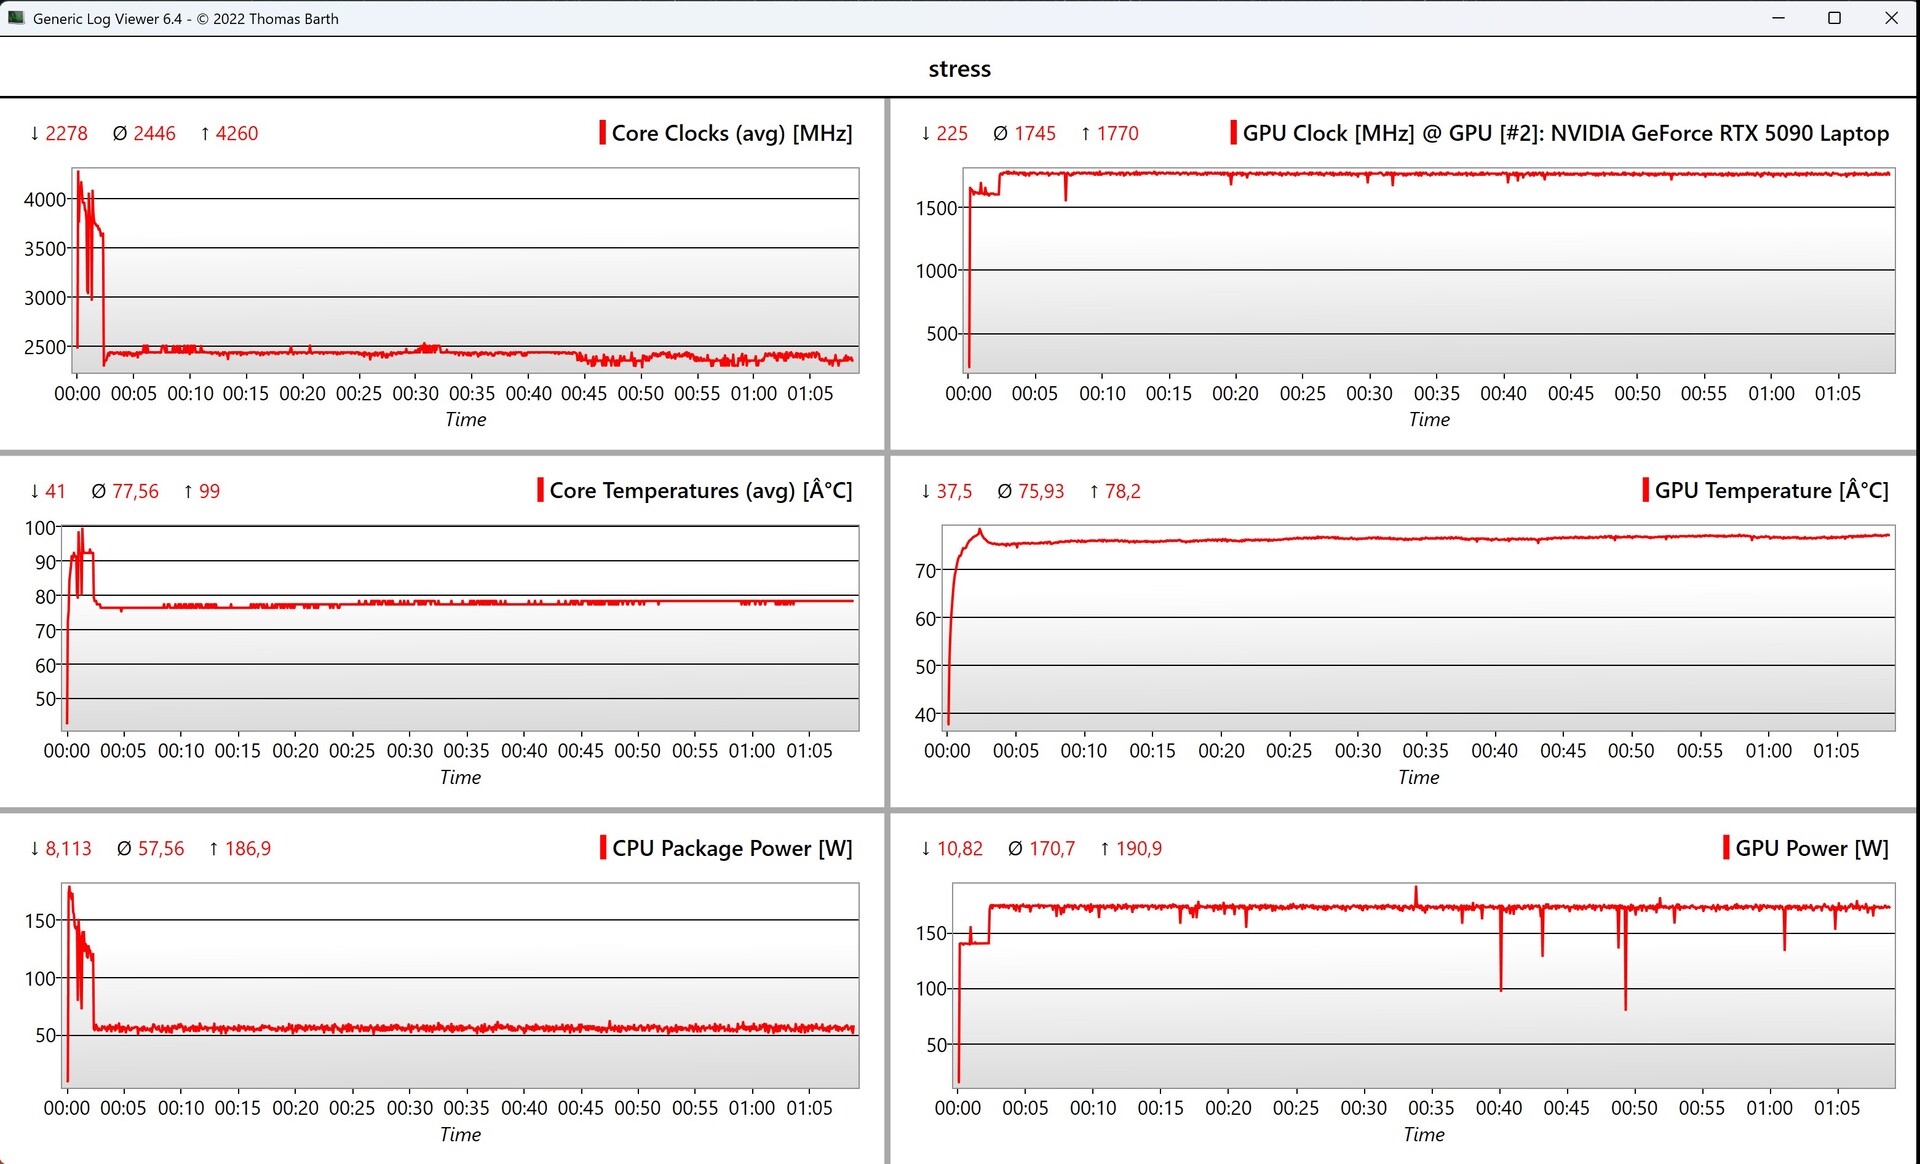
The laptop's surfaces stay super cool under low load and there were no restrictions when gaming during our test, as we only measured slightly more than 45 °C in the back area of the underside. Even so, the keyboard in particular stayed a lot cooler. During the stress test, the processor and graphics card levelled off at 50 and 175 watts respectively.
(±) The maximum temperature on the upper side is 44.2 °C / 112 F, compared to the average of 40.4 °C / 105 F, ranging from 21.2 to 68.8 °C for the class Gaming.
(-) The bottom heats up to a maximum of 48.1 °C / 119 F, compared to the average of 43.2 °C / 110 F
(+) In idle usage, the average temperature for the upper side is 30.8 °C / 87 F, compared to the device average of 33.9 °C / 93 F.
(±) 3: The average temperature for the upper side is 35.1 °C / 95 F, compared to the average of 33.9 °C / 93 F for the class Gaming.
(+) The palmrests and touchpad are reaching skin temperature as a maximum (34.3 °C / 93.7 F) and are therefore not hot.
(-) The average temperature of the palmrest area of similar devices was 28.8 °C / 83.8 F (-5.5 °C / -9.9 F).


| Asus ROG Strix Scar 16 2025 Intel Core Ultra 9 275HX, NVIDIA GeForce RTX 5090 Laptop | Asus ROG Strix G16 G615 Intel Core Ultra 9 275HX, NVIDIA GeForce RTX 5080 Laptop | Lenovo Legion Pro 7i 16 Gen 10 Intel Core Ultra 9 275HX, NVIDIA GeForce RTX 5080 Laptop | HP Omen Max 16 ah000 Intel Core Ultra 9 275HX, NVIDIA GeForce RTX 5090 Laptop | Aorus MASTER 16 AM6H Intel Core Ultra 9 275HX, NVIDIA GeForce RTX 5090 Laptop | Asus ROG Strix Scar 16 G634JZR Intel Core i9-14900HX, NVIDIA GeForce RTX 4080 Laptop GPU | |
|---|---|---|---|---|---|---|
| Heat | 13% | 7% | 11% | -2% | -2% | |
| Maximum Upper Side * (°C) | 44.2 | 39.6 10% | 42.6 4% | 42.8 3% | 39 12% | 47.8 -8% |
| Maximum Bottom * (°C) | 48.1 | 49.7 -3% | 41.2 14% | 50.2 -4% | 51 -6% | 52.2 -9% |
| Idle Upper Side * (°C) | 33 | 26.3 20% | 32.6 1% | 27.6 16% | 36 -9% | 32.4 2% |
| Idle Bottom * (°C) | 36.1 | 27.3 24% | 32.4 10% | 26.2 27% | 38 -5% | 33 9% |
* ... smaller is better
Speakers
Its stereo speakers do a good job overall and are perfectly adequate for videos or some music. However, the laptop's loud fans get in the way when gaming anyway.
Asus ROG Strix Scar 16 2025 audio analysis
(±) | speaker loudness is average but good (81.4 dB)
Bass 100 - 315 Hz
(±) | reduced bass - on average 8.4% lower than median
(±) | linearity of bass is average (9.7% delta to prev. frequency)
Mids 400 - 2000 Hz
(±) | higher mids - on average 5.4% higher than median
(+) | mids are linear (2.9% delta to prev. frequency)
Highs 2 - 16 kHz
(+) | balanced highs - only 1.3% away from median
(+) | highs are linear (3.8% delta to prev. frequency)
Overall 100 - 16.000 Hz
(+) | overall sound is linear (10.7% difference to median)
Compared to same class
» 7% of all tested devices in this class were better, 2% similar, 91% worse
» The best had a delta of 6%, average was 18%, worst was 132%
Compared to all devices tested
» 6% of all tested devices were better, 2% similar, 93% worse
» The best had a delta of 4%, average was 24%, worst was 134%
Asus ROG Strix G16 G615 audio analysis
(+) | speakers can play relatively loud (82.2 dB)
Bass 100 - 315 Hz
(±) | reduced bass - on average 7.5% lower than median
(±) | linearity of bass is average (7.4% delta to prev. frequency)
Mids 400 - 2000 Hz
(+) | balanced mids - only 2.9% away from median
(+) | mids are linear (3.6% delta to prev. frequency)
Highs 2 - 16 kHz
(+) | balanced highs - only 2.8% away from median
(±) | linearity of highs is average (8.3% delta to prev. frequency)
Overall 100 - 16.000 Hz
(+) | overall sound is linear (9.4% difference to median)
Compared to same class
» 3% of all tested devices in this class were better, 2% similar, 95% worse
» The best had a delta of 6%, average was 18%, worst was 132%
Compared to all devices tested
» 3% of all tested devices were better, 1% similar, 96% worse
» The best had a delta of 4%, average was 24%, worst was 134%
Lenovo Legion Pro 7i 16 Gen 10 audio analysis
(±) | speaker loudness is average but good (81.4 dB)
Bass 100 - 315 Hz
(±) | reduced bass - on average 7.6% lower than median
(±) | linearity of bass is average (9.4% delta to prev. frequency)
Mids 400 - 2000 Hz
(+) | balanced mids - only 4.1% away from median
(+) | mids are linear (4.8% delta to prev. frequency)
Highs 2 - 16 kHz
(+) | balanced highs - only 1.9% away from median
(+) | highs are linear (4.8% delta to prev. frequency)
Overall 100 - 16.000 Hz
(+) | overall sound is linear (9.4% difference to median)
Compared to same class
» 3% of all tested devices in this class were better, 2% similar, 95% worse
» The best had a delta of 6%, average was 18%, worst was 132%
Compared to all devices tested
» 3% of all tested devices were better, 1% similar, 96% worse
» The best had a delta of 4%, average was 24%, worst was 134%
HP Omen Max 16 ah000 audio analysis
(±) | speaker loudness is average but good (77.9 dB)
Bass 100 - 315 Hz
(±) | reduced bass - on average 9.9% lower than median
(±) | linearity of bass is average (13.4% delta to prev. frequency)
Mids 400 - 2000 Hz
(+) | balanced mids - only 2.3% away from median
(+) | mids are linear (4.3% delta to prev. frequency)
Highs 2 - 16 kHz
(+) | balanced highs - only 1.9% away from median
(+) | highs are linear (4.8% delta to prev. frequency)
Overall 100 - 16.000 Hz
(+) | overall sound is linear (11.4% difference to median)
Compared to same class
» 9% of all tested devices in this class were better, 3% similar, 88% worse
» The best had a delta of 6%, average was 18%, worst was 132%
Compared to all devices tested
» 7% of all tested devices were better, 2% similar, 91% worse
» The best had a delta of 4%, average was 24%, worst was 134%
Aorus MASTER 16 AM6H audio analysis
(±) | speaker loudness is average but good (75.36 dB)
Bass 100 - 315 Hz
(±) | reduced bass - on average 12.6% lower than median
(±) | linearity of bass is average (9% delta to prev. frequency)
Mids 400 - 2000 Hz
(+) | balanced mids - only 2.8% away from median
(+) | mids are linear (4.4% delta to prev. frequency)
Highs 2 - 16 kHz
(+) | balanced highs - only 1.8% away from median
(+) | highs are linear (3.8% delta to prev. frequency)
Overall 100 - 16.000 Hz
(+) | overall sound is linear (13.5% difference to median)
Compared to same class
» 19% of all tested devices in this class were better, 7% similar, 73% worse
» The best had a delta of 6%, average was 18%, worst was 132%
Compared to all devices tested
» 14% of all tested devices were better, 4% similar, 82% worse
» The best had a delta of 4%, average was 24%, worst was 134%
Asus ROG Strix Scar 16 G634JZR audio analysis
(±) | speaker loudness is average but good (79 dB)
Bass 100 - 315 Hz
(±) | reduced bass - on average 7.1% lower than median
(±) | linearity of bass is average (9% delta to prev. frequency)
Mids 400 - 2000 Hz
(±) | higher mids - on average 5.5% higher than median
(+) | mids are linear (3.3% delta to prev. frequency)
Highs 2 - 16 kHz
(+) | balanced highs - only 1.4% away from median
(+) | highs are linear (2.6% delta to prev. frequency)
Overall 100 - 16.000 Hz
(+) | overall sound is linear (9.8% difference to median)
Compared to same class
» 5% of all tested devices in this class were better, 1% similar, 94% worse
» The best had a delta of 6%, average was 18%, worst was 132%
Compared to all devices tested
» 4% of all tested devices were better, 1% similar, 95% worse
» The best had a delta of 4%, average was 24%, worst was 134%
Power consumption

The ROG Strix SCAR 16 is by no means a frugal laptop and its mini LED panel requires a lot of power, especially at high brightness levels. During the stress test, we briefly measured a maximum of 370 watts, which then quickly leveled off at around 310 watts. You can expect around 290 watts when gaming, which is why the supplied 380-watt power supply unit is definitely sufficient in size. Its standby consumption of 2.3 watts (despite deactivated lighting) is too high.
| Off / Standby | |
| Idle | |
| Load |
|
Key:
min: | |
| Asus ROG Strix Scar 16 2025 Ultra 9 275HX, GeForce RTX 5090 Laptop, WD PC SN8000S 2TB, Mini-LED, 2560x1600, 16" | Asus ROG Strix G16 G615 Ultra 9 275HX, GeForce RTX 5080 Laptop, Micron 2500 1TB MTFDKBA1T0QGN, IPS, 2560x1600, 16" | Lenovo Legion Pro 7i 16 Gen 10 Ultra 9 275HX, GeForce RTX 5080 Laptop, SK Hynix HFS001TEJ9X115N, OLED, 2560x1600, 16" | HP Omen Max 16 ah000 Ultra 9 275HX, GeForce RTX 5090 Laptop, WDC PC SN810 2TB, OLED, 2560x1600, 16" | Aorus MASTER 16 AM6H Ultra 9 275HX, GeForce RTX 5090 Laptop, Kingston OM8PGP41024Q-A0, OLED, 2560x1600, 16" | Asus ROG Strix Scar 16 G634JZR i9-14900HX, GeForce RTX 4080 Laptop GPU, SK hynix PC801 HFS002TEJ9X101N, Mini LED, 2560x1600, 16" | Average NVIDIA GeForce RTX 5090 Laptop | Average of class Gaming | |
|---|---|---|---|---|---|---|---|---|
| Power Consumption | 23% | -11% | 17% | 8% | 31% | 19% | 36% | |
| Idle Minimum * (Watt) | 22.5 | 10.8 52% | 28.5 -27% | 9.9 56% | 25 -11% | 10.71 52% | 16.2 ? 28% | 13.3 ? 41% |
| Idle Average * (Watt) | 32.2 | 17.7 45% | 38.8 -20% | 28.6 11% | 29.4 9% | 14.75 54% | 24.3 ? 25% | 19 ? 41% |
| Idle Maximum * (Watt) | 34.3 | 18.8 45% | 45.6 -33% | 47.1 -37% | 31 10% | 30 13% | 30.3 ? 12% | 24.5 ? 29% |
| Load Average * (Watt) | 169.3 | 139.4 18% | 132.2 22% | 141.8 16% | 109 36% | 135 20% | 135.3 ? 20% | 108.1 ? 36% |
| Cyberpunk 2077 ultra * (Watt) | 294 | 295 -0% | 318 -8% | 253 14% | 290 1% | |||
| Cyberpunk 2077 ultra external monitor * (Watt) | 288 | 291 -1% | 319 -11% | 230 20% | 292 -1% | |||
| Load Maximum * (Watt) | 371.5 | 359.3 3% | 384 -3% | 233 37% | 325 13% | 307 17% | 336 ? 10% | 254 ? 32% |
| Witcher 3 ultra * (Watt) | 286 |
* ... smaller is better
Power consumption Cyberpunk / stress test
Power consumption with external monitor
Runtimes
The laptop's high idle consumption makes itself known in its battery life. During the WLAN test at 150 cd/m², we still measured 6.5 hours but at full brightness, it didn't even manage 3 hours.

Notebookcheck total rating
Asus ROG Strix Scar 16 2025
- 05/07/2025 v8
Andreas Osthoff
 Total Sustainability Score:
 Possible alternatives compared
Image | Model / Review | Price | Weight | Height | Display |
|---|---|---|---|---|---|
1. 88.4%  | Asus ROG Strix Scar 16 2025 Intel Core Ultra 9 275HX ⎘ NVIDIA GeForce RTX 5090 Laptop ⎘ 64 GB Memory, 2048 GB SSD | Amazon: List Price: 4999€ | 2.8 kg | 30.8 mm | 16.00" 2560x1600 189 PPI Mini-LED |
2. 87.3%  | Asus ROG Strix G16 G615 Intel Core Ultra 9 275HX ⎘ NVIDIA GeForce RTX 5080 Laptop ⎘ 32 GB Memory, 1024 GB SSD | Amazon: 1. $2,150.61 ASUS ROG Strix G16 (2025) Ga... 2. $1,829.99 ASUS ROG Strix G16 G615LR-MS... 3. $1,214.31 ASUS ROG Strix G16 (2025) Ga... List Price: 3299€ | 2.6 kg | 30.8 mm | 16.00" 2560x1600 189 PPI IPS |
3. 87.5%  | Lenovo Legion Pro 7i 16 Gen 10 Intel Core Ultra 9 275HX ⎘ NVIDIA GeForce RTX 5080 Laptop ⎘ 32 GB Memory, 1024 GB SSD | Amazon: List Price: 4200 USD | 2.6 kg | 26.65 mm | 16.00" 2560x1600 189 PPI OLED |
4. 81.9%  | HP Omen Max 16 ah000 Intel Core Ultra 9 275HX ⎘ NVIDIA GeForce RTX 5090 Laptop ⎘ 32 GB Memory, 2048 GB SSD | Amazon: List Price: 3800 USD | 2.8 kg | 24.9 mm | 16.00" 2560x1600 189 PPI OLED |
5. 85.1%  | Aorus MASTER 16 AM6H Intel Core Ultra 9 275HX ⎘ NVIDIA GeForce RTX 5090 Laptop ⎘ 32 GB Memory, 1024 GB SSD | Amazon: List Price: 4.75 Euro | 2.5 kg | 29.9 mm | 16.00" 2560x1600 189 PPI OLED |
6. 87.6% v7 (old)  | Asus ROG Strix Scar 16 G634JZR Intel Core i9-14900HX ⎘ NVIDIA GeForce RTX 4080 Laptop GPU ⎘ 32 GB Memory, 2048 GB SSD | Amazon: List Price: 3199 EUR | 2.7 kg | 30.4 mm | 16.00" 2560x1600 189 PPI Mini LED |
Transparency
The selection of devices to be reviewed is made by our editorial team. The test sample was provided to the author as a loan by the manufacturer or retailer for the purpose of this review. The lender had no influence on this review, nor did the manufacturer receive a copy of this review before publication. There was no obligation to publish this review. As an independent media company, Notebookcheck is not subjected to the authority of manufacturers, retailers or publishers.
This is how Notebookcheck is testing
Every year, Notebookcheck independently reviews hundreds of laptops and smartphones using standardized procedures to ensure that all results are comparable. We have continuously developed our test methods for around 20 years and set industry standards in the process. In our test labs, high-quality measuring equipment is utilized by experienced technicians and editors. These tests involve a multi-stage validation process. Our complex rating system is based on hundreds of well-founded measurements and benchmarks, which maintains objectivity. Further information on our test methods can be found here.

