The 18-inch gamer with great mini LED and an RTX 5090 Laptop - Asus Strix SCAR 18 G835LX review
For gamers and creatives alike.
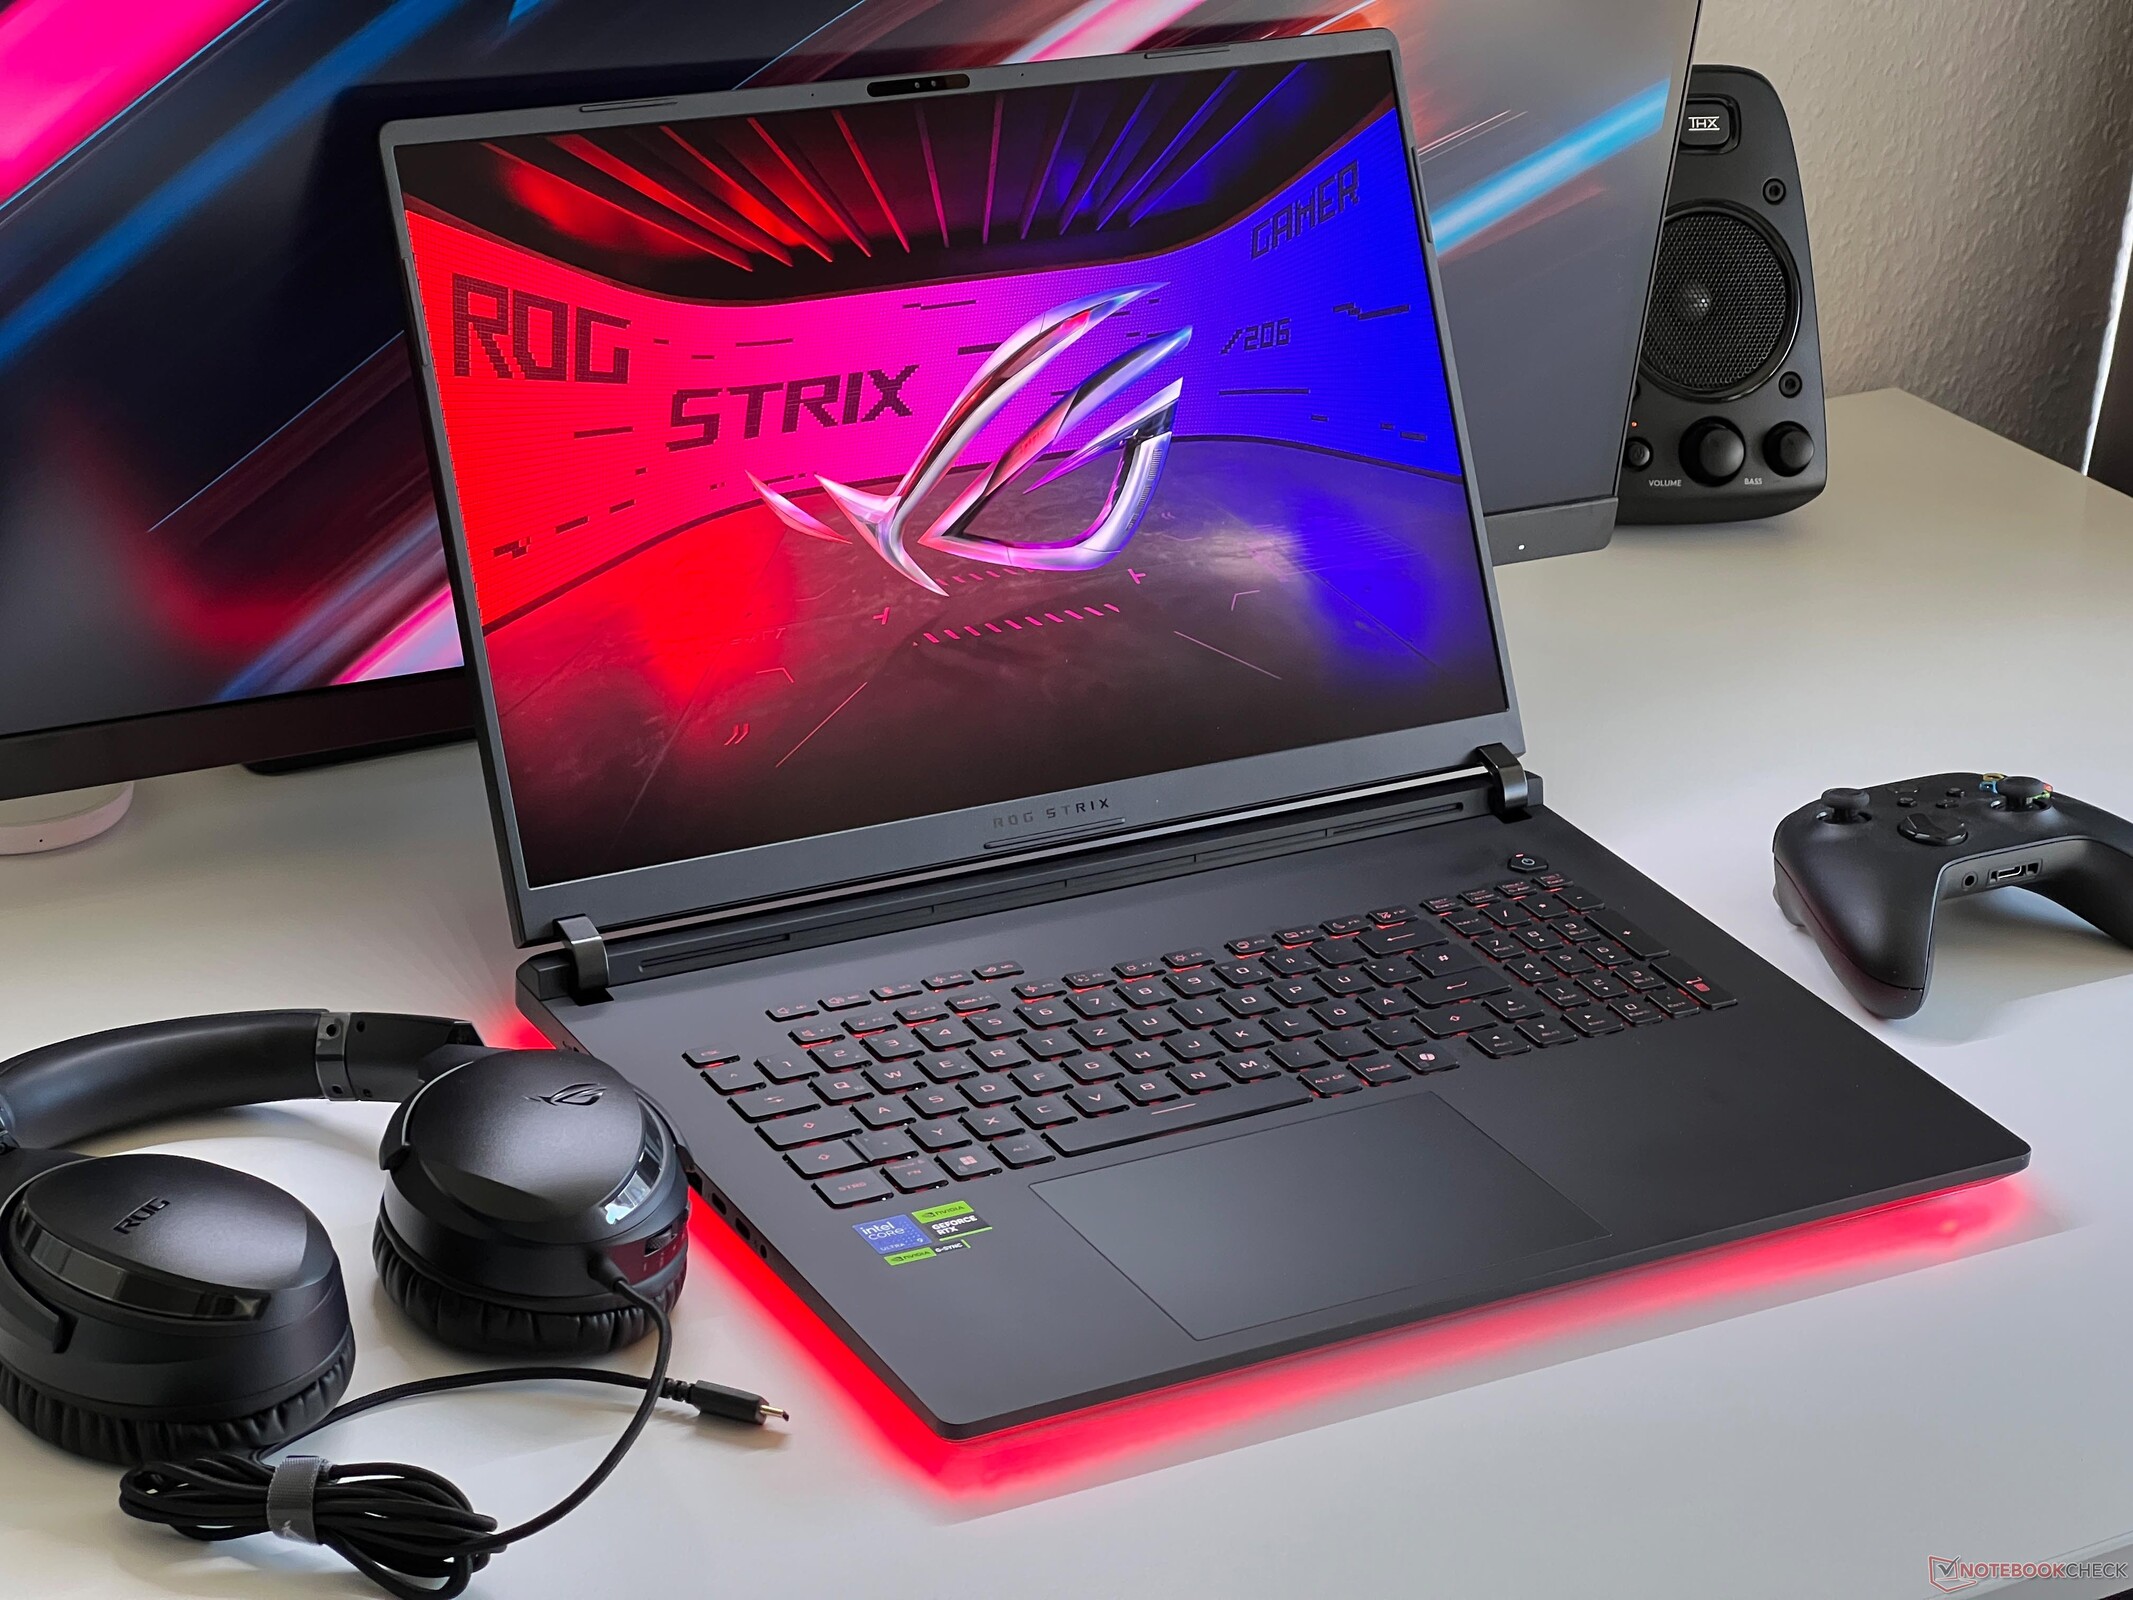
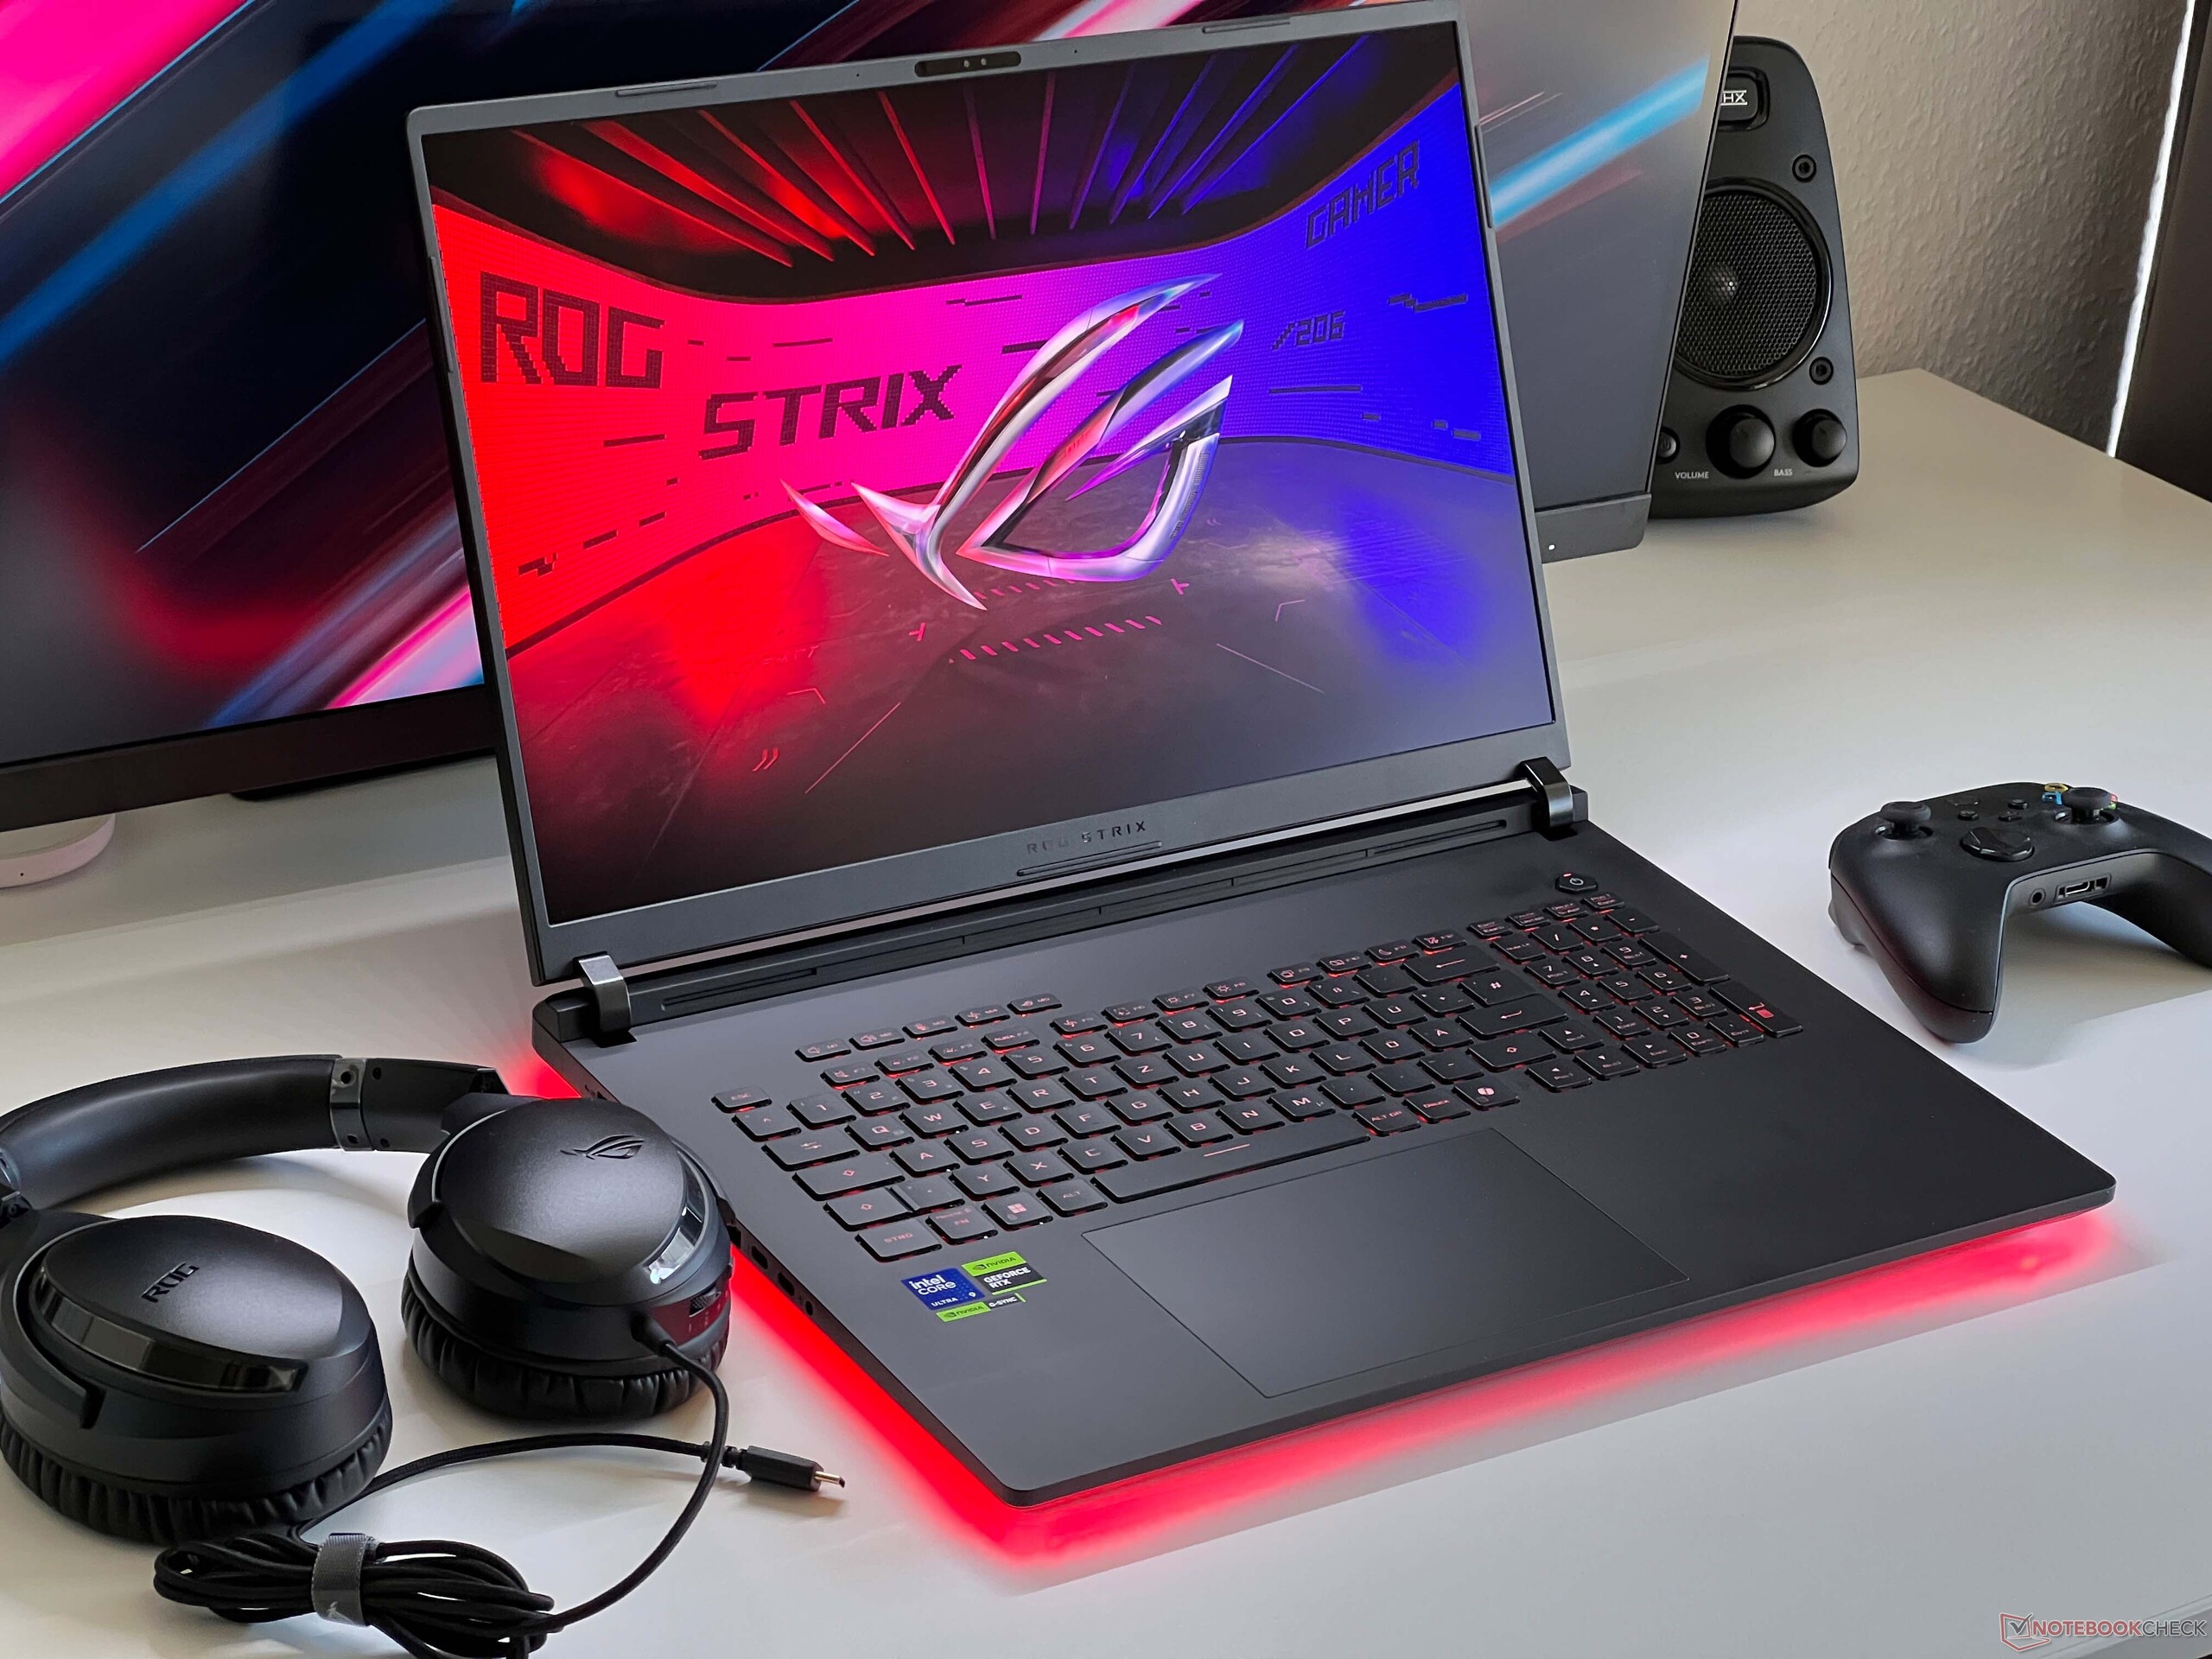
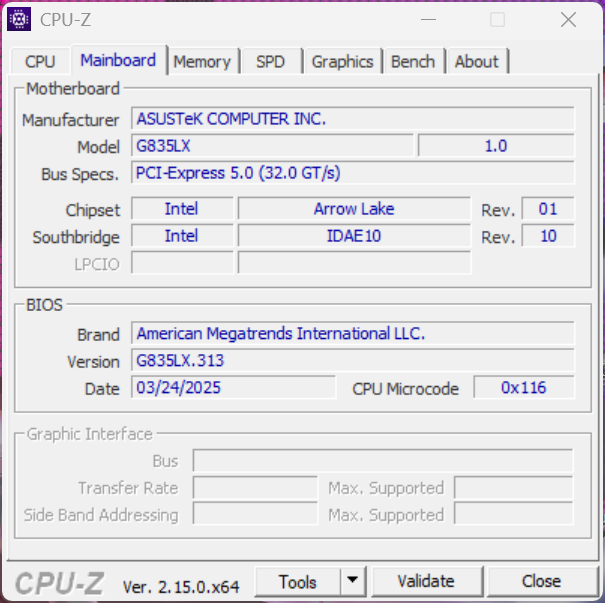
Asus has updated its gaming flagship Strix SCAR 18 with the Core Ultra 9 275HX, GeForce RTX 5090 Laptop and an outstanding mini LED display at 240 Hz. In addition, access to the device's components has been made much easier and there are plenty of lighting elements.Andreas Osthoff, 👁 Andreas Osthoff (translated by Daisy Dickson) Published 🇩🇪 🇫🇷 ...
Verdict - More power, a more stylish case and a great mini LED panel
The ROG Strix SCAR 18 is Asus' gaming flagship and this becomes clear as soon as you look at its technical data. It features the fastest components in the shape of the Core Ultra 9 275HX and the GeForce RTX 5090 Laptop, although its advantage over the old RTX 4090 Laptop is relatively small when gaming, especially in its native WQHD resolution. Only when using upscaling methods such as MFG4x can the new 5090 Laptop clearly set itself apart. Upgrading definitely makes more sense for owners of gaming laptops with RTX 3000 GPUs.
There have been some changes made to its case and its overall design is now a little tidier, while its lighting options have also been expanded with its all-around LED strip and AniME Vision display on the lid. The base unit is still made of plastic but unfortunately, the smooth surface on the top in particular gets dirty extremely quickly. Access to the components is now possible without the need for a screwdriver and the laptop's maintenance options are excellent, although our test device was already pretty well equipped. Its RAID 0 combination of SSDs isn't totally ideal—we would have preferred the use of a fast PCIe 5.0 slot because this would mean even better results with a single drive.
Its 240-Hz mini LED display is impressive in almost every respect and, in addition to the display's pure specs, Asus' additional modes are also pretty interesting. First of all, this includes super accurate factory profiles for P3 and sRGB, and you can deactivate local dimming for image editing. In HDR mode, it is also possible to convert the pale sRGB colors (when no HDR content is shown, for example the Windows desktop) into the P3 color space.
Disadvantages of the laptop include its noisy cooling in Performance and Turbo mode and, of course, its high power consumption. Then there's its price, which is extremely high, especially for our high-end version costing approximately $6,200—at least there are some accessories included. However, it makes more sense to buy a cheaper model with less memory and then easily expand it yourself if necessary.
The Strix SCAR 18 is the first of the new 18-inch gaming laptops that we have tested, but the competitor models will certainly follow soon and only then will we be able to say for sure how well the new SCAR 18 performs.
Pros
Cons
Price and availability
The new Asus ROG Strix SCAR 18 will likely be available from the end of April/beginning of May.
Table of Contents
- Verdict - More power, a more stylish case and a great mini LED panel
- Specifications
- Case - Lots of light, little shade
- Connectivity - The SCAR 18 with Thunderbolt 5
- Input devices
- Display - Great mini LED panel at 240 Hz
- Performance - Arrow Lake-HX and RTX 5000 Laptop
- Emissions
- Energy management - Short battery life
- Notebookcheck total rating
- Possible alternatives compared
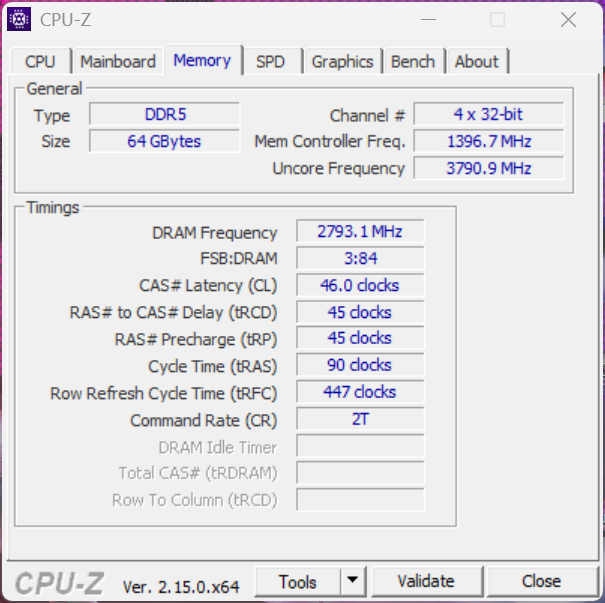
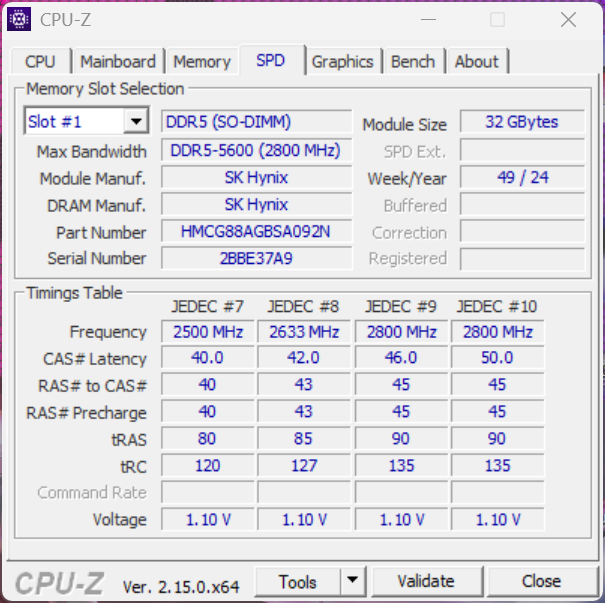
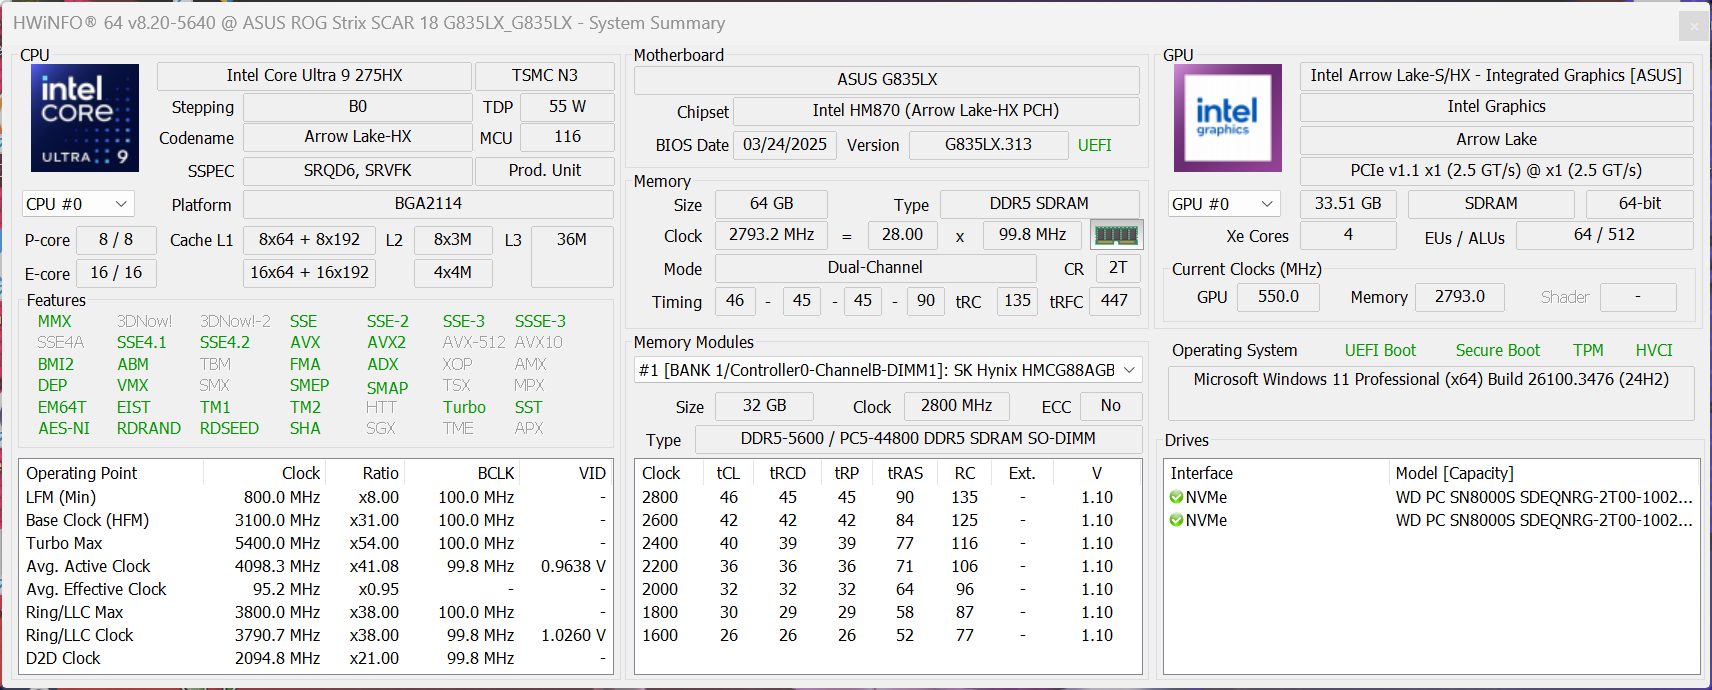
The ROG Strix SCAR 18 G835LX is the first new 18-inch gaming laptop to feature the Intel Core Ultra 9 275HX and the Nvidia GeForce RTX 5090 Laptop, and it's also Asus' gaming flagship of 2025. In addition, the device has a mini LED panel at 240 Hz, 64 GB RAM and a 4-TB SSD capacity for a price of around $6,200.
Specifications
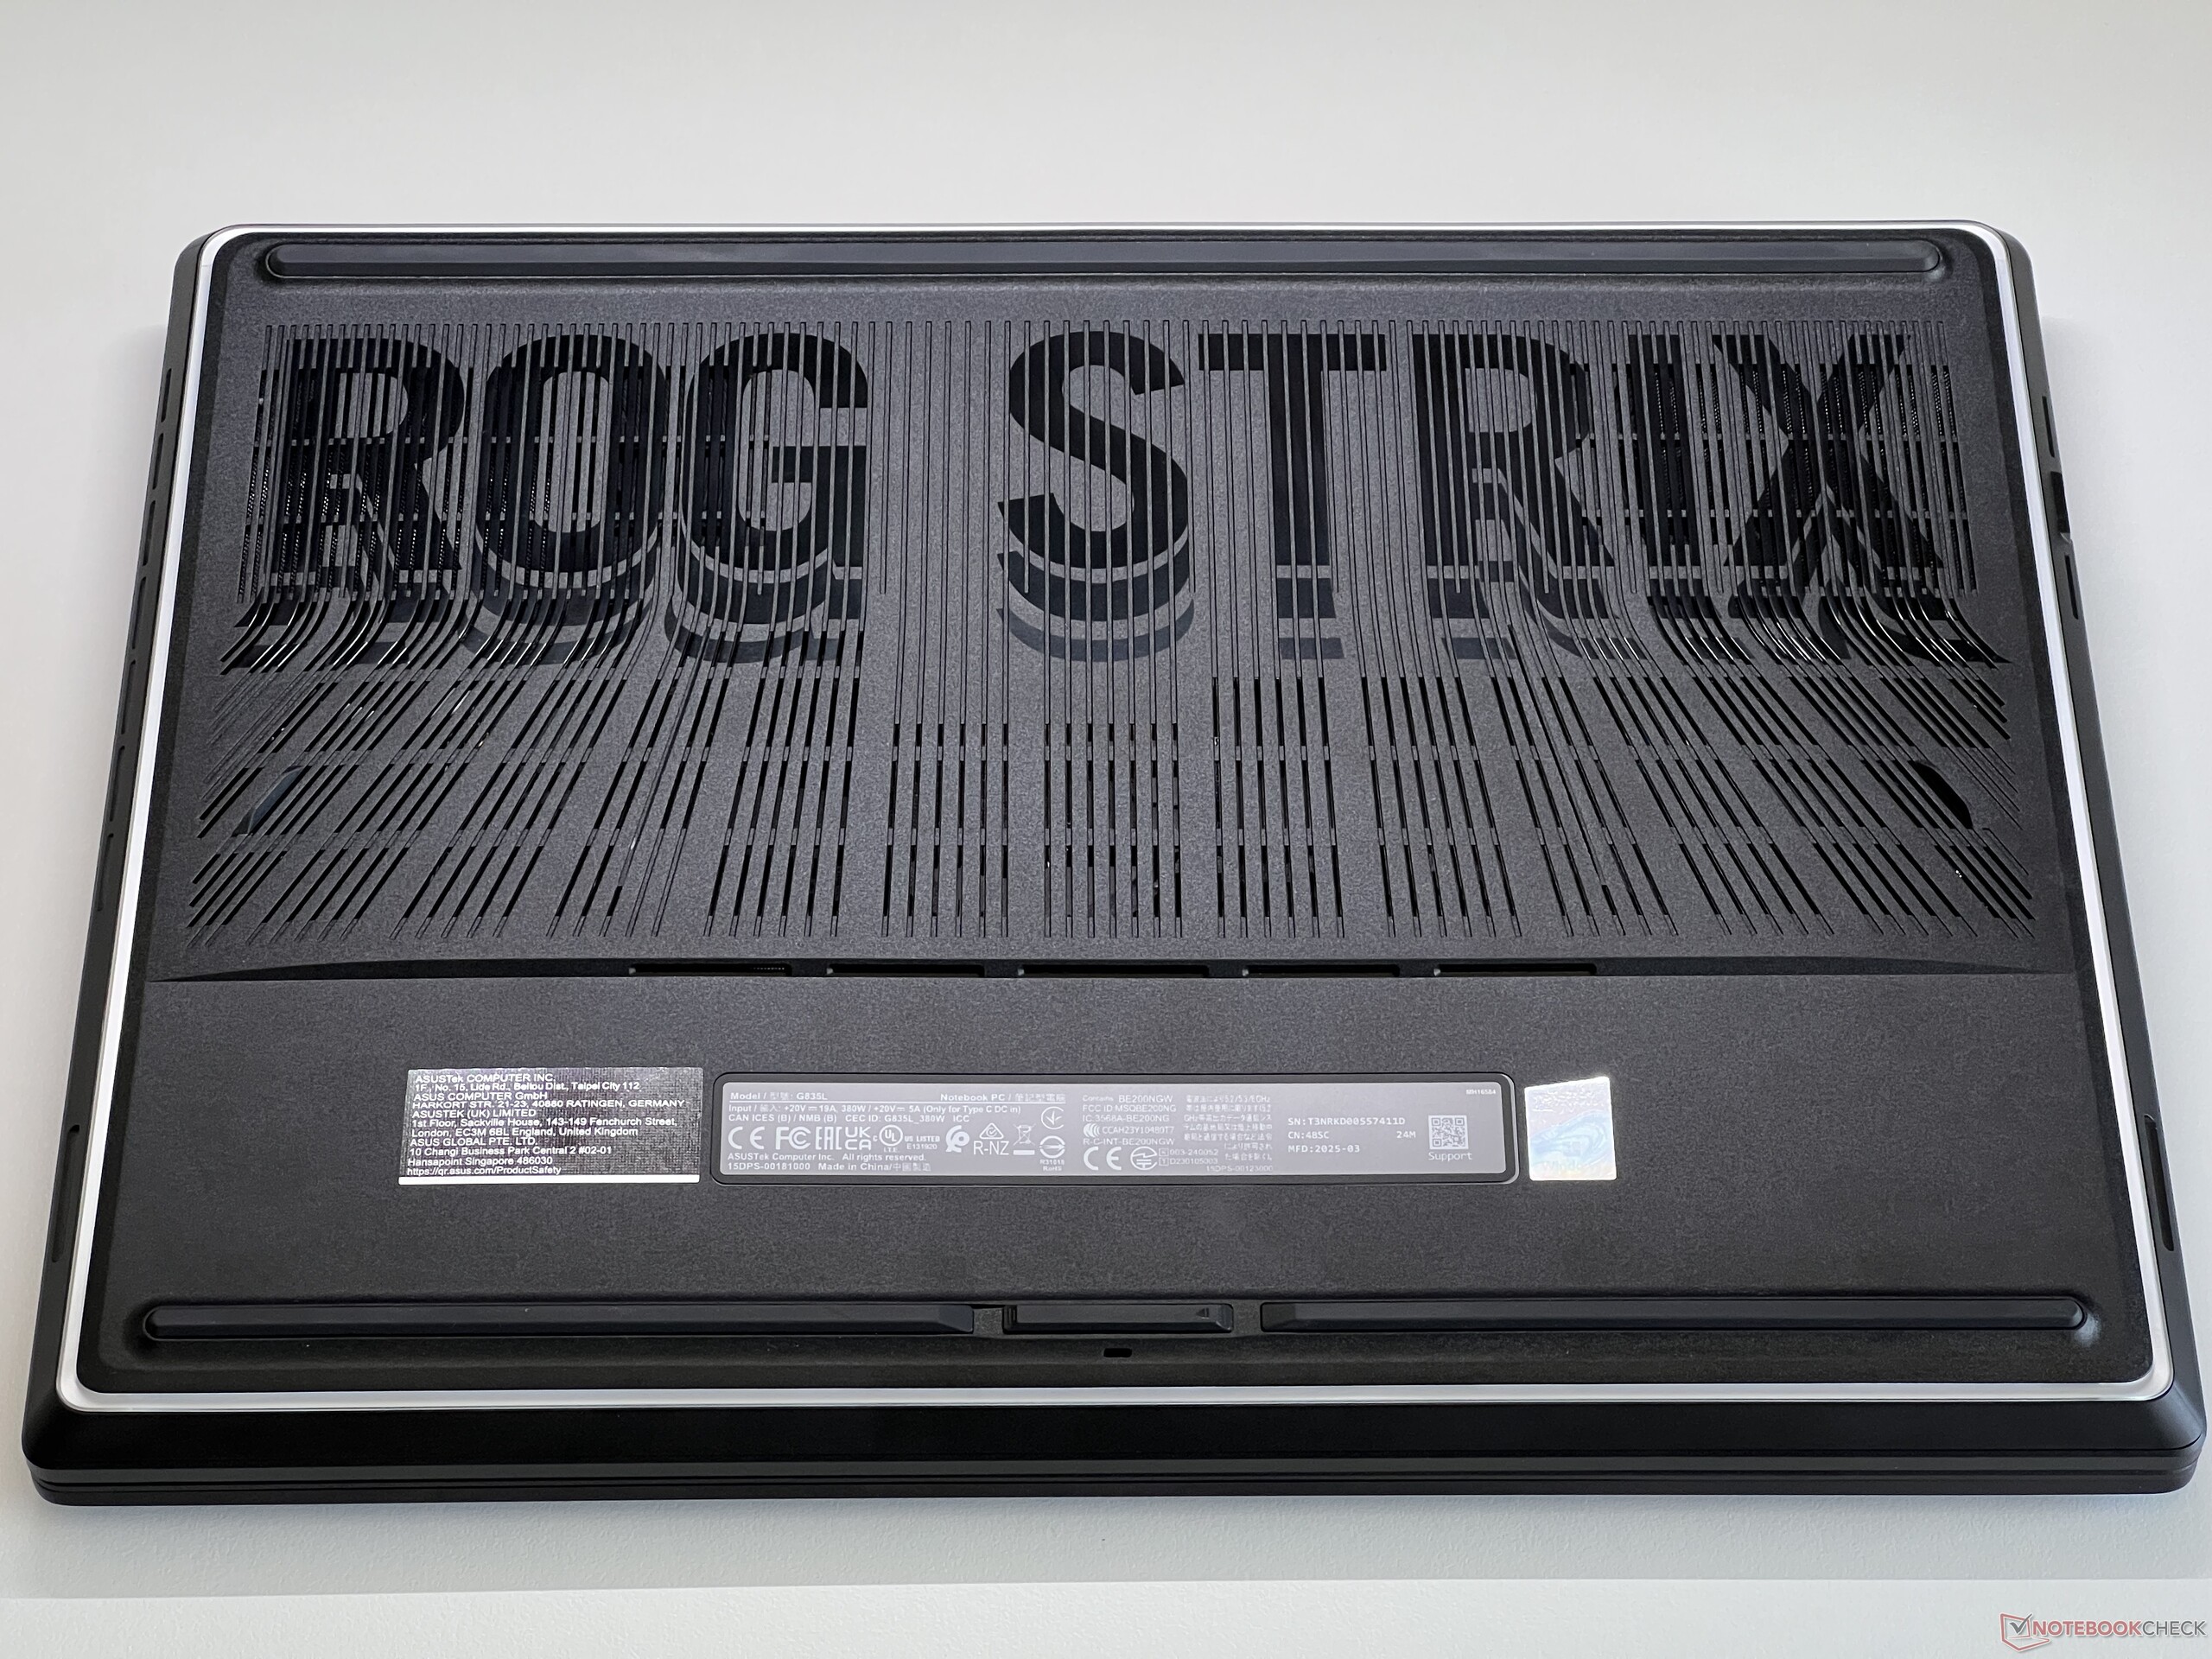
Case - Lots of light, little shade
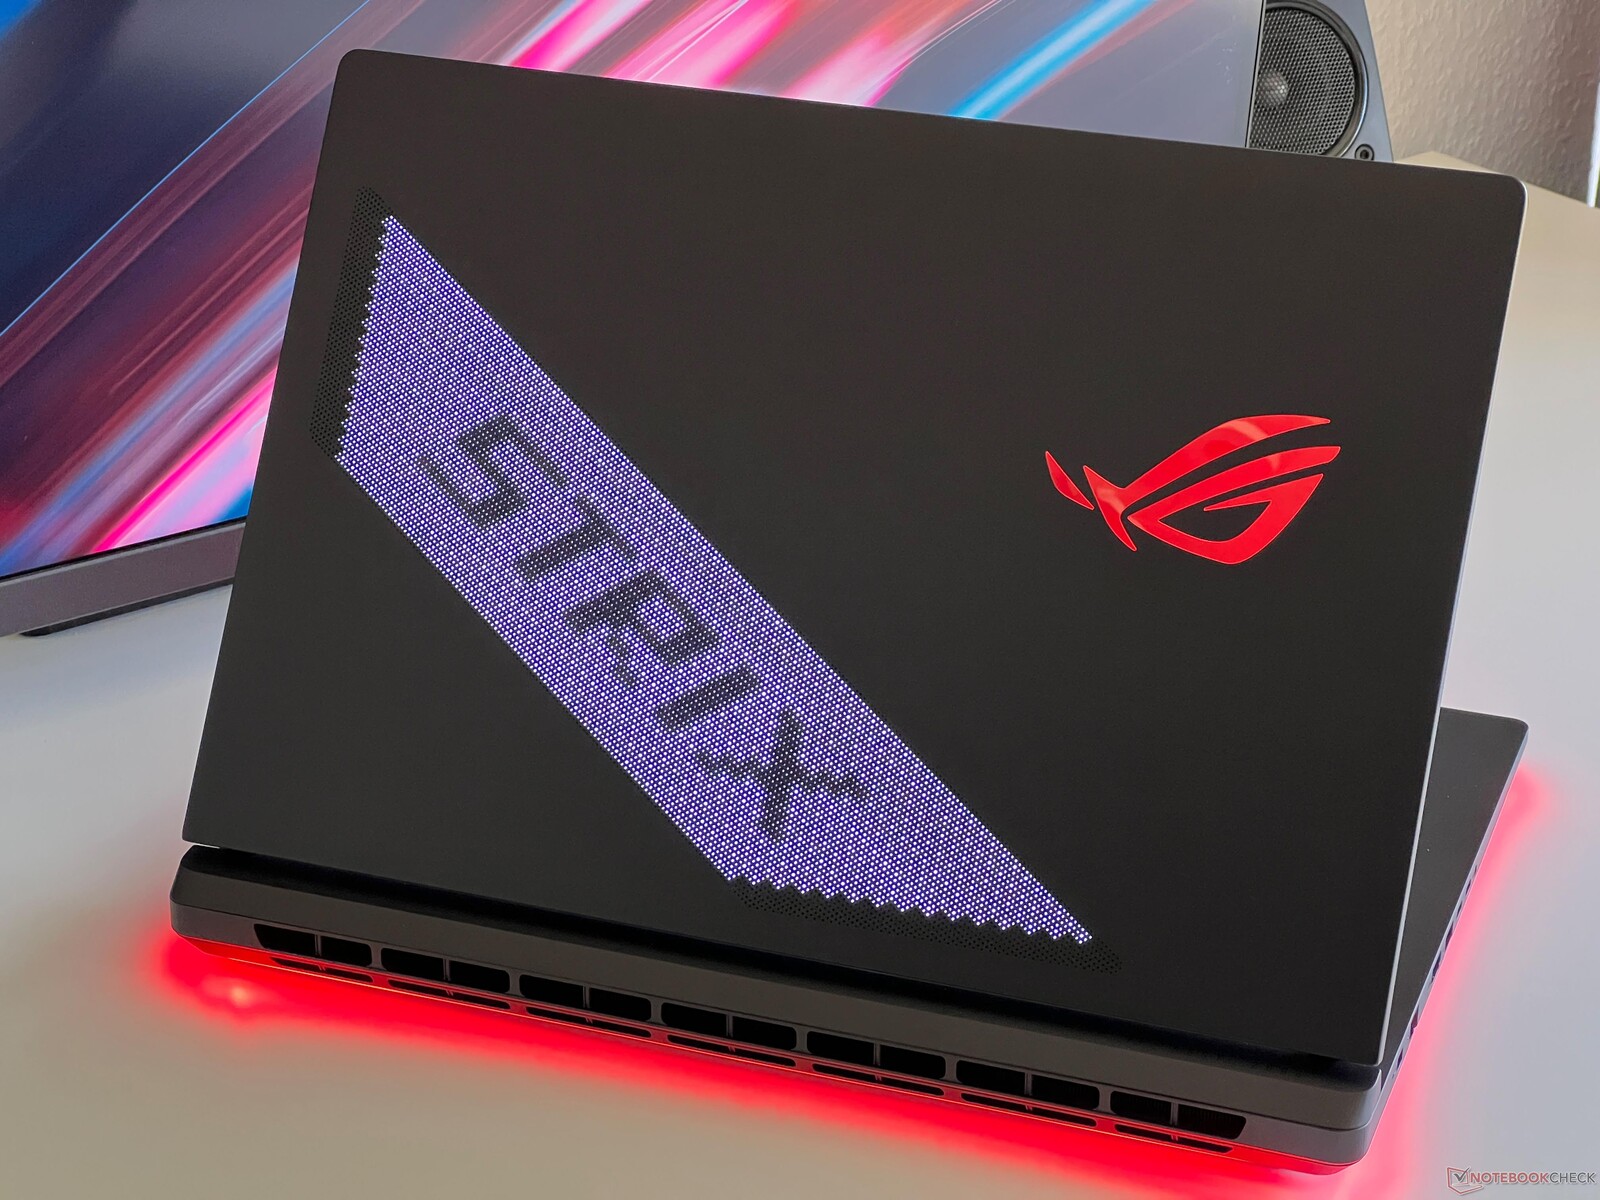
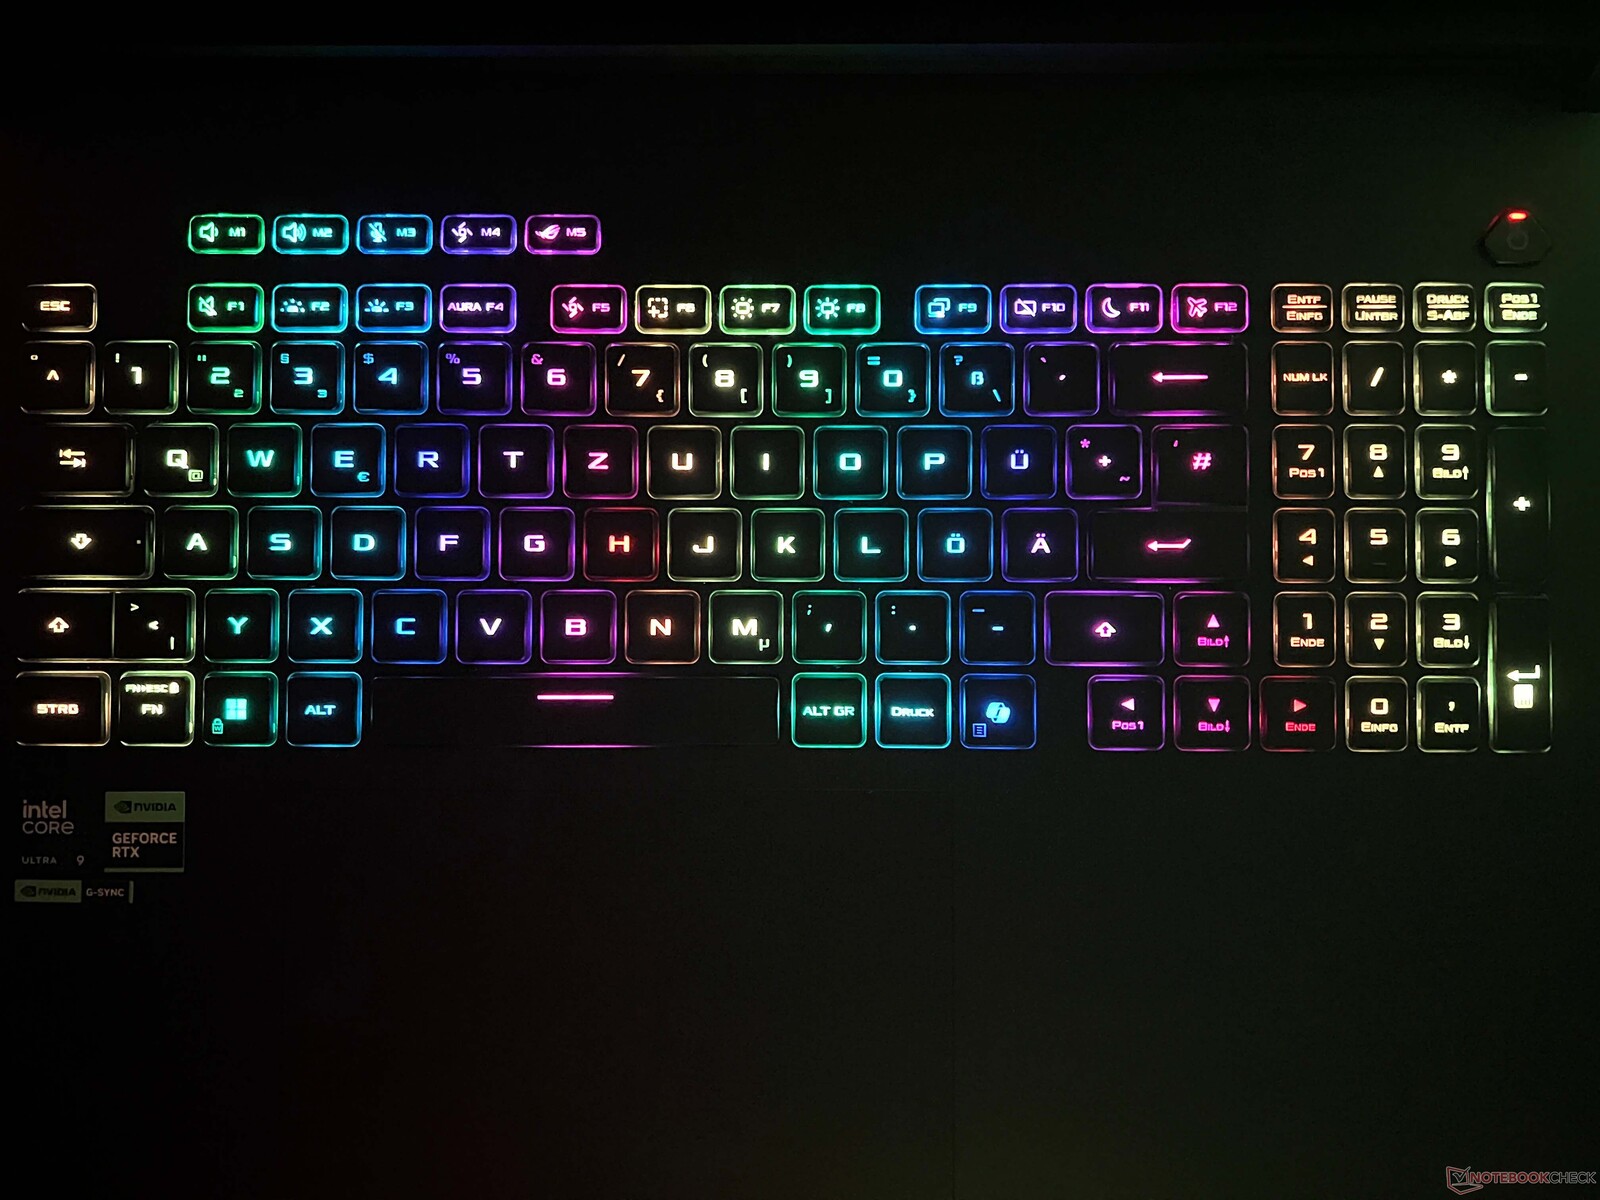
Asus has revised the laptop's entire case and its design now looks much more stylish. The all-around LED strip on the underside and the new AniME Vision dot-matrix display on the lid are both new. Together with the RGB keyboard backlighting and the ROG logo, you can let your creativity run wild here. The AniME-Vision display is a nice gimmick and, in addition to ready-made lettering and animations, you can use your own images as animations, too.
Aluminum is again used for the screen cover and plastic for the base unit. The case's overall stability is very good, but the base unit's smooth surface in particular is extremely sensitive to fingerprint marks and has to be regularly wiped with a damp cloth. The hinges hold the lid firmly in position (max. opening angle 135 degrees), but a slight rocking can't be completely prevented when you adjust its angle. All-in-all, the case is fine, but for a high-end product, we would have preferred one made entirely of metal.
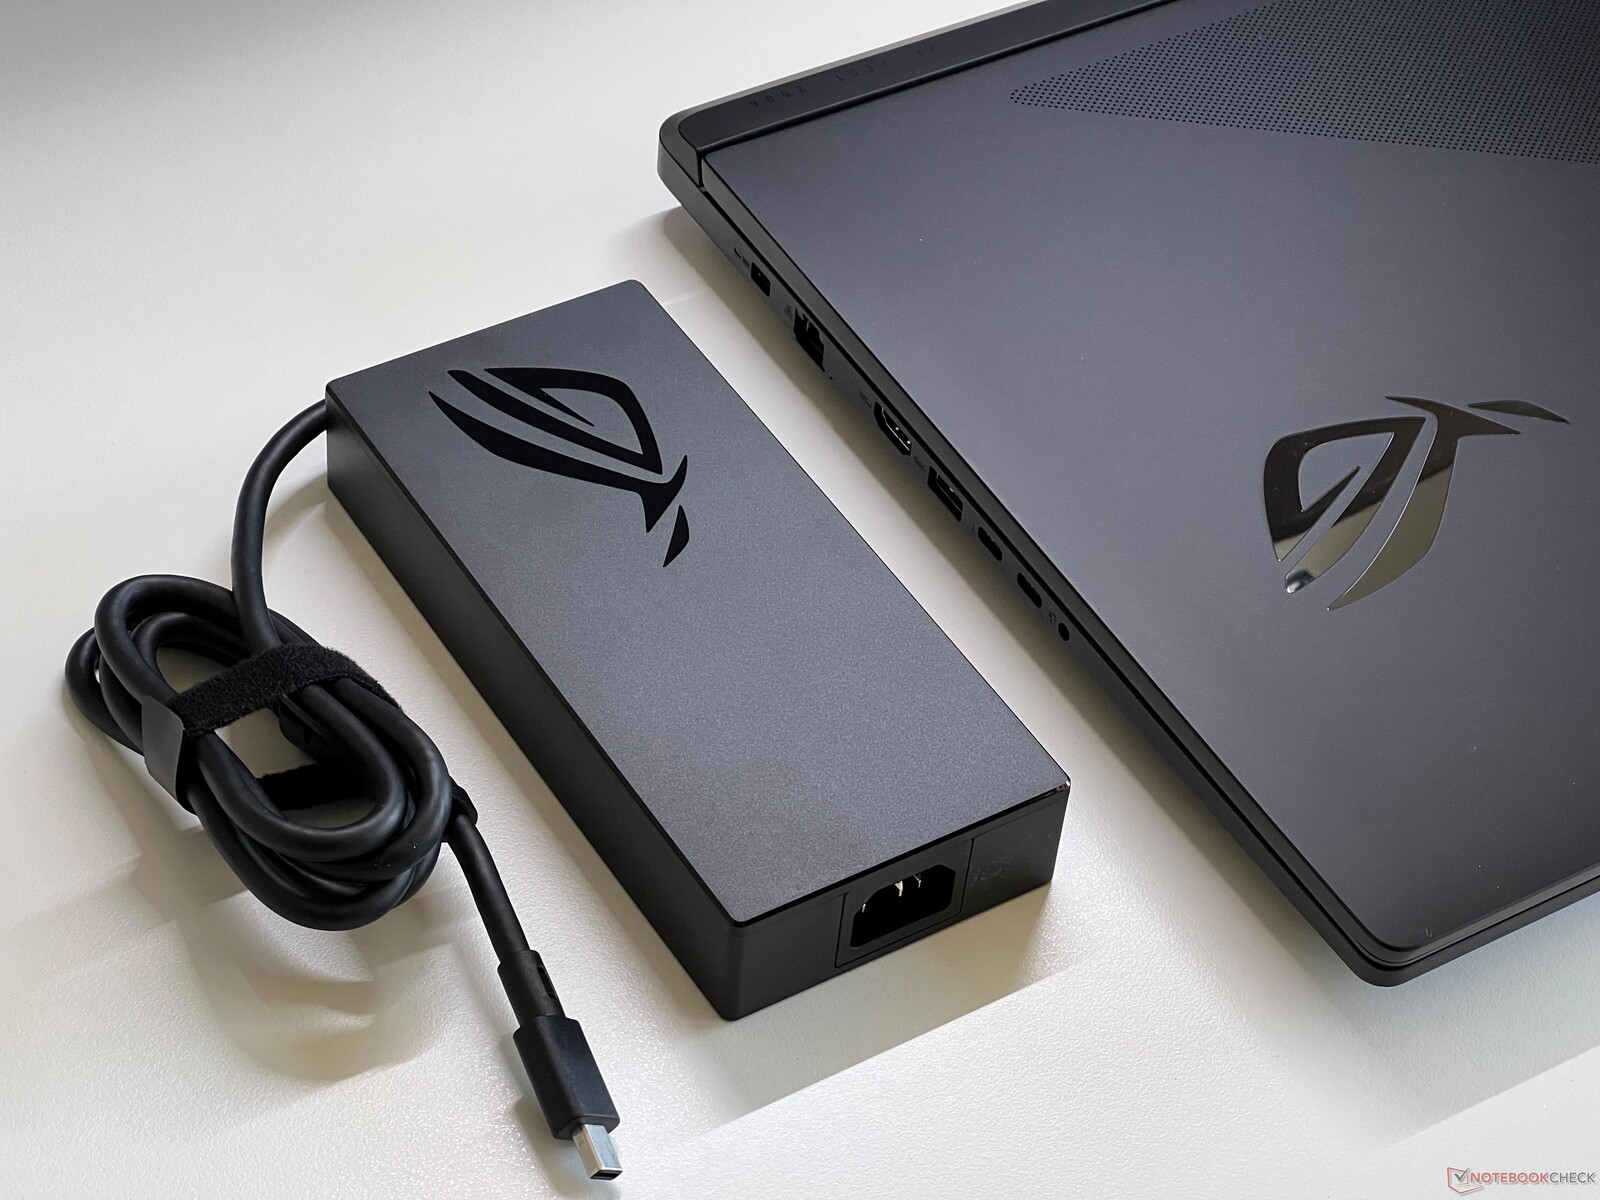
Among the 18-inch gamers, the new Strix SCAR 18 is relatively compact and, at 3.3 kilograms, is in the midfield when it comes to weight as well. The 380-watt power supply unit weighs an additional 986 grams.
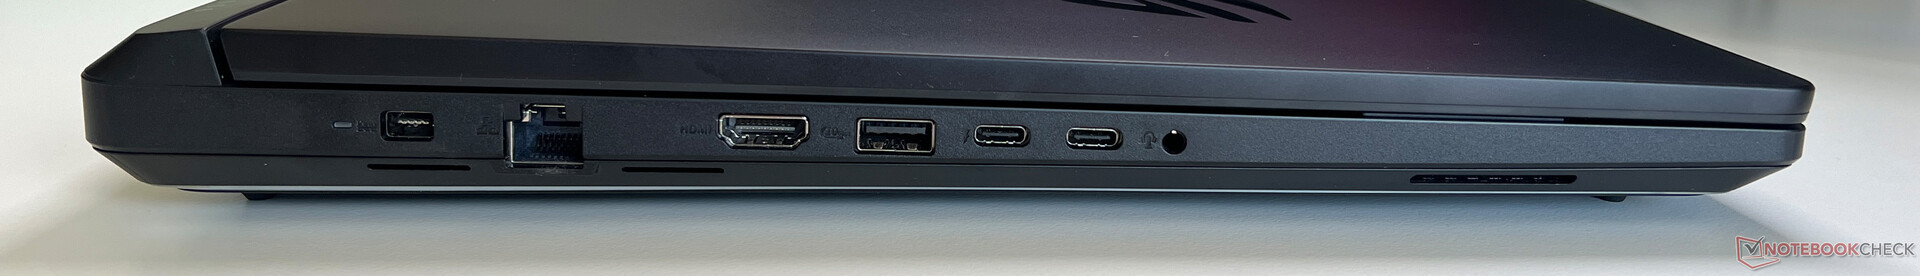
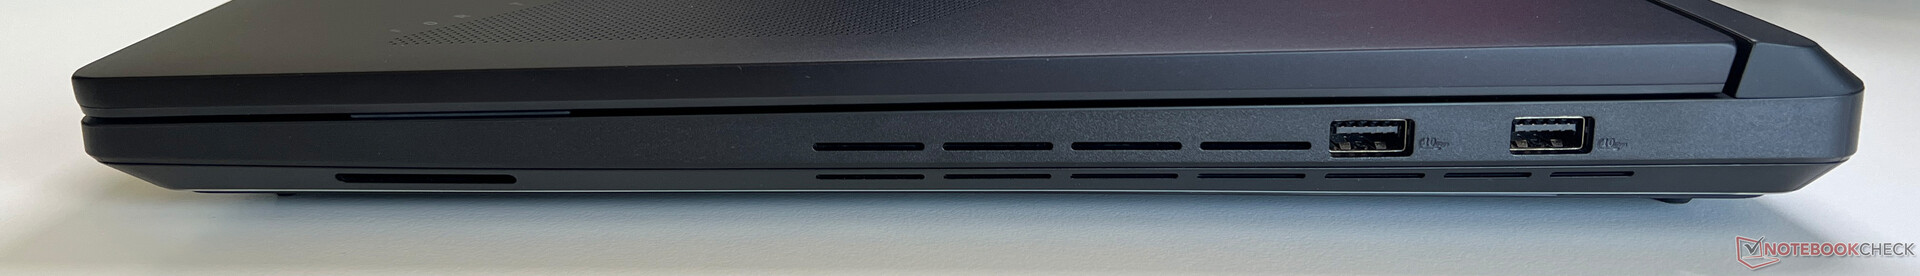
Connectivity - The SCAR 18 with Thunderbolt 5
Its port distribution hasn't changed, but the two USB-C ports now support Thunderbolt 5 at up to 120 GB/s. There not being any ports on the back (e.g. power, display, Ethernet) isn't ideal. Due to the laptop's weak Arrow Lake NPU, it isn't allowed to bear the Copilot+ designation, but functions such as the webcam's Studio Effects or live subtitles are supported.
Communication
In addition to a 2.5 Gbit/s Ethernet connection, the SCAR 18 features a modern Wi-Fi 7 module including Bluetooth 5.4. Its transfer rates in connection with our reference router from Asus were high and stable. There were no problems with the signal quality during our test.
| Networking | |
| Asus Strix Scar 18 G835LX | |
| iperf3 transmit AXE11000 | |
| iperf3 receive AXE11000 | |
| Razer Blade 18 2024 RZ09-0509 | |
| iperf3 transmit AXE11000 | |
| iperf3 receive AXE11000 | |
| iperf3 transmit AXE11000 6GHz | |
| iperf3 receive AXE11000 6GHz | |
| Alienware m18 R2 | |
| iperf3 transmit AXE11000 | |
| iperf3 receive AXE11000 | |
| iperf3 transmit AXE11000 6GHz | |
| iperf3 receive AXE11000 6GHz | |
| Acer Predator Helios 18 PH18-72-98MW | |
| iperf3 transmit AXE11000 | |
| iperf3 receive AXE11000 | |
| MSI Titan 18 HX A14VIG | |
| iperf3 transmit AXE11000 | |
| iperf3 receive AXE11000 | |
| iperf3 transmit AXE11000 6GHz | |
| iperf3 receive AXE11000 6GHz | |
| Schenker Key 17 Pro (M24) | |
| iperf3 transmit AXE11000 | |
| iperf3 receive AXE11000 | |
| iperf3 transmit AXE11000 6GHz | |
| iperf3 receive AXE11000 6GHz | |
| Asus ROG Strix Scar 18 G834JYR (2024) | |
| iperf3 transmit AXE11000 | |
| iperf3 receive AXE11000 | |
Webcam
The Asus laptop still has a 2 MP webcam without a shutter, which does its job but you shouldn't expect too much from its image quality. An IR camera for facial recognition via Windows Hello is also on board.


Accessories
Aside from a backpack, our test device also came with the wired ROG Fusion II 300 headset, the Gladius III gaming mouse and an additional 100-watt USB-C power supply.
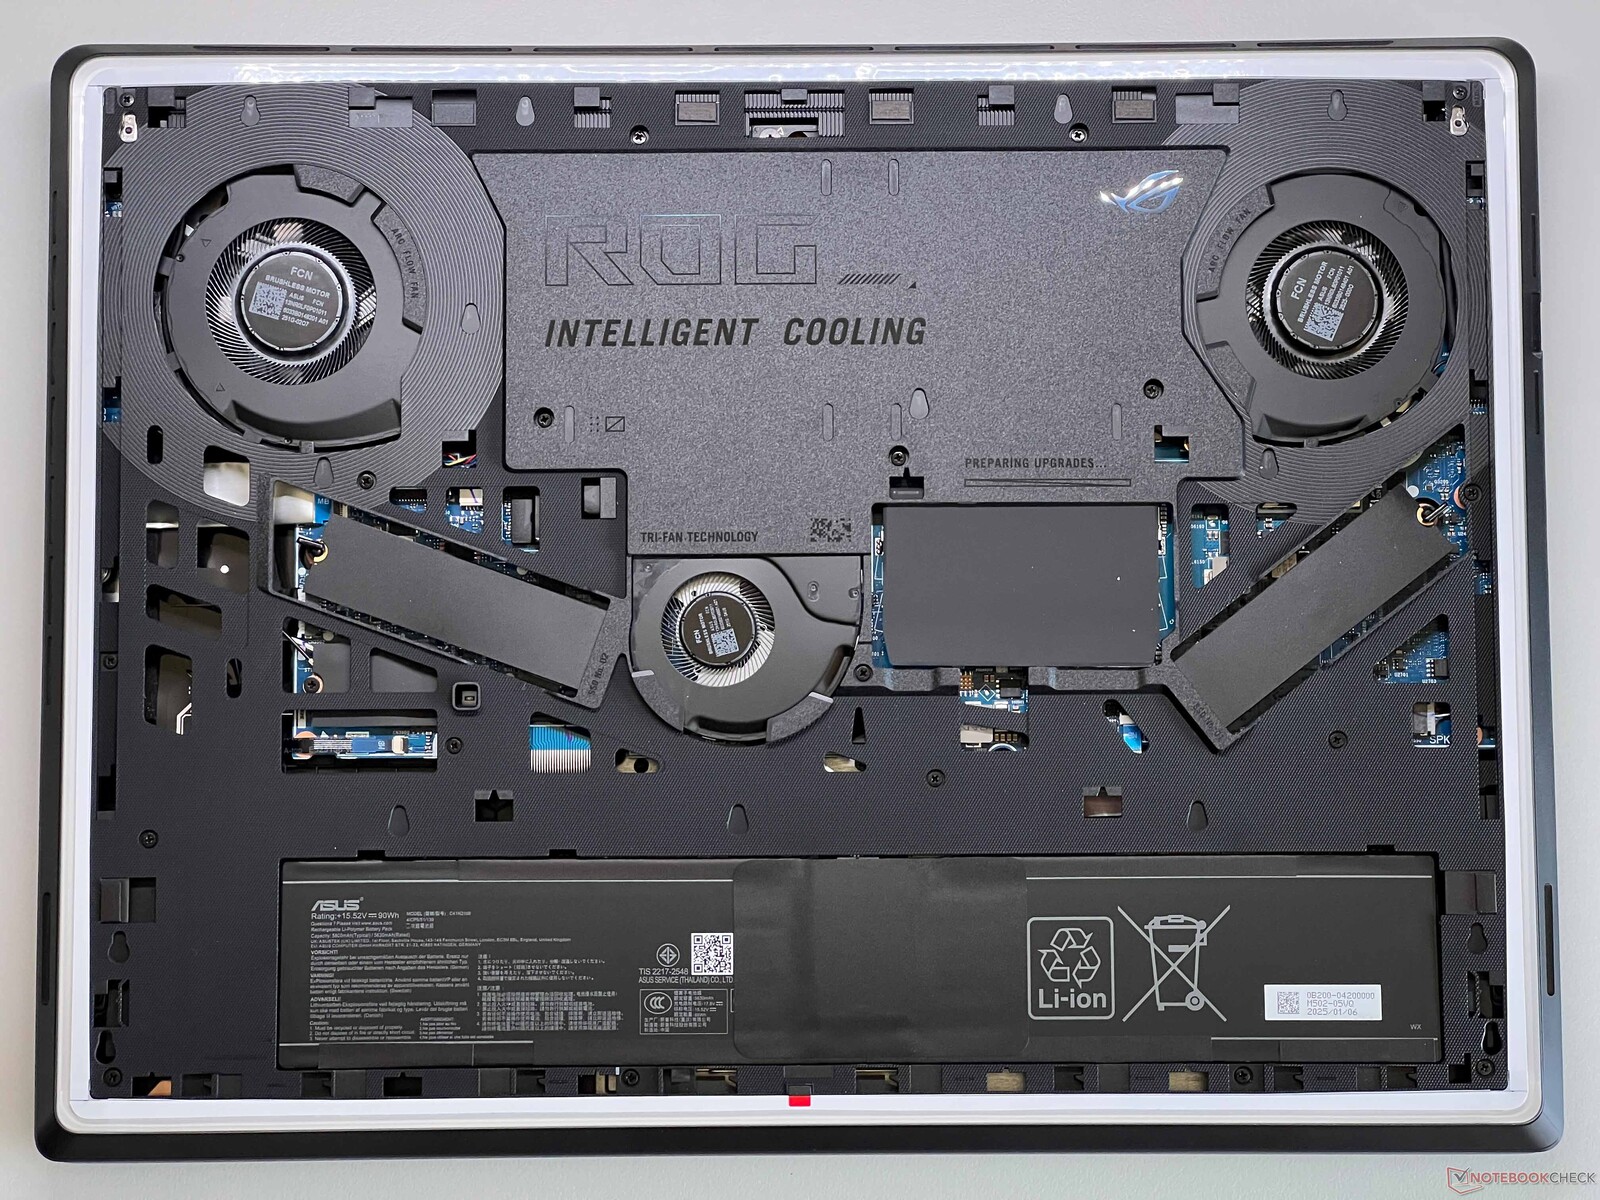
Maintenance
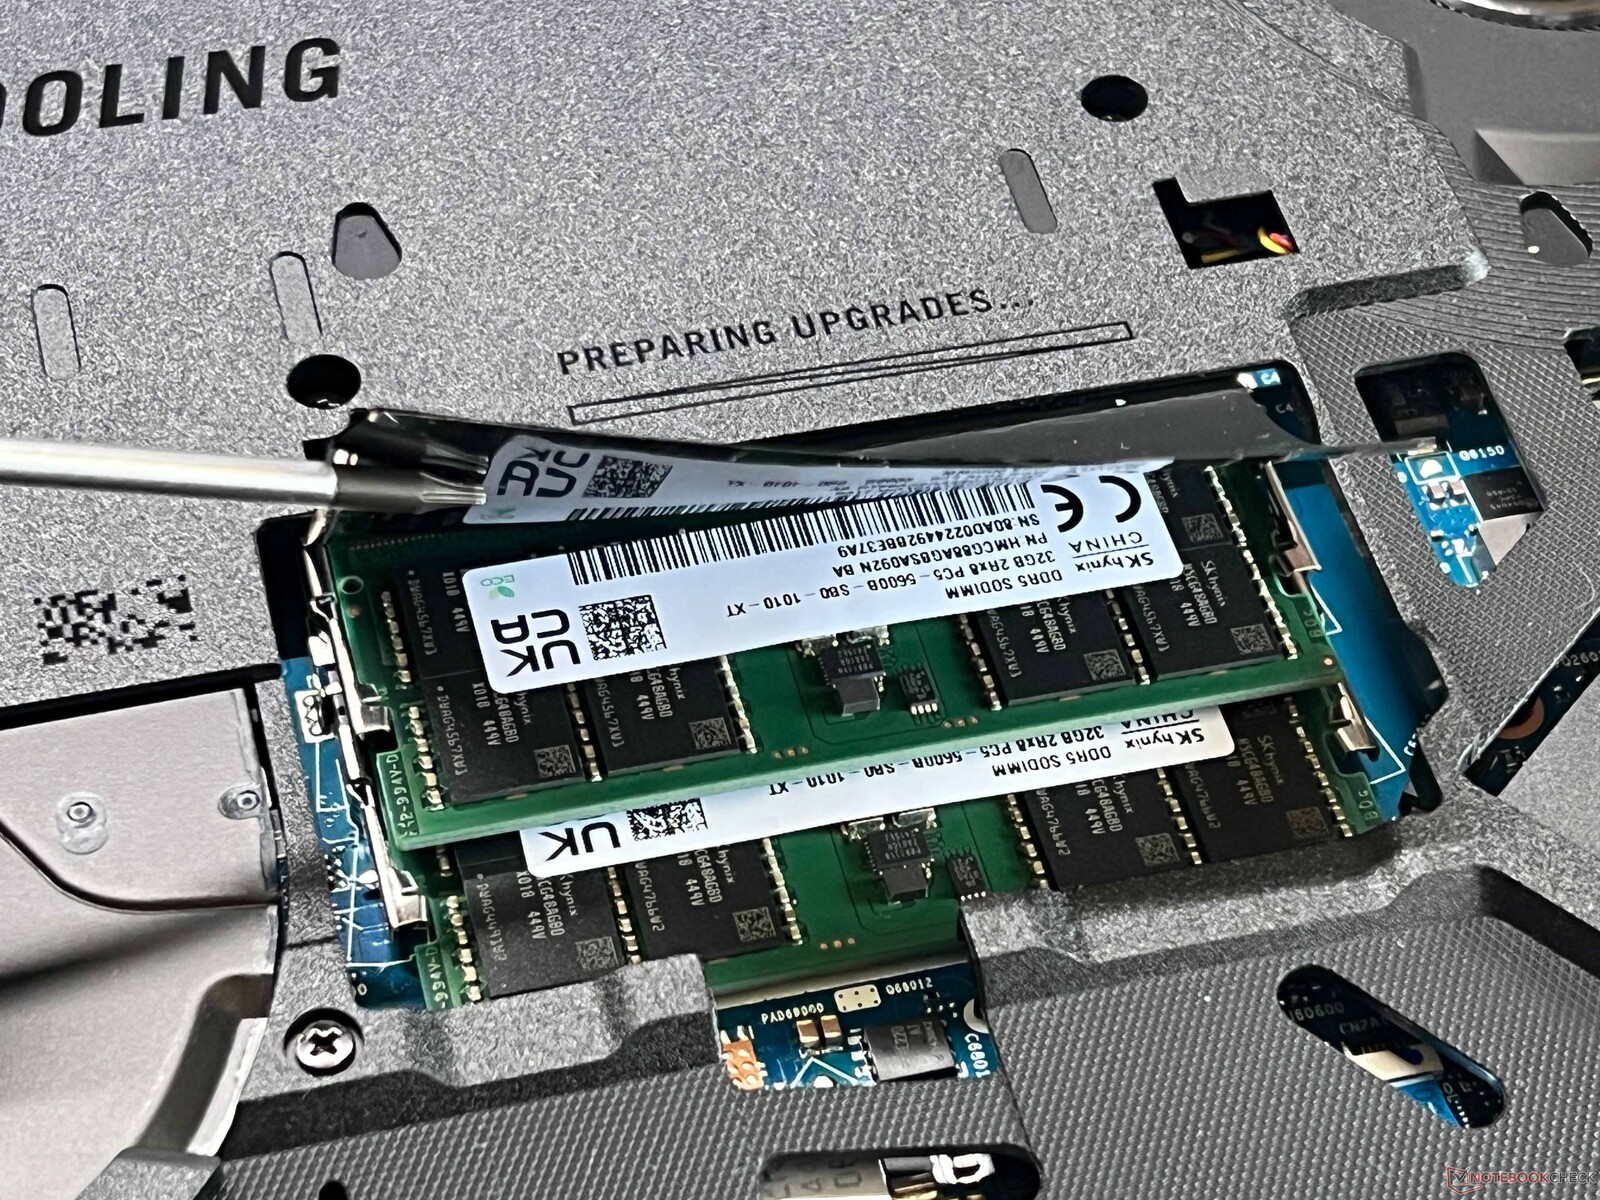
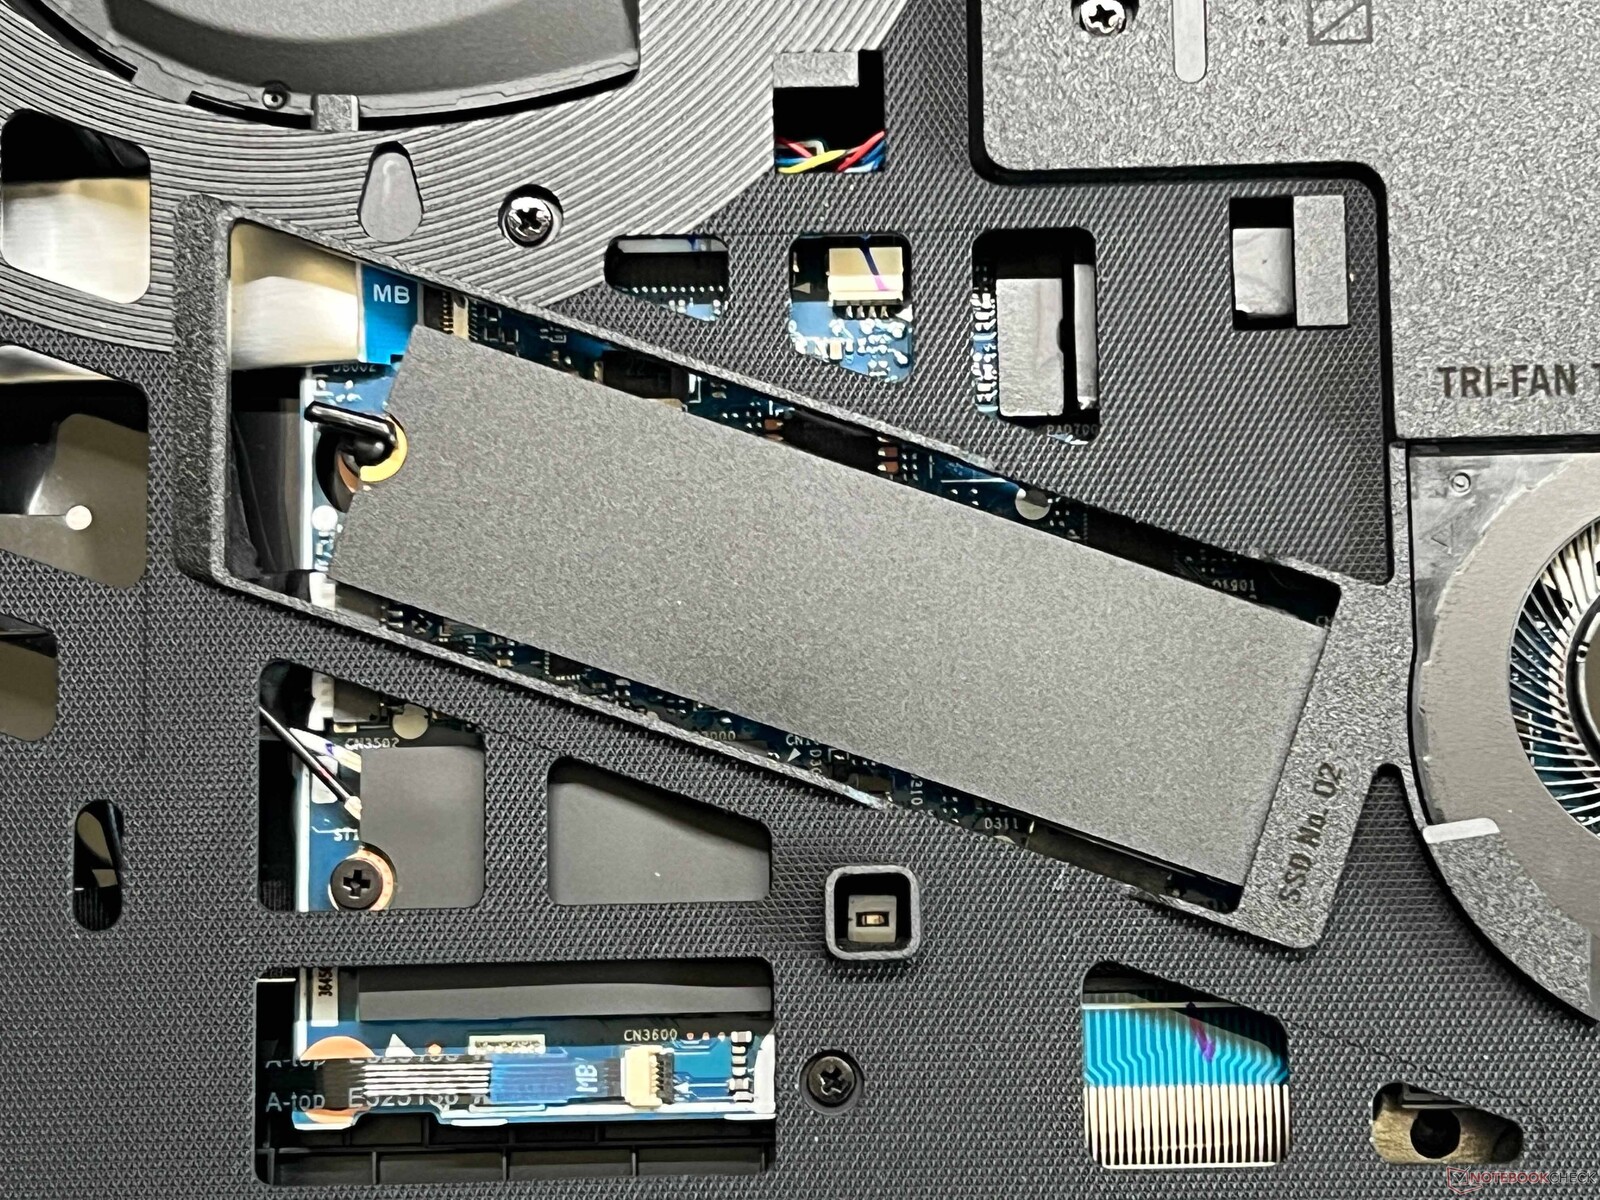
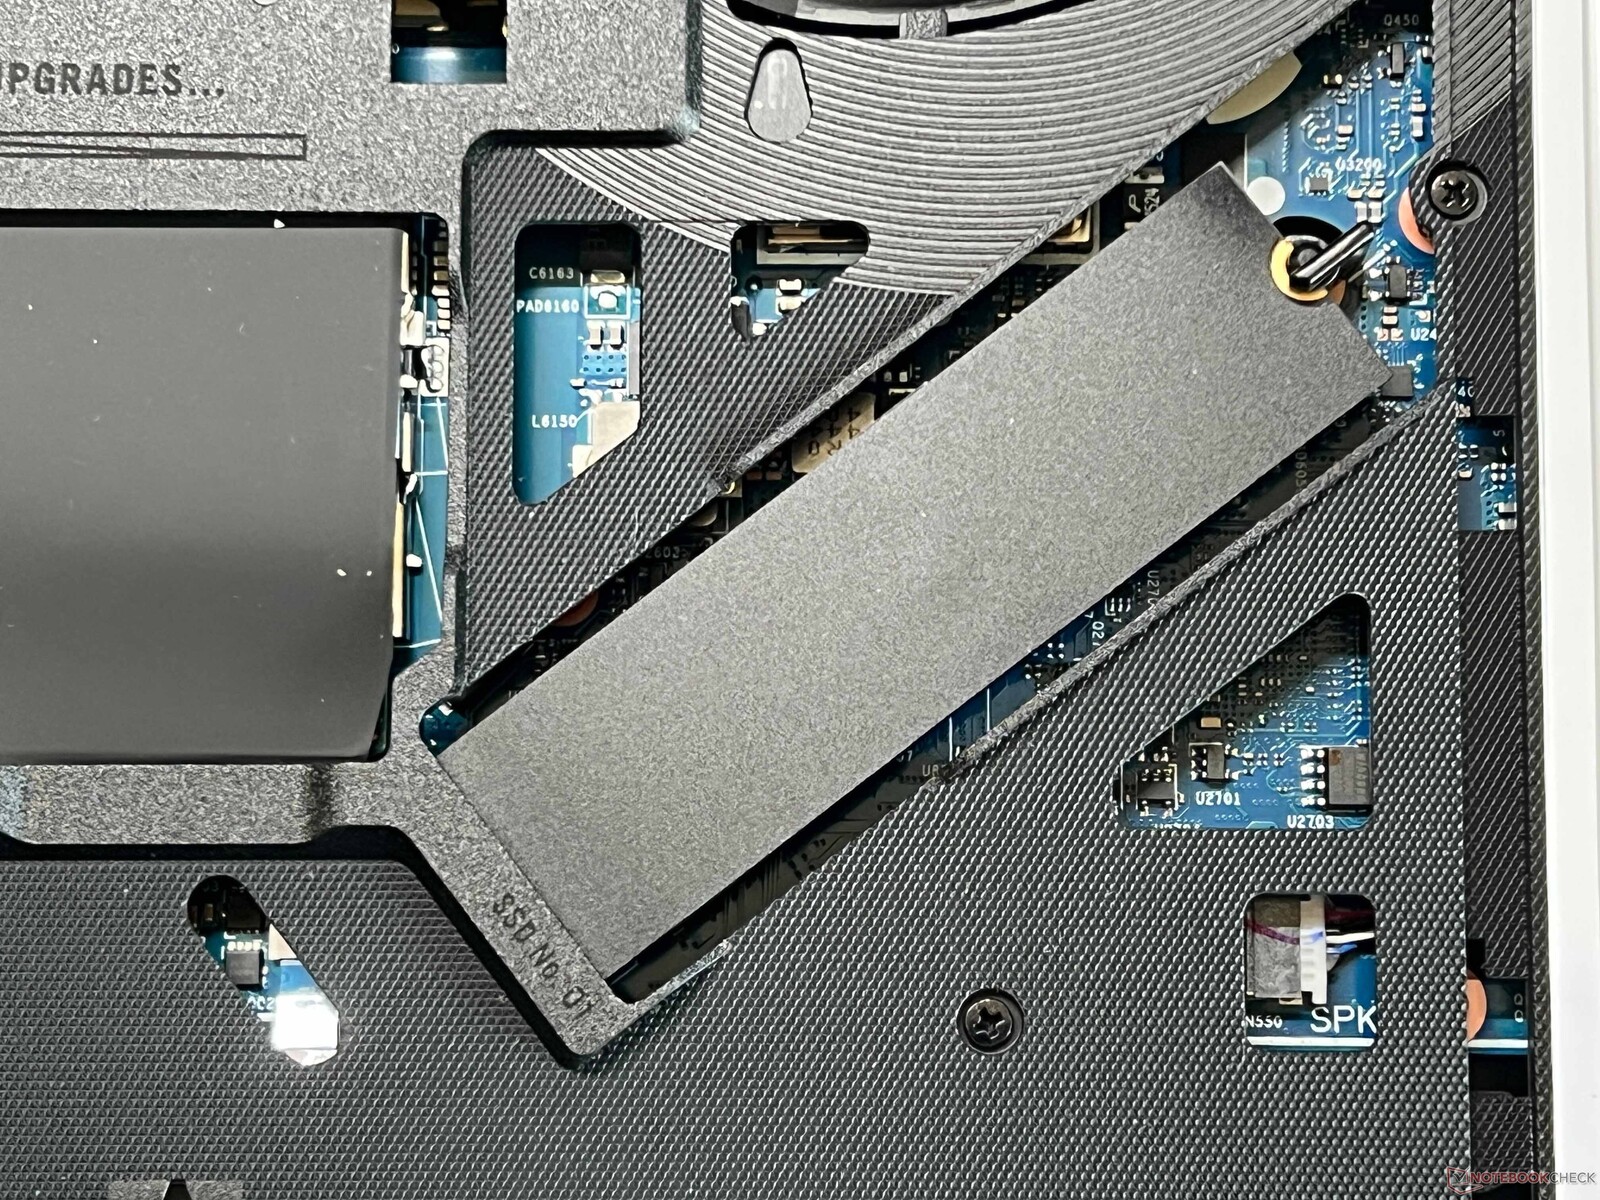
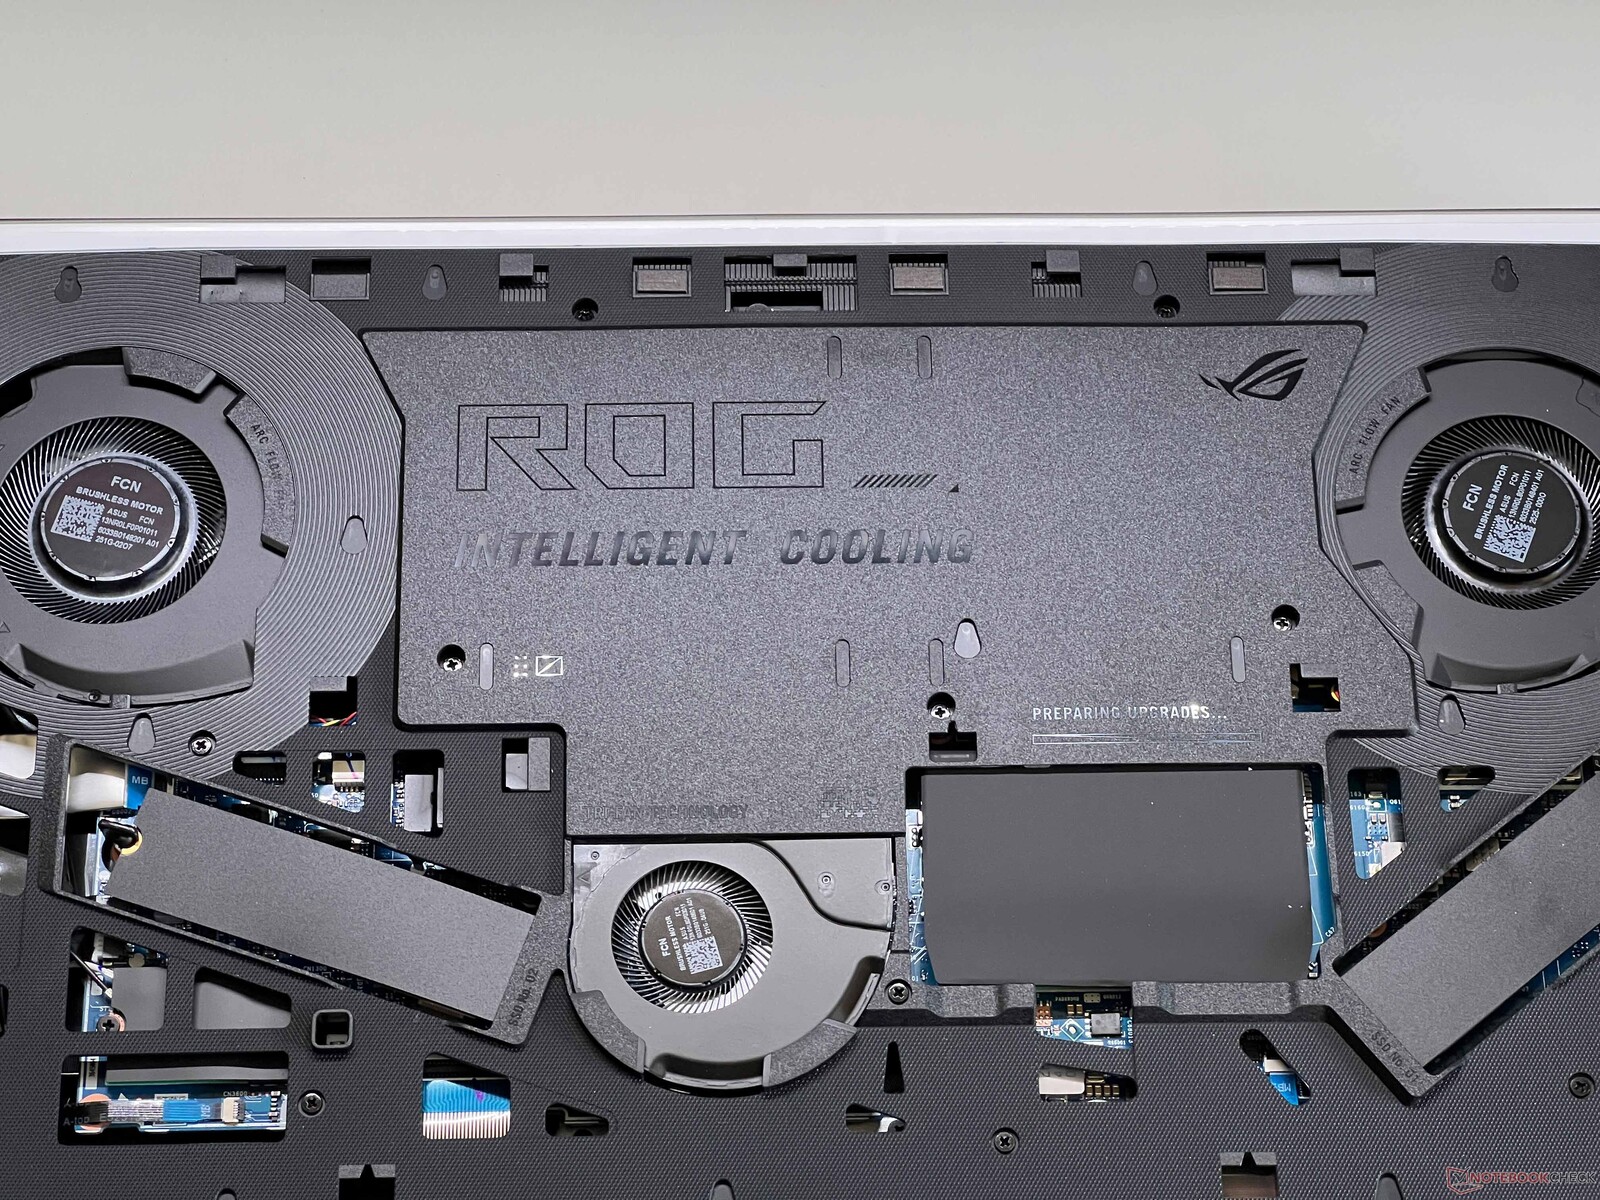
Asus has made access to the device's components much easier. The lower base plate can be unlocked via a slider and simply pulled forward. This provides access to the two M.2 2280 SSDs, the two SO-DIMM slots and the fans. Replacing the screwed-in battery requires further disassembly.
Sustainability
Asus hasn't commented on the laptop's CO2 footprint or use of recycled materials. Its packaging consists almost entirely of paper and cardboard.
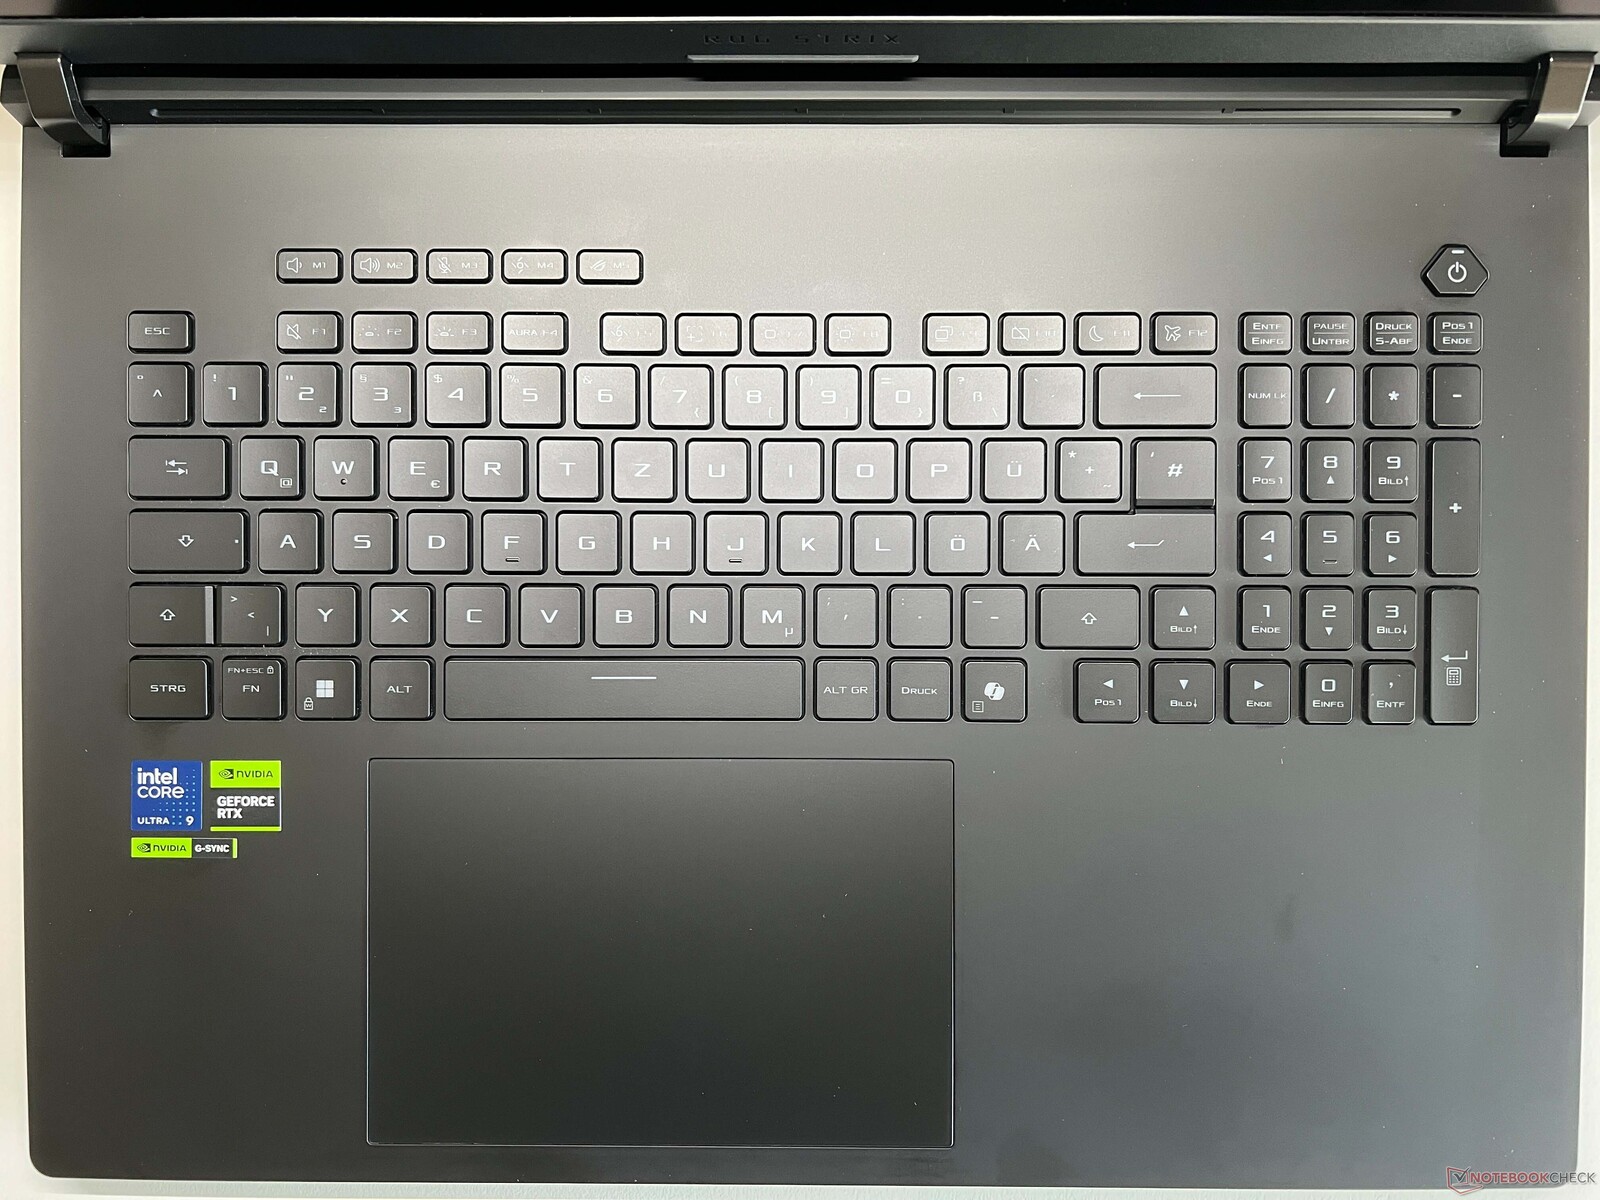
Input devices
The device's large keyboard with a numeric keypad feels comfortable to type on, with sufficient travel and a precise stroke. Mechanical keyboards are even better in this respect, whereas the Strix SCAR 18's keyboard is significantly quieter. Its backlighting can be set individually for each key. The large glass touchpad (13.5 x 8 cm) feels nice and smooth, while clicks in the lower area are very clear and muffled.
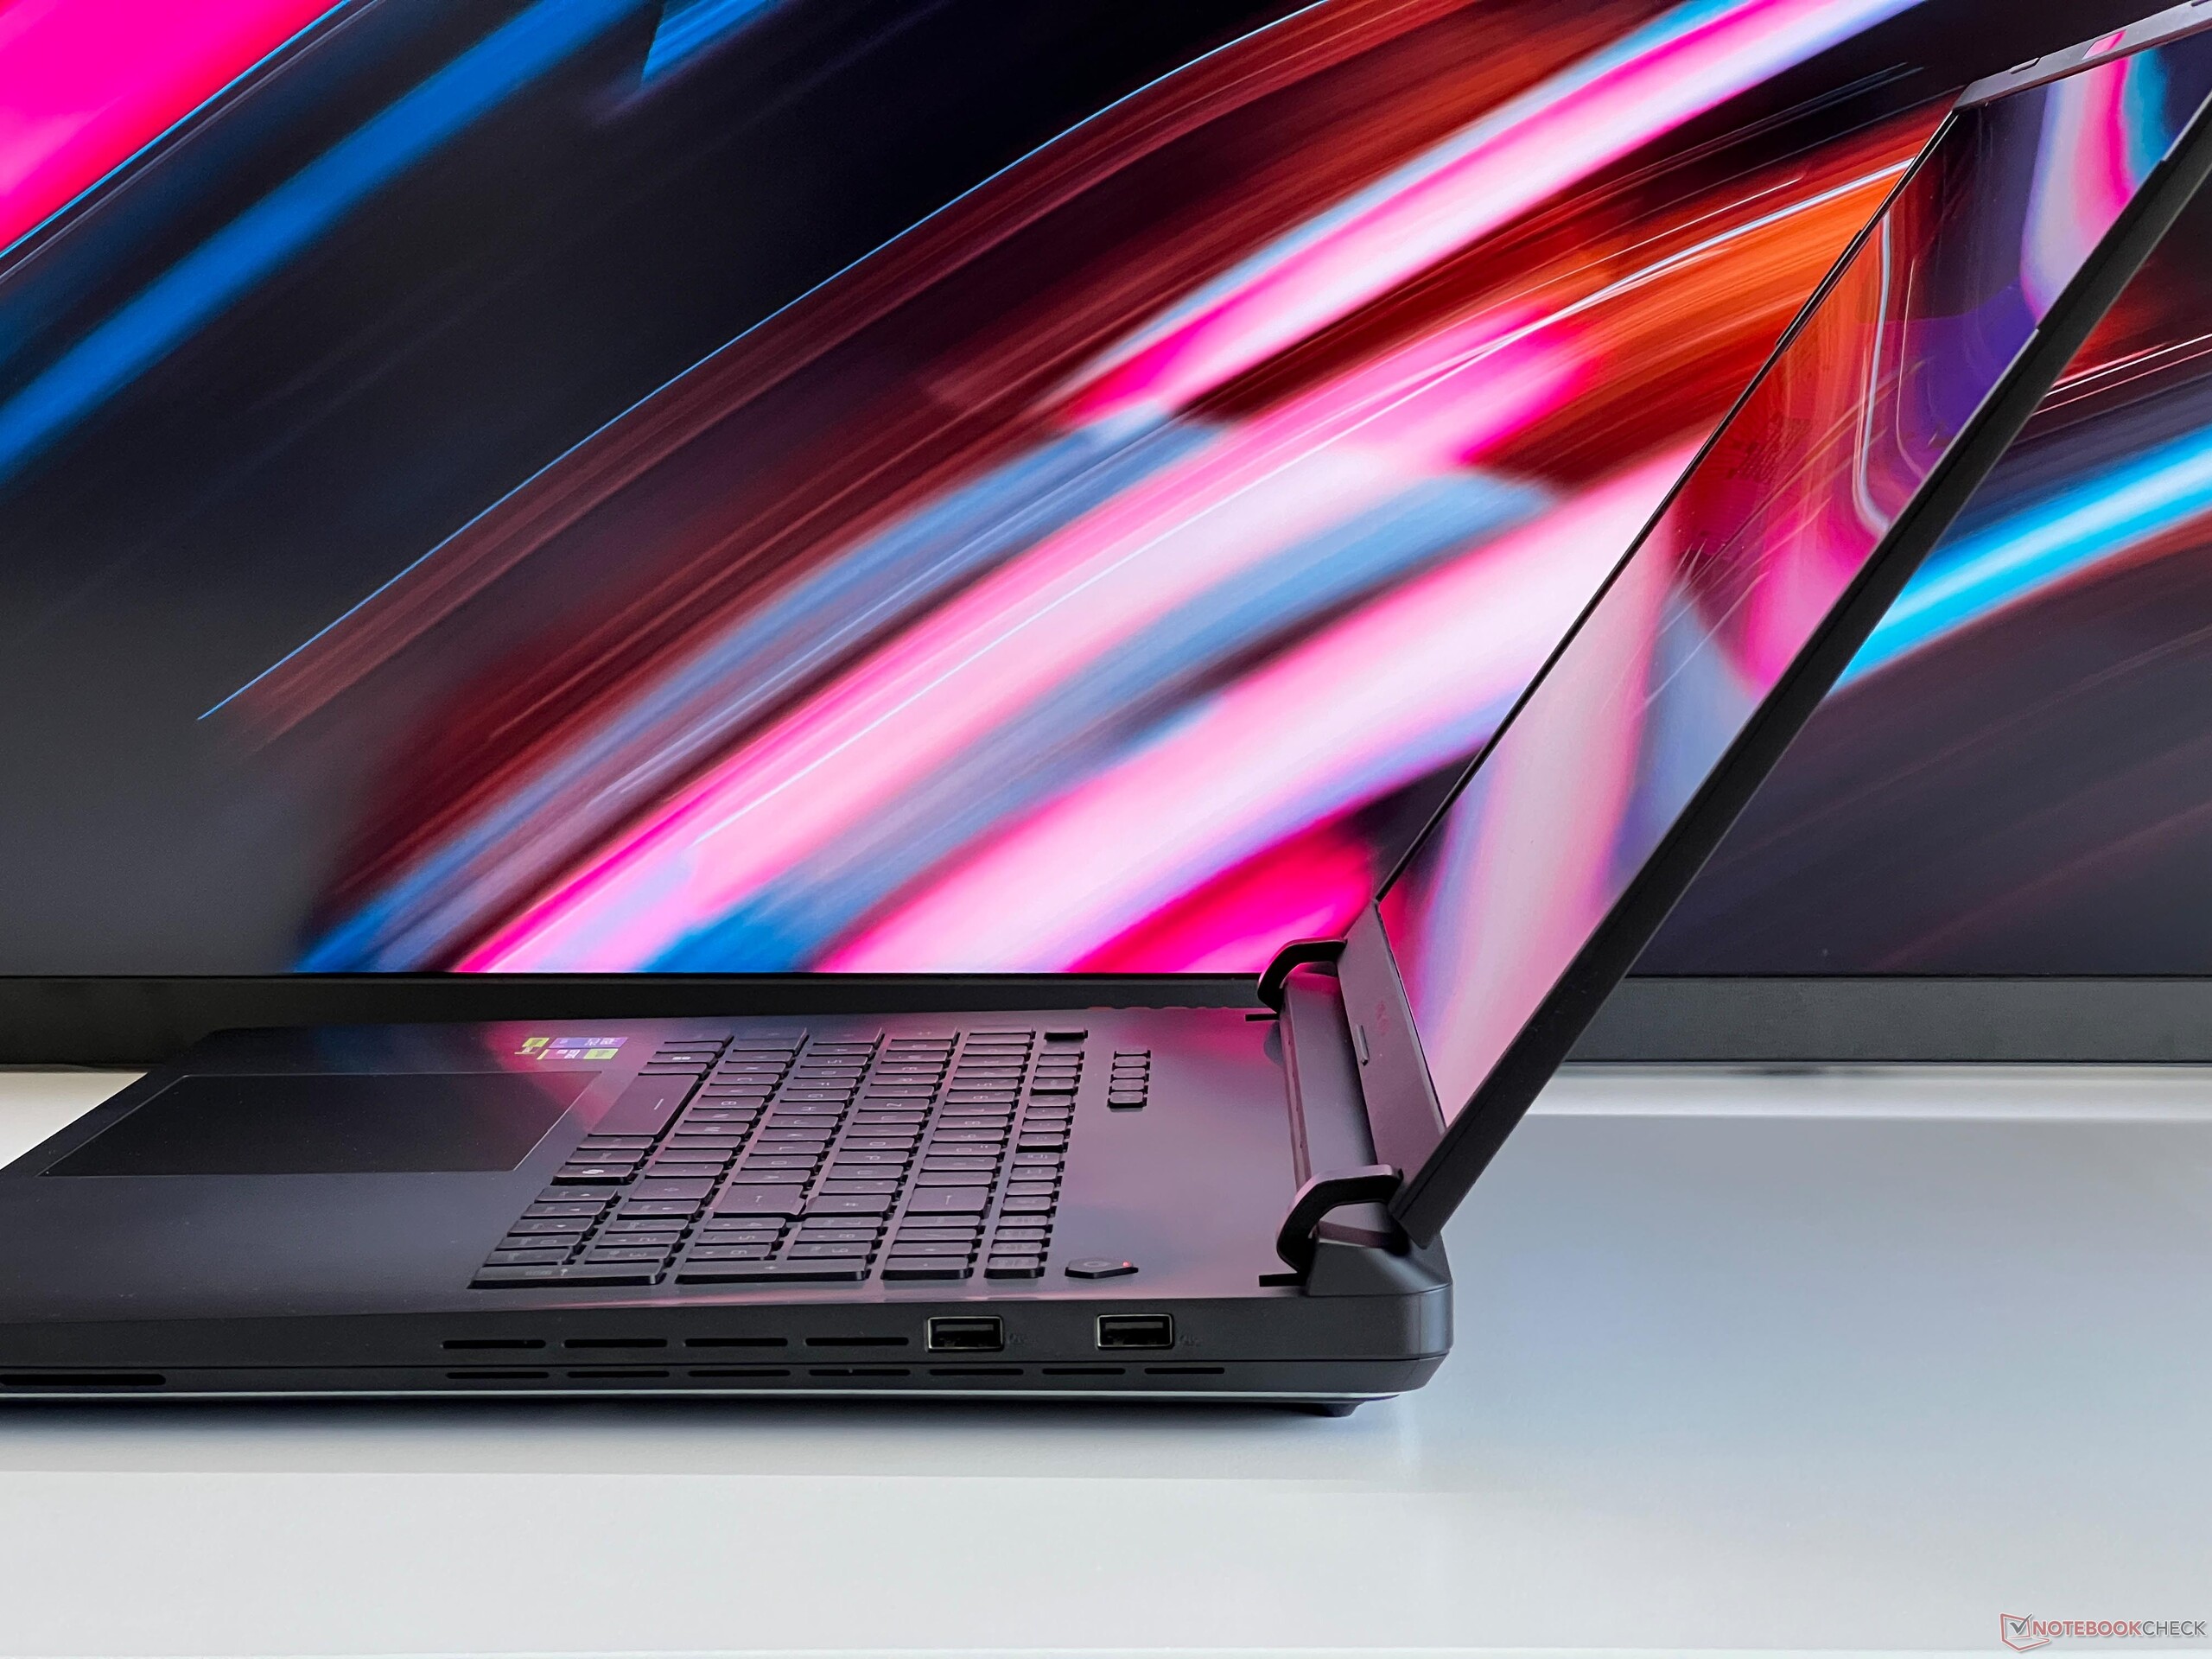
Display - Great mini LED panel at 240 Hz
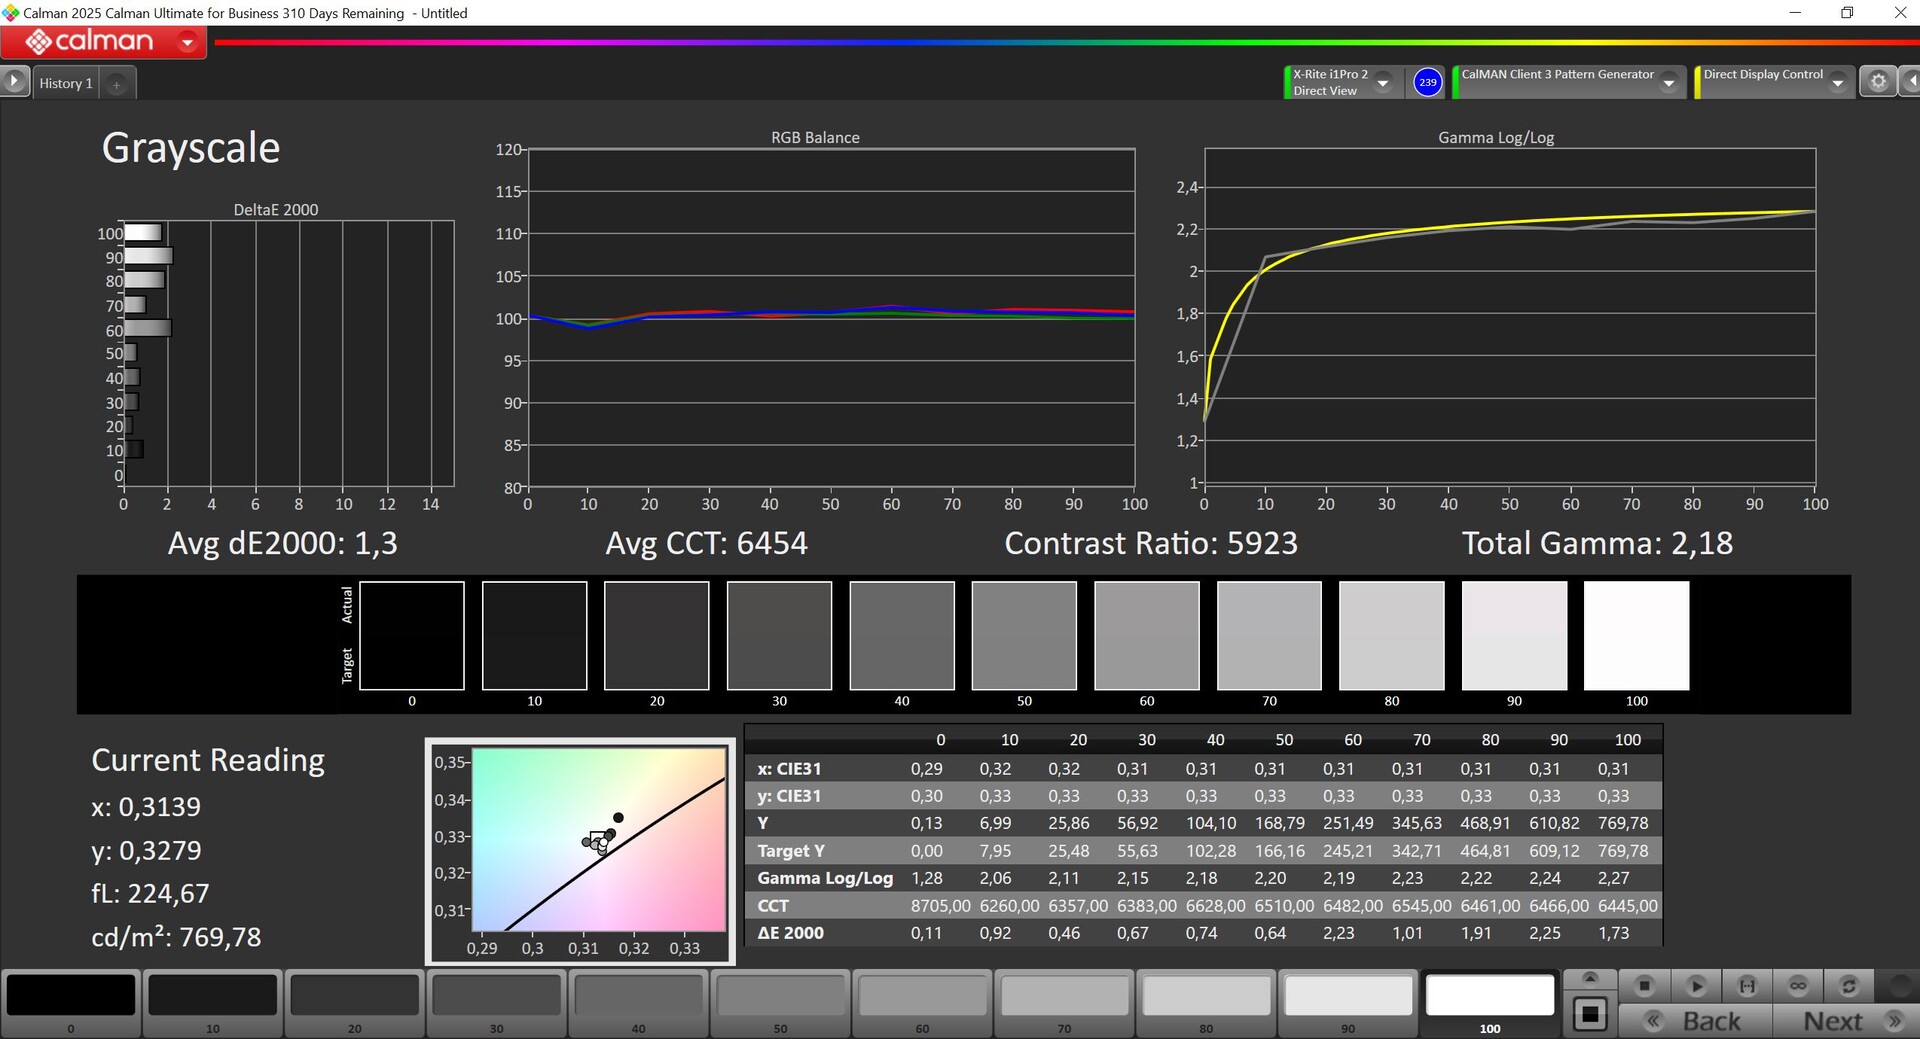
The Strix SCAR 18's mini LED panel with a resolution of 2,560 x 1,600 pixels (16:10) delivers excellent picture quality and even bright surfaces don't appear grainy. Thanks to its 240-Hz refresh rate, movements look super smooth. It isn't possible to reliably determine the response times of mini LED panels using our measuring method due to the backlight flickering, so the values we have provided are only a guide. However, Asus itself speaks of 3 ms and we didn't have any problems while gaming.
The panel offers some interesting features and operating modes. Three picture modes are available in SDR mode, each of which reaches different maximum brightness levels. You can choose from the settings multi-intensive (local dimming active, max. ~750 nits), multi-balanced (local dimming active, max. ~490 nits) and single image control (local dimming deactivated, max. ~611 nits). The single image mode is particularly interesting for image editing to ensure uniform brightness across the entire screen surface. In HDR mode (max. brightness 1,450 nits with an almost completely white image), you can select a P3 mode in addition to the normal mode, which automatically converts non-HDR content (such as the desktop) from sRGB to the P3 color space (although this can reduce color accuracy). This avoids the problem of non-HDR content looking very pale in HDR mode.
Another surprising feature of the panel is that its black level in SDR mode isn't 0, even when local dimming is active. As a result, there is some slight backlight bleeding (although less so with local dimming than in single image mode). Only in HDR mode is the picture really completely black (black level 0).
At around 750 cd/m², its brightness is slightly lower than last year—but it's still really impressive. Its black level is 0.1 cd/m², which results in an excellent contrast ratio of more than 7,000:1. The screen's brightness isn't reduced in battery mode. However, neither the brightness nor the color temperature can be automatically regulated by a sensor. The display flickers at all brightness levels, but the frequency is very high at 20 kHz and shouldn't cause any problems.
| |||||||||||||||||||||||||
Brightness Distribution: 93 %
Center on Battery: 764 cd/m²
Contrast: 7640:1 (Black: 0.1 cd/m²)
ΔE ColorChecker Calman: 1.2 | ∀{0.5-29.43 Ø4.71}
ΔE Greyscale Calman: 1.5 | ∀{0.09-98 Ø4.96}
87.2% AdobeRGB 1998 (Argyll 3D)
100% sRGB (Argyll 3D)
99% Display P3 (Argyll 3D)
Gamma: 2.17
CCT: 6556 K
| Asus Strix Scar 18 G835LX N180QDM-NM2, Mini-LED, 2560x1600, 18", 240 Hz | Razer Blade 18 2024 RZ09-0509 BOE NE180QDM-NM1, Mini-LED, 2560x1600, 18", 300 Hz | Alienware m18 R2 BOE NE18NZ1, IPS, 2560x1600, 18", 165 Hz | Acer Predator Helios 18 PH18-72-98MW B180QAN01.2 (AUO45A8), Mini-LED, 2560x1600, 18", 250 Hz | MSI Titan 18 HX A14VIG AU Optronics B180ZAN01.0, Mini-LED, 3840x2400, 18", 120 Hz | Schenker Key 17 Pro (M24) BOE, IPS, 3840x2160, 17.3", 144 Hz | Asus ROG Strix Scar 18 G834JYR (2024) BOE NE180QDM-NM1, Mini LED, 2560x1600, 18", 240 Hz | |
|---|---|---|---|---|---|---|---|
| Display | 0% | 0% | 2% | -1% | -3% | 1% | |
| Display P3 Coverage (%) | 99 | 99 0% | 97.8 -1% | 99.7 1% | 98.1 -1% | 93.51 -6% | 99.9 1% |
| sRGB Coverage (%) | 100 | 100 0% | 99.5 0% | 100 0% | 99.8 0% | 99.86 0% | 100 0% |
| AdobeRGB 1998 Coverage (%) | 87.2 | 86.9 0% | 88.9 2% | 91.6 5% | 86.2 -1% | 84.33 -3% | 90 3% |
| Response Times | -19% | 14% | -39% | -352% | -8% | -33% | |
| Response Time Grey 50% / Grey 80% * (ms) | 7.4 ? | 7.6 ? -3% | 5.3 ? 28% | 8 ? -8% | 8.6 ? -16% | 11.593 ? -57% | 12 ? -62% |
| Response Time Black / White * (ms) | 10.4 ? | 14 ? -35% | 10.4 ? -0% | 17.6 ? -69% | 81.8 ? -687% | 6 ? 42% | 10.7 ? -3% |
| PWM Frequency (Hz) | 20610 ? | 26444 ? | 4832 ? | 2592 ? | 5733 ? | ||
| PWM Amplitude * (%) | 100 | ||||||
| Screen | -99% | -94% | -30% | -88% | -157% | 15% | |
| Brightness middle (cd/m²) | 764 | 605.4 -21% | 271.8 -64% | 722 -5% | 467.5 -39% | 548 -28% | 937 23% |
| Brightness (cd/m²) | 747 | 600 -20% | 275 -63% | 724 -3% | 459 -39% | 505 -32% | 934 25% |
| Brightness Distribution (%) | 93 | 97 4% | 78 -16% | 93 0% | 90 -3% | 86 -8% | 89 -4% |
| Black Level * (cd/m²) | 0.1 | 0.62 -520% | 0.27 -170% | 0.04 60% | 0.54 -440% | 0.066 34% | |
| Contrast (:1) | 7640 | 976 -87% | 1007 -87% | 18050 136% | 1015 -87% | 14197 86% | |
| Colorchecker dE 2000 * | 1.2 | 1.53 -28% | 2.48 -107% | 3.4 -183% | 3.77 -214% | 3.81 -218% | 1.52 -27% |
| Colorchecker dE 2000 max. * | 2.8 | 4.15 -48% | 5.59 -100% | 5.32 -90% | 6.12 -119% | 7.9 -182% | 2.82 -1% |
| Greyscale dE 2000 * | 1.5 | 2.6 -73% | 3.7 -147% | 3.8 -153% | 3.2 -113% | 5.4 -260% | 1.7 -13% |
| Gamma | 2.17 101% | 2.22 99% | 2.2 100% | 2.383 92% | 2.43 91% | 2.062 107% | 2.042 108% |
| CCT | 6556 99% | 6843 95% | 6355 102% | 7051 92% | 6478 100% | 7224 90% | 6578 99% |
| Colorchecker dE 2000 calibrated * | 0.56 | 1.6 | 2.94 | 2.54 | 1.21 | ||
| Total Average (Program / Settings) | -39% /
-64% | -27% /
-56% | -22% /
-24% | -147% /
-112% | -56% /
-98% | -6% /
5% |
* ... smaller is better


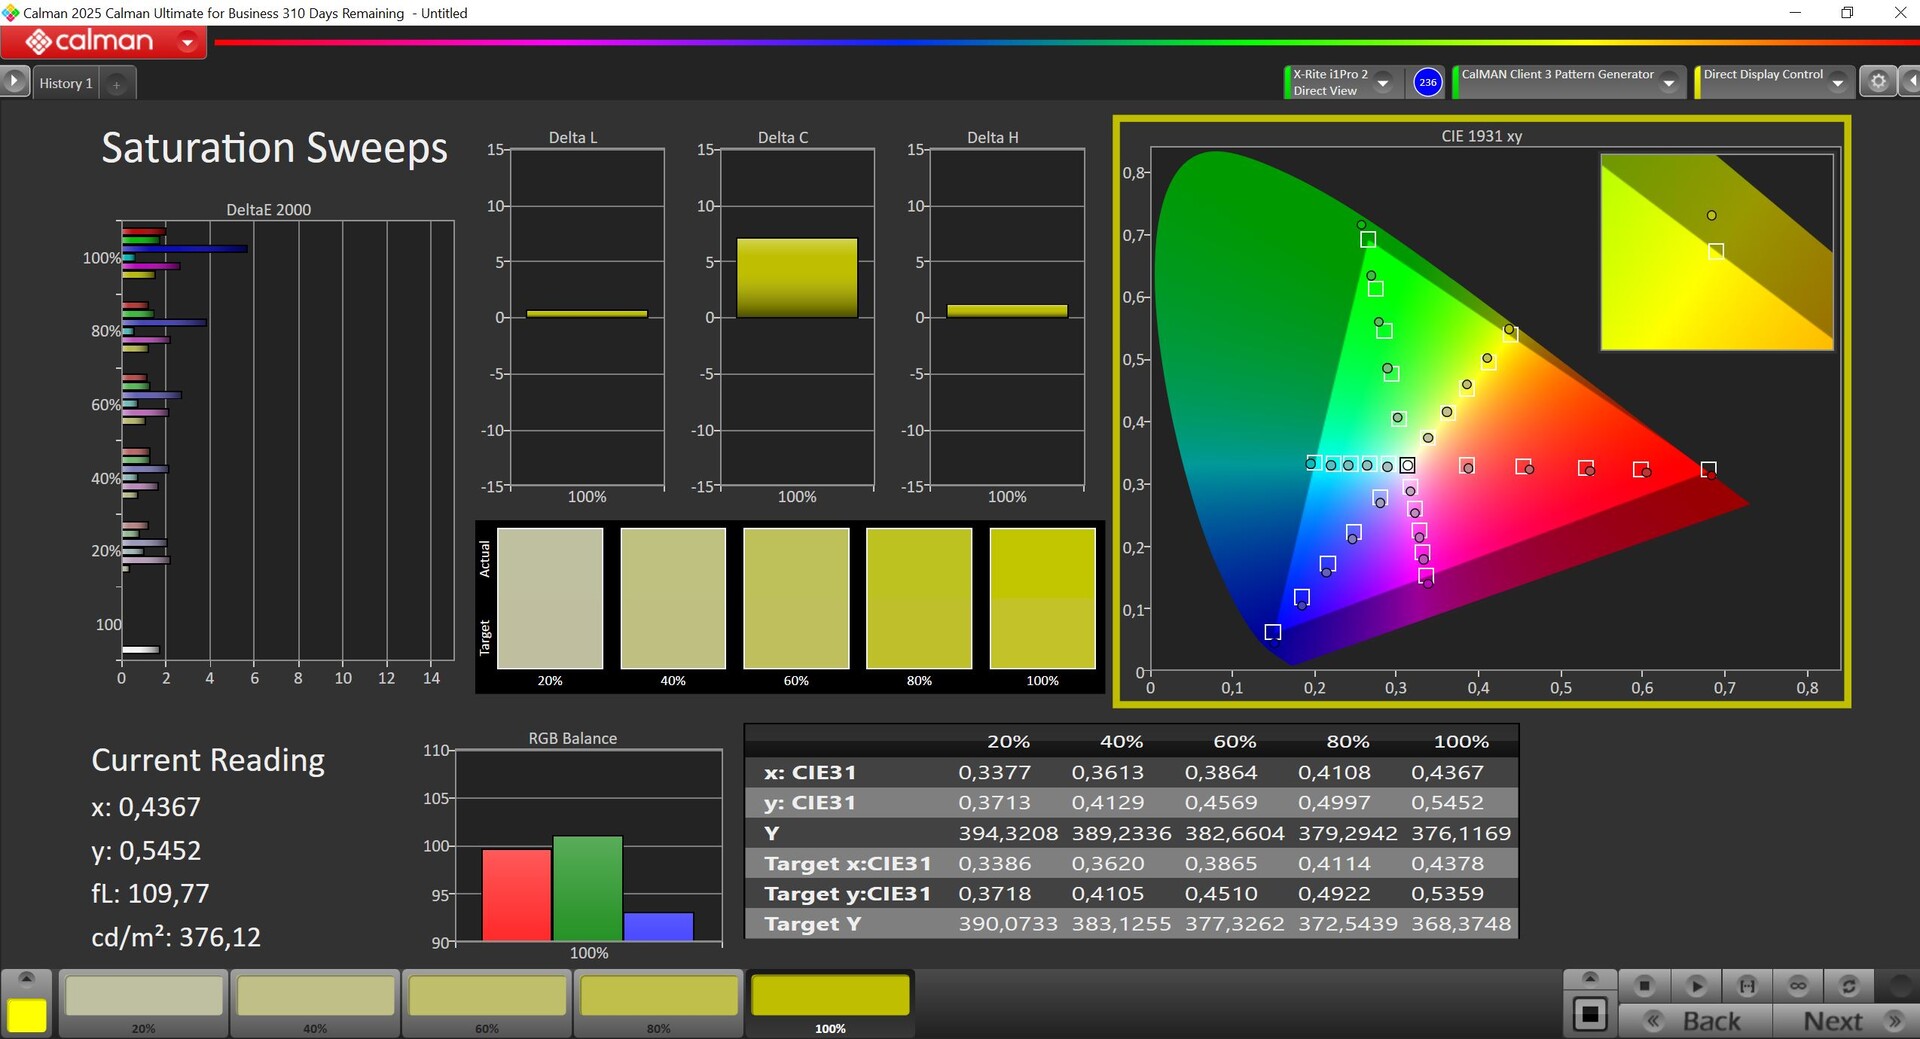

As usual, Asus offers various color profiles for SDR mode. The native mode is somewhat oversaturated, but very accurate profiles for P3 and sRGB are also available. We were unable to improve the display any further with our own calibration.


Display Response Times
| ↔ Response Time Black to White | ||
|---|---|---|
| 10.4 ms ... rise ↗ and fall ↘ combined | ↗ 0.6 ms rise | 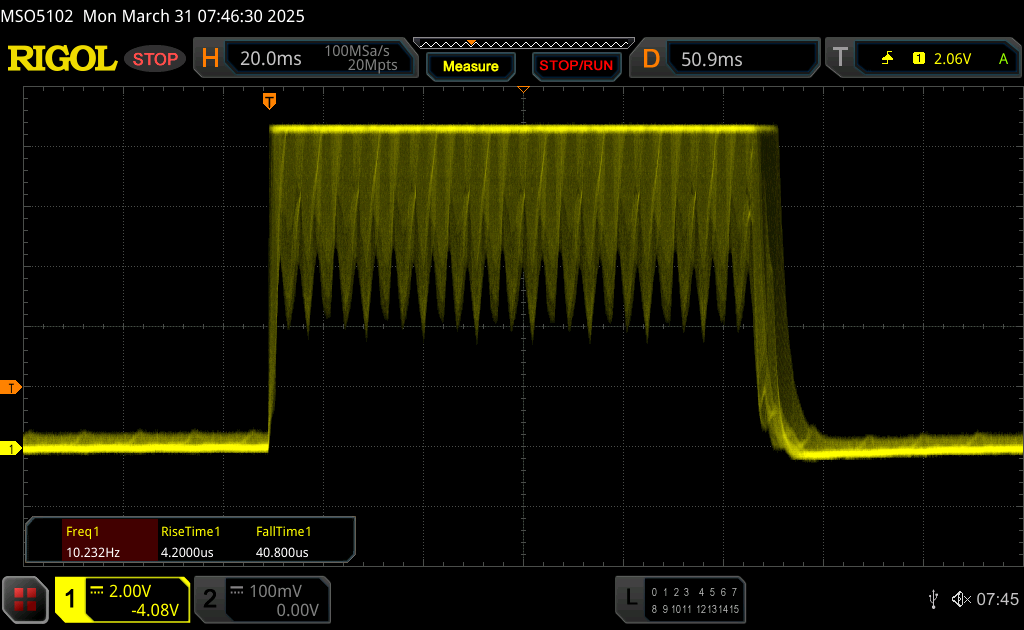 |
| ↘ 9.8 ms fall | ||
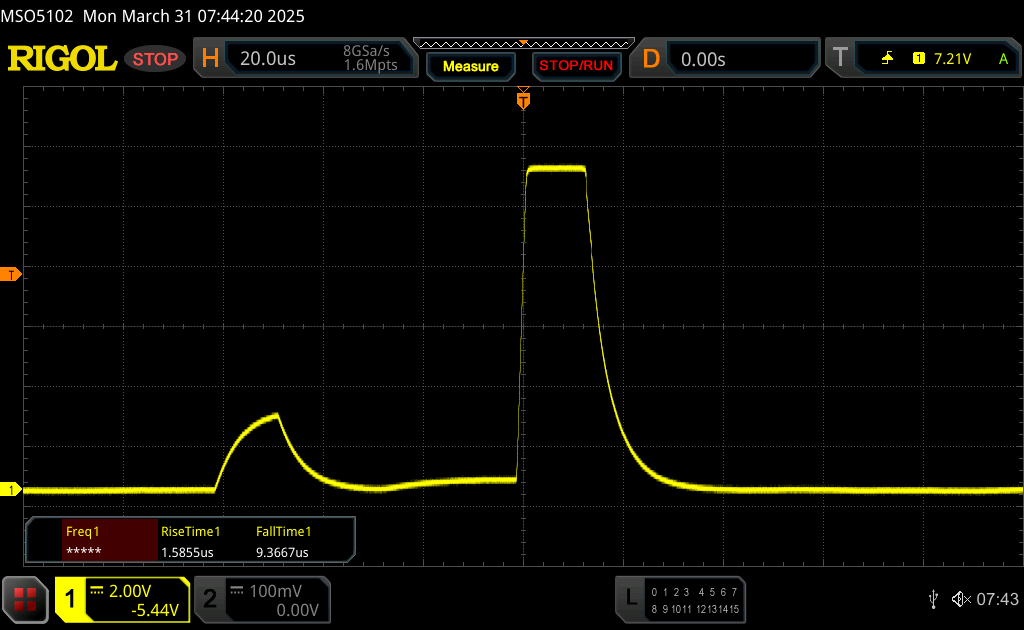
| The screen shows good response rates in our tests, but may be too slow for competitive gamers. In comparison, all tested devices range from 0.1 (minimum) to 240 (maximum) ms. » 28 % of all devices are better. This means that the measured response time is better than the average of all tested devices (19.8 ms). | ||
| ↔ Response Time 50% Grey to 80% Grey | ||
| 7.4 ms ... rise ↗ and fall ↘ combined | ↗ 2.4 ms rise | 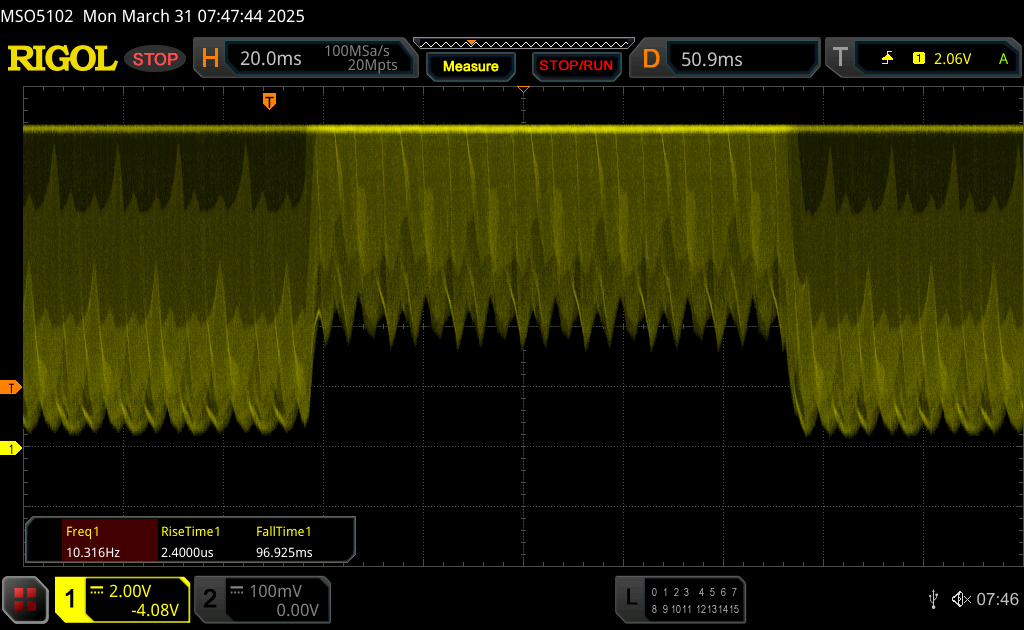 |
| ↘ 5 ms fall | ||
| The screen shows very fast response rates in our tests and should be very well suited for fast-paced gaming. In comparison, all tested devices range from 0.165 (minimum) to 636 (maximum) ms. » 20 % of all devices are better. This means that the measured response time is better than the average of all tested devices (31 ms). | ||
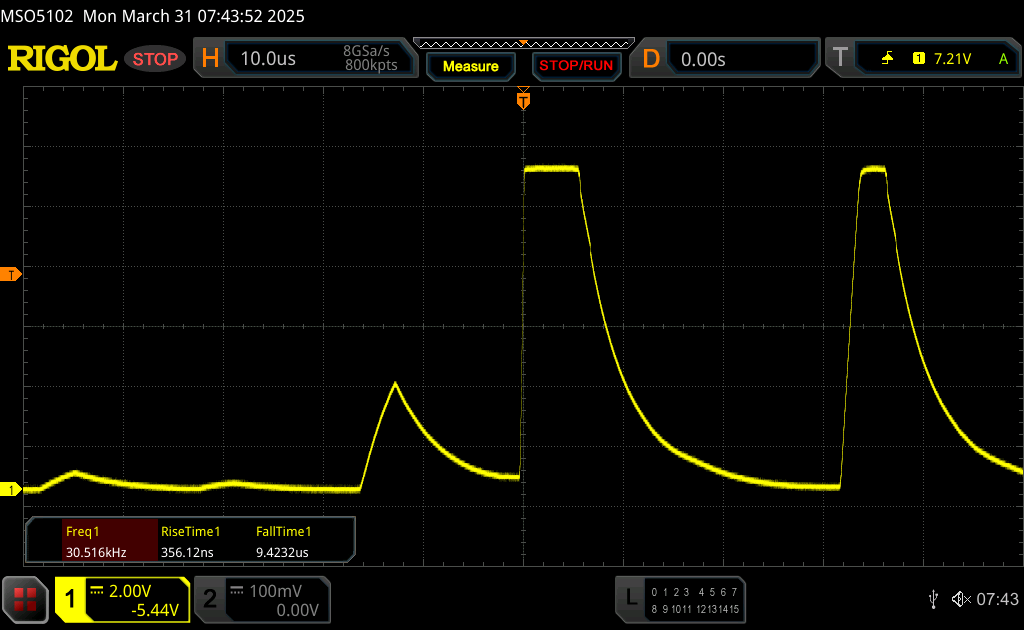
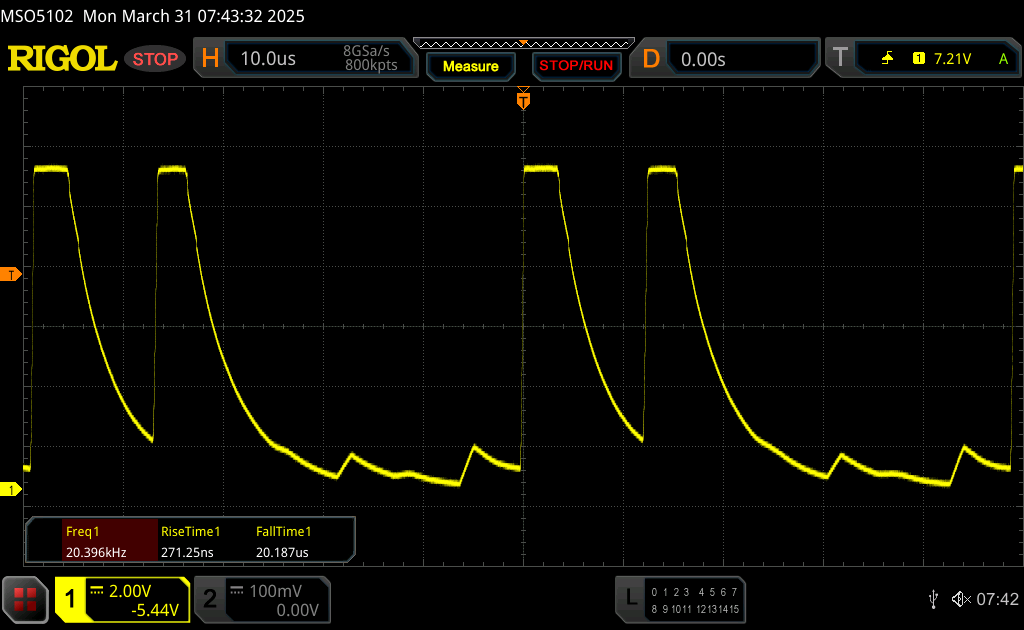
Screen Flickering / PWM (Pulse-Width Modulation)
| Screen flickering / PWM detected | 20610 Hz Amplitude: 100 % | ≤ 100 % brightness setting | 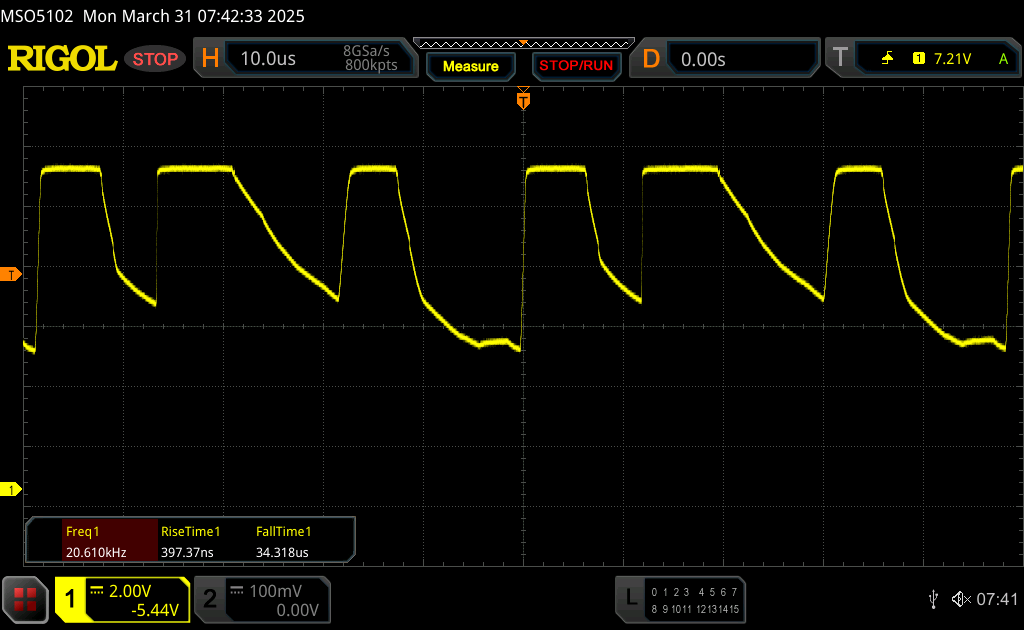 |
The display backlight flickers at 20610 Hz (worst case, e.g., utilizing PWM) Flickering detected at a brightness setting of 100 % and below. There should be no flickering or PWM above this brightness setting. The frequency of 20610 Hz is quite high, so most users sensitive to PWM should not notice any flickering. In comparison: 52 % of all tested devices do not use PWM to dim the display. If PWM was detected, an average of 7754 (minimum: 5 - maximum: 343500) Hz was measured. | |||


Performance - Arrow Lake-HX and RTX 5000 Laptop
Testing conditions
Asus offers three energy profiles called Quiet, Performance and Turbo, which we used for the following benchmarks and measurements. In general, we would like to see a bit bigger spread between Performance & Turbo. A manual mode is also available, in which you can increase the GPU's clock rate and influence the fan curves. Turbo mode is not available in battery mode.
| Energy profile | CPU TDP | CB R24 Multi | GPU TGP | Time Spy Graphics | CP 2077 QHD | max. fan noise emissions |
|---|---|---|---|---|---|---|
| Quiet | 100/65 watts | 1,825 points | 55 watts | 9,029 points | 43.5fps | 34.8 dB(A) |
| Performance | 120/105 watts | 2,039 points | 160 watts | 23,300 points | 102.7fps | 49 dB(A) |
| Turbo | 175/150 watts | 2,223 points | 175 watts | 24,599 watts | 106.8fps | 53.7 dB(A) |
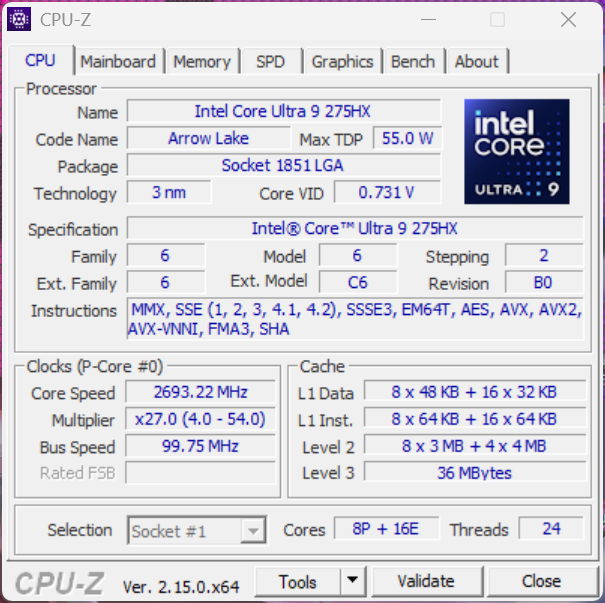
Processor - Core Ultra 9 275HX
The new Core Ultra 9 275HX from the Arrow Lake generation is used as the laptop's processor. It has 24 cores (8x performance, 16x efficiency) without hyperthreading and can consume up to 175 watts for short periods and 150 watts permanently. As we have already seen in our CPU analysis, its results in the synthetic benchmarks were very good and its average lead over the comparison models was at least 11%, while compared to the predecessor model, we even noted 18%. In battery mode, its power consumption was massively reduced (54/34 watts) and its multi-core performance dropped by 43%.
Cinebench R15 Multi continuous test
Cinebench R23: Multi Core | Single Core
Cinebench R20: CPU (Multi Core) | CPU (Single Core)
Cinebench R15: CPU Multi 64Bit | CPU Single 64Bit
Blender: v2.79 BMW27 CPU
7-Zip 18.03: 7z b 4 | 7z b 4 -mmt1
Geekbench 6.7: Multi-Core | Single-Core
Geekbench 5.5: Multi-Core | Single-Core
HWBOT x265 Benchmark v2.2: 4k Preset
LibreOffice : 20 Documents To PDF
R Benchmark 2.5: Overall mean
| CPU Performance rating | |
| Asus Strix Scar 18 G835LX | |
| Average Intel Core Ultra 9 275HX | |
| Alienware m18 R2 | |
| MSI Titan 18 HX A14VIG | |
| Asus ROG Strix Scar 18 G834JYR (2024) | |
| Razer Blade 18 2024 RZ09-0509 | |
| Schenker Key 17 Pro (M24) | |
| Acer Predator Helios 18 PH18-72-98MW | |
| Average of class Gaming | |
| Cinebench R23 / Multi Core | |
| Asus Strix Scar 18 G835LX | |
| Average Intel Core Ultra 9 275HX (30712 - 40970, n=31) | |
| MSI Titan 18 HX A14VIG | |
| Alienware m18 R2 | |
| Asus ROG Strix Scar 18 G834JYR (2024) | |
| Razer Blade 18 2024 RZ09-0509 | |
| Schenker Key 17 Pro (M24) | |
| Average of class Gaming (10488 - 42661, n=107, last 2 years) | |
| Acer Predator Helios 18 PH18-72-98MW | |
| Cinebench R23 / Single Core | |
| Asus Strix Scar 18 G835LX | |
| Alienware m18 R2 | |
| Average Intel Core Ultra 9 275HX (2009 - 2267, n=31) | |
| Asus ROG Strix Scar 18 G834JYR (2024) | |
| Acer Predator Helios 18 PH18-72-98MW | |
| MSI Titan 18 HX A14VIG | |
| Razer Blade 18 2024 RZ09-0509 | |
| Schenker Key 17 Pro (M24) | |
| Average of class Gaming (1166 - 2415, n=107, last 2 years) | |
| Cinebench R20 / CPU (Multi Core) | |
| Asus Strix Scar 18 G835LX | |
| Average Intel Core Ultra 9 275HX (12026 - 16108, n=30) | |
| MSI Titan 18 HX A14VIG | |
| Alienware m18 R2 | |
| Razer Blade 18 2024 RZ09-0509 | |
| Asus ROG Strix Scar 18 G834JYR (2024) | |
| Schenker Key 17 Pro (M24) | |
| Average of class Gaming (4029 - 16433, n=106, last 2 years) | |
| Acer Predator Helios 18 PH18-72-98MW | |
| Cinebench R20 / CPU (Single Core) | |
| Asus Strix Scar 18 G835LX | |
| Alienware m18 R2 | |
| Average Intel Core Ultra 9 275HX (774 - 870, n=30) | |
| Asus ROG Strix Scar 18 G834JYR (2024) | |
| Acer Predator Helios 18 PH18-72-98MW | |
| MSI Titan 18 HX A14VIG | |
| Razer Blade 18 2024 RZ09-0509 | |
| Average of class Gaming (442 - 913, n=106, last 2 years) | |
| Schenker Key 17 Pro (M24) | |
| Cinebench R15 / CPU Multi 64Bit | |
| Asus Strix Scar 18 G835LX | |
| Average Intel Core Ultra 9 275HX (4737 - 6271, n=30) | |
| Alienware m18 R2 | |
| MSI Titan 18 HX A14VIG | |
| Acer Predator Helios 18 PH18-72-98MW | |
| Schenker Key 17 Pro (M24) | |
| Razer Blade 18 2024 RZ09-0509 | |
| Asus ROG Strix Scar 18 G834JYR (2024) | |
| Average of class Gaming (1578 - 6330, n=105, last 2 years) | |
| Cinebench R15 / CPU Single 64Bit | |
| Asus Strix Scar 18 G835LX | |
| Average Intel Core Ultra 9 275HX (306 - 343, n=31) | |
| Alienware m18 R2 | |
| Acer Predator Helios 18 PH18-72-98MW | |
| Razer Blade 18 2024 RZ09-0509 | |
| Asus ROG Strix Scar 18 G834JYR (2024) | |
| MSI Titan 18 HX A14VIG | |
| Average of class Gaming (188.8 - 350, n=106, last 2 years) | |
| Schenker Key 17 Pro (M24) | |
| Blender / v2.79 BMW27 CPU | |
| Average of class Gaming (79 - 330, n=104, last 2 years) | |
| Acer Predator Helios 18 PH18-72-98MW | |
| Schenker Key 17 Pro (M24) | |
| Asus ROG Strix Scar 18 G834JYR (2024) | |
| Razer Blade 18 2024 RZ09-0509 | |
| MSI Titan 18 HX A14VIG | |
| Alienware m18 R2 | |
| Average Intel Core Ultra 9 275HX (82 - 116, n=29) | |
| Asus Strix Scar 18 G835LX | |
| 7-Zip 18.03 / 7z b 4 | |
| Asus Strix Scar 18 G835LX | |
| Alienware m18 R2 | |
| MSI Titan 18 HX A14VIG | |
| Asus ROG Strix Scar 18 G834JYR (2024) | |
| Average Intel Core Ultra 9 275HX (98236 - 124155, n=30) | |
| Schenker Key 17 Pro (M24) | |
| Razer Blade 18 2024 RZ09-0509 | |
| Acer Predator Helios 18 PH18-72-98MW | |
| Average of class Gaming (33491 - 148086, n=105, last 2 years) | |
| 7-Zip 18.03 / 7z b 4 -mmt1 | |
| Asus ROG Strix Scar 18 G834JYR (2024) | |
| Alienware m18 R2 | |
| Asus Strix Scar 18 G835LX | |
| Schenker Key 17 Pro (M24) | |
| Average Intel Core Ultra 9 275HX (6026 - 7149, n=30) | |
| MSI Titan 18 HX A14VIG | |
| Razer Blade 18 2024 RZ09-0509 | |
| Average of class Gaming (4199 - 7436, n=105, last 2 years) | |
| Acer Predator Helios 18 PH18-72-98MW | |
| Geekbench 6.7 / Multi-Core | |
| Asus Strix Scar 18 G835LX | |
| Average Intel Core Ultra 9 275HX (16033 - 21668, n=33) | |
| Alienware m18 R2 | |
| Asus ROG Strix Scar 18 G834JYR (2024) | |
| Acer Predator Helios 18 PH18-72-98MW | |
| Razer Blade 18 2024 RZ09-0509 | |
| MSI Titan 18 HX A14VIG | |
| Schenker Key 17 Pro (M24) | |
| Average of class Gaming (6625 - 22850, n=106, last 2 years) | |
| Geekbench 6.7 / Single-Core | |
| Asus Strix Scar 18 G835LX | |
| Alienware m18 R2 | |
| Average Intel Core Ultra 9 275HX (2843 - 3160, n=33) | |
| Asus ROG Strix Scar 18 G834JYR (2024) | |
| Acer Predator Helios 18 PH18-72-98MW | |
| Average of class Gaming (1490 - 3259, n=106, last 2 years) | |
| MSI Titan 18 HX A14VIG | |
| Razer Blade 18 2024 RZ09-0509 | |
| Schenker Key 17 Pro (M24) | |
| Geekbench 5.5 / Multi-Core | |
| Asus Strix Scar 18 G835LX | |
| Average Intel Core Ultra 9 275HX (19105 - 25855, n=31) | |
| Alienware m18 R2 | |
| Acer Predator Helios 18 PH18-72-98MW | |
| Asus ROG Strix Scar 18 G834JYR (2024) | |
| Schenker Key 17 Pro (M24) | |
| Razer Blade 18 2024 RZ09-0509 | |
| MSI Titan 18 HX A14VIG | |
| Average of class Gaming (6460 - 28263, n=105, last 2 years) | |
| Geekbench 5.5 / Single-Core | |
| Asus Strix Scar 18 G835LX | |
| Average Intel Core Ultra 9 275HX (2033 - 2292, n=31) | |
| Alienware m18 R2 | |
| Asus ROG Strix Scar 18 G834JYR (2024) | |
| MSI Titan 18 HX A14VIG | |
| Average of class Gaming (986 - 2474, n=105, last 2 years) | |
| Razer Blade 18 2024 RZ09-0509 | |
| Acer Predator Helios 18 PH18-72-98MW | |
| Schenker Key 17 Pro (M24) | |
| HWBOT x265 Benchmark v2.2 / 4k Preset | |
| Asus Strix Scar 18 G835LX | |
| Average Intel Core Ultra 9 275HX (30.7 - 43.8, n=30) | |
| Alienware m18 R2 | |
| MSI Titan 18 HX A14VIG | |
| Acer Predator Helios 18 PH18-72-98MW | |
| Asus ROG Strix Scar 18 G834JYR (2024) | |
| Average of class Gaming (11.5 - 44.4, n=105, last 2 years) | |
| Razer Blade 18 2024 RZ09-0509 | |
| Schenker Key 17 Pro (M24) | |
| LibreOffice / 20 Documents To PDF | |
| Acer Predator Helios 18 PH18-72-98MW | |
| Average of class Gaming (33.2 - 88.8, n=105, last 2 years) | |
| Razer Blade 18 2024 RZ09-0509 | |
| Schenker Key 17 Pro (M24) | |
| MSI Titan 18 HX A14VIG | |
| Alienware m18 R2 | |
| Asus ROG Strix Scar 18 G834JYR (2024) | |
| Average Intel Core Ultra 9 275HX (33.2 - 62.1, n=30) | |
| Asus Strix Scar 18 G835LX | |
| R Benchmark 2.5 / Overall mean | |
| Average of class Gaming (0.3439 - 0.759, n=106, last 2 years) | |
| Acer Predator Helios 18 PH18-72-98MW | |
| Average Intel Core Ultra 9 275HX (0.3943 - 0.4568, n=30) | |
| Schenker Key 17 Pro (M24) | |
| Asus ROG Strix Scar 18 G834JYR (2024) | |
| Asus Strix Scar 18 G835LX | |
| Razer Blade 18 2024 RZ09-0509 | |
| MSI Titan 18 HX A14VIG | |
| Alienware m18 R2 | |
* ... smaller is better
AIDA64: FP32 Ray-Trace | FPU Julia | CPU SHA3 | CPU Queen | FPU SinJulia | FPU Mandel | CPU AES | CPU ZLib | FP64 Ray-Trace | CPU PhotoWorxx
| Performance rating | |
| Asus Strix Scar 18 G835LX | |
| Average Intel Core Ultra 9 275HX | |
| MSI Titan 18 HX A14VIG | |
| Alienware m18 R2 | |
| Asus ROG Strix Scar 18 G834JYR (2024) | |
| Average of class Gaming | |
| Razer Blade 18 2024 RZ09-0509 | |
| Acer Predator Helios 18 PH18-72-98MW | |
| Schenker Key 17 Pro (M24) | |
| AIDA64 / FP32 Ray-Trace | |
| Asus Strix Scar 18 G835LX | |
| Average Intel Core Ultra 9 275HX (28039 - 39895, n=30) | |
| Average of class Gaming (10227 - 85542, n=105, last 2 years) | |
| MSI Titan 18 HX A14VIG | |
| Alienware m18 R2 | |
| Asus ROG Strix Scar 18 G834JYR (2024) | |
| Razer Blade 18 2024 RZ09-0509 | |
| Acer Predator Helios 18 PH18-72-98MW | |
| Schenker Key 17 Pro (M24) | |
| AIDA64 / FPU Julia | |
| Asus Strix Scar 18 G835LX | |
| Average Intel Core Ultra 9 275HX (140254 - 200744, n=30) | |
| MSI Titan 18 HX A14VIG | |
| Alienware m18 R2 | |
| Average of class Gaming (51376 - 238426, n=105, last 2 years) | |
| Asus ROG Strix Scar 18 G834JYR (2024) | |
| Razer Blade 18 2024 RZ09-0509 | |
| Acer Predator Helios 18 PH18-72-98MW | |
| Schenker Key 17 Pro (M24) | |
| AIDA64 / CPU SHA3 | |
| Asus Strix Scar 18 G835LX | |
| Average Intel Core Ultra 9 275HX (6710 - 9817, n=30) | |
| MSI Titan 18 HX A14VIG | |
| Alienware m18 R2 | |
| Average of class Gaming (2180 - 10115, n=105, last 2 years) | |
| Asus ROG Strix Scar 18 G834JYR (2024) | |
| Razer Blade 18 2024 RZ09-0509 | |
| Acer Predator Helios 18 PH18-72-98MW | |
| Schenker Key 17 Pro (M24) | |
| AIDA64 / CPU Queen | |
| MSI Titan 18 HX A14VIG | |
| Asus ROG Strix Scar 18 G834JYR (2024) | |
| Asus Strix Scar 18 G835LX | |
| Alienware m18 R2 | |
| Acer Predator Helios 18 PH18-72-98MW | |
| Schenker Key 17 Pro (M24) | |
| Razer Blade 18 2024 RZ09-0509 | |
| Average Intel Core Ultra 9 275HX (113887 - 140937, n=30) | |
| Average of class Gaming (49785 - 173351, n=90, last 2 years) | |
| AIDA64 / FPU SinJulia | |
| MSI Titan 18 HX A14VIG | |
| Alienware m18 R2 | |
| Asus ROG Strix Scar 18 G834JYR (2024) | |
| Razer Blade 18 2024 RZ09-0509 | |
| Acer Predator Helios 18 PH18-72-98MW | |
| Average of class Gaming (4424 - 33636, n=105, last 2 years) | |
| Asus Strix Scar 18 G835LX | |
| Schenker Key 17 Pro (M24) | |
| Average Intel Core Ultra 9 275HX (11172 - 14425, n=30) | |
| AIDA64 / FPU Mandel | |
| Asus Strix Scar 18 G835LX | |
| Average Intel Core Ultra 9 275HX (72596 - 104508, n=30) | |
| Average of class Gaming (25115 - 128721, n=105, last 2 years) | |
| Alienware m18 R2 | |
| MSI Titan 18 HX A14VIG | |
| Asus ROG Strix Scar 18 G834JYR (2024) | |
| Razer Blade 18 2024 RZ09-0509 | |
| Acer Predator Helios 18 PH18-72-98MW | |
| Schenker Key 17 Pro (M24) | |
| AIDA64 / CPU AES | |
| MSI Titan 18 HX A14VIG | |
| Asus Strix Scar 18 G835LX | |
| Alienware m18 R2 | |
| Average Intel Core Ultra 9 275HX (105608 - 247074, n=30) | |
| Asus ROG Strix Scar 18 G834JYR (2024) | |
| Razer Blade 18 2024 RZ09-0509 | |
| Acer Predator Helios 18 PH18-72-98MW | |
| Average of class Gaming (39258 - 247074, n=105, last 2 years) | |
| Schenker Key 17 Pro (M24) | |
| AIDA64 / CPU ZLib | |
| Asus Strix Scar 18 G835LX | |
| MSI Titan 18 HX A14VIG | |
| Alienware m18 R2 | |
| Average Intel Core Ultra 9 275HX (1582 - 2263, n=30) | |
| Razer Blade 18 2024 RZ09-0509 | |
| Asus ROG Strix Scar 18 G834JYR (2024) | |
| Acer Predator Helios 18 PH18-72-98MW | |
| Schenker Key 17 Pro (M24) | |
| Average of class Gaming (574 - 2531, n=105, last 2 years) | |
| AIDA64 / FP64 Ray-Trace | |
| Asus Strix Scar 18 G835LX | |
| Average Intel Core Ultra 9 275HX (14847 - 21854, n=30) | |
| Average of class Gaming (5509 - 45446, n=105, last 2 years) | |
| Alienware m18 R2 | |
| MSI Titan 18 HX A14VIG | |
| Razer Blade 18 2024 RZ09-0509 | |
| Asus ROG Strix Scar 18 G834JYR (2024) | |
| Acer Predator Helios 18 PH18-72-98MW | |
| Schenker Key 17 Pro (M24) | |
| AIDA64 / CPU PhotoWorxx | |
| Asus Strix Scar 18 G835LX | |
| Schenker Key 17 Pro (M24) | |
| Average Intel Core Ultra 9 275HX (37482 - 62916, n=30) | |
| Alienware m18 R2 | |
| Asus ROG Strix Scar 18 G834JYR (2024) | |
| Razer Blade 18 2024 RZ09-0509 | |
| Acer Predator Helios 18 PH18-72-98MW | |
| Average of class Gaming (12271 - 89891, n=105, last 2 years) | |
| MSI Titan 18 HX A14VIG | |
System performance
The Strix SCAR 18 is a super responsive system, but its benchmark results were only average. The Advanced Optimus graphics switching causes a brief hang when starting games, but this is normal.
CrossMark: Overall | Productivity | Creativity | Responsiveness
WebXPRT 3: Overall
WebXPRT 4: Overall
Mozilla Kraken 1.1: Total
| PCMark 10 / Score | |
| Alienware m18 R2 | |
| MSI Titan 18 HX A14VIG | |
| Razer Blade 18 2024 RZ09-0509 | |
| Asus ROG Strix Scar 18 G834JYR (2024) | |
| Asus Strix Scar 18 G835LX | |
| Average Intel Core Ultra 9 275HX, NVIDIA GeForce RTX 5090 Laptop (7474 - 9497, n=11) | |
| Average of class Gaming (5828 - 12414, n=93, last 2 years) | |
| Schenker Key 17 Pro (M24) | |
| Acer Predator Helios 18 PH18-72-98MW | |
| PCMark 10 / Essentials | |
| MSI Titan 18 HX A14VIG | |
| Alienware m18 R2 | |
| Asus ROG Strix Scar 18 G834JYR (2024) | |
| Razer Blade 18 2024 RZ09-0509 | |
| Acer Predator Helios 18 PH18-72-98MW | |
| Asus Strix Scar 18 G835LX | |
| Average Intel Core Ultra 9 275HX, NVIDIA GeForce RTX 5090 Laptop (9994 - 11369, n=12) | |
| Schenker Key 17 Pro (M24) | |
| Average of class Gaming (8810 - 11935, n=97, last 2 years) | |
| PCMark 10 / Productivity | |
| Alienware m18 R2 | |
| Average of class Gaming (6845 - 25323, n=95, last 2 years) | |
| Asus ROG Strix Scar 18 G834JYR (2024) | |
| MSI Titan 18 HX A14VIG | |
| Razer Blade 18 2024 RZ09-0509 | |
| Acer Predator Helios 18 PH18-72-98MW | |
| Average Intel Core Ultra 9 275HX, NVIDIA GeForce RTX 5090 Laptop (9122 - 10925, n=11) | |
| Schenker Key 17 Pro (M24) | |
| Asus Strix Scar 18 G835LX | |
| PCMark 10 / Digital Content Creation | |
| Asus Strix Scar 18 G835LX | |
| MSI Titan 18 HX A14VIG | |
| Average Intel Core Ultra 9 275HX, NVIDIA GeForce RTX 5090 Laptop (9952 - 19234, n=11) | |
| Alienware m18 R2 | |
| Razer Blade 18 2024 RZ09-0509 | |
| Asus ROG Strix Scar 18 G834JYR (2024) | |
| Schenker Key 17 Pro (M24) | |
| Average of class Gaming (7602 - 19954, n=95, last 2 years) | |
| Acer Predator Helios 18 PH18-72-98MW | |
| CrossMark / Overall | |
| Asus Strix Scar 18 G835LX | |
| Asus ROG Strix Scar 18 G834JYR (2024) | |
| Average Intel Core Ultra 9 275HX, NVIDIA GeForce RTX 5090 Laptop (1995 - 2339, n=12) | |
| Alienware m18 R2 | |
| Razer Blade 18 2024 RZ09-0509 | |
| Average of class Gaming (1366 - 2409, n=94, last 2 years) | |
| MSI Titan 18 HX A14VIG | |
| CrossMark / Productivity | |
| Asus ROG Strix Scar 18 G834JYR (2024) | |
| Average Intel Core Ultra 9 275HX, NVIDIA GeForce RTX 5090 Laptop (1847 - 2211, n=12) | |
| Asus Strix Scar 18 G835LX | |
| Razer Blade 18 2024 RZ09-0509 | |
| Alienware m18 R2 | |
| Average of class Gaming (1386 - 2254, n=94, last 2 years) | |
| MSI Titan 18 HX A14VIG | |
| CrossMark / Creativity | |
| Asus Strix Scar 18 G835LX | |
| Average Intel Core Ultra 9 275HX, NVIDIA GeForce RTX 5090 Laptop (2170 - 2642, n=12) | |
| Asus ROG Strix Scar 18 G834JYR (2024) | |
| Alienware m18 R2 | |
| Razer Blade 18 2024 RZ09-0509 | |
| Average of class Gaming (1343 - 2786, n=94, last 2 years) | |
| MSI Titan 18 HX A14VIG | |
| CrossMark / Responsiveness | |
| Asus ROG Strix Scar 18 G834JYR (2024) | |
| Average Intel Core Ultra 9 275HX, NVIDIA GeForce RTX 5090 Laptop (1673 - 2217, n=12) | |
| Asus Strix Scar 18 G835LX | |
| Alienware m18 R2 | |
| Razer Blade 18 2024 RZ09-0509 | |
| Average of class Gaming (1226 - 2334, n=94, last 2 years) | |
| MSI Titan 18 HX A14VIG | |
| WebXPRT 3 / Overall | |
| Average Intel Core Ultra 9 275HX, NVIDIA GeForce RTX 5090 Laptop (315 - 372, n=12) | |
| Asus Strix Scar 18 G835LX | |
| Razer Blade 18 2024 RZ09-0509 | |
| MSI Titan 18 HX A14VIG | |
| Alienware m18 R2 | |
| Asus ROG Strix Scar 18 G834JYR (2024) | |
| Average of class Gaming (220 - 532, n=98, last 2 years) | |
| Schenker Key 17 Pro (M24) | |
| WebXPRT 4 / Overall | |
| Asus Strix Scar 18 G835LX | |
| Average Intel Core Ultra 9 275HX, NVIDIA GeForce RTX 5090 Laptop (301 - 341, n=11) | |
| Alienware m18 R2 | |
| Asus ROG Strix Scar 18 G834JYR (2024) | |
| MSI Titan 18 HX A14VIG | |
| Average of class Gaming (165 - 354, n=98, last 2 years) | |
| Schenker Key 17 Pro (M24) | |
| Mozilla Kraken 1.1 / Total | |
| Schenker Key 17 Pro (M24) | |
| Average of class Gaming (391 - 590, n=100, last 2 years) | |
| MSI Titan 18 HX A14VIG | |
| Asus ROG Strix Scar 18 G834JYR (2024) | |
| Razer Blade 18 2024 RZ09-0509 | |
| Acer Predator Helios 18 PH18-72-98MW | |
| Alienware m18 R2 | |
| Average Intel Core Ultra 9 275HX, NVIDIA GeForce RTX 5090 Laptop (402 - 424, n=12) | |
| Asus Strix Scar 18 G835LX | |
* ... smaller is better
| PCMark 10 Score | 8623 points | |
Help | ||
| AIDA64 / Memory Copy | |
| Asus Strix Scar 18 G835LX | |
| Asus ROG Strix Scar 18 G834JYR (2024) | |
| Average Intel Core Ultra 9 275HX (56003 - 94460, n=30) | |
| Alienware m18 R2 | |
| Schenker Key 17 Pro (M24) | |
| Acer Predator Helios 18 PH18-72-98MW | |
| Razer Blade 18 2024 RZ09-0509 | |
| Average of class Gaming (21750 - 129946, n=105, last 2 years) | |
| MSI Titan 18 HX A14VIG | |
| AIDA64 / Memory Read | |
| Asus ROG Strix Scar 18 G834JYR (2024) | |
| Asus Strix Scar 18 G835LX | |
| Alienware m18 R2 | |
| Schenker Key 17 Pro (M24) | |
| Acer Predator Helios 18 PH18-72-98MW | |
| Average Intel Core Ultra 9 275HX (55795 - 97151, n=30) | |
| Razer Blade 18 2024 RZ09-0509 | |
| Average of class Gaming (22956 - 118858, n=105, last 2 years) | |
| MSI Titan 18 HX A14VIG | |
| AIDA64 / Memory Write | |
| Asus Strix Scar 18 G835LX | |
| Average Intel Core Ultra 9 275HX (55663 - 116129, n=30) | |
| Asus ROG Strix Scar 18 G834JYR (2024) | |
| Schenker Key 17 Pro (M24) | |
| Alienware m18 R2 | |
| Average of class Gaming (22297 - 135096, n=105, last 2 years) | |
| Acer Predator Helios 18 PH18-72-98MW | |
| Razer Blade 18 2024 RZ09-0509 | |
| MSI Titan 18 HX A14VIG | |
| AIDA64 / Memory Latency | |
| Average Intel Core Ultra 9 275HX (105.8 - 161.6, n=30) | |
| Asus Strix Scar 18 G835LX | |
| Average of class Gaming (75.3 - 259, n=105, last 2 years) | |
| MSI Titan 18 HX A14VIG | |
| Razer Blade 18 2024 RZ09-0509 | |
| Alienware m18 R2 | |
| Schenker Key 17 Pro (M24) | |
| Acer Predator Helios 18 PH18-72-98MW | |
| Asus ROG Strix Scar 18 G834JYR (2024) | |
* ... smaller is better
DPC latencies
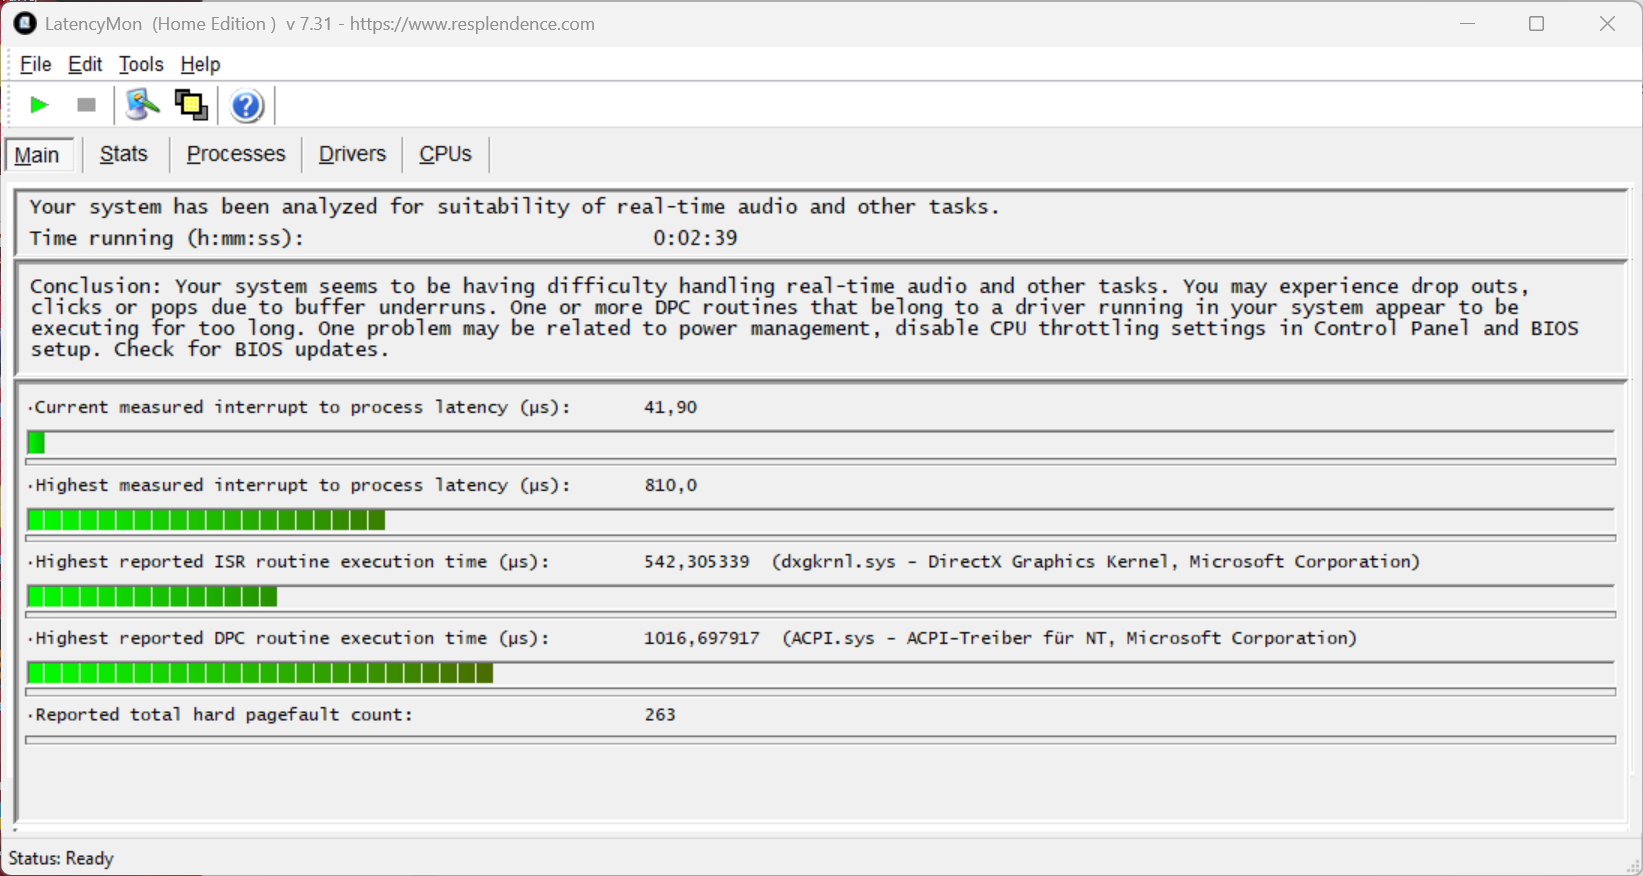
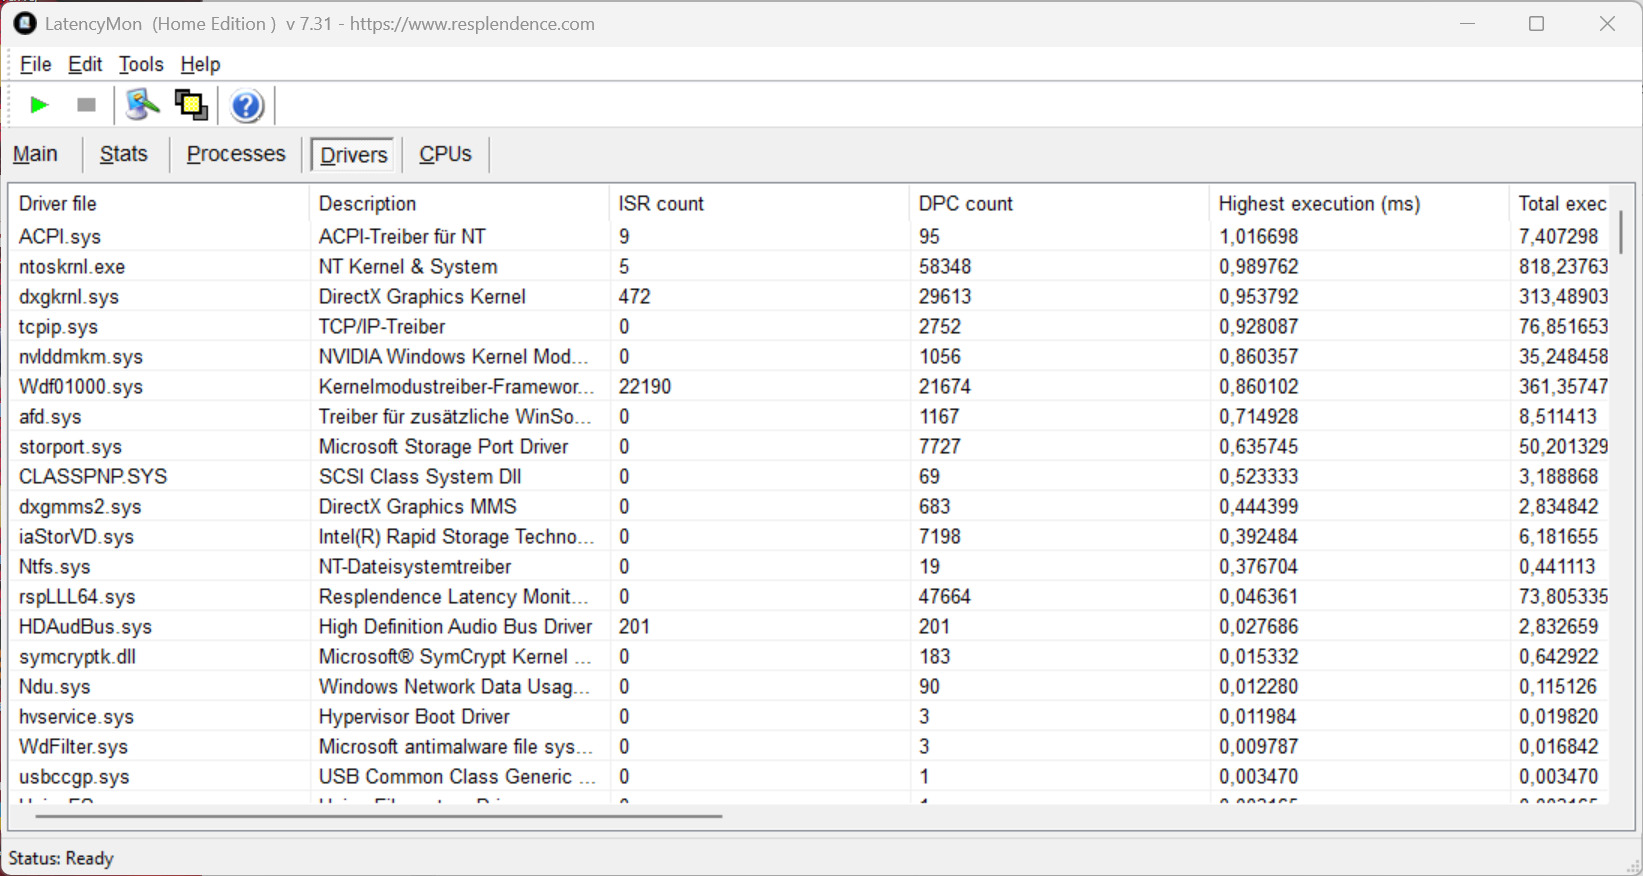
In our standardized latency test (surfing the web, 4K YouTube playback, CPU load), the test device with the current BIOS version showed no limitations. Although one driver failed slightly, the important interrupt-to-process latency value was low.
| DPC Latencies / LatencyMon - interrupt to process latency (max), Web, Youtube, Prime95 | |
| Acer Predator Helios 18 PH18-72-98MW | |
| Alienware m18 R2 | |
| MSI Titan 18 HX A14VIG | |
| Schenker Key 17 Pro (M24) | |
| Razer Blade 18 2024 RZ09-0509 | |
| Asus ROG Strix Scar 18 G834JYR (2024) | |
| Asus Strix Scar 18 G835LX | |
* ... smaller is better
Storage device
Our test configuration is equipped with two 2-TB SSDs from WD, which run in a RAID 0 array (3.6 TB free for the user). Although this was able to increase its maximum transfer rate, the team clearly fell behind in some values during the benchmarks. A RAID 0 array also isn't ideal if one of the SSDs is defective. It would have been better if Asus had already installed a PCIe 5.0 slot, because this would've resulted in better performance even with a single SSD or without RAID. Even so, the performance of the two SSDs remains stable under constant load.

* ... smaller is better
Reading continuous performance: DiskSpd Read Loop, Queue Depth 8
Graphics card
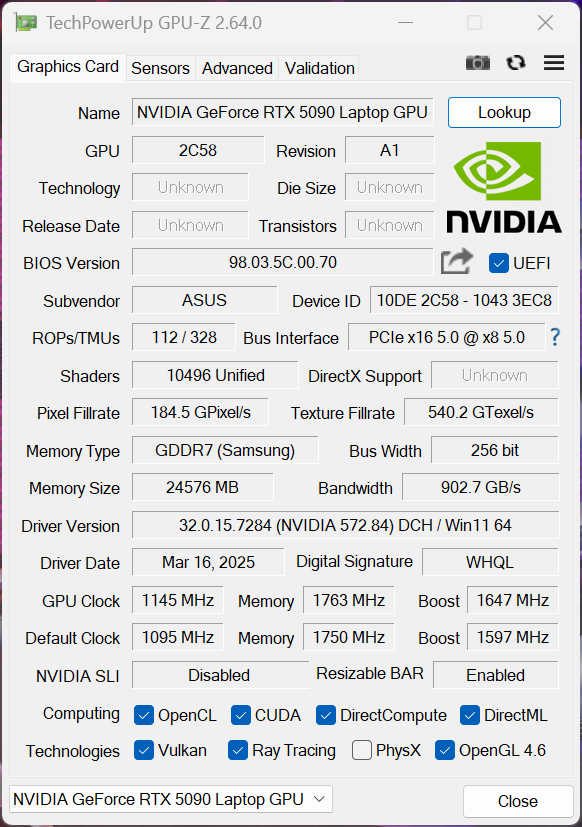
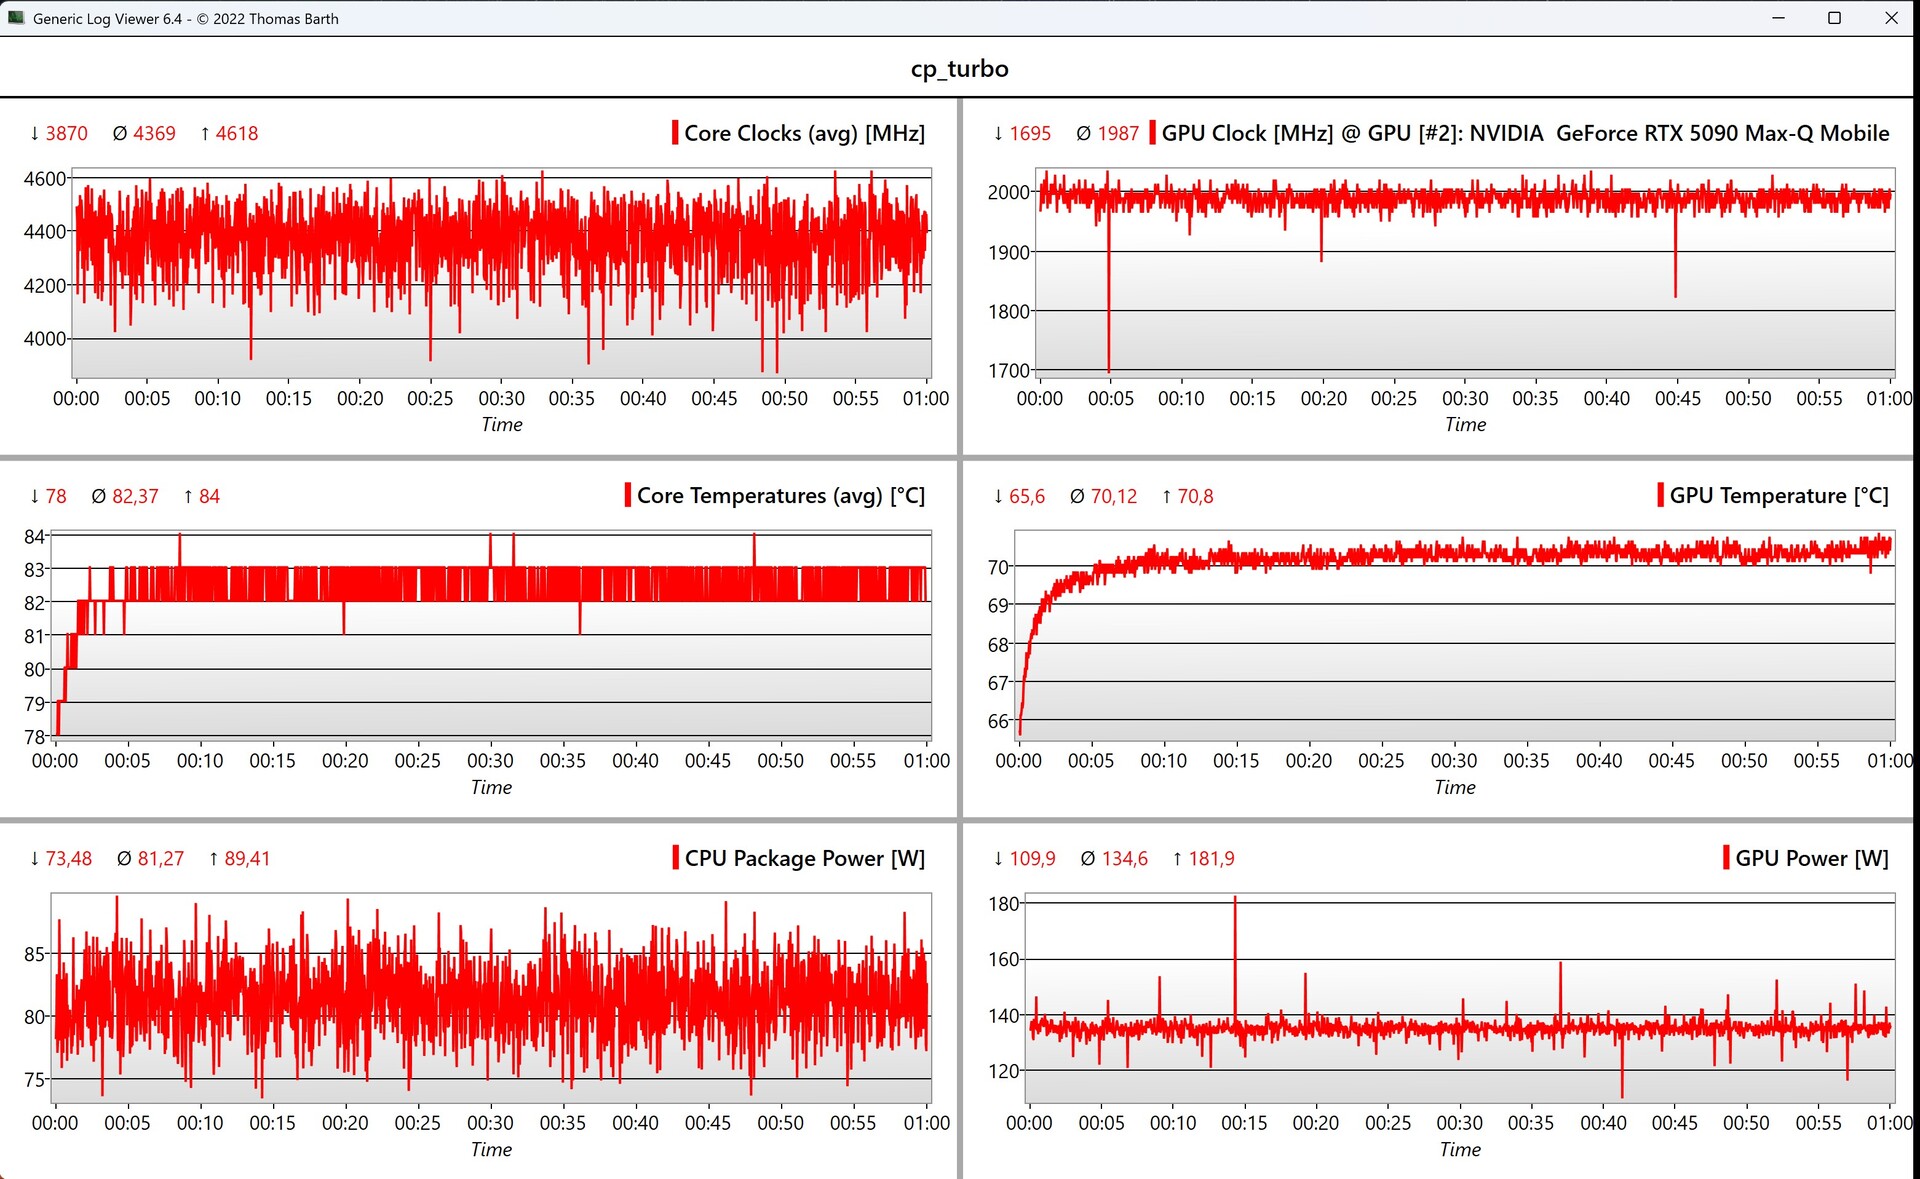
The Strix SCAR 18 is equipped with the new GeForce RTX 5090 Laptop, which features 24 GB of VRAM and reaches a maximum clock speed of 2,340 MHz. It is the fastest variant with a TGP of 175 watts (150 watts + 25 watts Dynamic Boost). We have reported in detail on the new features of the RTX 5000 range in our GPU analysis. During the synthetic benchmarks, the new SCAR 18 was around 20% ahead of the old model. In manual mode, the core and memory clock can be increased by up to 200 MHz, which resulted in around 25,200 points in Time Spy Graphics (+700 points vs. Turbo). The GPU's performance remained constant even under permanent load, but the GPU can consume a maximum of 55 watts in battery mode, which is why its performance was significantly lower in this case (-64%).
| 3DMark 11 Performance | 48486 points | |
| 3DMark Fire Strike Score | 38733 points | |
| 3DMark Time Spy Score | 23130 points | |
| 3DMark Steel Nomad Score | 5883 points | |
| 3DMark Steel Nomad Light Score | 25244 points | |
| 3DMark Steel Nomad Light Unlimited Score | 24960 points | |
Help | ||
| Blender / v3.3 Classroom OPTIX/RTX | |
| Average of class Gaming (9 - 32, n=106, last 2 years) | |
| Razer Blade 18 2024 RZ09-0509 | |
| Acer Predator Helios 18 PH18-72-98MW | |
| Schenker Key 17 Pro (M24) | |
| Asus ROG Strix Scar 18 G834JYR (2024) | |
| Alienware m18 R2 | |
| Average NVIDIA GeForce RTX 5090 Laptop (9 - 18, n=23) | |
| MSI Titan 18 HX A14VIG | |
| Asus Strix Scar 18 G835LX | |
| Blender / v3.3 Classroom CUDA | |
| Average of class Gaming (15 - 228, n=106, last 2 years) | |
| Razer Blade 18 2024 RZ09-0509 | |
| MSI Titan 18 HX A14VIG | |
| Acer Predator Helios 18 PH18-72-98MW | |
| Alienware m18 R2 | |
| Schenker Key 17 Pro (M24) | |
| Average NVIDIA GeForce RTX 5090 Laptop (15 - 37, n=22) | |
| Asus ROG Strix Scar 18 G834JYR (2024) | |
| Asus Strix Scar 18 G835LX | |
| Blender / v3.3 Classroom CPU | |
| Average of class Gaming (122 - 565, n=102, last 2 years) | |
| Acer Predator Helios 18 PH18-72-98MW | |
| Schenker Key 17 Pro (M24) | |
| Asus ROG Strix Scar 18 G834JYR (2024) | |
| Razer Blade 18 2024 RZ09-0509 | |
| Alienware m18 R2 | |
| MSI Titan 18 HX A14VIG | |
| Average NVIDIA GeForce RTX 5090 Laptop (123 - 282, n=23) | |
| Asus Strix Scar 18 G835LX | |
* ... smaller is better
Gaming performance
Overall, its gaming performance is very good, but the advantage in its native performance without upscaling isn't the biggest—especially compared to the old GeForce RTX 4090 Laptop—and an update makes little sense here. This changes if you are still using an RTX-3000 generation GPU such as the RTX 3080 Ti. However, if you want to play demanding games with full ray tracing or path tracing, such as Cyberpunk or Alan Wake, you won't be able to avoid upscaling via DLSS4, even in WQHD resolution. With Frame Generation, the laptop's performance can be increased even more significantly, which we have also shown in detail in our GPU analysis.
| Cyberpunk 2077 - 1920x1080 Ultra Preset (FSR off) | |
| Asus Strix Scar 18 G835LX | |
| Alienware m18 R2 | |
| MSI Titan 18 HX A14VIG | |
| Schenker Key 17 Pro (M24) | |
| Asus ROG Strix Scar 18 G834JYR (2024) | |
| Average of class Gaming (17.7 - 169.9, n=115, last 2 years) | |
| Razer Blade 18 2024 RZ09-0509 | |
| Baldur's Gate 3 - 1920x1080 Ultra Preset AA:T | |
| MSI Titan 18 HX A14VIG | |
| Alienware m18 R2 | |
| Asus Strix Scar 18 G835LX | |
| Schenker Key 17 Pro (M24) | |
| Razer Blade 18 2024 RZ09-0509 | |
| Average of class Gaming (59.4 - 246, n=104, last 2 years) | |
Cyberpunk 2077 ultra FPS diagram
| low | med. | high | ultra | QHD | 4K DLSS | 4K | |
|---|---|---|---|---|---|---|---|
| GTA V (2015) | 161.9 | 156.8 | 179.5 | ||||
| Dota 2 Reborn (2015) | 240 | 210 | 200 | 186.6 | 179.9 | ||
| Final Fantasy XV Benchmark (2018) | 233 | 231 | 199.3 | 162.4 | 101.3 | ||
| X-Plane 11.11 (2018) | 163.4 | 158.1 | 121.7 | 94.8 | |||
| Strange Brigade (2018) | 563 | 431 | 418 | 401 | 330 | 187.2 | |
| Baldur's Gate 3 (2023) | 193.7 | 145.6 | 125.4 | 82.8 | |||
| Cyberpunk 2077 (2023) | 154.9 | 106.8 | 52.1 | ||||
| Alan Wake 2 (2023) | 116.4 | 82.4 | 46 | ||||
| F1 24 (2024) | 148 | 100 | 52 | ||||
| Call of Duty Black Ops 6 (2024) | 147 | 117 | 79 | ||||
| Indiana Jones and the Great Circle (2024) | 127.9 | 102.2 | 65 | ||||
| Monster Hunter Wilds (2025) | 87.6 | 72 | 46.3 | ||||
| Assassin's Creed Shadows (2025) | 65 | 51 | 36 |
Emissions
Noise emissions
The device's fan noise is largely determined by the selected energy profile and we recommend using quiet mode during everyday use, as the fans are very often silent. Gaming is also interesting using this mode if you don't want things to get loud—we measured a maximum of 34.8 dB(A). As soon as turbo mode is activated, the fans always run at just under 30 dB(A). When gaming and during the stress test, it got really loud at 53.7 dB(A) and you should definitely use headphones or the included headset—but this also applies to performance mode (49 dB(A)). However, it must also be said that some competitors are even significantly louder. We noted slight electronic noises in some synthetic GPU benchmarks, but this isn't a problem during everyday use and when gaming.
Noise level
| Idle |
| 29.8 / 29.8 / 29.8 dB(A) |
| Load |
| 42.9 / 53.7 dB(A) |
 | ||
30 dB silent 40 dB(A) audible 50 dB(A) loud |
||
min: | ||
| Asus Strix Scar 18 G835LX GeForce RTX 5090 Laptop, Ultra 9 275HX, WD PC SN8000S 2TB | Razer Blade 18 2024 RZ09-0509 GeForce RTX 4090 Laptop GPU, i9-14900HX | Alienware m18 R2 GeForce RTX 4090 Laptop GPU, i9-14900HX, SK Hynix PC811 HFS002TEM9X152N | Acer Predator Helios 18 PH18-72-98MW GeForce RTX 4090 Laptop GPU, i9-14900HX, 2x SK Hynix HFS001TEJ9X115N (RAID 0) | MSI Titan 18 HX A14VIG GeForce RTX 4090 Laptop GPU, i9-14900HX, 2x Samsung PM9A1a MZVL22T0HDLB (RAID 0) | Schenker Key 17 Pro (M24) GeForce RTX 4090 Laptop GPU, i9-14900HX, Samsung 990 Pro 1 TB | Asus ROG Strix Scar 18 G834JYR (2024) GeForce RTX 4090 Laptop GPU, i9-14900HX, Samsung PM9A1a MZVL22T0HDLB | |
|---|---|---|---|---|---|---|---|
| Noise | 5% | 8% | -14% | 7% | 5% | -2% | |
| off / environment * (dB) | 23.3 | 23.4 -0% | 23.6 -1% | 25 -7% | 22.8 2% | 23.41 -0% | 24 -3% |
| Idle Minimum * (dB) | 29.8 | 23.9 20% | 23.8 20% | 30 -1% | 23.8 20% | 25.33 15% | 27 9% |
| Idle Average * (dB) | 29.8 | 28.2 5% | 26.1 12% | 36 -21% | 23.8 20% | 25.33 15% | 28 6% |
| Idle Maximum * (dB) | 29.8 | 29 3% | 31.5 -6% | 44 -48% | 28 6% | 25.33 15% | 32 -7% |
| Load Average * (dB) | 42.9 | 36.8 14% | 31.5 27% | 48 -12% | 38 11% | 33.57 22% | 50 -17% |
| Cyberpunk 2077 ultra * (dB) | 53.7 | 61.97 -15% | |||||
| Load Maximum * (dB) | 53.7 | 61.1 -14% | 56.6 -5% | 51 5% | 62.8 -17% | 62.14 -16% | 52 3% |
| Witcher 3 ultra * (dB) | 54.1 | 52.1 | 49 | 57.3 | 50 |
* ... smaller is better
Temperature
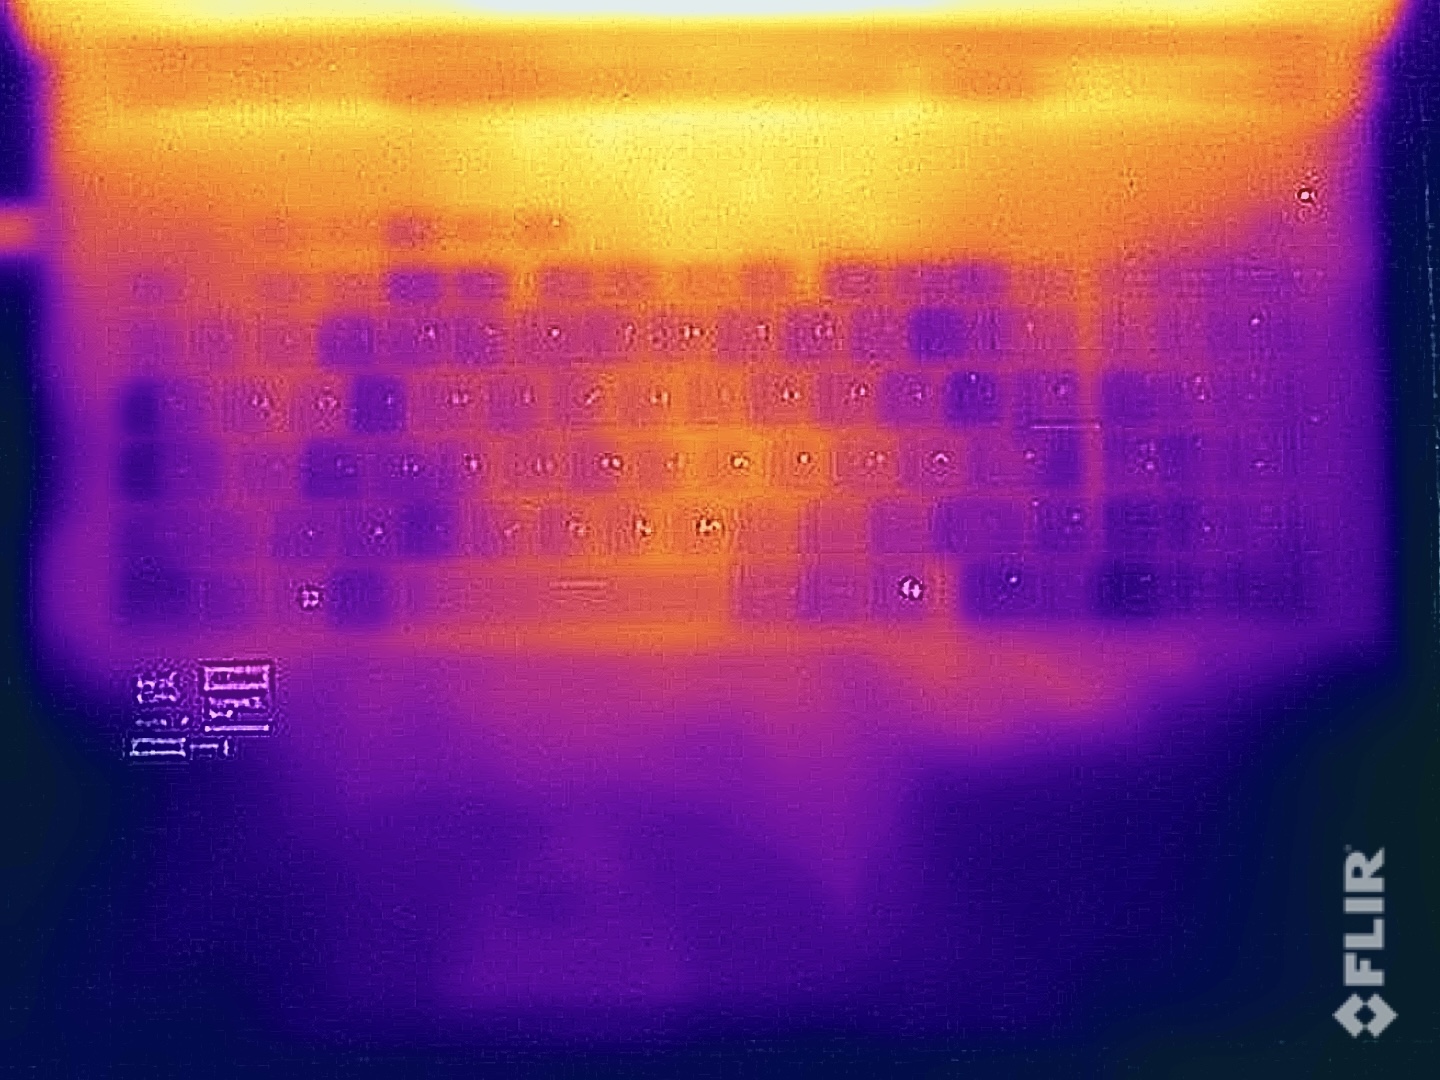
There are no problems regarding the laptop's surface temperatures and we only measured around 45 °C in a few places under full load. Even so, the keyboard (and especially the WASD area) only warms up slightly and your hands stay cool when gaming. The GPU was favored during the stress test and was stable at 175 watts after a few minutes (CPU ~57 watts), during which the temperatures also remained harmless.
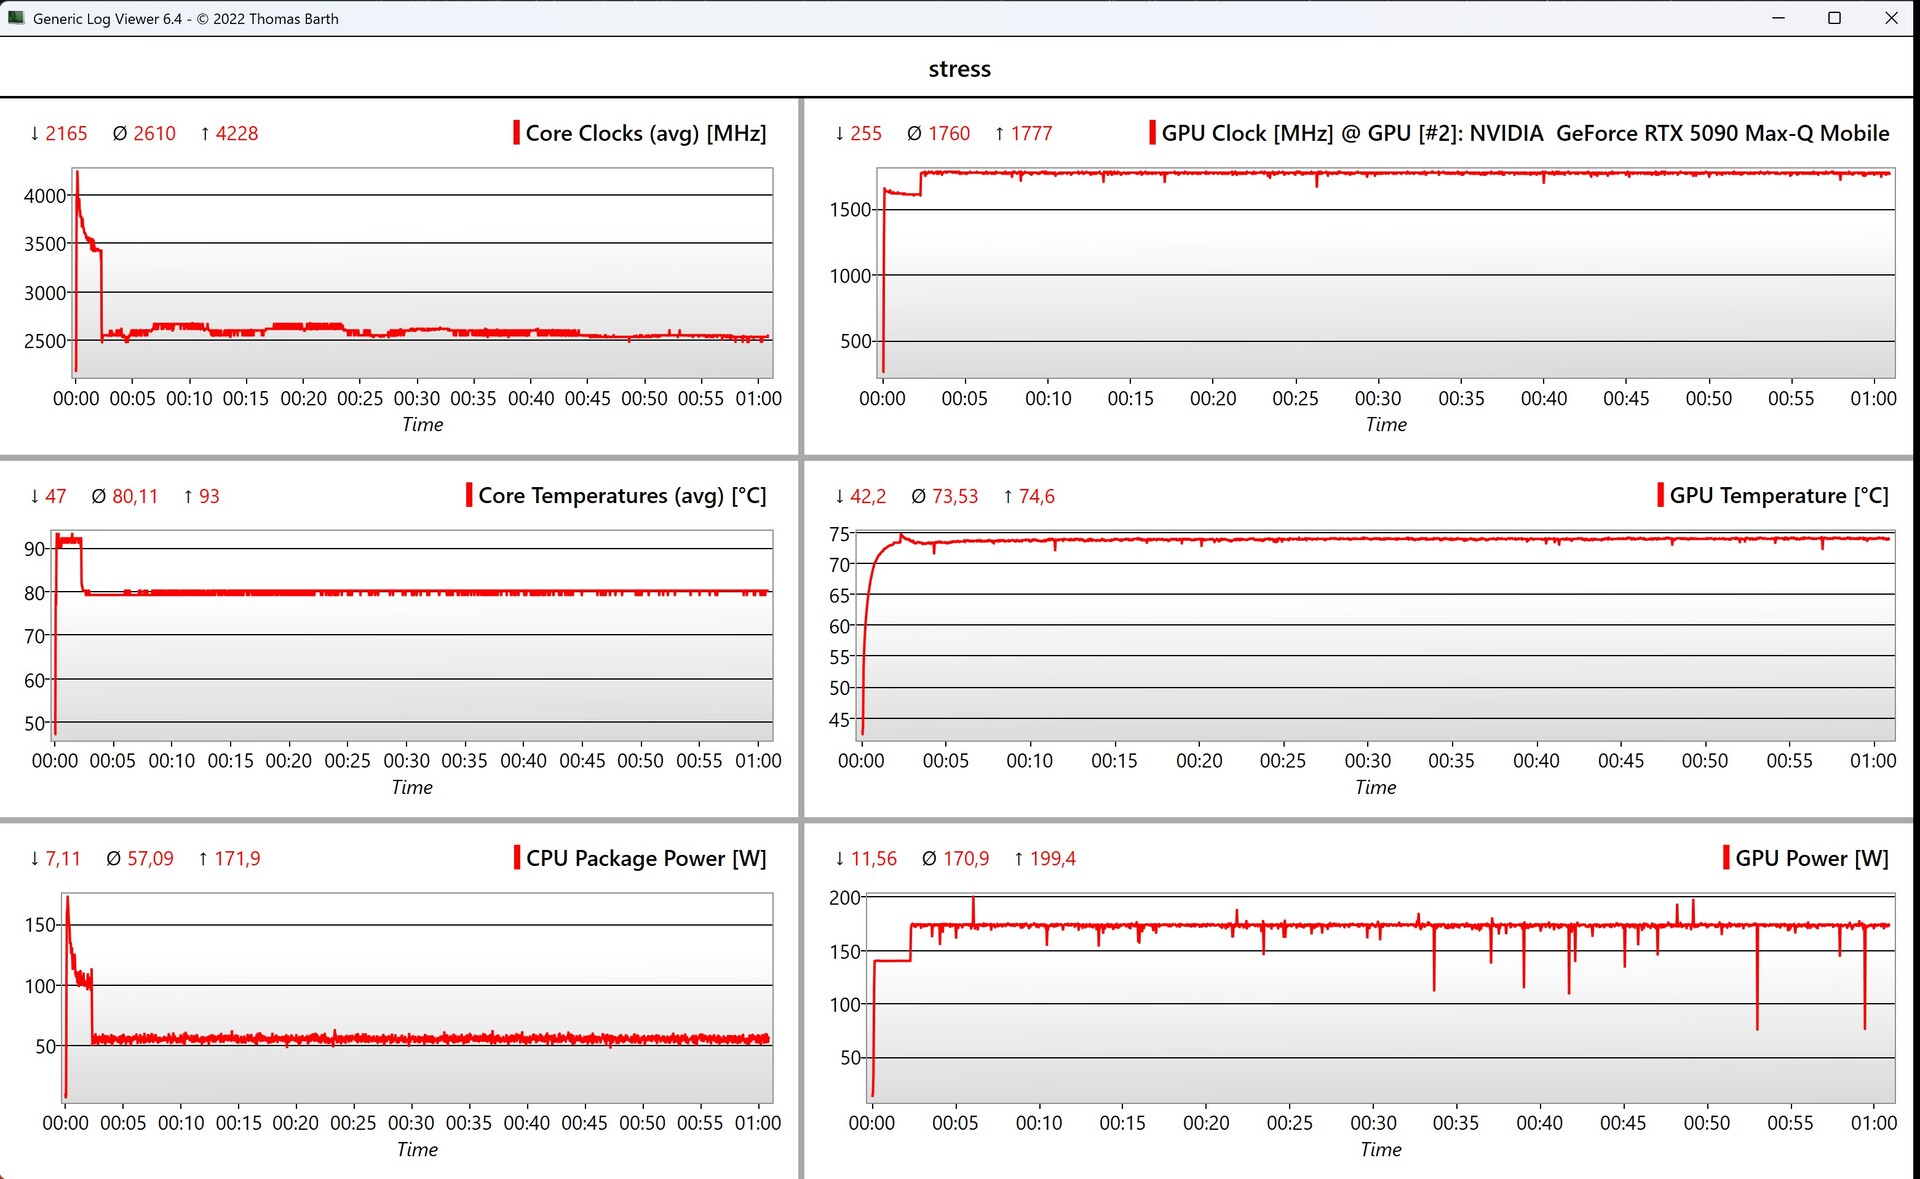
(-) The maximum temperature on the upper side is 45.6 °C / 114 F, compared to the average of 40.4 °C / 105 F, ranging from 21.2 to 68.8 °C for the class Gaming.
(-) The bottom heats up to a maximum of 46 °C / 115 F, compared to the average of 43.2 °C / 110 F
(+) In idle usage, the average temperature for the upper side is 26.8 °C / 80 F, compared to the device average of 33.9 °C / 93 F.
(±) 3: The average temperature for the upper side is 34.4 °C / 94 F, compared to the average of 33.9 °C / 93 F for the class Gaming.
(+) The palmrests and touchpad are cooler than skin temperature with a maximum of 29.2 °C / 84.6 F and are therefore cool to the touch.
(±) The average temperature of the palmrest area of similar devices was 28.8 °C / 83.8 F (-0.4 °C / -0.8 F).

| Asus Strix Scar 18 G835LX Intel Core Ultra 9 275HX, NVIDIA GeForce RTX 5090 Laptop | Razer Blade 18 2024 RZ09-0509 Intel Core i9-14900HX, NVIDIA GeForce RTX 4090 Laptop GPU | Alienware m18 R2 Intel Core i9-14900HX, NVIDIA GeForce RTX 4090 Laptop GPU | Acer Predator Helios 18 PH18-72-98MW Intel Core i9-14900HX, NVIDIA GeForce RTX 4090 Laptop GPU | MSI Titan 18 HX A14VIG Intel Core i9-14900HX, NVIDIA GeForce RTX 4090 Laptop GPU | Schenker Key 17 Pro (M24) Intel Core i9-14900HX, NVIDIA GeForce RTX 4090 Laptop GPU | Asus ROG Strix Scar 18 G834JYR (2024) Intel Core i9-14900HX, NVIDIA GeForce RTX 4090 Laptop GPU | |
|---|---|---|---|---|---|---|---|
| Heat | -10% | -16% | -12% | -2% | -39% | -4% | |
| Maximum Upper Side * (°C) | 45.6 | 43.2 5% | 41.2 10% | 43 6% | 37.8 17% | 51 -12% | 49 -7% |
| Maximum Bottom * (°C) | 46 | 42.6 7% | 34.6 25% | 59 -28% | 37.6 18% | 64 -39% | 47 -2% |
| Idle Upper Side * (°C) | 28.9 | 36 -25% | 42.8 -48% | 32 -11% | 34.8 -20% | 42.3 -46% | 29 -0% |
| Idle Bottom * (°C) | 29.2 | 36.4 -25% | 43.6 -49% | 34 -16% | 36 -23% | 46 -58% | 31 -6% |
* ... smaller is better
Speakers
The device's sound system consists of four modules and its performance is decent, but there were better comparison devices during our test in this respect. Still, the speakers aren't much use for gaming anyway, as the fans are too loud.
Asus Strix Scar 18 G835LX audio analysis
(+) | speakers can play relatively loud (86.3 dB)
Bass 100 - 315 Hz
(±) | reduced bass - on average 7.5% lower than median
(±) | linearity of bass is average (7.7% delta to prev. frequency)
Mids 400 - 2000 Hz
(±) | higher mids - on average 9.9% higher than median
(+) | mids are linear (6.9% delta to prev. frequency)
Highs 2 - 16 kHz
(+) | balanced highs - only 2.2% away from median
(+) | highs are linear (4.1% delta to prev. frequency)
Overall 100 - 16.000 Hz
(+) | overall sound is linear (13.7% difference to median)
Compared to same class
» 21% of all tested devices in this class were better, 7% similar, 72% worse
» The best had a delta of 6%, average was 18%, worst was 132%
Compared to all devices tested
» 15% of all tested devices were better, 4% similar, 81% worse
» The best had a delta of 4%, average was 23%, worst was 134%
Razer Blade 18 2024 RZ09-0509 audio analysis
(+) | speakers can play relatively loud (85.2 dB)
Bass 100 - 315 Hz
(±) | reduced bass - on average 5.3% lower than median
(+) | bass is linear (6.5% delta to prev. frequency)
Mids 400 - 2000 Hz
(+) | balanced mids - only 4.5% away from median
(±) | linearity of mids is average (7.1% delta to prev. frequency)
Highs 2 - 16 kHz
(+) | balanced highs - only 2.9% away from median
(+) | highs are linear (4% delta to prev. frequency)
Overall 100 - 16.000 Hz
(+) | overall sound is linear (9.3% difference to median)
Compared to same class
» 3% of all tested devices in this class were better, 2% similar, 95% worse
» The best had a delta of 6%, average was 18%, worst was 132%
Compared to all devices tested
» 3% of all tested devices were better, 1% similar, 96% worse
» The best had a delta of 4%, average was 23%, worst was 134%
Alienware m18 R2 audio analysis
(+) | speakers can play relatively loud (82.5 dB)
Bass 100 - 315 Hz
(-) | nearly no bass - on average 22.1% lower than median
(±) | linearity of bass is average (14% delta to prev. frequency)
Mids 400 - 2000 Hz
(+) | balanced mids - only 4.1% away from median
(+) | mids are linear (3.3% delta to prev. frequency)
Highs 2 - 16 kHz
(+) | balanced highs - only 4% away from median
(+) | highs are linear (6.1% delta to prev. frequency)
Overall 100 - 16.000 Hz
(±) | linearity of overall sound is average (17% difference to median)
Compared to same class
» 45% of all tested devices in this class were better, 12% similar, 43% worse
» The best had a delta of 6%, average was 18%, worst was 132%
Compared to all devices tested
» 31% of all tested devices were better, 8% similar, 61% worse
» The best had a delta of 4%, average was 23%, worst was 134%
Acer Predator Helios 18 PH18-72-98MW audio analysis
(+) | speakers can play relatively loud (85 dB)
Bass 100 - 315 Hz
(-) | nearly no bass - on average 21.1% lower than median
(±) | linearity of bass is average (10.7% delta to prev. frequency)
Mids 400 - 2000 Hz
(+) | balanced mids - only 2.9% away from median
(+) | mids are linear (5.6% delta to prev. frequency)
Highs 2 - 16 kHz
(+) | balanced highs - only 2.7% away from median
(+) | highs are linear (3.6% delta to prev. frequency)
Overall 100 - 16.000 Hz
(+) | overall sound is linear (13.6% difference to median)
Compared to same class
» 20% of all tested devices in this class were better, 7% similar, 73% worse
» The best had a delta of 6%, average was 18%, worst was 132%
Compared to all devices tested
» 15% of all tested devices were better, 4% similar, 82% worse
» The best had a delta of 4%, average was 23%, worst was 134%
MSI Titan 18 HX A14VIG audio analysis
(+) | speakers can play relatively loud (89.2 dB)
Bass 100 - 315 Hz
(-) | nearly no bass - on average 17.6% lower than median
(±) | linearity of bass is average (8% delta to prev. frequency)
Mids 400 - 2000 Hz
(+) | balanced mids - only 1.8% away from median
(+) | mids are linear (3.7% delta to prev. frequency)
Highs 2 - 16 kHz
(+) | balanced highs - only 1.2% away from median
(+) | highs are linear (2% delta to prev. frequency)
Overall 100 - 16.000 Hz
(+) | overall sound is linear (9.9% difference to median)
Compared to same class
» 5% of all tested devices in this class were better, 2% similar, 94% worse
» The best had a delta of 6%, average was 18%, worst was 132%
Compared to all devices tested
» 4% of all tested devices were better, 1% similar, 95% worse
» The best had a delta of 4%, average was 23%, worst was 134%
Schenker Key 17 Pro (M24) audio analysis
(±) | speaker loudness is average but good (80.9 dB)
Bass 100 - 315 Hz
(±) | reduced bass - on average 12.7% lower than median
(±) | linearity of bass is average (9.1% delta to prev. frequency)
Mids 400 - 2000 Hz
(+) | balanced mids - only 2.3% away from median
(+) | mids are linear (5.1% delta to prev. frequency)
Highs 2 - 16 kHz
(+) | balanced highs - only 2.9% away from median
(±) | linearity of highs is average (8.9% delta to prev. frequency)
Overall 100 - 16.000 Hz
(+) | overall sound is linear (11.2% difference to median)
Compared to same class
» 13% of all tested devices in this class were better, 4% similar, 83% worse
» The best had a delta of 7%, average was 17%, worst was 35%
Compared to all devices tested
» 7% of all tested devices were better, 2% similar, 91% worse
» The best had a delta of 4%, average was 23%, worst was 134%
Asus ROG Strix Scar 18 G834JYR (2024) audio analysis
(+) | speakers can play relatively loud (82 dB)
Bass 100 - 315 Hz
(±) | reduced bass - on average 5.6% lower than median
(+) | bass is linear (6.8% delta to prev. frequency)
Mids 400 - 2000 Hz
(±) | higher mids - on average 5.7% higher than median
(+) | mids are linear (2.8% delta to prev. frequency)
Highs 2 - 16 kHz
(±) | reduced highs - on average 7.2% lower than median
(±) | linearity of highs is average (7.2% delta to prev. frequency)
Overall 100 - 16.000 Hz
(+) | overall sound is linear (13% difference to median)
Compared to same class
» 18% of all tested devices in this class were better, 3% similar, 79% worse
» The best had a delta of 6%, average was 18%, worst was 132%
Compared to all devices tested
» 13% of all tested devices were better, 3% similar, 85% worse
» The best had a delta of 4%, average was 23%, worst was 134%
Energy management - Short battery life
Power consumption
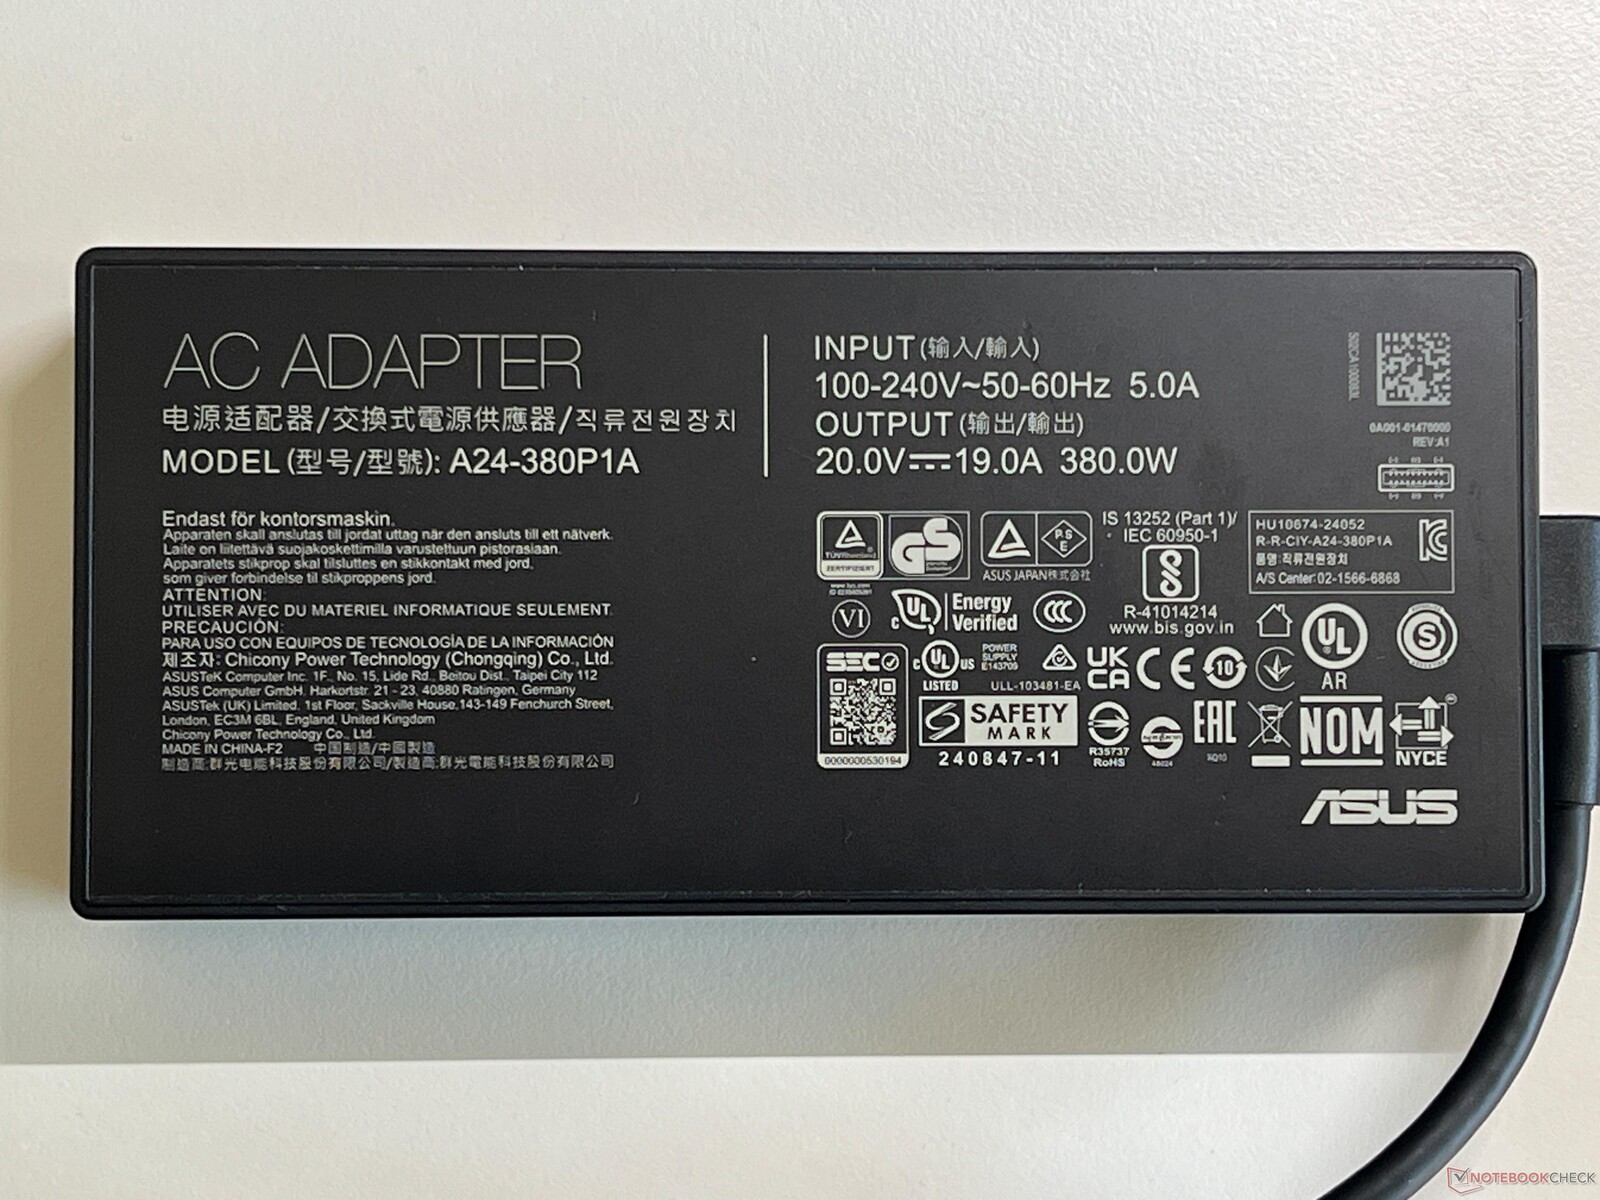
The Strix SCAR 18 isn't a particularly efficient laptop and its bright mini LED panel requires a lot of power right off the bat, which is why its maximum idle consumption was already around 40 watts during our test. Under load, it briefly consumed 430 watts for a second, but then immediately leveled off at 320 watts. The 380-watt power supply unit supplied is therefore sufficient in size. Its standby consumption of 1.9 watts is too high, although the entire lighting was already deactivated.
| Off / Standby | |
| Idle | |
| Load |
|
Key:
min: | |
| Asus Strix Scar 18 G835LX Ultra 9 275HX, GeForce RTX 5090 Laptop, WD PC SN8000S 2TB, Mini-LED, 2560x1600, 18" | Razer Blade 18 2024 RZ09-0509 i9-14900HX, GeForce RTX 4090 Laptop GPU, , Mini-LED, 2560x1600, 18" | Alienware m18 R2 i9-14900HX, GeForce RTX 4090 Laptop GPU, SK Hynix PC811 HFS002TEM9X152N, IPS, 2560x1600, 18" | Acer Predator Helios 18 PH18-72-98MW i9-14900HX, GeForce RTX 4090 Laptop GPU, 2x SK Hynix HFS001TEJ9X115N (RAID 0), Mini-LED, 2560x1600, 18" | MSI Titan 18 HX A14VIG i9-14900HX, GeForce RTX 4090 Laptop GPU, 2x Samsung PM9A1a MZVL22T0HDLB (RAID 0), Mini-LED, 3840x2400, 18" | Schenker Key 17 Pro (M24) i9-14900HX, GeForce RTX 4090 Laptop GPU, Samsung 990 Pro 1 TB, IPS, 3840x2160, 17.3" | Asus ROG Strix Scar 18 G834JYR (2024) i9-14900HX, GeForce RTX 4090 Laptop GPU, Samsung PM9A1a MZVL22T0HDLB, Mini LED, 2560x1600, 18" | Average NVIDIA GeForce RTX 5090 Laptop | Average of class Gaming | |
|---|---|---|---|---|---|---|---|---|---|
| Power Consumption | -22% | 8% | -26% | 0% | 24% | 23% | 11% | 30% | |
| Idle Minimum * (Watt) | 11.4 | 25.4 -123% | 10.6 7% | 31 -172% | 13.2 -16% | 12.16 -7% | 14 -23% | 16.1 ? -41% | 13 ? -14% |
| Idle Average * (Watt) | 39.2 | 37.7 4% | 20.9 47% | 35 11% | 25.4 35% | 15.97 59% | 17 57% | 25.3 ? 35% | 19 ? 52% |
| Idle Maximum * (Watt) | 40.2 | 57.9 -44% | 40 -0% | 43 -7% | 53.5 -33% | 23.71 41% | 24 40% | 31.1 ? 23% | 24.6 ? 39% |
| Load Average * (Watt) | 161.2 | 128.4 20% | 201.1 -25% | 144 11% | 151.4 6% | 113.06 30% | 143 11% | 137.7 ? 15% | 110.7 ? 31% |
| Cyberpunk 2077 ultra * (Watt) | 303 | 274 10% | |||||||
| Cyberpunk 2077 ultra external monitor * (Watt) | 295 | 280 5% | |||||||
| Load Maximum * (Watt) | 430.9 | 297.9 31% | 378.9 12% | 318 26% | 395.2 8% | 301 30% | 302 30% | 339 ? 21% | 259 ? 40% |
| Witcher 3 ultra * (Watt) | 273.1 | 358 | 228 | 336 | 251 |
* ... smaller is better
Power consumption Cyberpunk / stress test
Power consumption with external monitor
Runtimes
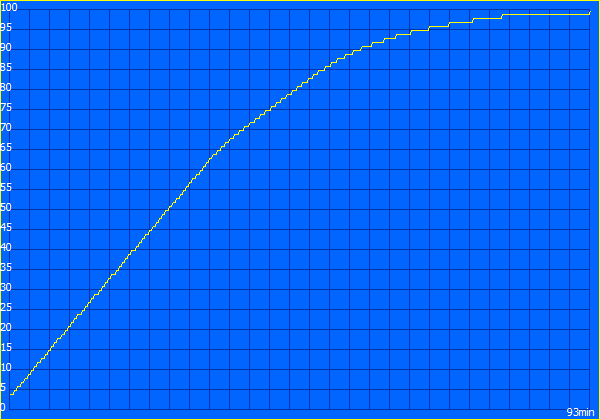
The laptop's 90-Wh battery can't help much with its high consumption rates either. During the WLAN test at 150 cd/m², we measured around 5.5 hours, and no more than three hours at full brightness (60 Hz in each case). At least these results were better than those of many direct competitors—only the predecessor model lasted longer. Gaming ended after just 44 minutes.
| Asus Strix Scar 18 G835LX Ultra 9 275HX, GeForce RTX 5090 Laptop, 90 Wh | Razer Blade 18 2024 RZ09-0509 i9-14900HX, GeForce RTX 4090 Laptop GPU, 91.7 Wh | Alienware m18 R2 i9-14900HX, GeForce RTX 4090 Laptop GPU, 97 Wh | Acer Predator Helios 18 PH18-72-98MW i9-14900HX, GeForce RTX 4090 Laptop GPU, 90 Wh | MSI Titan 18 HX A14VIG i9-14900HX, GeForce RTX 4090 Laptop GPU, 99.9 Wh | Schenker Key 17 Pro (M24) i9-14900HX, GeForce RTX 4090 Laptop GPU, 99 Wh | Asus ROG Strix Scar 18 G834JYR (2024) i9-14900HX, GeForce RTX 4090 Laptop GPU, 90 Wh | Average of class Gaming | |
|---|---|---|---|---|---|---|---|---|
| Battery runtime | -19% | -13% | -25% | -12% | 4% | 26% | 32% | |
| H.264 (h) | 5.8 | 7.5 29% | 8.32 ? 43% | |||||
| WiFi v1.3 (h) | 5.5 | 4.4 -20% | 4.8 -13% | 3.2 -42% | 4.2 -24% | 3.4 -38% | 7.7 40% | 7.11 ? 29% |
| Cyberpunk 2077 ultra 150cd (h) | 0.7 | 1.1 57% | ||||||
| Load (h) | 1.2 | 1 -17% | 1.1 -8% | 1.2 0% | 1.1 -8% | 1.3 8% | 1.502 ? 25% |
Notebookcheck total rating
Asus Strix Scar 18 G835LX
- 03/31/2025 v8
Andreas Osthoff
 Total Sustainability Score:
 Possible alternatives compared
Image | Model / Review | Price | Weight | Height | Display |
|---|---|---|---|---|---|
1. 88%  | Asus Strix Scar 18 G835LX Intel Core Ultra 9 275HX ⎘ NVIDIA GeForce RTX 5090 Laptop ⎘ 64 GB Memory, 2048 GB SSD | Amazon: List Price: 5799€ | 3.3 kg | 32 mm | 18.00" 2560x1600 168 PPI Mini-LED |
2. 90.5% v7 (old)  | Razer Blade 18 2024 RZ09-0509 Intel Core i9-14900HX ⎘ NVIDIA GeForce RTX 4090 Laptop GPU ⎘ 32 GB Memory | Amazon: List Price: 4500 USD | 3.1 kg | 21.9 mm | 18.00" 2560x1600 168 PPI Mini-LED |
3. 89.5% v7 (old)  | Alienware m18 R2 Intel Core i9-14900HX ⎘ NVIDIA GeForce RTX 4090 Laptop GPU ⎘ 32 GB Memory, 2048 GB SSD | Amazon: 1. $3,499.99 Dell Alienware m18 R2 Gaming... 2. $2,799.00 Alienware M18 Gaming Laptop ... 3. $3,699.00 Dell Alienware 18 Area-51 Ga... List Price: 3300 USD | 4 kg | 26.7 mm | 18.00" 2560x1600 168 PPI IPS |
4. 87.1% v7 (old)  | Acer Predator Helios 18 PH18-72-98MW Intel Core i9-14900HX ⎘ NVIDIA GeForce RTX 4090 Laptop GPU ⎘ 32 GB Memory, 2048 GB SSD | Amazon: 1. $23.99 HSSDTECH DC in Power Jack Ch... 2. $84.99 330W Charger for Acer Predat... 3. $899.99 Acer Predator Helios 300 PH3... | 3.3 kg | 29.5 mm | 18.00" 2560x1600 168 PPI Mini-LED |
5. 88.8% v7 (old)  | MSI Titan 18 HX A14VIG Intel Core i9-14900HX ⎘ NVIDIA GeForce RTX 4090 Laptop GPU ⎘ 128 GB Memory, 4096 GB SSD | Amazon: 1. $6,699.99 msi Titan 18 HX AI 18" 240Hz... 2. $5,699.99 msi Titan 18 HX AI 18" 120Hz... 3. $4,974.99 Titan 18 HX Dragon Edition N... List Price: 5000 USD | 3.6 kg | 32.1 mm | 18.00" 3840x2400 252 PPI Mini-LED |
6. 85.1%  | Schenker Key 17 Pro (M24) Intel Core i9-14900HX ⎘ NVIDIA GeForce RTX 4090 Laptop GPU ⎘ 32 GB Memory, 1024 GB SSD | Amazon: List Price: 4273€ | 3.4 kg | 24.9 mm | 17.30" 3840x2160 255 PPI IPS |
Transparency
The selection of devices to be reviewed is made by our editorial team. The test sample was provided to the author as a loan by the manufacturer or retailer for the purpose of this review. The lender had no influence on this review, nor did the manufacturer receive a copy of this review before publication. There was no obligation to publish this review. As an independent media company, Notebookcheck is not subjected to the authority of manufacturers, retailers or publishers.
This is how Notebookcheck is testing
Every year, Notebookcheck independently reviews hundreds of laptops and smartphones using standardized procedures to ensure that all results are comparable. We have continuously developed our test methods for around 20 years and set industry standards in the process. In our test labs, high-quality measuring equipment is utilized by experienced technicians and editors. These tests involve a multi-stage validation process. Our complex rating system is based on hundreds of well-founded measurements and benchmarks, which maintains objectivity. Further information on our test methods can be found here.

