Acer Predator Helios 18 2024 laptop review: New hardware for the 18-inch gamer

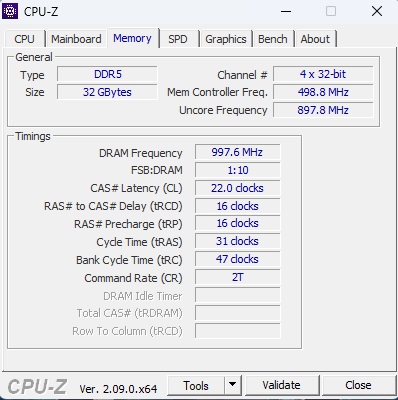
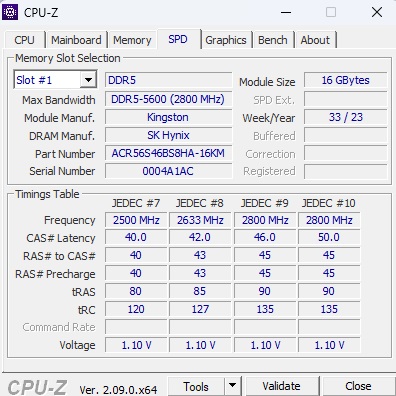
In 2023, Acer started selling 18-inch laptops. While our first test device was fitted with a Core i9-13900HX and a GeForce RTX 4080, the successor model's test configuration boasts a Core i9-14900HX and a GeForce RTX 4090. One thing that's stayed the same is the laptop's powerful Mini-LED panel that impresses almost entirely without compromise (more on that shortly). Acer has installed 2x 16 GB DDR5-5600 RAM and two RAID-0 format NVMe-SSDs (M.2 2280) with 1 TB of storage each. At the time of testing, the laptop is not yet available in the United States, so we can't yet give any information on its MRSP.
Competitors to the Predator Helios 18 include 18-inch gamers such as the MSI Titan 18 HX A14, the Asus ROG Strix Scar 18 G834 and the Alienware m18 R1—all of which are listed in the tables as comparison devices.
Possible competitors compared
Rating | Date | Model | Weight | Height | Size | Resolution | Price |
|---|---|---|---|---|---|---|---|
| 87.1 % v7 (old) | 03 / 2024 | Acer Predator Helios 18 PH18-72-98MW i9-14900HX, GeForce RTX 4090 Laptop GPU | 3.3 kg | 29.5 mm | 18.00" | 2560x1600 | |
| 88.8 % v7 (old) | 01 / 2024 | MSI Titan 18 HX A14VIG i9-14900HX, GeForce RTX 4090 Laptop GPU | 3.6 kg | 32.1 mm | 18.00" | 3840x2400 | |
| 88.3 % v7 (old) | 02 / 2024 | Asus ROG Strix Scar 18 G834JYR (2024) i9-14900HX, GeForce RTX 4090 Laptop GPU | 3.1 kg | 30.8 mm | 18.00" | 2560x1600 | |
| 88.3 % v7 (old) | 10 / 2023 | Acer Predator Helios 18 N23Q2 i9-13900HX, GeForce RTX 4080 Laptop GPU | 3.2 kg | 29.15 mm | 18.00" | 2560x1600 | |
| 89.2 % v7 (old) | 11 / 2023 | Alienware m18 R1 AMD R9 7945HX, Radeon RX 7900M | 3.9 kg | 26.7 mm | 18.00" | 1920x1200 |
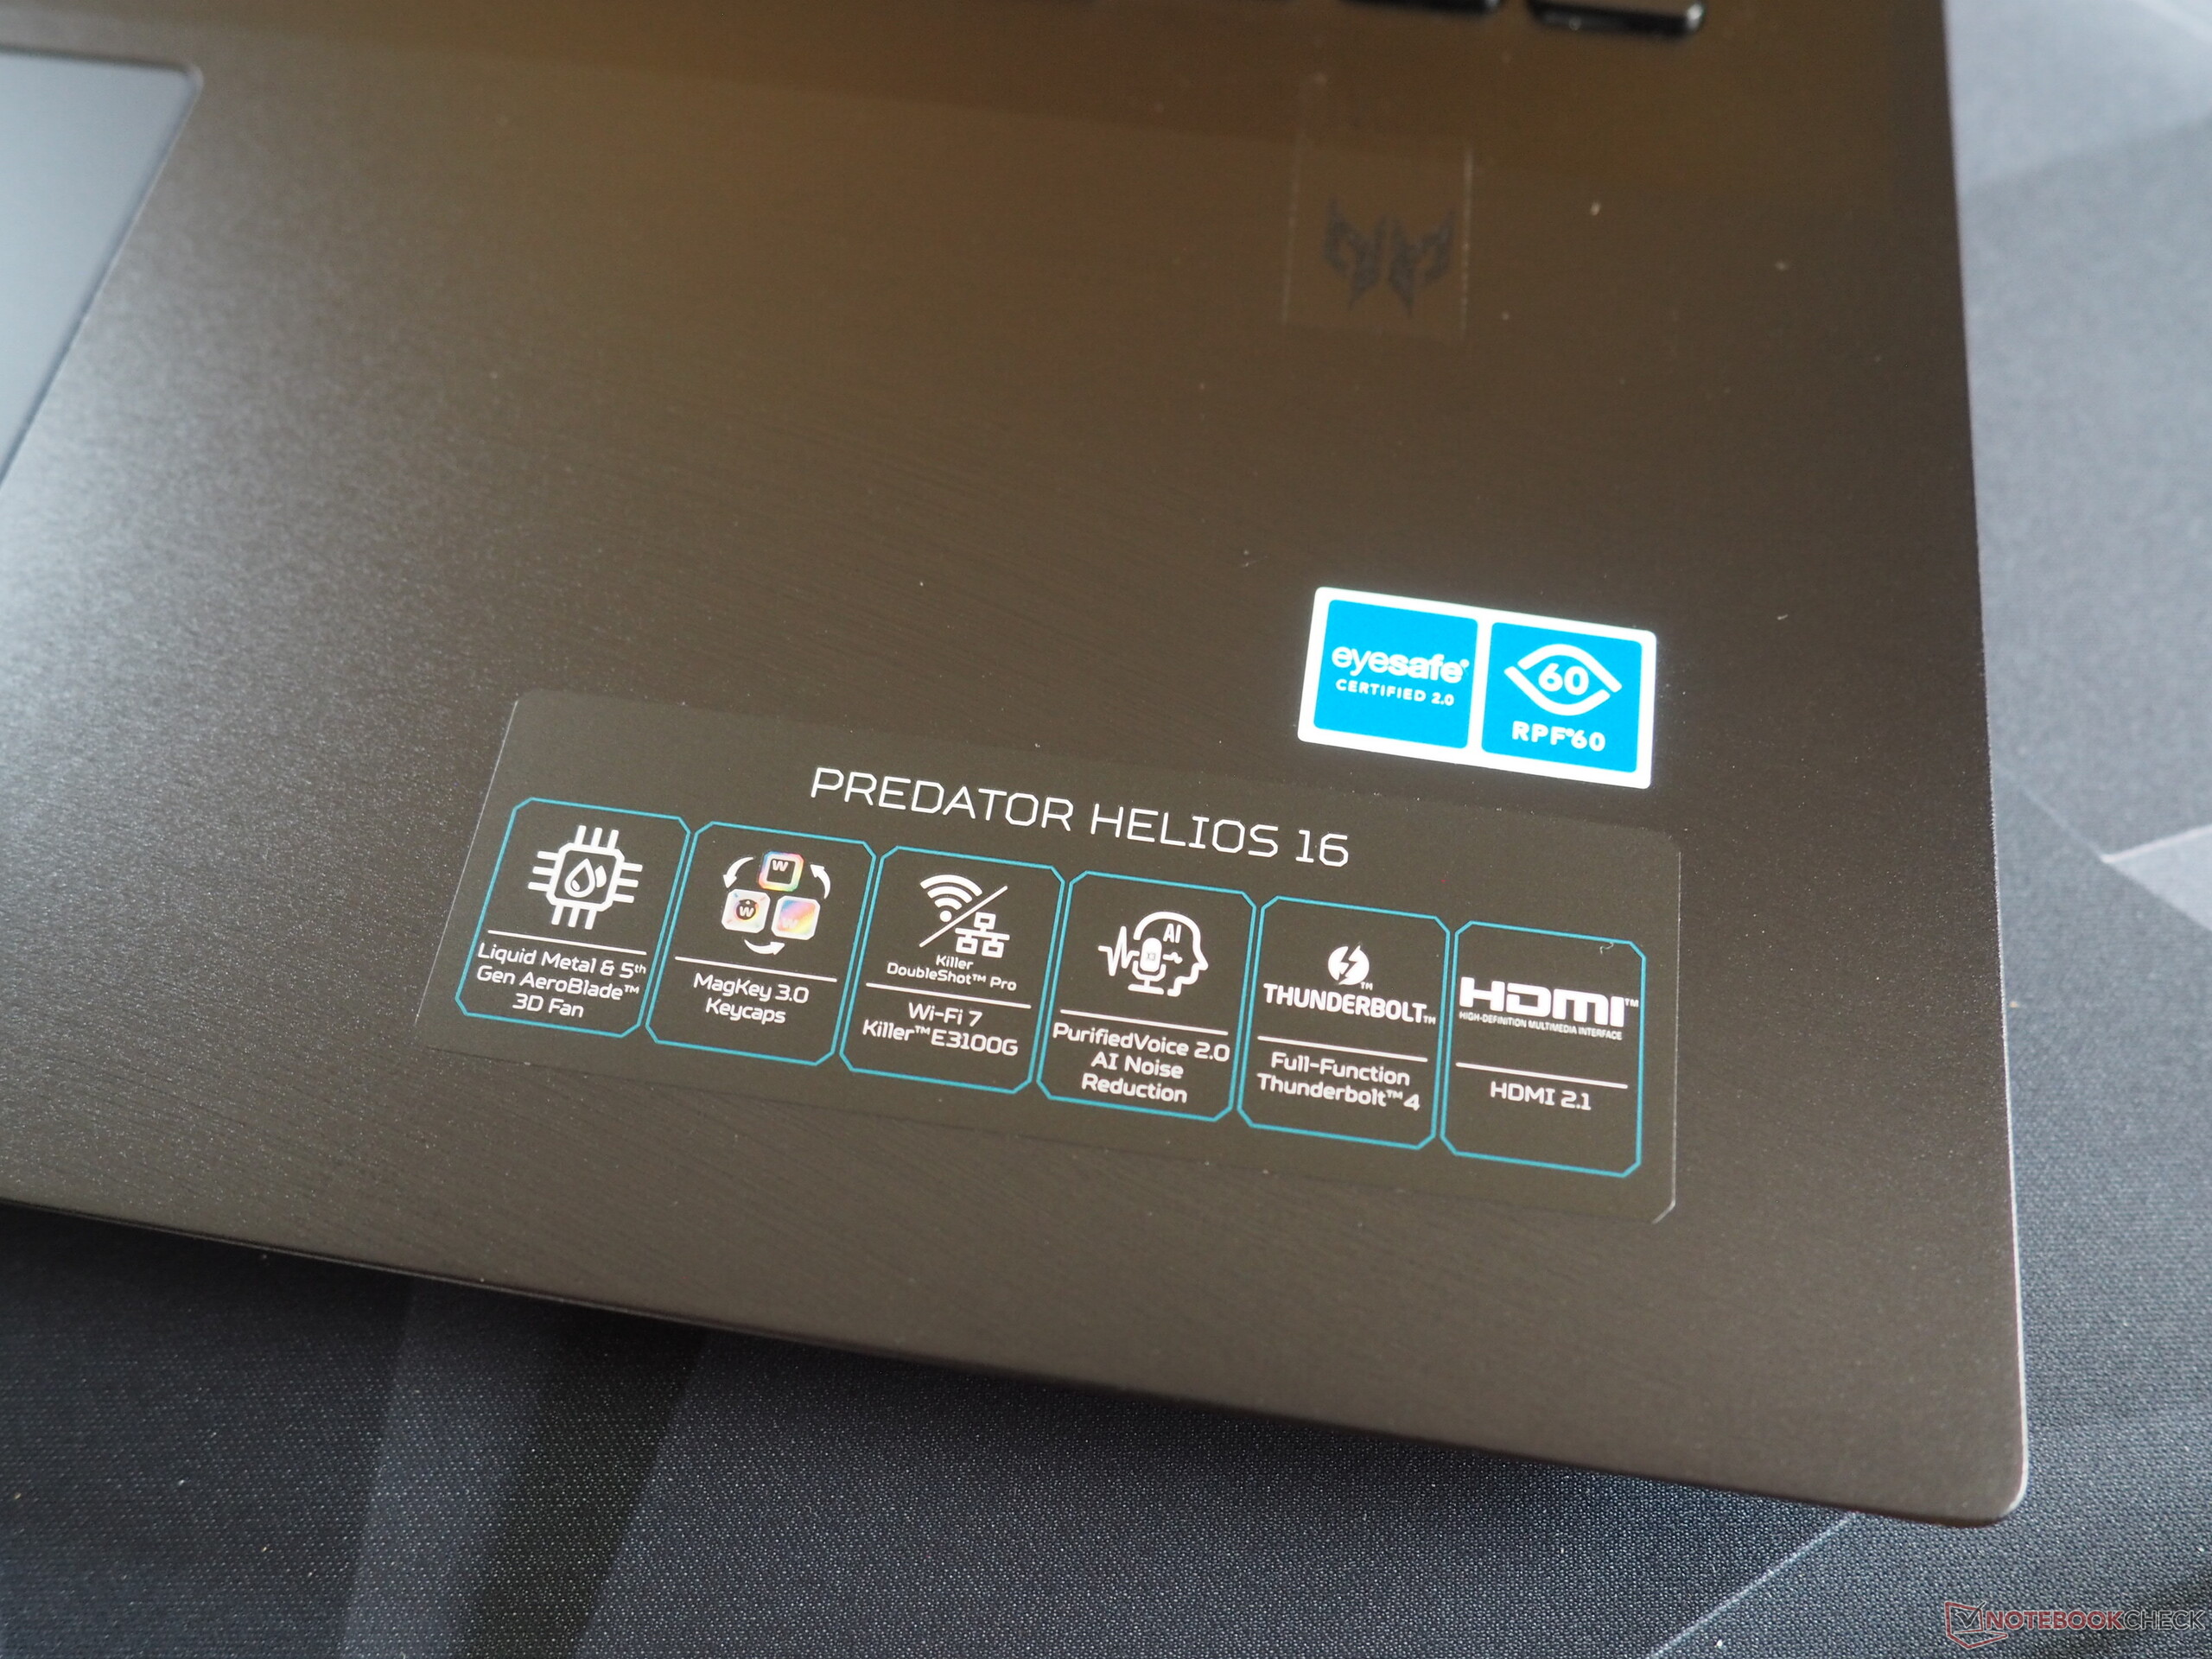
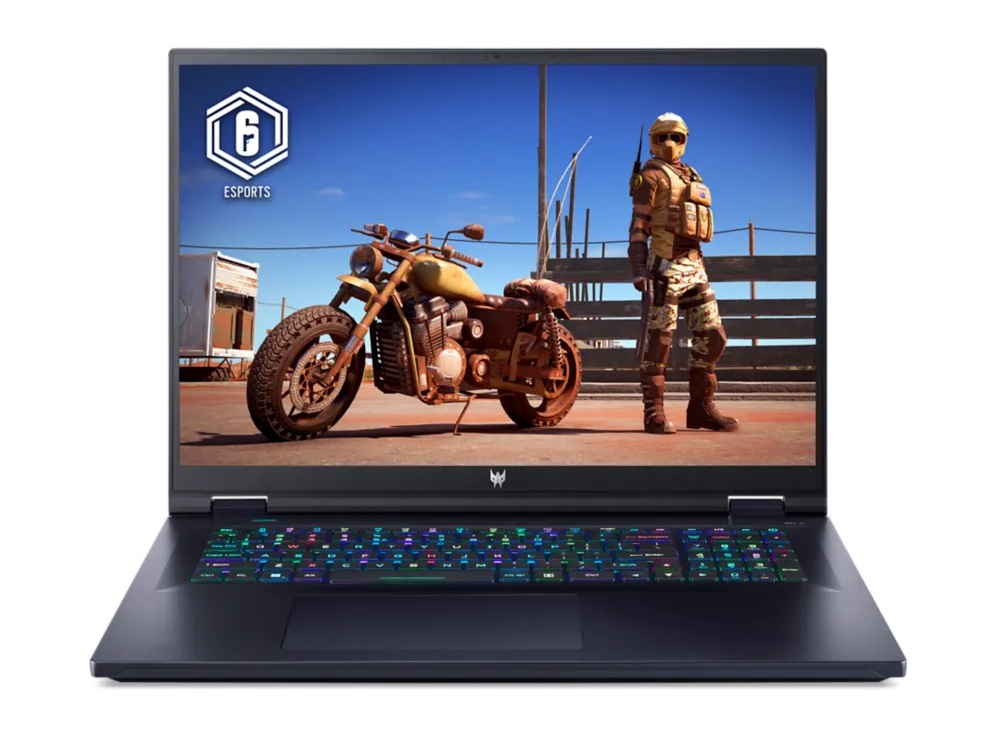
Case
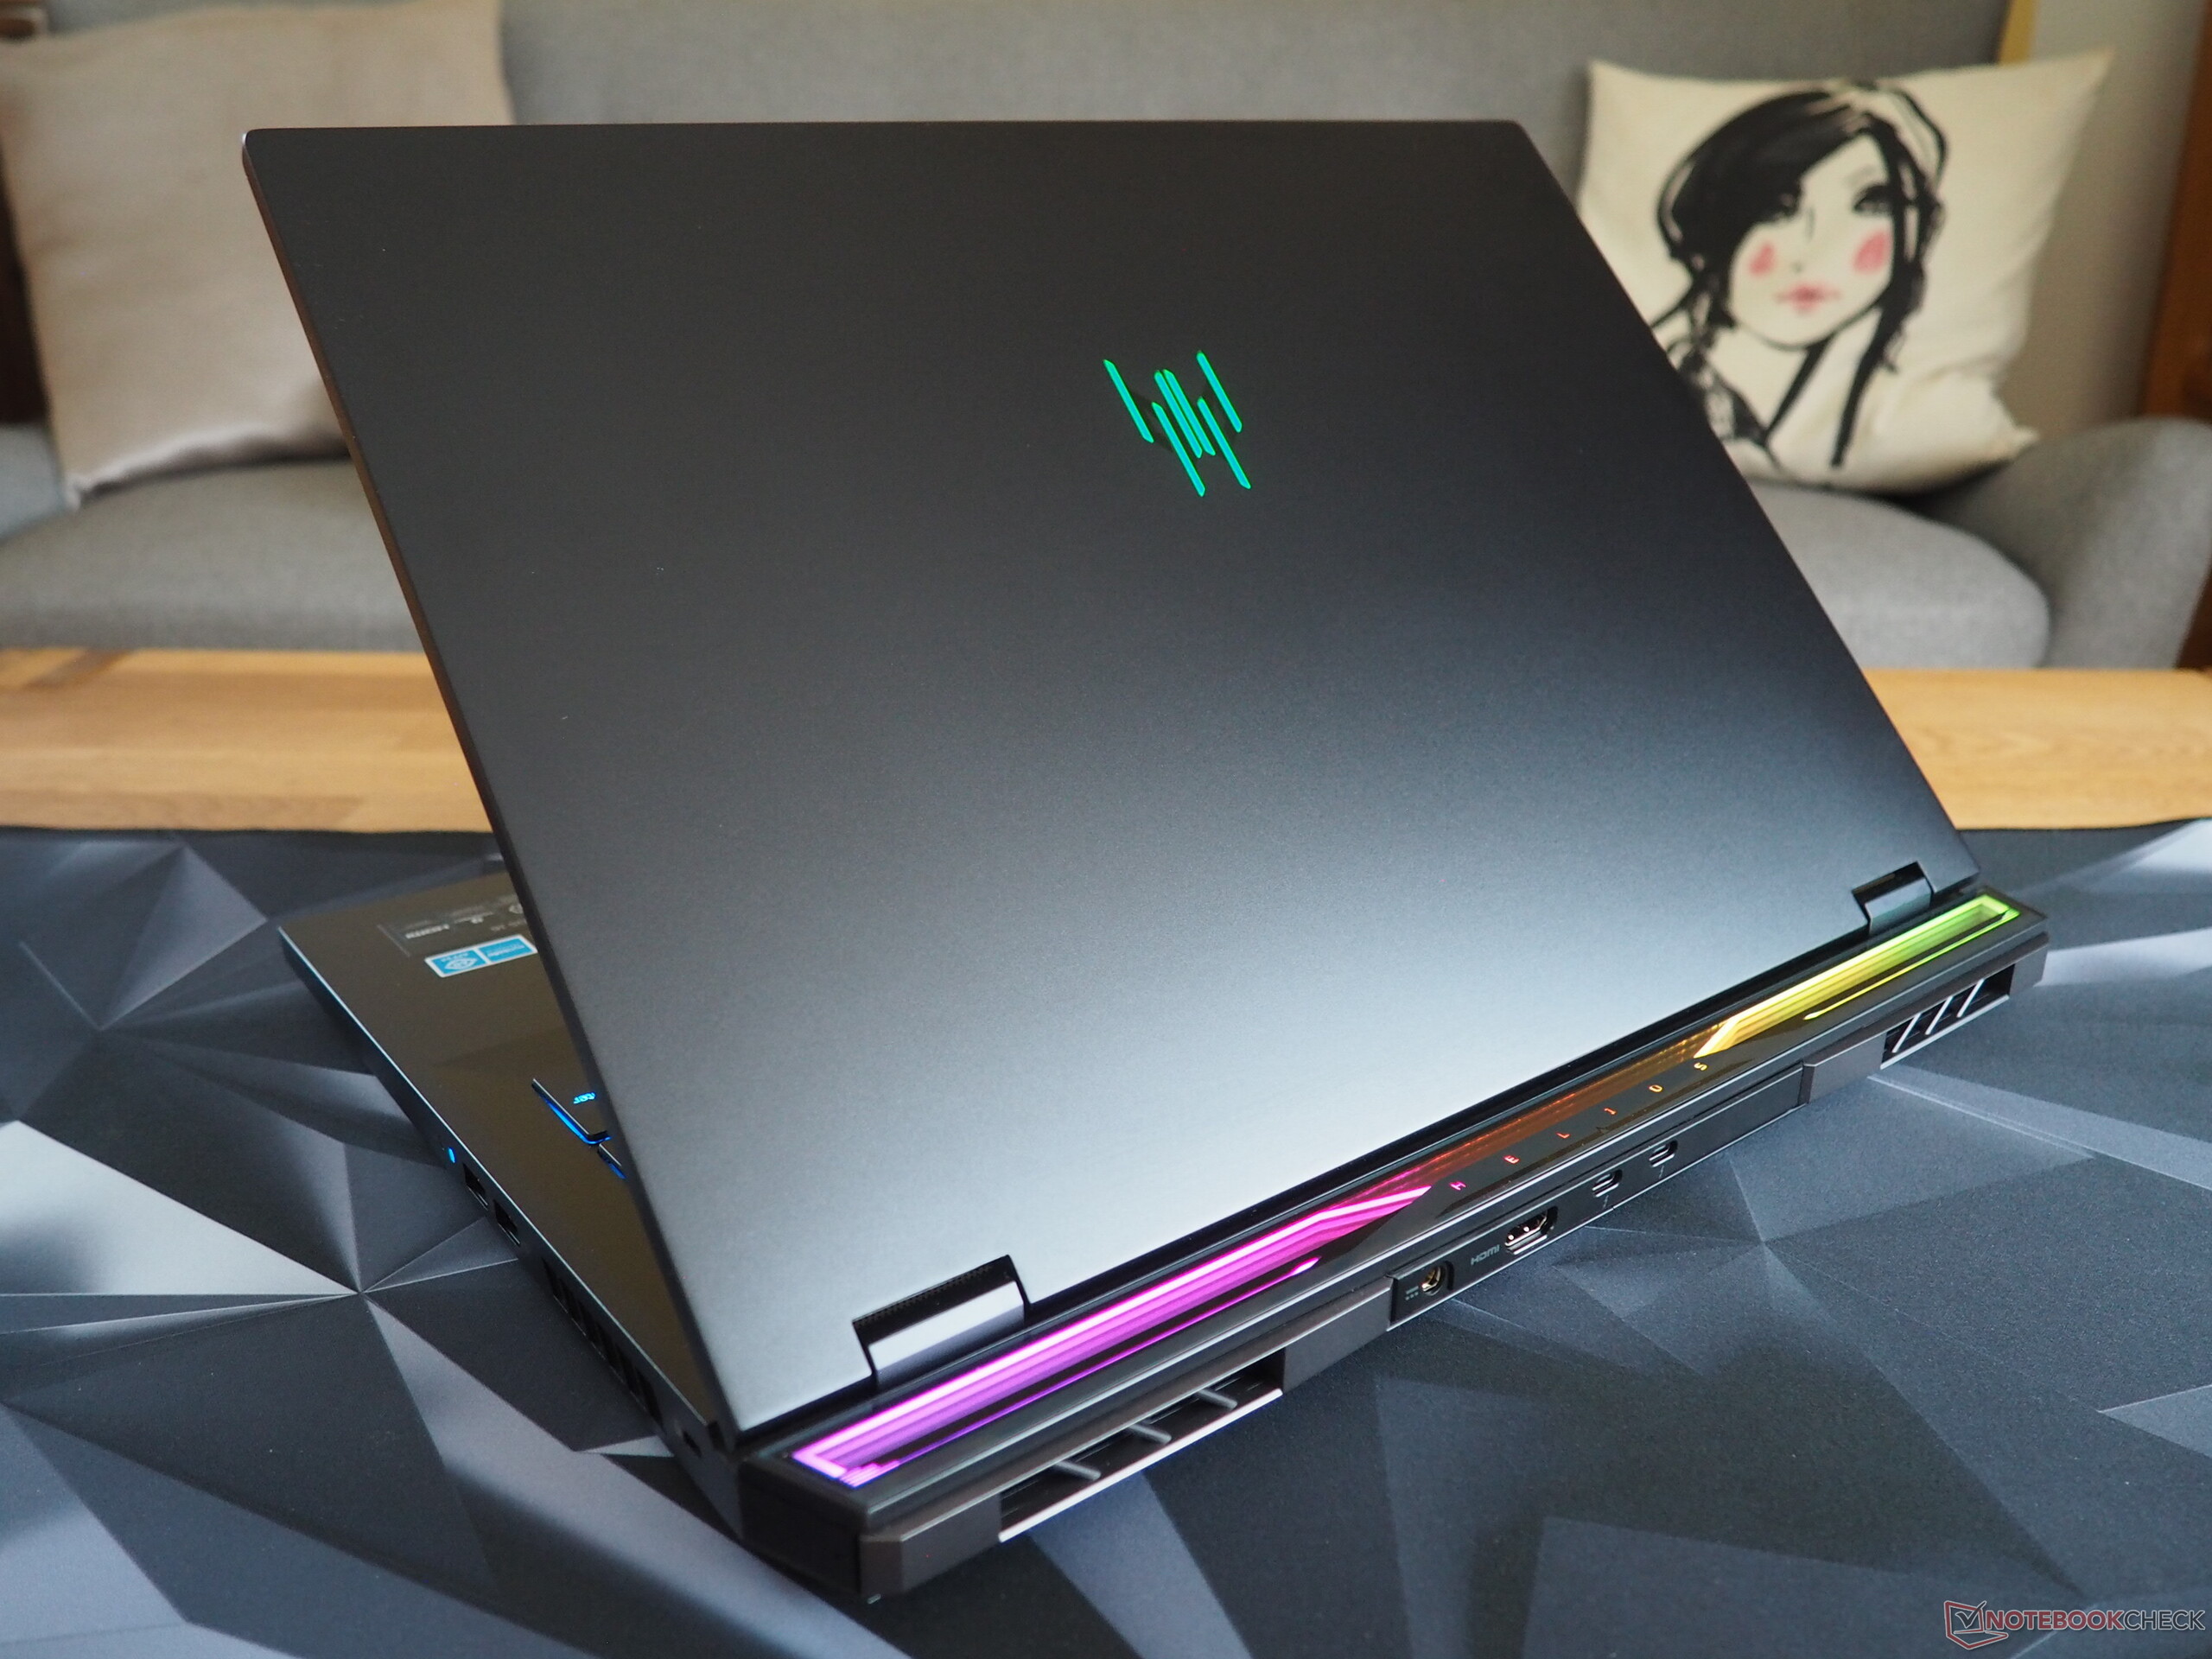
When it comes to the device's case, Acer has stayed true to its predecessor—although upon taking a closer look, you begin to notice a few changes. The manufacturer has swapped out the keyboard model and has redesigned the stylish light strip along the rear. The laptop continues to feel high-quality, as its lid and the top of its base unit are both made from metal. We also have nothing negative to report about the device's build. If anything, Acer could do with improving the laptop's hinges, as they can be a bit wobbly at times. Although the lid could be more stable and certain parts of the keyboard can be pushed in when you press hard enough, we would still rate its case as being stable. Its design is neither dull nor overly playful.

With regards to its weight, the Predator Helios 18 is about average. Its 3.3 kg is more than the Asus ROG Strix Scar 18 but less than the MSI Titan 18 and Alienware m18.
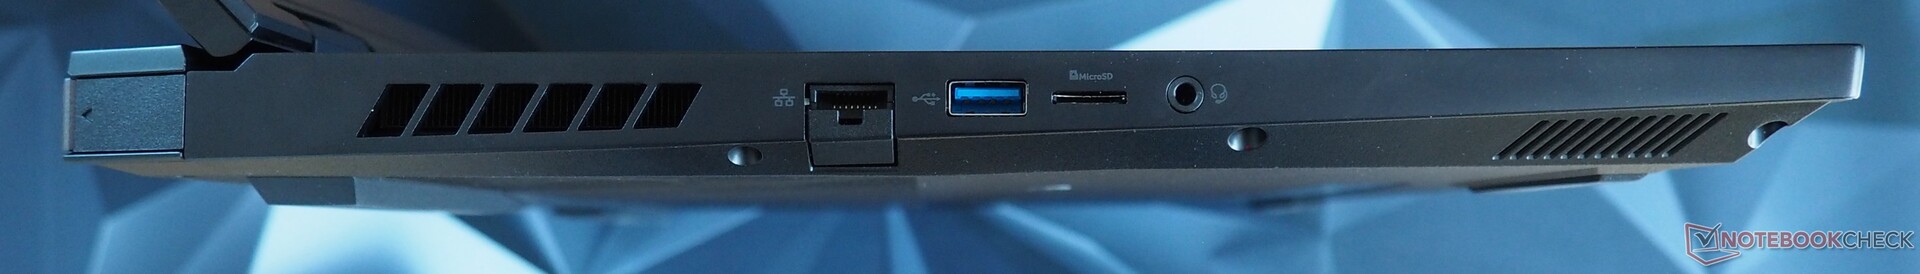
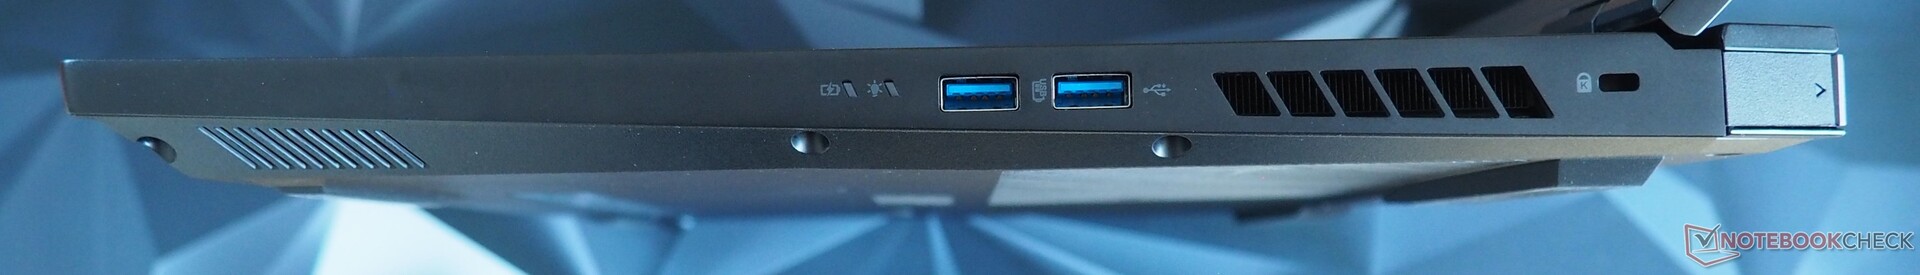
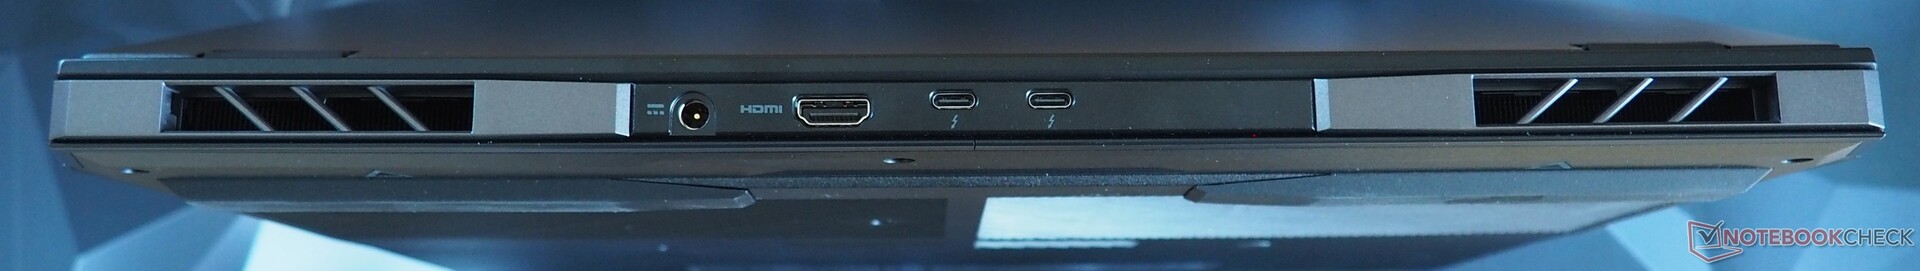
Connectivity
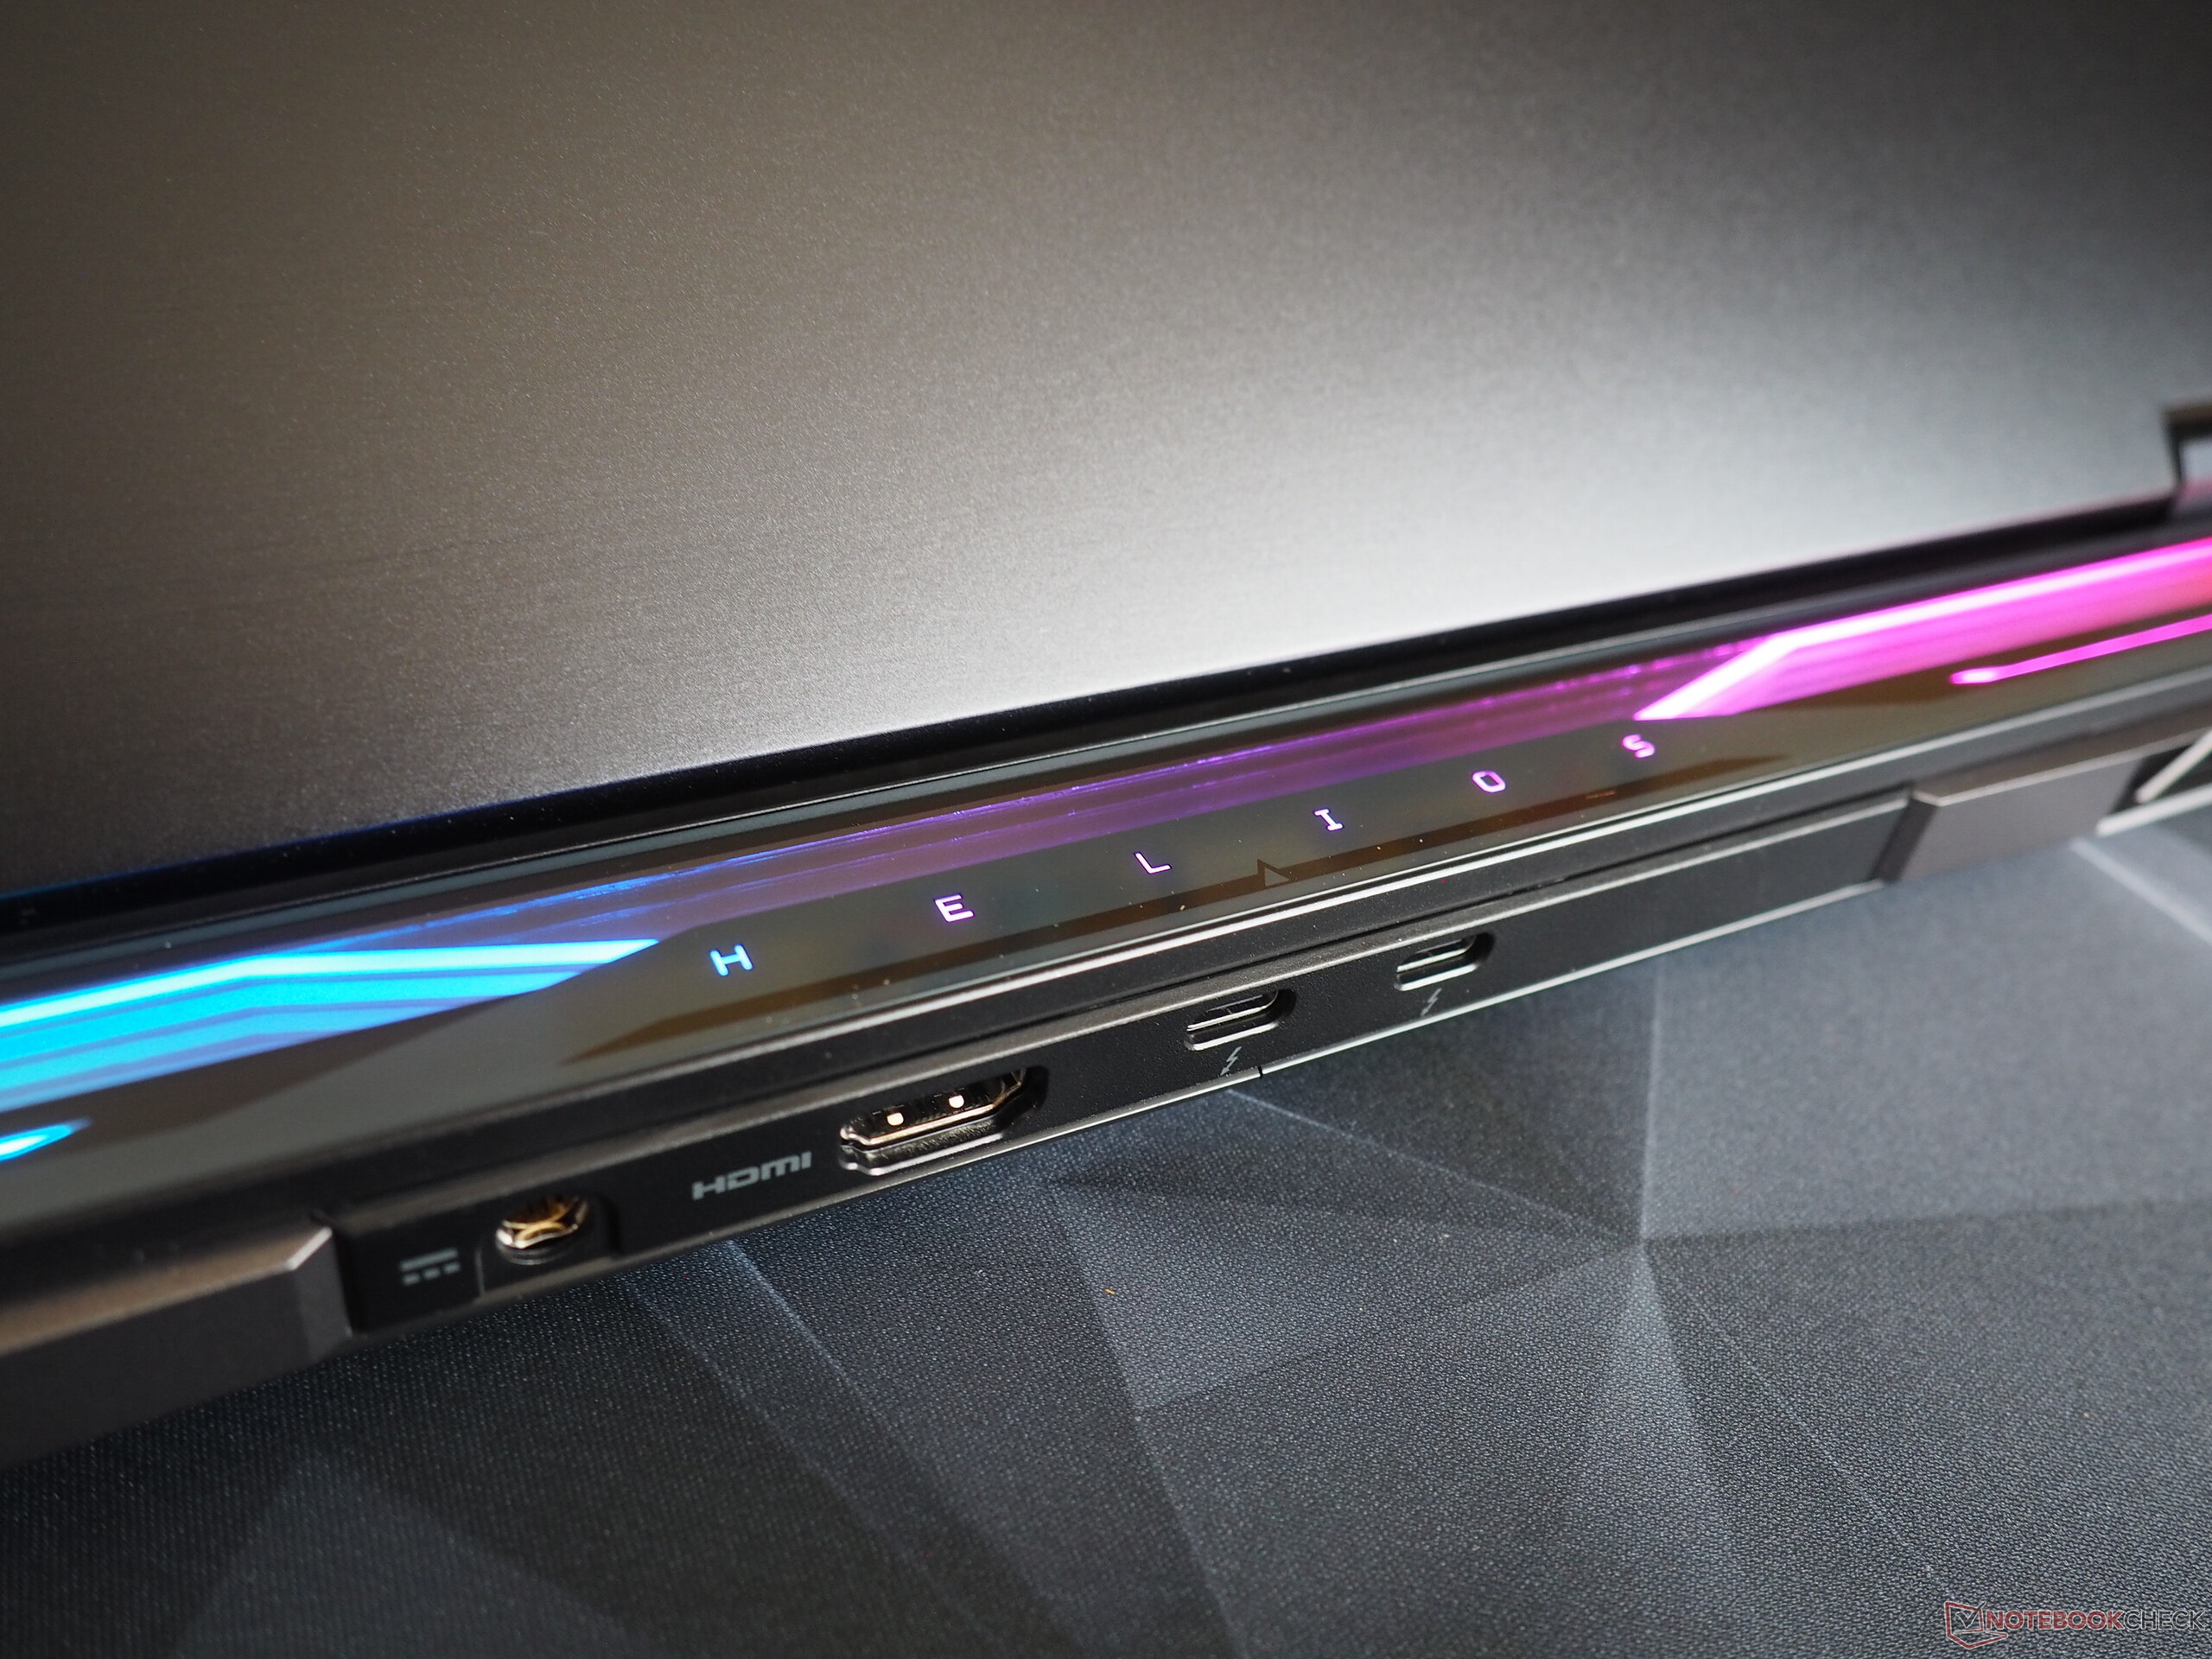
The device's connectivity options are modern. While the back houses an HDMI 2.1 output and two Thunderbolt 4 ports (incl. DisplayPort & Power Delivery), the right side features two USB 3.2 Gen-2 ports (Type A) and a slot for a Kensington lock. This package is completed by an RJ45 port, a USB 3.0 port (Type A), a microSD card reader and an audio jack on the left side.
SD card reader
The installed card reader achieves mediocre speeds. Only the Alienware m18, which was able to make use of our reference card to a certain extent, impressed us in this respect.
| SD Card Reader | |
| average JPG Copy Test (av. of 3 runs) | |
| Alienware m18 R1 AMD (Toshiba Exceria Pro SDXC 64 GB UHS-II) | |
| Average of class Gaming (20.9 - 210, n=54, last 2 years) | |
| Acer Predator Helios 18 PH18-72-98MW (AV PRO microSD 128 GB V60) | |
| MSI Titan 18 HX A14VIG (Toshiba Exceria Pro SDXC 64 GB UHS-II) | |
| Acer Predator Helios 18 N23Q2 | |
| maximum AS SSD Seq Read Test (1GB) | |
| Alienware m18 R1 AMD (Toshiba Exceria Pro SDXC 64 GB UHS-II) | |
| Average of class Gaming (25.5 - 261, n=51, last 2 years) | |
| MSI Titan 18 HX A14VIG (Toshiba Exceria Pro SDXC 64 GB UHS-II) | |
| Acer Predator Helios 18 PH18-72-98MW (AV PRO microSD 128 GB V60) | |
| Acer Predator Helios 18 N23Q2 | |
Communication
The new Helios 18 has a cutting-edge Wi-Fi 7 chip, which we can only test to a limited extent due to a lack of suitable hardware. In our standard tests, its Wi-Fi module delivered solid performance (sending) all the way through to very good performance (receiving).
Webcam
Thanks to its Full HD resolution, the installed webcam is somewhat sharper than most laptops—but as is often the case, there is still room for improvement when it comes to color accuracy.

")
")
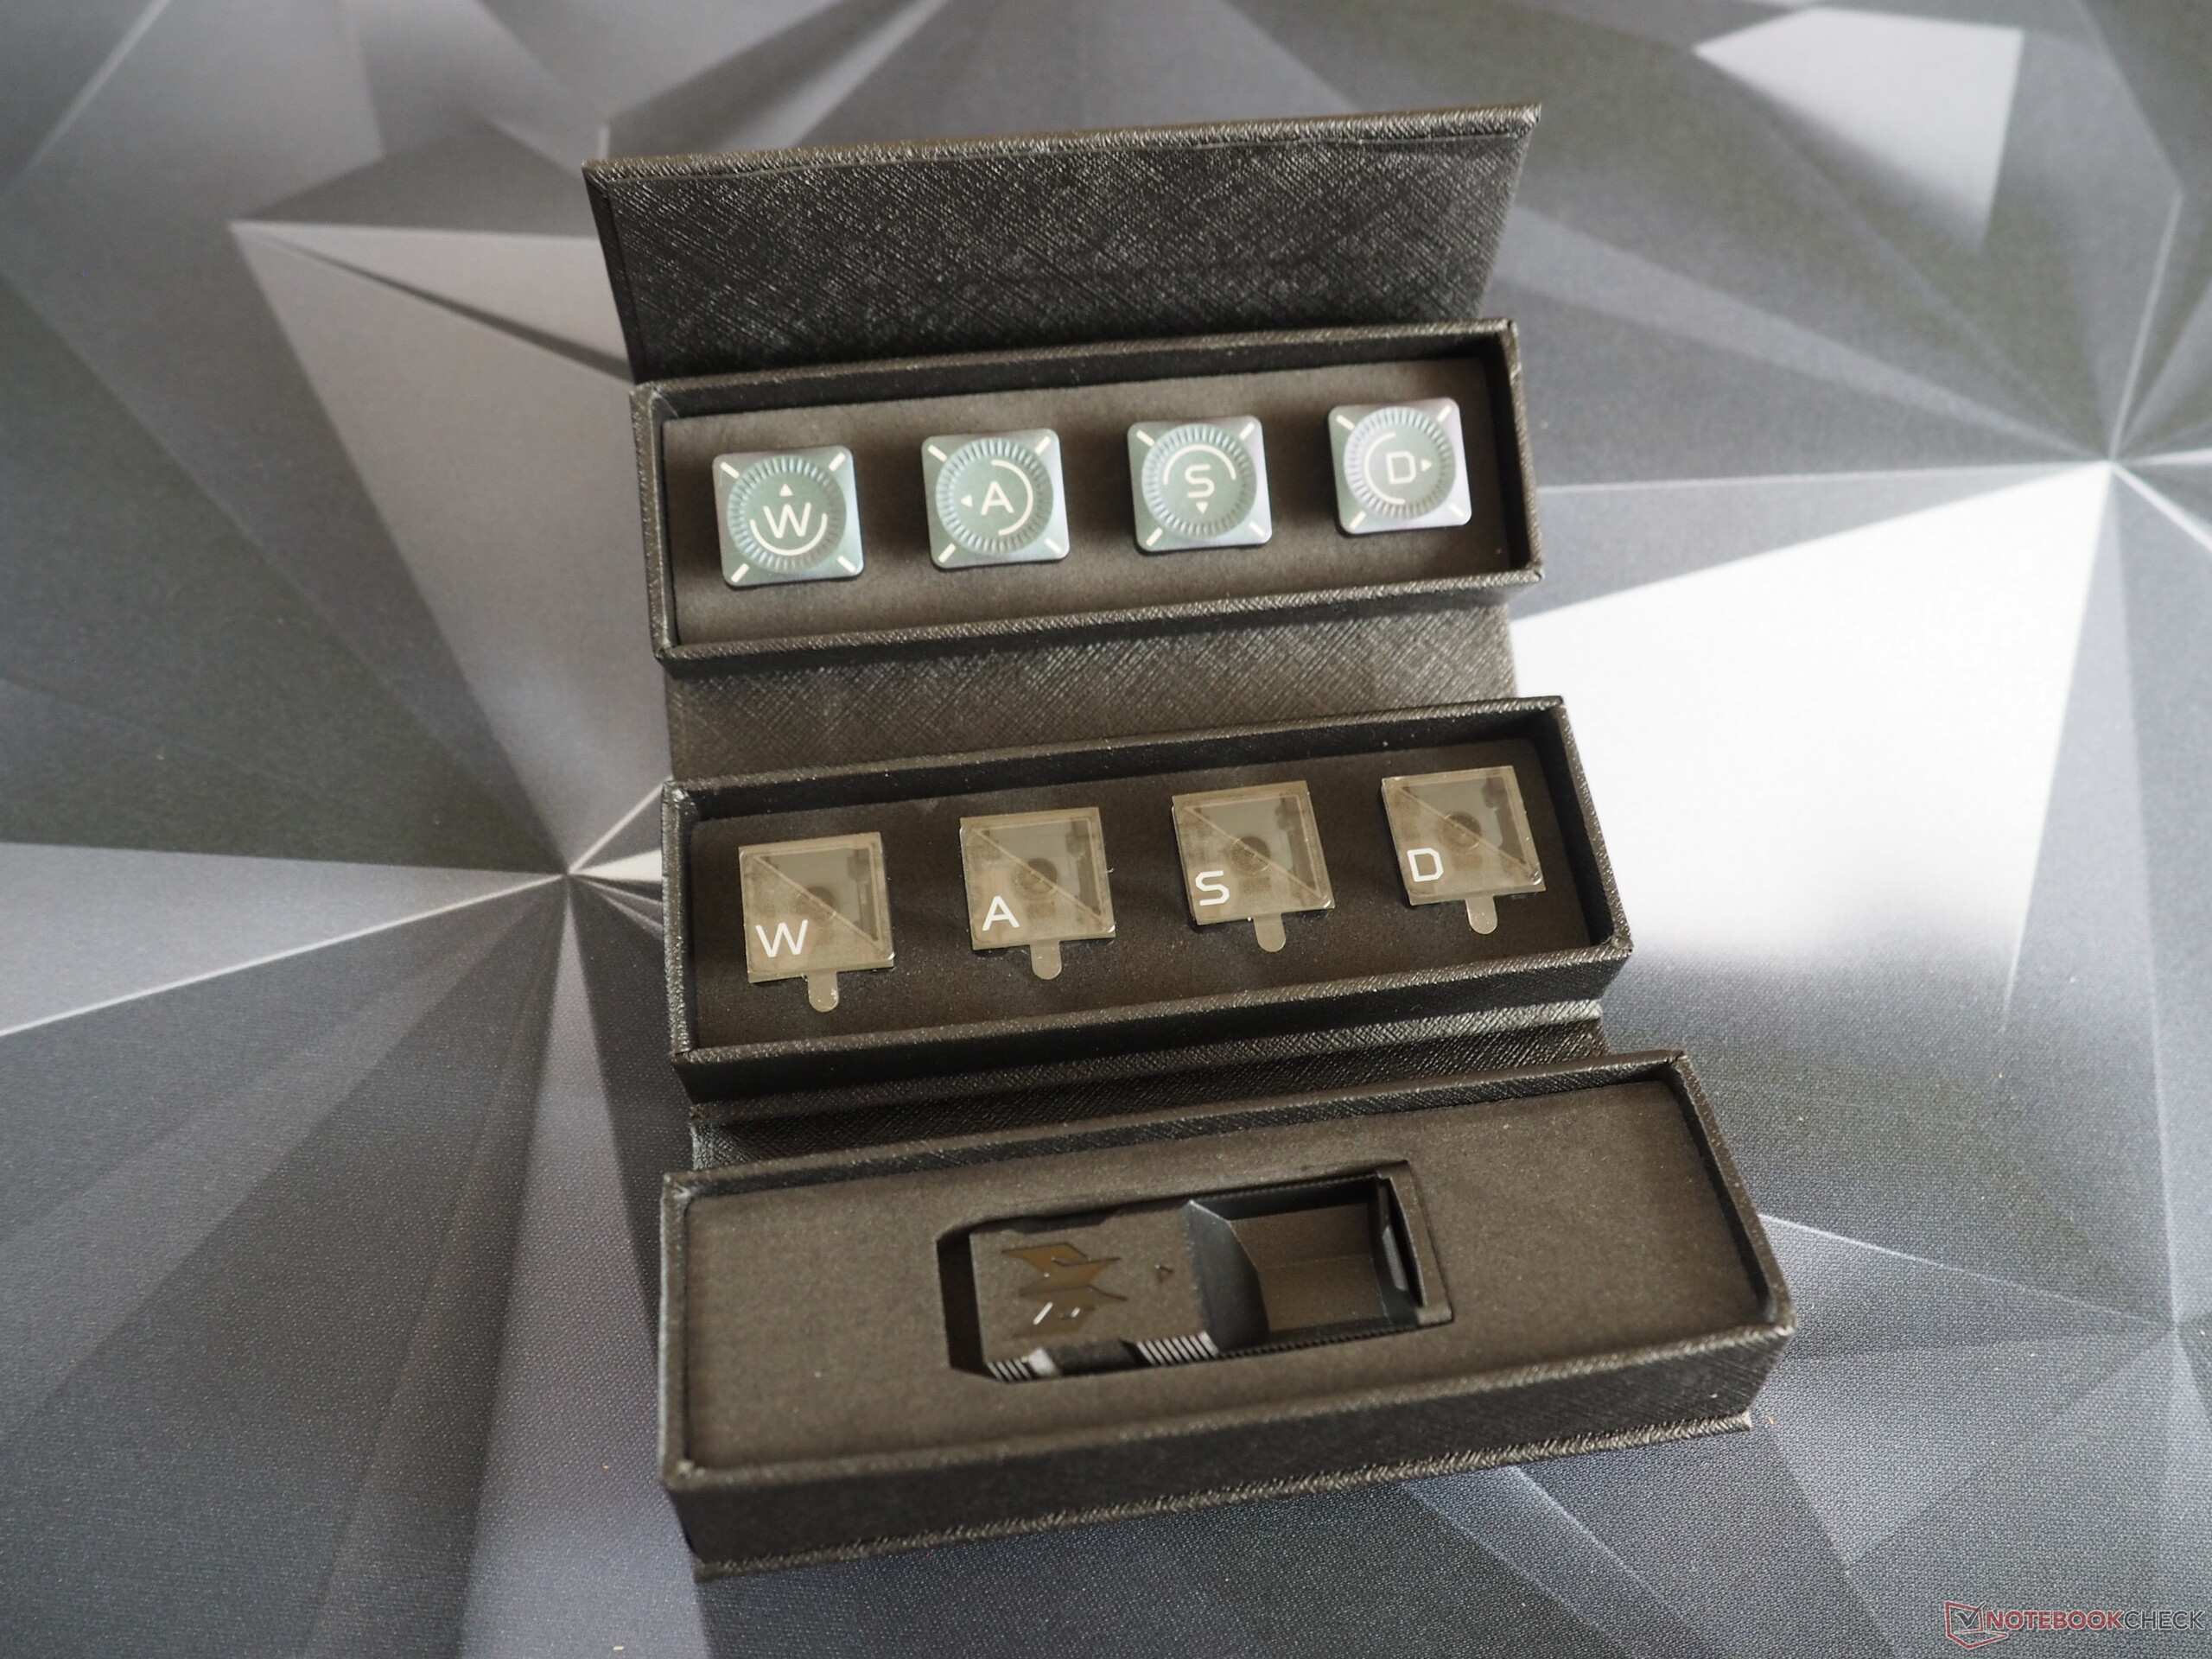
Accessories
The Predator Helios 18 boasts an interesting special feature: Its box not only contains replaceable fan grilles for the back of the device, but you also receive two sets of different WASD keys and some key levers. As expected, the supplied 330-watt power supply unit is quite bulky.
Maintenance
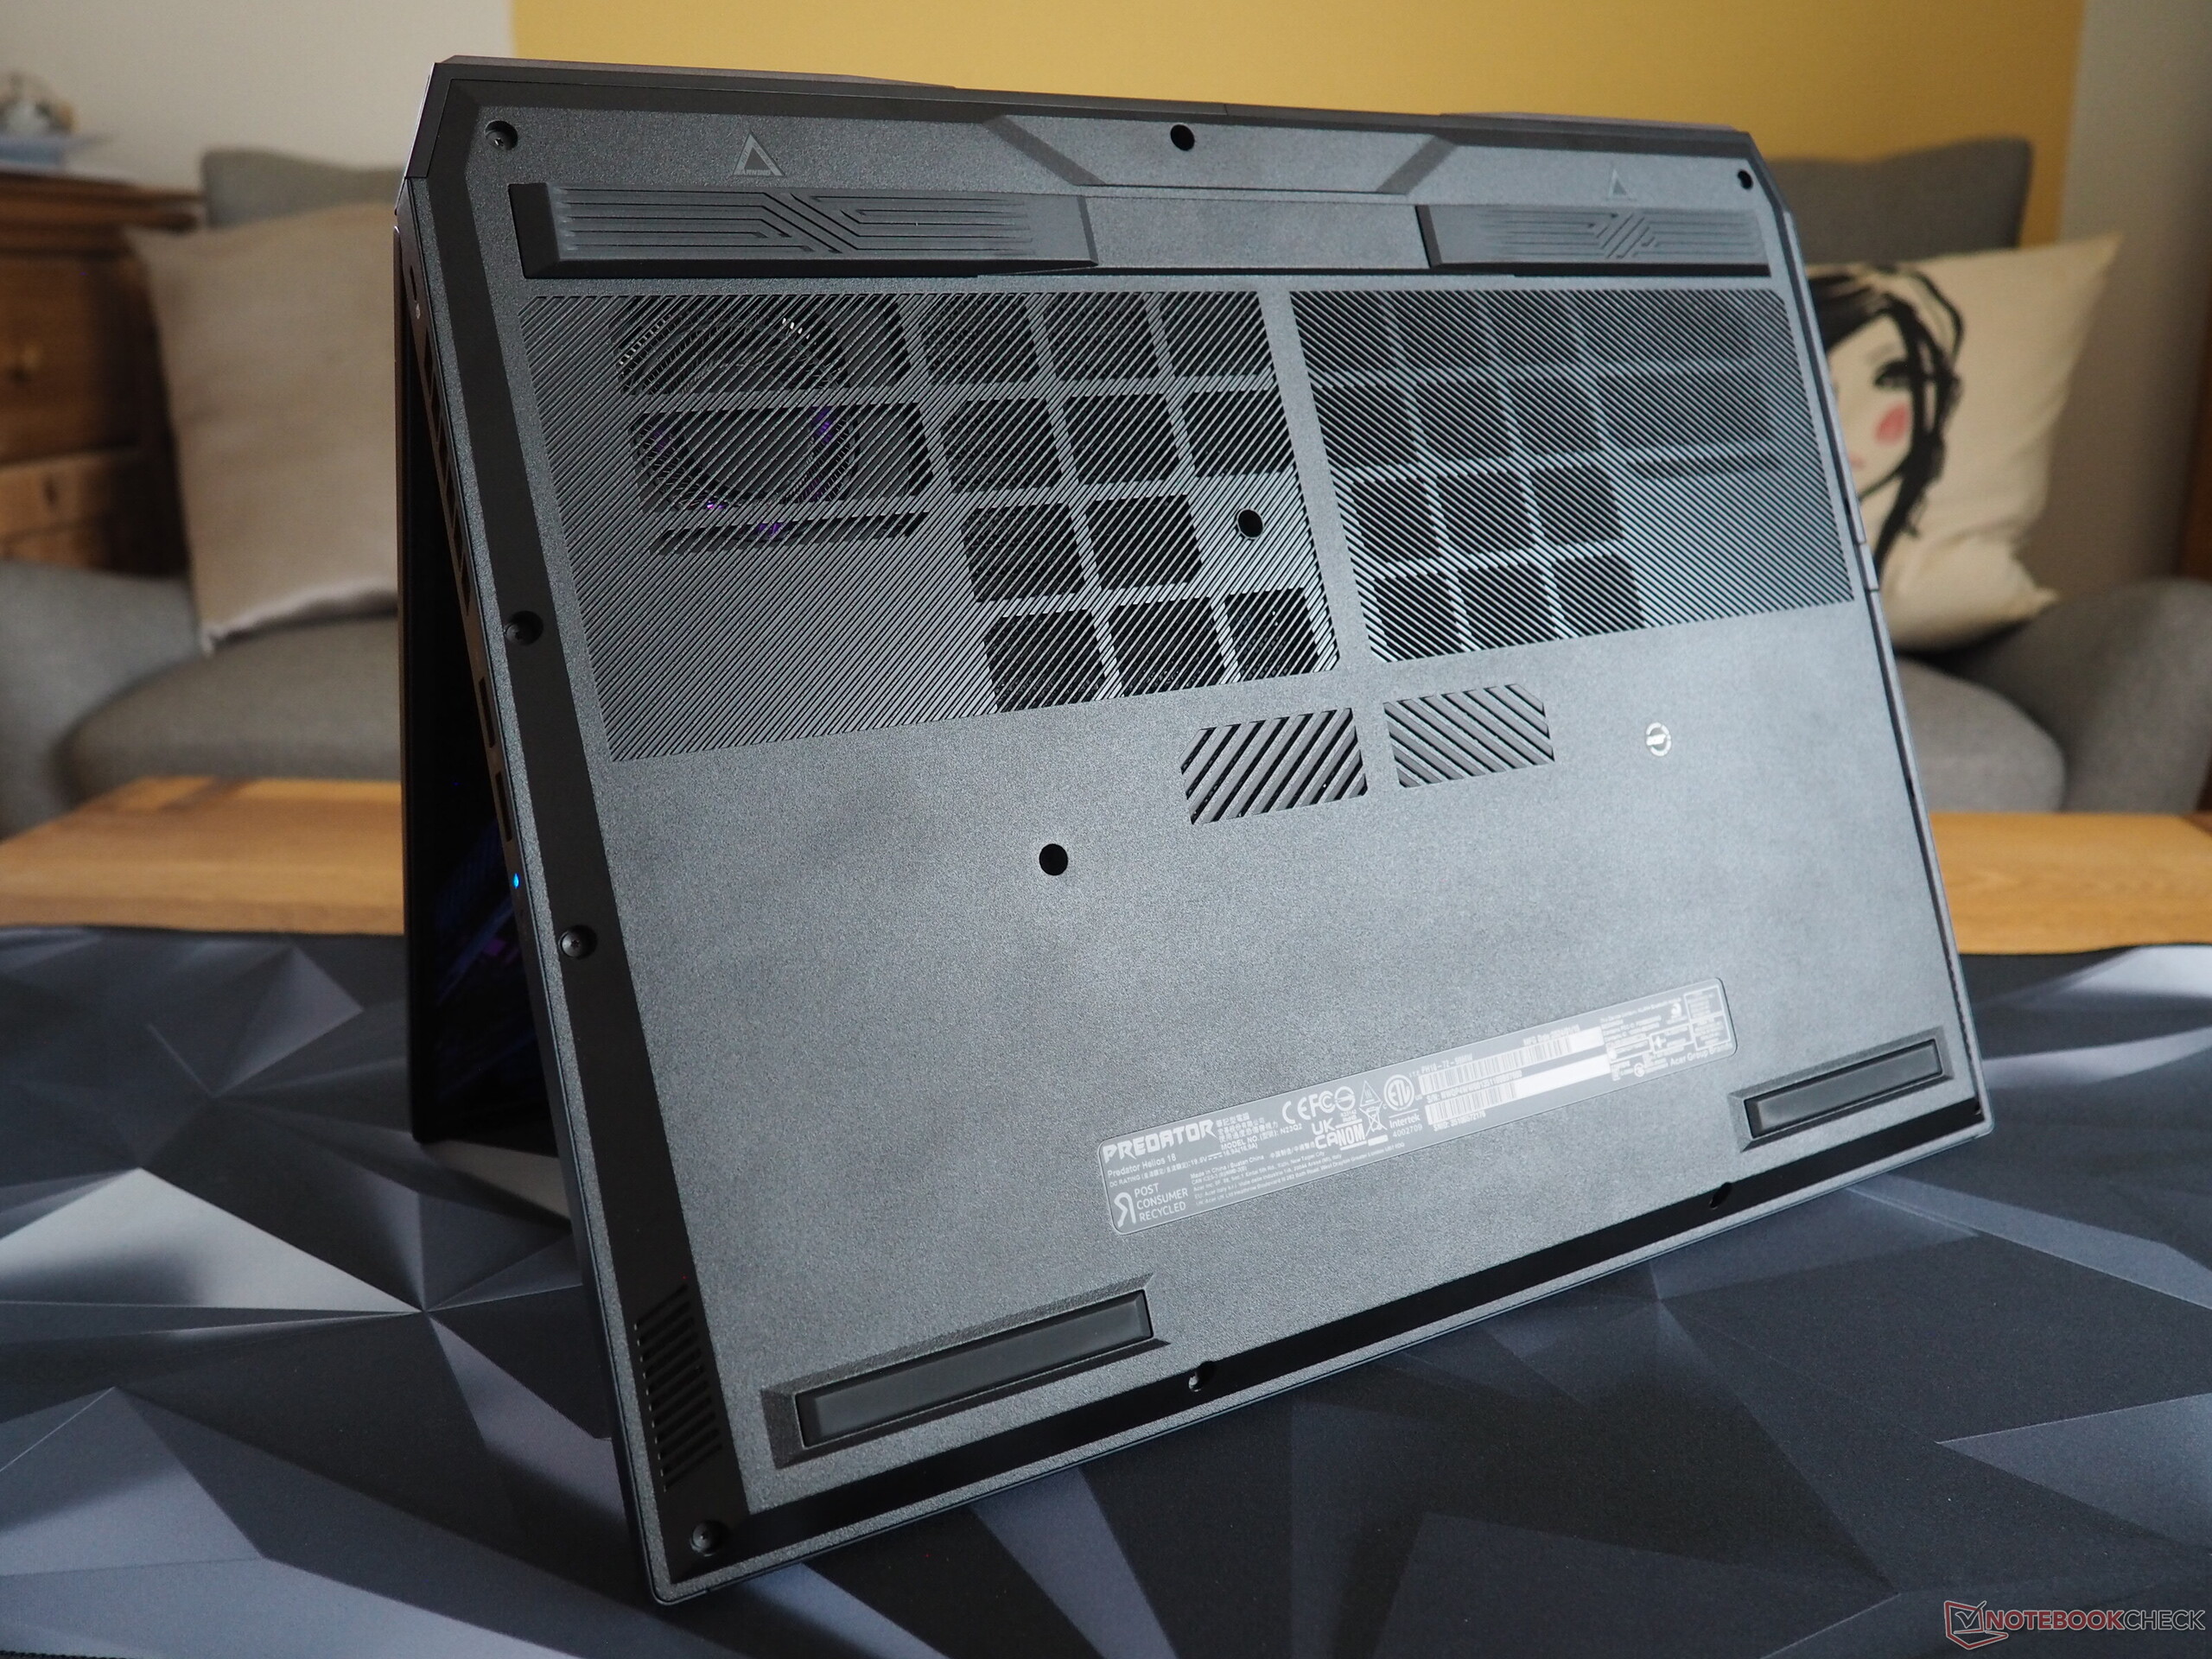
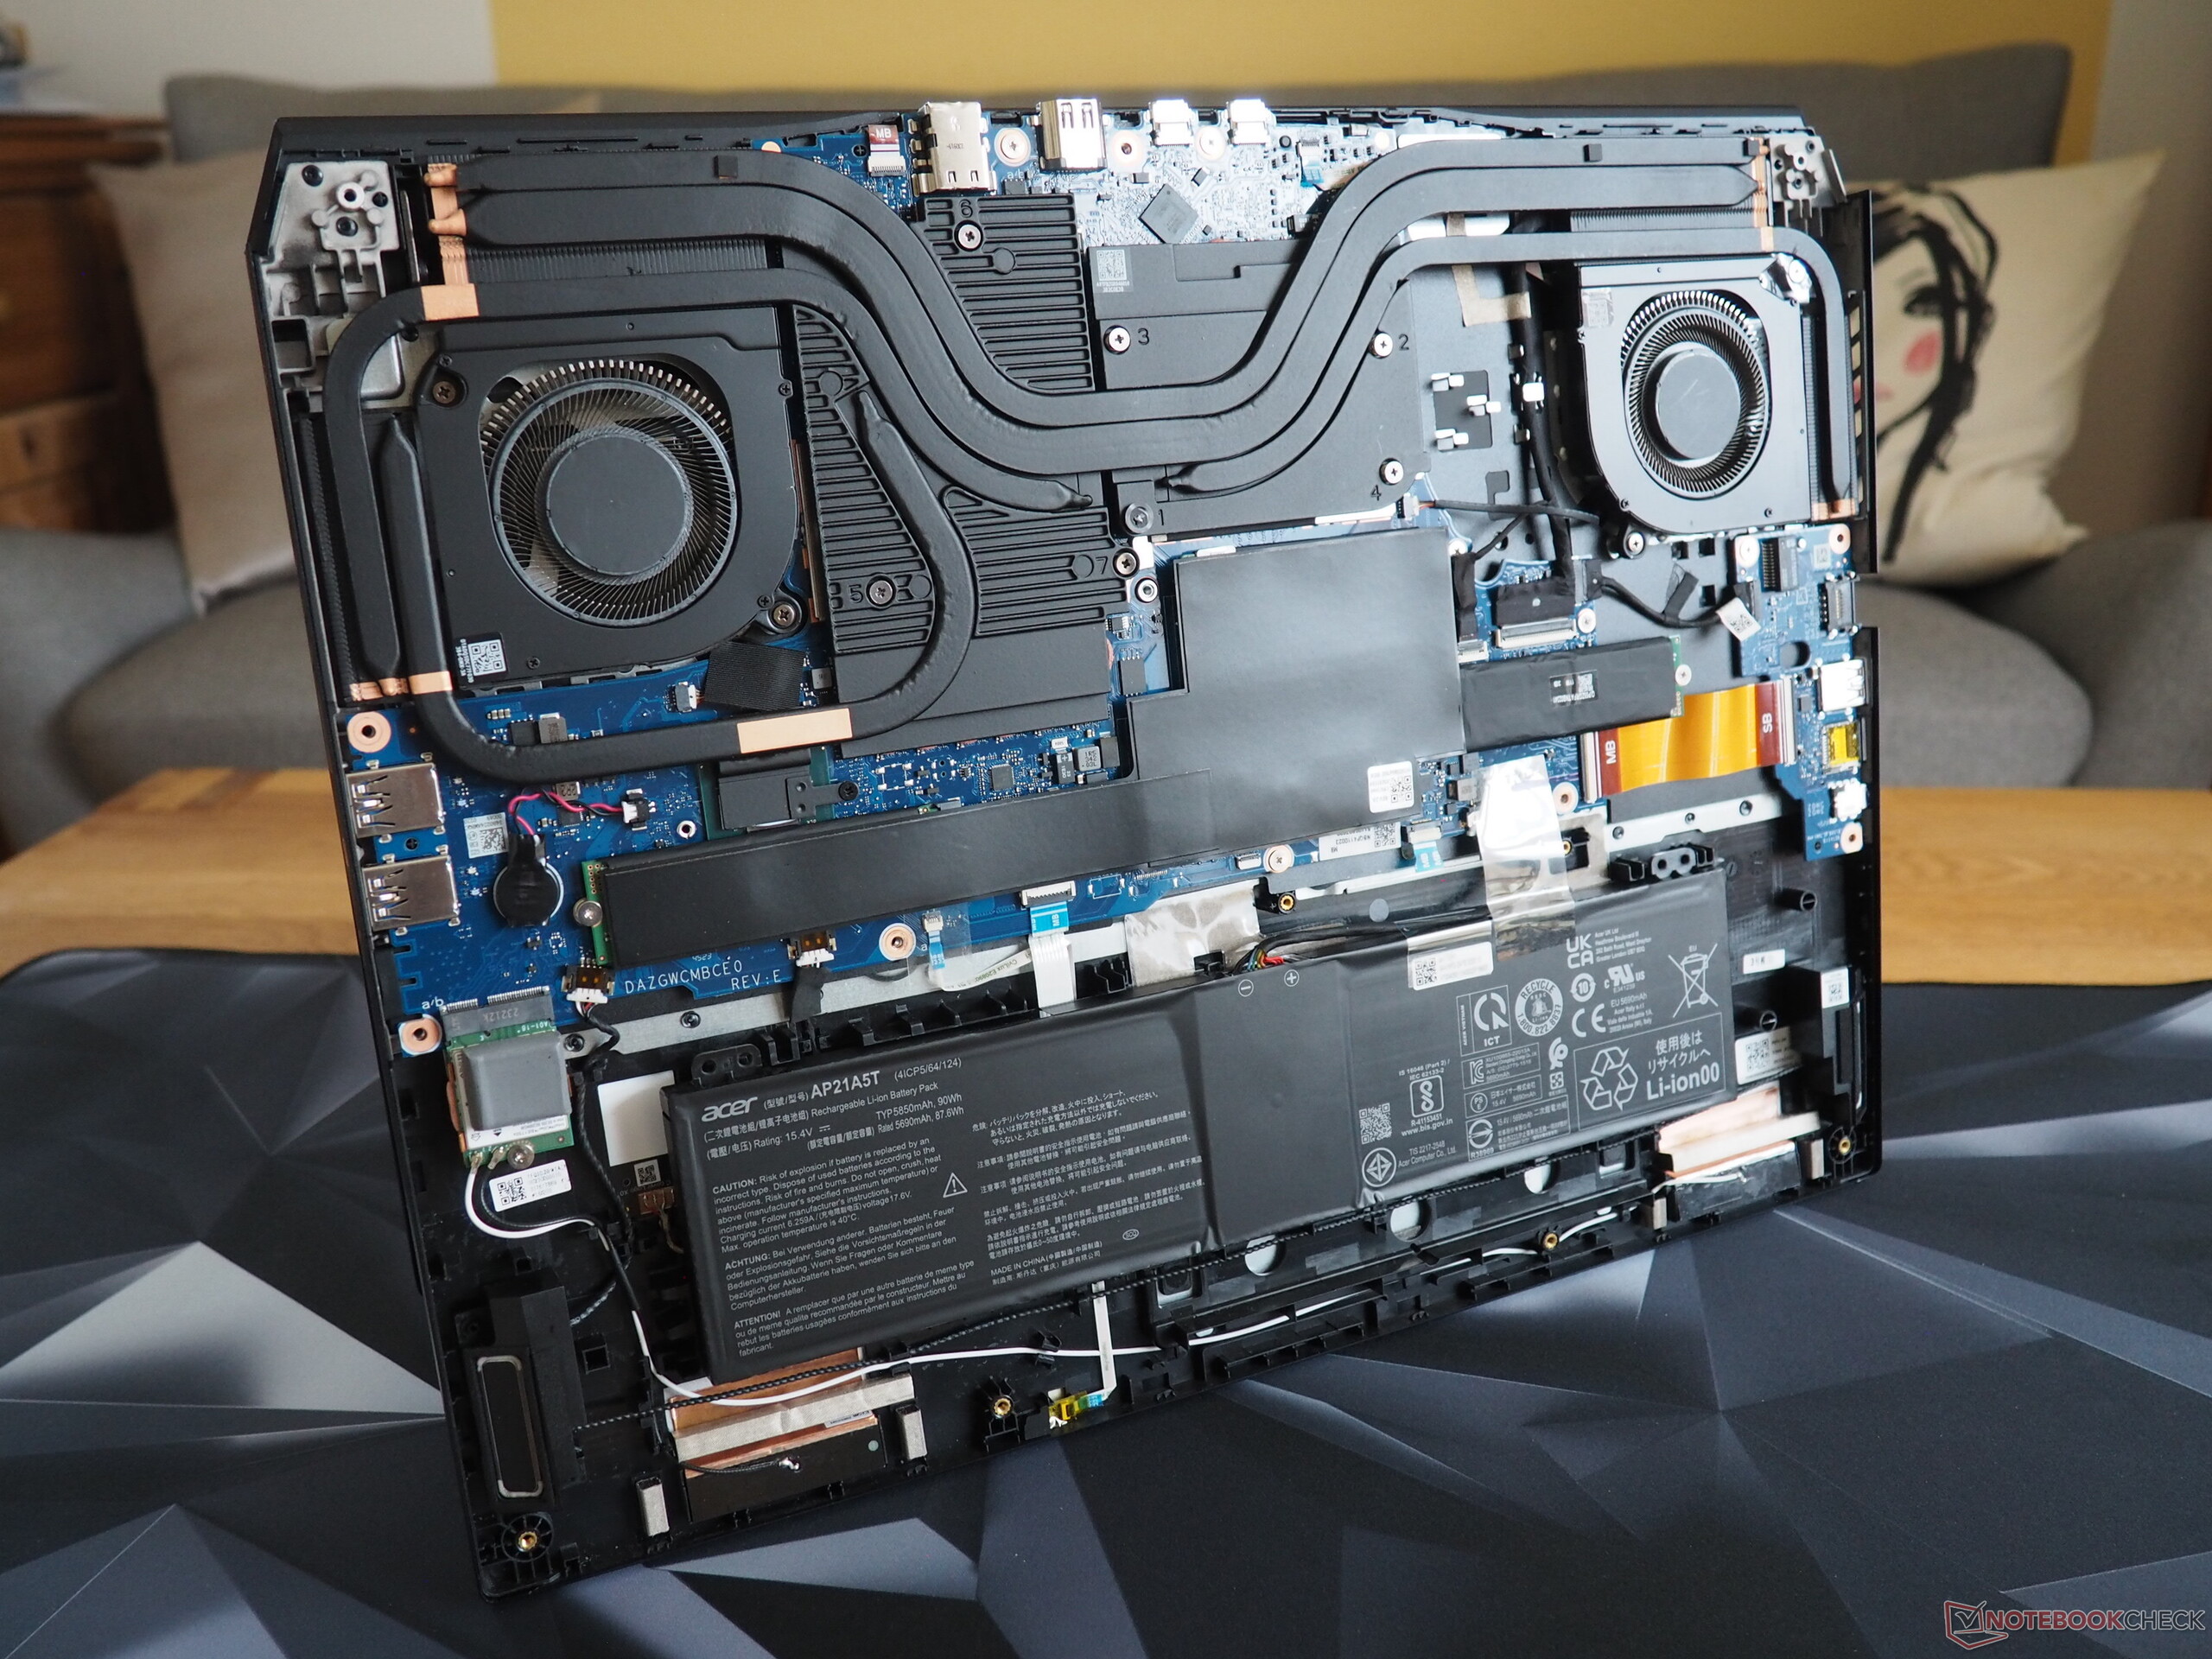
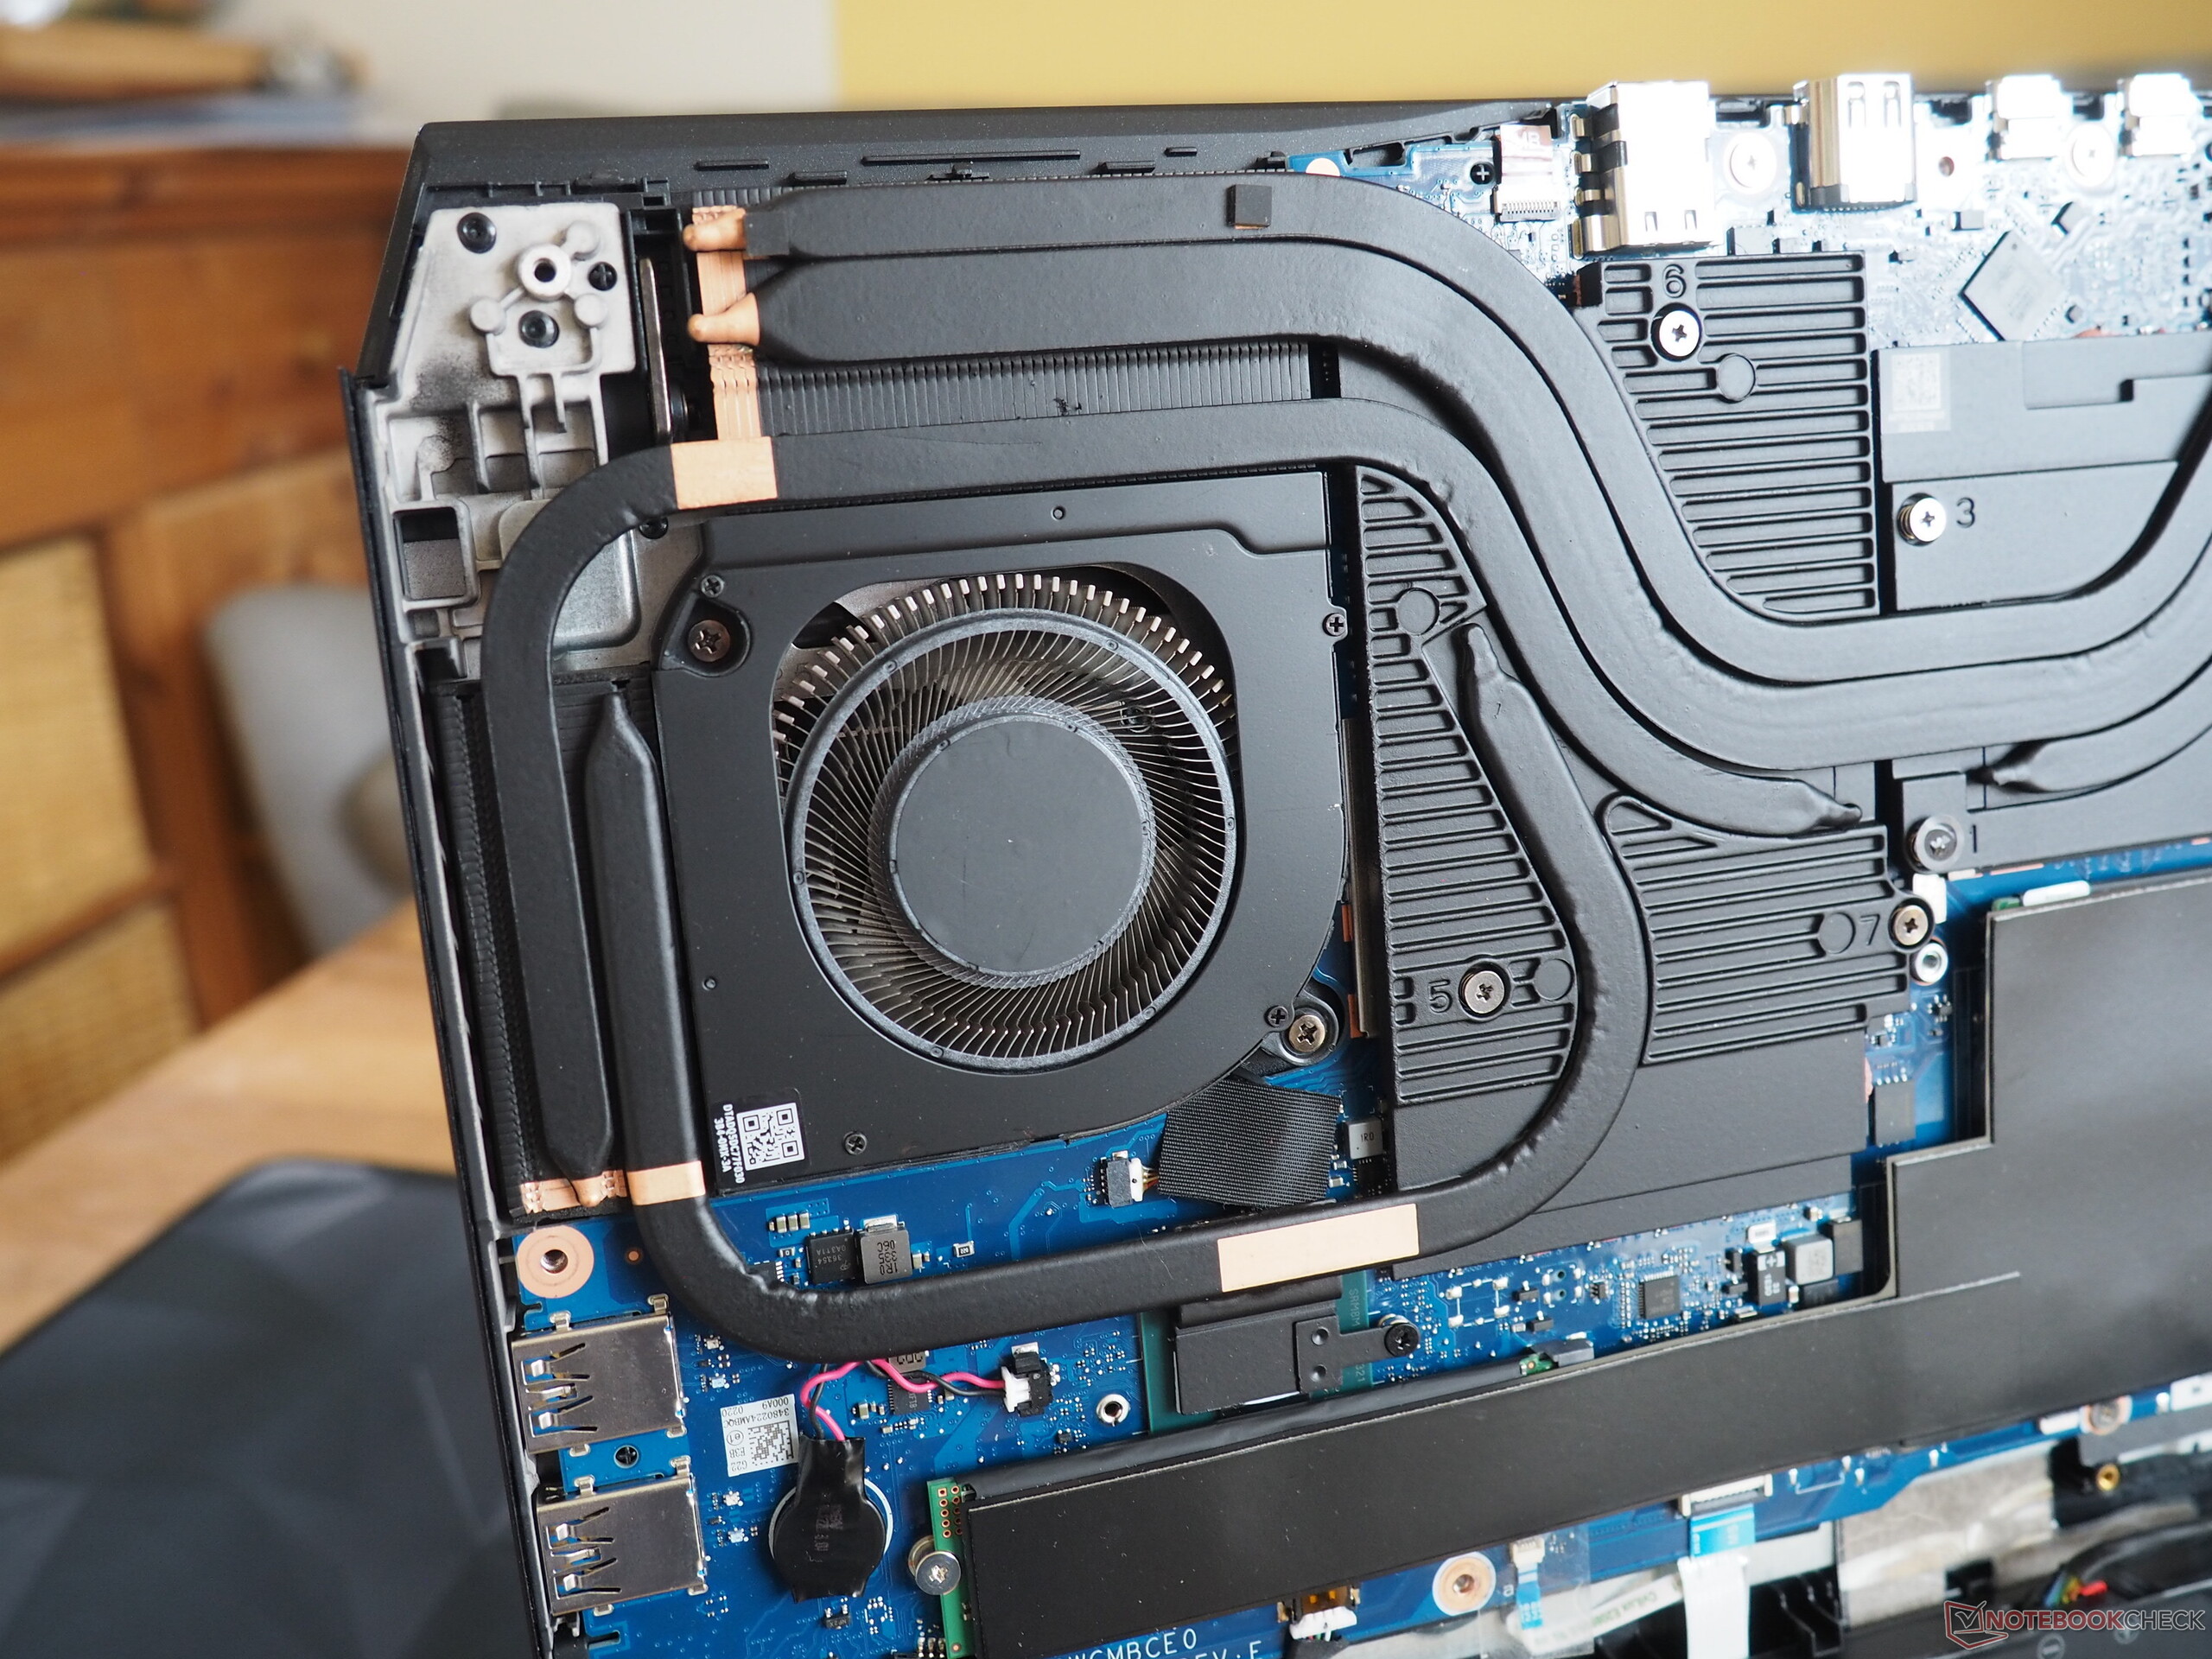
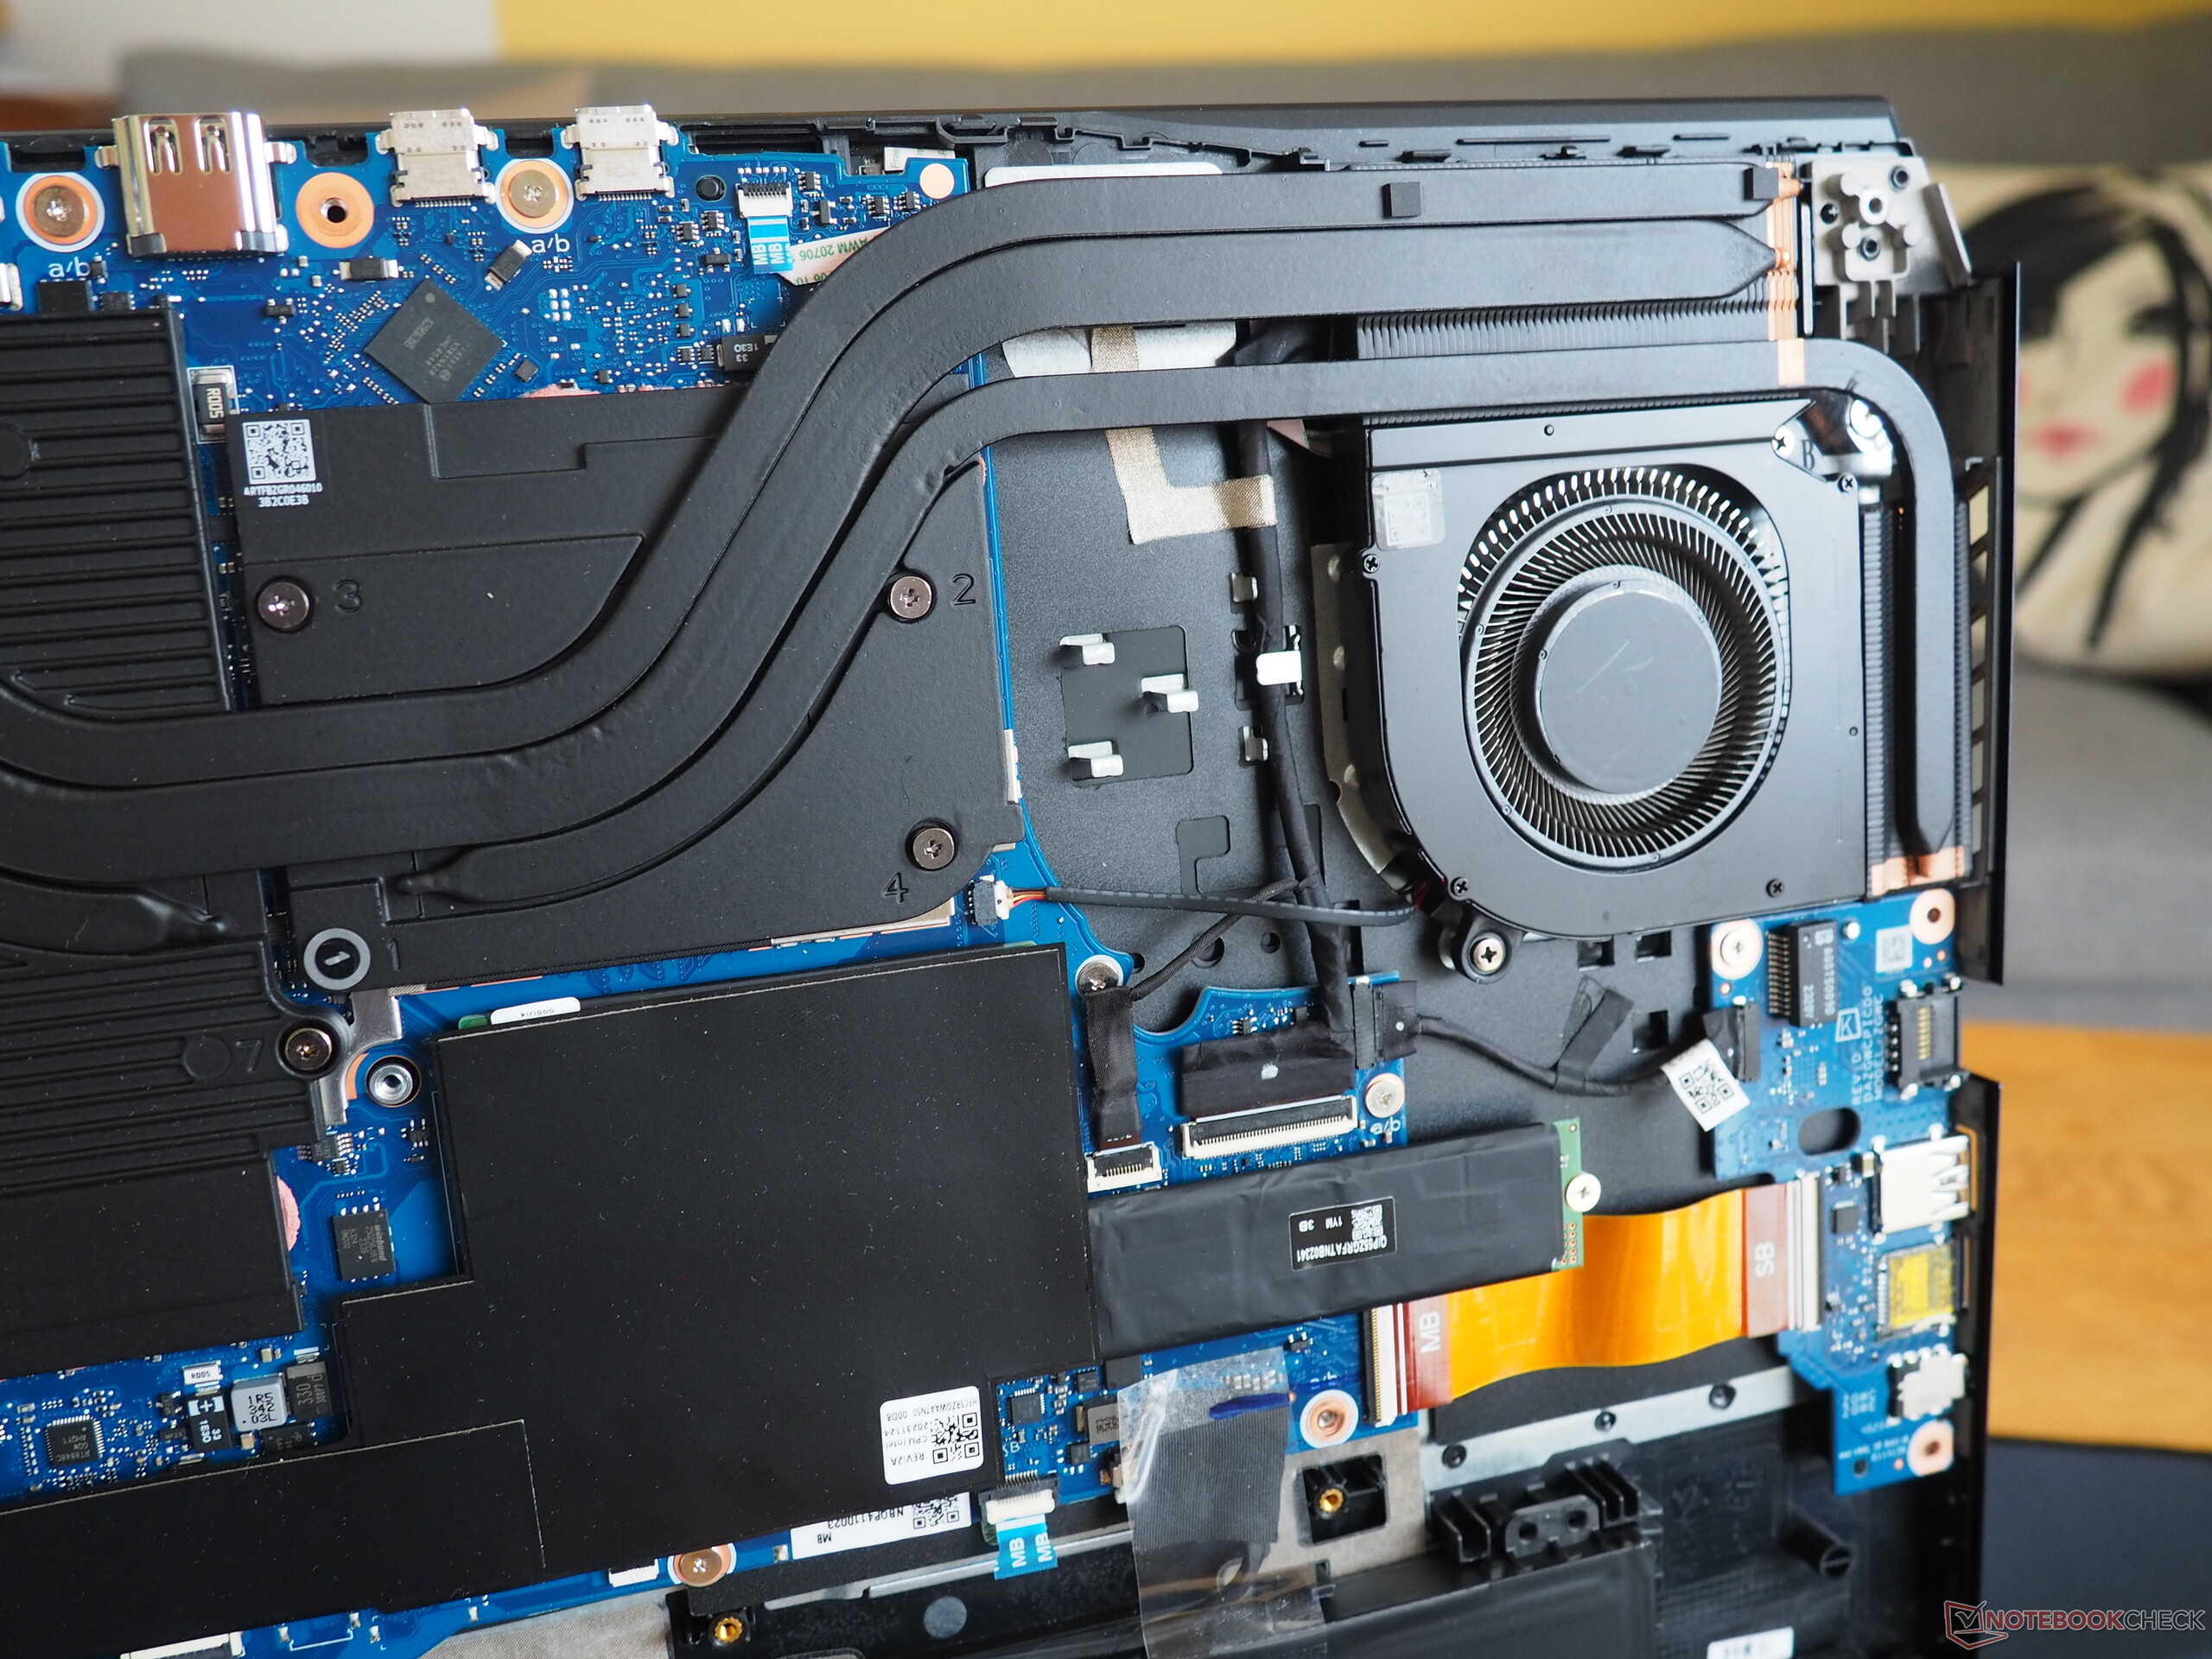
Its maintenance options left us with mixed feelings. It takes quite a while to unscrew the 14 Torx screws and pry open the bottom plate—plus, Acer might even scare away many users through its use of a warranty seal (covering one screw). On the inside, you at least have access to the cooling system, battery, WLAN module, RAM and the SSD. However, the latter two are covered by films and pads, which doesn't make them easy to swap out.
Warranty
The laptop is covered by a 24-month warranty.
Input devices
Keyboard
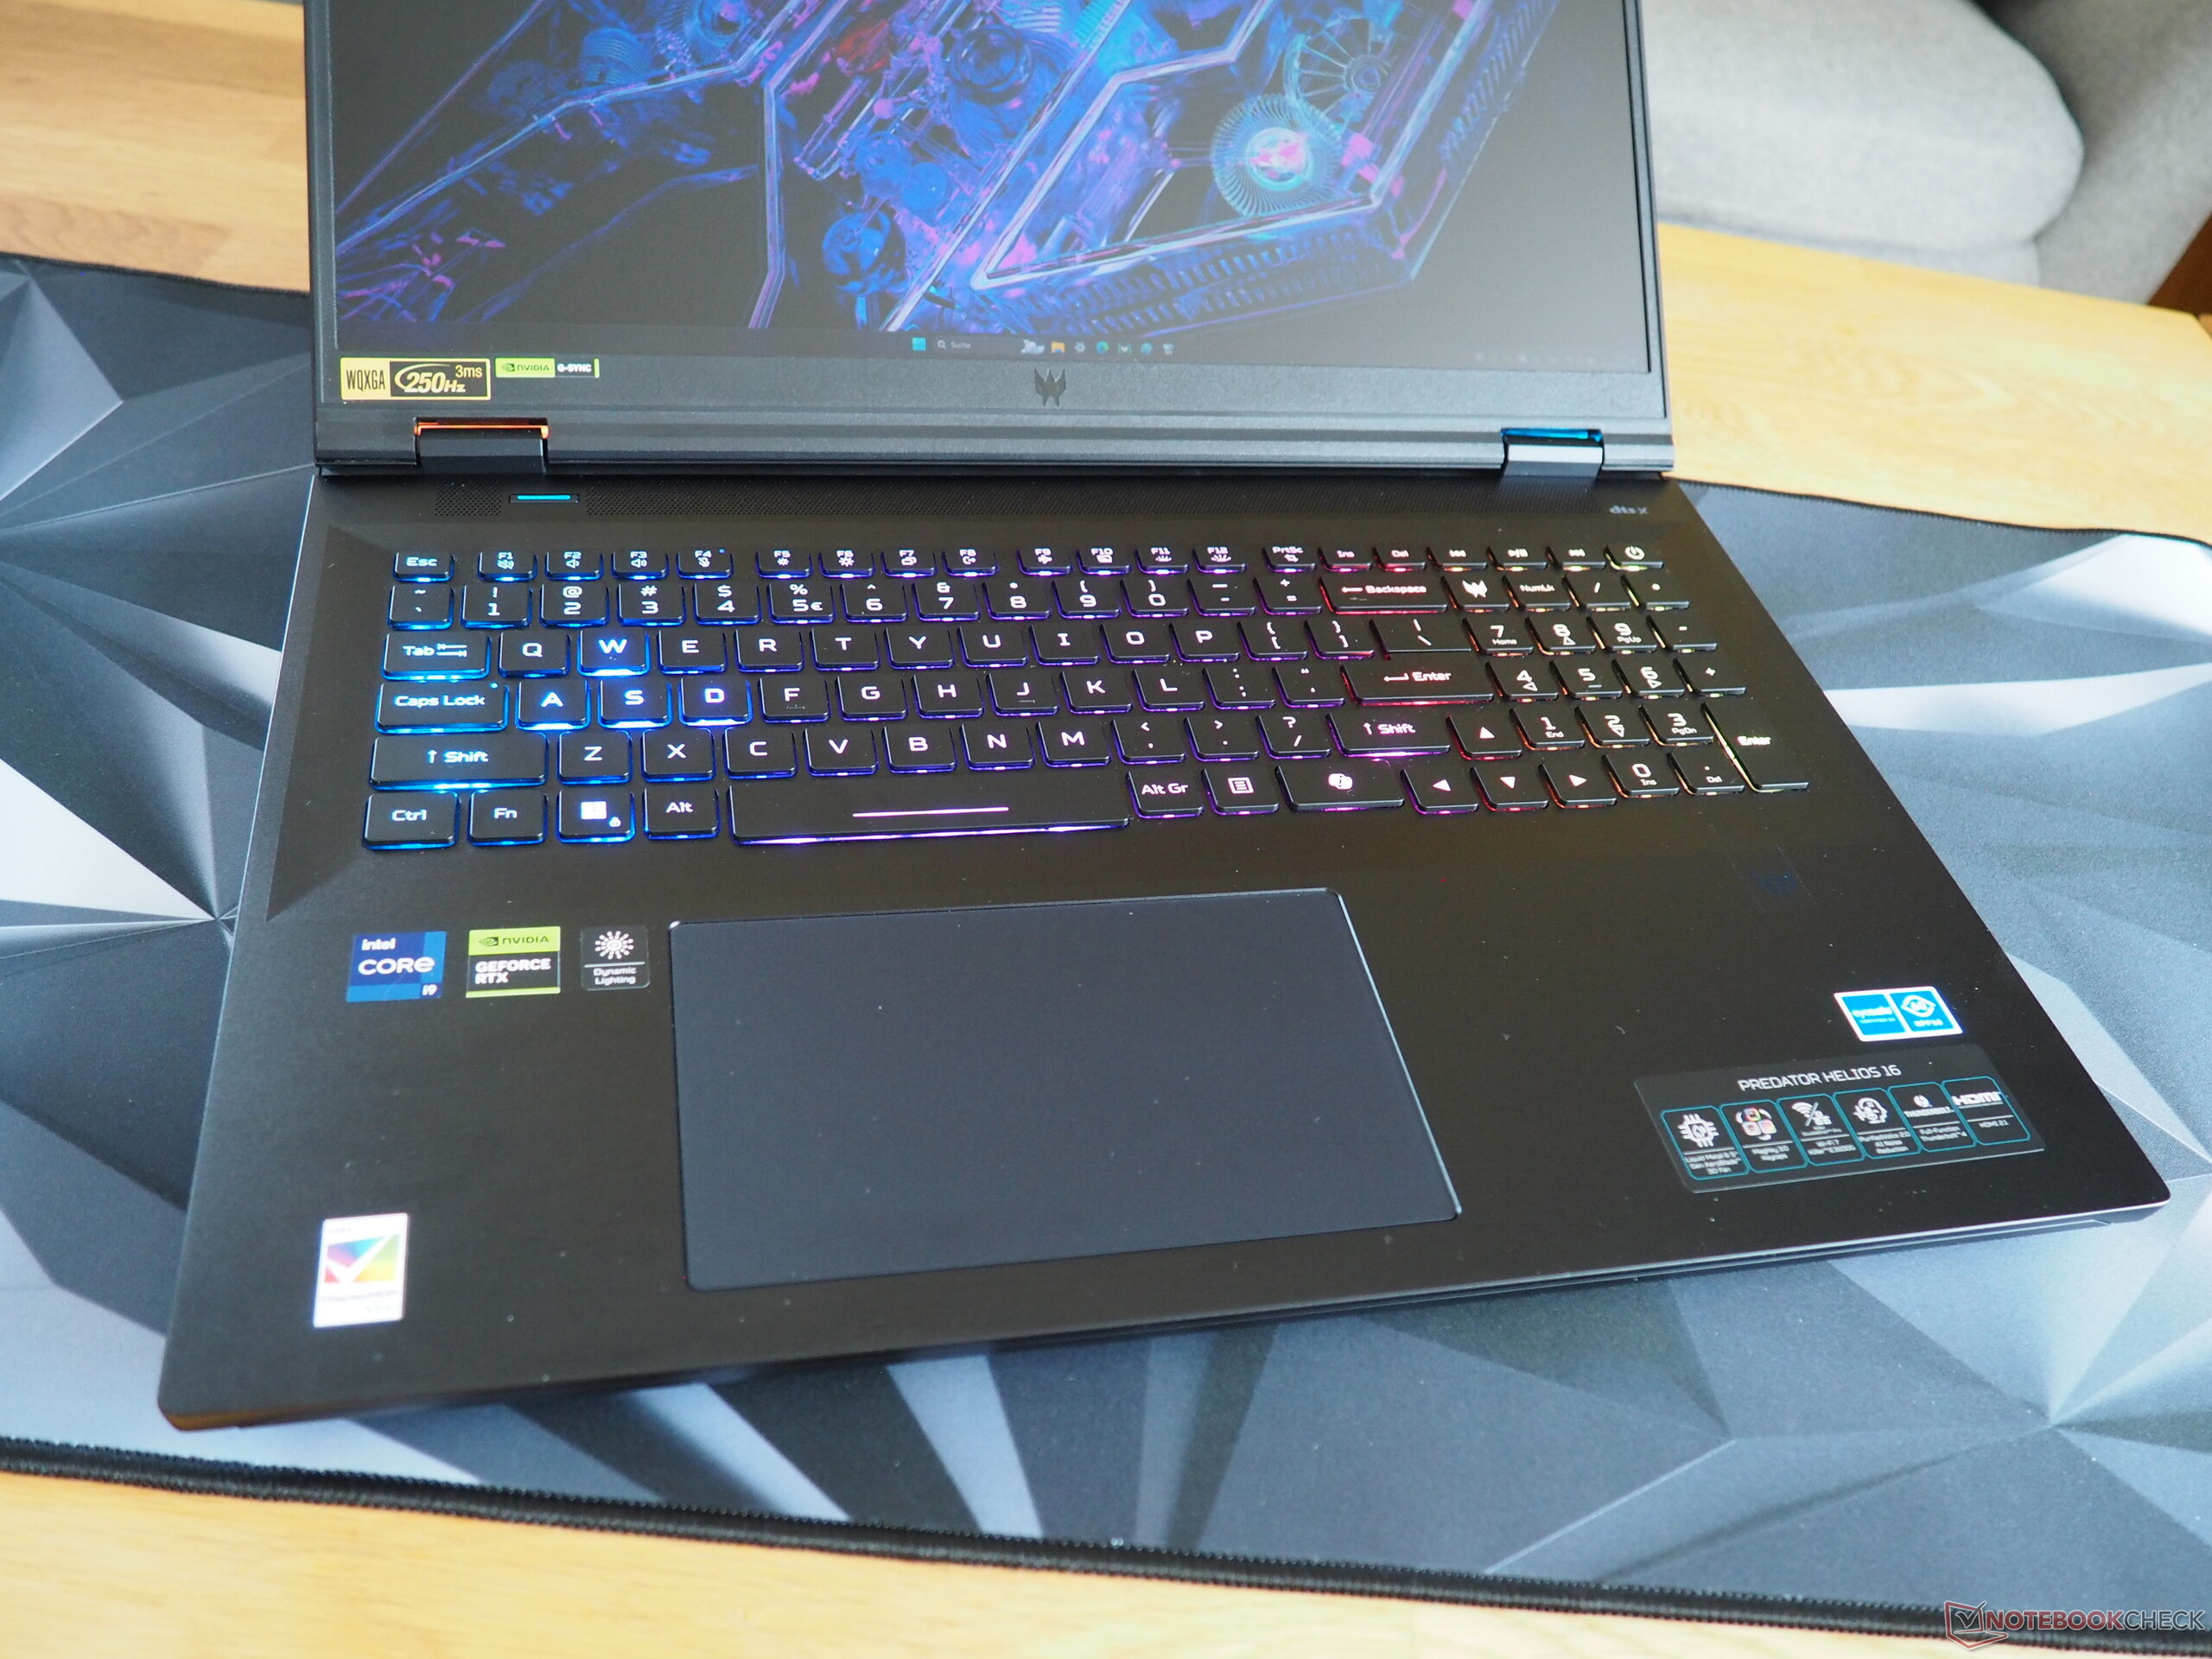
Gamers will be excited to see the laptop's extensive lighting in particular (single-key RGB) which, in our eyes, could be a little more even. For a classic rubber-dome keyboard, it feels surprisingly good to type on—it's just a bit loud. Aside from a few details (modified numerical keypad), its layout is good. In contrast to other manufacturers, Acer hasn't experimented much and most functions are useful. The manufacturer also deserves praise for the laptop's generous key size (e.g. its well-sized arrow keys).
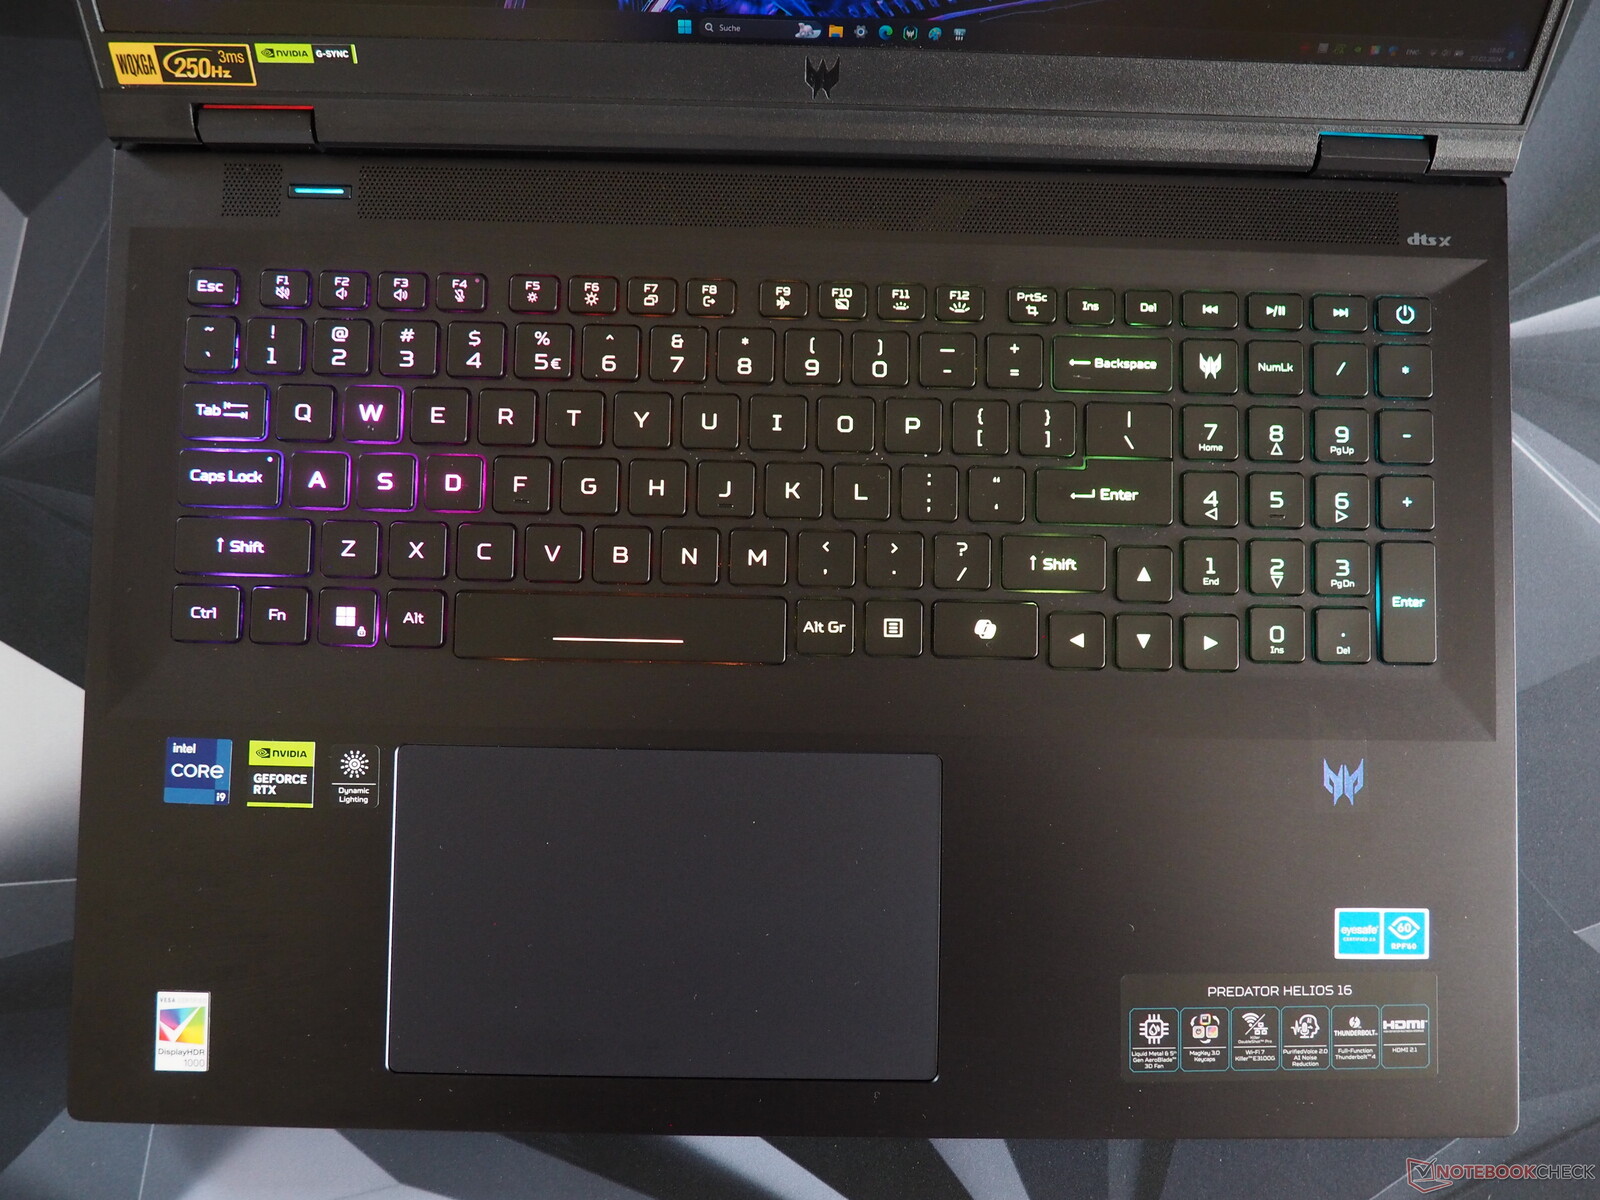
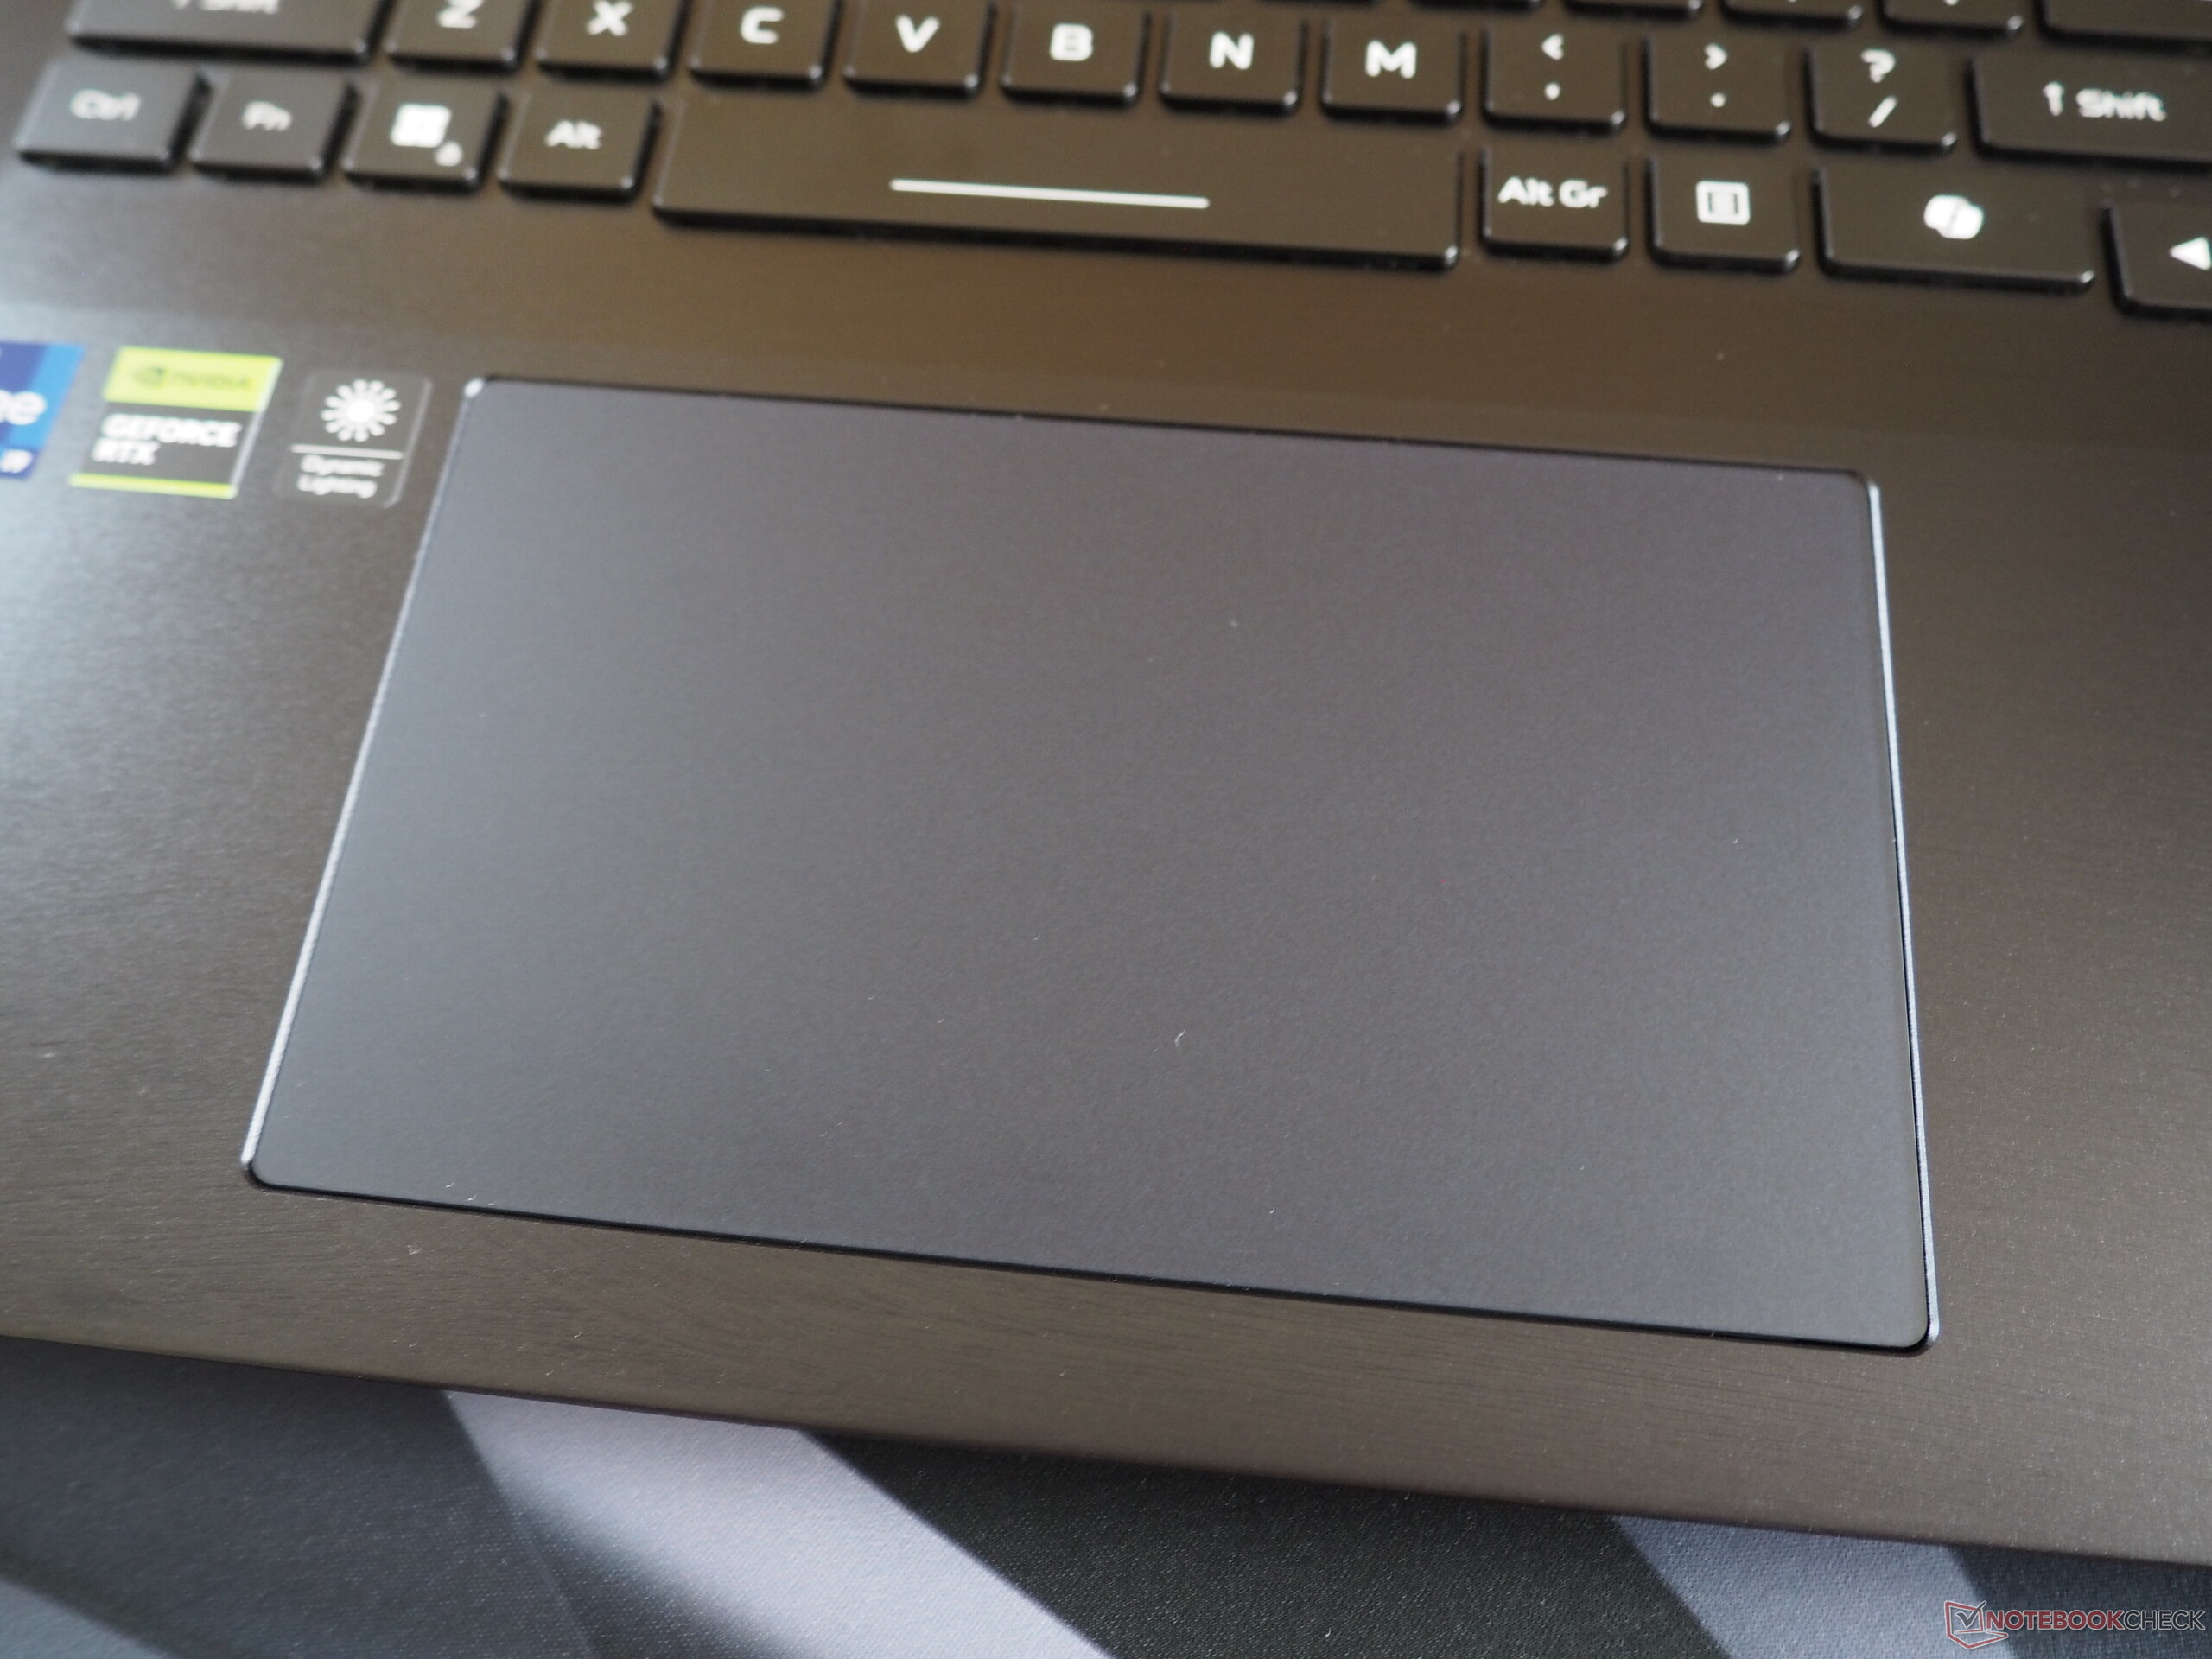
Touchpad
Its touchpad is also nearly flawless. Its 15 x 9 cm size is generous and it allows for long movements without having to lift your finger. In addition, its smooth surface ensures that your fingers glide over the pad well. We didn't note anything inconspicuous when it came to its gesture support and precision.
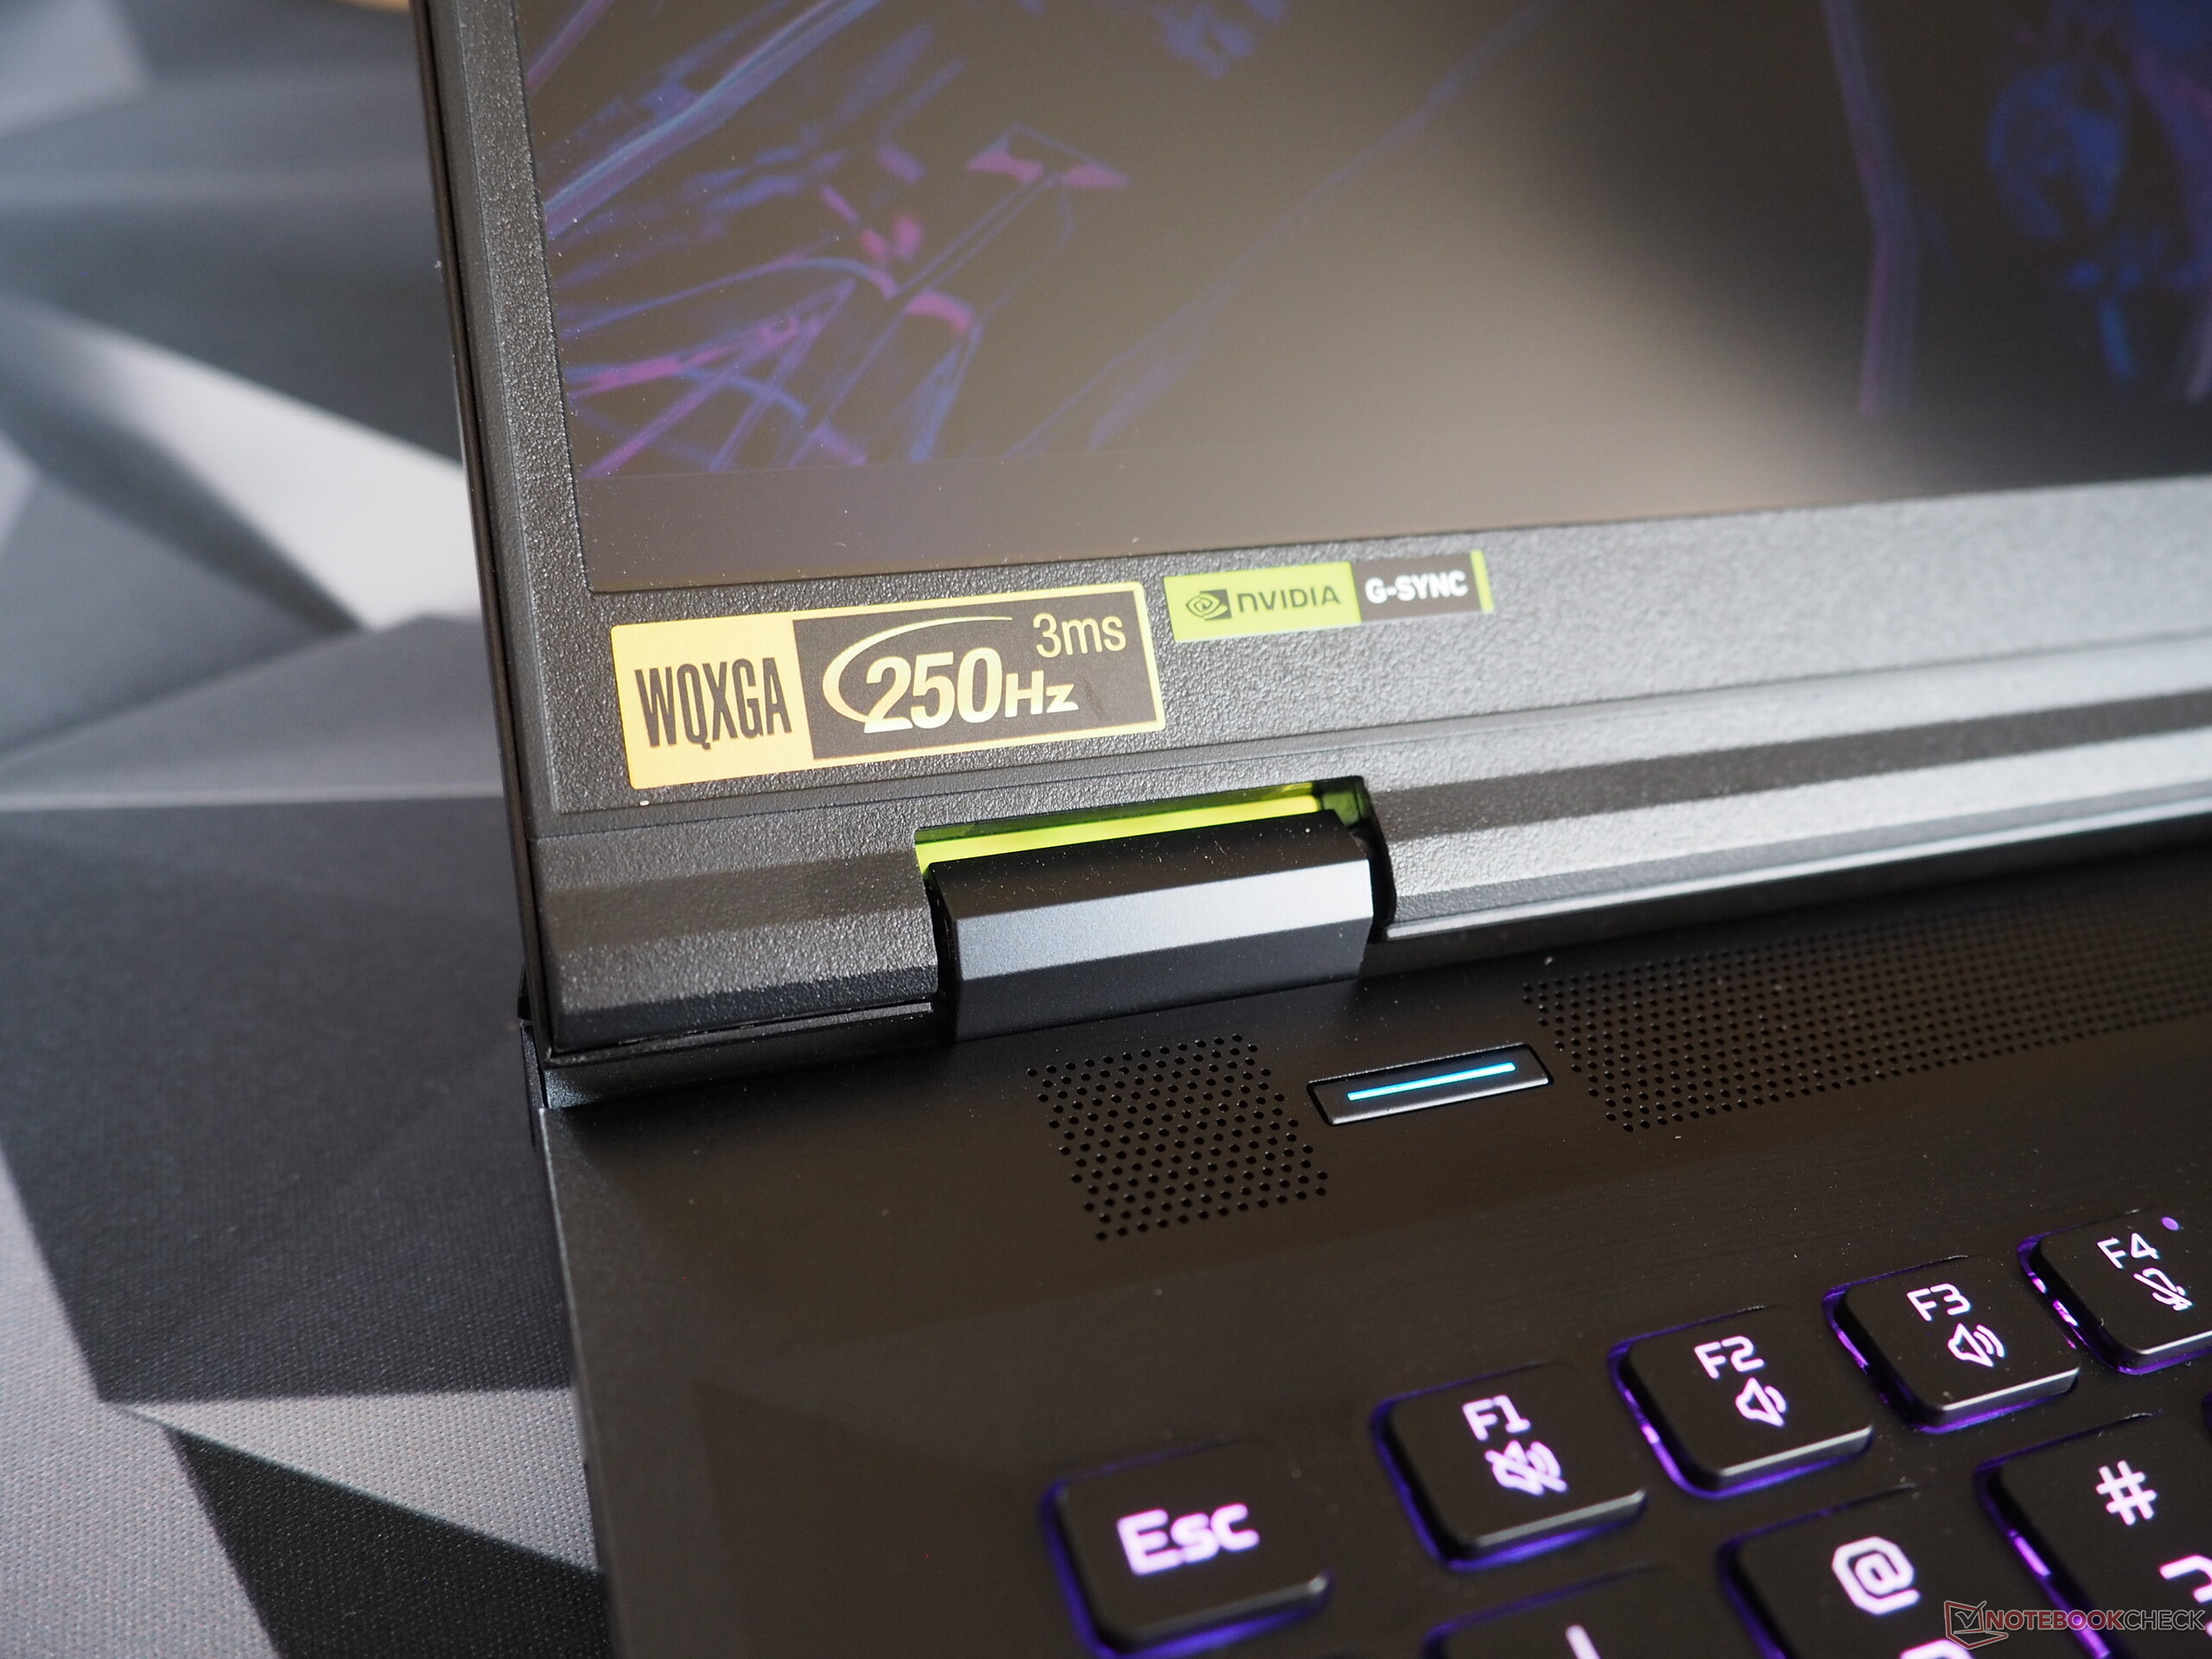
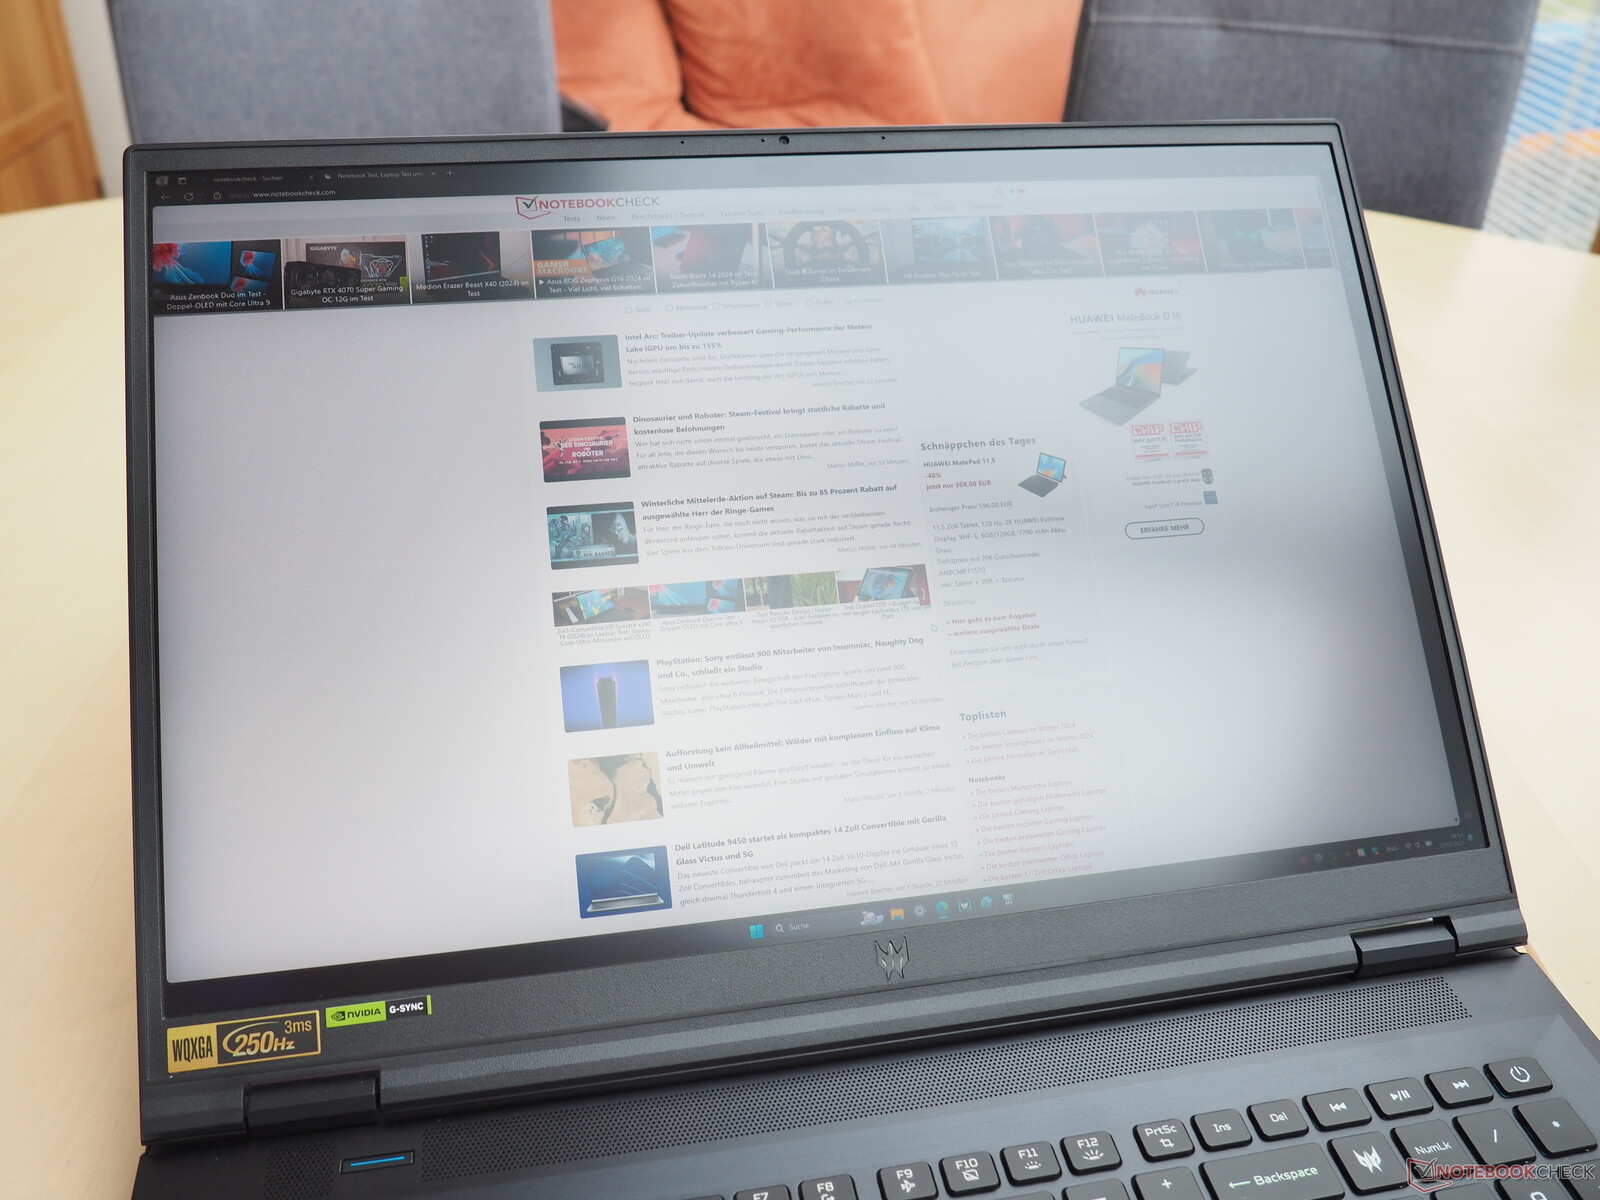
Display
The 2024 version has inherited its predecessor's Mini-LED display (WQXGA, 16:10, 250 Hz, HDR1000). If you disregard its flickering across all brightness levels (which should thankfully only prove to be an issue for sensitive users), this technology has clear advantages over a standard IPS panel.
| |||||||||||||||||||||||||
Brightness Distribution: 93 %
Center on Battery: 722 cd/m²
Contrast: 18050:1 (Black: 0.04 cd/m²)
ΔE ColorChecker Calman: 3.4 | ∀{0.5-29.43 Ø4.72}
calibrated: 1.6
ΔE Greyscale Calman: 3.8 | ∀{0.09-98 Ø4.97}
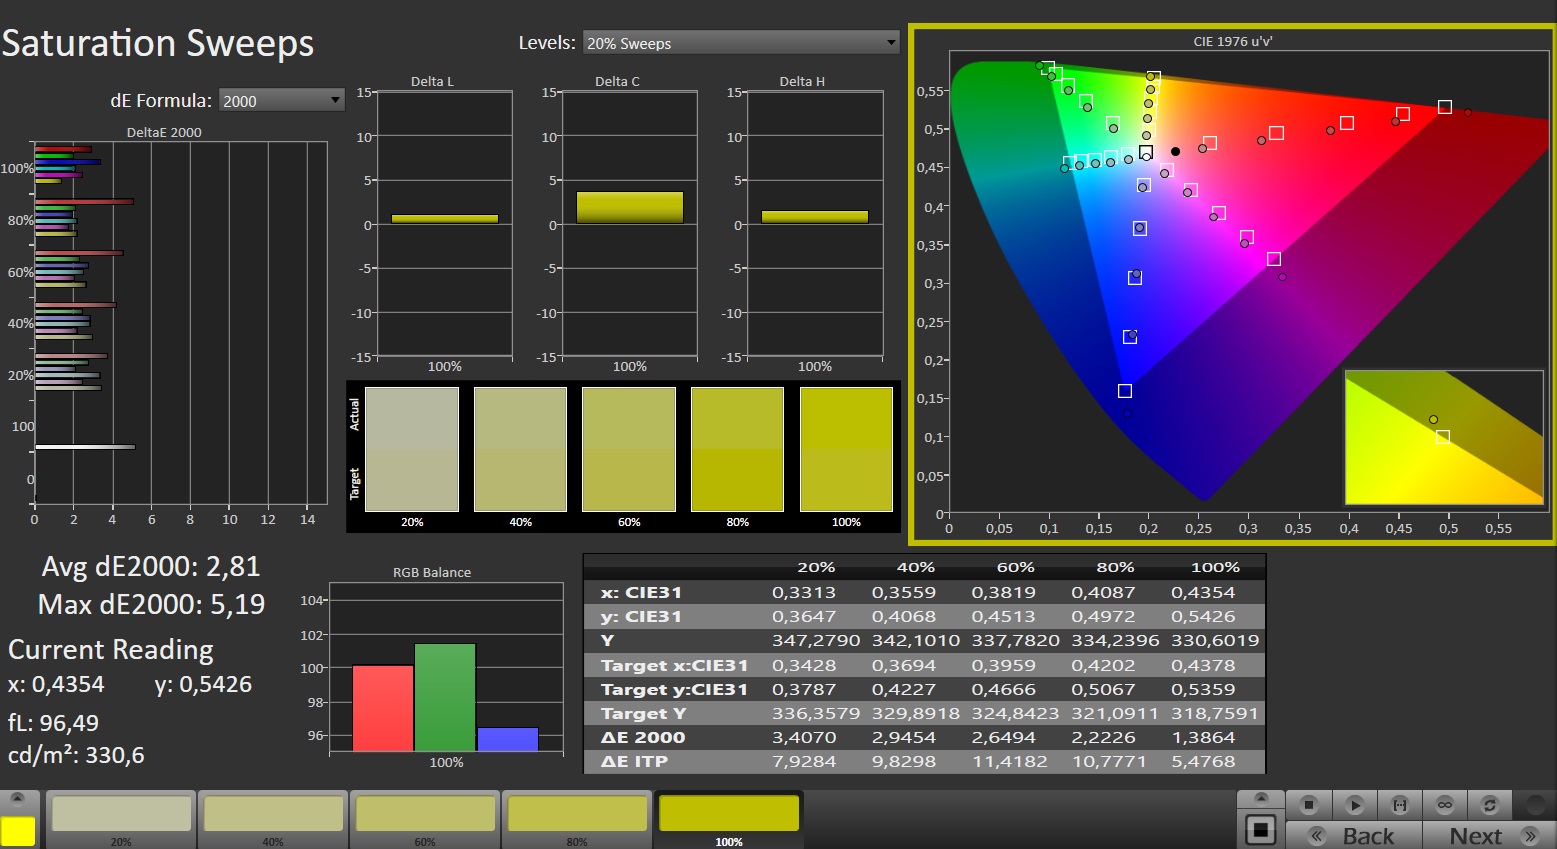
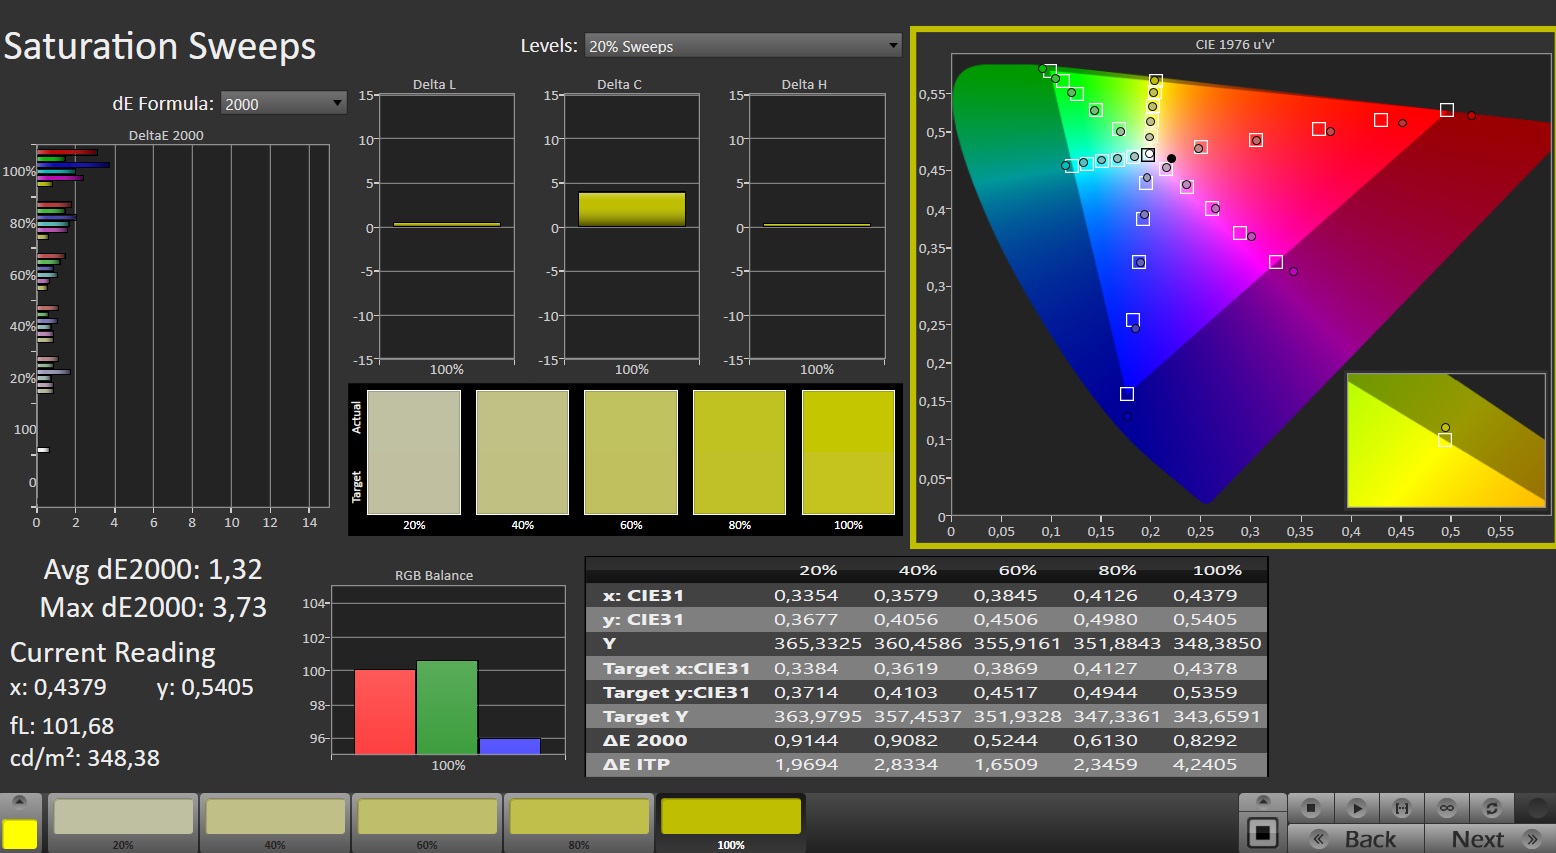
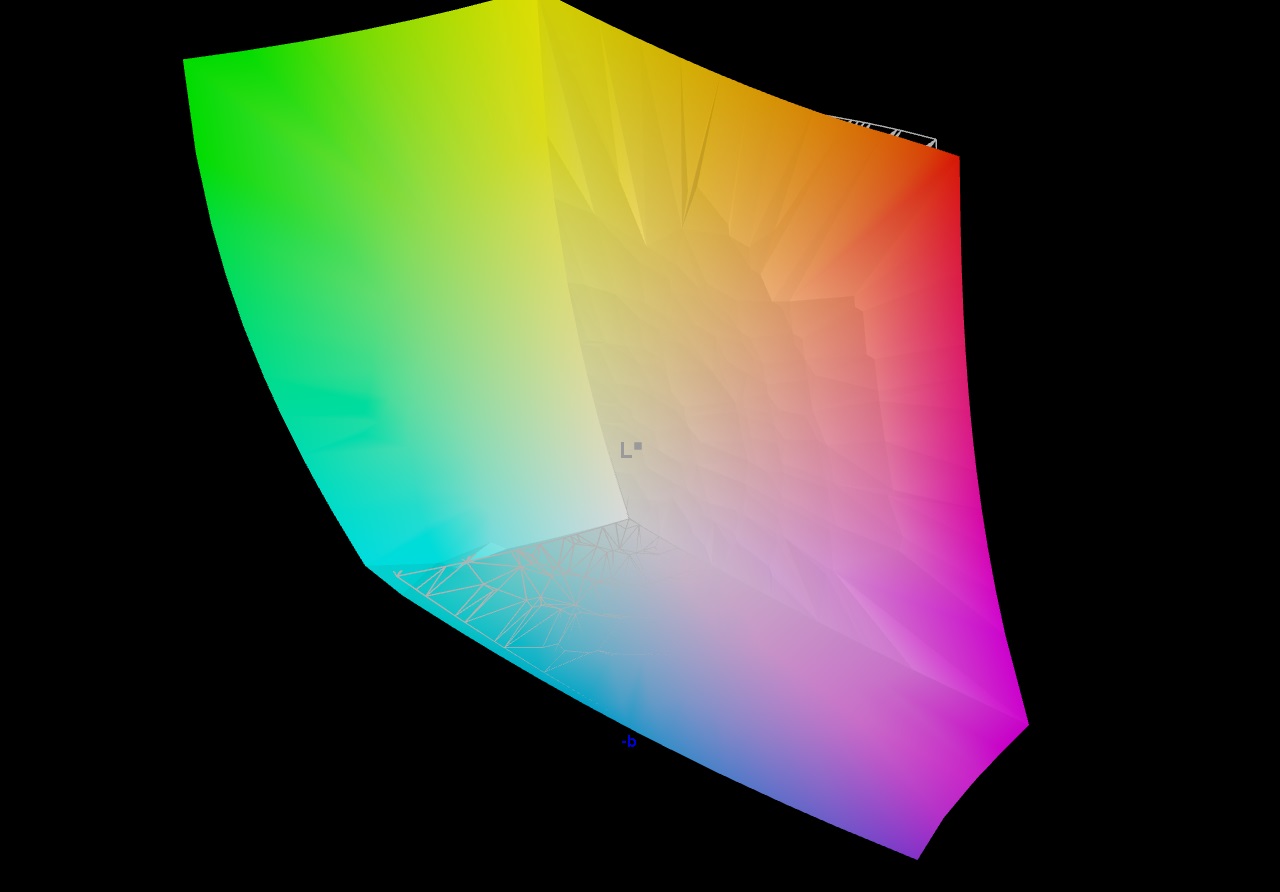
91.6% AdobeRGB 1998 (Argyll 3D)
100% sRGB (Argyll 3D)
99.7% Display P3 (Argyll 3D)
Gamma: 2.383
CCT: 7051 K
| Acer Predator Helios 18 PH18-72-98MW B180QAN01.2 (AUO45A8), Mini-LED, 2560x1600, 18" | MSI Titan 18 HX A14VIG AU Optronics B180ZAN01.0, Mini-LED, 3840x2400, 18" | Asus ROG Strix Scar 18 G834JYR (2024) BOE NE180QDM-NM1, Mini LED, 2560x1600, 18" | Acer Predator Helios 18 N23Q2 AUO45A8 (B180QAN01.2), IPS, 2560x1600, 18" | Alienware m18 R1 AMD BOE NE18NZ1, IPS, 1920x1200, 18" | |
|---|---|---|---|---|---|
| Display | -3% | -1% | 0% | -1% | |
| Display P3 Coverage (%) | 99.7 | 98.1 -2% | 99.9 0% | 99.8 0% | 98.5 -1% |
| sRGB Coverage (%) | 100 | 99.8 0% | 100 0% | 100 0% | 99.7 0% |
| AdobeRGB 1998 Coverage (%) | 91.6 | 86.2 -6% | 90 -2% | 91.8 0% | 88.7 -3% |
| Response Times | -187% | -6% | 2% | 55% | |
| Response Time Grey 50% / Grey 80% * (ms) | 8 ? | 8.6 ? -8% | 12 ? -50% | 7.6 ? 5% | 2.8 ? 65% |
| Response Time Black / White * (ms) | 17.6 ? | 81.8 ? -365% | 10.7 ? 39% | 17.8 ? -1% | 9.6 ? 45% |
| PWM Frequency (Hz) | 4832 ? | 2592 ? | 5733 ? | 2509 | |
| Screen | -24% | 17% | -82% | -54% | |
| Brightness middle (cd/m²) | 722 | 467.5 -35% | 937 30% | 360 -50% | 319.6 -56% |
| Brightness (cd/m²) | 724 | 459 -37% | 934 29% | 355 -51% | 304 -58% |
| Brightness Distribution (%) | 93 | 90 -3% | 89 -4% | 92 -1% | 87 -6% |
| Black Level * (cd/m²) | 0.04 | 0.066 -65% | 0.21 -425% | 0.25 -525% | |
| Contrast (:1) | 18050 | 14197 -21% | 1714 -91% | 1278 -93% | |
| Colorchecker dE 2000 * | 3.4 | 3.77 -11% | 1.52 55% | 3.82 -12% | 1.22 64% |
| Colorchecker dE 2000 max. * | 5.32 | 6.12 -15% | 2.82 47% | 7.38 -39% | 3.1 42% |
| Colorchecker dE 2000 calibrated * | 1.6 | 2.94 -84% | 1.21 24% | 2.24 -40% | 0.47 71% |
| Greyscale dE 2000 * | 3.8 | 3.2 16% | 1.7 55% | 5.06 -33% | 0.8 79% |
| Gamma | 2.383 92% | 2.43 91% | 2.042 108% | 2.52 87% | 2.23 99% |
| CCT | 7051 92% | 6478 100% | 6578 99% | 5657 115% | 6471 100% |
| Total Average (Program / Settings) | -71% /
-46% | 3% /
10% | -27% /
-53% | 0% /
-27% |
* ... smaller is better
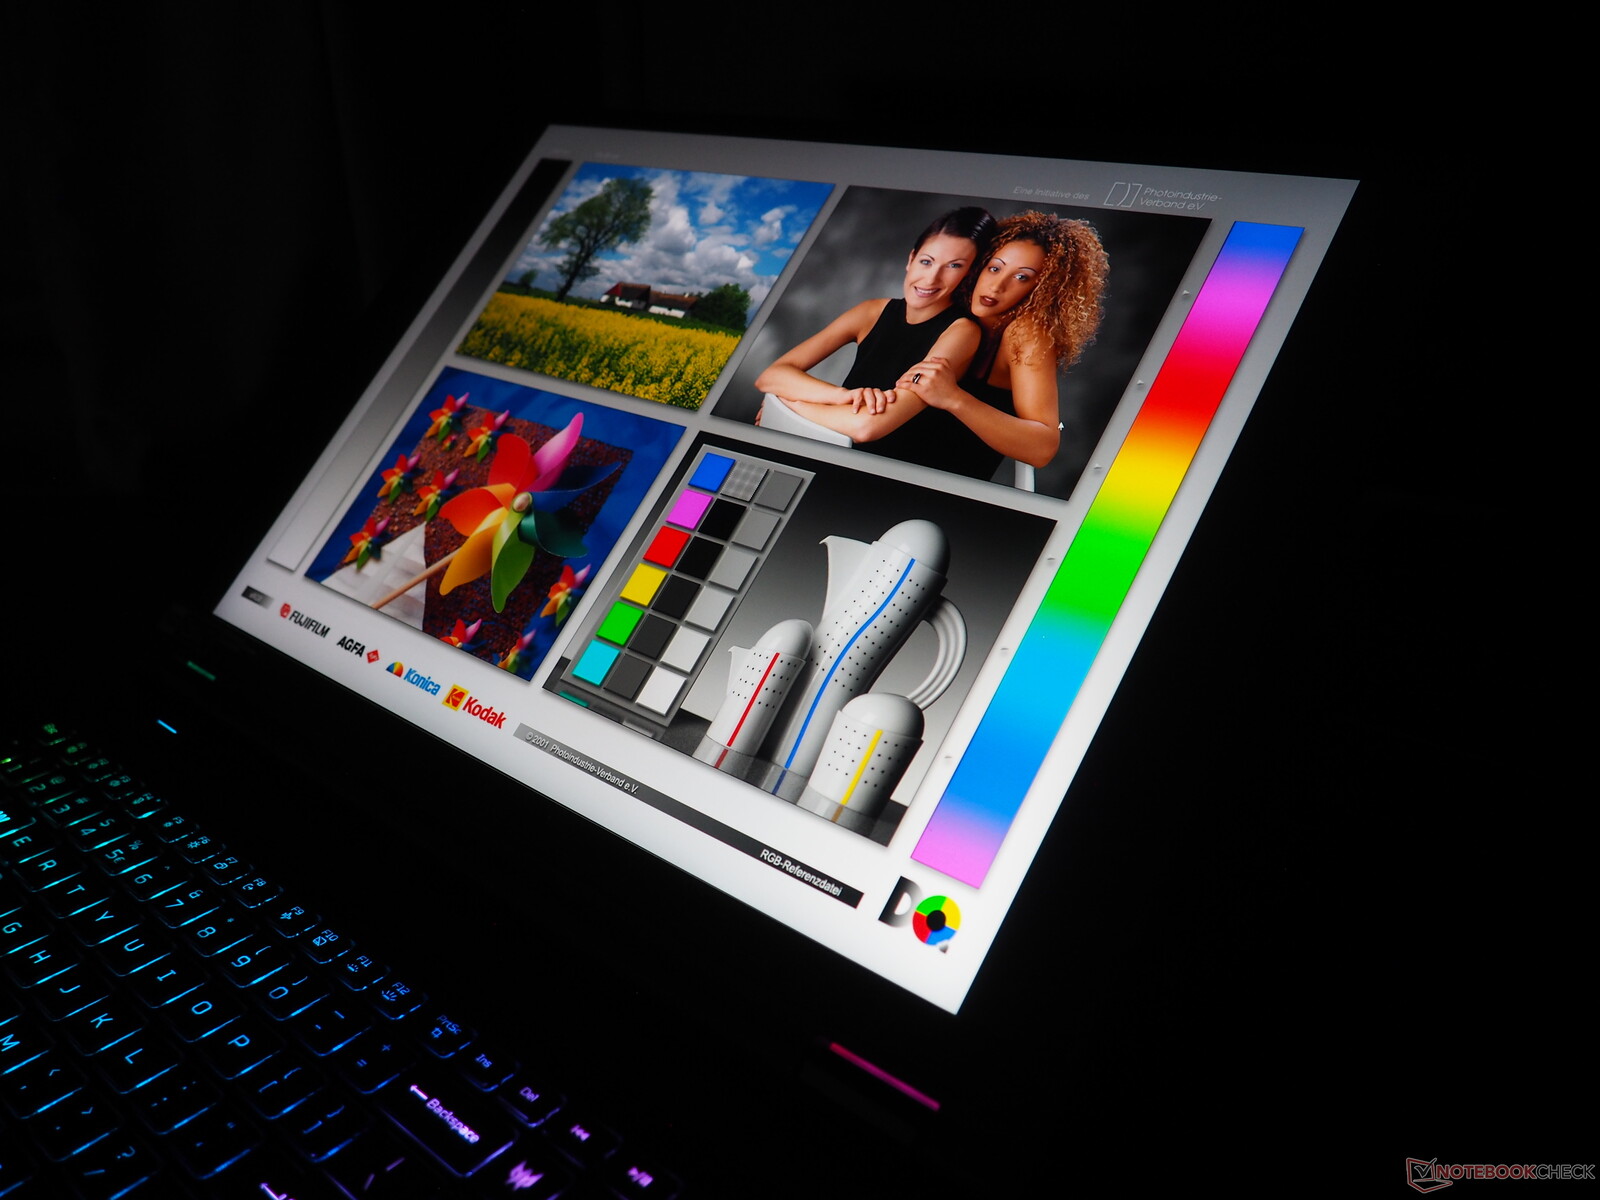
Beginning with its impressive brightness: An average of 724 cd/m² means you can use the device even in super bright surroundings (meaning outdoors). In combination with its extremely low black value of approx. 0.04 cd/m², the screen delivers a great contrast of about 18,000:1. Adding to this is extensive color space coverage—although it can't quite cover AdobeRGB in its entirety, it manages to cover 100 % of sRGB and DCI-P3, which is impressive.
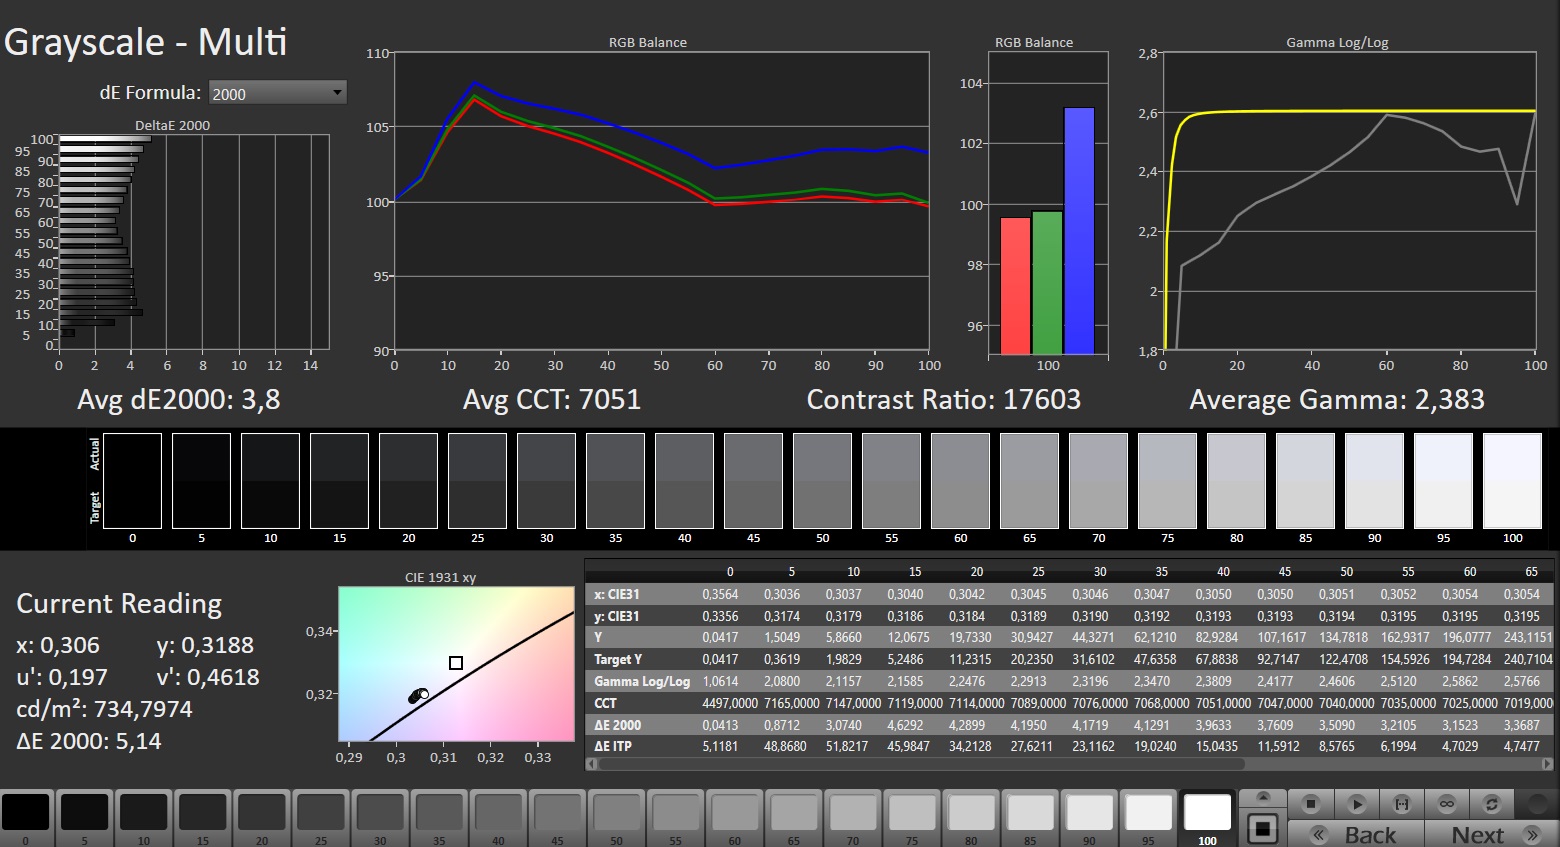
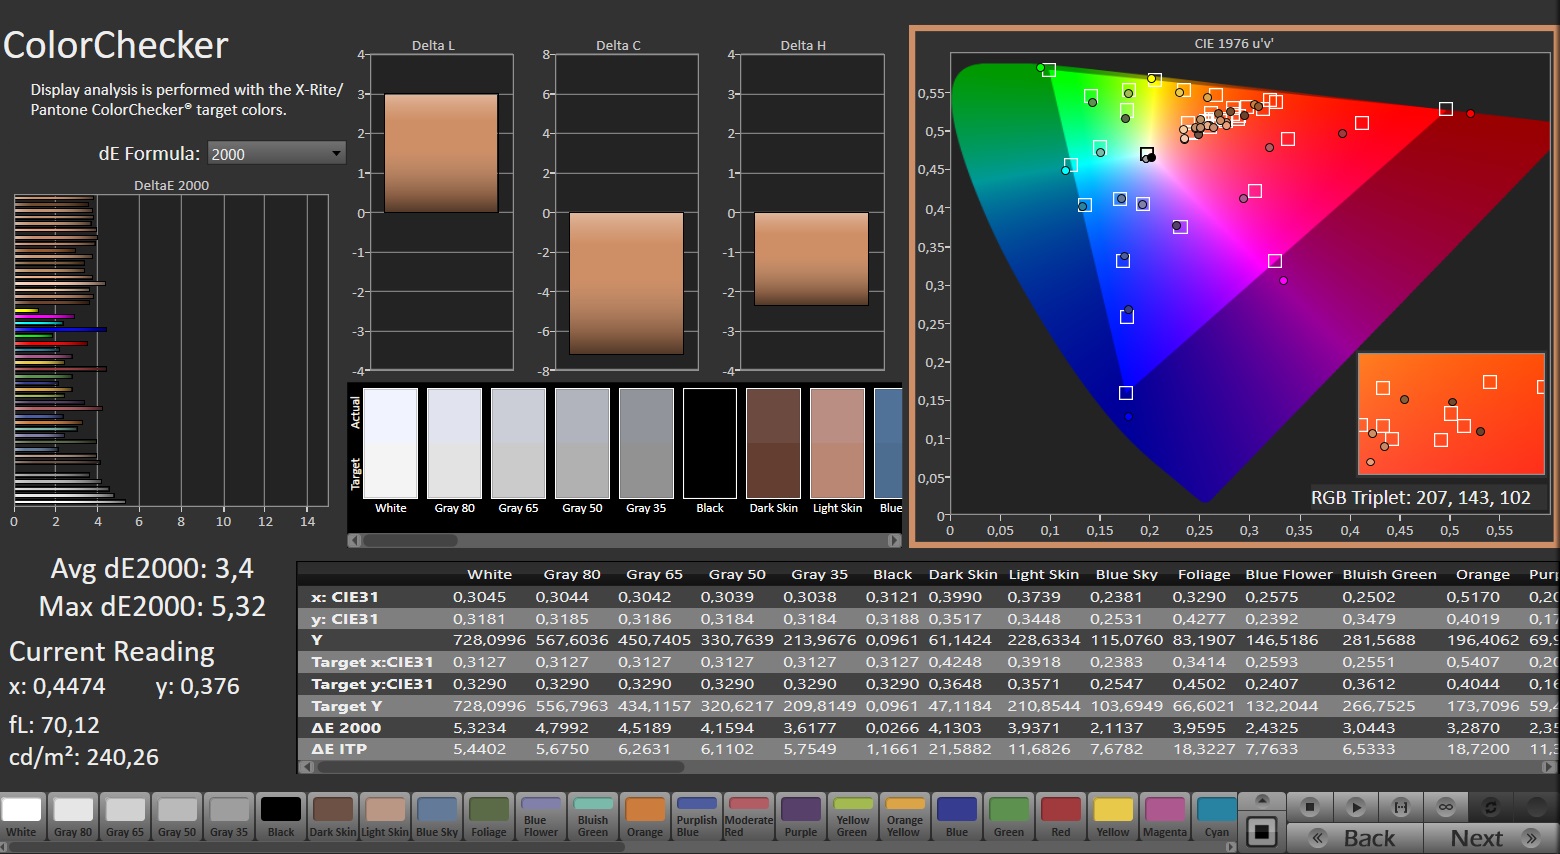
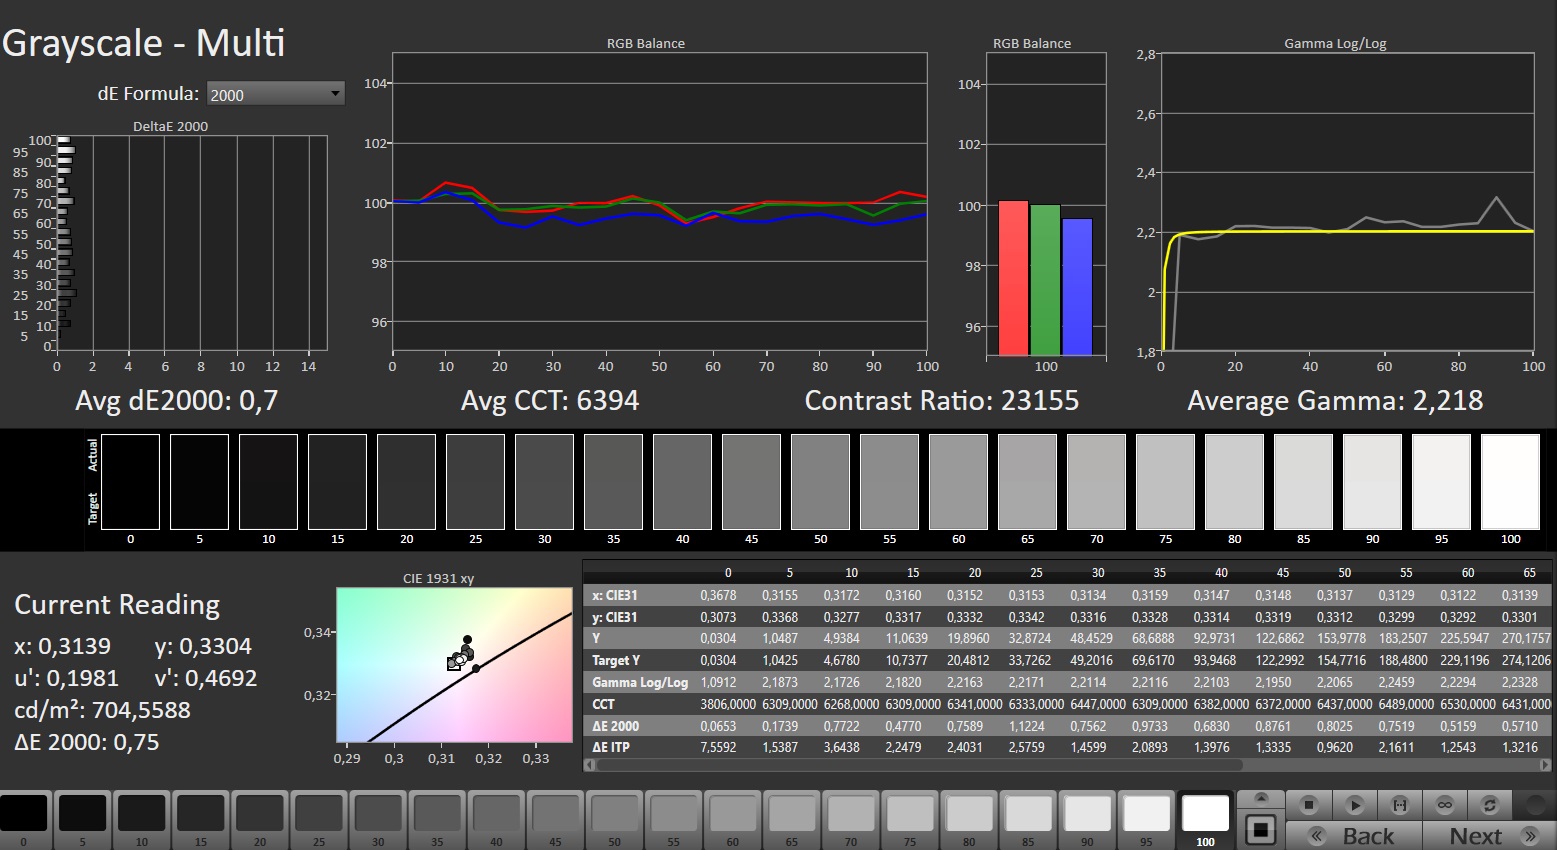
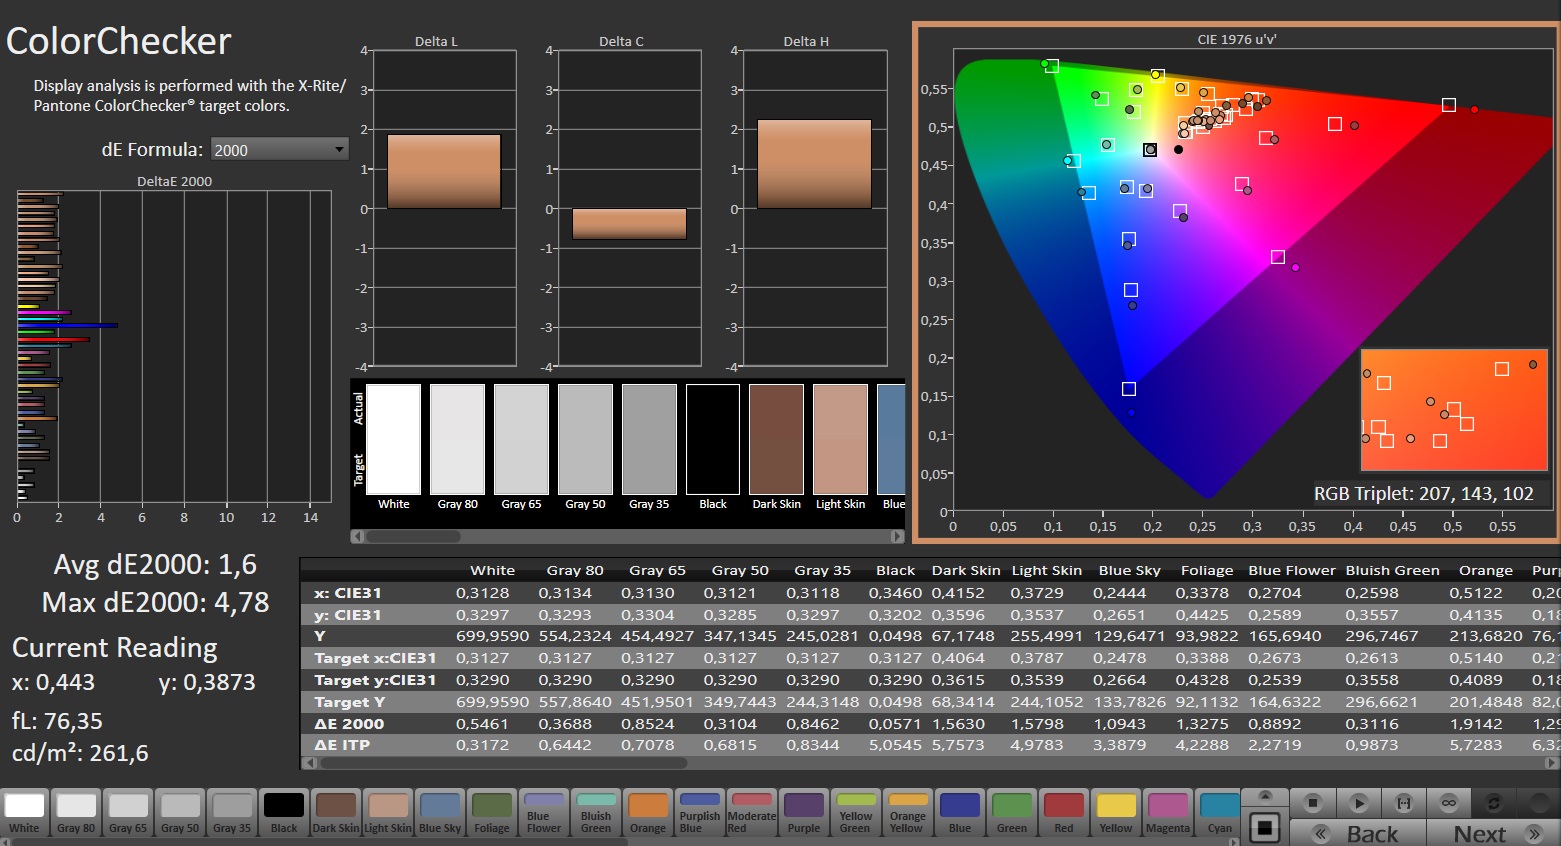
Unfortunately, its color accuracy isn't the best straight out of the box, so professional users should carry out a calibration after purchasing (our ICC file is linked above).


Its response times are decent to good but they can't quite live up to those of OLED panels which, in addition, deliver even better contrasts and black values. On the other hand, they also come with their own weaknesses (e.g. usually a reflective surface).
Display Response Times
| ↔ Response Time Black to White | ||
|---|---|---|
| 17.6 ms ... rise ↗ and fall ↘ combined | ↗ 15.2 ms rise | 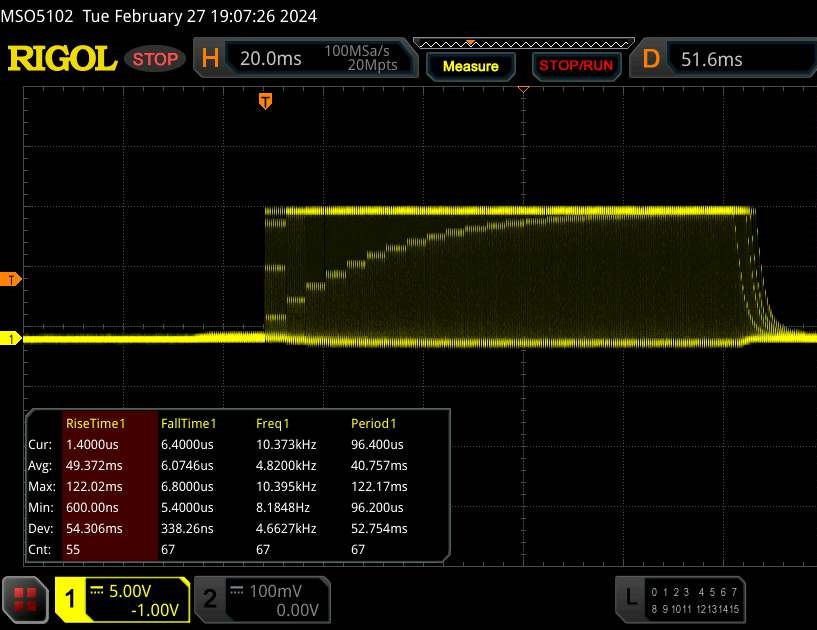 |
| ↘ 2.4 ms fall | ||
| The screen shows good response rates in our tests, but may be too slow for competitive gamers. In comparison, all tested devices range from 0.1 (minimum) to 240 (maximum) ms. » 40 % of all devices are better. This means that the measured response time is better than the average of all tested devices (19.8 ms). | ||
| ↔ Response Time 50% Grey to 80% Grey | ||
| 8 ms ... rise ↗ and fall ↘ combined | ↗ 4.9 ms rise | 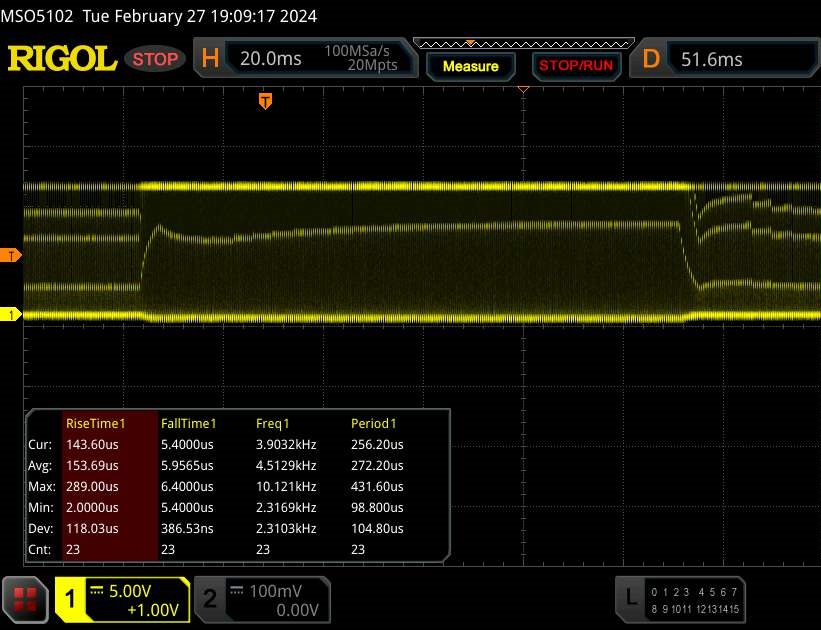 |
| ↘ 3.1 ms fall | ||
| The screen shows fast response rates in our tests and should be suited for gaming. In comparison, all tested devices range from 0.165 (minimum) to 636 (maximum) ms. » 21 % of all devices are better. This means that the measured response time is better than the average of all tested devices (31 ms). | ||
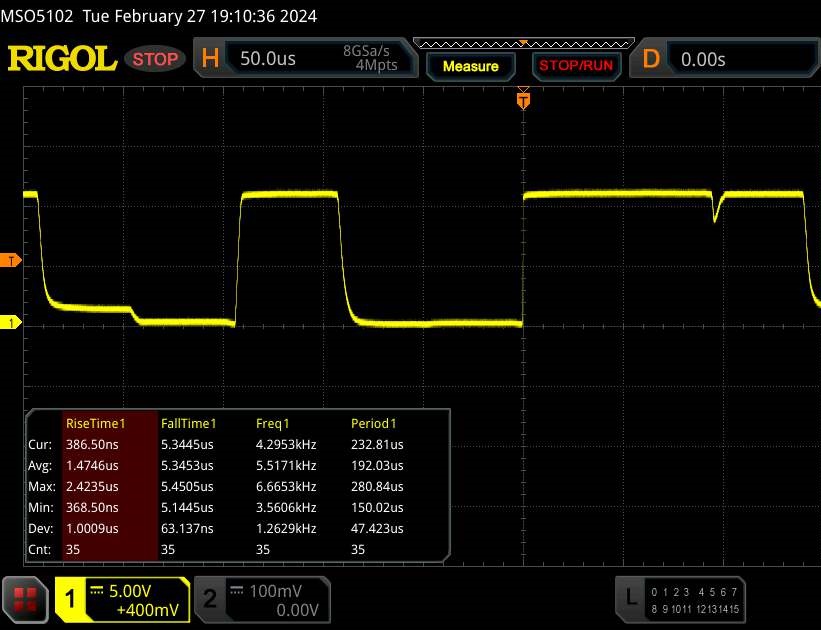
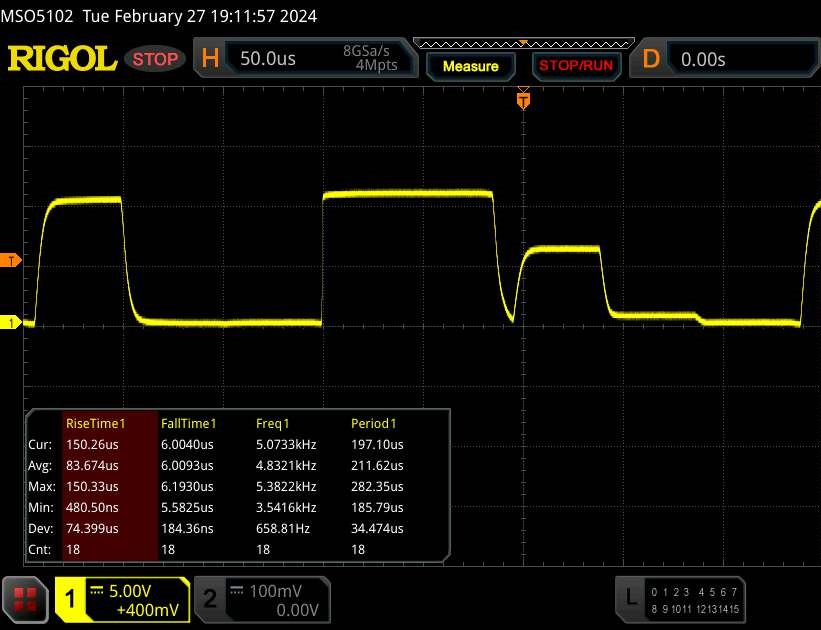
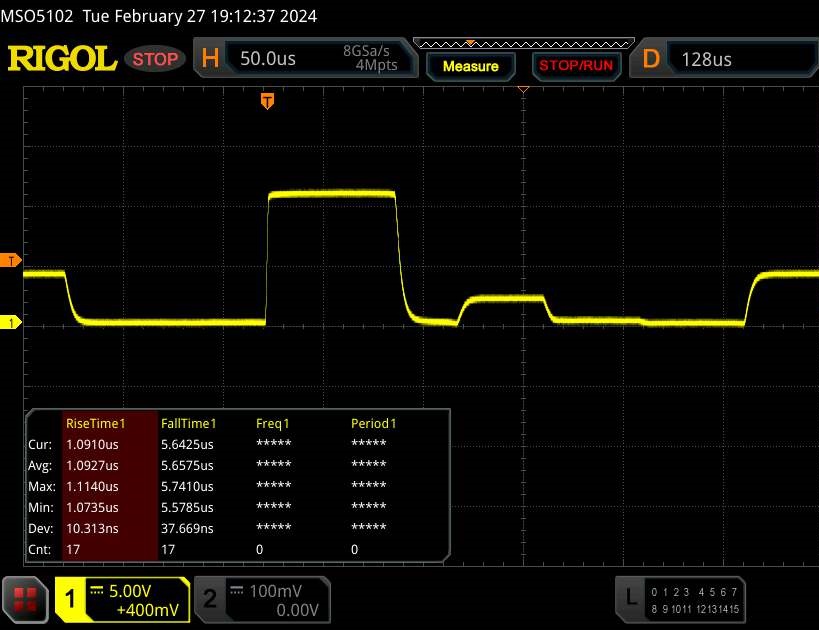
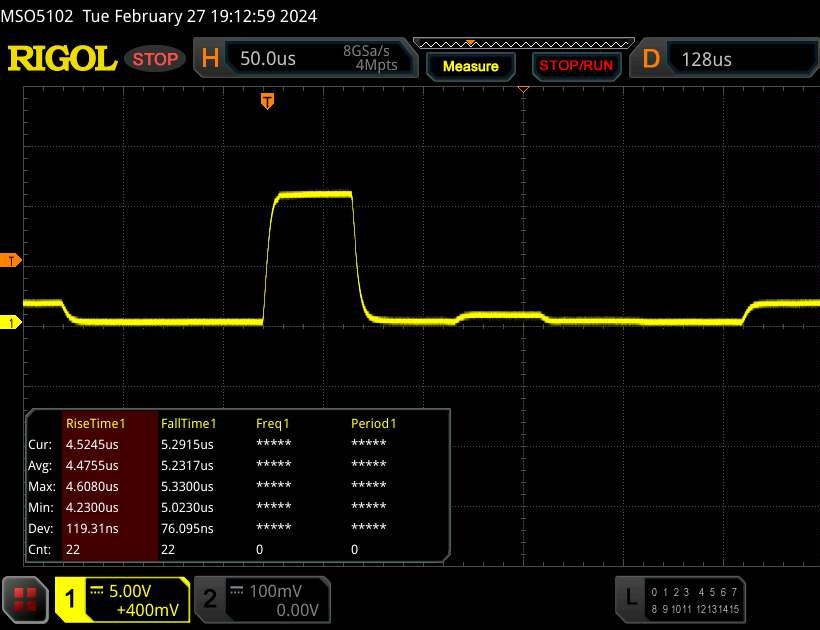
Screen Flickering / PWM (Pulse-Width Modulation)
| Screen flickering / PWM detected | 4832 Hz | ≤ 100 % brightness setting | 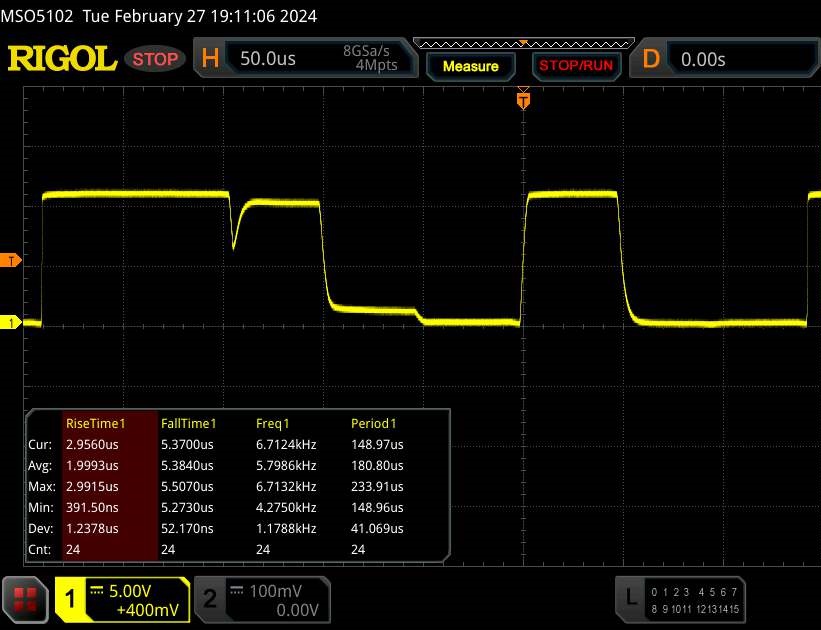 |
The display backlight flickers at 4832 Hz (worst case, e.g., utilizing PWM) Flickering detected at a brightness setting of 100 % and below. There should be no flickering or PWM above this brightness setting. The frequency of 4832 Hz is quite high, so most users sensitive to PWM should not notice any flickering. In comparison: 52 % of all tested devices do not use PWM to dim the display. If PWM was detected, an average of 7763 (minimum: 5 - maximum: 343500) Hz was measured. | |||

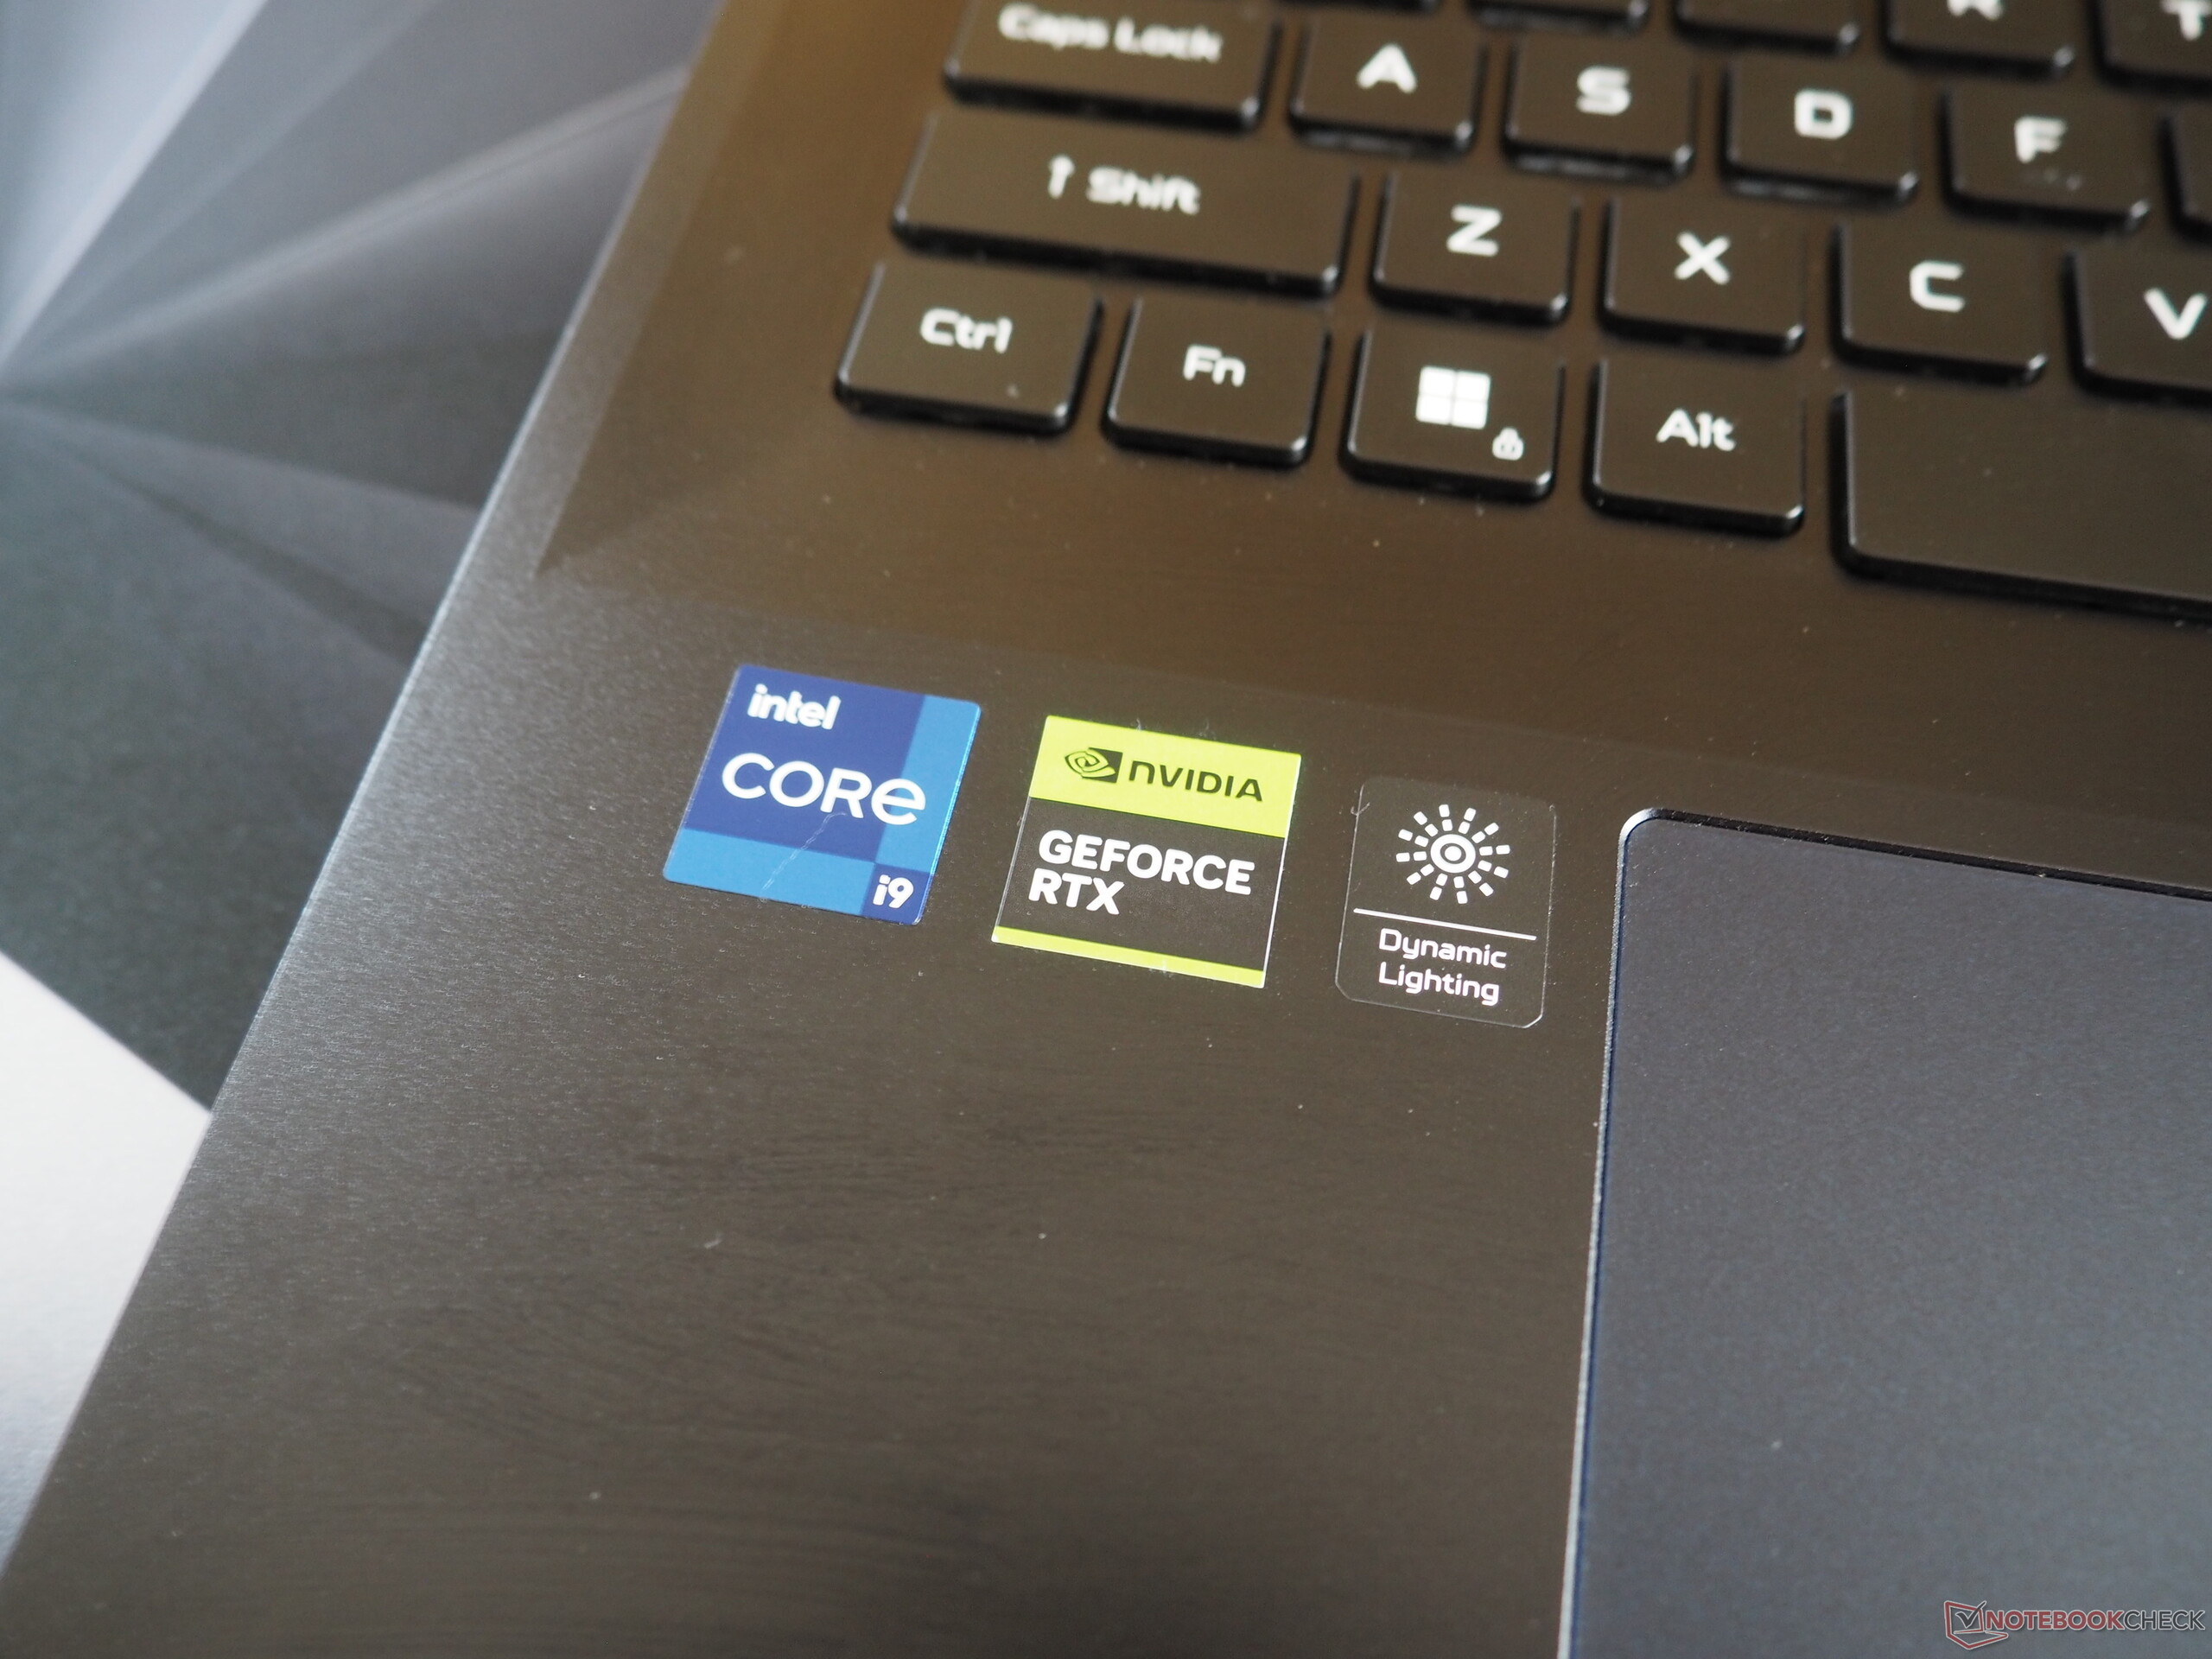
Performance
The Predator Helios 18's components are top-of-the-range models when it comes to gaming laptops. 32 GB RAM and 2 TB of storage should be sufficient for most users in the coming years. The same can be said for its CPU and GPU power, neither of which have yet reached their limits due to the laptop's moderate display resolution of 2,560 x 1,600 pixels.
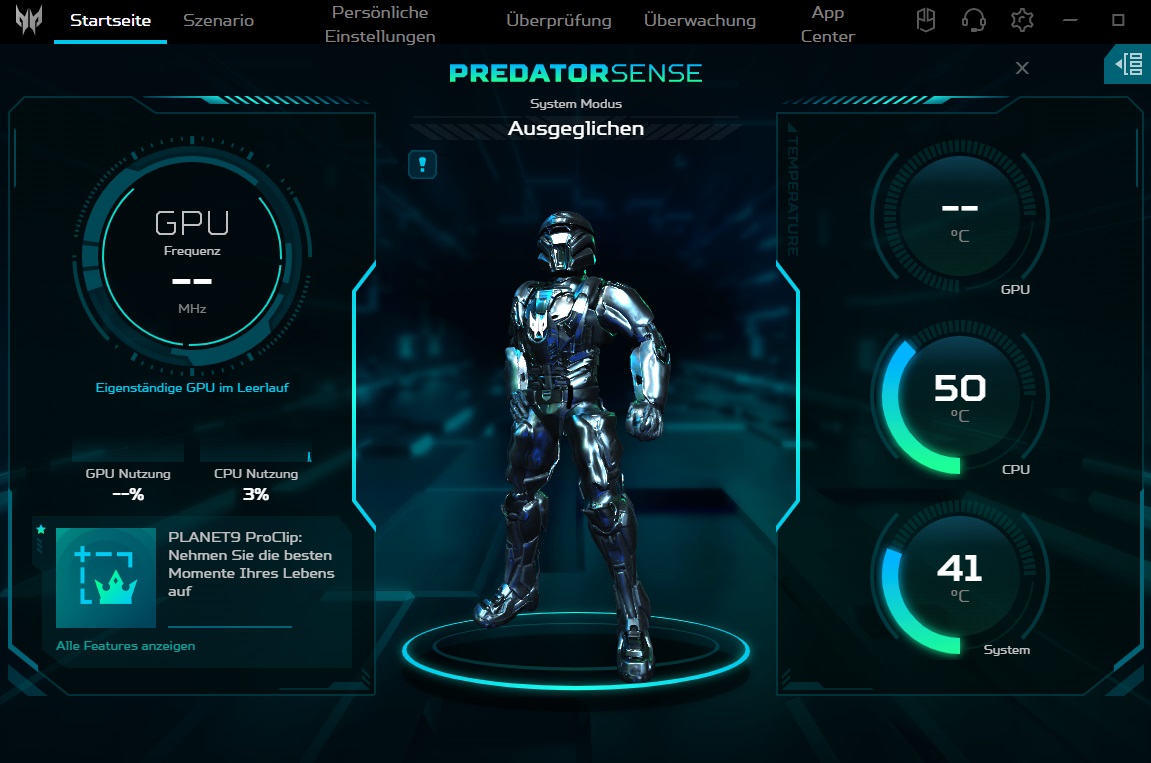
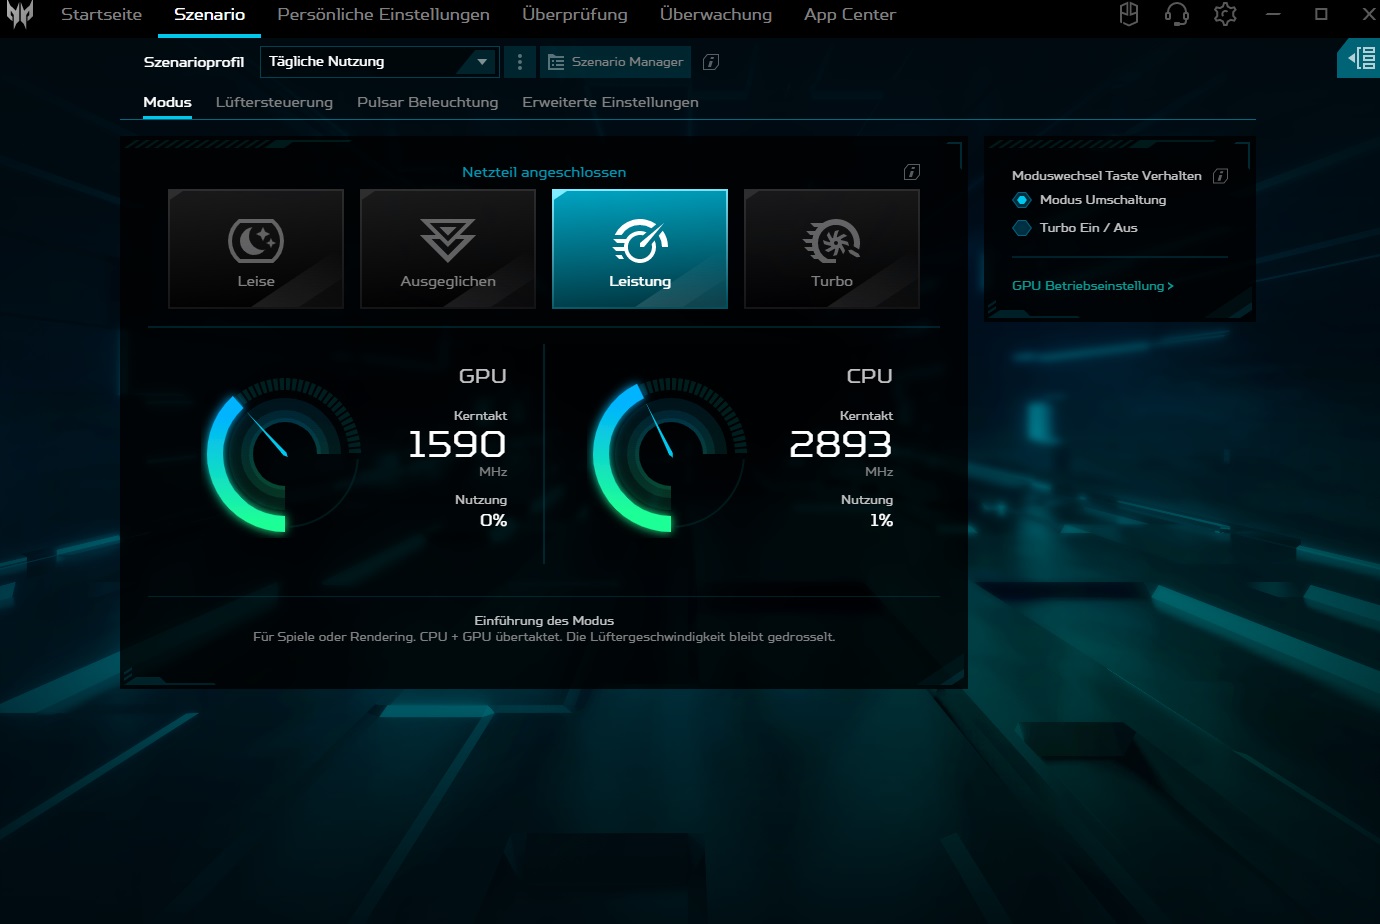
Testing conditions
Within the pre-installed manufacturer software (Predator Sense), there are several operating modes listed under Scenario, which have a major influence on performance and noise emissions. As the 18-inch laptop is extremely loud in turbo mode (>60 dB when gaming), all measurements were carried out in performance mode. The determined speed and emission values are therefore only comparable with its predecessor to a limited extent.
| Witcher 3 (FHD/Ultra) | Quiet | Balanced | Performance | Turbo |
| Noise | 38 dB(A) | 43 dB(A) | 49 dB(A) | 61 dB(A) |
| Performance | 130 fps | 160 fps | 180 fps | 200 fps |
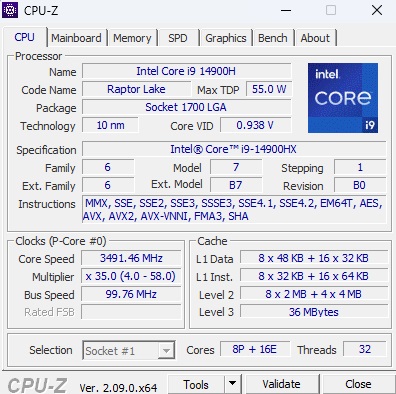
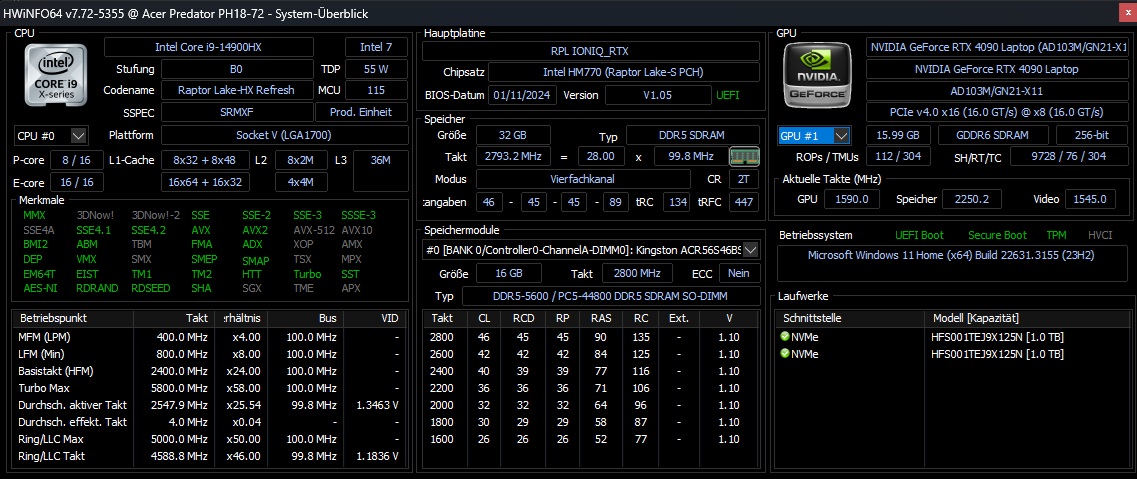
Processor
The Core i9-14900HX is a top-of-the-range model from Intel's Raptor Lake series and although it has a high consumption, it delivers great performance. Intel makes use of 8 performance cores with hyper threading and 16 efficiency cores without HT, resulting in 32 parallel threads. In performance mode, the CPU achieved slightly below-average results (-6 % compared to the previous average). Moreover, its performance drops during longer periods of load, as our Cinebench loop revealed (see graph). This wasn't the case with any of the competitor devices.
Cinebench R15 Multi continuous test
* ... smaller is better
AIDA64: FP32 Ray-Trace | FPU Julia | CPU SHA3 | CPU Queen | FPU SinJulia | FPU Mandel | CPU AES | CPU ZLib | FP64 Ray-Trace | CPU PhotoWorxx
| Performance rating | |
| Alienware m18 R1 AMD | |
| Acer Predator Helios 18 N23Q2 | |
| MSI Titan 18 HX A14VIG | |
| Asus ROG Strix Scar 18 G834JYR (2024) | |
| Average Intel Core i9-14900HX | |
| Average of class Gaming | |
| Acer Predator Helios 18 PH18-72-98MW | |
| AIDA64 / FP32 Ray-Trace | |
| Alienware m18 R1 AMD | |
| Average of class Gaming (10227 - 85542, n=107, last 2 years) | |
| MSI Titan 18 HX A14VIG | |
| Acer Predator Helios 18 N23Q2 | |
| Asus ROG Strix Scar 18 G834JYR (2024) | |
| Average Intel Core i9-14900HX (13098 - 33474, n=36) | |
| Acer Predator Helios 18 PH18-72-98MW | |
| AIDA64 / FPU Julia | |
| Alienware m18 R1 AMD | |
| MSI Titan 18 HX A14VIG | |
| Acer Predator Helios 18 N23Q2 | |
| Average of class Gaming (51376 - 238426, n=107, last 2 years) | |
| Asus ROG Strix Scar 18 G834JYR (2024) | |
| Average Intel Core i9-14900HX (67573 - 166040, n=36) | |
| Acer Predator Helios 18 PH18-72-98MW | |
| AIDA64 / CPU SHA3 | |
| Alienware m18 R1 AMD | |
| MSI Titan 18 HX A14VIG | |
| Acer Predator Helios 18 N23Q2 | |
| Asus ROG Strix Scar 18 G834JYR (2024) | |
| Average of class Gaming (2180 - 9817, n=107, last 2 years) | |
| Average Intel Core i9-14900HX (3589 - 7979, n=36) | |
| Acer Predator Helios 18 PH18-72-98MW | |
| AIDA64 / CPU Queen | |
| Alienware m18 R1 AMD | |
| MSI Titan 18 HX A14VIG | |
| Asus ROG Strix Scar 18 G834JYR (2024) | |
| Acer Predator Helios 18 PH18-72-98MW | |
| Average Intel Core i9-14900HX (118405 - 148966, n=36) | |
| Acer Predator Helios 18 N23Q2 | |
| Average of class Gaming (49785 - 173351, n=94, last 2 years) | |
| AIDA64 / FPU SinJulia | |
| Alienware m18 R1 AMD | |
| MSI Titan 18 HX A14VIG | |
| Asus ROG Strix Scar 18 G834JYR (2024) | |
| Acer Predator Helios 18 N23Q2 | |
| Average Intel Core i9-14900HX (10475 - 18517, n=36) | |
| Acer Predator Helios 18 PH18-72-98MW | |
| Average of class Gaming (4424 - 33636, n=107, last 2 years) | |
| AIDA64 / FPU Mandel | |
| Alienware m18 R1 AMD | |
| MSI Titan 18 HX A14VIG | |
| Average of class Gaming (25115 - 128721, n=107, last 2 years) | |
| Acer Predator Helios 18 N23Q2 | |
| Asus ROG Strix Scar 18 G834JYR (2024) | |
| Average Intel Core i9-14900HX (32543 - 83662, n=36) | |
| Acer Predator Helios 18 PH18-72-98MW | |
| AIDA64 / CPU AES | |
| Acer Predator Helios 18 N23Q2 | |
| Alienware m18 R1 AMD | |
| Average Intel Core i9-14900HX (86964 - 241777, n=36) | |
| MSI Titan 18 HX A14VIG | |
| Asus ROG Strix Scar 18 G834JYR (2024) | |
| Acer Predator Helios 18 PH18-72-98MW | |
| Average of class Gaming (39258 - 247074, n=107, last 2 years) | |
| AIDA64 / CPU ZLib | |
| Alienware m18 R1 AMD | |
| MSI Titan 18 HX A14VIG | |
| Acer Predator Helios 18 N23Q2 | |
| Average Intel Core i9-14900HX (1054 - 2292, n=36) | |
| Asus ROG Strix Scar 18 G834JYR (2024) | |
| Acer Predator Helios 18 PH18-72-98MW | |
| Average of class Gaming (574 - 2531, n=107, last 2 years) | |
| AIDA64 / FP64 Ray-Trace | |
| Alienware m18 R1 AMD | |
| Average of class Gaming (5509 - 45446, n=107, last 2 years) | |
| MSI Titan 18 HX A14VIG | |
| Acer Predator Helios 18 N23Q2 | |
| Asus ROG Strix Scar 18 G834JYR (2024) | |
| Average Intel Core i9-14900HX (6809 - 18349, n=36) | |
| Acer Predator Helios 18 PH18-72-98MW | |
| AIDA64 / CPU PhotoWorxx | |
| Acer Predator Helios 18 N23Q2 | |
| Asus ROG Strix Scar 18 G834JYR (2024) | |
| Acer Predator Helios 18 PH18-72-98MW | |
| Average Intel Core i9-14900HX (23903 - 54702, n=36) | |
| Average of class Gaming (12271 - 89891, n=107, last 2 years) | |
| Alienware m18 R1 AMD | |
| MSI Titan 18 HX A14VIG | |
System performance
Its system performance also wasn't quite enough for first place. Its total PCMark 10 score is comparable to its predecessor's. The device's RAM delivers typical performance levels for DDR5-5600 RAM.
CrossMark: Overall | Productivity | Creativity | Responsiveness
WebXPRT 3: Overall
WebXPRT 4: Overall
Mozilla Kraken 1.1: Total
| PCMark 10 / Score | |
| Alienware m18 R1 AMD | |
| MSI Titan 18 HX A14VIG | |
| Asus ROG Strix Scar 18 G834JYR (2024) | |
| Average Intel Core i9-14900HX, NVIDIA GeForce RTX 4090 Laptop GPU (8230 - 9234, n=13) | |
| Acer Predator Helios 18 N23Q2 | |
| Average of class Gaming (5828 - 11574, n=95, last 2 years) | |
| Acer Predator Helios 18 PH18-72-98MW | |
| PCMark 10 / Essentials | |
| Alienware m18 R1 AMD | |
| MSI Titan 18 HX A14VIG | |
| Asus ROG Strix Scar 18 G834JYR (2024) | |
| Average Intel Core i9-14900HX, NVIDIA GeForce RTX 4090 Laptop GPU (10778 - 11628, n=13) | |
| Acer Predator Helios 18 PH18-72-98MW | |
| Acer Predator Helios 18 N23Q2 | |
| Average of class Gaming (8810 - 12600, n=99, last 2 years) | |
| PCMark 10 / Productivity | |
| Alienware m18 R1 AMD | |
| Average of class Gaming (6845 - 21327, n=97, last 2 years) | |
| Average Intel Core i9-14900HX, NVIDIA GeForce RTX 4090 Laptop GPU (9458 - 11759, n=13) | |
| Asus ROG Strix Scar 18 G834JYR (2024) | |
| Acer Predator Helios 18 N23Q2 | |
| MSI Titan 18 HX A14VIG | |
| Acer Predator Helios 18 PH18-72-98MW | |
| PCMark 10 / Digital Content Creation | |
| Alienware m18 R1 AMD | |
| MSI Titan 18 HX A14VIG | |
| Asus ROG Strix Scar 18 G834JYR (2024) | |
| Average Intel Core i9-14900HX, NVIDIA GeForce RTX 4090 Laptop GPU (13219 - 16462, n=13) | |
| Acer Predator Helios 18 N23Q2 | |
| Average of class Gaming (7602 - 19657, n=97, last 2 years) | |
| Acer Predator Helios 18 PH18-72-98MW | |
| CrossMark / Overall | |
| Asus ROG Strix Scar 18 G834JYR (2024) | |
| Acer Predator Helios 18 N23Q2 | |
| Average Intel Core i9-14900HX, NVIDIA GeForce RTX 4090 Laptop GPU (1877 - 2344, n=10) | |
| Average of class Gaming (1366 - 2409, n=96, last 2 years) | |
| Alienware m18 R1 AMD | |
| MSI Titan 18 HX A14VIG | |
| CrossMark / Productivity | |
| Acer Predator Helios 18 N23Q2 | |
| Asus ROG Strix Scar 18 G834JYR (2024) | |
| Average Intel Core i9-14900HX, NVIDIA GeForce RTX 4090 Laptop GPU (1738 - 2162, n=10) | |
| Average of class Gaming (1386 - 2254, n=96, last 2 years) | |
| Alienware m18 R1 AMD | |
| MSI Titan 18 HX A14VIG | |
| CrossMark / Creativity | |
| Asus ROG Strix Scar 18 G834JYR (2024) | |
| Acer Predator Helios 18 N23Q2 | |
| Average Intel Core i9-14900HX, NVIDIA GeForce RTX 4090 Laptop GPU (2195 - 2660, n=10) | |
| Average of class Gaming (1343 - 2729, n=96, last 2 years) | |
| Alienware m18 R1 AMD | |
| MSI Titan 18 HX A14VIG | |
| CrossMark / Responsiveness | |
| Acer Predator Helios 18 N23Q2 | |
| Asus ROG Strix Scar 18 G834JYR (2024) | |
| Average Intel Core i9-14900HX, NVIDIA GeForce RTX 4090 Laptop GPU (1478 - 2327, n=10) | |
| Average of class Gaming (1226 - 2334, n=96, last 2 years) | |
| Alienware m18 R1 AMD | |
| MSI Titan 18 HX A14VIG | |
| WebXPRT 3 / Overall | |
| Alienware m18 R1 AMD | |
| MSI Titan 18 HX A14VIG | |
| Average Intel Core i9-14900HX, NVIDIA GeForce RTX 4090 Laptop GPU (279 - 339, n=10) | |
| Asus ROG Strix Scar 18 G834JYR (2024) | |
| Acer Predator Helios 18 N23Q2 | |
| Average of class Gaming (220 - 532, n=100, last 2 years) | |
| WebXPRT 4 / Overall | |
| Asus ROG Strix Scar 18 G834JYR (2024) | |
| Alienware m18 R1 AMD | |
| Average Intel Core i9-14900HX, NVIDIA GeForce RTX 4090 Laptop GPU (246 - 309, n=8) | |
| MSI Titan 18 HX A14VIG | |
| Average of class Gaming (165 - 354, n=101, last 2 years) | |
| Mozilla Kraken 1.1 / Total | |
| Average of class Gaming (391 - 590, n=104, last 2 years) | |
| Alienware m18 R1 AMD | |
| Acer Predator Helios 18 N23Q2 | |
| Average Intel Core i9-14900HX, NVIDIA GeForce RTX 4090 Laptop GPU (428 - 535, n=11) | |
| MSI Titan 18 HX A14VIG | |
| Asus ROG Strix Scar 18 G834JYR (2024) | |
| Acer Predator Helios 18 PH18-72-98MW | |
* ... smaller is better
| PCMark 10 Score | 8230 points | |
Help | ||
| AIDA64 / Memory Copy | |
| Asus ROG Strix Scar 18 G834JYR (2024) | |
| Acer Predator Helios 18 N23Q2 | |
| Acer Predator Helios 18 PH18-72-98MW | |
| Average Intel Core i9-14900HX (38028 - 83392, n=36) | |
| Average of class Gaming (21750 - 129946, n=107, last 2 years) | |
| MSI Titan 18 HX A14VIG | |
| Alienware m18 R1 AMD | |
| AIDA64 / Memory Read | |
| Asus ROG Strix Scar 18 G834JYR (2024) | |
| Acer Predator Helios 18 N23Q2 | |
| Acer Predator Helios 18 PH18-72-98MW | |
| Average Intel Core i9-14900HX (43306 - 87568, n=36) | |
| Average of class Gaming (22956 - 118858, n=107, last 2 years) | |
| Alienware m18 R1 AMD | |
| MSI Titan 18 HX A14VIG | |
| AIDA64 / Memory Write | |
| Asus ROG Strix Scar 18 G834JYR (2024) | |
| Average of class Gaming (22297 - 135096, n=107, last 2 years) | |
| Acer Predator Helios 18 N23Q2 | |
| Average Intel Core i9-14900HX (37146 - 80589, n=36) | |
| Acer Predator Helios 18 PH18-72-98MW | |
| Alienware m18 R1 AMD | |
| MSI Titan 18 HX A14VIG | |
| AIDA64 / Memory Latency | |
| Average of class Gaming (75.3 - 259, n=107, last 2 years) | |
| MSI Titan 18 HX A14VIG | |
| Alienware m18 R1 AMD | |
| Average Intel Core i9-14900HX (76.1 - 105, n=36) | |
| Acer Predator Helios 18 N23Q2 | |
| Acer Predator Helios 18 PH18-72-98MW | |
| Asus ROG Strix Scar 18 G834JYR (2024) | |
* ... smaller is better
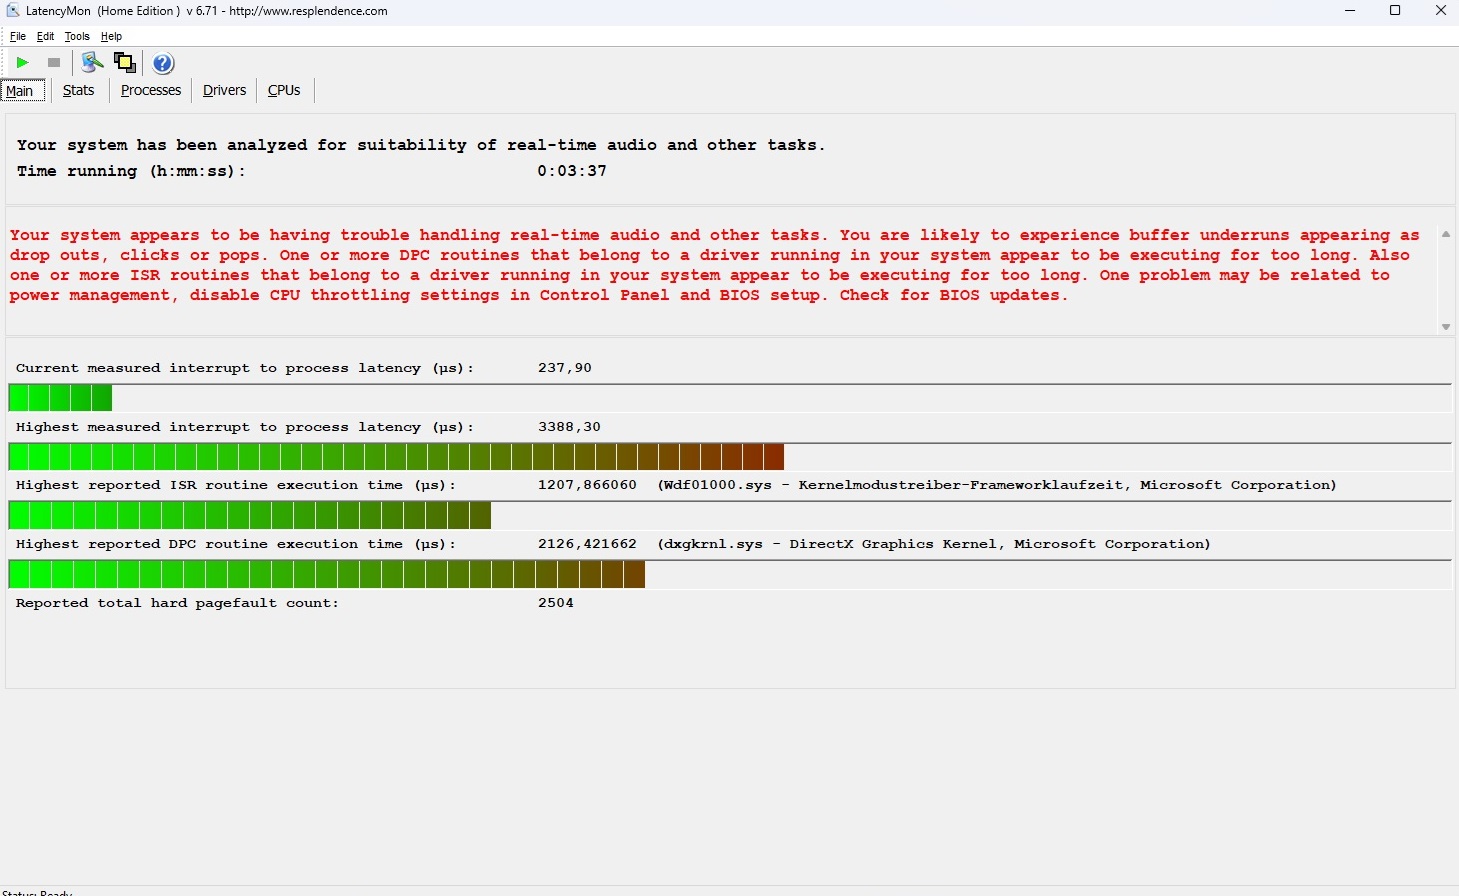
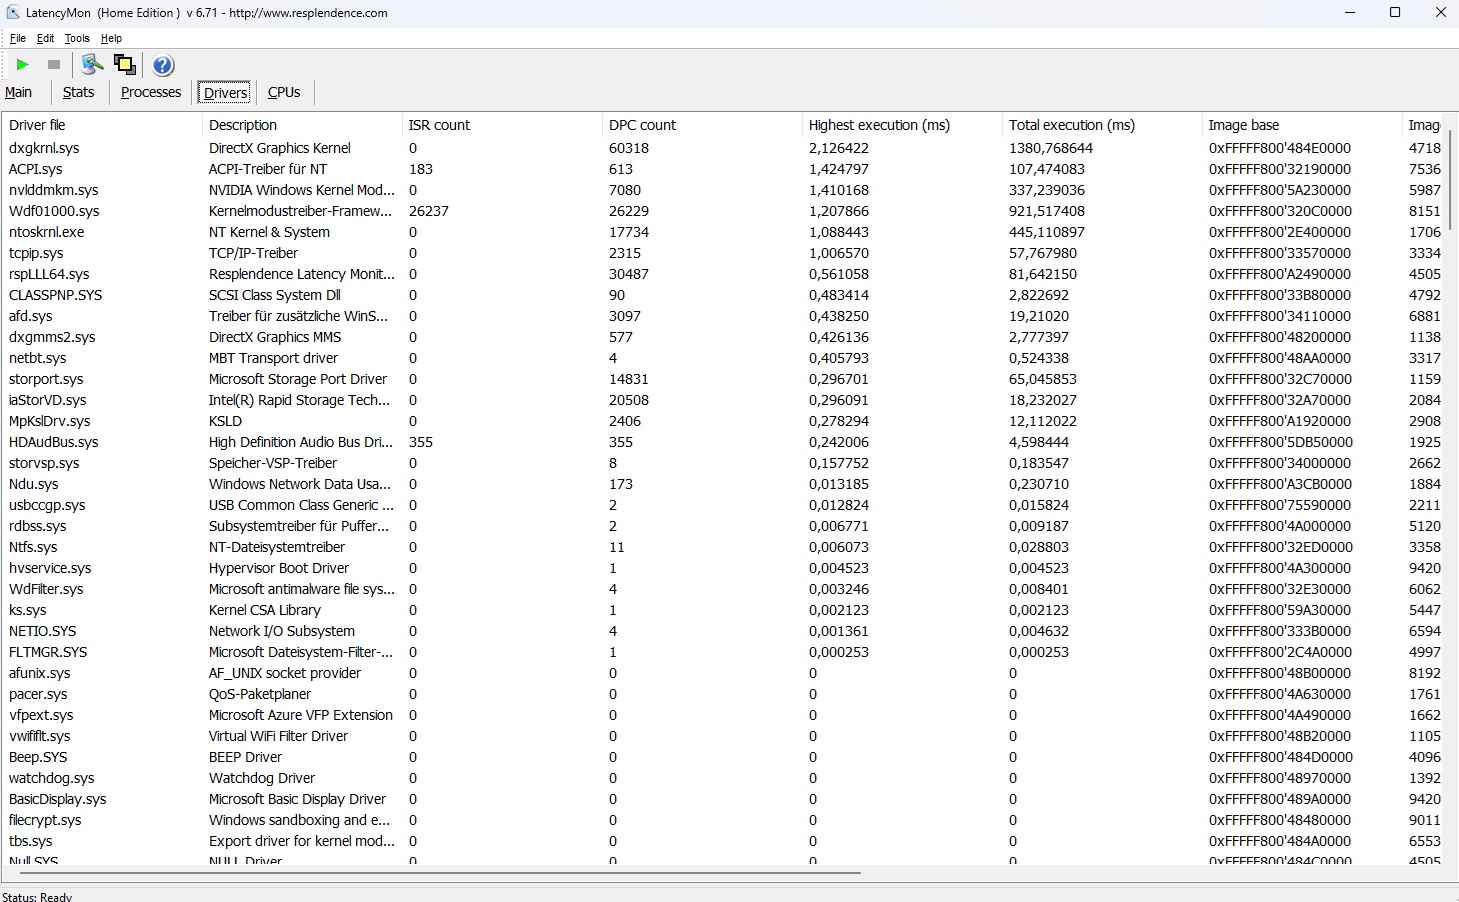
DPC latency
The laptop's latencies may be considerably lower than on the old Helios 18 but according to the tool LatencyMon, they are still too high for certain fields of use (real-time audio and video editing).
| DPC Latencies / LatencyMon - interrupt to process latency (max), Web, Youtube, Prime95 | |
| Acer Predator Helios 18 N23Q2 | |
| Acer Predator Helios 18 PH18-72-98MW | |
| MSI Titan 18 HX A14VIG | |
| Alienware m18 R1 AMD | |
| Asus ROG Strix Scar 18 G834JYR (2024) | |
* ... smaller is better
Storage devices
As mentioned in our introduction, Acer has combined two NVMe SSDs into a Raid 0 array. At first glance, this delivers first-class results when it comes to its sequential read and write rates. However, the laptop's cooling seems to be less than ideal, as we noted some occasional performance fluctuations after a while during our loop test.

* ... smaller is better
Reading continuous performance: DiskSpd Read Loop, Queue Depth 8
Graphics card
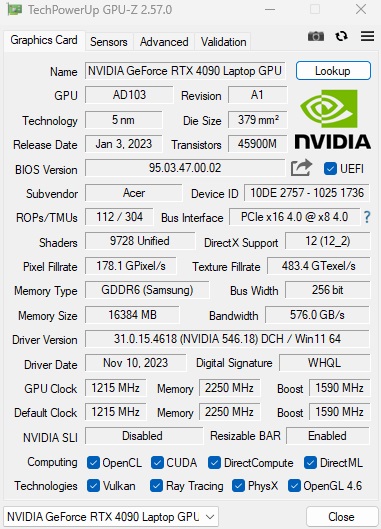
The GeForce RTX 4090—based on Ada Lovelace architecture—is currently Nvidia's most powerful laptop graphics card. Its 9,728 shader units are just as generous as its 16 GB GDDR6 VRAM, especially since Acer has selected the maximum 175 watts as a TGP. Even so, its GPU performance in performance mode falls short of what could be possible. Analogous to the CPU tests, it achieved 6 per cent less compared to the previous average of the RTX 4090.
| 3DMark 11 Performance | 44065 points | |
| 3DMark Cloud Gate Standard Score | 59876 points | |
| 3DMark Fire Strike Score | 33907 points | |
| 3DMark Time Spy Score | 18542 points | |
Help | ||
* ... smaller is better
Gaming performance
The gaming benchmarks paint a similar picture. Here, too, the RTX 4090 wasn't able to make use of its full potential. Nevertheless, this was enough to run all modern games with full details in its native resolution of 2,560 x 1,600 pixels. Things only get difficult when playing extremely demanding or poorly optimized games such as Lords of the Fallen. DLSS can help here, with the latter game running at 72fps instead of 43fps (quality setting) in QHD/Ultra, for example. Oftentimes, the RTX 4090 would also have enough reserves for a 4K screen (see GPU page).
| The Witcher 3 - 1920x1080 Ultra Graphics & Postprocessing (HBAO+) | |
| MSI Titan 18 HX A14VIG | |
| Average NVIDIA GeForce RTX 4090 Laptop GPU (139.2 - 216, n=35) | |
| Asus ROG Strix Scar 18 G834JYR (2024) | |
| Acer Predator Helios 18 PH18-72-98MW | |
| Average of class Gaming (95 - 240, n=7, last 2 years) | |
| Acer Predator Helios 18 N23Q2 | |
| Alienware m18 R1 AMD | |
| Skull & Bones - 2560x1440 Ultra High Preset AA:T | |
| Average NVIDIA GeForce RTX 4090 Laptop GPU (85 - 98, n=3) | |
| Asus ROG Zephyrus M16 | |
| Acer Predator Helios 18 PH18-72-98MW | |
| Prince of Persia The Lost Crown - 2560x1440 Ultra Preset AA:SM | |
| Asus ROG Zephyrus M16 | |
| Average NVIDIA GeForce RTX 4090 Laptop GPU (355 - 356, n=2) | |
| Acer Predator Helios 18 PH18-72-98MW | |
| Average of class Gaming (352 - 357, n=4, last 2 years) | |
| Lords of the Fallen - 2560x1440 Ultra Preset | |
| XMG Neo 17 E23 | |
| Average NVIDIA GeForce RTX 4090 Laptop GPU (43 - 51.9, n=2) | |
| Acer Predator Helios 18 PH18-72-98MW | |
| Counter-Strike 2 - 2560x1440 Very High Preset | |
| XMG Neo 17 E23 | |
| Average NVIDIA GeForce RTX 4090 Laptop GPU (156.6 - 188.7, n=2) | |
| Acer Predator Helios 18 PH18-72-98MW | |
| Average of class Gaming (15.7 - 224, n=5, last 2 years) | |
| Lies of P - 2560x1440 Best Preset | |
| XMG Neo 17 E23 | |
| Average NVIDIA GeForce RTX 4090 Laptop GPU (136.4 - 173.1, n=2) | |
| Acer Predator Helios 18 PH18-72-98MW | |
| EA Sports WRC - 2560x1440 Ultra Preset AA:Epic AF:16x | |
| XMG Neo 17 E23 | |
| Average NVIDIA GeForce RTX 4090 Laptop GPU (97.9 - 103, n=2) | |
| Acer Predator Helios 18 PH18-72-98MW | |
| Armored Core 6 - 2560x1440 Maximum Preset | |
| XMG Neo 17 E23 | |
| Average NVIDIA GeForce RTX 4090 Laptop GPU (92 - 114.7, n=2) | |
| Acer Predator Helios 18 PH18-72-98MW | |
| Average of class Gaming (n=1last 2 years) | |
| Atlas Fallen - 2560x1440 Very High Preset | |
| XMG Neo 17 E23 | |
| Average NVIDIA GeForce RTX 4090 Laptop GPU (128.3 - 171.1, n=2) | |
| Acer Predator Helios 18 PH18-72-98MW | |
In order to test how the GPU's performance behaves over a longer period of time, we put the Helios 18 up against the role-playing game The Witcher 3 for around 60 minutes. The result: We noted absolutely no drops in frame rate.
Witcher 3 FPS diagram
| low | med. | high | ultra | QHD | |
|---|---|---|---|---|---|
| GTA V (2015) | 180.4 | 134 | 126.4 | ||
| The Witcher 3 (2015) | 180 | ||||
| Dota 2 Reborn (2015) | 226 | 205 | 192.8 | 178.3 | |
| Final Fantasy XV Benchmark (2018) | 157.1 | 131.9 | |||
| X-Plane 11.11 (2018) | 183.7 | 148.3 | 114.5 | ||
| Far Cry 5 (2018) | 146 | 123 | 115 | ||
| Strange Brigade (2018) | 329 | 305 | 243 | ||
| Atlas Fallen (2023) | 182 | 161 | 128.3 | ||
| Armored Core 6 (2023) | 109.3 | 103.5 | 92 | ||
| The Crew Motorfest (2023) | 60 | 60 | 60 | ||
| Lies of P (2023) | 208 | 187 | 136.4 | ||
| Counter-Strike 2 (2023) | 234 | 189.7 | 156.6 | ||
| Lords of the Fallen (2023) | 87.3 | 64.2 | 43 | ||
| EA Sports WRC (2023) | 135.2 | 115.1 | 97.9 | ||
| Prince of Persia The Lost Crown (2024) | 357 | 356 | 355 | ||
| Skull & Bones (2024) | 133 | 106 | 85 | ||
| Last Epoch (2024) | 203 | 190 | 145.5 |
Emissions
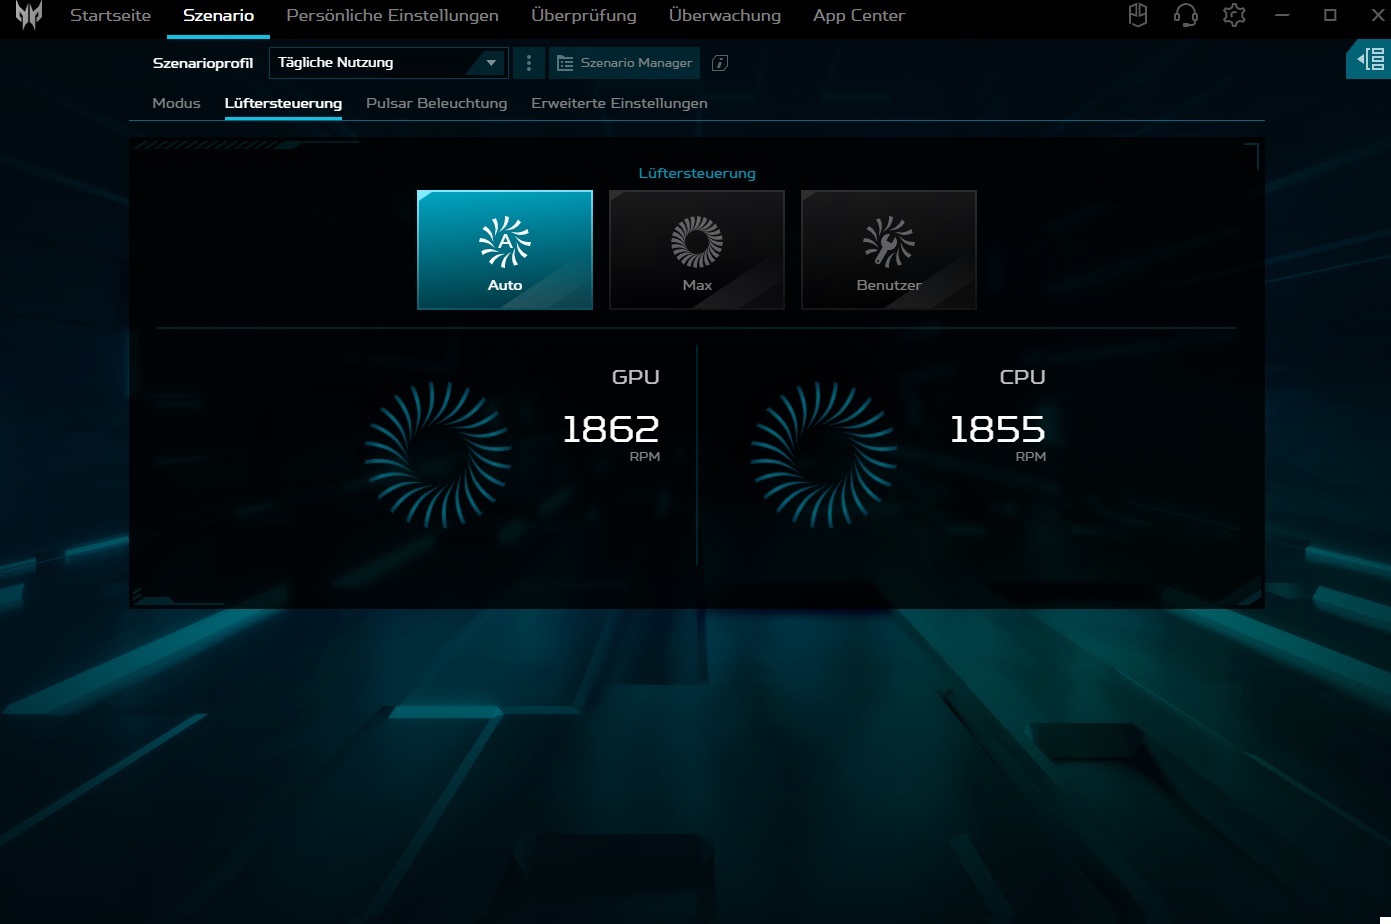
Noise emissions
One of the Predator Helios 18's biggest weaknesses is its meagre fan control. In balanced mode, the fans sometimes start spinning unnecessarily when the laptop is idling. In performance and turbo mode, this behavior happens even more frequently and intensively. Under load, the 18-inch device doesn't behave out of the ordinary. In 3D use, performance mode results in audible but not exaggerated values of 48 to 51 dB(A).
Noise level
| Idle |
| 30 / 36 / 44 dB(A) |
| Load |
| 48 / 51 dB(A) |
 | ||
30 dB silent 40 dB(A) audible 50 dB(A) loud |
||
min: | ||
| Acer Predator Helios 18 PH18-72-98MW i9-14900HX, GeForce RTX 4090 Laptop GPU | MSI Titan 18 HX A14VIG i9-14900HX, GeForce RTX 4090 Laptop GPU | Asus ROG Strix Scar 18 G834JYR (2024) i9-14900HX, GeForce RTX 4090 Laptop GPU | Acer Predator Helios 18 N23Q2 i9-13900HX, GeForce RTX 4080 Laptop GPU | Alienware m18 R1 AMD R9 7945HX, Radeon RX 7900M | |
|---|---|---|---|---|---|
| Noise | 12% | 8% | 12% | 15% | |
| off / environment * (dB) | 25 | 22.8 9% | 24 4% | 23 8% | 22.4 10% |
| Idle Minimum * (dB) | 30 | 23.8 21% | 27 10% | 23 23% | 23 23% |
| Idle Average * (dB) | 36 | 23.8 34% | 28 22% | 23 36% | 23.4 35% |
| Idle Maximum * (dB) | 44 | 28 36% | 32 27% | 23 48% | 33.5 24% |
| Load Average * (dB) | 48 | 38 21% | 50 -4% | 45.26 6% | 33.5 30% |
| Witcher 3 ultra * (dB) | 49 | 57.3 -17% | 50 -2% | 59.82 -22% | 53.6 -9% |
| Load Maximum * (dB) | 51 | 62.8 -23% | 52 -2% | 59.94 -18% | 53.6 -5% |
* ... smaller is better
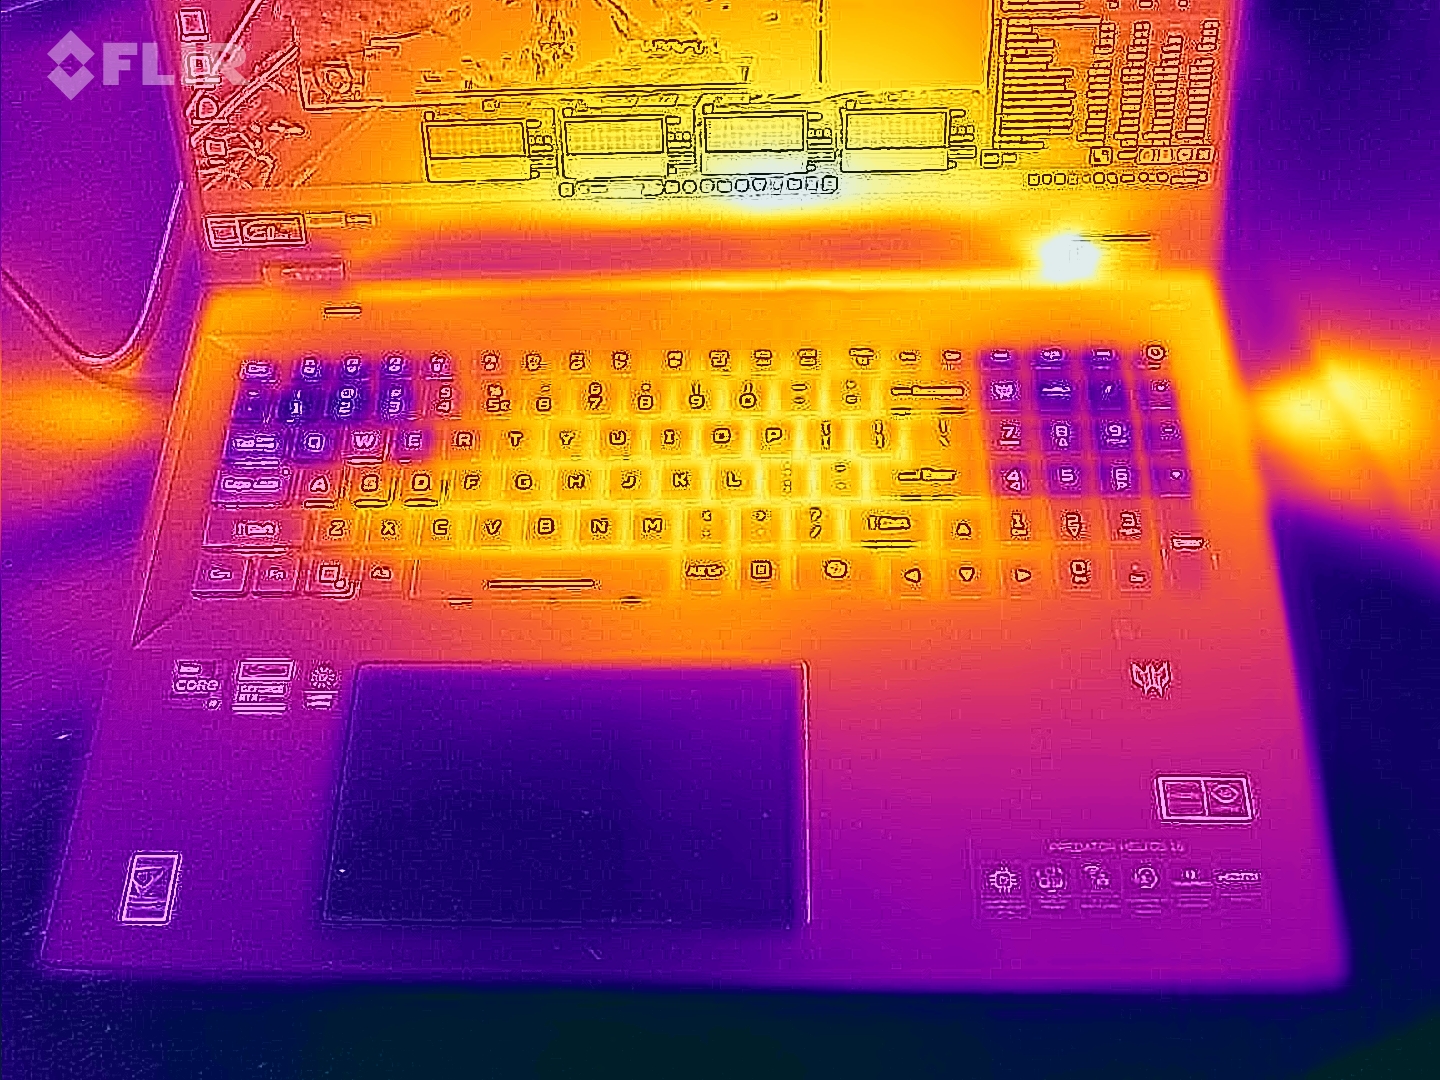
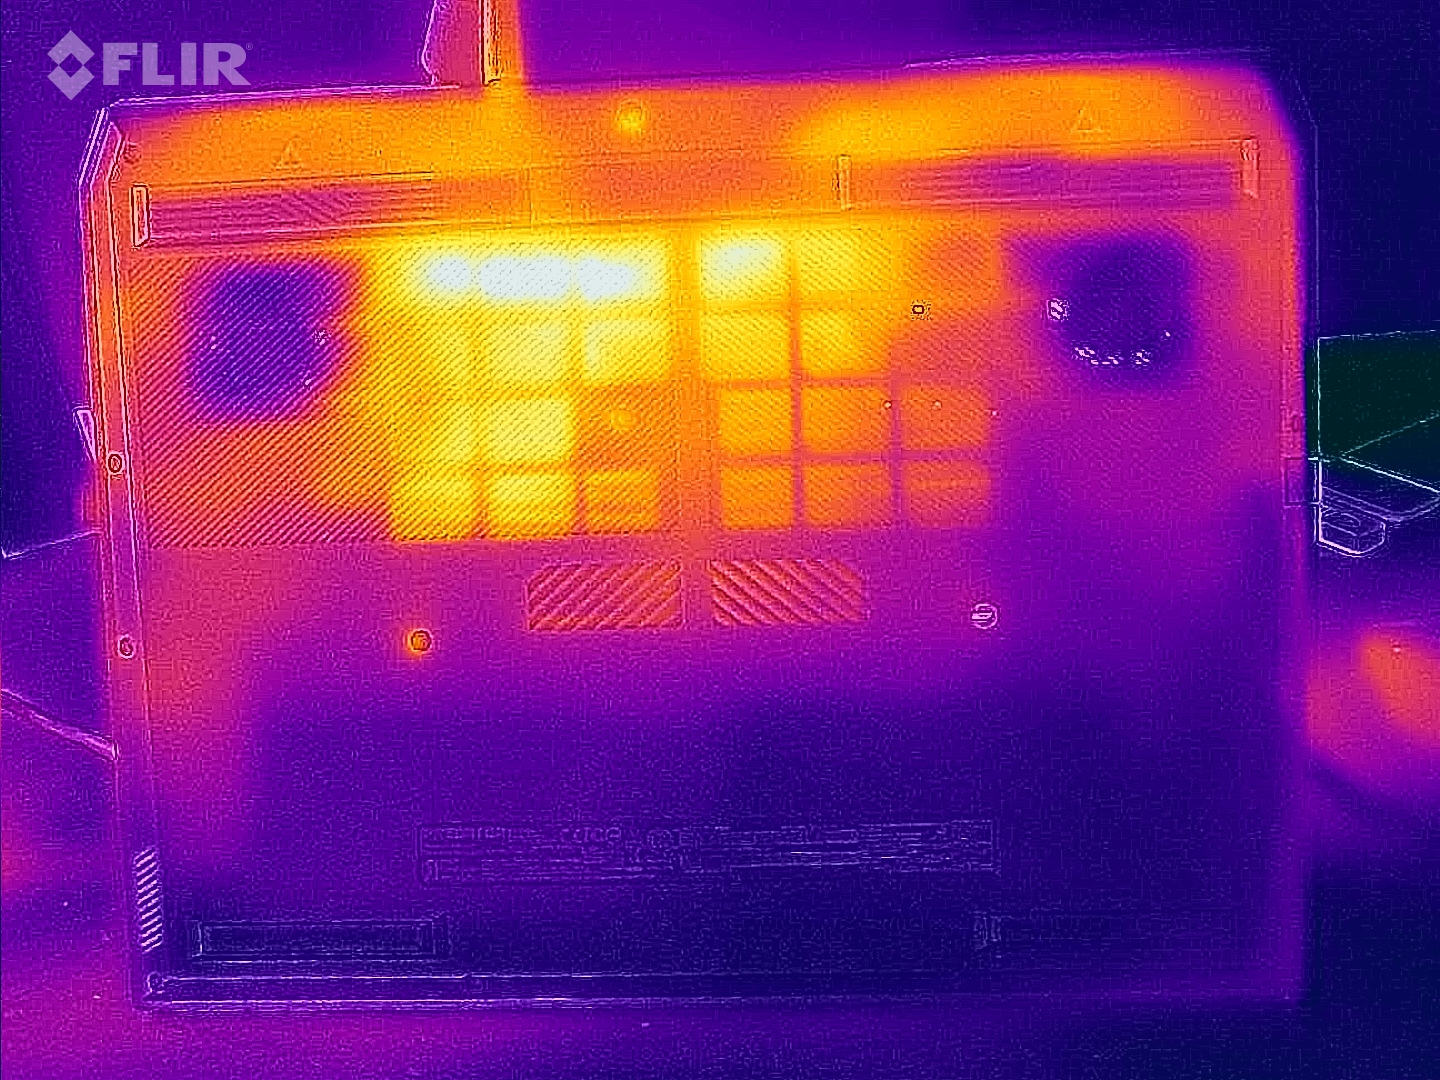
Temperature
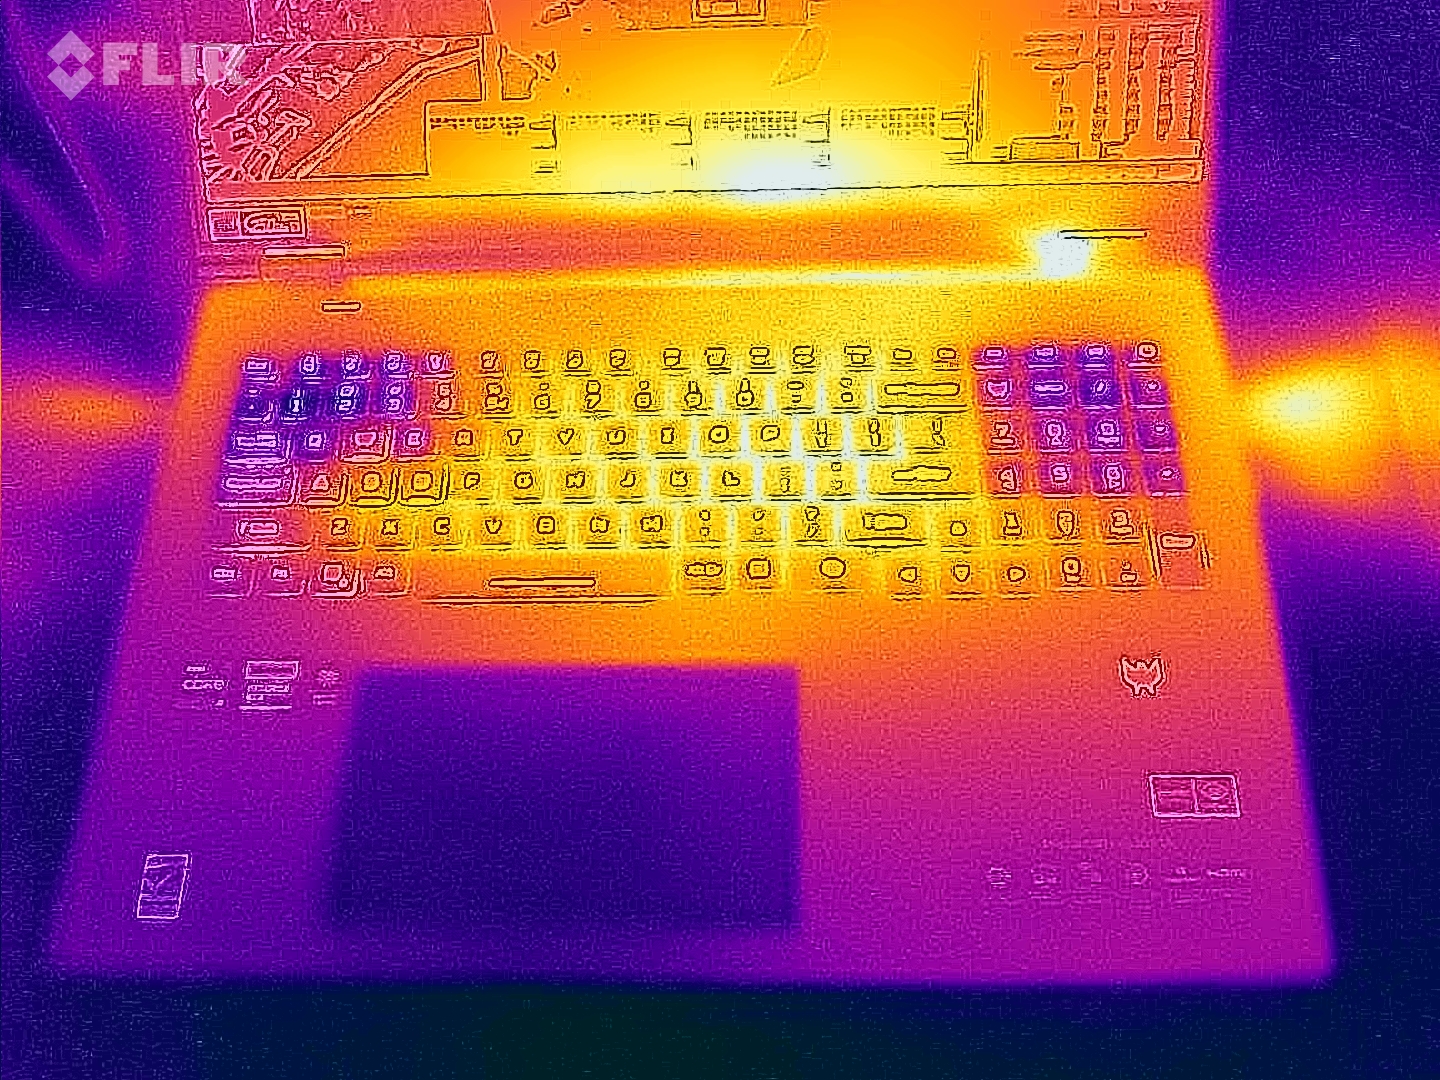
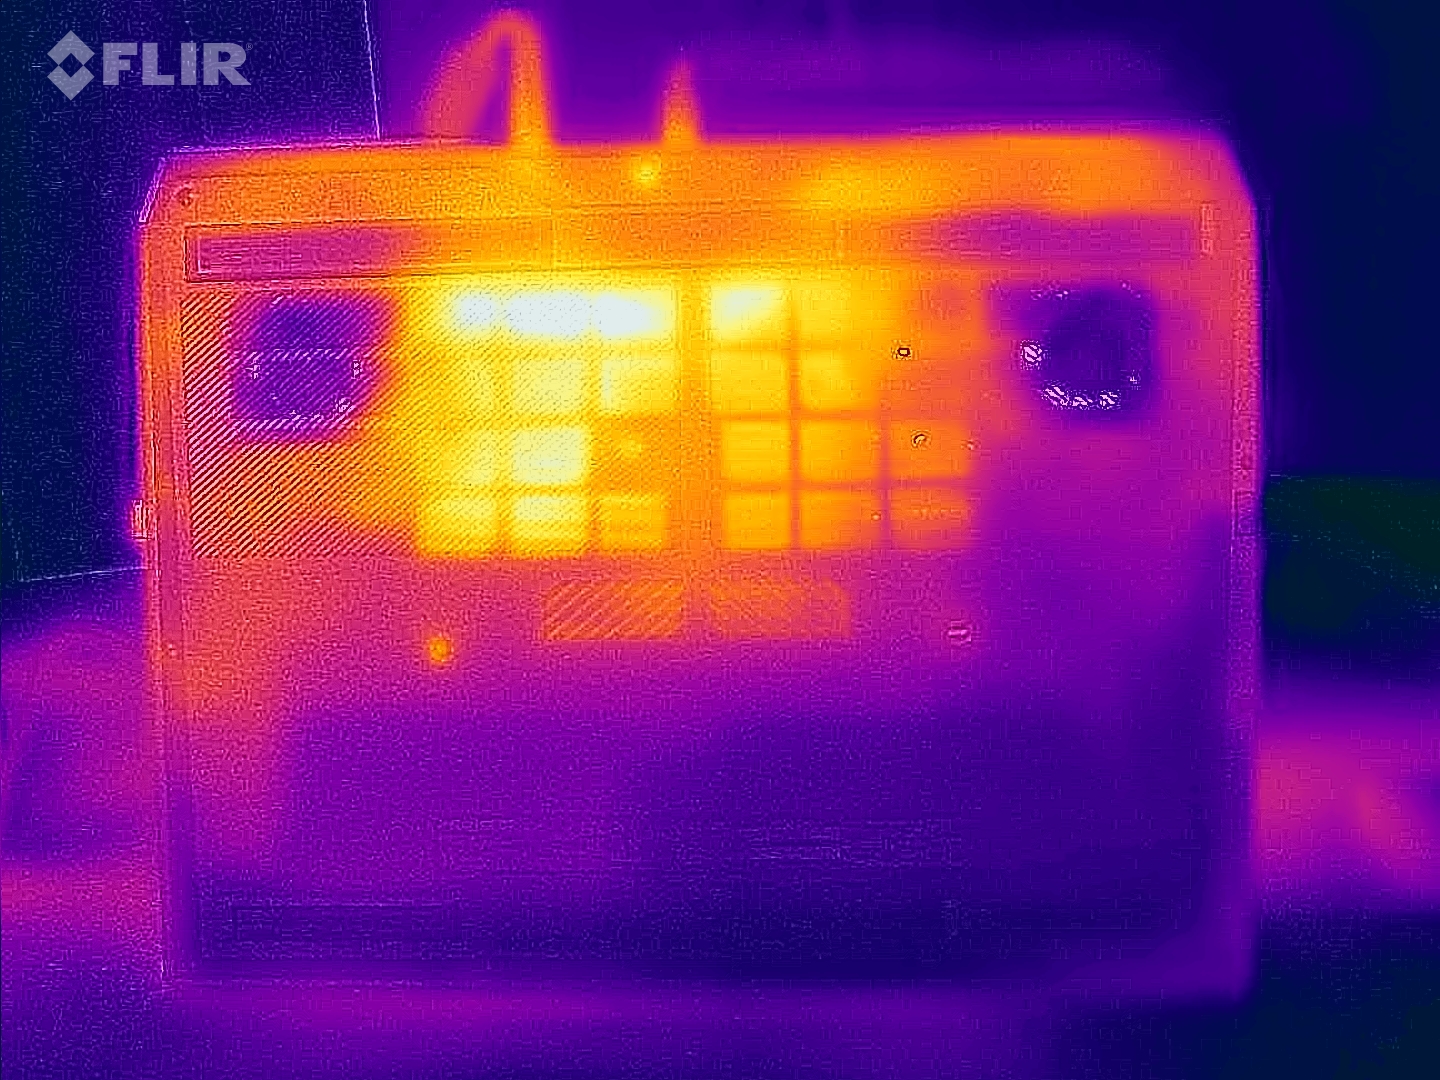
The bottom of the laptop's case surface heats up the most. After 60 minutes of our stress test, we measured over 50 °C on certain parts, which means you won't be able to game with the device sitting on your lap. The top remains a lot cooler, with values reaching up to 43 °C. When idle, the values are pretty moderate—we noted an average of 29 C° (top) and 30 °C (bottom), which is absolutely fine.
(±) The maximum temperature on the upper side is 43 °C / 109 F, compared to the average of 40.4 °C / 105 F, ranging from 21.2 to 68.8 °C for the class Gaming.
(-) The bottom heats up to a maximum of 59 °C / 138 F, compared to the average of 43.2 °C / 110 F
(+) In idle usage, the average temperature for the upper side is 29.2 °C / 85 F, compared to the device average of 33.9 °C / 93 F.
(-) Playing The Witcher 3, the average temperature for the upper side is 38.9 °C / 102 F, compared to the device average of 33.9 °C / 93 F.
(+) The palmrests and touchpad are reaching skin temperature as a maximum (33 °C / 91.4 F) and are therefore not hot.
(-) The average temperature of the palmrest area of similar devices was 28.8 °C / 83.8 F (-4.2 °C / -7.6 F).
| Acer Predator Helios 18 PH18-72-98MW i9-14900HX, GeForce RTX 4090 Laptop GPU | MSI Titan 18 HX A14VIG i9-14900HX, GeForce RTX 4090 Laptop GPU | Asus ROG Strix Scar 18 G834JYR (2024) i9-14900HX, GeForce RTX 4090 Laptop GPU | Acer Predator Helios 18 N23Q2 i9-13900HX, GeForce RTX 4080 Laptop GPU | Alienware m18 R1 AMD R9 7945HX, Radeon RX 7900M | |
|---|---|---|---|---|---|
| Heat | 8% | 6% | 1% | 14% | |
| Maximum Upper Side * (°C) | 43 | 37.8 12% | 49 -14% | 35 19% | 40.2 7% |
| Maximum Bottom * (°C) | 59 | 37.6 36% | 47 20% | 56 5% | 37.4 37% |
| Idle Upper Side * (°C) | 32 | 34.8 -9% | 29 9% | 34 -6% | 31.6 1% |
| Idle Bottom * (°C) | 34 | 36 -6% | 31 9% | 39 -15% | 30.6 10% |
* ... smaller is better
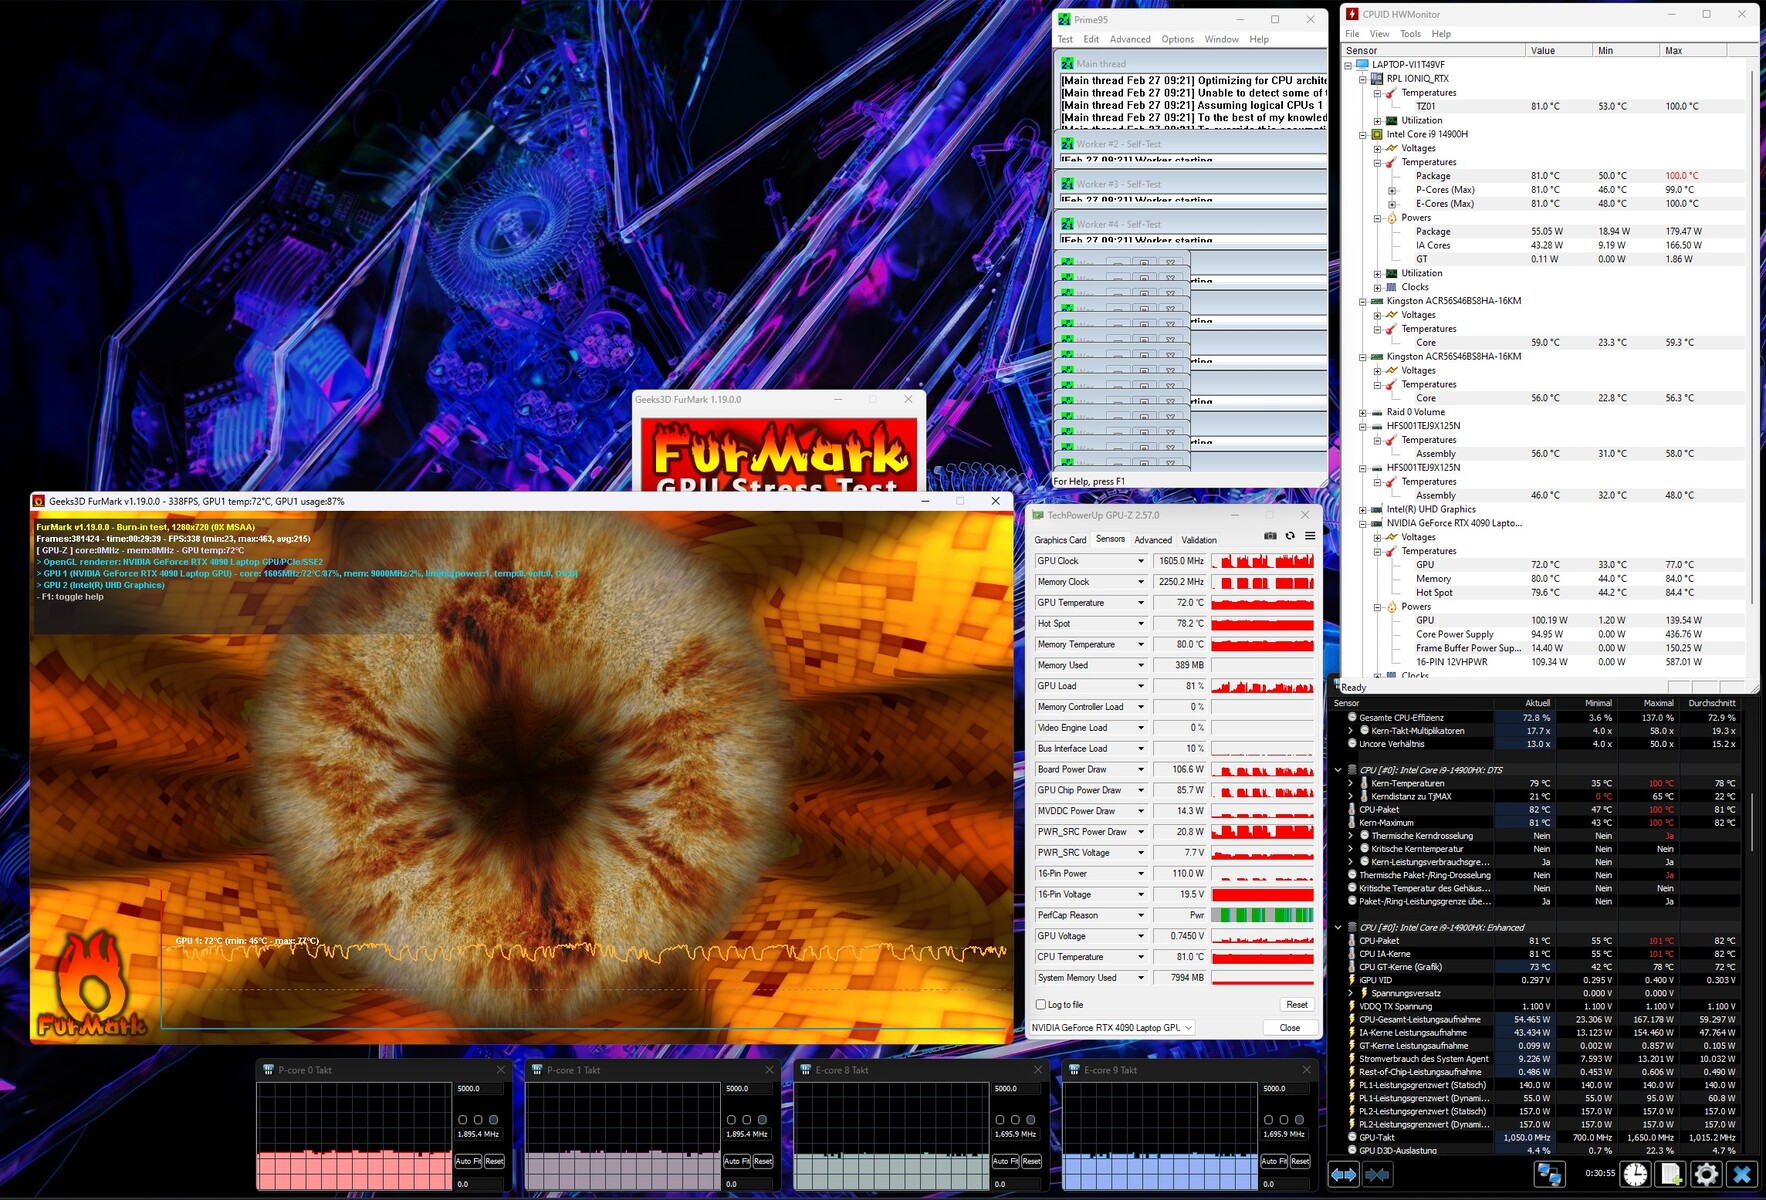
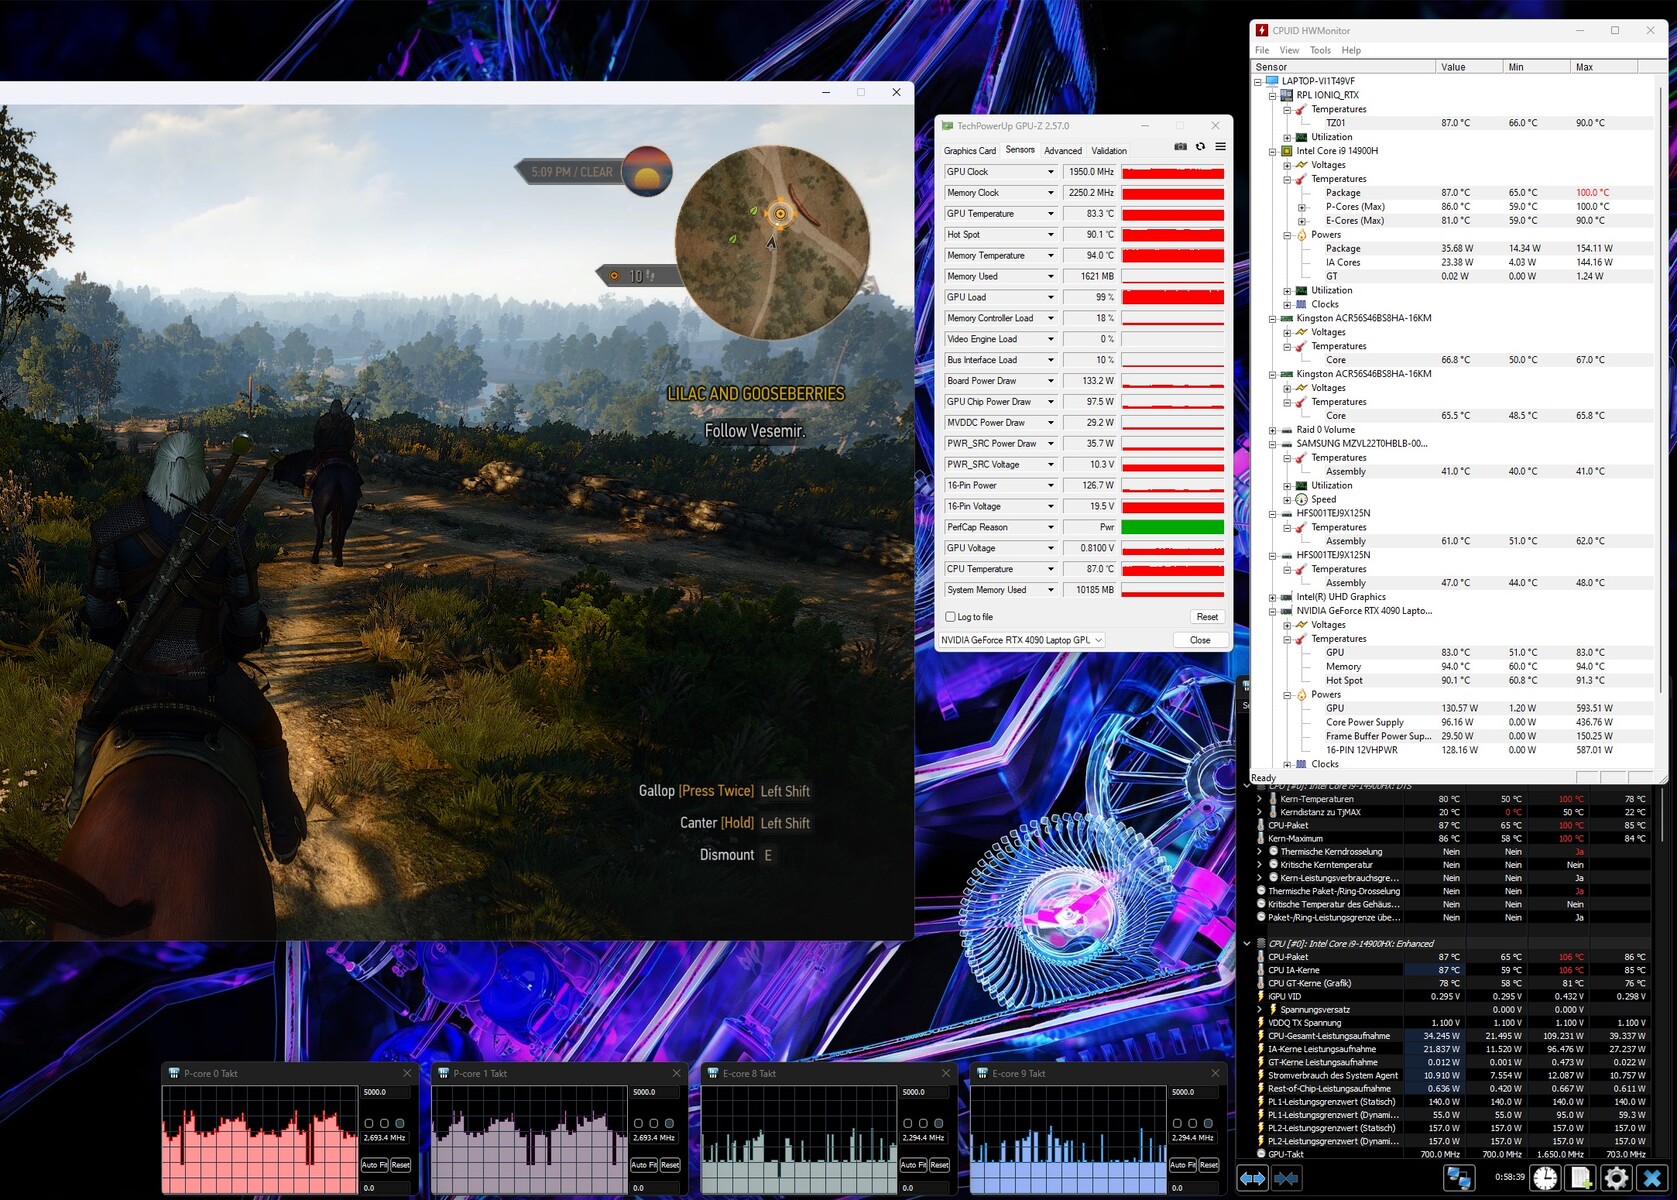
Stress test
Our stress test using the Furmark and Prime95 tools did not push the components to their limits. While the Core i9-14900HX leveled off at around 81 °C, the GeForce RTX 4090 reached around 72 °C (hotspot 78 °C). However, the hardware can get hotter in gaming mode due to its higher clock rates. In The Witcher 3, our tools measured around 87 °C (CPU) and 83 °C (GPU).
Speakers
Our audio analysis confirmed that the new Predator Helios 18 sounds better than its predecessor. Although the bass could still be more powerful, the mids and highs are now more pronounced. A maximum volume of 85 dB(A) should also be sufficient for most users.
Acer Predator Helios 18 PH18-72-98MW audio analysis
(+) | speakers can play relatively loud (85 dB)
Bass 100 - 315 Hz
(-) | nearly no bass - on average 21.1% lower than median
(±) | linearity of bass is average (10.7% delta to prev. frequency)
Mids 400 - 2000 Hz
(+) | balanced mids - only 2.9% away from median
(+) | mids are linear (5.6% delta to prev. frequency)
Highs 2 - 16 kHz
(+) | balanced highs - only 2.7% away from median
(+) | highs are linear (3.6% delta to prev. frequency)
Overall 100 - 16.000 Hz
(+) | overall sound is linear (13.6% difference to median)
Compared to same class
» 20% of all tested devices in this class were better, 7% similar, 73% worse
» The best had a delta of 6%, average was 18%, worst was 132%
Compared to all devices tested
» 15% of all tested devices were better, 4% similar, 82% worse
» The best had a delta of 4%, average was 23%, worst was 134%
MSI Titan 18 HX A14VIG audio analysis
(+) | speakers can play relatively loud (89.2 dB)
Bass 100 - 315 Hz
(-) | nearly no bass - on average 17.6% lower than median
(±) | linearity of bass is average (8% delta to prev. frequency)
Mids 400 - 2000 Hz
(+) | balanced mids - only 1.8% away from median
(+) | mids are linear (3.7% delta to prev. frequency)
Highs 2 - 16 kHz
(+) | balanced highs - only 1.2% away from median
(+) | highs are linear (2% delta to prev. frequency)
Overall 100 - 16.000 Hz
(+) | overall sound is linear (9.9% difference to median)
Compared to same class
» 5% of all tested devices in this class were better, 2% similar, 94% worse
» The best had a delta of 6%, average was 18%, worst was 132%
Compared to all devices tested
» 4% of all tested devices were better, 1% similar, 95% worse
» The best had a delta of 4%, average was 23%, worst was 134%
Asus ROG Strix Scar 18 G834JYR (2024) audio analysis
(+) | speakers can play relatively loud (82 dB)
Bass 100 - 315 Hz
(±) | reduced bass - on average 5.6% lower than median
(+) | bass is linear (6.8% delta to prev. frequency)
Mids 400 - 2000 Hz
(±) | higher mids - on average 5.7% higher than median
(+) | mids are linear (2.8% delta to prev. frequency)
Highs 2 - 16 kHz
(±) | reduced highs - on average 7.2% lower than median
(±) | linearity of highs is average (7.2% delta to prev. frequency)
Overall 100 - 16.000 Hz
(+) | overall sound is linear (13% difference to median)
Compared to same class
» 18% of all tested devices in this class were better, 3% similar, 79% worse
» The best had a delta of 6%, average was 18%, worst was 132%
Compared to all devices tested
» 13% of all tested devices were better, 2% similar, 85% worse
» The best had a delta of 4%, average was 23%, worst was 134%
Acer Predator Helios 18 N23Q2 audio analysis
(+) | speakers can play relatively loud (82.74 dB)
Bass 100 - 315 Hz
(-) | nearly no bass - on average 17.6% lower than median
(±) | linearity of bass is average (9.8% delta to prev. frequency)
Mids 400 - 2000 Hz
(±) | higher mids - on average 9.1% higher than median
(±) | linearity of mids is average (8.8% delta to prev. frequency)
Highs 2 - 16 kHz
(±) | higher highs - on average 5.3% higher than median
(+) | highs are linear (6.4% delta to prev. frequency)
Overall 100 - 16.000 Hz
(±) | linearity of overall sound is average (20.3% difference to median)
Compared to same class
» 72% of all tested devices in this class were better, 6% similar, 23% worse
» The best had a delta of 6%, average was 18%, worst was 132%
Compared to all devices tested
» 53% of all tested devices were better, 8% similar, 39% worse
» The best had a delta of 4%, average was 23%, worst was 134%
Alienware m18 R1 AMD audio analysis
(+) | speakers can play relatively loud (84.2 dB)
Bass 100 - 315 Hz
(-) | nearly no bass - on average 22.7% lower than median
(-) | bass is not linear (15.8% delta to prev. frequency)
Mids 400 - 2000 Hz
(+) | balanced mids - only 1.5% away from median
(+) | mids are linear (3.8% delta to prev. frequency)
Highs 2 - 16 kHz
(+) | balanced highs - only 3.6% away from median
(+) | highs are linear (5.5% delta to prev. frequency)
Overall 100 - 16.000 Hz
(±) | linearity of overall sound is average (16.5% difference to median)
Compared to same class
» 42% of all tested devices in this class were better, 7% similar, 51% worse
» The best had a delta of 6%, average was 18%, worst was 132%
Compared to all devices tested
» 28% of all tested devices were better, 6% similar, 66% worse
» The best had a delta of 4%, average was 23%, worst was 134%
Power management
Power consumption
Acer could do with fine-tuning the device's power consumption a little. Despite its active graphics switching, the 18-inch laptop requires quite a lot of power in idle mode, namely 31 to 43 watts. Most competitors as well as the old Helios do a lot better in this respect. There may also have been a bug in our test device.
| Off / Standby | |
| Idle | |
| Load |
|
Key:
min: | |
| Acer Predator Helios 18 PH18-72-98MW i9-14900HX, GeForce RTX 4090 Laptop GPU | MSI Titan 18 HX A14VIG i9-14900HX, GeForce RTX 4090 Laptop GPU | Asus ROG Strix Scar 18 G834JYR (2024) i9-14900HX, GeForce RTX 4090 Laptop GPU | Acer Predator Helios 18 N23Q2 i9-13900HX, GeForce RTX 4080 Laptop GPU | Alienware m18 R1 AMD R9 7945HX, Radeon RX 7900M | Average of class Gaming | |
|---|---|---|---|---|---|---|
| Power Consumption | -3% | 24% | 22% | -34% | 39% | |
| Idle Minimum * (Watt) | 31 | 13.2 57% | 14 55% | 16 48% | 30.3 2% | 13 ? 58% |
| Idle Average * (Watt) | 35 | 25.4 27% | 17 51% | 19 46% | 55.6 -59% | 18.7 ? 47% |
| Idle Maximum * (Watt) | 43 | 53.5 -24% | 24 44% | 21.3 50% | 101.1 -135% | 24.3 ? 43% |
| Load Average * (Watt) | 144 | 151.4 -5% | 143 1% | 124 14% | 160.3 -11% | 108.2 ? 25% |
| Witcher 3 ultra * (Watt) | 228 | 336 -47% | 251 -10% | 289 -27% | 216 5% | |
| Load Maximum * (Watt) | 318 | 395.2 -24% | 302 5% | 319 -0% | 332.1 -4% | 254 ? 20% |
* ... smaller is better
Power consumption Witcher 3 / stress test
Power consumption with external monitor
Runtimes
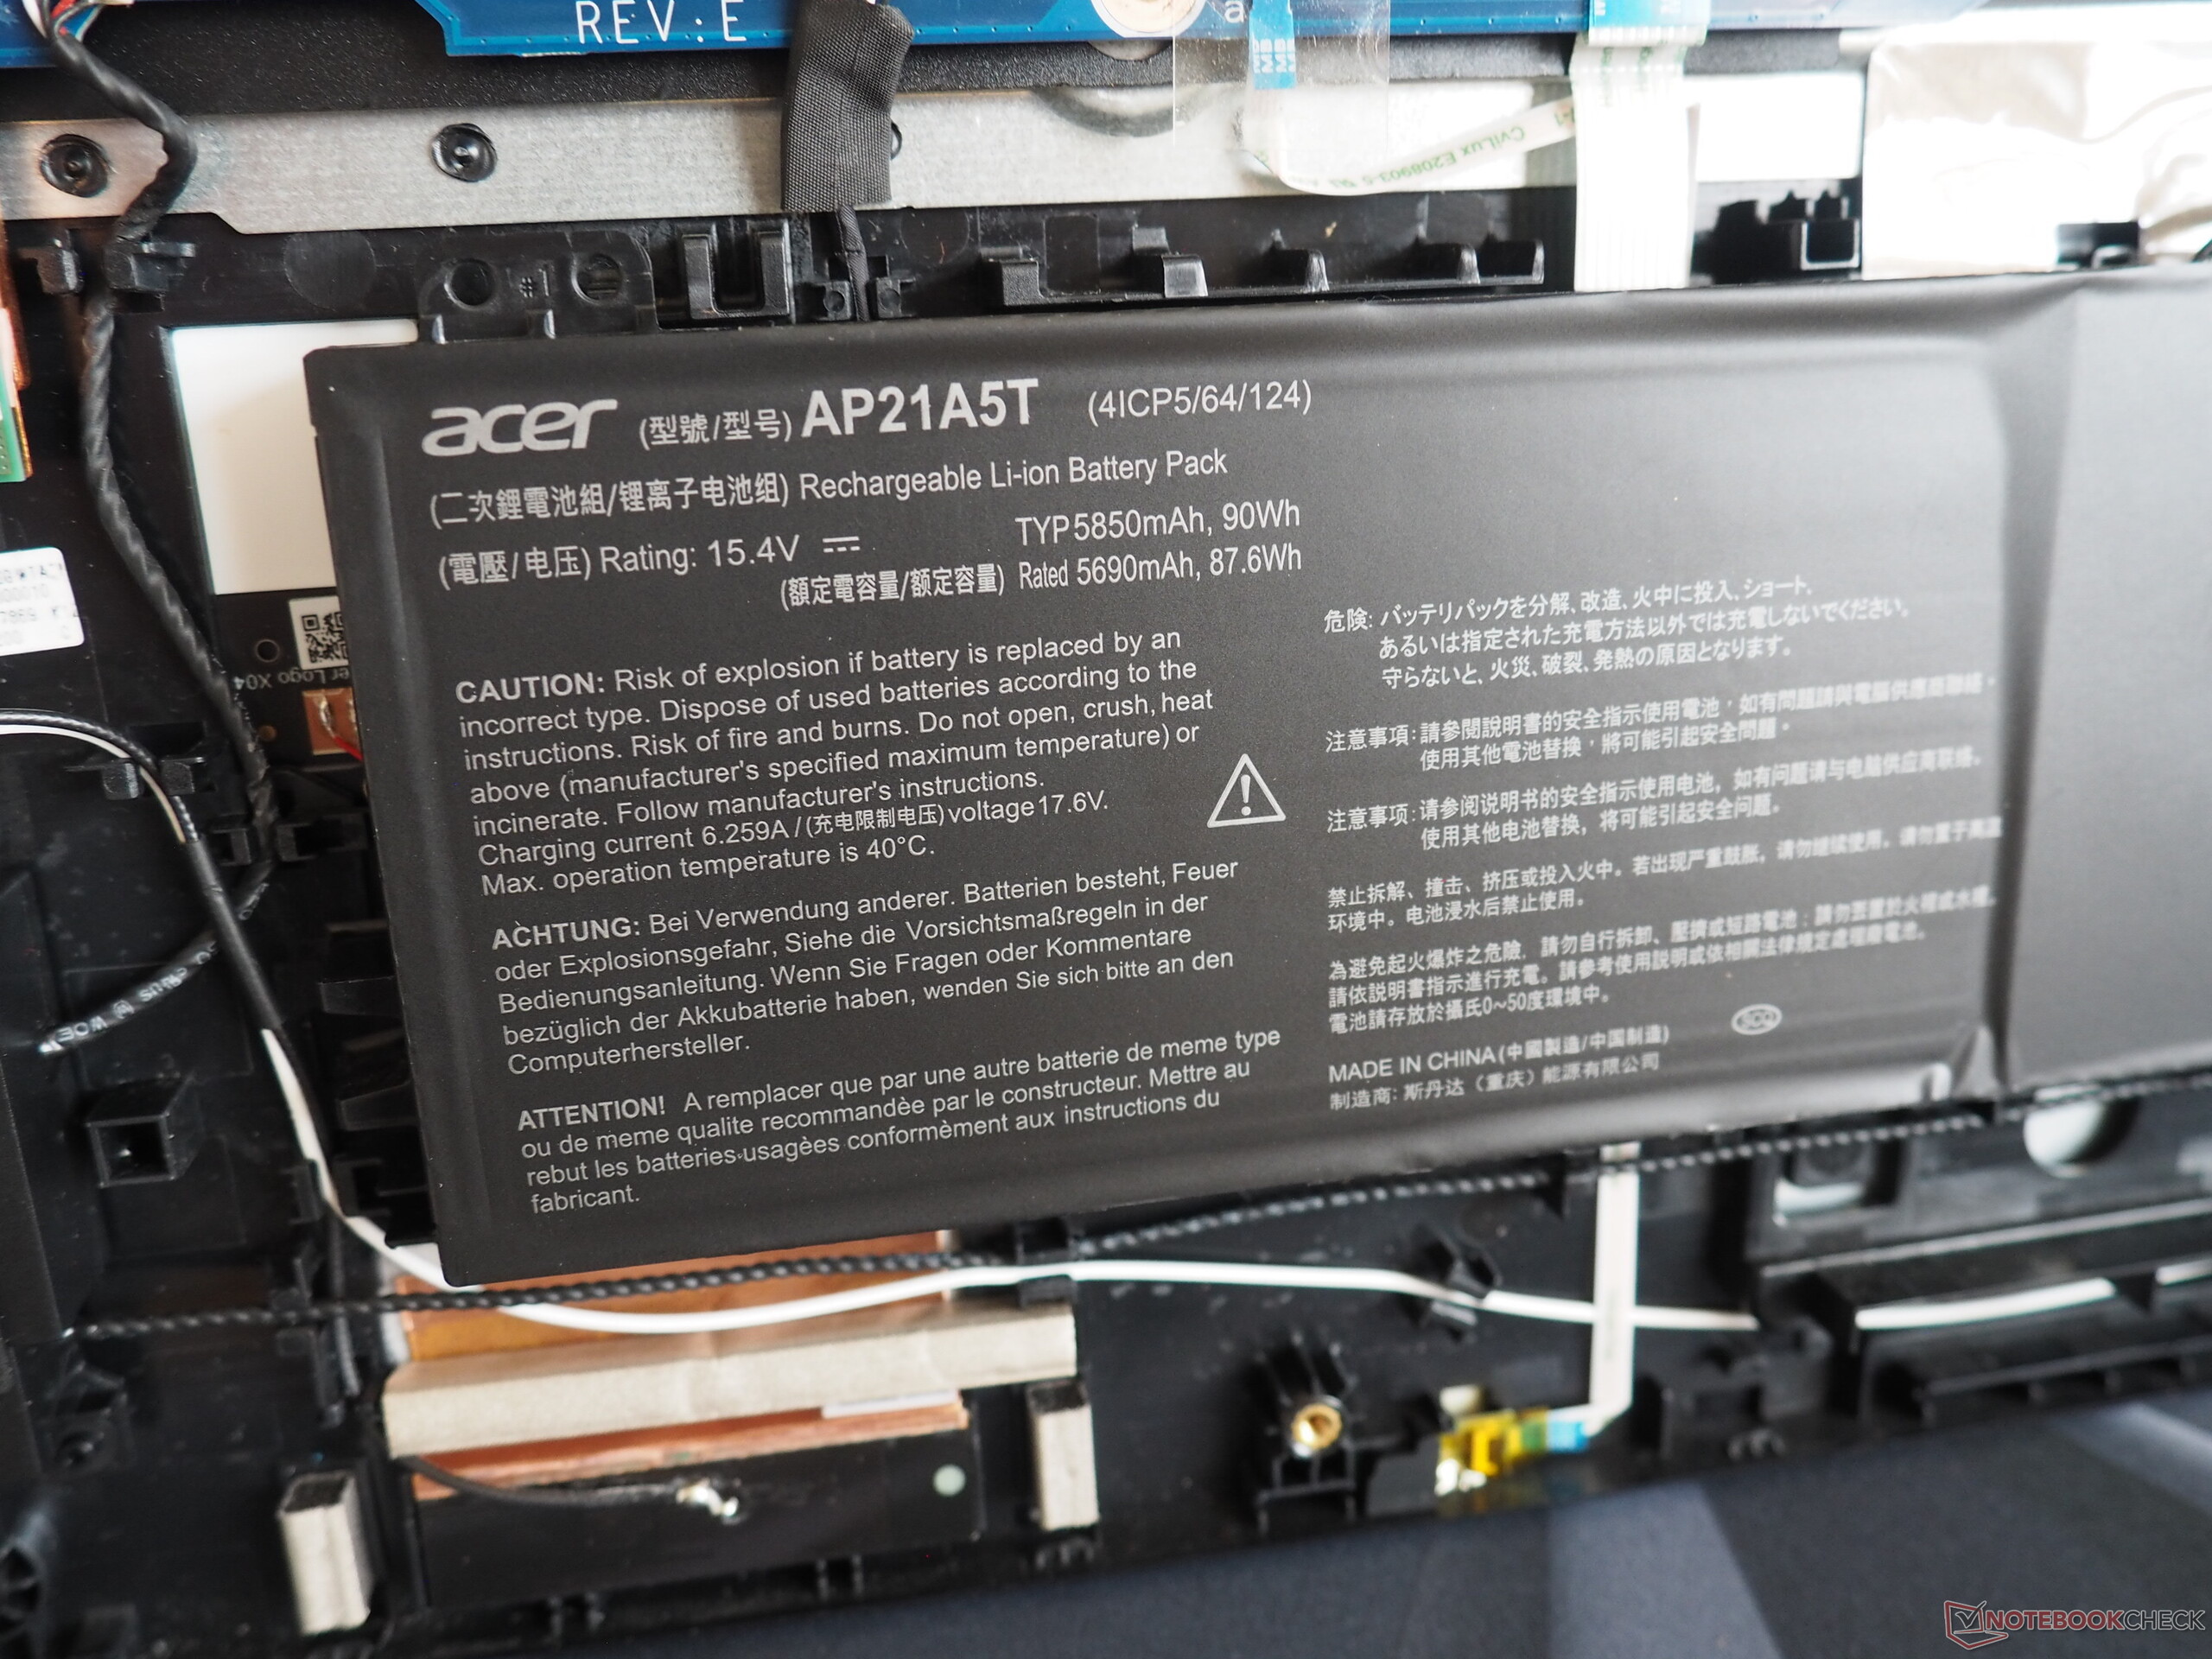
Its high power requirement leads to a very modest battery life. In our WLAN test with the brightness reduced to 150 cd/m², the Predator Helios 18 only lasted for just over 3 hours. In comparison, the ROG Strix Scar 18 managed more than 7 hours. In general, its 90-Wh battery is by no means small.
| Acer Predator Helios 18 PH18-72-98MW i9-14900HX, GeForce RTX 4090 Laptop GPU, 90 Wh | MSI Titan 18 HX A14VIG i9-14900HX, GeForce RTX 4090 Laptop GPU, 99.9 Wh | Asus ROG Strix Scar 18 G834JYR (2024) i9-14900HX, GeForce RTX 4090 Laptop GPU, 90 Wh | Acer Predator Helios 18 N23Q2 i9-13900HX, GeForce RTX 4080 Laptop GPU, 90 Wh | Alienware m18 R1 AMD R9 7945HX, Radeon RX 7900M, 97 Wh | Average of class Gaming | |
|---|---|---|---|---|---|---|
| Battery runtime | 20% | 80% | 47% | -46% | 78% | |
| WiFi v1.3 (h) | 3.2 | 4.2 31% | 7.7 141% | 4.4 38% | 1.4 -56% | 7 ? 119% |
| Load (h) | 1.1 | 1.2 9% | 1.3 18% | 1.7 55% | 0.7 -36% | 1.51 ? 37% |
| Reader / Idle (h) | 5.9 | 10.2 | 4.5 | 8.71 ? | ||
| H.264 (h) | 7.5 | 4.8 | 8.9 ? |
Pros
Cons
Verdict
The 2024 version is more of a subtle update of the existing Predator Helios 18.
Performance-wise, its Core i9-14900HX and GeForce RTX 4090 hardly differ from the old Core i9-13900HX and GeForce RTX 4080. On the other hand, its WQXGA-MiniLED display with an aspect ratio of 16:10 continues to deliver impressive picture quality (brightness, contrast, color space etc). Adding to this are great input devices and modern connectivity options (2x Thunderbolt 4).
Demanding gamers with the right budget will be sure to receive an all-round carefree package.
In its current state, however, the Predator Helios 18 has just missed out on a "very good" rating. Aside from its fan control (which sometimes causes annoying revving), Acer could also do with revising the laptop's idle power consumption, which currently still leads to meager runtimes.
Many competitors may not currently be on the market, but they are at least on par with the device—whether it be the MSI Titan 18 or the Asus ROG Strix Scar 18.
Price and availability
At the time of writing, the Predator Helios 18 with a Core i9-14900HX and a GeForce RTX 4090 is not yet available to purchase in the United States.
Acer Predator Helios 18 PH18-72-98MW
- 02/27/2024 v7 (old)
Florian Glaser
Transparency
The selection of devices to be reviewed is made by our editorial team. The test sample was provided to the author as a loan by the manufacturer or retailer for the purpose of this review. The lender had no influence on this review, nor did the manufacturer receive a copy of this review before publication. There was no obligation to publish this review. As an independent media company, Notebookcheck is not subjected to the authority of manufacturers, retailers or publishers.
This is how Notebookcheck is testing
Every year, Notebookcheck independently reviews hundreds of laptops and smartphones using standardized procedures to ensure that all results are comparable. We have continuously developed our test methods for around 20 years and set industry standards in the process. In our test labs, high-quality measuring equipment is utilized by experienced technicians and editors. These tests involve a multi-stage validation process. Our complex rating system is based on hundreds of well-founded measurements and benchmarks, which maintains objectivity. Further information on our test methods can be found here.
Price comparison

