
Verdict - Plenty of space for upgrades, weak performance mode
With "Performance mode" enabled, the gaming laptop delivers slightly below-average performance for its class. In return, it operates more quietly than many competitors, though the optional "Turbo mode" significantly increases noise levels. A more balanced performance preset would have been desirable. The system's excellent upgrade options—4 RAM slots and 3 SSD slots—along with a high-quality mini LED panel and fast Wi-Fi 7, remain clear highlights.
Below Wi-Fi 6E, however, the transfer rates are particularly slow in comparison. It is also somewhat annoying that the display lid closes far too quickly on its own. Although the SSD is fast, it is throttled at some point under prolonged load.
Pros
Cons
Price and availability
In our test configuration, the gaming laptop is available from around 3,850 euros (approx. US$4,500) in Germany, for example, at notebooksbilliger.de.
- $2,797.09Acer Predator Helios Neo 18 AI Gaming Laptop | Intel Core Ultra 9 Processor 275HX | NVIDIA GeForce RTX 5070 Ti | 18" WQXGA 240Hz G-SYNC | 32GB DDR5 | 2TB Gen 4 SSD | Killer Wi-Fi 6E | PHN18-72-9474
- $3,379.99acer Predator Helios 18 AI Gaming Laptop 18" 250Hz 1000 nits Mini-LED WQXGA (Intel Ultra 9-275HX, GeForce RTX 5080 16GB, 32GB DDR5, 1TB SSD, 2 Thunderbolt 5, Win 11 Home) w/DKZ USB Port Expander
- $1,999.99Acer Predator Helios Neo 18 AI Gaming Laptop | Intel Core Ultra 9 Processor 275HX | NVIDIA GeForce RTX 5070 Ti | 18" WQXGA 240Hz G-SYNC | 16GB DDR5 | 1TB Gen 4 SSD | Killer Wi-Fi 6E | PHN18-72-92Y3
Table of Contents
- Verdict - Plenty of space for upgrades, weak performance mode
- Specifications
- Case & features: Upgrade-friendly Predator
- Input devices - Predator button and lots of RGB
- Display - 1,600p mini LED
- Performance - Slightly below average in performance mode
- Emissions & energy - 400 W power supply unit!
- Notebookcheck overall rating
- Possible alternatives comparison
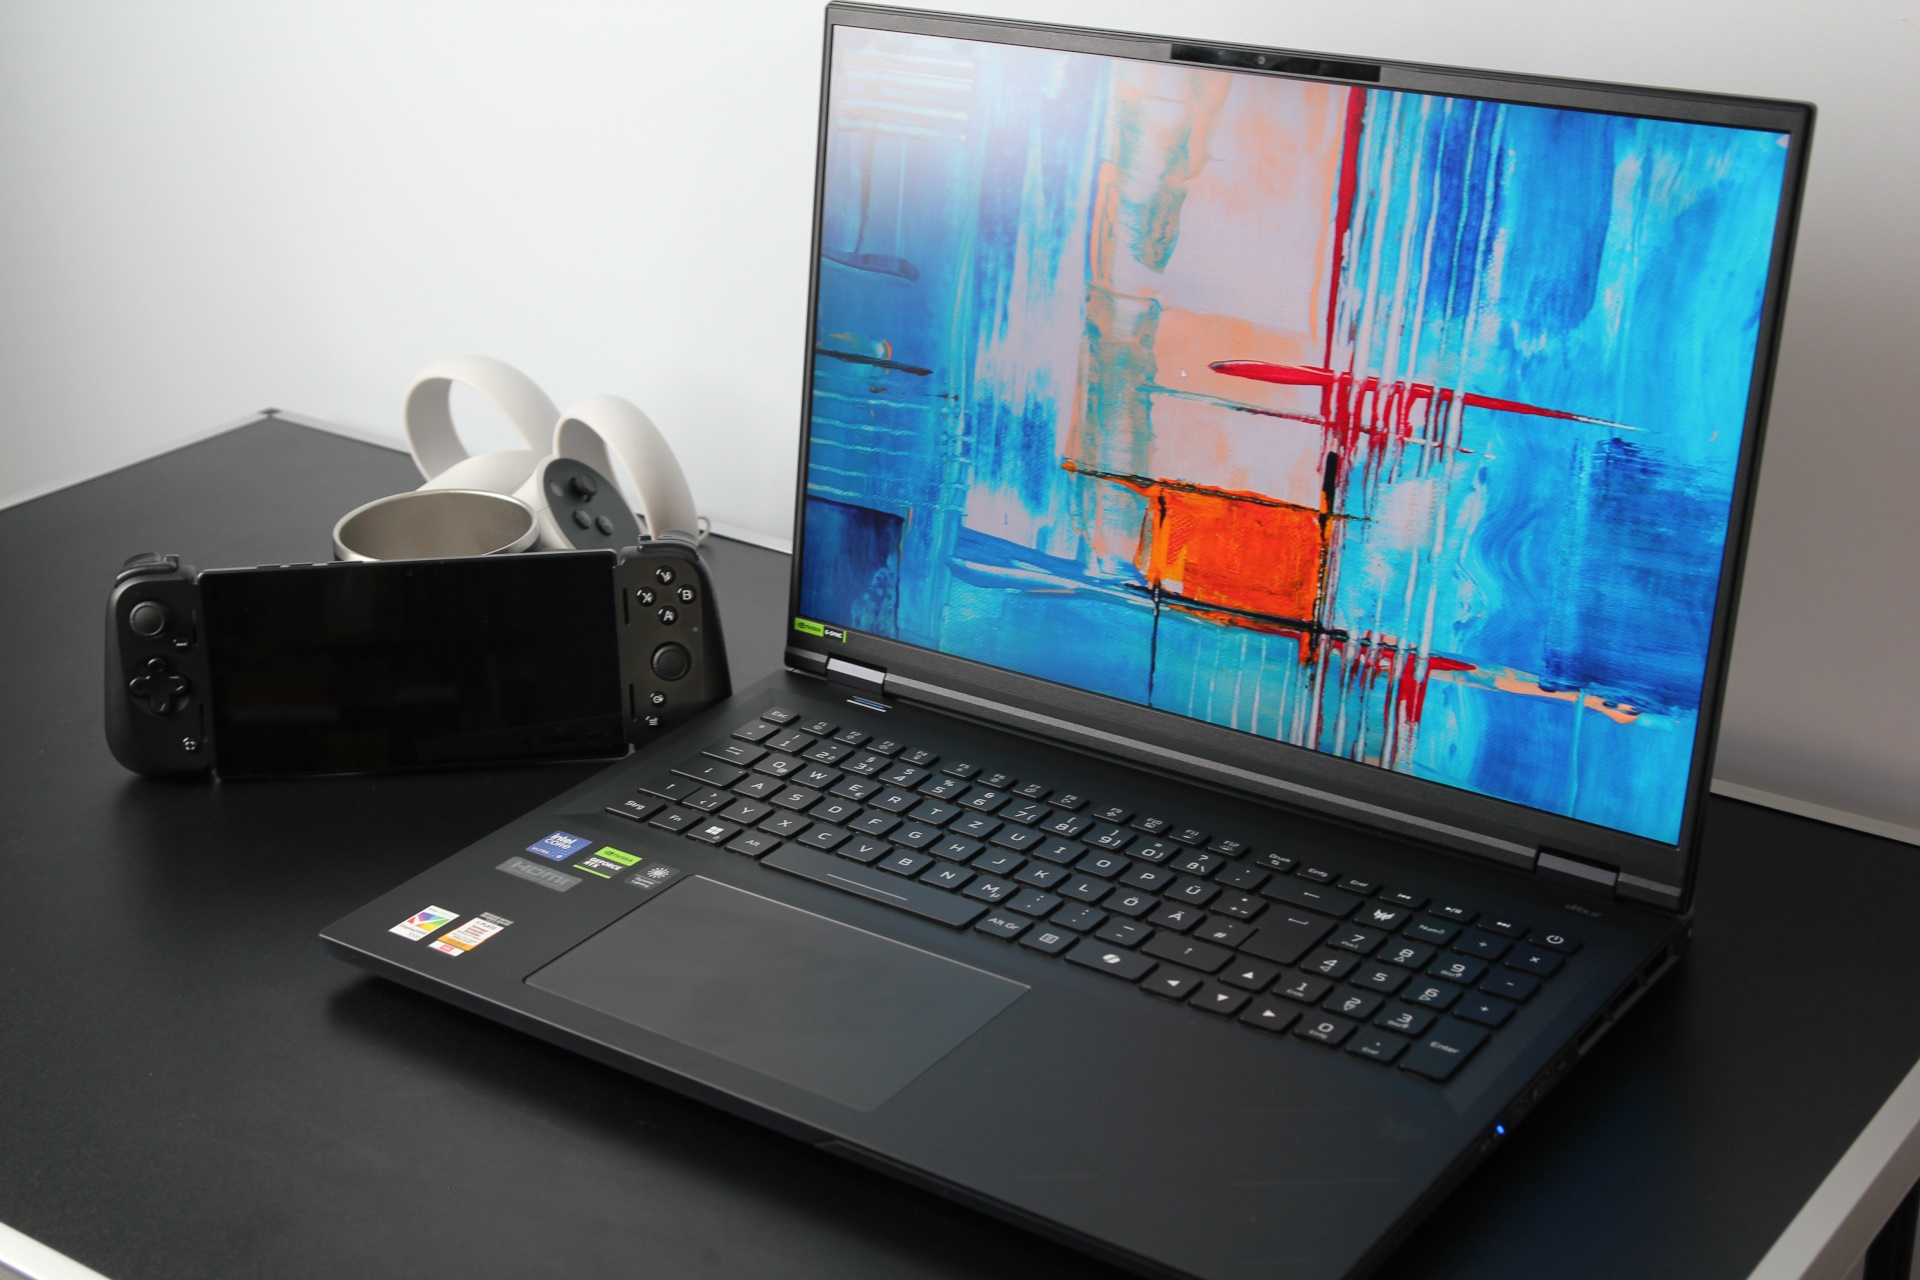
Last year, we bought the Helios 18 with a mini LED panel, Core i9-14900HX, and GeForce RTX 4090 laptop as an "all-round carefree package" for gamers. There was slight criticism of the fan control, power consumption, and the throttling of the SSD. What has Acer done about this this year?
Specifications
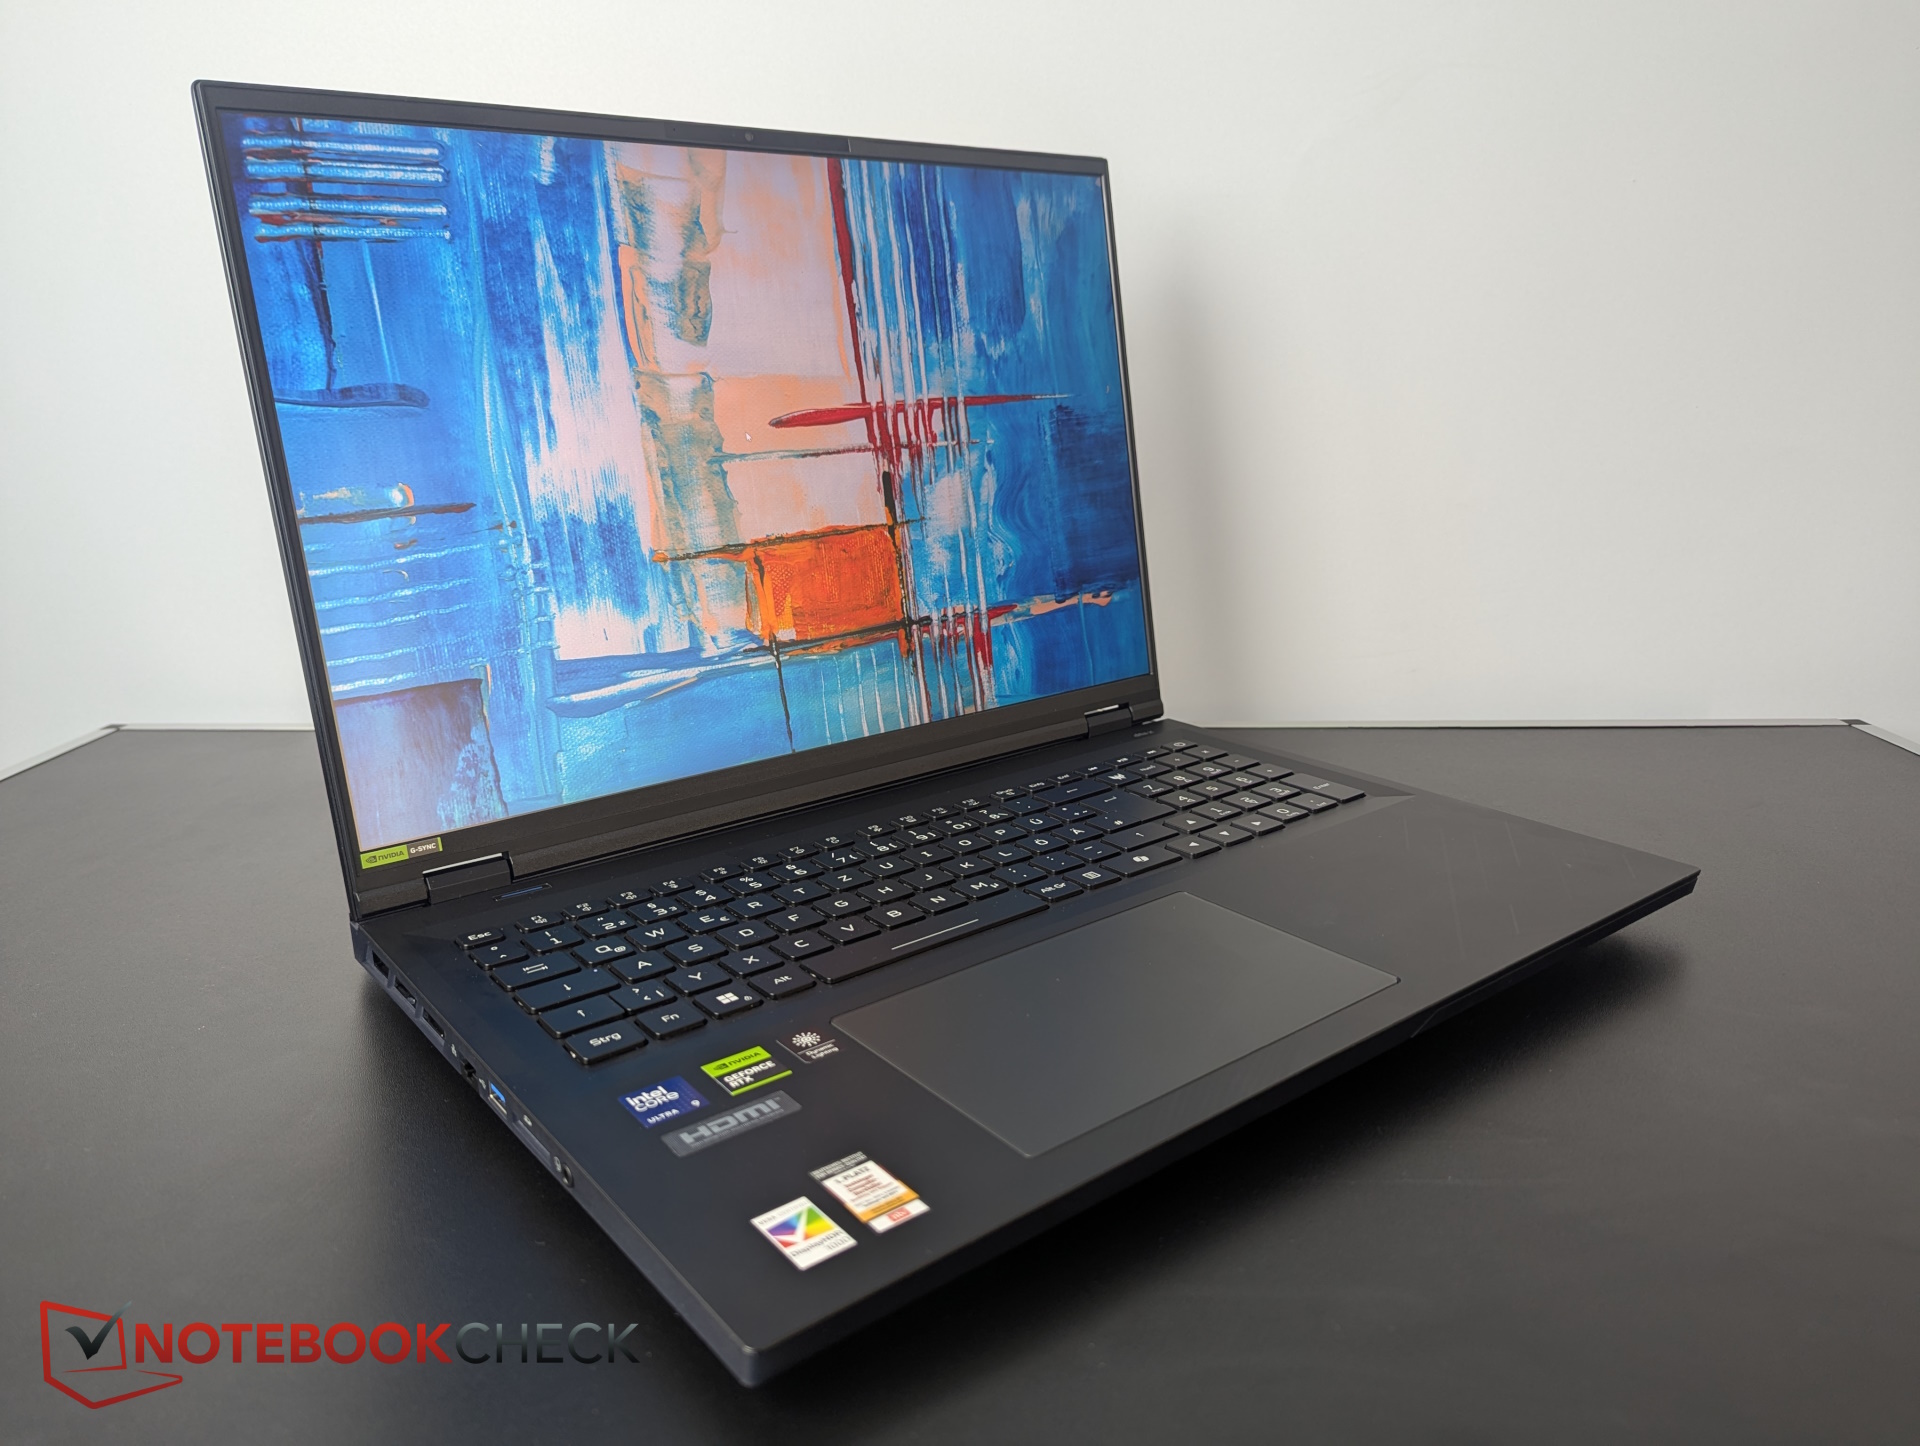
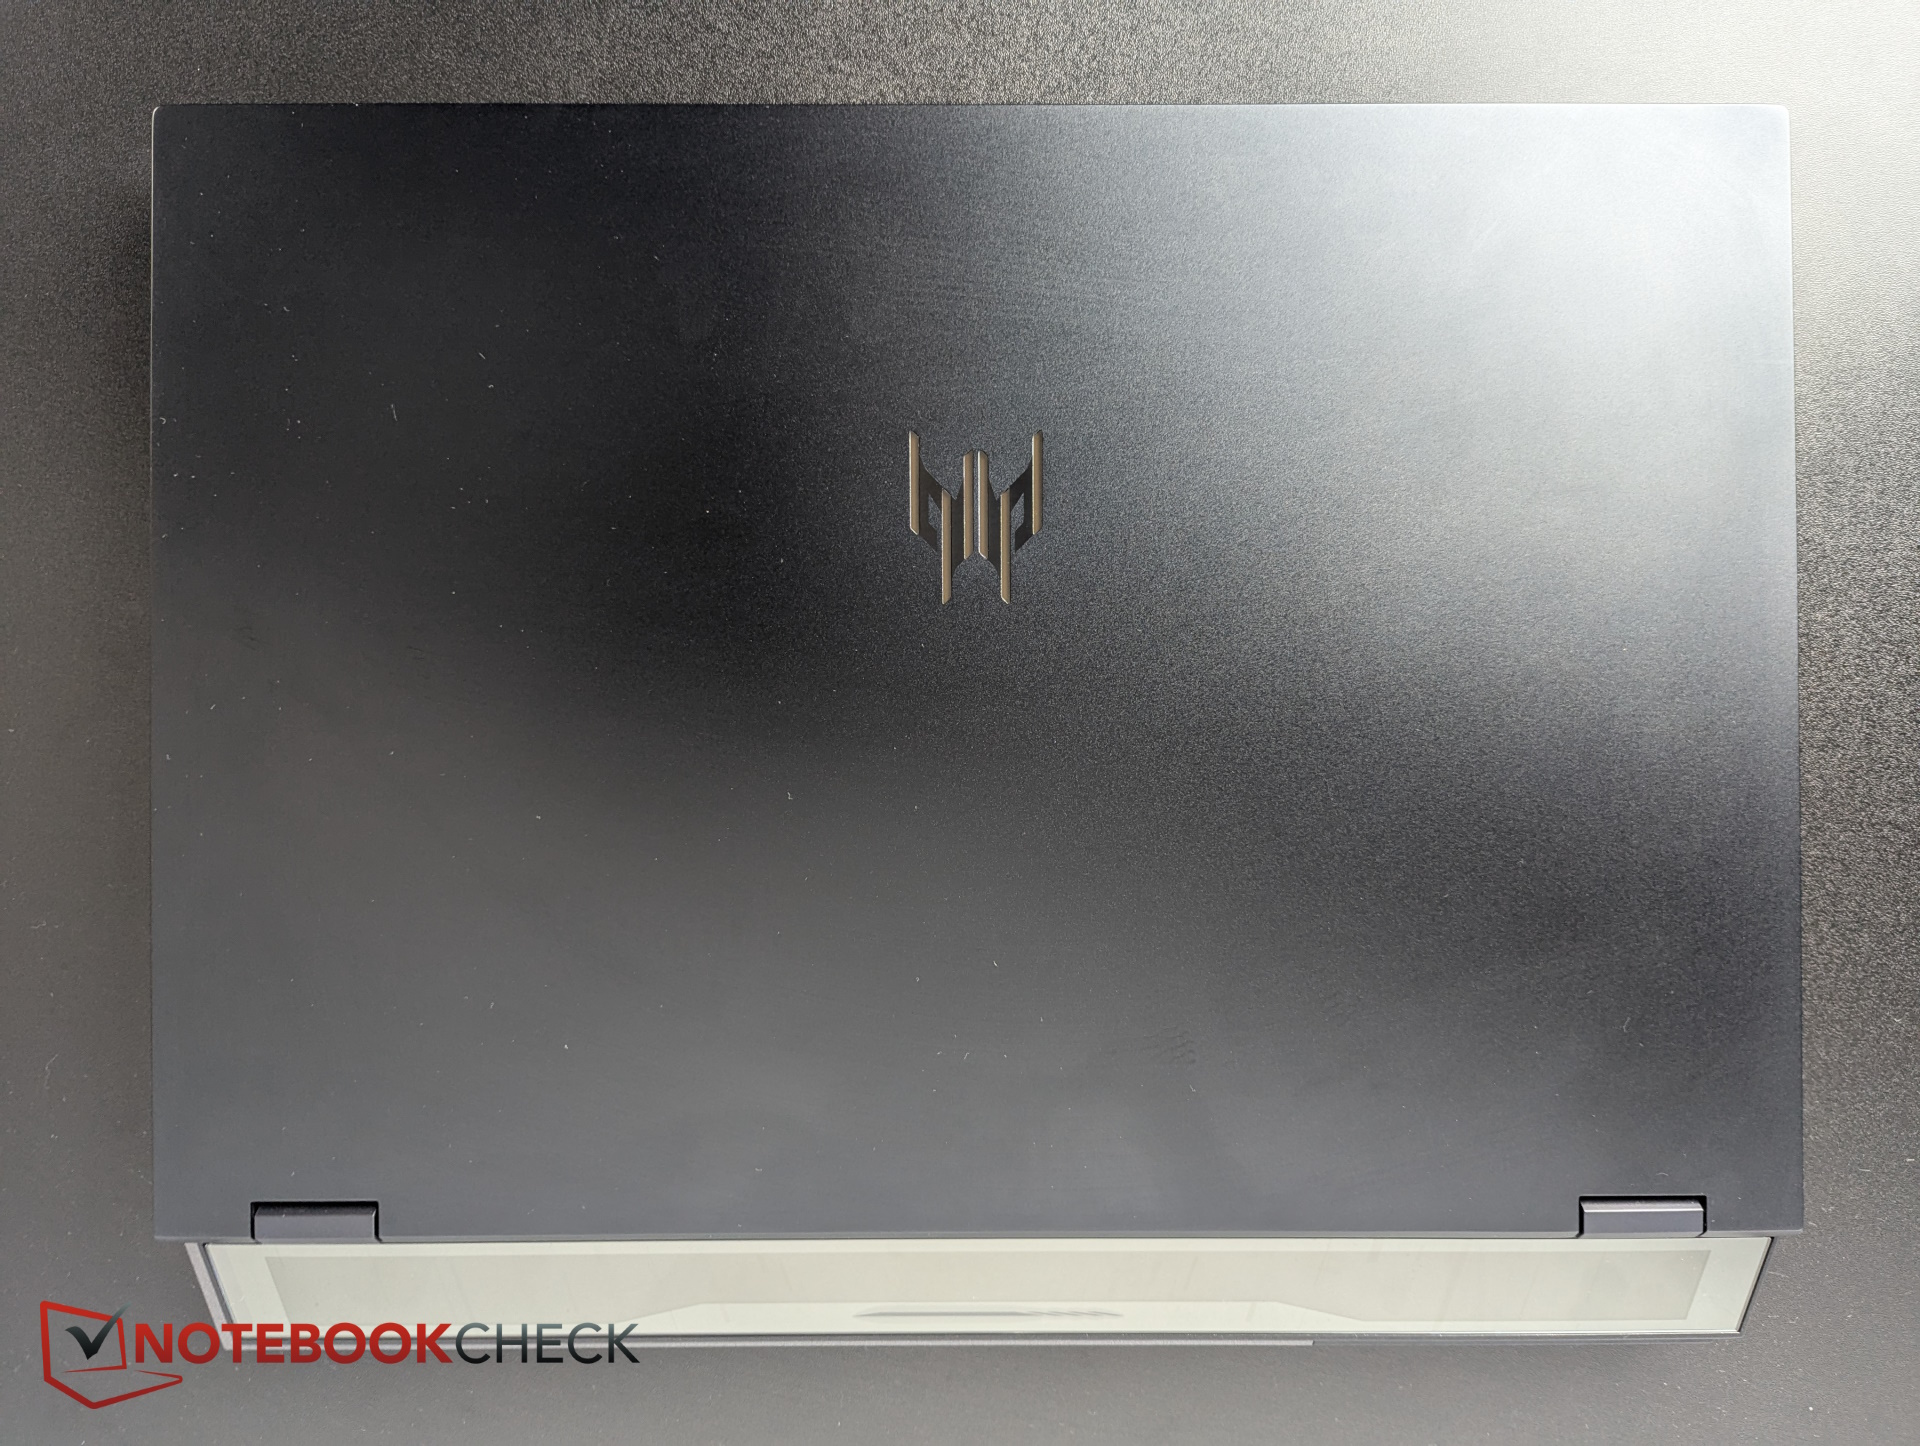
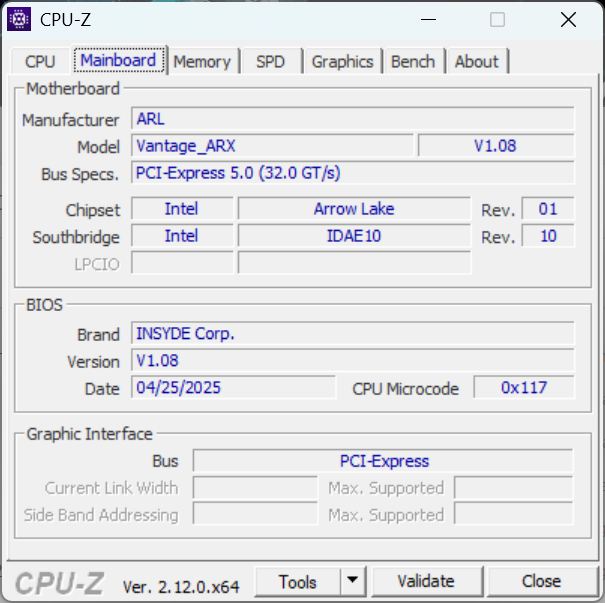
Case & features: Upgrade-friendly Predator
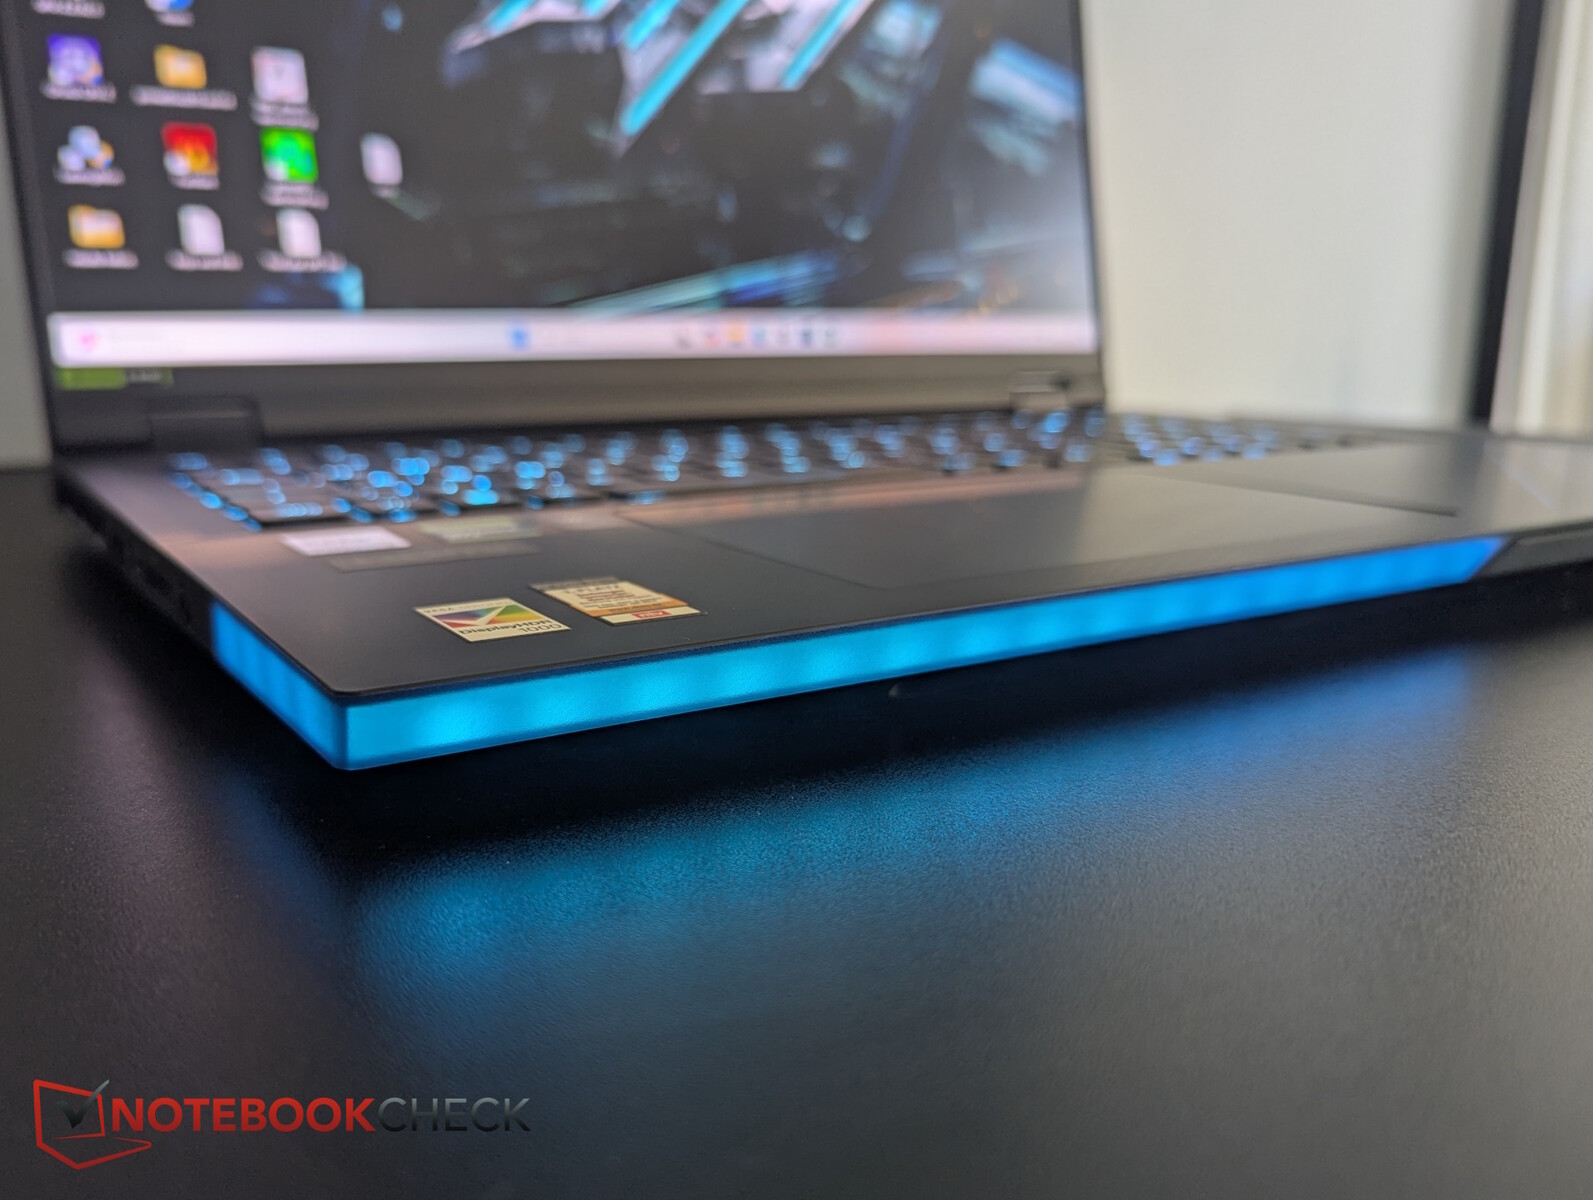
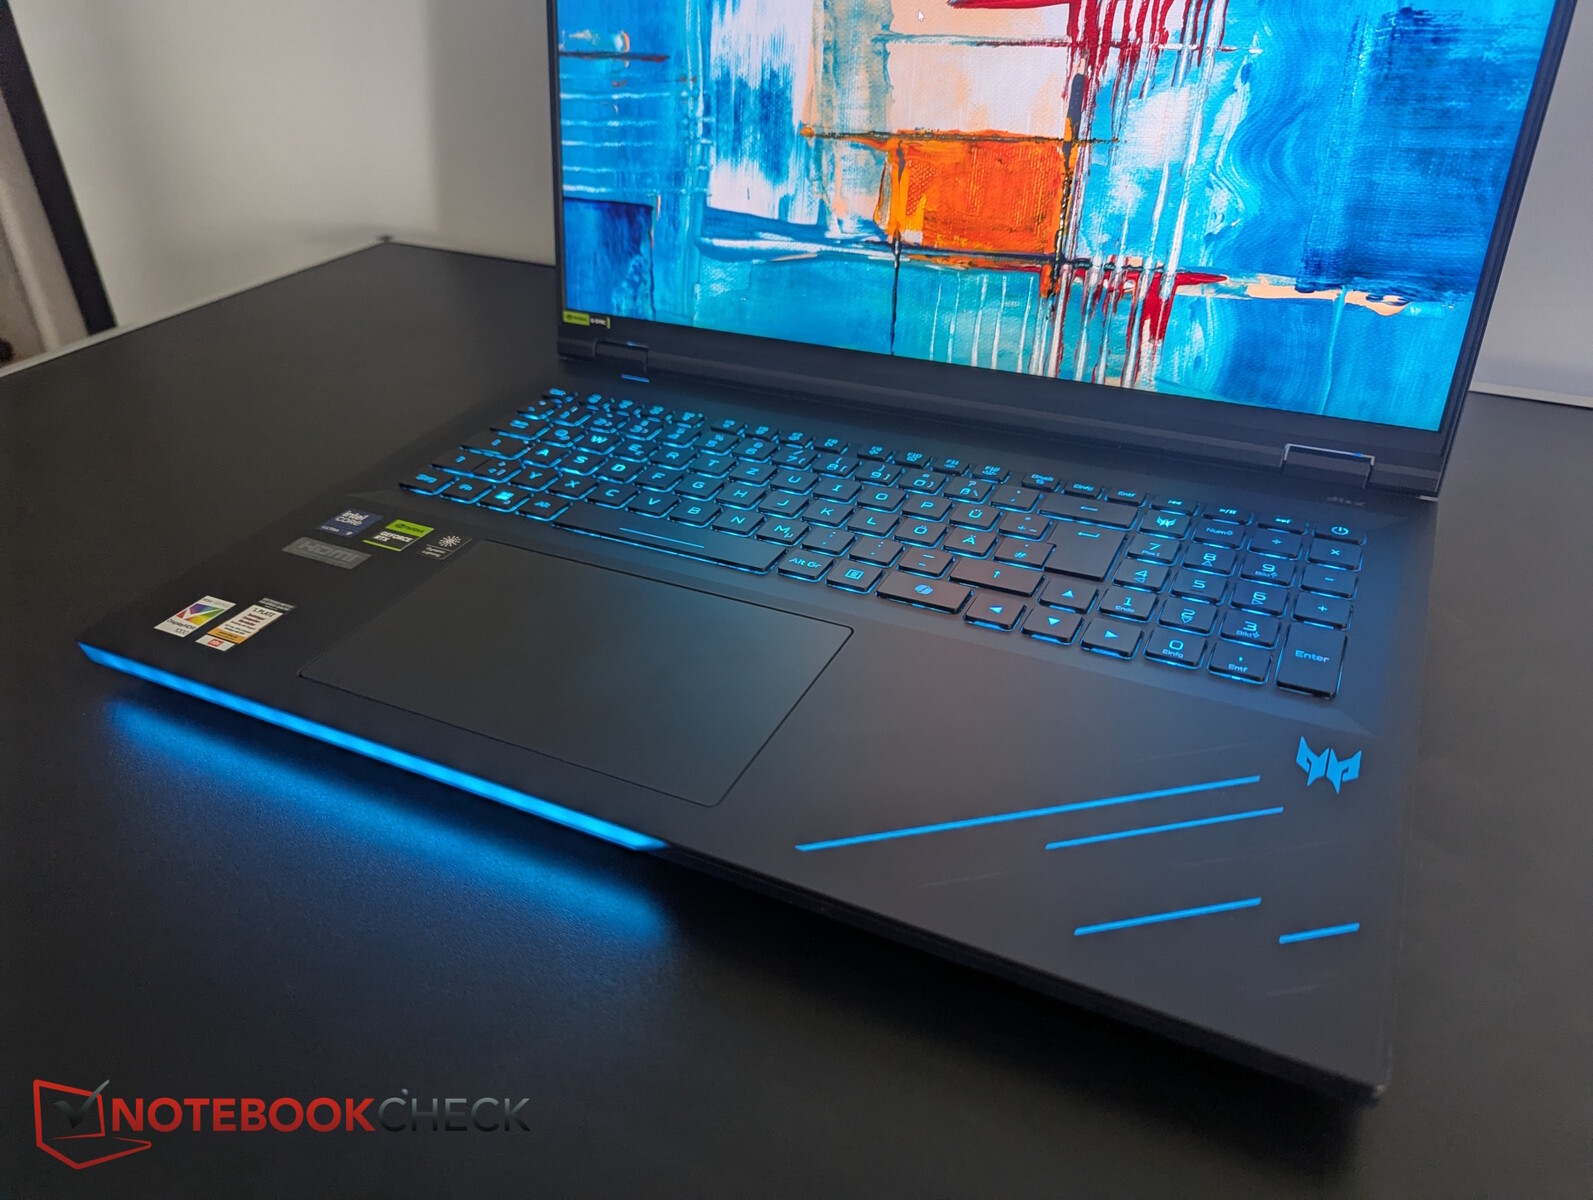
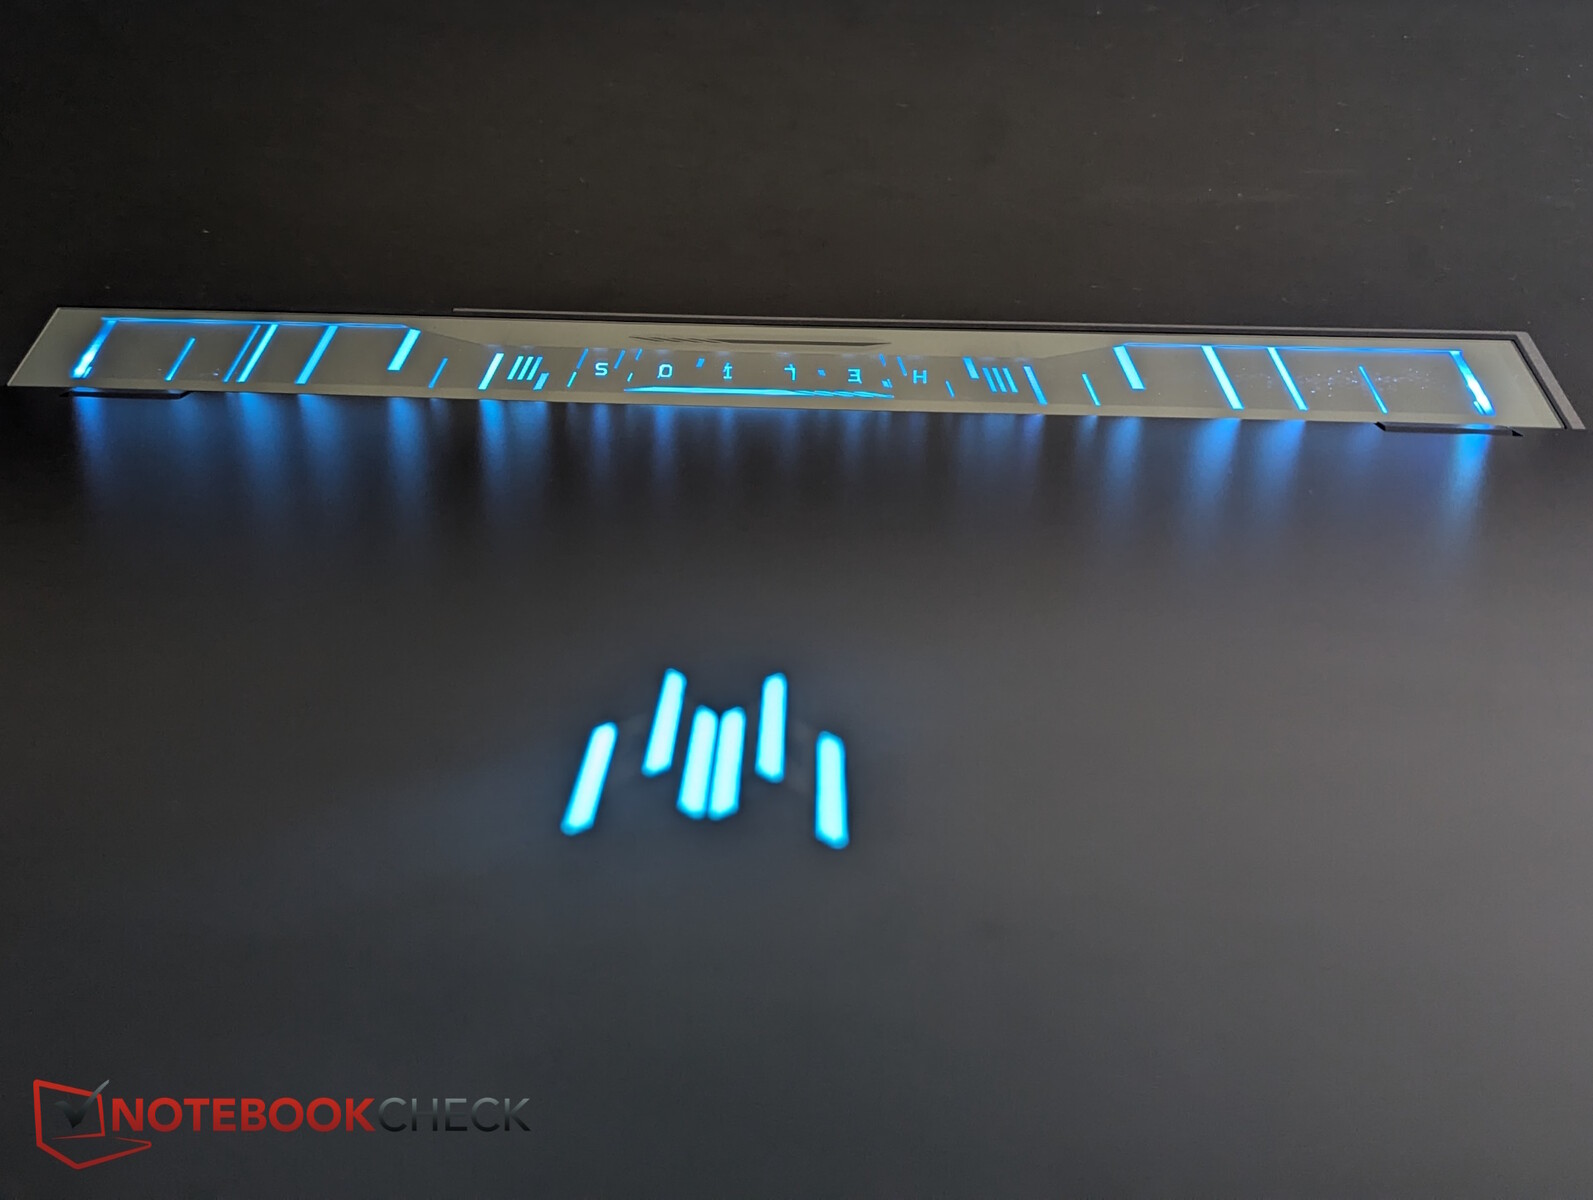
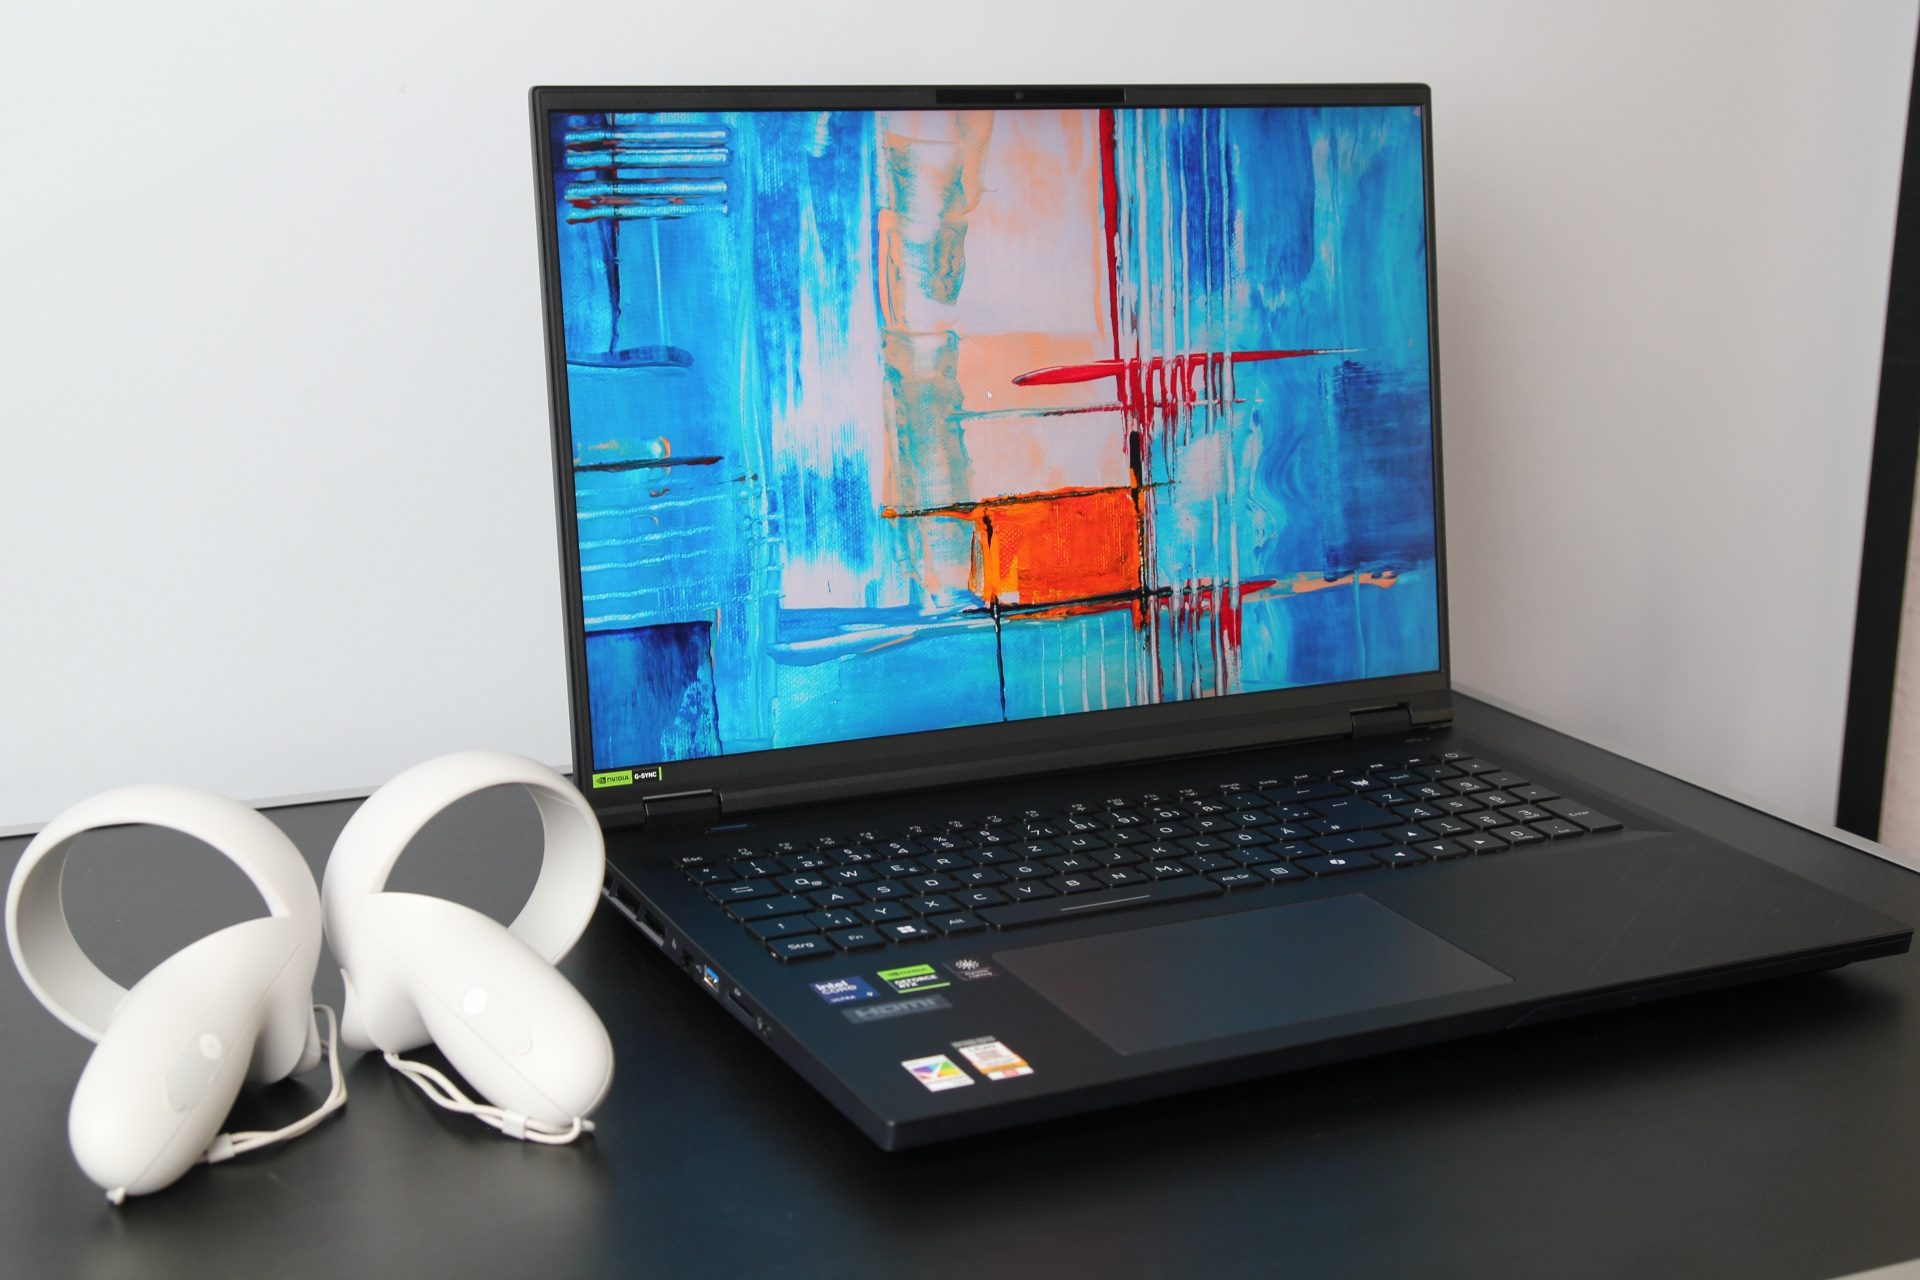
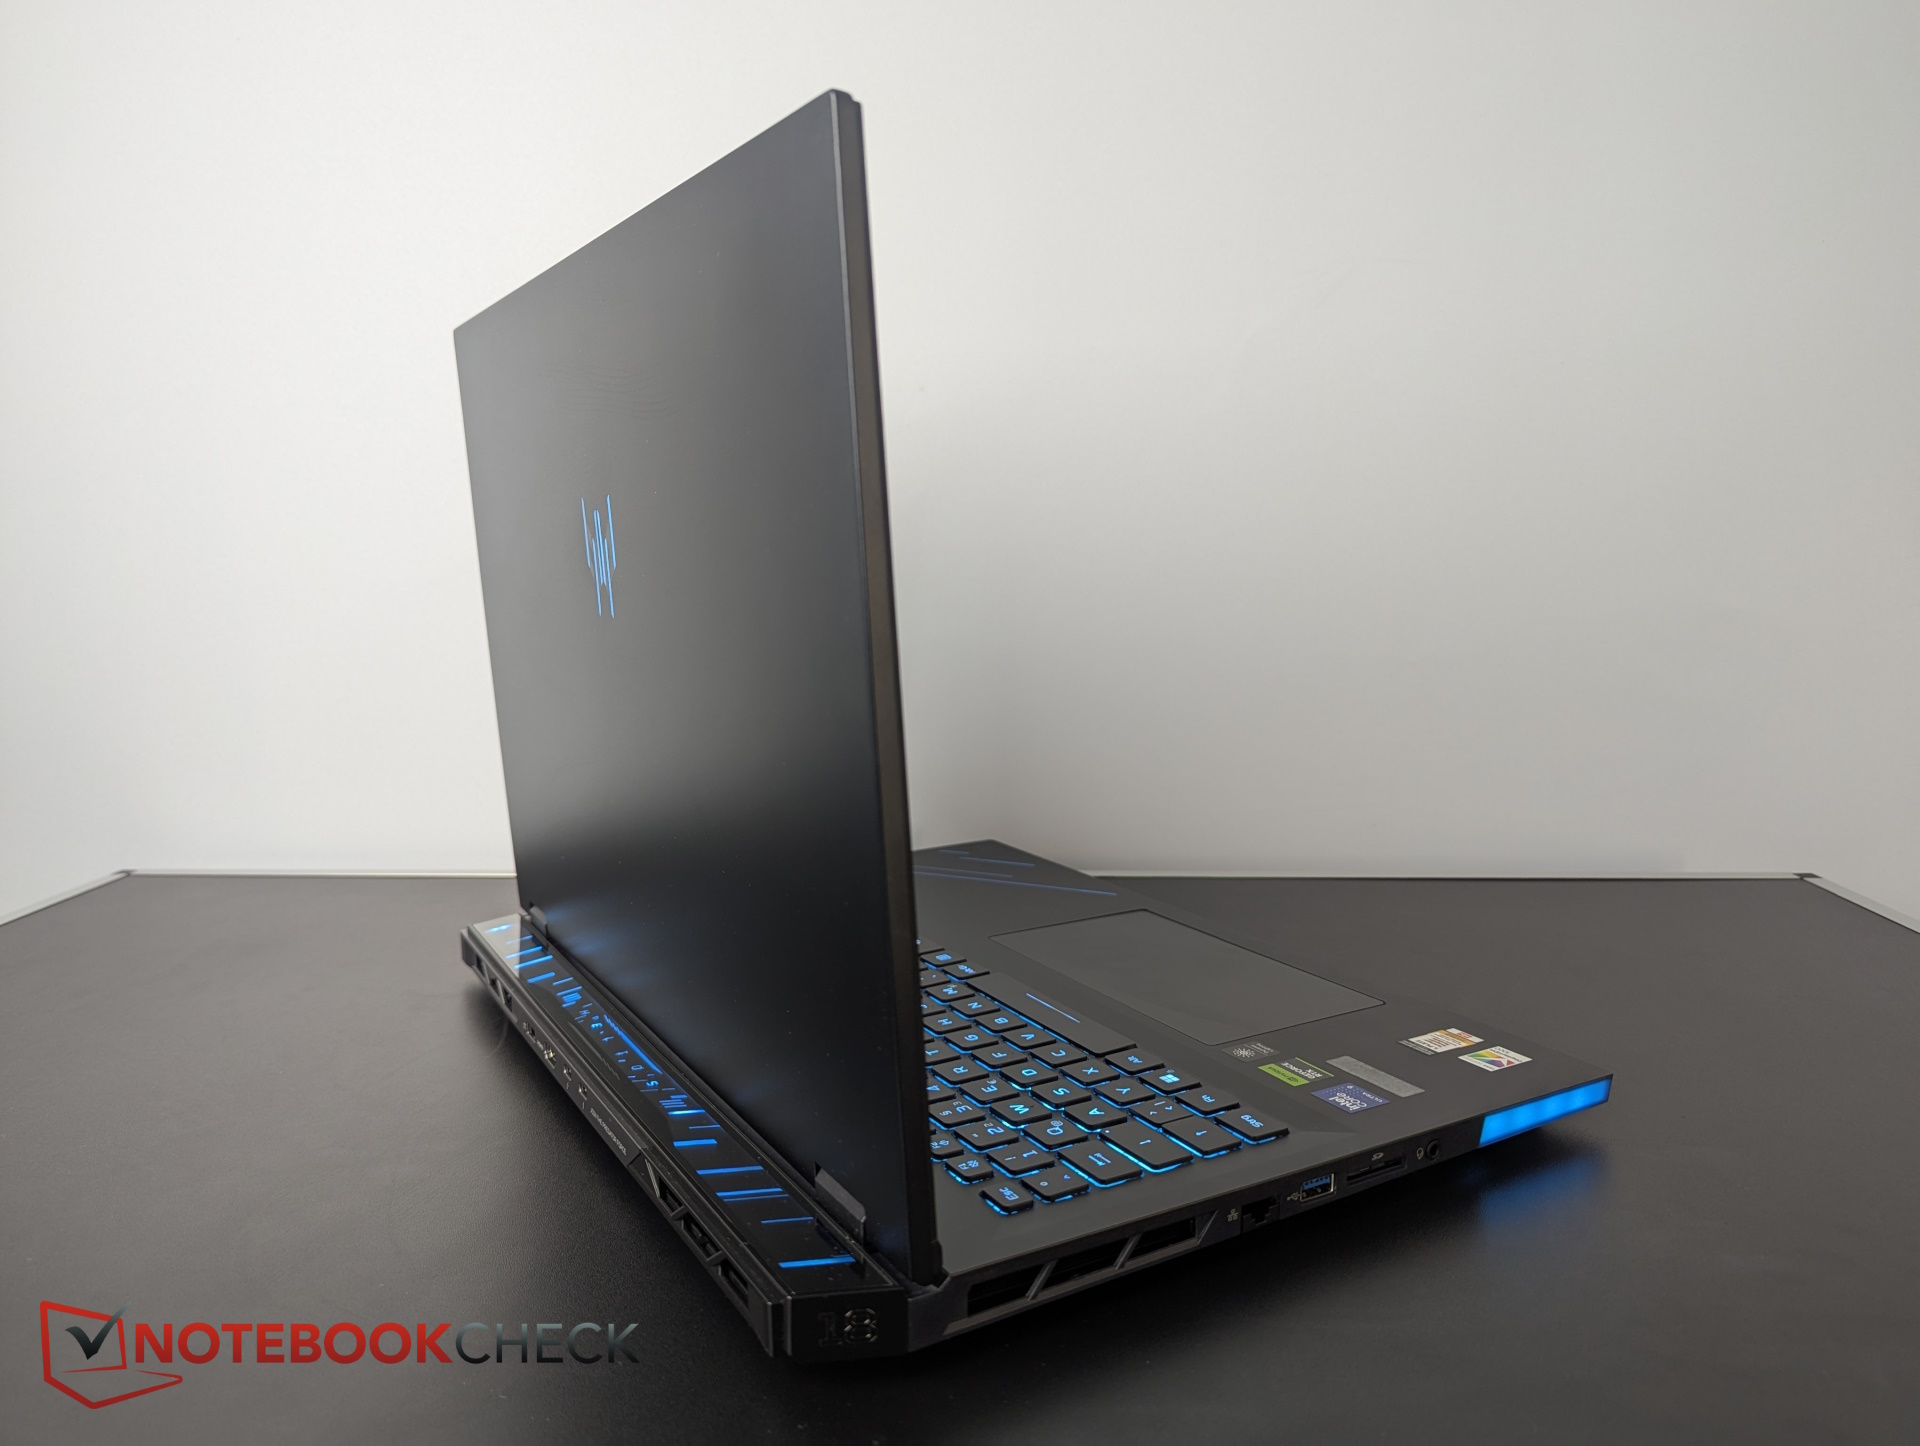
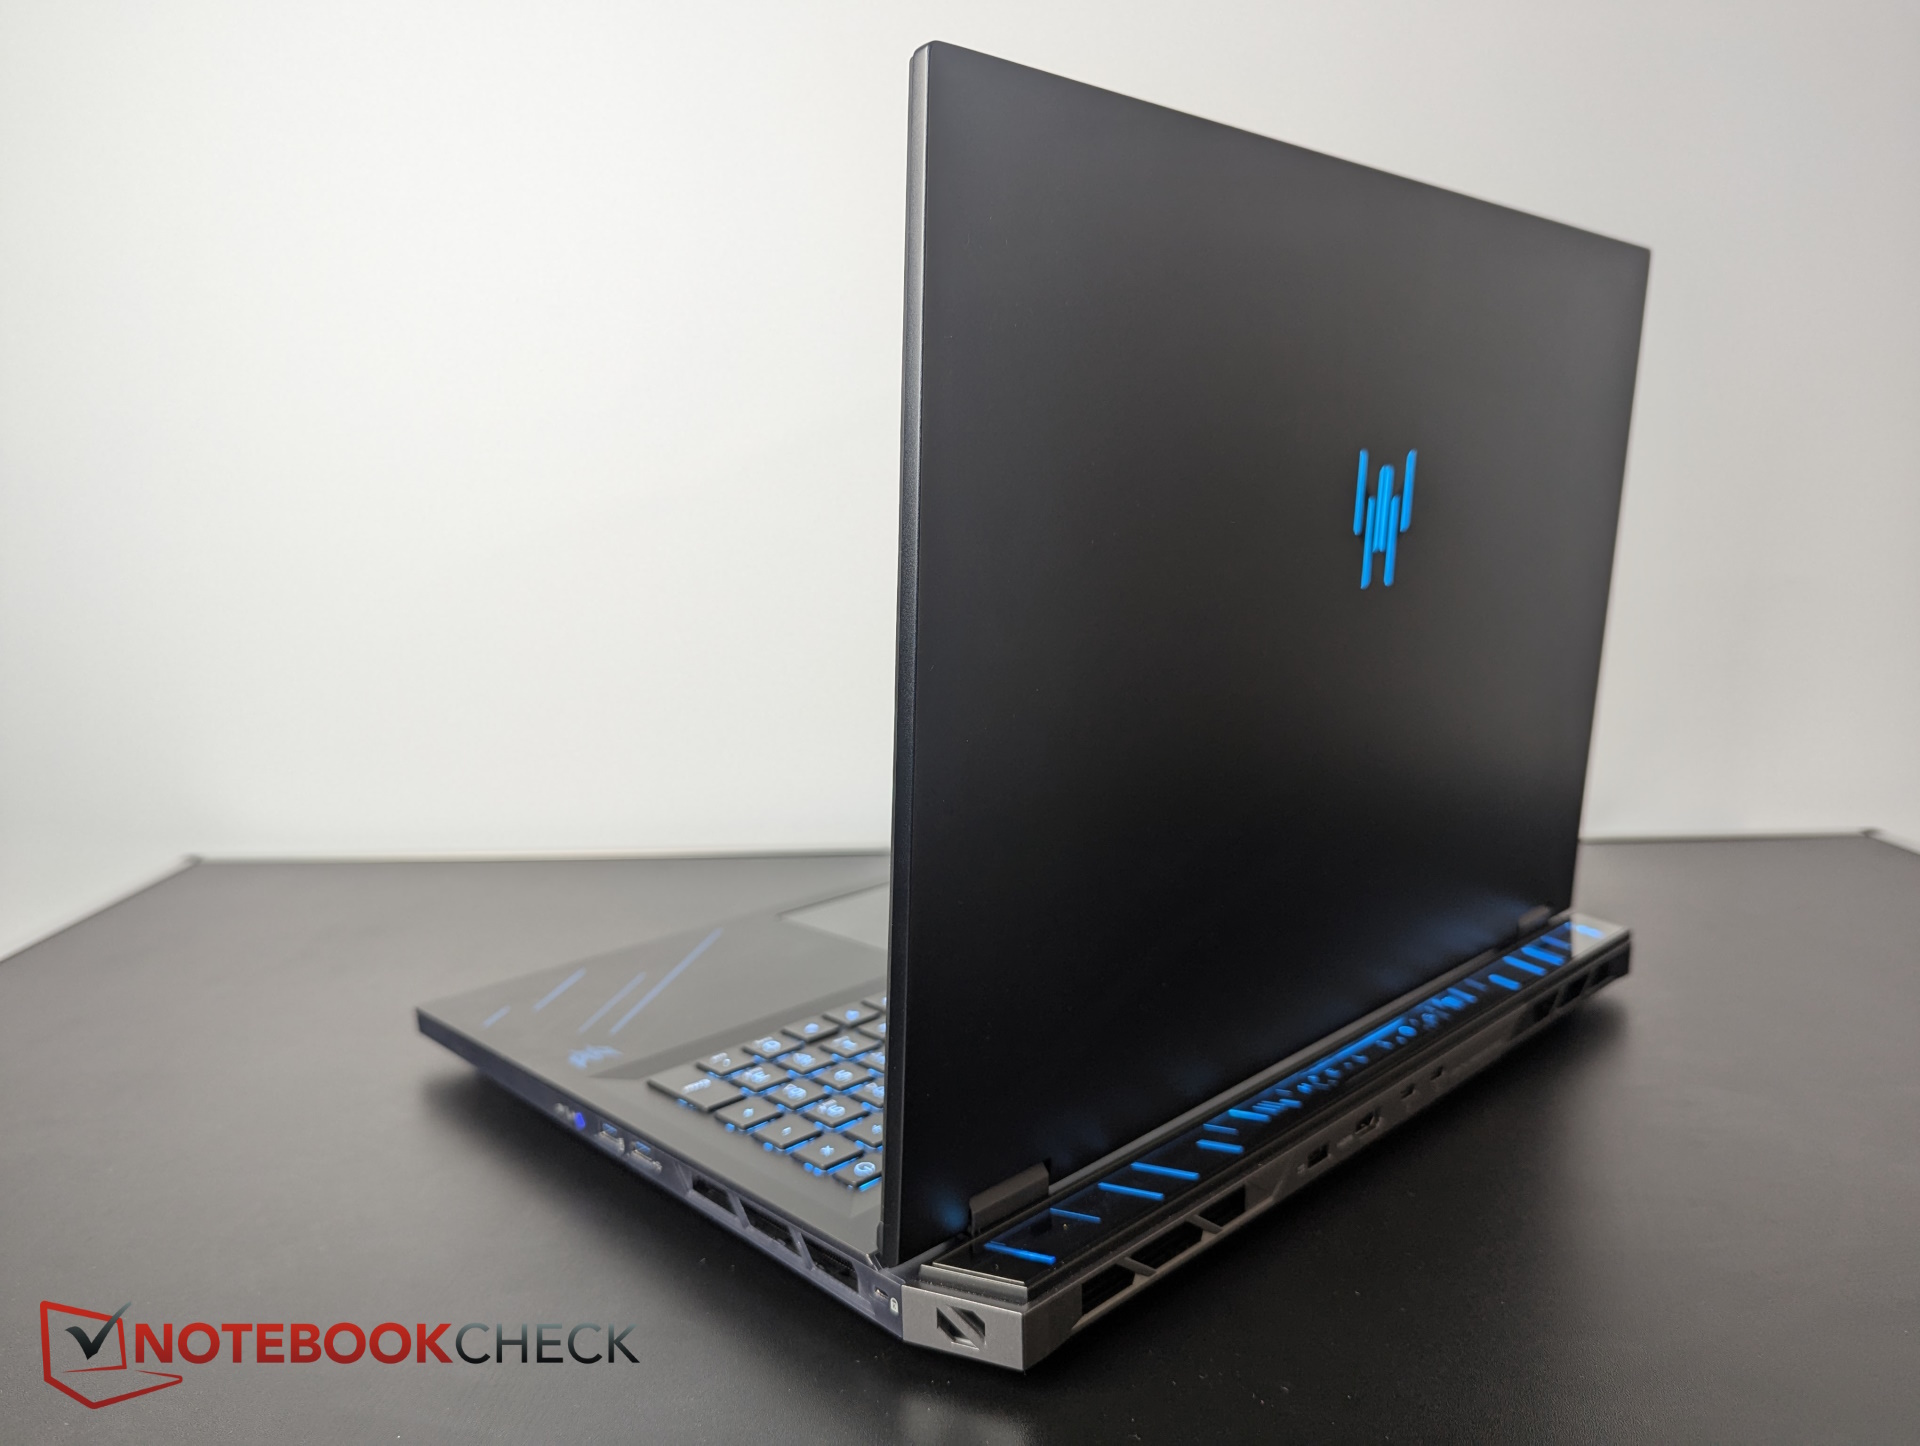
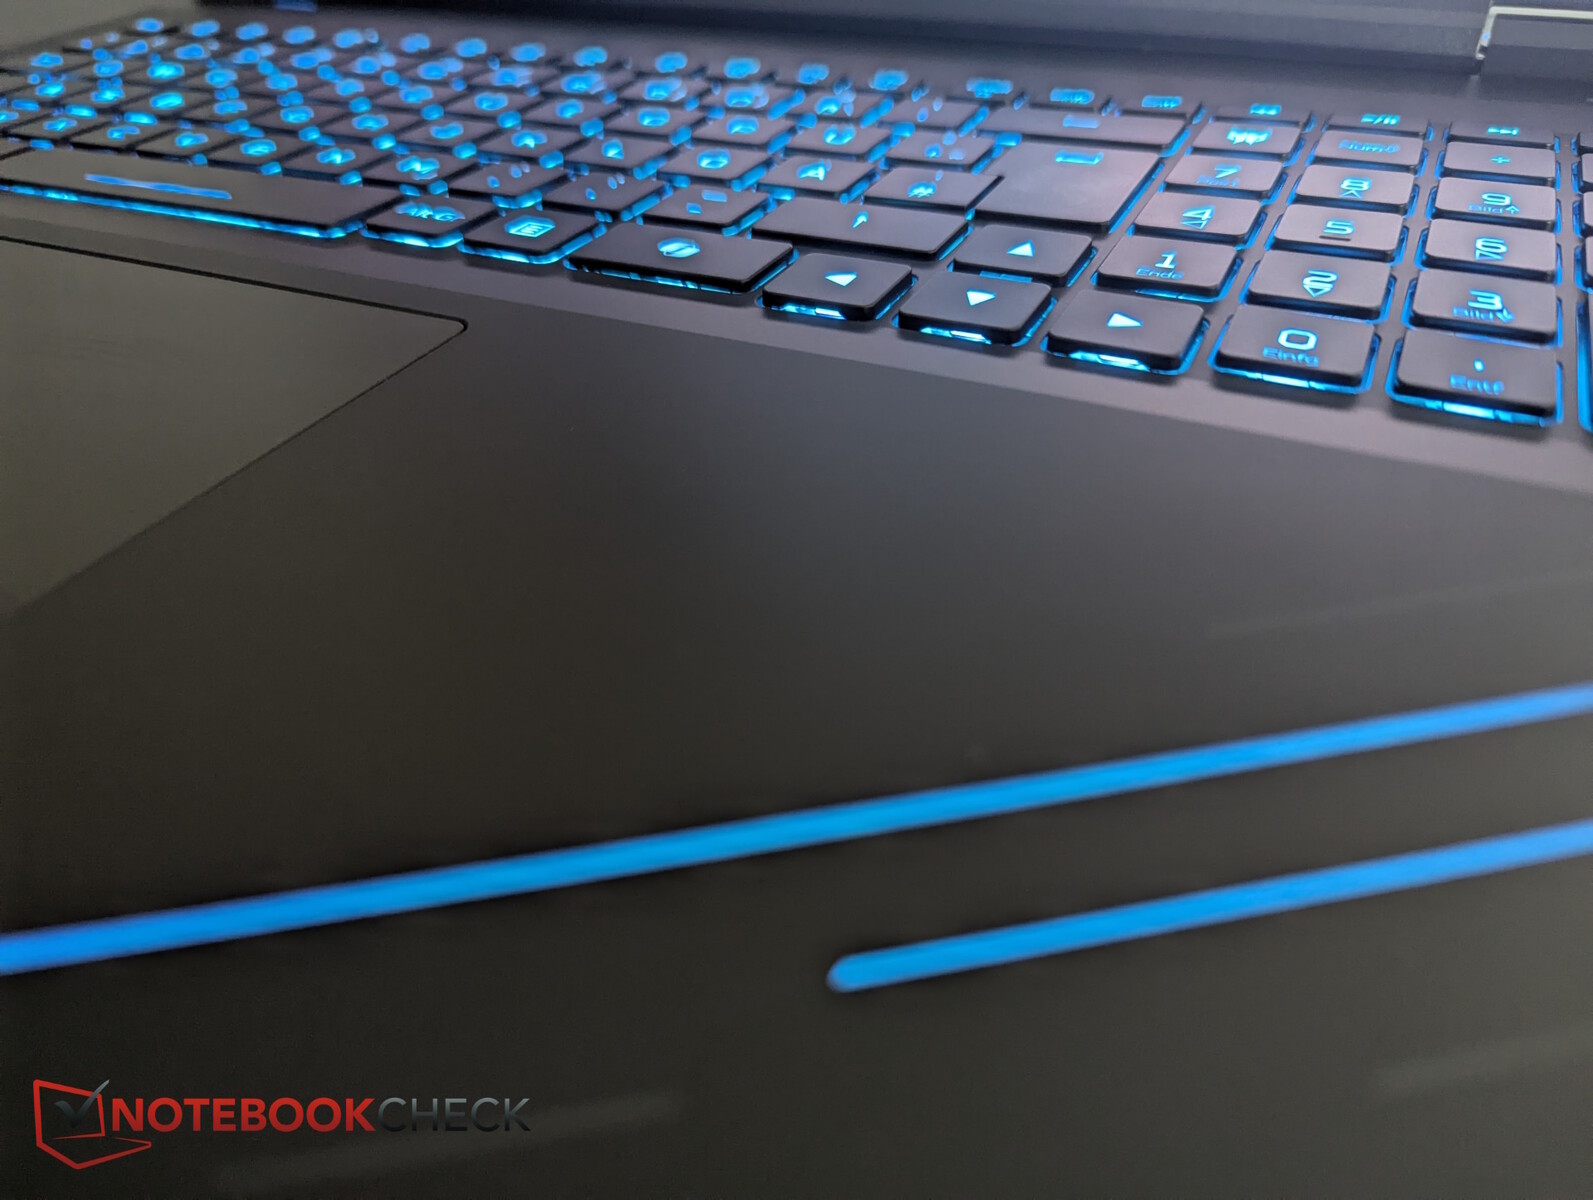
At first glance, the black case with the cooling system protruding to the rear hardly seems to have changed. But when all the lights come on, you can see some differences from the Predecessor. For example, there is now an LED strip that wraps around the front left edge. The base, lid, and air outlet are now also illuminated.
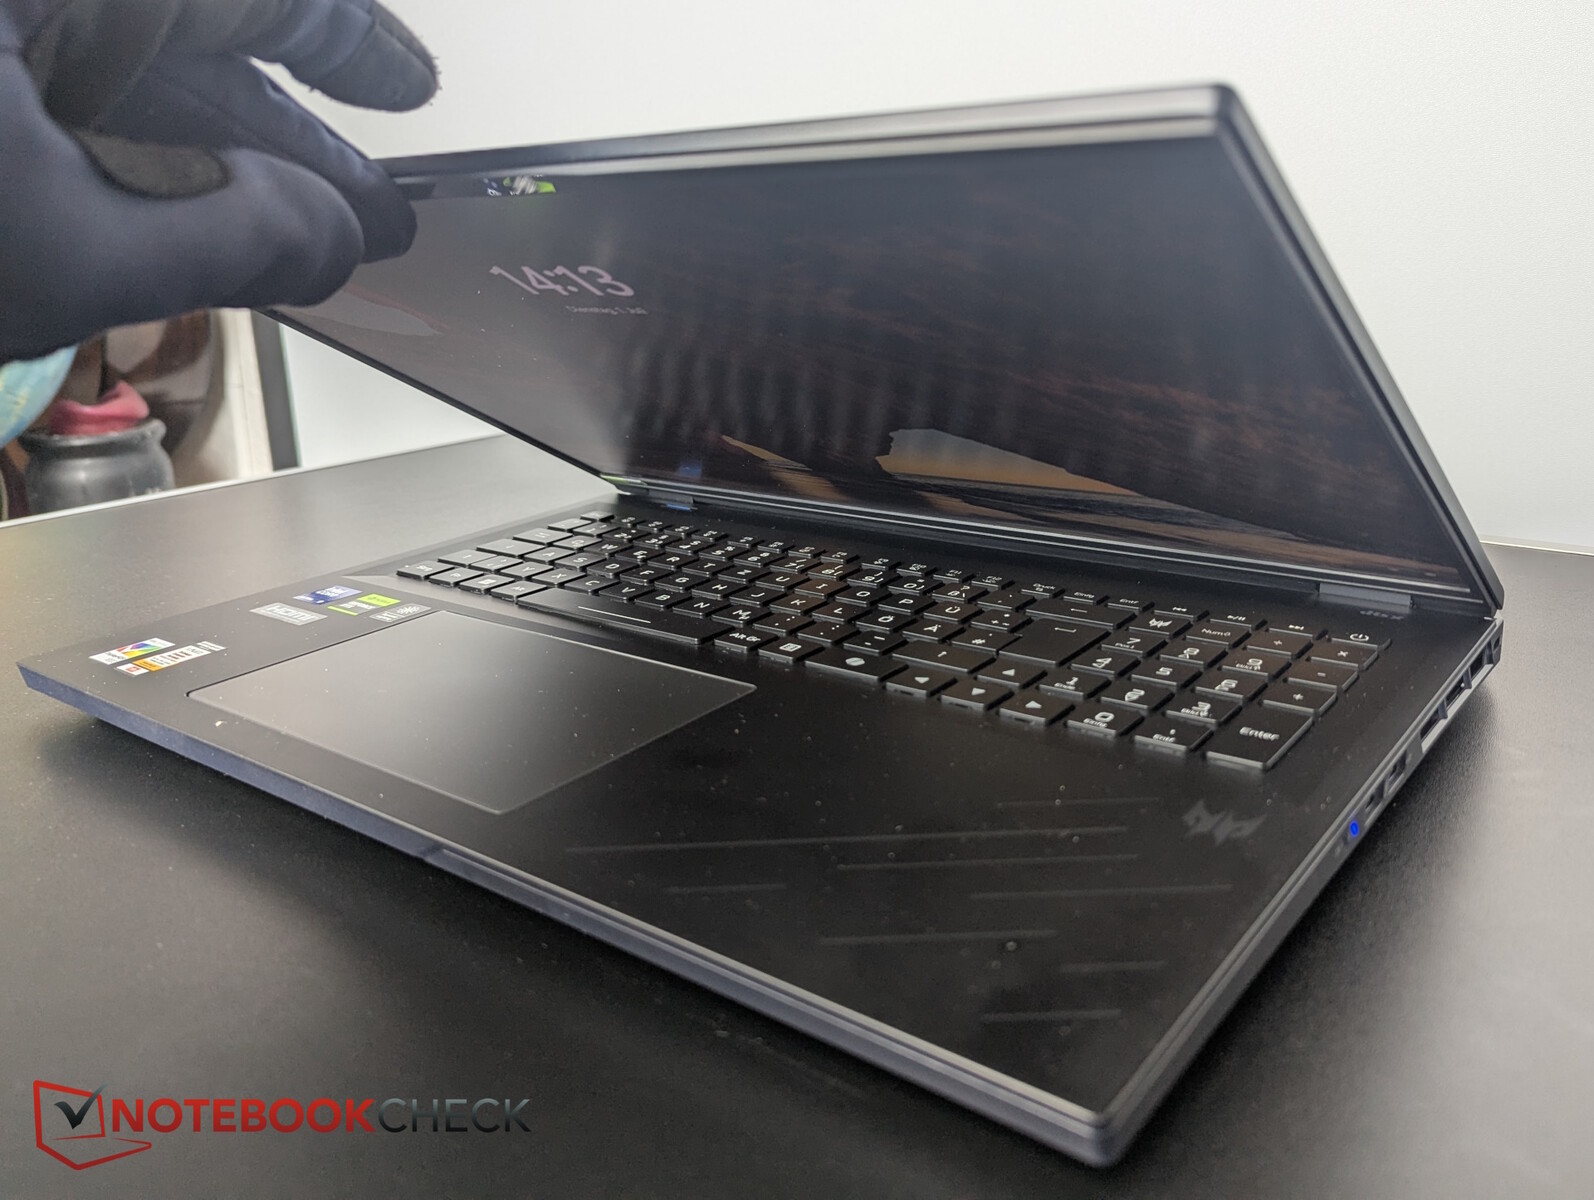
The whole case is made of rigid plastics. The Display opens to approximately 160 degrees, the hinges are sturdy but they automatically close the lid too early.
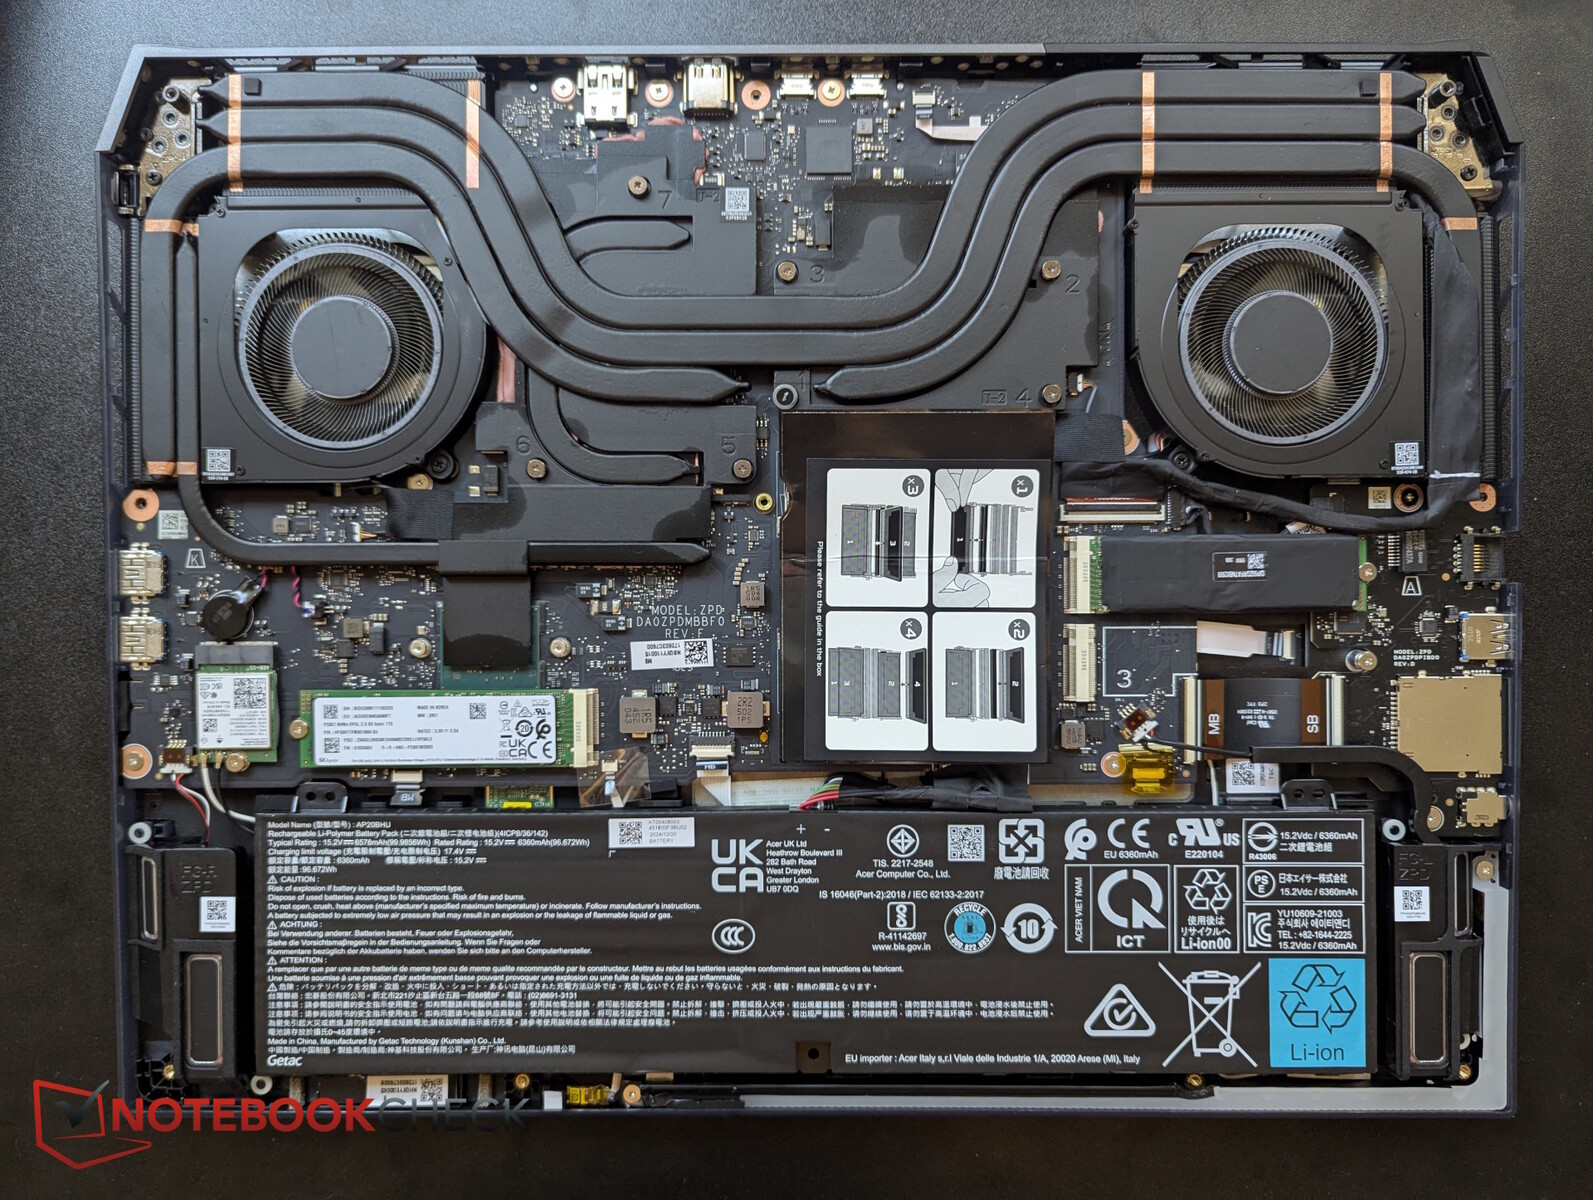
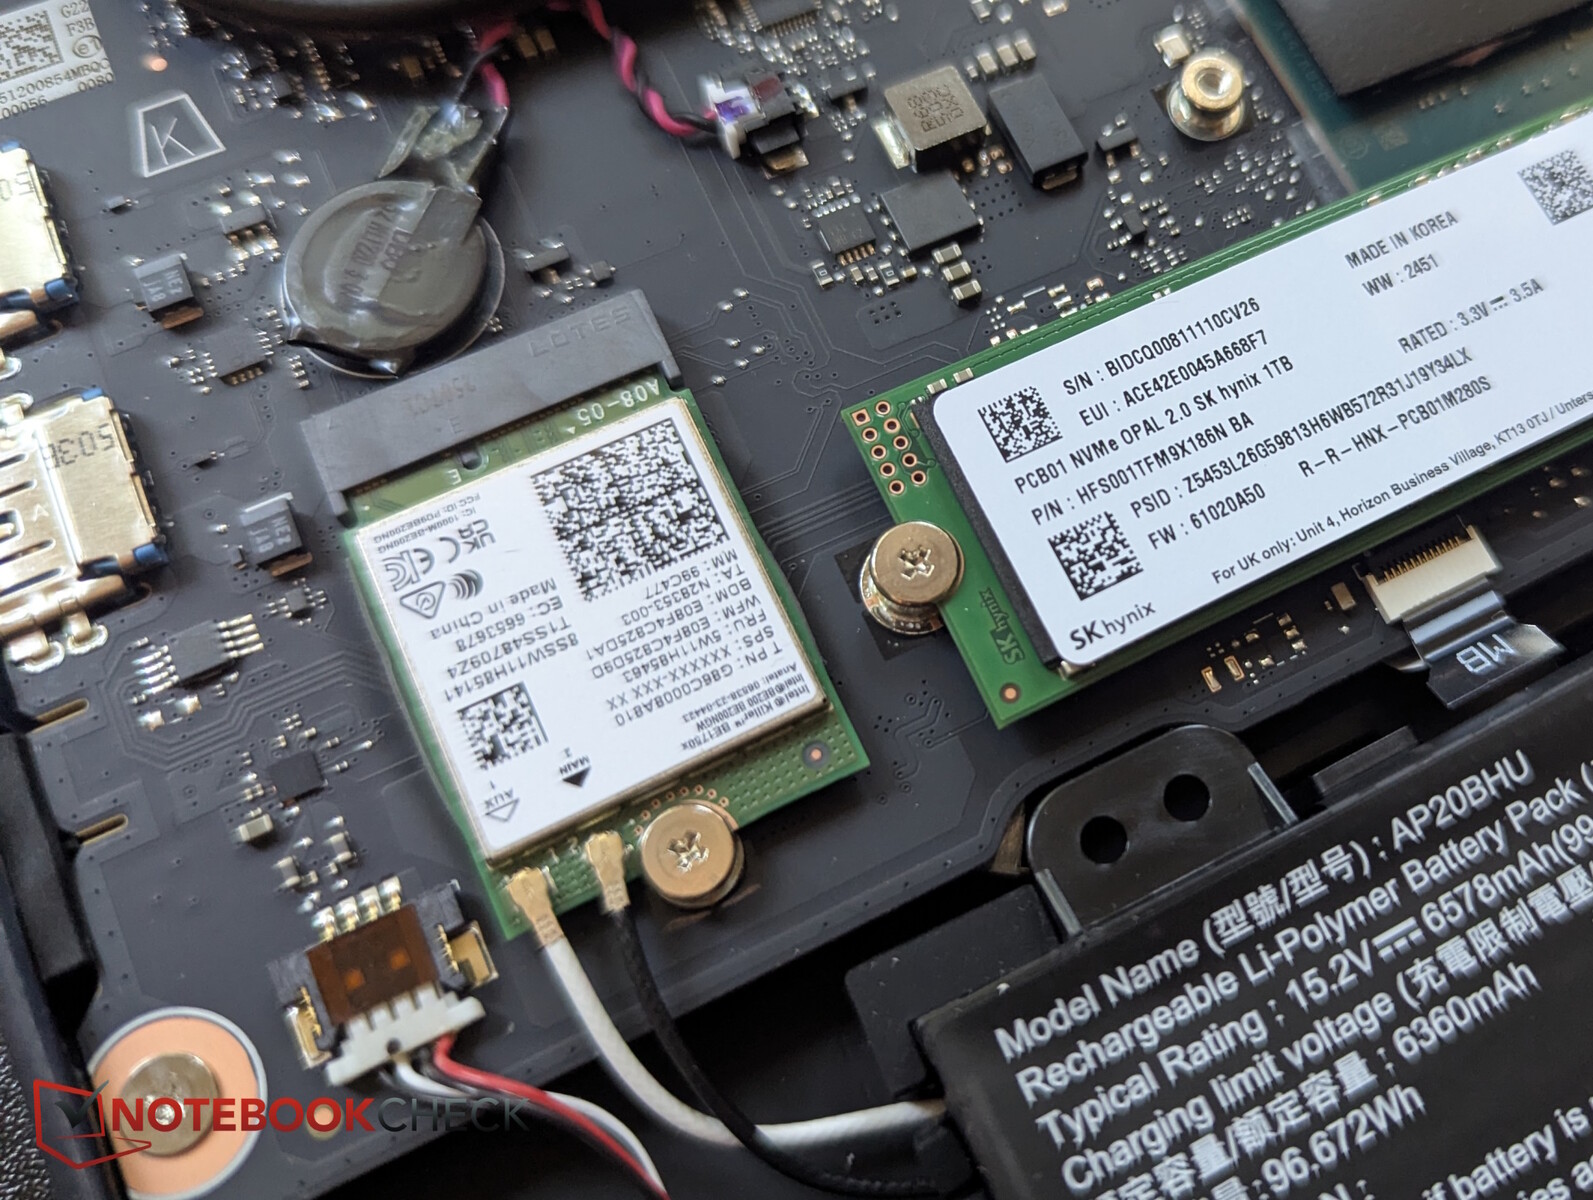
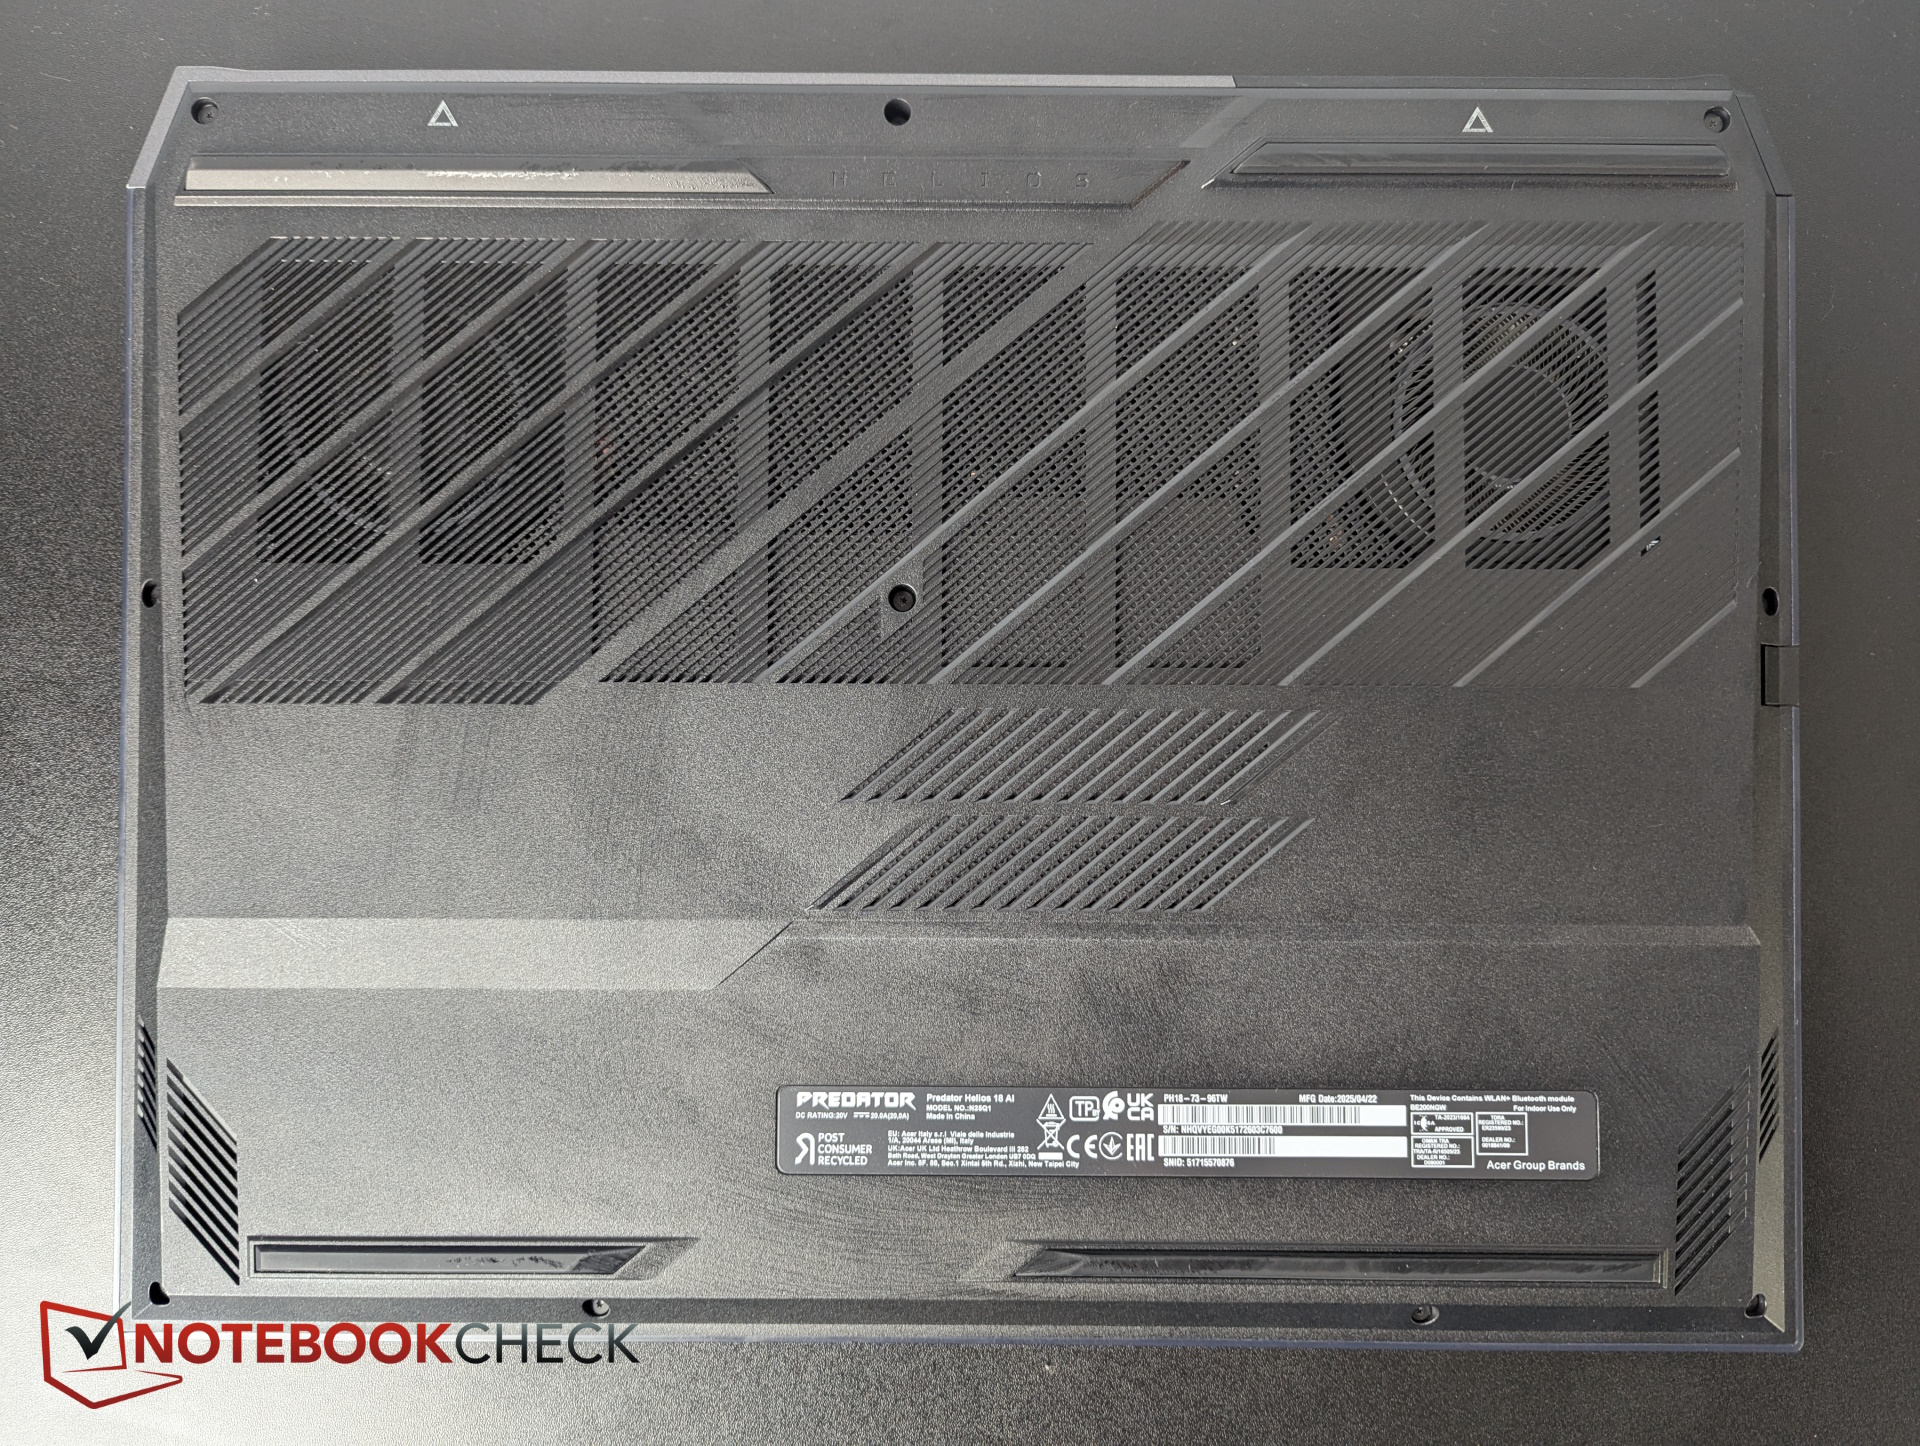
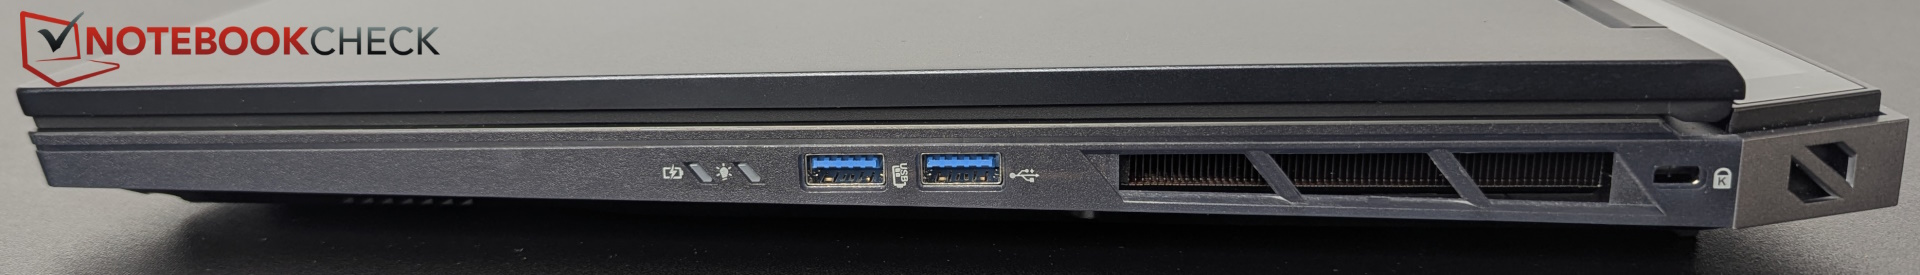
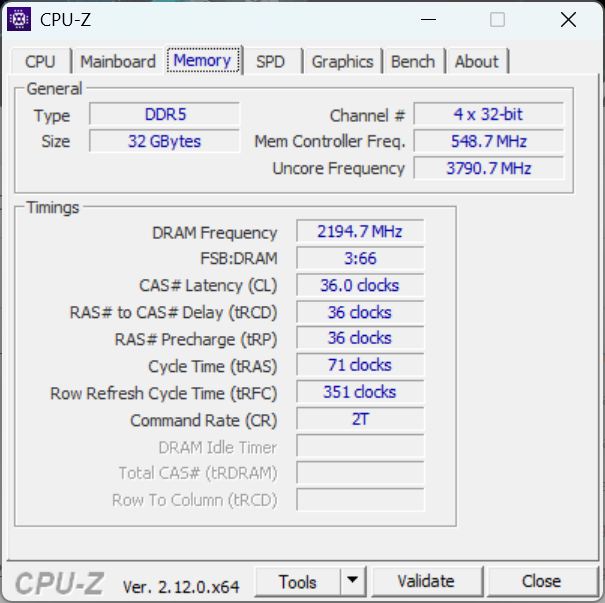
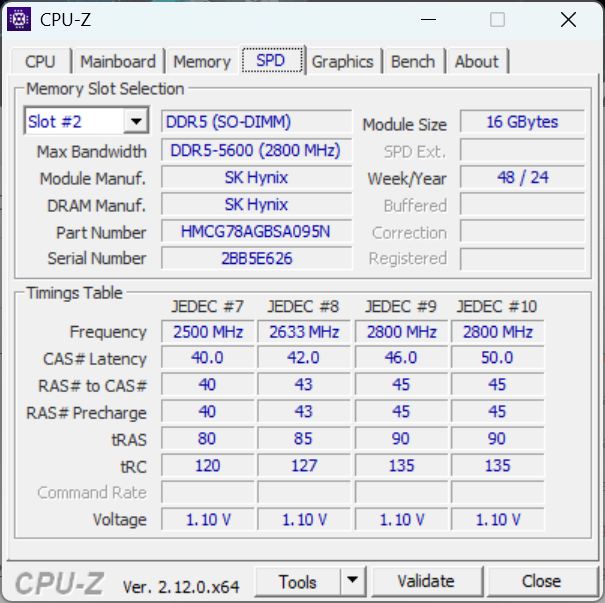
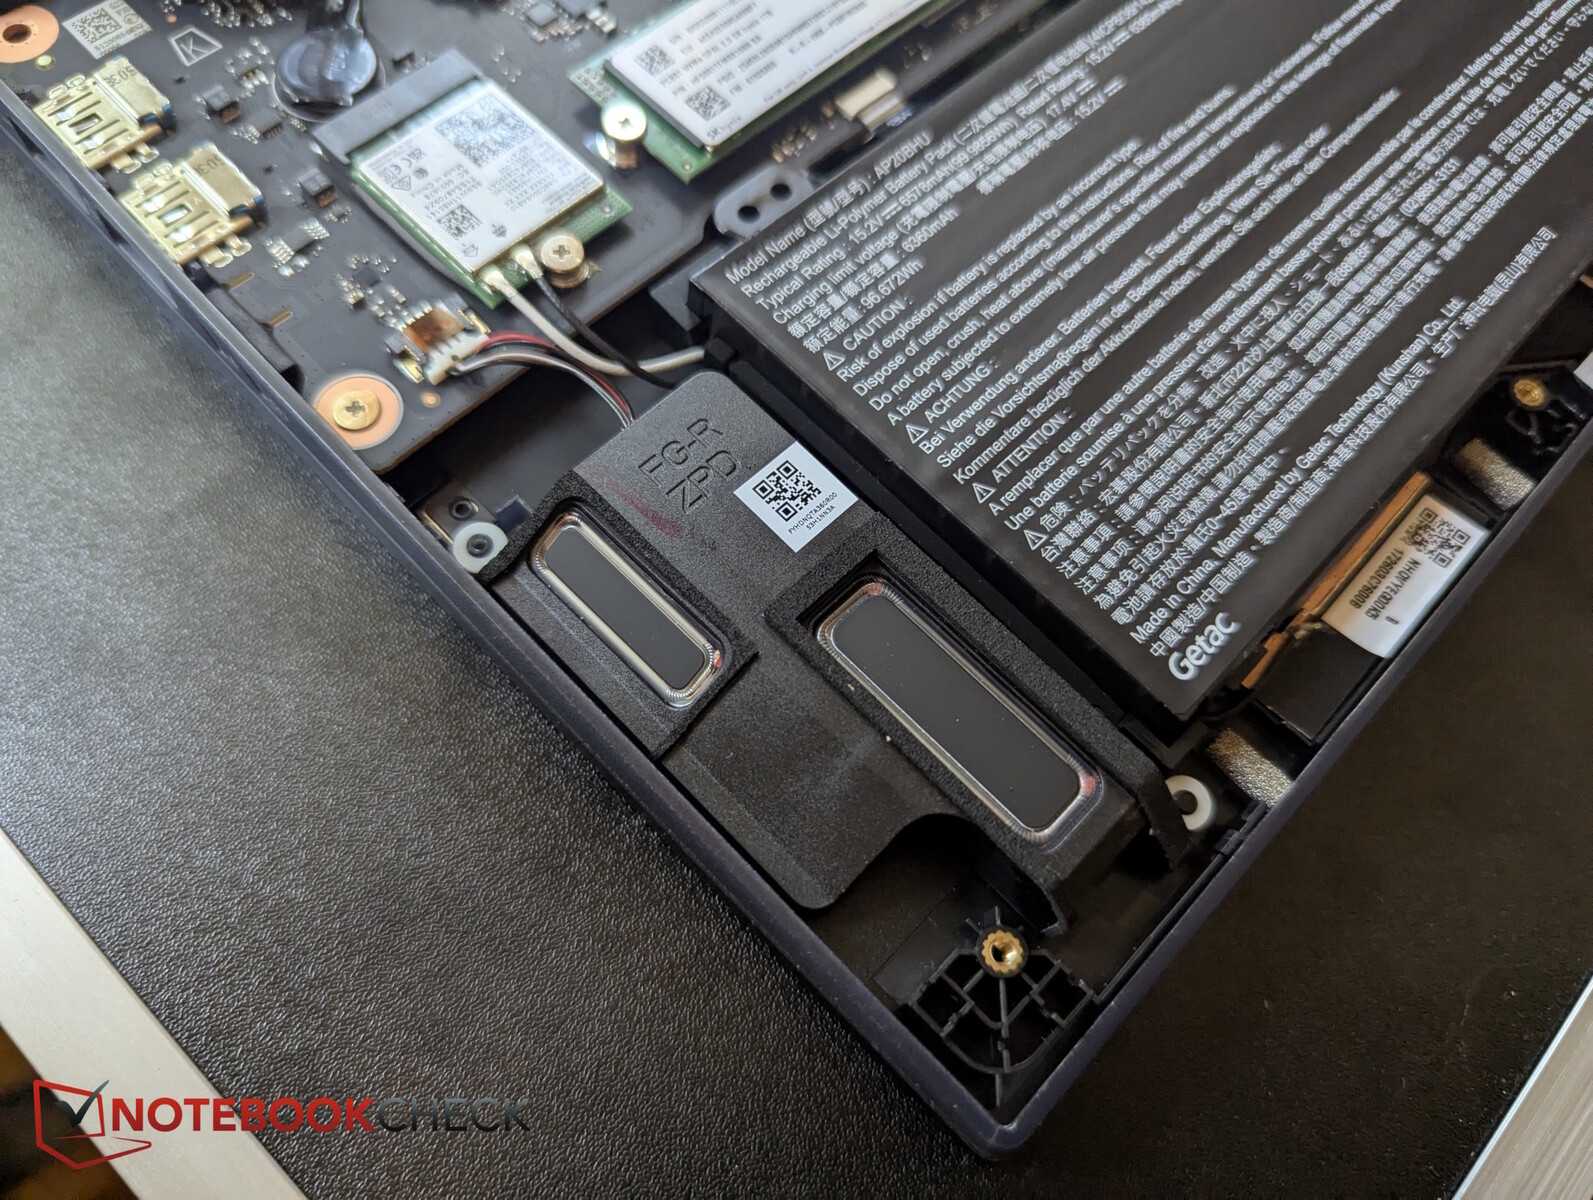
Eleven Phillips screws of equal length hold the underside in place. Inside, we see four RAM and three M.2 SSD slots. The Wi-Fi 7 module is also replaceable. The latter is fast in the 6 GHz network, but slow in the 5 GHz network.

With the same thickness, the new Helios 18 is now slightly shorter on both edges, but almost 200 g heavier. After all, the competition is similarly large, thick, and heavy.
The Full HD webcam is no longer quite up to date; the image appears milky, the sharpness could be much better, but the color deviations are acceptable.
| SD Card Reader | |
| average JPG Copy Test (av. of 3 runs) | |
| MSI Vector A18 HX A9W (Toshiba Exceria Pro SDXC 64 GB UHS-II) | |
| Medion Erazer Beast 18 X1 MD62731 (AV PRO microSD 128 GB V60) | |
| Average of class Gaming (20.9 - 210, n=54, last 2 years) | |
| MSI Titan 18 HX AI A2XWJG (AV PRO microSD 128 GB V60) | |
| Acer Predator Helios 18 AI | |
| MSI Raider A18 HX A9WIG-080 | |
| maximum AS SSD Seq Read Test (1GB) | |
| MSI Vector A18 HX A9W (Toshiba Exceria Pro SDXC 64 GB UHS-II) | |
| MSI Raider A18 HX A9WIG-080 | |
| Medion Erazer Beast 18 X1 MD62731 (AV PRO microSD 128 GB V60) | |
| Average of class Gaming (25.5 - 261, n=51, last 2 years) | |
| MSI Titan 18 HX AI A2XWJG (AV PRO microSD 128 GB V60) | |
| Acer Predator Helios 18 AI | |


Sustainability
Acer does not provide any information on CO2 emissions. The packaging consists mainly of cardboard, which can even be used as a headphone stand. However, the power supply unit was wrapped in plastic, while the Acer shipping box contained polystyrene.
Input devices - Predator button and lots of RGB
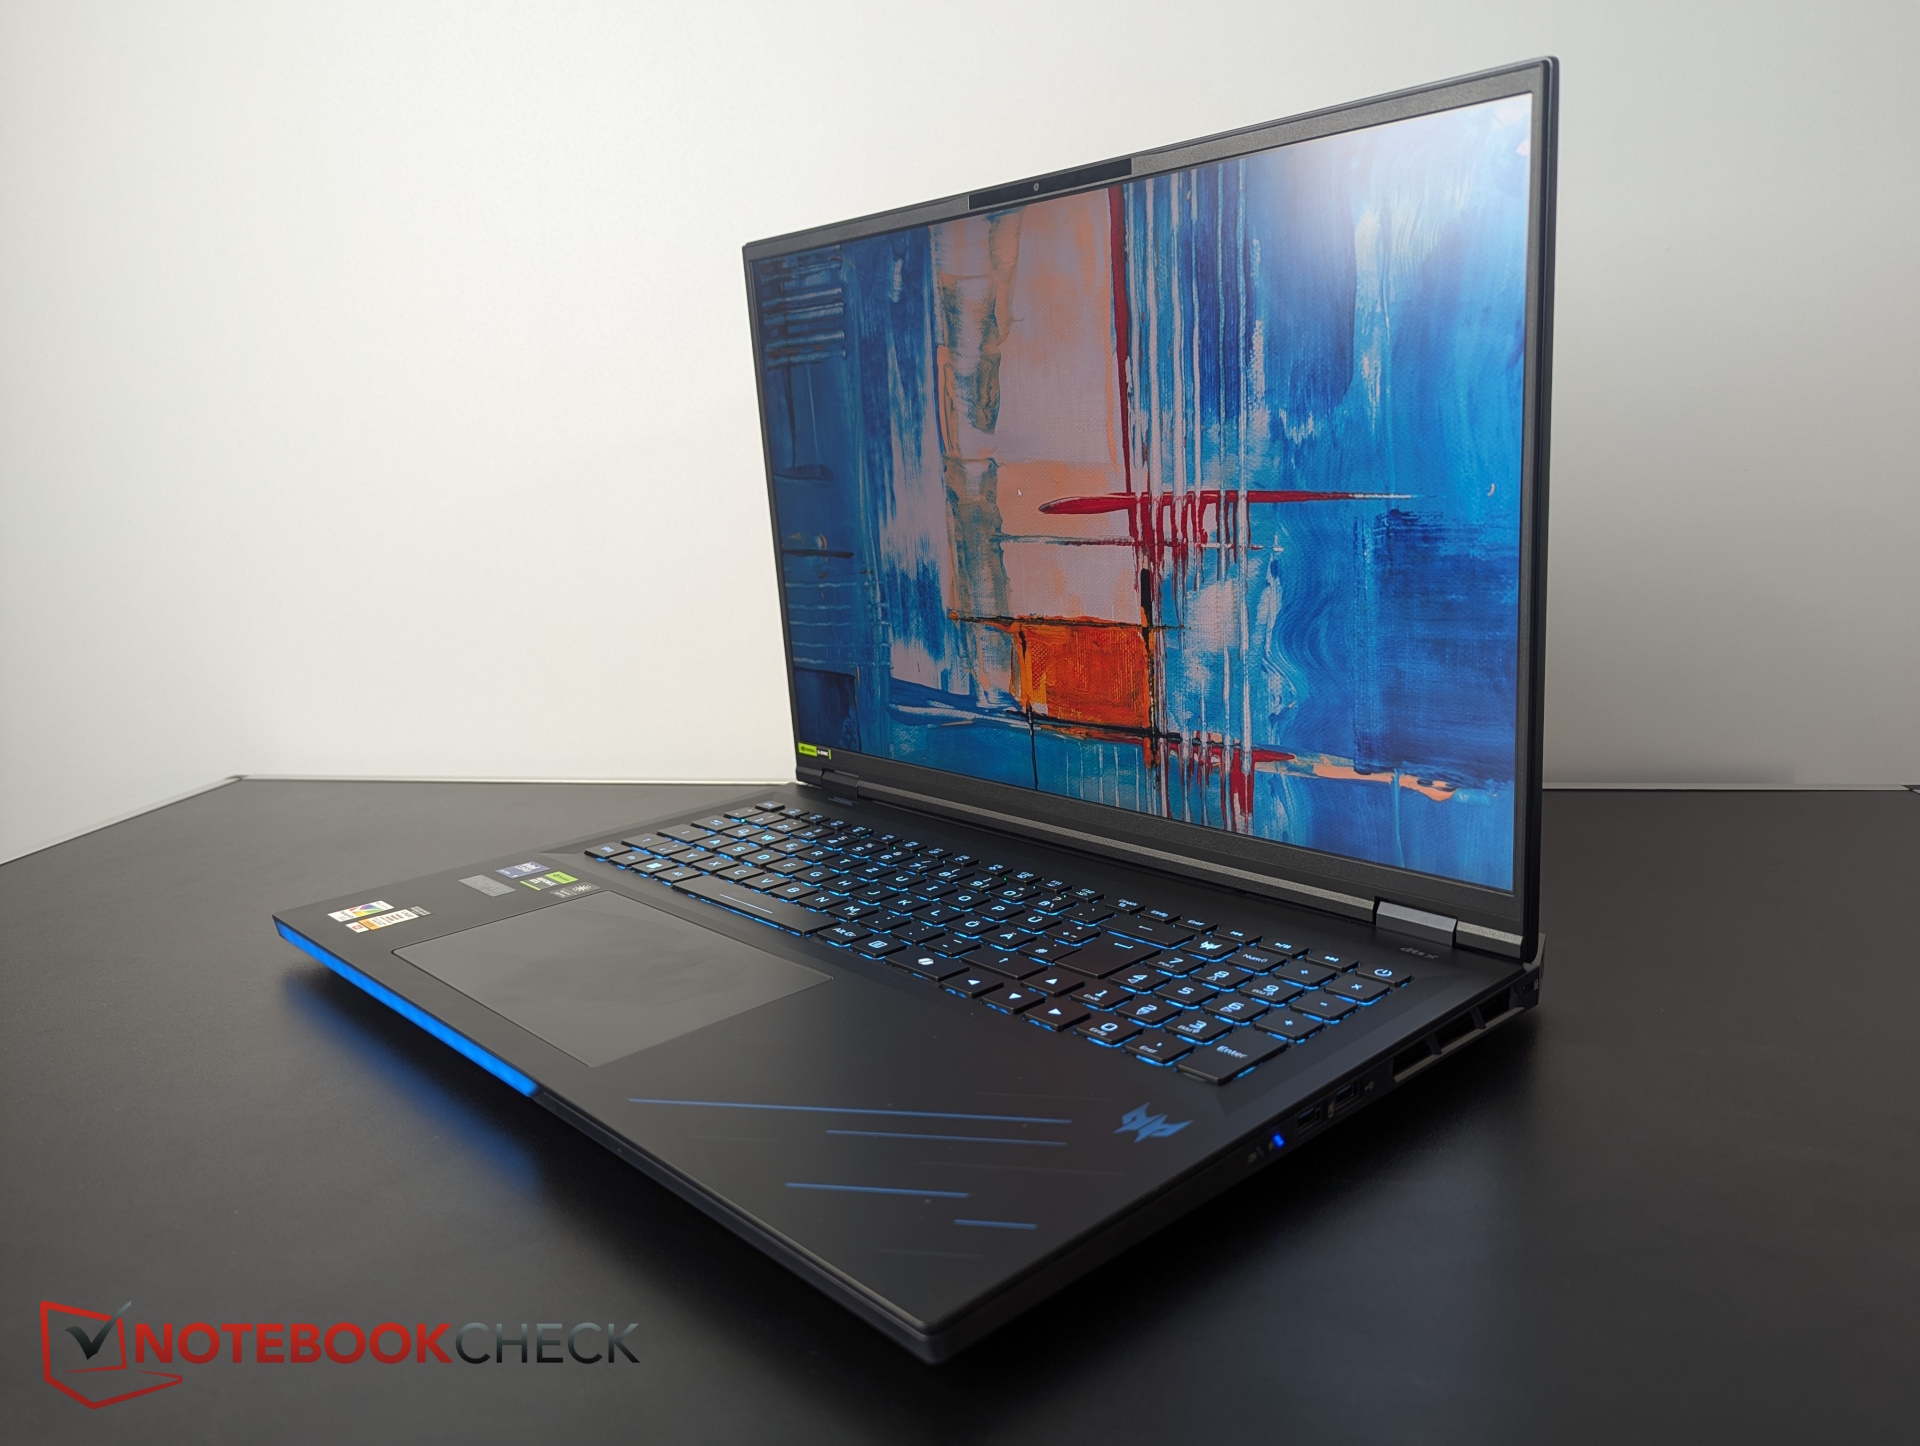
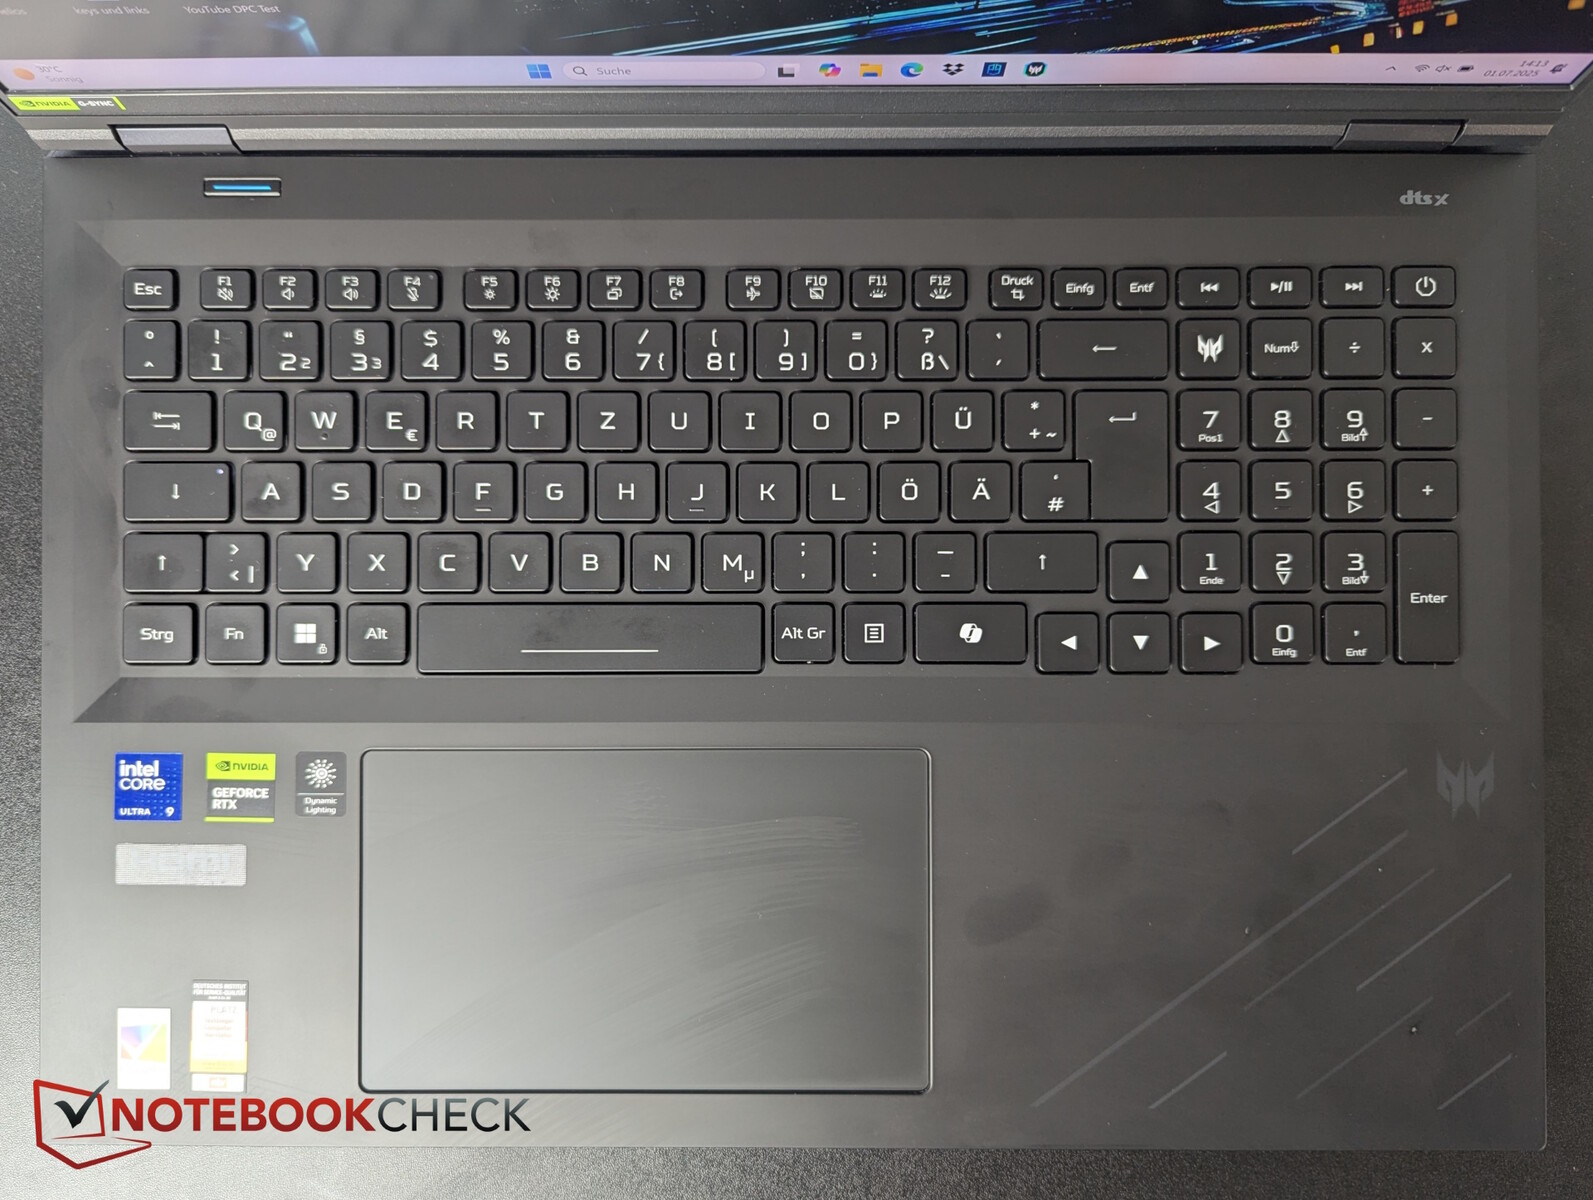
Thanks to the 18-inch screen, there is also a large NumPad on the right. The arrow keys are also a standard size. An additional Predator button launches the Control Center. A mode switch is designed separately at the top left.
The keys have a short to medium travel with good feedback. The keystroke noise is moderate; only the space bar is slightly louder.
The touchpad is huge, approximately 15.2 x 9 cm, and offers good gliding properties, even with slow movements. However, the integrated keys feel and sound a little too "springy" when typing, and they rattle slightly. Clicks trigger quite reliably, but taps are not always reliable.
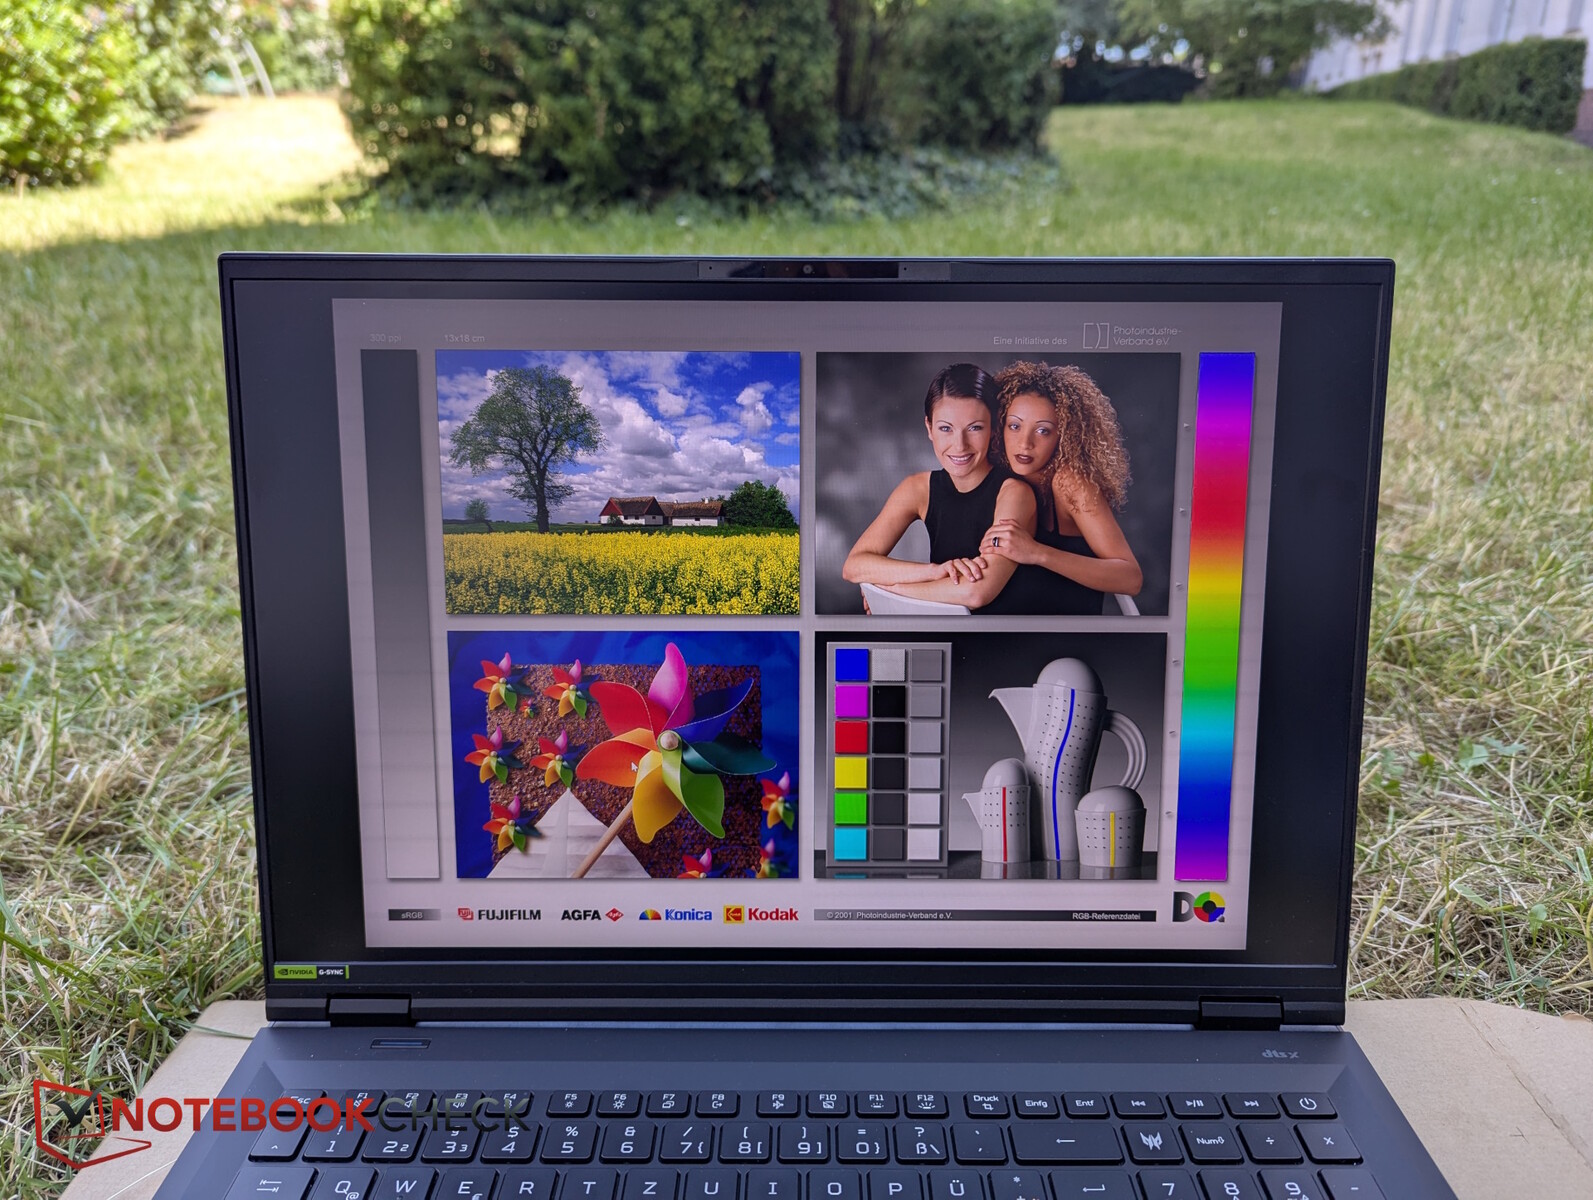
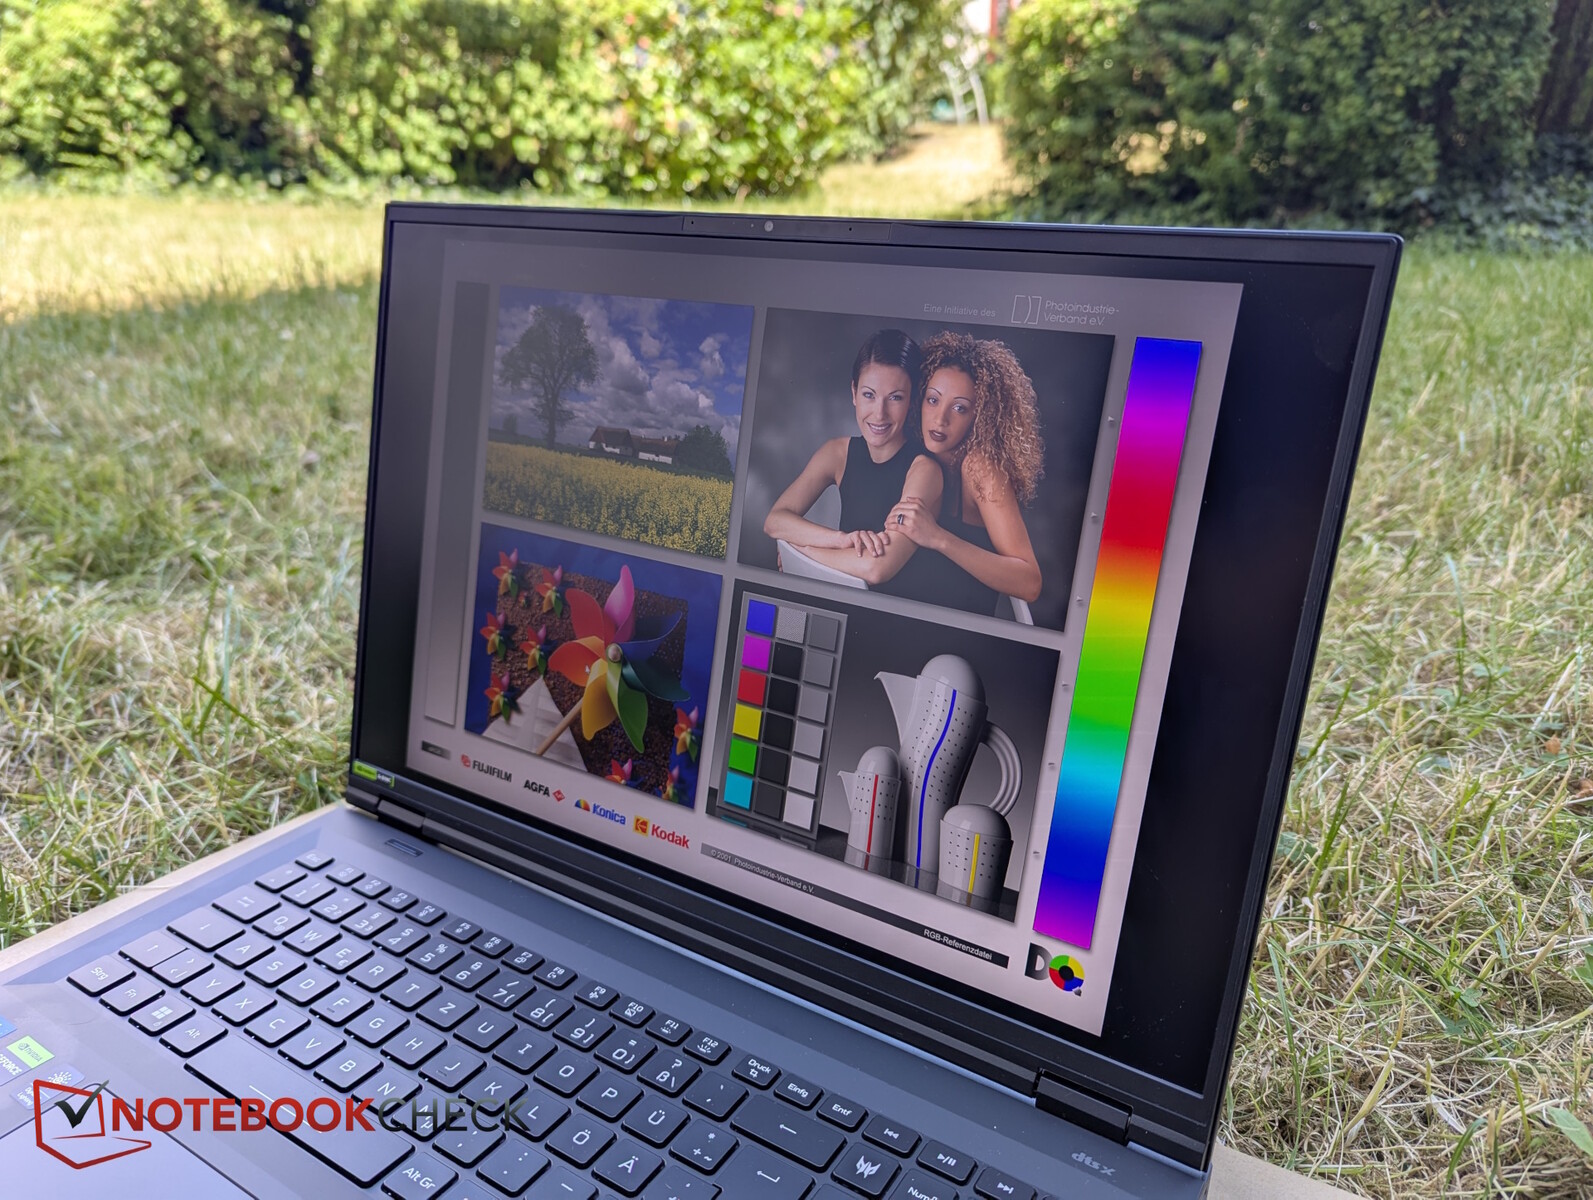
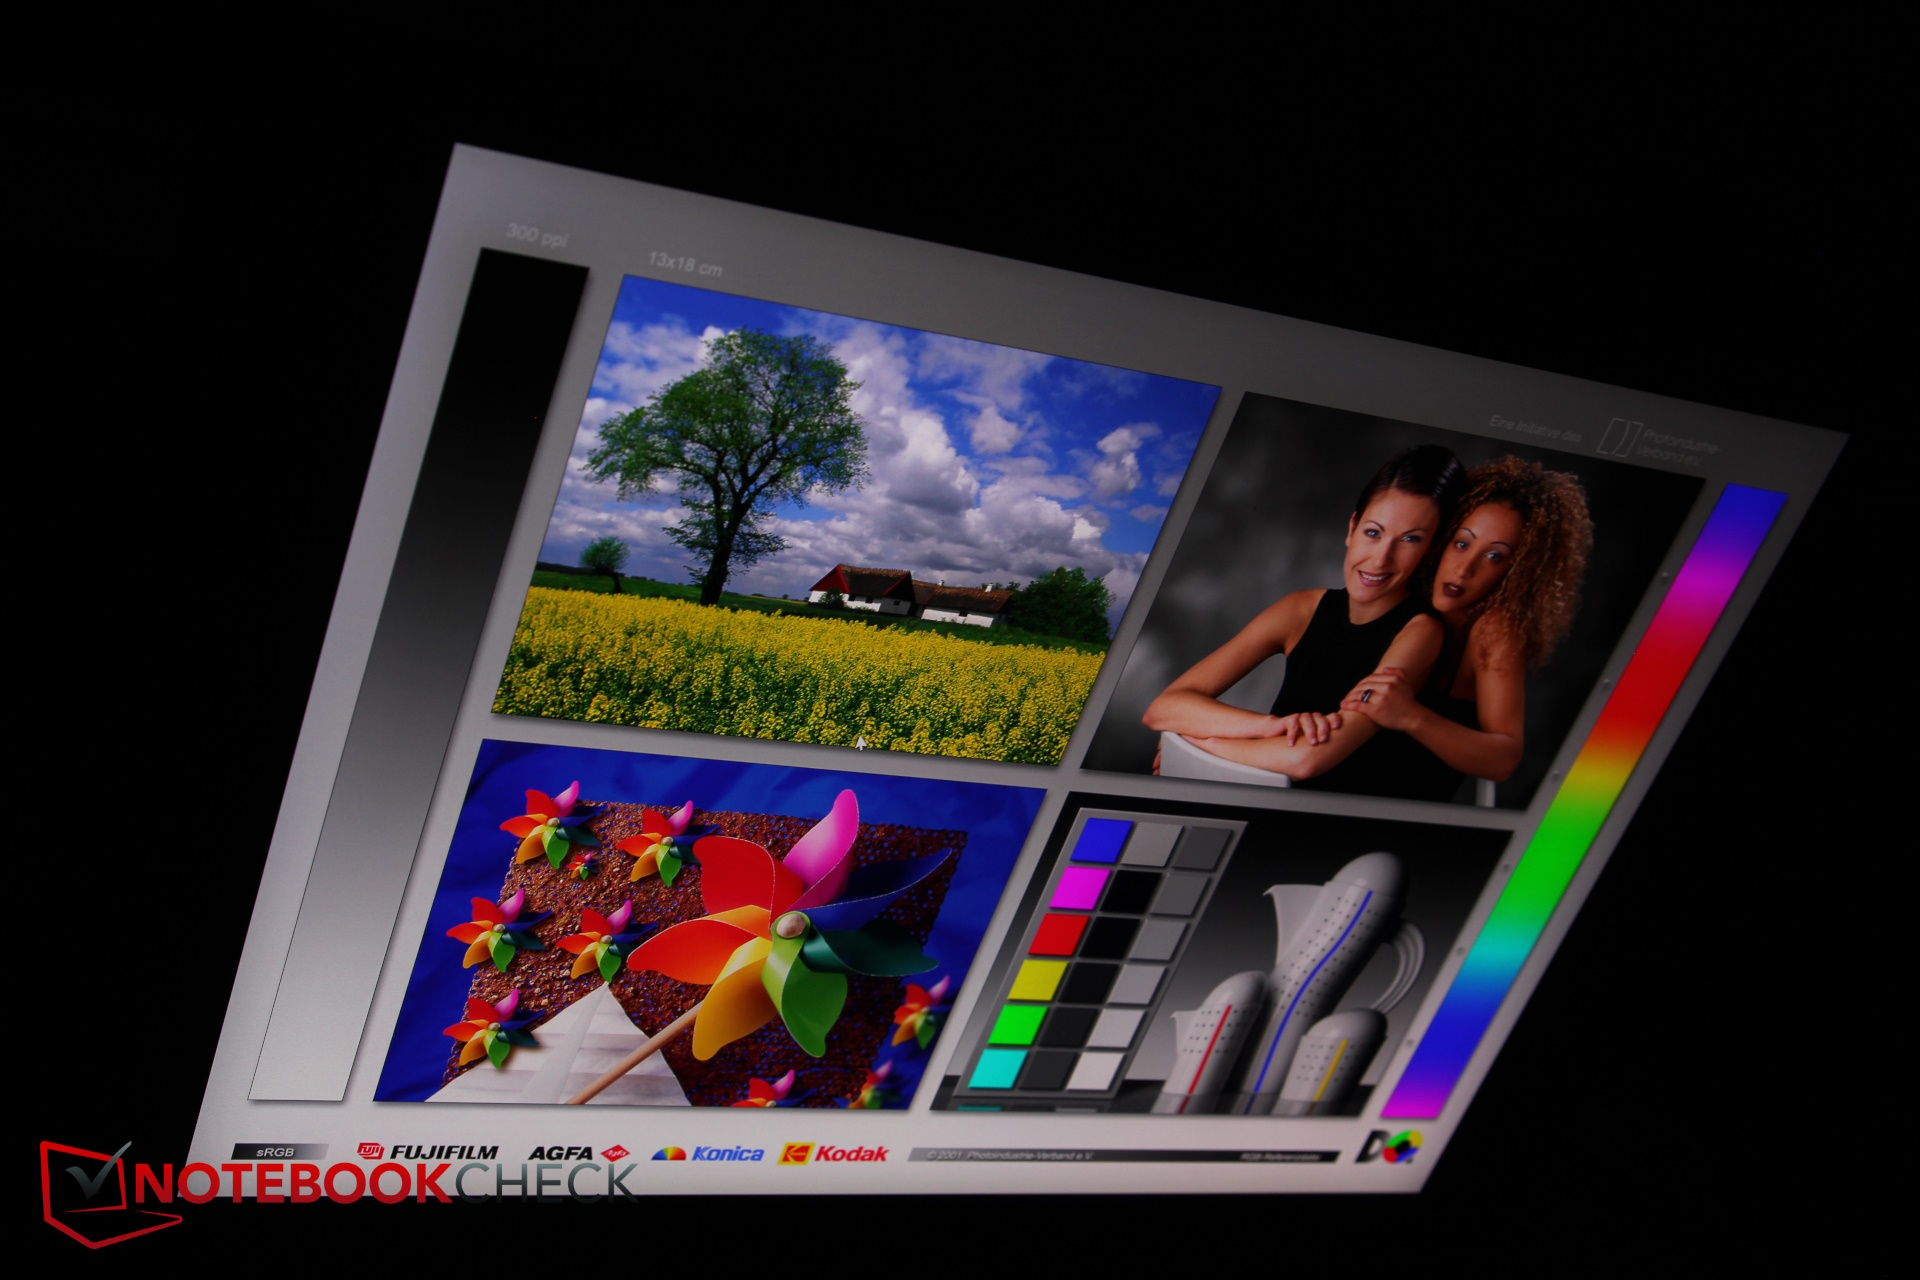
Display - 1,600p mini LED
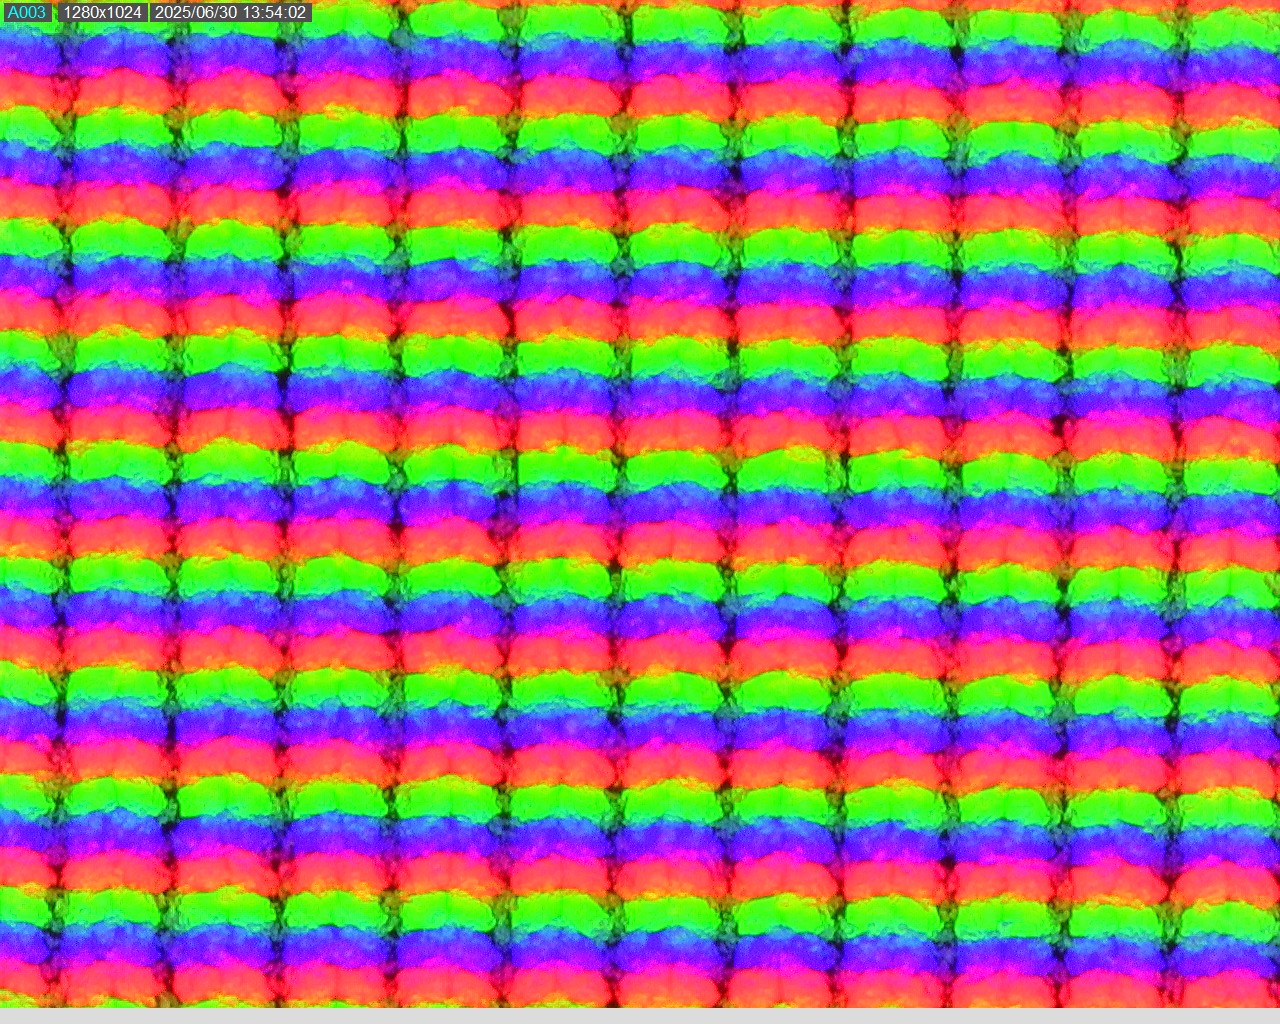
In our case, the Helios is equipped with a QHD mini-LED display with 250 Hz, whereas the 4K dual-mode display advertised by Acer on the website is only available with the RTX 5090 laptop.
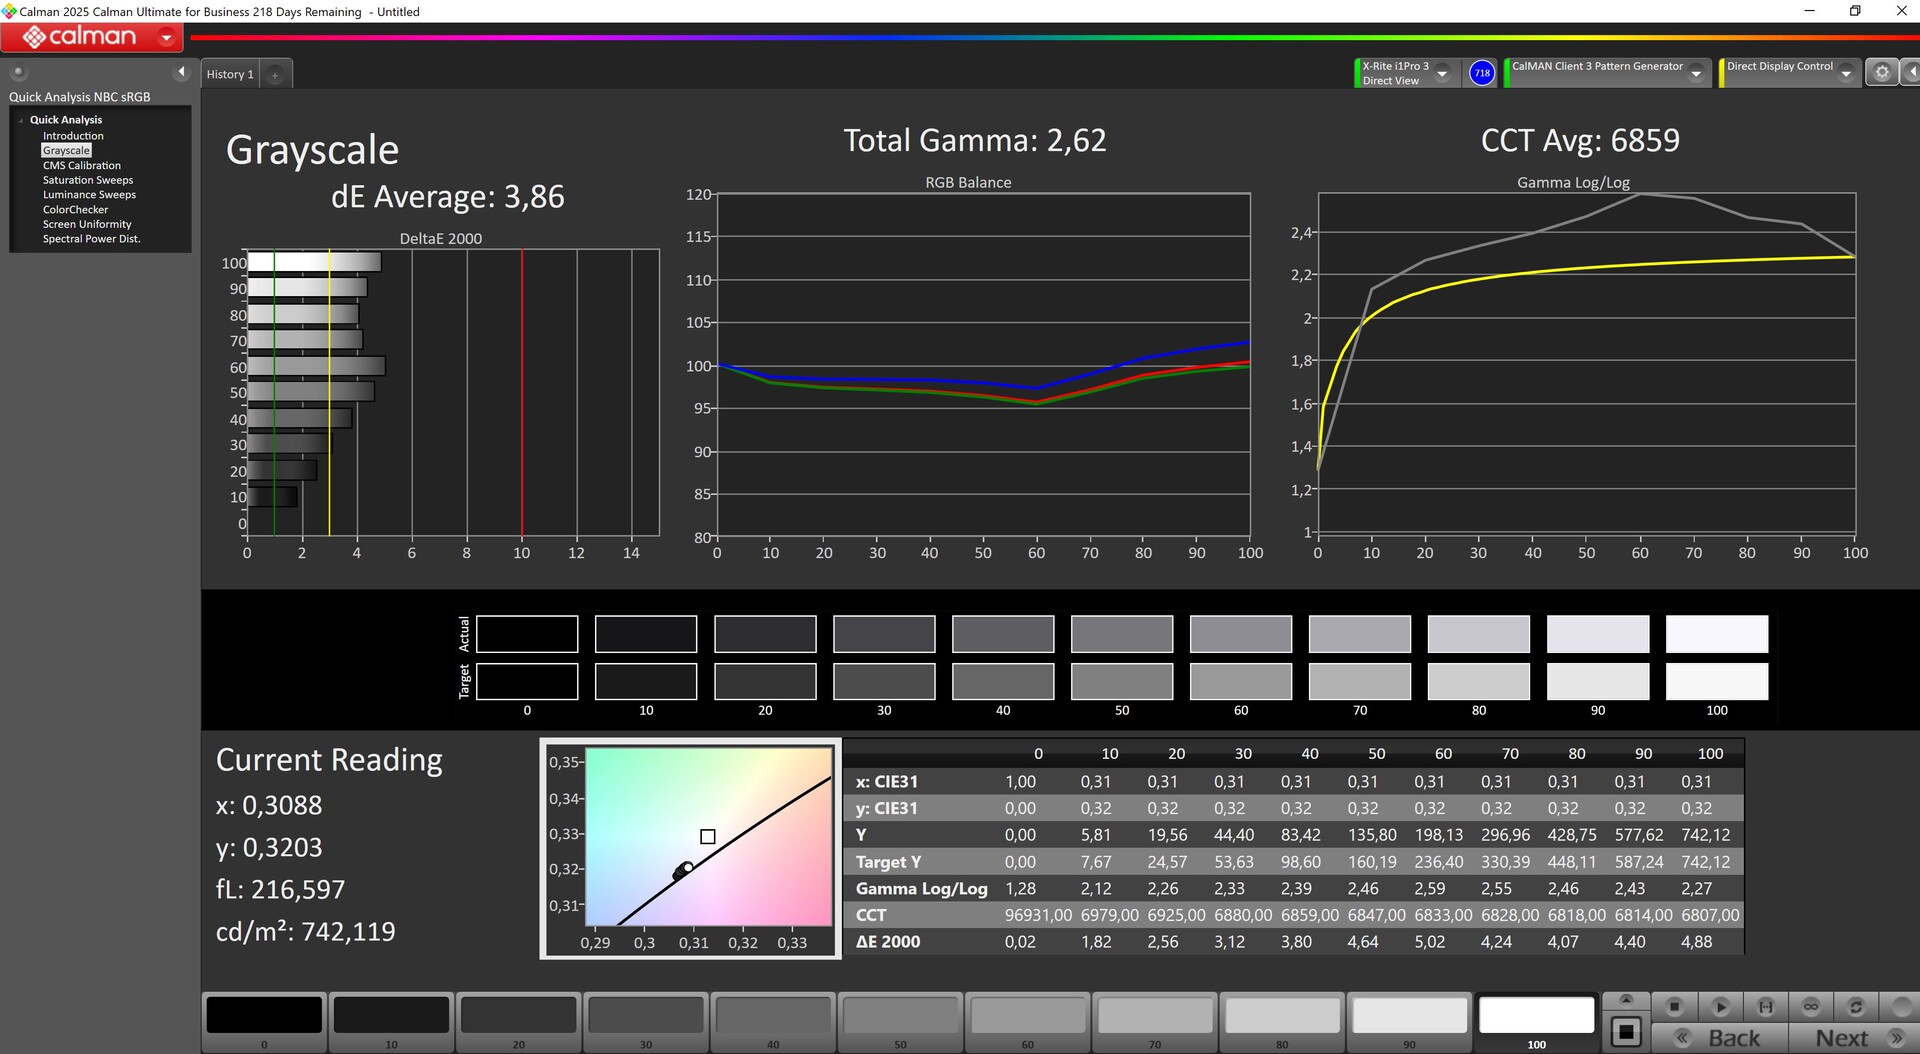
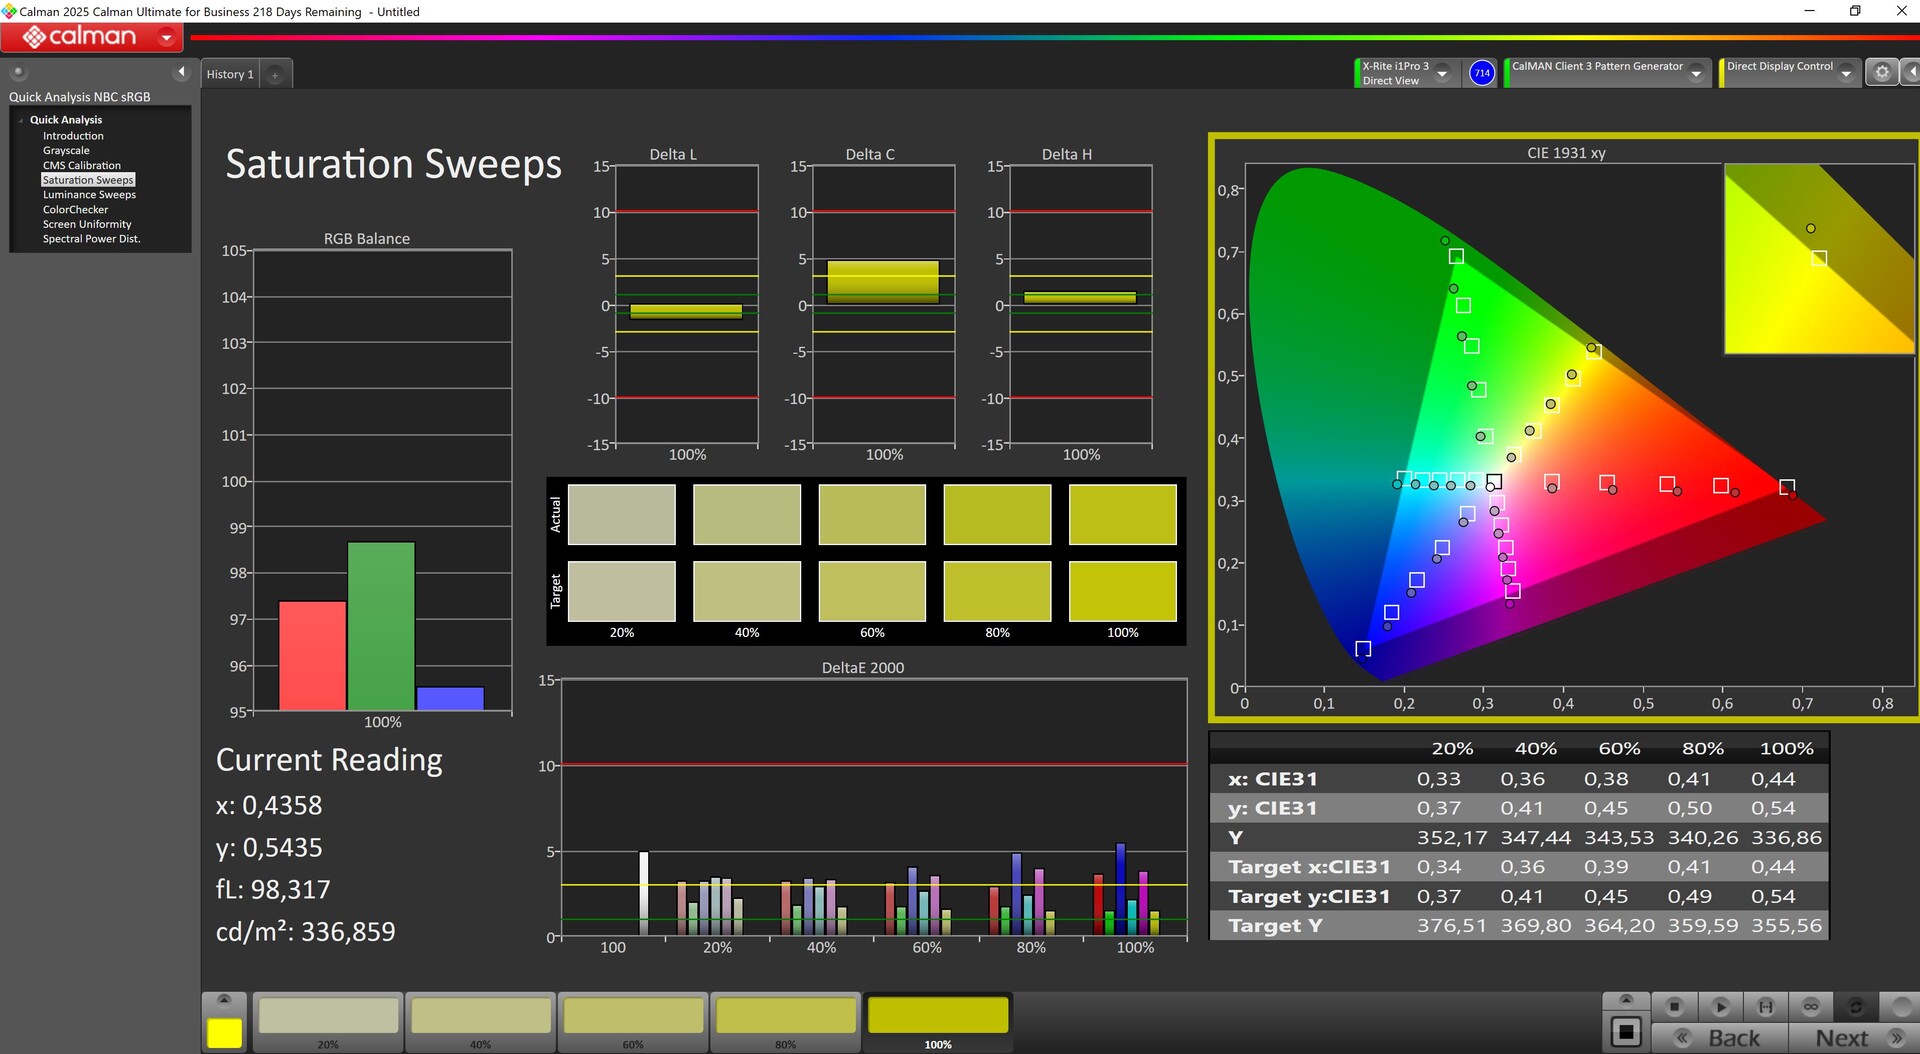
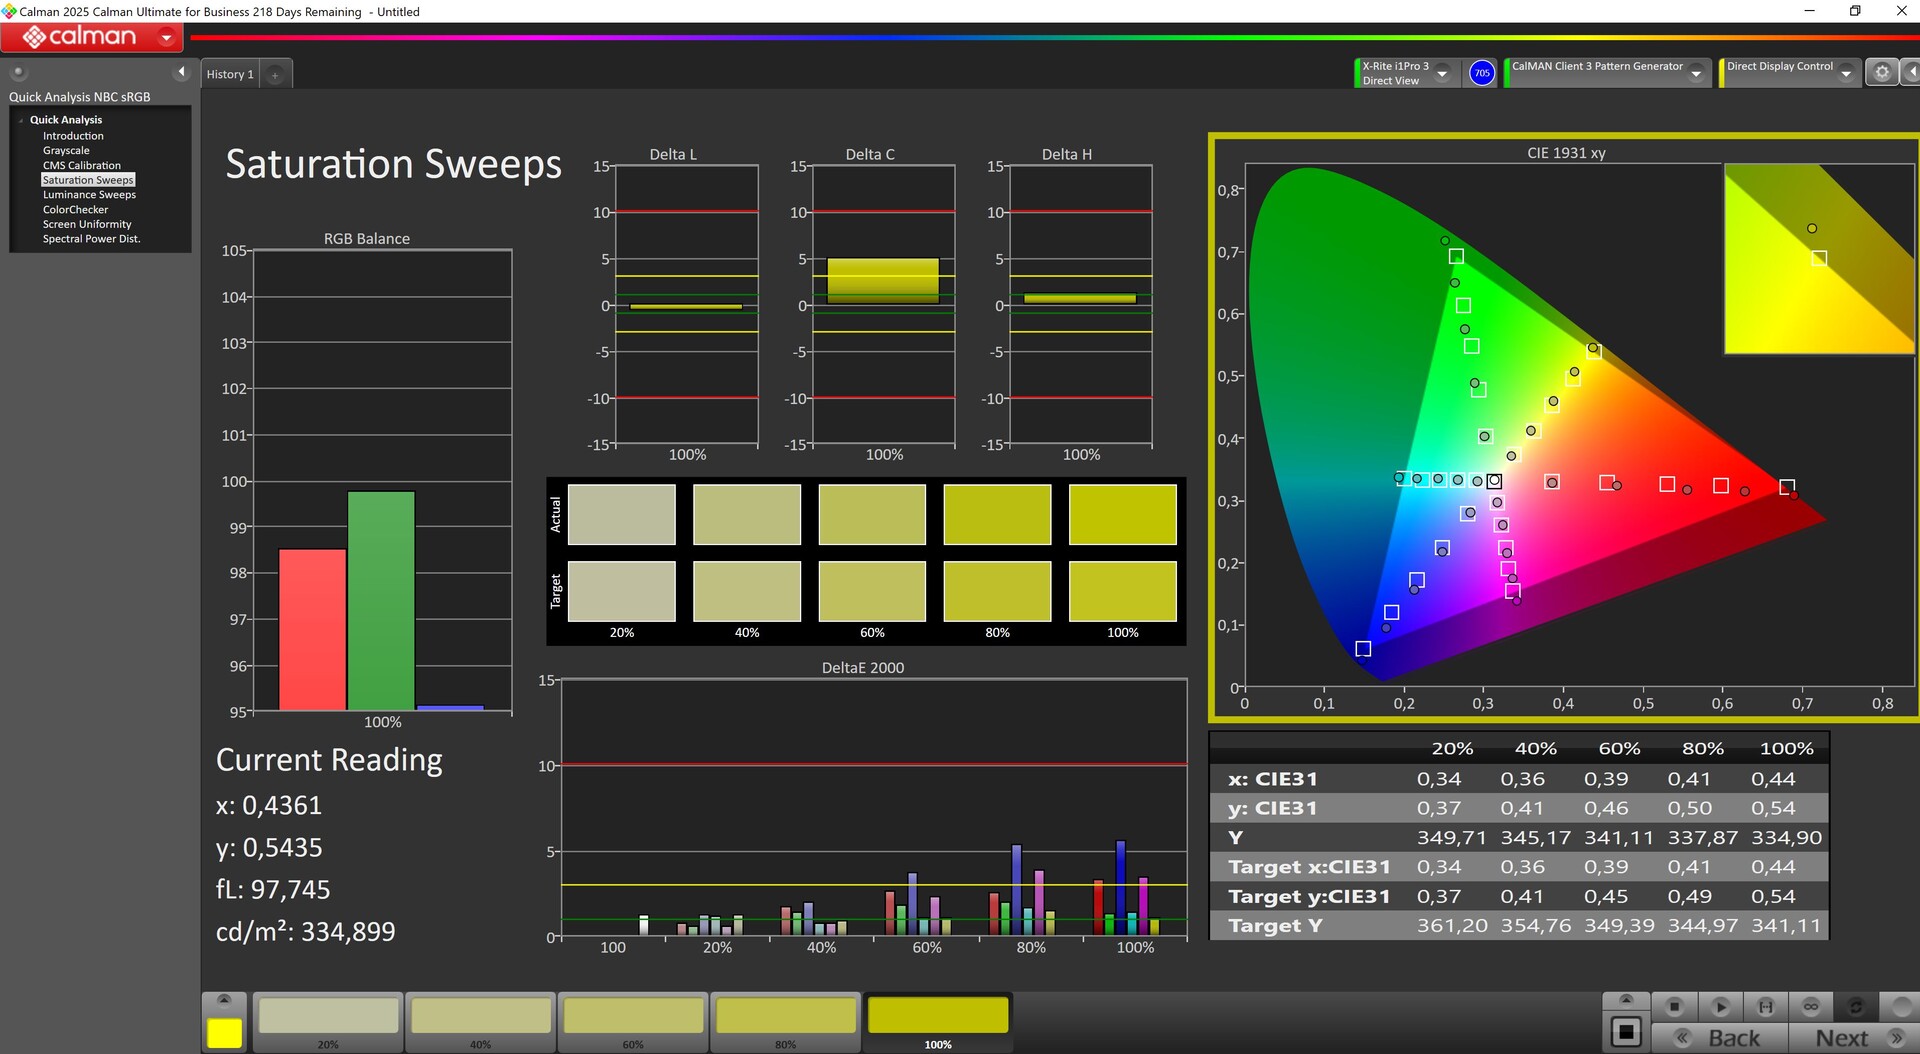
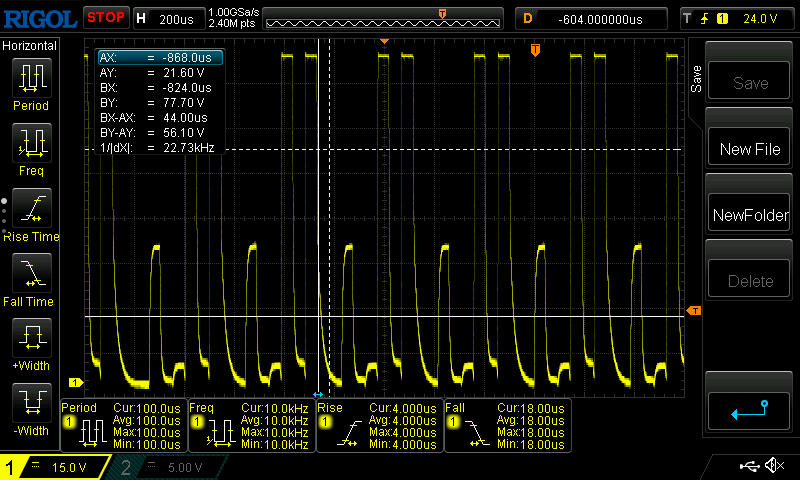
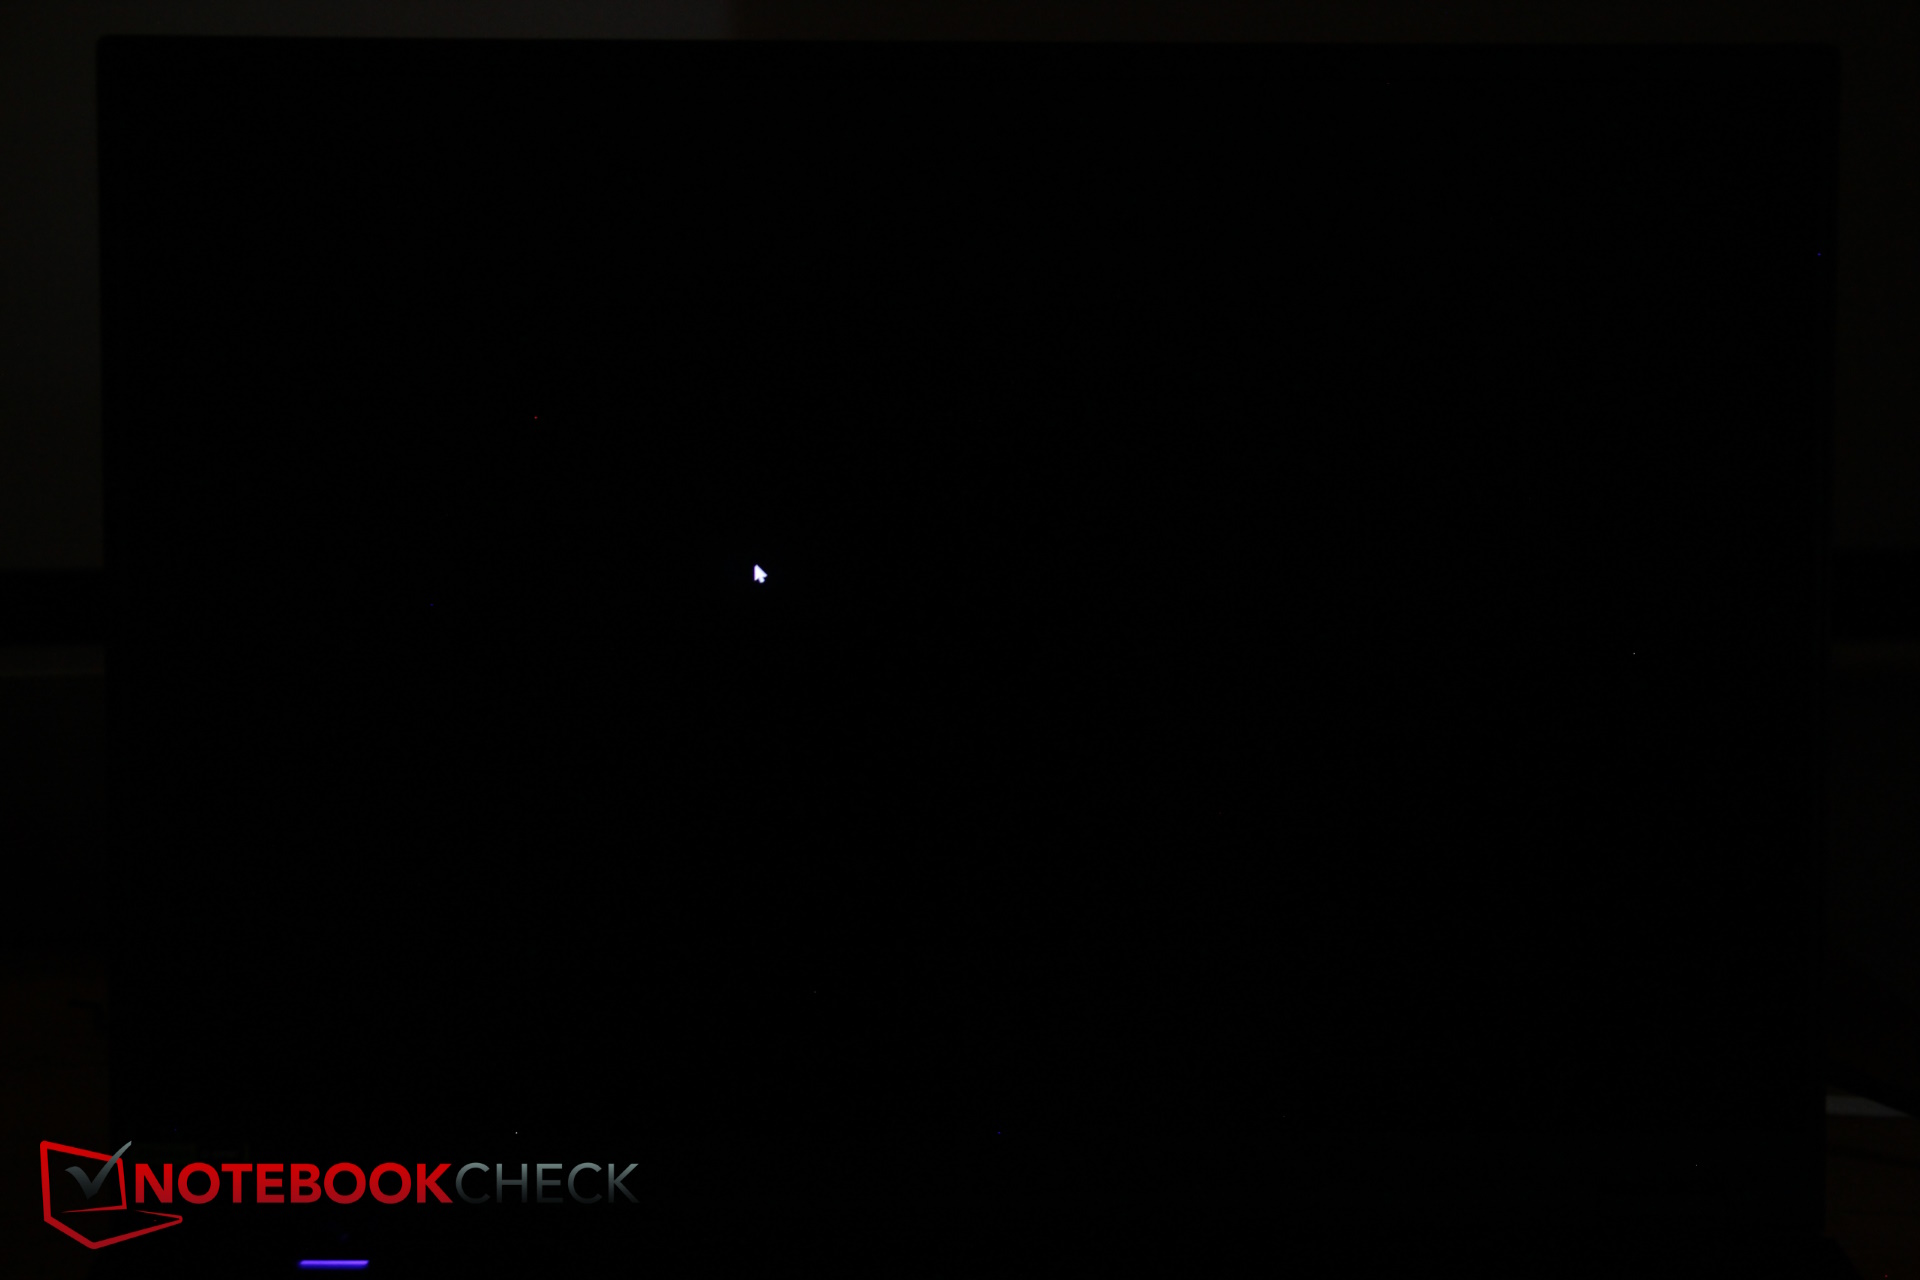
However, the panel of the test device is still of high quality, as we measured an average brightness of over 700 nits. The illumination is very good, with no halos, and the black level is extremely low, resulting in very high contrast. The display does flicker, but at a very high rate, so that even sensitive individuals should not notice PWM. P3 and sRGB color spaces are fully covered.
| |||||||||||||||||||||||||
Brightness Distribution: 96 %
Center on Battery: 400 cd/m²
Contrast: 18250:1 (Black: 0.04 cd/m²)
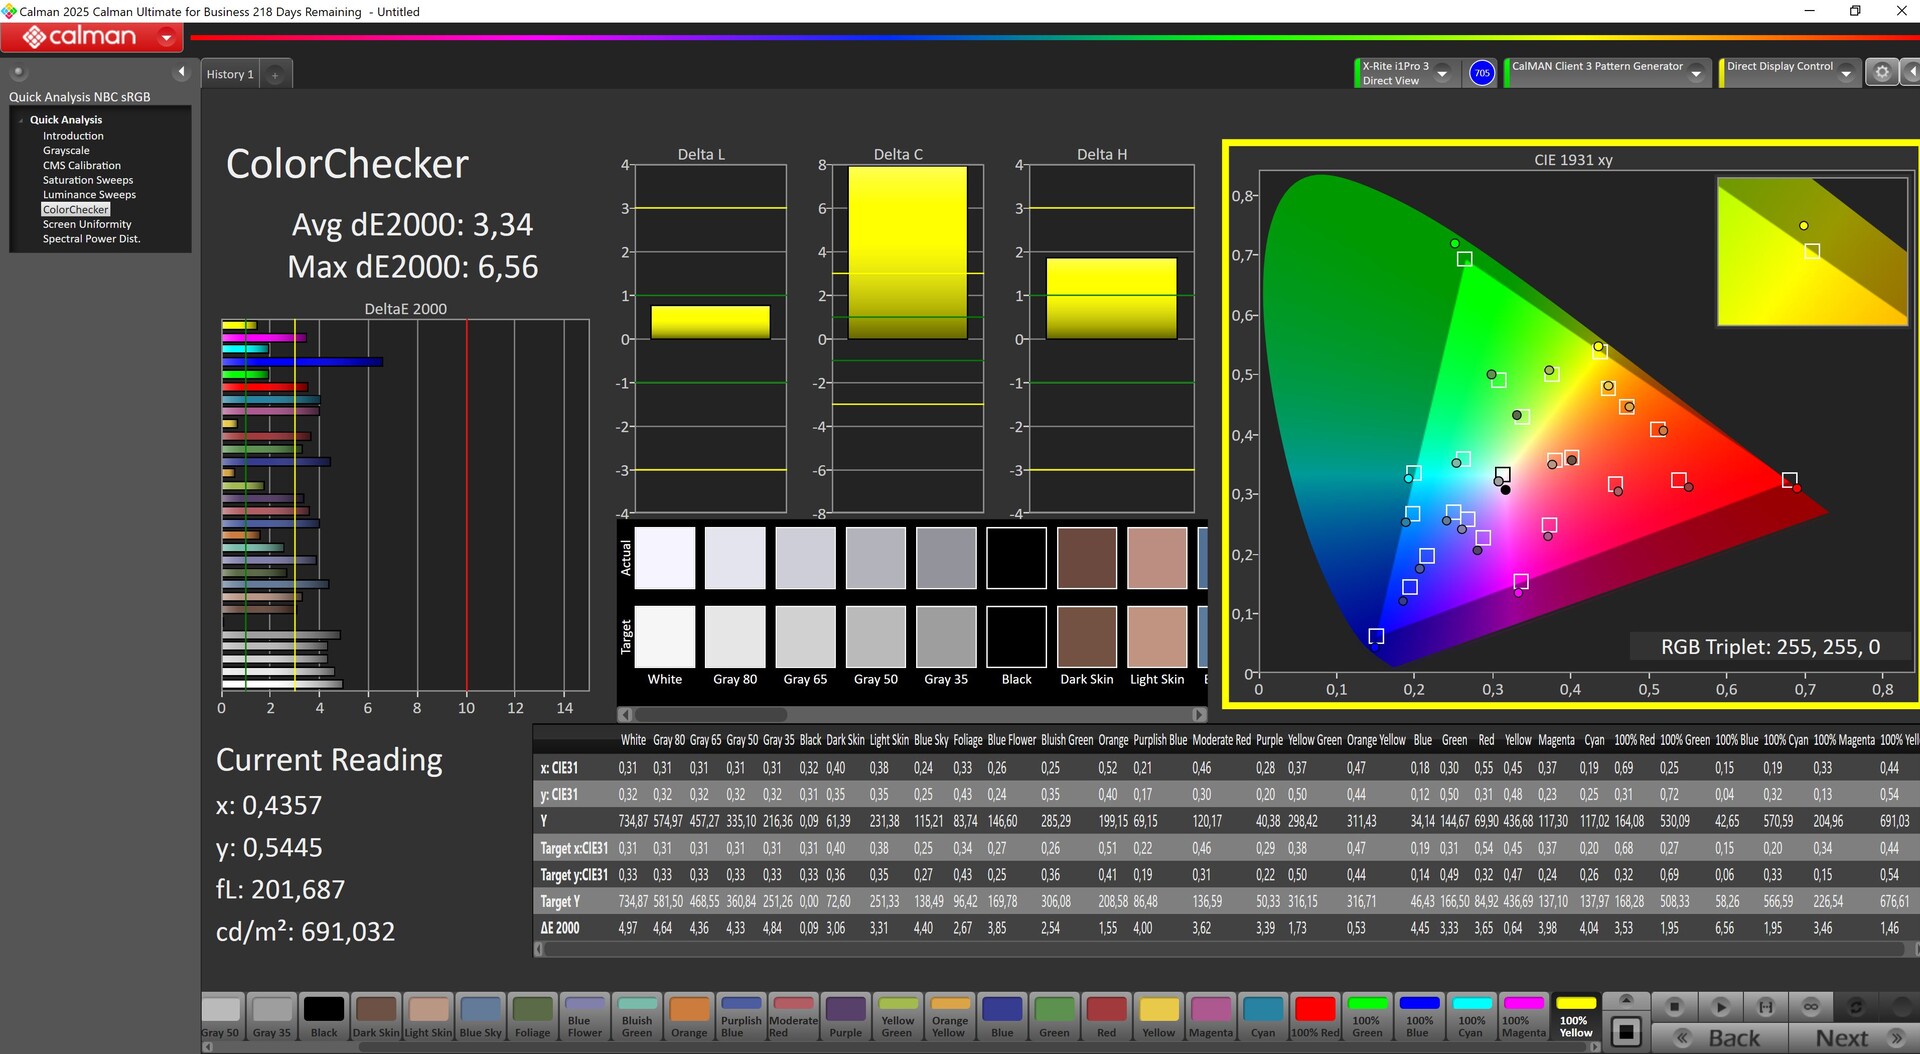
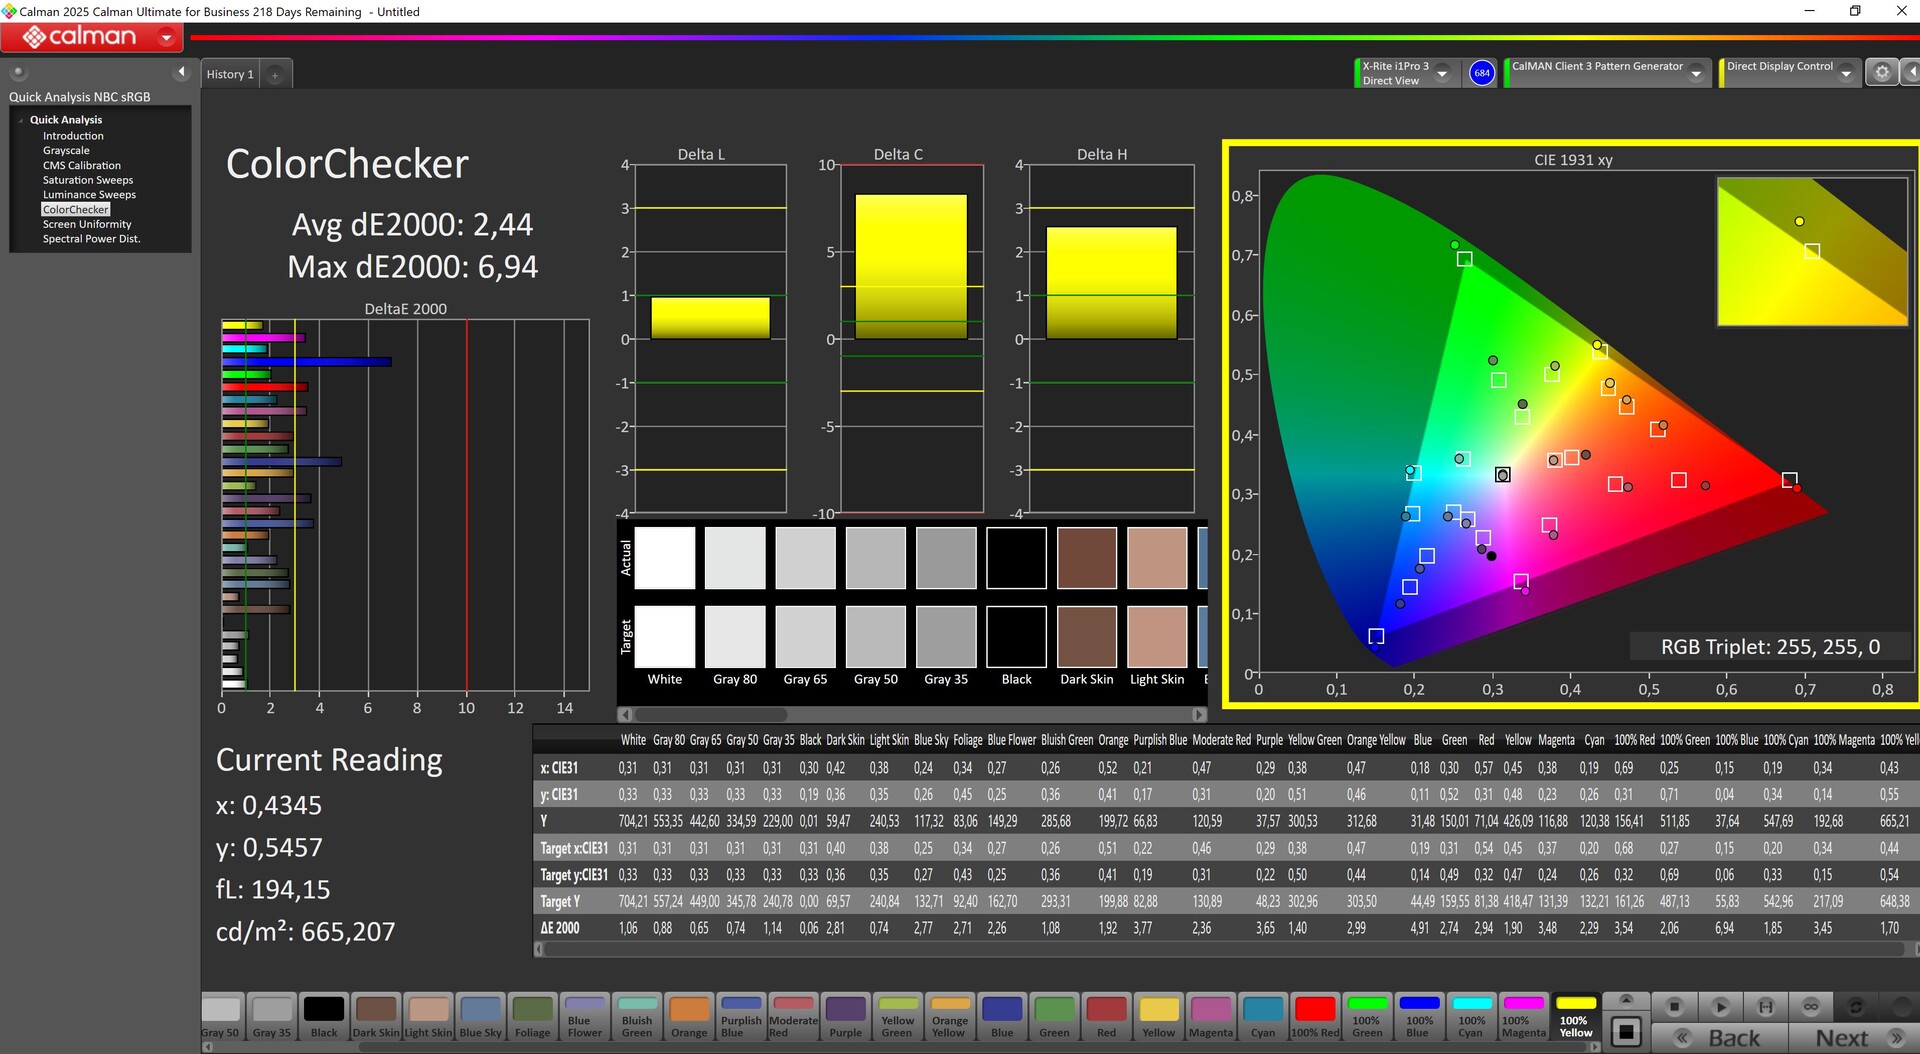
ΔE ColorChecker Calman: 3.34 | ∀{0.5-29.43 Ø4.72}
calibrated: 2.44
ΔE Greyscale Calman: 3.86 | ∀{0.09-98 Ø4.97}
90.1% AdobeRGB 1998 (Argyll 3D)
100% sRGB (Argyll 3D)
99.7% Display P3 (Argyll 3D)
Gamma: 2.62
CCT: 6859 K
| Acer Predator Helios 18 AI B180QAN01.2 (AUO45A8), IPS, 2560x1600, 18", 250 Hz | Acer Predator Helios 18 PH18-72-98MW B180QAN01.2 (AUO45A8), Mini-LED, 2560x1600, 18", 250 Hz | Medion Erazer Beast 18 X1 MD62731 BOEhydis NE180QDM-NZ2, IPS, 2560x1600, 18", 240 Hz | Asus Strix Scar 18 G835LX N180QDM-NM2, Mini-LED, 2560x1600, 18", 240 Hz | MSI Titan 18 HX AI A2XWJG AU Optronics B180ZAN01.0, Mini-LED, 3840x2160, 18", 120 Hz | MSI Vector A18 HX A9W AU Optronics B180QAN01.0, IPS, 2560x1600, 18", 240 Hz | |
|---|---|---|---|---|---|---|
| Display | 1% | -3% | -1% | 0% | -2% | |
| HDR Peak Brightness (cd/m²) | 1153 | |||||
| Display P3 Coverage (%) | 99.7 | 99.7 0% | 97.1 -3% | 99 -1% | 99.7 0% | 98.1 -2% |
| sRGB Coverage (%) | 100 | 100 0% | 99.9 0% | 100 0% | 99.9 0% | 99.9 0% |
| AdobeRGB 1998 Coverage (%) | 90.1 | 91.6 2% | 84.7 -6% | 87.2 -3% | 90.4 0% | 86.3 -4% |
| Response Times | -295% | -96% | -114% | -159% | -90% | |
| Response Time Grey 50% / Grey 80% * (ms) | 3.6 ? | 8 ? -122% | 5.6 ? -56% | 7.4 ? -106% | 8.8 ? -144% | 4.3 ? -19% |
| Response Time Black / White * (ms) | 3.1 ? | 17.6 ? -468% | 7.3 ? -135% | 10.4 ? -235% | 15 ? -384% | 8.1 ? -161% |
| PWM Frequency (Hz) | 2500 | 4832 ? | 20610 ? | 15430 ? | ||
| PWM Amplitude * (%) | 100 | 100 -0% | 50 50% | |||
| Screen | 5% | -122% | -3% | -10% | -153% | |
| Brightness middle (cd/m²) | 730 | 722 -1% | 478 -35% | 764 5% | 704 -4% | 543 -26% |
| Brightness (cd/m²) | 719 | 724 1% | 456 -37% | 747 4% | 680 -5% | 502 -30% |
| Brightness Distribution (%) | 96 | 93 -3% | 89 -7% | 93 -3% | 88 -8% | 86 -10% |
| Black Level * (cd/m²) | 0.04 | 0.04 -0% | 0.4 -900% | 0.1 -150% | 0.56 -1300% | |
| Contrast (:1) | 18250 | 18050 -1% | 1195 -93% | 7640 -58% | 970 -95% | |
| Colorchecker dE 2000 * | 3.34 | 3.4 -2% | 3.94 -18% | 1.2 64% | 4.11 -23% | 3.41 -2% |
| Colorchecker dE 2000 max. * | 6.56 | 5.32 19% | 8.6 -31% | 2.8 57% | 6.43 2% | 6.4 2% |
| Colorchecker dE 2000 calibrated * | 2.44 | 1.6 34% | 0.75 69% | 2.5 -2% | 0.66 73% | |
| Greyscale dE 2000 * | 3.86 | 3.8 2% | 5.5 -42% | 1.5 61% | 4.9 -27% | 3.4 12% |
| Gamma | 2.62 84% | 2.383 92% | 2.212 99% | 2.17 101% | 2.03 108% | 2.3 96% |
| CCT | 6859 95% | 7051 92% | 7059 92% | 6556 99% | 6331 103% | 6070 107% |
| Total Average (Program / Settings) | -96% /
-39% | -74% /
-92% | -39% /
-26% | -56% /
-42% | -82% /
-112% |
* ... smaller is better
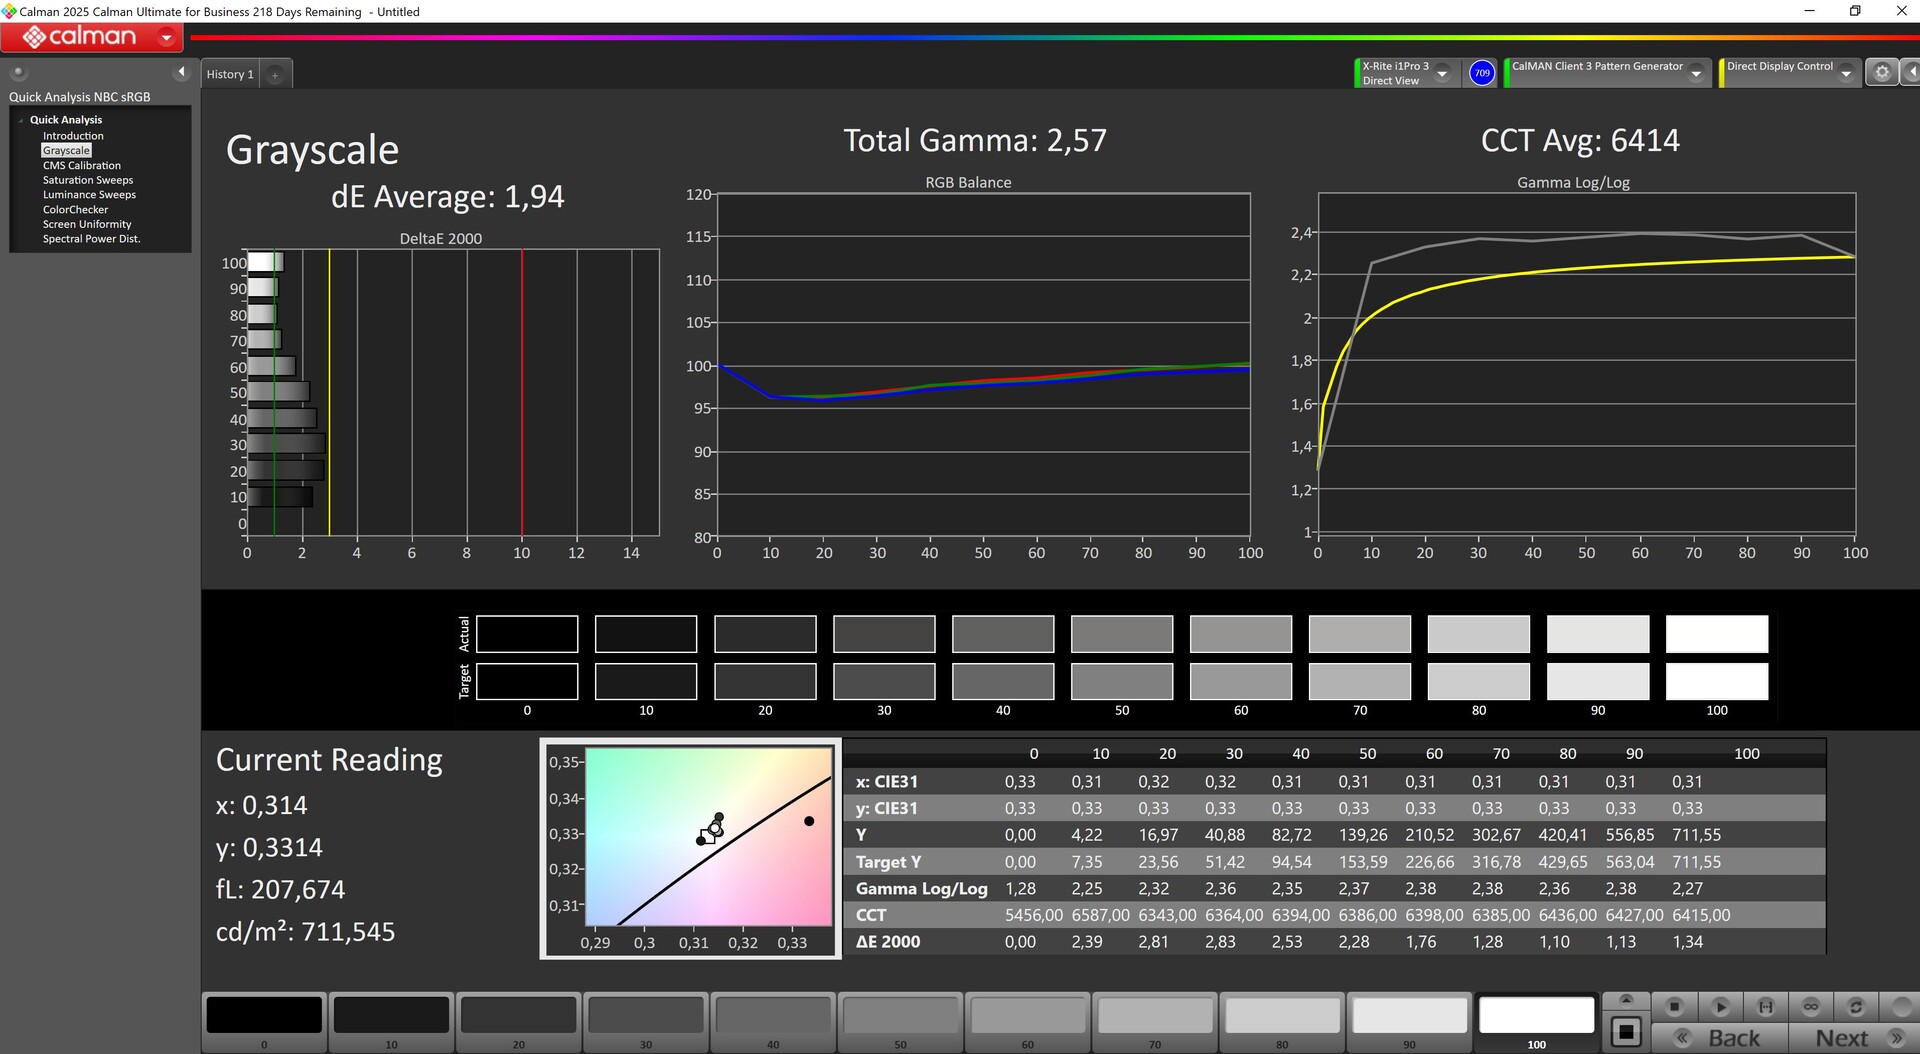
We measured average DeltaE values of 3.86 (grayscale) and 3.34 (ColorChecker) at native brightness ex works. We were able to reduce the values to 1.94 and 2.44, respectively, with our manual calibration.
Display Response Times
| ↔ Response Time Black to White | ||
|---|---|---|
| 3.1 ms ... rise ↗ and fall ↘ combined | ↗ 2.7 ms rise | 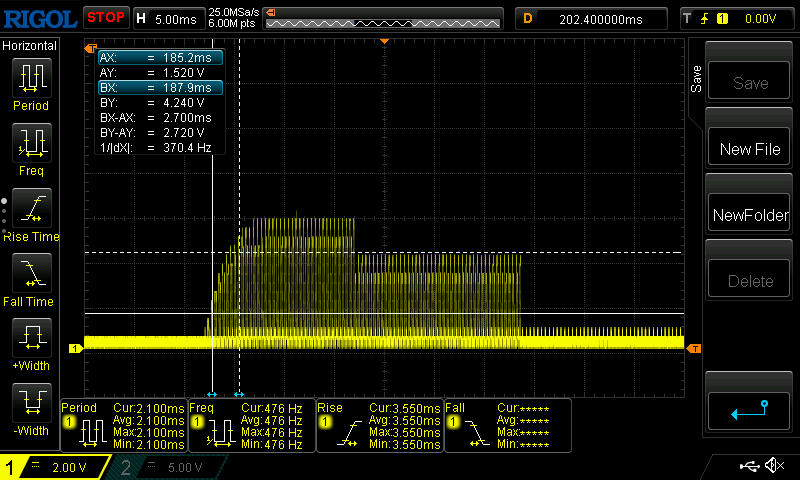 |
| ↘ 0.4 ms fall | ||
| The screen shows very fast response rates in our tests and should be very well suited for fast-paced gaming. In comparison, all tested devices range from 0.1 (minimum) to 240 (maximum) ms. » 15 % of all devices are better. This means that the measured response time is better than the average of all tested devices (19.8 ms). | ||
| ↔ Response Time 50% Grey to 80% Grey | ||
| 3.6 ms ... rise ↗ and fall ↘ combined | ↗ 1.6 ms rise |  |
| ↘ 2 ms fall | ||
| The screen shows very fast response rates in our tests and should be very well suited for fast-paced gaming. In comparison, all tested devices range from 0.165 (minimum) to 636 (maximum) ms. » 14 % of all devices are better. This means that the measured response time is better than the average of all tested devices (31 ms). | ||
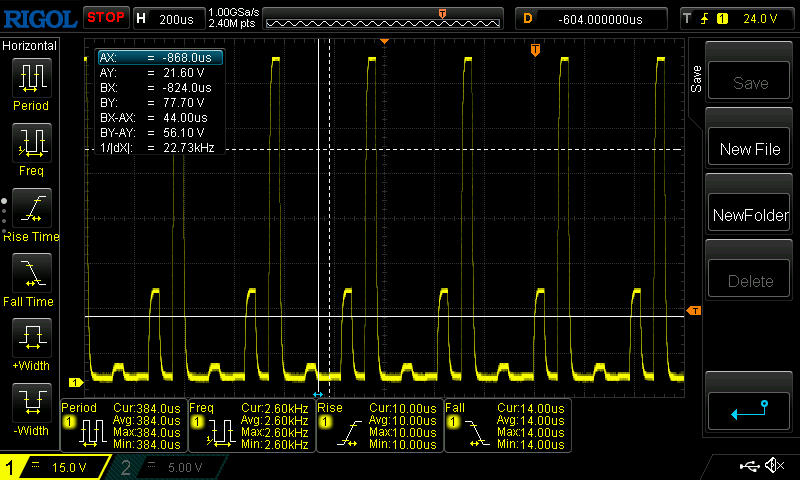
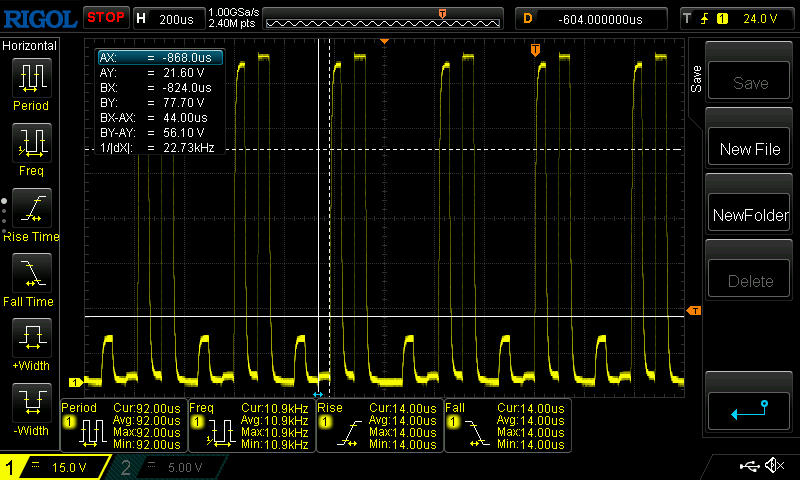
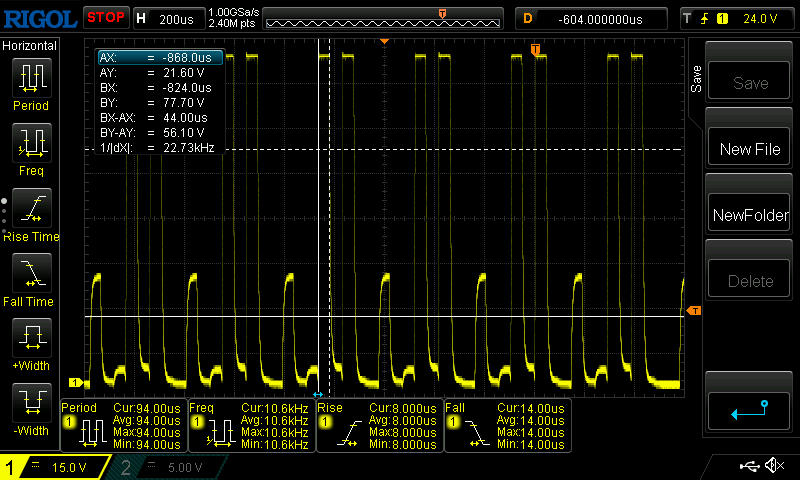
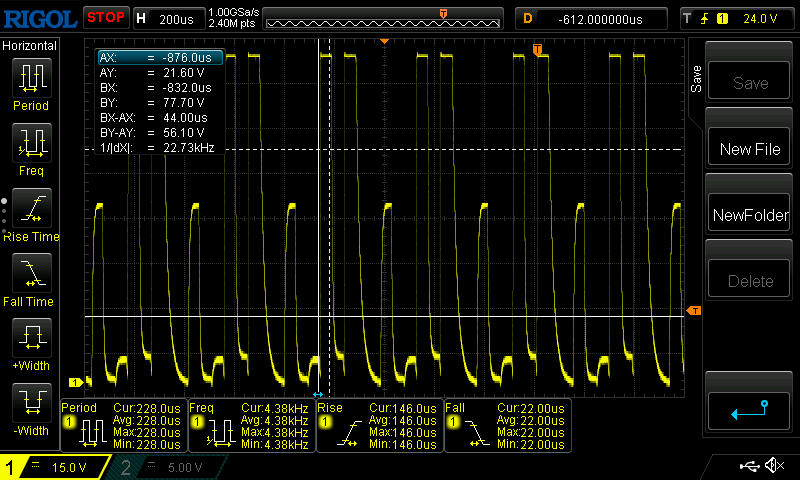
Screen Flickering / PWM (Pulse-Width Modulation)
| Screen flickering / PWM detected | 2500 Hz Amplitude: 100 % | 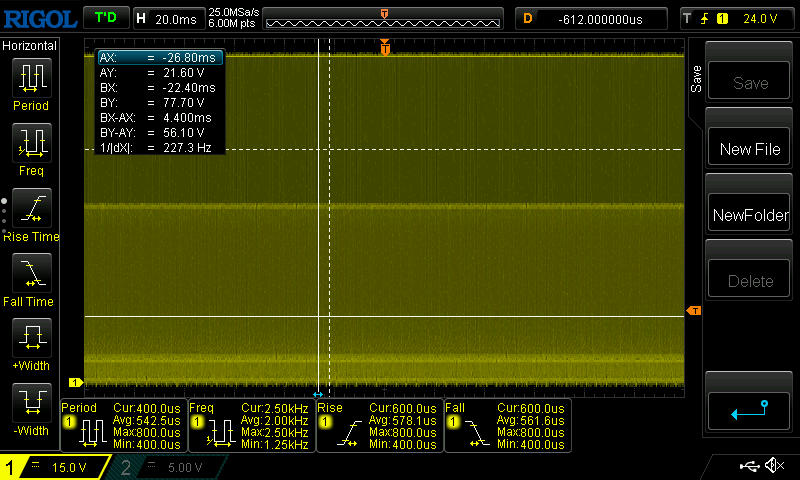 | |
The display backlight flickers at 2500 Hz (worst case, e.g., utilizing PWM) . The frequency of 2500 Hz is quite high, so most users sensitive to PWM should not notice any flickering. In comparison: 52 % of all tested devices do not use PWM to dim the display. If PWM was detected, an average of 7763 (minimum: 5 - maximum: 343500) Hz was measured. | |||
In battery mode, the brightness is "throttled" from 700 to 400 nits. However, this is still sufficient to allow for clear viewing of content outdoors in the shade and when viewed directly from above.

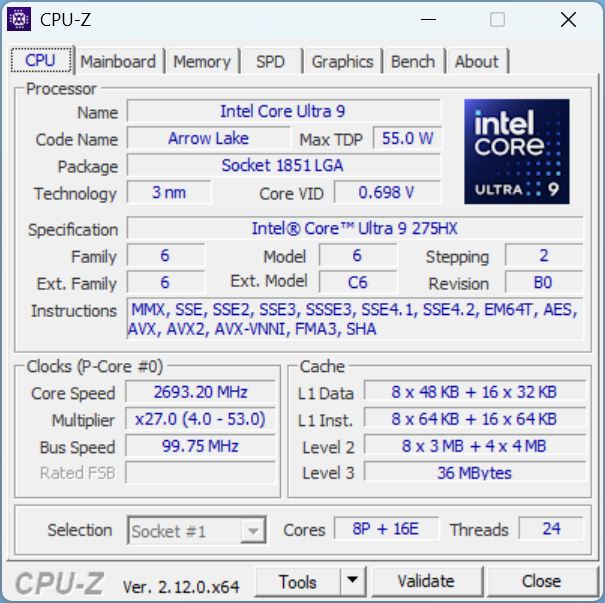
Performance - Slightly below average in performance mode
With its Intel Core Ultra 9 275HX and the Nvidia GeForce RTX 5080 laptop, the large 18-inch laptop clearly positions itself as a high-end gamer and desktop replacement, also thanks to its many upgrade options.
Test conditions
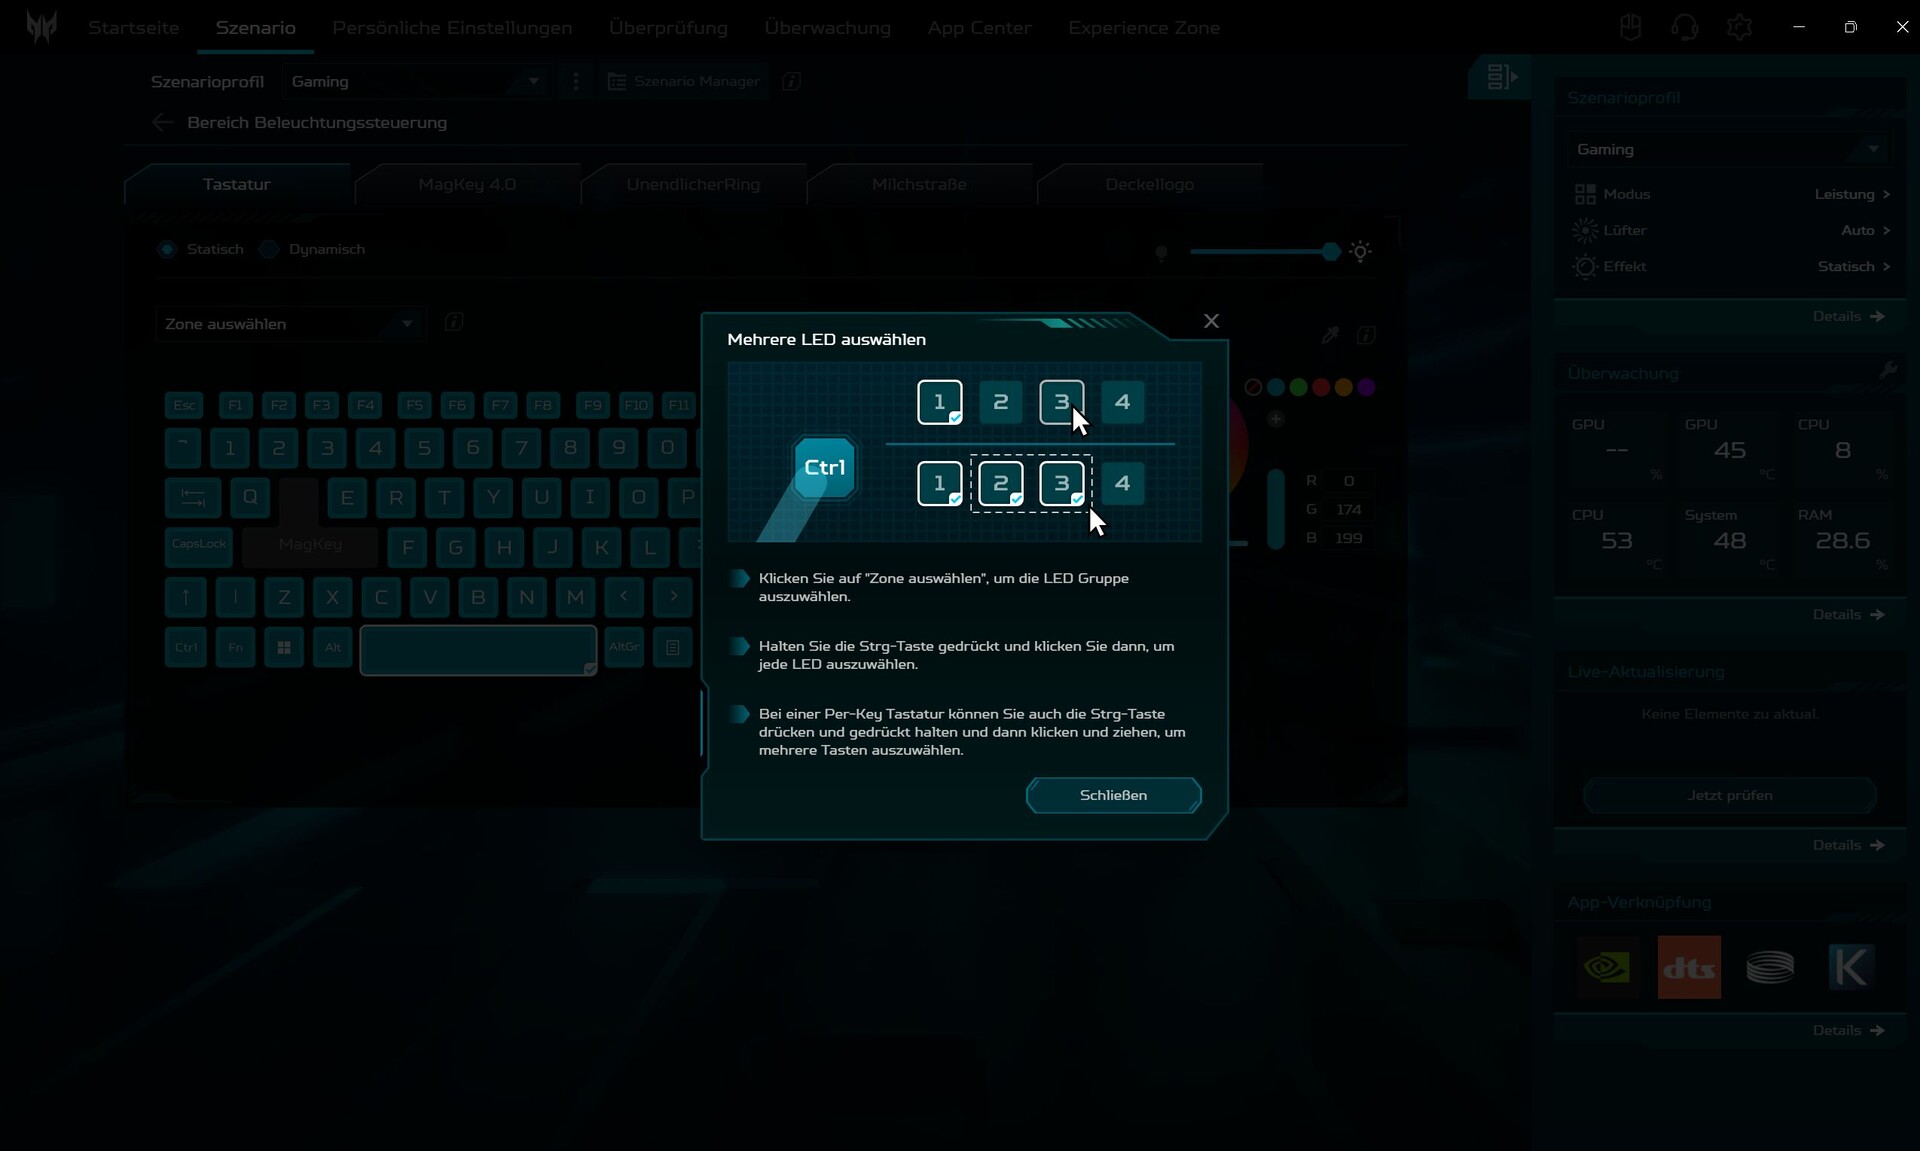
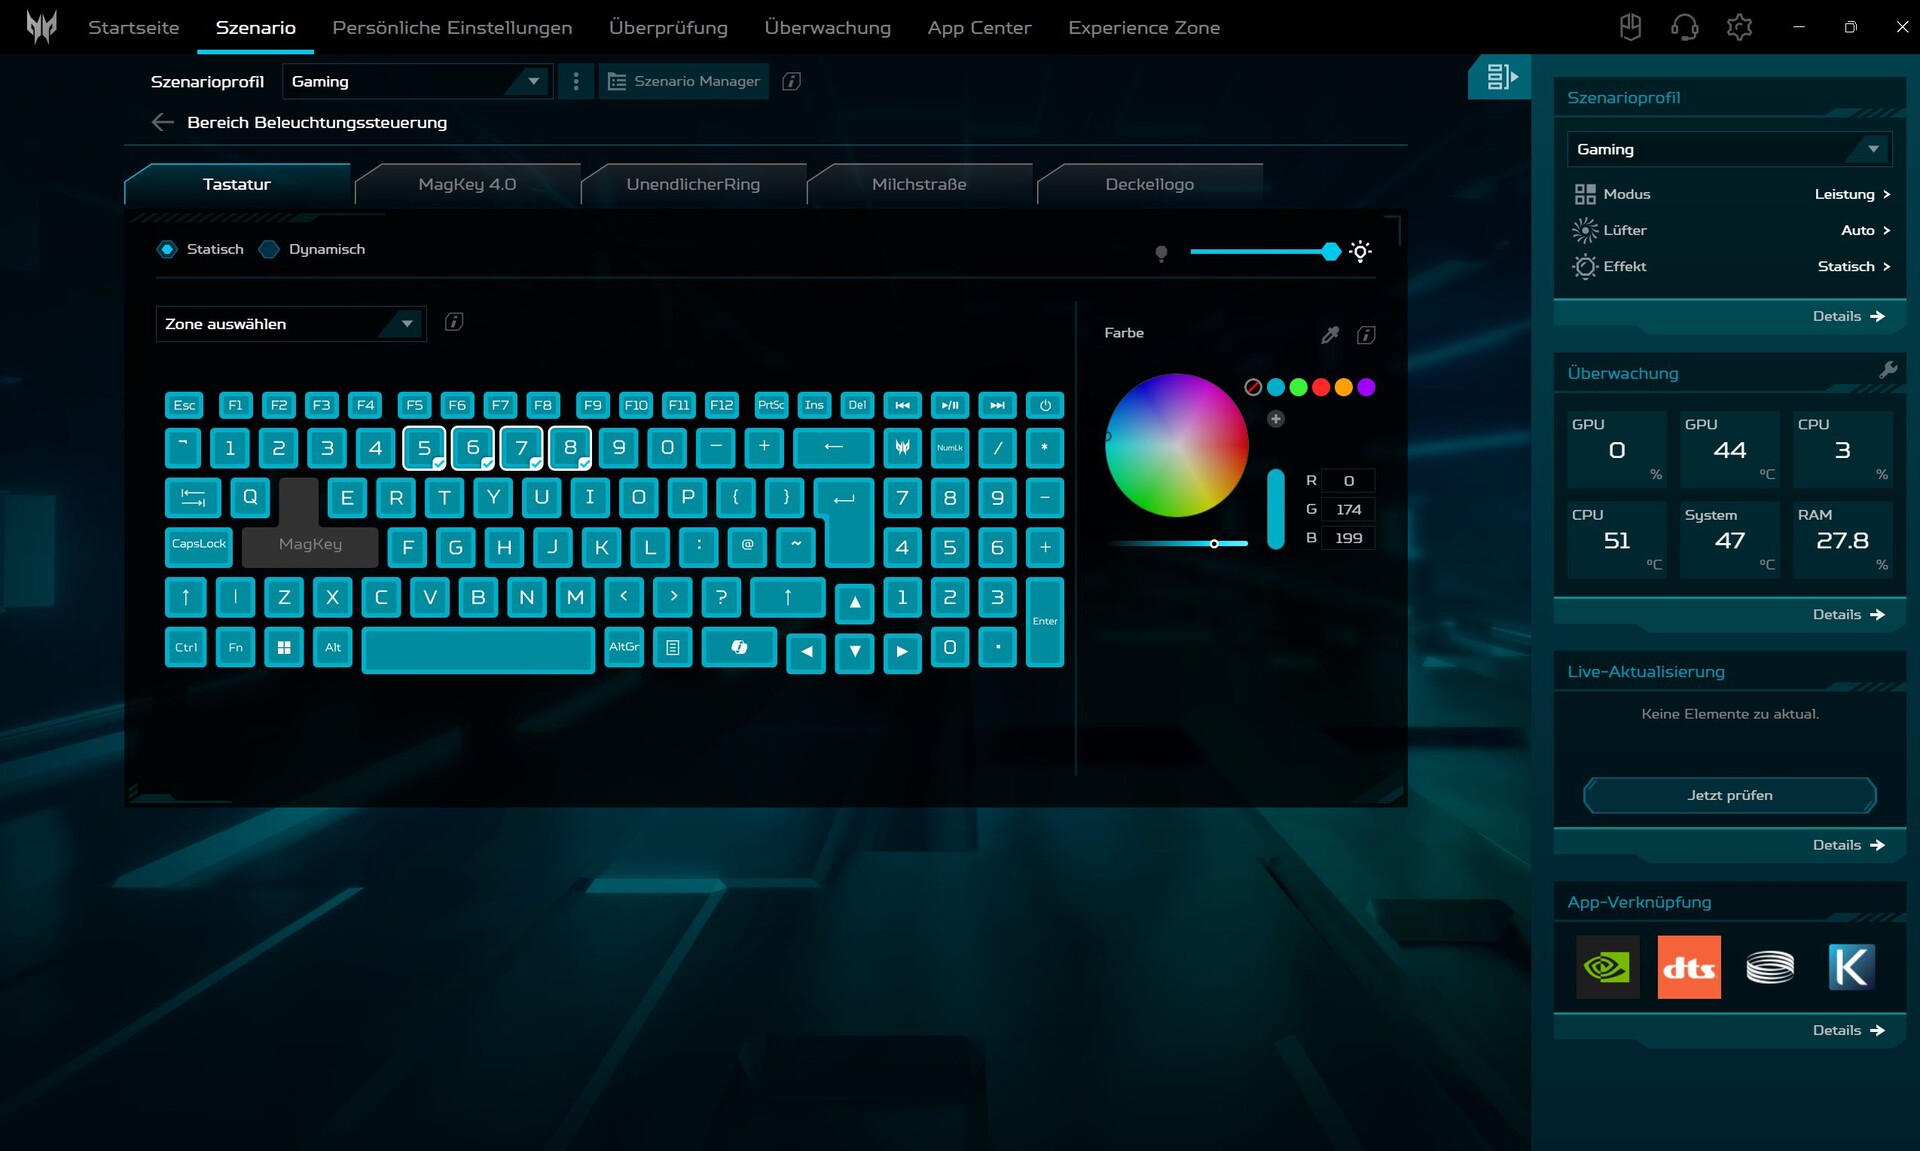
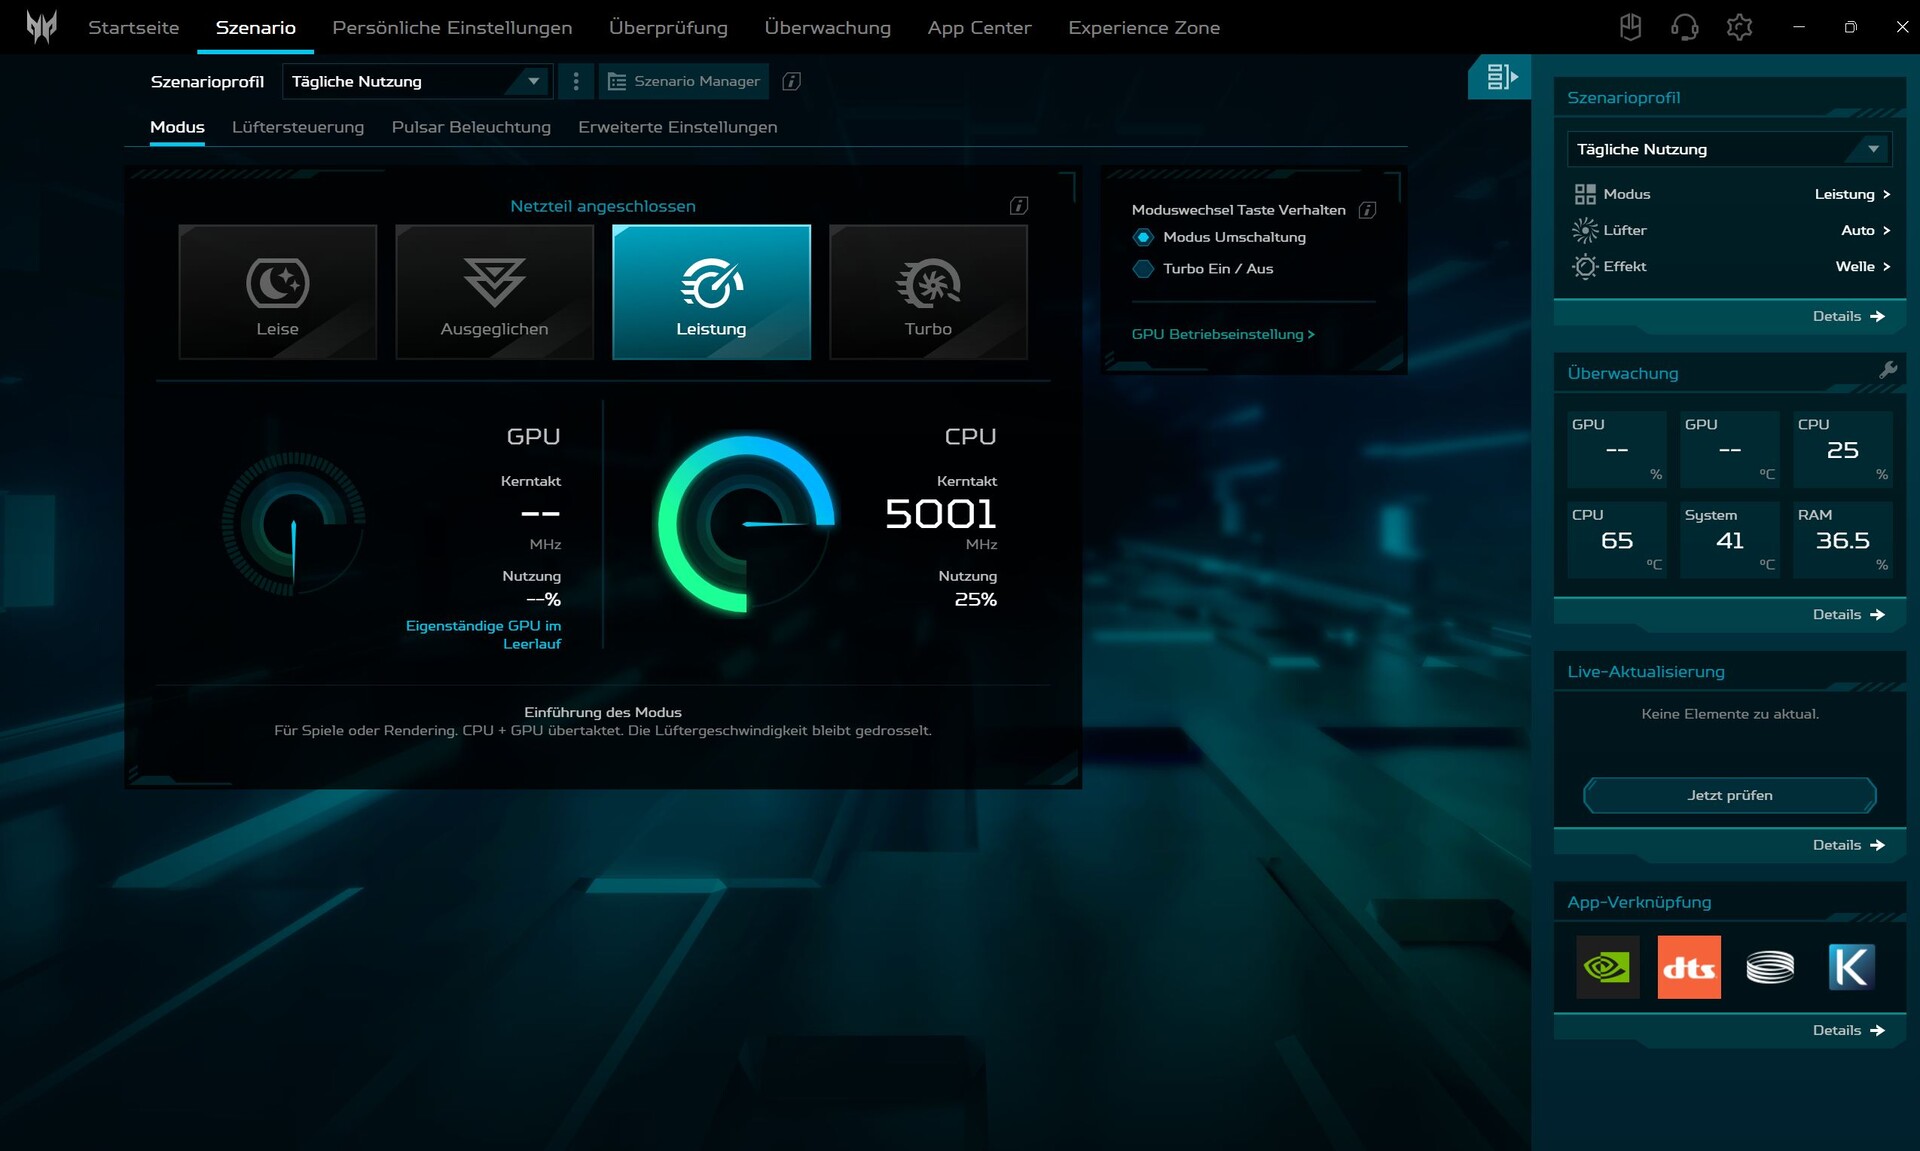
PredatorSense is the Control Center (our review article) of Acer's gaming laptops. The program contains many settings, but is somewhat confusing, convoluted, and overloaded. For example, graphics switching is available via a text link ("GPU operating settings") and is easily overlooked. There are 4 performance modes (Quiet, Balanced, Performance, Turbo); we use the Performance mode for our benchmarks.
When booting up, a startup sound is always played so loudly that you can't help but wince. Fortunately, the annoying startup sound can be deactivated in PredatorSense (Personal settings, System startup effect).
The "Acer Jump Start" software is also annoying. It annoys with a pop-up for Dropbox, is actually of little use, and can be safely uninstalled.


| Energy profile | PL2/PL1 | CB 15 Multi | CP 2077 FHD Ultra | max. Fan volume |
|---|---|---|---|---|
| Quiet | 115/75 watts | 4,709 points | 111 fps | 27.5 dB(A) |
| Balanced | 135/115 watts | 5,242 points | 121 fps | 39 dB(A) |
| Power | 160/135 watts | 5,379 points | 139.6 fps | 50.33 dB(A) |
| Turbo | 190/160 watts | 5,894 points | 147 fps | 60 dB(A) |
| battery (Balanced) | 135/115 watts | 3,319 points | 26.6 fps | 27.5 dB(A) |
Processor
The Intel Core Ultra 9 275HX is installed in many high-end gaming laptops, its 24 cores (8 P, 16 E cores) clock at up to 4.6 to 5.4 GHz.
In the Cinebench R15 continuous loop, our Helios 18 ranks in the middle. The Medion Erazer Beast 18 X1 is weaker, the Asus Strix Scar 18 is faster, both with the same CPU. Across all CPU tests, the average laptop with the same CPU is 6 percent faster, and the Asus Strix Scar is even 13 percent faster. In Turbo mode, the Cinebench R15 score is above average but still below that of many competitors.
Away from the power outlet, the Helios 18 loses around 38 percent of its CPU performance.
Cinebench R15 Multi loop
Cinebench R23: Multi Core | Single Core
Cinebench R20: CPU (Multi Core) | CPU (Single Core)
Cinebench R15: CPU Multi 64Bit | CPU Single 64Bit
Blender: v2.79 BMW27 CPU
7-Zip 18.03: 7z b 4 | 7z b 4 -mmt1
Geekbench 6.7: Multi-Core | Single-Core
Geekbench 5.5: Multi-Core | Single-Core
HWBOT x265 Benchmark v2.2: 4k Preset
LibreOffice : 20 Documents To PDF
R Benchmark 2.5: Overall mean
| CPU Performance rating | |
| MSI Raider A18 HX A9WIG-080 | |
| Asus Strix Scar 18 G835LX | |
| MSI Titan 18 HX AI A2XWJG | |
| MSI Vector A18 HX A9W | |
| Average Intel Core Ultra 9 275HX | |
| Acer Predator Helios 18 AI | |
| Medion Erazer Beast 18 X1 MD62731 | |
| Acer Predator Helios 18 PH18-72-98MW | |
| Average of class Gaming | |
| Cinebench R23 / Multi Core | |
| MSI Titan 18 HX AI A2XWJG | |
| MSI Vector A18 HX A9W | |
| Asus Strix Scar 18 G835LX | |
| MSI Raider A18 HX A9WIG-080 | |
| Average Intel Core Ultra 9 275HX (30712 - 40970, n=31) | |
| Acer Predator Helios 18 AI | |
| Medion Erazer Beast 18 X1 MD62731 | |
| Acer Predator Helios 18 PH18-72-98MW | |
| Average of class Gaming (10488 - 40970, n=110, last 2 years) | |
| Cinebench R23 / Single Core | |
| Medion Erazer Beast 18 X1 MD62731 | |
| Asus Strix Scar 18 G835LX | |
| Average Intel Core Ultra 9 275HX (2009 - 2267, n=31) | |
| MSI Titan 18 HX AI A2XWJG | |
| Acer Predator Helios 18 PH18-72-98MW | |
| MSI Raider A18 HX A9WIG-080 | |
| Acer Predator Helios 18 AI | |
| Average of class Gaming (1166 - 2356, n=110, last 2 years) | |
| MSI Vector A18 HX A9W | |
| Cinebench R20 / CPU (Multi Core) | |
| MSI Titan 18 HX AI A2XWJG | |
| MSI Vector A18 HX A9W | |
| Asus Strix Scar 18 G835LX | |
| MSI Raider A18 HX A9WIG-080 | |
| Average Intel Core Ultra 9 275HX (12026 - 16108, n=30) | |
| Acer Predator Helios 18 AI | |
| Medion Erazer Beast 18 X1 MD62731 | |
| Average of class Gaming (4029 - 16108, n=109, last 2 years) | |
| Acer Predator Helios 18 PH18-72-98MW | |
| Cinebench R20 / CPU (Single Core) | |
| Asus Strix Scar 18 G835LX | |
| Medion Erazer Beast 18 X1 MD62731 | |
| MSI Raider A18 HX A9WIG-080 | |
| Average Intel Core Ultra 9 275HX (774 - 870, n=30) | |
| MSI Titan 18 HX AI A2XWJG | |
| Acer Predator Helios 18 PH18-72-98MW | |
| MSI Vector A18 HX A9W | |
| Acer Predator Helios 18 AI | |
| Average of class Gaming (442 - 895, n=109, last 2 years) | |
| Cinebench R15 / CPU Multi 64Bit | |
| MSI Titan 18 HX AI A2XWJG | |
| MSI Vector A18 HX A9W | |
| Asus Strix Scar 18 G835LX | |
| MSI Raider A18 HX A9WIG-080 | |
| Average Intel Core Ultra 9 275HX (4737 - 6271, n=30) | |
| Acer Predator Helios 18 AI | |
| Medion Erazer Beast 18 X1 MD62731 | |
| Acer Predator Helios 18 PH18-72-98MW | |
| Average of class Gaming (1578 - 6271, n=108, last 2 years) | |
| Cinebench R15 / CPU Single 64Bit | |
| Asus Strix Scar 18 G835LX | |
| Medion Erazer Beast 18 X1 MD62731 | |
| Average Intel Core Ultra 9 275HX (306 - 343, n=31) | |
| MSI Titan 18 HX AI A2XWJG | |
| MSI Raider A18 HX A9WIG-080 | |
| MSI Vector A18 HX A9W | |
| Acer Predator Helios 18 PH18-72-98MW | |
| Acer Predator Helios 18 AI | |
| Average of class Gaming (188.8 - 343, n=109, last 2 years) | |
| Blender / v2.79 BMW27 CPU | |
| Average of class Gaming (80 - 330, n=107, last 2 years) | |
| Acer Predator Helios 18 PH18-72-98MW | |
| Medion Erazer Beast 18 X1 MD62731 | |
| Acer Predator Helios 18 AI | |
| Average Intel Core Ultra 9 275HX (82 - 116, n=29) | |
| Asus Strix Scar 18 G835LX | |
| MSI Titan 18 HX AI A2XWJG | |
| MSI Vector A18 HX A9W | |
| MSI Raider A18 HX A9WIG-080 | |
| 7-Zip 18.03 / 7z b 4 | |
| MSI Raider A18 HX A9WIG-080 | |
| MSI Vector A18 HX A9W | |
| MSI Titan 18 HX AI A2XWJG | |
| Asus Strix Scar 18 G835LX | |
| Average Intel Core Ultra 9 275HX (98236 - 124155, n=30) | |
| Acer Predator Helios 18 PH18-72-98MW | |
| Acer Predator Helios 18 AI | |
| Medion Erazer Beast 18 X1 MD62731 | |
| Average of class Gaming (33491 - 148086, n=108, last 2 years) | |
| 7-Zip 18.03 / 7z b 4 -mmt1 | |
| MSI Vector A18 HX A9W | |
| MSI Raider A18 HX A9WIG-080 | |
| Medion Erazer Beast 18 X1 MD62731 | |
| Asus Strix Scar 18 G835LX | |
| MSI Titan 18 HX AI A2XWJG | |
| Average Intel Core Ultra 9 275HX (6026 - 7149, n=30) | |
| Average of class Gaming (4199 - 7436, n=108, last 2 years) | |
| Acer Predator Helios 18 PH18-72-98MW | |
| Acer Predator Helios 18 AI | |
| Geekbench 6.7 / Multi-Core | |
| MSI Titan 18 HX AI A2XWJG | |
| Asus Strix Scar 18 G835LX | |
| MSI Raider A18 HX A9WIG-080 | |
| Average Intel Core Ultra 9 275HX (16033 - 21668, n=33) | |
| Acer Predator Helios 18 AI | |
| Medion Erazer Beast 18 X1 MD62731 | |
| Acer Predator Helios 18 PH18-72-98MW | |
| MSI Vector A18 HX A9W | |
| Average of class Gaming (6625 - 22104, n=109, last 2 years) | |
| Geekbench 6.7 / Single-Core | |
| MSI Vector A18 HX A9W | |
| Asus Strix Scar 18 G835LX | |
| MSI Raider A18 HX A9WIG-080 | |
| Medion Erazer Beast 18 X1 MD62731 | |
| MSI Titan 18 HX AI A2XWJG | |
| Average Intel Core Ultra 9 275HX (2843 - 3160, n=33) | |
| Acer Predator Helios 18 PH18-72-98MW | |
| Acer Predator Helios 18 AI | |
| Average of class Gaming (1490 - 3259, n=109, last 2 years) | |
| Geekbench 5.5 / Multi-Core | |
| MSI Titan 18 HX AI A2XWJG | |
| Asus Strix Scar 18 G835LX | |
| MSI Raider A18 HX A9WIG-080 | |
| Average Intel Core Ultra 9 275HX (19105 - 25855, n=31) | |
| MSI Vector A18 HX A9W | |
| Acer Predator Helios 18 AI | |
| Acer Predator Helios 18 PH18-72-98MW | |
| Medion Erazer Beast 18 X1 MD62731 | |
| Average of class Gaming (6460 - 27010, n=108, last 2 years) | |
| Geekbench 5.5 / Single-Core | |
| MSI Raider A18 HX A9WIG-080 | |
| MSI Vector A18 HX A9W | |
| Asus Strix Scar 18 G835LX | |
| Medion Erazer Beast 18 X1 MD62731 | |
| MSI Titan 18 HX AI A2XWJG | |
| Average Intel Core Ultra 9 275HX (2033 - 2292, n=31) | |
| Average of class Gaming (986 - 2474, n=108, last 2 years) | |
| Acer Predator Helios 18 AI | |
| Acer Predator Helios 18 PH18-72-98MW | |
| HWBOT x265 Benchmark v2.2 / 4k Preset | |
| MSI Titan 18 HX AI A2XWJG | |
| MSI Vector A18 HX A9W | |
| MSI Raider A18 HX A9WIG-080 | |
| Asus Strix Scar 18 G835LX | |
| Average Intel Core Ultra 9 275HX (30.7 - 43.8, n=30) | |
| Acer Predator Helios 18 AI | |
| Medion Erazer Beast 18 X1 MD62731 | |
| Acer Predator Helios 18 PH18-72-98MW | |
| Average of class Gaming (11.5 - 44.3, n=108, last 2 years) | |
| LibreOffice / 20 Documents To PDF | |
| Acer Predator Helios 18 PH18-72-98MW | |
| Average of class Gaming (19 - 88.8, n=108, last 2 years) | |
| Medion Erazer Beast 18 X1 MD62731 | |
| MSI Titan 18 HX AI A2XWJG | |
| MSI Raider A18 HX A9WIG-080 | |
| MSI Vector A18 HX A9W | |
| Average Intel Core Ultra 9 275HX (33.2 - 62.1, n=30) | |
| Asus Strix Scar 18 G835LX | |
| Acer Predator Helios 18 AI | |
| R Benchmark 2.5 / Overall mean | |
| Acer Predator Helios 18 AI | |
| Average of class Gaming (0.3439 - 0.759, n=109, last 2 years) | |
| Acer Predator Helios 18 PH18-72-98MW | |
| Average Intel Core Ultra 9 275HX (0.3943 - 0.4568, n=30) | |
| MSI Titan 18 HX AI A2XWJG | |
| Medion Erazer Beast 18 X1 MD62731 | |
| Asus Strix Scar 18 G835LX | |
| MSI Raider A18 HX A9WIG-080 | |
| MSI Vector A18 HX A9W | |
* ... smaller is better
AIDA64: FP32 Ray-Trace | FPU Julia | CPU SHA3 | CPU Queen | FPU SinJulia | FPU Mandel | CPU AES | CPU ZLib | FP64 Ray-Trace | CPU PhotoWorxx
| Performance rating | |
| MSI Raider A18 HX A9WIG-080 | |
| MSI Vector A18 HX A9W | |
| MSI Titan 18 HX AI A2XWJG | |
| Asus Strix Scar 18 G835LX | |
| Average Intel Core Ultra 9 275HX | |
| Acer Predator Helios 18 AI | |
| Medion Erazer Beast 18 X1 MD62731 | |
| Average of class Gaming | |
| Acer Predator Helios 18 PH18-72-98MW | |
| AIDA64 / FP32 Ray-Trace | |
| MSI Vector A18 HX A9W | |
| MSI Raider A18 HX A9WIG-080 | |
| MSI Titan 18 HX AI A2XWJG | |
| Asus Strix Scar 18 G835LX | |
| Average Intel Core Ultra 9 275HX (28039 - 39895, n=30) | |
| Acer Predator Helios 18 AI | |
| Average of class Gaming (10227 - 85542, n=107, last 2 years) | |
| Medion Erazer Beast 18 X1 MD62731 | |
| Acer Predator Helios 18 PH18-72-98MW | |
| AIDA64 / FPU Julia | |
| MSI Raider A18 HX A9WIG-080 | |
| MSI Vector A18 HX A9W | |
| MSI Titan 18 HX AI A2XWJG | |
| Asus Strix Scar 18 G835LX | |
| Average Intel Core Ultra 9 275HX (140254 - 200744, n=30) | |
| Acer Predator Helios 18 AI | |
| Medion Erazer Beast 18 X1 MD62731 | |
| Average of class Gaming (51376 - 238426, n=107, last 2 years) | |
| Acer Predator Helios 18 PH18-72-98MW | |
| AIDA64 / CPU SHA3 | |
| MSI Titan 18 HX AI A2XWJG | |
| MSI Vector A18 HX A9W | |
| MSI Raider A18 HX A9WIG-080 | |
| Asus Strix Scar 18 G835LX | |
| Average Intel Core Ultra 9 275HX (6710 - 9817, n=30) | |
| Acer Predator Helios 18 AI | |
| Medion Erazer Beast 18 X1 MD62731 | |
| Average of class Gaming (2180 - 9817, n=107, last 2 years) | |
| Acer Predator Helios 18 PH18-72-98MW | |
| AIDA64 / CPU Queen | |
| MSI Raider A18 HX A9WIG-080 | |
| MSI Vector A18 HX A9W | |
| MSI Titan 18 HX AI A2XWJG | |
| Asus Strix Scar 18 G835LX | |
| Acer Predator Helios 18 AI | |
| Acer Predator Helios 18 PH18-72-98MW | |
| Average Intel Core Ultra 9 275HX (113887 - 140937, n=30) | |
| Average of class Gaming (49785 - 173351, n=94, last 2 years) | |
| Medion Erazer Beast 18 X1 MD62731 | |
| AIDA64 / FPU SinJulia | |
| MSI Raider A18 HX A9WIG-080 | |
| MSI Vector A18 HX A9W | |
| Acer Predator Helios 18 PH18-72-98MW | |
| Average of class Gaming (4424 - 33636, n=107, last 2 years) | |
| MSI Titan 18 HX AI A2XWJG | |
| Asus Strix Scar 18 G835LX | |
| Acer Predator Helios 18 AI | |
| Average Intel Core Ultra 9 275HX (11172 - 14425, n=30) | |
| Medion Erazer Beast 18 X1 MD62731 | |
| AIDA64 / FPU Mandel | |
| MSI Vector A18 HX A9W | |
| MSI Raider A18 HX A9WIG-080 | |
| MSI Titan 18 HX AI A2XWJG | |
| Asus Strix Scar 18 G835LX | |
| Average Intel Core Ultra 9 275HX (72596 - 104508, n=30) | |
| Acer Predator Helios 18 AI | |
| Medion Erazer Beast 18 X1 MD62731 | |
| Average of class Gaming (25115 - 128721, n=107, last 2 years) | |
| Acer Predator Helios 18 PH18-72-98MW | |
| AIDA64 / CPU AES | |
| MSI Raider A18 HX A9WIG-080 | |
| MSI Vector A18 HX A9W | |
| Asus Strix Scar 18 G835LX | |
| MSI Titan 18 HX AI A2XWJG | |
| Average Intel Core Ultra 9 275HX (105608 - 247074, n=30) | |
| Acer Predator Helios 18 AI | |
| Acer Predator Helios 18 PH18-72-98MW | |
| Medion Erazer Beast 18 X1 MD62731 | |
| Average of class Gaming (39258 - 247074, n=107, last 2 years) | |
| AIDA64 / CPU ZLib | |
| MSI Vector A18 HX A9W | |
| MSI Raider A18 HX A9WIG-080 | |
| MSI Titan 18 HX AI A2XWJG | |
| Asus Strix Scar 18 G835LX | |
| Average Intel Core Ultra 9 275HX (1582 - 2263, n=30) | |
| Acer Predator Helios 18 AI | |
| Medion Erazer Beast 18 X1 MD62731 | |
| Acer Predator Helios 18 PH18-72-98MW | |
| Average of class Gaming (574 - 2531, n=107, last 2 years) | |
| AIDA64 / FP64 Ray-Trace | |
| MSI Vector A18 HX A9W | |
| MSI Raider A18 HX A9WIG-080 | |
| MSI Titan 18 HX AI A2XWJG | |
| Asus Strix Scar 18 G835LX | |
| Average Intel Core Ultra 9 275HX (14847 - 21854, n=30) | |
| Acer Predator Helios 18 AI | |
| Average of class Gaming (5509 - 45446, n=107, last 2 years) | |
| Medion Erazer Beast 18 X1 MD62731 | |
| Acer Predator Helios 18 PH18-72-98MW | |
| AIDA64 / CPU PhotoWorxx | |
| MSI Titan 18 HX AI A2XWJG | |
| Asus Strix Scar 18 G835LX | |
| Average Intel Core Ultra 9 275HX (37482 - 62916, n=30) | |
| Medion Erazer Beast 18 X1 MD62731 | |
| Acer Predator Helios 18 PH18-72-98MW | |
| Average of class Gaming (12271 - 89891, n=107, last 2 years) | |
| MSI Vector A18 HX A9W | |
| Acer Predator Helios 18 AI | |
| MSI Raider A18 HX A9WIG-080 | |
System performance

In terms of system performance, the Helios 18 is slightly below average at 4 percent. But subjectively, opening file browsers or context menus always takes a little longer than usual. Hopefully, future updates will eliminate these brief hiccups.
PCMark 10: Score | Essentials | Productivity | Digital Content Creation
CrossMark: Overall | Productivity | Creativity | Responsiveness
WebXPRT 3: Overall
WebXPRT 4: Overall
Mozilla Kraken 1.1: Total
| Performance rating | |
| MSI Raider A18 HX A9WIG-080 | |
| MSI Vector A18 HX A9W | |
| MSI Titan 18 HX AI A2XWJG | |
| Asus Strix Scar 18 G835LX | |
| Average Intel Core Ultra 9 275HX, NVIDIA GeForce RTX 5080 Laptop | |
| Acer Predator Helios 18 AI | |
| Average of class Gaming | |
| Medion Erazer Beast 18 X1 MD62731 | |
| Acer Predator Helios 18 PH18-72-98MW -6! | |
| PCMark 10 / Score | |
| MSI Vector A18 HX A9W | |
| MSI Raider A18 HX A9WIG-080 | |
| MSI Titan 18 HX AI A2XWJG | |
| Average Intel Core Ultra 9 275HX, NVIDIA GeForce RTX 5080 Laptop (7805 - 10409, n=9) | |
| Asus Strix Scar 18 G835LX | |
| Acer Predator Helios 18 AI | |
| Medion Erazer Beast 18 X1 MD62731 | |
| Average of class Gaming (5828 - 11574, n=95, last 2 years) | |
| Acer Predator Helios 18 PH18-72-98MW | |
| PCMark 10 / Essentials | |
| MSI Raider A18 HX A9WIG-080 | |
| MSI Vector A18 HX A9W | |
| Acer Predator Helios 18 PH18-72-98MW | |
| Asus Strix Scar 18 G835LX | |
| MSI Titan 18 HX AI A2XWJG | |
| Average Intel Core Ultra 9 275HX, NVIDIA GeForce RTX 5080 Laptop (10206 - 11472, n=9) | |
| Acer Predator Helios 18 AI | |
| Average of class Gaming (8810 - 12600, n=99, last 2 years) | |
| Medion Erazer Beast 18 X1 MD62731 | |
| PCMark 10 / Productivity | |
| Average of class Gaming (6845 - 21327, n=97, last 2 years) | |
| MSI Vector A18 HX A9W | |
| MSI Raider A18 HX A9WIG-080 | |
| Average Intel Core Ultra 9 275HX, NVIDIA GeForce RTX 5080 Laptop (8319 - 20616, n=9) | |
| Acer Predator Helios 18 PH18-72-98MW | |
| Acer Predator Helios 18 AI | |
| Medion Erazer Beast 18 X1 MD62731 | |
| MSI Titan 18 HX AI A2XWJG | |
| Asus Strix Scar 18 G835LX | |
| PCMark 10 / Digital Content Creation | |
| MSI Vector A18 HX A9W | |
| MSI Titan 18 HX AI A2XWJG | |
| Asus Strix Scar 18 G835LX | |
| Average Intel Core Ultra 9 275HX, NVIDIA GeForce RTX 5080 Laptop (10505 - 19351, n=9) | |
| Acer Predator Helios 18 AI | |
| Medion Erazer Beast 18 X1 MD62731 | |
| MSI Raider A18 HX A9WIG-080 | |
| Average of class Gaming (7602 - 19657, n=97, last 2 years) | |
| Acer Predator Helios 18 PH18-72-98MW | |
| CrossMark / Overall | |
| MSI Raider A18 HX A9WIG-080 | |
| MSI Titan 18 HX AI A2XWJG | |
| Asus Strix Scar 18 G835LX | |
| MSI Vector A18 HX A9W | |
| Average Intel Core Ultra 9 275HX, NVIDIA GeForce RTX 5080 Laptop (1857 - 2244, n=9) | |
| Acer Predator Helios 18 AI | |
| Average of class Gaming (1366 - 2409, n=96, last 2 years) | |
| Medion Erazer Beast 18 X1 MD62731 | |
| CrossMark / Productivity | |
| Asus Strix Scar 18 G835LX | |
| MSI Raider A18 HX A9WIG-080 | |
| MSI Titan 18 HX AI A2XWJG | |
| Average Intel Core Ultra 9 275HX, NVIDIA GeForce RTX 5080 Laptop (1764 - 2122, n=9) | |
| MSI Vector A18 HX A9W | |
| Acer Predator Helios 18 AI | |
| Average of class Gaming (1386 - 2254, n=96, last 2 years) | |
| Medion Erazer Beast 18 X1 MD62731 | |
| CrossMark / Creativity | |
| MSI Raider A18 HX A9WIG-080 | |
| MSI Titan 18 HX AI A2XWJG | |
| MSI Vector A18 HX A9W | |
| Asus Strix Scar 18 G835LX | |
| Average Intel Core Ultra 9 275HX, NVIDIA GeForce RTX 5080 Laptop (2115 - 2498, n=9) | |
| Acer Predator Helios 18 AI | |
| Average of class Gaming (1343 - 2729, n=96, last 2 years) | |
| Medion Erazer Beast 18 X1 MD62731 | |
| CrossMark / Responsiveness | |
| Average Intel Core Ultra 9 275HX, NVIDIA GeForce RTX 5080 Laptop (1466 - 2096, n=9) | |
| MSI Raider A18 HX A9WIG-080 | |
| Asus Strix Scar 18 G835LX | |
| Acer Predator Helios 18 AI | |
| MSI Titan 18 HX AI A2XWJG | |
| Average of class Gaming (1226 - 2334, n=96, last 2 years) | |
| MSI Vector A18 HX A9W | |
| Medion Erazer Beast 18 X1 MD62731 | |
| WebXPRT 3 / Overall | |
| MSI Raider A18 HX A9WIG-080 | |
| MSI Titan 18 HX AI A2XWJG | |
| MSI Vector A18 HX A9W | |
| Asus Strix Scar 18 G835LX | |
| Average Intel Core Ultra 9 275HX, NVIDIA GeForce RTX 5080 Laptop (306 - 378, n=9) | |
| Medion Erazer Beast 18 X1 MD62731 | |
| Average of class Gaming (220 - 532, n=100, last 2 years) | |
| Acer Predator Helios 18 AI | |
| WebXPRT 4 / Overall | |
| Asus Strix Scar 18 G835LX | |
| MSI Raider A18 HX A9WIG-080 | |
| Medion Erazer Beast 18 X1 MD62731 | |
| Average Intel Core Ultra 9 275HX, NVIDIA GeForce RTX 5080 Laptop (285 - 336, n=9) | |
| MSI Vector A18 HX A9W | |
| MSI Titan 18 HX AI A2XWJG | |
| Acer Predator Helios 18 AI | |
| Average of class Gaming (165 - 354, n=101, last 2 years) | |
| Mozilla Kraken 1.1 / Total | |
| Average of class Gaming (391 - 590, n=104, last 2 years) | |
| Acer Predator Helios 18 PH18-72-98MW | |
| Acer Predator Helios 18 AI | |
| Medion Erazer Beast 18 X1 MD62731 | |
| Average Intel Core Ultra 9 275HX, NVIDIA GeForce RTX 5080 Laptop (405 - 432, n=9) | |
| Asus Strix Scar 18 G835LX | |
| MSI Titan 18 HX AI A2XWJG | |
| MSI Vector A18 HX A9W | |
| MSI Raider A18 HX A9WIG-080 | |
* ... smaller is better
| PCMark 10 Score | 8511 points | |
Help | ||
| AIDA64 / Memory Copy | |
| MSI Titan 18 HX AI A2XWJG | |
| Asus Strix Scar 18 G835LX | |
| Average Intel Core Ultra 9 275HX (56003 - 94460, n=30) | |
| Acer Predator Helios 18 PH18-72-98MW | |
| Medion Erazer Beast 18 X1 MD62731 | |
| Average of class Gaming (21750 - 129946, n=107, last 2 years) | |
| Acer Predator Helios 18 AI | |
| MSI Vector A18 HX A9W | |
| MSI Raider A18 HX A9WIG-080 | |
| AIDA64 / Memory Read | |
| MSI Titan 18 HX AI A2XWJG | |
| Medion Erazer Beast 18 X1 MD62731 | |
| Asus Strix Scar 18 G835LX | |
| Acer Predator Helios 18 PH18-72-98MW | |
| Average Intel Core Ultra 9 275HX (55795 - 97151, n=30) | |
| Average of class Gaming (22956 - 118858, n=107, last 2 years) | |
| Acer Predator Helios 18 AI | |
| MSI Vector A18 HX A9W | |
| MSI Raider A18 HX A9WIG-080 | |
| AIDA64 / Memory Write | |
| MSI Titan 18 HX AI A2XWJG | |
| Asus Strix Scar 18 G835LX | |
| Average Intel Core Ultra 9 275HX (55663 - 116129, n=30) | |
| Medion Erazer Beast 18 X1 MD62731 | |
| Average of class Gaming (22297 - 135096, n=107, last 2 years) | |
| Acer Predator Helios 18 PH18-72-98MW | |
| MSI Vector A18 HX A9W | |
| Acer Predator Helios 18 AI | |
| MSI Raider A18 HX A9WIG-080 | |
| AIDA64 / Memory Latency | |
| Acer Predator Helios 18 AI | |
| Average Intel Core Ultra 9 275HX (105.8 - 161.6, n=30) | |
| Medion Erazer Beast 18 X1 MD62731 | |
| Asus Strix Scar 18 G835LX | |
| Average of class Gaming (75.3 - 259, n=107, last 2 years) | |
| MSI Titan 18 HX AI A2XWJG | |
| MSI Vector A18 HX A9W | |
| MSI Raider A18 HX A9WIG-080 | |
| Acer Predator Helios 18 PH18-72-98MW | |
* ... smaller is better
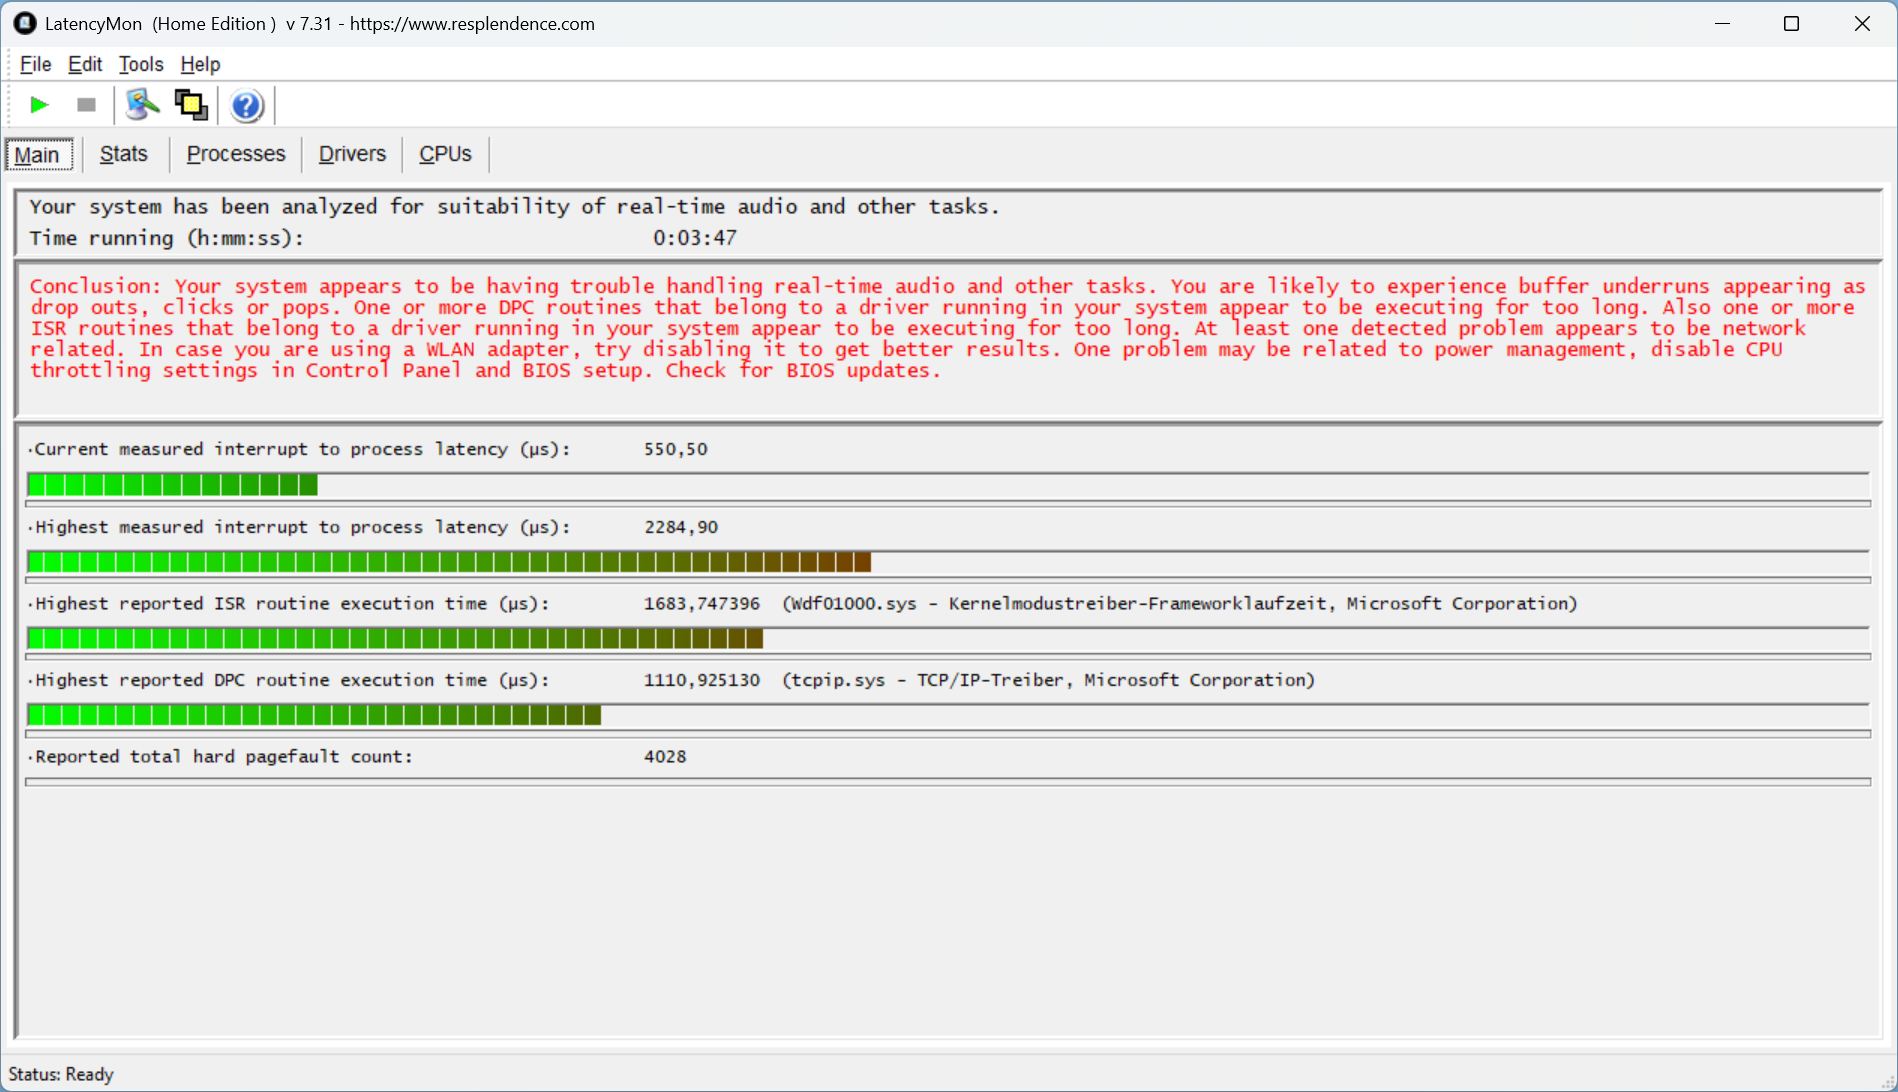
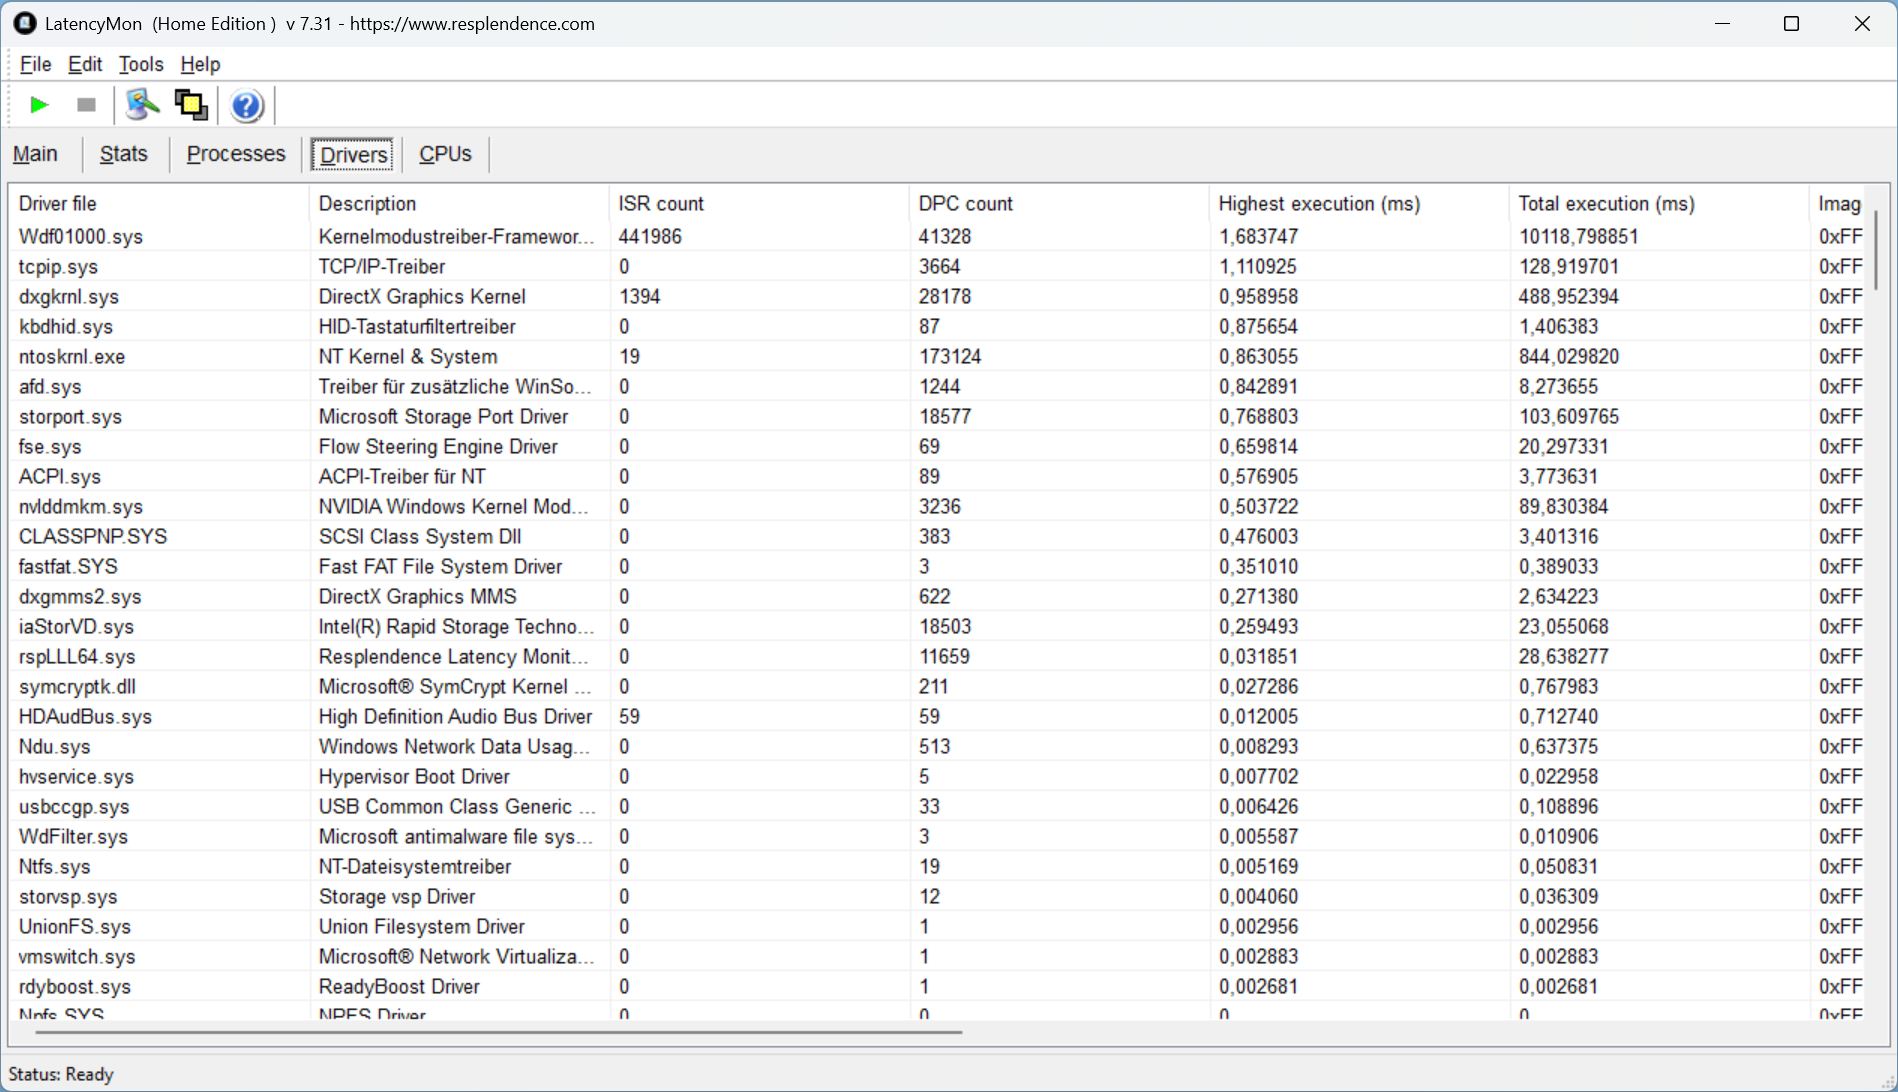
DPC latencies
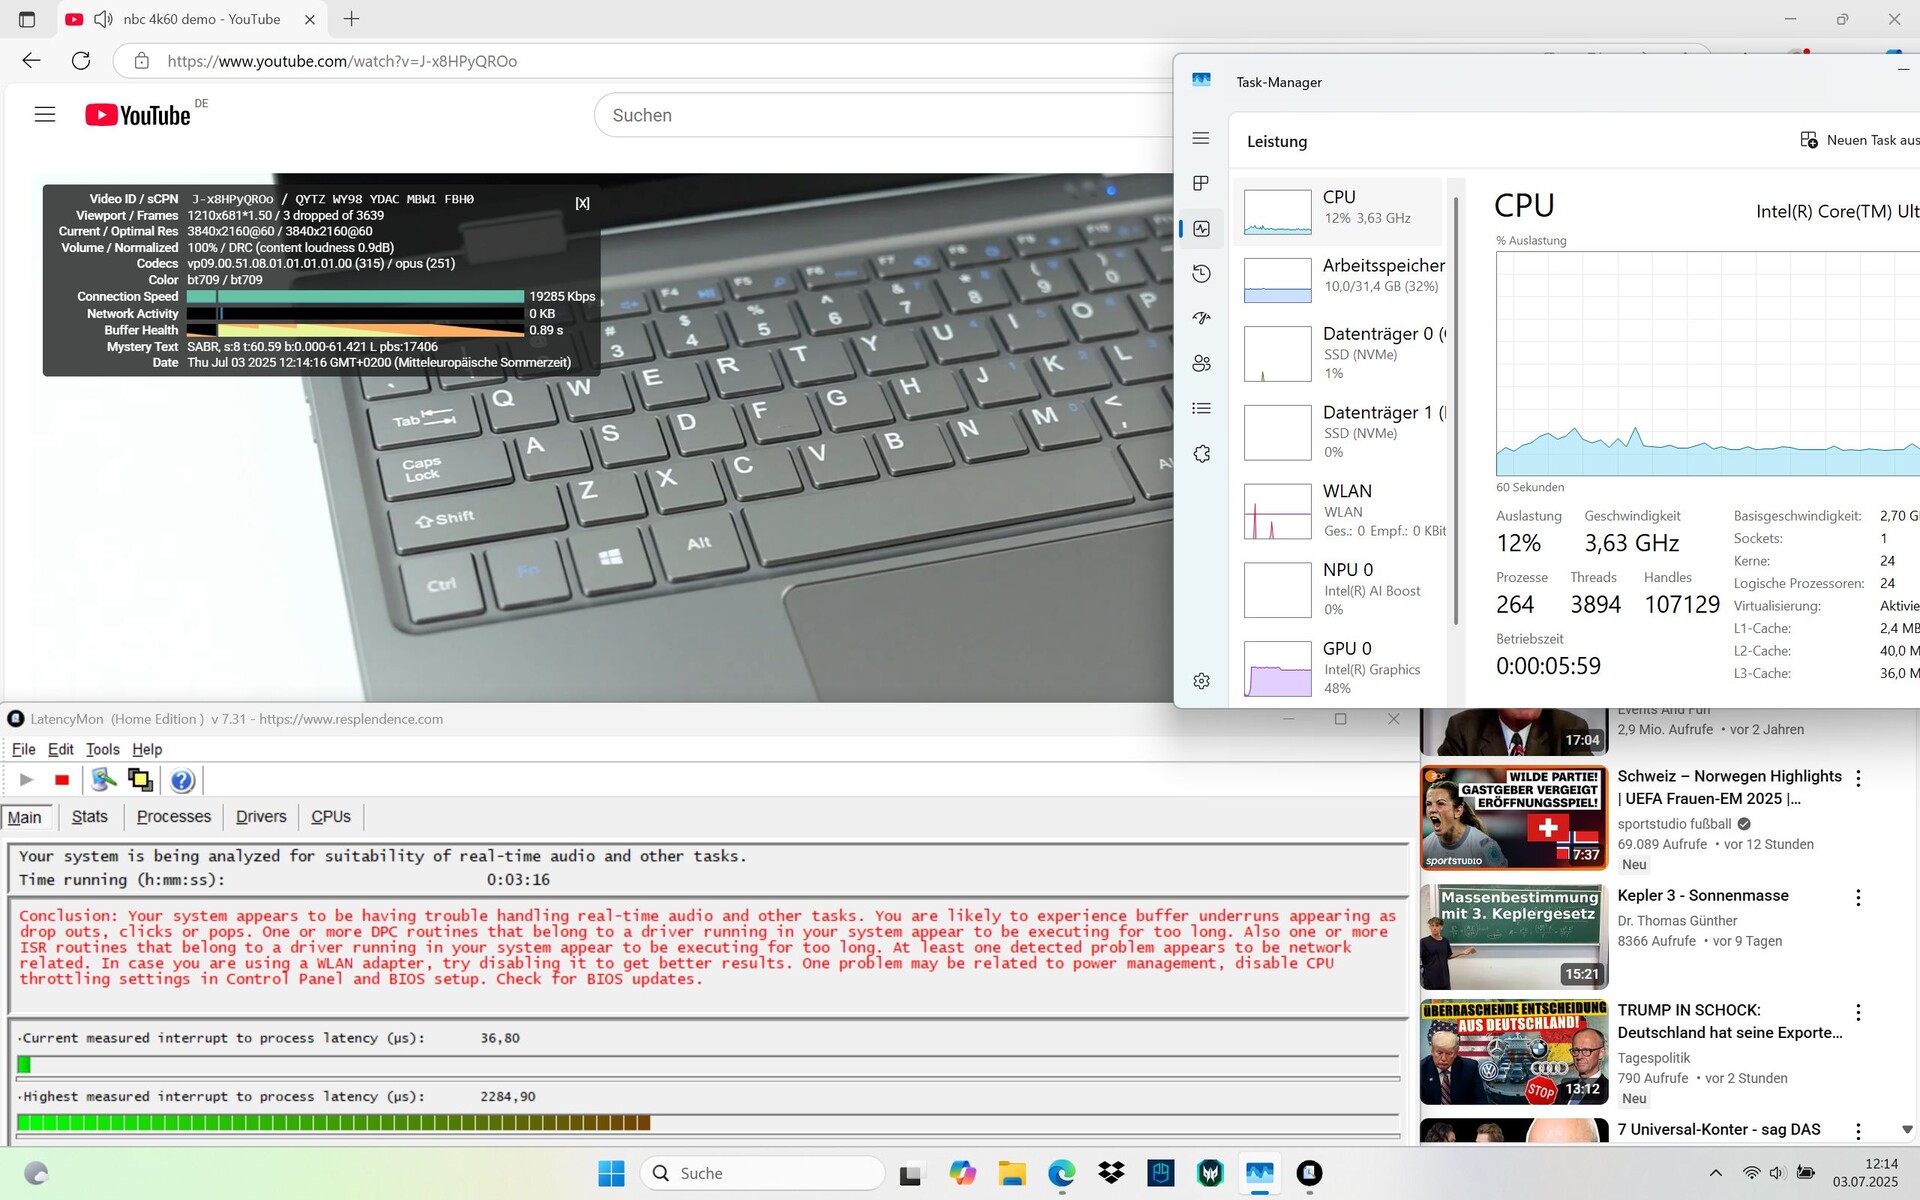
LatencyMon starts with the first latencies, which increase when the browser and other tabs are opened. Our 4K 60 fps YouTube video is played with 3 omitted frames.
| DPC Latencies / LatencyMon - interrupt to process latency (max), Web, Youtube, Prime95 | |
| Medion Erazer Beast 18 X1 MD62731 | |
| Acer Predator Helios 18 PH18-72-98MW | |
| Acer Predator Helios 18 AI | |
| MSI Titan 18 HX AI A2XWJG | |
| MSI Raider A18 HX A9WIG-080 | |
| Asus Strix Scar 18 G835LX | |
| MSI Vector A18 HX A9W | |
* ... smaller is better
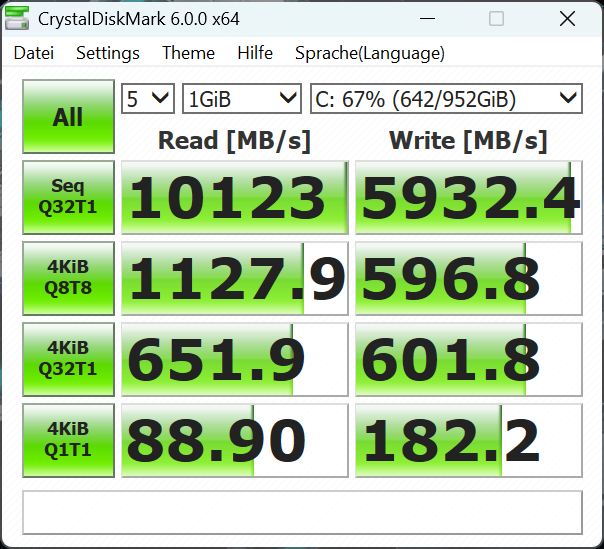
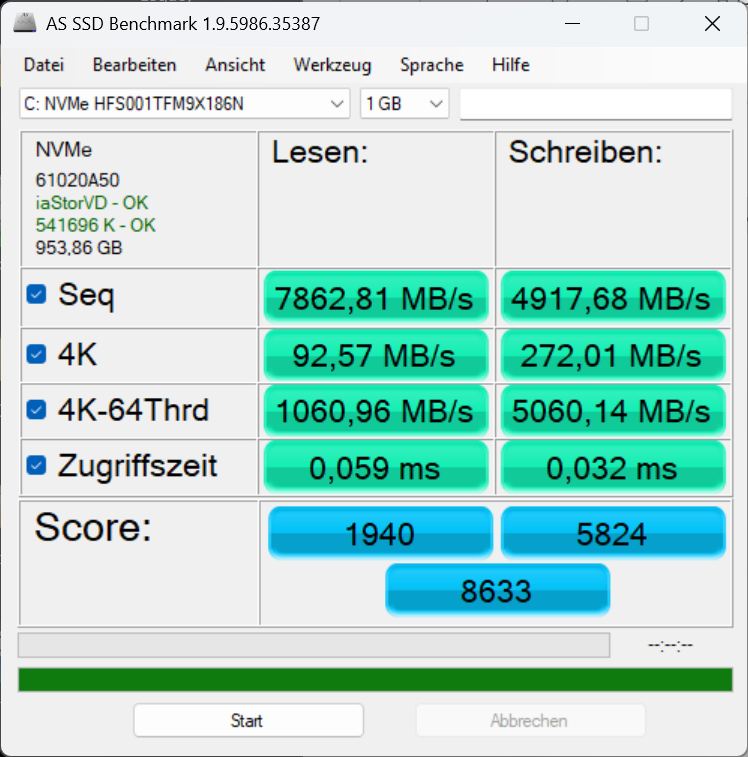
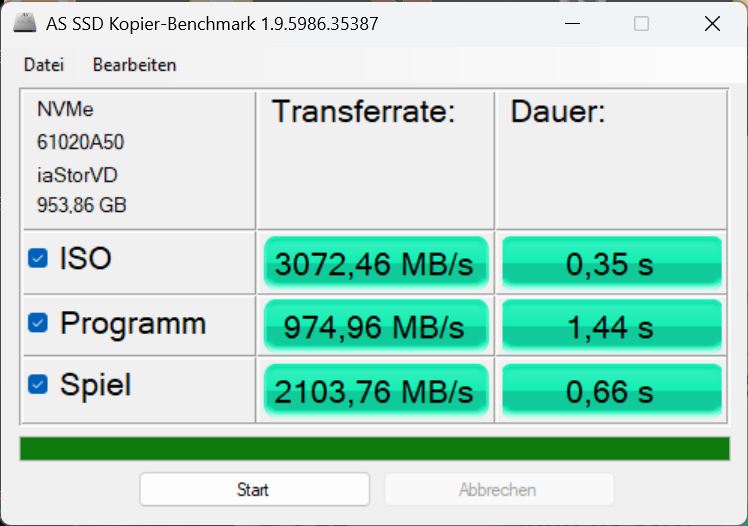
Mass storage
Our configuration contains two SSDs from SK Hynix (different models), each with 1 TB of storage space, which are apparently not connected in RAID. The system SSD is very fast, but is throttled after half the time under continuous load.

* ... smaller is better
Continuous read: DiskSpd Read Loop, Queue Depth 8
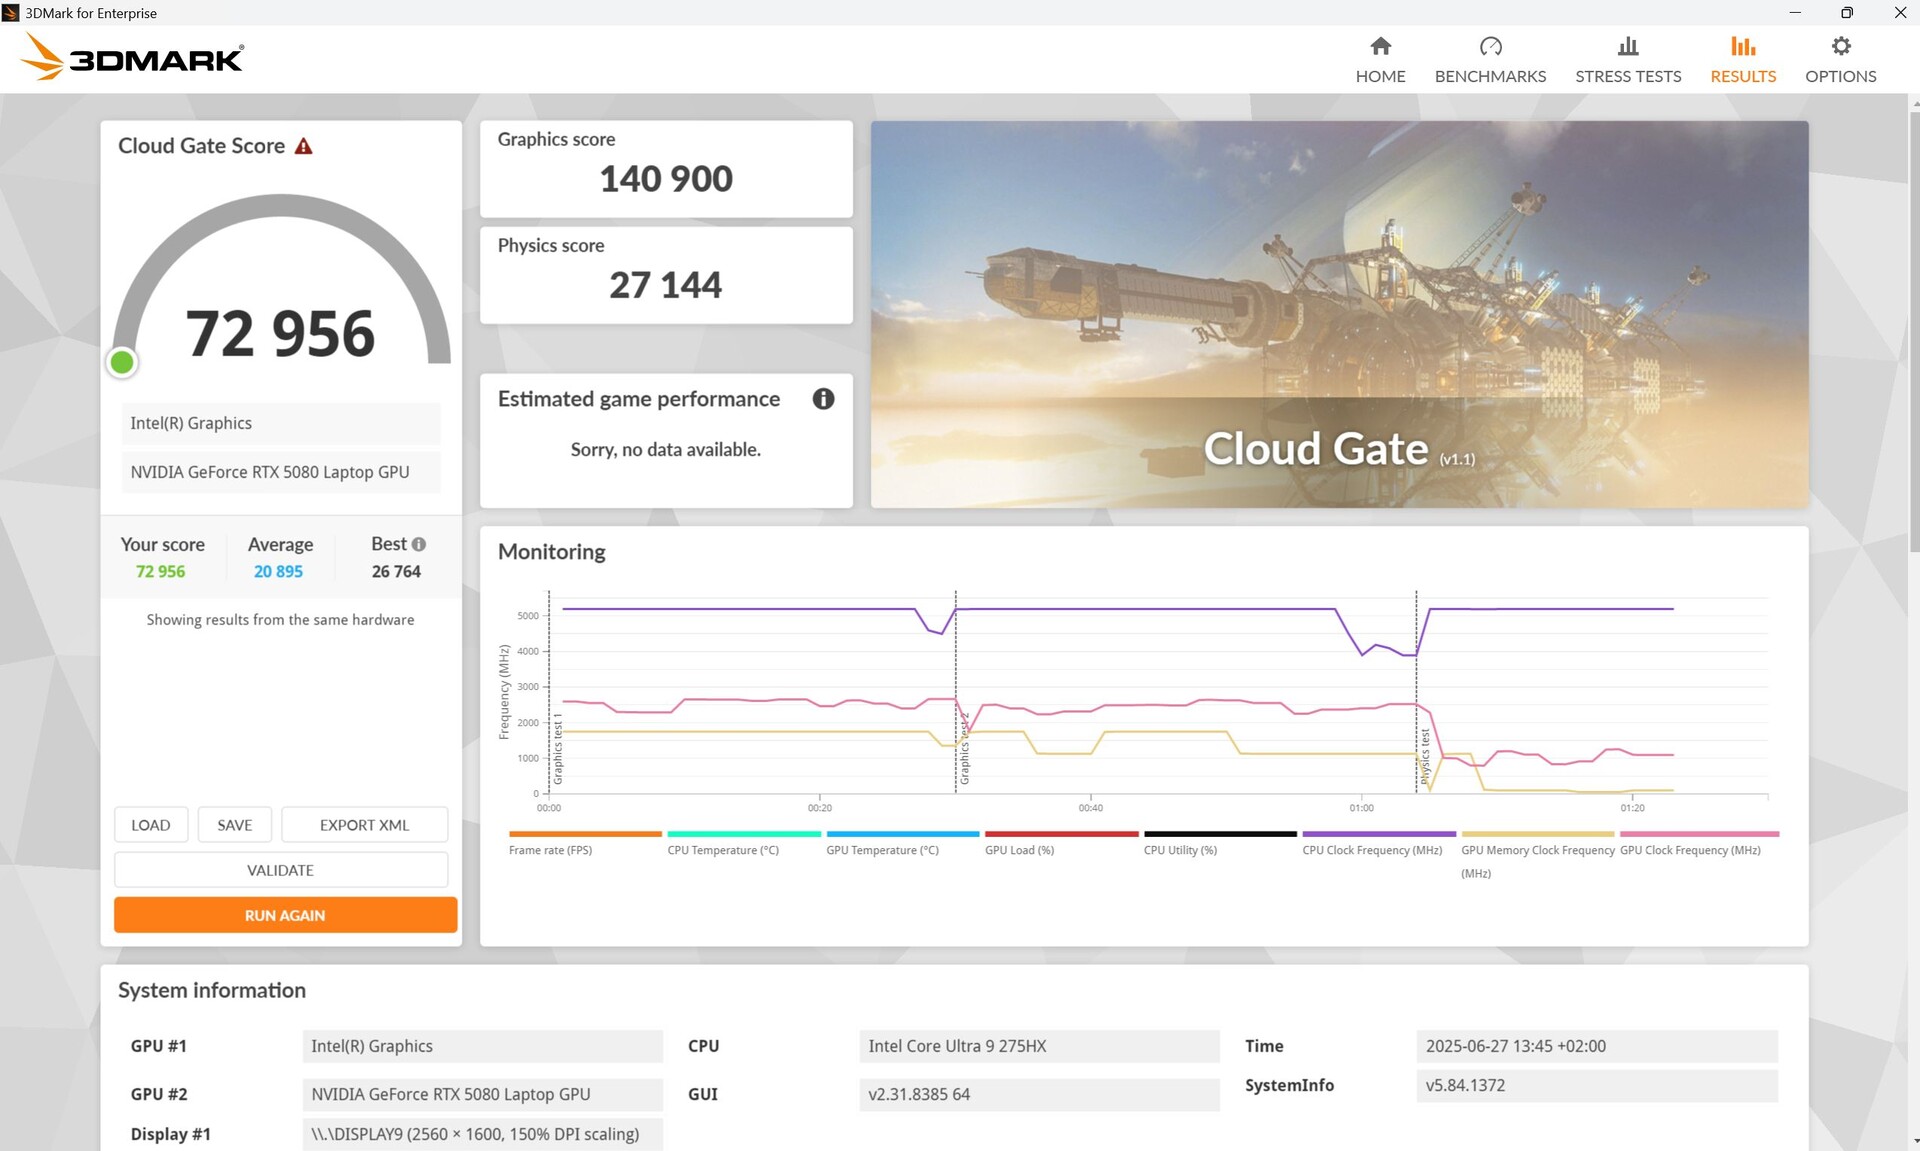
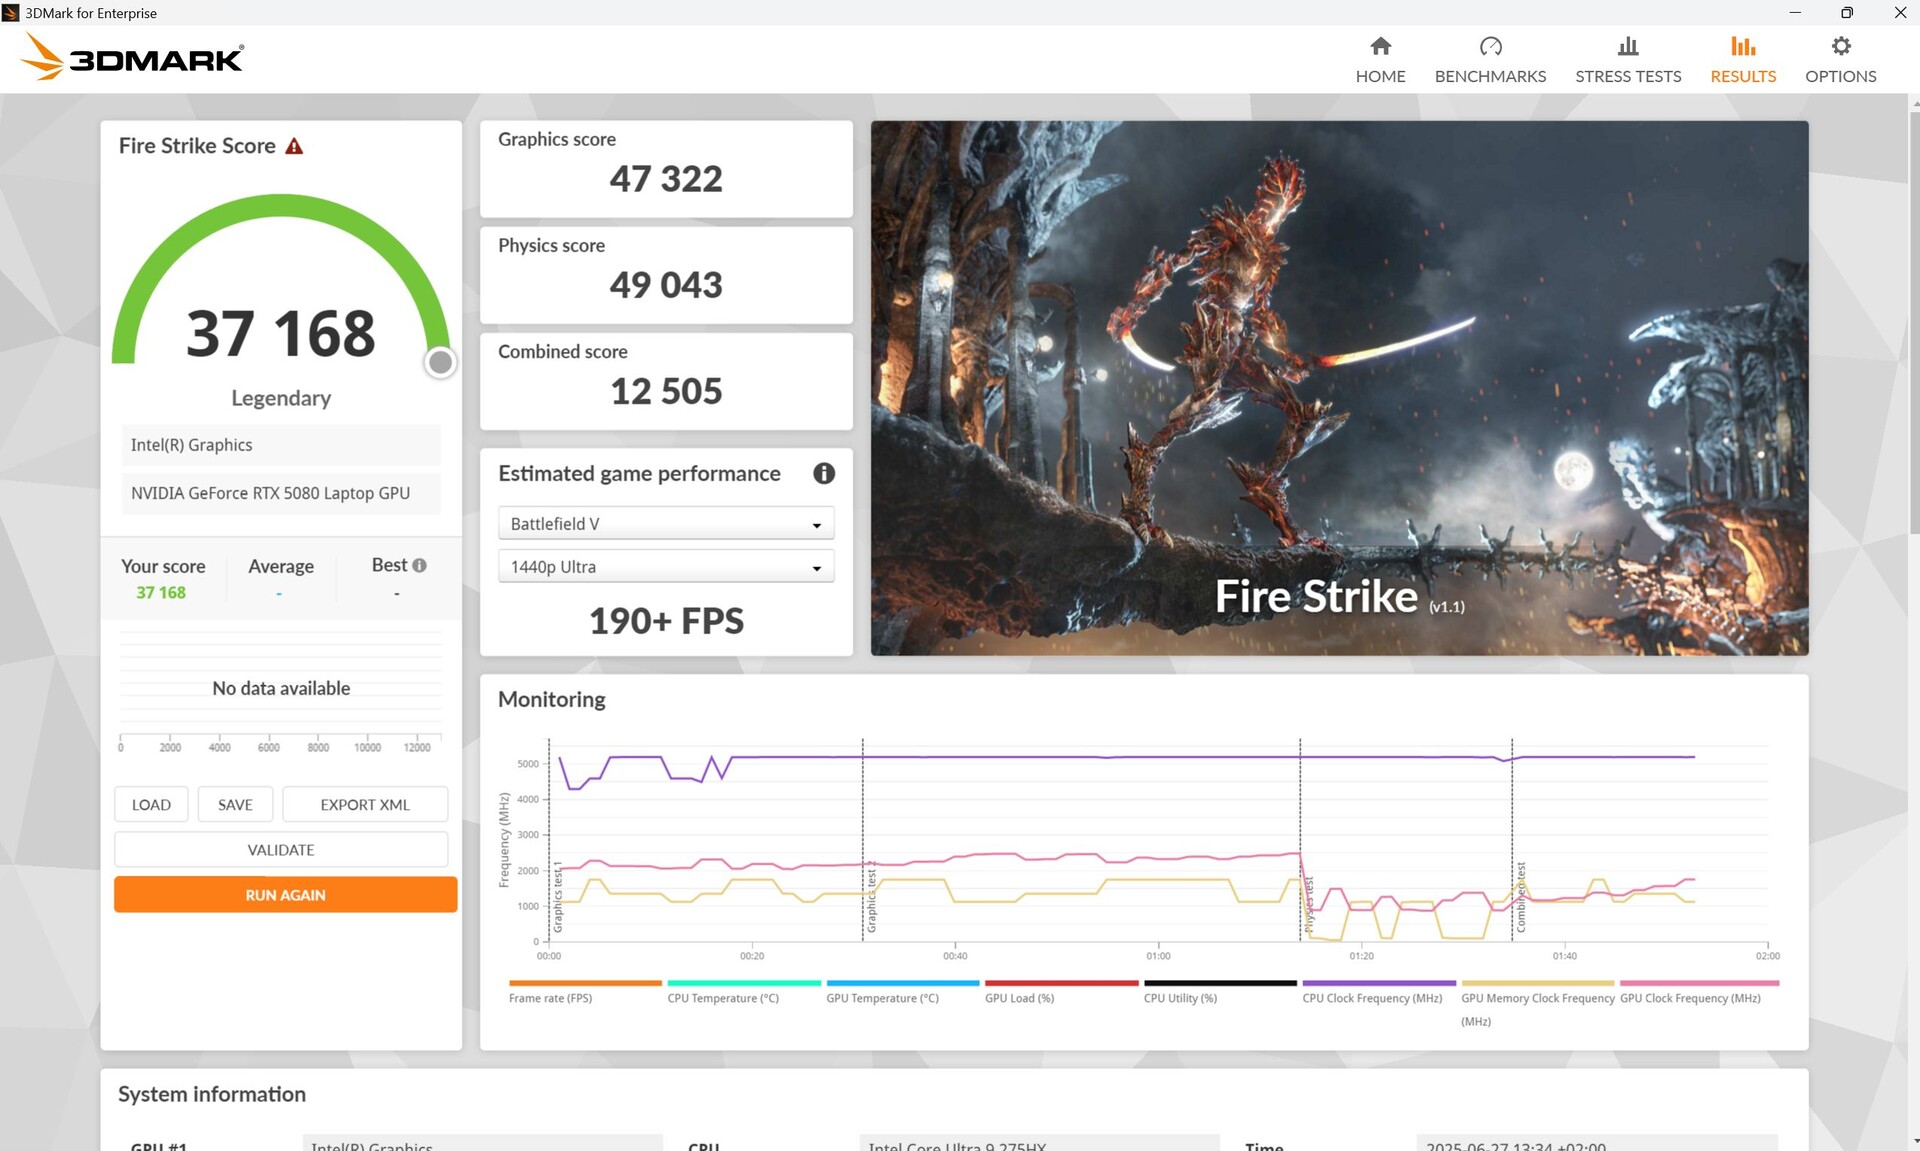
GPU performance
In the synthetic 3DMarks, the GeForce RTX 5080 laptop of our Helios 18 is around 3 percent behind the average; the MSI Raider A18 with the same GPU is 8 percent faster. A whopping 85 percent of 3D performance is lost in battery mode!
The situation is similar in the gaming tests: our Helios performs in Full HD on par with the Medion Erazer Beast 18 X1, but the MSI Vector A18 HX with RTX 5070 Ti laptop is even 8 to 9 percent ahead of the two RTX 5080-equipped gamers! The Helios 18 predecessor with RTX 4090 laptop is only 4 percent slower across all games. In QHD, the differences can be even greater.
The Helios 18 feels particularly comfortable in Full HD and QHD. Baldur's Gate 3, for example, crashes at 7 fps in 4K, and some other titles, such as F1 25 or Cyberpunk 2077, no longer run smoothly in 4K. Our Cyberpunk graph shows, on the one hand, that a few frames are lost over time, and on the other hand, that the MSI Vector 17 is at least as fast, despite having an actually weaker GPU.
Some titles, such as F1 25 in QHD, can still be given a boost via DLSS if they no longer run completely smoothly natively.
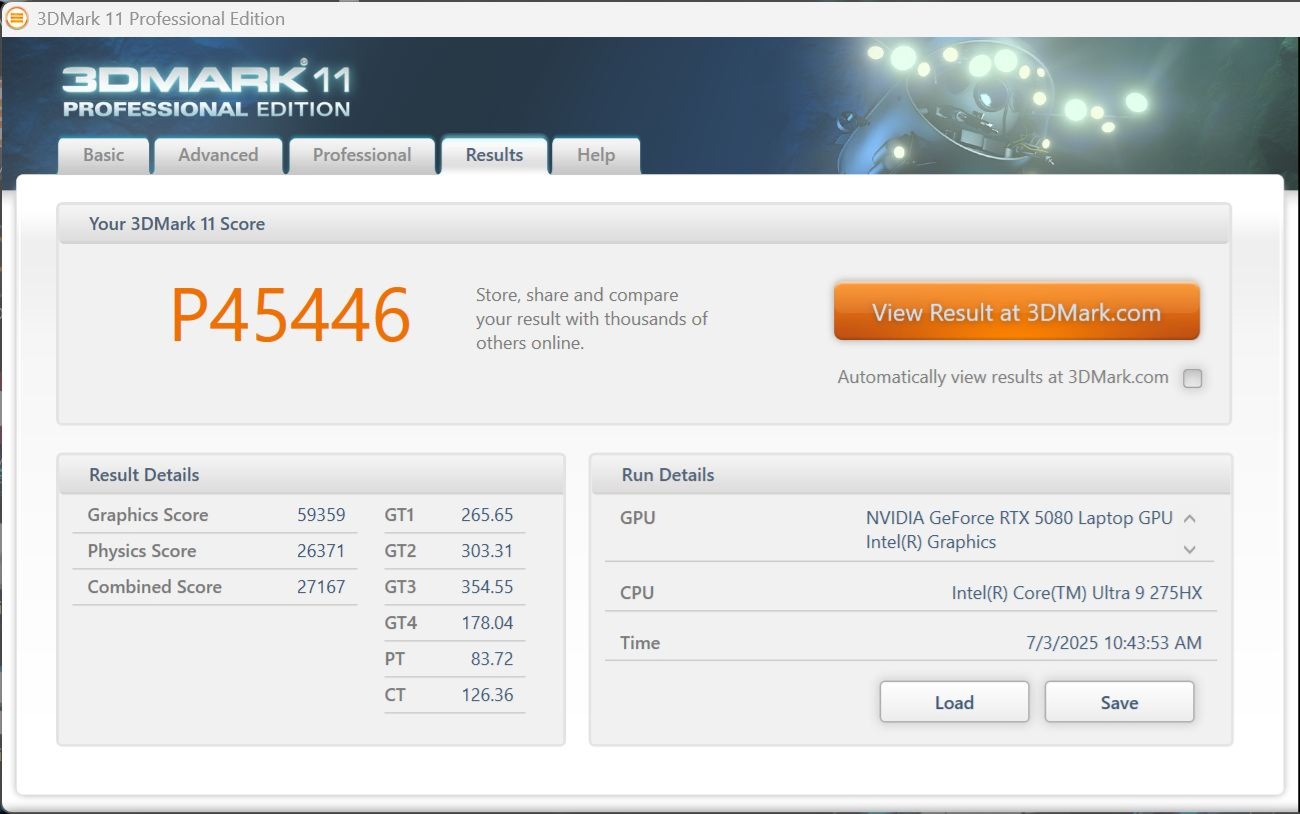
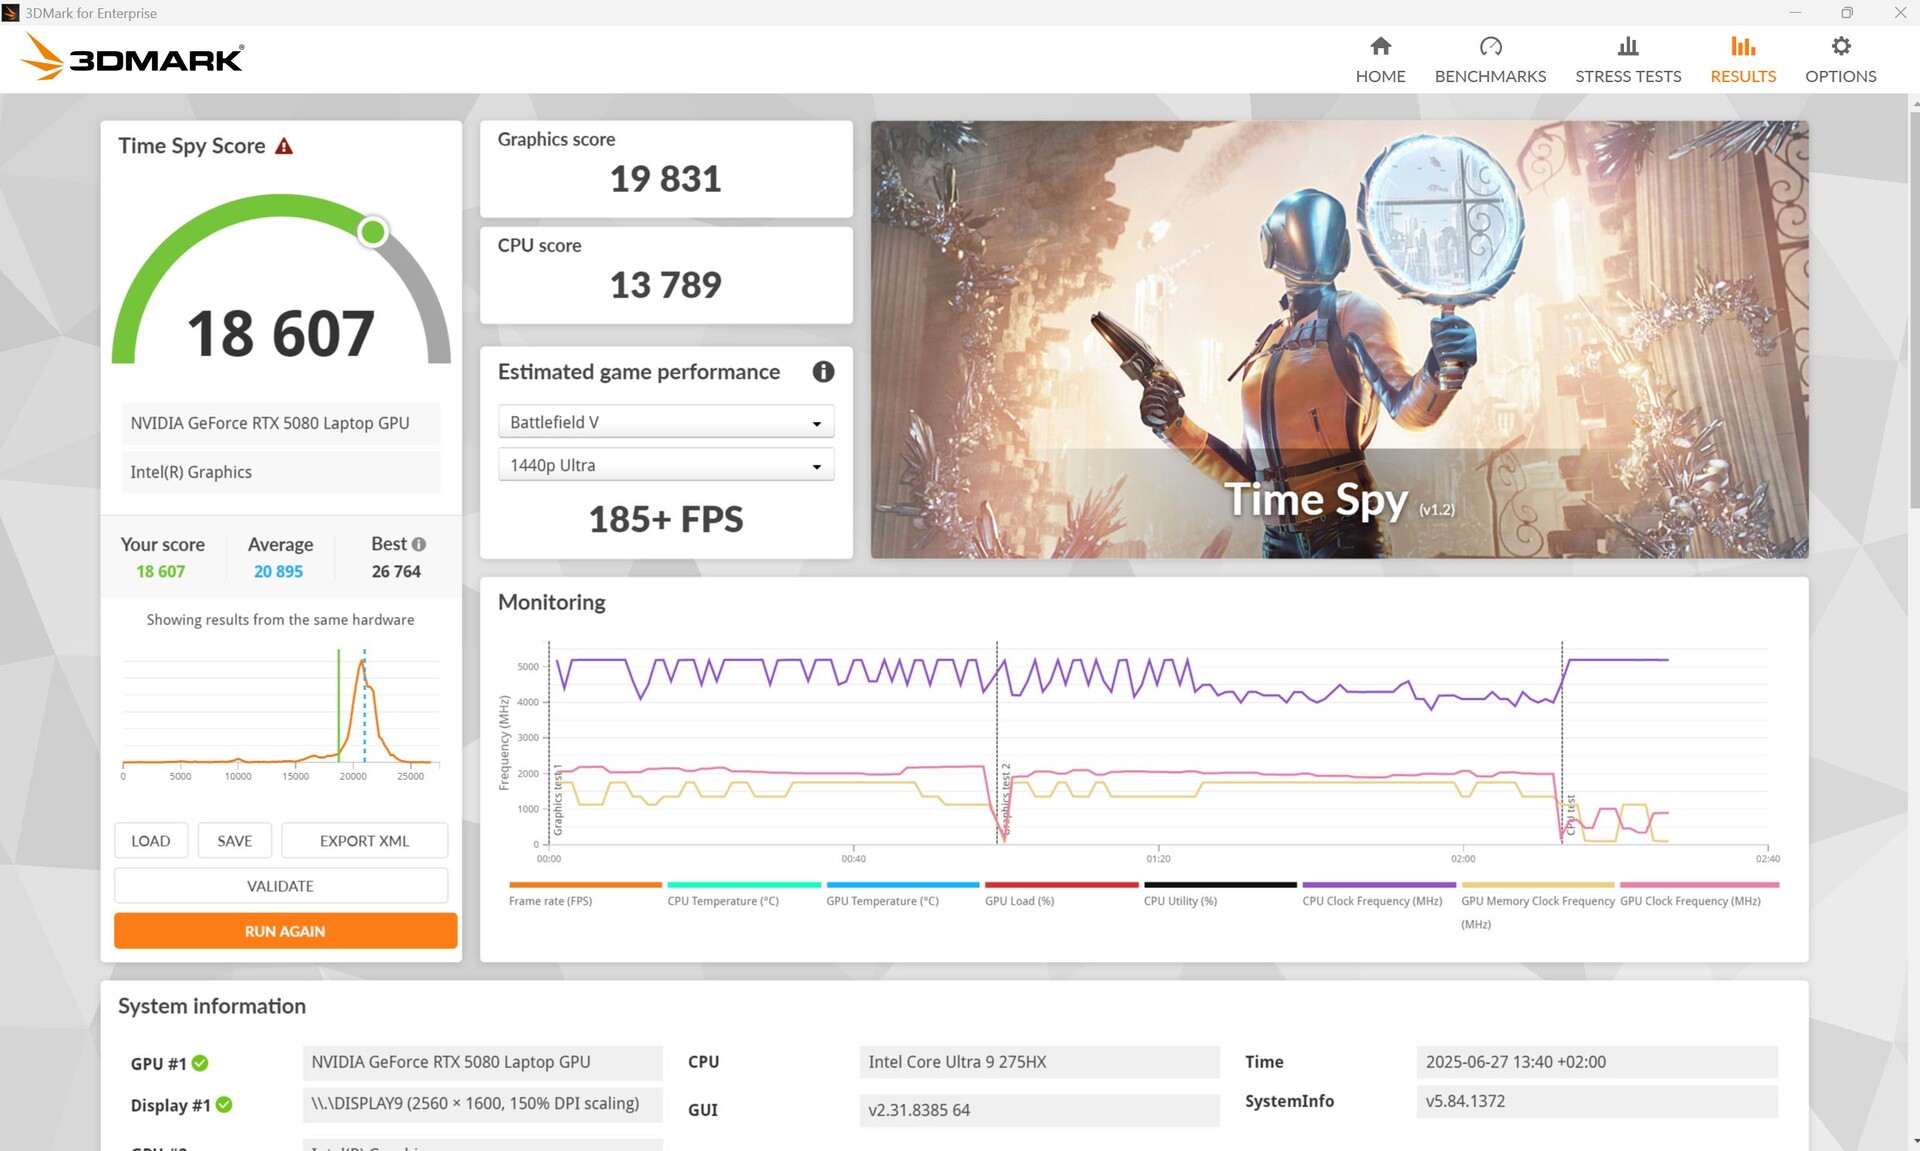
| 3DMark 11 Performance | 45446 points | |
| 3DMark Cloud Gate Standard Score | 72956 points | |
| 3DMark Fire Strike Score | 37168 points | |
| 3DMark Time Spy Score | 18607 points | |
Help | ||
* ... smaller is better
| Cyberpunk 2077 - 1920x1080 Ultra Preset (FSR off) | |
| MSI Raider A18 HX A9WIG-080 | |
| Medion Erazer Beast 18 X1 MD62731 | |
| Acer Predator Helios 18 AI | |
| MSI Vector 17 HX AI A2XWIG | |
| MSI Vector A18 HX A9W | |
| Alienware 16 Area-51 | |
| Average of class Gaming (17.7 - 169.9, n=117, last 2 years) | |
| GTA V - 1920x1080 Highest AA:4xMSAA + FX AF:16x | |
| MSI Raider A18 HX A9WIG-080 | |
| MSI Vector 17 HX AI A2XWIG | |
| Acer Predator Helios 18 AI | |
| Medion Erazer Beast 18 X1 MD62731 | |
| Acer Predator Helios 18 PH18-72-98MW | |
| Average of class Gaming (48.3 - 186.9, n=97, last 2 years) | |
Cyberpunk 2077 Ultra FPS chart
| low | med. | high | ultra | QHD DLSS | QHD | 4K DLSS | 4K | |
|---|---|---|---|---|---|---|---|---|
| GTA V (2015) | 185.9 | 184.6 | 181.3 | 146.1 | 143.9 | |||
| Dota 2 Reborn (2015) | 201 | 177.5 | 173.2 | 158.3 | 155.9 | |||
| Final Fantasy XV Benchmark (2018) | 233 | 220 | 176.3 | 144.5 | ||||
| X-Plane 11.11 (2018) | 145.8 | 131.1 | 105.1 | 90.8 | ||||
| Strange Brigade (2018) | 600 | 456 | 406 | 371 | 278 | 148.9 | ||
| Baldur's Gate 3 (2023) | 232 | 206 | 182.4 | 178 | 181 | 123 | 30.6 | |
| Cyberpunk 2077 (2023) | 176.3 | 170.3 | 150.4 | 139.6 | 103.8 | 94.6 | 42 | |
| F1 25 (2025) | 177.7 | 176.1 | 169.9 | 44.3 | 48.7 | 27.3 | 24.8 | 12.8 |
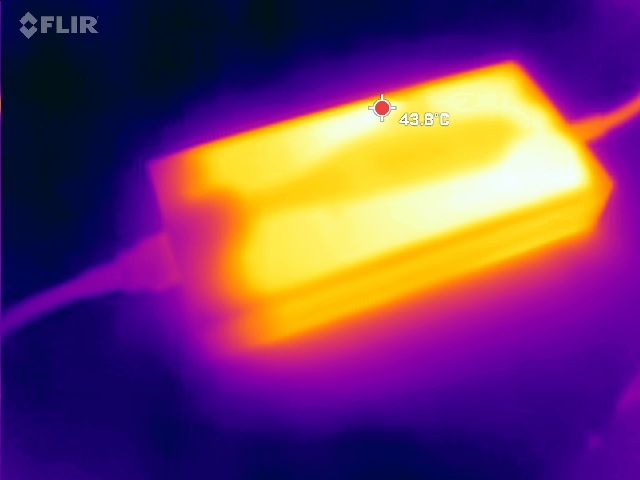
Emissions & energy - 400 W power supply unit!
Noise emissions
The fans of the Helios are already noticeable from time to time when idling, both in Turbo and Performance mode.
The approx. 50 dB under load is at the lower end of the comparison scale, so there are significantly louder gamers. It gets extremely loud in Turbo mode, reaching up to 60 dB. If you play in the quieter Balanced mode, you have to expect a drop in 3D performance of around 13 percent.
Noise level
| Idle |
| 24 / 24 / 31.31 dB(A) |
| Load |
| 40.31 / 50.33 dB(A) |
 | ||
30 dB silent 40 dB(A) audible 50 dB(A) loud |
||
min: | ||
| Acer Predator Helios 18 AI GeForce RTX 5080 Laptop, Ultra 9 275HX, SK hynix PCB01 HFS001TFM9X186N | MSI Raider A18 HX A9WIG-080 GeForce RTX 5080 Laptop, R9 9955HX3D, Samsung PM9E1 MZVLC2T0HBLD | Medion Erazer Beast 18 X1 MD62731 GeForce RTX 5080 Laptop, Ultra 9 275HX, Phison E31 2 TB | Asus Strix Scar 18 G835LX GeForce RTX 5090 Laptop, Ultra 9 275HX, WD PC SN8000S 2TB | MSI Titan 18 HX AI A2XWJG GeForce RTX 5090 Laptop, Ultra 9 285HX, 1x Samsung PM9E1 MZVLC2T0HBLD-00BT7 + 2x Samsung PM9A1 MZVL22T0HDLB-00BT7 (RAID 0) | MSI Vector A18 HX A9W GeForce RTX 5070 Ti Laptop, R9 9955HX | |
|---|---|---|---|---|---|---|
| Noise | -7% | -21% | -9% | -12% | -6% | |
| off / environment * (dB) | 24 | 25.1 -5% | 25 -4% | 23.3 3% | 25.56 -7% | 22.5 6% |
| Idle Minimum * (dB) | 24 | 28.6 -19% | 25 -4% | 29.8 -24% | 27.68 -15% | 26 -8% |
| Idle Average * (dB) | 24 | 28.9 -20% | 39 -63% | 29.8 -24% | 27.68 -15% | 26 -8% |
| Idle Maximum * (dB) | 31.31 | 29.2 7% | 42 -34% | 29.8 5% | 31.54 -1% | 32 -2% |
| Load Average * (dB) | 40.31 | 45.6 -13% | 52 -29% | 42.9 -6% | 44 -9% | 44.4 -10% |
| Cyberpunk 2077 ultra * (dB) | 50.33 | 55.6 -10% | 53 -5% | 53.7 -7% | 58.7 -17% | 49.8 1% |
| Load Maximum * (dB) | 50.33 | 45.8 9% | 55 -9% | 53.7 -7% | 58.9 -17% | 61.6 -22% |
* ... smaller is better
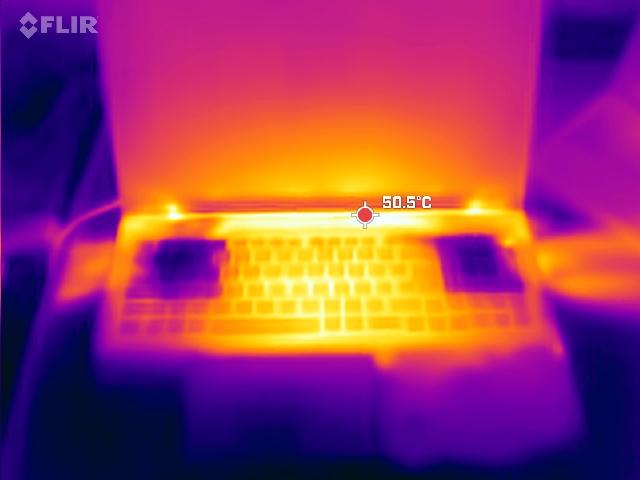
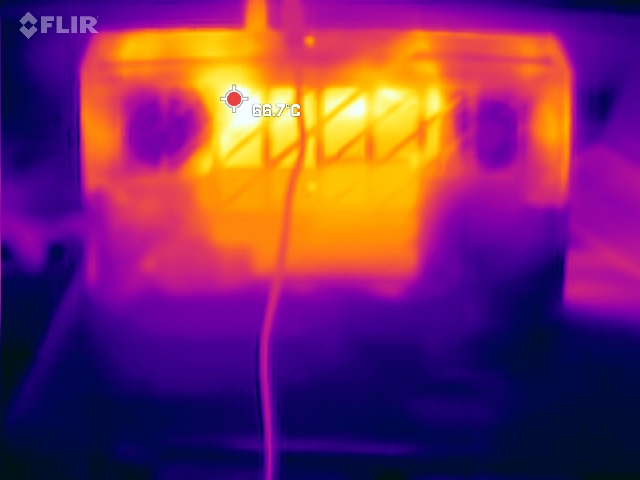
Temperature
It gets hot under full load, especially at the bottom, centrally towards the display (up to 59 °C). The WASD keys remain moderately warm (39 °C).
(-) The maximum temperature on the upper side is 48 °C / 118 F, compared to the average of 40.4 °C / 105 F, ranging from 21.2 to 68.8 °C for the class Gaming.
(-) The bottom heats up to a maximum of 59 °C / 138 F, compared to the average of 43.2 °C / 110 F
(+) In idle usage, the average temperature for the upper side is 30.3 °C / 87 F, compared to the device average of 33.9 °C / 93 F.
(-) 3: The average temperature for the upper side is 39.7 °C / 103 F, compared to the average of 33.9 °C / 93 F for the class Gaming.
(+) The palmrests and touchpad are reaching skin temperature as a maximum (34 °C / 93.2 F) and are therefore not hot.
(-) The average temperature of the palmrest area of similar devices was 28.8 °C / 83.8 F (-5.2 °C / -9.4 F).
| Acer Predator Helios 18 AI Intel Core Ultra 9 275HX, NVIDIA GeForce RTX 5080 Laptop | MSI Raider A18 HX A9WIG-080 AMD Ryzen 9 9955HX3D, NVIDIA GeForce RTX 5080 Laptop | Medion Erazer Beast 18 X1 MD62731 Intel Core Ultra 9 275HX, NVIDIA GeForce RTX 5080 Laptop | Asus Strix Scar 18 G835LX Intel Core Ultra 9 275HX, NVIDIA GeForce RTX 5090 Laptop | MSI Titan 18 HX AI A2XWJG Intel Core Ultra 9 285HX, NVIDIA GeForce RTX 5090 Laptop | MSI Vector A18 HX A9W AMD Ryzen 9 9955HX, NVIDIA GeForce RTX 5070 Ti Laptop | Acer Predator Helios 18 PH18-72-98MW Intel Core i9-14900HX, NVIDIA GeForce RTX 4090 Laptop GPU | |
|---|---|---|---|---|---|---|---|
| Heat | 1% | 8% | 13% | -7% | 11% | 3% | |
| Maximum Upper Side * (°C) | 48 | 49.3 -3% | 47 2% | 45.6 5% | 48.2 -0% | 46.6 3% | 43 10% |
| Maximum Bottom * (°C) | 59 | 50.9 14% | 48 19% | 46 22% | 53.6 9% | 45.6 23% | 59 -0% |
| Idle Upper Side * (°C) | 33 | 35.2 -7% | 29 12% | 28.9 12% | 37.2 -13% | 31.2 5% | 32 3% |
| Idle Bottom * (°C) | 33 | 33.5 -2% | 33 -0% | 29.2 12% | 40.4 -22% | 28.6 13% | 34 -3% |
* ... smaller is better
Speaker
The 6-speaker system (according to Acer) plays quite loudly, has balanced highs, and at least no bass phobia like many colleagues.
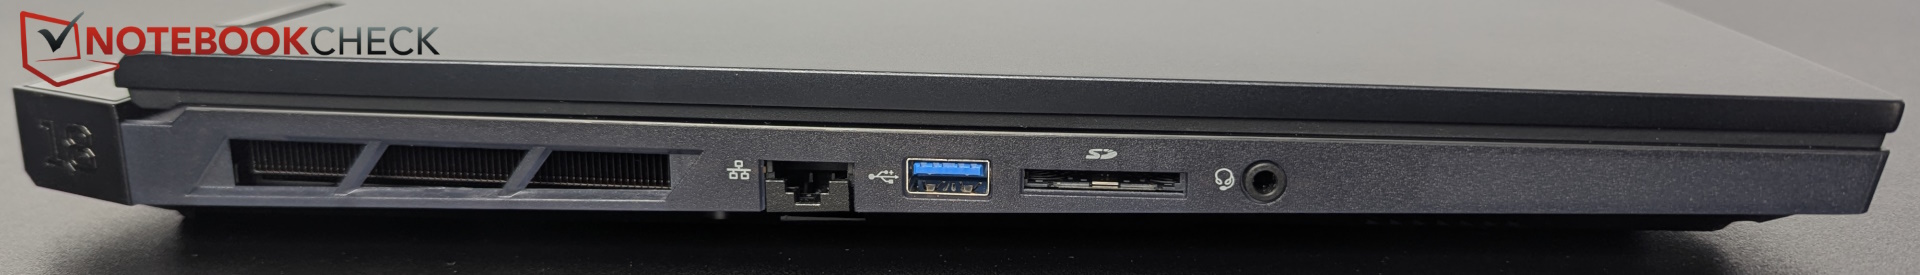
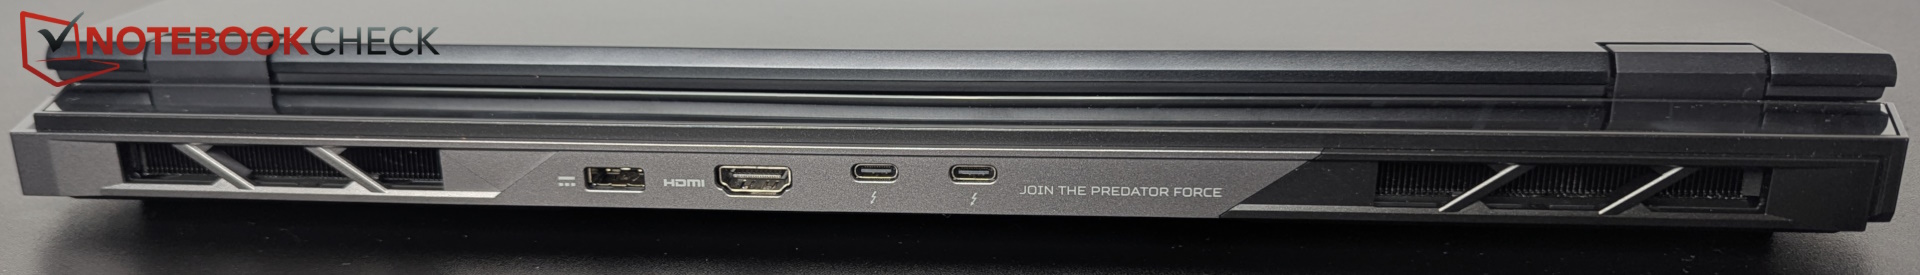
A headset port in jack format is available for connecting headphones and similar devices.
Acer Predator Helios 18 AI audio analysis
(+) | speakers can play relatively loud (87.6 dB)
Bass 100 - 315 Hz
(±) | reduced bass - on average 9.5% lower than median
(±) | linearity of bass is average (8.6% delta to prev. frequency)
Mids 400 - 2000 Hz
(±) | higher mids - on average 9.1% higher than median
(±) | linearity of mids is average (8.3% delta to prev. frequency)
Highs 2 - 16 kHz
(+) | balanced highs - only 1.9% away from median
(+) | highs are linear (3.8% delta to prev. frequency)
Overall 100 - 16.000 Hz
(+) | overall sound is linear (13.1% difference to median)
Compared to same class
» 18% of all tested devices in this class were better, 4% similar, 78% worse
» The best had a delta of 6%, average was 18%, worst was 132%
Compared to all devices tested
» 13% of all tested devices were better, 3% similar, 84% worse
» The best had a delta of 4%, average was 24%, worst was 134%
MSI Raider A18 HX A9WIG-080 audio analysis
(+) | speakers can play relatively loud (85.9 dB)
Bass 100 - 315 Hz
(-) | nearly no bass - on average 17.1% lower than median
(±) | linearity of bass is average (8.5% delta to prev. frequency)
Mids 400 - 2000 Hz
(±) | higher mids - on average 9.4% higher than median
(±) | linearity of mids is average (9.1% delta to prev. frequency)
Highs 2 - 16 kHz
(+) | balanced highs - only 3.8% away from median
(+) | highs are linear (5.8% delta to prev. frequency)
Overall 100 - 16.000 Hz
(±) | linearity of overall sound is average (18.9% difference to median)
Compared to same class
» 63% of all tested devices in this class were better, 8% similar, 29% worse
» The best had a delta of 6%, average was 18%, worst was 132%
Compared to all devices tested
» 44% of all tested devices were better, 8% similar, 48% worse
» The best had a delta of 4%, average was 24%, worst was 134%
Power consumption
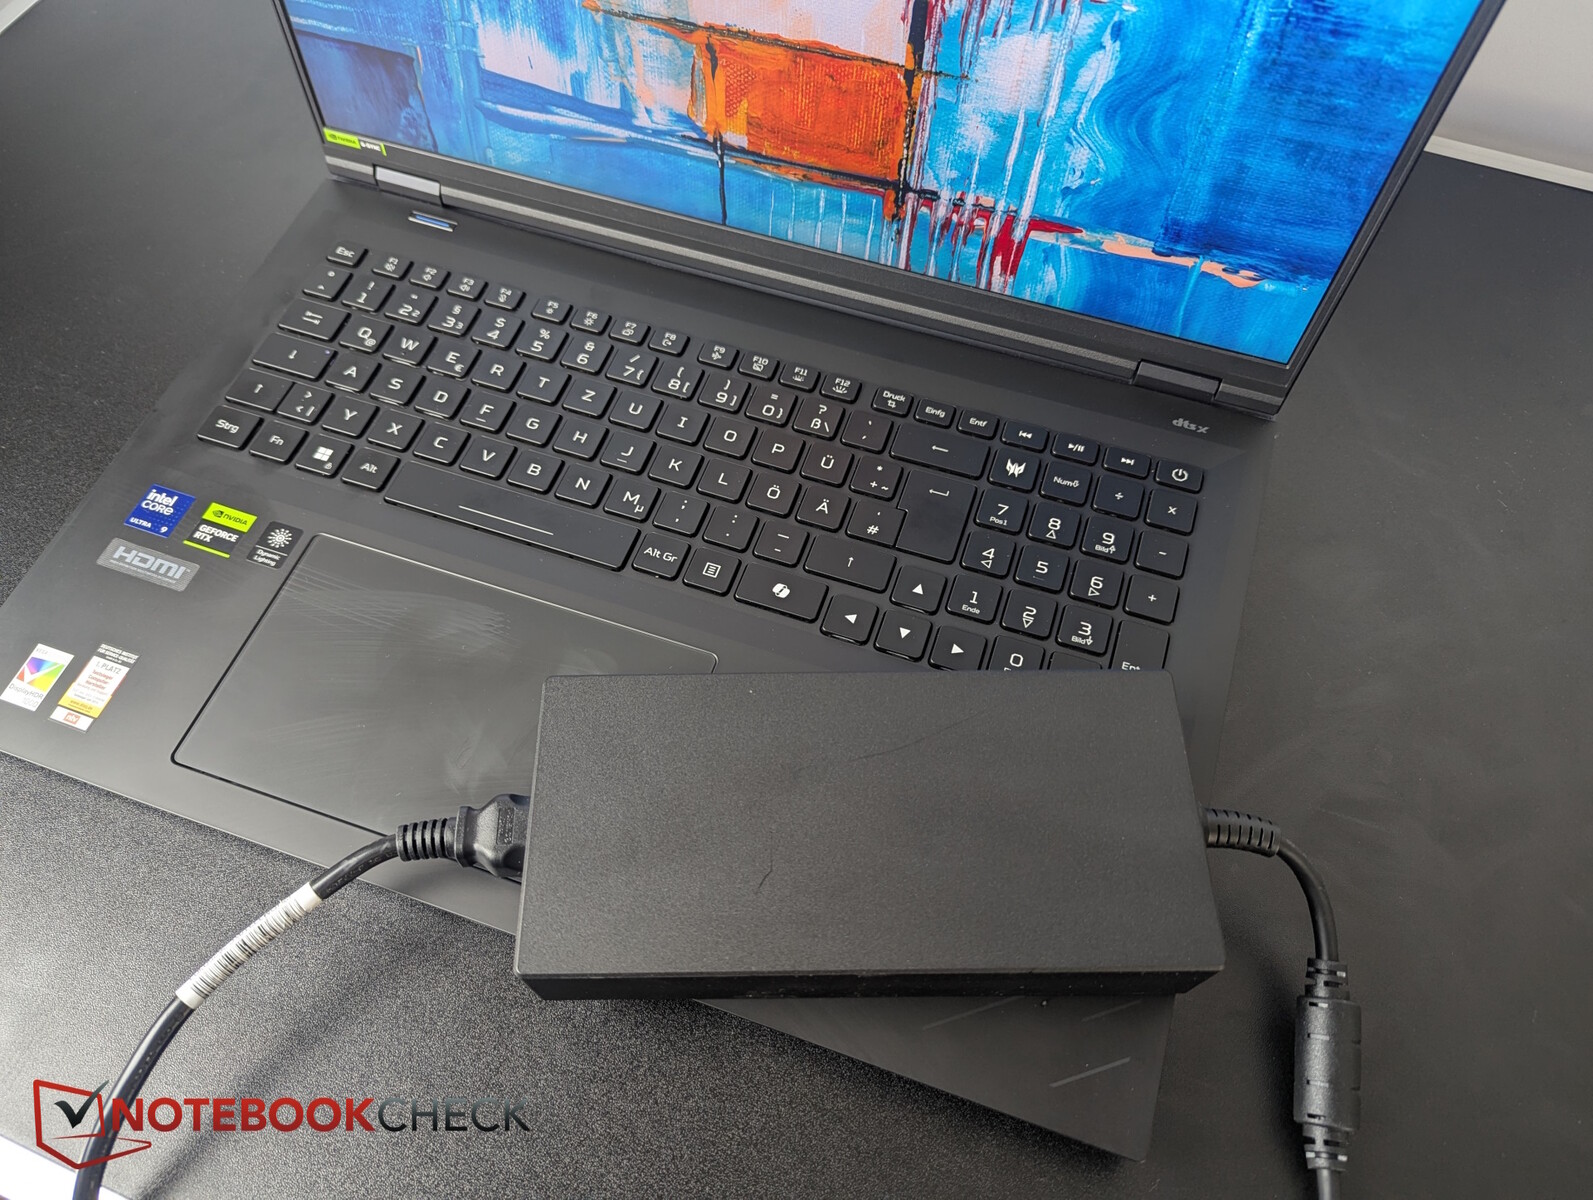
In gaming, the consumption of 245 W is fairly moderate in comparison, but there are particularly high, temporary load peaks of up to 375 W, which the large 400 W power supply can handle with.
The dGPU is active with an external display (TB).
| Off / Standby | |
| Idle | |
| Load |
|
Key:
min: | |
| Acer Predator Helios 18 AI Ultra 9 275HX, GeForce RTX 5080 Laptop, SK hynix PCB01 HFS001TFM9X186N, IPS, 2560x1600, 18" | MSI Raider A18 HX A9WIG-080 R9 9955HX3D, GeForce RTX 5080 Laptop, Samsung PM9E1 MZVLC2T0HBLD, MiniLED IPS, 3840x2400, 18" | Medion Erazer Beast 18 X1 MD62731 Ultra 9 275HX, GeForce RTX 5080 Laptop, Phison E31 2 TB, IPS, 2560x1600, 18" | Asus Strix Scar 18 G835LX Ultra 9 275HX, GeForce RTX 5090 Laptop, WD PC SN8000S 2TB, Mini-LED, 2560x1600, 18" | MSI Titan 18 HX AI A2XWJG Ultra 9 285HX, GeForce RTX 5090 Laptop, 1x Samsung PM9E1 MZVLC2T0HBLD-00BT7 + 2x Samsung PM9A1 MZVL22T0HDLB-00BT7 (RAID 0), Mini-LED, 3840x2160, 18" | MSI Vector A18 HX A9W R9 9955HX, GeForce RTX 5070 Ti Laptop, , IPS, 2560x1600, 18" | Average NVIDIA GeForce RTX 5080 Laptop | Average of class Gaming | |
|---|---|---|---|---|---|---|---|---|
| Power Consumption | -65% | 20% | -27% | -19% | -42% | -6% | 18% | |
| Idle Minimum * (Watt) | 17.3 | 41.5 -140% | 7.9 54% | 11.4 34% | 19.01 -10% | 20.8 -20% | 19.1 ? -10% | 13.1 ? 24% |
| Idle Average * (Watt) | 23 | 53.5 -133% | 11.5 50% | 39.2 -70% | 30.92 -34% | 52.8 -130% | 25.3 ? -10% | 18.8 ? 18% |
| Idle Maximum * (Watt) | 25.3 | 53.8 -113% | 16.6 34% | 40.2 -59% | 33.84 -34% | 54.5 -115% | 30.4 ? -20% | 24.4 ? 4% |
| Load Average * (Watt) | 123 | 168.5 -37% | 130 -6% | 161.2 -31% | 105.4 14% | 146.6 -19% | 128.5 ? -4% | 108.6 ? 12% |
| Cyberpunk 2077 ultra * (Watt) | 244 | 298 -22% | 253 -4% | 303 -24% | 343 -41% | 285 -17% | ||
| Cyberpunk 2077 ultra external monitor * (Watt) | 243 | 295 -21% | 245 -1% | 295 -21% | 330 -36% | 278 -14% | ||
| Load Maximum * (Watt) | 375 | 323.7 14% | 330 12% | 430.9 -15% | 354 6% | 297.3 21% | 314 ? 16% | 255 ? 32% |
* ... smaller is better
Power consumption Cyberpunk / Stress test
Power consumption with the external monitor
Battery life
The ample 99 Wh battery provides around 4.5 to 5 hours of Wi-Fi and video runtime with the brightness turned down, which is average in comparison.
| Acer Predator Helios 18 AI Ultra 9 275HX, GeForce RTX 5080 Laptop, 99 Wh | MSI Raider A18 HX A9WIG-080 R9 9955HX3D, GeForce RTX 5080 Laptop, 99 Wh | Medion Erazer Beast 18 X1 MD62731 Ultra 9 275HX, GeForce RTX 5080 Laptop, 99 Wh | Asus Strix Scar 18 G835LX Ultra 9 275HX, GeForce RTX 5090 Laptop, 90 Wh | MSI Titan 18 HX AI A2XWJG Ultra 9 285HX, GeForce RTX 5090 Laptop, 99 Wh | MSI Vector A18 HX A9W R9 9955HX, GeForce RTX 5070 Ti Laptop, 99 Wh | Acer Predator Helios 18 PH18-72-98MW i9-14900HX, GeForce RTX 4090 Laptop GPU, 90 Wh | Average of class Gaming | |
|---|---|---|---|---|---|---|---|---|
| Battery runtime | -42% | 61% | 9% | -14% | -22% | -31% | 50% | |
| H.264 (h) | 4.3 | 5.8 35% | 3 -30% | 8.9 ? 107% | ||||
| WiFi v1.3 (h) | 4.9 | 2.1 -57% | 7.9 61% | 5.5 12% | 4.3 -12% | 3.8 -22% | 3.2 -35% | 6.98 ? 42% |
| Load (h) | 1.5 | 1.1 -27% | 1.2 -20% | 1.5 0% | 1.1 -27% | 1.51 ? 1% | ||
| Cyberpunk 2077 ultra 150cd (h) | 0.7 | 1.2 | ||||||
| Reader / Idle (h) | 7 | 8.71 ? |
Notebookcheck overall rating
The Helios 18 AI is a great gamer with a good display, good features, and plenty of upgrade potential.
Acer Predator Helios 18 AI
- 07/04/2025 v8
Christian Hintze
 Total Sustainability Score:
 Possible alternatives comparison
Image | Model / Review | Price | Weight | Height | Display |
|---|---|---|---|---|---|
1. 86.4%  | Acer Predator Helios 18 AI Intel Core Ultra 9 275HX ⎘ NVIDIA GeForce RTX 5080 Laptop ⎘ 31.6 GB Memory, SSD | Amazon: List Price: 3999 Euro | 3.5 kg | 29.55 mm | 18.00" 2560x1600 168 PPI IPS |
2. 85.1%  | MSI Raider A18 HX A9WIG-080 AMD Ryzen 9 9955HX3D ⎘ NVIDIA GeForce RTX 5080 Laptop ⎘ 64 GB Memory, 2048 GB SSD | Amazon: List Price: 4350 Euro | 3.6 kg | 34 mm | 18.00" 3840x2400 252 PPI MiniLED IPS |
3. 82.5%  | Medion Erazer Beast 18 X1 MD62731 Intel Core Ultra 9 275HX ⎘ NVIDIA GeForce RTX 5080 Laptop ⎘ 32 GB Memory, SSD | Amazon: List Price: 3700 EUR | 3.6 kg | 30.4 mm | 18.00" 2560x1600 168 PPI IPS |
4. 88%  | Asus Strix Scar 18 G835LX Intel Core Ultra 9 275HX ⎘ NVIDIA GeForce RTX 5090 Laptop ⎘ 64 GB Memory, 2048 GB SSD | Amazon: List Price: 5799€ | 3.3 kg | 32 mm | 18.00" 2560x1600 168 PPI Mini-LED |
5. 86.1%  | MSI Titan 18 HX AI A2XWJG Intel Core Ultra 9 285HX ⎘ NVIDIA GeForce RTX 5090 Laptop ⎘ 64 GB Memory, 6000 GB SSD | Amazon: List Price: 6600 USD | 3.6 kg | 32.05 mm | 18.00" 3840x2160 245 PPI Mini-LED |
6. 84.8%  | MSI Vector A18 HX A9W AMD Ryzen 9 9955HX ⎘ NVIDIA GeForce RTX 5070 Ti Laptop ⎘ 32 GB Memory | Amazon: List Price: 3200 USD | 3.5 kg | 32.05 mm | 18.00" 2560x1600 189 PPI IPS |
Transparency
The selection of devices to be reviewed is made by our editorial team. The test sample was provided to the author as a loan by the manufacturer or retailer for the purpose of this review. The lender had no influence on this review, nor did the manufacturer receive a copy of this review before publication. There was no obligation to publish this review. As an independent media company, Notebookcheck is not subjected to the authority of manufacturers, retailers or publishers.
This is how Notebookcheck is testing
Every year, Notebookcheck independently reviews hundreds of laptops and smartphones using standardized procedures to ensure that all results are comparable. We have continuously developed our test methods for around 20 years and set industry standards in the process. In our test labs, high-quality measuring equipment is utilized by experienced technicians and editors. These tests involve a multi-stage validation process. Our complex rating system is based on hundreds of well-founded measurements and benchmarks, which maintains objectivity. Further information on our test methods can be found here.

