Verdict: Ultimate performance, but zero mobility with the MSI Raider A18 HX
If you are looking for one of the most powerful laptops in existence, the MSI Raider A18 HX should certainly be high up on your list. With the AMD Ryzen 9 9955HX3D, the flagship of AMD's mobile processors in the year 2025, there are not many laptops currently on the market that will outperform this gaming giant. This also applies to the dGPU - although it "only" packs in the Nvidia GeForce RTX 5080 and not the RTX 5090, users can also expect flagship GPU performance.
What they can not expect: A good battery life, or a quiet laptop. If you seek those qualities, the MSI Raider A18 is not for you. One thing we also are disappointed with is the speaker system, which is loud, but without bass. On the plus side, the MSI laptop offers features like an SD card reader or 2.5Gbit Ethernet, which make it not only a great gaming laptop, but also potentially a strong mobile workstation.
Pros
Cons
Price and Availability
At the time of writing, the MSI Raider A18 HX costs over $6,000 in the USA - Amazon offers it.
Table of Contents
- Verdict: Ultimate performance, but zero mobility with the MSI Raider A18 HX
- Specifications: AMD Fire Range combined with RTX 5080
- Case: Huge MSI laptop with lots of gaming flare
- Connectivity: MSI packs in SD card and 2.5Gbit Ethernet
- Input Devices: MSI's RGB keyboard can glow however you want
- Display: MSI Raider A18 HX has bright, matte miniLED screen
- Performance: AMD Fire Range equals Intel Arrow Lake HX, at lower power consumption
- Emissions: Pulsing fan makes the MSI Raider A18 annoying
- Energy Management: MSI laptop burns through large battery fast
- Notebookcheck Rating
- Potential Competitors in Comparison
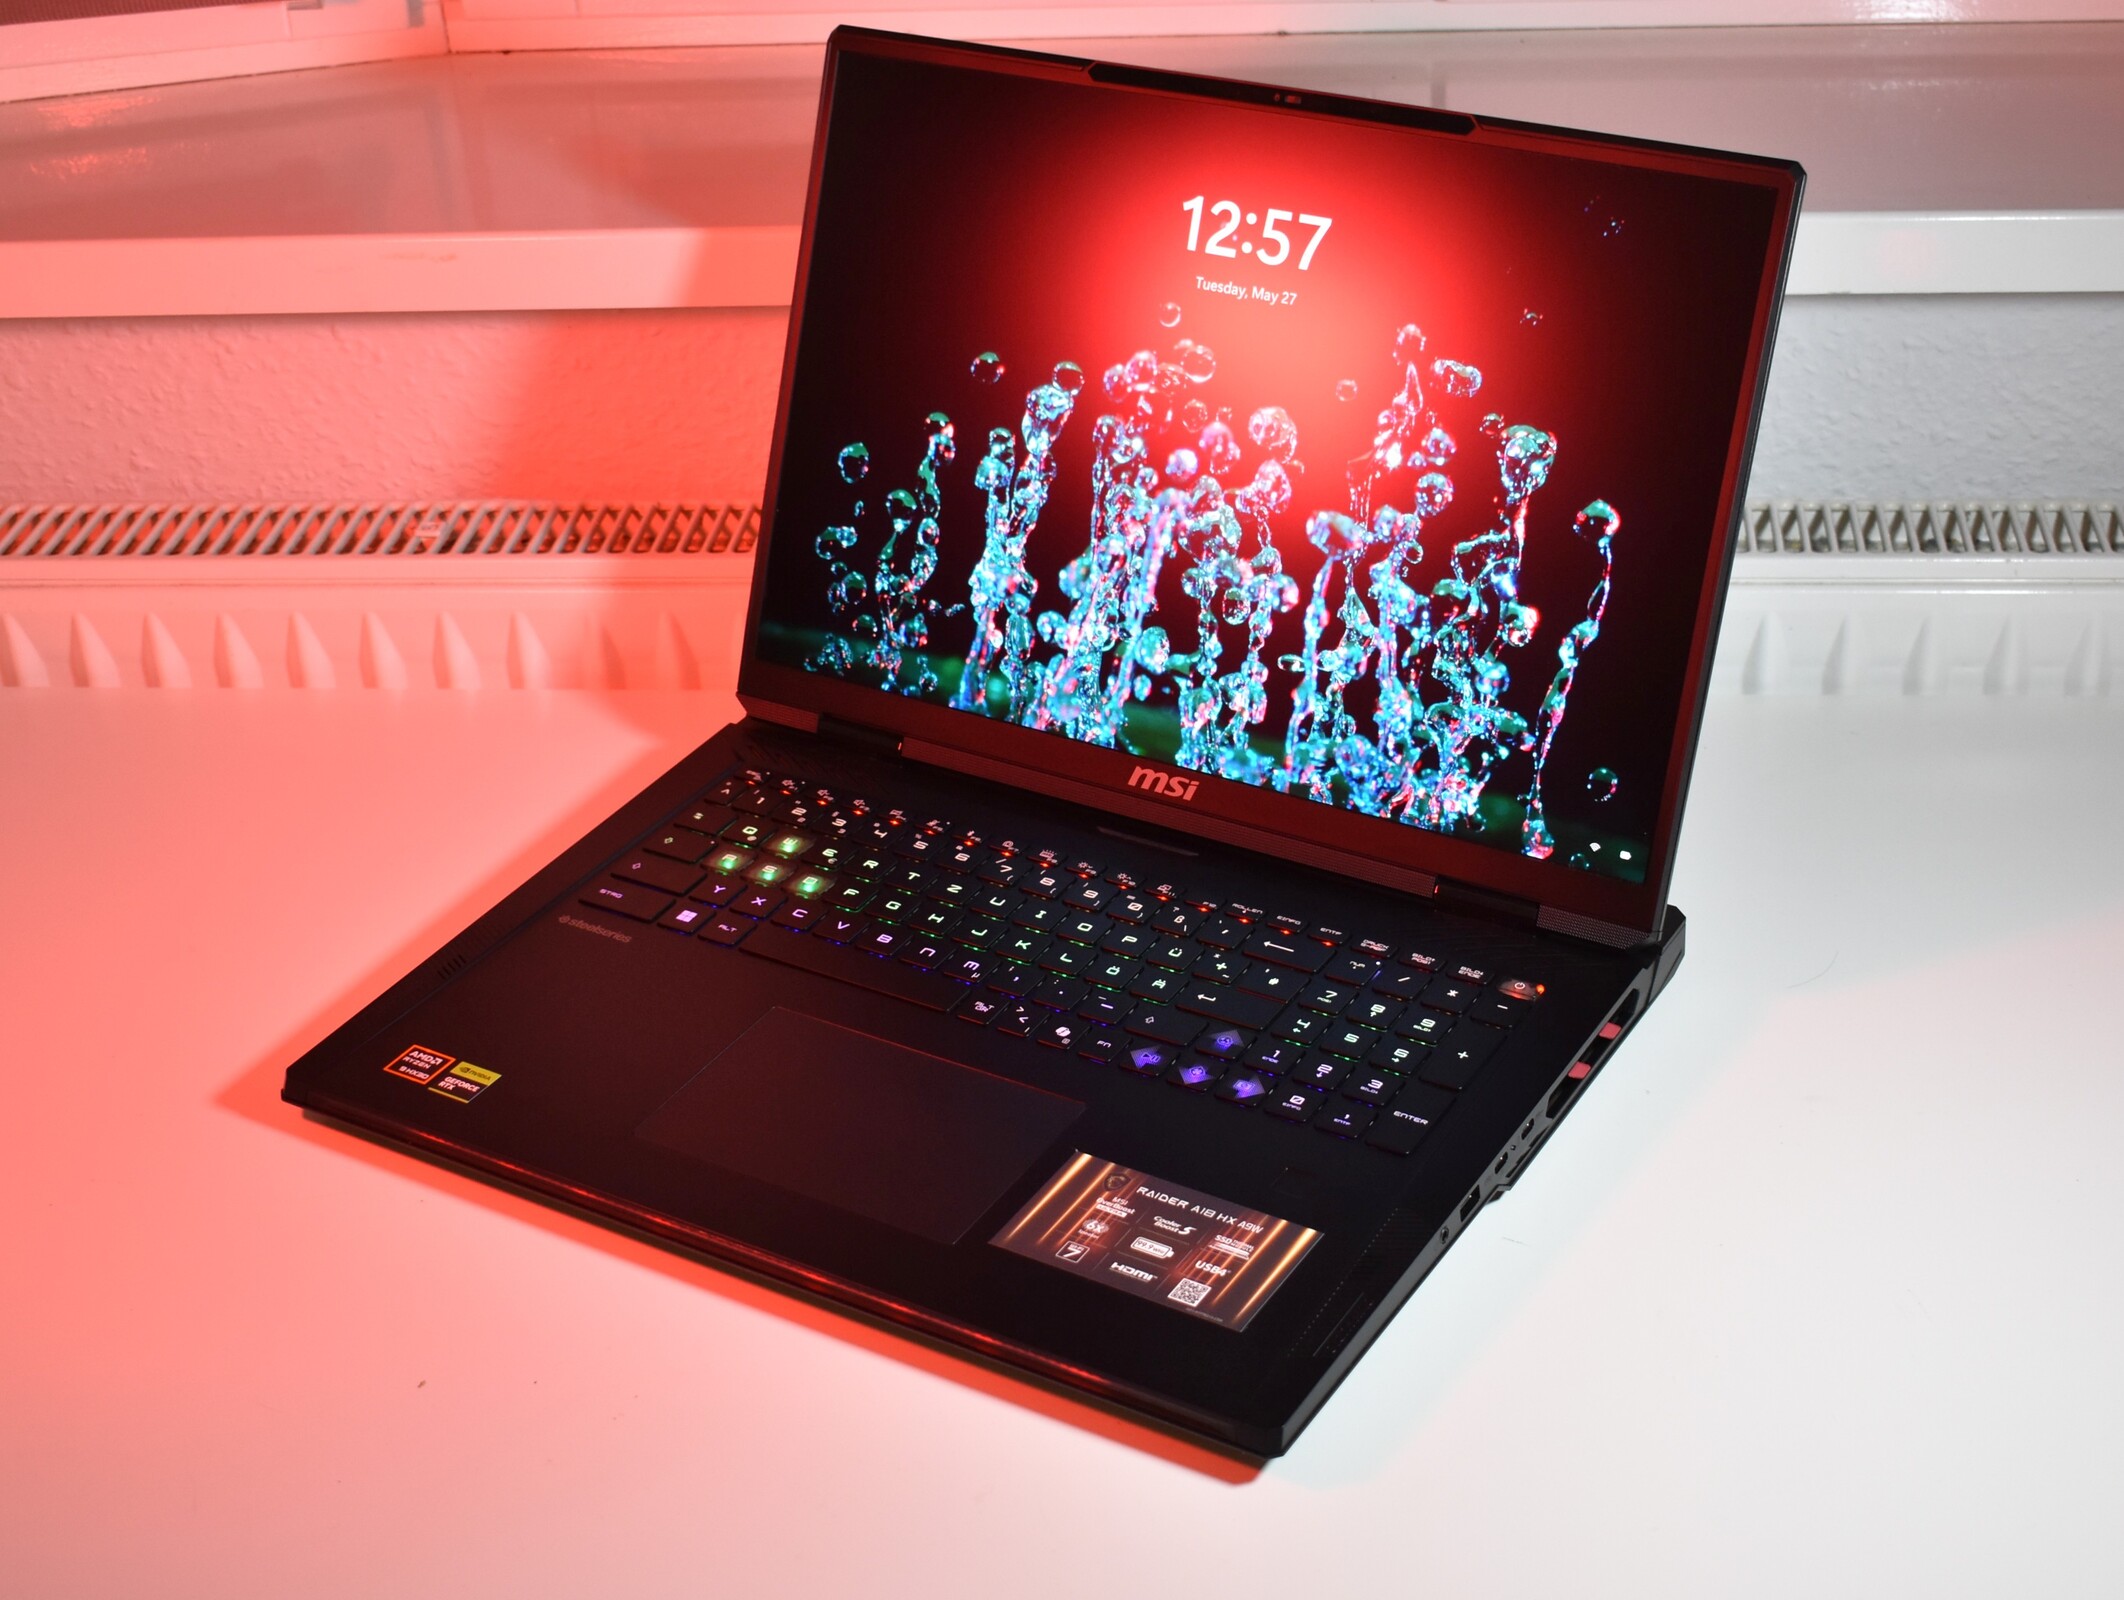
AMD's mobile offerings that get the most attention are no doubt Strix Point, and it's even more powerful, GPU focused, Strix Halo variant. But Strix Halo is not the most powerful option from AMD for laptops, that honor goes to AMD Fire Range, which are essentially AMD's desktop chips for laptops. With this review, we get to test a huge laptop with a cooling powerful enough for these behemoths of processors: The MSI Raider A18 HX A9WIG-080, which sports a large 18-inch miniLED display and the Nvidia GeForce RTX 5080, also.
Specifications: AMD Fire Range combined with RTX 5080
Case: Huge MSI laptop with lots of gaming flare
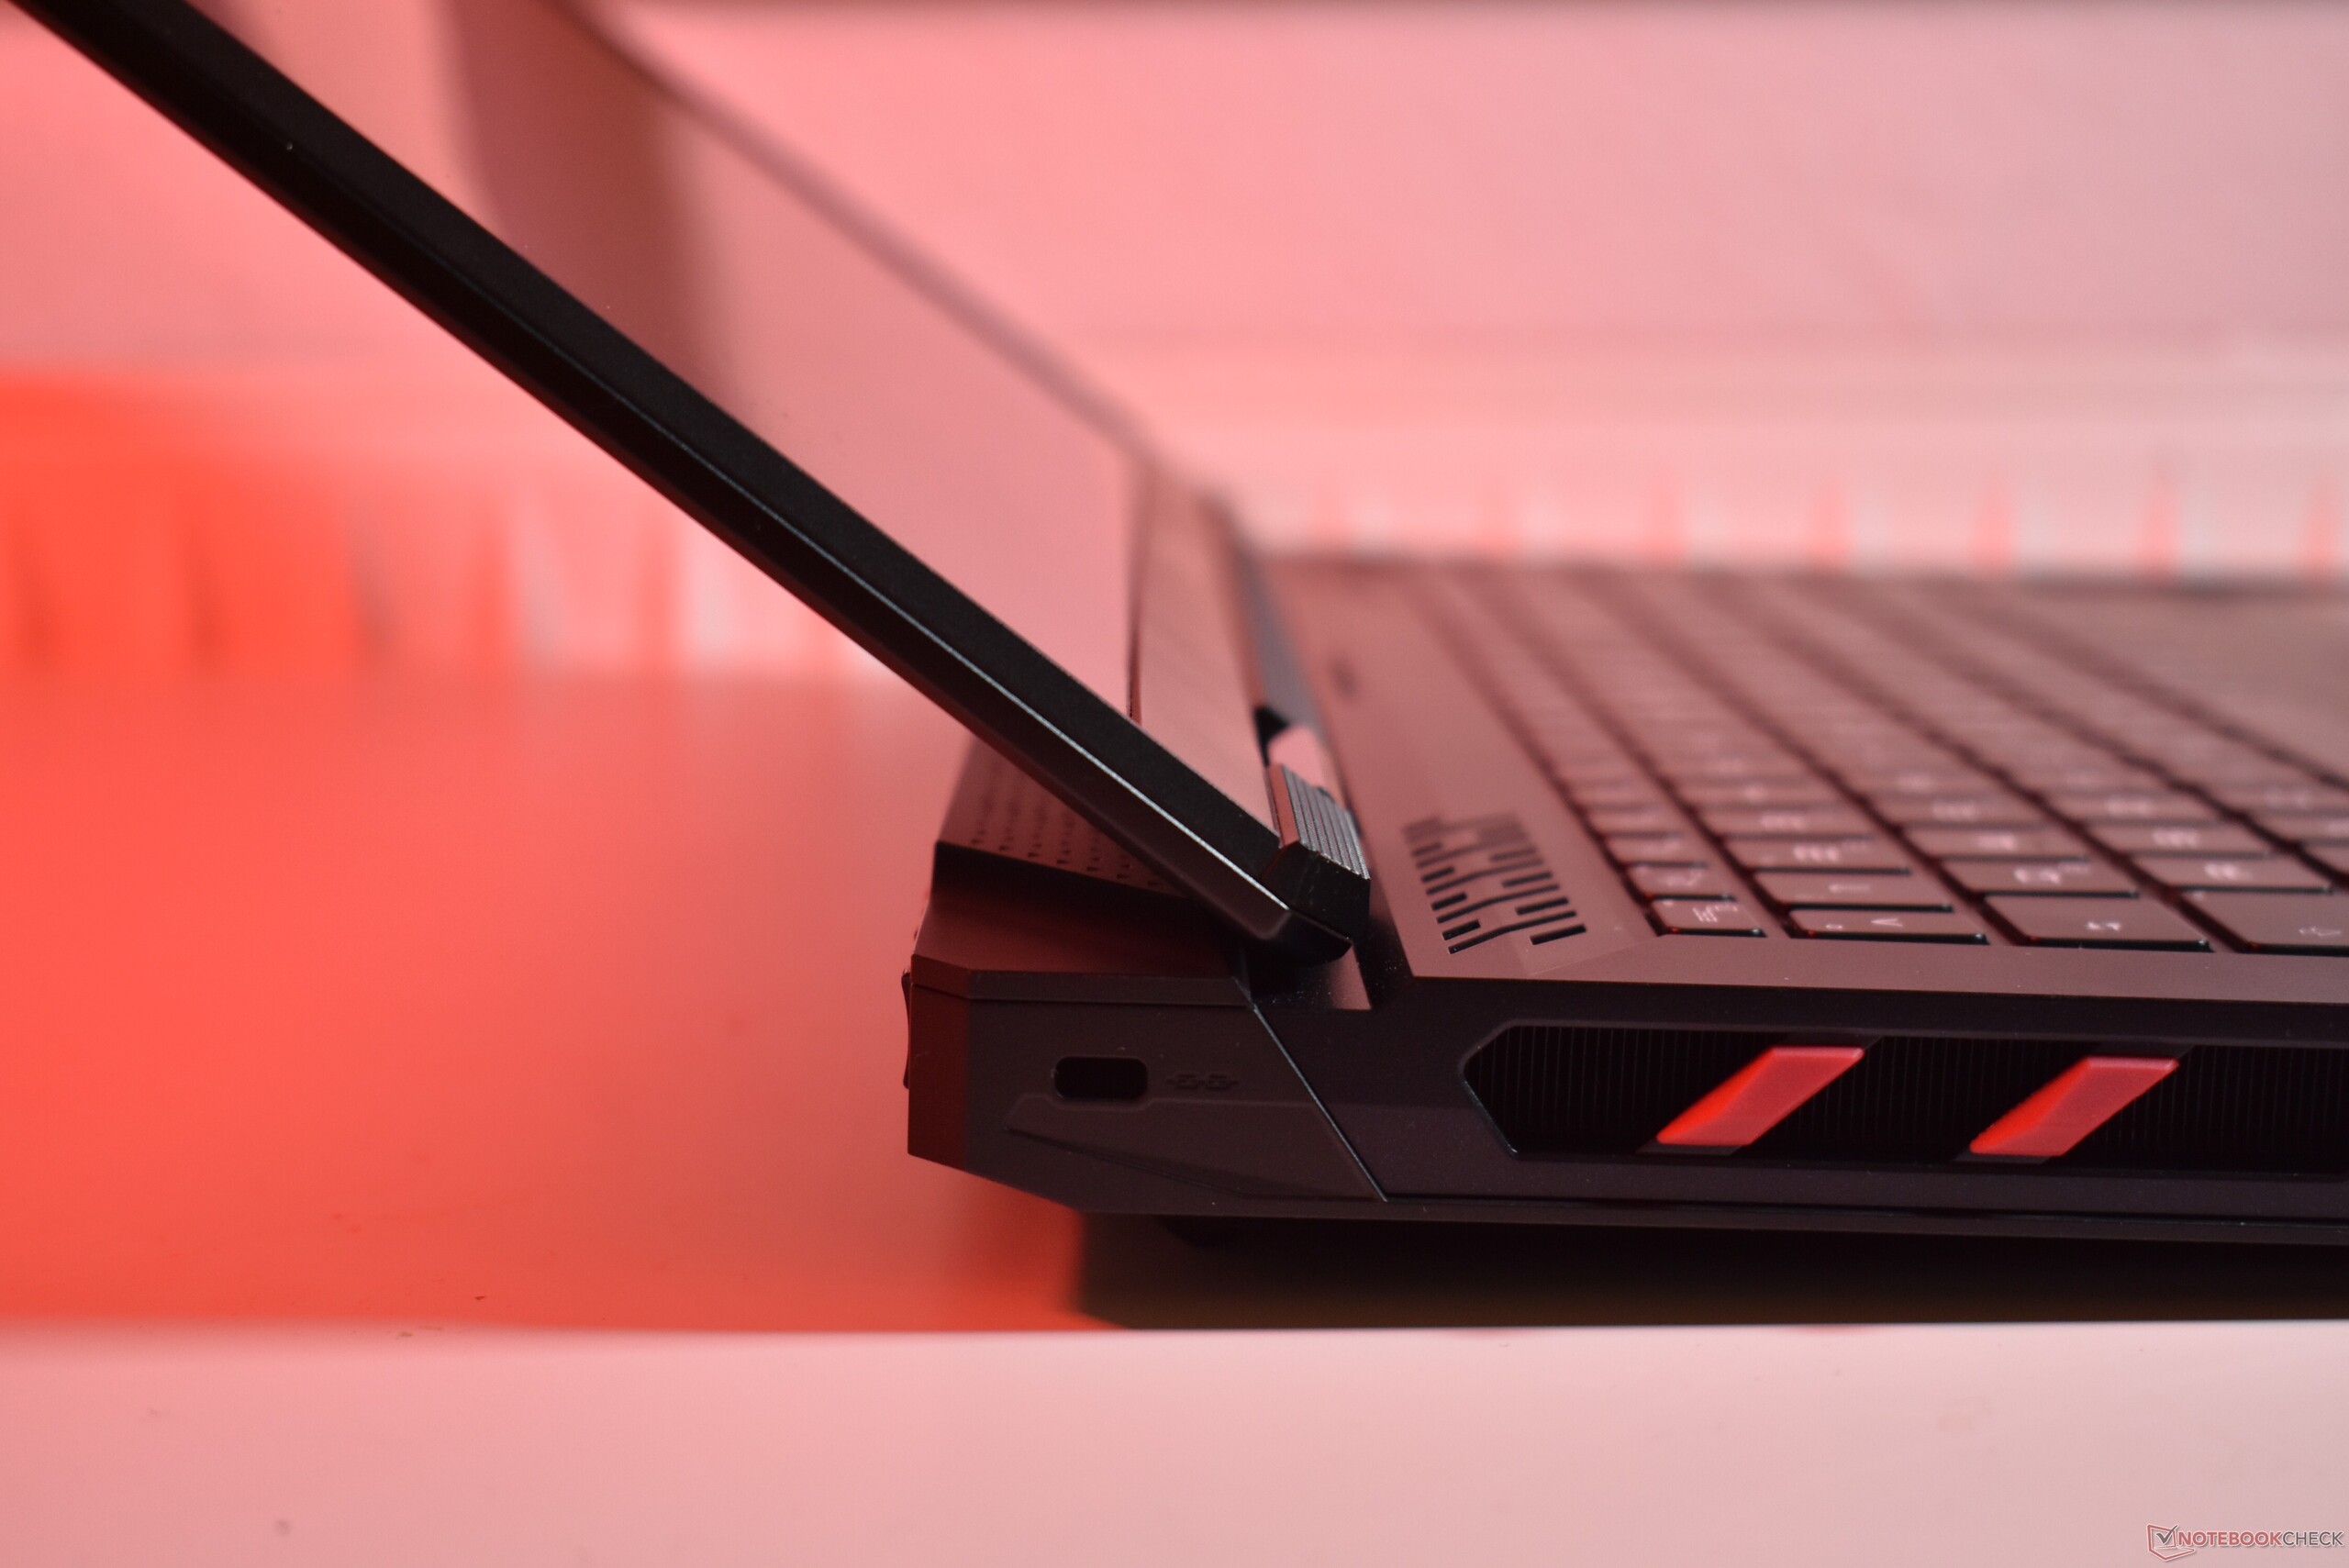
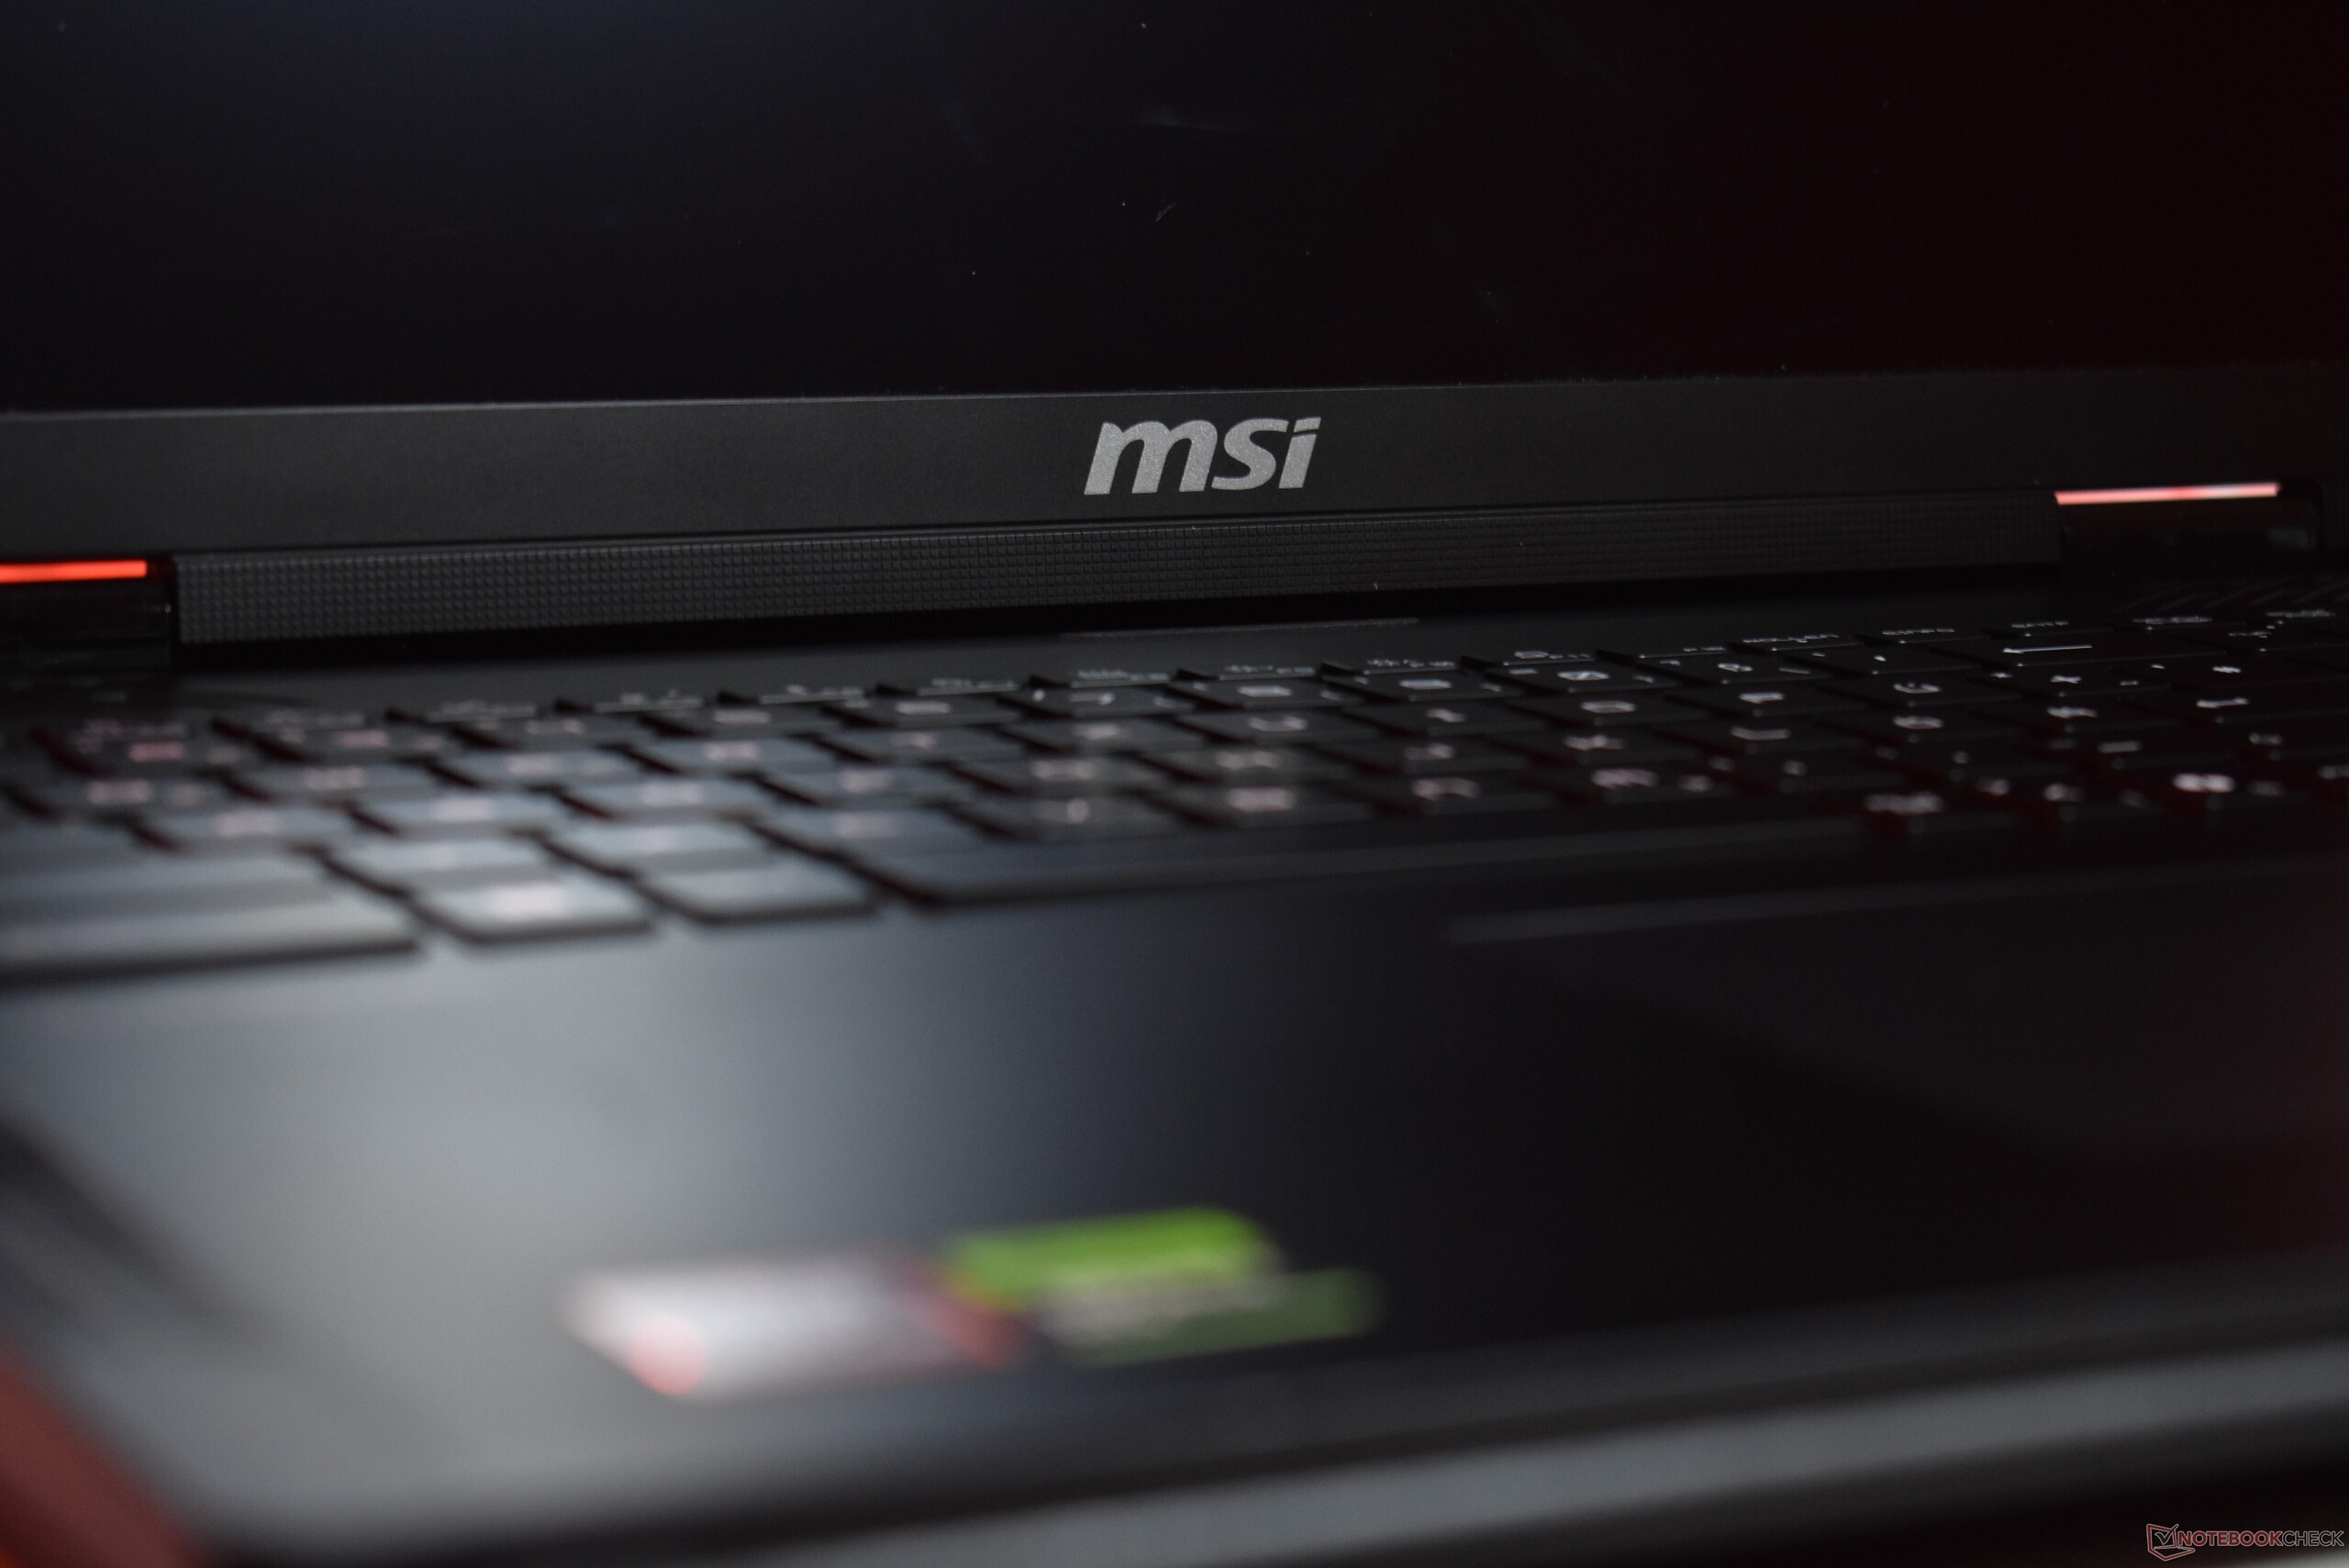
This gigantic laptop is a gaming PC, and it looks like one, too. There are plenty of red accents in the black chassis, as well as RGB lights in the logo on the lid plus in the keyboard and front edge. There are also angles and many creases on the case, furthering the "gamer appeal". MSI uses both aluminum and plastic as the materials of choice for the Raider A18. The thick base, which has a magnesium frame on the inside, has a high amount of strength, though the screen cover is not nearly as strong, exhibiting some flex.
While it is possible to open the screen with one hand, there is some light wobble in the hinge. Also, the screen only opens to 130 degrees, as the cooling block behind the screen blocks it from opening further.
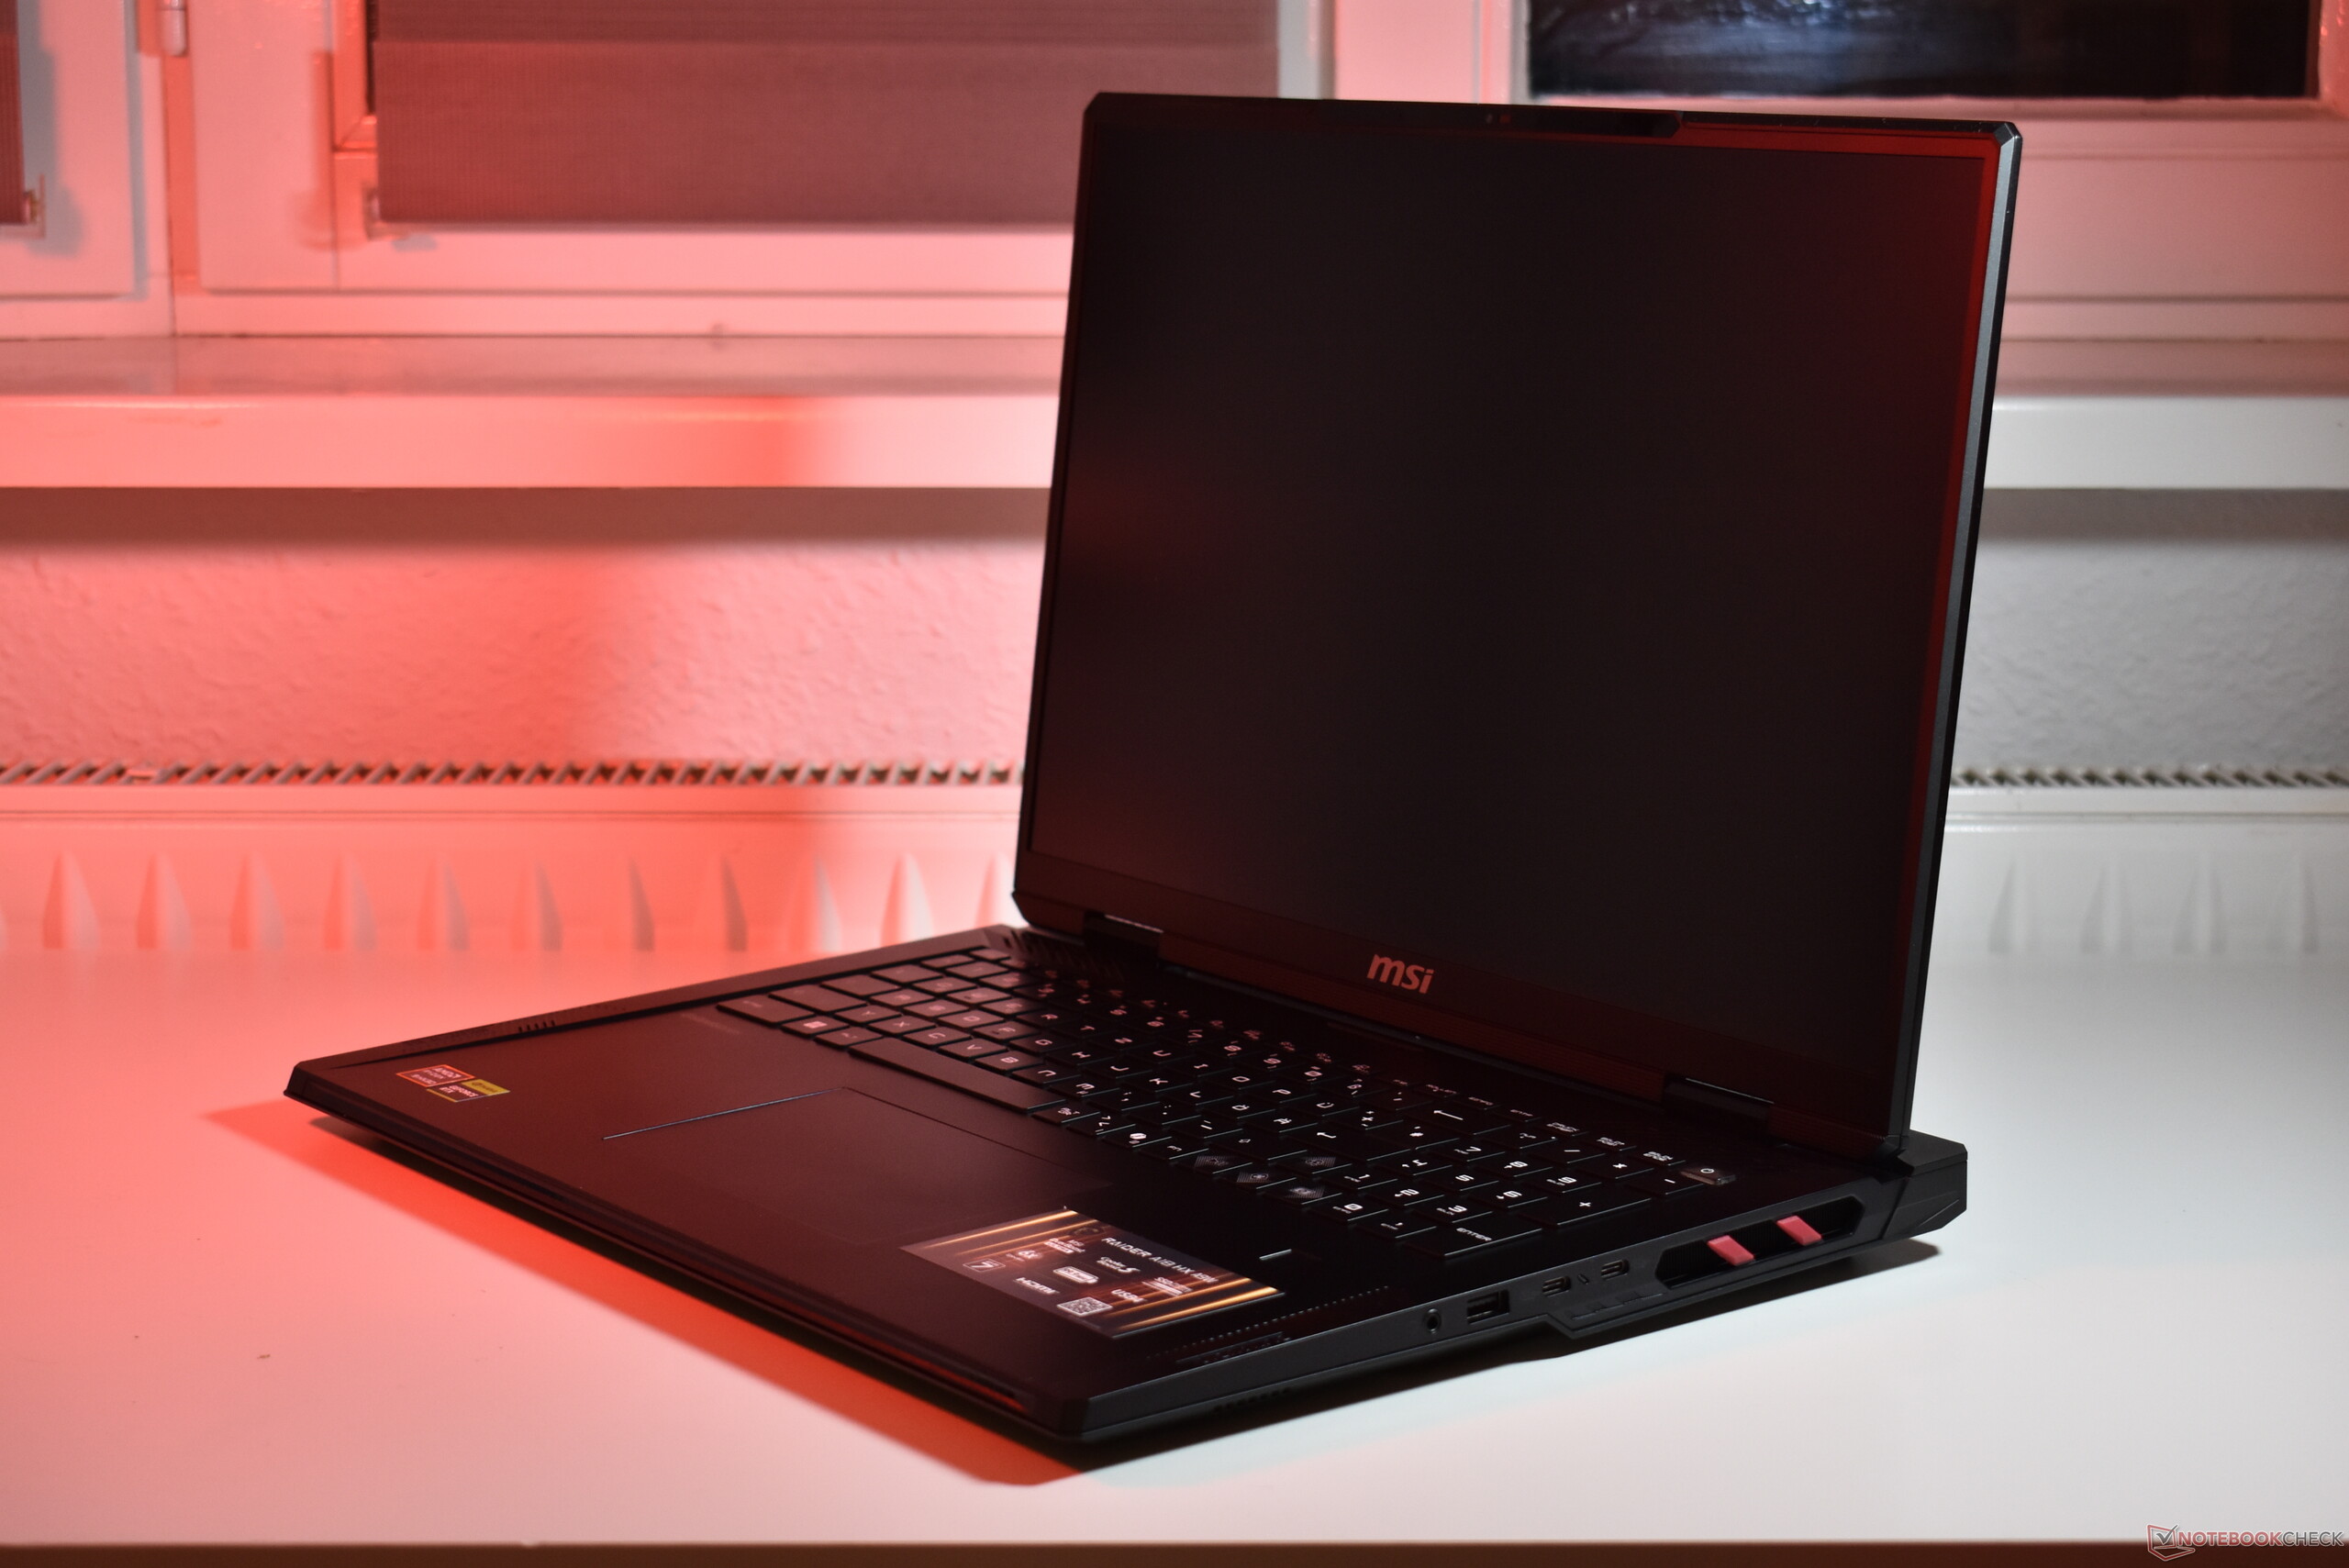

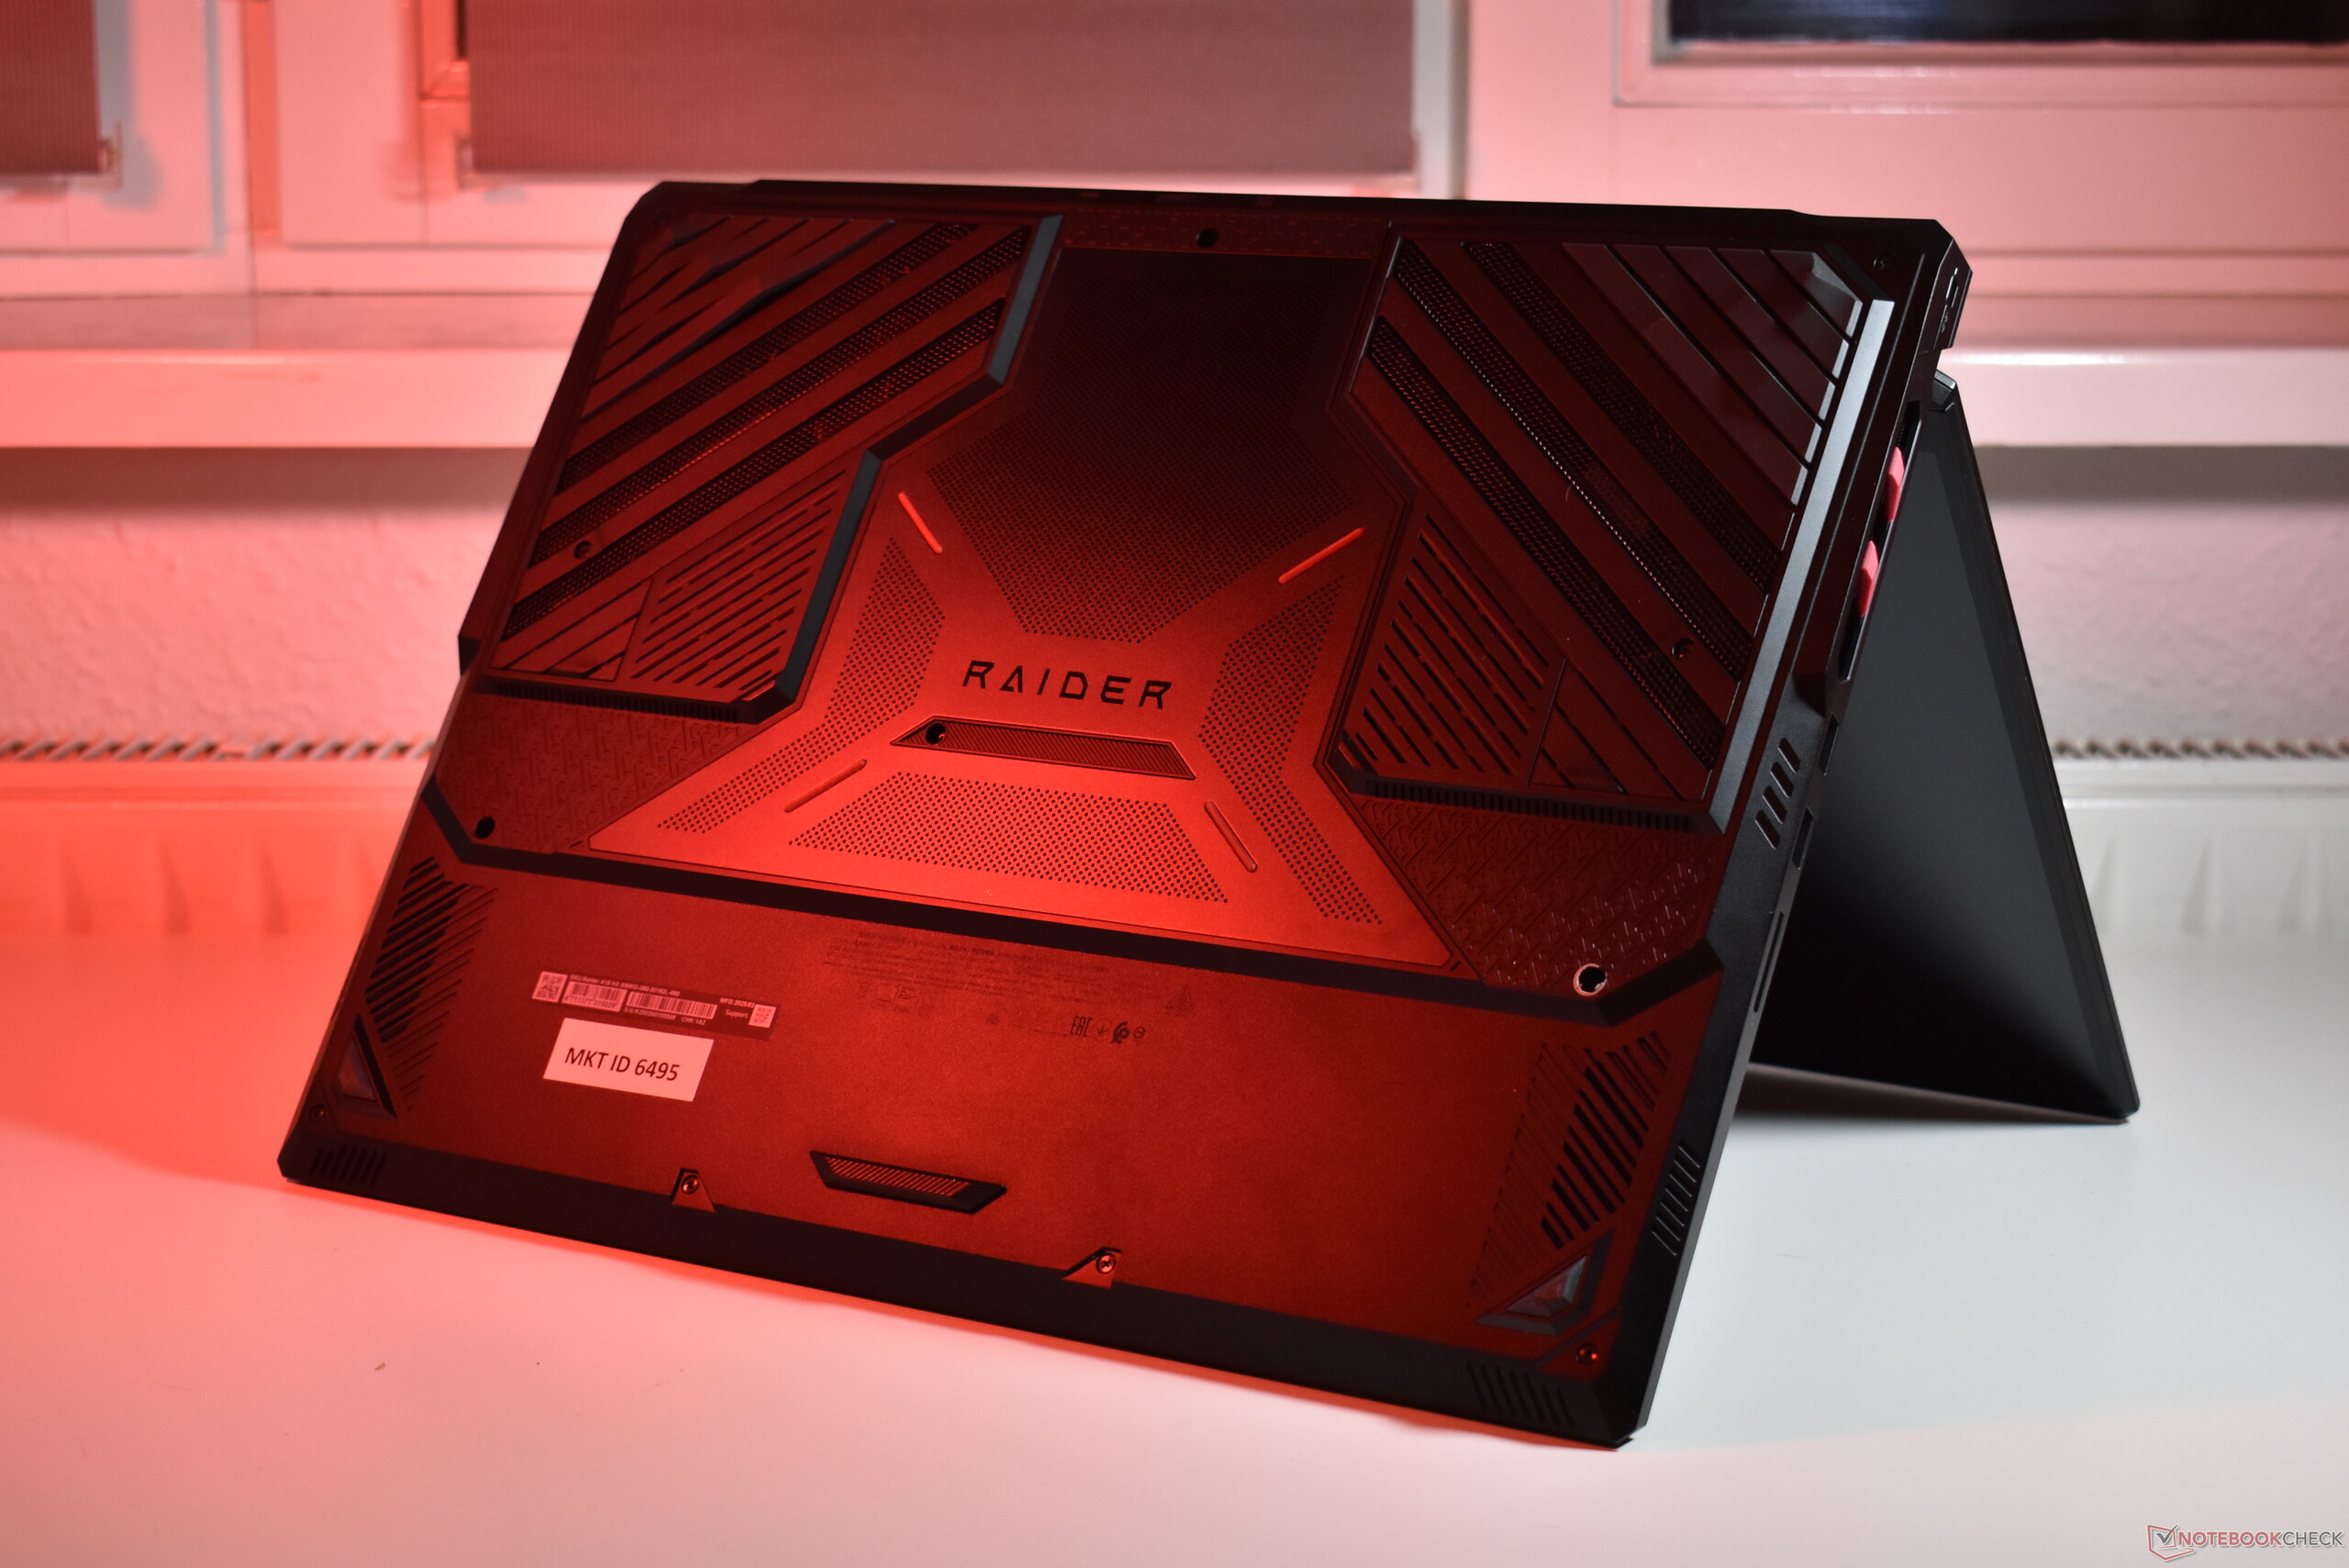
The MSI Raider A18 is the heaviest 18-inch laptop in our comparison - though none of these devices are really suited for mobile use. The 18-inch category is strictly dominated by desktop replacement models thus far that will rarely leave the home office desk.
Connectivity: MSI packs in SD card and 2.5Gbit Ethernet
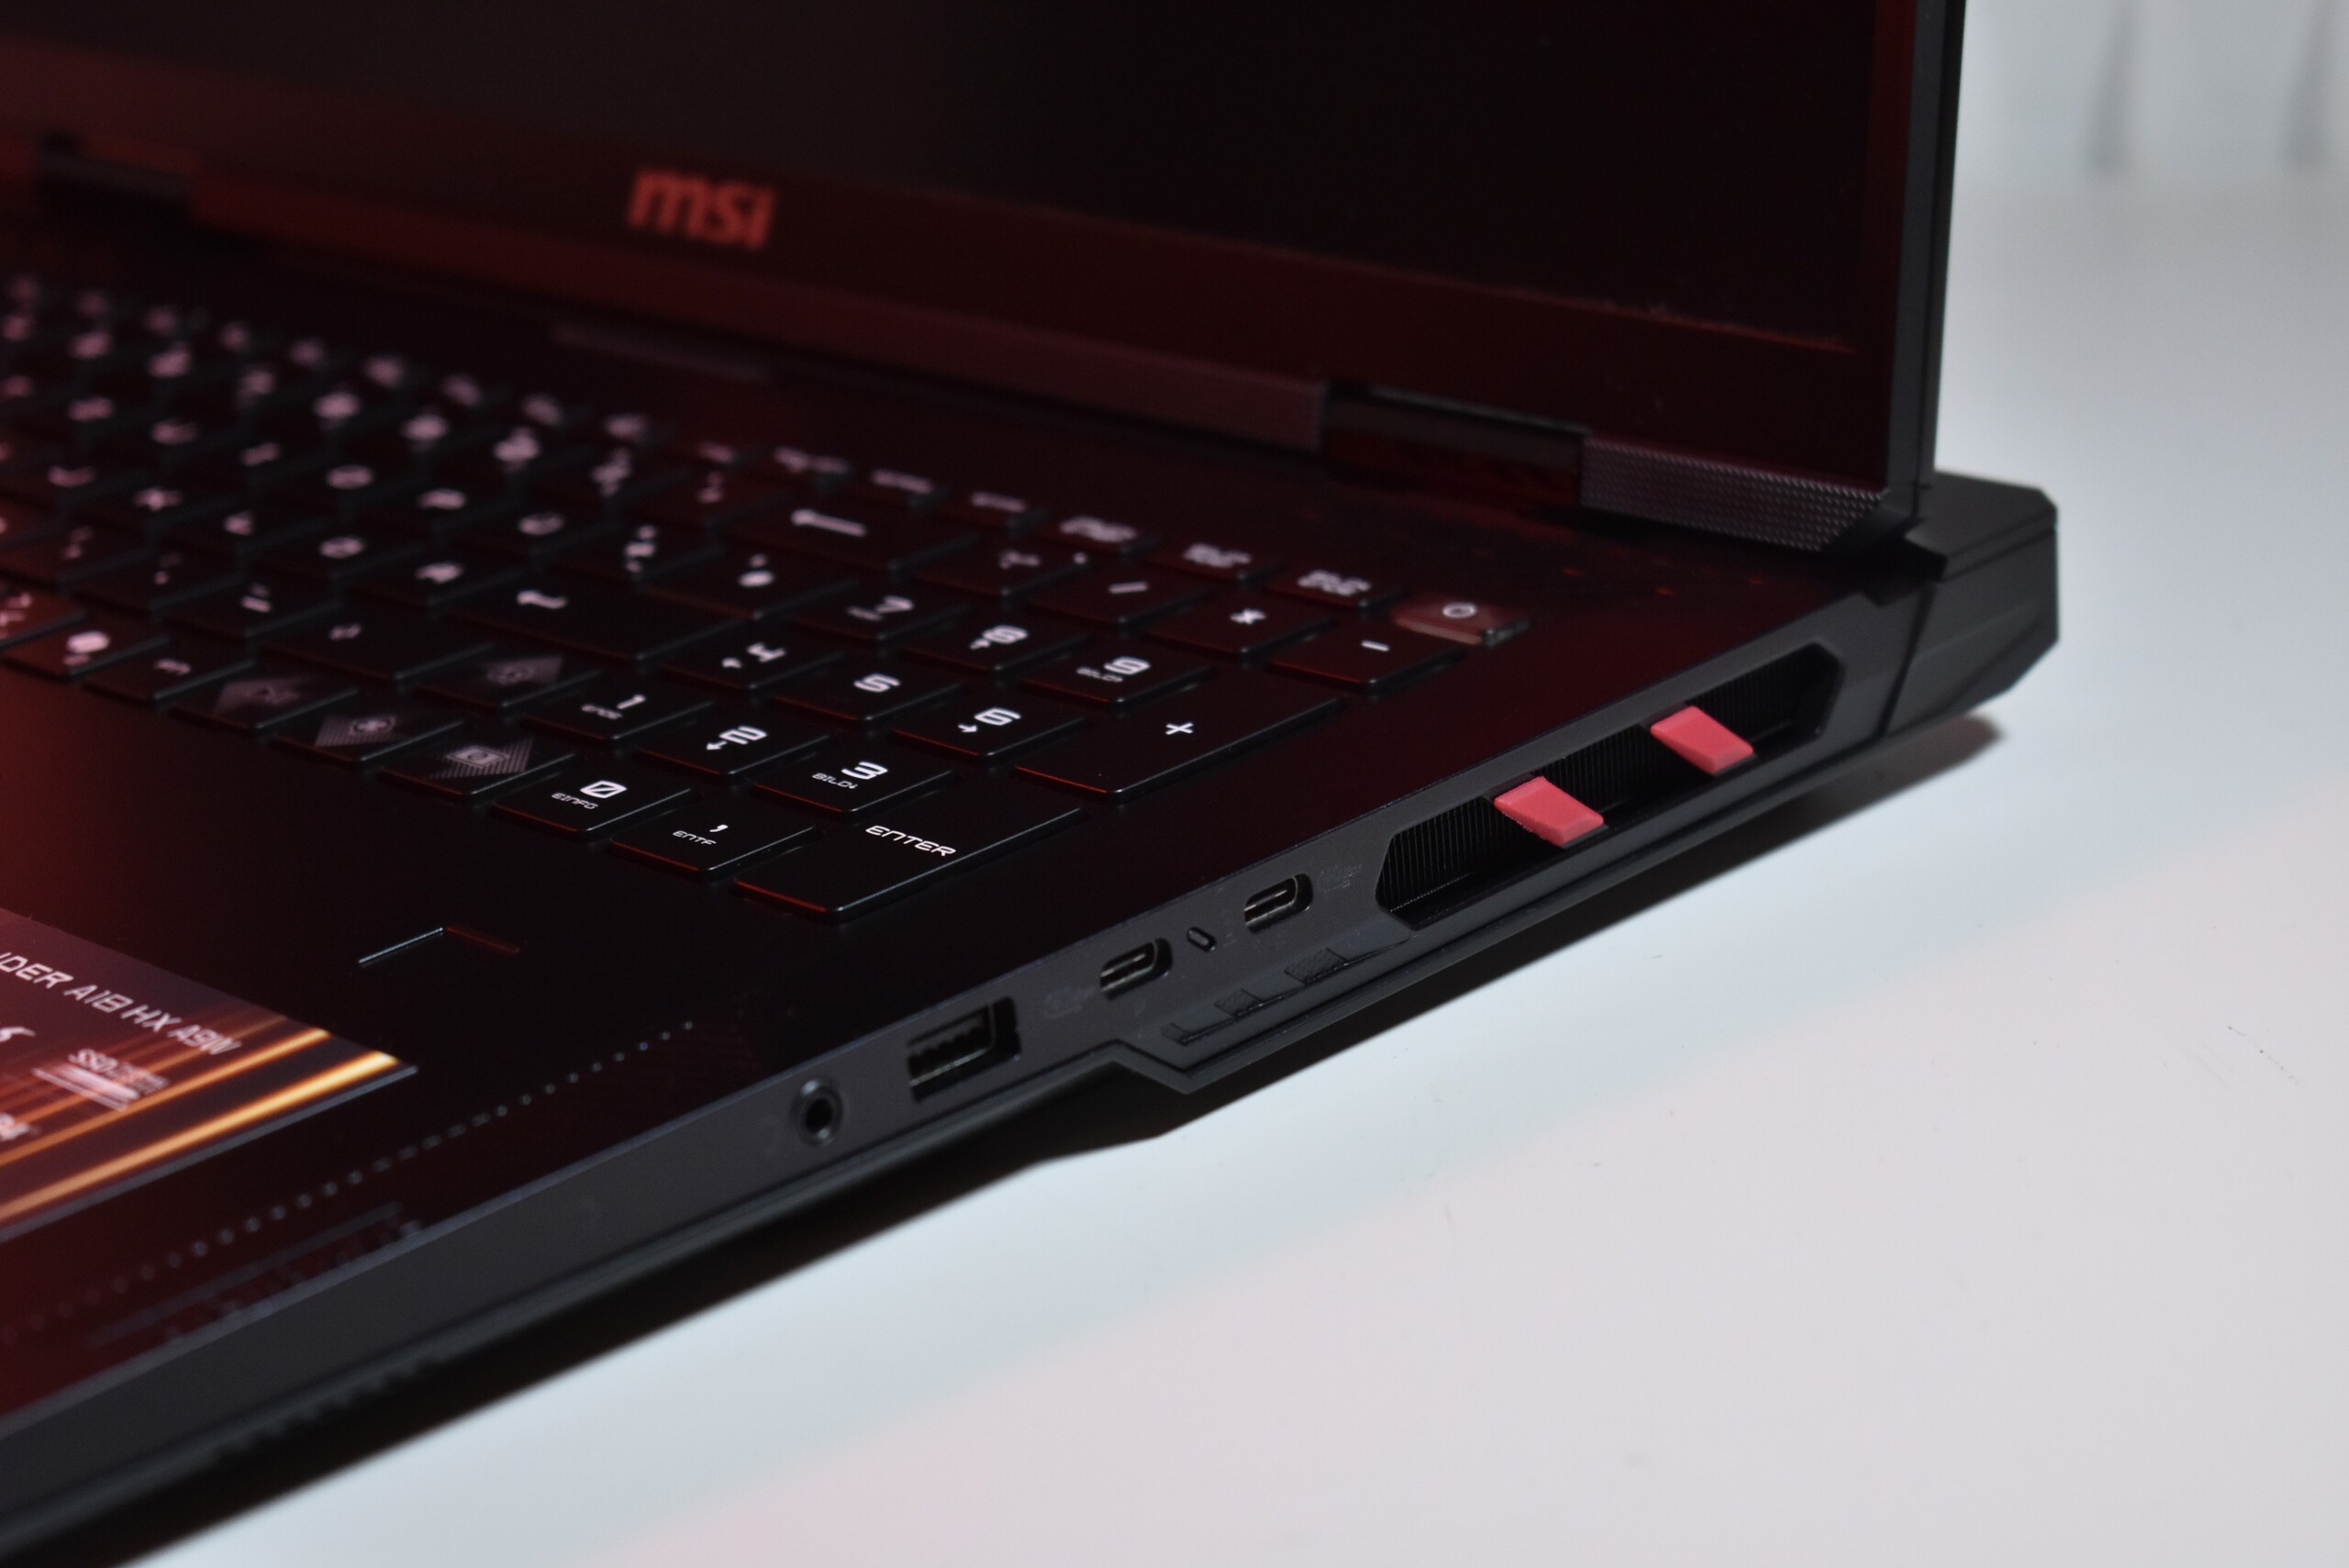
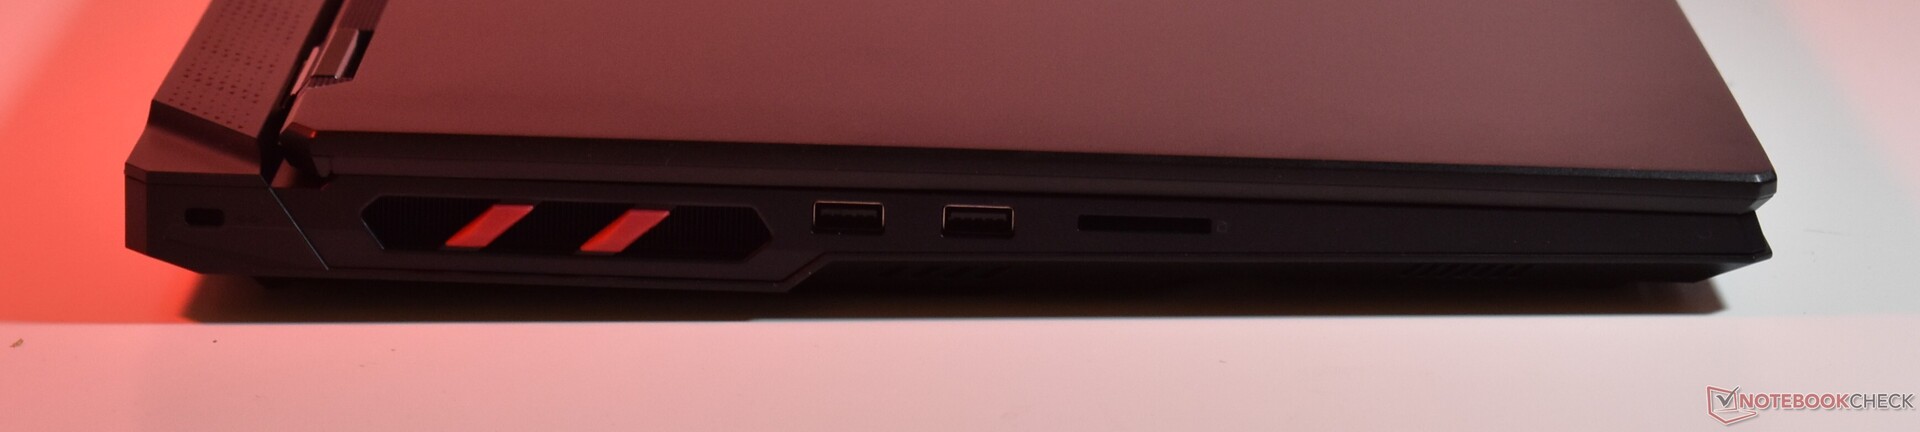
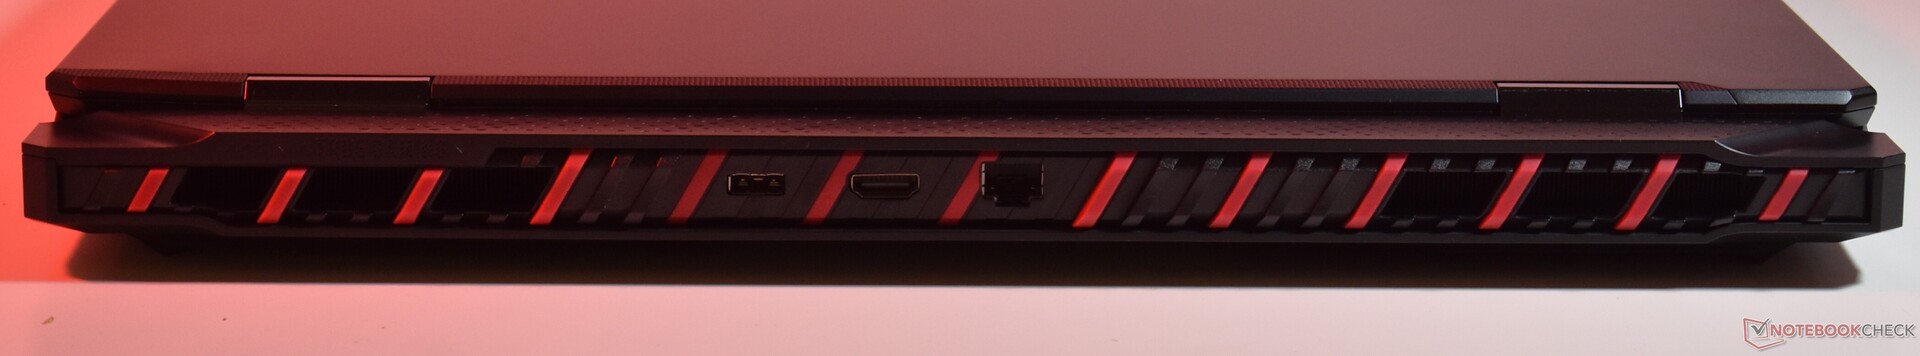
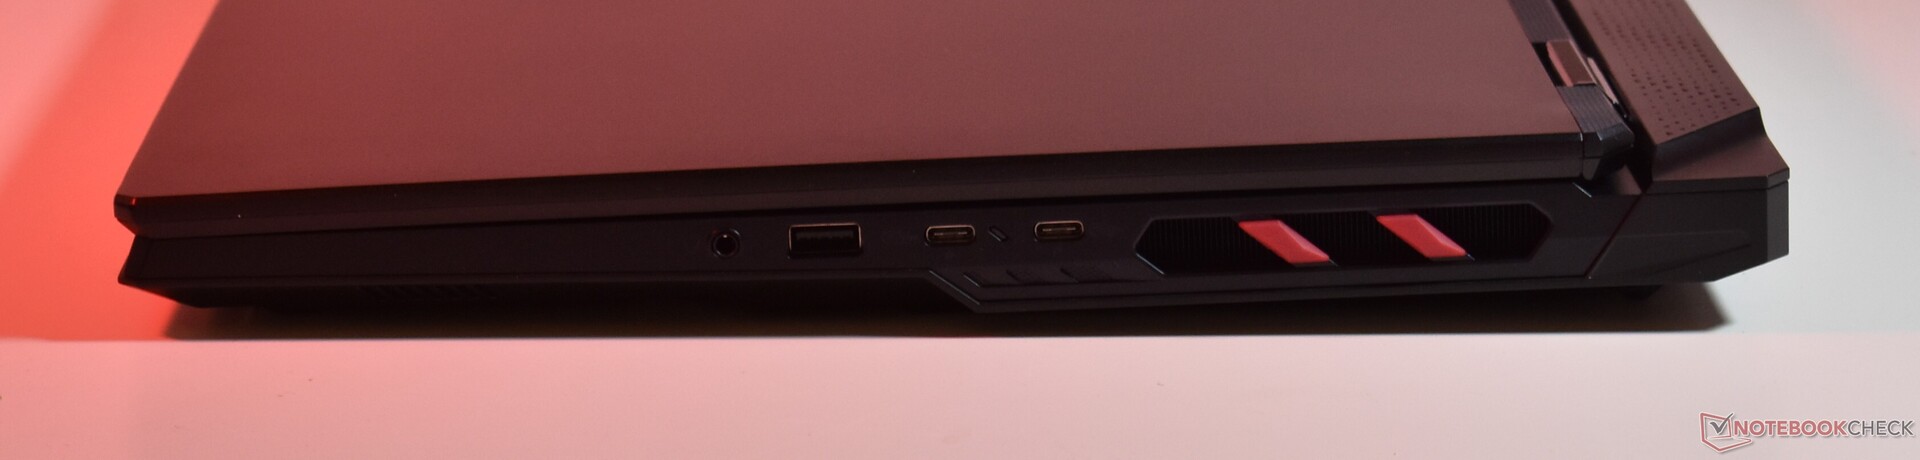
MSI includes all the ports you could want on a modern laptop - thankfully, as the thick and big chassis offers more than enough space. The ports are placed on the left and right sides, as well as the back. A bit confusing: The charging port looks like a USB A port, but it is not. Also, it would be nice if MSI could have placed one of the USB-C ports on the left side, too.
SD Card Reader
The full-size SD card reader can not house the cards fully, they stick out. We tested its speed with the AV PRO microSD 128 GB V60 reference card: The card reader is very fast when it is actually reading data, but only offers average speed when transferring data onto the card.
| SD Card Reader | |
| average JPG Copy Test (av. of 3 runs) | |
| Medion Erazer Beast 18 X1 MD62731 (AV PRO microSD 128 GB V60) | |
| Aorus Master 18 AM8H (AV PRO microSD 128 GB V60) | |
| Average of class Gaming (20.9 - 210, n=53, last 2 years) | |
| MSI Raider 18 HX A14V (Toshiba Exceria Pro SDXC 64 GB UHS-II) | |
| MSI Raider A18 HX A9WIG-080 | |
| maximum AS SSD Seq Read Test (1GB) | |
| MSI Raider A18 HX A9WIG-080 | |
| Aorus Master 18 AM8H (AV PRO microSD 128 GB V60) | |
| Medion Erazer Beast 18 X1 MD62731 (AV PRO microSD 128 GB V60) | |
| Average of class Gaming (25.5 - 261, n=50, last 2 years) | |
| MSI Raider 18 HX A14V (Toshiba Exceria Pro SDXC 64 GB UHS-II) | |
Communication
This MSI Raider A18 supports the Wi-Fi 7 standard with the MediaTek Wi-Fi 7 MT7925. Transfer rates are very good, the laptop should not have any trouble during intense gaming sessions. Alternatively, for an even more stable connection, there is a 2.5GBit Ethernet connector on the back.
Webcam
MSI uses a simple 1080p webcam, which has an IR camera and a privacy shutter. The webcam is just good enough for video calling, but the image quality is not great.


Accessories
Besides the humongous 400 W charger with a proprietary plug, there are no other accessories included in the box.
Maintenance
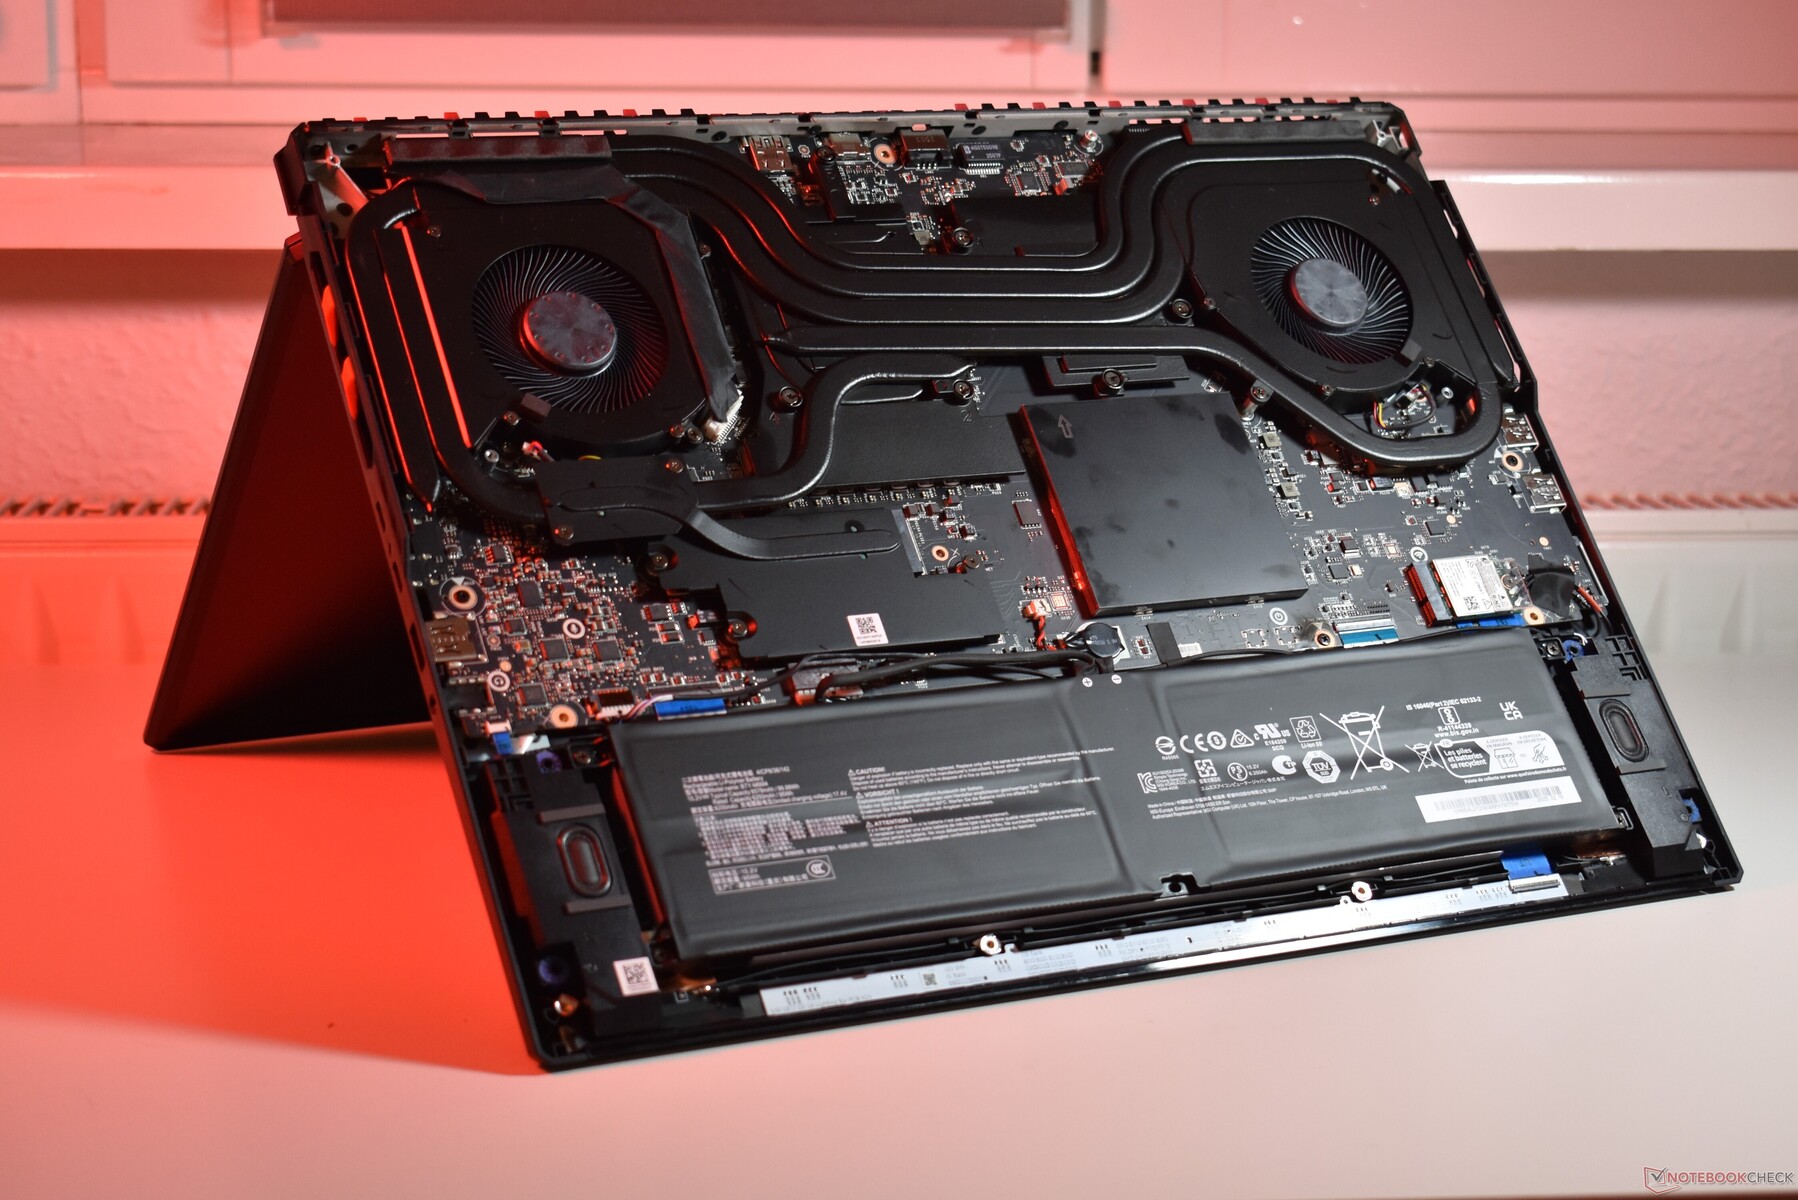
In total, there are twelve Philips head screws that secure the bottom cover of the MSI Raider A18 laptop. Additionally, MSI places some clips around the edges of the base that hold down the cover that need to be opened with a plastic pry tool.
Once the cover is removed, access to the internals is granted. Memory, storage and Wi-Fi are all modular, with the SSD hidden below a thermal unit connected to the cooling system. Additionally, the cooling system can be cleaned, and the battery replaced, if necessary.
Sustainability
There is not a lot of information on MSI's sustainability efforts with the MSI Raider A18 HX. The laptop is EPEAT Silver certified, but that is all the information we get.
Warranty
As many other consumer laptops in the EU market, the MSI Raider A18 HX has a 24-month warranty. The device has to be sent in, and the warranty only applies in Germany.
Input Devices: MSI's RGB keyboard can glow however you want
Keyboard
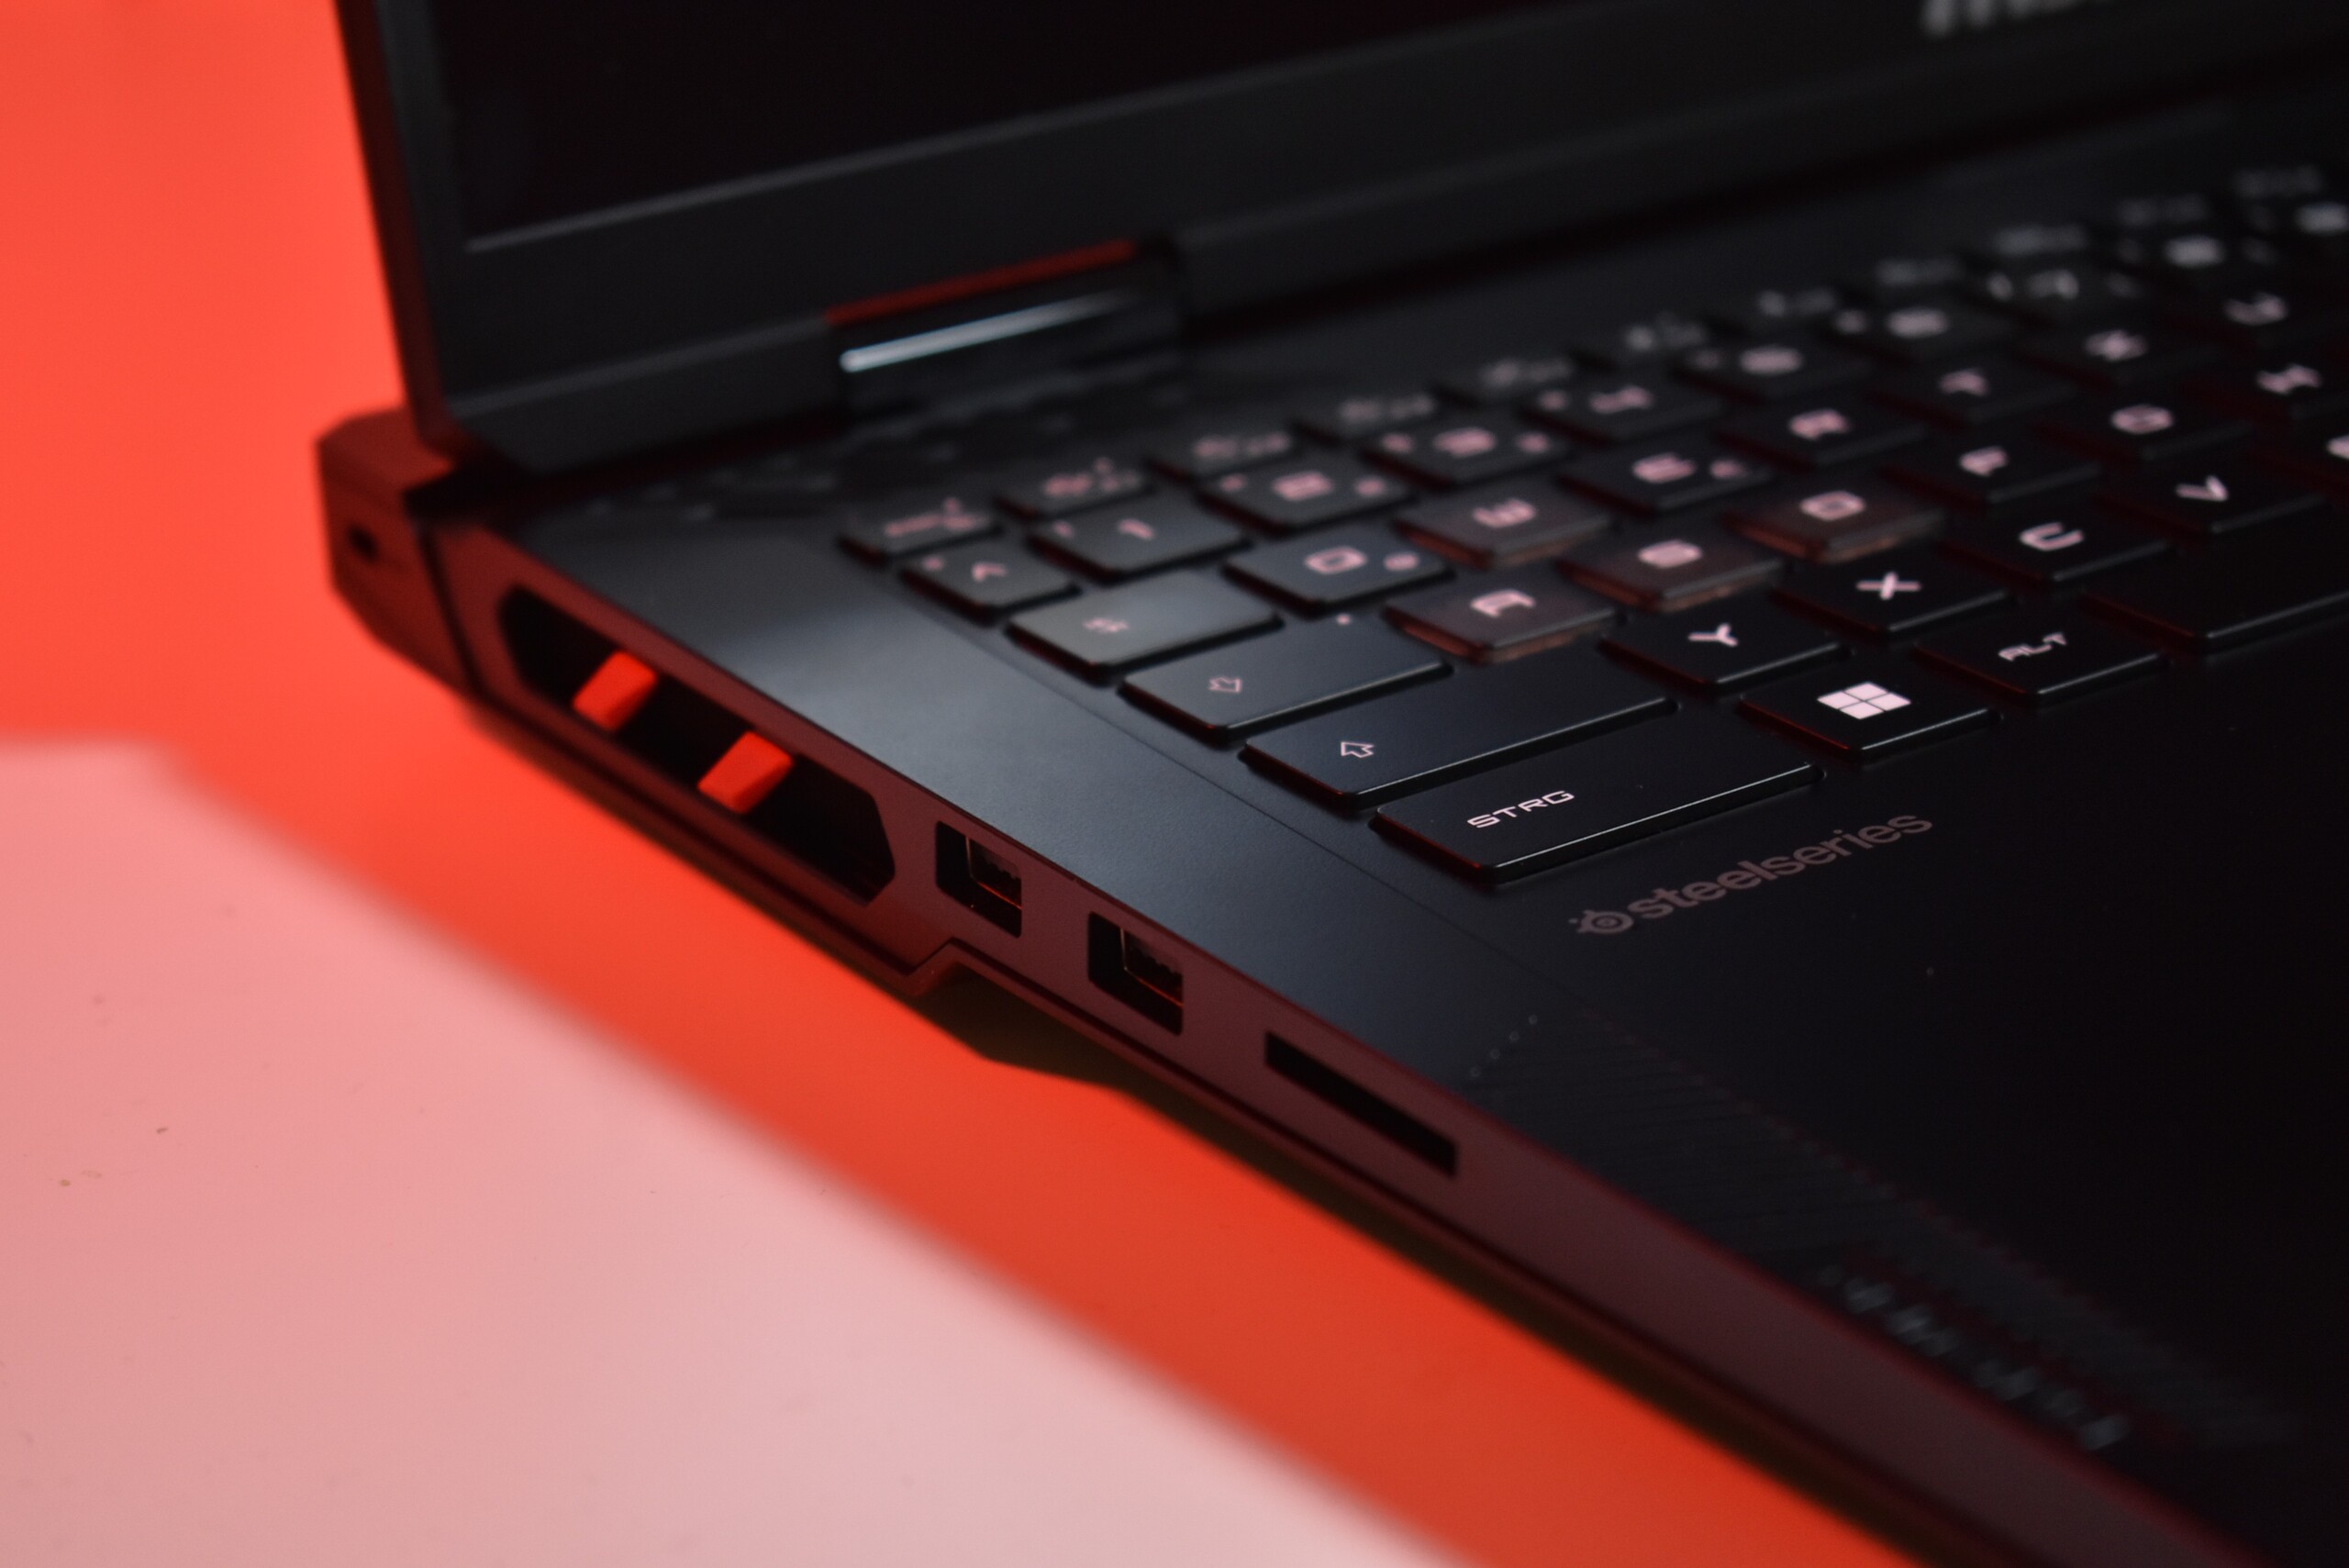
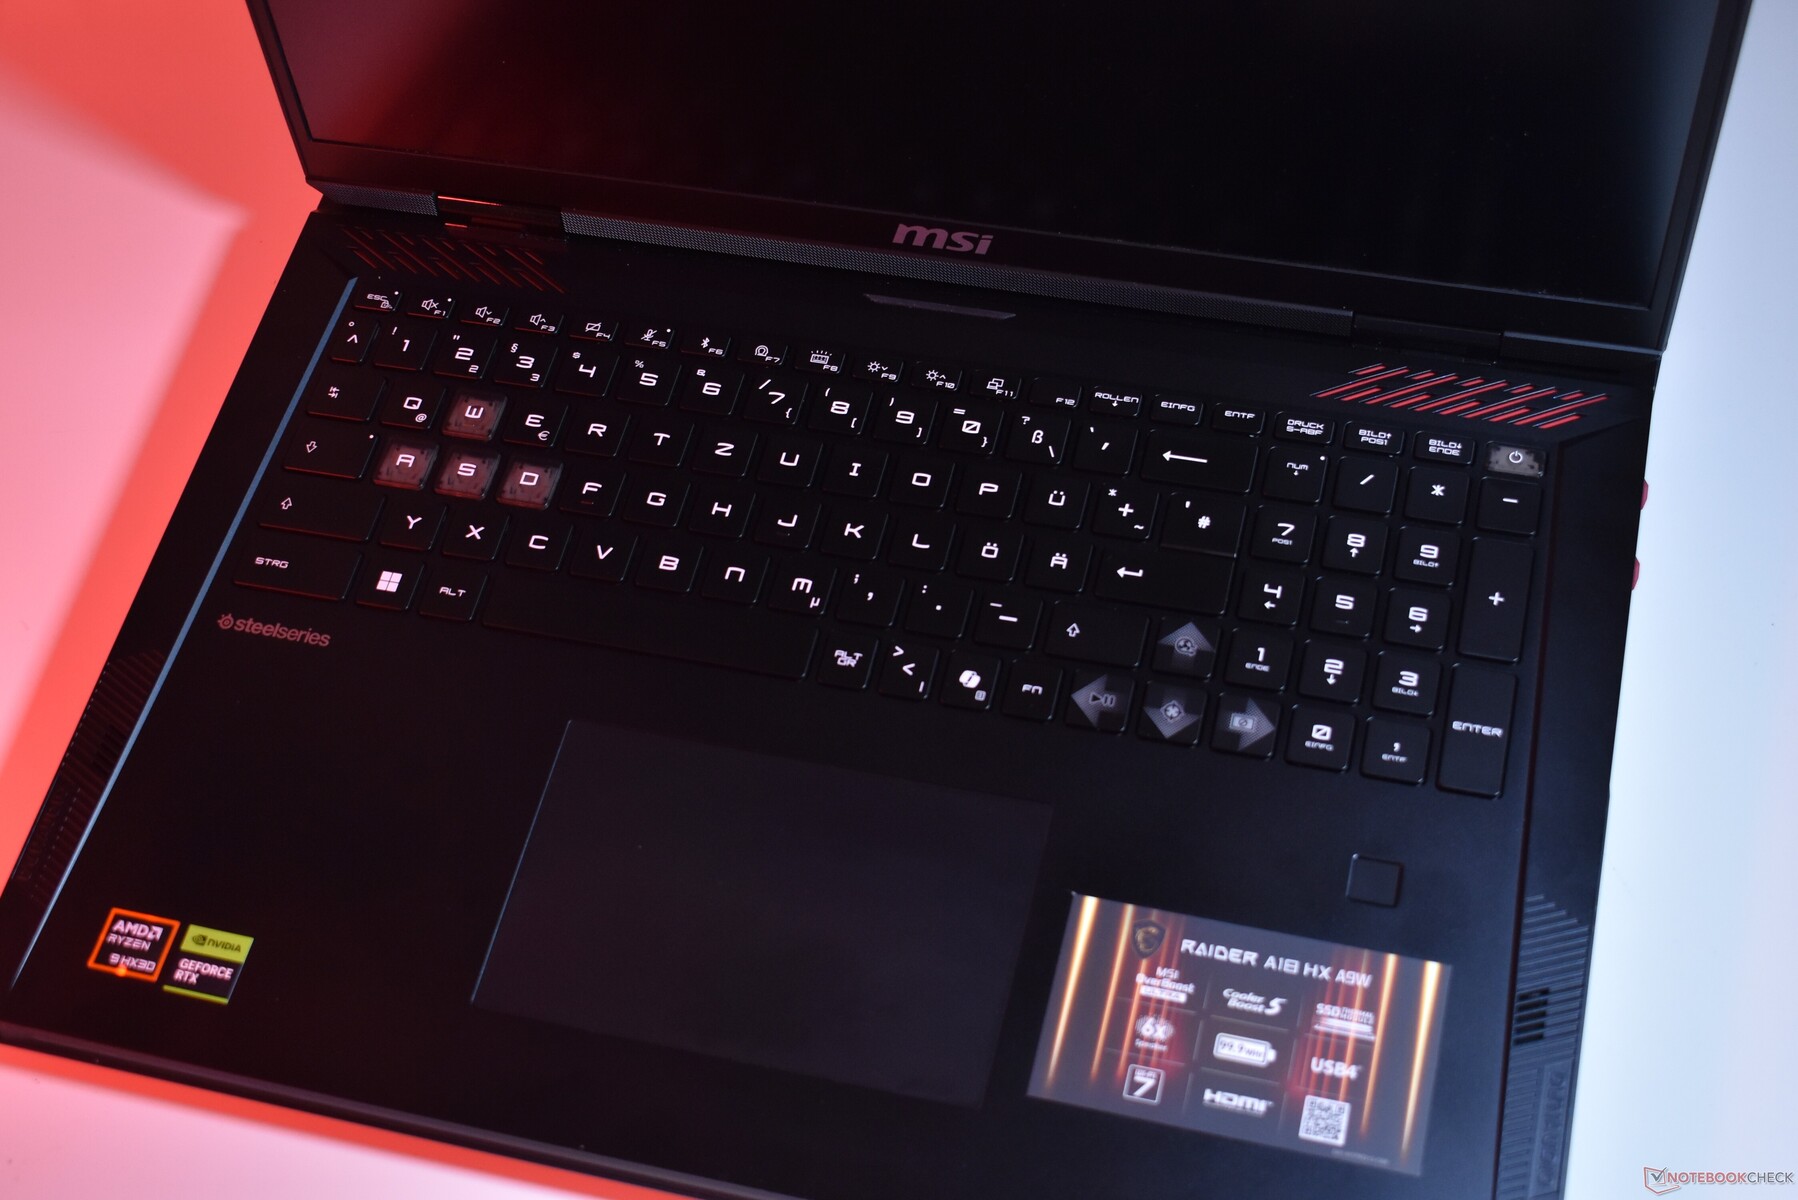
The keyboard is a key part of the MSI Raider A18 HX. MSI uses a Steelseries keyboard, which offers a very nice typing experience. It is a full-size keyboard with a numpad with a long key-travel and a soft, pillowy feel. There is an RGB backlight that is offers key-by-key customizability and a range of different effect.
There are weaknesses: The area around the R-key has some flex under heavy typing. Also, the layout is not that great, with oddities like the weird position for the FN key and the small Enter key on a European unit.
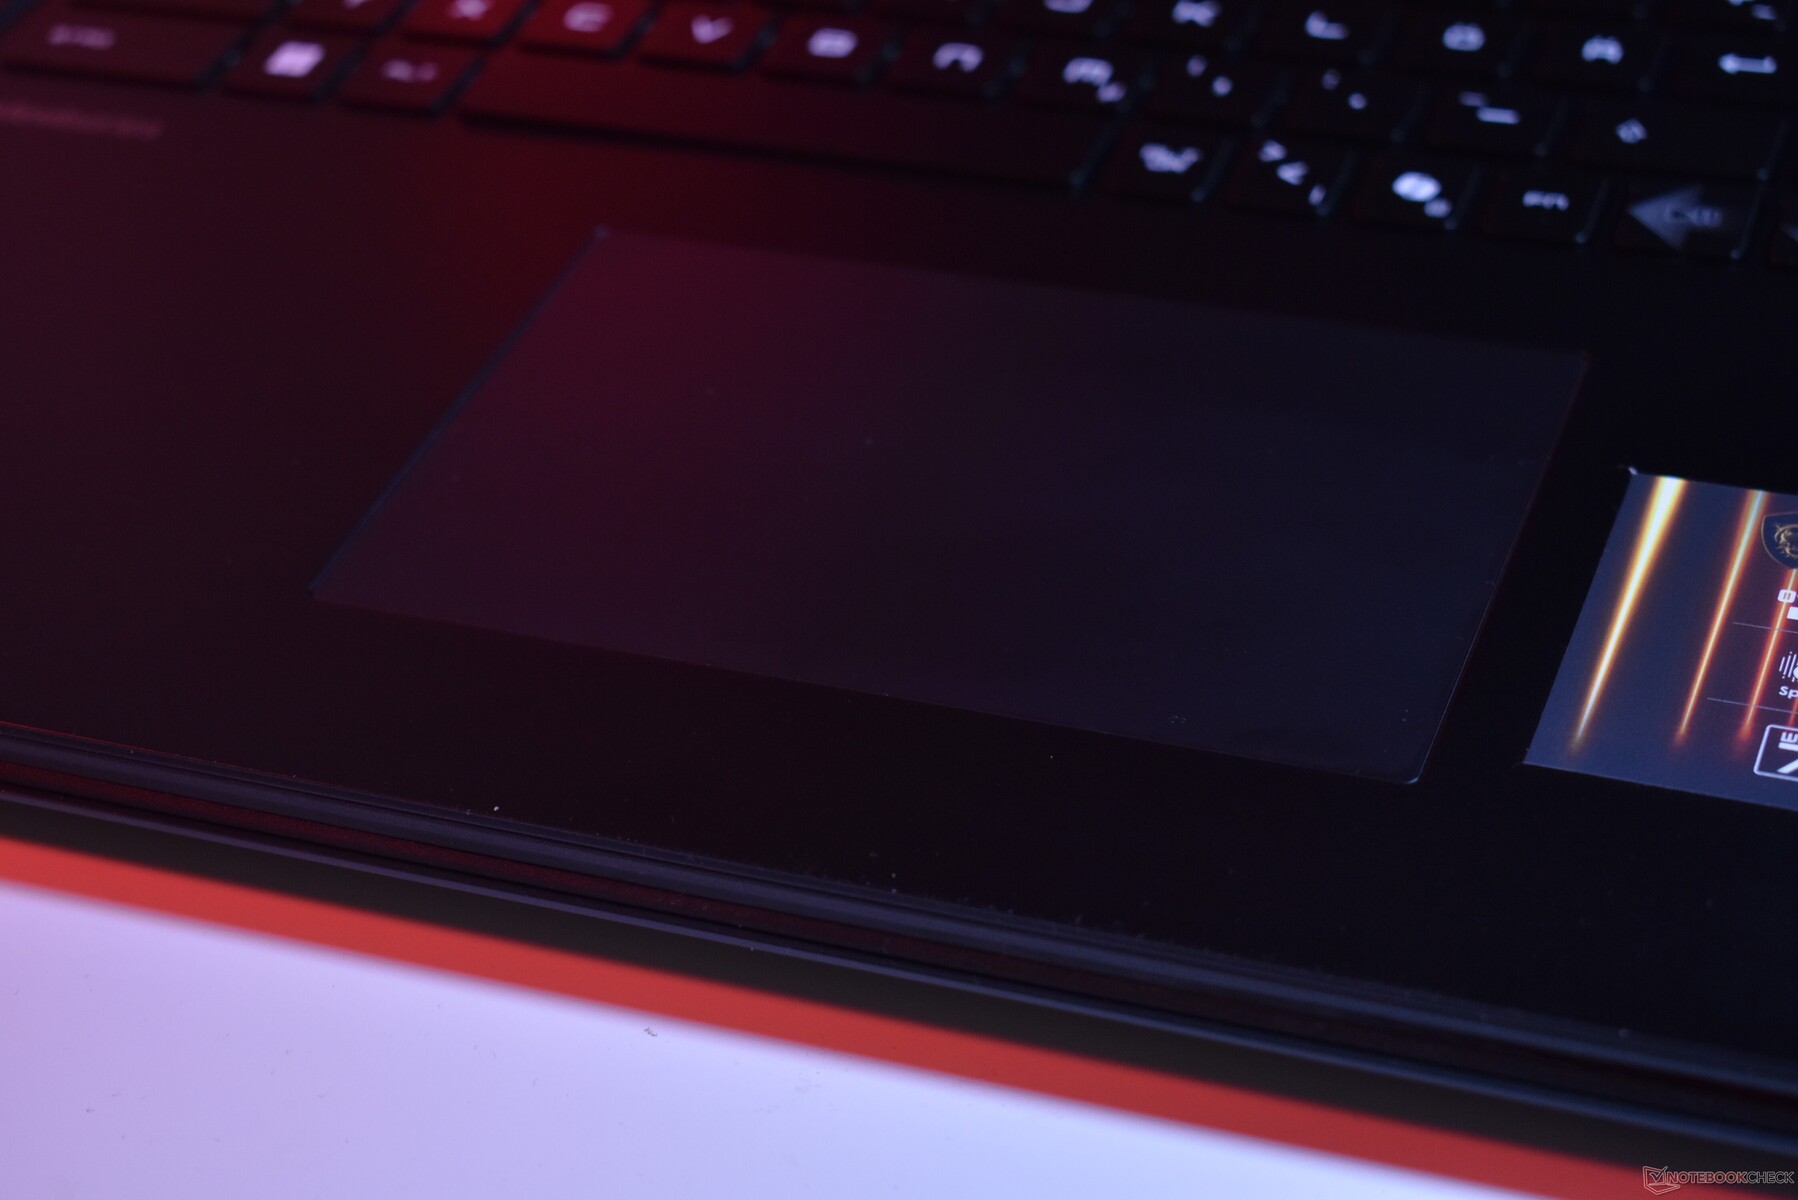
Touchpad
MSI puts in a mechanical clickpad, which measures 13.1 x 8.2 cm. The mechanical click is nice, hard enough but still dampened. Its mechanism is also not too loud. The surface is made out of matte black plastic, which is very smooth, making it ideal for gliding fingers over it. Overall, we like this touchpad, and it works great, though a haptic glass touchpad would have been even better.
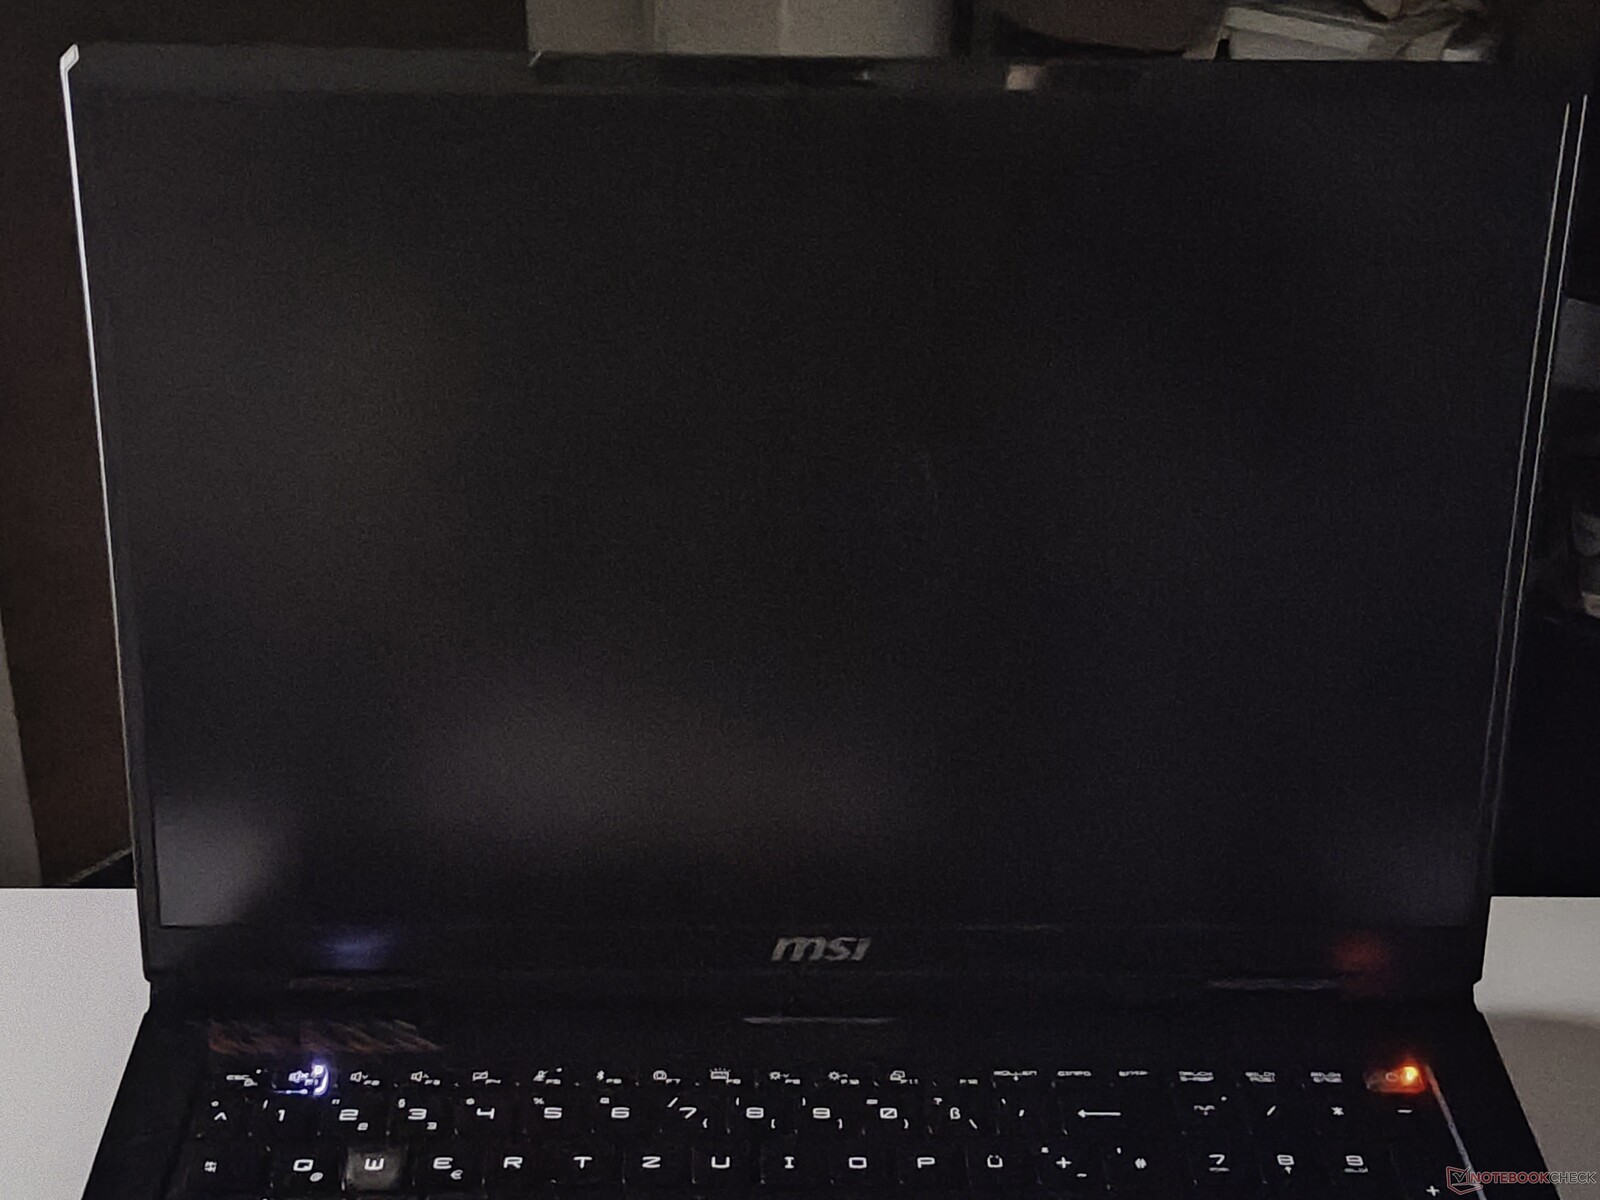
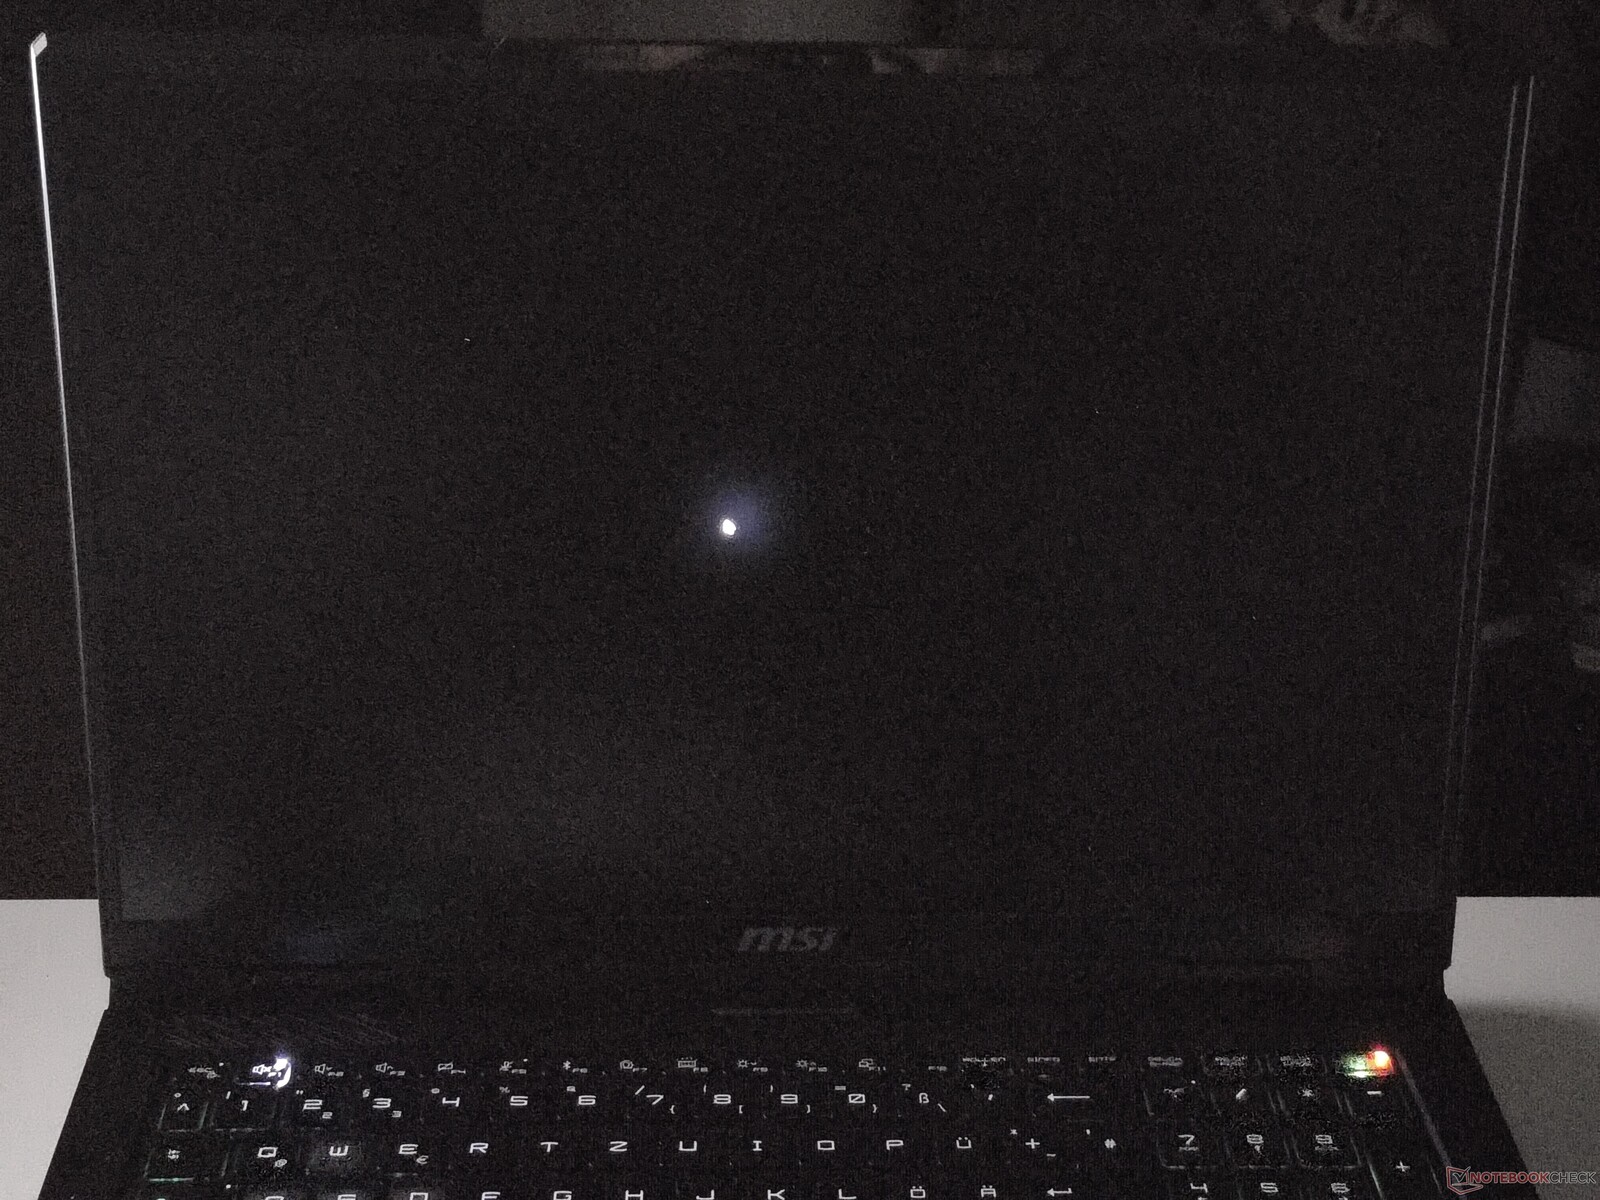
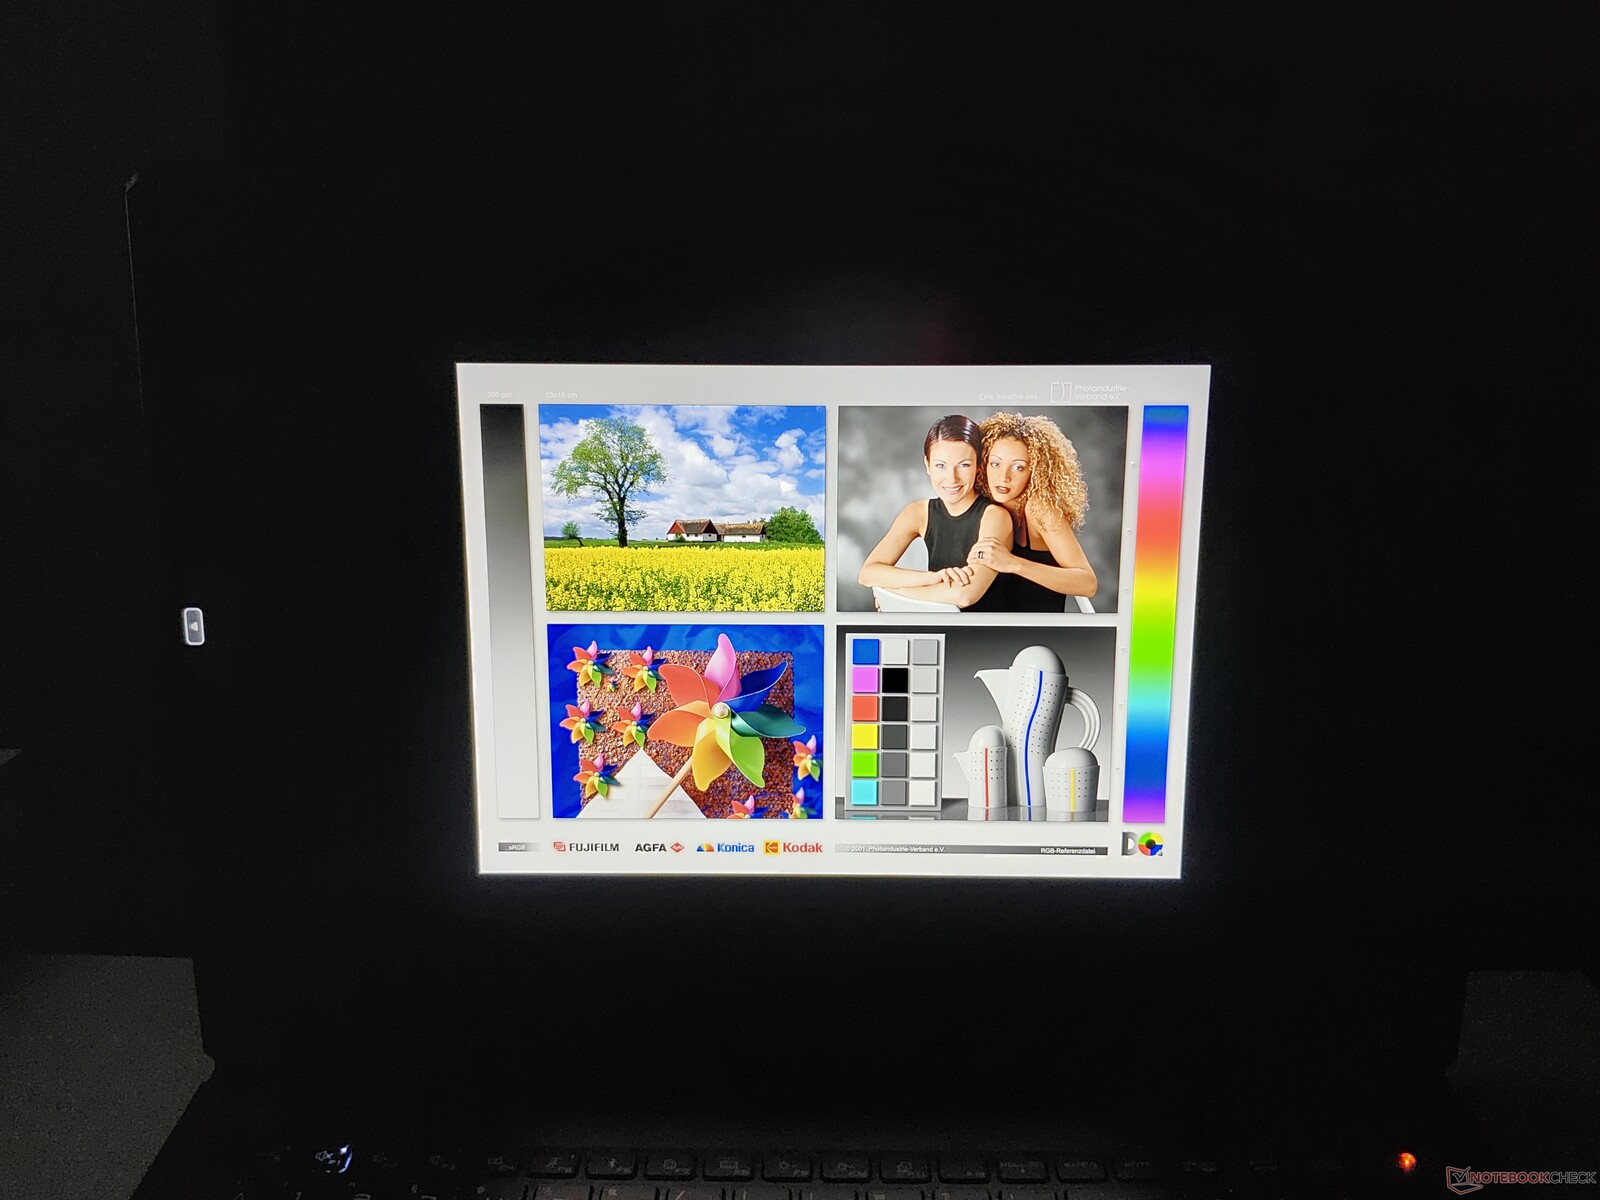
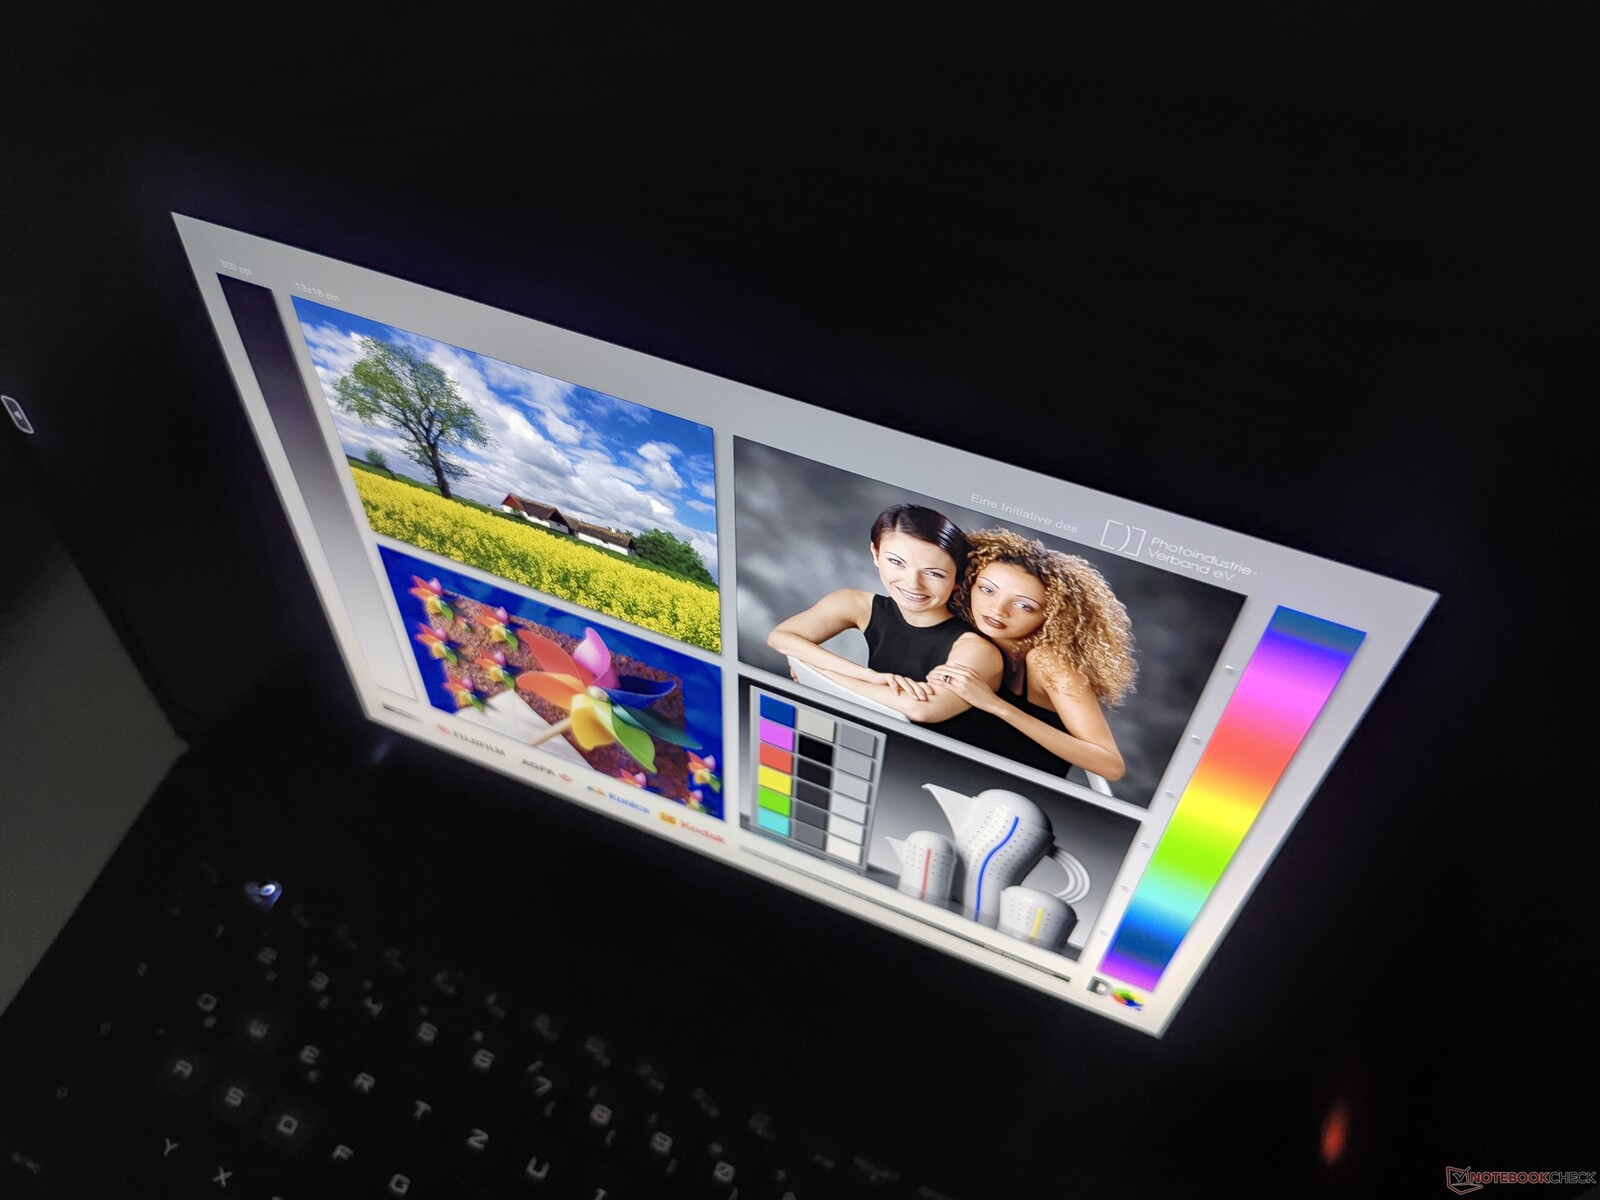
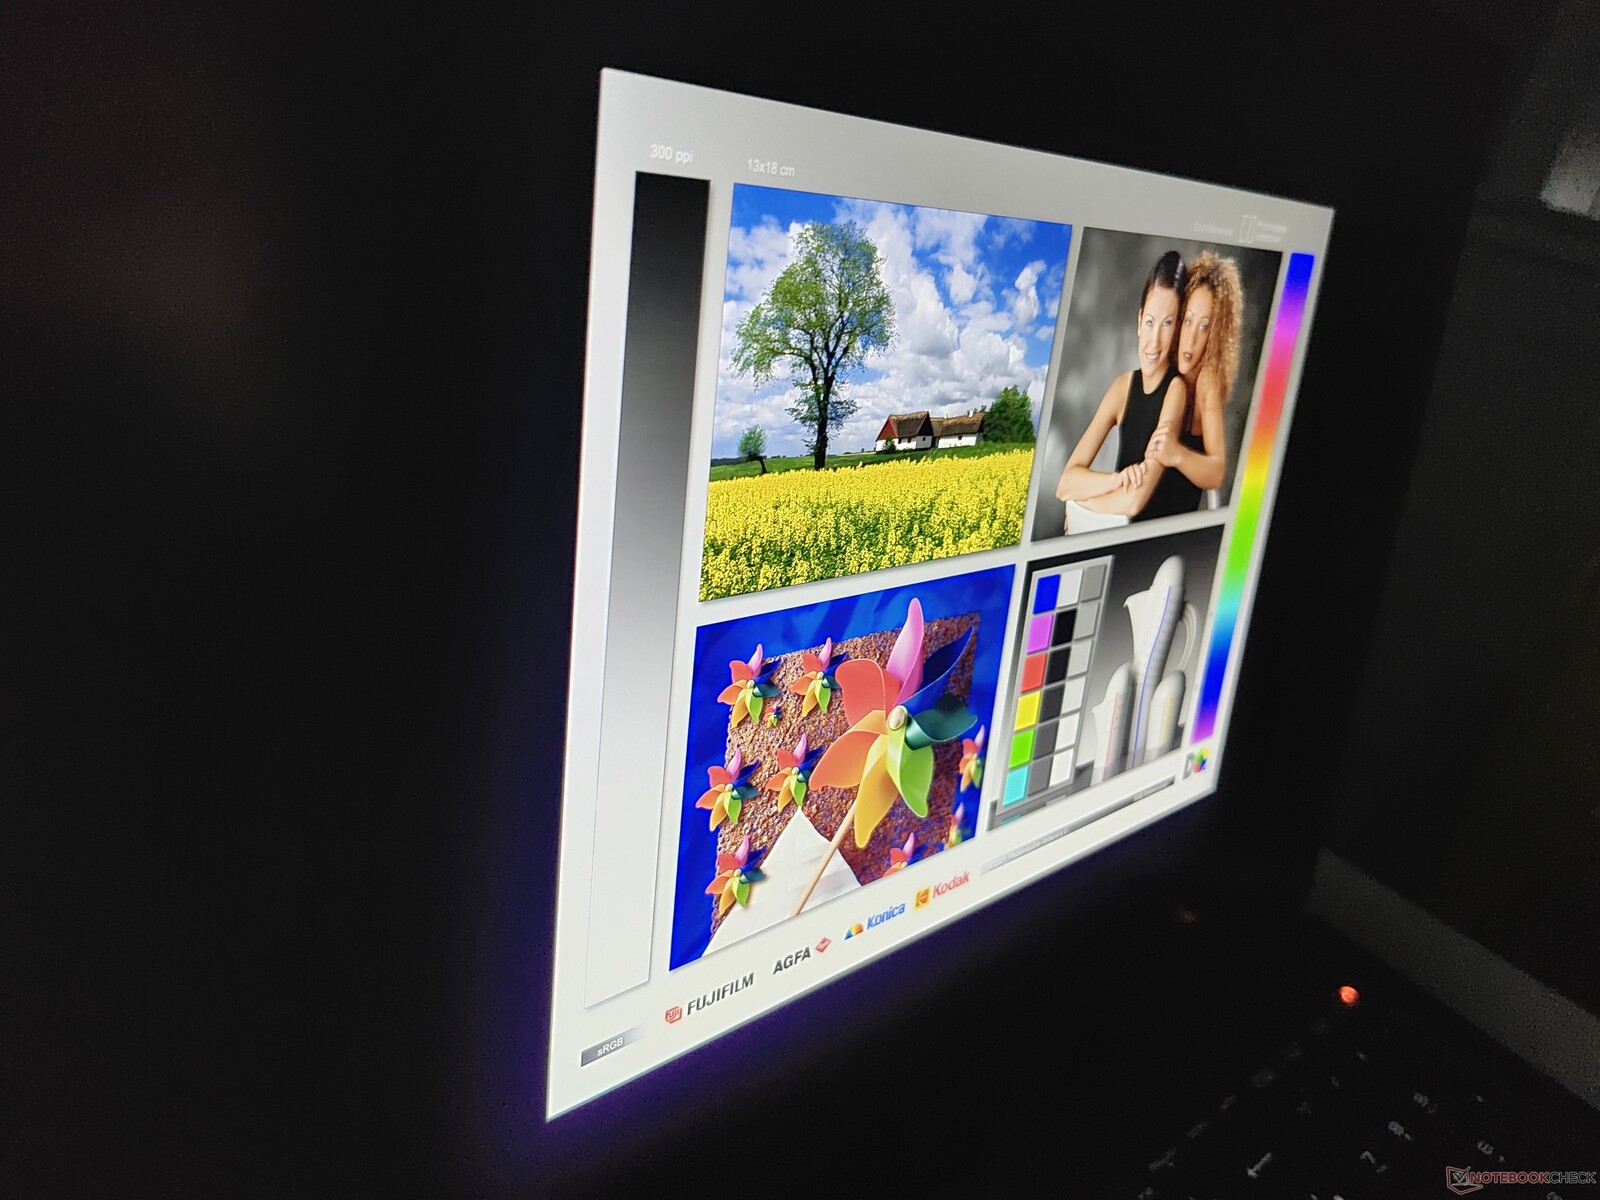
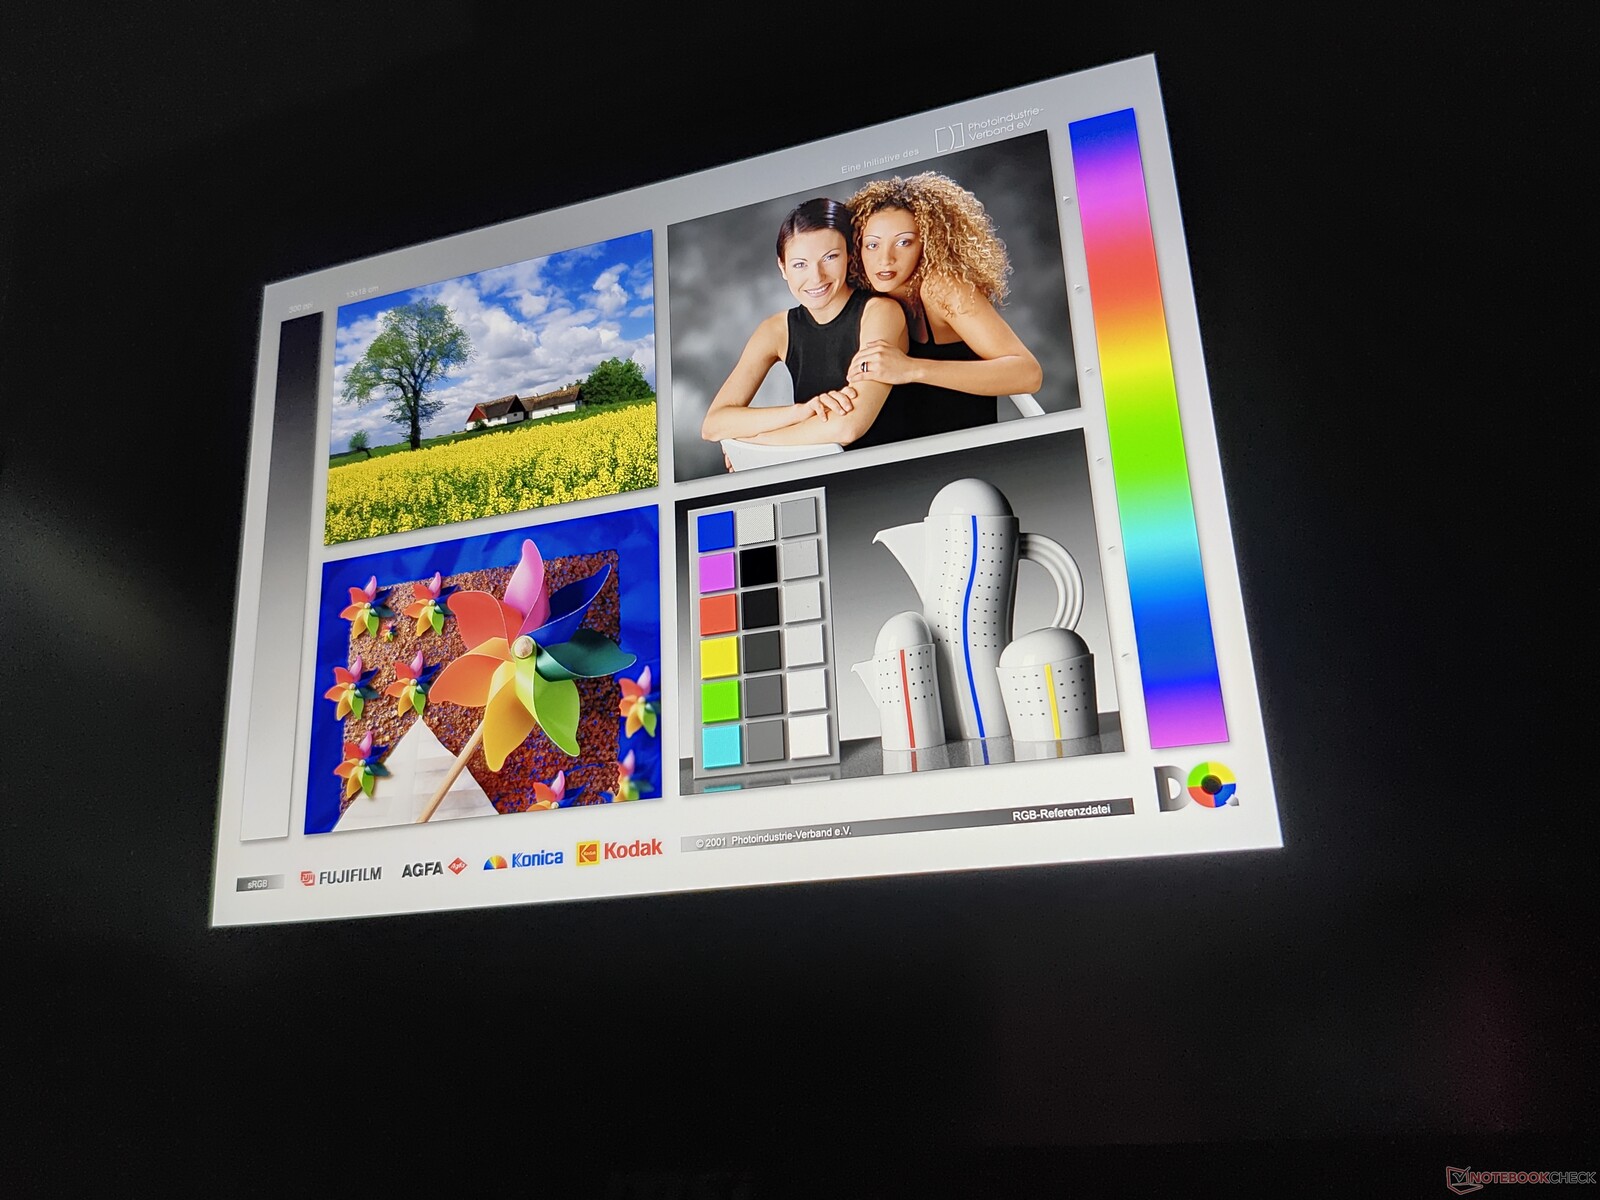
Display: MSI Raider A18 HX has bright, matte miniLED screen
The specifications of the MSI Raider A18 HX list four different screens, all of which have an 18-inch size in the 16:10 aspect ratio:
- WUXGA (1,920 x 1,200), IPS, 144 Hz
- WUXGA (1,920 x 1,200), IPS, 165 Hz
- WQXGA / 2.5K (2,560 x 1,600), IPS, 240 Hz
- WQUXGA / 4K-UHD (3,840 x 2,400), miniLED, 120 Hz
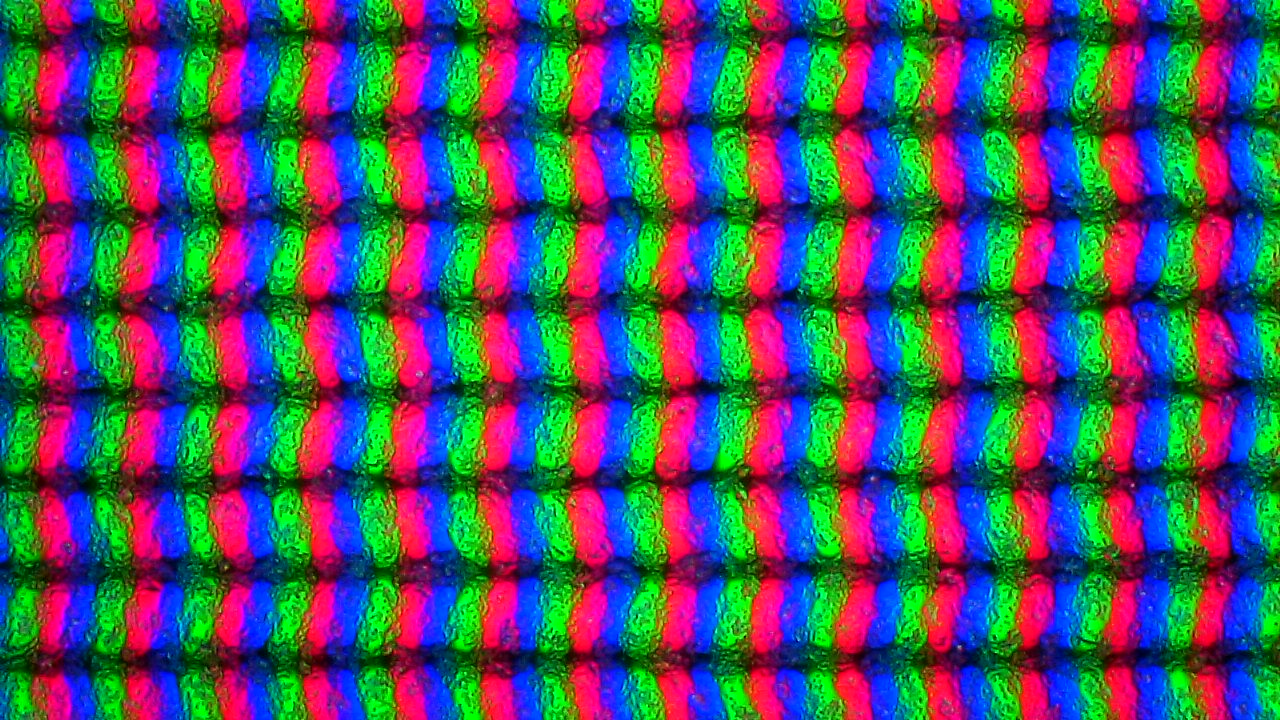
MSI uses a matte screen made by AU Optotronics. When the screen is used in its SDR mode, the brightness tops out around 500 cd/m² - in HDR mode, this value increased to around 900 cd/m². We measure a maximum of 889 cd/m² in the center of the display in HDR mode.
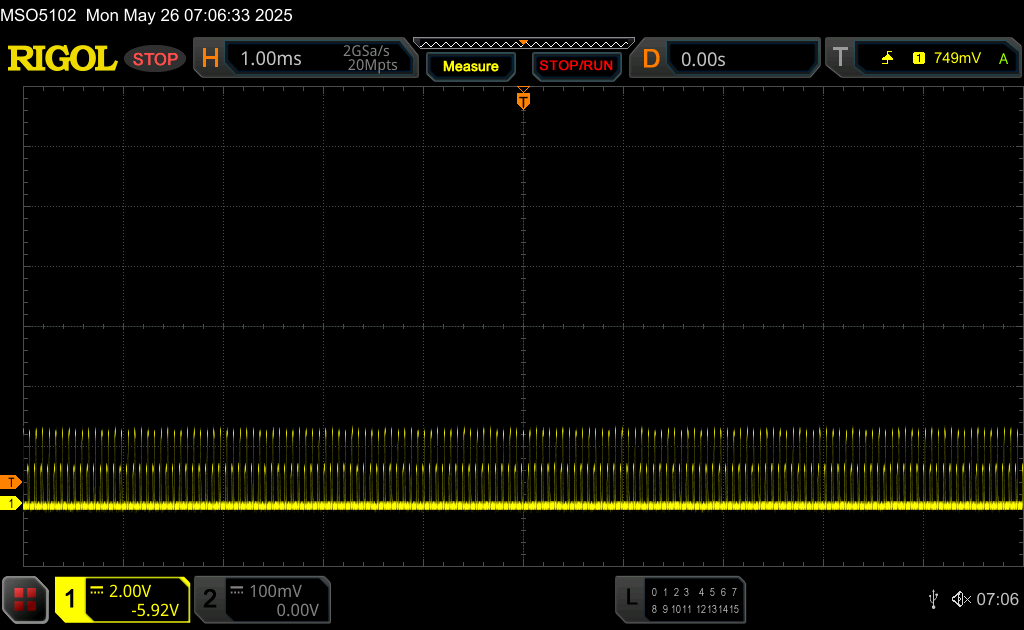
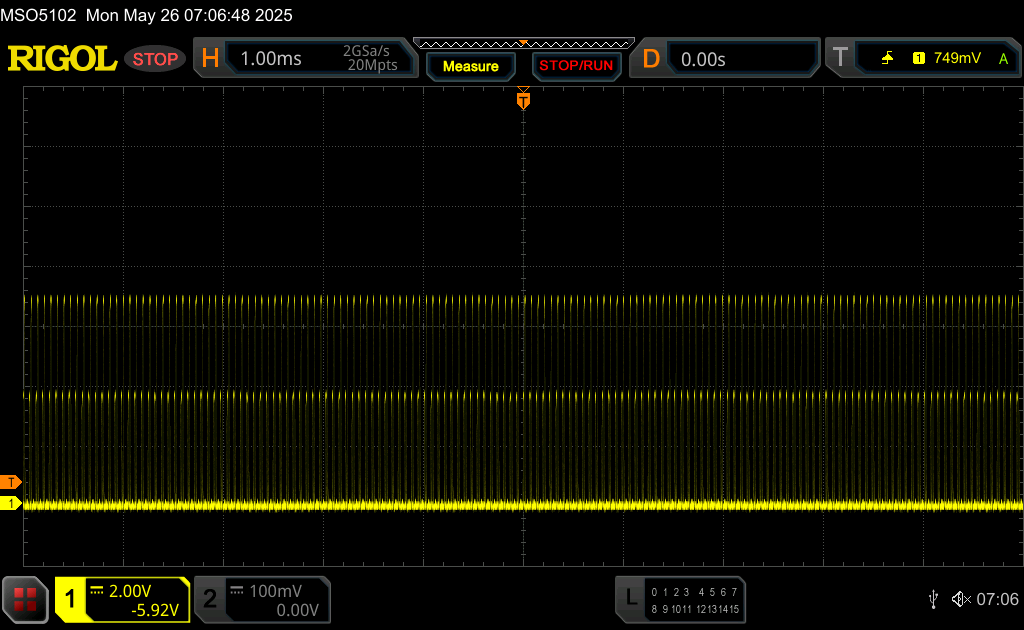
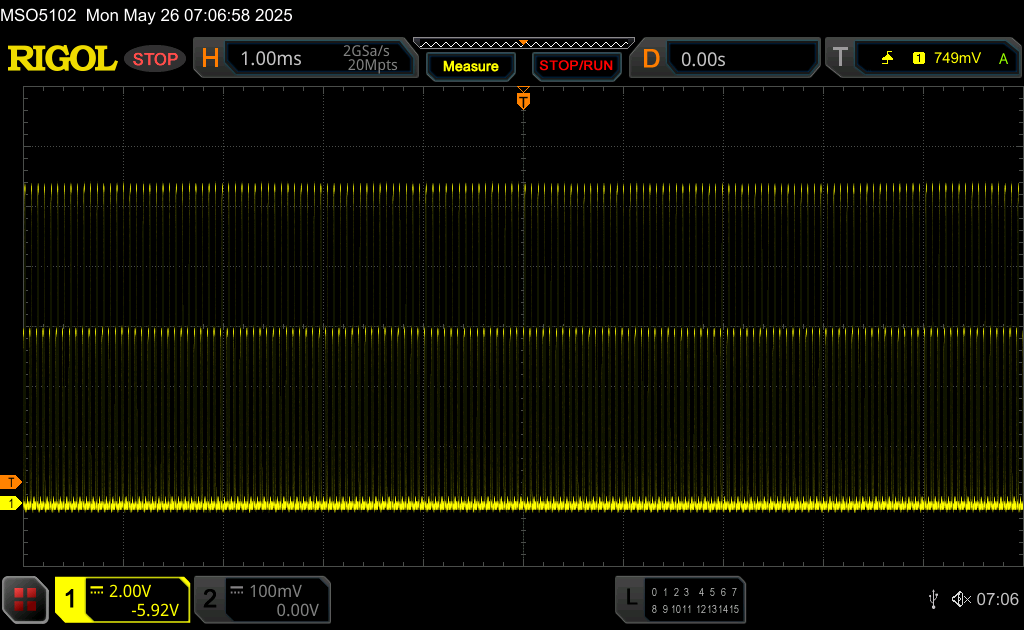
The screen uses PWM, but the frequency is extremely high. Albeit the amplitude is very high, most users should not be affected by this high frequency.
| |||||||||||||||||||||||||
Brightness Distribution: 85 %
Center on Battery: 510 cd/m²
Contrast: 51000:1 (Black: 0.01 cd/m²)
ΔE ColorChecker Calman: 4.5 | ∀{0.5-29.43 Ø4.72}
calibrated: 5.7
ΔE Greyscale Calman: 2.3 | ∀{0.09-98 Ø4.97}
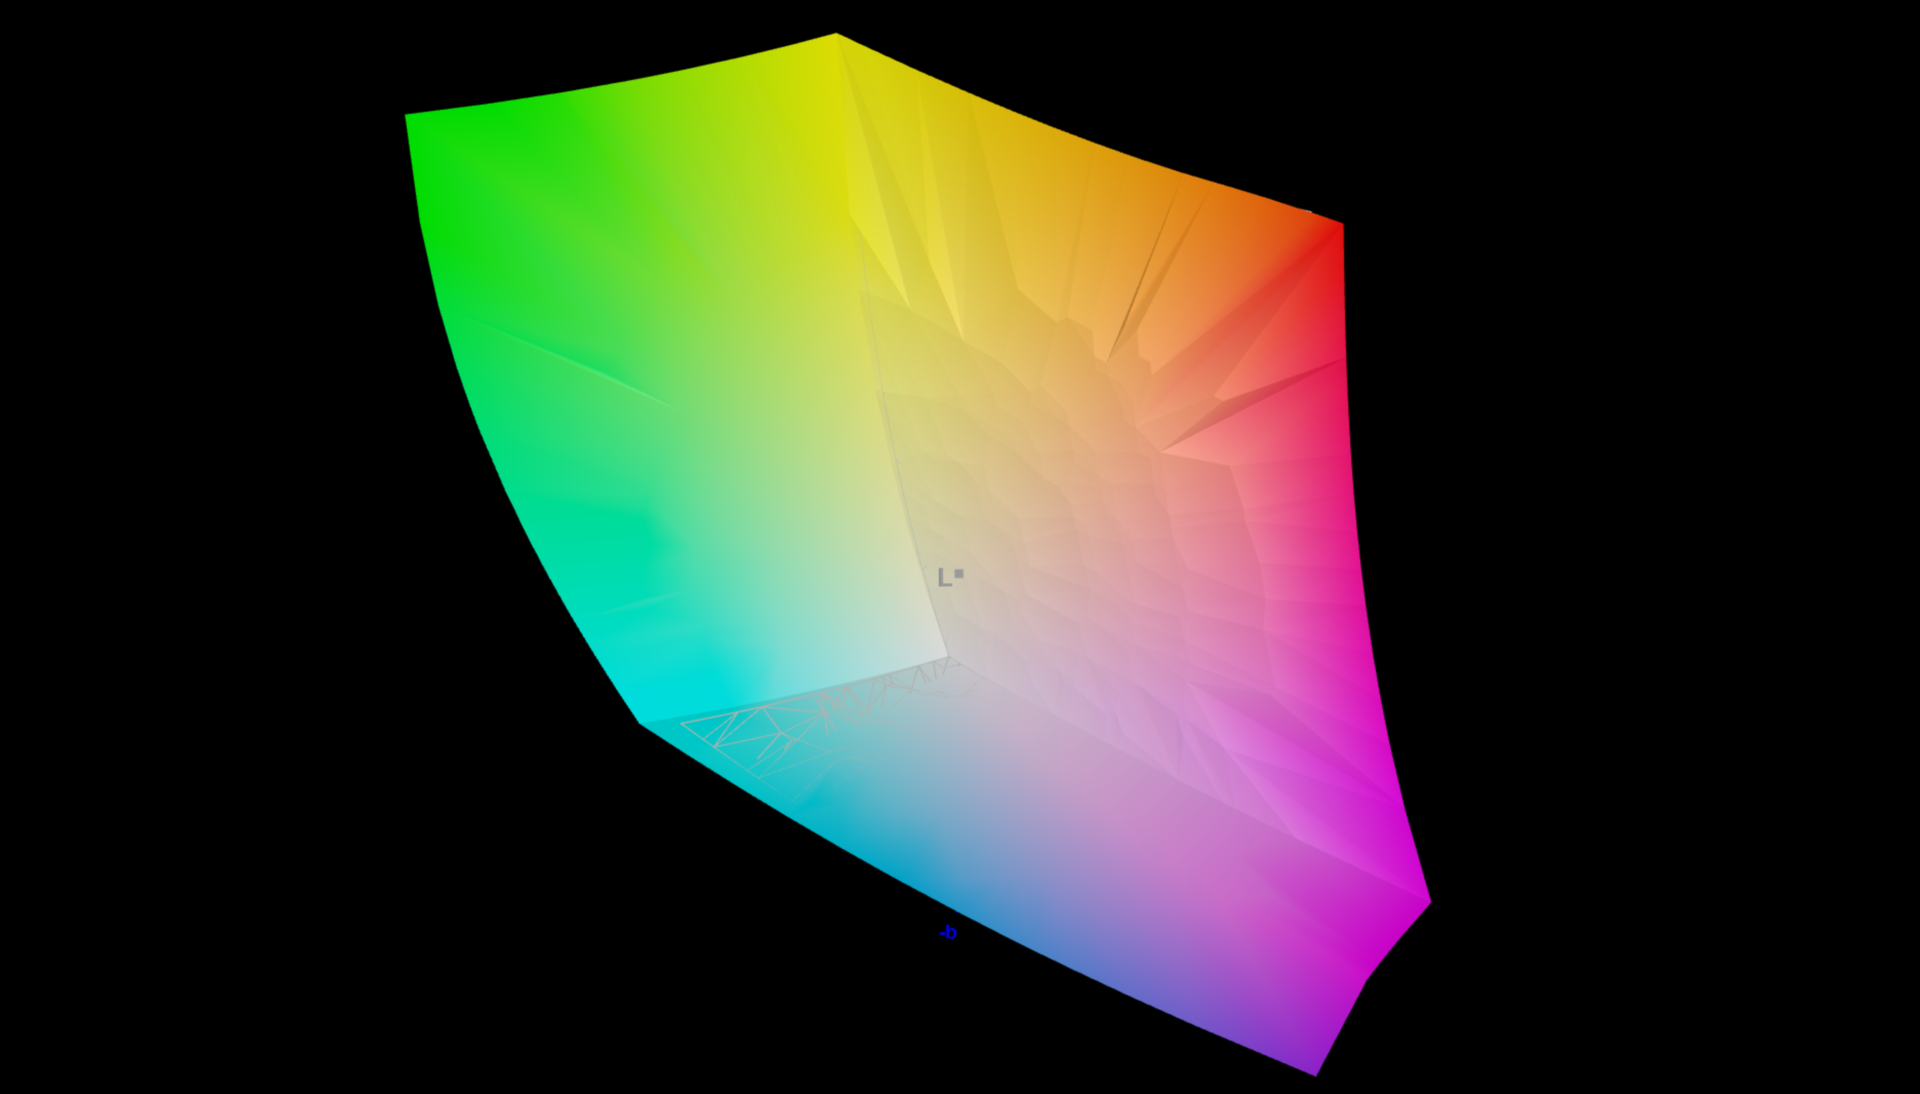
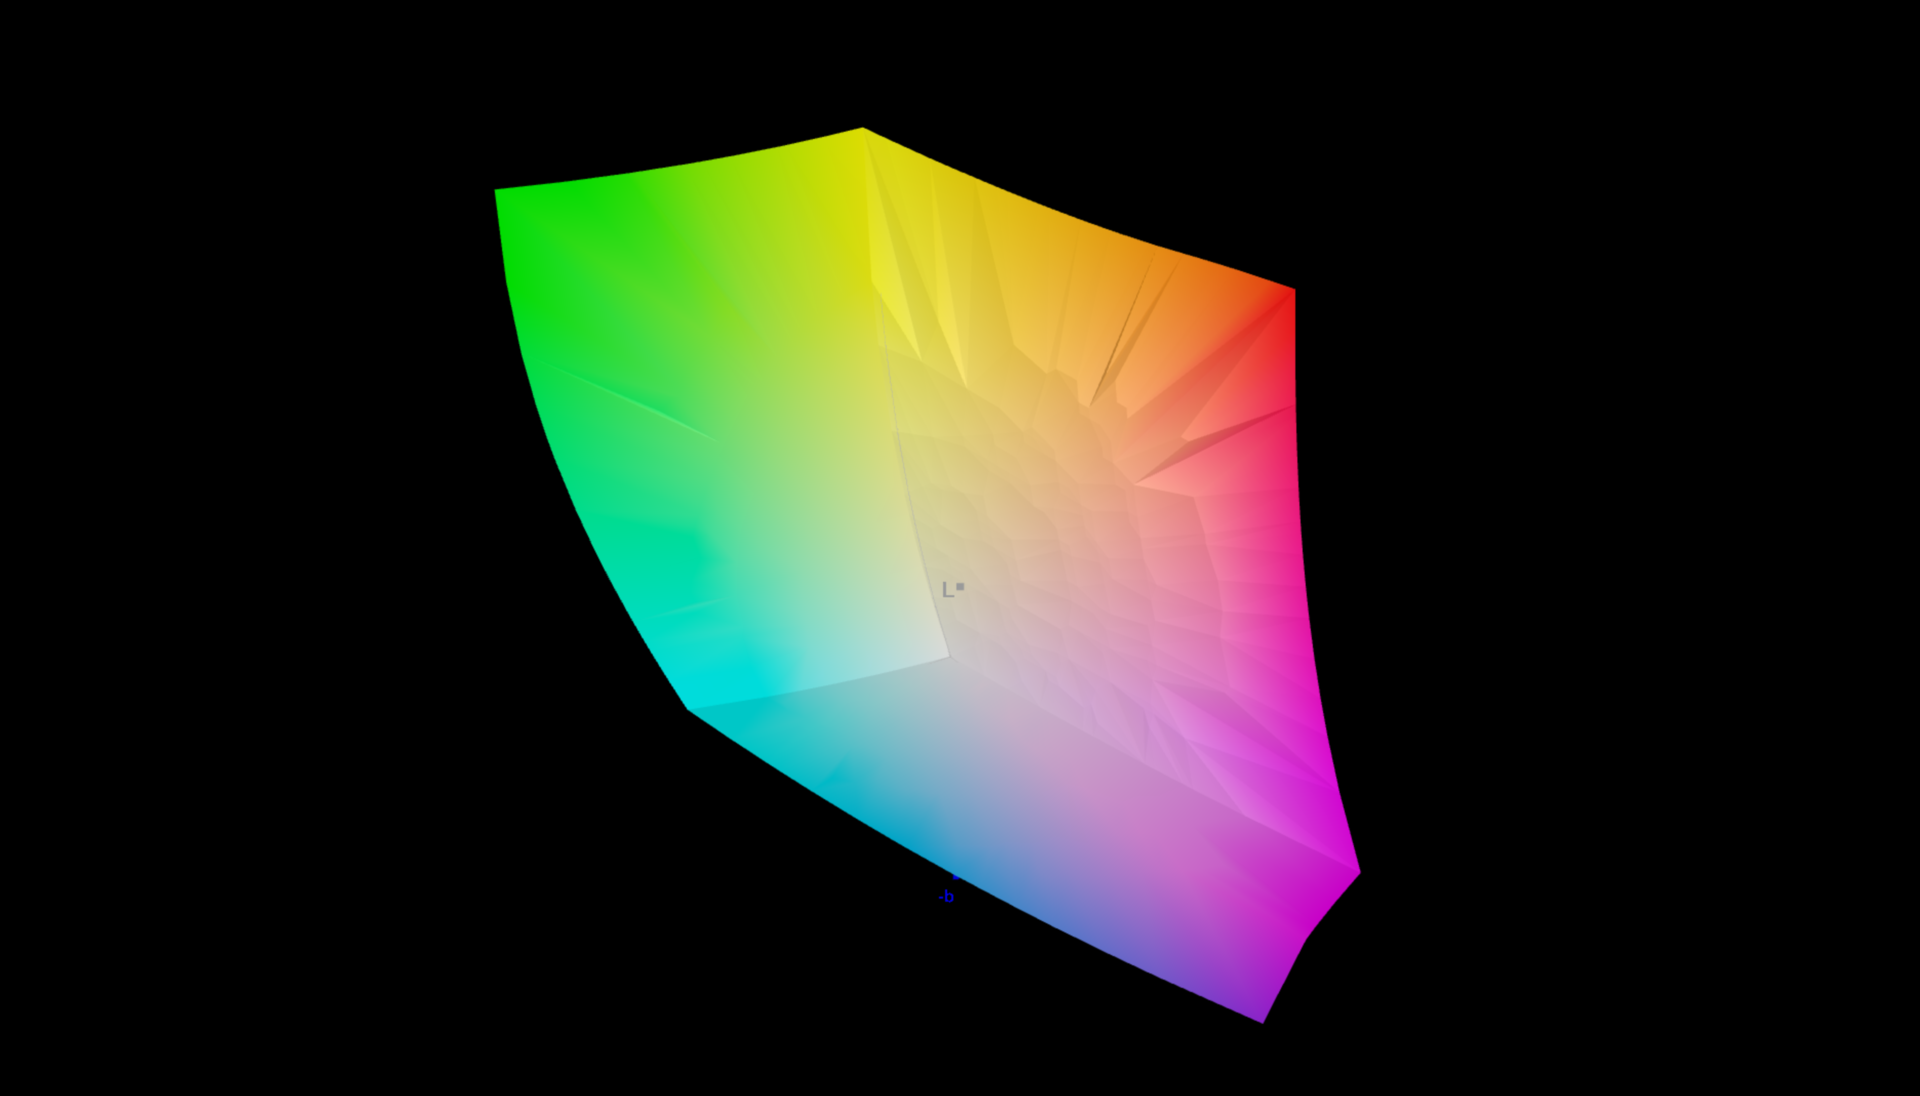
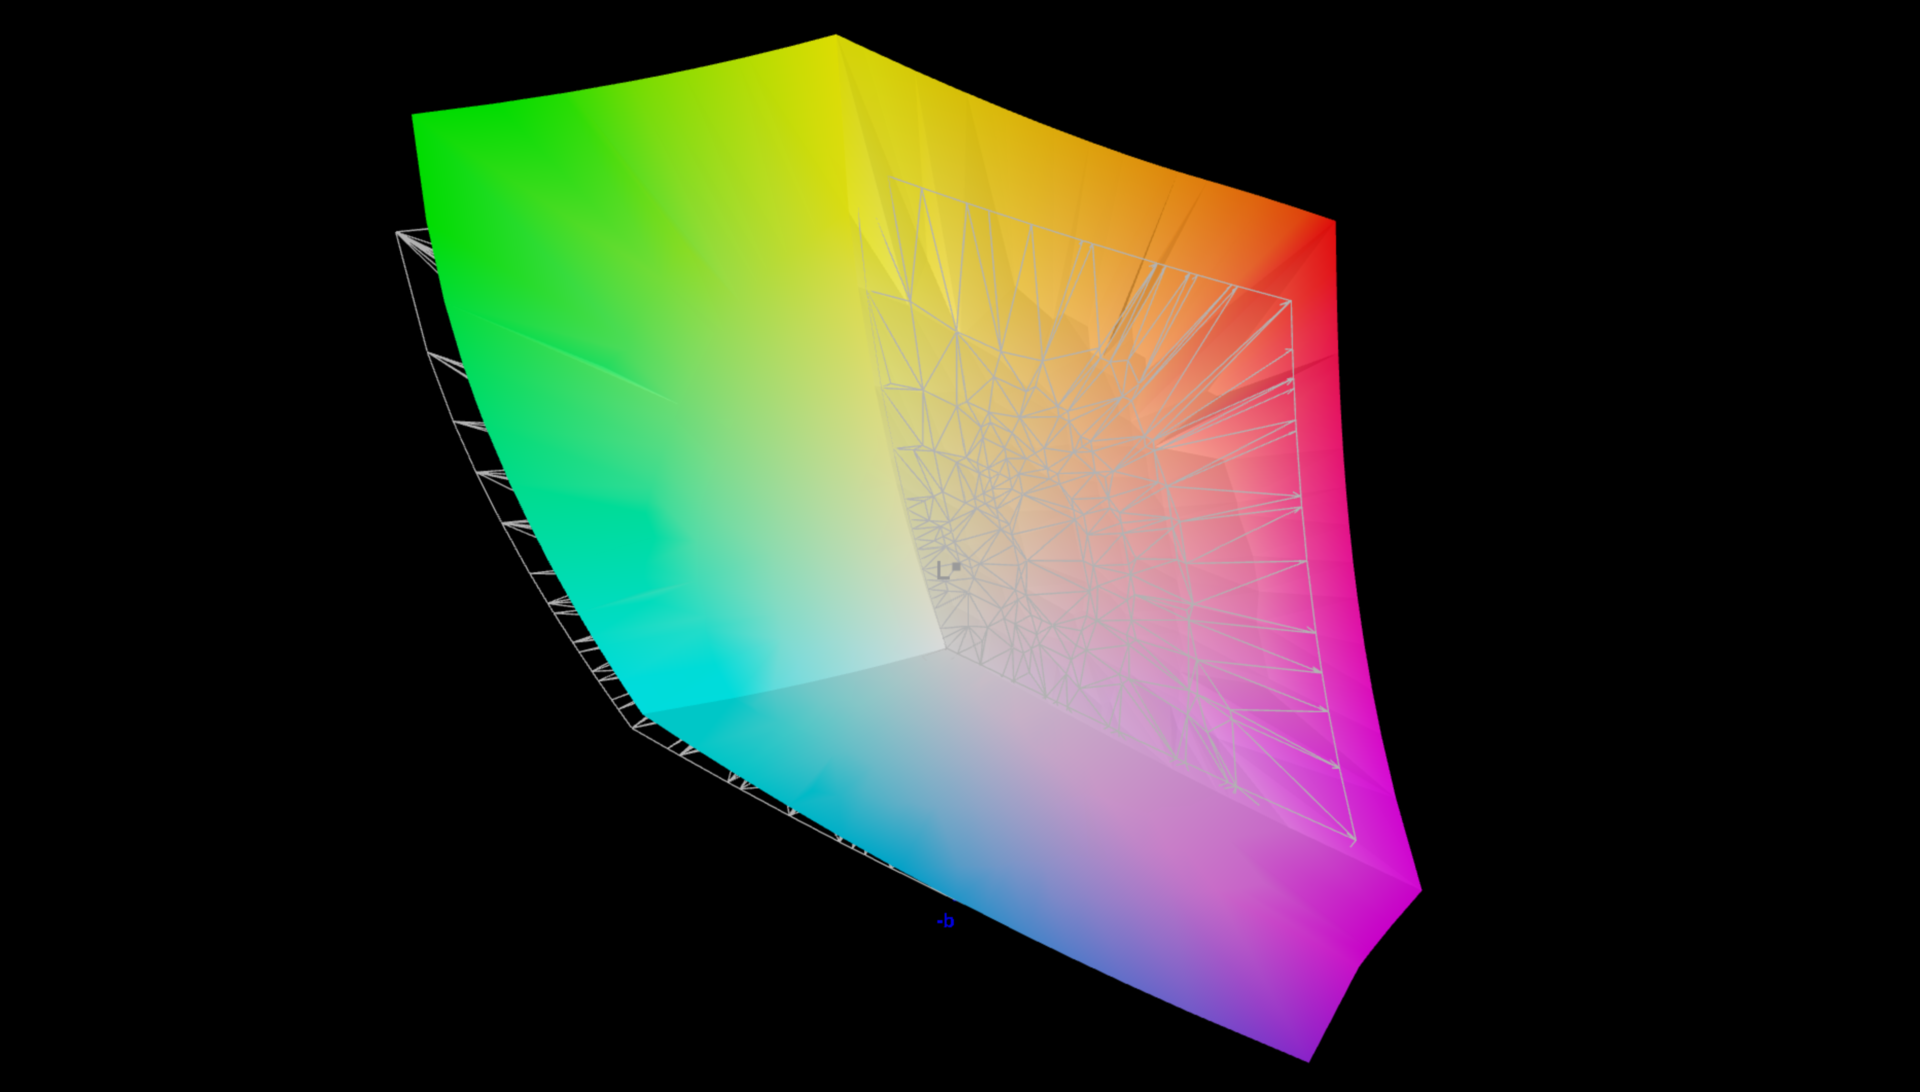
93.9% AdobeRGB 1998 (Argyll 3D)
100% sRGB (Argyll 3D)
99.9% Display P3 (Argyll 3D)
Gamma: 2.08
CCT: 6648 K
| MSI Raider A18 HX A9WIG-080 B180ZAN01.0, MiniLED IPS, 3840x2400, 18", 120 Hz | MSI Raider 18 HX A14V AU Optronics B180ZAN1.0, Mini-LED, 3840x2400, 18", 120 Hz | Medion Erazer Beast 18 X1 MD62731 BOEhydis NE180QDM-NZ2, IPS, 2560x1600, 18", 240 Hz | Aorus Master 18 AM8H NE180QDM-NM1 (BOE0C58), Mini-LED, 2560x1600, 18", 240 Hz | Asus Strix Scar 18 G835LX N180QDM-NM2, Mini-LED, 2560x1600, 18", 240 Hz | |
|---|---|---|---|---|---|
| Display | -4% | -4% | -2% | -3% | |
| Display P3 Coverage (%) | 99.9 | 96.6 -3% | 97.1 -3% | 99.9 0% | 99 -1% |
| sRGB Coverage (%) | 100 | 99.9 0% | 99.9 0% | 100 0% | 100 0% |
| AdobeRGB 1998 Coverage (%) | 93.9 | 84.8 -10% | 84.7 -10% | 87.7 -7% | 87.2 -7% |
| Response Times | -112% | 64% | 25% | 33% | |
| Response Time Grey 50% / Grey 80% * (ms) | 23 ? | 10.4 ? 55% | 5.6 ? 76% | 16.4 ? 29% | 7.4 ? 68% |
| Response Time Black / White * (ms) | 15.1 ? | 75.8 ? -402% | 7.3 ? 52% | 8.1 ? 46% | 10.4 ? 31% |
| PWM Frequency (Hz) | 15203 | 2606.2 ? | 1398 ? | 20610 ? | |
| PWM Amplitude * (%) | 100 | 90 10% | 100 -0% | 100 -0% | |
| Screen | -6% | -451% | -147% | -87% | |
| Brightness middle (cd/m²) | 510 | 575.7 13% | 478 -6% | 438 -14% | 764 50% |
| Brightness (cd/m²) | 470 | 574 22% | 456 -3% | 451 -4% | 747 59% |
| Brightness Distribution (%) | 85 | 94 11% | 89 5% | 90 6% | 93 9% |
| Black Level * (cd/m²) | 0.01 | 0.4 -3900% | 0.13 -1200% | 0.1 -900% | |
| Contrast (:1) | 51000 | 1195 -98% | 3369 -93% | 7640 -85% | |
| Colorchecker dE 2000 * | 4.5 | 3.56 21% | 3.94 12% | 1.25 72% | 1.2 73% |
| Colorchecker dE 2000 max. * | 7.3 | 8.64 -18% | 8.6 -18% | 4.93 32% | 2.8 62% |
| Colorchecker dE 2000 calibrated * | 5.7 | 2.69 53% | 0.75 87% | ||
| Greyscale dE 2000 * | 2.3 | 5.6 -143% | 5.5 -139% | 1.7 26% | 1.5 35% |
| Gamma | 2.08 106% | 2.34 94% | 2.212 99% | 2.173 101% | 2.17 101% |
| CCT | 6648 98% | 7872 83% | 7059 92% | 6518 100% | 6556 99% |
| Total Average (Program / Settings) | -41% /
-30% | -130% /
-282% | -41% /
-79% | -19% /
-43% |
* ... smaller is better
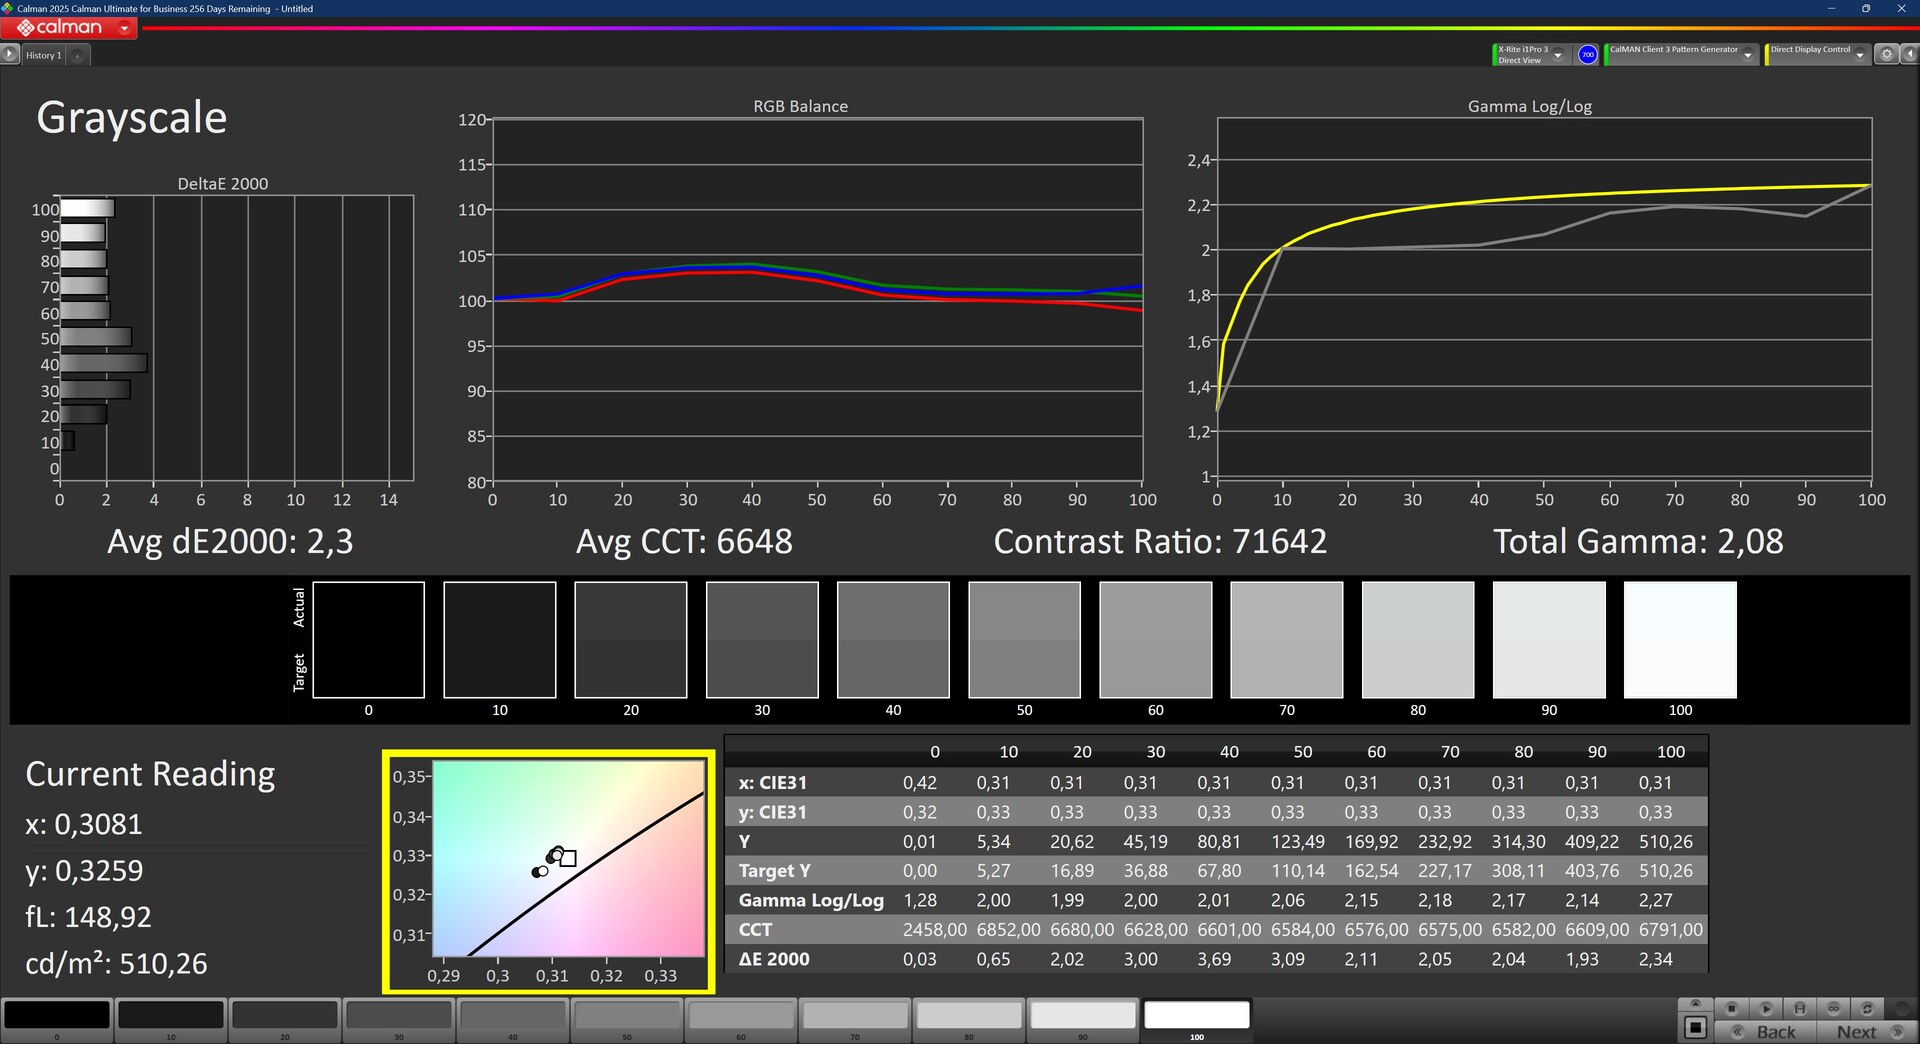

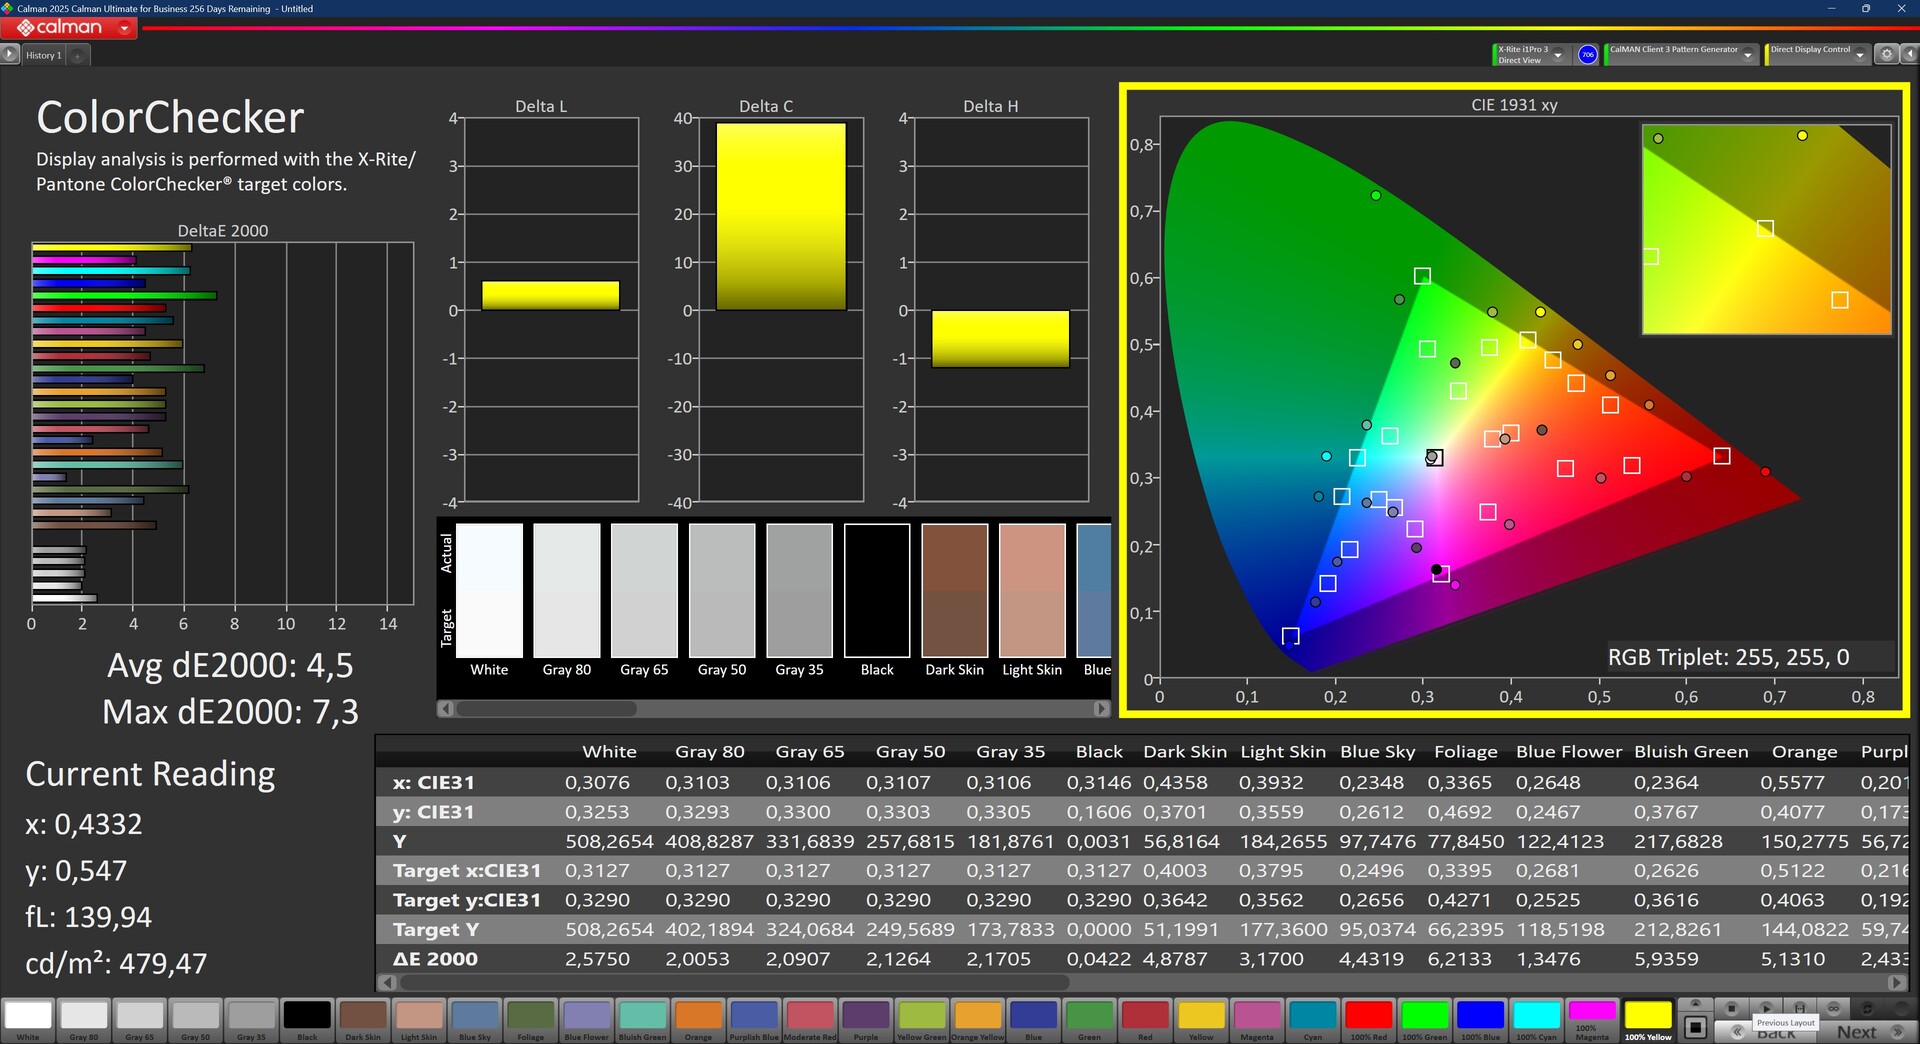
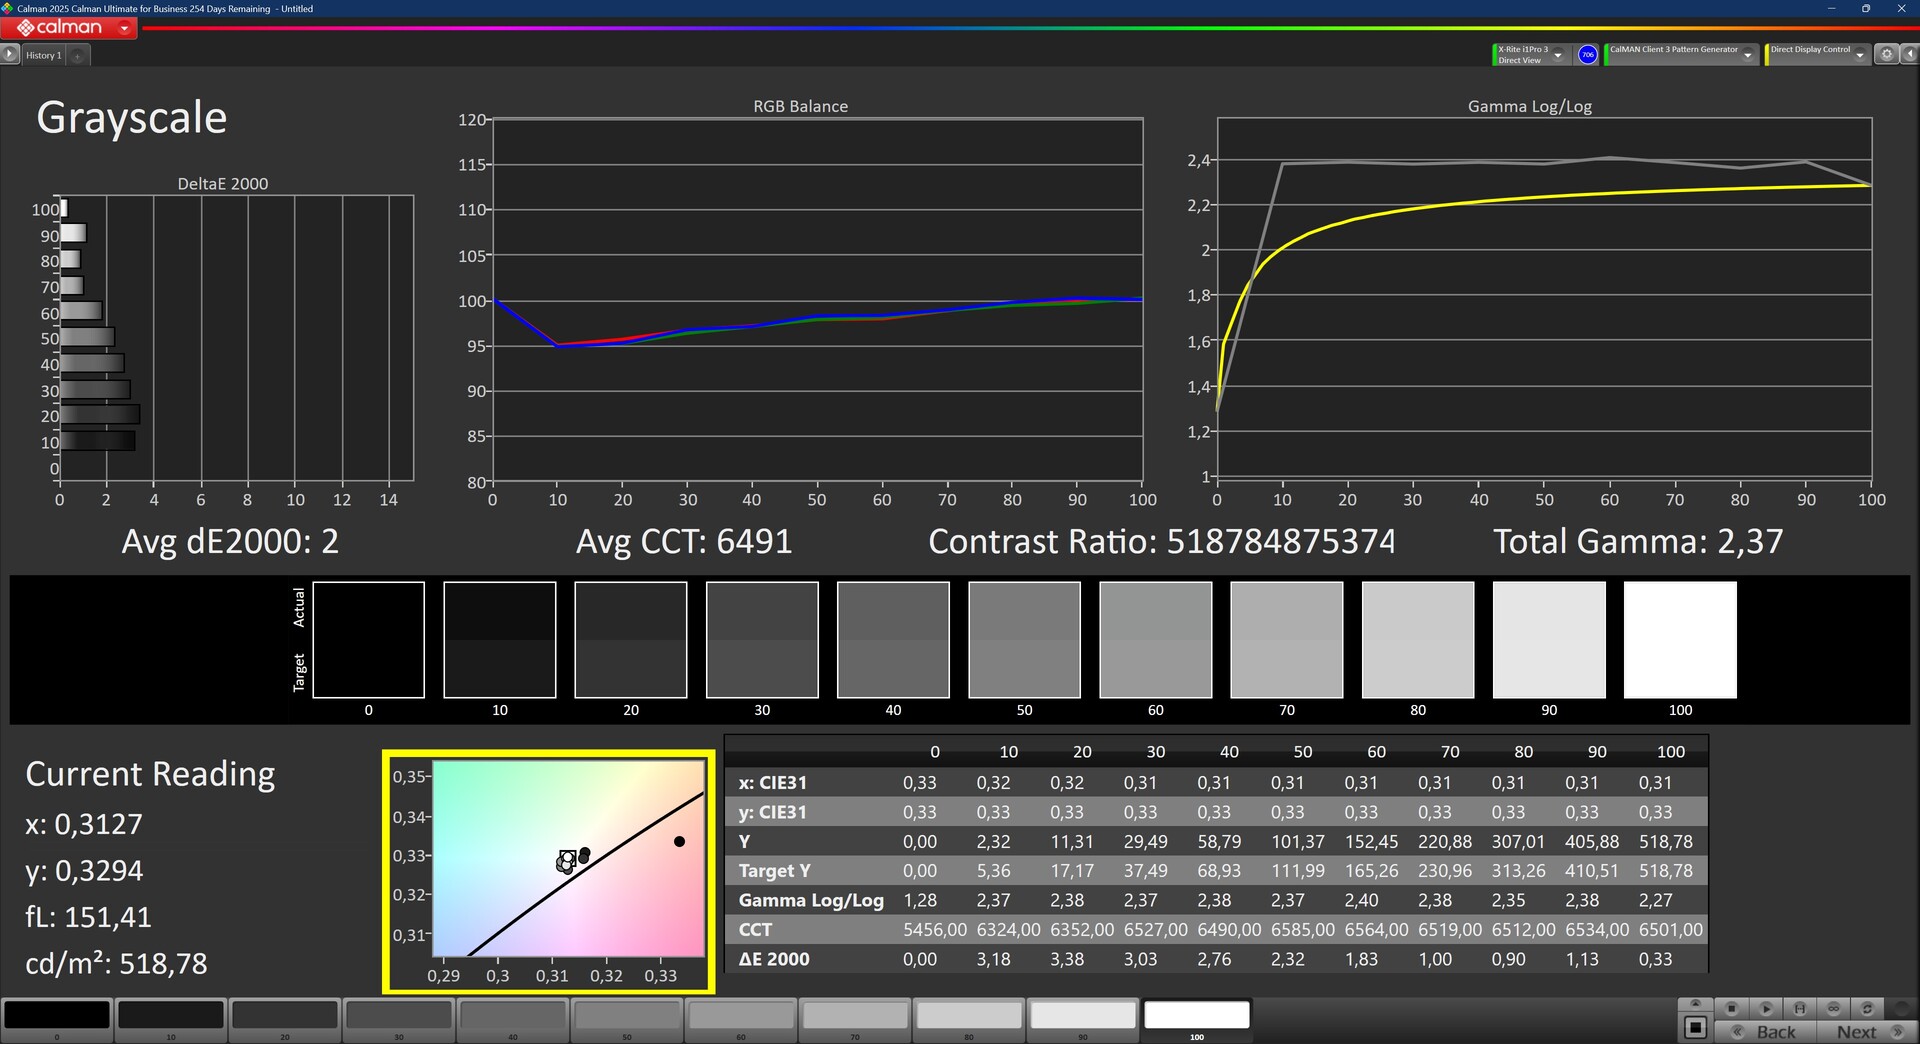

There is a color-mode selector from MSI, we selected the sRGB mode for our measurements. Unfortunately, the colors are not really accurate, even after a calibration.
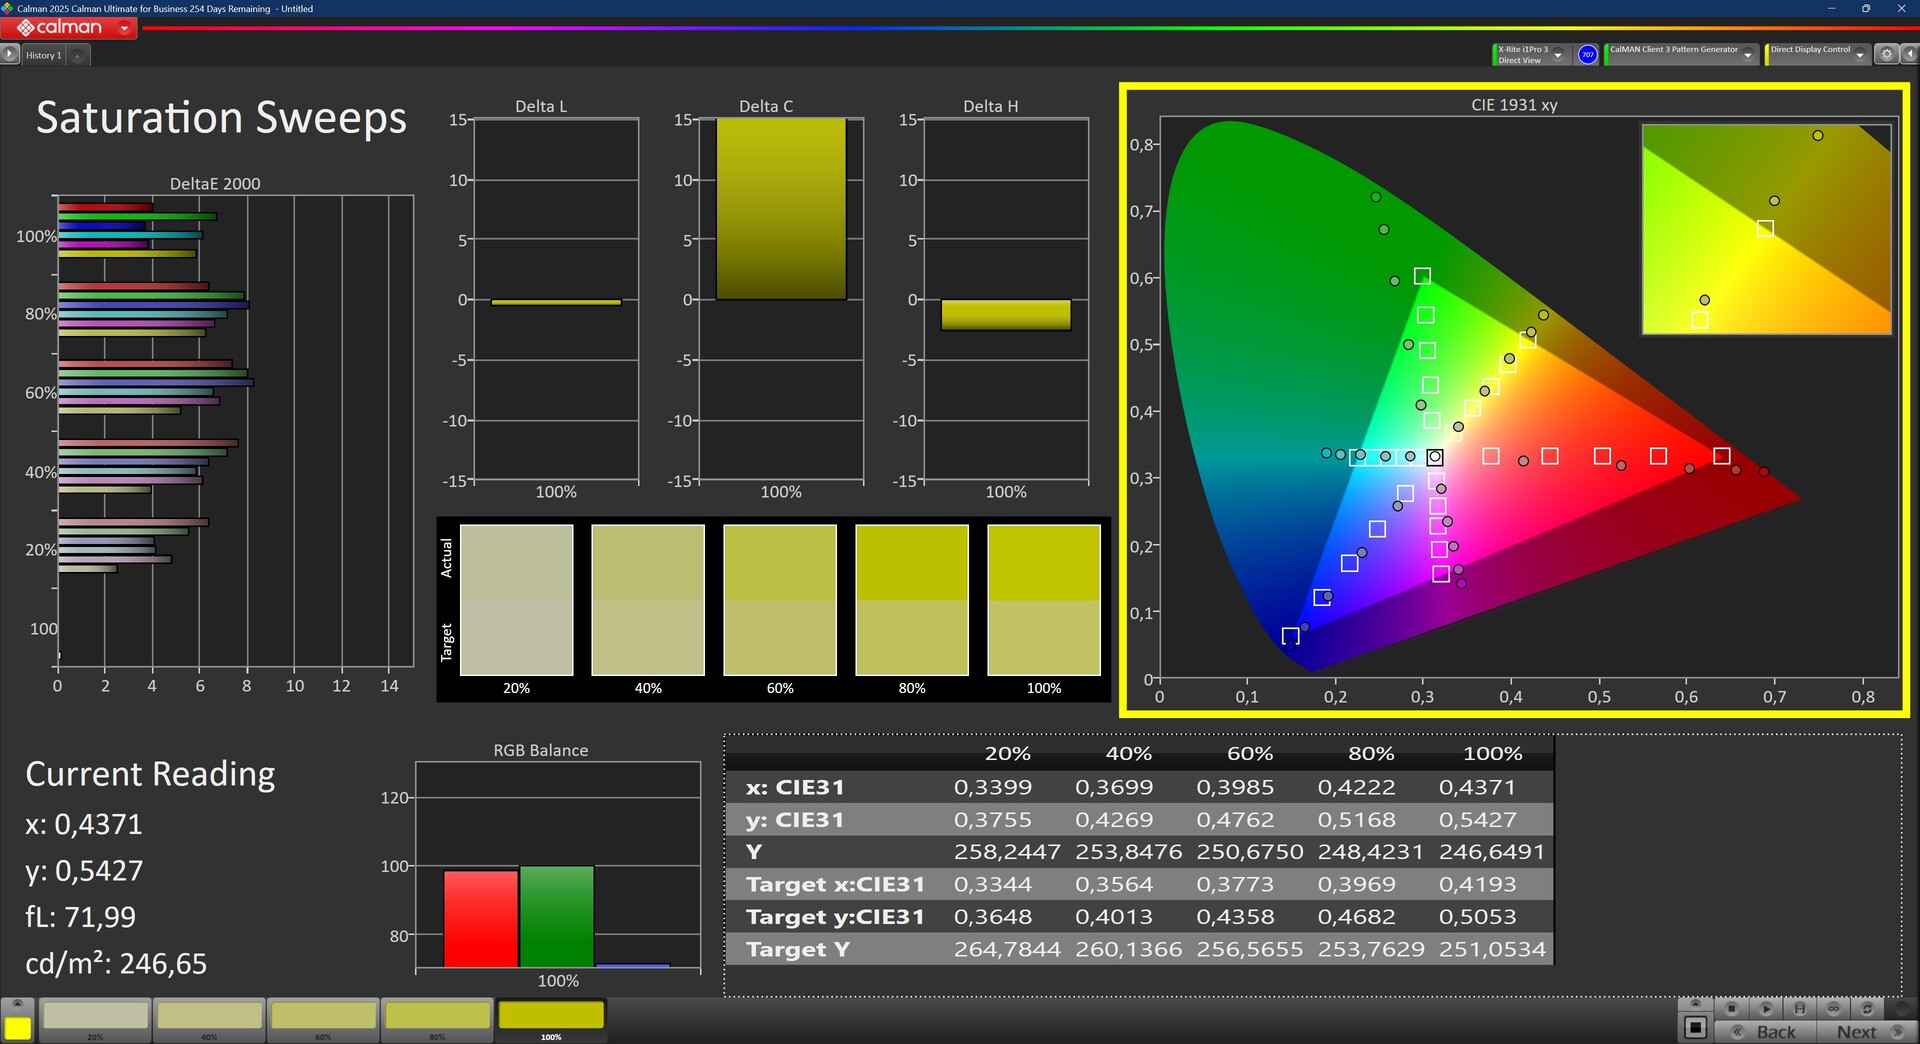
Color gamut coverage of the screen is great. Both the sRGB and DCI P3 color gamuts are completely covered, making the screen suitable for some color critical work.
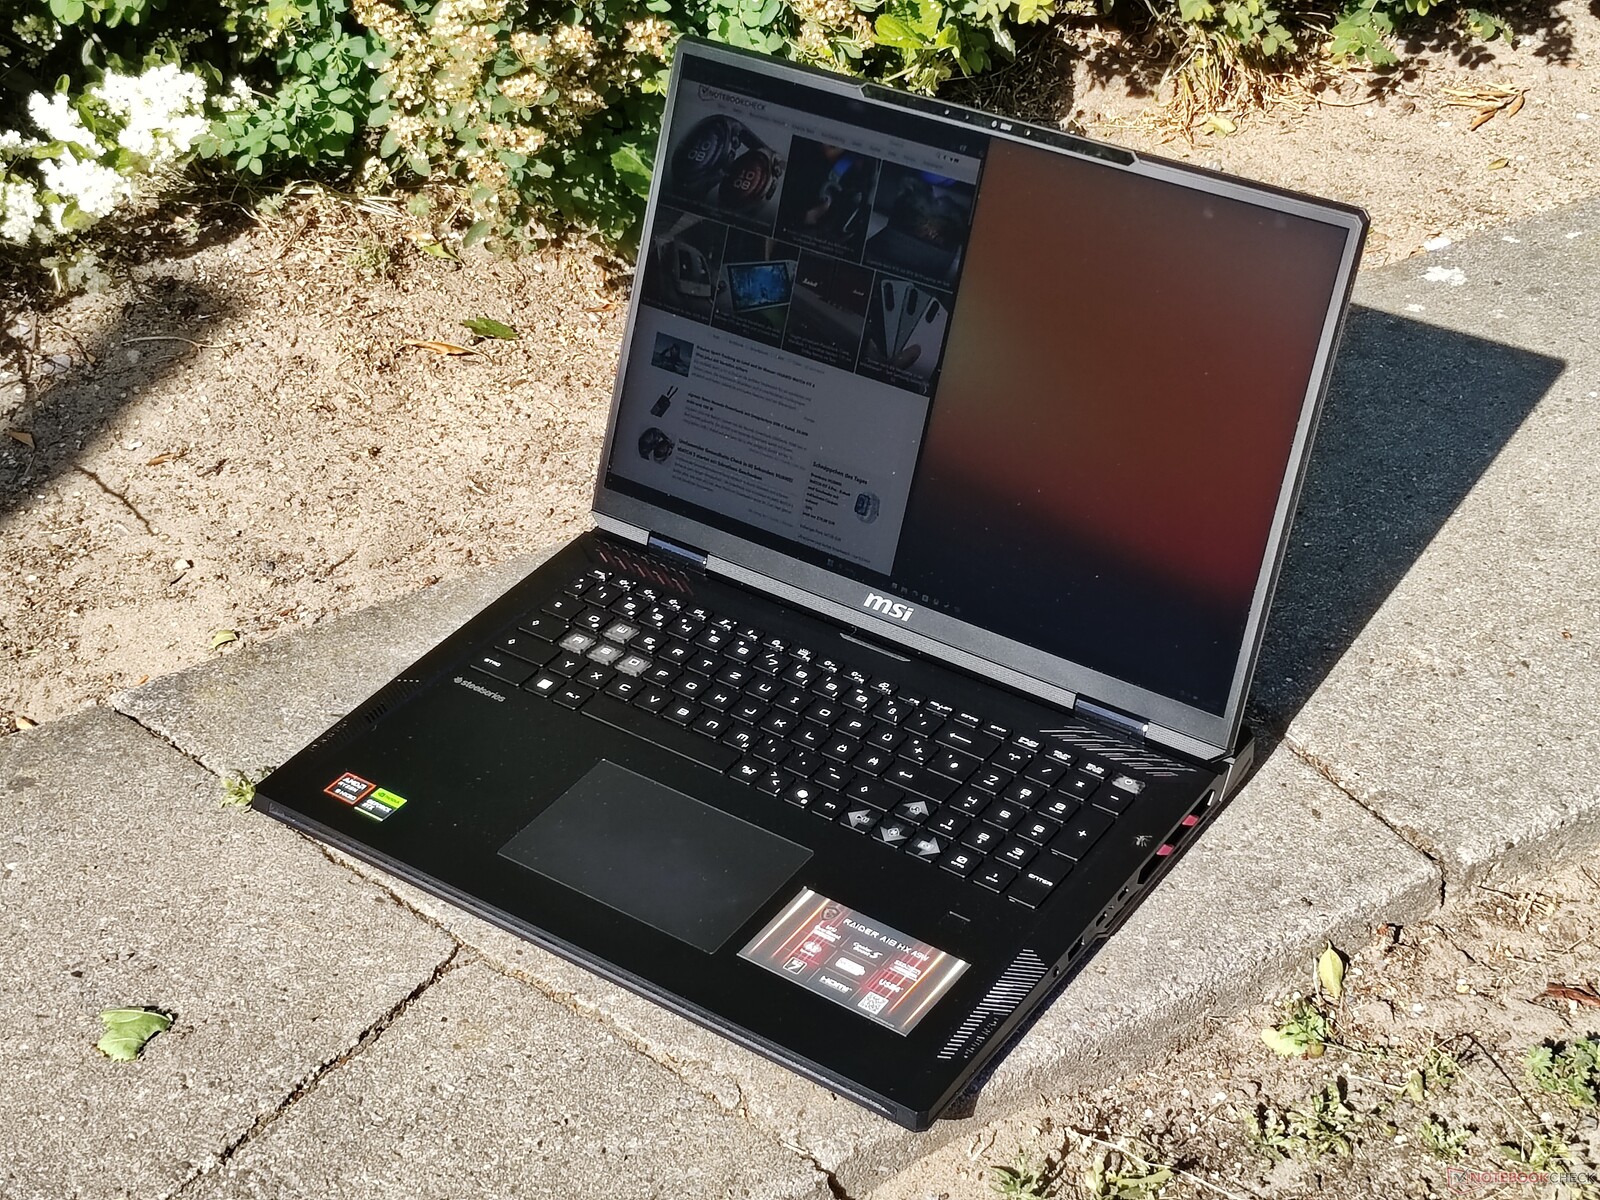
Outside, the screen is certainly usable, even in SDR mode. The high brightness and matte surface make for a great combination.
Display Response Times
| ↔ Response Time Black to White | ||
|---|---|---|
| 15.1 ms ... rise ↗ and fall ↘ combined | ↗ 8.6 ms rise | 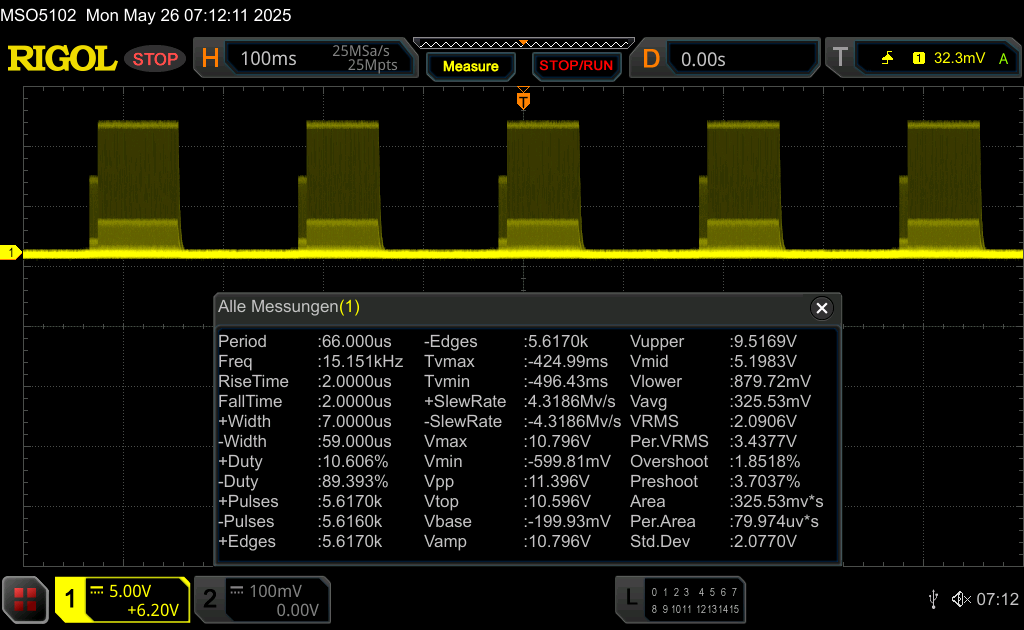 |
| ↘ 6.6 ms fall | ||
| The screen shows good response rates in our tests, but may be too slow for competitive gamers. In comparison, all tested devices range from 0.1 (minimum) to 240 (maximum) ms. » 36 % of all devices are better. This means that the measured response time is better than the average of all tested devices (19.8 ms). | ||
| ↔ Response Time 50% Grey to 80% Grey | ||
| 23 ms ... rise ↗ and fall ↘ combined | ↗ 12.4 ms rise | 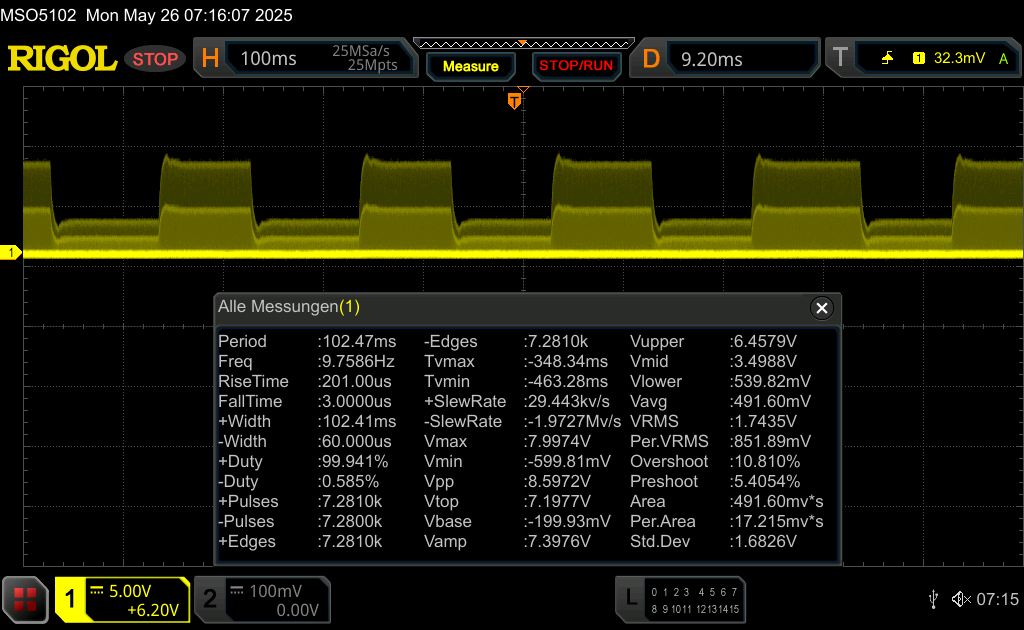 |
| ↘ 10.6 ms fall | ||
| The screen shows good response rates in our tests, but may be too slow for competitive gamers. In comparison, all tested devices range from 0.165 (minimum) to 636 (maximum) ms. » 34 % of all devices are better. This means that the measured response time is better than the average of all tested devices (31 ms). | ||
Screen Flickering / PWM (Pulse-Width Modulation)
| Screen flickering / PWM detected | 15203 Hz Amplitude: 100 % | 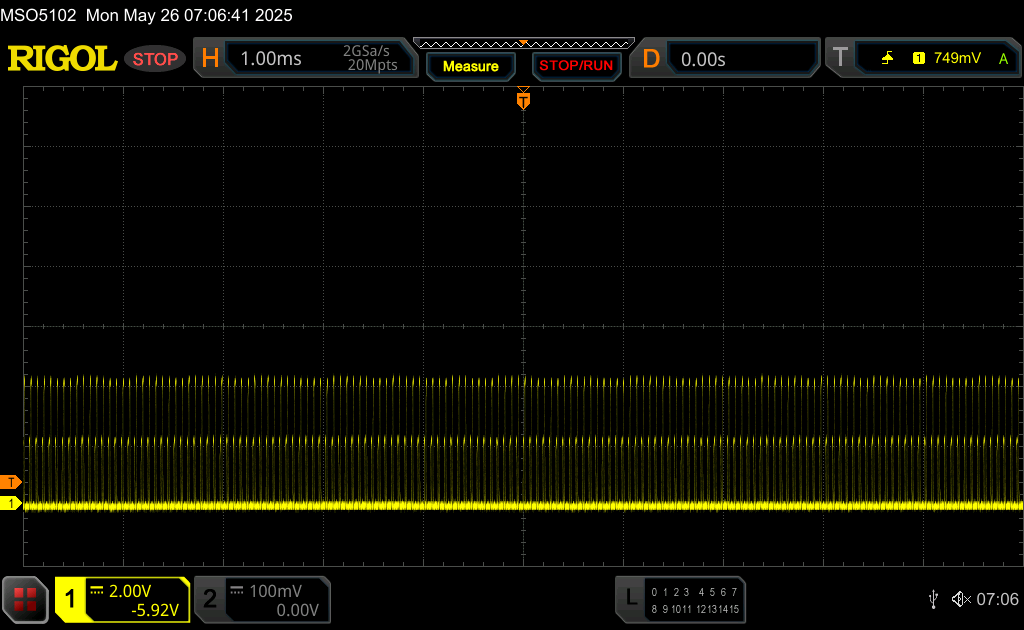 | |
The display backlight flickers at 15203 Hz (worst case, e.g., utilizing PWM) . The frequency of 15203 Hz is quite high, so most users sensitive to PWM should not notice any flickering. In comparison: 52 % of all tested devices do not use PWM to dim the display. If PWM was detected, an average of 7753 (minimum: 5 - maximum: 343500) Hz was measured. | |||


Performance: AMD Fire Range equals Intel Arrow Lake HX, at lower power consumption
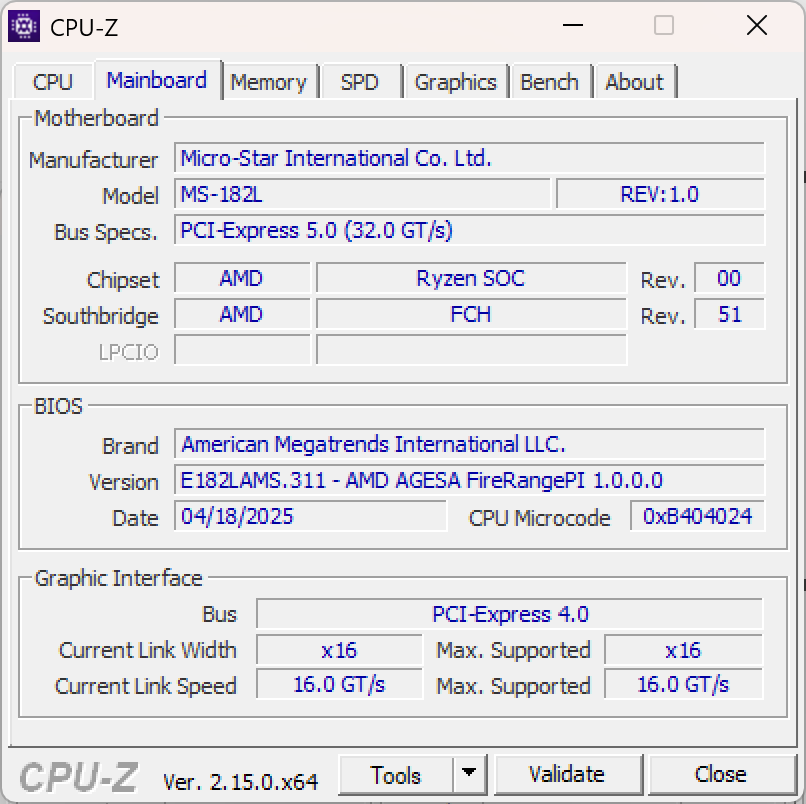
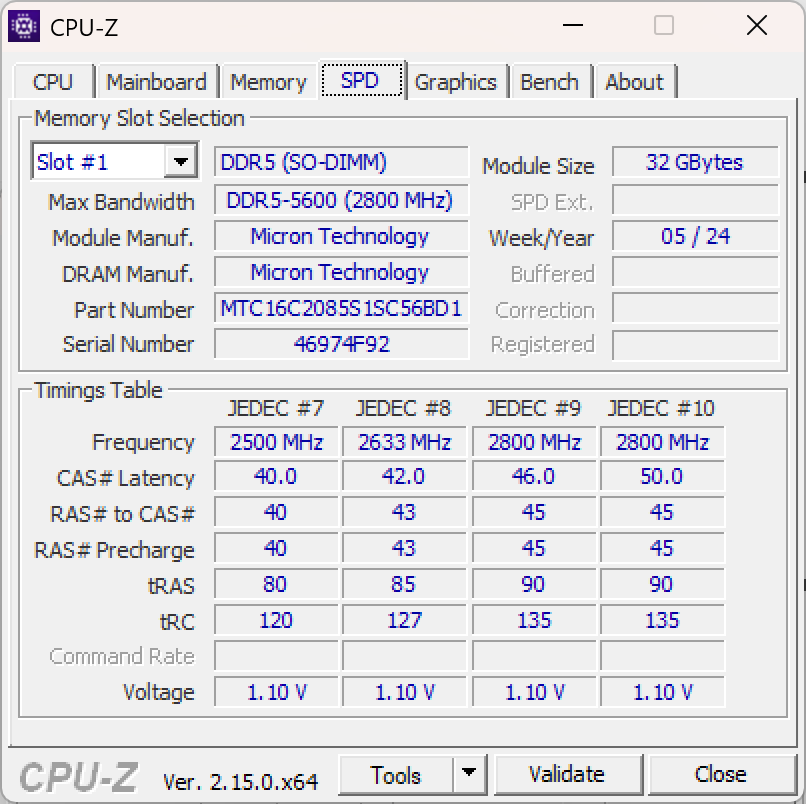
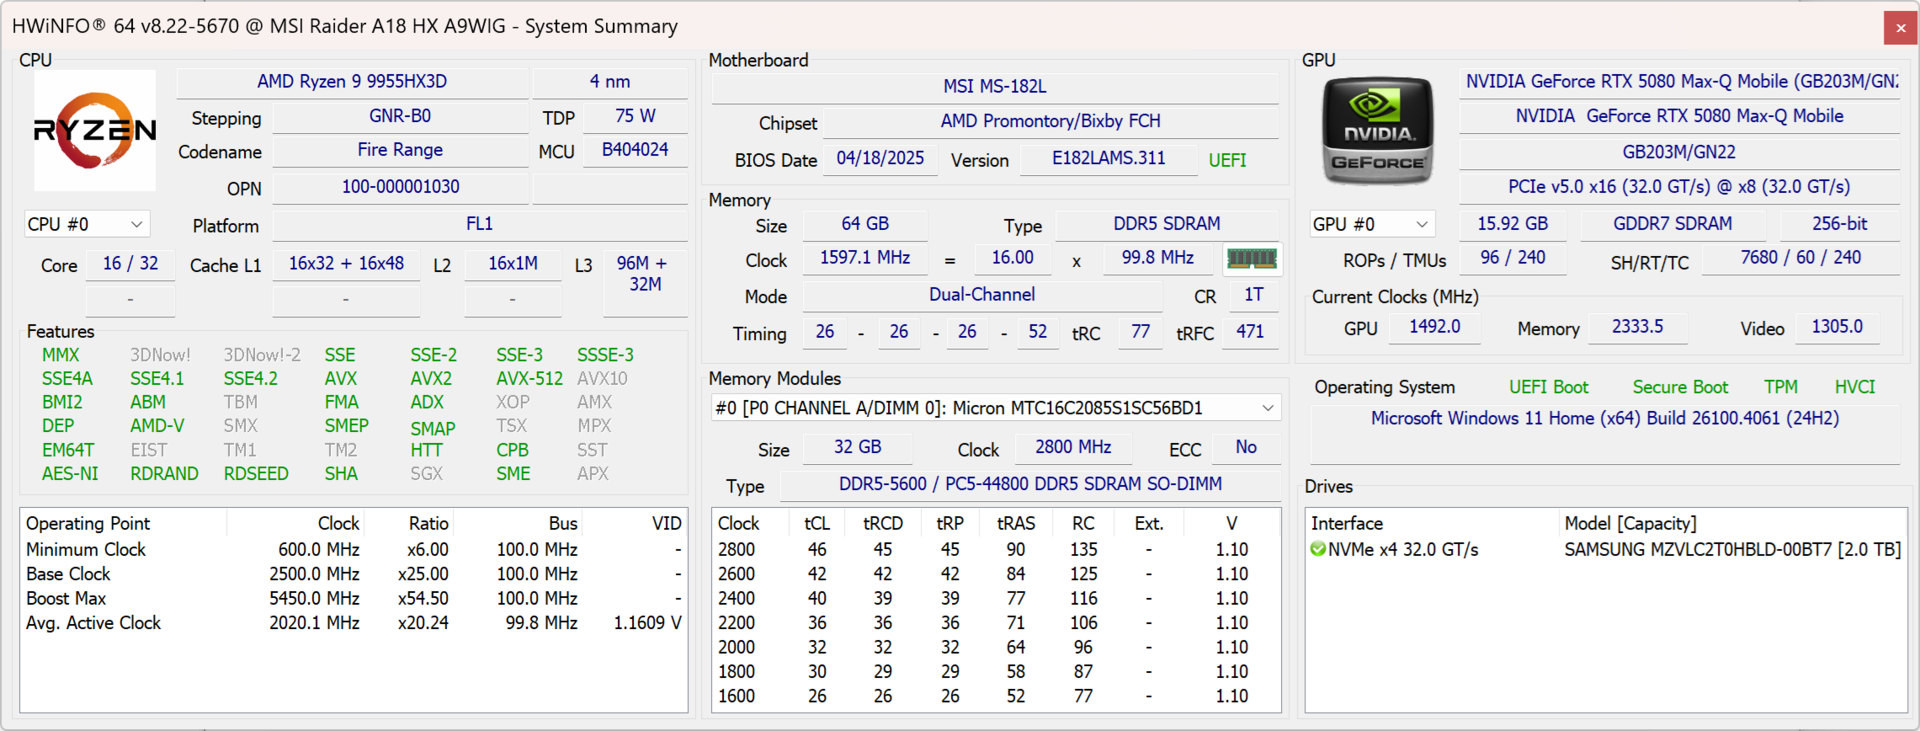
The AMD version of the MSI Raider A18 HX is only available with the AMD Ryzen 9 9955HX3D. Available dedicated GPUs include the Nvidia GeForce RTX 5080 and GeForce RTX 5090. In terms of memory, there are two SO-DIMM sockets, offering up to 96 GB of DDR5-5600 RAM. There is a single M.2 2280 slot for an SSD, which MSI offers with up to 2 TB of capacity.

Testing Conditions
Power profiles can be managed with the MSI Center app. The following profiles are available, which influence the CPU power limits (PL1 / sustained CPU power consumption, PL2 / maximum CPU power consumption) as well as GPU TGP (total graphics power):
- ECO-Silent: PL1 30 W / PL2 30 W | TGP 85 W
- Balanced: PL1 72 W / PL2 72 W | TGP 105 W
- Extreme Performance: PL1 130 W / PL2 130 W | TGP 165 W
We performed all benchmarks in the "Extreme performance" mode.
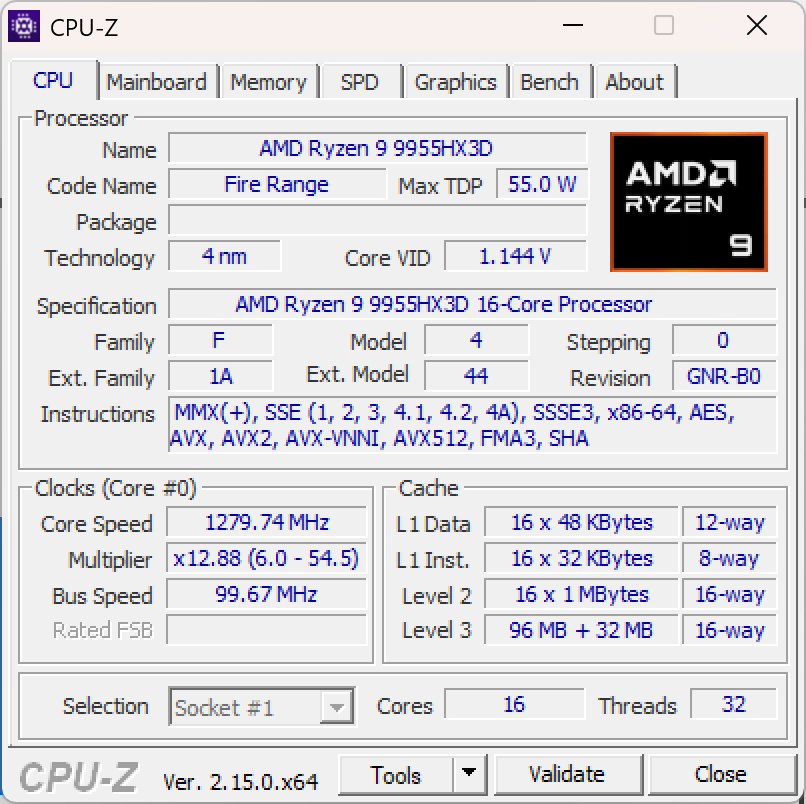
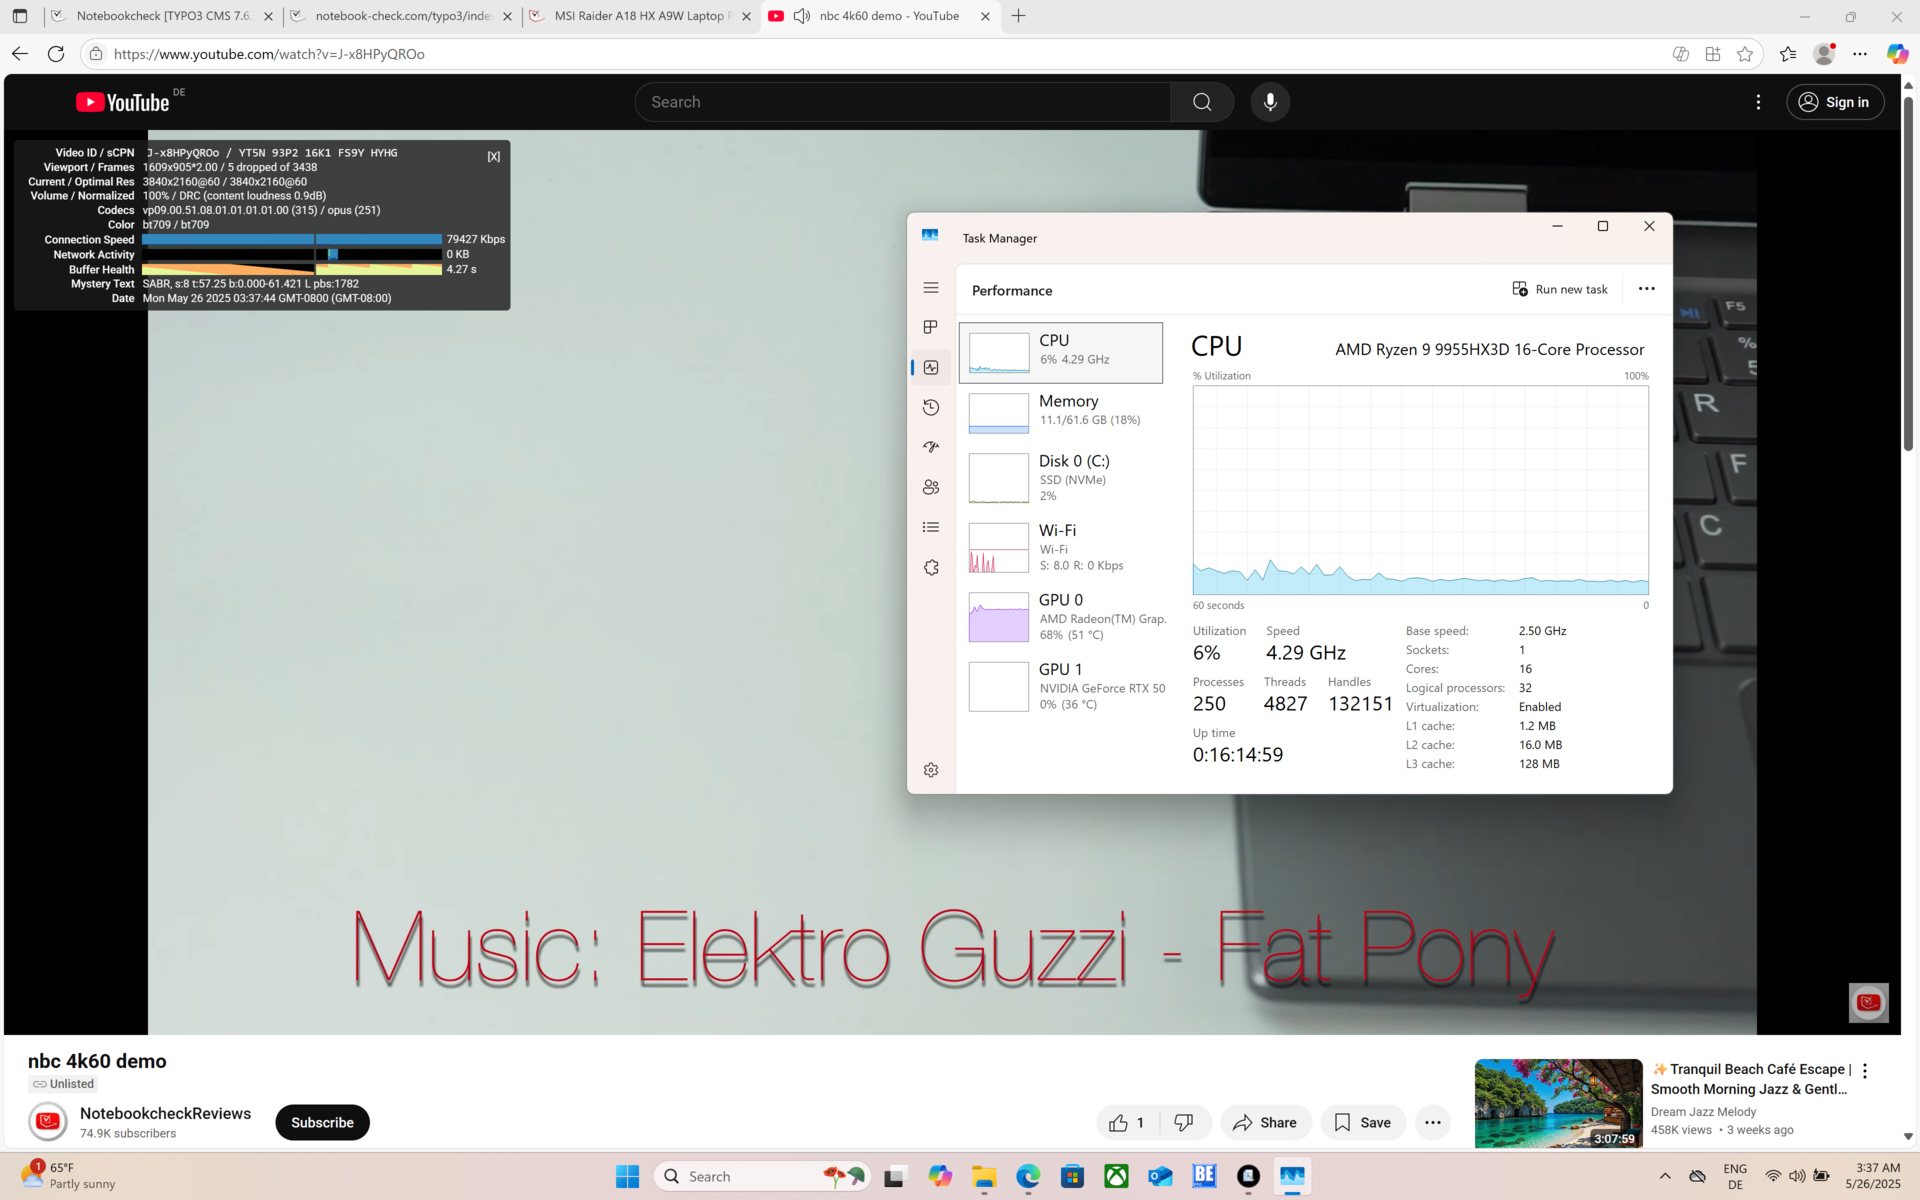
Processor
The AMD Ryzen 9 9955HX3D is the most powerful AMD processor for laptops. The "Fire Range" CPU has sixteen Zen5 cores with clock rates from 2.5 to 5.4 GHz. Its TDP sits at 55 W, this CPU is made for workstations and gaming laptops. For further comparisons, we recommend using our CPU comparison list.
In our testing, the MSI Raider A18 HX matched the performance of the Asus Strix Scar 18 with the Intel Core Ultra 9 275HX, but while the Asus ran at a TDP of 150 W, the MSI delivered this performance with just 130 W. If you want ultimate CPU performance in a laptop, the MSI Raider A18 can certainly be a contender.
This however only applies when an AC adapter is connected. On battery power, the performance is cut in half (19278 points in CB23 multicore, minus 102 percent).
Cinebench R15 Multi Loop
Cinebench R23: Multi Core | Single Core
Cinebench R20: CPU (Multi Core) | CPU (Single Core)
Cinebench R15: CPU Multi 64Bit | CPU Single 64Bit
Blender: v2.79 BMW27 CPU
7-Zip 18.03: 7z b 4 | 7z b 4 -mmt1
Geekbench 6.7: Multi-Core | Single-Core
Geekbench 5.5: Multi-Core | Single-Core
HWBOT x265 Benchmark v2.2: 4k Preset
LibreOffice : 20 Documents To PDF
R Benchmark 2.5: Overall mean
| CPU Performance rating | |
| Average AMD Ryzen 9 9955HX3D | |
| Asus Strix Scar 18 G835LX | |
| MSI Raider A18 HX A9WIG-080 | |
| Aorus Master 18 AM8H | |
| MSI Raider 18 HX A14V | |
| Medion Erazer Beast 18 X1 MD62731 | |
| Average of class Gaming | |
| Cinebench R23 / Multi Core | |
| Average AMD Ryzen 9 9955HX3D (38864 - 39266, n=2) | |
| Asus Strix Scar 18 G835LX | |
| MSI Raider A18 HX A9WIG-080 | |
| Aorus Master 18 AM8H | |
| Medion Erazer Beast 18 X1 MD62731 | |
| MSI Raider 18 HX A14V | |
| Average of class Gaming (10488 - 40970, n=107, last 2 years) | |
| Cinebench R23 / Single Core | |
| Medion Erazer Beast 18 X1 MD62731 | |
| Asus Strix Scar 18 G835LX | |
| MSI Raider 18 HX A14V | |
| Average AMD Ryzen 9 9955HX3D (2165 - 2179, n=2) | |
| MSI Raider A18 HX A9WIG-080 | |
| Aorus Master 18 AM8H | |
| Average of class Gaming (1166 - 2356, n=107, last 2 years) | |
| Cinebench R20 / CPU (Multi Core) | |
| Asus Strix Scar 18 G835LX | |
| Average AMD Ryzen 9 9955HX3D (15146 - 15177, n=2) | |
| MSI Raider A18 HX A9WIG-080 | |
| Aorus Master 18 AM8H | |
| Medion Erazer Beast 18 X1 MD62731 | |
| MSI Raider 18 HX A14V | |
| Average of class Gaming (4029 - 16108, n=106, last 2 years) | |
| Cinebench R20 / CPU (Single Core) | |
| Asus Strix Scar 18 G835LX | |
| Medion Erazer Beast 18 X1 MD62731 | |
| MSI Raider 18 HX A14V | |
| MSI Raider A18 HX A9WIG-080 | |
| Average AMD Ryzen 9 9955HX3D (847 - 851, n=2) | |
| Aorus Master 18 AM8H | |
| Average of class Gaming (442 - 895, n=106, last 2 years) | |
| Cinebench R15 / CPU Multi 64Bit | |
| Asus Strix Scar 18 G835LX | |
| Average AMD Ryzen 9 9955HX3D (6041 - 6044, n=2) | |
| MSI Raider A18 HX A9WIG-080 | |
| Aorus Master 18 AM8H | |
| Medion Erazer Beast 18 X1 MD62731 | |
| MSI Raider 18 HX A14V | |
| Average of class Gaming (1578 - 6271, n=105, last 2 years) | |
| Cinebench R15 / CPU Single 64Bit | |
| Asus Strix Scar 18 G835LX | |
| Medion Erazer Beast 18 X1 MD62731 | |
| Aorus Master 18 AM8H | |
| Average AMD Ryzen 9 9955HX3D (321 - 333, n=2) | |
| MSI Raider A18 HX A9WIG-080 | |
| MSI Raider 18 HX A14V | |
| Average of class Gaming (188.8 - 343, n=106, last 2 years) | |
| Blender / v2.79 BMW27 CPU | |
| Average of class Gaming (80 - 330, n=104, last 2 years) | |
| Medion Erazer Beast 18 X1 MD62731 | |
| MSI Raider 18 HX A14V | |
| Aorus Master 18 AM8H | |
| Asus Strix Scar 18 G835LX | |
| MSI Raider A18 HX A9WIG-080 | |
| Average AMD Ryzen 9 9955HX3D (80 - 80, n=2) | |
| 7-Zip 18.03 / 7z b 4 | |
| Average AMD Ryzen 9 9955HX3D (145803 - 148086, n=2) | |
| MSI Raider A18 HX A9WIG-080 | |
| Asus Strix Scar 18 G835LX | |
| MSI Raider 18 HX A14V | |
| Aorus Master 18 AM8H | |
| Medion Erazer Beast 18 X1 MD62731 | |
| Average of class Gaming (33491 - 148086, n=105, last 2 years) | |
| 7-Zip 18.03 / 7z b 4 -mmt1 | |
| Average AMD Ryzen 9 9955HX3D (7151 - 7300, n=2) | |
| MSI Raider A18 HX A9WIG-080 | |
| Medion Erazer Beast 18 X1 MD62731 | |
| Asus Strix Scar 18 G835LX | |
| Aorus Master 18 AM8H | |
| MSI Raider 18 HX A14V | |
| Average of class Gaming (4199 - 7436, n=105, last 2 years) | |
| Geekbench 6.7 / Multi-Core | |
| Asus Strix Scar 18 G835LX | |
| Average AMD Ryzen 9 9955HX3D (19788 - 20551, n=4) | |
| MSI Raider A18 HX A9WIG-080 | |
| Aorus Master 18 AM8H | |
| Medion Erazer Beast 18 X1 MD62731 | |
| MSI Raider 18 HX A14V | |
| Average of class Gaming (6625 - 22104, n=106, last 2 years) | |
| Geekbench 6.7 / Single-Core | |
| Average AMD Ryzen 9 9955HX3D (3146 - 3237, n=4) | |
| Asus Strix Scar 18 G835LX | |
| MSI Raider A18 HX A9WIG-080 | |
| Medion Erazer Beast 18 X1 MD62731 | |
| Aorus Master 18 AM8H | |
| MSI Raider 18 HX A14V | |
| Average of class Gaming (1490 - 3259, n=106, last 2 years) | |
| Geekbench 5.5 / Multi-Core | |
| Asus Strix Scar 18 G835LX | |
| Average AMD Ryzen 9 9955HX3D (23468 - 23669, n=2) | |
| MSI Raider A18 HX A9WIG-080 | |
| Aorus Master 18 AM8H | |
| MSI Raider 18 HX A14V | |
| Medion Erazer Beast 18 X1 MD62731 | |
| Average of class Gaming (6460 - 27010, n=105, last 2 years) | |
| Geekbench 5.5 / Single-Core | |
| MSI Raider A18 HX A9WIG-080 | |
| Average AMD Ryzen 9 9955HX3D (2381 - 2401, n=2) | |
| Asus Strix Scar 18 G835LX | |
| Medion Erazer Beast 18 X1 MD62731 | |
| Aorus Master 18 AM8H | |
| MSI Raider 18 HX A14V | |
| Average of class Gaming (986 - 2474, n=105, last 2 years) | |
| HWBOT x265 Benchmark v2.2 / 4k Preset | |
| MSI Raider A18 HX A9WIG-080 | |
| Average AMD Ryzen 9 9955HX3D (42.3 - 42.7, n=2) | |
| Asus Strix Scar 18 G835LX | |
| Aorus Master 18 AM8H | |
| MSI Raider 18 HX A14V | |
| Medion Erazer Beast 18 X1 MD62731 | |
| Average of class Gaming (11.5 - 44.3, n=105, last 2 years) | |
| LibreOffice / 20 Documents To PDF | |
| Aorus Master 18 AM8H | |
| Average of class Gaming (33.2 - 88.8, n=105, last 2 years) | |
| Medion Erazer Beast 18 X1 MD62731 | |
| Average AMD Ryzen 9 9955HX3D (44.9 - 46.6, n=2) | |
| MSI Raider A18 HX A9WIG-080 | |
| Asus Strix Scar 18 G835LX | |
| MSI Raider 18 HX A14V | |
| R Benchmark 2.5 / Overall mean | |
| Average of class Gaming (0.3439 - 0.759, n=106, last 2 years) | |
| Aorus Master 18 AM8H | |
| Medion Erazer Beast 18 X1 MD62731 | |
| Asus Strix Scar 18 G835LX | |
| MSI Raider 18 HX A14V | |
| MSI Raider A18 HX A9WIG-080 | |
| Average AMD Ryzen 9 9955HX3D (0.3552 - 0.3677, n=2) | |
* ... smaller is better
AIDA64: FP32 Ray-Trace | FPU Julia | CPU SHA3 | CPU Queen | FPU SinJulia | FPU Mandel | CPU AES | CPU ZLib | FP64 Ray-Trace | CPU PhotoWorxx
| Performance rating | |
| MSI Raider A18 HX A9WIG-080 | |
| Average AMD Ryzen 9 9955HX3D | |
| Asus Strix Scar 18 G835LX | |
| Aorus Master 18 AM8H | |
| MSI Raider 18 HX A14V | |
| Medion Erazer Beast 18 X1 MD62731 | |
| Average of class Gaming | |
| AIDA64 / FP32 Ray-Trace | |
| MSI Raider A18 HX A9WIG-080 | |
| Average AMD Ryzen 9 9955HX3D (80619 - 84943, n=2) | |
| Asus Strix Scar 18 G835LX | |
| Aorus Master 18 AM8H | |
| Average of class Gaming (10227 - 85542, n=104, last 2 years) | |
| Medion Erazer Beast 18 X1 MD62731 | |
| MSI Raider 18 HX A14V | |
| AIDA64 / FPU Julia | |
| MSI Raider A18 HX A9WIG-080 | |
| Average AMD Ryzen 9 9955HX3D (230738 - 238426, n=2) | |
| Asus Strix Scar 18 G835LX | |
| Aorus Master 18 AM8H | |
| Medion Erazer Beast 18 X1 MD62731 | |
| MSI Raider 18 HX A14V | |
| Average of class Gaming (51376 - 238426, n=104, last 2 years) | |
| AIDA64 / CPU SHA3 | |
| MSI Raider A18 HX A9WIG-080 | |
| Average AMD Ryzen 9 9955HX3D (9656 - 9750, n=2) | |
| Asus Strix Scar 18 G835LX | |
| Aorus Master 18 AM8H | |
| Medion Erazer Beast 18 X1 MD62731 | |
| MSI Raider 18 HX A14V | |
| Average of class Gaming (2180 - 9817, n=104, last 2 years) | |
| AIDA64 / CPU Queen | |
| Average AMD Ryzen 9 9955HX3D (171718 - 173351, n=2) | |
| MSI Raider A18 HX A9WIG-080 | |
| MSI Raider 18 HX A14V | |
| Asus Strix Scar 18 G835LX | |
| Aorus Master 18 AM8H | |
| Average of class Gaming (49785 - 173351, n=91, last 2 years) | |
| Medion Erazer Beast 18 X1 MD62731 | |
| AIDA64 / FPU SinJulia | |
| MSI Raider A18 HX A9WIG-080 | |
| Average AMD Ryzen 9 9955HX3D (32989 - 33636, n=2) | |
| MSI Raider 18 HX A14V | |
| Average of class Gaming (4424 - 33636, n=104, last 2 years) | |
| Asus Strix Scar 18 G835LX | |
| Aorus Master 18 AM8H | |
| Medion Erazer Beast 18 X1 MD62731 | |
| AIDA64 / FPU Mandel | |
| MSI Raider A18 HX A9WIG-080 | |
| Average AMD Ryzen 9 9955HX3D (122088 - 126658, n=2) | |
| Asus Strix Scar 18 G835LX | |
| Aorus Master 18 AM8H | |
| Medion Erazer Beast 18 X1 MD62731 | |
| Average of class Gaming (25115 - 128721, n=104, last 2 years) | |
| MSI Raider 18 HX A14V | |
| AIDA64 / CPU AES | |
| MSI Raider A18 HX A9WIG-080 | |
| Average AMD Ryzen 9 9955HX3D (161913 - 163423, n=2) | |
| Asus Strix Scar 18 G835LX | |
| MSI Raider 18 HX A14V | |
| Aorus Master 18 AM8H | |
| Medion Erazer Beast 18 X1 MD62731 | |
| Average of class Gaming (39258 - 247074, n=104, last 2 years) | |
| AIDA64 / CPU ZLib | |
| MSI Raider A18 HX A9WIG-080 | |
| Average AMD Ryzen 9 9955HX3D (2497 - 2517, n=2) | |
| Asus Strix Scar 18 G835LX | |
| MSI Raider 18 HX A14V | |
| Aorus Master 18 AM8H | |
| Medion Erazer Beast 18 X1 MD62731 | |
| Average of class Gaming (574 - 2531, n=104, last 2 years) | |
| AIDA64 / FP64 Ray-Trace | |
| MSI Raider A18 HX A9WIG-080 | |
| Average AMD Ryzen 9 9955HX3D (42676 - 45384, n=2) | |
| Asus Strix Scar 18 G835LX | |
| Aorus Master 18 AM8H | |
| Average of class Gaming (5509 - 45446, n=104, last 2 years) | |
| MSI Raider 18 HX A14V | |
| Medion Erazer Beast 18 X1 MD62731 | |
| AIDA64 / CPU PhotoWorxx | |
| Asus Strix Scar 18 G835LX | |
| Aorus Master 18 AM8H | |
| Medion Erazer Beast 18 X1 MD62731 | |
| Average of class Gaming (12271 - 89891, n=104, last 2 years) | |
| Average AMD Ryzen 9 9955HX3D (38765 - 43032, n=2) | |
| MSI Raider 18 HX A14V | |
| MSI Raider A18 HX A9WIG-080 | |
System Performance
As expected, system performance benchmarks are excellent, and the MSI laptop flies in everyday use.
PCMark 10: Score | Essentials | Productivity | Digital Content Creation
CrossMark: Overall | Productivity | Creativity | Responsiveness
WebXPRT 3: Overall
WebXPRT 4: Overall
Mozilla Kraken 1.1: Total
| Performance rating | |
| MSI Raider A18 HX A9WIG-080 | |
| Average AMD Ryzen 9 9955HX3D, NVIDIA GeForce RTX 5080 Laptop | |
| Aorus Master 18 AM8H | |
| MSI Raider 18 HX A14V | |
| Asus Strix Scar 18 G835LX | |
| Medion Erazer Beast 18 X1 MD62731 | |
| Average of class Gaming | |
| PCMark 10 / Score | |
| MSI Raider 18 HX A14V | |
| MSI Raider A18 HX A9WIG-080 | |
| Average AMD Ryzen 9 9955HX3D, NVIDIA GeForce RTX 5080 Laptop (n=1) | |
| Asus Strix Scar 18 G835LX | |
| Aorus Master 18 AM8H | |
| Medion Erazer Beast 18 X1 MD62731 | |
| Average of class Gaming (5828 - 11574, n=93, last 2 years) | |
| PCMark 10 / Essentials | |
| MSI Raider 18 HX A14V | |
| MSI Raider A18 HX A9WIG-080 | |
| Average AMD Ryzen 9 9955HX3D, NVIDIA GeForce RTX 5080 Laptop (n=1) | |
| Aorus Master 18 AM8H | |
| Asus Strix Scar 18 G835LX | |
| Average of class Gaming (8810 - 11935, n=97, last 2 years) | |
| Medion Erazer Beast 18 X1 MD62731 | |
| PCMark 10 / Productivity | |
| MSI Raider 18 HX A14V | |
| Average of class Gaming (6845 - 21327, n=95, last 2 years) | |
| MSI Raider A18 HX A9WIG-080 | |
| Average AMD Ryzen 9 9955HX3D, NVIDIA GeForce RTX 5080 Laptop (n=1) | |
| Medion Erazer Beast 18 X1 MD62731 | |
| Asus Strix Scar 18 G835LX | |
| Aorus Master 18 AM8H | |
| PCMark 10 / Digital Content Creation | |
| Asus Strix Scar 18 G835LX | |
| Aorus Master 18 AM8H | |
| MSI Raider 18 HX A14V | |
| Medion Erazer Beast 18 X1 MD62731 | |
| MSI Raider A18 HX A9WIG-080 | |
| Average AMD Ryzen 9 9955HX3D, NVIDIA GeForce RTX 5080 Laptop (n=1) | |
| Average of class Gaming (7602 - 19657, n=95, last 2 years) | |
| CrossMark / Overall | |
| Aorus Master 18 AM8H | |
| MSI Raider A18 HX A9WIG-080 | |
| Average AMD Ryzen 9 9955HX3D, NVIDIA GeForce RTX 5080 Laptop (n=1) | |
| Asus Strix Scar 18 G835LX | |
| MSI Raider 18 HX A14V | |
| Average of class Gaming (1366 - 2409, n=93, last 2 years) | |
| Medion Erazer Beast 18 X1 MD62731 | |
| CrossMark / Productivity | |
| Aorus Master 18 AM8H | |
| Asus Strix Scar 18 G835LX | |
| MSI Raider A18 HX A9WIG-080 | |
| Average AMD Ryzen 9 9955HX3D, NVIDIA GeForce RTX 5080 Laptop (n=1) | |
| MSI Raider 18 HX A14V | |
| Average of class Gaming (1386 - 2254, n=93, last 2 years) | |
| Medion Erazer Beast 18 X1 MD62731 | |
| CrossMark / Creativity | |
| MSI Raider A18 HX A9WIG-080 | |
| Average AMD Ryzen 9 9955HX3D, NVIDIA GeForce RTX 5080 Laptop (n=1) | |
| Asus Strix Scar 18 G835LX | |
| Aorus Master 18 AM8H | |
| MSI Raider 18 HX A14V | |
| Average of class Gaming (1343 - 2729, n=93, last 2 years) | |
| Medion Erazer Beast 18 X1 MD62731 | |
| CrossMark / Responsiveness | |
| Aorus Master 18 AM8H | |
| MSI Raider 18 HX A14V | |
| MSI Raider A18 HX A9WIG-080 | |
| Average AMD Ryzen 9 9955HX3D, NVIDIA GeForce RTX 5080 Laptop (n=1) | |
| Asus Strix Scar 18 G835LX | |
| Average of class Gaming (1226 - 2334, n=93, last 2 years) | |
| Medion Erazer Beast 18 X1 MD62731 | |
| WebXPRT 3 / Overall | |
| MSI Raider A18 HX A9WIG-080 | |
| Average AMD Ryzen 9 9955HX3D, NVIDIA GeForce RTX 5080 Laptop (n=1) | |
| Asus Strix Scar 18 G835LX | |
| Medion Erazer Beast 18 X1 MD62731 | |
| MSI Raider 18 HX A14V | |
| Average of class Gaming (220 - 532, n=98, last 2 years) | |
| Aorus Master 18 AM8H | |
| WebXPRT 4 / Overall | |
| Asus Strix Scar 18 G835LX | |
| MSI Raider A18 HX A9WIG-080 | |
| Average AMD Ryzen 9 9955HX3D, NVIDIA GeForce RTX 5080 Laptop (n=1) | |
| Medion Erazer Beast 18 X1 MD62731 | |
| MSI Raider 18 HX A14V | |
| Aorus Master 18 AM8H | |
| Average of class Gaming (165 - 354, n=98, last 2 years) | |
| Mozilla Kraken 1.1 / Total | |
| Average of class Gaming (391 - 590, n=101, last 2 years) | |
| MSI Raider 18 HX A14V | |
| Aorus Master 18 AM8H | |
| Medion Erazer Beast 18 X1 MD62731 | |
| Asus Strix Scar 18 G835LX | |
| MSI Raider A18 HX A9WIG-080 | |
| Average AMD Ryzen 9 9955HX3D, NVIDIA GeForce RTX 5080 Laptop (n=1) | |
* ... smaller is better
| PCMark 10 Score | 8859 points | |
Help | ||
| AIDA64 / Memory Copy | |
| Asus Strix Scar 18 G835LX | |
| Medion Erazer Beast 18 X1 MD62731 | |
| Aorus Master 18 AM8H | |
| Average of class Gaming (21750 - 129946, n=104, last 2 years) | |
| MSI Raider 18 HX A14V | |
| Average AMD Ryzen 9 9955HX3D (56383 - 61533, n=2) | |
| MSI Raider A18 HX A9WIG-080 | |
| AIDA64 / Memory Read | |
| Medion Erazer Beast 18 X1 MD62731 | |
| Asus Strix Scar 18 G835LX | |
| Aorus Master 18 AM8H | |
| Average of class Gaming (22956 - 118858, n=104, last 2 years) | |
| Average AMD Ryzen 9 9955HX3D (59750 - 65369, n=2) | |
| MSI Raider 18 HX A14V | |
| MSI Raider A18 HX A9WIG-080 | |
| AIDA64 / Memory Write | |
| Asus Strix Scar 18 G835LX | |
| Medion Erazer Beast 18 X1 MD62731 | |
| Average of class Gaming (22297 - 135096, n=104, last 2 years) | |
| Aorus Master 18 AM8H | |
| Average AMD Ryzen 9 9955HX3D (59506 - 72898, n=2) | |
| MSI Raider 18 HX A14V | |
| MSI Raider A18 HX A9WIG-080 | |
| AIDA64 / Memory Latency | |
| Aorus Master 18 AM8H | |
| Medion Erazer Beast 18 X1 MD62731 | |
| Asus Strix Scar 18 G835LX | |
| Average of class Gaming (75.3 - 259, n=104, last 2 years) | |
| Average AMD Ryzen 9 9955HX3D (96.1 - 103.6, n=2) | |
| MSI Raider 18 HX A14V | |
| MSI Raider A18 HX A9WIG-080 | |
* ... smaller is better
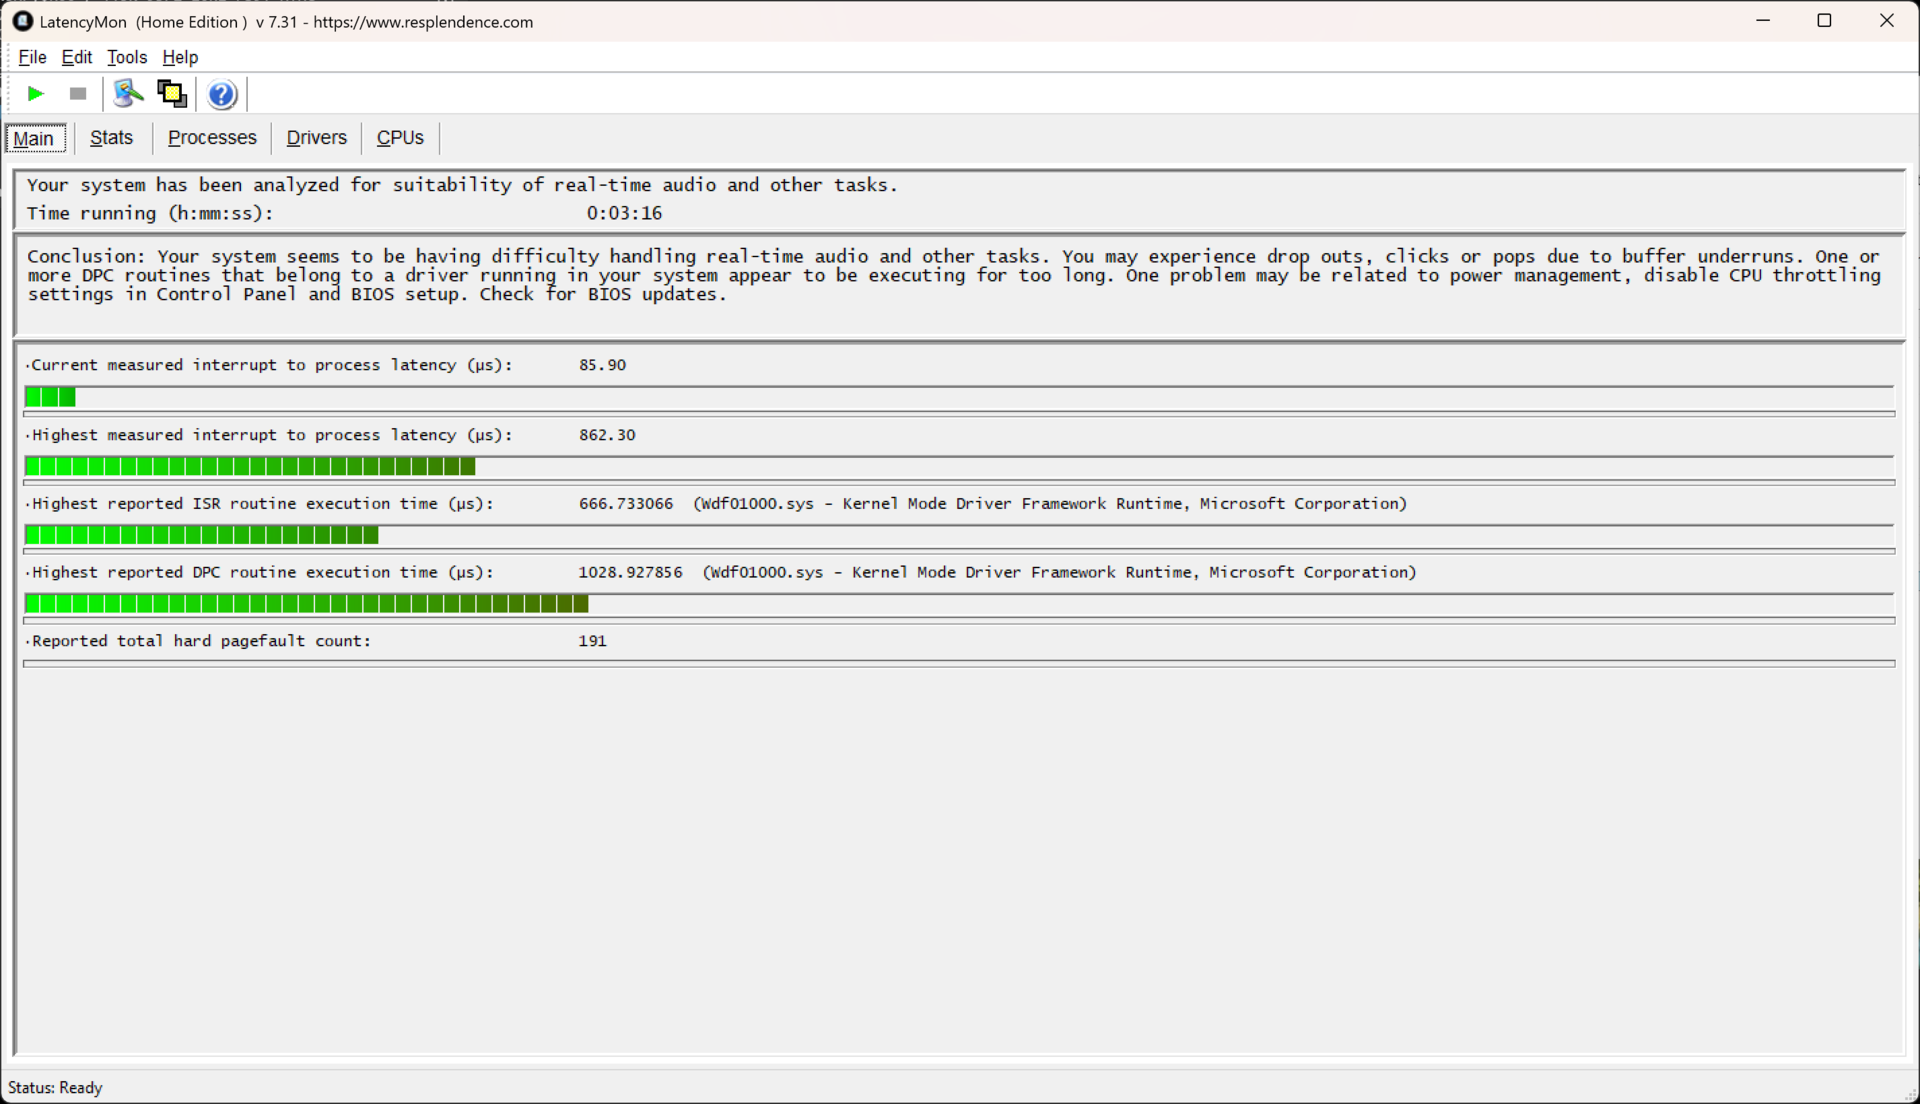
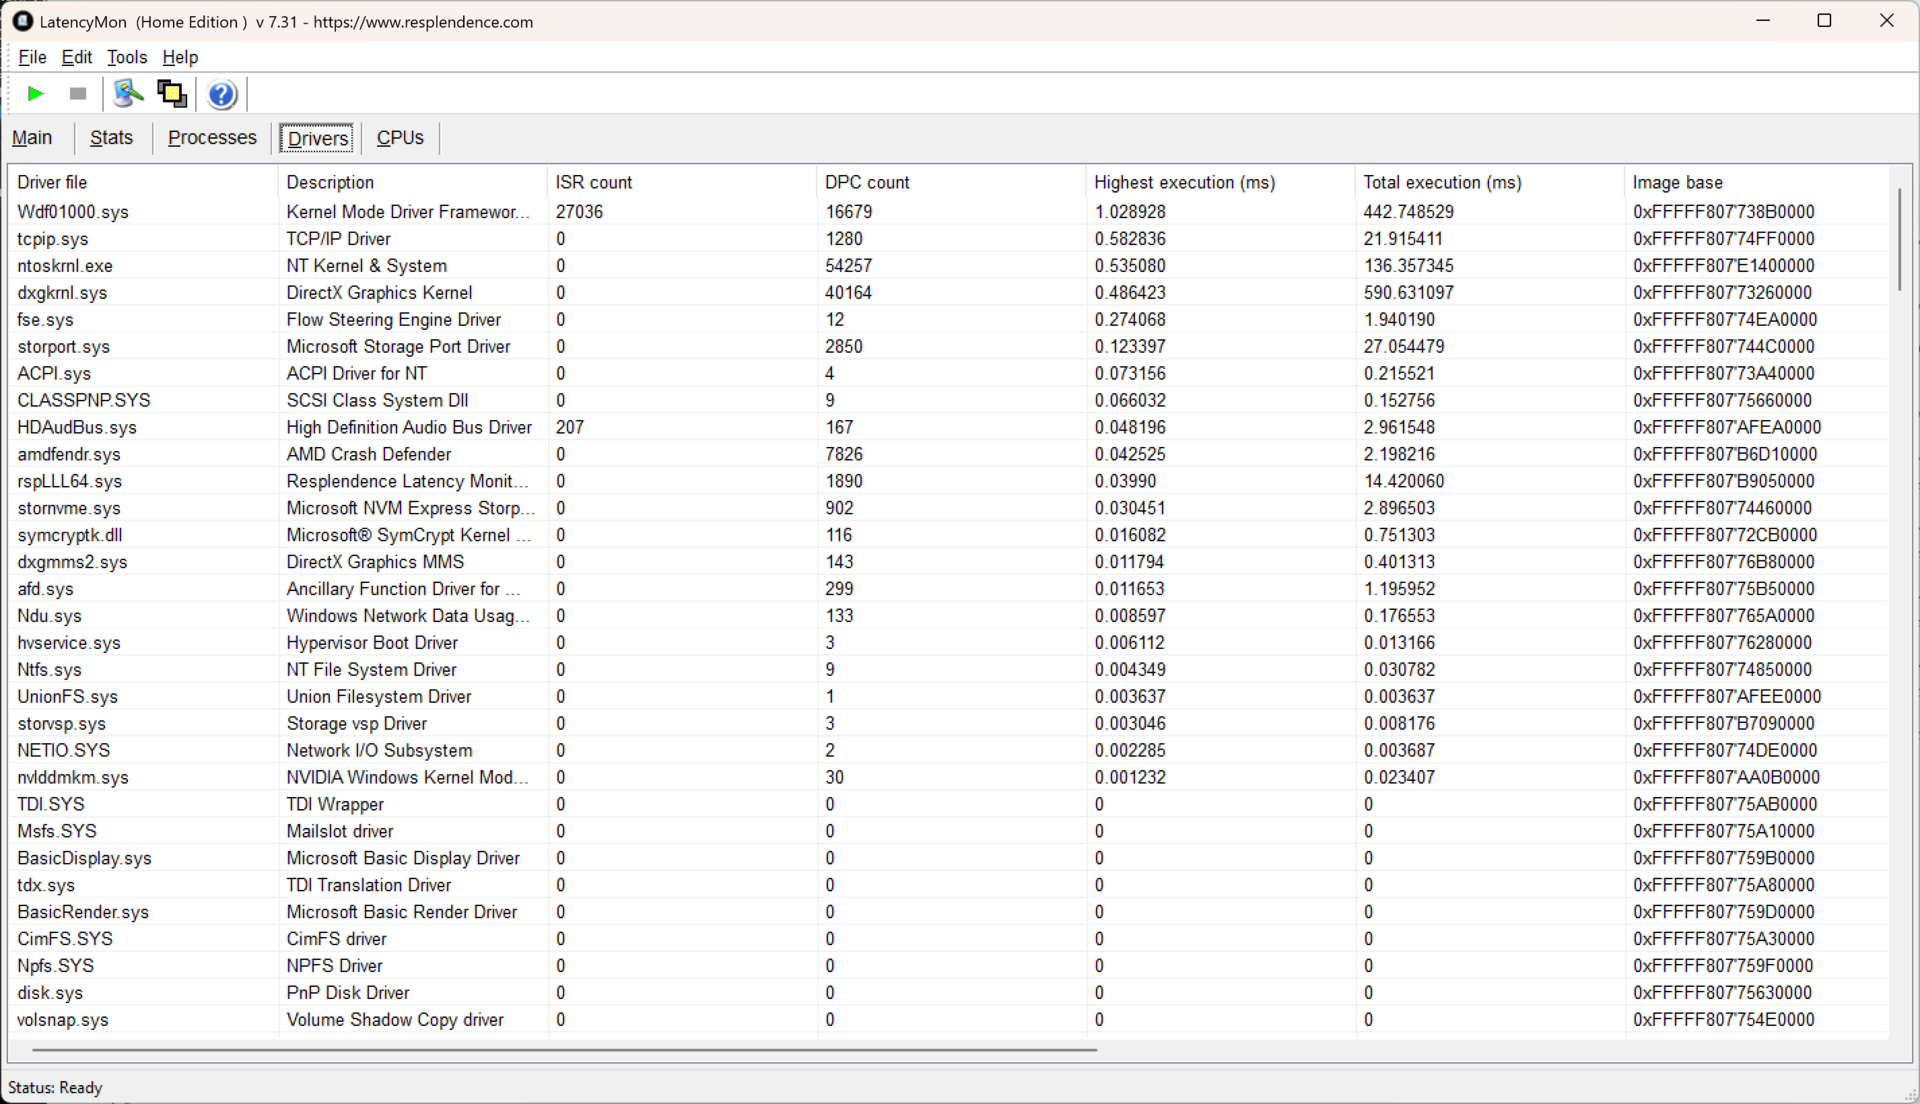
DPC Latency
There are some problems with DPC latency drop-outs on the MSI Raider A18 HX, but they might be resolved with a driver or BIOS update.
| DPC Latencies / LatencyMon - interrupt to process latency (max), Web, Youtube, Prime95 | |
| Medion Erazer Beast 18 X1 MD62731 | |
| MSI Raider 18 HX A14V | |
| Aorus Master 18 AM8H | |
| MSI Raider A18 HX A9WIG-080 | |
| Asus Strix Scar 18 G835LX | |
* ... smaller is better
Storage Devices
MSI uses a very fast NVMe PCIe 5.0 SSD, which has a capacity of 2 TB and is made by Samsung. The PM9E1 is the fastest drive in our comparison, and it does not exhibit any throttling either - thanks to MSI's competent SSD cooling solution.

* ... smaller is better
Disk Throttling: DiskSpd Read Loop, Queue Depth 8
GPU Performance
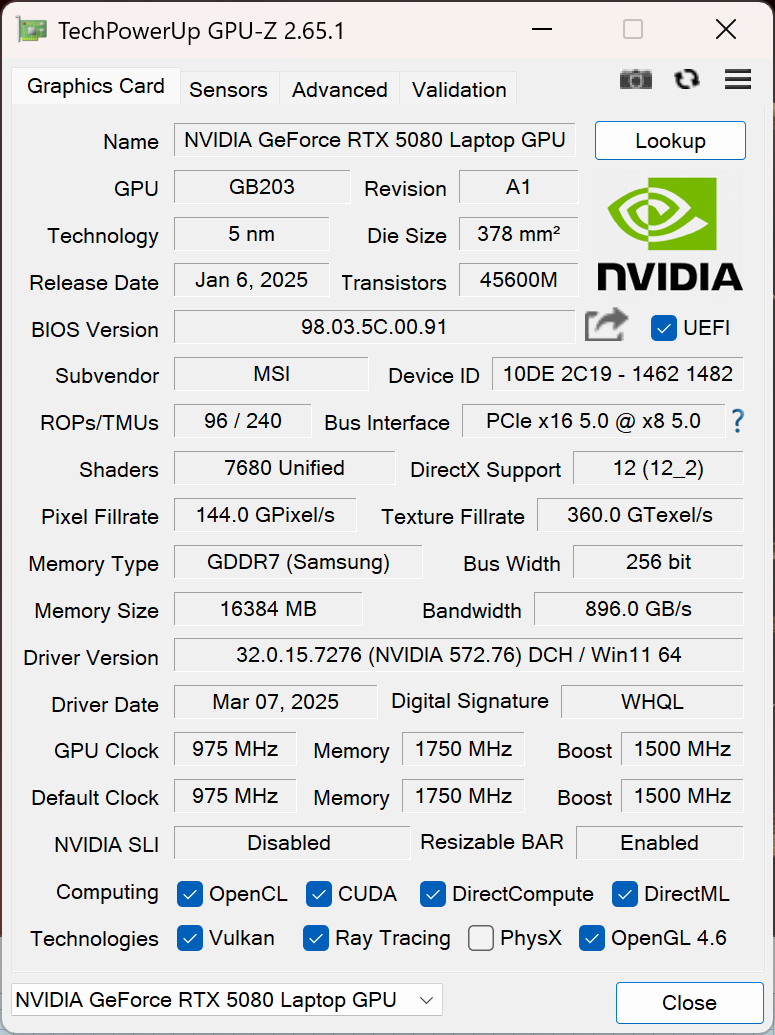
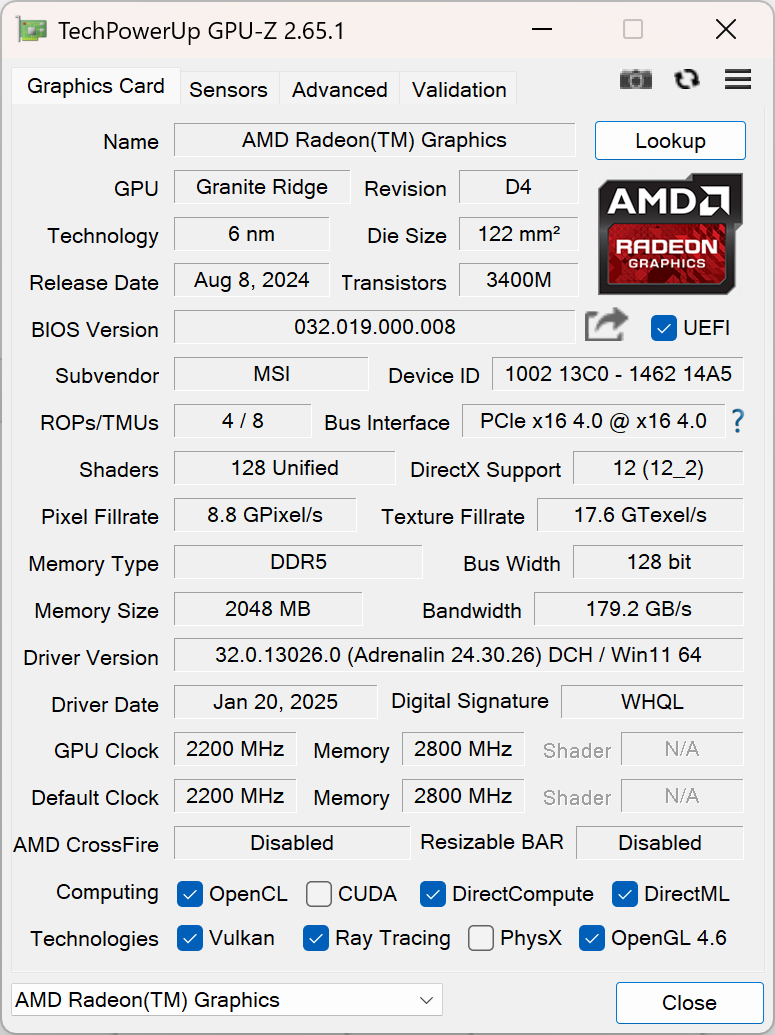
The Nvidia GeForce RTX 5080 Laptop is Nvidia's second-fastest consumer GPU of the current "Blackwell" generation. It has the same 256-Bit memory interface as the more expensive RTX 5090, but less shader-units - 8192 instead of 10496 - though at higher clock-rates of 0.98 to 2.29 GHz. Like for the CPUs, we have a GPU comparison list with more benchmark numbers.
As the benchmarks show, the differences between the RTX 5090 and 5080 are minimal when it comes to the synthetic GPU benchmarks. The RTX 5090 is maybe five percent faster, although it should be mentioned that the RTX 5080 in the Raider A18 HX is also slightly faster than the average for that GPU.
| 3DMark 11 Performance | 51993 points | |
| 3DMark Fire Strike Score | 41506 points | |
| 3DMark Time Spy Score | 19302 points | |
Help | ||
* ... smaller is better
Gaming Performance
The MSI Raider A18 HX achieves a great gaming performance. With the Nvidia GeForce RTX 5080, it even beats out the RTX 5090 equipped laptops in the comparison by a small margin. Additionally, the performance stays stable under sustained load in our Cyberpunk 2077 load test.
| Performance rating - Percent | |
| MSI Raider A18 HX A9WIG-080 | |
| Asus Strix Scar 18 G835LX | |
| Aorus Master 18 AM8H -1! | |
| MSI Raider 18 HX A14V -1! | |
| Medion Erazer Beast 18 X1 MD62731 -1! | |
| Average of class Gaming | |
| Baldur's Gate 3 - 1920x1080 Ultra Preset AA:T | |
| Aorus Master 18 AM8H | |
| Asus Strix Scar 18 G835LX | |
| Medion Erazer Beast 18 X1 MD62731 | |
| MSI Raider A18 HX A9WIG-080 | |
| Average of class Gaming (59.4 - 246, n=102, last 2 years) | |
| GTA V - 1920x1080 Highest AA:4xMSAA + FX AF:16x | |
| MSI Raider A18 HX A9WIG-080 | |
| Aorus Master 18 AM8H | |
| Asus Strix Scar 18 G835LX | |
| MSI Raider 18 HX A14V | |
| Medion Erazer Beast 18 X1 MD62731 | |
| Average of class Gaming (48.3 - 186.9, n=94, last 2 years) | |
| Final Fantasy XV Benchmark - 1920x1080 High Quality | |
| Aorus Master 18 AM8H | |
| Asus Strix Scar 18 G835LX | |
| MSI Raider A18 HX A9WIG-080 | |
| Medion Erazer Beast 18 X1 MD62731 | |
| MSI Raider 18 HX A14V | |
| Average of class Gaming (41 - 215, n=95, last 2 years) | |
| Dota 2 Reborn - 1920x1080 ultra (3/3) best looking | |
| MSI Raider A18 HX A9WIG-080 | |
| Asus Strix Scar 18 G835LX | |
| MSI Raider 18 HX A14V | |
| Aorus Master 18 AM8H | |
| Medion Erazer Beast 18 X1 MD62731 | |
| Average of class Gaming (84.8 - 248, n=107, last 2 years) | |
| X-Plane 11.11 - 1920x1080 high (fps_test=3) | |
| MSI Raider 18 HX A14V | |
| Asus Strix Scar 18 G835LX | |
| MSI Raider A18 HX A9WIG-080 | |
| Aorus Master 18 AM8H | |
| Medion Erazer Beast 18 X1 MD62731 | |
| Average of class Gaming (52.1 - 143.5, n=109, last 2 years) | |
| Cyberpunk 2077 - 3840x2160 Ultra Preset (FSR off) | |
| Asus Strix Scar 18 G835LX | |
| MSI Raider A18 HX A9WIG-080 | |
| Average of class Gaming (25.1 - 128.8, n=34, last 2 years) | |
| MSI Raider 18 HX A14V | |
Cyberpunk 2077 ultra FPS Chart
| low | med. | high | ultra | QHD DLSS | QHD | 4K DLSS | 4K | |
|---|---|---|---|---|---|---|---|---|
| GTA V (2015) | 190.2 | 189.5 | 189 | 185 | 177.8 | 173.3 | ||
| Dota 2 Reborn (2015) | 327 | 304 | 271 | 239 | 199.2 | |||
| Final Fantasy XV Benchmark (2018) | 233 | 232 | 194.8 | 151.2 | 87 | |||
| X-Plane 11.11 (2018) | 158 | 138.2 | 113.9 | 124.1 | ||||
| Baldur's Gate 3 (2023) | 244 | 195.5 | 171.9 | 169.3 | 132.8 | 114.6 | 70.6 | |
| Cyberpunk 2077 (2023) | 225 | 197.1 | 167.9 | 151.9 | 104 | 46.3 | ||
| Alan Wake 2 (2023) | 134.7 | 125.7 | 116.4 | 78.3 | 63.1 | 40.7 | ||
| F1 24 (2024) | 396 | 349 | 277 | 134.8 | 126.9 | 79.3 | 68.2 | 39.4 |
| Black Myth: Wukong (2024) | 124 | 96 | 56 | 41 | 42 | 24 | ||
| Indiana Jones and the Great Circle (2024) | 189.3 | 141.8 | 127.2 | 99.5 | 61.8 | |||
| Monster Hunter Wilds (2025) | 127.6 | 111 | 90 | 70.6 | 59.3 | 42.9 | ||
| Assassin's Creed Shadows (2025) | 115 | 104 | 91 | 69 | 55 | 52 | 38 |
Emissions: Pulsing fan makes the MSI Raider A18 annoying
System Noise
If you buy the MSI Raider A18 HX, you better plan on wearing a headset all the time. The two fans of this MSI Raider laptop never shut up, apart from when the device is turned off. At least when idling, the fans stay under 30 dB(a), but you can definitely hear them. Worse, the fans tend to emit a very annoying pulsing noise. Under load, the MSI reaches a maximum of 55 dB(a) when running Cyberpunk 2077.
Noise level
| Idle |
| 28.6 / 28.9 / 29.2 dB(A) |
| Load |
| 45.6 / 45.8 dB(A) |
 | ||
30 dB silent 40 dB(A) audible 50 dB(A) loud |
||
min: | ||
| MSI Raider A18 HX A9WIG-080 GeForce RTX 5080 Laptop, R9 9955HX3D, Samsung PM9E1 MZVLC2T0HBLD | MSI Raider 18 HX A14V GeForce RTX 4080 Laptop GPU, i9-14900HX, Samsung PM9A1 MZVL22T0HBLB | Medion Erazer Beast 18 X1 MD62731 GeForce RTX 5080 Laptop, Ultra 9 275HX, Phison E31 2 TB | Aorus Master 18 AM8H GeForce RTX 5090 Laptop, Ultra 9 275HX, Kingston KC3000 2048G SKC3000D2048G | Asus Strix Scar 18 G835LX GeForce RTX 5090 Laptop, Ultra 9 275HX, WD PC SN8000S 2TB | |
|---|---|---|---|---|---|
| Noise | -6% | -14% | -4% | -1% | |
| off / environment * (dB) | 25.1 | 23.3 7% | 25 -0% | 25 -0% | 23.3 7% |
| Idle Minimum * (dB) | 28.6 | 28.6 -0% | 25 13% | 26 9% | 29.8 -4% |
| Idle Average * (dB) | 28.9 | 28.6 1% | 39 -35% | 29 -0% | 29.8 -3% |
| Idle Maximum * (dB) | 29.2 | 31.3 -7% | 42 -44% | 34 -16% | 29.8 -2% |
| Load Average * (dB) | 45.6 | 44.1 3% | 52 -14% | 50 -10% | 42.9 6% |
| Cyberpunk 2077 ultra * (dB) | 55.6 | 59.4 -7% | 53 5% | 52 6% | 53.7 3% |
| Load Maximum * (dB) | 45.8 | 62.7 -37% | 55 -20% | 53 -16% | 53.7 -17% |
* ... smaller is better
Temperature
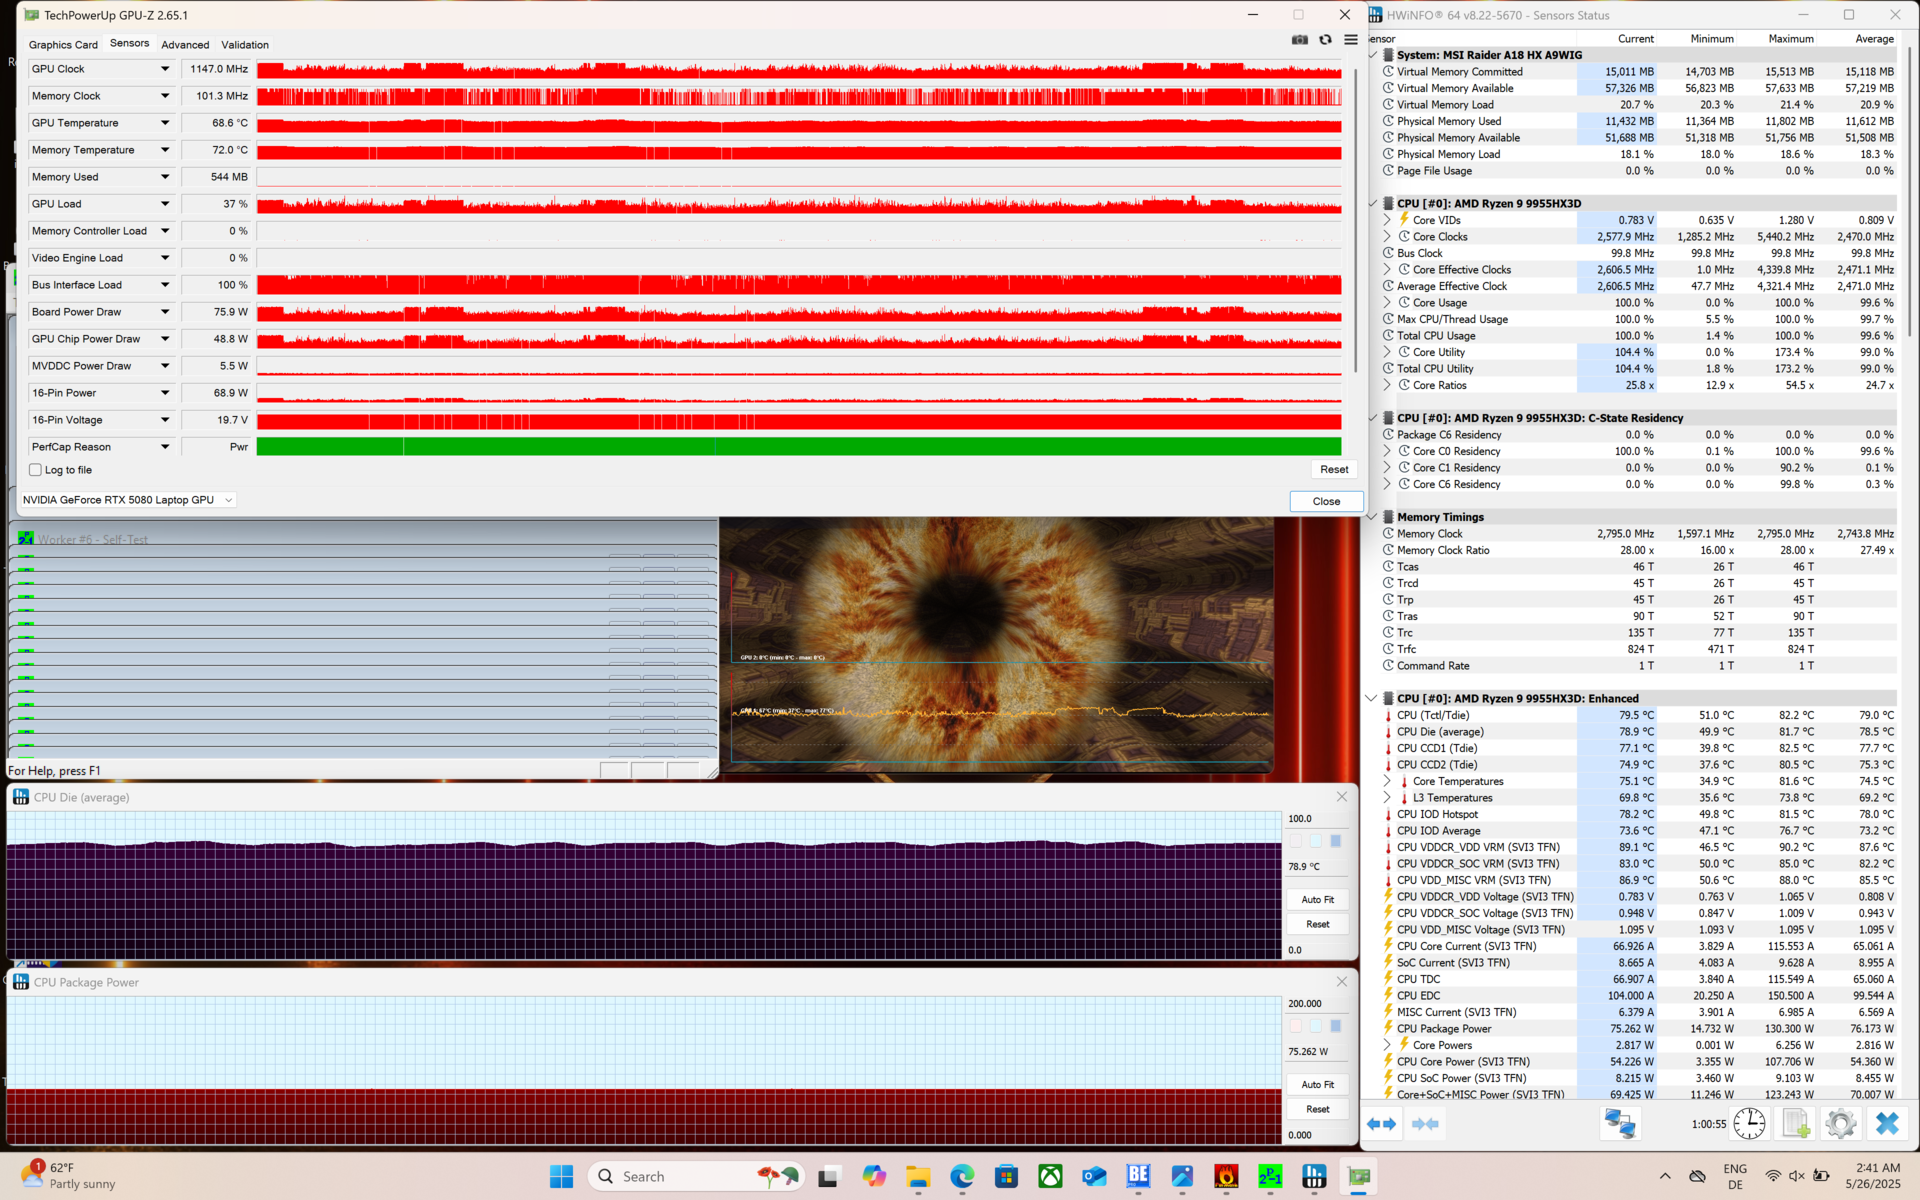
A device with such raw power will run hot, even with the fans working overtime. At least the temperatures do not turn extreme, we measure a maximum of 52.7 degrees Celsius or 127 F in our Cyberpunk 2077 test. Also, the palmrest area, which is the area the users will touch the most, does not get hot at all.
Under 100 percent load on both the CPU and GPU, the processor can consume up to 75 W and the same is true for the GPU. This means the device is able to cool a maximum of 150 W sustained when you combine the two.
(-) The maximum temperature on the upper side is 49.3 °C / 121 F, compared to the average of 40.4 °C / 105 F, ranging from 21.2 to 68.8 °C for the class Gaming.
(-) The bottom heats up to a maximum of 50.9 °C / 124 F, compared to the average of 43.2 °C / 110 F
(+) In idle usage, the average temperature for the upper side is 30 °C / 86 F, compared to the device average of 33.9 °C / 93 F.
(±) 3: The average temperature for the upper side is 34.8 °C / 95 F, compared to the average of 33.9 °C / 93 F for the class Gaming.
(+) The palmrests and touchpad are cooler than skin temperature with a maximum of 29.4 °C / 84.9 F and are therefore cool to the touch.
(±) The average temperature of the palmrest area of similar devices was 28.8 °C / 83.8 F (-0.6 °C / -1.1 F).
| MSI Raider A18 HX A9WIG-080 AMD Ryzen 9 9955HX3D, NVIDIA GeForce RTX 5080 Laptop | MSI Raider 18 HX A14V Intel Core i9-14900HX, NVIDIA GeForce RTX 4080 Laptop GPU | Medion Erazer Beast 18 X1 MD62731 Intel Core Ultra 9 275HX, NVIDIA GeForce RTX 5080 Laptop | Aorus Master 18 AM8H Intel Core Ultra 9 275HX, NVIDIA GeForce RTX 5090 Laptop | Asus Strix Scar 18 G835LX Intel Core Ultra 9 275HX, NVIDIA GeForce RTX 5090 Laptop | |
|---|---|---|---|---|---|
| Heat | 5% | 8% | 1% | 12% | |
| Maximum Upper Side * (°C) | 49.3 | 40.8 17% | 47 5% | 50 -1% | 45.6 8% |
| Maximum Bottom * (°C) | 50.9 | 43.4 15% | 48 6% | 46 10% | 46 10% |
| Idle Upper Side * (°C) | 35.2 | 36.4 -3% | 29 18% | 36 -2% | 28.9 18% |
| Idle Bottom * (°C) | 33.5 | 36.4 -9% | 33 1% | 35 -4% | 29.2 13% |
* ... smaller is better
Speakers
There are a total of six speakers in the MSI Raider A18 HX, and they are plenty loud, with a nice level of volume of 85.9 dB(a). However, MSI seems to have forgotten about the bass, as the sound is really tiny and too heavy on the highs - not at all the premium experience we would have hoped for from a gaming laptop.
MSI Raider A18 HX A9WIG-080 audio analysis
(+) | speakers can play relatively loud (85.9 dB)
Bass 100 - 315 Hz
(-) | nearly no bass - on average 17.1% lower than median
(±) | linearity of bass is average (8.5% delta to prev. frequency)
Mids 400 - 2000 Hz
(±) | higher mids - on average 9.4% higher than median
(±) | linearity of mids is average (9.1% delta to prev. frequency)
Highs 2 - 16 kHz
(+) | balanced highs - only 3.8% away from median
(+) | highs are linear (5.8% delta to prev. frequency)
Overall 100 - 16.000 Hz
(±) | linearity of overall sound is average (18.9% difference to median)
Compared to same class
» 63% of all tested devices in this class were better, 8% similar, 29% worse
» The best had a delta of 6%, average was 18%, worst was 132%
Compared to all devices tested
» 44% of all tested devices were better, 8% similar, 48% worse
» The best had a delta of 4%, average was 23%, worst was 134%
Asus Strix Scar 18 G835LX audio analysis
(+) | speakers can play relatively loud (86.3 dB)
Bass 100 - 315 Hz
(±) | reduced bass - on average 7.5% lower than median
(±) | linearity of bass is average (7.7% delta to prev. frequency)
Mids 400 - 2000 Hz
(±) | higher mids - on average 9.9% higher than median
(+) | mids are linear (6.9% delta to prev. frequency)
Highs 2 - 16 kHz
(+) | balanced highs - only 2.2% away from median
(+) | highs are linear (4.1% delta to prev. frequency)
Overall 100 - 16.000 Hz
(+) | overall sound is linear (13.7% difference to median)
Compared to same class
» 21% of all tested devices in this class were better, 7% similar, 72% worse
» The best had a delta of 6%, average was 18%, worst was 132%
Compared to all devices tested
» 15% of all tested devices were better, 4% similar, 81% worse
» The best had a delta of 4%, average was 23%, worst was 134%
Energy Management: MSI laptop burns through large battery fast
Power Consumption
Power efficient, the MSI Raider A18 is not. Even with everything turned off, and the screen brightness turned down, it still consumed more than 40 W. This is worse than all the other laptops in our comparison.
At max, the MSI laptop draws 323 W - no challenge for the 400 W charger.
| Off / Standby | |
| Idle | |
| Load |
|
Key:
min: | |
| MSI Raider A18 HX A9WIG-080 R9 9955HX3D, GeForce RTX 5080 Laptop, Samsung PM9E1 MZVLC2T0HBLD, MiniLED IPS, 3840x2400, 18" | MSI Raider 18 HX A14V i9-14900HX, GeForce RTX 4080 Laptop GPU, Samsung PM9A1 MZVL22T0HBLB, Mini-LED, 3840x2400, 18" | Medion Erazer Beast 18 X1 MD62731 Ultra 9 275HX, GeForce RTX 5080 Laptop, Phison E31 2 TB, IPS, 2560x1600, 18" | Aorus Master 18 AM8H Ultra 9 275HX, GeForce RTX 5090 Laptop, Kingston KC3000 2048G SKC3000D2048G, Mini-LED, 2560x1600, 18" | Asus Strix Scar 18 G835LX Ultra 9 275HX, GeForce RTX 5090 Laptop, WD PC SN8000S 2TB, Mini-LED, 2560x1600, 18" | Average NVIDIA GeForce RTX 5080 Laptop | Average of class Gaming | |
|---|---|---|---|---|---|---|---|
| Power Consumption | 13% | 40% | 14% | 13% | 35% | 49% | |
| Idle Minimum * (Watt) | 41.5 | 27.7 33% | 7.9 81% | 29 30% | 11.4 73% | 19.1 ? 54% | 13 ? 69% |
| Idle Average * (Watt) | 53.5 | 38.3 28% | 11.5 79% | 33 38% | 39.2 27% | 25.3 ? 53% | 18.6 ? 65% |
| Idle Maximum * (Watt) | 53.8 | 47.1 12% | 16.6 69% | 48 11% | 40.2 25% | 30.4 ? 43% | 24.2 ? 55% |
| Load Average * (Watt) | 168.5 | 121.2 28% | 130 23% | 141 16% | 161.2 4% | 128.5 ? 24% | 108.7 ? 35% |
| Cyberpunk 2077 ultra * (Watt) | 298 | 313 -5% | 253 15% | 283 5% | 303 -2% | ||
| Cyberpunk 2077 ultra external monitor * (Watt) | 295 | 306 -4% | 245 17% | 283 4% | 295 -0% | ||
| Load Maximum * (Watt) | 323.7 | 321.8 1% | 330 -2% | 340 -5% | 430.9 -33% | 314 ? 3% | 255 ? 21% |
* ... smaller is better
Power Consumption Cyberpunk / Stress Test
Power Consumption external Monitor
Battery Life
If you hope to use the MSI Raider A18 HX without a charger connected: Forget about it. Despite the 99.9 Wh battery, the laptop barely lasted two hours in our Wi-Fi test (150 cd/m² brightness). This is basically a desktop that you can transport between different desks, and always with the charger in toe.
| MSI Raider A18 HX A9WIG-080 R9 9955HX3D, GeForce RTX 5080 Laptop, 99 Wh | MSI Raider 18 HX A14V i9-14900HX, GeForce RTX 4080 Laptop GPU, 99.9 Wh | Medion Erazer Beast 18 X1 MD62731 Ultra 9 275HX, GeForce RTX 5080 Laptop, 99 Wh | Aorus Master 18 AM8H Ultra 9 275HX, GeForce RTX 5090 Laptop, 99 Wh | Asus Strix Scar 18 G835LX Ultra 9 275HX, GeForce RTX 5090 Laptop, 90 Wh | Average of class Gaming | |
|---|---|---|---|---|---|---|
| Battery runtime | 38% | 276% | 103% | 86% | 137% | |
| WiFi v1.3 (h) | 2.1 | 3.3 57% | 7.9 276% | 4.9 133% | 5.5 162% | 7.07 ? 237% |
| Load (h) | 1.1 | 1.3 18% | 1.9 73% | 1.2 9% | 1.502 ? 37% | |
| Cyberpunk 2077 ultra 150cd (h) | 0.7 |
Notebookcheck Rating
The MSI Raider A18 HX is one of the most powerful laptops on the market, making it suitable for both gaming and intensive work tasks. However, you always need to keep it connected to its huge 400 W charger, as it barely lasts longer than two hours at the most, even with its 99 Wh battery.
MSI Raider A18 HX A9WIG-080
- 06/01/2025 v8
Benjamin Herzig
 Total Sustainability Score:
 Potential Competitors in Comparison
Image | Model / Review | Price | Weight | Height | Display |
|---|---|---|---|---|---|
1. 85.1%  | MSI Raider A18 HX A9WIG-080 AMD Ryzen 9 9955HX3D ⎘ NVIDIA GeForce RTX 5080 Laptop ⎘ 64 GB Memory, 2048 GB SSD | Amazon: List Price: 4350 Euro | 3.6 kg | 34 mm | 18.00" 3840x2400 252 PPI MiniLED IPS |
2. 84.7%  | MSI Raider 18 HX A14V Intel Core i9-14900HX ⎘ NVIDIA GeForce RTX 4080 Laptop GPU ⎘ 64 GB Memory, 2048 GB SSD | Amazon: 1. $74.99 330W 280W Laptop Charger Fit... 2. $4,079.25 msi Raider 18 HX AI 18” 12... 3. $3,599.00 EXCaliberPC [2025] MSI Raide... List Price: 3400 USD | 3.6 kg | 32 mm | 18.00" 3840x2400 252 PPI Mini-LED |
3. 82.5%  | Medion Erazer Beast 18 X1 MD62731 Intel Core Ultra 9 275HX ⎘ NVIDIA GeForce RTX 5080 Laptop ⎘ 32 GB Memory, SSD | Amazon: List Price: 3700 EUR | 3.6 kg | 30.4 mm | 18.00" 2560x1600 168 PPI IPS |
4. 86.8%  | Aorus Master 18 AM8H Intel Core Ultra 9 275HX ⎘ NVIDIA GeForce RTX 5090 Laptop ⎘ 64 GB Memory, 2048 GB SSD | Amazon: List Price: 5000 EUR | 3.4 kg | 31 mm | 18.00" 2560x1600 168 PPI Mini-LED |
5. 88%  | Asus Strix Scar 18 G835LX Intel Core Ultra 9 275HX ⎘ NVIDIA GeForce RTX 5090 Laptop ⎘ 64 GB Memory, 2048 GB SSD | Amazon: List Price: 5799€ | 3.3 kg | 32 mm | 18.00" 2560x1600 168 PPI Mini-LED |
Transparency
The selection of devices to be reviewed is made by our editorial team. The test sample was provided to the author as a loan by the manufacturer or retailer for the purpose of this review. The lender had no influence on this review, nor did the manufacturer receive a copy of this review before publication. There was no obligation to publish this review. As an independent media company, Notebookcheck is not subjected to the authority of manufacturers, retailers or publishers.
This is how Notebookcheck is testing
Every year, Notebookcheck independently reviews hundreds of laptops and smartphones using standardized procedures to ensure that all results are comparable. We have continuously developed our test methods for around 20 years and set industry standards in the process. In our test labs, high-quality measuring equipment is utilized by experienced technicians and editors. These tests involve a multi-stage validation process. Our complex rating system is based on hundreds of well-founded measurements and benchmarks, which maintains objectivity. Further information on our test methods can be found here.
