
Verdict - The Beast 18 X1 is good, but with room for improvement
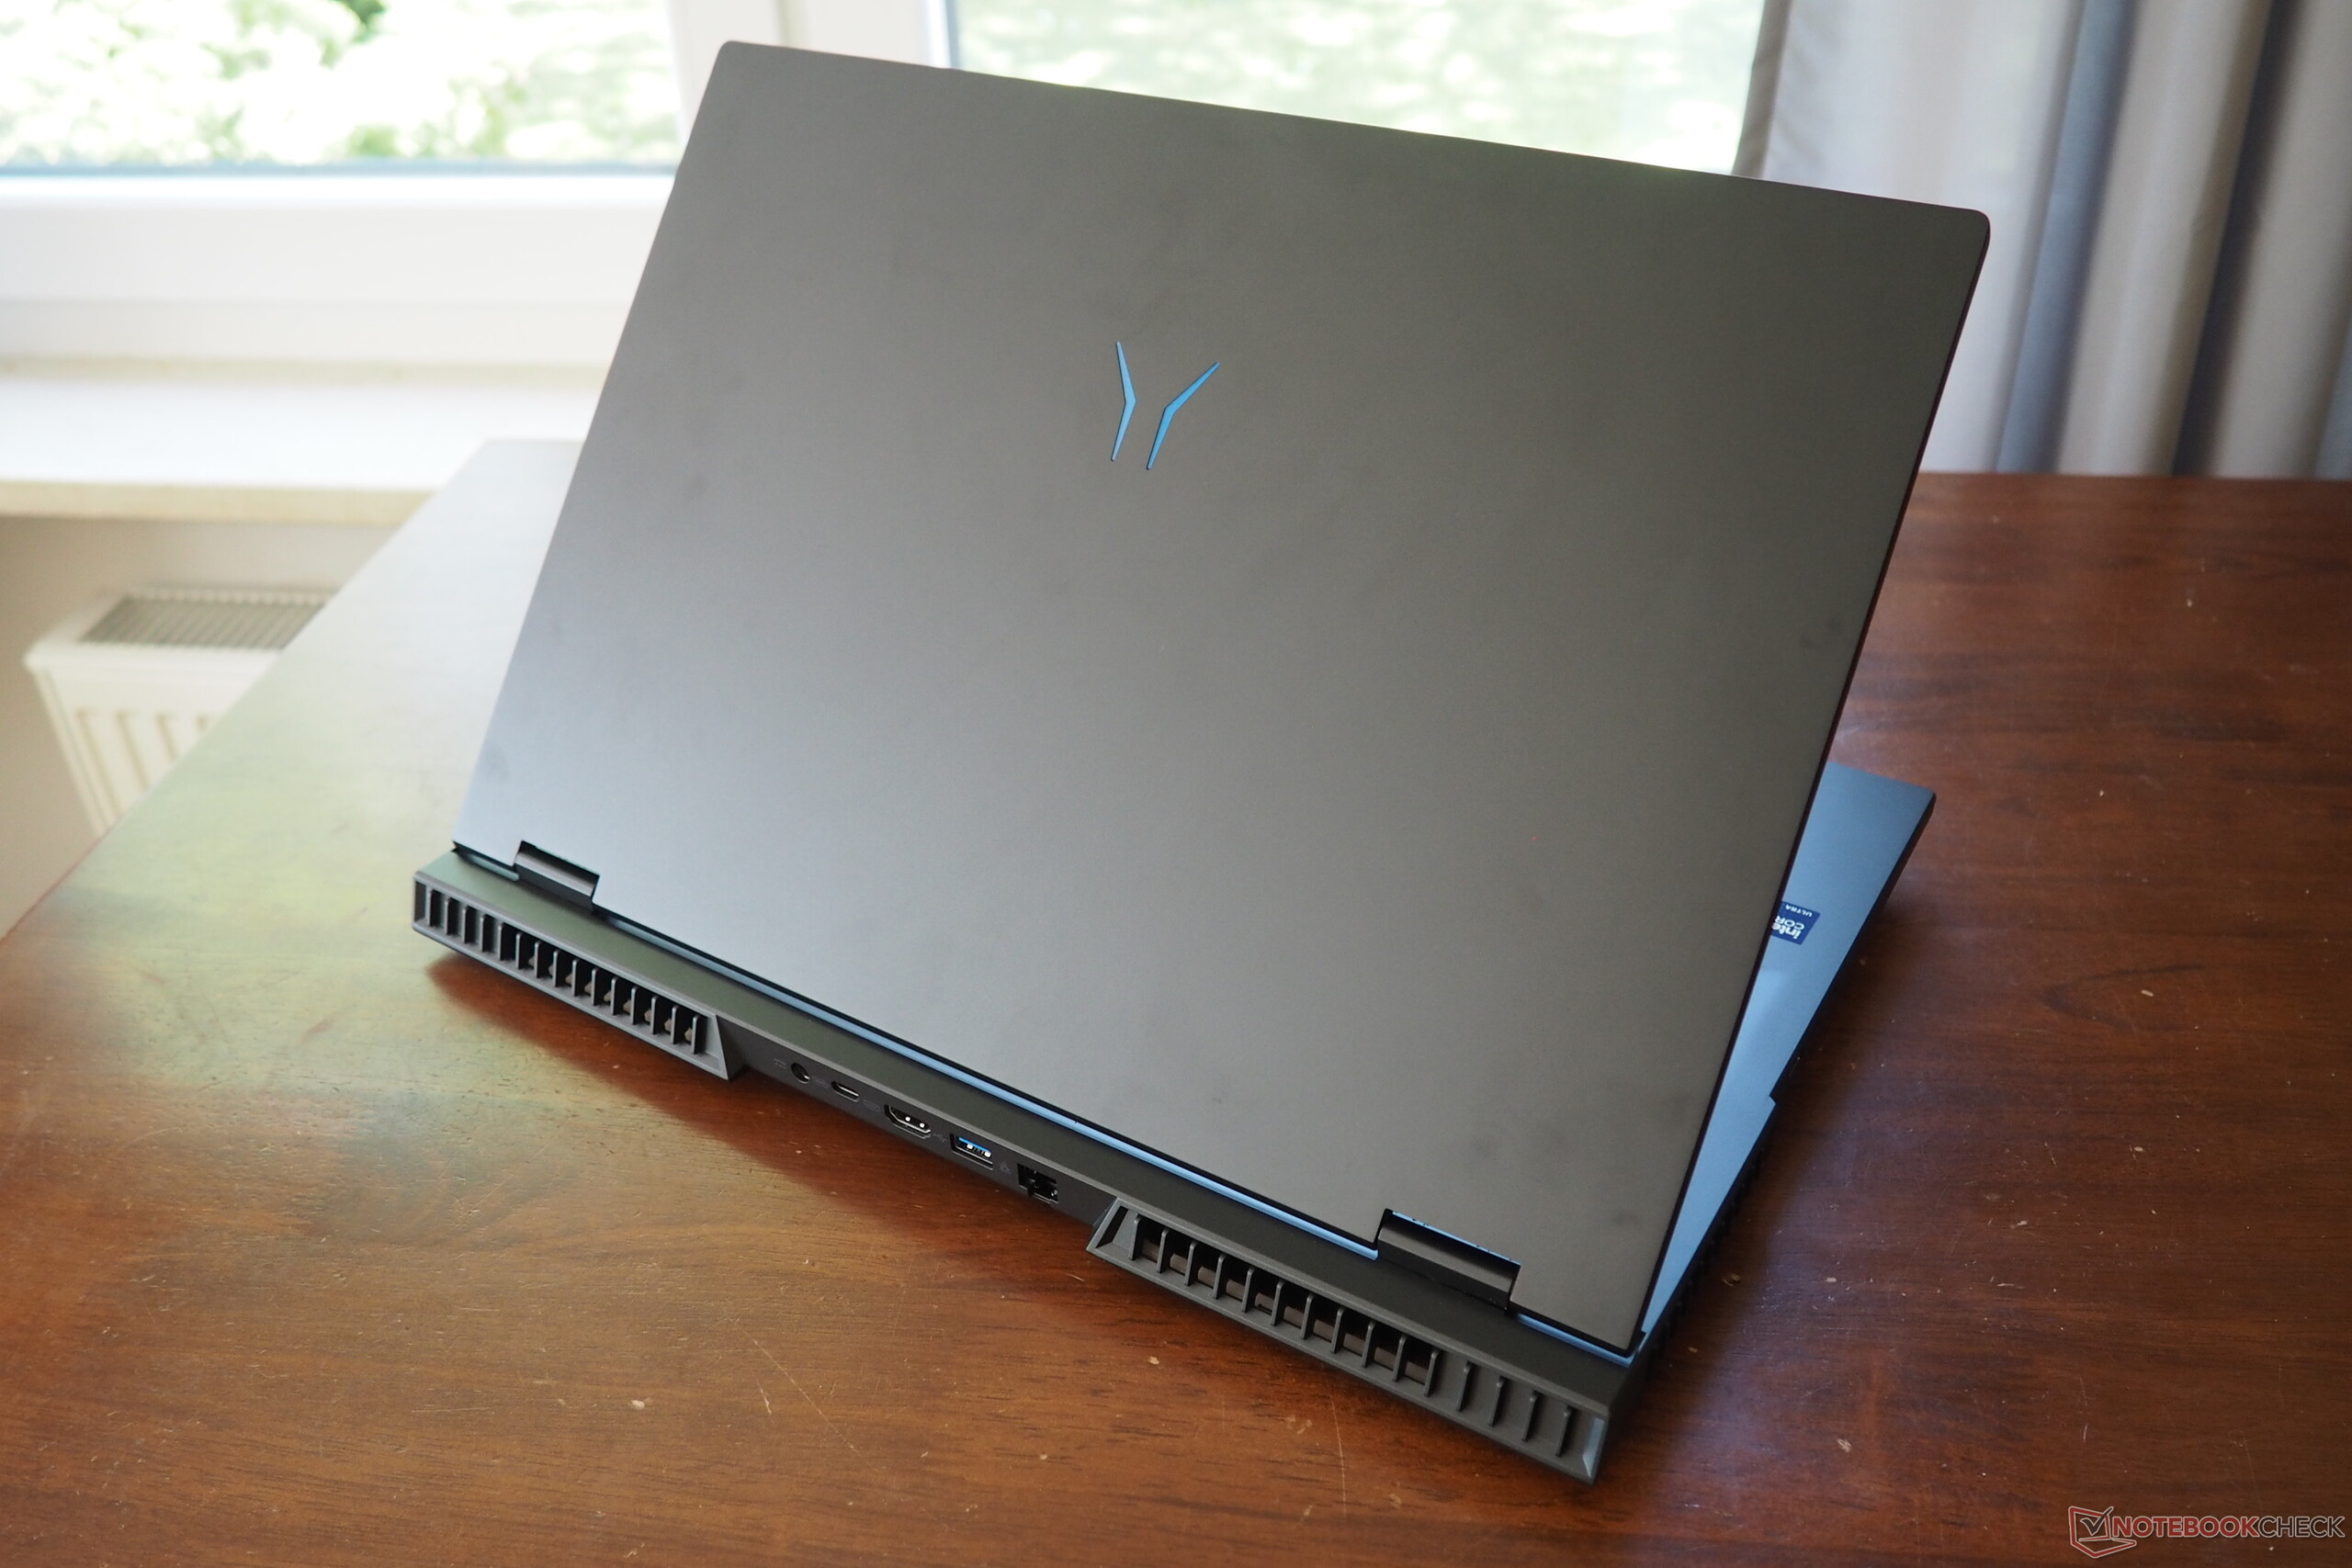
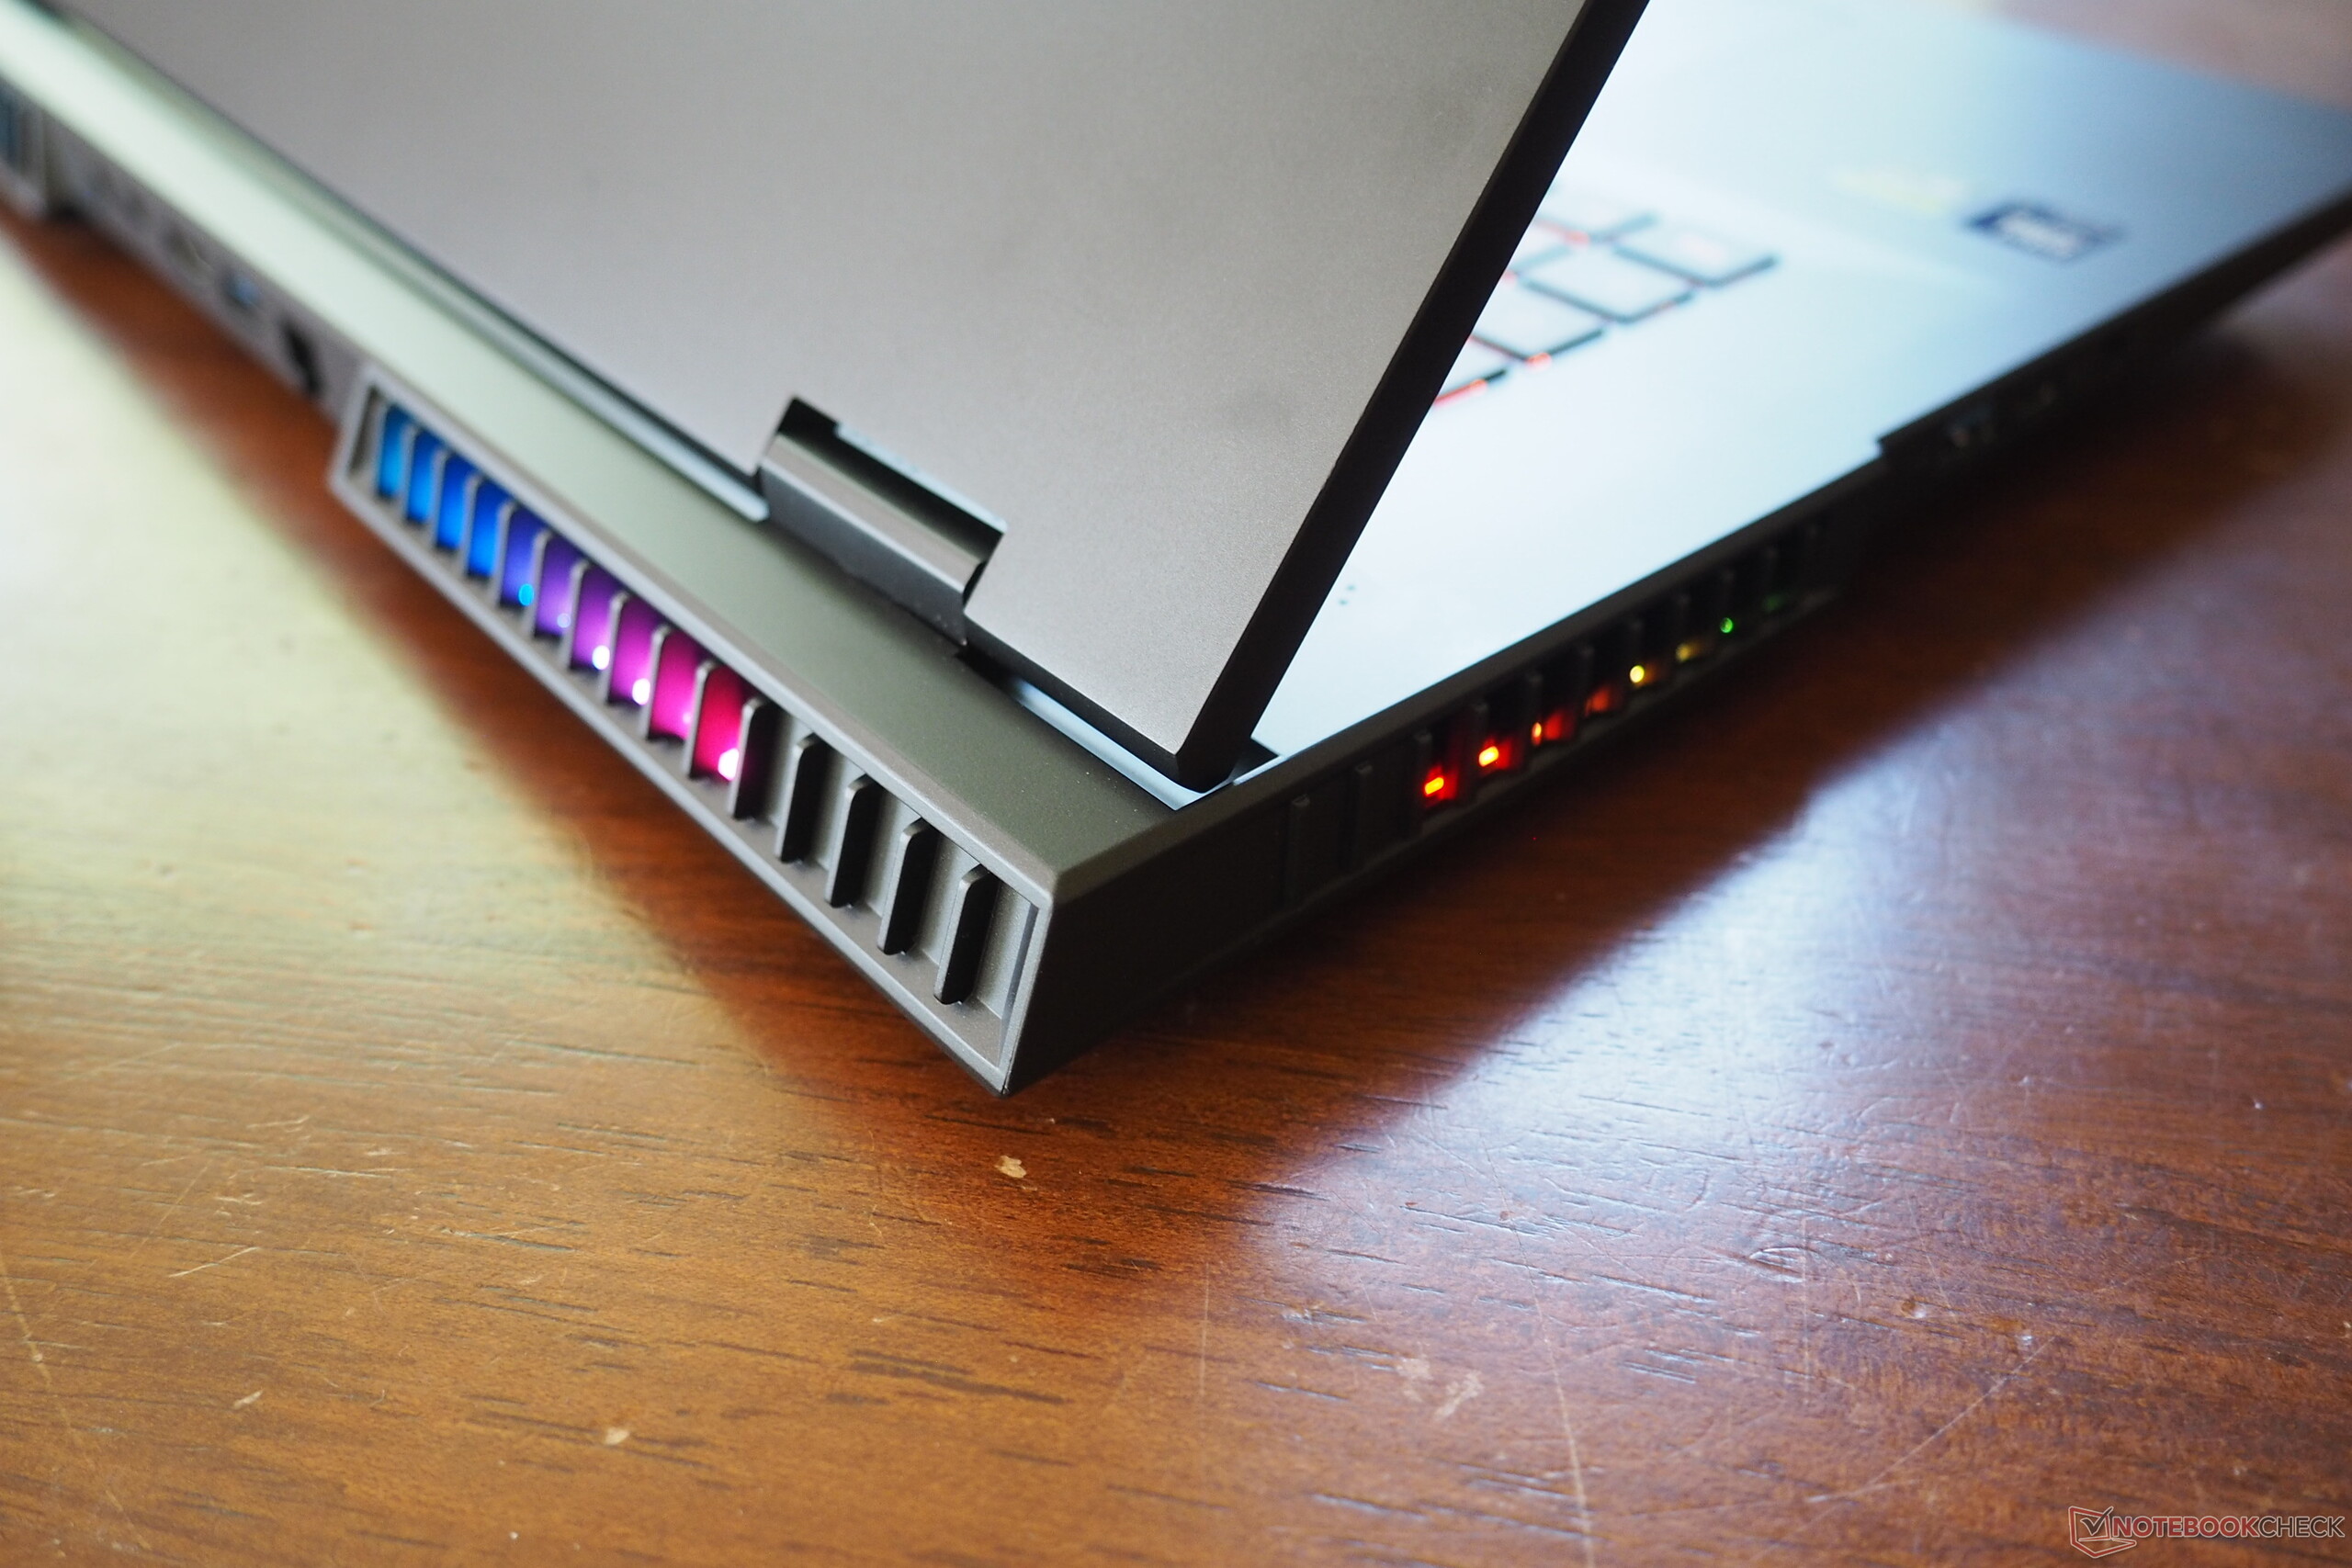
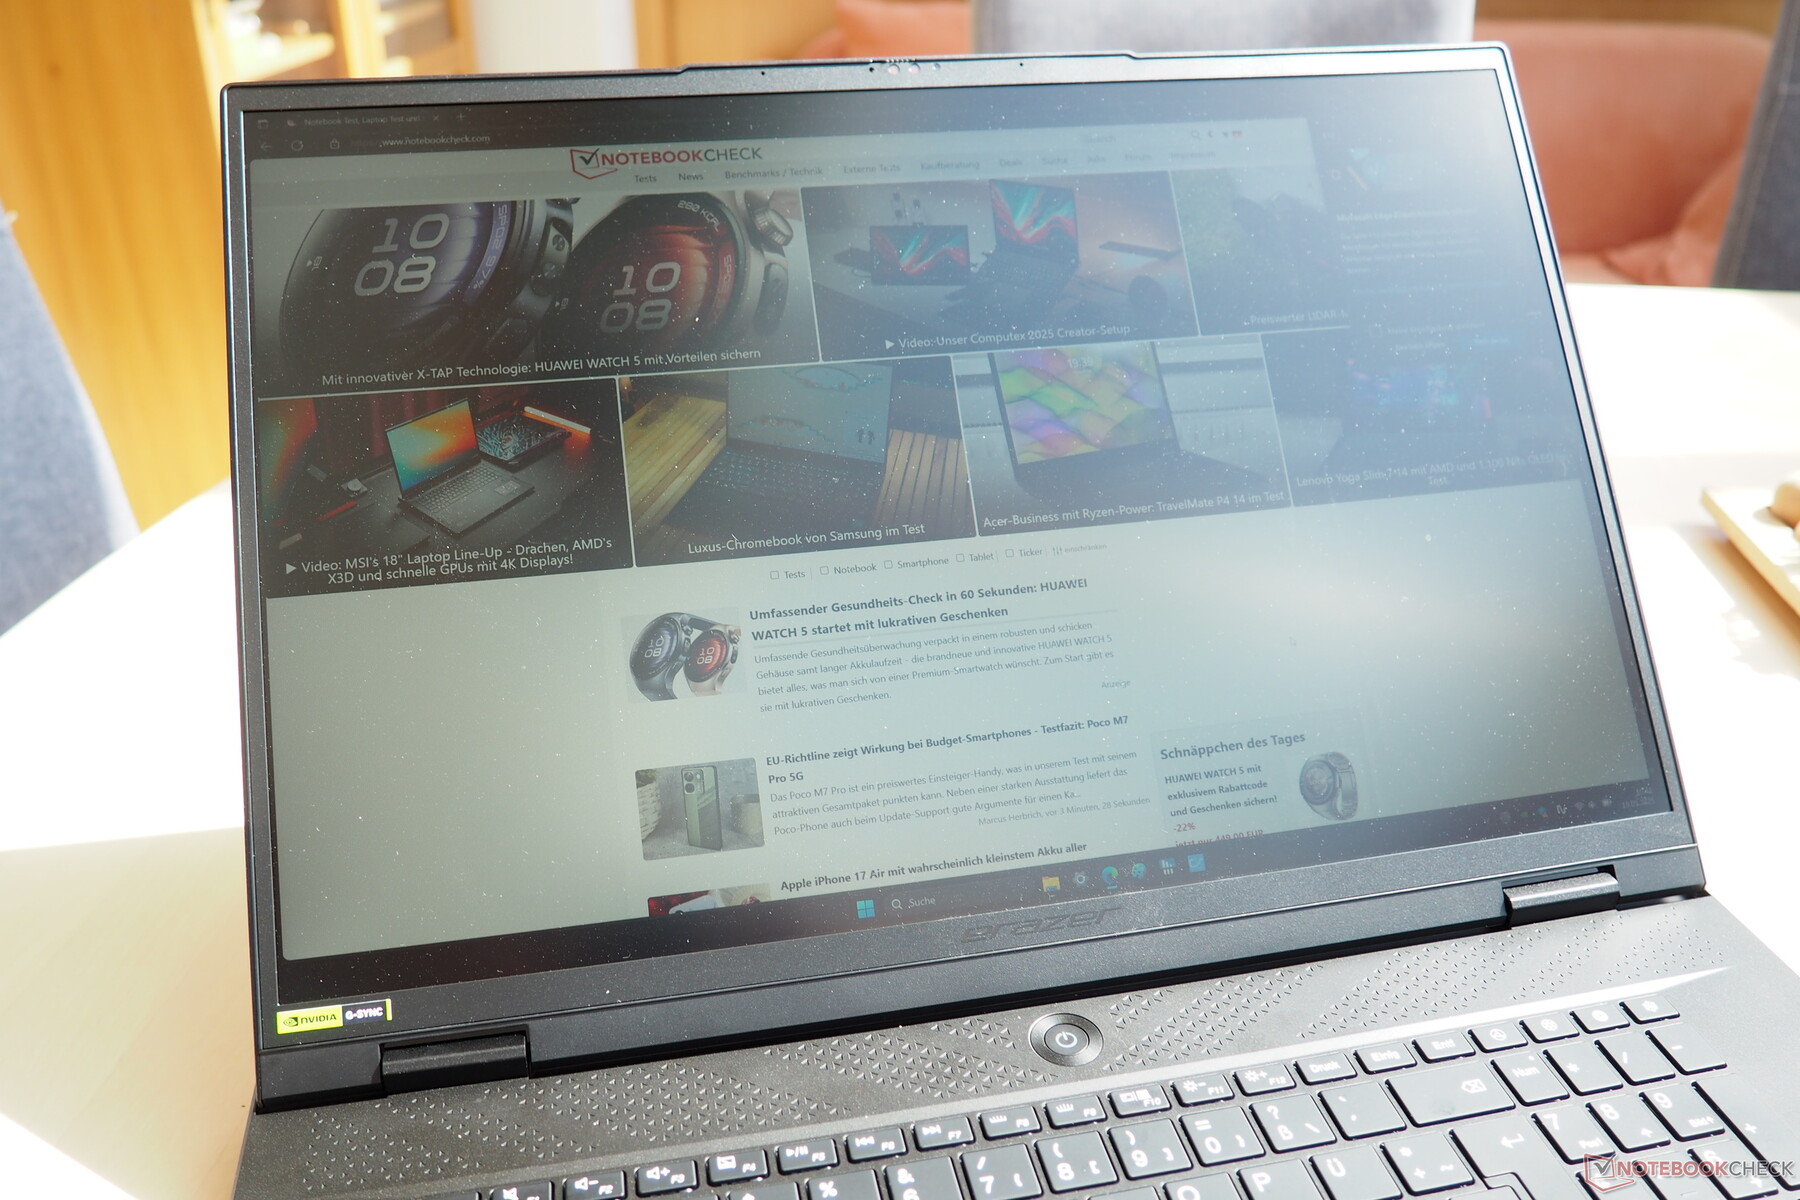
If you want a powerful desktop replacement, you might like the Erazer Beast 18 X1. Although the 18-incher can get extremely loud under load (even in balanced mode), like many other gaming laptops, users who are not very sensitive to noise and/or who are gaming with a headset anyway will be able to put up with the volume. The massive device cuts a solid figure and scores points with a rather lavish connectivity, including Thunderbolt 5, an RGB keyboard, and stylish light strips on the side and rear (see photos). The input devices are decent to good, but the model is really not able to impress here.
Nvidia's GeForce RTX 5080 laptop performs within the expected range, whereas Intel's Core Ultra 9 275HX loses some performance under prolonged load (more on this in a moment). The competition includes the Aorus Master 18 and the Asus ROG Strix Scar 18, which we tested with the more powerful RTX 5090 laptop.
Pros
Cons
Price and availability
The Medion Erazer Beast 18 X1 MD62731 is listed for around 3,700 euros on the Medion homepage listed.
Specifications
Case
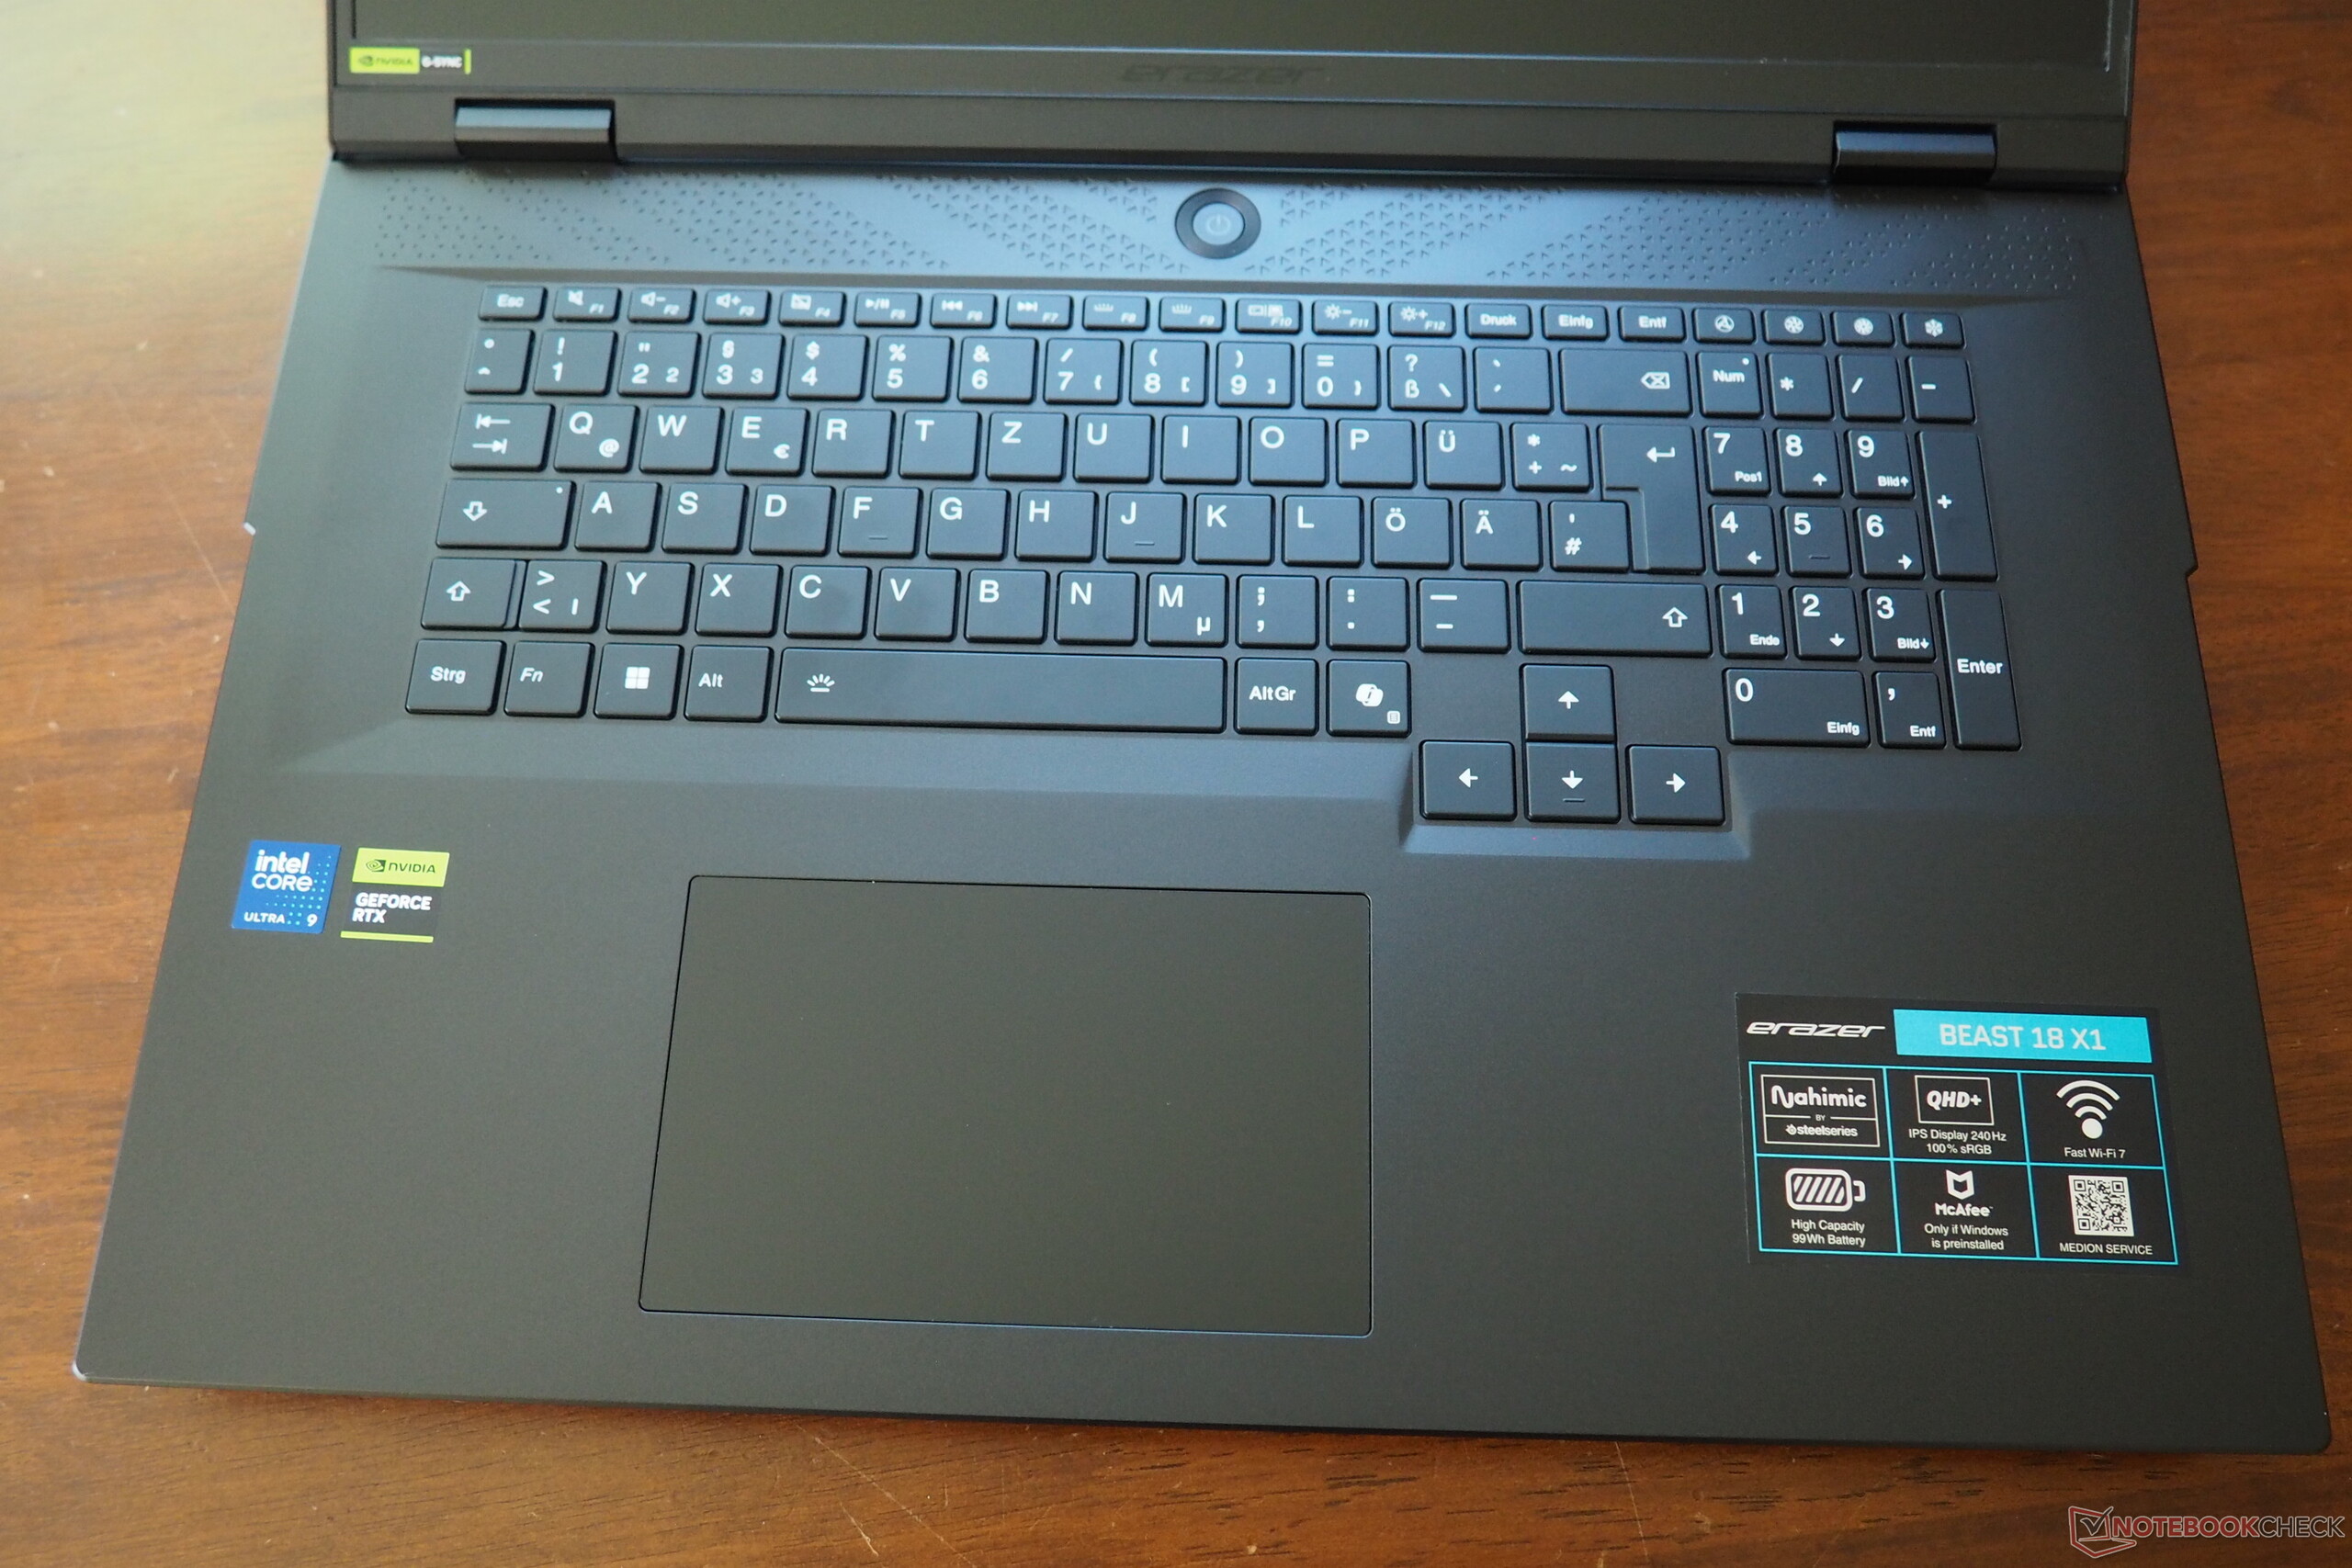
In terms of quality, Medion delivers the usual average fare. While the lid of the 18-incher is made of aluminum, the base unit is made of plastic. Despite the relatively thicker construction, the latter can be bent slightly in some places, but this primarily only happens when more pressure is applied. On the other hand, the generous opening angle of 150° deserves praise, although the hinges could be a little tighter. With an overall height of just under 3 cm (without case feet), the Beast 18 X1 aligns with its counterparts from Aorus and Asus, although the weight is somewhat higher at 3.6 to 3.3-3.4 kg.

Equipment
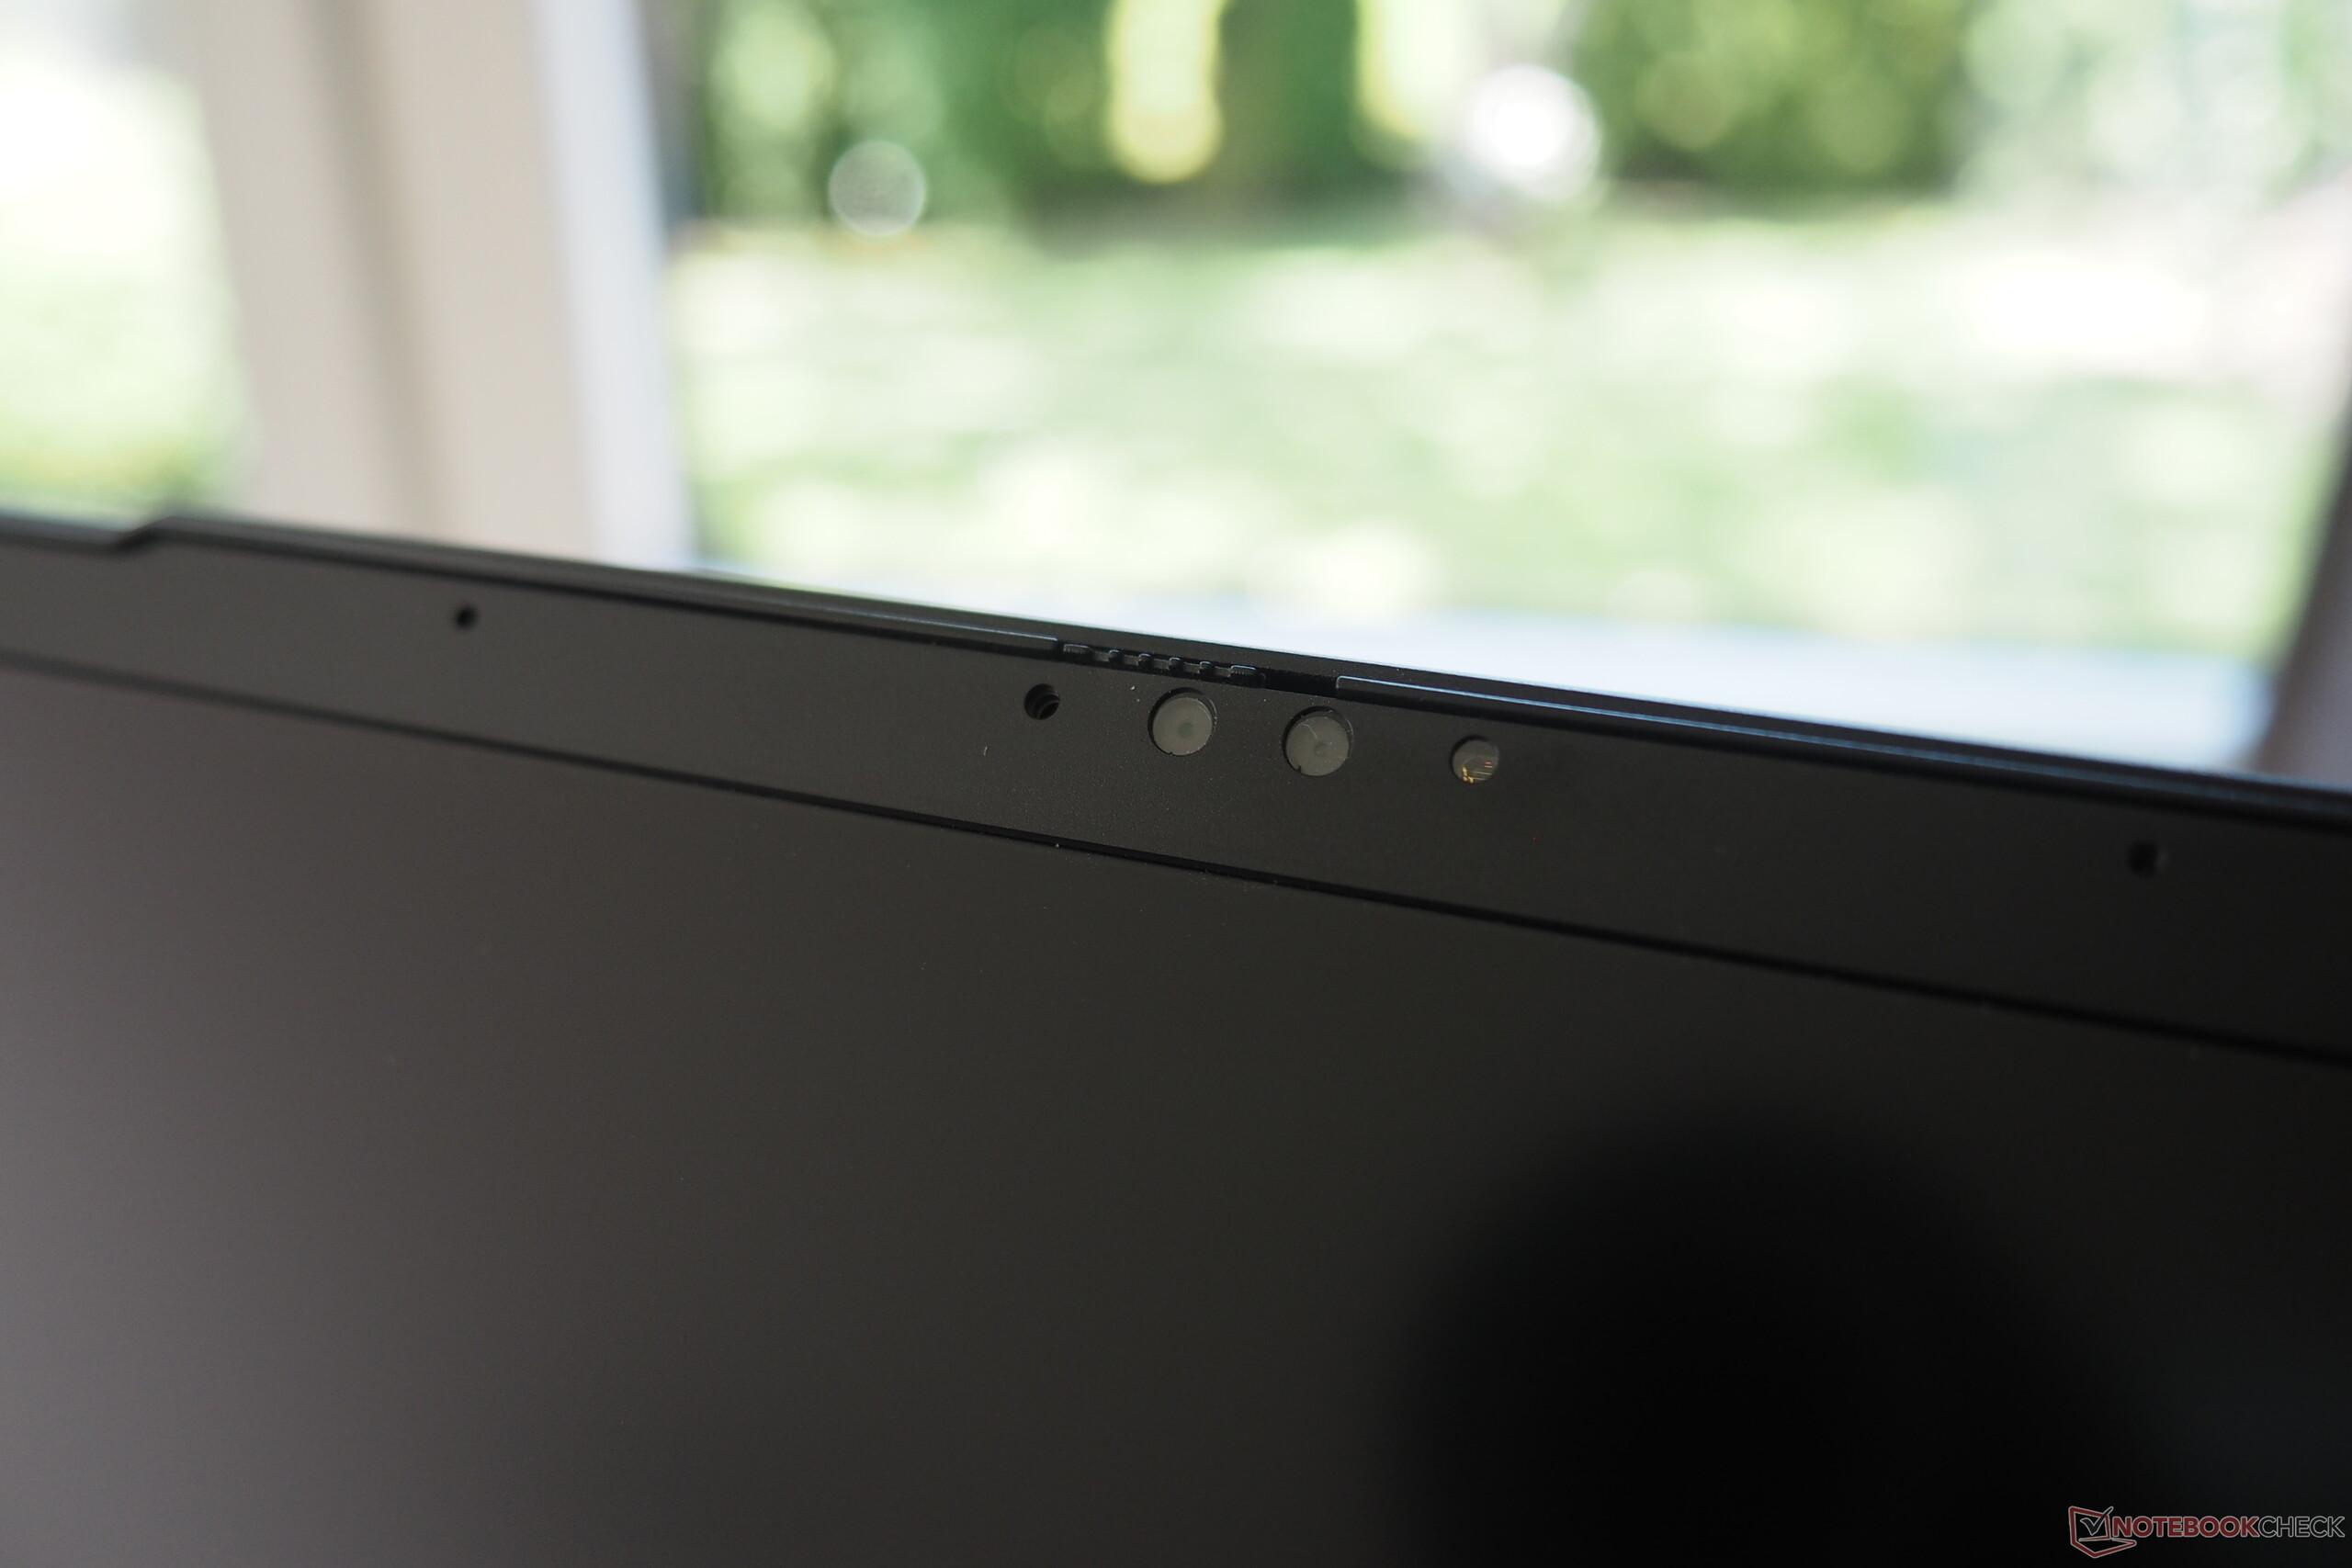
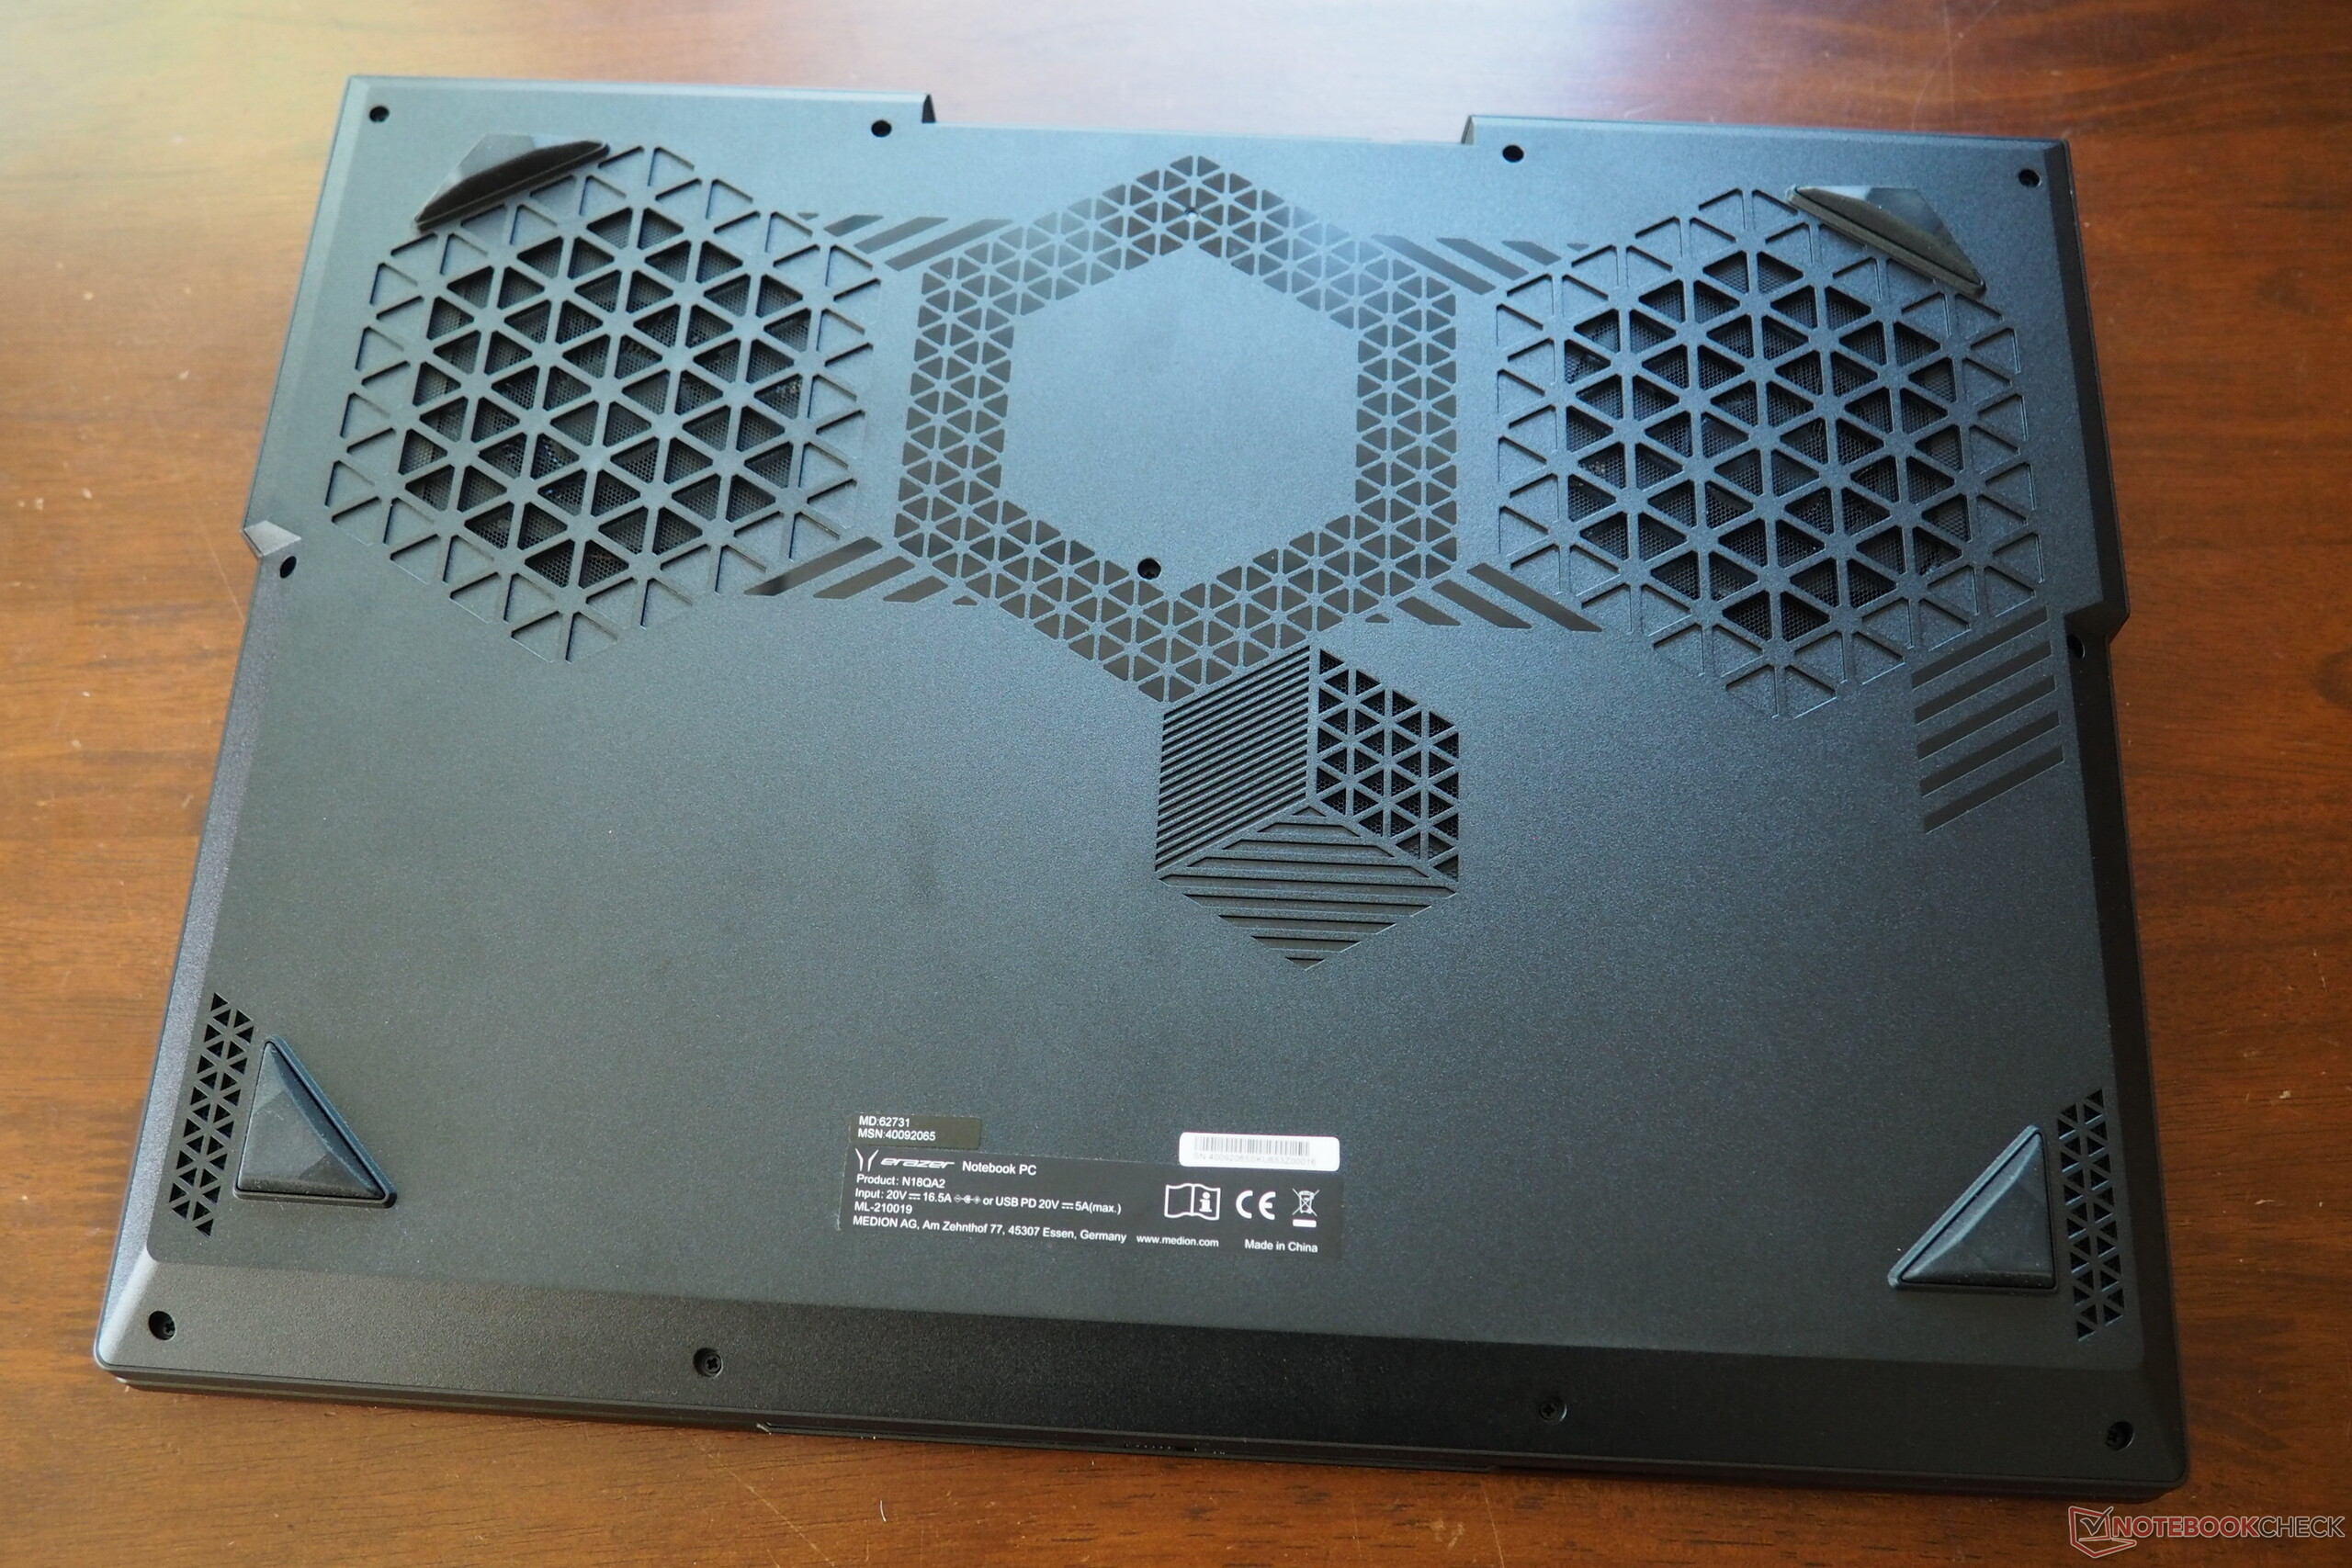
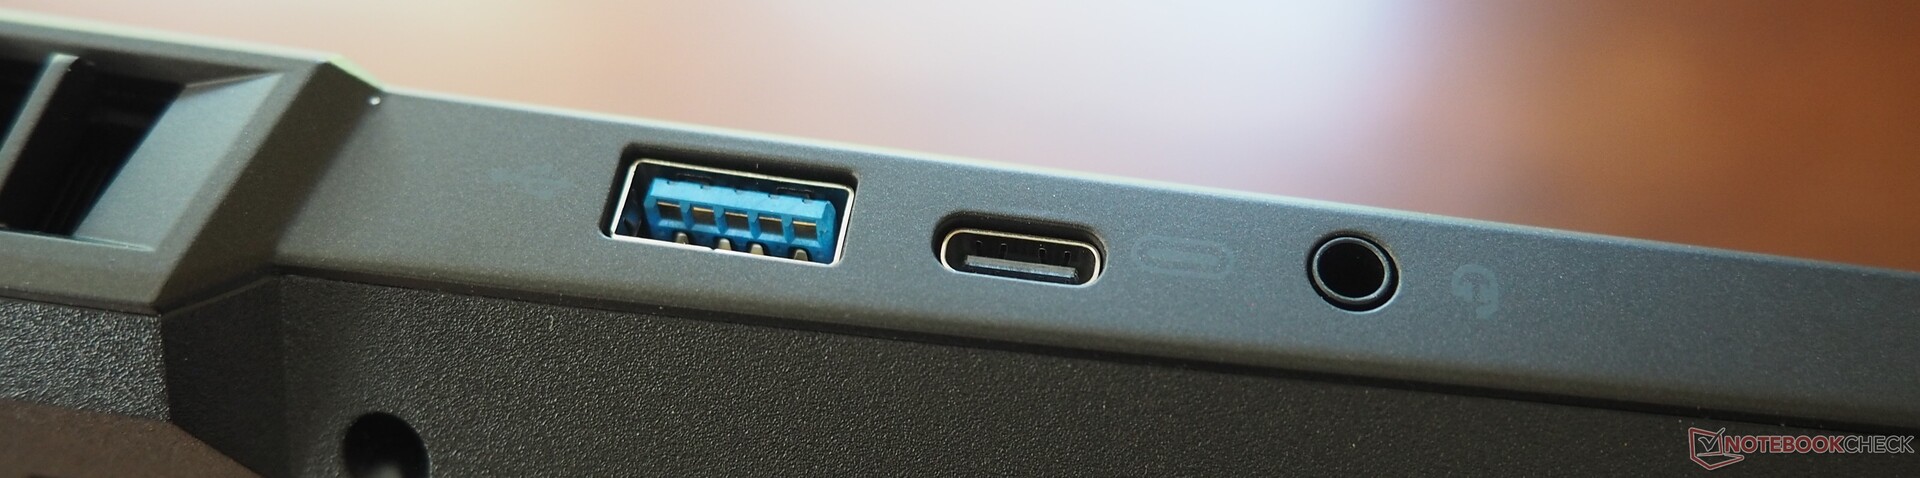
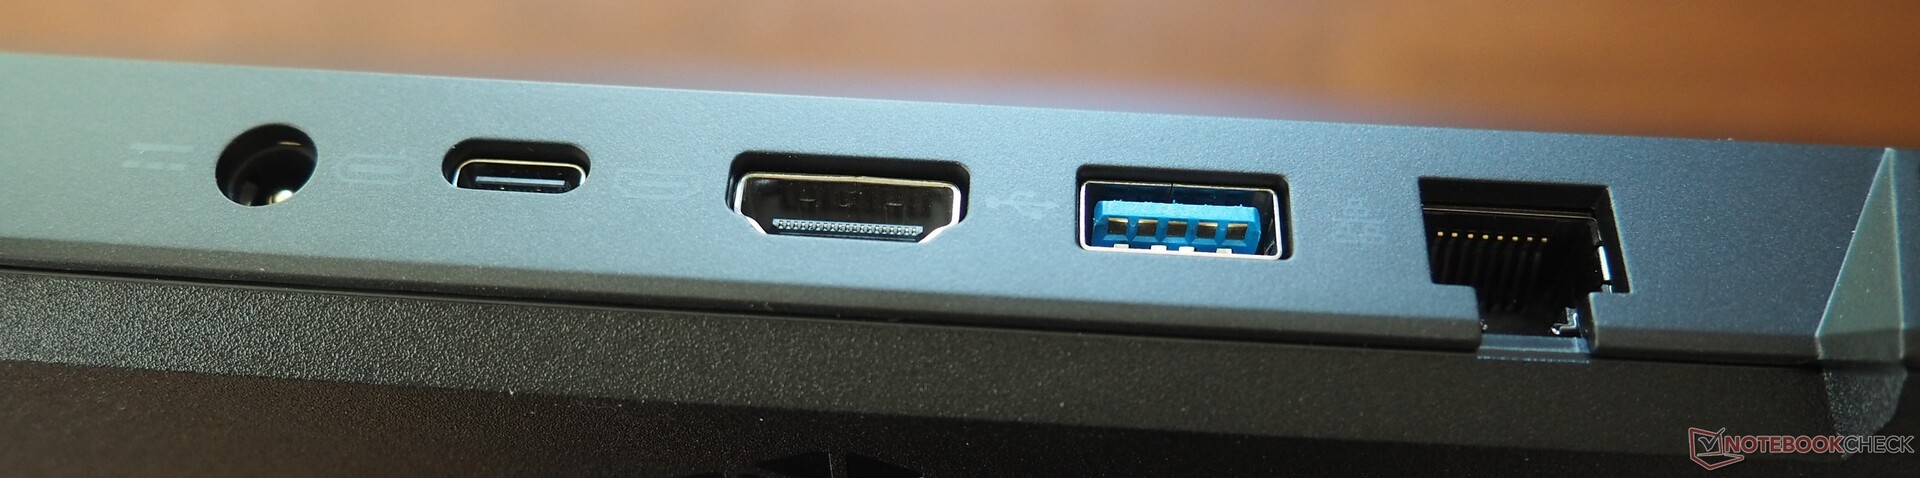
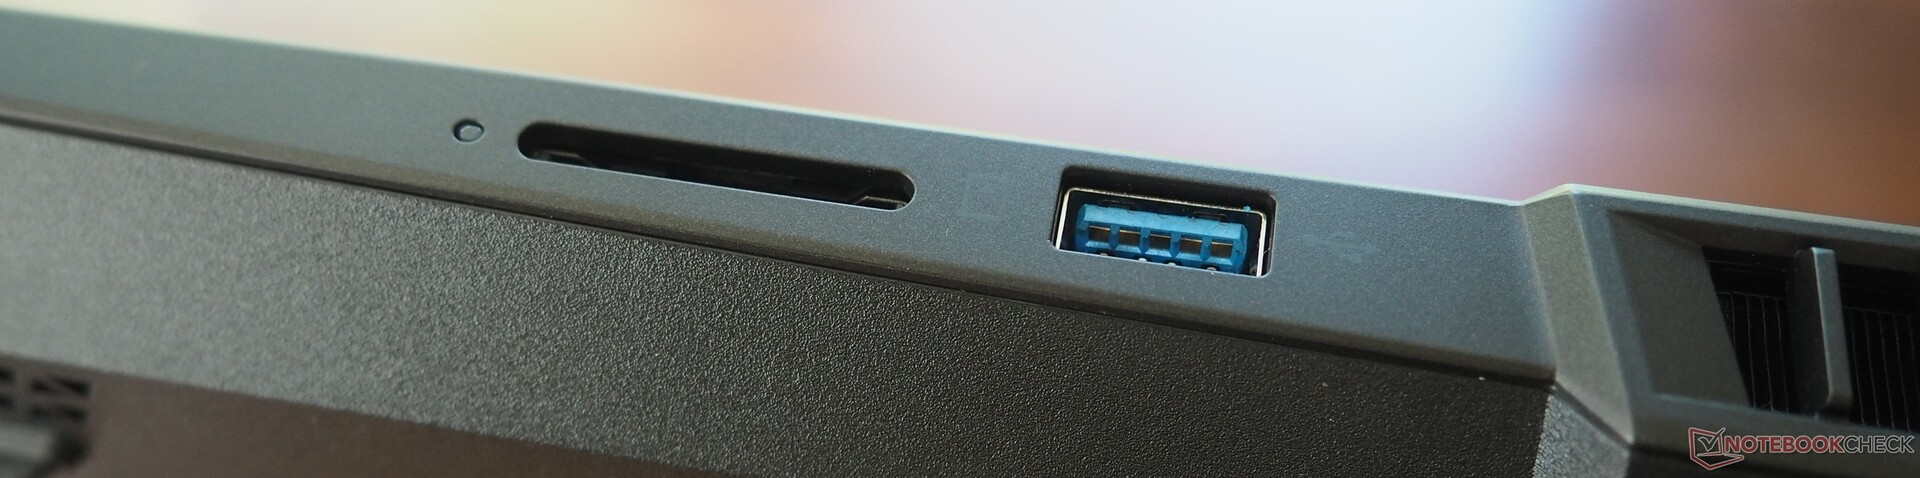
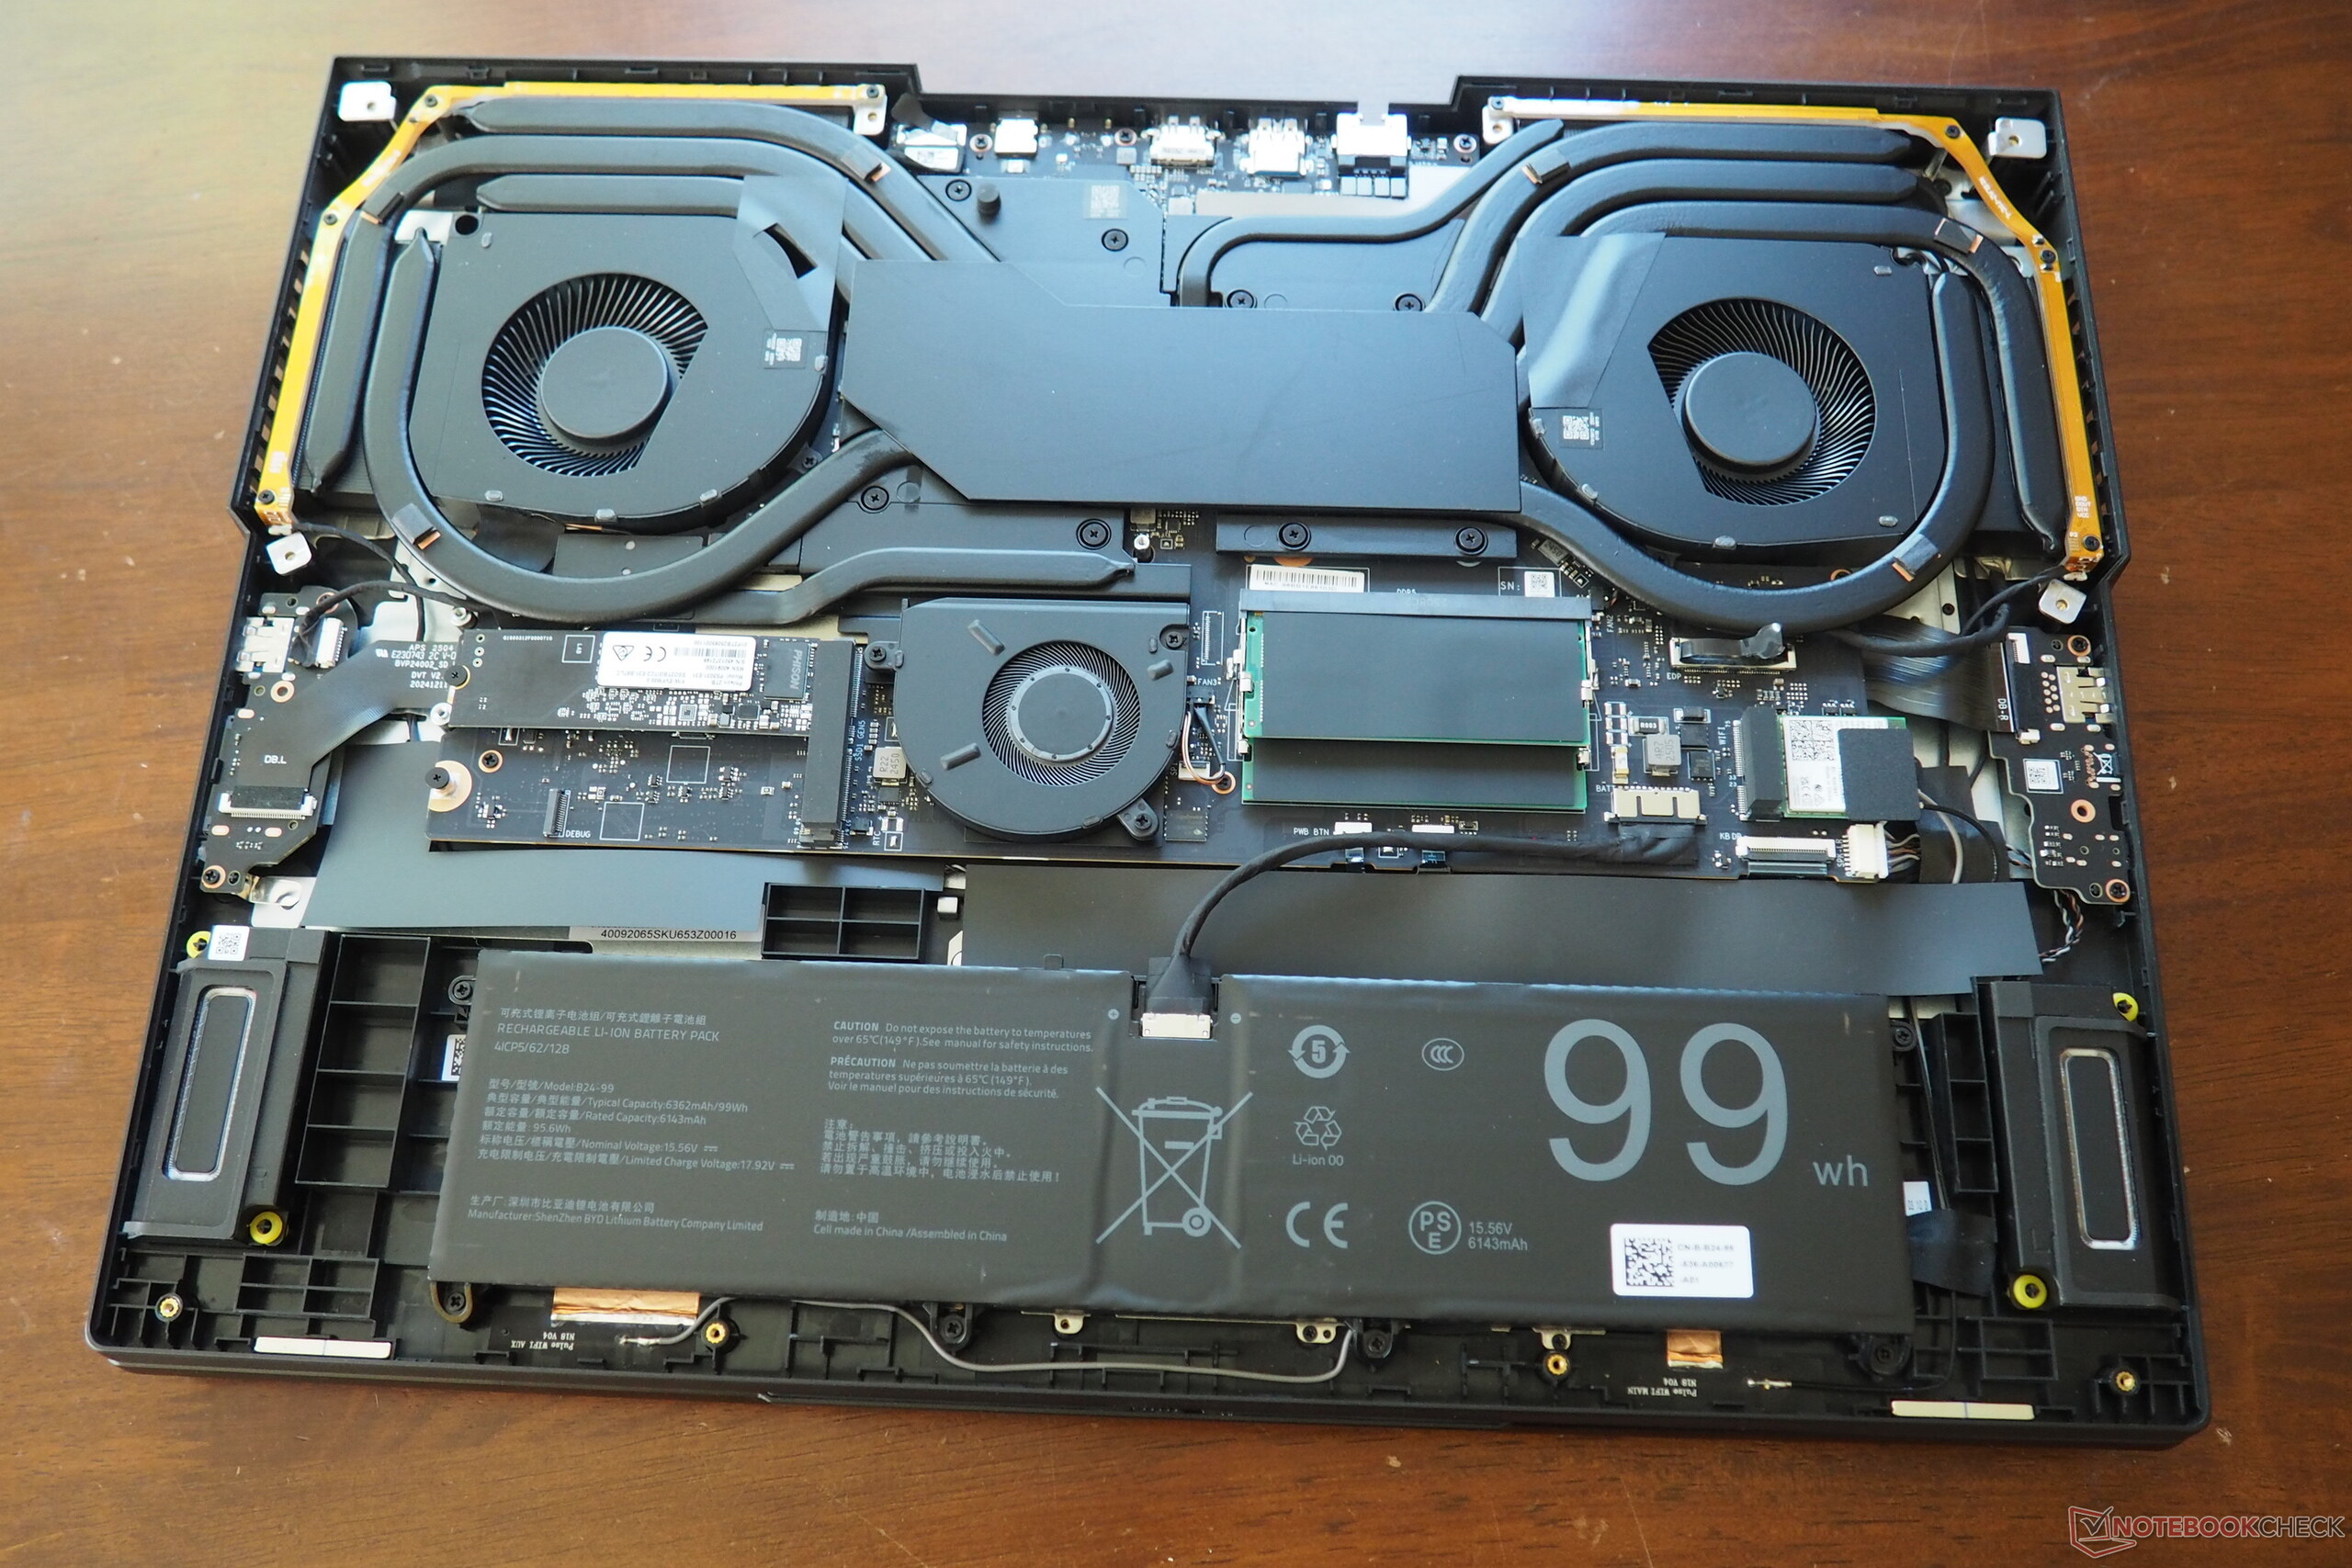
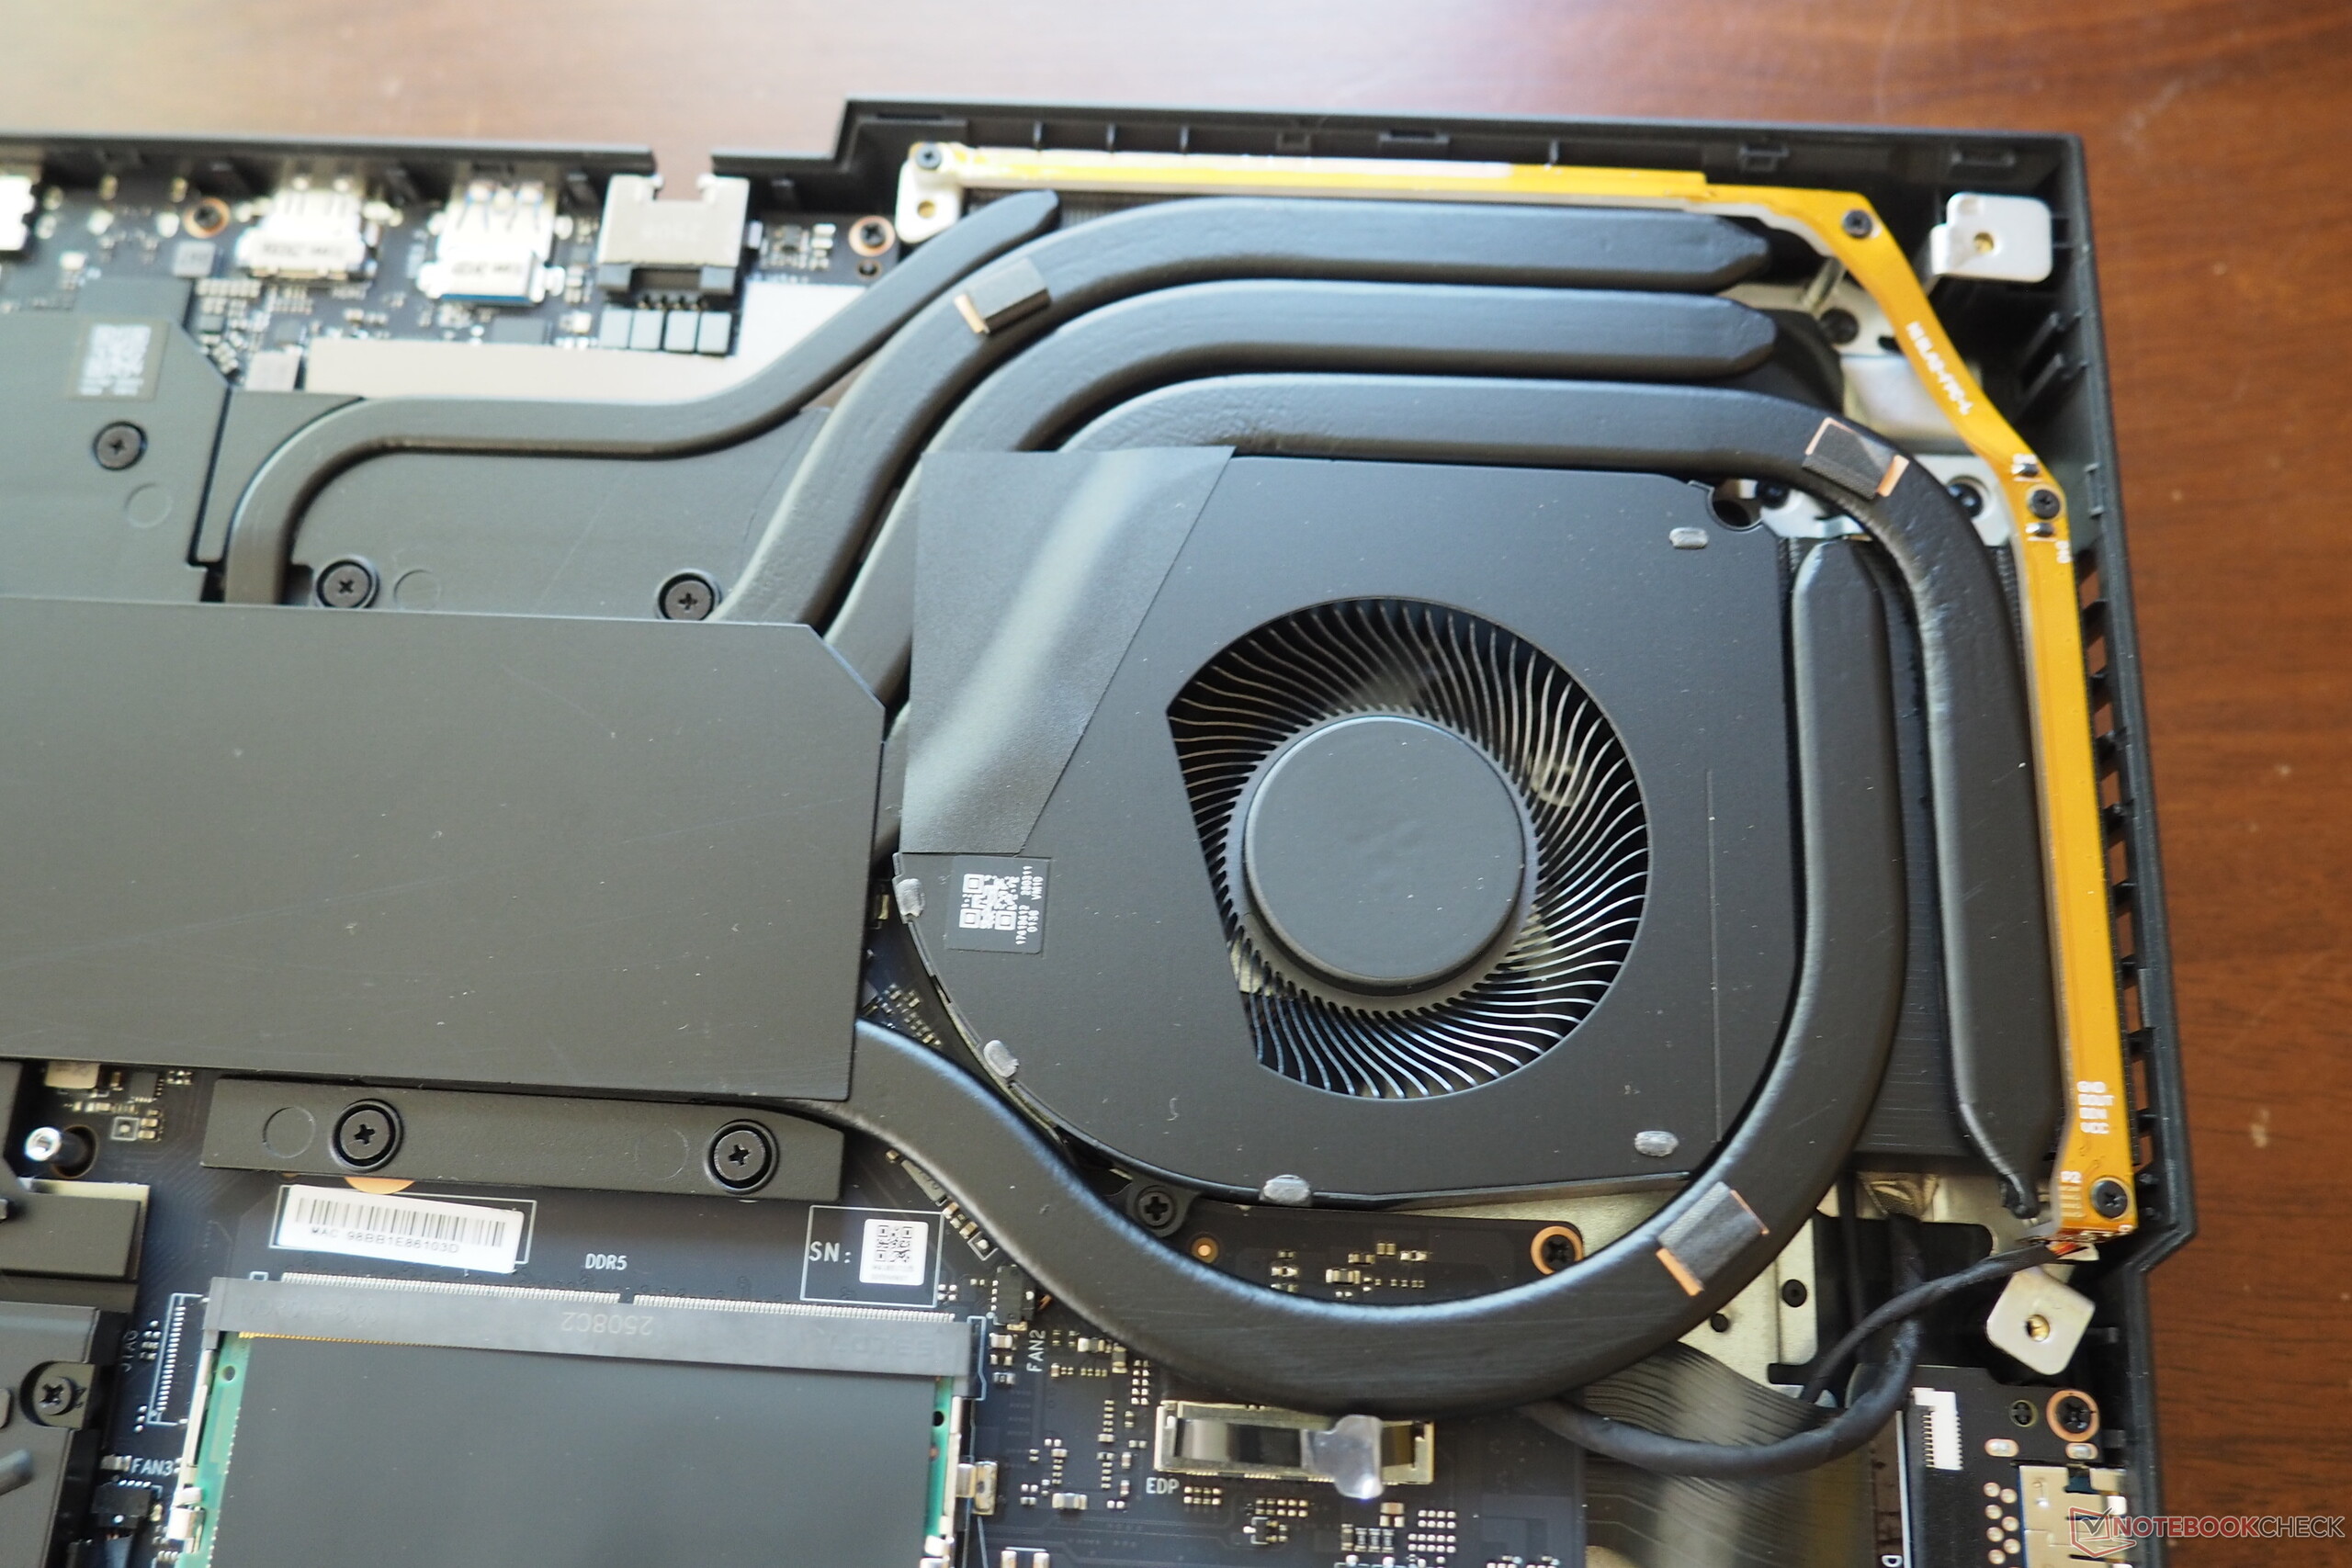
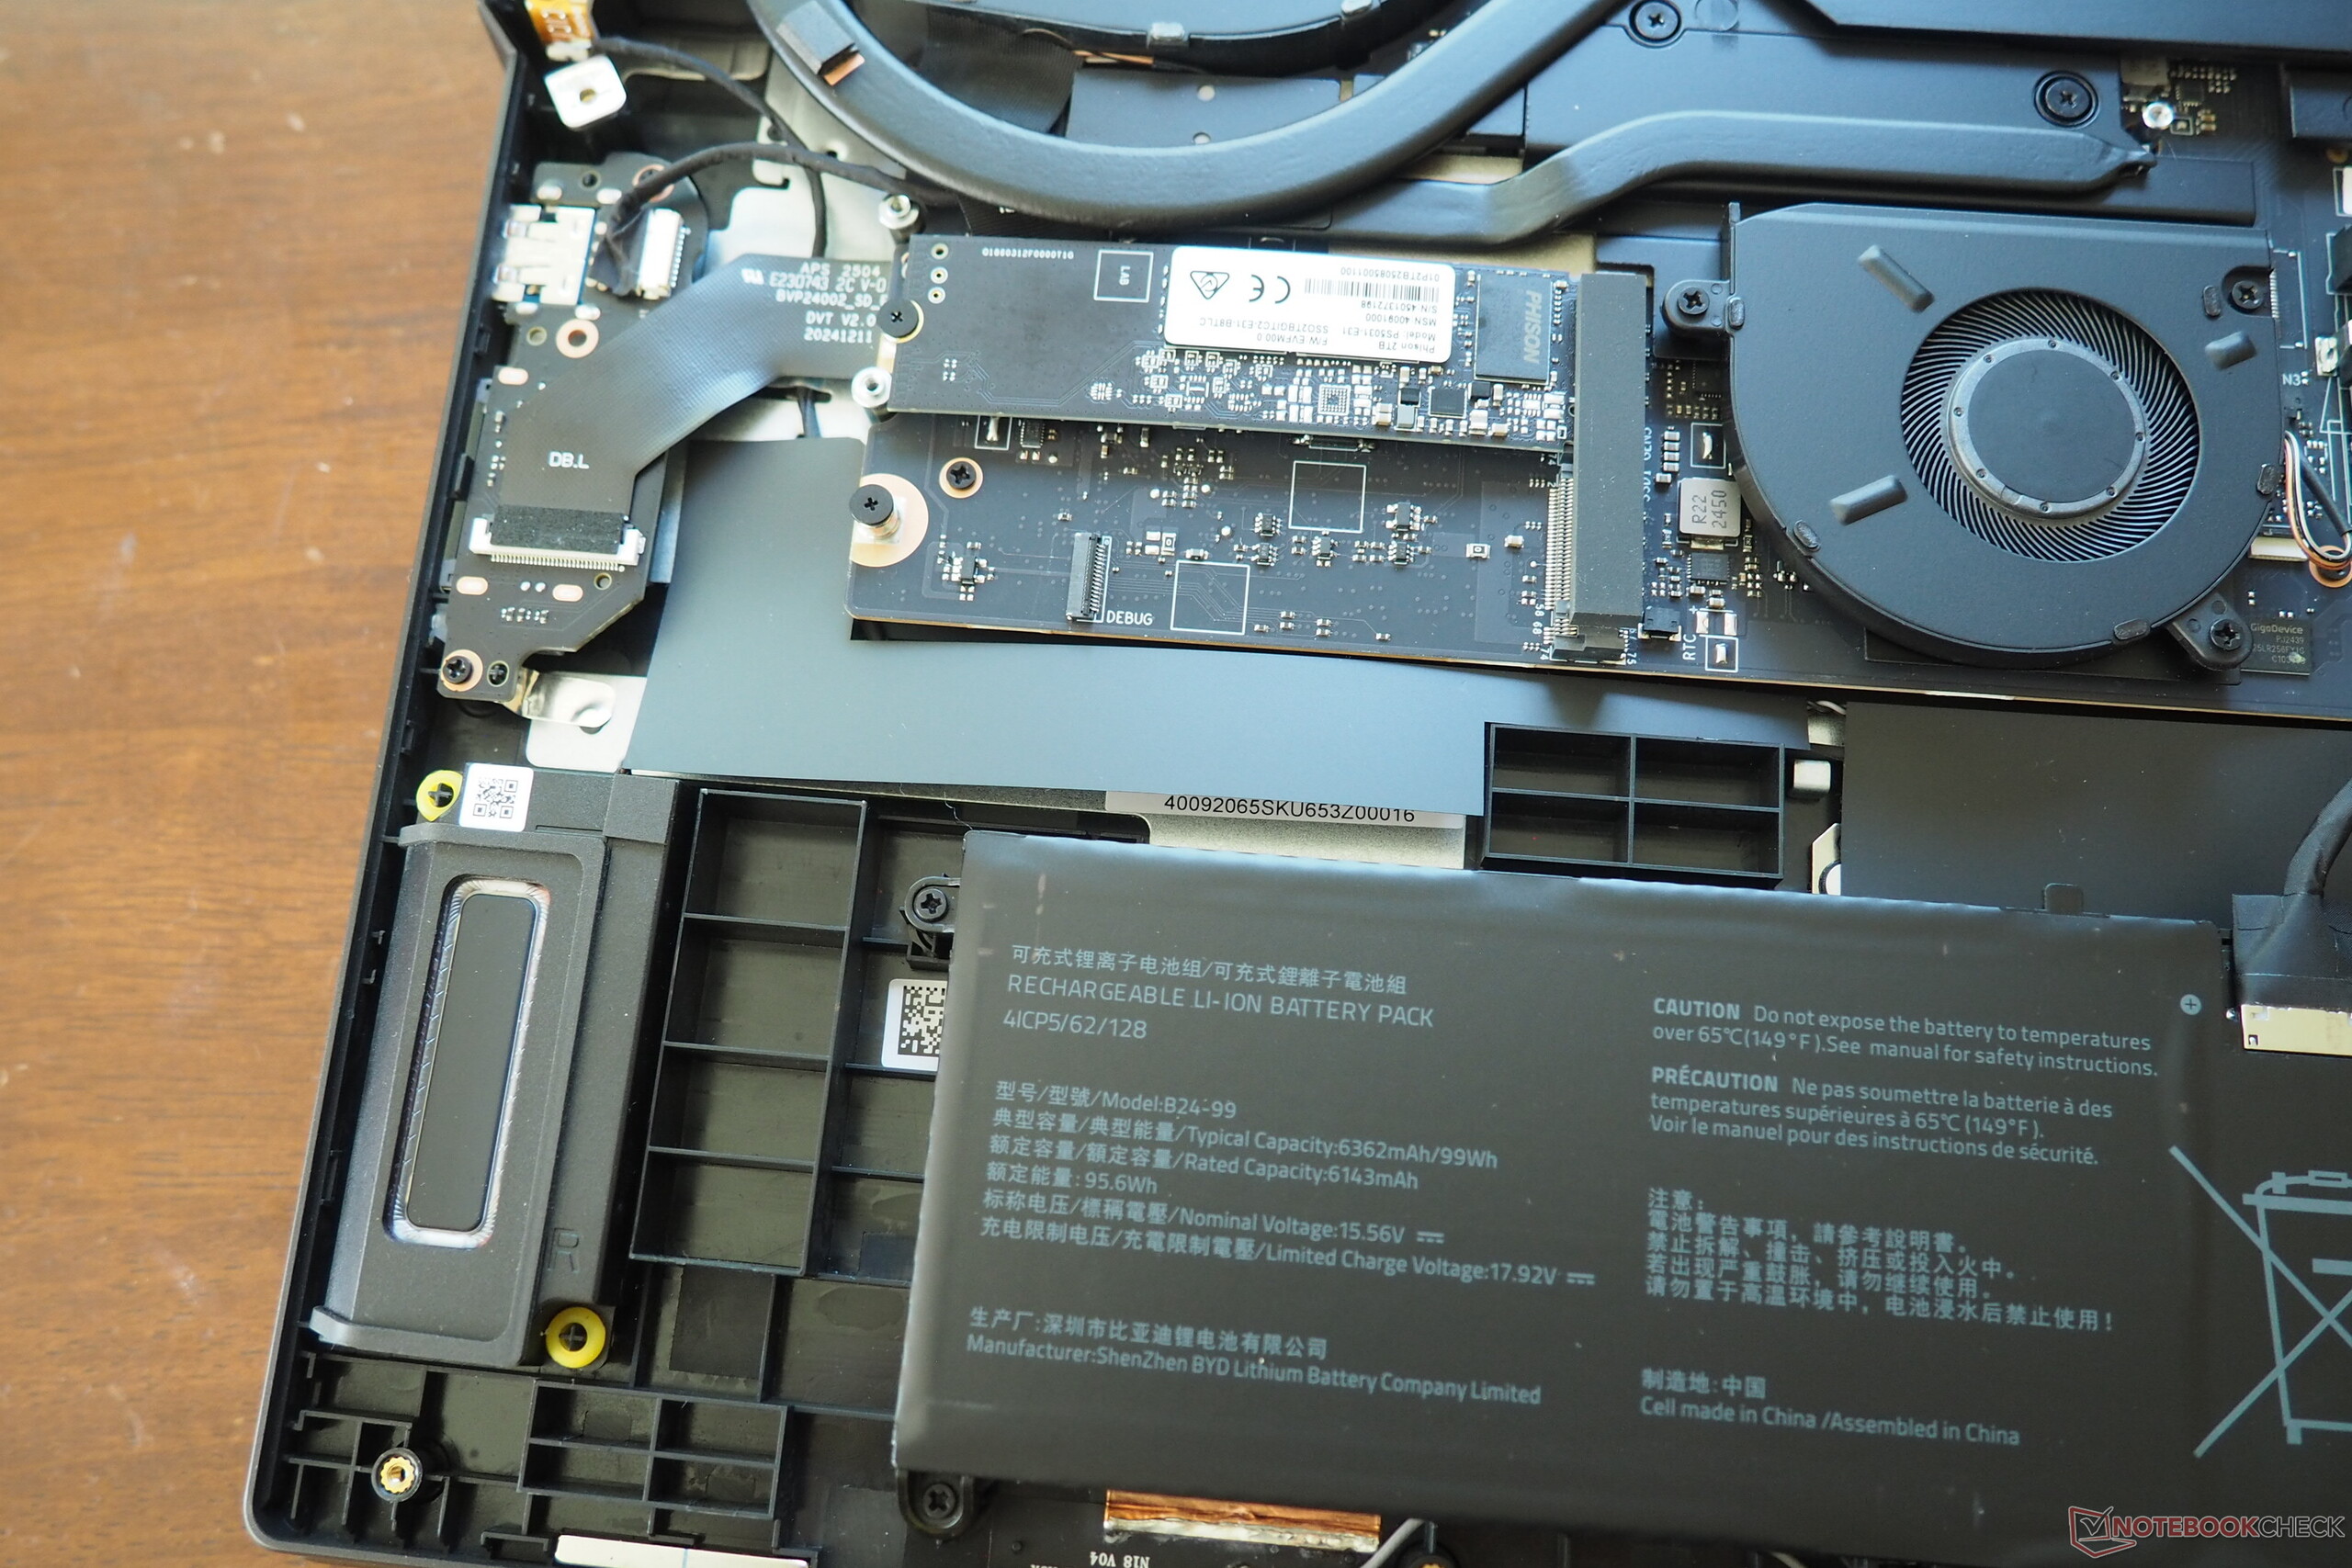
The selection of interfaces is impressive, as befits a desktop replacement. In addition to two USB-A ports (3.2 Gen1), there are also two Type-C ports, one of which supports the Thunderbolt 5 interface. There is also an audio socket, an HDMI 2.1 output, a pleasingly fast card reader, and a 2.5 Gbit network port. Wireless connections are handled by an Intel Wi-Fi 7 chip (BE200), which scored particularly well in the test with its speed. Meanwhile, the FHD webcam does not generate any cheers, but does offer physical coverage, which is not a given. Maintenance of the Erazer Beast 18 X1 is moderately easy or difficult: After removing 11 Phillips screws, the base plate can be levered out of its anchoring, revealing a cooling system with three fans. Both of the two RAM slots are occupied, but there is still room for the M.2 slots.
SD Card Reader
| SD Card Reader | |
| average JPG Copy Test (av. of 3 runs) | |
| Medion Erazer Beast 18 X1 MD62731 (AV PRO microSD 128 GB V60) | |
| Aorus Master 18 AM8H (AV PRO microSD 128 GB V60) | |
| Average of class Gaming (20.9 - 210, n=54, last 2 years) | |
| Acer Predator Helios 18 N23Q2 | |
| MSI GE78HX 13VH-070US (Angelibird AV Pro V60) | |
| maximum AS SSD Seq Read Test (1GB) | |
| Aorus Master 18 AM8H (AV PRO microSD 128 GB V60) | |
| Medion Erazer Beast 18 X1 MD62731 (AV PRO microSD 128 GB V60) | |
| Average of class Gaming (25.5 - 261, n=51, last 2 years) | |
| MSI GE78HX 13VH-070US (Angelibird AV Pro V60) | |
| Acer Predator Helios 18 N23Q2 | |
Communication
Webcam


Input devices
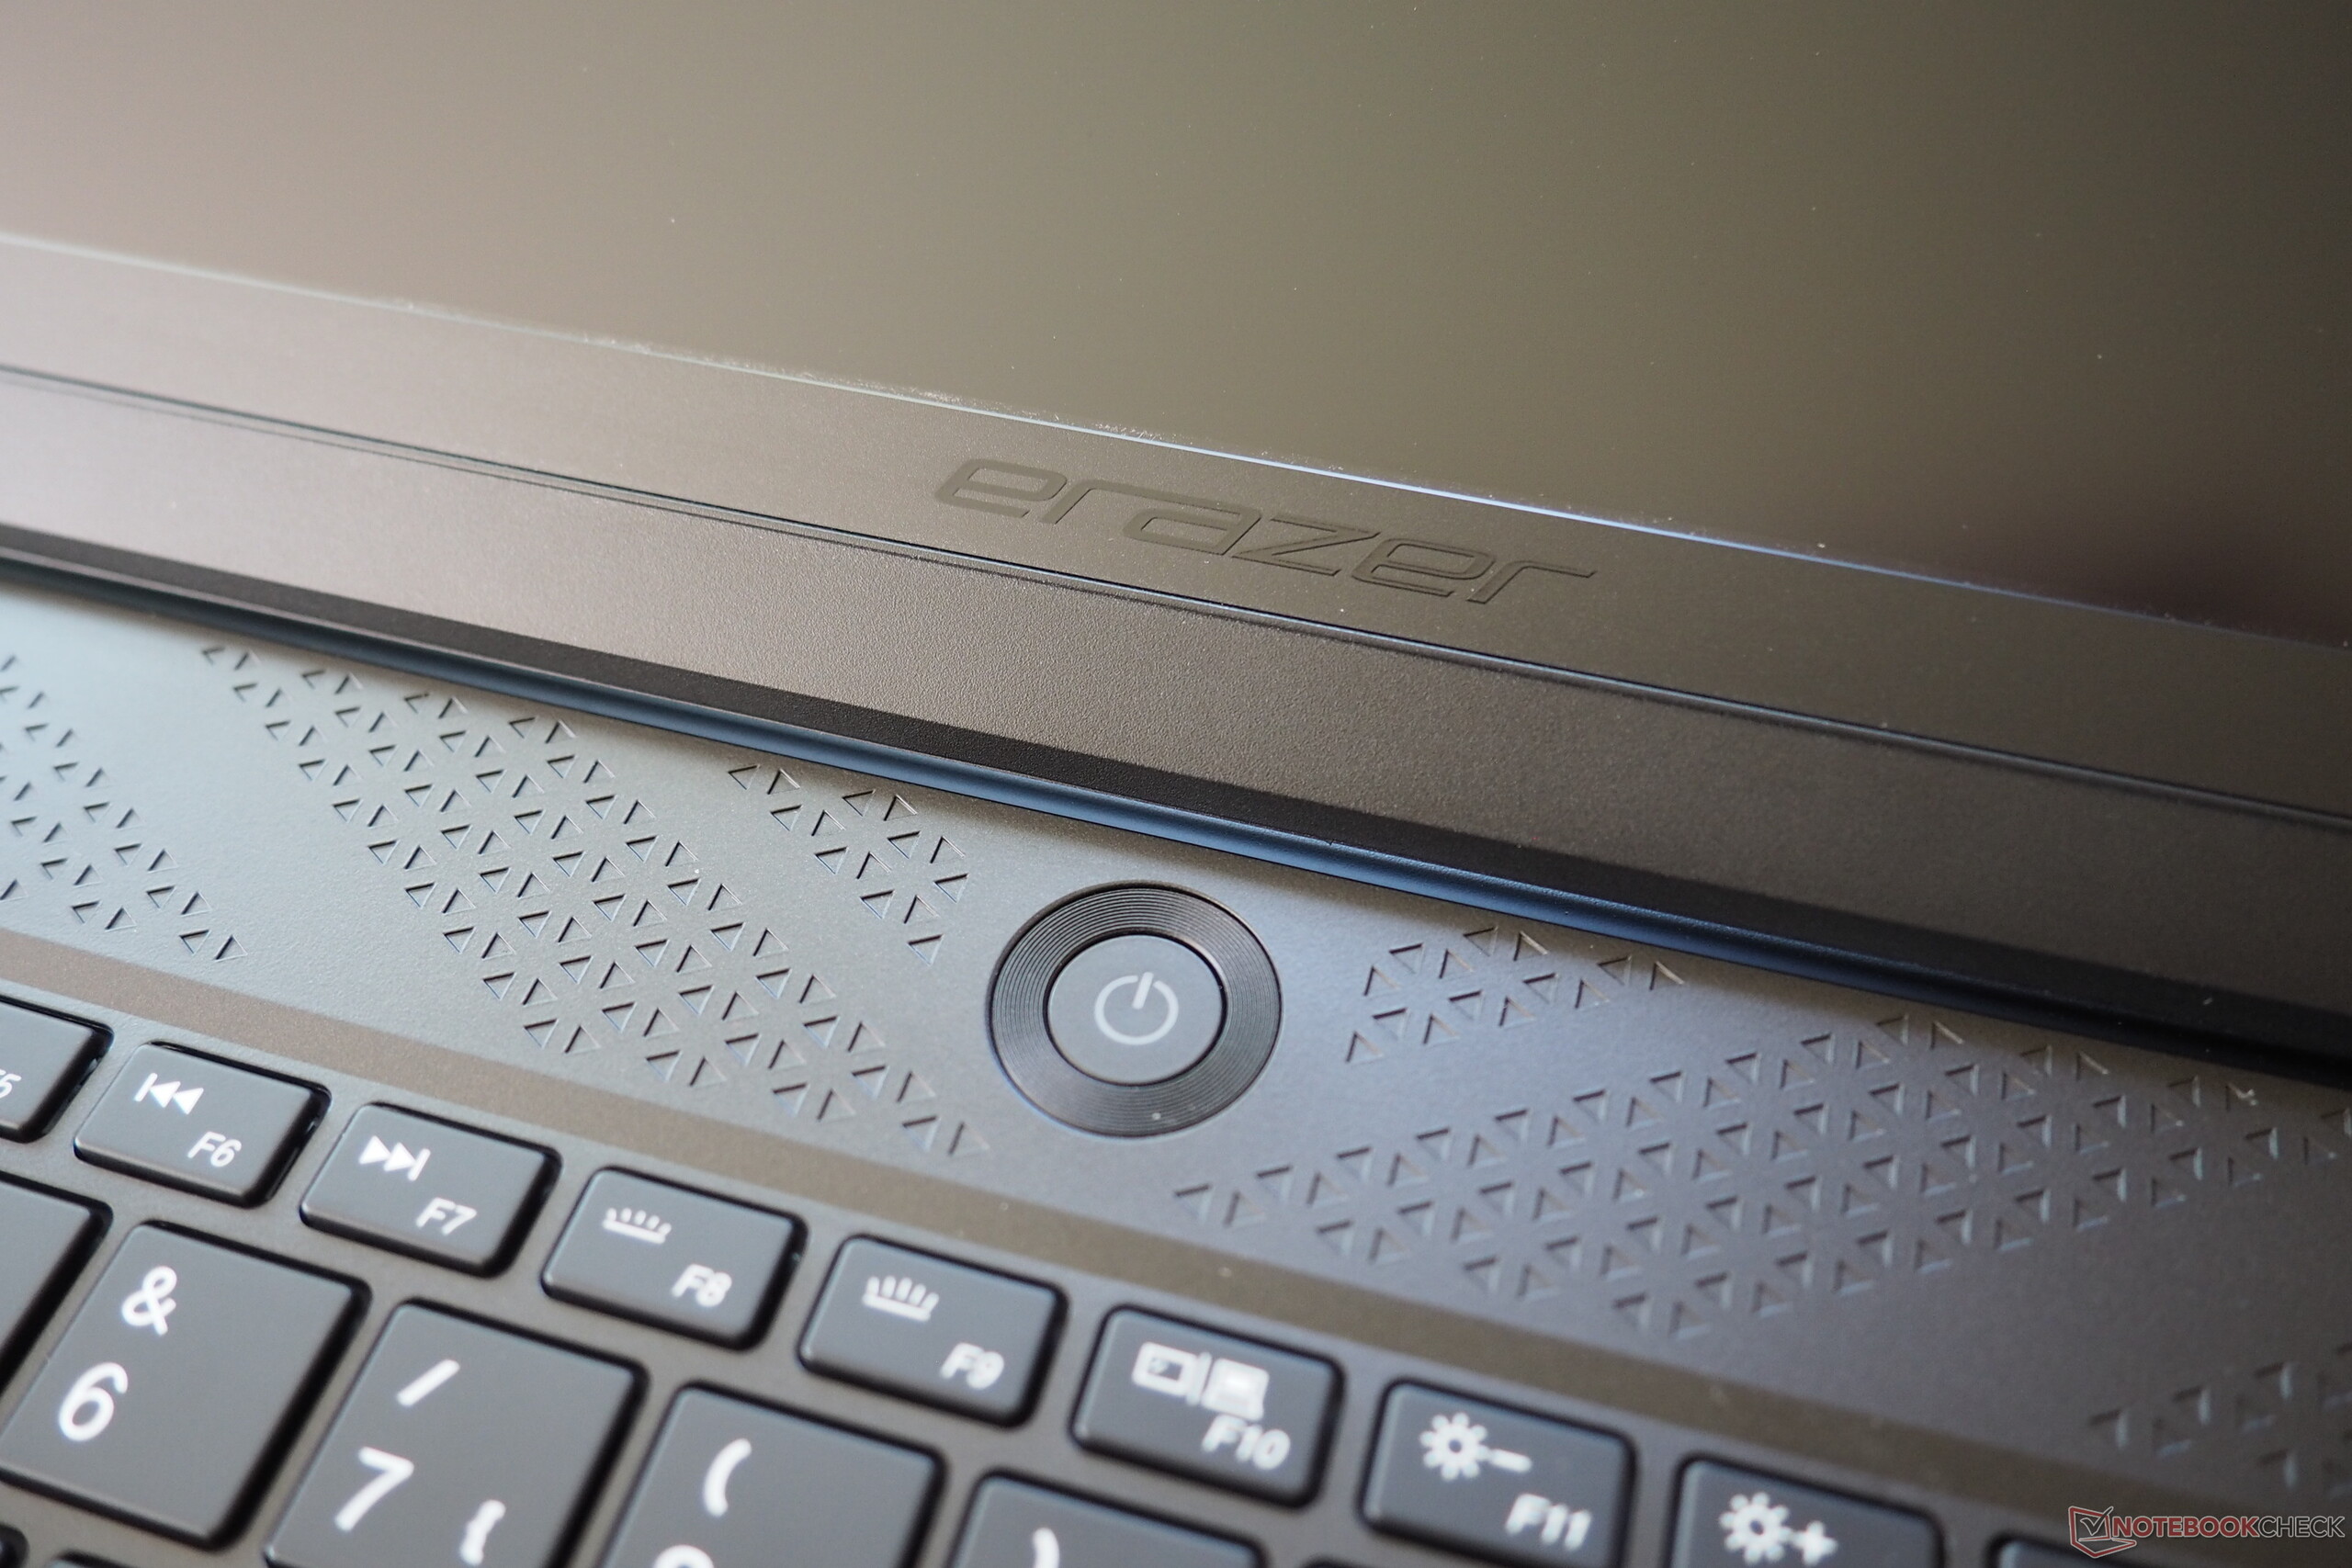
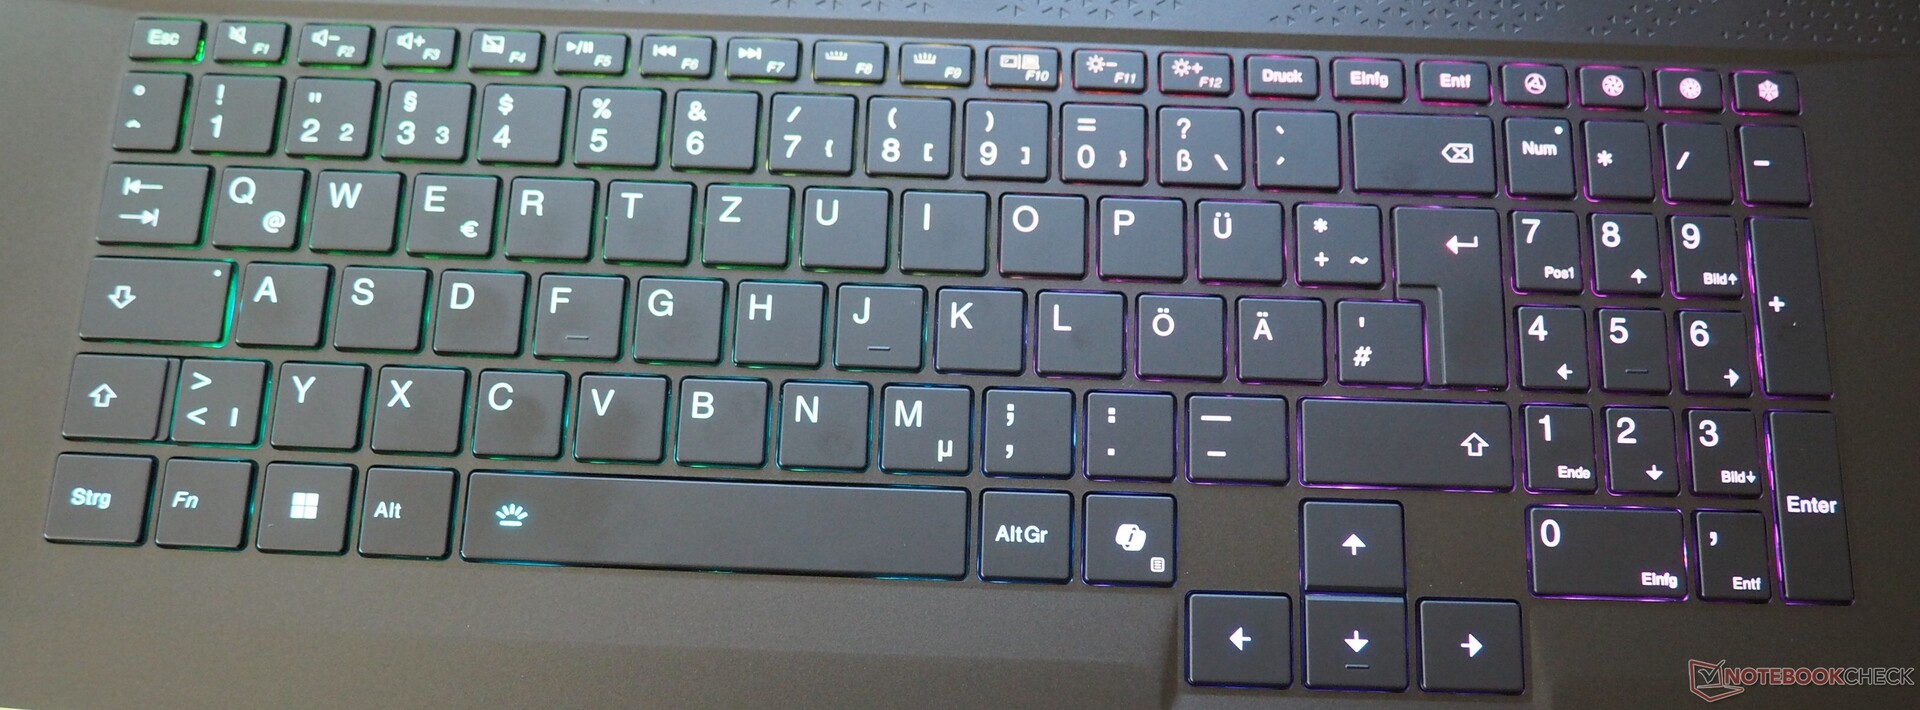
The chiclet keyboard has a dedicated numpad and impresses with normal-sized directional arrows and (in the top right corner) practical special keys for fan control. The feedback and key feel seem acceptable to us; the Aorus Master 18, for example, performs even better here. The clickpad could be more stable here and there, but with a size of around 13 x 8 cm, it is appropriately sized for an 18-inch product.
Display
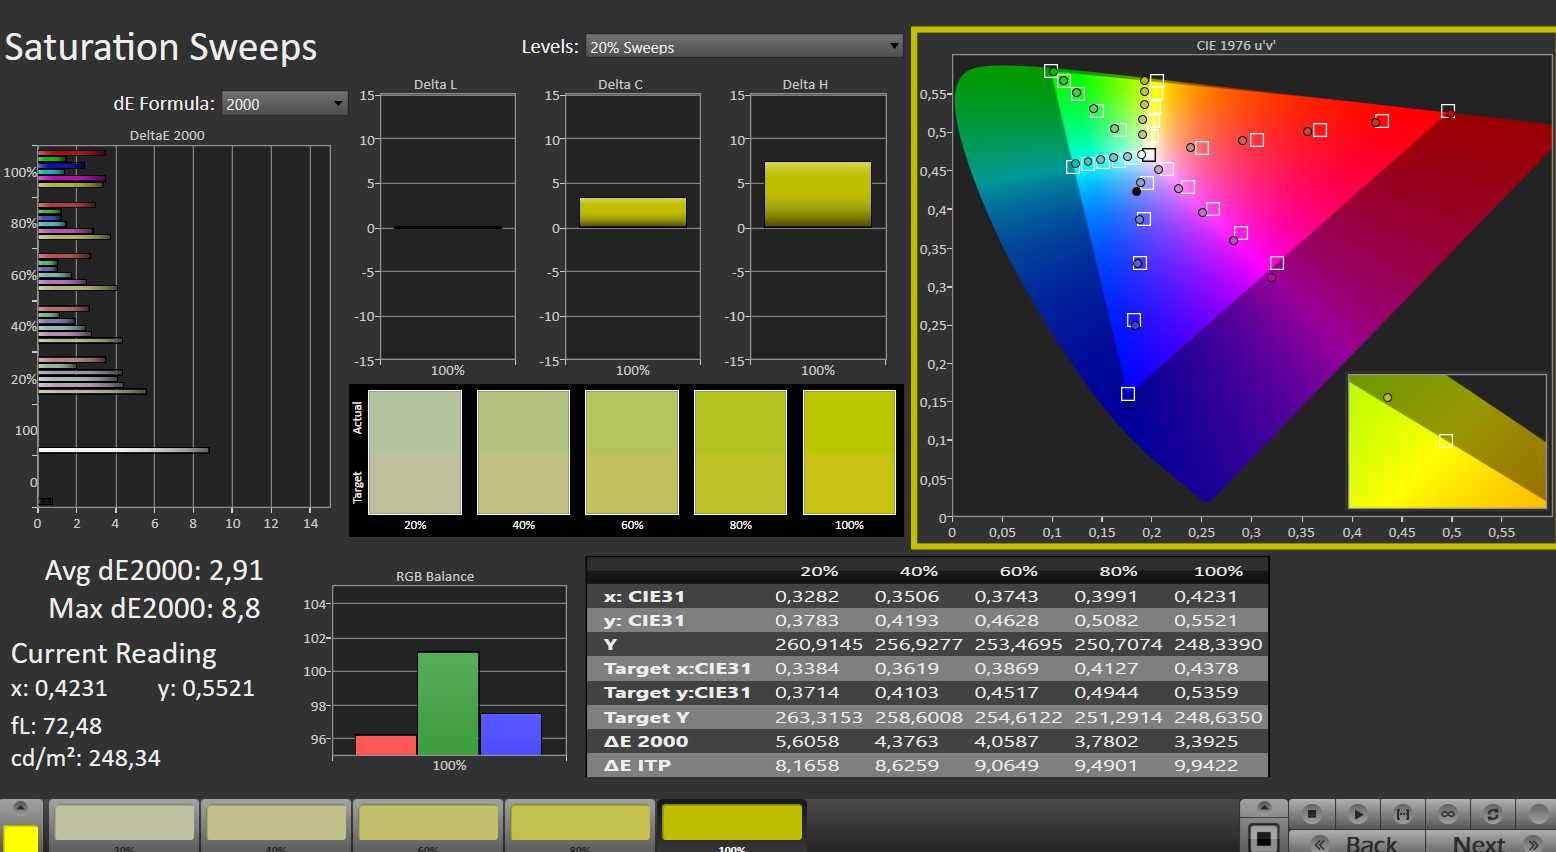
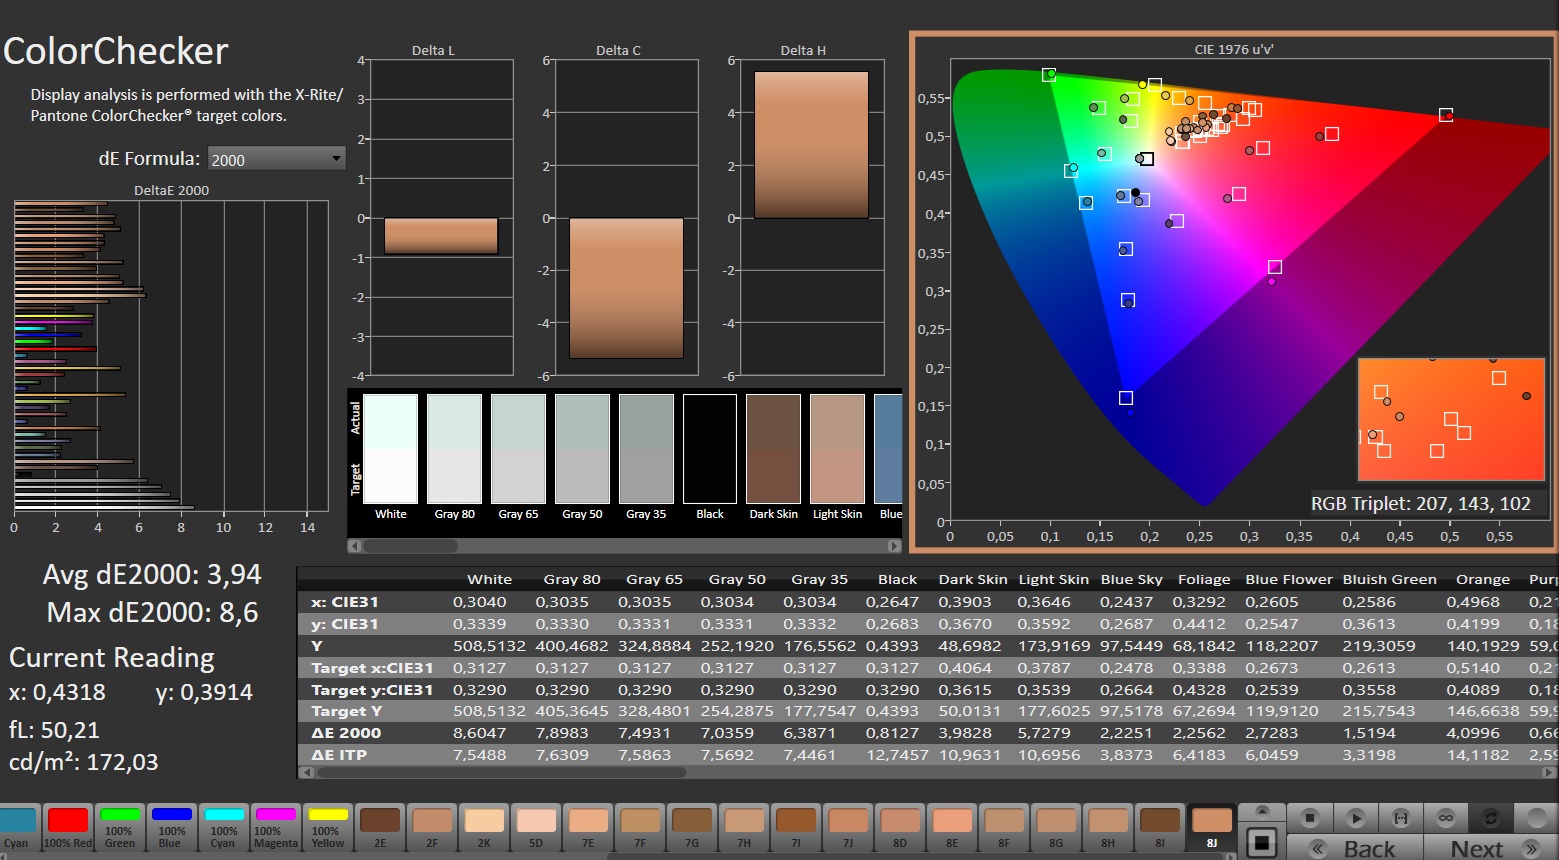
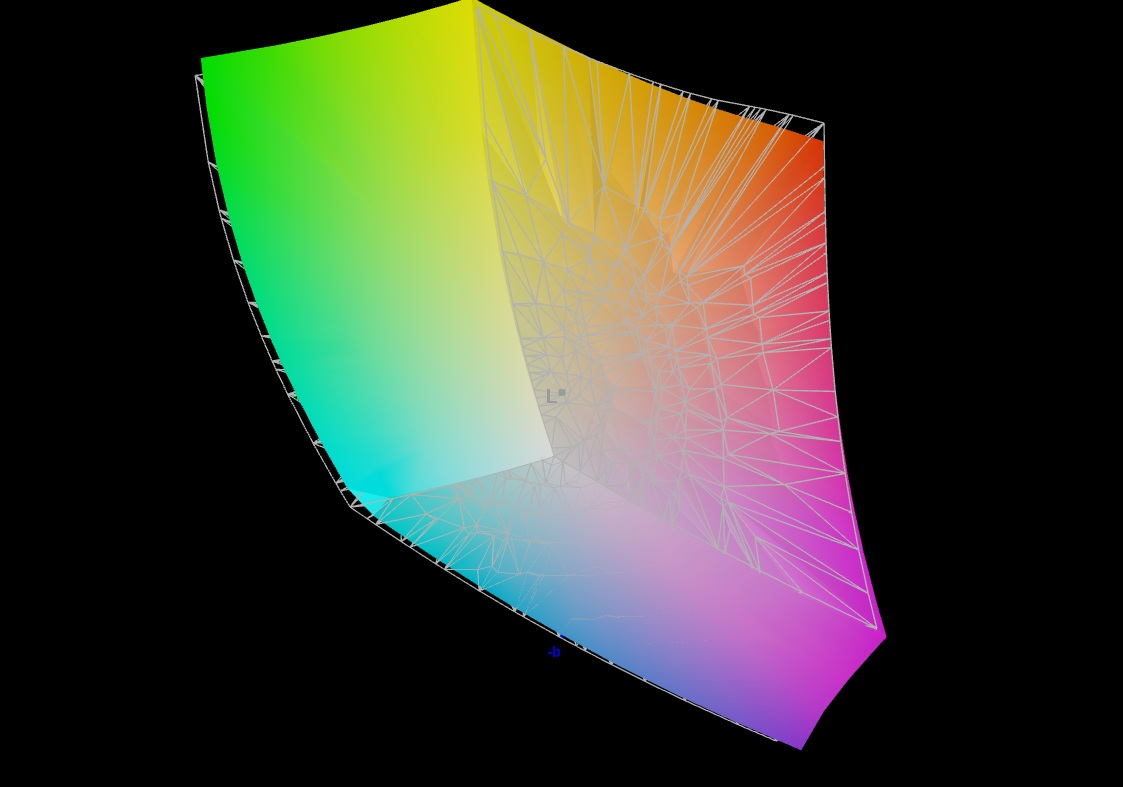
Medion does not use an OLED or mini-LED panel, but instead relies on a classic IPS display, which nevertheless delivers a good performance in most disciplines.
| |||||||||||||||||||||||||
Brightness Distribution: 89 %
Center on Battery: 478 cd/m²
Contrast: 1195:1 (Black: 0.4 cd/m²)
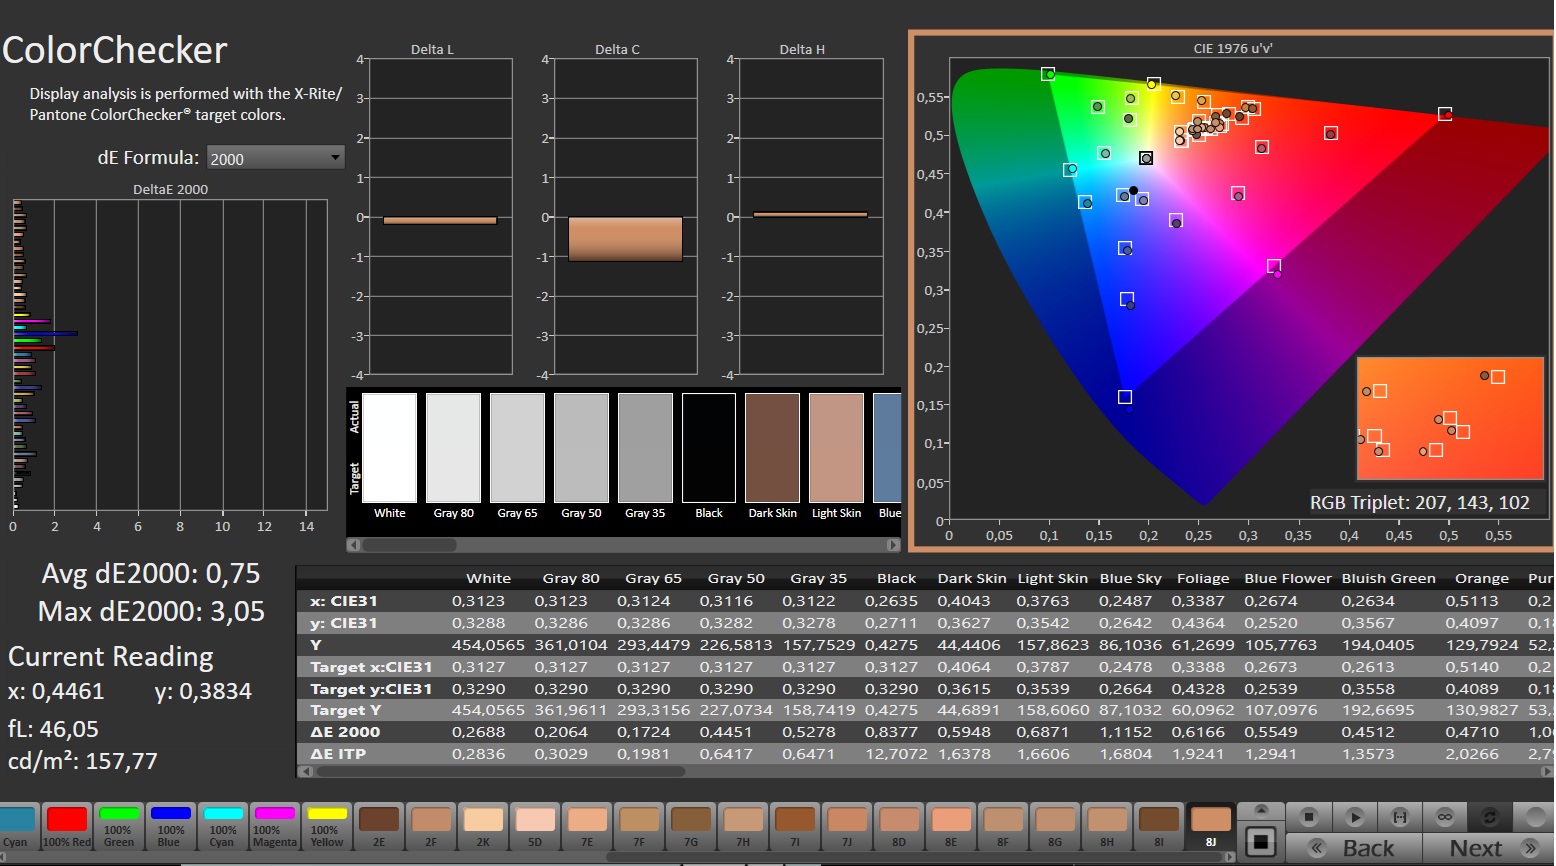
ΔE ColorChecker Calman: 3.94 | ∀{0.5-29.43 Ø4.72}
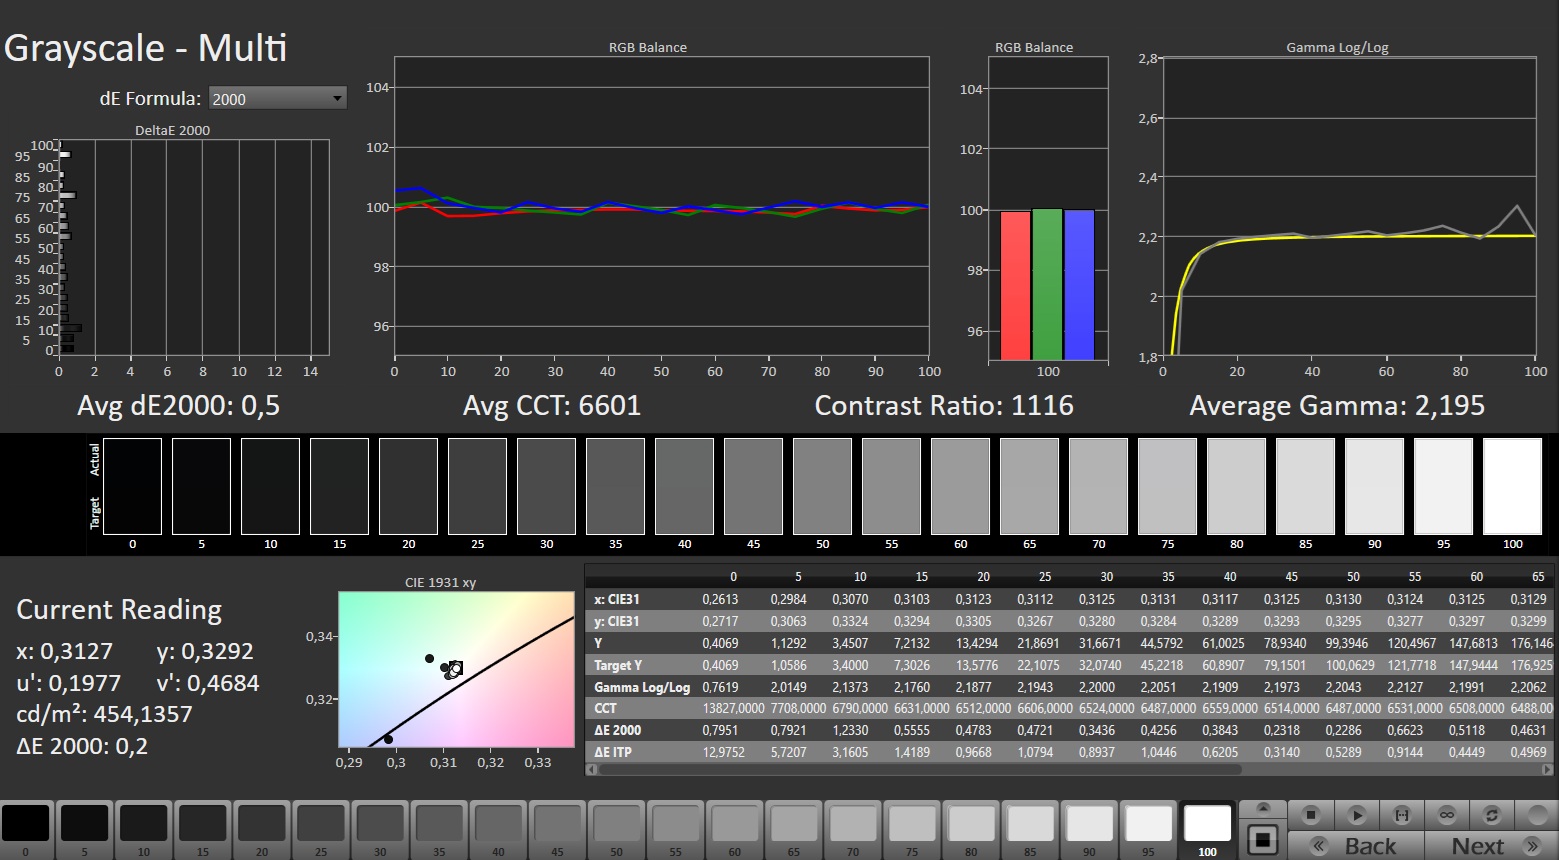
calibrated: 0.75
ΔE Greyscale Calman: 5.5 | ∀{0.09-98 Ø4.97}
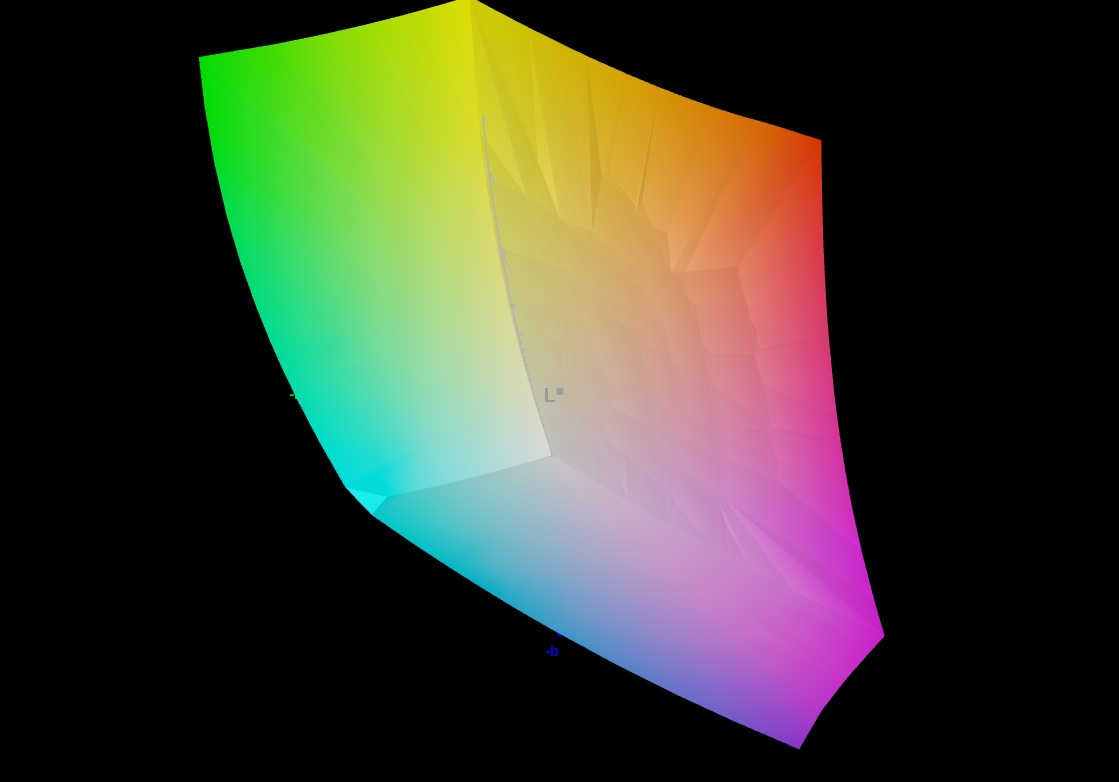
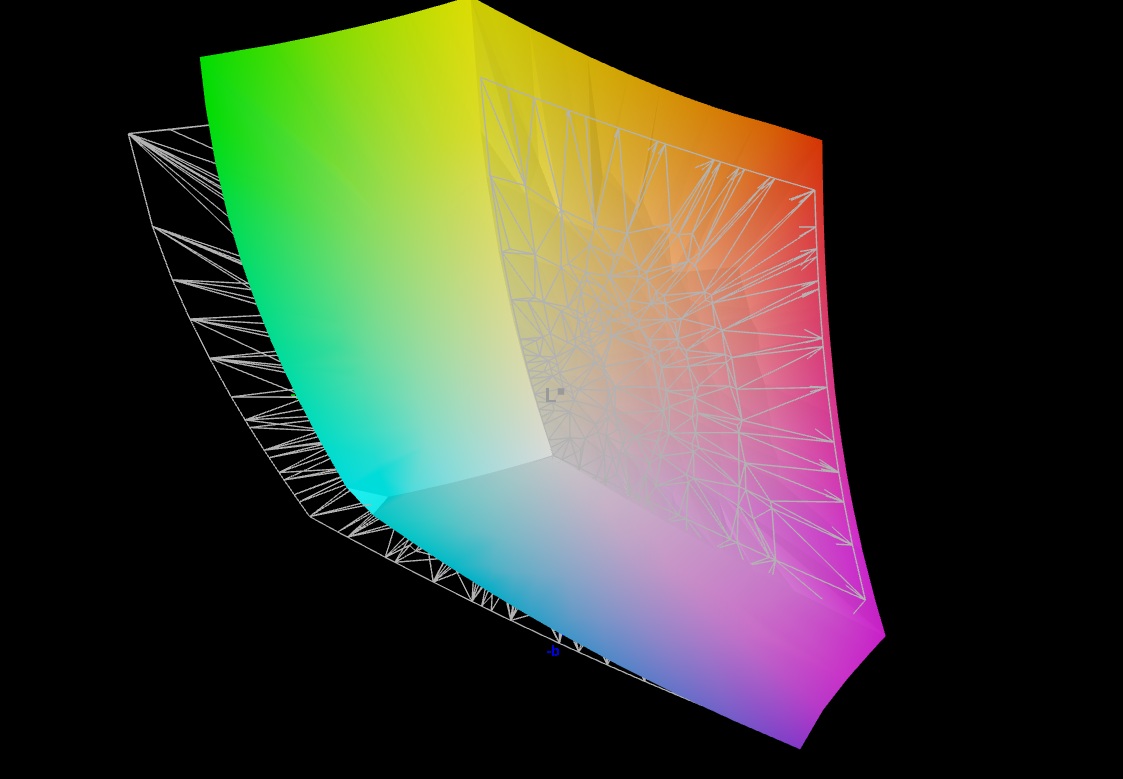
84.7% AdobeRGB 1998 (Argyll 3D)
99.9% sRGB (Argyll 3D)
97.1% Display P3 (Argyll 3D)
Gamma: 2.212
CCT: 7059 K
| Medion Erazer Beast 18 X1 MD62731 BOEhydis NE180QDM-NZ2, IPS, 2560x1600, 18", 240 Hz | MSI GE78HX 13VH-070US AU Optronics B170QAN01.2, IPS, 2560x1600, 17", 240 Hz | Acer Predator Helios 18 N23Q2 AUO45A8 (B180QAN01.2), IPS, 2560x1600, 18", 250 Hz | Asus Strix Scar 18 G835LX N180QDM-NM2, Mini-LED, 2560x1600, 18", 240 Hz | Aorus Master 18 AM8H NE180QDM-NM1 (BOE0C58), Mini-LED, 2560x1600, 18", 240 Hz | Lenovo Legion Pro 7i 16 Gen 10 Samsung ATNA60HU01-0, OLED, 2560x1600, 16", 240 Hz | |
|---|---|---|---|---|---|---|
| Display | 1% | 4% | 2% | 2% | 4% | |
| Display P3 Coverage (%) | 97.1 | 97.6 1% | 99.8 3% | 99 2% | 99.9 3% | 99.5 2% |
| sRGB Coverage (%) | 99.9 | 99.9 0% | 100 0% | 100 0% | 100 0% | 100 0% |
| AdobeRGB 1998 Coverage (%) | 84.7 | 86.5 2% | 91.8 8% | 87.2 3% | 87.7 4% | 94.4 11% |
| Response Times | 19% | -90% | -37% | -102% | 95% | |
| Response Time Grey 50% / Grey 80% * (ms) | 5.6 ? | 4.2 ? 25% | 7.6 ? -36% | 7.4 ? -32% | 16.4 ? -193% | 0.28 ? 95% |
| Response Time Black / White * (ms) | 7.3 ? | 6.4 ? 12% | 17.8 ? -144% | 10.4 ? -42% | 8.1 ? -11% | 0.43 ? 94% |
| PWM Frequency (Hz) | 2509 | 20610 ? | 1398 ? | 1438 ? | ||
| PWM Amplitude * (%) | 100 | 100 | 29 | |||
| Screen | -15% | -14% | 119% | 53% | 20% | |
| Brightness middle (cd/m²) | 478 | 398.6 -17% | 360 -25% | 764 60% | 438 -8% | 490.4 3% |
| Brightness (cd/m²) | 456 | 384 -16% | 355 -22% | 747 64% | 451 -1% | 498 9% |
| Brightness Distribution (%) | 89 | 89 0% | 92 3% | 93 4% | 90 1% | 97 9% |
| Black Level * (cd/m²) | 0.4 | 0.46 -15% | 0.21 48% | 0.1 75% | 0.13 67% | |
| Contrast (:1) | 1195 | 867 -27% | 1714 43% | 7640 539% | 3369 182% | |
| Colorchecker dE 2000 * | 3.94 | 4.05 -3% | 3.82 3% | 1.2 70% | 1.25 68% | 3.2 19% |
| Colorchecker dE 2000 max. * | 8.6 | 8.68 -1% | 7.38 14% | 2.8 67% | 4.93 43% | 6.04 30% |
| Colorchecker dE 2000 calibrated * | 0.75 | 1.02 -36% | 2.24 -199% | 0.84 -12% | ||
| Greyscale dE 2000 * | 5.5 | 6.5 -18% | 5.06 8% | 1.5 73% | 1.7 69% | 1 82% |
| Gamma | 2.212 99% | 2.11 104% | 2.52 87% | 2.17 101% | 2.173 101% | 2.24 98% |
| CCT | 7059 92% | 7518 86% | 5657 115% | 6556 99% | 6518 100% | 6373 102% |
| Total Average (Program / Settings) | 2% /
-7% | -33% /
-21% | 28% /
68% | -16% /
17% | 40% /
29% |
* ... smaller is better
Starting with the color space, which covers almost 100% of sRGB and DCI-P3 (AdobeRGB is covered at 85%). The luminosity is good as well, with an average of 456 cd/m² available.
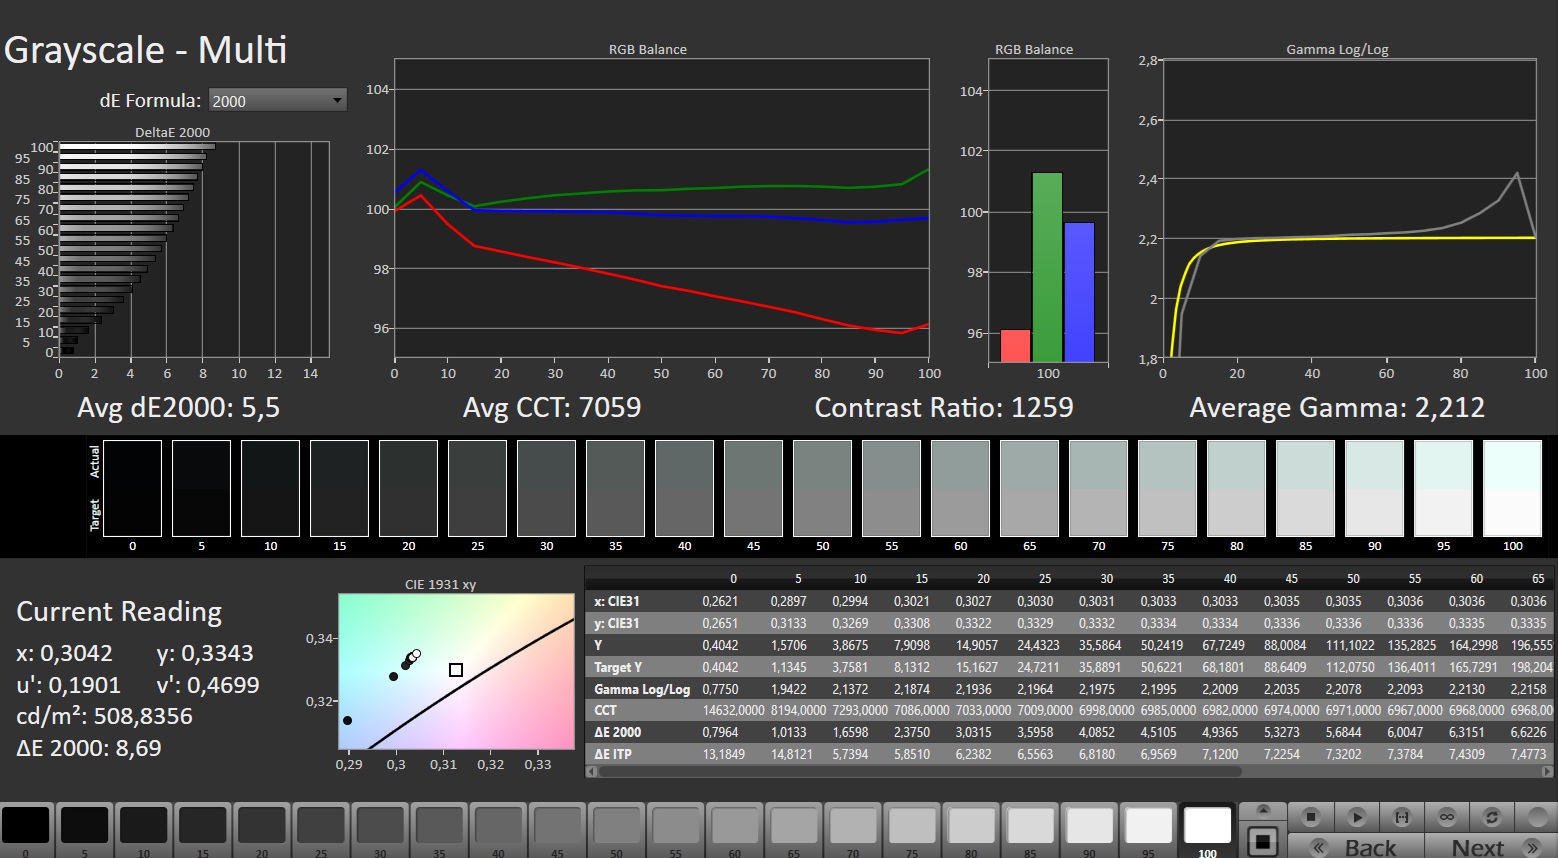
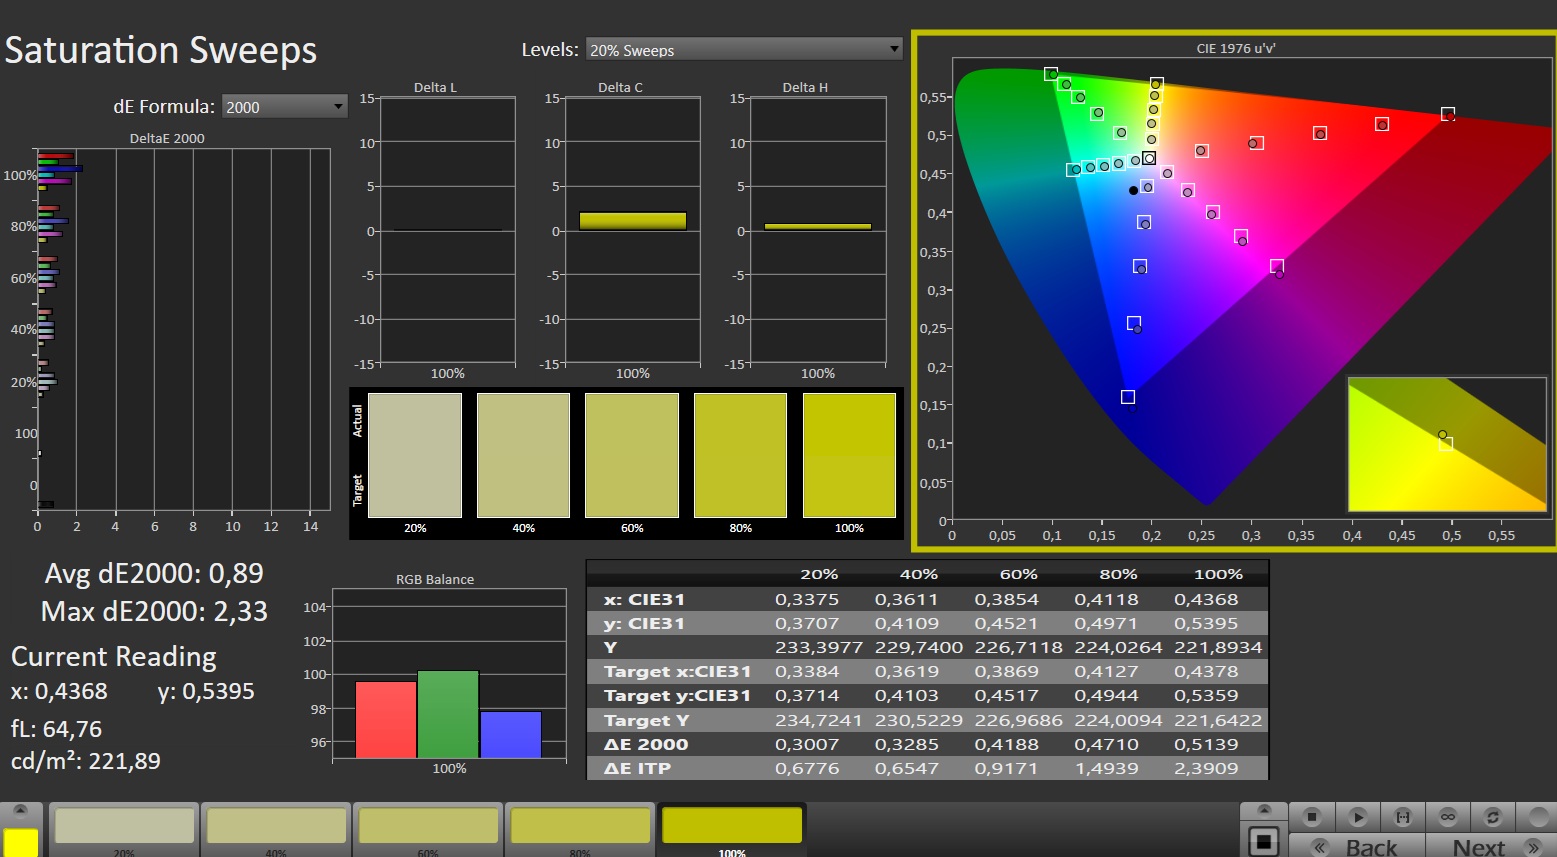
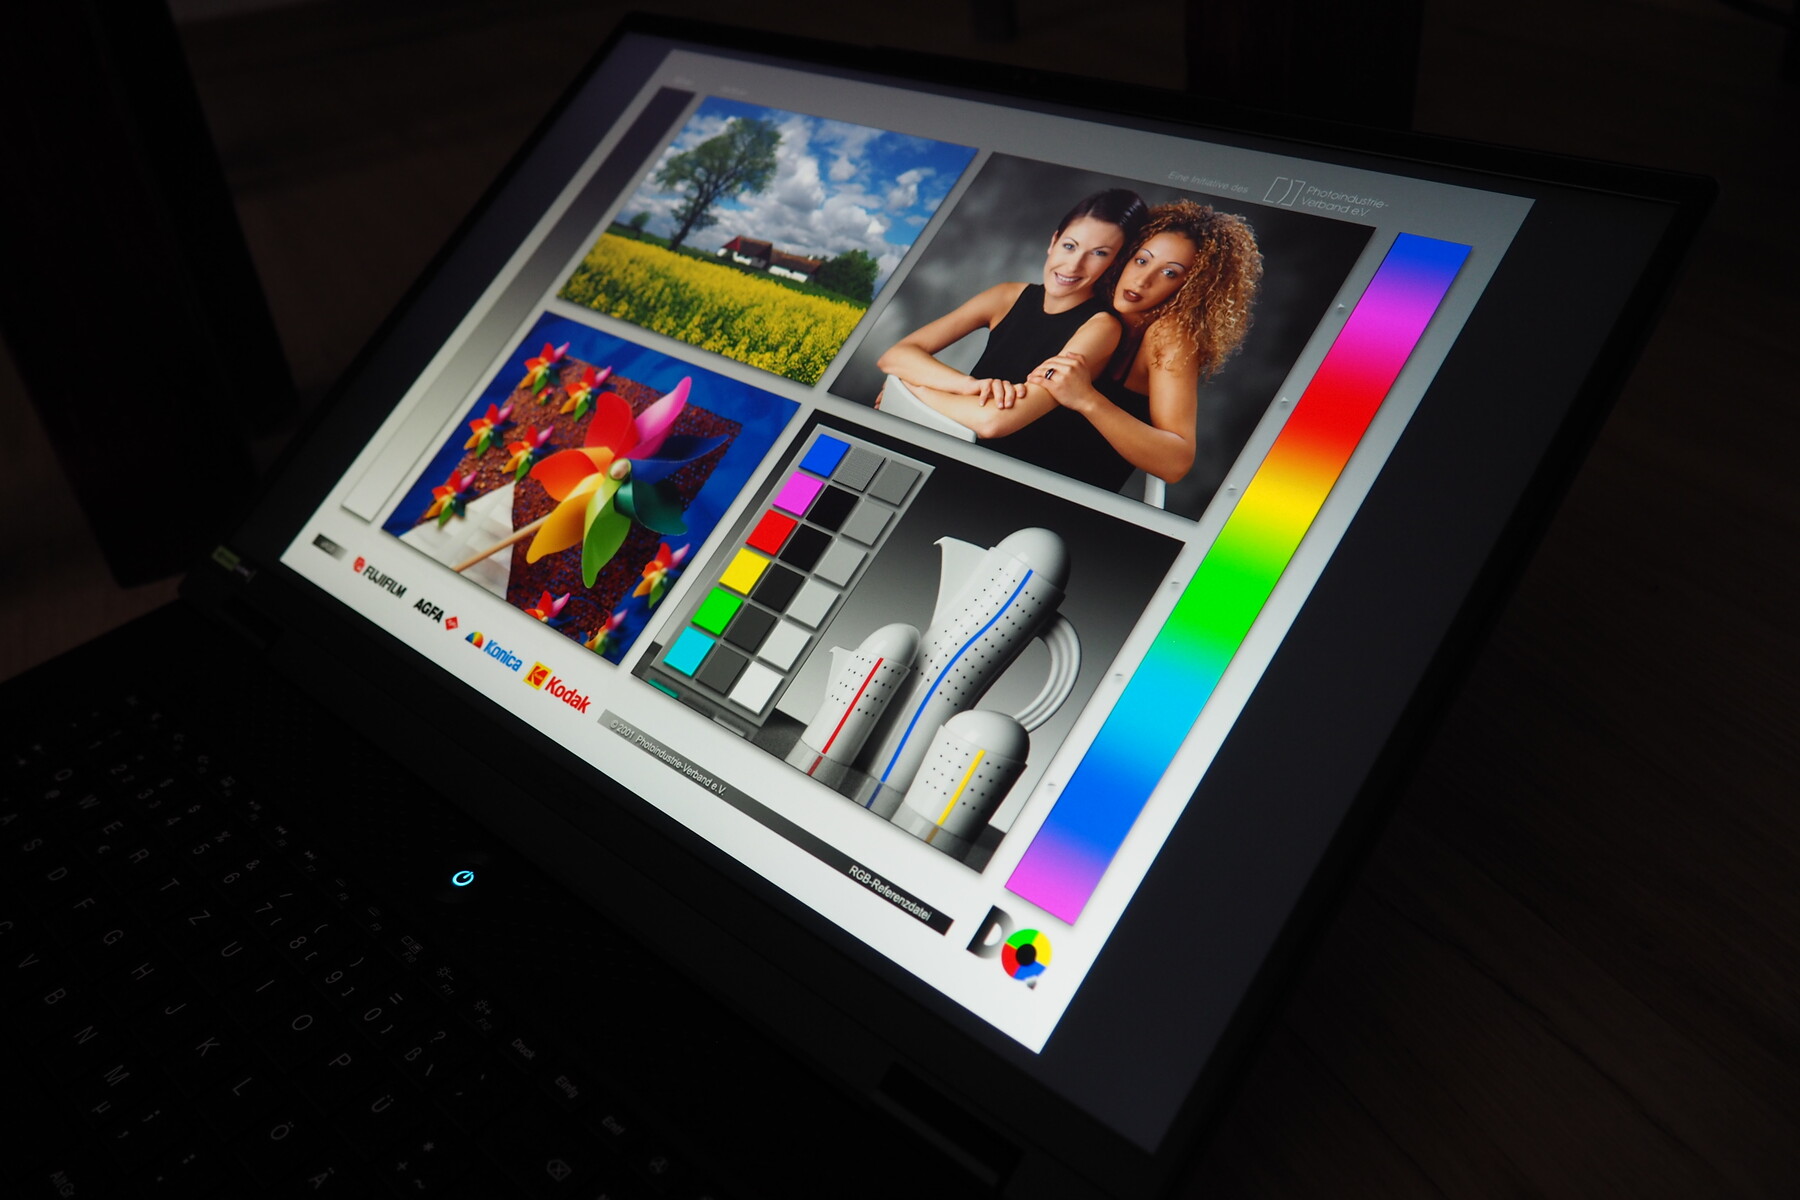
The contrast is only decent due to the mediocre black value of 0.4 cd/m², but 1,195:1 is still within the usual IPS range. The same applies to the viewing angles and the response time, which, according to our measurements, is around 5 to 7 ms.
According to the specifications, the 18-inch screen also supports 240 Hz refresh rate. It has a 2,560 x 1,600 pixels resolution (16:10 format), which is neither low nor particularly high in relation to the screen diagonal.
Display Response Times
| ↔ Response Time Black to White | ||
|---|---|---|
| 7.3 ms ... rise ↗ and fall ↘ combined | ↗ 2.2 ms rise | 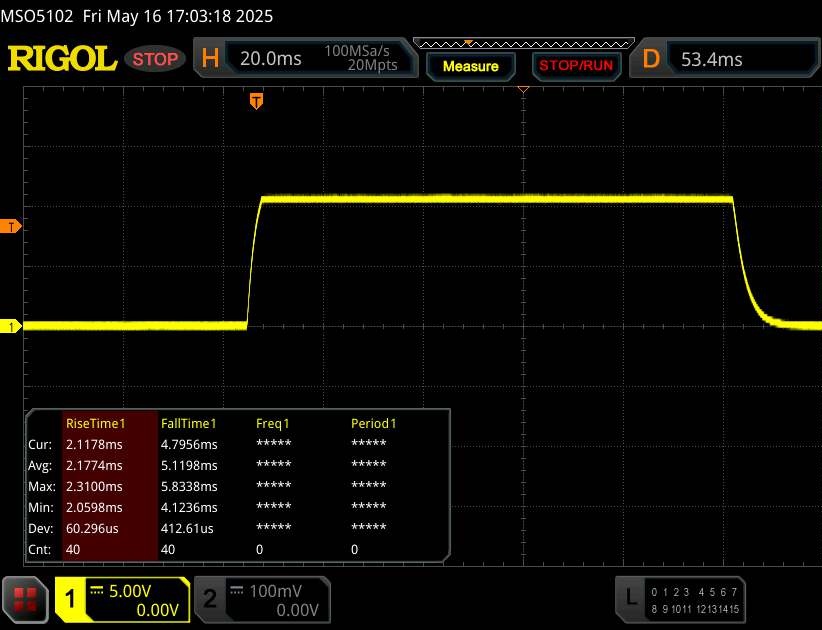 |
| ↘ 5.1 ms fall | ||
| The screen shows very fast response rates in our tests and should be very well suited for fast-paced gaming. In comparison, all tested devices range from 0.1 (minimum) to 240 (maximum) ms. » 22 % of all devices are better. This means that the measured response time is better than the average of all tested devices (19.8 ms). | ||
| ↔ Response Time 50% Grey to 80% Grey | ||
| 5.6 ms ... rise ↗ and fall ↘ combined | ↗ 2.7 ms rise | 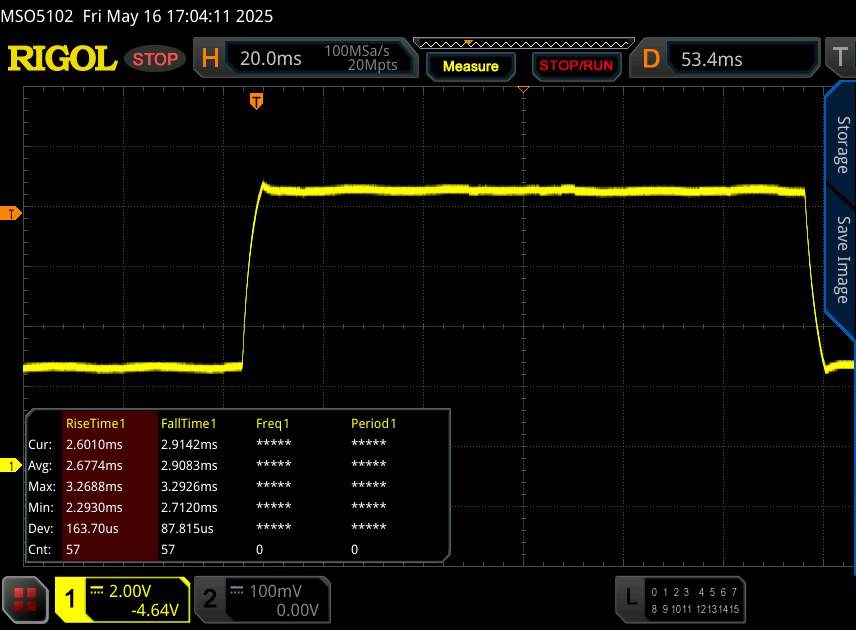 |
| ↘ 2.9 ms fall | ||
| The screen shows very fast response rates in our tests and should be very well suited for fast-paced gaming. In comparison, all tested devices range from 0.165 (minimum) to 636 (maximum) ms. » 18 % of all devices are better. This means that the measured response time is better than the average of all tested devices (31 ms). | ||
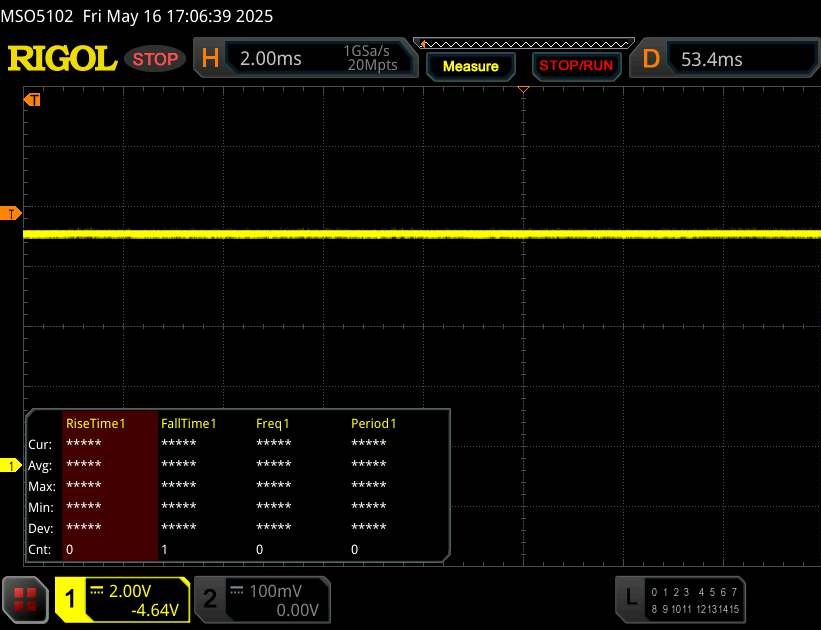
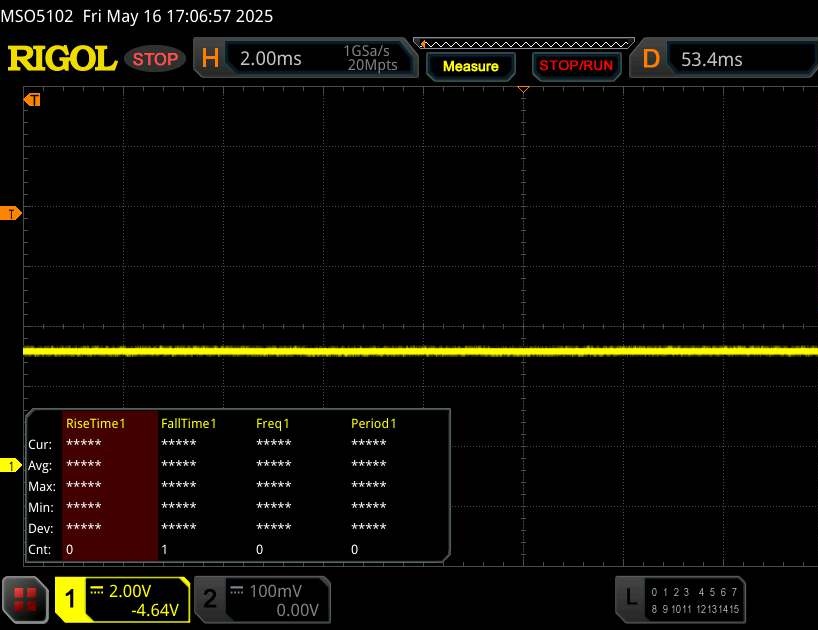
Screen Flickering / PWM (Pulse-Width Modulation)
| Screen flickering / PWM not detected | 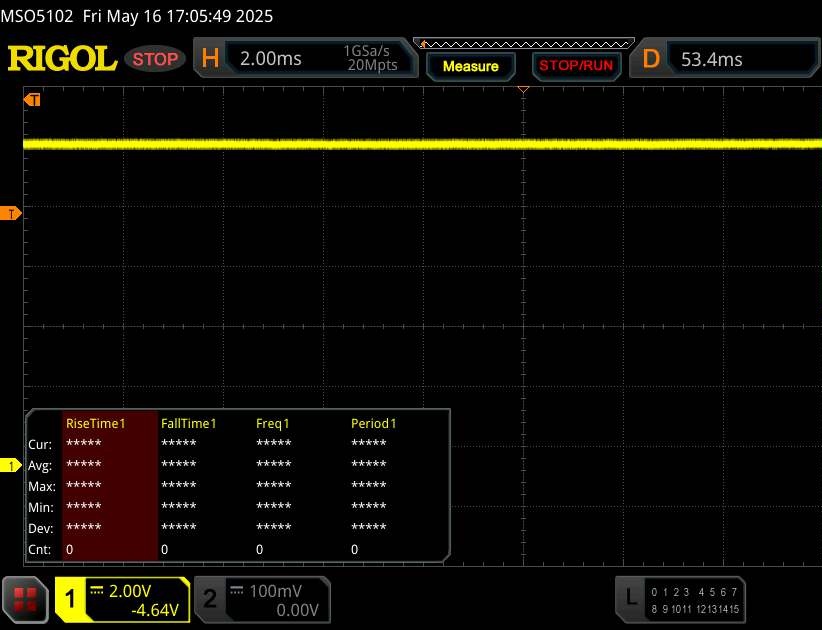 | ||
In comparison: 52 % of all tested devices do not use PWM to dim the display. If PWM was detected, an average of 7763 (minimum: 5 - maximum: 343500) Hz was measured. | |||

Performance
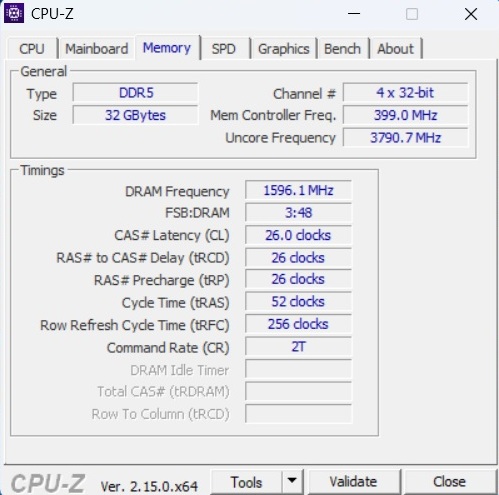
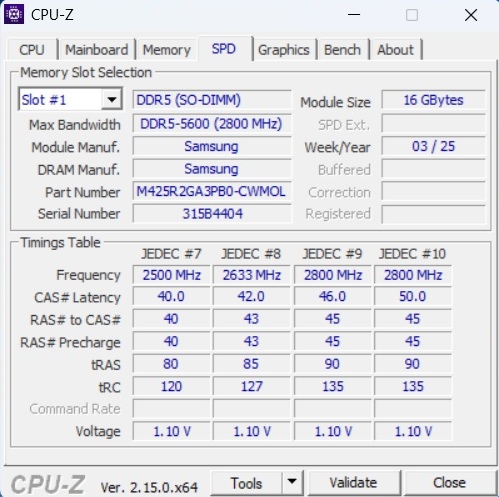
The Beast 18 X1 not only belongs to the high-end segment in terms of price, but also in terms of performance. 32 GB of RAM is just as adequate in 2025 as a 2 TB SSD, although you could expect (even) more for over $4,000. Incidentally, Medion also offers the Beast 18 X1 with the mobile RTX 5090 for ~$5,650.
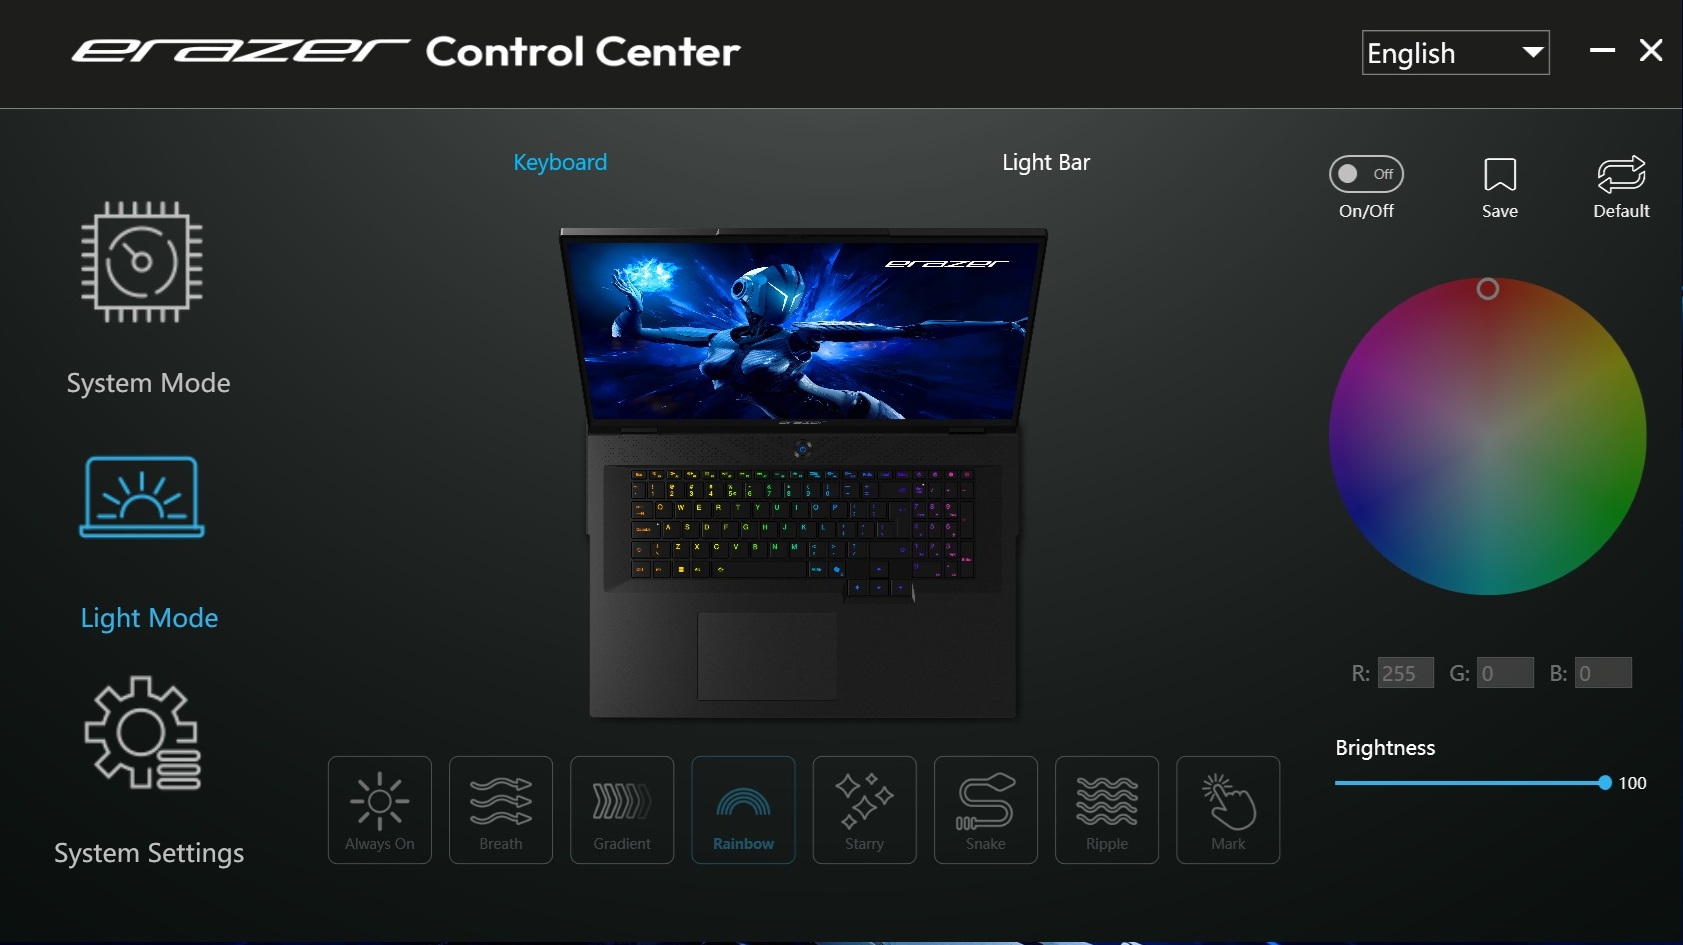
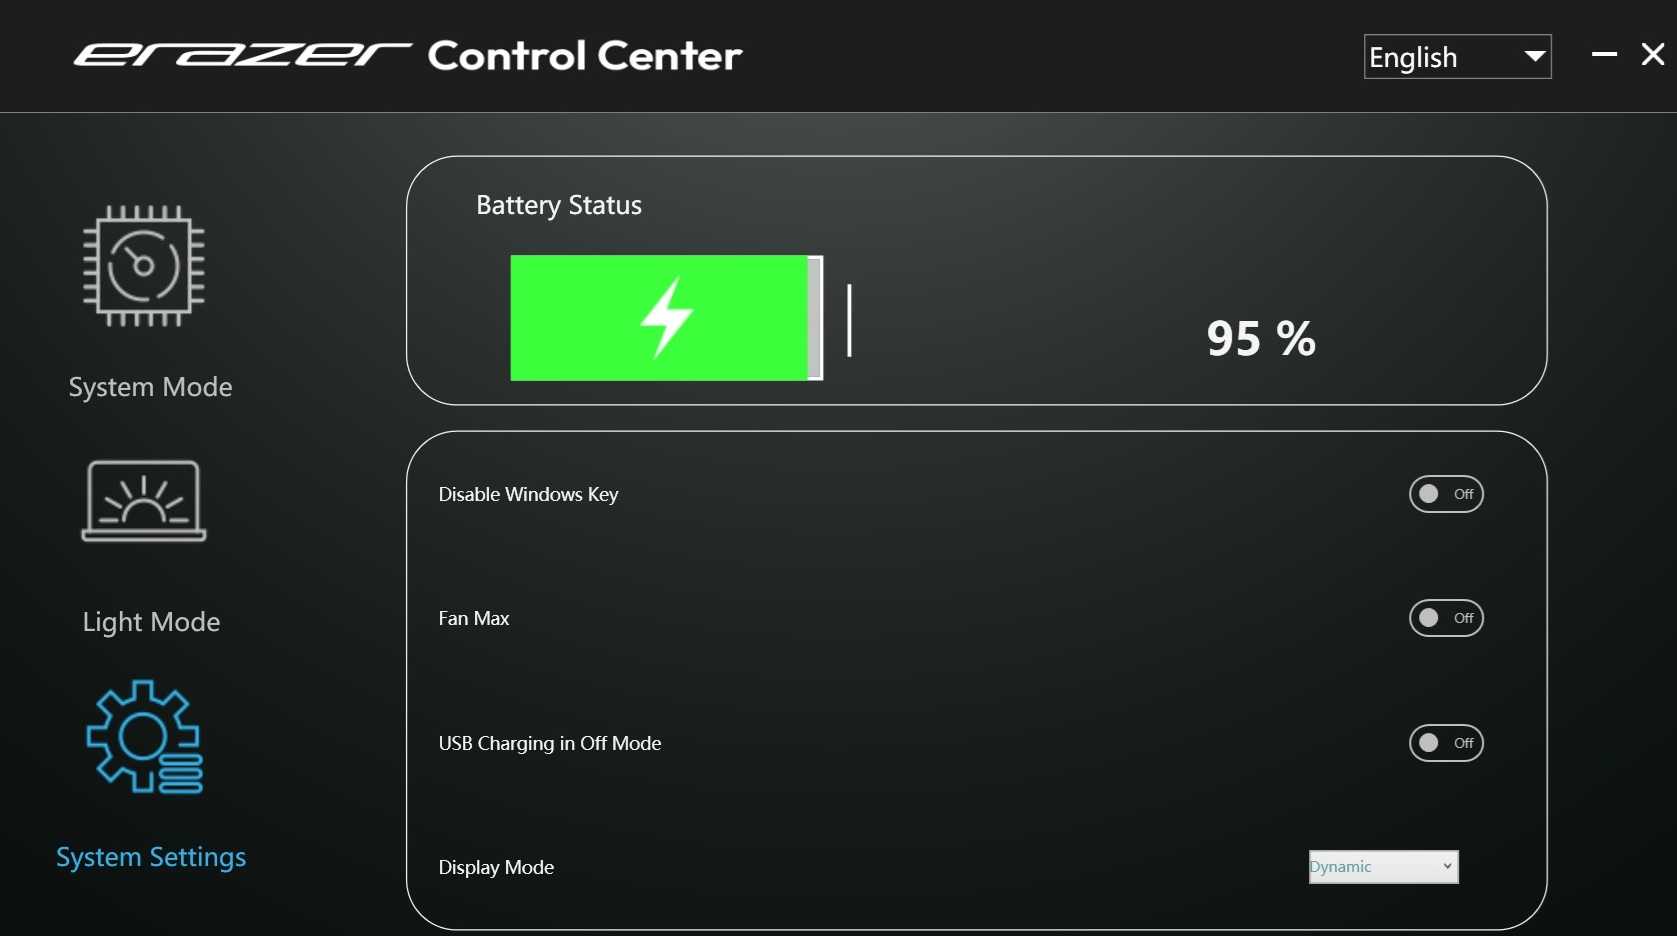
Test conditions
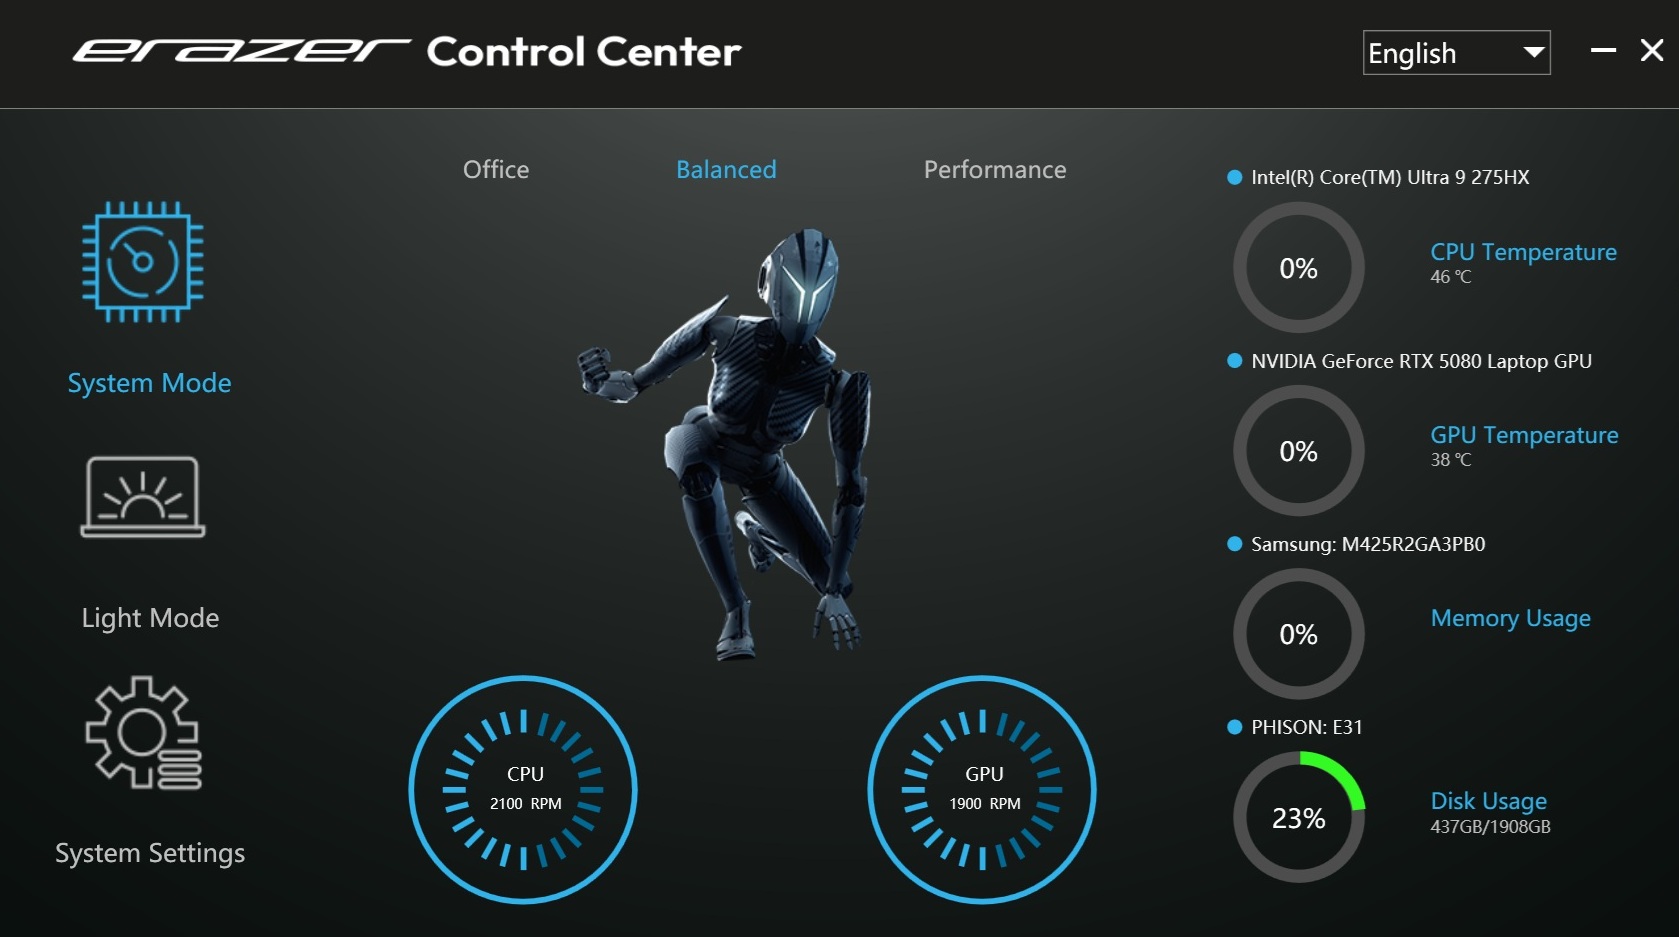
There are three operating modes in the Erazer Control Center, some of which significantly impact emissions and speed. Since the 18-incher is almost absurdly loud in Performance mode with over 60 dB(A) in places, we limited ourselves to the equally audible Balanced mode for the measurements, which consumes slightly more CPU than GPU power (see table).
| Erazer Control Center Mode | Office | Balanced | Performance |
| Cyberpunk 2077 Noise | max. 46 dB(A) | max. 53 dB(A) | max. 61 dB(A) |
| Cyberpunk 2077 Performance (FHD/Ultra) | 78.8 fps | 139.8 fps | 146.5 fps |
| Cinebench R15 Multi Score | 3596 Points | 4871 Points | 6154 Points |
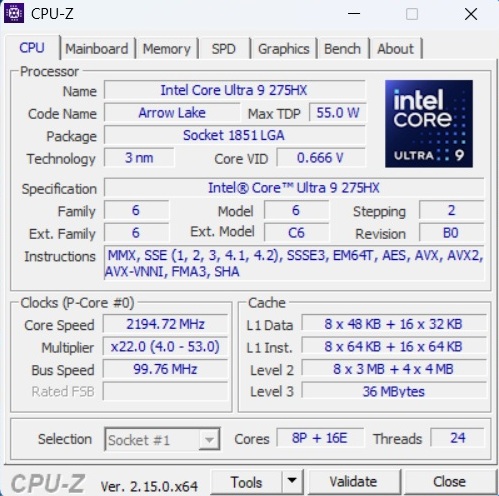
Processor
If you take the balanced mode as a basis, the installed Core Ultra 9 275HX, which contains 8 performance cores and 16 efficiency cores (each without Hyper-Threading), performs slightly below the average value determined so far for this CPU and roughly reaches the level of the Aorus Master 18 (also wasn't tested in maximum mode because of the heavy background noise). It is particularly unfortunate that the results in the Cinebench loop drop by several percent over time, which was not the case with the competitor devices.
Cinebench R15 Multi loop
* ... smaller is better
AIDA64: FP32 Ray-Trace | FPU Julia | CPU SHA3 | CPU Queen | FPU SinJulia | FPU Mandel | CPU AES | CPU ZLib | FP64 Ray-Trace | CPU PhotoWorxx
| Performance rating | |
| Asus Strix Scar 18 G835LX | |
| Lenovo Legion Pro 7i 16 Gen 10 | |
| Average Intel Core Ultra 9 275HX | |
| Acer Predator Helios 18 N23Q2 | |
| Aorus Master 18 AM8H | |
| MSI GE78HX 13VH-070US | |
| Average of class Gaming | |
| Medion Erazer Beast 18 X1 MD62731 | |
| AIDA64 / FP32 Ray-Trace | |
| Asus Strix Scar 18 G835LX | |
| Lenovo Legion Pro 7i 16 Gen 10 | |
| Average Intel Core Ultra 9 275HX (28039 - 39895, n=30) | |
| Aorus Master 18 AM8H | |
| Average of class Gaming (10227 - 85542, n=107, last 2 years) | |
| Medion Erazer Beast 18 X1 MD62731 | |
| MSI GE78HX 13VH-070US | |
| Acer Predator Helios 18 N23Q2 | |
| AIDA64 / FPU Julia | |
| Asus Strix Scar 18 G835LX | |
| Lenovo Legion Pro 7i 16 Gen 10 | |
| Average Intel Core Ultra 9 275HX (140254 - 200744, n=30) | |
| Aorus Master 18 AM8H | |
| MSI GE78HX 13VH-070US | |
| Medion Erazer Beast 18 X1 MD62731 | |
| Acer Predator Helios 18 N23Q2 | |
| Average of class Gaming (51376 - 238426, n=107, last 2 years) | |
| AIDA64 / CPU SHA3 | |
| Asus Strix Scar 18 G835LX | |
| Lenovo Legion Pro 7i 16 Gen 10 | |
| Average Intel Core Ultra 9 275HX (6710 - 9817, n=30) | |
| Aorus Master 18 AM8H | |
| Medion Erazer Beast 18 X1 MD62731 | |
| MSI GE78HX 13VH-070US | |
| Acer Predator Helios 18 N23Q2 | |
| Average of class Gaming (2180 - 9817, n=107, last 2 years) | |
| AIDA64 / CPU Queen | |
| MSI GE78HX 13VH-070US | |
| Asus Strix Scar 18 G835LX | |
| Lenovo Legion Pro 7i 16 Gen 10 | |
| Acer Predator Helios 18 N23Q2 | |
| Average Intel Core Ultra 9 275HX (113887 - 140937, n=30) | |
| Aorus Master 18 AM8H | |
| Average of class Gaming (49785 - 173351, n=94, last 2 years) | |
| Medion Erazer Beast 18 X1 MD62731 | |
| AIDA64 / FPU SinJulia | |
| MSI GE78HX 13VH-070US | |
| Acer Predator Helios 18 N23Q2 | |
| Average of class Gaming (4424 - 33636, n=107, last 2 years) | |
| Asus Strix Scar 18 G835LX | |
| Lenovo Legion Pro 7i 16 Gen 10 | |
| Average Intel Core Ultra 9 275HX (11172 - 14425, n=30) | |
| Aorus Master 18 AM8H | |
| Medion Erazer Beast 18 X1 MD62731 | |
| AIDA64 / FPU Mandel | |
| Asus Strix Scar 18 G835LX | |
| Lenovo Legion Pro 7i 16 Gen 10 | |
| Average Intel Core Ultra 9 275HX (72596 - 104508, n=30) | |
| Aorus Master 18 AM8H | |
| Medion Erazer Beast 18 X1 MD62731 | |
| Average of class Gaming (25115 - 128721, n=107, last 2 years) | |
| MSI GE78HX 13VH-070US | |
| Acer Predator Helios 18 N23Q2 | |
| AIDA64 / CPU AES | |
| Acer Predator Helios 18 N23Q2 | |
| Asus Strix Scar 18 G835LX | |
| MSI GE78HX 13VH-070US | |
| Lenovo Legion Pro 7i 16 Gen 10 | |
| Average Intel Core Ultra 9 275HX (105608 - 247074, n=30) | |
| Aorus Master 18 AM8H | |
| Medion Erazer Beast 18 X1 MD62731 | |
| Average of class Gaming (39258 - 247074, n=107, last 2 years) | |
| AIDA64 / CPU ZLib | |
| Asus Strix Scar 18 G835LX | |
| MSI GE78HX 13VH-070US | |
| Lenovo Legion Pro 7i 16 Gen 10 | |
| Average Intel Core Ultra 9 275HX (1582 - 2263, n=30) | |
| Acer Predator Helios 18 N23Q2 | |
| Aorus Master 18 AM8H | |
| Medion Erazer Beast 18 X1 MD62731 | |
| Average of class Gaming (574 - 2531, n=107, last 2 years) | |
| AIDA64 / FP64 Ray-Trace | |
| Asus Strix Scar 18 G835LX | |
| Lenovo Legion Pro 7i 16 Gen 10 | |
| Average Intel Core Ultra 9 275HX (14847 - 21854, n=30) | |
| Aorus Master 18 AM8H | |
| Average of class Gaming (5509 - 45446, n=107, last 2 years) | |
| MSI GE78HX 13VH-070US | |
| Acer Predator Helios 18 N23Q2 | |
| Medion Erazer Beast 18 X1 MD62731 | |
| AIDA64 / CPU PhotoWorxx | |
| Asus Strix Scar 18 G835LX | |
| Lenovo Legion Pro 7i 16 Gen 10 | |
| Acer Predator Helios 18 N23Q2 | |
| MSI GE78HX 13VH-070US | |
| Average Intel Core Ultra 9 275HX (37482 - 62916, n=30) | |
| Aorus Master 18 AM8H | |
| Medion Erazer Beast 18 X1 MD62731 | |
| Average of class Gaming (12271 - 89891, n=107, last 2 years) | |
System performance
When it comes to system performance, the difference between the competitors is limited. Subjectively, we sometimes notice hangs when opening programs, which, as is often the case, is probably due to graphics switching. Nvidia's Blackwell generation, or its current driver, has a bigger problem here than Ada Lovelace (we also noticed the same with the Aorus Master 18).
PCMark 10: Score | Essentials | Productivity | Digital Content Creation
CrossMark: Overall | Productivity | Creativity | Responsiveness
WebXPRT 3: Overall
WebXPRT 4: Overall
Mozilla Kraken 1.1: Total
| Performance rating | |
| Aorus Master 18 AM8H | |
| Asus Strix Scar 18 G835LX | |
| Lenovo Legion Pro 7i 16 Gen 10 | |
| Average Intel Core Ultra 9 275HX, NVIDIA GeForce RTX 5080 Laptop | |
| Acer Predator Helios 18 N23Q2 -1! | |
| MSI GE78HX 13VH-070US | |
| Average of class Gaming | |
| Medion Erazer Beast 18 X1 MD62731 | |
| PCMark 10 / Score | |
| Lenovo Legion Pro 7i 16 Gen 10 | |
| MSI GE78HX 13VH-070US | |
| Average Intel Core Ultra 9 275HX, NVIDIA GeForce RTX 5080 Laptop (7805 - 10409, n=9) | |
| Asus Strix Scar 18 G835LX | |
| Aorus Master 18 AM8H | |
| Acer Predator Helios 18 N23Q2 | |
| Medion Erazer Beast 18 X1 MD62731 | |
| Average of class Gaming (5828 - 11574, n=95, last 2 years) | |
| PCMark 10 / Essentials | |
| MSI GE78HX 13VH-070US | |
| Lenovo Legion Pro 7i 16 Gen 10 | |
| Aorus Master 18 AM8H | |
| Acer Predator Helios 18 N23Q2 | |
| Asus Strix Scar 18 G835LX | |
| Average Intel Core Ultra 9 275HX, NVIDIA GeForce RTX 5080 Laptop (10206 - 11472, n=9) | |
| Average of class Gaming (8810 - 12600, n=99, last 2 years) | |
| Medion Erazer Beast 18 X1 MD62731 | |
| PCMark 10 / Productivity | |
| Average of class Gaming (6845 - 21327, n=97, last 2 years) | |
| Average Intel Core Ultra 9 275HX, NVIDIA GeForce RTX 5080 Laptop (8319 - 20616, n=9) | |
| Acer Predator Helios 18 N23Q2 | |
| MSI GE78HX 13VH-070US | |
| Medion Erazer Beast 18 X1 MD62731 | |
| Lenovo Legion Pro 7i 16 Gen 10 | |
| Asus Strix Scar 18 G835LX | |
| Aorus Master 18 AM8H | |
| PCMark 10 / Digital Content Creation | |
| Lenovo Legion Pro 7i 16 Gen 10 | |
| Asus Strix Scar 18 G835LX | |
| Aorus Master 18 AM8H | |
| Average Intel Core Ultra 9 275HX, NVIDIA GeForce RTX 5080 Laptop (10505 - 19351, n=9) | |
| Medion Erazer Beast 18 X1 MD62731 | |
| MSI GE78HX 13VH-070US | |
| Acer Predator Helios 18 N23Q2 | |
| Average of class Gaming (7602 - 19657, n=97, last 2 years) | |
| CrossMark / Overall | |
| Aorus Master 18 AM8H | |
| Asus Strix Scar 18 G835LX | |
| Acer Predator Helios 18 N23Q2 | |
| Average Intel Core Ultra 9 275HX, NVIDIA GeForce RTX 5080 Laptop (1857 - 2244, n=9) | |
| Lenovo Legion Pro 7i 16 Gen 10 | |
| Average of class Gaming (1366 - 2409, n=96, last 2 years) | |
| MSI GE78HX 13VH-070US | |
| Medion Erazer Beast 18 X1 MD62731 | |
| CrossMark / Productivity | |
| Aorus Master 18 AM8H | |
| Acer Predator Helios 18 N23Q2 | |
| Asus Strix Scar 18 G835LX | |
| Average Intel Core Ultra 9 275HX, NVIDIA GeForce RTX 5080 Laptop (1764 - 2122, n=9) | |
| Lenovo Legion Pro 7i 16 Gen 10 | |
| Average of class Gaming (1386 - 2254, n=96, last 2 years) | |
| MSI GE78HX 13VH-070US | |
| Medion Erazer Beast 18 X1 MD62731 | |
| CrossMark / Creativity | |
| Asus Strix Scar 18 G835LX | |
| Aorus Master 18 AM8H | |
| Acer Predator Helios 18 N23Q2 | |
| Average Intel Core Ultra 9 275HX, NVIDIA GeForce RTX 5080 Laptop (2115 - 2498, n=9) | |
| Lenovo Legion Pro 7i 16 Gen 10 | |
| Average of class Gaming (1343 - 2729, n=96, last 2 years) | |
| Medion Erazer Beast 18 X1 MD62731 | |
| MSI GE78HX 13VH-070US | |
| CrossMark / Responsiveness | |
| Aorus Master 18 AM8H | |
| Acer Predator Helios 18 N23Q2 | |
| Average Intel Core Ultra 9 275HX, NVIDIA GeForce RTX 5080 Laptop (1466 - 2096, n=9) | |
| Asus Strix Scar 18 G835LX | |
| Average of class Gaming (1226 - 2334, n=96, last 2 years) | |
| MSI GE78HX 13VH-070US | |
| Lenovo Legion Pro 7i 16 Gen 10 | |
| Medion Erazer Beast 18 X1 MD62731 | |
| WebXPRT 3 / Overall | |
| Lenovo Legion Pro 7i 16 Gen 10 | |
| Asus Strix Scar 18 G835LX | |
| Average Intel Core Ultra 9 275HX, NVIDIA GeForce RTX 5080 Laptop (306 - 378, n=9) | |
| Medion Erazer Beast 18 X1 MD62731 | |
| Acer Predator Helios 18 N23Q2 | |
| Average of class Gaming (220 - 532, n=100, last 2 years) | |
| MSI GE78HX 13VH-070US | |
| Aorus Master 18 AM8H | |
| WebXPRT 4 / Overall | |
| Asus Strix Scar 18 G835LX | |
| Lenovo Legion Pro 7i 16 Gen 10 | |
| Medion Erazer Beast 18 X1 MD62731 | |
| Average Intel Core Ultra 9 275HX, NVIDIA GeForce RTX 5080 Laptop (285 - 336, n=9) | |
| Aorus Master 18 AM8H | |
| MSI GE78HX 13VH-070US | |
| Average of class Gaming (165 - 354, n=101, last 2 years) | |
| Mozilla Kraken 1.1 / Total | |
| MSI GE78HX 13VH-070US | |
| Average of class Gaming (391 - 590, n=104, last 2 years) | |
| Acer Predator Helios 18 N23Q2 | |
| Aorus Master 18 AM8H | |
| Medion Erazer Beast 18 X1 MD62731 | |
| Average Intel Core Ultra 9 275HX, NVIDIA GeForce RTX 5080 Laptop (405 - 432, n=9) | |
| Asus Strix Scar 18 G835LX | |
| Lenovo Legion Pro 7i 16 Gen 10 | |
* ... smaller is better
| PCMark 10 Score | 8378 points | |
Help | ||
| AIDA64 / Memory Copy | |
| Lenovo Legion Pro 7i 16 Gen 10 | |
| Asus Strix Scar 18 G835LX | |
| Average Intel Core Ultra 9 275HX (56003 - 94460, n=30) | |
| Acer Predator Helios 18 N23Q2 | |
| Medion Erazer Beast 18 X1 MD62731 | |
| MSI GE78HX 13VH-070US | |
| Aorus Master 18 AM8H | |
| Average of class Gaming (21750 - 129946, n=107, last 2 years) | |
| AIDA64 / Memory Read | |
| Lenovo Legion Pro 7i 16 Gen 10 | |
| Acer Predator Helios 18 N23Q2 | |
| Medion Erazer Beast 18 X1 MD62731 | |
| Asus Strix Scar 18 G835LX | |
| MSI GE78HX 13VH-070US | |
| Average Intel Core Ultra 9 275HX (55795 - 97151, n=30) | |
| Aorus Master 18 AM8H | |
| Average of class Gaming (22956 - 118858, n=107, last 2 years) | |
| AIDA64 / Memory Write | |
| Lenovo Legion Pro 7i 16 Gen 10 | |
| Asus Strix Scar 18 G835LX | |
| Average Intel Core Ultra 9 275HX (55663 - 116129, n=30) | |
| Medion Erazer Beast 18 X1 MD62731 | |
| MSI GE78HX 13VH-070US | |
| Average of class Gaming (22297 - 135096, n=107, last 2 years) | |
| Acer Predator Helios 18 N23Q2 | |
| Aorus Master 18 AM8H | |
| AIDA64 / Memory Latency | |
| Aorus Master 18 AM8H | |
| Average Intel Core Ultra 9 275HX (105.8 - 161.6, n=30) | |
| Medion Erazer Beast 18 X1 MD62731 | |
| Lenovo Legion Pro 7i 16 Gen 10 | |
| Asus Strix Scar 18 G835LX | |
| Average of class Gaming (75.3 - 259, n=107, last 2 years) | |
| MSI GE78HX 13VH-070US | |
| Acer Predator Helios 18 N23Q2 | |
* ... smaller is better
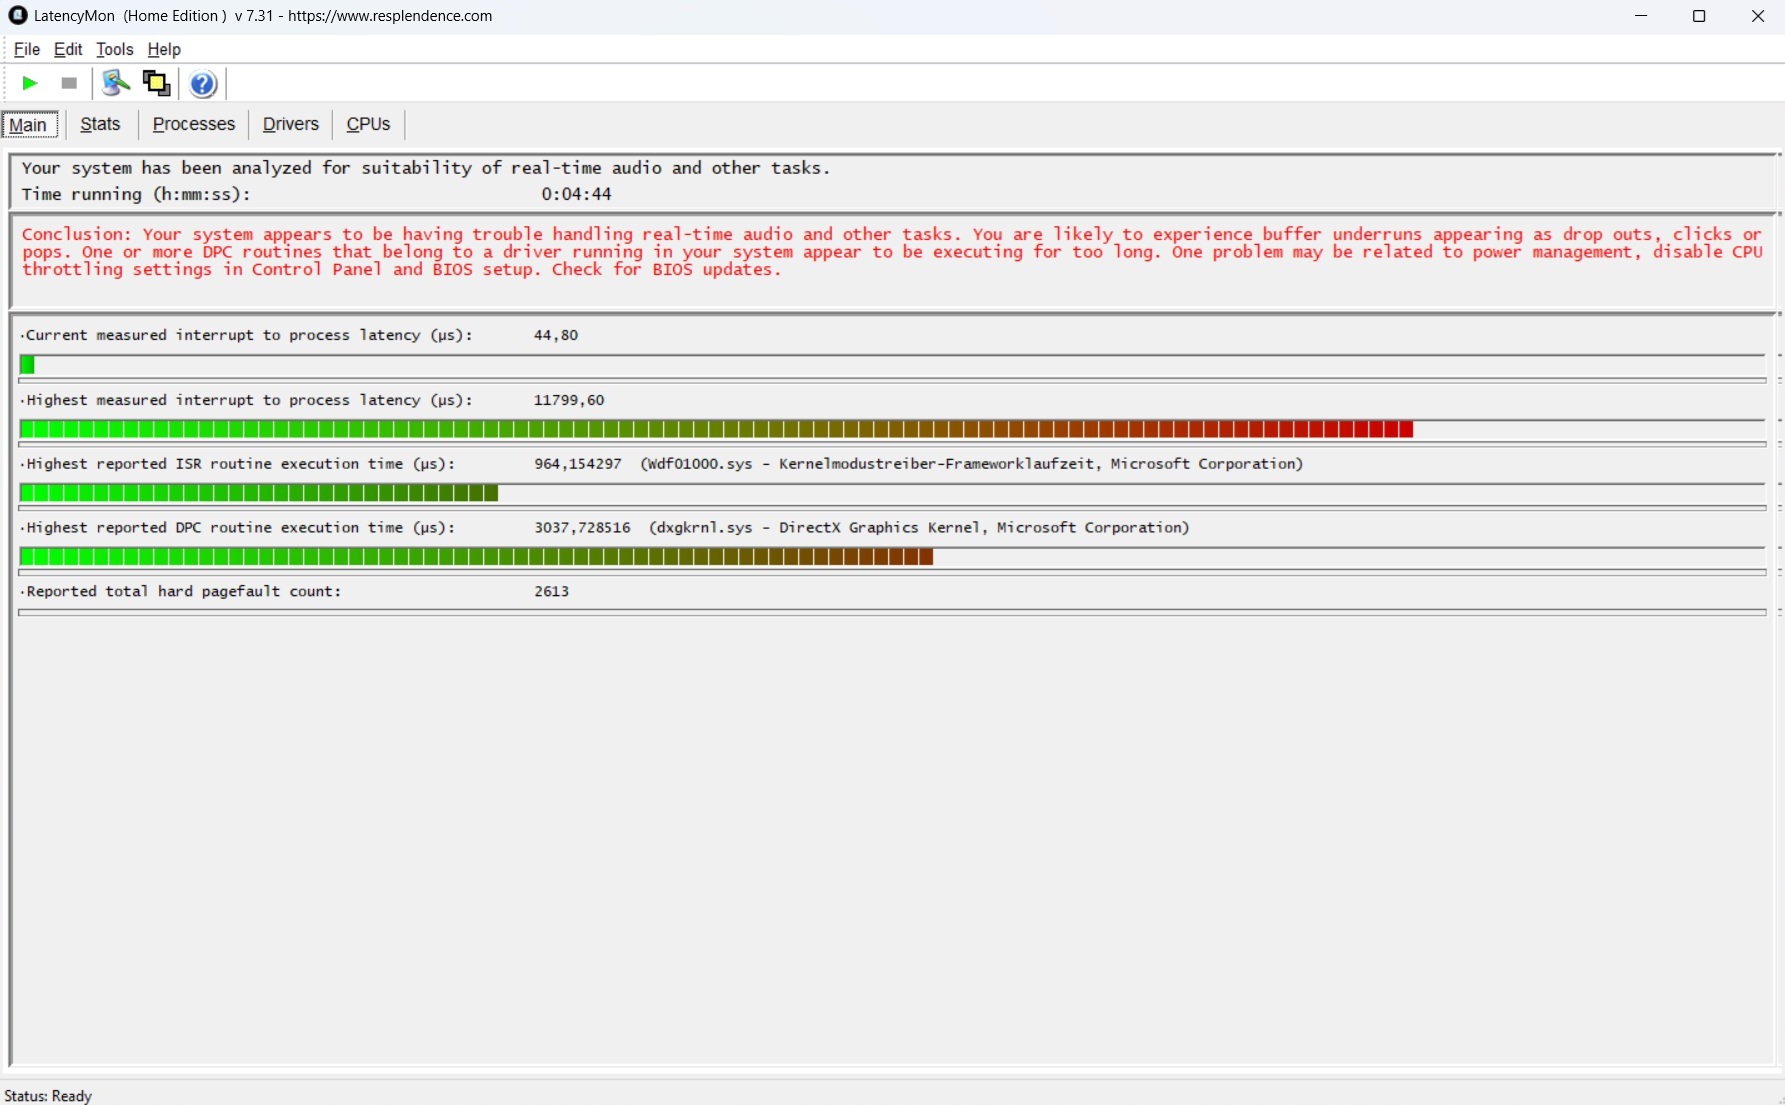
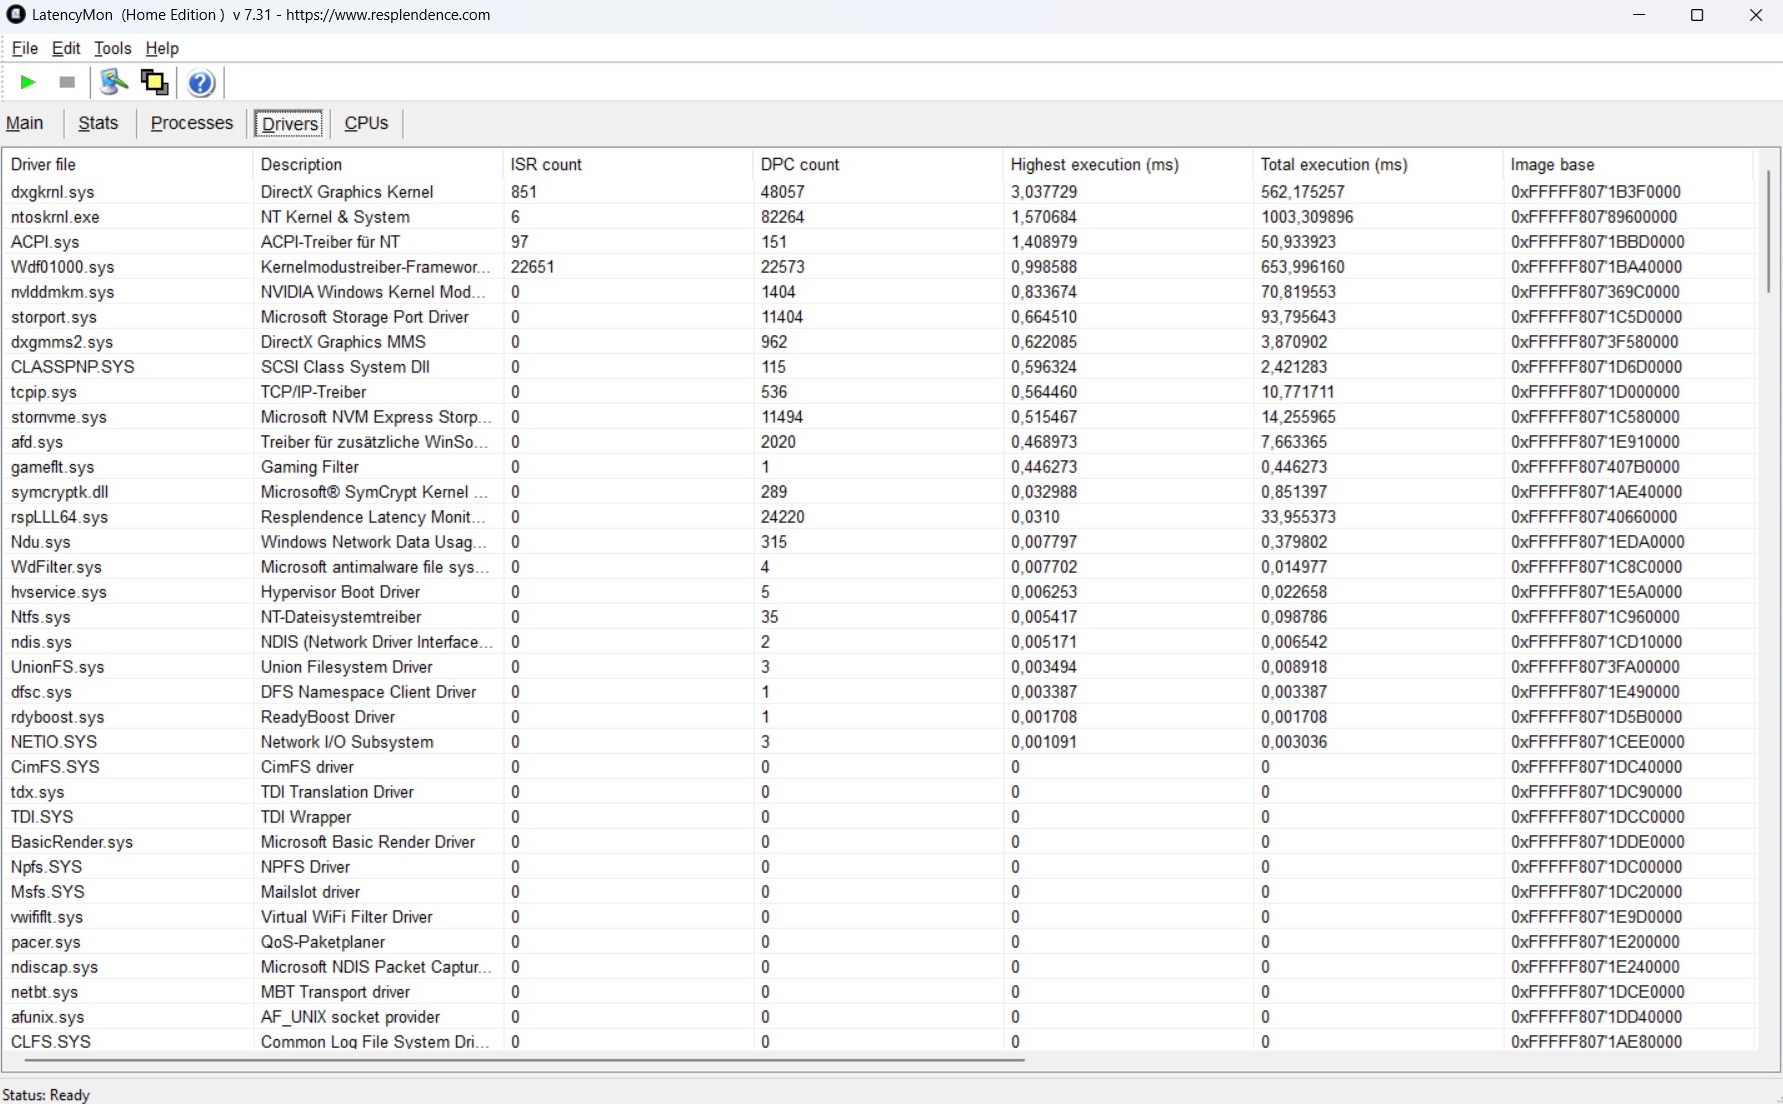
DPC latencies
In general, latencies are not the highlight of the Beast 18 X1: a maximum of 11,799 µs is even worse than the Acer Predator Helios 18 (8,290 µs).
| DPC Latencies / LatencyMon - interrupt to process latency (max), Web, Youtube, Prime95 | |
| Medion Erazer Beast 18 X1 MD62731 | |
| Acer Predator Helios 18 N23Q2 | |
| MSI GE78HX 13VH-070US | |
| Aorus Master 18 AM8H | |
| Asus Strix Scar 18 G835LX | |
| Lenovo Legion Pro 7i 16 Gen 10 | |
* ... smaller is better
Mass storage
However, the speedy PCIe Gen. 5x4 SSD deserves respect. The 2TB drive cracks the 10,000 MB/s mark in sequential tests, and can even run without throttling in the long term.

* ... smaller is better
Continuous read: DiskSpd Read Loop, Queue Depth 8
Graphics card
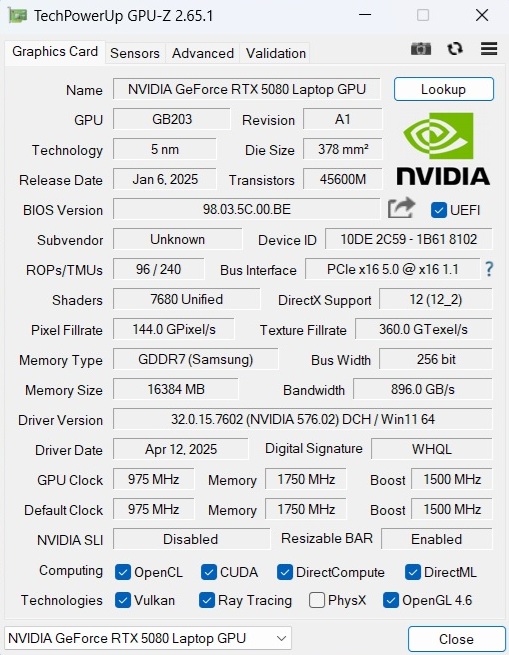
The GeForce RTX 5080 laptop is currently Nvidia's second most powerful notebook model from the Blackwell series after the RTX 5090 laptop. However, the latter only has a limited advantage in our 3DMark course when you look at the competition. Conversely, the RTX 5080 is not much faster than the old RTX 4080 laptop, which can at least keep up well in synthetic tests. Meanwhile, 16 GB GDDR7 VRAM is not a revelation for the price range, but it is still better than the 12 GB GDDR6X of the predecessor. The TGP level can reach a maximum of 175 watts.
| 3DMark 11 Performance | 44491 points | |
| 3DMark Ice Storm Standard Score | 245418 points | |
| 3DMark Cloud Gate Standard Score | 61468 points | |
| 3DMark Fire Strike Score | 30780 points | |
| 3DMark Time Spy Score | 20170 points | |
Help | ||
* ... smaller is better
Gaming performance
In gaming benchmarks, the gaps between the competitor devices are somewhat larger, but in practice, you will often not notice much of this. Basically, the mobile RTX 5080 is fast enough to run most modern games smoothly in maximum details and the native QHD+ resolution. Things only get tight with very demanding or moderately optimized titles, such as The Elder Scrolls: Oblivion Remastered. The use of upscaling (keyword DLSS) and/or (multi) frame generation is recommended here. With the Stalker 2, the frame rate in QHD doubles as a result (see table).
| Stalker 2 | |
| 2560x1440 Epic Preset | |
| Aorus Master 18 AM8H | |
| Medion Erazer Beast 18 X1 MD62731 | |
| Average NVIDIA GeForce RTX 5080 Laptop (41.5 - 58.5, n=2) | |
| Average of class Gaming (29 - 110.7, n=13, last 2 years) | |
| 2560x1440 Epic Preset + Quality DLSS + FG | |
| Aorus Master 18 AM8H | |
| Medion Erazer Beast 18 X1 MD62731 | |
| Average NVIDIA GeForce RTX 5080 Laptop (80.7 - 122.1, n=2) | |
| Average of class Gaming (58.3 - 134.6, n=12, last 2 years) | |
| Horizon Forbidden West | |
| 2560x1440 Very High Preset AA:T | |
| Aorus Master 18 AM8H | |
| Medion Erazer Beast 18 X1 MD62731 | |
| Average NVIDIA GeForce RTX 5080 Laptop (n=1) | |
| Average of class Gaming (39.6 - 100.9, n=10, last 2 years) | |
| 2560x1440 Very High Preset + DLSS Quality | |
| Aorus Master 18 AM8H | |
| Medion Erazer Beast 18 X1 MD62731 | |
| Average NVIDIA GeForce RTX 5080 Laptop (n=1) | |
| Average of class Gaming (58.4 - 116.6, n=8, last 2 years) | |
| Ghost of Tsushima | |
| 2560x1440 Very High Preset AA:T | |
| Aorus Master 18 AM8H | |
| Medion Erazer Beast 18 X1 MD62731 | |
| Average NVIDIA GeForce RTX 5080 Laptop (n=1) | |
| Average of class Gaming (22.7 - 100.3, n=13, last 2 years) | |
| 2560x1440 Very High Preset + Quality DLSS | |
| Aorus Master 18 AM8H | |
| Medion Erazer Beast 18 X1 MD62731 | |
| Average NVIDIA GeForce RTX 5080 Laptop (n=1) | |
| Average of class Gaming (55.2 - 105.2, n=10, last 2 years) | |
| Senua's Saga Hellblade 2 | |
| 2560x1440 High Preset | |
| Aorus Master 18 AM8H | |
| Medion Erazer Beast 18 X1 MD62731 | |
| Average NVIDIA GeForce RTX 5080 Laptop (n=1) | |
| Average of class Gaming (24.2 - 63.1, n=11, last 2 years) | |
| 2560x1440 High Preset + Quality DLSS | |
| Aorus Master 18 AM8H | |
| Medion Erazer Beast 18 X1 MD62731 | |
| Average NVIDIA GeForce RTX 5080 Laptop (n=1) | |
| Average of class Gaming (39.6 - 81.9, n=9, last 2 years) | |
| Space Marine 2 | |
| 2560x1440 Ultra Preset AA:T | |
| Aorus Master 18 AM8H | |
| Medion Erazer Beast 18 X1 MD62731 | |
| Average NVIDIA GeForce RTX 5080 Laptop (n=1) | |
| Average of class Gaming (48.2 - 107.4, n=11, last 2 years) | |
| 2560x1440 Ultra Preset + Quality DLSS | |
| Aorus Master 18 AM8H | |
| Medion Erazer Beast 18 X1 MD62731 | |
| Average NVIDIA GeForce RTX 5080 Laptop (n=1) | |
| Average of class Gaming (58.5 - 100.8, n=10, last 2 years) | |
| Until Dawn | |
| 2560x1440 Ultra Preset | |
| Aorus Master 18 AM8H | |
| Medion Erazer Beast 18 X1 MD62731 | |
| Average NVIDIA GeForce RTX 5080 Laptop (n=1) | |
| Average of class Gaming (30.4 - 76.6, n=11, last 2 years) | |
| 2560x1440 Ultra Preset + Quality DLSS + Ray Tracing | |
| Aorus Master 18 AM8H | |
| Medion Erazer Beast 18 X1 MD62731 | |
| Average NVIDIA GeForce RTX 5080 Laptop (n=1) | |
| Average of class Gaming (39.5 - 86.3, n=10, last 2 years) | |
| Kingdom Come Deliverance 2 | |
| 2560x1440 Ultra Preset | |
| Aorus Master 18 AM8H | |
| Medion Erazer Beast 18 X1 MD62731 | |
| Average NVIDIA GeForce RTX 5080 Laptop (n=1) | |
| Average of class Gaming (36.8 - 97.2, n=13, last 2 years) | |
| 2560x1440 Ultra Preset + Quality DLSS | |
| Medion Erazer Beast 18 X1 MD62731 | |
| Average NVIDIA GeForce RTX 5080 Laptop (n=1) | |
| Aorus Master 18 AM8H | |
| Average of class Gaming (50.3 - 115.5, n=13, last 2 years) | |
| The Elder Scrolls IV Oblivion Remastered | |
| 2560x1440 Ultra Preset AA:T | |
| Medion Erazer Beast 18 X1 MD62731 | |
| Average NVIDIA GeForce RTX 5080 Laptop (17.9 - 36.6, n=3) | |
| Average of class Gaming (12.7 - 45.9, n=14, last 2 years) | |
| 2560x1440 Ultra Preset + Quality DLSS | |
| Medion Erazer Beast 18 X1 MD62731 | |
| Average NVIDIA GeForce RTX 5080 Laptop (51 - 53.2, n=2) | |
| Average of class Gaming (25.3 - 59.7, n=12, last 2 years) | |
| low | med. | high | ultra | QHD DLSS | QHD | |
|---|---|---|---|---|---|---|
| GTA V (2015) | 185.4 | 170.6 | 139.5 | 137.4 | ||
| Dota 2 Reborn (2015) | 211 | 186.4 | 175.1 | 162.3 | ||
| Final Fantasy XV Benchmark (2018) | 218 | 189.9 | 152.1 | |||
| X-Plane 11.11 (2018) | 143 | 132.2 | 108.9 | |||
| Strange Brigade (2018) | 434 | 403 | 371 | 281 | ||
| Baldur's Gate 3 (2023) | 202 | 181.6 | 179.6 | 130.5 | ||
| Cyberpunk 2077 (2023) | 157.8 | 148.1 | 139.8 | 96.4 | ||
| Counter-Strike 2 (2023) | 345 | 290 | 255 | 205 | ||
| Prince of Persia The Lost Crown (2024) | 356 | 356 | 356 | 356 | ||
| Helldivers 2 (2024) | 135.9 | 134.5 | 131.9 | 127.8 | ||
| Dragon's Dogma 2 (2024) | 84.8 | 82.3 | ||||
| Horizon Forbidden West (2024) | 148.2 | 117.7 | 115.5 | 110.6 | 90.7 | |
| Ghost of Tsushima (2024) | 110.7 | 105.7 | 97.5 | 96.1 | 76.7 | |
| Senua's Saga Hellblade 2 (2024) | 99.3 | 76 | 81 | 55.1 | ||
| Star Wars Outlaws (2024) | 79.8 | 72.7 | 67.8 | 64.8 | 51.4 | |
| Space Marine 2 (2024) | 90 | 89.7 | 88.7 | 86.9 | 86.2 | |
| Until Dawn (2024) | 92.9 | 91 | 81.6 | 74.4 | 59 | |
| Stalker 2 (2024) | 90.7 | 78.1 | 72.6 | 122.1 | 58.5 | |
| Kingdom Come Deliverance 2 (2025) | 173.8 | 145.6 | 101.6 | 98.9 | 74.5 | |
| Civilization 7 (2025) | 173.4 | 165.5 | 158 | |||
| The Elder Scrolls IV Oblivion Remastered (2025) | 106.3 | 94.1 | 50.6 | 53.2 | 36.6 | |
| Doom: The Dark Ages (2025) | 113 | 104 | 101 | 97 | 72 |
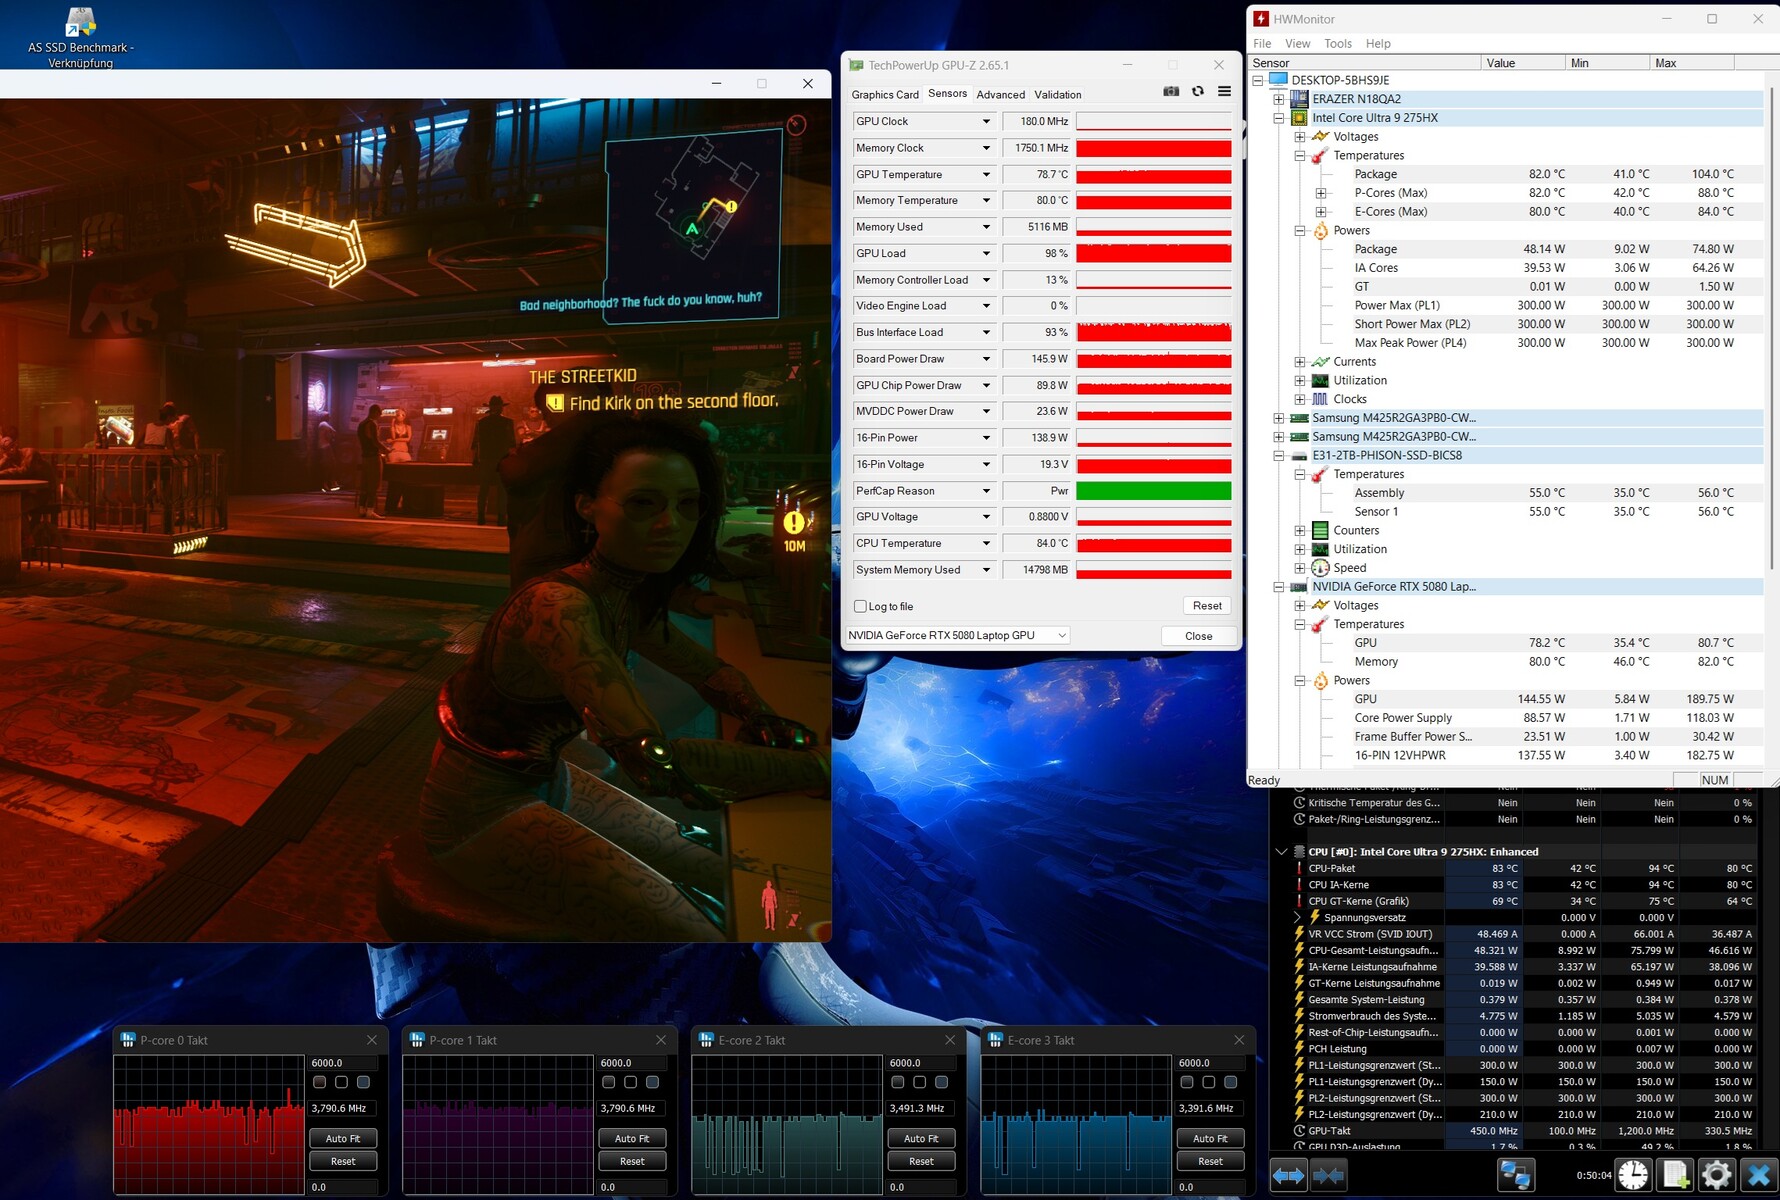
We tested how the 3D performance behaves over a longer period of time with Cyberpunk 2077 tested. In the course of the test, there were occasional brief FPS drops, but these were only subtle and not huge.
Cyberpunk 2077 Ultra FPS chart
Emissions
Noise emissions
One of the biggest criticisms of the Beast 18 X1 is its modest fan control. Even when using the Balanced mode, the cooling system sometimes reaches an unpleasant 40 dB(A) or even higher in idle mode, which could annoy many users in the long run. Under load, the noise values are already reached with the Balanced profile, which some competitors only generate in Performance mode (compare the Strix Scar 18, for example).
Noise level
| Idle |
| 25 / 39 / 42 dB(A) |
| Load |
| 52 / 55 dB(A) |
 | ||
30 dB silent 40 dB(A) audible 50 dB(A) loud |
||
min: | ||
| Medion Erazer Beast 18 X1 MD62731 Ultra 9 275HX, GeForce RTX 5080 Laptop | MSI GE78HX 13VH-070US i9-13950HX, GeForce RTX 4080 Laptop GPU | Acer Predator Helios 18 N23Q2 i9-13900HX, GeForce RTX 4080 Laptop GPU | Asus Strix Scar 18 G835LX Ultra 9 275HX, GeForce RTX 5090 Laptop | Aorus Master 18 AM8H Ultra 9 275HX, GeForce RTX 5090 Laptop | Lenovo Legion Pro 7i 16 Gen 10 Ultra 9 275HX, GeForce RTX 5080 Laptop | |
|---|---|---|---|---|---|---|
| Noise | 13% | 18% | 8% | 7% | 20% | |
| off / environment * (dB) | 25 | 23.4 6% | 23 8% | 23.3 7% | 25 -0% | 22.9 8% |
| Idle Minimum * (dB) | 25 | 24.2 3% | 23 8% | 29.8 -19% | 26 -4% | 22.9 8% |
| Idle Average * (dB) | 39 | 25.6 34% | 23 41% | 29.8 24% | 29 26% | 22.9 41% |
| Idle Maximum * (dB) | 42 | 31 26% | 23 45% | 29.8 29% | 34 19% | 26.3 37% |
| Load Average * (dB) | 52 | 43.3 17% | 45.26 13% | 42.9 17% | 50 4% | 27.8 47% |
| Cyberpunk 2077 ultra * (dB) | 53 | 53.7 -1% | 52 2% | 54.2 -2% | ||
| Load Maximum * (dB) | 55 | 59.1 -7% | 59.94 -9% | 53.7 2% | 53 4% | 53.9 2% |
| Witcher 3 ultra * (dB) | 56.3 | 59.82 |
* ... smaller is better
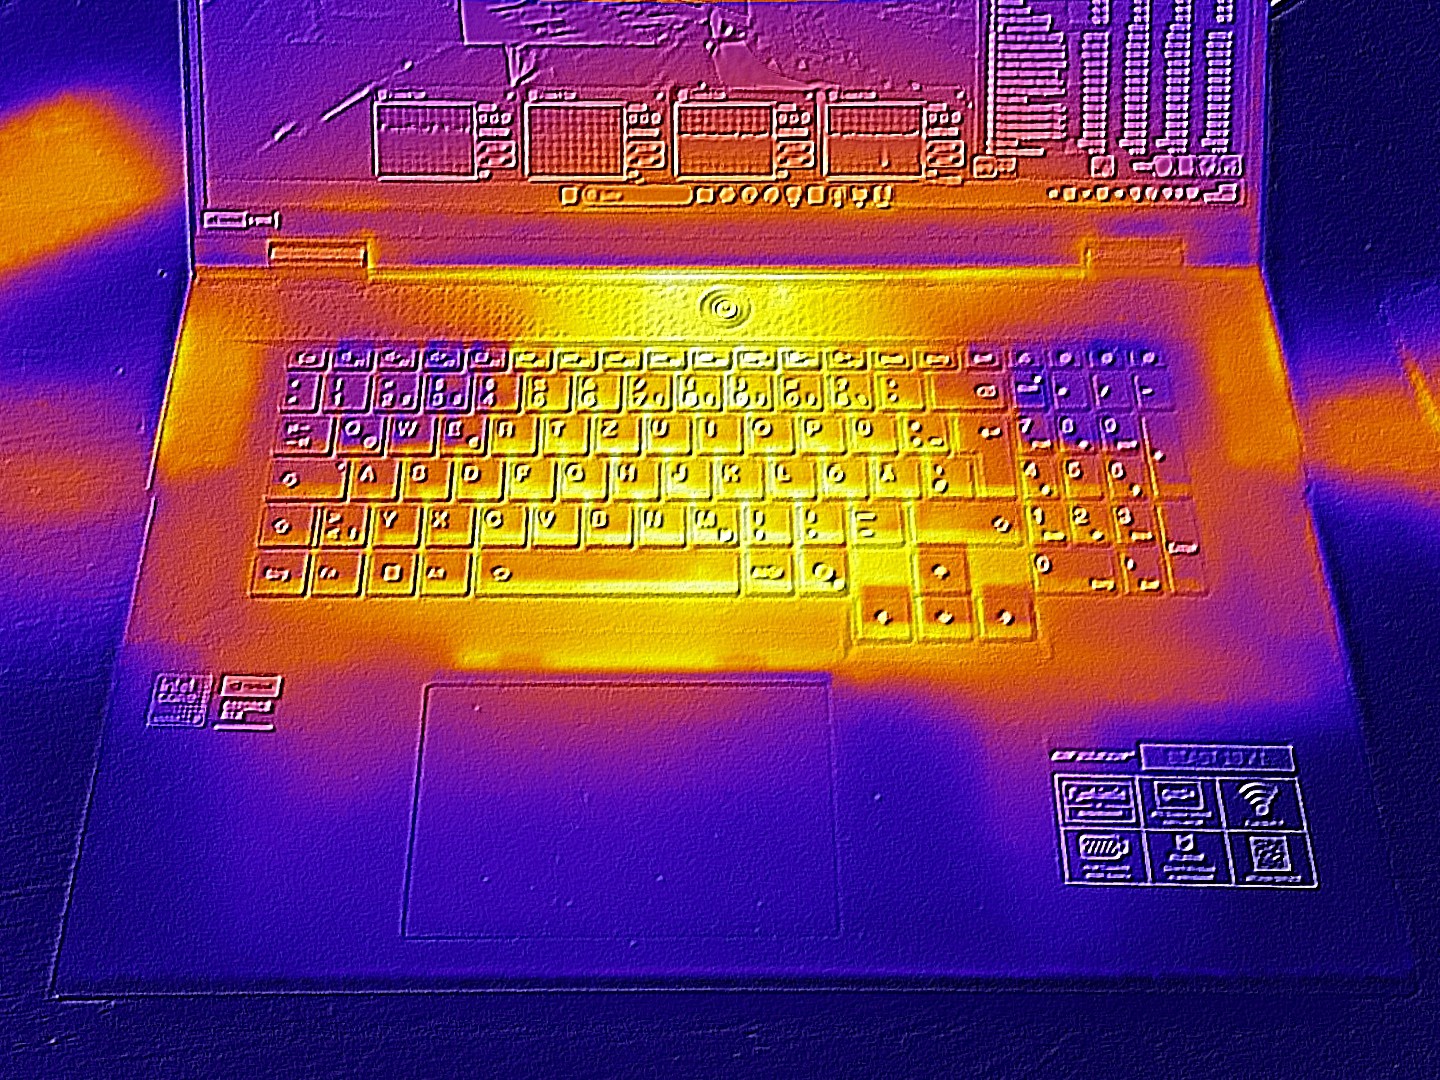
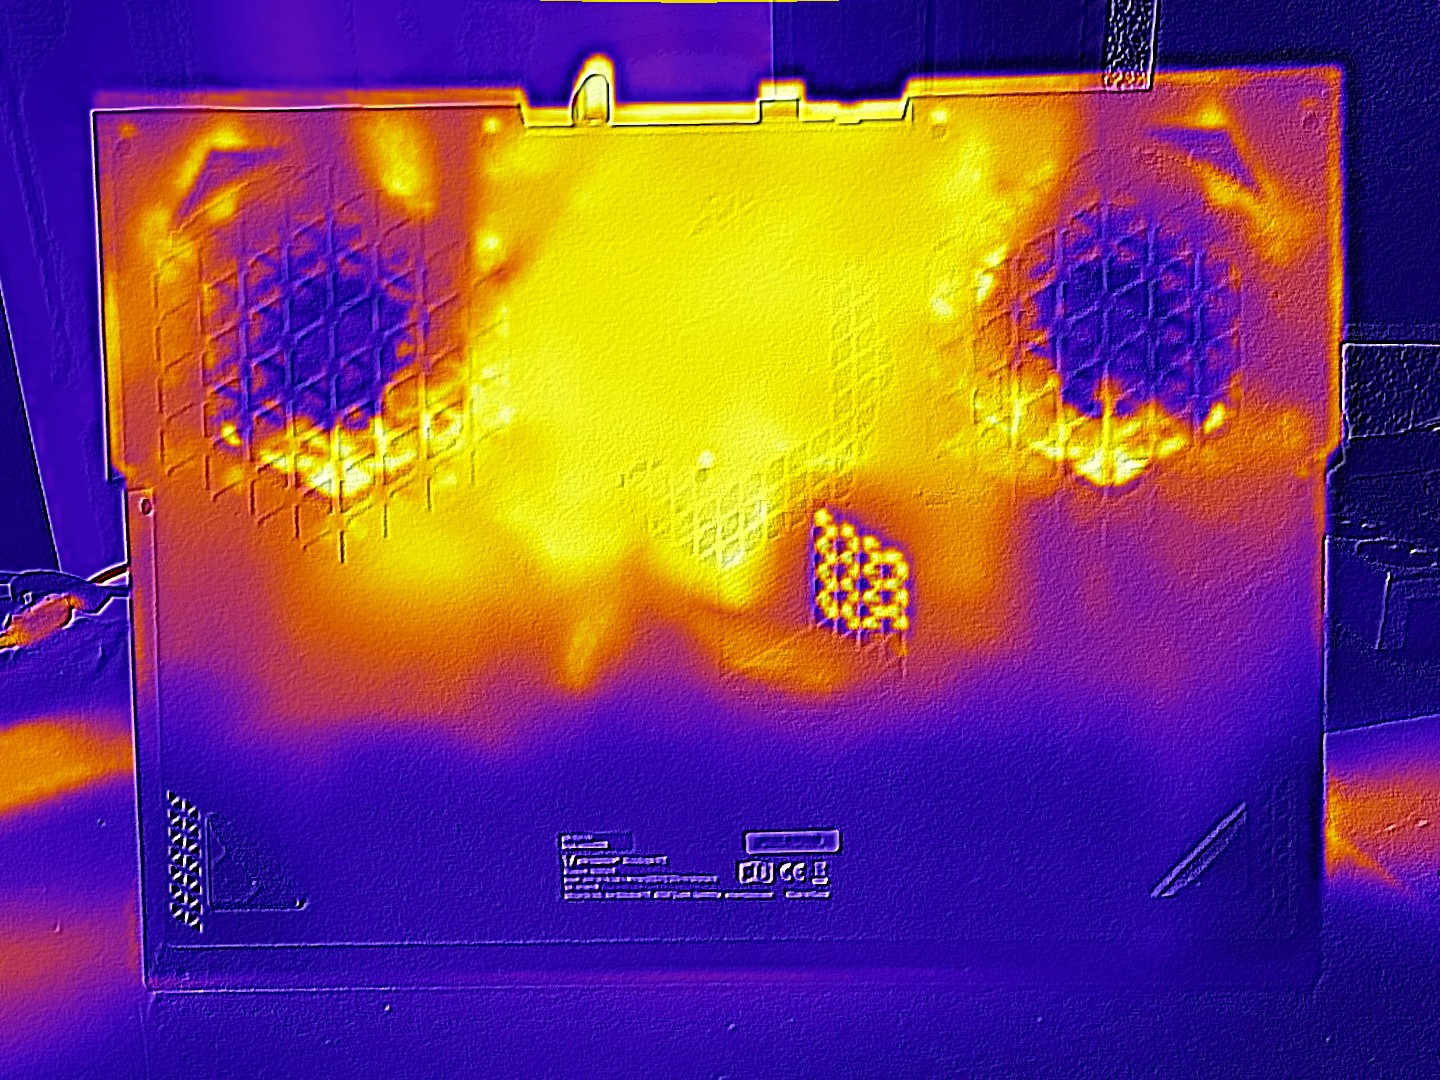
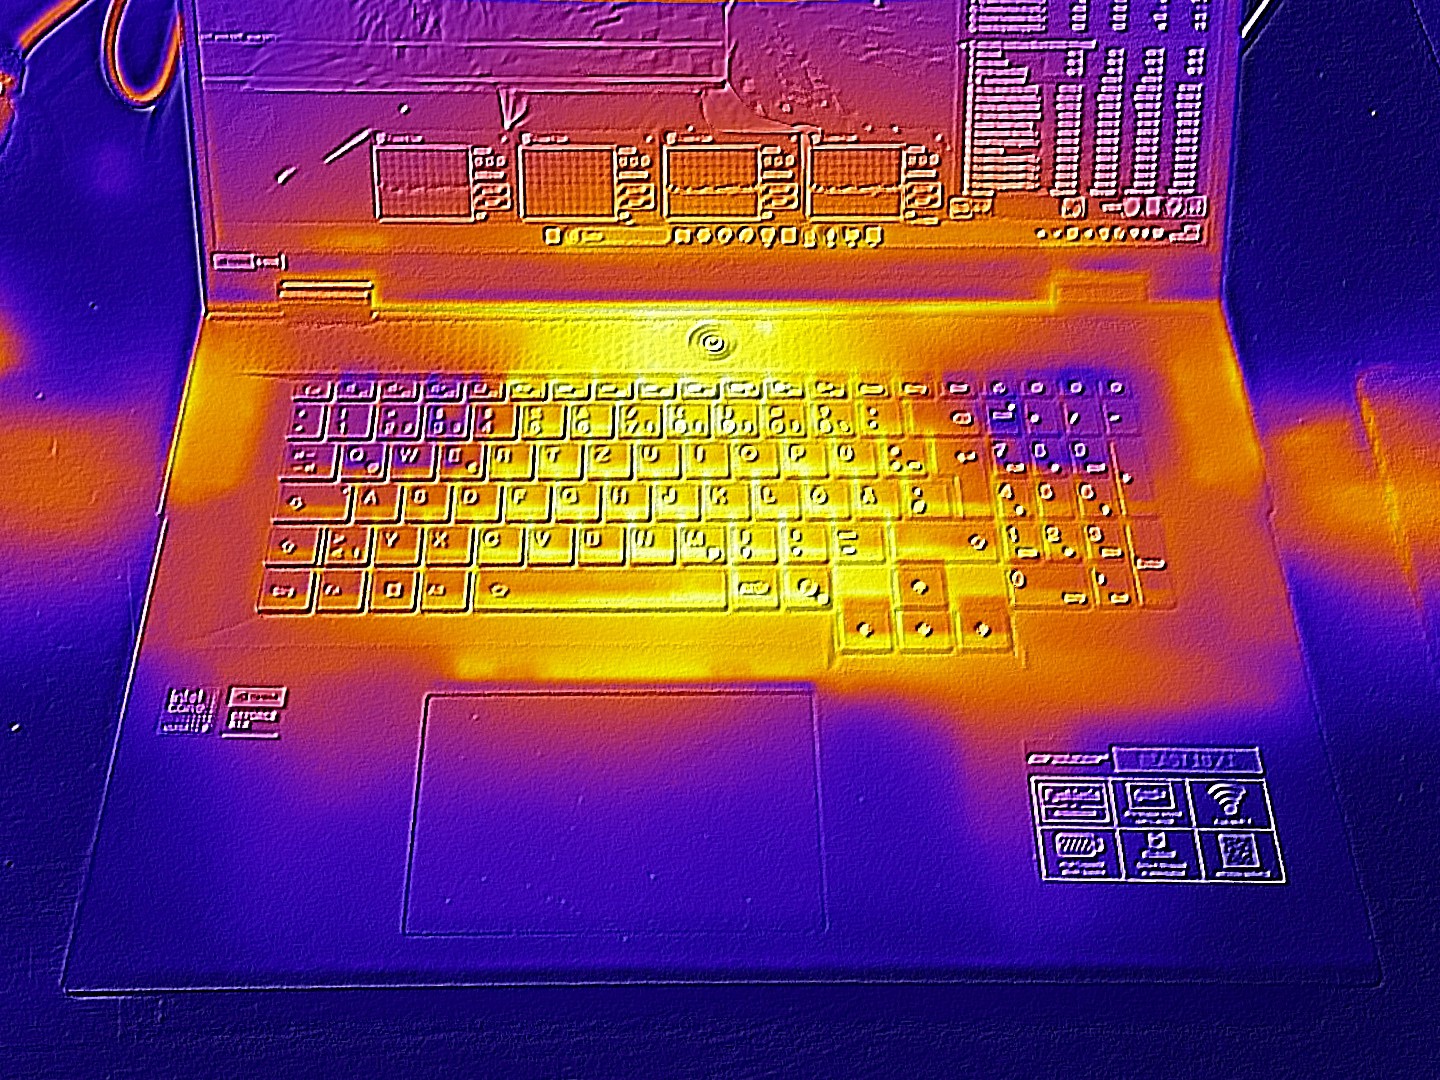
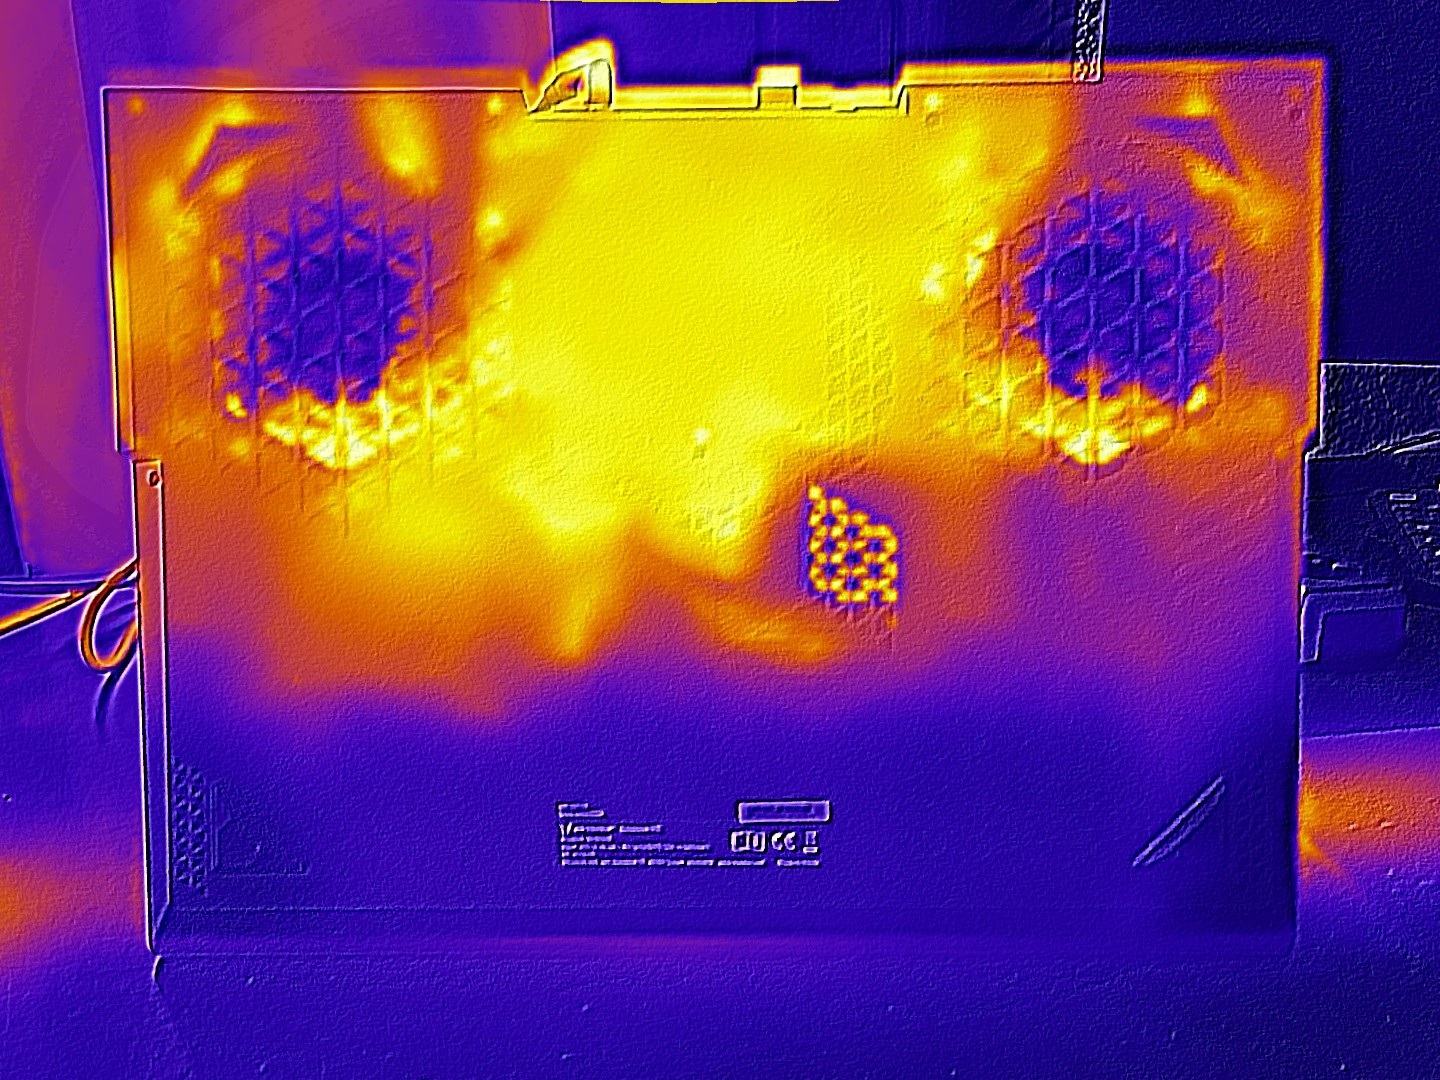
Temperature
The case temperatures are less of a concern. A maximum of 47 °C on the top and 48 °C on the bottom is typical for a high-end laptop. In idle mode, the surfaces mostly stay below the 30 °C mark, keeping them pleasantly cool.
(-) The maximum temperature on the upper side is 47 °C / 117 F, compared to the average of 40.4 °C / 105 F, ranging from 21.2 to 68.8 °C for the class Gaming.
(-) The bottom heats up to a maximum of 48 °C / 118 F, compared to the average of 43.2 °C / 110 F
(+) In idle usage, the average temperature for the upper side is 27.9 °C / 82 F, compared to the device average of 33.9 °C / 93 F.
(-) 3: The average temperature for the upper side is 42 °C / 108 F, compared to the average of 33.9 °C / 93 F for the class Gaming.
(-) The palmrests and touchpad can get very hot to the touch with a maximum of 41 °C / 105.8 F.
(-) The average temperature of the palmrest area of similar devices was 28.8 °C / 83.8 F (-12.2 °C / -22 F).
| Medion Erazer Beast 18 X1 MD62731 Ultra 9 275HX, GeForce RTX 5080 Laptop | MSI GE78HX 13VH-070US i9-13950HX, GeForce RTX 4080 Laptop GPU | Acer Predator Helios 18 N23Q2 i9-13900HX, GeForce RTX 4080 Laptop GPU | Asus Strix Scar 18 G835LX Ultra 9 275HX, GeForce RTX 5090 Laptop | Aorus Master 18 AM8H Ultra 9 275HX, GeForce RTX 5090 Laptop | Lenovo Legion Pro 7i 16 Gen 10 Ultra 9 275HX, GeForce RTX 5080 Laptop | |
|---|---|---|---|---|---|---|
| Heat | 6% | -7% | 5% | -8% | 3% | |
| Maximum Upper Side * (°C) | 47 | 37.4 20% | 35 26% | 45.6 3% | 50 -6% | 42.6 9% |
| Maximum Bottom * (°C) | 48 | 45 6% | 56 -17% | 46 4% | 46 4% | 41.2 14% |
| Idle Upper Side * (°C) | 29 | 29.8 -3% | 34 -17% | 28.9 -0% | 36 -24% | 32.6 -12% |
| Idle Bottom * (°C) | 33 | 32.4 2% | 39 -18% | 29.2 12% | 35 -6% | 32.4 2% |
* ... smaller is better
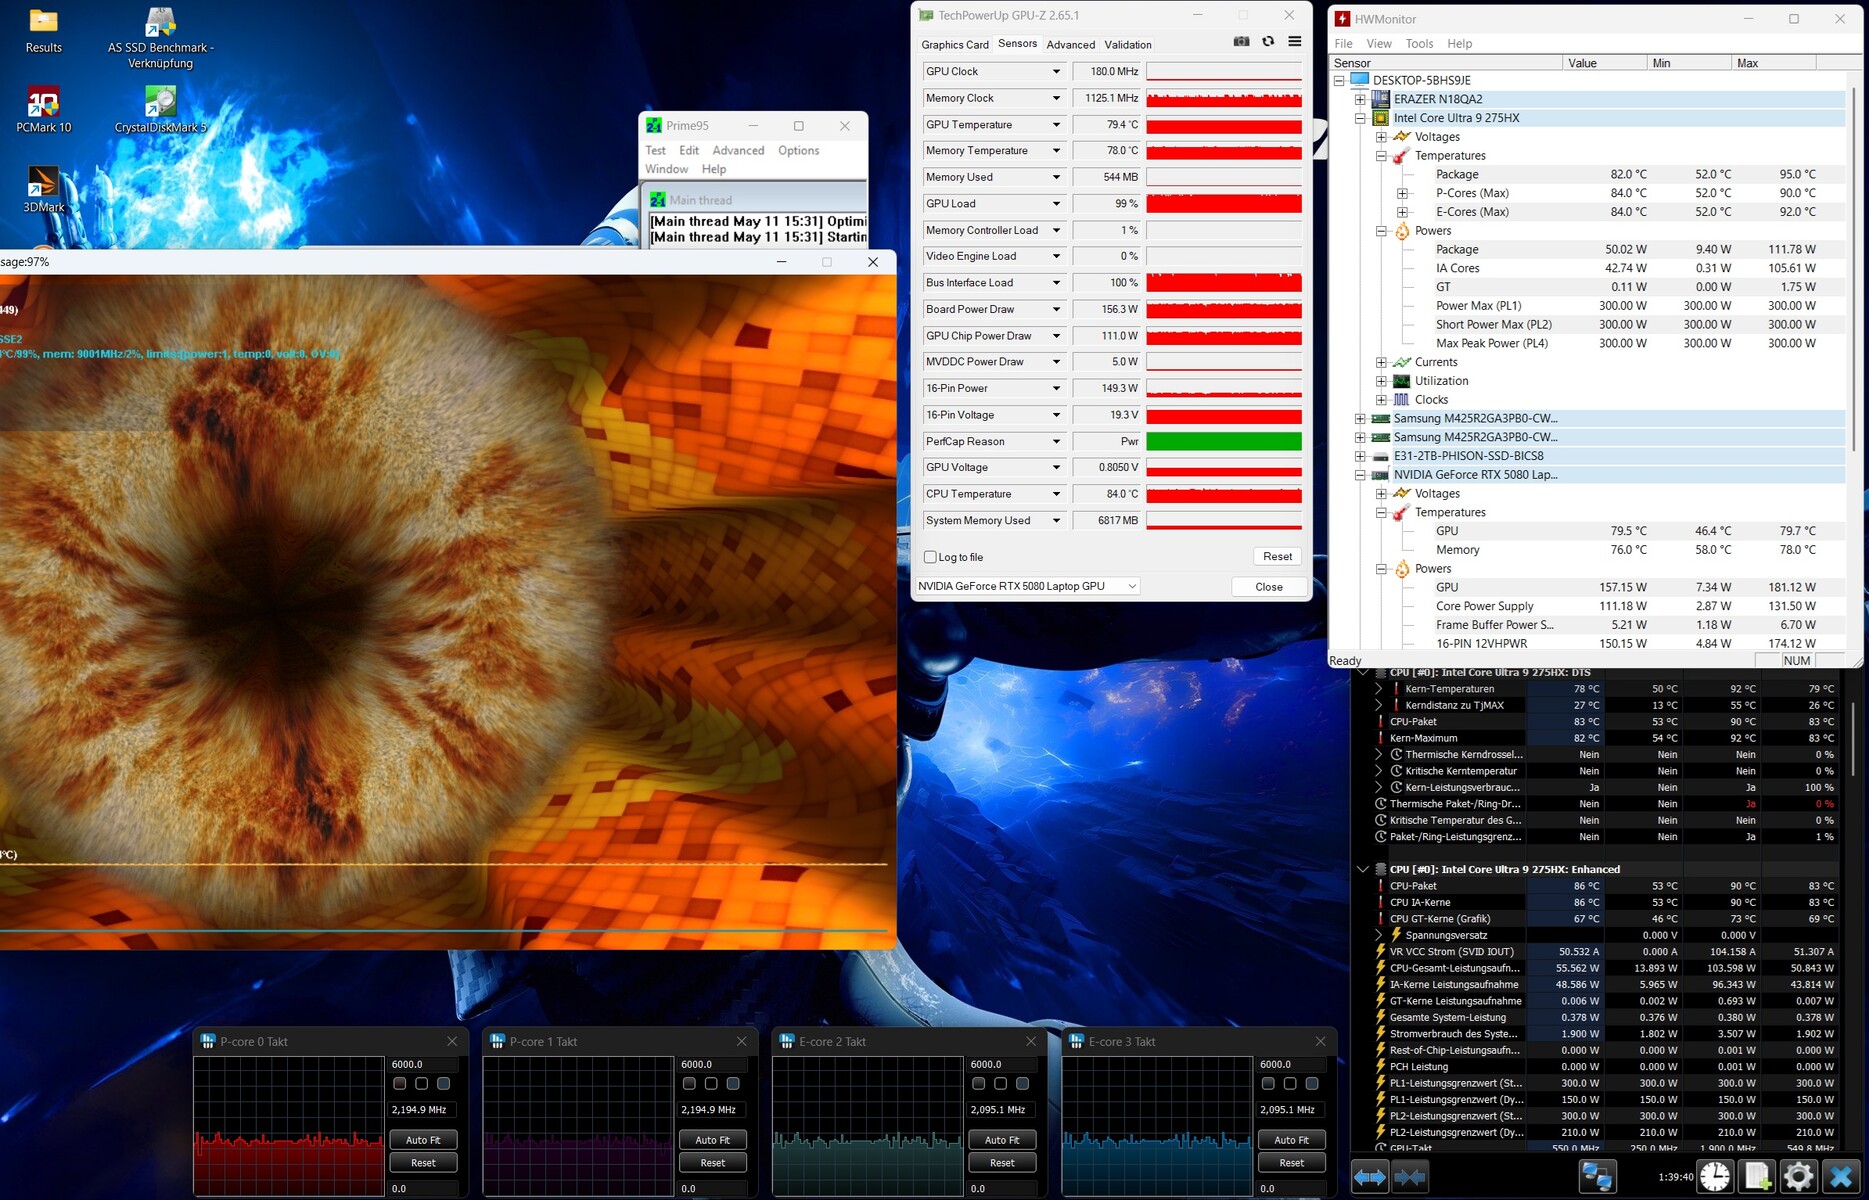
Stress test
Our stress test with Furmark and Prime95 did not cause the components to sweat too much. Around 80 °C for the CPU and GPU is acceptable.
Speaker
The sound system can also fill larger rooms with a maximum volume of 89 dB(A). According to the audio analysis, the sound quality is slightly below that of the Aorus Master 18 but remains relatively good for a notebook, despite the usual bass weaknesses.
Medion Erazer Beast 18 X1 MD62731 audio analysis
(+) | speakers can play relatively loud (89 dB)
Bass 100 - 315 Hz
(-) | nearly no bass - on average 18.6% lower than median
(±) | linearity of bass is average (13% delta to prev. frequency)
Mids 400 - 2000 Hz
(+) | balanced mids - only 2.8% away from median
(+) | mids are linear (4.5% delta to prev. frequency)
Highs 2 - 16 kHz
(±) | higher highs - on average 5.3% higher than median
(+) | highs are linear (6.4% delta to prev. frequency)
Overall 100 - 16.000 Hz
(+) | overall sound is linear (14.2% difference to median)
Compared to same class
» 25% of all tested devices in this class were better, 7% similar, 68% worse
» The best had a delta of 6%, average was 18%, worst was 132%
Compared to all devices tested
» 17% of all tested devices were better, 4% similar, 79% worse
» The best had a delta of 4%, average was 23%, worst was 134%
Aorus Master 18 AM8H audio analysis
(±) | speaker loudness is average but good (77 dB)
Bass 100 - 315 Hz
(±) | reduced bass - on average 8.7% lower than median
(±) | linearity of bass is average (10.3% delta to prev. frequency)
Mids 400 - 2000 Hz
(+) | balanced mids - only 3% away from median
(+) | mids are linear (4.3% delta to prev. frequency)
Highs 2 - 16 kHz
(+) | balanced highs - only 2.8% away from median
(+) | highs are linear (5.4% delta to prev. frequency)
Overall 100 - 16.000 Hz
(+) | overall sound is linear (11.9% difference to median)
Compared to same class
» 12% of all tested devices in this class were better, 4% similar, 85% worse
» The best had a delta of 6%, average was 18%, worst was 132%
Compared to all devices tested
» 9% of all tested devices were better, 2% similar, 89% worse
» The best had a delta of 4%, average was 23%, worst was 134%
Energy management
Power consumption
At idle, the power consumption fluctuates similarly to the noise level. Ideally, it is only 7.9 to 16.6 watts, which is better than all comparison devices (the dGPU is automatically activated when an external monitor is connected). In 3D mode, the power consumption is up to 330 watts, and the supplied power supply unit is also specified at 330 watts.
| Off / Standby | |
| Idle | |
| Load |
|
Key:
min: | |
| Medion Erazer Beast 18 X1 MD62731 Ultra 9 275HX, GeForce RTX 5080 Laptop | MSI GE78HX 13VH-070US i9-13950HX, GeForce RTX 4080 Laptop GPU | Acer Predator Helios 18 N23Q2 i9-13900HX, GeForce RTX 4080 Laptop GPU | Asus Strix Scar 18 G835LX Ultra 9 275HX, GeForce RTX 5090 Laptop | Aorus Master 18 AM8H Ultra 9 275HX, GeForce RTX 5090 Laptop | Lenovo Legion Pro 7i 16 Gen 10 Ultra 9 275HX, GeForce RTX 5080 Laptop | Average of class Gaming | |
|---|---|---|---|---|---|---|---|
| Power Consumption | -60% | -38% | -75% | -97% | -107% | -27% | |
| Idle Minimum * (Watt) | 7.9 | 16.1 -104% | 16 -103% | 11.4 -44% | 29 -267% | 28.5 -261% | 13 ? -65% |
| Idle Average * (Watt) | 11.5 | 24 -109% | 19 -65% | 39.2 -241% | 33 -187% | 38.8 -237% | 18.7 ? -63% |
| Idle Maximum * (Watt) | 16.6 | 34 -105% | 21.3 -28% | 40.2 -142% | 48 -189% | 45.6 -175% | 24.3 ? -46% |
| Load Average * (Watt) | 130 | 123.6 5% | 124 5% | 161.2 -24% | 141 -8% | 132.2 -2% | 108.2 ? 17% |
| Cyberpunk 2077 ultra * (Watt) | 253 | 303 -20% | 283 -12% | 318 -26% | |||
| Cyberpunk 2077 ultra external monitor * (Watt) | 245 | 295 -20% | 283 -16% | 319 -30% | |||
| Load Maximum * (Watt) | 330 | 285.7 13% | 319 3% | 430.9 -31% | 340 -3% | 384 -16% | 254 ? 23% |
| Witcher 3 ultra * (Watt) | 286 | 289 |
* ... smaller is better
Power consumption Cyberpunk / Stress test
Power consumption with external monitor
Battery life
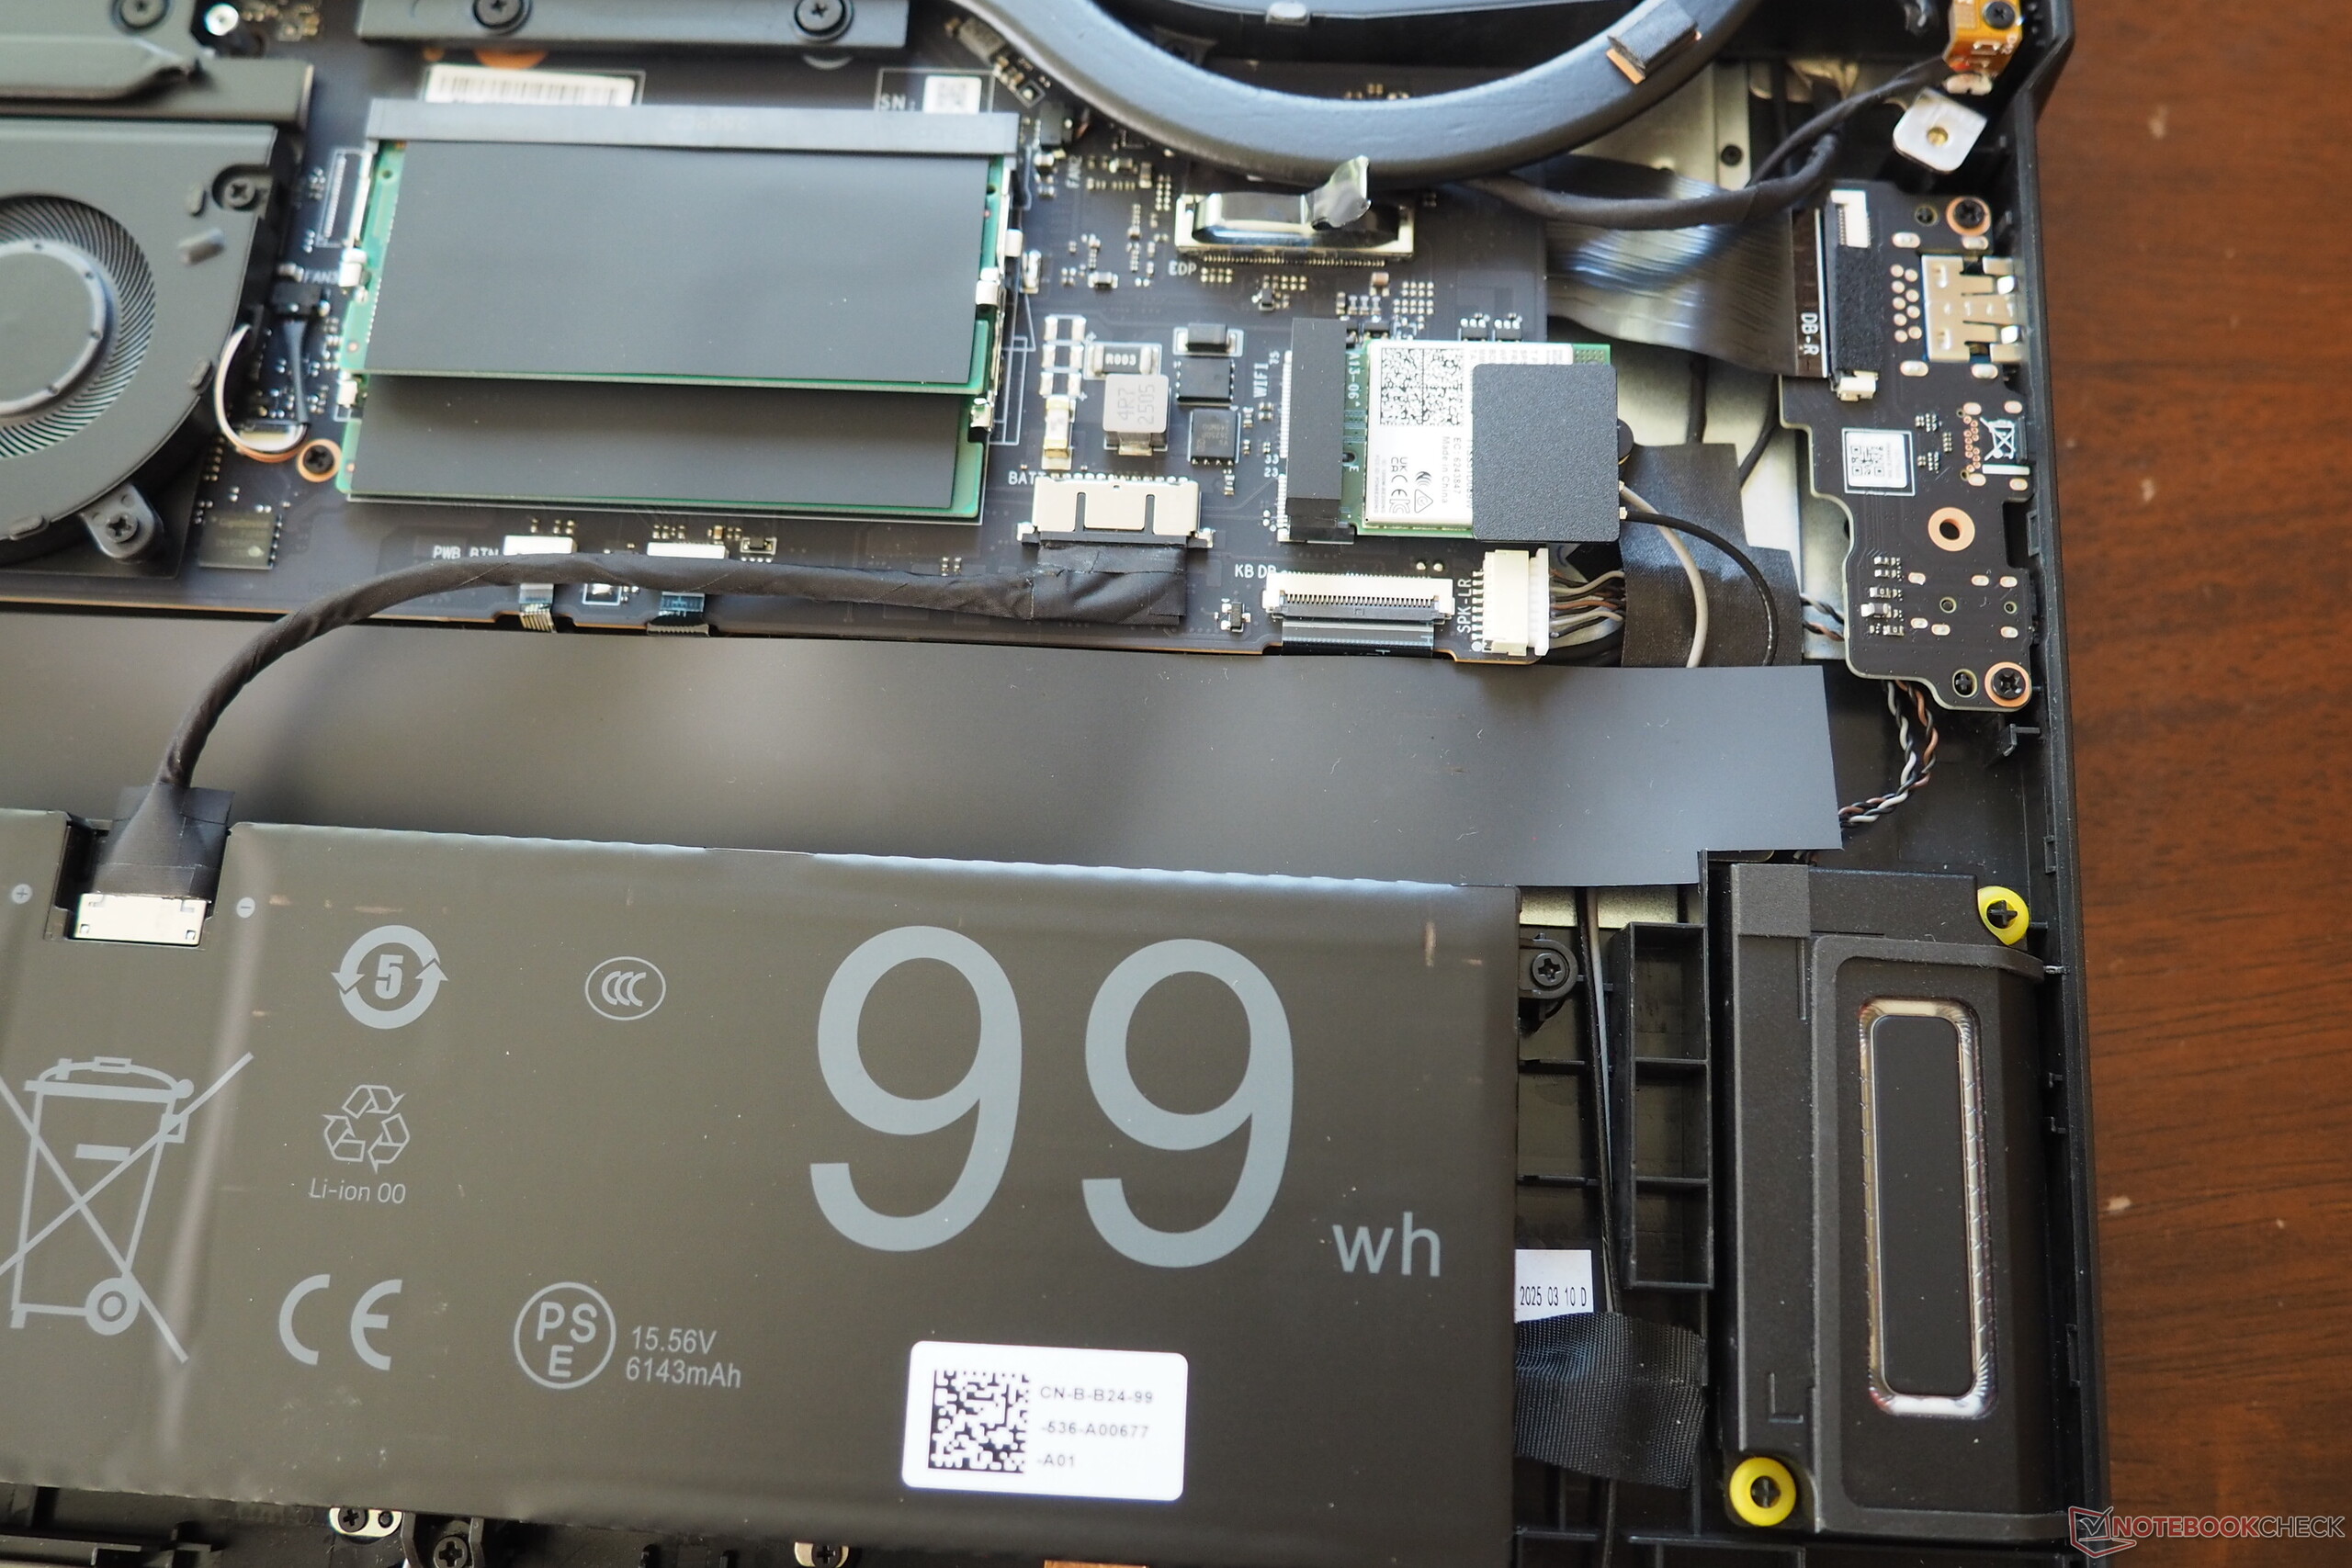
Thanks to its moderate power consumption during idle mode, the Erazer Beast 18 X1 delivers the longest battery life among the test devices. Approximately 8 hours of internet browsing with the brightness set to 150 cd/m² is a more than respectable figure.
| Medion Erazer Beast 18 X1 MD62731 Ultra 9 275HX, GeForce RTX 5080 Laptop, 99 Wh | MSI GE78HX 13VH-070US i9-13950HX, GeForce RTX 4080 Laptop GPU, 99 Wh | Acer Predator Helios 18 N23Q2 i9-13900HX, GeForce RTX 4080 Laptop GPU, 90 Wh | Asus Strix Scar 18 G835LX Ultra 9 275HX, GeForce RTX 5090 Laptop, 90 Wh | Aorus Master 18 AM8H Ultra 9 275HX, GeForce RTX 5090 Laptop, 99 Wh | Lenovo Legion Pro 7i 16 Gen 10 Ultra 9 275HX, GeForce RTX 5080 Laptop, 99 Wh | Average of class Gaming | |
|---|---|---|---|---|---|---|---|
| Battery runtime | -23% | -44% | -30% | -38% | -32% | -11% | |
| WiFi v1.3 (h) | 7.9 | 6.1 -23% | 4.4 -44% | 5.5 -30% | 4.9 -38% | 5.4 -32% | 7 ? -11% |
| Reader / Idle (h) | 7.3 | 5.8 | 8.71 ? | ||||
| Load (h) | 1.5 | 1.7 | 1.2 | 1.9 | 0.8 | 1.51 ? | |
| H.264 (h) | 4.8 | 5.8 | 8.9 ? | ||||
| Cyberpunk 2077 ultra 150cd (h) | 0.7 |
Notebookcheck overall rating
The Medion Erazer Beast 18 X1 stands out from the 18-inch competition with its respectable battery life, but tends to be louder under load (in the same performance mode) than its counterparts.
Medion Erazer Beast 18 X1 MD62731
- 05/21/2025 v8
Florian Glaser
 Total Sustainability Score:
 Possible alternatives comparison
Image | Model / Review | Price | Weight | Height | Display |
|---|---|---|---|---|---|
1. 82.5%  | Medion Erazer Beast 18 X1 MD62731 Intel Core Ultra 9 275HX ⎘ NVIDIA GeForce RTX 5080 Laptop ⎘ 32 GB Memory, SSD | Amazon: List Price: 3700 EUR | 3.6 kg | 30.4 mm | 18.00" 2560x1600 168 PPI IPS |
2. 88.3% v7 (old)  | MSI GE78HX 13VH-070US Intel Core i9-13950HX ⎘ NVIDIA GeForce RTX 4080 Laptop GPU ⎘ 32 GB Memory, 2048 GB SSD | Amazon: 1. $136.99 Compatible with MSI Raider G... 2. $119.99 330W Charger for MSI Raider ... 3. $52.99 Replacement Backlit Keyboard... List Price: 3600 USD | 3 kg | 23 mm | 17.00" 2560x1600 178 PPI IPS |
3. 88.3% v7 (old)  | Acer Predator Helios 18 N23Q2 Intel Core i9-13900HX ⎘ NVIDIA GeForce RTX 4080 Laptop GPU ⎘ 32 GB Memory, 2048 GB SSD | Amazon: 1. $2,796.73 Acer Predator Helios Neo 18 ... 2. $165.98 New KrystalPix LCD Display F... 3. $1,999.99 Acer Predator Helios Neo 18 ... List Price: 3699 Euro | 3.2 kg | 29.15 mm | 18.00" 2560x1600 168 PPI IPS |
4. 88% 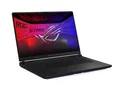 | Asus Strix Scar 18 G835LX Intel Core Ultra 9 275HX ⎘ NVIDIA GeForce RTX 5090 Laptop ⎘ 64 GB Memory, 2048 GB SSD | Amazon: List Price: 5799€ | 3.3 kg | 32 mm | 18.00" 2560x1600 168 PPI Mini-LED |
5. 86.8%  | Aorus Master 18 AM8H Intel Core Ultra 9 275HX ⎘ NVIDIA GeForce RTX 5090 Laptop ⎘ 64 GB Memory, 2048 GB SSD | Amazon: List Price: 5000 EUR | 3.4 kg | 31 mm | 18.00" 2560x1600 168 PPI Mini-LED |
6. 87.5%  | Lenovo Legion Pro 7i 16 Gen 10 Intel Core Ultra 9 275HX ⎘ NVIDIA GeForce RTX 5080 Laptop ⎘ 32 GB Memory, 1024 GB SSD | Amazon: List Price: 4200 USD | 2.6 kg | 26.65 mm | 16.00" 2560x1600 189 PPI OLED |
Transparency
The selection of devices to be reviewed is made by our editorial team. The test sample was provided to the author as a loan by the manufacturer or retailer for the purpose of this review. The lender had no influence on this review, nor did the manufacturer receive a copy of this review before publication. There was no obligation to publish this review. As an independent media company, Notebookcheck is not subjected to the authority of manufacturers, retailers or publishers.
This is how Notebookcheck is testing
Every year, Notebookcheck independently reviews hundreds of laptops and smartphones using standardized procedures to ensure that all results are comparable. We have continuously developed our test methods for around 20 years and set industry standards in the process. In our test labs, high-quality measuring equipment is utilized by experienced technicians and editors. These tests involve a multi-stage validation process. Our complex rating system is based on hundreds of well-founded measurements and benchmarks, which maintains objectivity. Further information on our test methods can be found here.

