Dell Precision 7875 high-end workstation in review: AMD Ryzen Threadripper PRO 7995WX with 96 cores and Nvidia RTX 6000
")
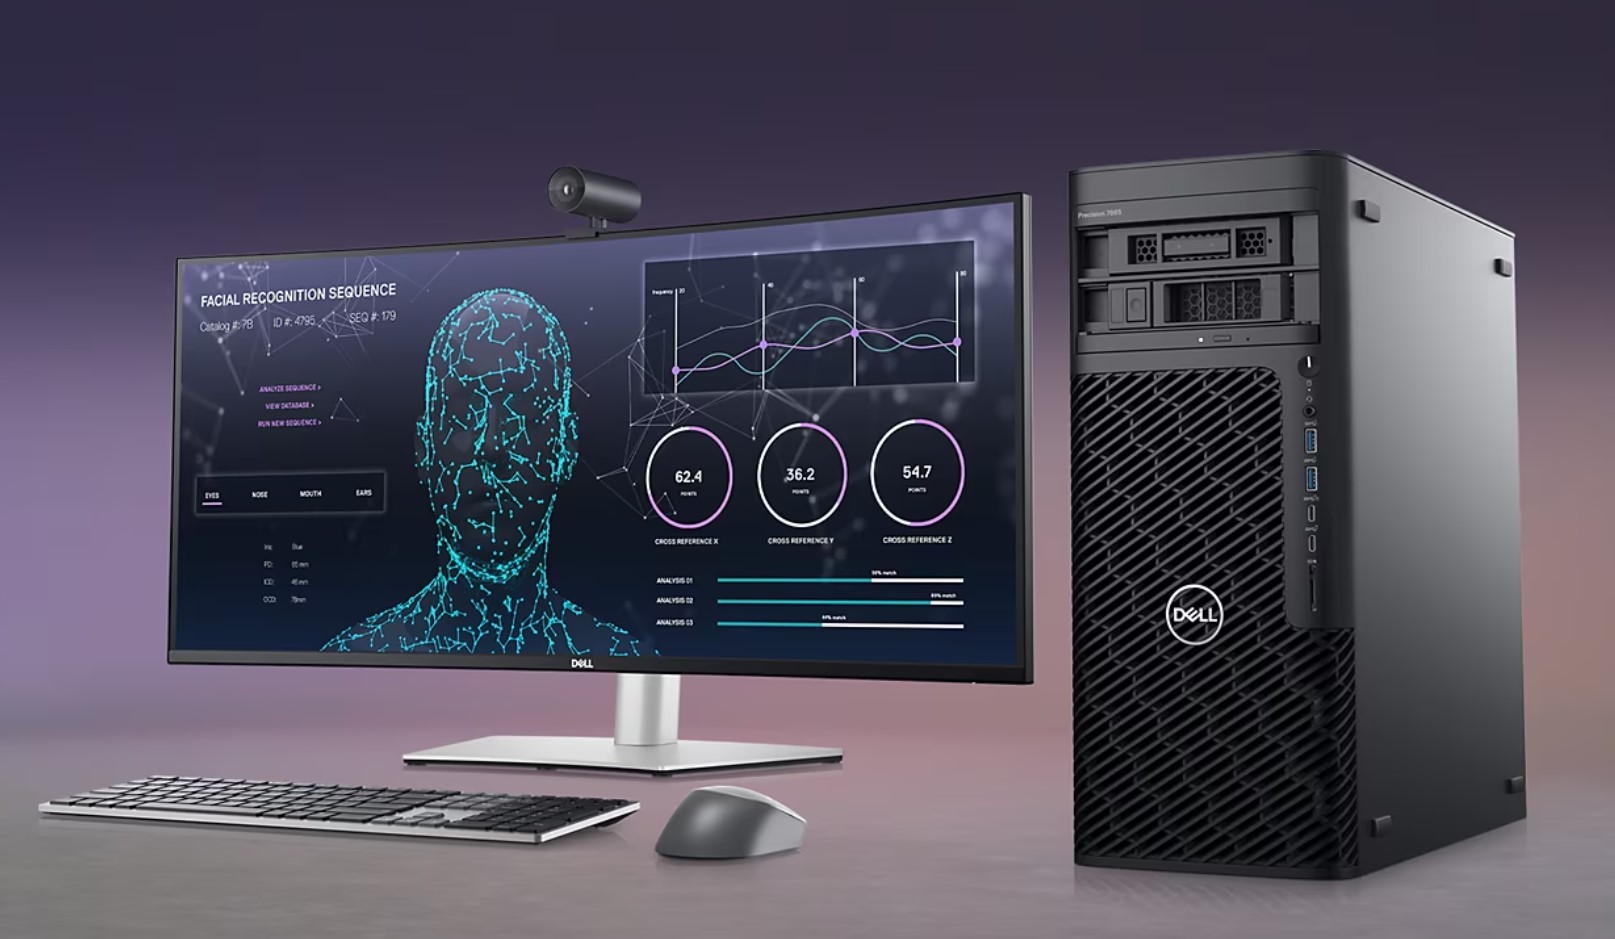
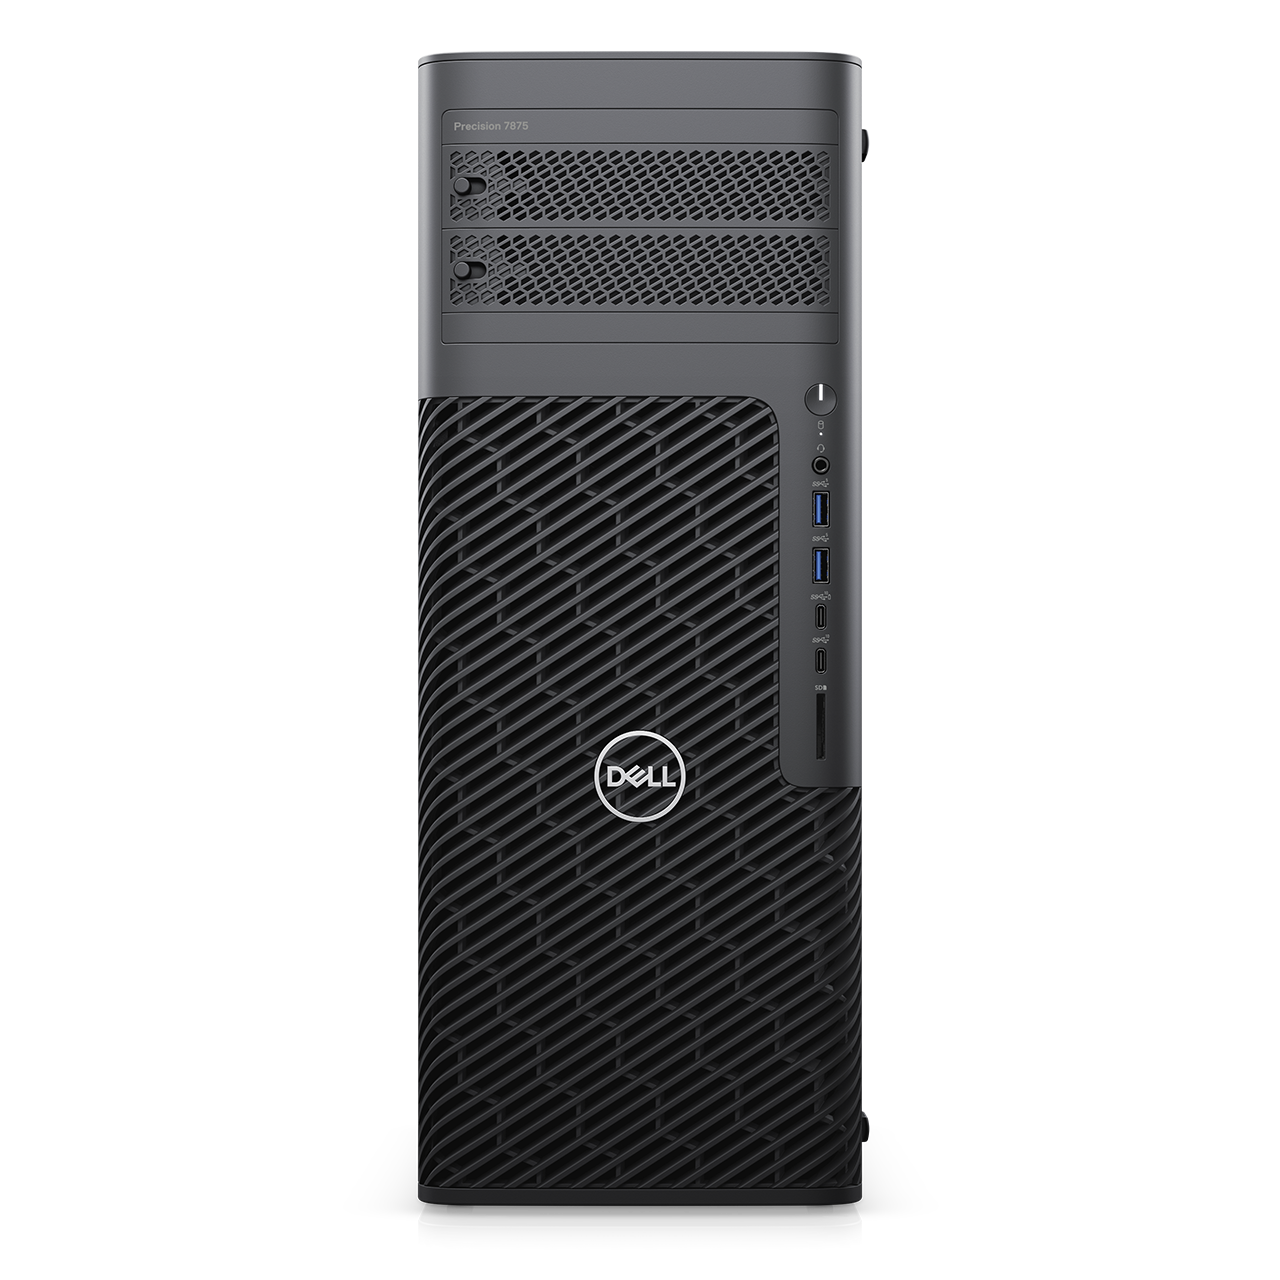
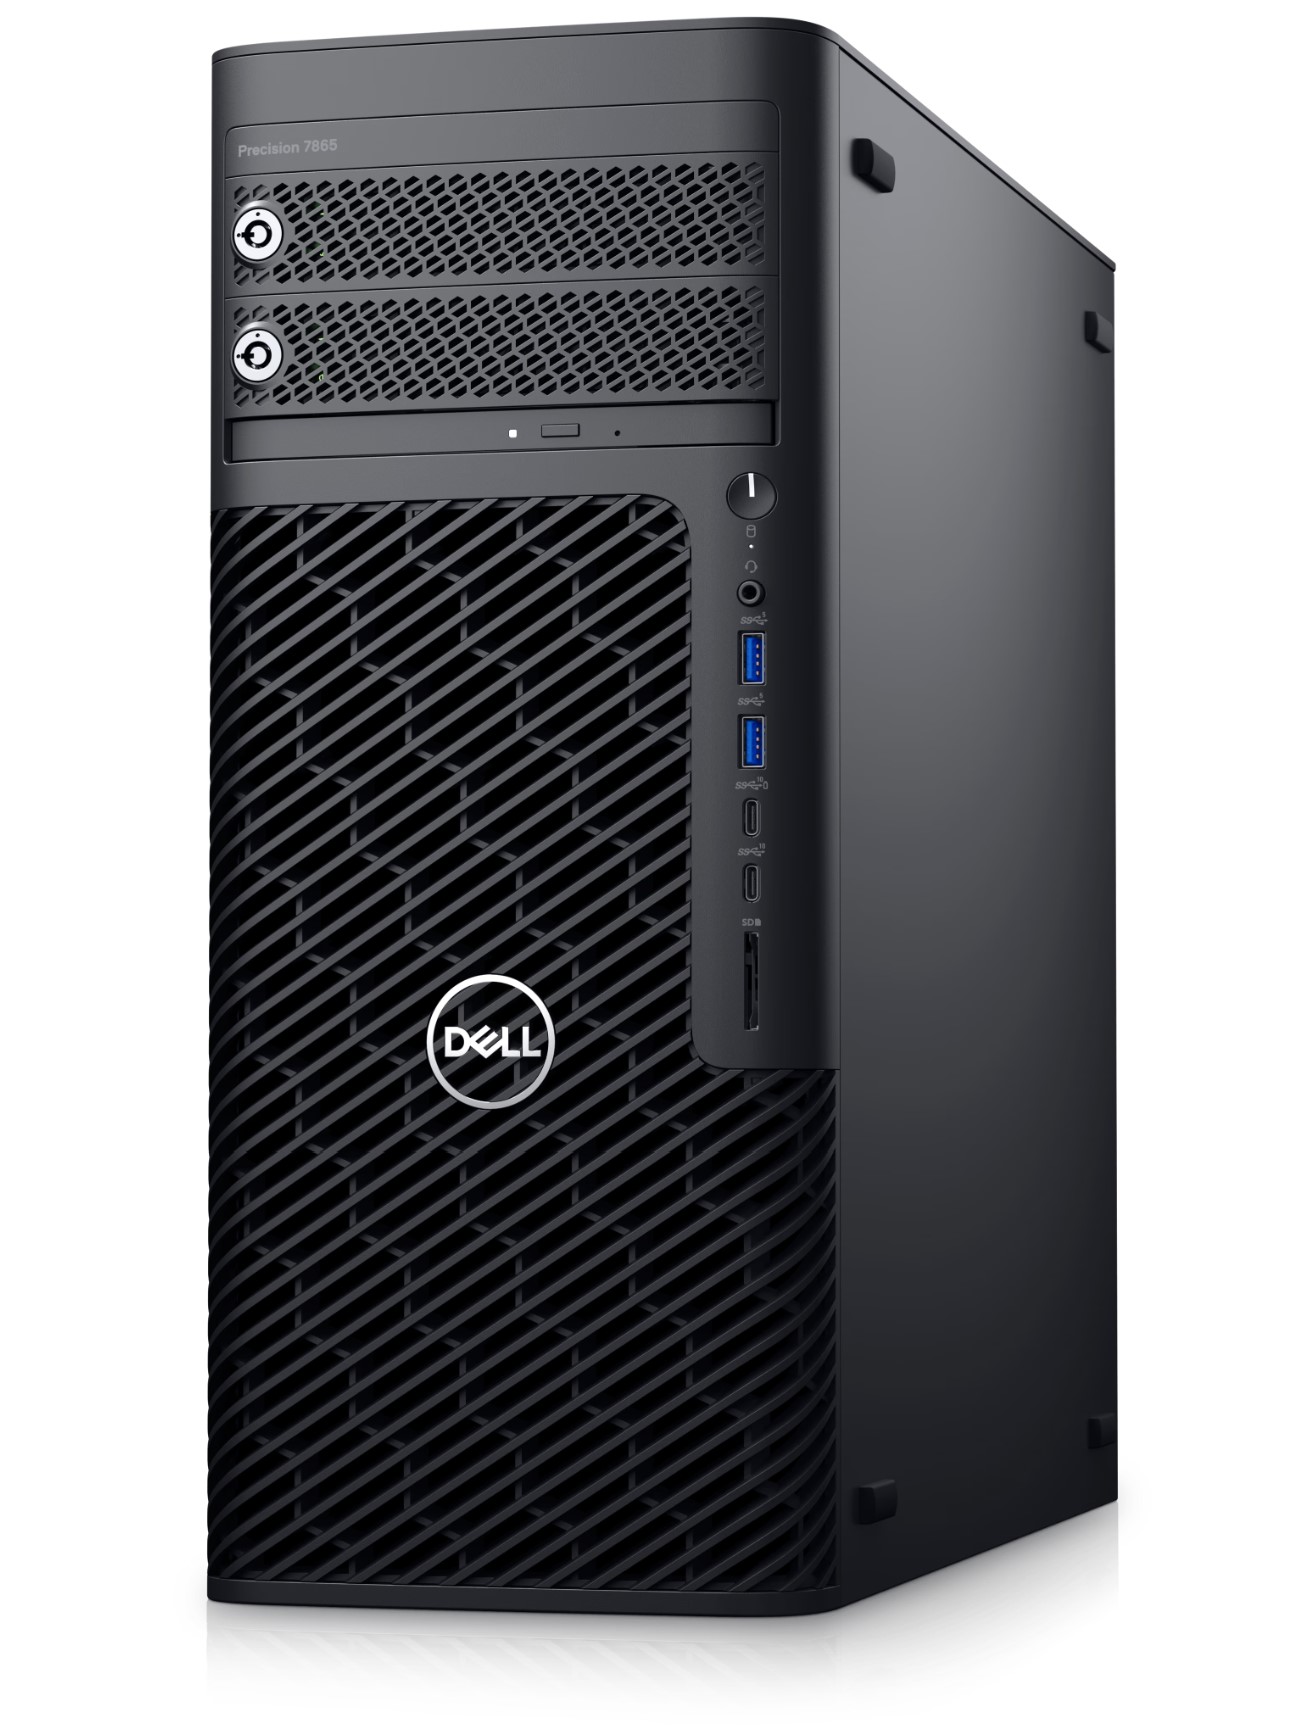
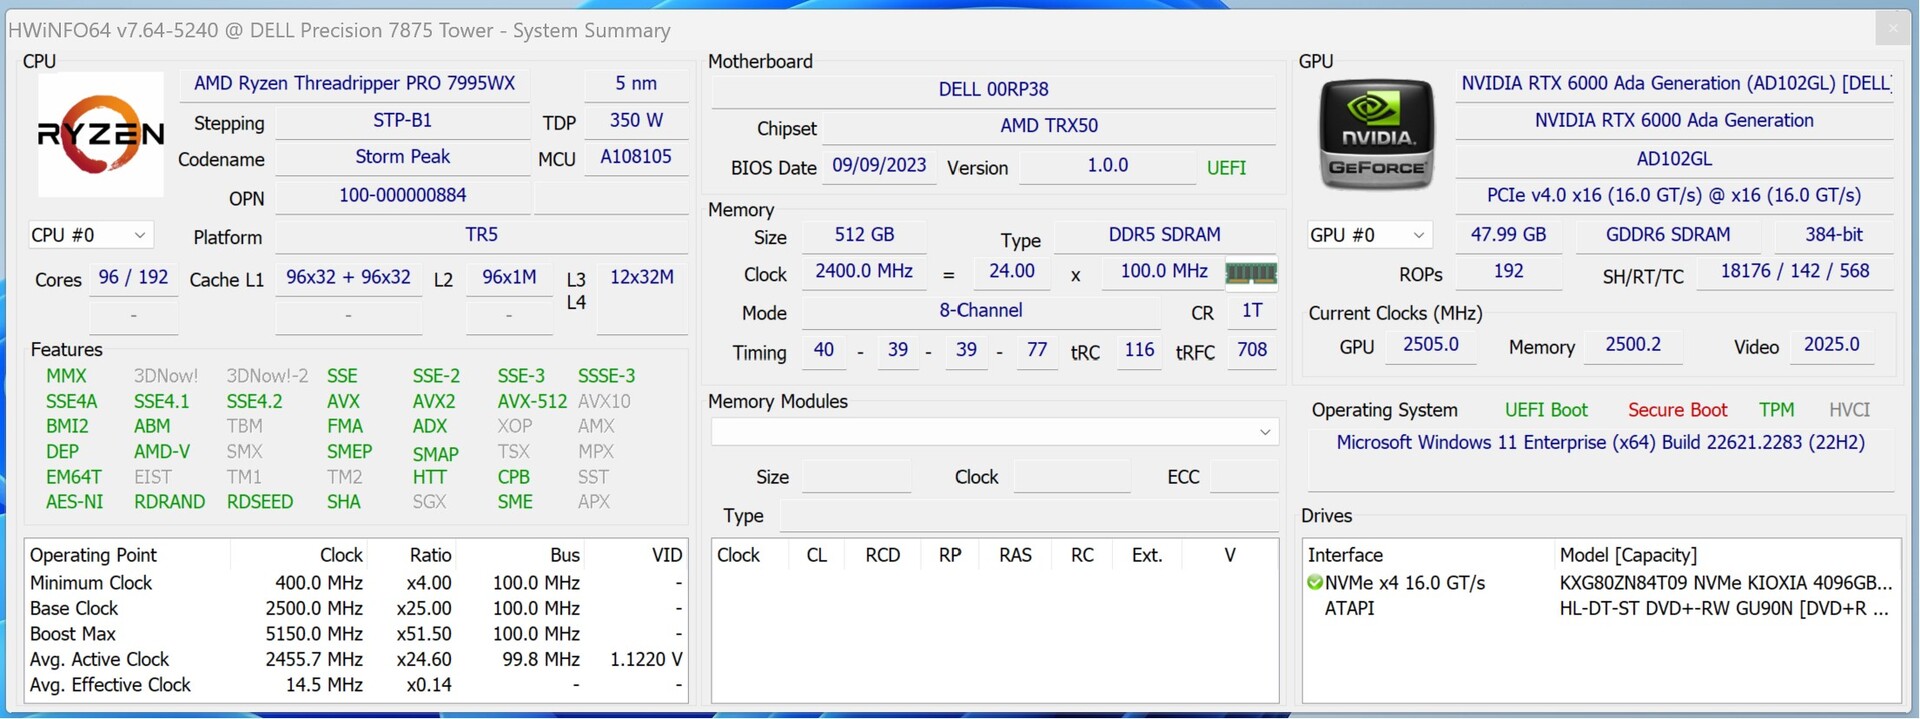
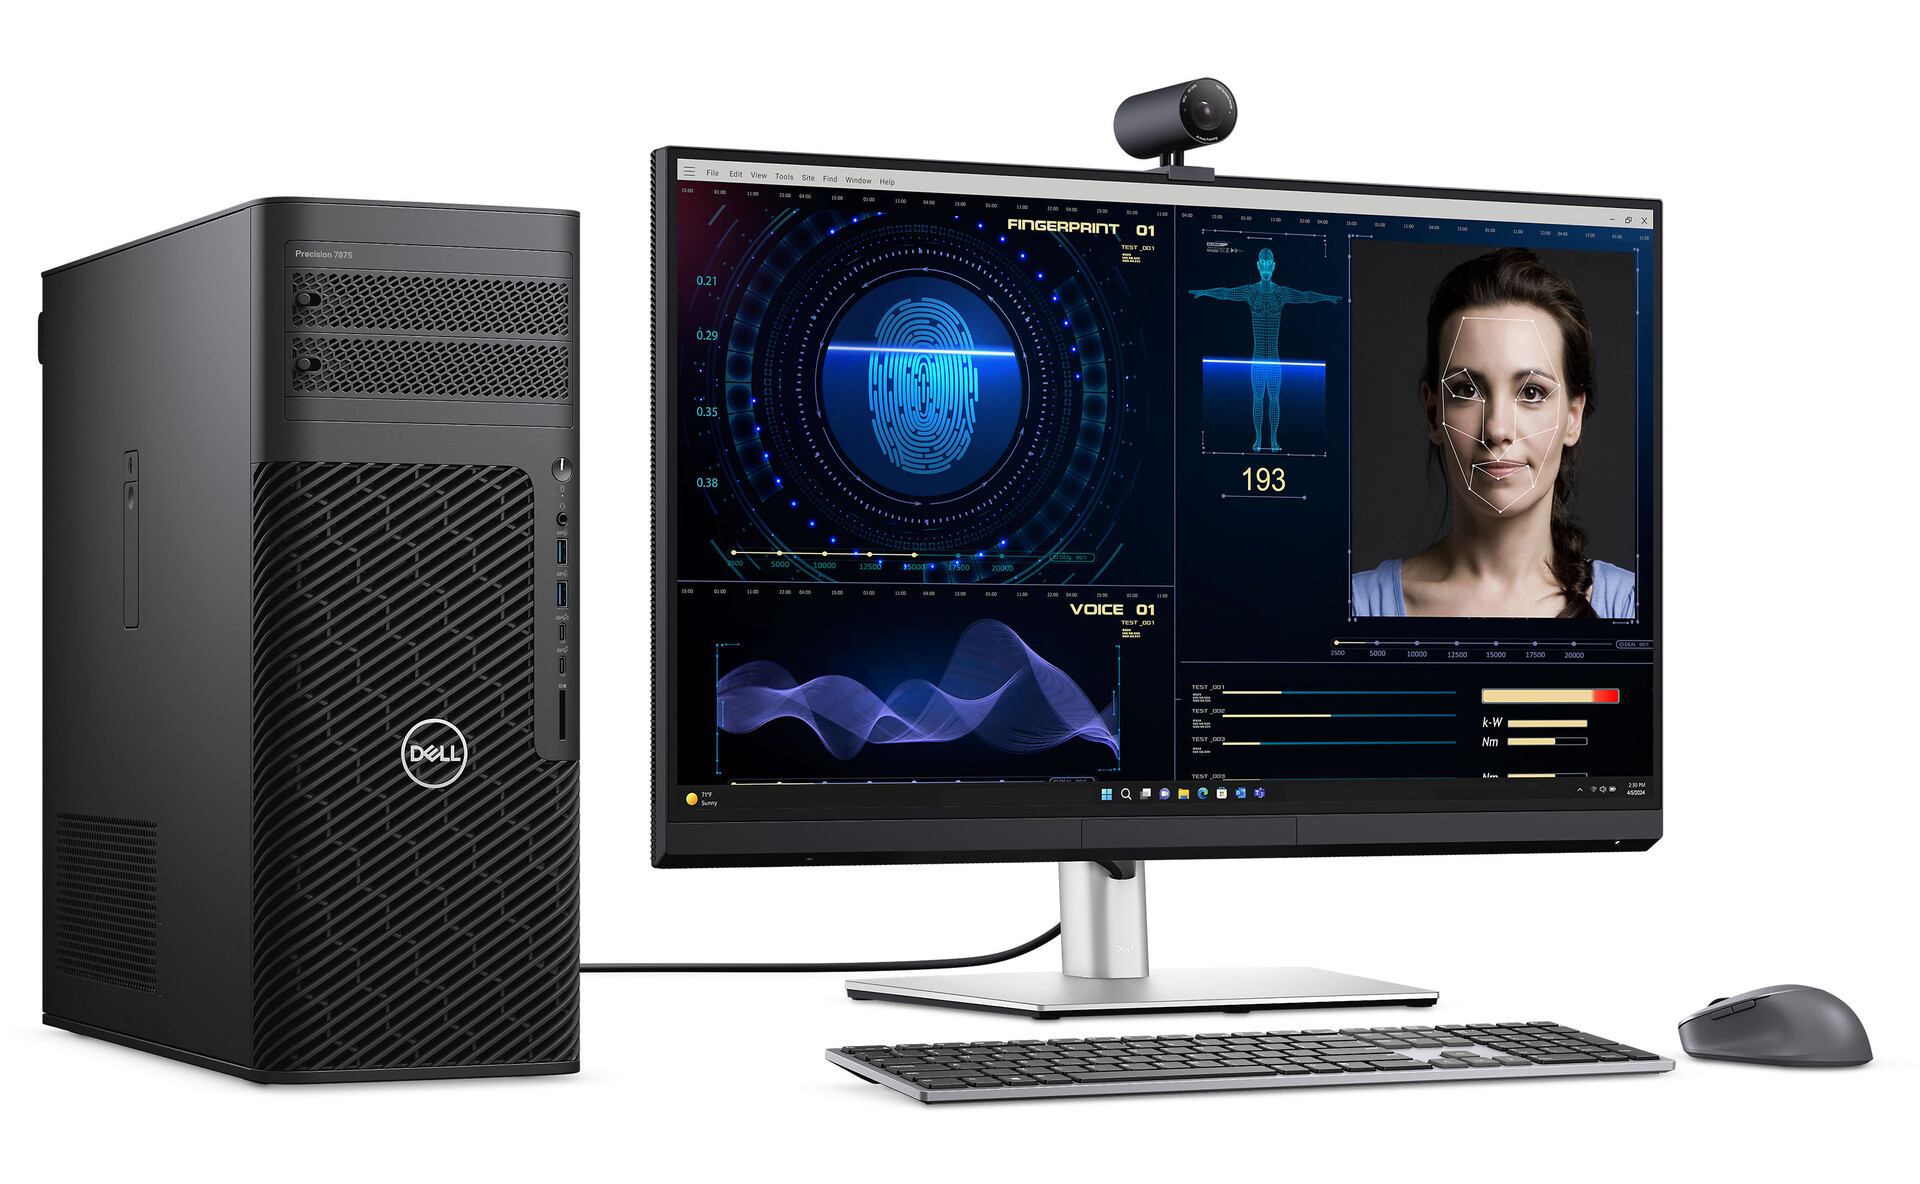
The Precision 7865 Tower Workstation is a high-performance workstation from Dell. With the addition of the latest AMD Ryzen Threadripper processors from the 7000 series, the workstation now supports up to 96 computing cores and 192 threads. Beyond this, it boasts up to 1,024 GB RAM and is equipped with two high-end workstation graphics cards, making it well-suited for exceptionally demanding tasks.
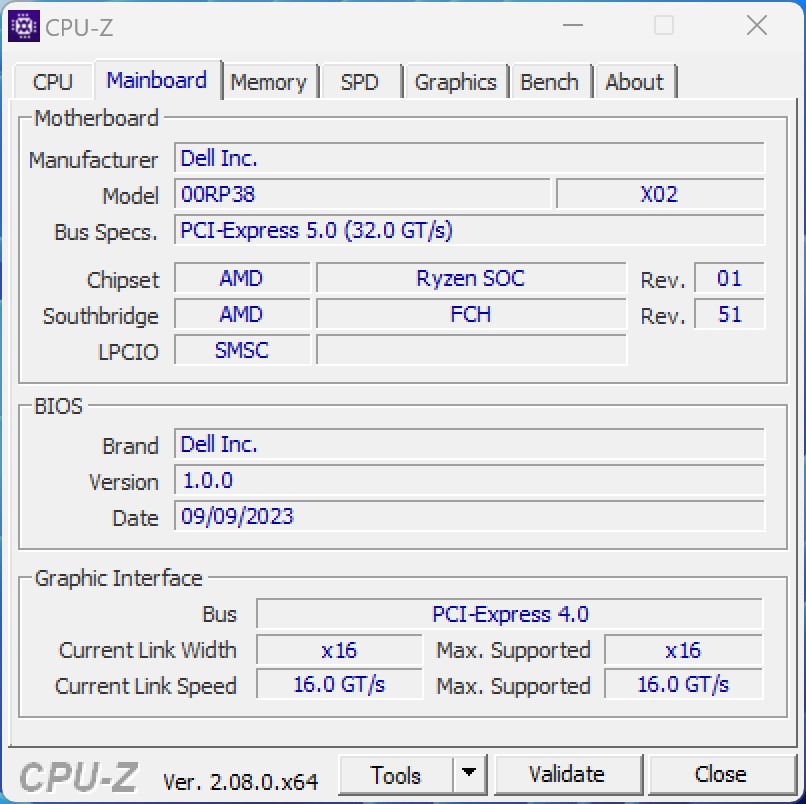
We had the opportunity to test the new high-end workstation, which features the AMD Ryzen Threadripper Pro 7995WX with 512 GB RDIMM and a 4 TB SSD. Additionally, the system incorporates two Nvidia RTX 6000 Ada Generation graphics cards. Although there is no official price information for the test system, a detailed look at the prices indicates a mid-five-digit range for the test configuration. These units are not intended for home use but find their niche in commercial environments where substantial computing power is essential, and time is money. In the long run, such systems can prove cost-effective if the time saved justifies the investment.
Of course, Dell does not only provide the top model; the systems may be customized and adapted to specific needs through the store's configuration options.
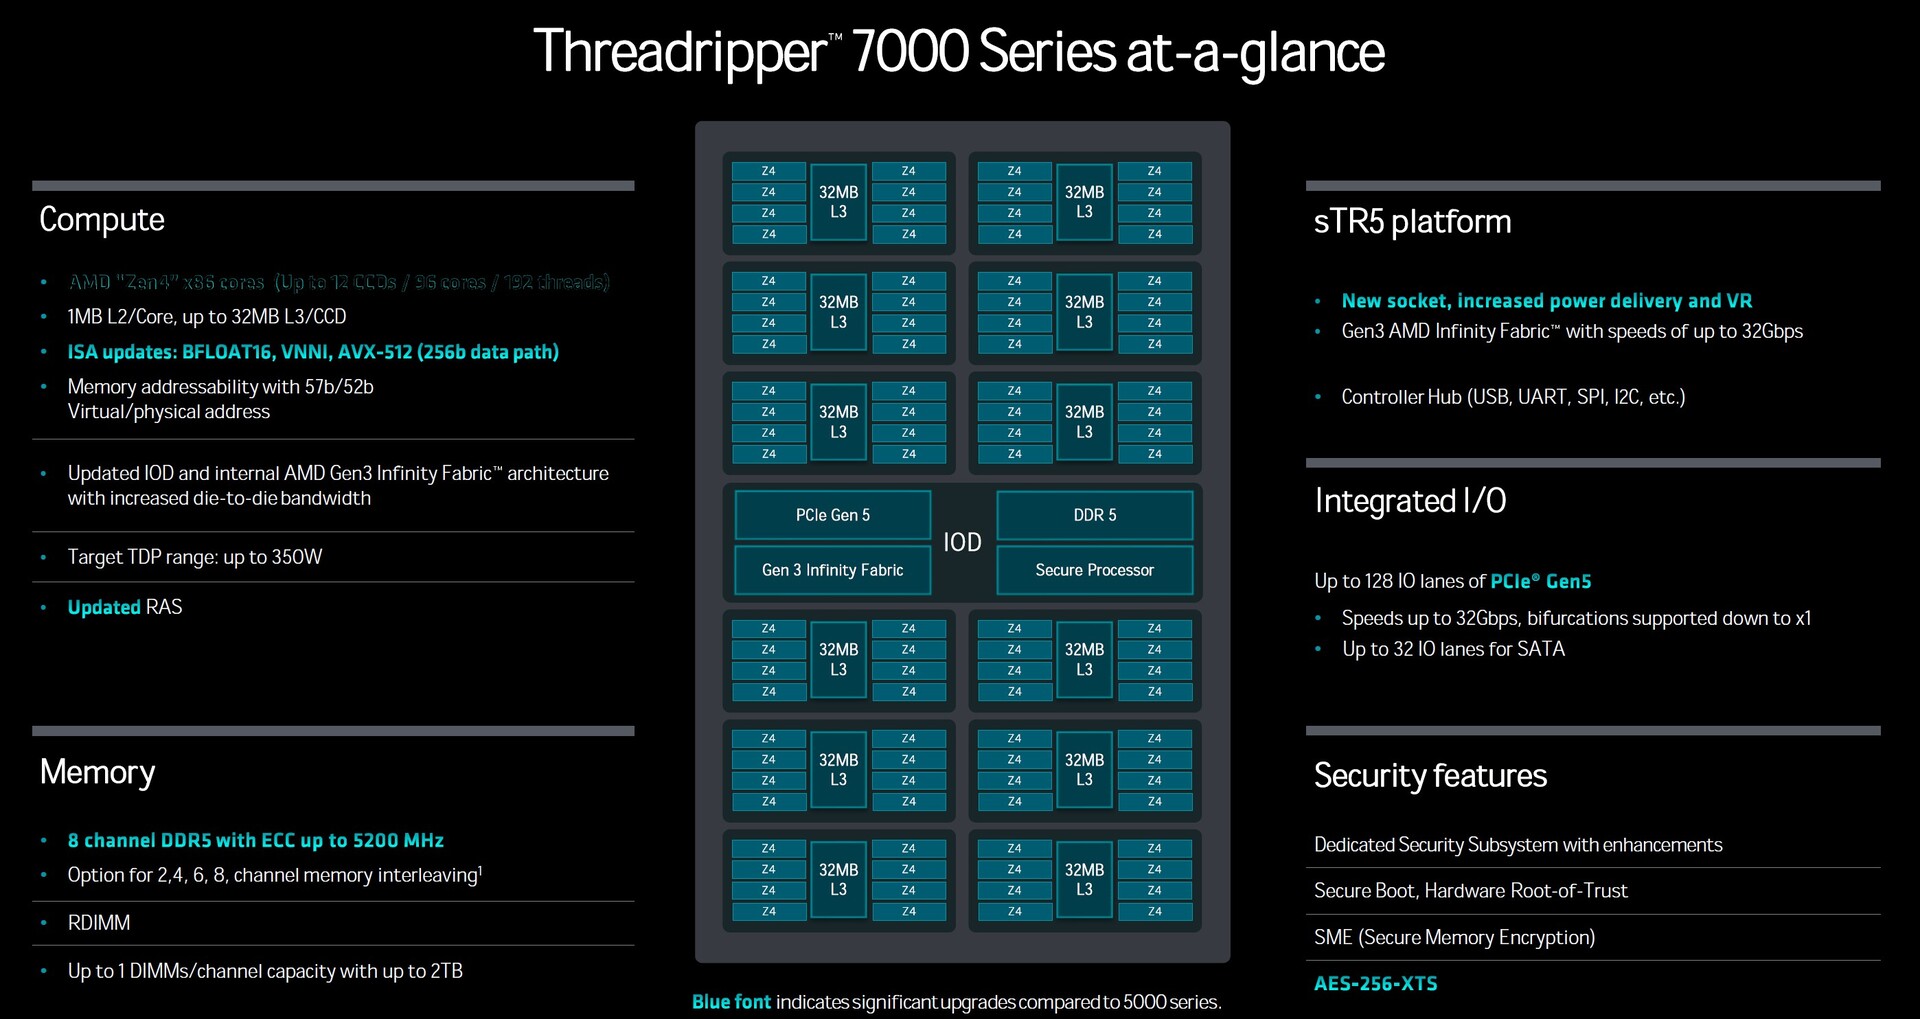
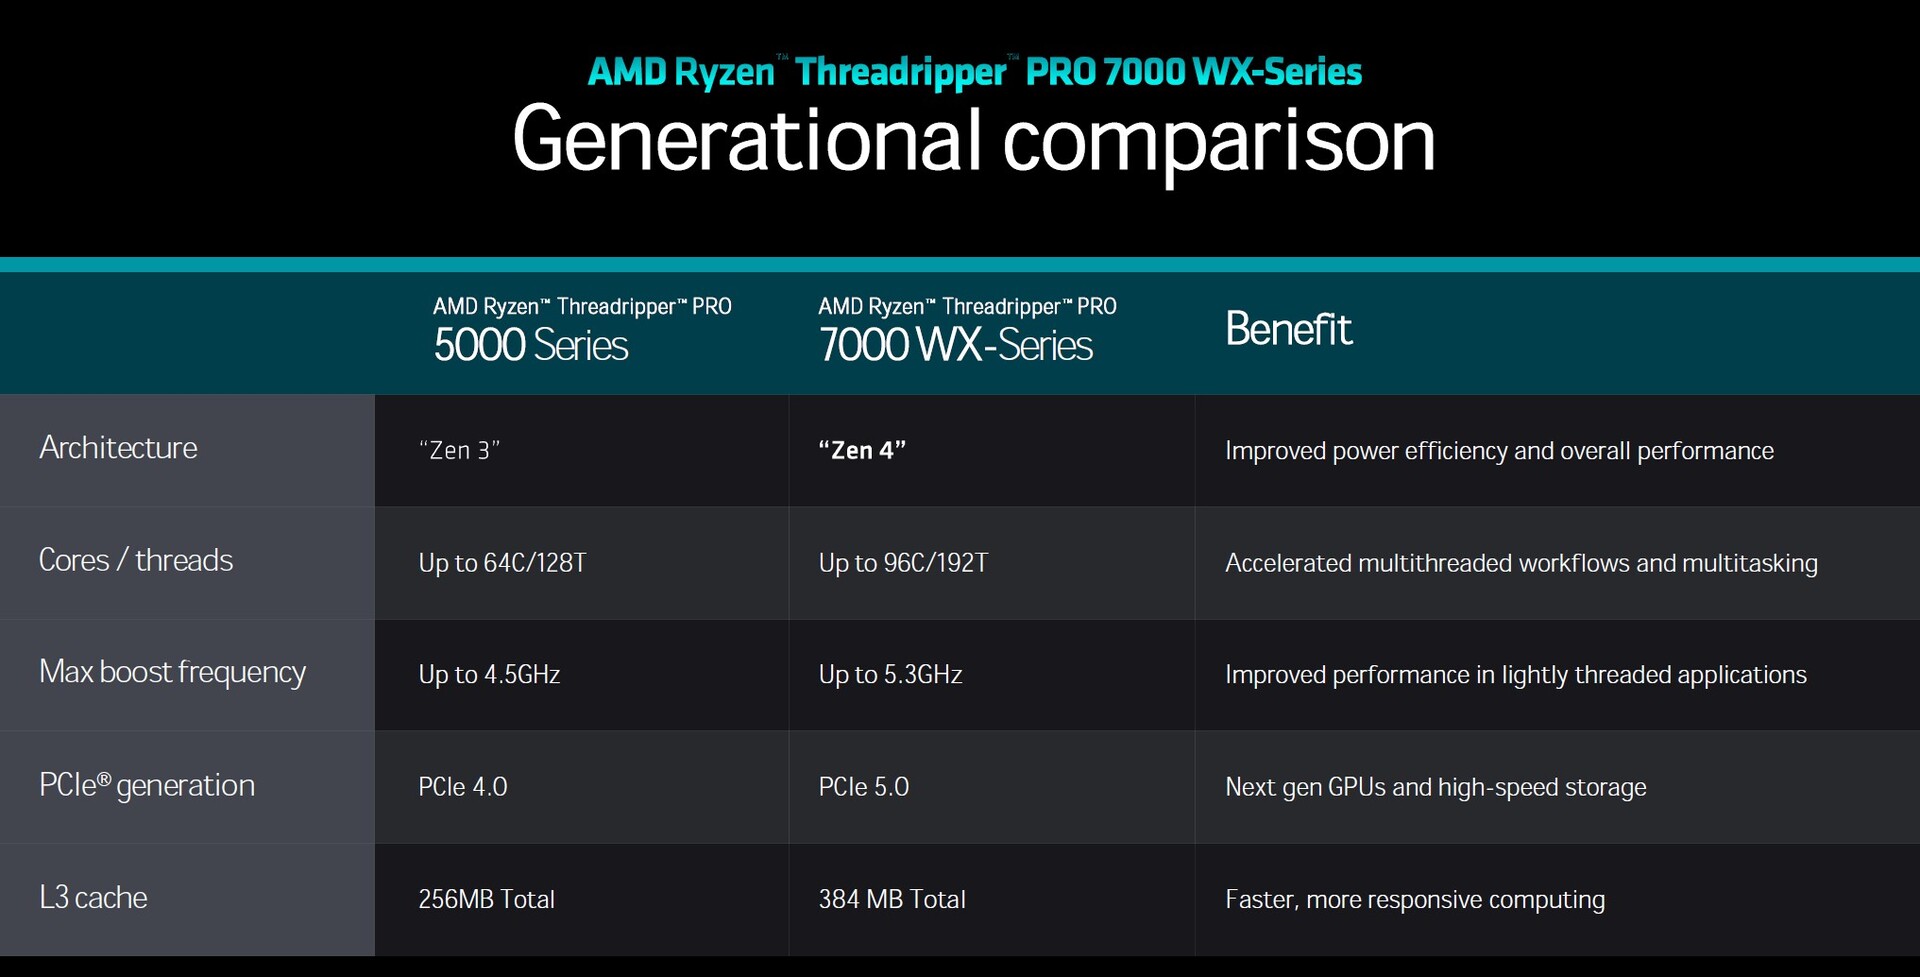
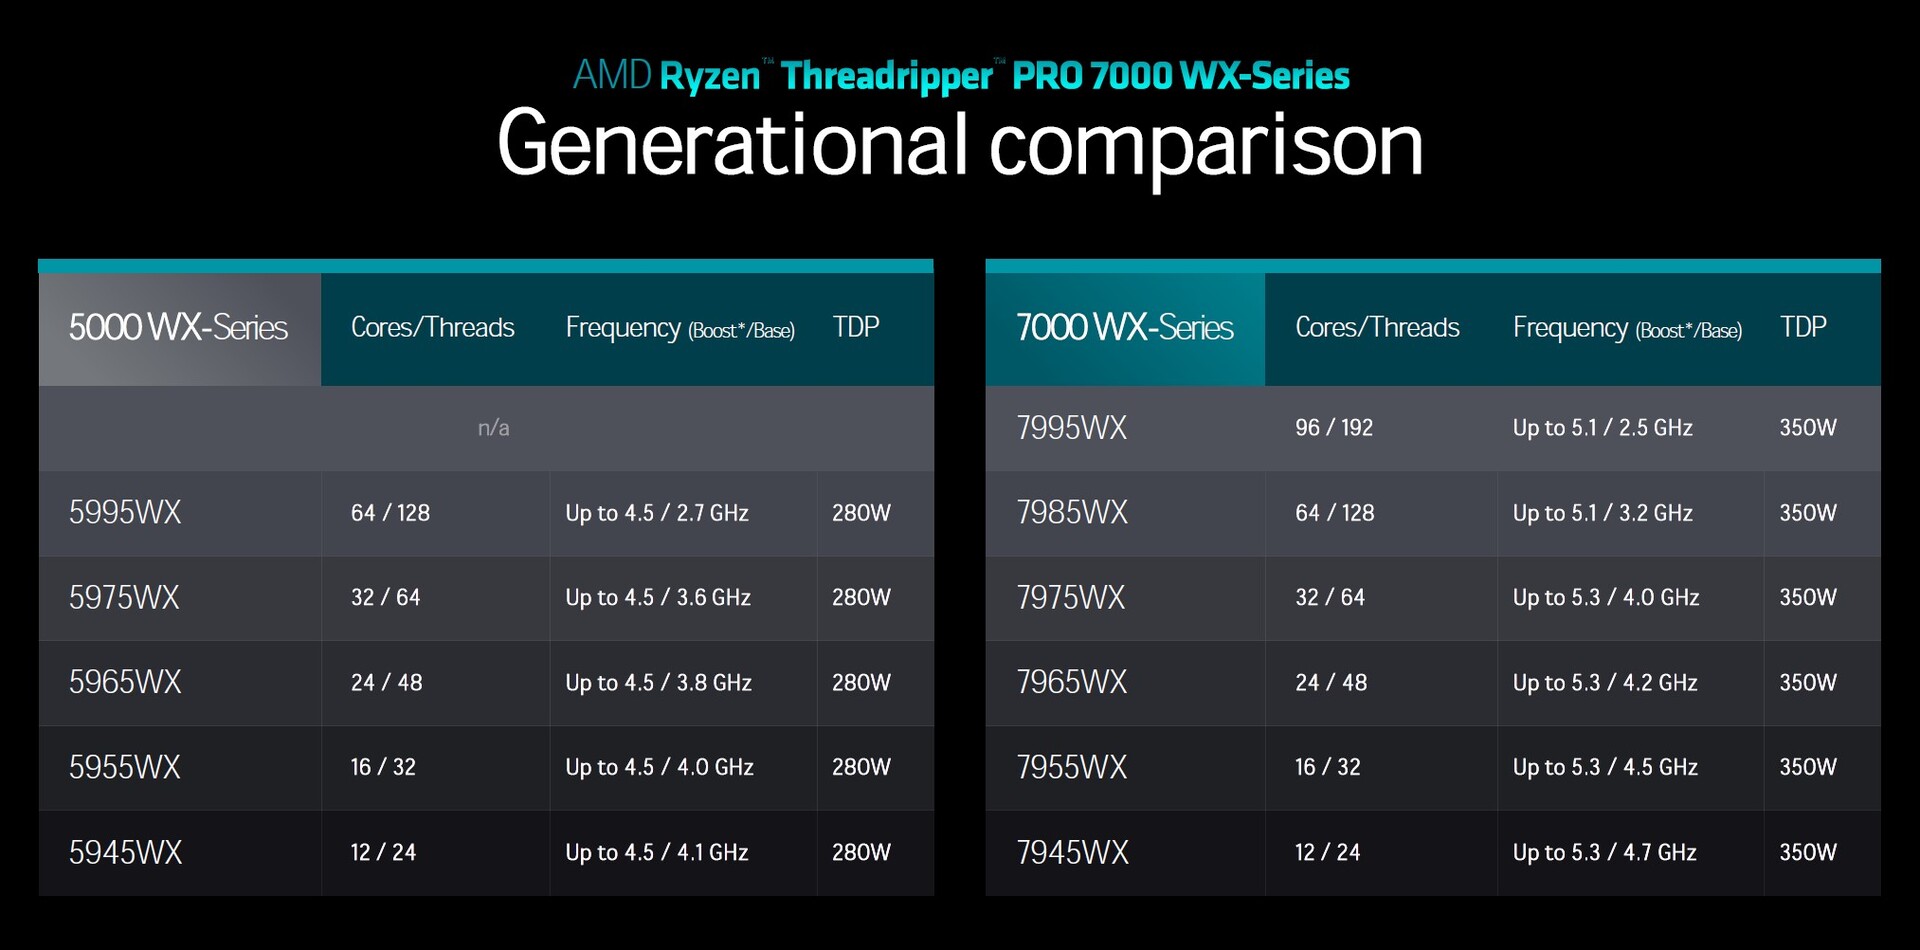
Details on the Threadripper-7000-WX-Serie
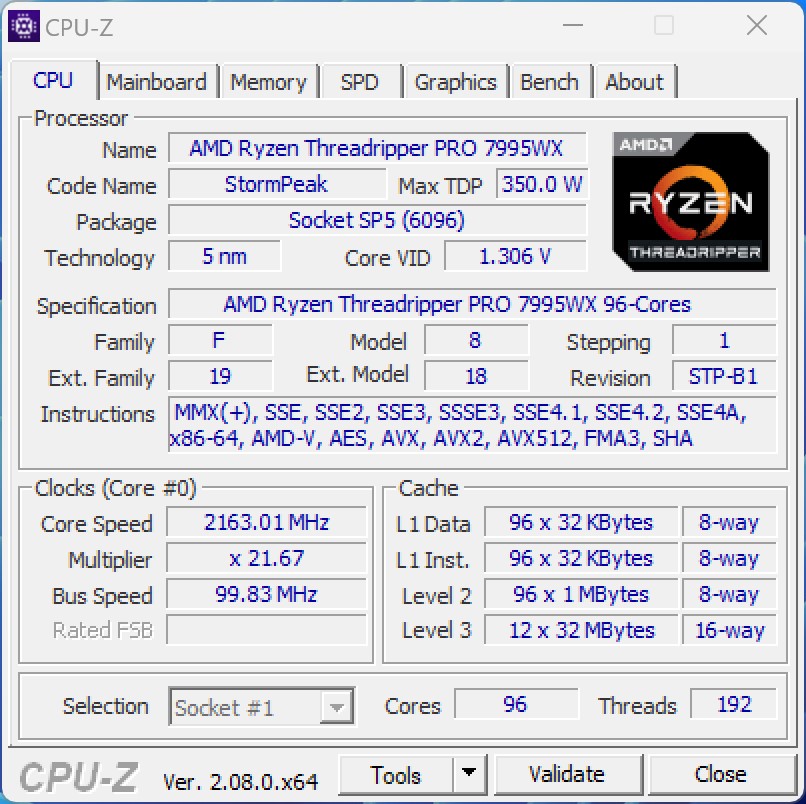
AMD has offered a significant performance gain over Zen3 with its Zen4-based Ryzen 7000 CPUs, extending its focus to the server and workstation sectors. While earlier Threadripper processors in the 5000 series used Zen3 cores and had a maximum of 64 native cores, the latest high-end version, the AMD Ryzen Threadripper Pro 7995WX, has an astonishing 96 cores. The chipset architecture is kept, with 12 CPU Compute Dies (CCDs) located beneath the heat spreader. Higher clock speeds, reaching up to 5.1 GHz in boost mode, and an increase in L3 cache are notable upgrades. The addition of PCIe 5.0 supports the most recent standard, guaranteeing that future graphics cards may work at maximum capacity. This standard also improves mass storage devices by using high data speeds in the server and workstation sectors.
Important information on test conditions
Dell provided us with the opportunity to remotely test the Dell Precision 7875 Tower Workstation. Regrettably, this meant we did not have direct access to the hardware. The connection to the test system was established through Parsec, resulting in a slight loss of performance, as noted by Dell. However, this loss is expected to be in the low single-digit range. The active connection also has an impact on 3D performance. Unfortunately, not all tests could be conducted as it was often impractical to initiate the 3D application via Parsec. Additionally, we are unable to provide information on the emissions of the test unit.
Processor benchmarks
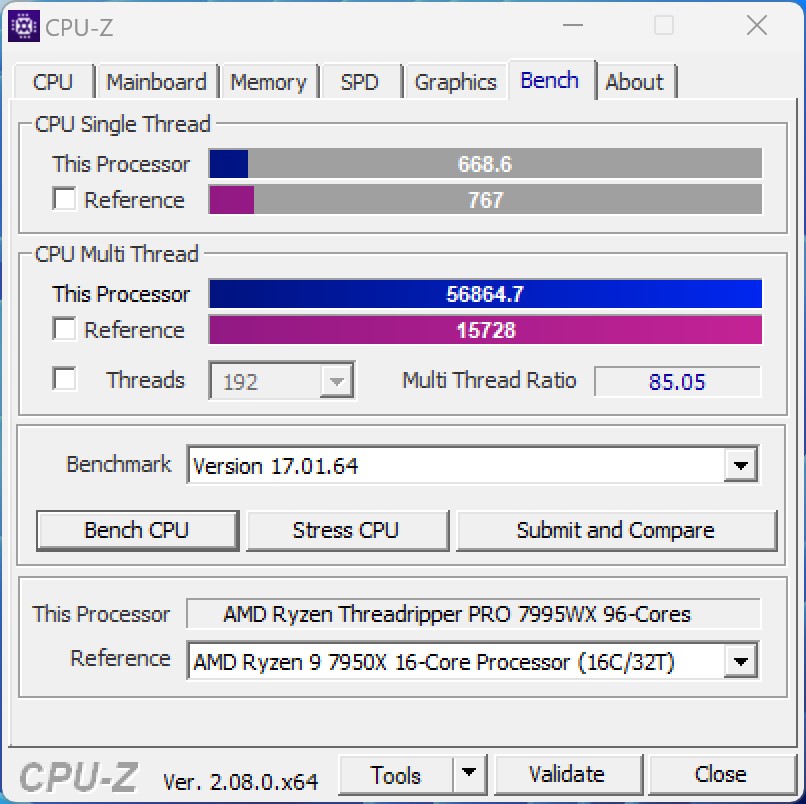
The AMD Ryzen Threadripper Pro 7995WX delivers substantial performance, especially in scenarios where the software efficiently manages a high number of computing cores. In our tests, we encountered negative examples where certain software struggled to handle this abundance of computing cores. Nevertheless, the AMD Ryzen Threadripper Pro 7995WX remains competitive against all the processors we have tested thus far. However, in terms of single-core performance, it falls short of the current Intel and AMD processors in the consumer sector. Nevertheless, when compared to its predecessor, the AMD Ryzen Threadripper Pro 3995WX, we observe a significant performance increase of over 40 percent. For Intel's counterpart to AMD's Threadripper models, the Sapphire Rapids models, which currently offer a maximum of 56 cores, unfortunately, we lack comparative data.
The AMD Ryzen Threadripper Pro 7995WX operates at a base clock of 2.5 GHz, with the potential to reach up to 5.1 GHz in boost mode. In comparison to its predecessors, AMD has also raised the maximum power consumption, now reaching up to 350 watts, a value we confirmed during testing.
For additional comparisons and benchmarks, please consult our CPU comparison table.
| Cinebench R23 | |
| Single Core | |
| Intel Core i9-14900K | |
| AMD Ryzen 9 7950X3D | |
| AMD Ryzen 9 7950X | |
| AMD Ryzen Threadripper PRO 7995WX | |
| AMD Ryzen Threadripper PRO 3995WX | |
| Multi Core | |
| AMD Ryzen Threadripper PRO 7995WX | |
| AMD Ryzen Threadripper PRO 3995WX | |
| Intel Core i9-14900K | |
| AMD Ryzen 9 7950X | |
| AMD Ryzen 9 7950X3D | |
| Cinebench R20 | |
| CPU (Single Core) | |
| Intel Core i9-14900K | |
| AMD Ryzen 9 7950X | |
| AMD Ryzen 9 7950X3D | |
| AMD Ryzen Threadripper PRO 7995WX | |
| AMD Ryzen Threadripper PRO 3995WX | |
| CPU (Multi Core) | |
| AMD Ryzen Threadripper PRO 7995WX | |
| AMD Ryzen Threadripper PRO 3995WX | |
| Intel Core i9-14900K | |
| AMD Ryzen 9 7950X | |
| AMD Ryzen 9 7950X3D | |
| Cinebench 2024 | |
| CPU Multi Core | |
| AMD Ryzen Threadripper PRO 7995WX | |
| Intel Core i9-14900K | |
| CPU Single Core | |
| Intel Core i9-14900K | |
| AMD Ryzen Threadripper PRO 7995WX | |
| Cinebench R15 | |
| CPU Single 64Bit | |
| Intel Core i9-14900K | |
| AMD Ryzen 9 7950X | |
| AMD Ryzen 9 7950X3D | |
| AMD Ryzen Threadripper PRO 7995WX | |
| AMD Ryzen Threadripper PRO 3995WX | |
| CPU Multi 64Bit | |
| AMD Ryzen Threadripper PRO 7995WX | |
| AMD Ryzen Threadripper PRO 3995WX | |
| Intel Core i9-14900K | |
| AMD Ryzen 9 7950X | |
| AMD Ryzen 9 7950X3D | |
| Cinebench R11.5 | |
| CPU Single 64Bit | |
| Intel Core i9-14900K | |
| AMD Ryzen 9 7950X | |
| AMD Ryzen 9 7950X3D | |
| AMD Ryzen Threadripper PRO 7995WX | |
| AMD Ryzen Threadripper PRO 3995WX | |
| CPU Multi 64Bit | |
| AMD Ryzen Threadripper PRO 7995WX | |
| Intel Core i9-14900K | |
| AMD Ryzen 9 7950X | |
| AMD Ryzen 9 7950X3D | |
| AMD Ryzen Threadripper PRO 3995WX | |
| Cinebench R10 | |
| Rendering Single CPUs 64Bit | |
| Intel Core i9-14900K | |
| AMD Ryzen 9 7950X | |
| AMD Ryzen Threadripper PRO 3995WX | |
| AMD Ryzen 9 7950X3D | |
| AMD Ryzen Threadripper PRO 7995WX | |
| Rendering Multiple CPUs 64Bit | |
| Intel Core i9-14900K | |
| AMD Ryzen 9 7950X | |
| AMD Ryzen Threadripper PRO 3995WX | |
| AMD Ryzen 9 7950X3D | |
| AMD Ryzen Threadripper PRO 7995WX | |
| Blender - v2.79 BMW27 CPU | |
| AMD Ryzen 9 7950X3D | |
| AMD Ryzen 9 7950X | |
| Intel Core i9-14900K | |
| AMD Ryzen Threadripper PRO 3995WX | |
| AMD Ryzen Threadripper PRO 7995WX | |
| wPrime 2.10 | |
| 32m | |
| AMD Ryzen Threadripper PRO 7995WX | |
| AMD Ryzen Threadripper PRO 3995WX | |
| Intel Core i9-14900K | |
| AMD Ryzen 9 7950X3D | |
| AMD Ryzen 9 7950X | |
| 1024m | |
| Intel Core i9-14900K | |
| AMD Ryzen 9 7950X3D | |
| AMD Ryzen 9 7950X | |
| AMD Ryzen Threadripper PRO 3995WX | |
| AMD Ryzen Threadripper PRO 7995WX | |
| X264 HD Benchmark 4.0 | |
| Pass 1 | |
| Intel Core i9-14900K | |
| AMD Ryzen 9 7950X3D | |
| AMD Ryzen 9 7950X | |
| AMD Ryzen Threadripper PRO 7995WX | |
| AMD Ryzen Threadripper PRO 3995WX | |
| Pass 2 | |
| Intel Core i9-14900K | |
| AMD Ryzen Threadripper PRO 7995WX | |
| AMD Ryzen 9 7950X | |
| AMD Ryzen 9 7950X3D | |
| AMD Ryzen Threadripper PRO 3995WX | |
| WinRAR - Result | |
| AMD Ryzen Threadripper PRO 7995WX | |
| AMD Ryzen 9 7950X | |
| Intel Core i9-14900K | |
| AMD Ryzen 9 7950X3D | |
| AMD Ryzen Threadripper PRO 3995WX | |
| TrueCrypt | |
| AES Mean 100MB | |
| AMD Ryzen Threadripper PRO 7995WX | |
| AMD Ryzen 9 7950X | |
| AMD Ryzen 9 7950X3D | |
| Intel Core i9-14900K | |
| AMD Ryzen Threadripper PRO 3995WX | |
| Twofish Mean 100MB | |
| Intel Core i9-14900K | |
| AMD Ryzen Threadripper PRO 7995WX | |
| AMD Ryzen Threadripper PRO 3995WX | |
| AMD Ryzen 9 7950X | |
| AMD Ryzen 9 7950X3D | |
| Serpent Mean 100MB | |
| AMD Ryzen Threadripper PRO 7995WX | |
| AMD Ryzen Threadripper PRO 3995WX | |
| AMD Ryzen 9 7950X | |
| AMD Ryzen 9 7950X3D | |
| Intel Core i9-14900K | |
| 3DMark 11 - 1280x720 Performance Physics | |
| AMD Ryzen 9 7950X3D | |
| Intel Core i9-14900K | |
| AMD Ryzen 9 7950X | |
| AMD Ryzen Threadripper PRO 7995WX | |
| AMD Ryzen Threadripper PRO 3995WX | |
| AMD Ryzen Threadripper PRO 3975WX | |
| 7-Zip 18.03 | |
| 7z b 4 | |
| AMD Ryzen Threadripper PRO 7995WX | |
| AMD Ryzen 9 7950X | |
| AMD Ryzen 9 7950X3D | |
| Intel Core i9-14900K | |
| AMD Ryzen Threadripper PRO 3995WX | |
| 7z b 4 -mmt1 | |
| AMD Ryzen 9 7950X | |
| AMD Ryzen 9 7950X3D | |
| Intel Core i9-14900K | |
| AMD Ryzen Threadripper PRO 7995WX | |
| AMD Ryzen Threadripper PRO 3995WX | |
| HWBOT x265 Benchmark v2.2 - 4k Preset | |
| AMD Ryzen Threadripper PRO 7995WX | |
| AMD Ryzen Threadripper PRO 3995WX | |
| AMD Ryzen 9 7950X | |
| Intel Core i9-14900K | |
| AMD Ryzen 9 7950X3D | |
| R Benchmark 2.5 - Overall mean | |
| AMD Ryzen Threadripper PRO 3995WX | |
| AMD Ryzen Threadripper PRO 7995WX | |
| AMD Ryzen 9 7950X3D | |
| AMD Ryzen 9 7950X | |
| Intel Core i9-14900K | |
| LibreOffice - 20 Documents To PDF | |
| AMD Ryzen Threadripper PRO 3995WX | |
| AMD Ryzen Threadripper PRO 7995WX | |
| AMD Ryzen 9 7950X3D | |
| AMD Ryzen 9 7950X | |
| Intel Core i9-14900K | |
| WebXPRT 3 - Overall | |
| AMD Ryzen 9 7950X3D | |
| Intel Core i9-14900K | |
| AMD Ryzen 9 7950X | |
| AMD Ryzen Threadripper PRO 7995WX | |
| AMD Ryzen Threadripper PRO 3995WX | |
| Mozilla Kraken 1.1 - Total | |
| AMD Ryzen Threadripper PRO 3995WX | |
| AMD Ryzen Threadripper PRO 7995WX | |
| AMD Ryzen 9 7950X3D | |
| AMD Ryzen 9 7950X | |
| Intel Core i9-14900K | |
| 3DMark | |
| 3840x2160 Fire Strike Ultra Physics | |
| Intel Core i9-14900K | |
| AMD Ryzen 9 7950X3D | |
| AMD Ryzen 9 7950X | |
| AMD Ryzen Threadripper PRO 7995WX | |
| AMD Ryzen Threadripper PRO 3995WX | |
| AMD Ryzen Threadripper PRO 3975WX | |
| 1920x1080 Fire Strike Physics | |
| Intel Core i9-14900K | |
| AMD Ryzen 9 7950X3D | |
| AMD Ryzen 9 7950X | |
| AMD Ryzen Threadripper PRO 7995WX | |
| AMD Ryzen Threadripper PRO 3995WX | |
| AMD Ryzen Threadripper PRO 3975WX | |
| 2560x1440 Time Spy CPU | |
| Intel Core i9-14900K | |
| AMD Ryzen 9 7950X3D | |
| AMD Ryzen 9 7950X | |
| AMD Ryzen Threadripper PRO 7995WX | |
| AMD Ryzen Threadripper PRO 3975WX | |
| AMD Ryzen Threadripper PRO 3995WX | |
| Geekbench 6.0 | |
| Multi-Core | |
| AMD Ryzen Threadripper PRO 7995WX | |
| Intel Core i9-14900K | |
| Single-Core | |
| Intel Core i9-14900K | |
| AMD Ryzen Threadripper PRO 7995WX | |
| Geekbench 6.7 | |
| Multi-Core | |
| AMD Ryzen Threadripper PRO 7995WX | |
| Intel Core i9-14900K | |
| AMD Ryzen 9 7950X3D | |
| Single-Core | |
| Intel Core i9-14900K | |
| AMD Ryzen 9 7950X3D | |
| AMD Ryzen Threadripper PRO 7995WX | |
* ... smaller is better
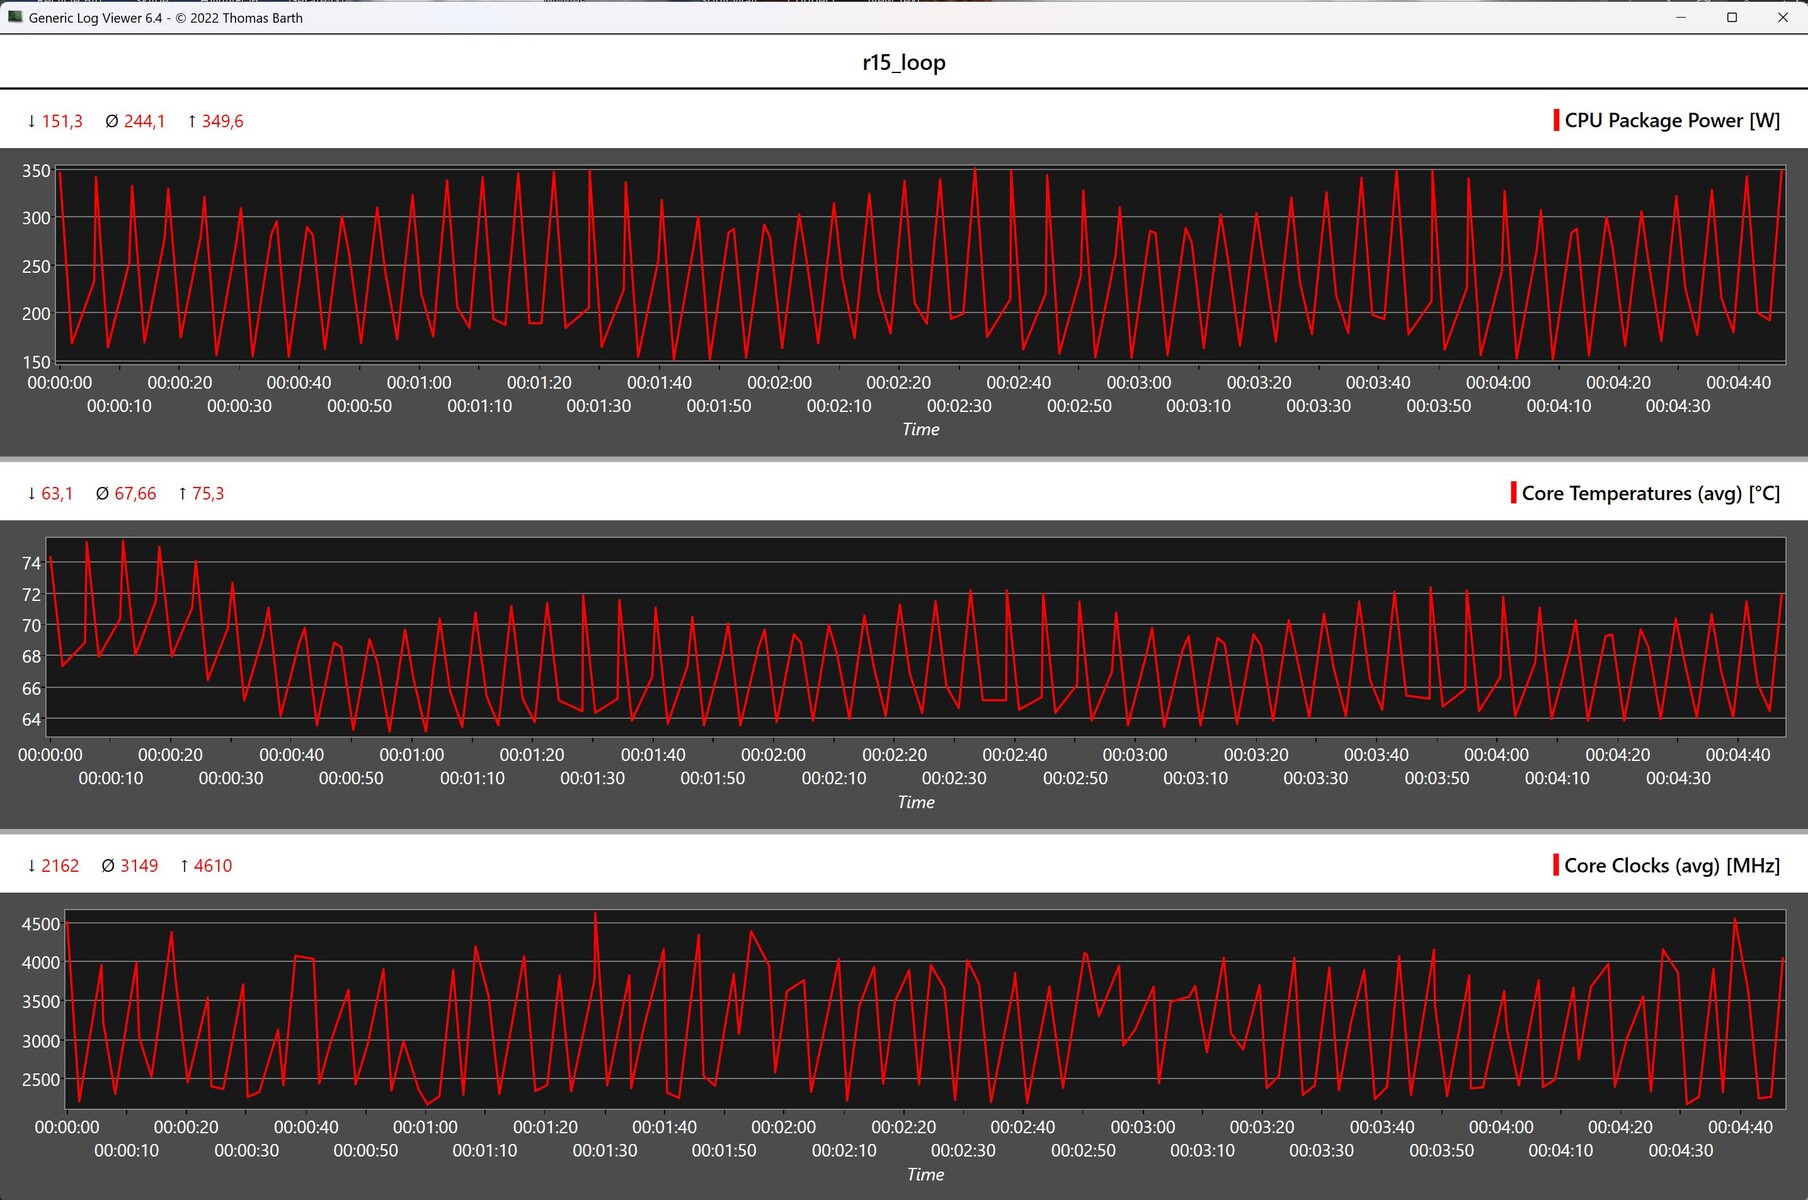
Dell Precision 7875 Tower Workstation in Cinebench R15 Multi Loop
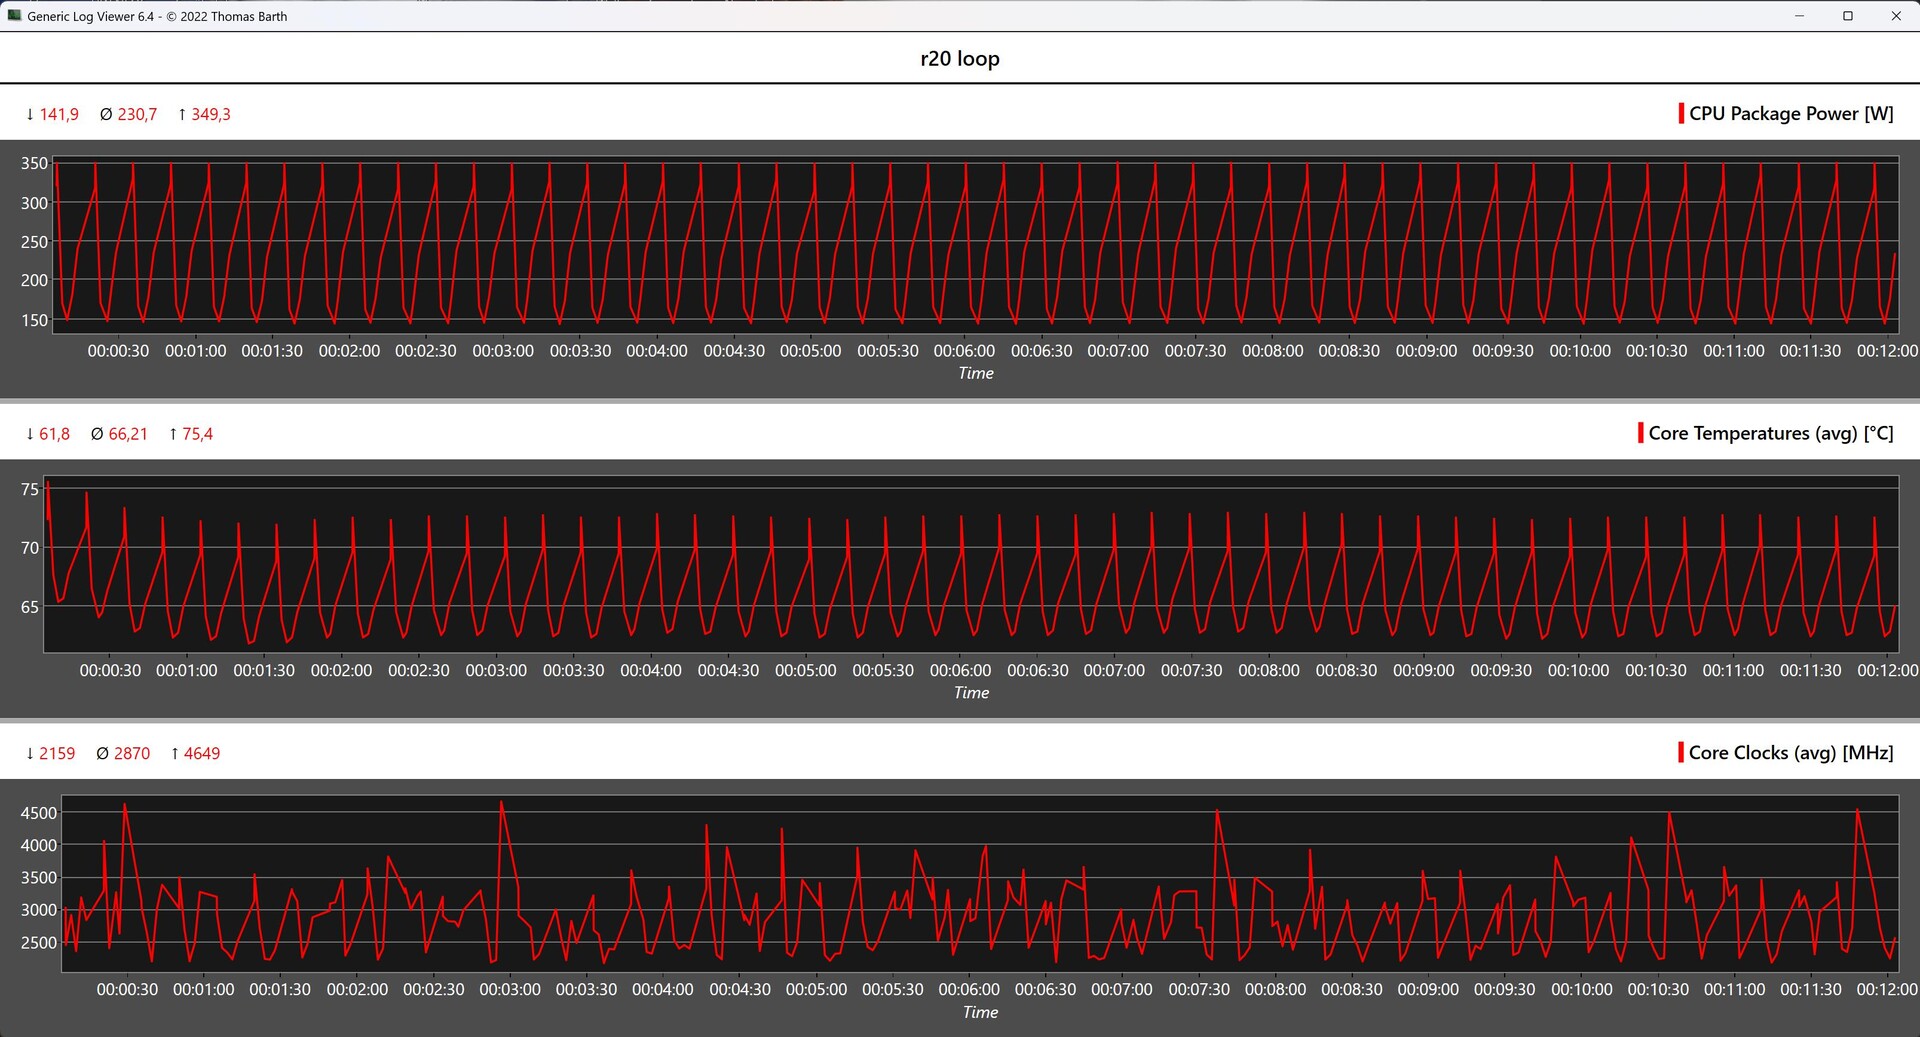
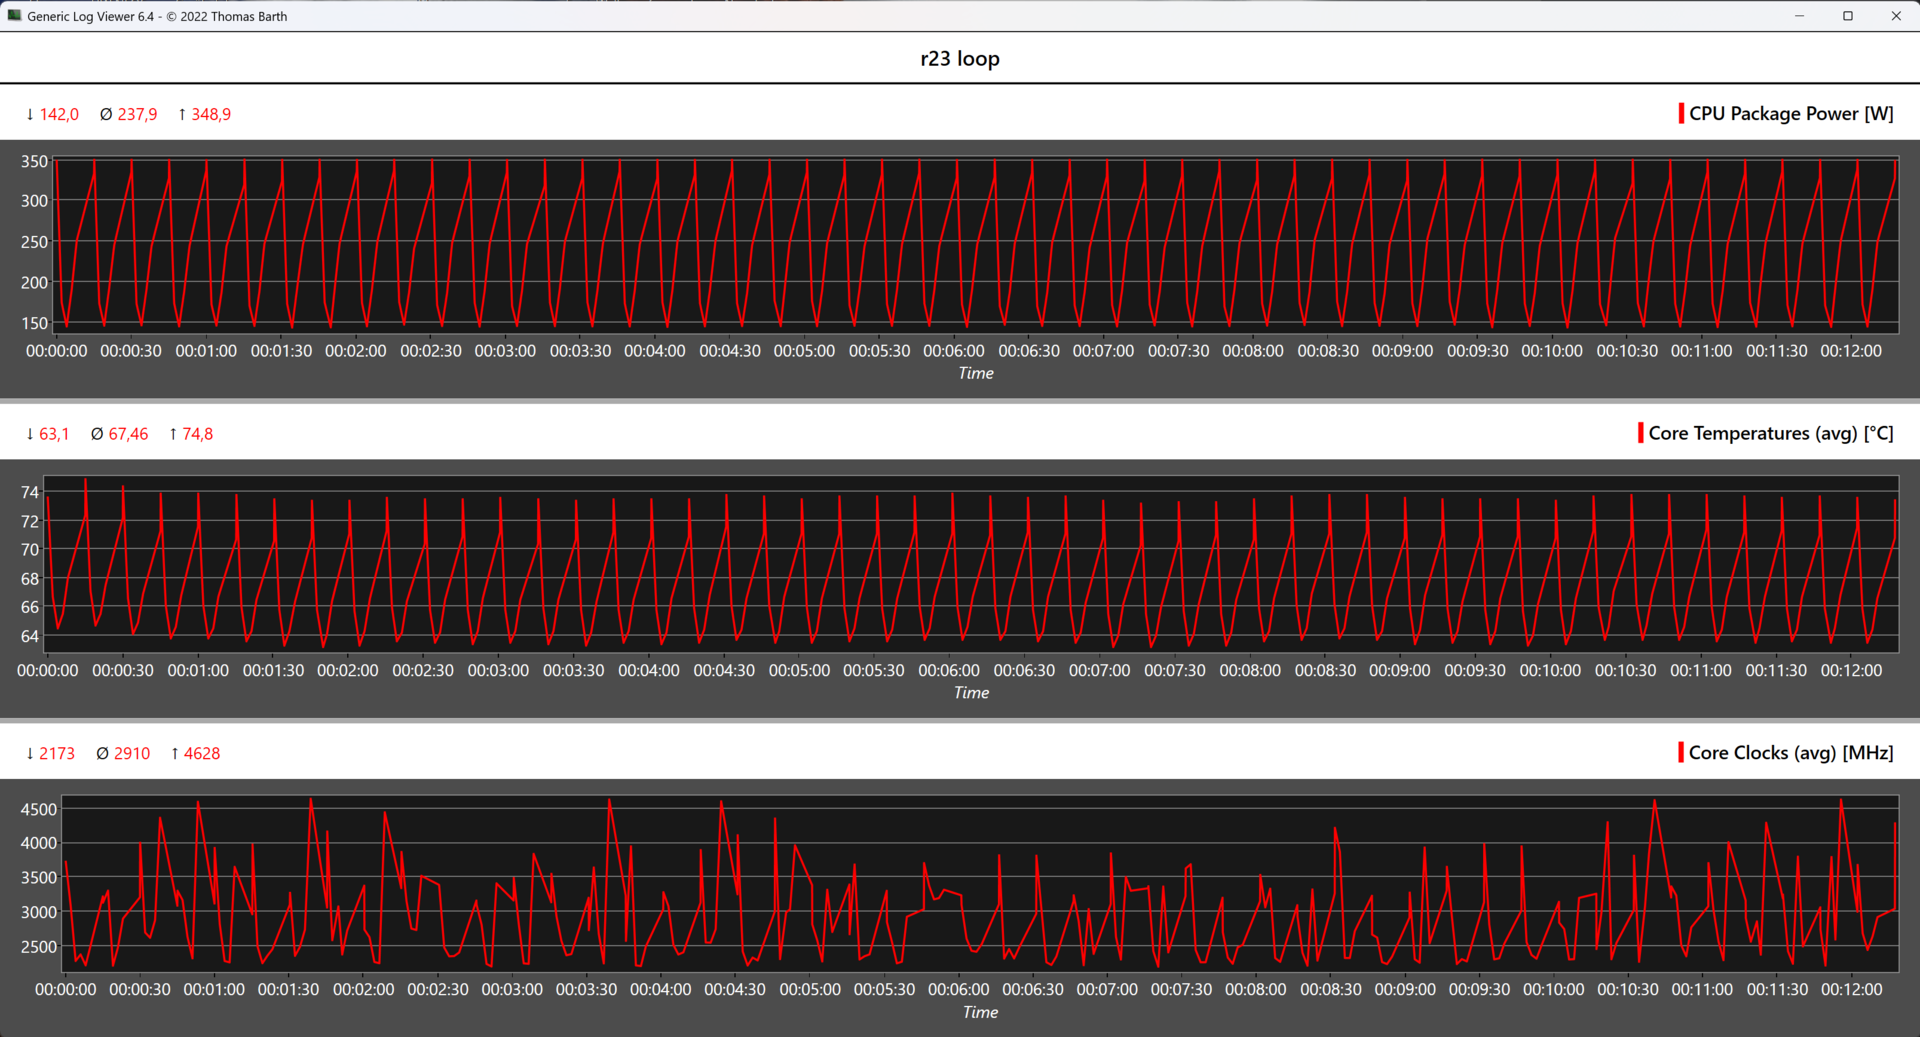
The Dell Precision 7875 Tower Workstation excels during the stress test of the Cinebench R15 Multi Loop, delivering an outstanding result. Throughout the 50 runs, we observed only slight fluctuations in performance, ruling out any significant drop in power with steadily decreasing capabilities. Telemetry data reveals that the processor can be consistently operated at the maximum power of 350 watts without encountering issues. Additionally, the system demonstrated stable performance in stress tests involving the Cinebench R20 Multi Loop and the Cinebench R23 Multi Loop.
Synthetic benchmarks and application performance
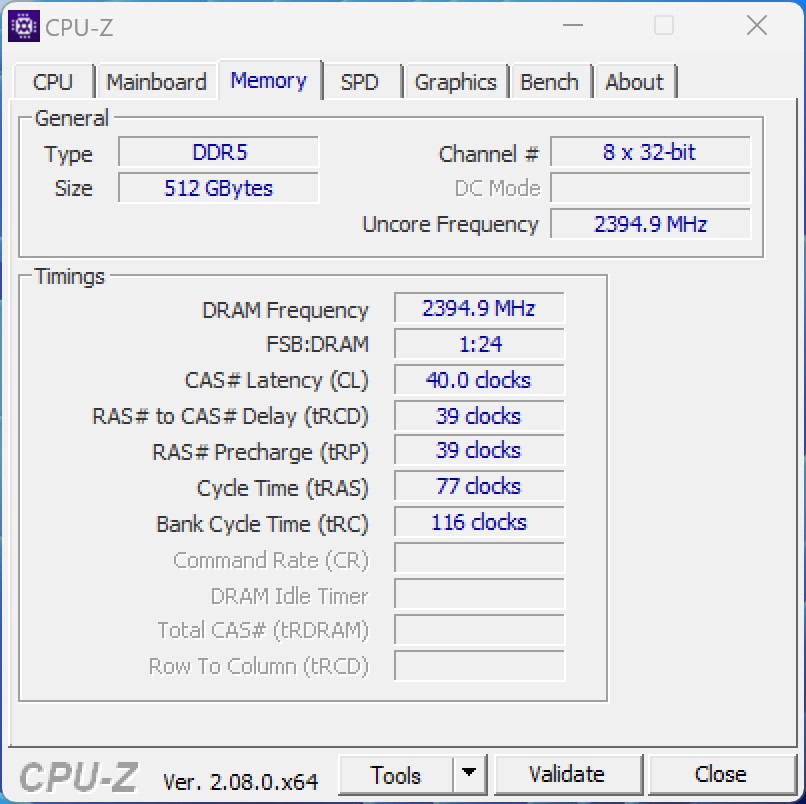
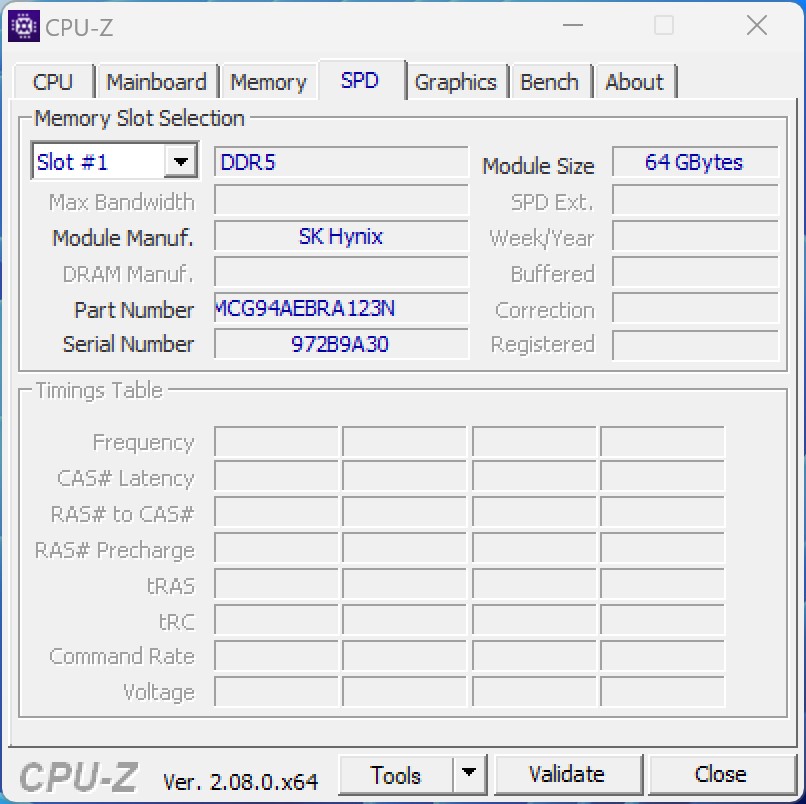
The synthetic tests conducted with the test system indicate that the substantial number of computing cores cannot be fully leveraged, resulting in the system struggling to outperform its competitors. While the Dell Precision 7875 Tower emerges victorious in a direct comparison with the Lenovo ThinkStation P620 based on the AMD Ryzen Threadripper Pro 3995WX, the most significant advantage lies in the RAM tests. The octa-channel operation of our test system allows it to assert a clear lead with impressive values. The installed RDRAMM, clocked at 4,800 MT/s, is notably large at 512 GB. Furthermore, the RAM boasts ECC support, a feature expected as standard in the workstation sector.
| 3DMark | |
| 1920x1080 Fire Strike Physics | |
| Intel Core i9-14900K | |
| AMD Ryzen 9 7950X3D | |
| AMD Ryzen 9 7950X | |
| AMD Ryzen Threadripper PRO 7995WX | |
| AMD Ryzen Threadripper PRO 3995WX | |
| AMD Ryzen Threadripper PRO 3975WX | |
| 2560x1440 Time Spy CPU | |
| Intel Core i9-14900K | |
| AMD Ryzen 9 7950X3D | |
| AMD Ryzen 9 7950X | |
| AMD Ryzen Threadripper PRO 7995WX | |
| AMD Ryzen Threadripper PRO 3975WX | |
| AMD Ryzen Threadripper PRO 3995WX | |
| 3DMark 11 - 1280x720 Performance Physics | |
| AMD Ryzen 9 7950X3D | |
| Intel Core i9-14900K | |
| AMD Ryzen 9 7950X | |
| AMD Ryzen Threadripper PRO 7995WX | |
| AMD Ryzen Threadripper PRO 3995WX | |
| AMD Ryzen Threadripper PRO 3975WX | |
| CrossMark - Overall | |
| Intel Core i9-14900K | |
| AMD Ryzen 9 7950X | |
| AMD Ryzen 9 7950X3D | |
| AMD Ryzen Threadripper PRO 7995WX | |
| AIDA64 / Memory Copy | |
| AMD Ryzen Threadripper PRO 7995WX | |
| AMD Ryzen Threadripper PRO 3995WX | |
| Intel Core i9-14900K | |
| Intel Core i9-14900K | |
| AMD Ryzen 9 7950X3D | |
| AMD Ryzen 9 7950X | |
| Average of class (4514 - 234662, n=2212) | |
| AIDA64 / Memory Read | |
| AMD Ryzen Threadripper PRO 7995WX | |
| AMD Ryzen Threadripper PRO 3995WX | |
| Intel Core i9-14900K | |
| Intel Core i9-14900K | |
| AMD Ryzen 9 7950X3D | |
| AMD Ryzen 9 7950X | |
| Average of class (4031 - 271066, n=2174) | |
| AIDA64 / Memory Write | |
| AMD Ryzen Threadripper PRO 7995WX | |
| AMD Ryzen Threadripper PRO 3995WX | |
| AMD Ryzen 9 7950X3D | |
| Intel Core i9-14900K | |
| Intel Core i9-14900K | |
| AMD Ryzen 9 7950X | |
| Average of class (3506 - 242868, n=2179) | |
| AIDA64 / Memory Latency | |
| AMD Ryzen Threadripper PRO 3995WX | |
| Average of class (6.1 - 536, n=2240) | |
| AMD Ryzen Threadripper PRO 7995WX | |
| Intel Core i9-14900K | |
| Intel Core i9-14900K | |
| AMD Ryzen 9 7950X3D | |
| AMD Ryzen 9 7950X | |
* ... smaller is better
3D performance
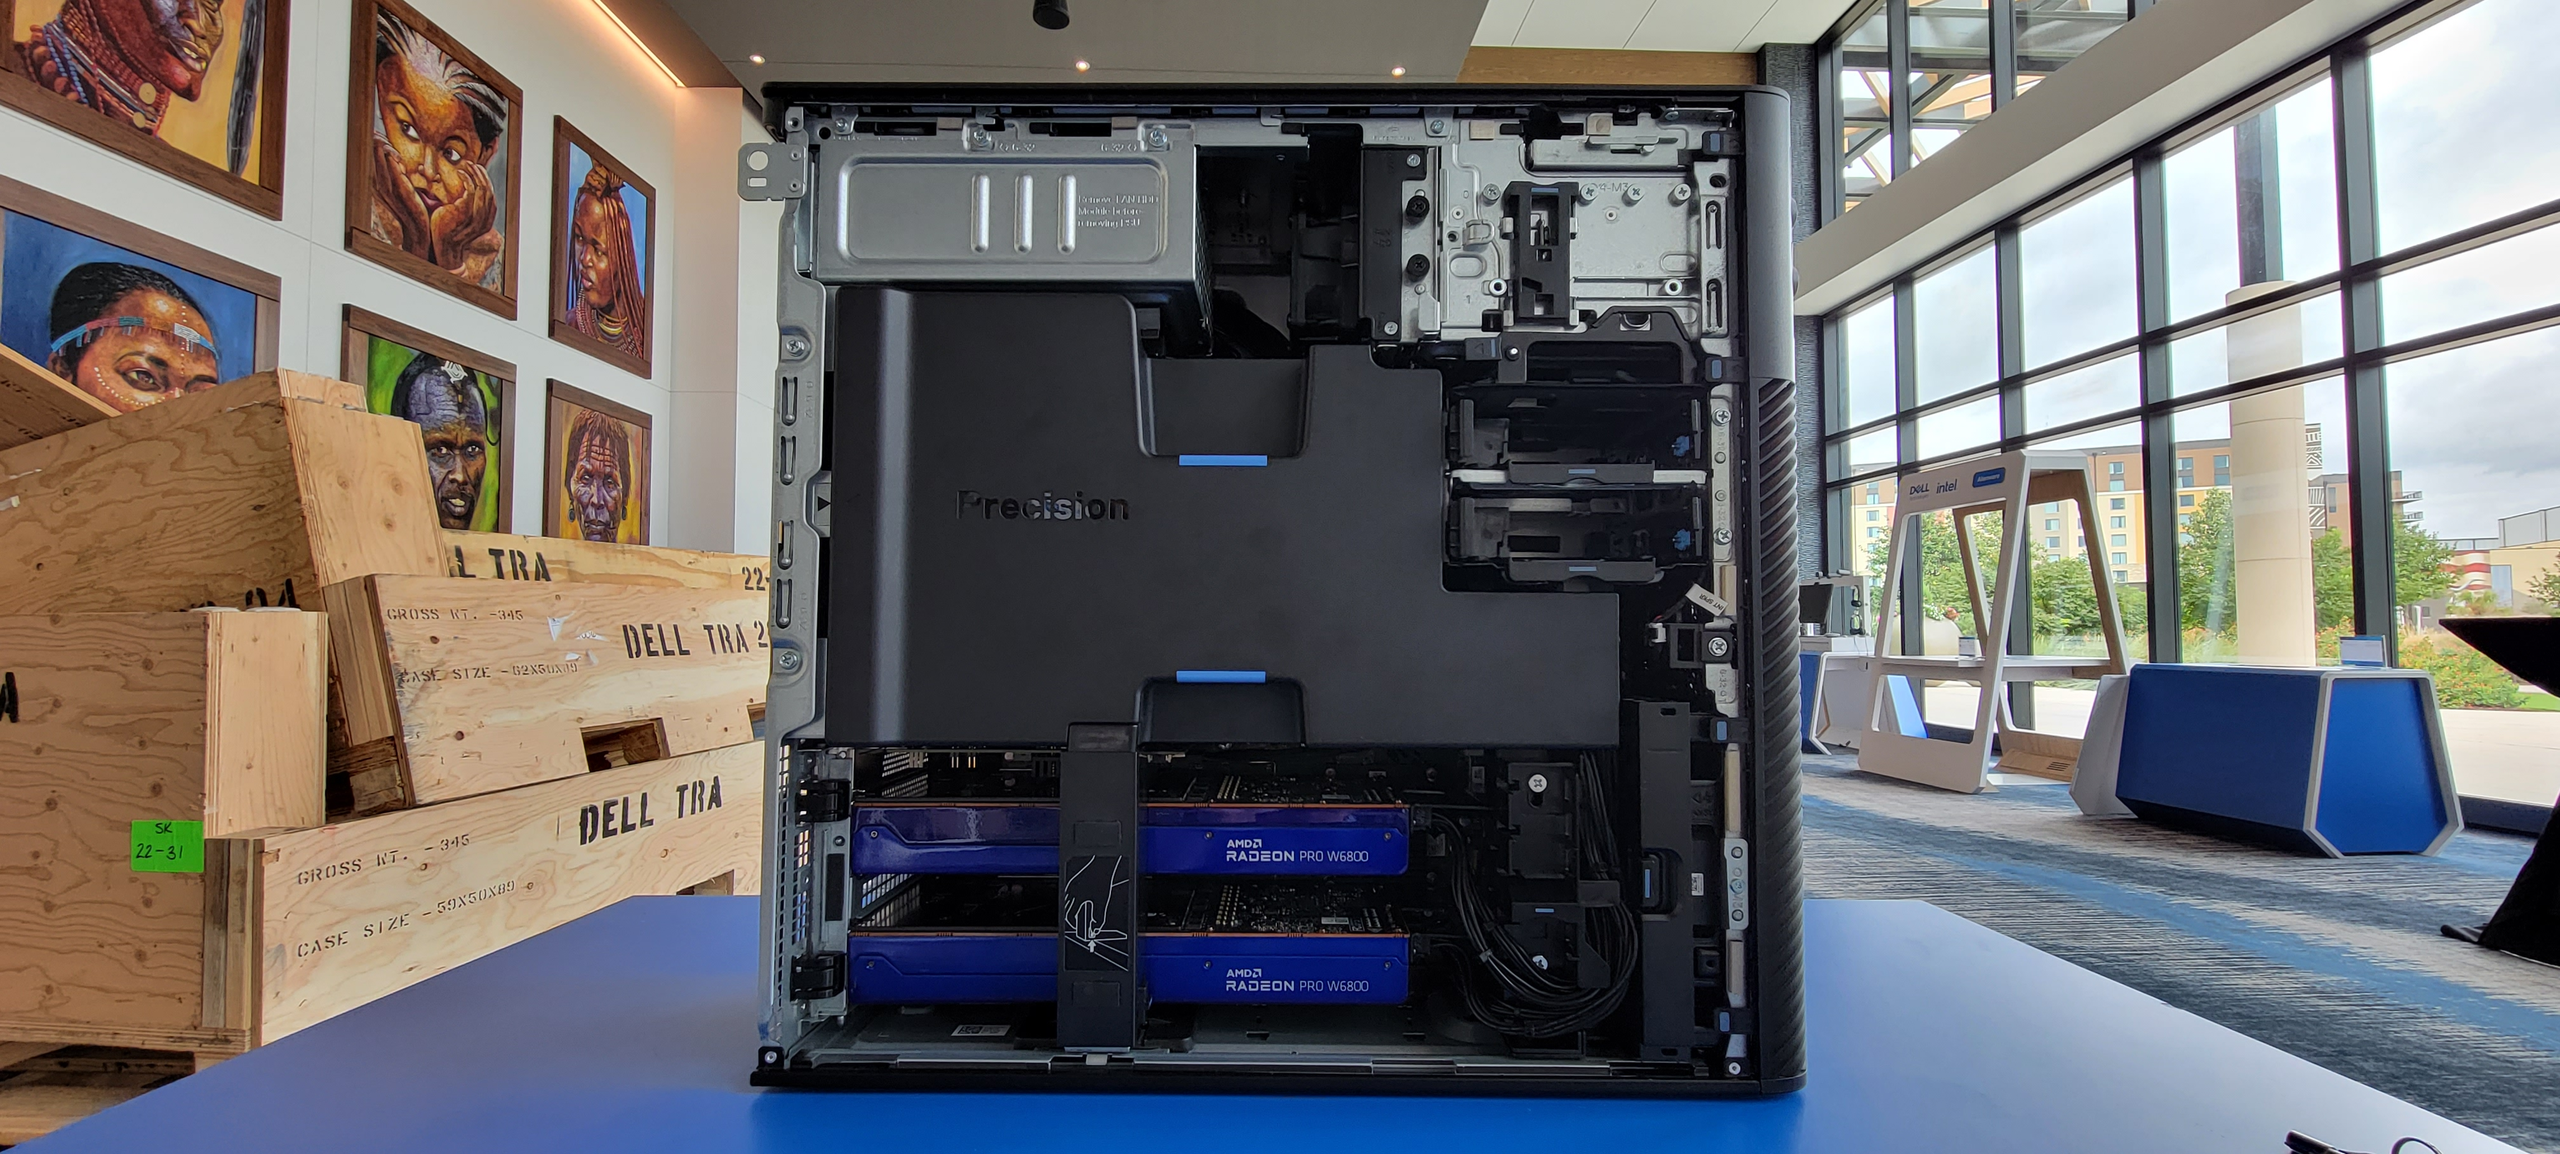
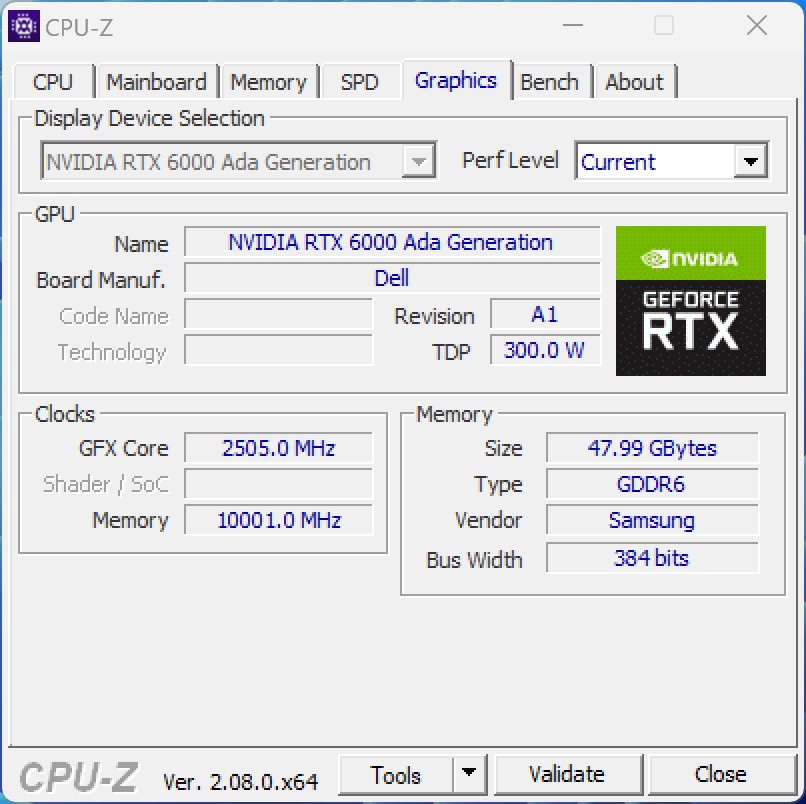
Dell has equipped the Dell Precision 7875 Tower Workstation with two Nvidia graphics cards, specifically RTX 6000 models from the current Ada generation, each boasting 48 GB of VRAM. Due to potential difficulties with multiple GPUs in some tests, we conducted the tests with a single graphics card. The graphics chip employed is the AD102 in full configuration, featuring 18,176 shaders. Notably, the Nvidia GeForce RTX 4090 utilizes a slightly smaller model, with Nvidia limiting the power consumption to 300 watts. In contrast to the Nvidia GeForce RTX 4090, the RTX 6000 employs standard GDDR6 VRAM with a slightly lower memory bandwidth.
During our testing, the results were somewhat subdued compared to our other test systems. It's important to reiterate that the full 3D performance couldn't be replicated due to the test environment limitations. However, the Nvidia RTX 6000 Ada Generation shines in render tests, showcasing significant performance gains in some instances. Depending on the review, we observe up to a 96 percent power increase compared to an Nvidia GeForce RTX 4090. This highlights the substantial impact of driver optimizations, unfortunately limited to professional workstation GPUs.
The Dell Precision 7875 Tower Workstation also supports AMD's Radeon PRO graphics cards. The current flagship, the AMD Radeon Pro W7900, offering 48 GB of VRAM.
For additional comparisons and benchmarks, please consult our GPU comparison table.
| AMD Ryzen Threadripper PRO 7995WX, NVIDIA RTX 6000 Ada Generation RTX 6000 Ada Generation, TR Pro 7995WX | AMD Ryzen Threadripper PRO 3995WX, AMD Radeon Pro W6800 Radeon Pro W6800, TR Pro 3995WX, WDC PC SN720 SDAPNTW-256G | AMD Ryzen Threadripper PRO 3975WX, NVIDIA RTX A6000 RTX A6000, TR Pro 3975WX | AMD Ryzen 9 7950X, NVIDIA Titan RTX Titan RTX, R9 7950X | Intel Core i9-14900K, NVIDIA GeForce RTX 4090 GeForce RTX 4090, i9-14900K, WDC PC SN720 SDAQNTW-512G | AMD Ryzen 9 7950X, NVIDIA GeForce RTX 4090 GeForce RTX 4090, R9 7950X, Corsair MP600 GS | AMD Ryzen 9 7950X3D, NVIDIA GeForce RTX 4090 GeForce RTX 4090, R9 7950X3D | |
|---|---|---|---|---|---|---|---|
| SPECviewperf 2020 | -49% | -51% | -54% | -39% | -43% | -42% | |
| 3840x2160 Siemens NX (snx-04) (fps) | 974 | 434 -55% | 481 -51% | 375 -61% | 47.2 -95% | 41.3 -96% | 42.5 -96% |
| 3840x2160 Medical (medical-03) (fps) | 79 | 52 -34% | 37.9 -52% | 16.5 -79% | 40.3 -49% | 45.9 -42% | 46.2 -42% |
| 3840x2160 Energy (energy-03) (fps) | 457 | 87.7 -81% | 63 -86% | 93.9 -79% | 230 -50% | 141 -69% | 140 -69% |
| 3840x2160 Creo (creo-03) (fps) | 191 | 87.8 -54% | 111 -42% | 135 -29% | 148 -23% | 133 -30% | 140 -27% |
| 3840x2160 CATIA (catia-06) (fps) | 139 | 76.2 -45% | 82.4 -41% | 90.9 -35% | 97.1 -30% | 95.3 -31% | 95.9 -31% |
| 3840x2160 3ds Max (3dsmax-07) (fps) | 207 | 162 -22% | 137 -34% | 118 -43% | 236 14% | 228 10% | 236 14% |
| SPECviewperf 13 | -46% | -38% | -41% | -12% | -16% | -14% | |
| 3ds Max (3dsmax-06) (fps) | 496.95 | 318 -36% | 338 -32% | 321 -35% | 567 14% | 563 13% | 573 15% |
| Catia (catia-05) (fps) | 578.86 | 389 -33% | 371 -36% | 534 -8% | 428 -26% | 402 -31% | 427 -26% |
| Creo (creo-02) (fps) | 590.13 | 366 -38% | 386 -35% | 618 5% | 552 -6% | 577 -2% | |
| Energy (energy-02) (fps) | 230.06 | 87.8 -62% | 132 -43% | 51.8 -77% | 127 -45% | 126 -45% | 127 -45% |
| Maya (maya-05) (fps) | 637.3 | 395 -38% | 415 -35% | 499 -22% | 881 38% | 715 12% | 748 17% |
| Medical (medical-02) (fps) | 331.9 | 116 -65% | 184 -45% | 92 -72% | 180 -46% | 186 -44% | 189 -43% |
| Showcase (showcase-02) (fps) | 430.2 | 216 -50% | 255 -41% | 198 -54% | 400 -7% | 455 6% | 456 6% |
| Siemens NX (snx-03) (fps) | 437 | 638 | 512 | 56.3 | 49.1 | 49.3 | |
| Solidworks (sw-04) (fps) | 278 | 173 -38% | 192 -31% | 218 -22% | 199 -28% | 186 -33% | 191 -31% |
| SPECviewperf 12 | -44% | -39% | -36% | -14% | -28% | -19% | |
| 1900x1060 3ds Max (3dsmax-05) (fps) | 473 | 311 -34% | 336 -29% | 315 -33% | 565 19% | 571 21% | 560 18% |
| 1900x1060 Catia (catia-04) (fps) | 349 | 248 -29% | 229 -34% | 332 -5% | 291 -17% | 257 -26% | 274 -21% |
| 1900x1060 Creo (creo-01) (fps) | 250 | 101 -60% | 136 -46% | 197 -21% | 127 -49% | 115 -54% | 118 -53% |
| 1900x1060 Energy (energy-01) (fps) | 58.2 | 37.8 -35% | 39.8 -32% | 28.8 -51% | 84.7 46% | 54.7 -6% | 80.1 38% |
| 1900x1060 Maya (maya-04) (fps) | 266 | 157 -41% | 144 -46% | 260 -2% | 340 28% | 317 19% | 329 24% |
| 1900x1060 Medical (medical-01) (fps) | 282 | 165 -41% | 159 -44% | 101 -64% | 303 7% | 119 -58% | 212 -25% |
| 1900x1060 Showcase (showcase-01) (fps) | 429 | 215 -50% | 255 -41% | 197 -54% | 398 -7% | 457 7% | 427 0% |
| 1900x1060 Siemens NX (snx-02) (fps) | 677 | 243 -64% | 351 -48% | 283 -58% | 31.4 -95% | 27.1 -96% | 27.4 -96% |
| 1900x1060 Solidworks (sw-03) (fps) | 319 | 185 -42% | 225 -29% | 207 -35% | 139 -56% | 126 -61% | 130 -59% |
| Total Average (Program / Settings) | -46% /
-46% | -43% /
-42% | -44% /
-42% | -22% /
-20% | -29% /
-28% | -25% /
-23% |
Gaming benchmarks
| Performance rating - Percent | |
| AMD Ryzen 7 7800X3D, NVIDIA GeForce RTX 4090 | |
| AMD Ryzen 9 7950X3D, NVIDIA GeForce RTX 4090 | |
| Intel Core i9-13900K, NVIDIA GeForce RTX 4090 | |
| AMD Ryzen 9 7950X, NVIDIA GeForce RTX 4090 | |
| AMD Ryzen 5 7600X, NVIDIA GeForce RTX 4090 | |
| Intel Core i7-13700K, NVIDIA GeForce RTX 4090 | |
| Intel Core i7-13700, NVIDIA GeForce RTX 4090 | |
| Intel Core i7-12700, NVIDIA GeForce RTX 4090 | |
| AMD Ryzen Threadripper PRO 7995WX, NVIDIA RTX 6000 Ada Generation | |
| Intel Core i5-13400, NVIDIA GeForce RTX 4090 | |
| Intel Core i5-12400F, NVIDIA GeForce RTX 4090 | |
| Far Cry 5 | |
| 1920x1080 Ultra Preset AA:T | |
| AMD Ryzen 7 7800X3D, NVIDIA GeForce RTX 4090 | |
| AMD Ryzen 9 7950X3D, NVIDIA GeForce RTX 4090 | |
| Intel Core i9-13900K, NVIDIA GeForce RTX 4090 | |
| AMD Ryzen 9 7950X, NVIDIA GeForce RTX 4090 | |
| AMD Ryzen 5 7600X, NVIDIA GeForce RTX 4090 | |
| Intel Core i7-13700, NVIDIA GeForce RTX 4090 | |
| Intel Core i7-13700K, NVIDIA GeForce RTX 4090 | |
| Intel Core i7-12700, NVIDIA GeForce RTX 4090 | |
| Intel Core i5-13400, NVIDIA GeForce RTX 4090 | |
| Intel Core i5-12400F, NVIDIA GeForce RTX 4090 | |
| AMD Ryzen Threadripper PRO 7995WX, NVIDIA RTX 6000 Ada Generation | |
| 1280x720 Low Preset AA:T | |
| AMD Ryzen 7 7800X3D, NVIDIA GeForce RTX 4090 | |
| AMD Ryzen 9 7950X3D, NVIDIA GeForce RTX 4090 | |
| Intel Core i9-13900K, NVIDIA GeForce RTX 4090 | |
| Intel Core i7-13700K, NVIDIA GeForce RTX 4090 | |
| AMD Ryzen 5 7600X, NVIDIA GeForce RTX 4090 | |
| AMD Ryzen 9 7950X, NVIDIA GeForce RTX 4090 | |
| Intel Core i7-13700, NVIDIA GeForce RTX 4090 | |
| Intel Core i7-12700, NVIDIA GeForce RTX 4090 | |
| Intel Core i5-13400, NVIDIA GeForce RTX 4090 | |
| Intel Core i5-12400F, NVIDIA GeForce RTX 4090 | |
| AMD Ryzen Threadripper PRO 7995WX, NVIDIA RTX 6000 Ada Generation | |
| X-Plane 11.11 | |
| 1920x1080 high (fps_test=3) | |
| AMD Ryzen 7 7800X3D, NVIDIA GeForce RTX 4090 | |
| AMD Ryzen 9 7950X3D, NVIDIA GeForce RTX 4090 | |
| Intel Core i9-13900K, NVIDIA GeForce RTX 4090 | |
| AMD Ryzen 9 7950X, NVIDIA GeForce RTX 4090 | |
| AMD Ryzen 5 7600X, NVIDIA GeForce RTX 4090 | |
| Intel Core i7-13700K, NVIDIA GeForce RTX 4090 | |
| Intel Core i7-13700, NVIDIA GeForce RTX 4090 | |
| AMD Ryzen Threadripper PRO 7995WX, NVIDIA RTX 6000 Ada Generation | |
| Intel Core i7-12700, NVIDIA GeForce RTX 4090 | |
| Intel Core i5-13400, NVIDIA GeForce RTX 4090 | |
| Intel Core i5-12400F, NVIDIA GeForce RTX 4090 | |
| 1280x720 low (fps_test=1) | |
| Intel Core i9-13900K, NVIDIA GeForce RTX 4090 | |
| AMD Ryzen 9 7950X3D, NVIDIA GeForce RTX 4090 | |
| Intel Core i7-13700K, NVIDIA GeForce RTX 4090 | |
| AMD Ryzen 9 7950X, NVIDIA GeForce RTX 4090 | |
| AMD Ryzen 7 7800X3D, NVIDIA GeForce RTX 4090 | |
| Intel Core i7-13700, NVIDIA GeForce RTX 4090 | |
| AMD Ryzen 5 7600X, NVIDIA GeForce RTX 4090 | |
| Intel Core i7-12700, NVIDIA GeForce RTX 4090 | |
| AMD Ryzen Threadripper PRO 7995WX, NVIDIA RTX 6000 Ada Generation | |
| Intel Core i5-13400, NVIDIA GeForce RTX 4090 | |
| Intel Core i5-12400F, NVIDIA GeForce RTX 4090 | |
| Final Fantasy XV Benchmark | |
| 1920x1080 High Quality | |
| AMD Ryzen 9 7950X, NVIDIA GeForce RTX 4090 | |
| AMD Ryzen 7 7800X3D, NVIDIA GeForce RTX 4090 | |
| Intel Core i9-13900K, NVIDIA GeForce RTX 4090 | |
| AMD Ryzen 9 7950X3D, NVIDIA GeForce RTX 4090 | |
| Intel Core i7-13700K, NVIDIA GeForce RTX 4090 | |
| AMD Ryzen 5 7600X, NVIDIA GeForce RTX 4090 | |
| Intel Core i7-13700, NVIDIA GeForce RTX 4090 | |
| Intel Core i7-12700, NVIDIA GeForce RTX 4090 | |
| AMD Ryzen Threadripper PRO 7995WX, NVIDIA RTX 6000 Ada Generation | |
| Intel Core i5-13400, NVIDIA GeForce RTX 4090 | |
| Intel Core i5-12400F, NVIDIA GeForce RTX 4090 | |
| 1280x720 Lite Quality | |
| Intel Core i9-13900K, NVIDIA GeForce RTX 4090 | |
| AMD Ryzen 9 7950X, NVIDIA GeForce RTX 4090 | |
| AMD Ryzen 5 7600X, NVIDIA GeForce RTX 4090 | |
| Intel Core i7-13700, NVIDIA GeForce RTX 4090 | |
| Intel Core i7-13700K, NVIDIA GeForce RTX 4090 | |
| AMD Ryzen 7 7800X3D, NVIDIA GeForce RTX 4090 | |
| AMD Ryzen 9 7950X3D, NVIDIA GeForce RTX 4090 | |
| Intel Core i7-12700, NVIDIA GeForce RTX 4090 | |
| AMD Ryzen Threadripper PRO 7995WX, NVIDIA RTX 6000 Ada Generation | |
| Intel Core i5-12400F, NVIDIA GeForce RTX 4090 | |
| Intel Core i5-13400, NVIDIA GeForce RTX 4090 | |
| Dota 2 Reborn | |
| 1920x1080 ultra (3/3) best looking | |
| AMD Ryzen 7 7800X3D, NVIDIA GeForce RTX 4090 | |
| AMD Ryzen 9 7950X3D, NVIDIA GeForce RTX 4090 | |
| AMD Ryzen 9 7950X, NVIDIA GeForce RTX 4090 | |
| Intel Core i9-13900K, NVIDIA GeForce RTX 4090 | |
| AMD Ryzen 5 7600X, NVIDIA GeForce RTX 4090 | |
| Intel Core i7-13700K, NVIDIA GeForce RTX 4090 | |
| Intel Core i7-13700, NVIDIA GeForce RTX 4090 | |
| Intel Core i7-12700, NVIDIA GeForce RTX 4090 | |
| Intel Core i5-13400, NVIDIA GeForce RTX 4090 | |
| Intel Core i5-12400F, NVIDIA GeForce RTX 4090 | |
| AMD Ryzen Threadripper PRO 7995WX, NVIDIA RTX 6000 Ada Generation | |
| 1280x720 min (0/3) fastest | |
| AMD Ryzen 7 7800X3D, NVIDIA GeForce RTX 4090 | |
| AMD Ryzen 9 7950X3D, NVIDIA GeForce RTX 4090 | |
| AMD Ryzen 9 7950X, NVIDIA GeForce RTX 4090 | |
| Intel Core i9-13900K, NVIDIA GeForce RTX 4090 | |
| AMD Ryzen 5 7600X, NVIDIA GeForce RTX 4090 | |
| Intel Core i7-13700K, NVIDIA GeForce RTX 4090 | |
| Intel Core i7-13700, NVIDIA GeForce RTX 4090 | |
| Intel Core i7-12700, NVIDIA GeForce RTX 4090 | |
| Intel Core i5-12400F, NVIDIA GeForce RTX 4090 | |
| Intel Core i5-13400, NVIDIA GeForce RTX 4090 | |
| AMD Ryzen Threadripper PRO 7995WX, NVIDIA RTX 6000 Ada Generation | |
| The Witcher 3 | |
| 1920x1080 Ultra Graphics & Postprocessing (HBAO+) | |
| Intel Core i9-13900K, NVIDIA GeForce RTX 4090 | |
| AMD Ryzen 9 7950X, NVIDIA GeForce RTX 4090 | |
| AMD Ryzen 7 7800X3D, NVIDIA GeForce RTX 4090 | |
| AMD Ryzen 5 7600X, NVIDIA GeForce RTX 4090 | |
| Intel Core i7-13700K, NVIDIA GeForce RTX 4090 | |
| Intel Core i7-13700, NVIDIA GeForce RTX 4090 | |
| AMD Ryzen 9 7950X3D, NVIDIA GeForce RTX 4090 | |
| Intel Core i7-12700, NVIDIA GeForce RTX 4090 | |
| Intel Core i5-13400, NVIDIA GeForce RTX 4090 | |
| Intel Core i5-12400F, NVIDIA GeForce RTX 4090 | |
| AMD Ryzen Threadripper PRO 7995WX, NVIDIA RTX 6000 Ada Generation | |
| 1024x768 Low Graphics & Postprocessing | |
| AMD Ryzen 9 7950X3D, NVIDIA GeForce RTX 4090 | |
| AMD Ryzen 7 7800X3D, NVIDIA GeForce RTX 4090 | |
| AMD Ryzen 9 7950X, NVIDIA GeForce RTX 4090 | |
| Intel Core i9-13900K, NVIDIA GeForce RTX 4090 | |
| AMD Ryzen 5 7600X, NVIDIA GeForce RTX 4090 | |
| Intel Core i7-13700K, NVIDIA GeForce RTX 4090 | |
| Intel Core i7-13700, NVIDIA GeForce RTX 4090 | |
| AMD Ryzen Threadripper PRO 7995WX, NVIDIA RTX 6000 Ada Generation | |
| Intel Core i7-12700, NVIDIA GeForce RTX 4090 | |
| Intel Core i5-13400, NVIDIA GeForce RTX 4090 | |
| Intel Core i5-12400F, NVIDIA GeForce RTX 4090 | |
| Borderlands 3 | |
| 1280x720 Very Low Overall Quality (DX11) | |
| AMD Ryzen 7 7800X3D, NVIDIA GeForce RTX 4090 | |
| AMD Ryzen 9 7950X3D, NVIDIA GeForce RTX 4090 | |
| Intel Core i9-13900K, NVIDIA GeForce RTX 4090 | |
| AMD Ryzen 9 7950X, NVIDIA GeForce RTX 4090 | |
| AMD Ryzen 5 7600X, NVIDIA GeForce RTX 4090 | |
| Intel Core i7-13700, NVIDIA GeForce RTX 4090 | |
| Intel Core i7-13700K, NVIDIA GeForce RTX 4090 | |
| Intel Core i7-12700, NVIDIA GeForce RTX 4090 | |
| AMD Ryzen Threadripper PRO 7995WX, NVIDIA RTX 6000 Ada Generation | |
| Intel Core i5-13400, NVIDIA GeForce RTX 4090 | |
| Intel Core i5-12400F, NVIDIA GeForce RTX 4090 | |
| 1920x1080 Badass Overall Quality (DX11) | |
| AMD Ryzen 9 7950X3D, NVIDIA GeForce RTX 4090 | |
| AMD Ryzen 7 7800X3D, NVIDIA GeForce RTX 4090 | |
| AMD Ryzen 9 7950X, NVIDIA GeForce RTX 4090 | |
| Intel Core i9-13900K, NVIDIA GeForce RTX 4090 | |
| AMD Ryzen 5 7600X, NVIDIA GeForce RTX 4090 | |
| Intel Core i7-13700K, NVIDIA GeForce RTX 4090 | |
| Intel Core i7-13700, NVIDIA GeForce RTX 4090 | |
| Intel Core i7-12700, NVIDIA GeForce RTX 4090 | |
| AMD Ryzen Threadripper PRO 7995WX, NVIDIA RTX 6000 Ada Generation | |
| Intel Core i5-13400, NVIDIA GeForce RTX 4090 | |
| Intel Core i5-12400F, NVIDIA GeForce RTX 4090 | |
| Far Cry New Dawn | |
| 1280x720 Low Preset | |
| AMD Ryzen 7 7800X3D, NVIDIA GeForce RTX 4090 | |
| AMD Ryzen 9 7950X3D, NVIDIA GeForce RTX 4090 | |
| Intel Core i9-13900K, NVIDIA GeForce RTX 4090 | |
| Intel Core i7-13700, NVIDIA GeForce RTX 4090 | |
| Intel Core i7-13700K, NVIDIA GeForce RTX 4090 | |
| AMD Ryzen 9 7950X, NVIDIA GeForce RTX 4090 | |
| AMD Ryzen 5 7600X, NVIDIA GeForce RTX 4090 | |
| Intel Core i7-12700, NVIDIA GeForce RTX 4090 | |
| Intel Core i5-13400, NVIDIA GeForce RTX 4090 | |
| Intel Core i5-12400F, NVIDIA GeForce RTX 4090 | |
| AMD Ryzen Threadripper PRO 7995WX, NVIDIA RTX 6000 Ada Generation | |
| 1920x1080 Ultra Preset | |
| AMD Ryzen 7 7800X3D, NVIDIA GeForce RTX 4090 | |
| AMD Ryzen 9 7950X3D, NVIDIA GeForce RTX 4090 | |
| Intel Core i9-13900K, NVIDIA GeForce RTX 4090 | |
| AMD Ryzen 9 7950X, NVIDIA GeForce RTX 4090 | |
| Intel Core i7-13700K, NVIDIA GeForce RTX 4090 | |
| AMD Ryzen 5 7600X, NVIDIA GeForce RTX 4090 | |
| Intel Core i7-13700, NVIDIA GeForce RTX 4090 | |
| Intel Core i7-12700, NVIDIA GeForce RTX 4090 | |
| Intel Core i5-13400, NVIDIA GeForce RTX 4090 | |
| Intel Core i5-12400F, NVIDIA GeForce RTX 4090 | |
| AMD Ryzen Threadripper PRO 7995WX, NVIDIA RTX 6000 Ada Generation | |
| Shadow of the Tomb Raider | |
| 1280x720 Lowest Preset | |
| AMD Ryzen 7 7800X3D, NVIDIA GeForce RTX 4090 | |
| AMD Ryzen 9 7950X3D, NVIDIA GeForce RTX 4090 | |
| AMD Ryzen 9 7950X, NVIDIA GeForce RTX 4090 | |
| AMD Ryzen 5 7600X, NVIDIA GeForce RTX 4090 | |
| Intel Core i9-13900K, NVIDIA GeForce RTX 4090 | |
| Intel Core i7-13700, NVIDIA GeForce RTX 4090 | |
| Intel Core i7-13700K, NVIDIA GeForce RTX 4090 | |
| AMD Ryzen Threadripper PRO 7995WX, NVIDIA RTX 6000 Ada Generation | |
| Intel Core i7-12700, NVIDIA GeForce RTX 4090 | |
| Intel Core i5-13400, NVIDIA GeForce RTX 4090 | |
| Intel Core i5-12400F, NVIDIA GeForce RTX 4090 | |
| 1920x1080 Highest Preset AA:T | |
| AMD Ryzen 7 7800X3D, NVIDIA GeForce RTX 4090 | |
| AMD Ryzen 9 7950X3D, NVIDIA GeForce RTX 4090 | |
| AMD Ryzen 9 7950X, NVIDIA GeForce RTX 4090 | |
| Intel Core i9-13900K, NVIDIA GeForce RTX 4090 | |
| AMD Ryzen 5 7600X, NVIDIA GeForce RTX 4090 | |
| Intel Core i7-13700K, NVIDIA GeForce RTX 4090 | |
| Intel Core i7-13700, NVIDIA GeForce RTX 4090 | |
| AMD Ryzen Threadripper PRO 7995WX, NVIDIA RTX 6000 Ada Generation | |
| Intel Core i7-12700, NVIDIA GeForce RTX 4090 | |
| Intel Core i5-13400, NVIDIA GeForce RTX 4090 | |
| Intel Core i5-12400F, NVIDIA GeForce RTX 4090 | |
| Tiny Tina's Wonderlands | |
| 1920x1080 Low Preset (DX12) | |
| AMD Ryzen 7 7800X3D, NVIDIA GeForce RTX 4090 | |
| AMD Ryzen 9 7950X3D, NVIDIA GeForce RTX 4090 | |
| AMD Ryzen 9 7950X, NVIDIA GeForce RTX 4090 | |
| AMD Ryzen 5 7600X, NVIDIA GeForce RTX 4090 | |
| Intel Core i9-13900K, NVIDIA GeForce RTX 4090 | |
| Intel Core i7-13700, NVIDIA GeForce RTX 4090 | |
| Intel Core i7-13700K, NVIDIA GeForce RTX 4090 | |
| AMD Ryzen Threadripper PRO 7995WX, NVIDIA RTX 6000 Ada Generation | |
| Intel Core i7-12700, NVIDIA GeForce RTX 4090 | |
| Intel Core i5-13400, NVIDIA GeForce RTX 4090 | |
| Intel Core i5-12400F, NVIDIA GeForce RTX 4090 | |
| 1920x1080 Badass Preset (DX12) | |
| AMD Ryzen 7 7800X3D, NVIDIA GeForce RTX 4090 | |
| AMD Ryzen 9 7950X3D, NVIDIA GeForce RTX 4090 | |
| AMD Ryzen 9 7950X, NVIDIA GeForce RTX 4090 | |
| AMD Ryzen 5 7600X, NVIDIA GeForce RTX 4090 | |
| Intel Core i9-13900K, NVIDIA GeForce RTX 4090 | |
| Intel Core i7-13700, NVIDIA GeForce RTX 4090 | |
| Intel Core i7-13700K, NVIDIA GeForce RTX 4090 | |
| Intel Core i7-12700, NVIDIA GeForce RTX 4090 | |
| AMD Ryzen Threadripper PRO 7995WX, NVIDIA RTX 6000 Ada Generation | |
| Intel Core i5-13400, NVIDIA GeForce RTX 4090 | |
| Intel Core i5-12400F, NVIDIA GeForce RTX 4090 | |
| Metro Exodus | |
| 1280x720 Low Quality AF:4x | |
| AMD Ryzen 7 7800X3D, NVIDIA GeForce RTX 4090 | |
| AMD Ryzen 5 7600X, NVIDIA GeForce RTX 4090 | |
| AMD Ryzen 9 7950X, NVIDIA GeForce RTX 4090 | |
| AMD Ryzen 9 7950X3D, NVIDIA GeForce RTX 4090 | |
| Intel Core i7-13700, NVIDIA GeForce RTX 4090 | |
| Intel Core i9-13900K, NVIDIA GeForce RTX 4090 | |
| Intel Core i7-13700K, NVIDIA GeForce RTX 4090 | |
| Intel Core i7-12700, NVIDIA GeForce RTX 4090 | |
| Intel Core i5-12400F, NVIDIA GeForce RTX 4090 | |
| Intel Core i5-13400, NVIDIA GeForce RTX 4090 | |
| AMD Ryzen Threadripper PRO 7995WX, NVIDIA RTX 6000 Ada Generation | |
| 1920x1080 Ultra Quality AF:16x | |
| AMD Ryzen 7 7800X3D, NVIDIA GeForce RTX 4090 | |
| AMD Ryzen 9 7950X, NVIDIA GeForce RTX 4090 | |
| AMD Ryzen 5 7600X, NVIDIA GeForce RTX 4090 | |
| AMD Ryzen 9 7950X3D, NVIDIA GeForce RTX 4090 | |
| Intel Core i9-13900K, NVIDIA GeForce RTX 4090 | |
| Intel Core i7-13700, NVIDIA GeForce RTX 4090 | |
| Intel Core i7-13700K, NVIDIA GeForce RTX 4090 | |
| Intel Core i7-12700, NVIDIA GeForce RTX 4090 | |
| Intel Core i5-13400, NVIDIA GeForce RTX 4090 | |
| Intel Core i5-12400F, NVIDIA GeForce RTX 4090 | |
| AMD Ryzen Threadripper PRO 7995WX, NVIDIA RTX 6000 Ada Generation | |
| low | med. | high | ultra | QHD | 4K DLSS | 4K | |
|---|---|---|---|---|---|---|---|
| The Witcher 3 (2015) | 661 | 579 | 489 | 260 | 219 | 183.5 | |
| Dota 2 Reborn (2015) | 168.7 | 159 | 164.8 | 153.6 | 153.1 | ||
| Final Fantasy XV Benchmark (2018) | 228 | 228 | 201 | 194.7 | 124.2 | ||
| X-Plane 11.11 (2018) | 163.5 | 155.6 | 123.3 | 100.7 | |||
| Far Cry 5 (2018) | 144 | 130 | 126 | 118 | 118 | 115 | |
| Shadow of the Tomb Raider (2018) | 265 | 250 | 240 | 233 | 219 | 127.9 | |
| Far Cry New Dawn (2019) | 127 | 113 | 109 | 100 | 99 | 98 | |
| Metro Exodus (2019) | 167.6 | 125 | 114.4 | 103.6 | 94.5 | 89.8 | |
| Borderlands 3 (2019) | 181.9 | 156.5 | 153.2 | 141 | 138.1 | 87.7 | |
| Horizon Zero Dawn (2020) | 238 | 220 | 208 | 199 | 192 | 173 | 125 |
| Far Cry 6 (2021) | 177.8 | 159.2 | 143.5 | 142.9 | 138.9 | 109.9 | |
| Tiny Tina's Wonderlands (2022) | 334 | 265 | 232 | 219 | 175.3 | 87.3 | |
| A Plague Tale Requiem (2022) | 183.6 | 169.3 | 160.6 | 131 | 94.2 | 108.4 | 54 |
| The Witcher 3 v4 (2023) | 287 | 248 | 219 | 210 | 208 | 128.1 | |
| Starfield (2023) | 140.5 | 129 | 112.6 | 103.9 | 89.1 | 62.9 | |
| Cyberpunk 2077 (2023) | 164.2 | 162.5 | 155.3 | 147.2 | 131 | 60.3 | |
| Total War Pharaoh (2023) | 330.6 | 215.3 | 157.5 | 140.9 | 140.7 | 112.7 |
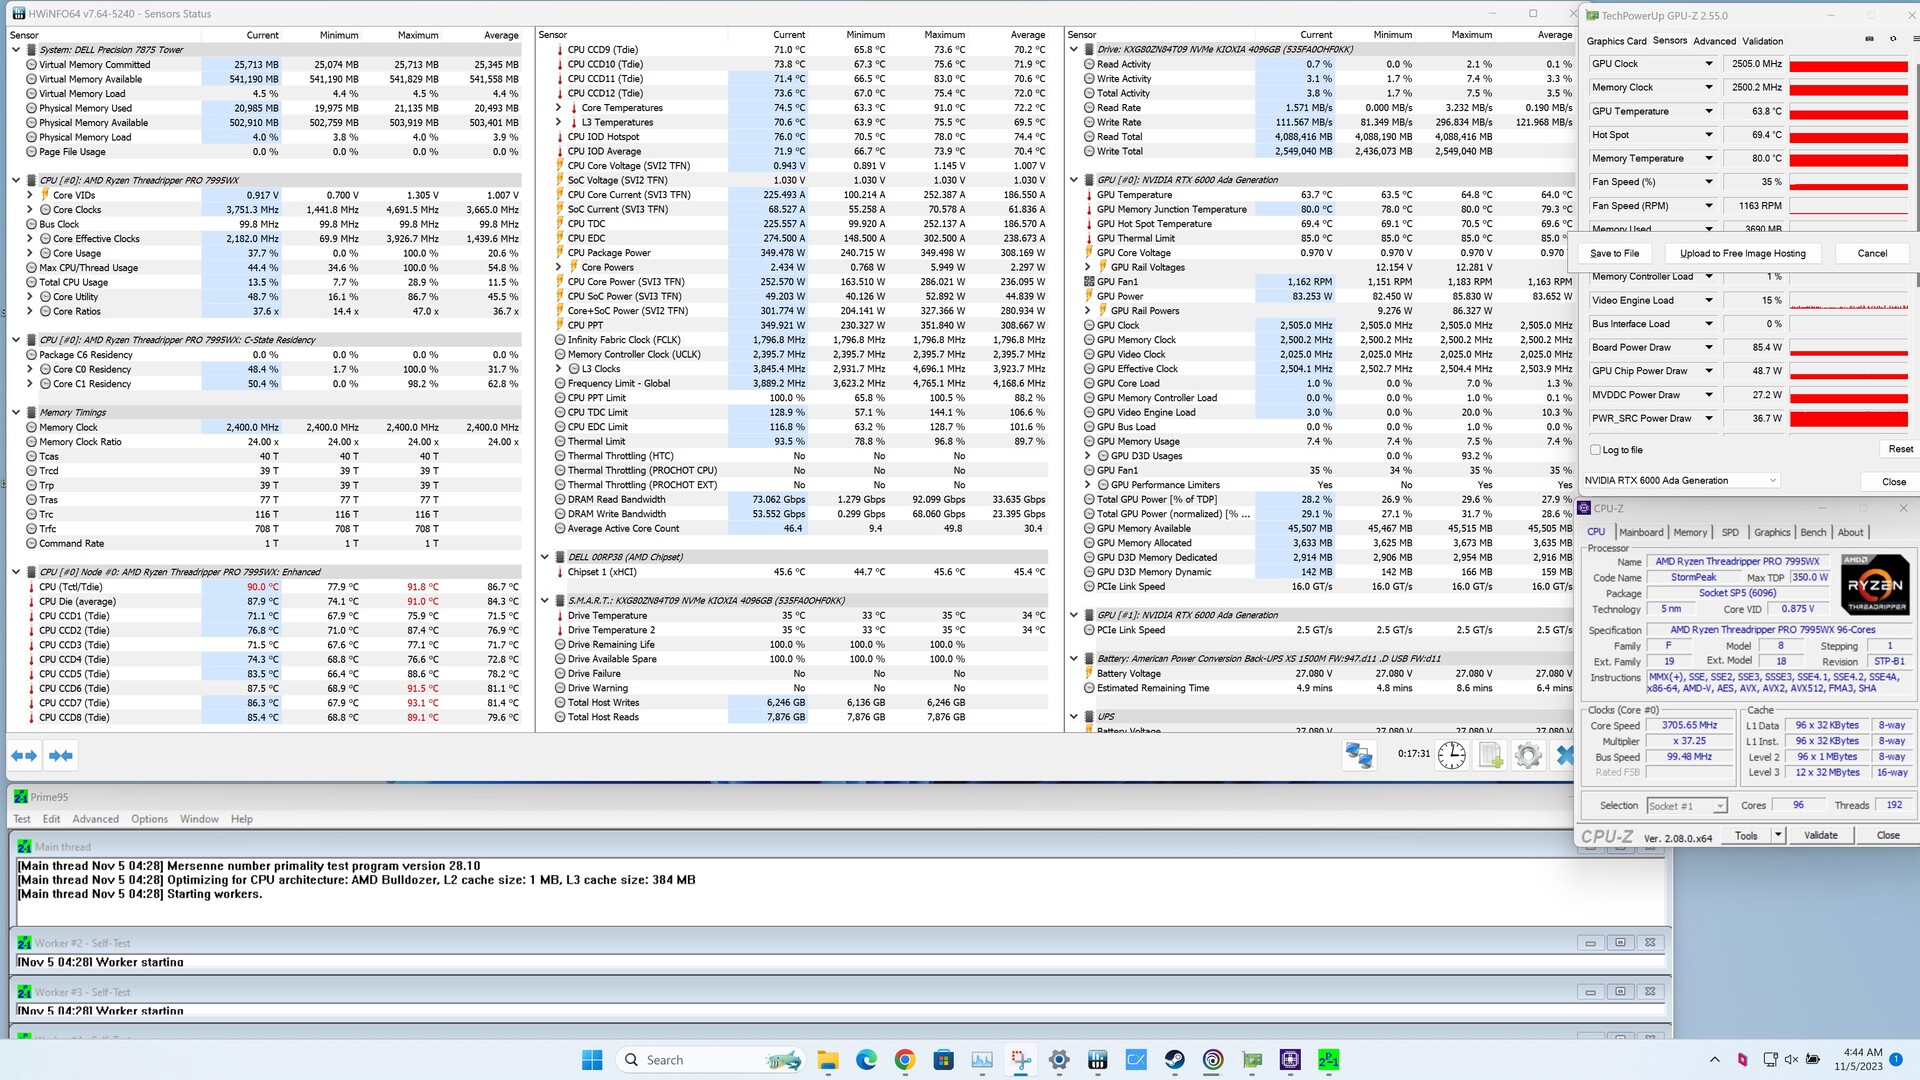
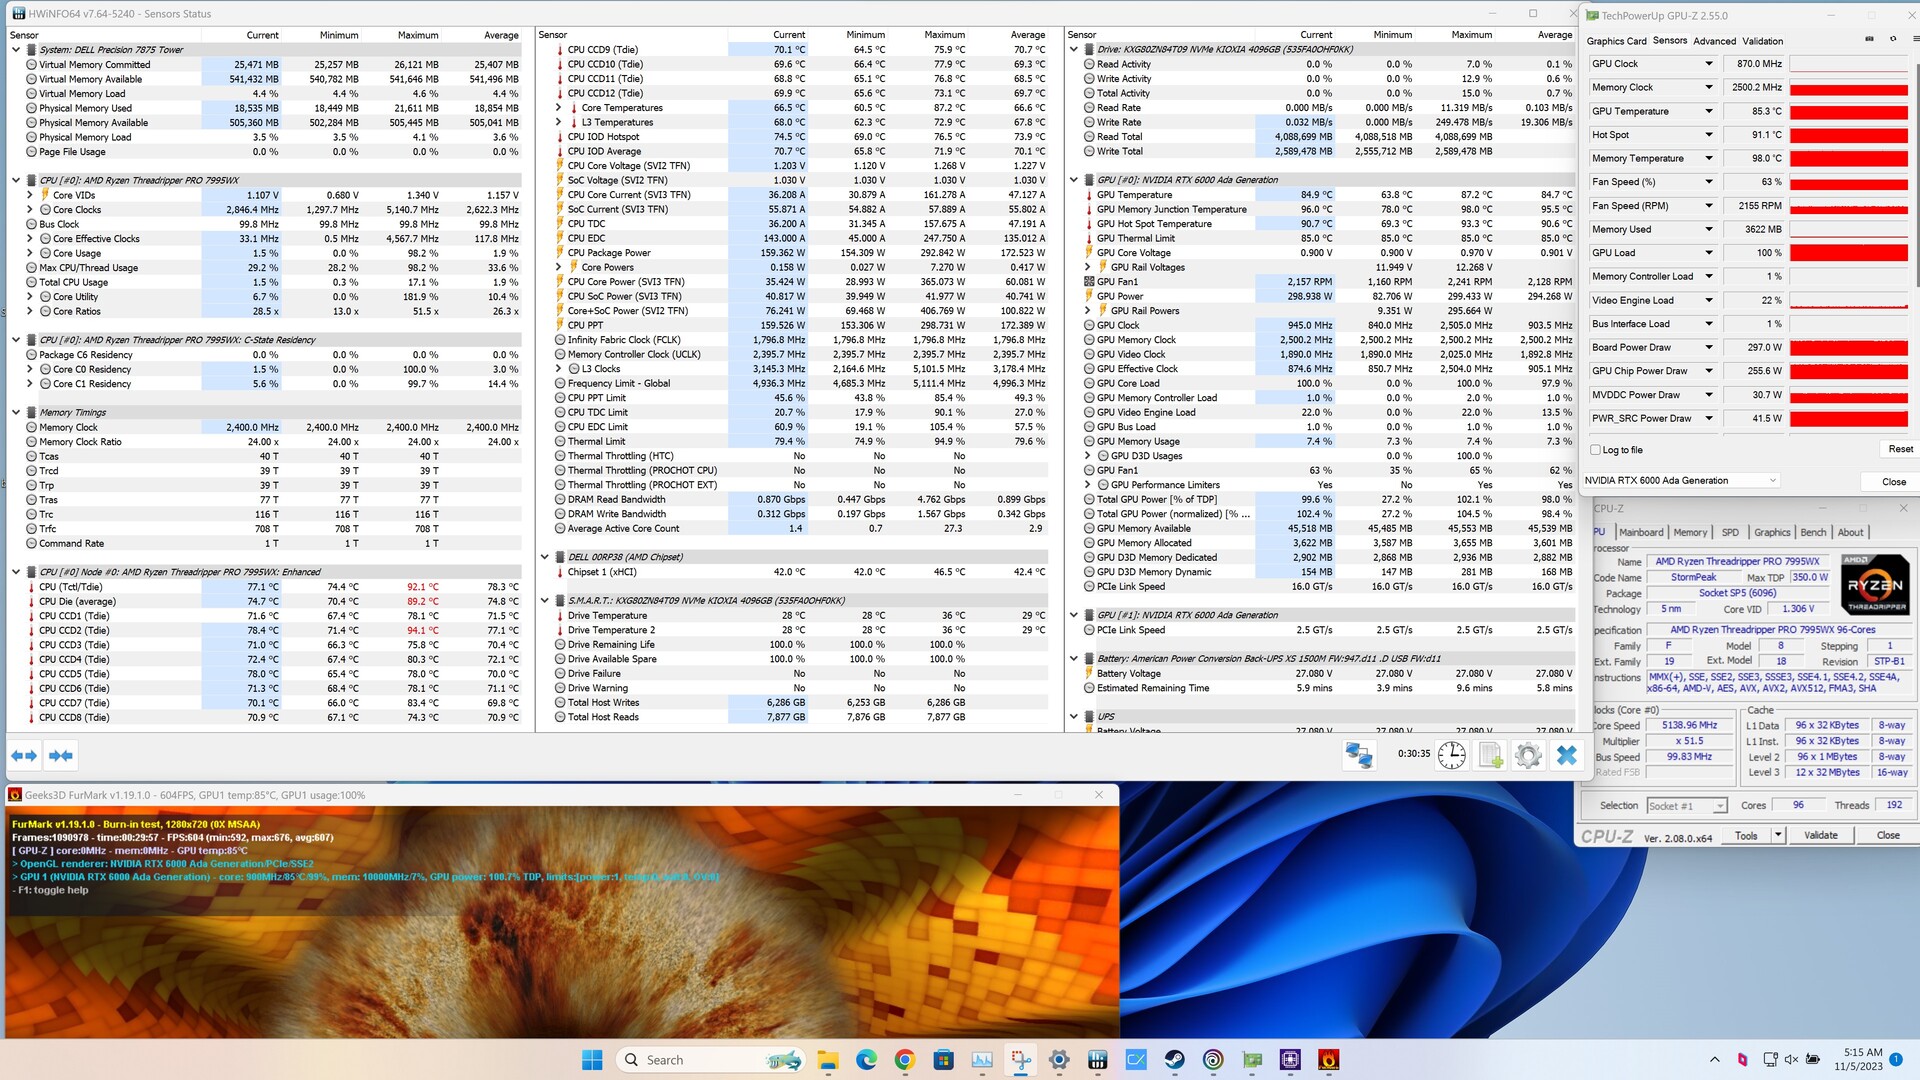
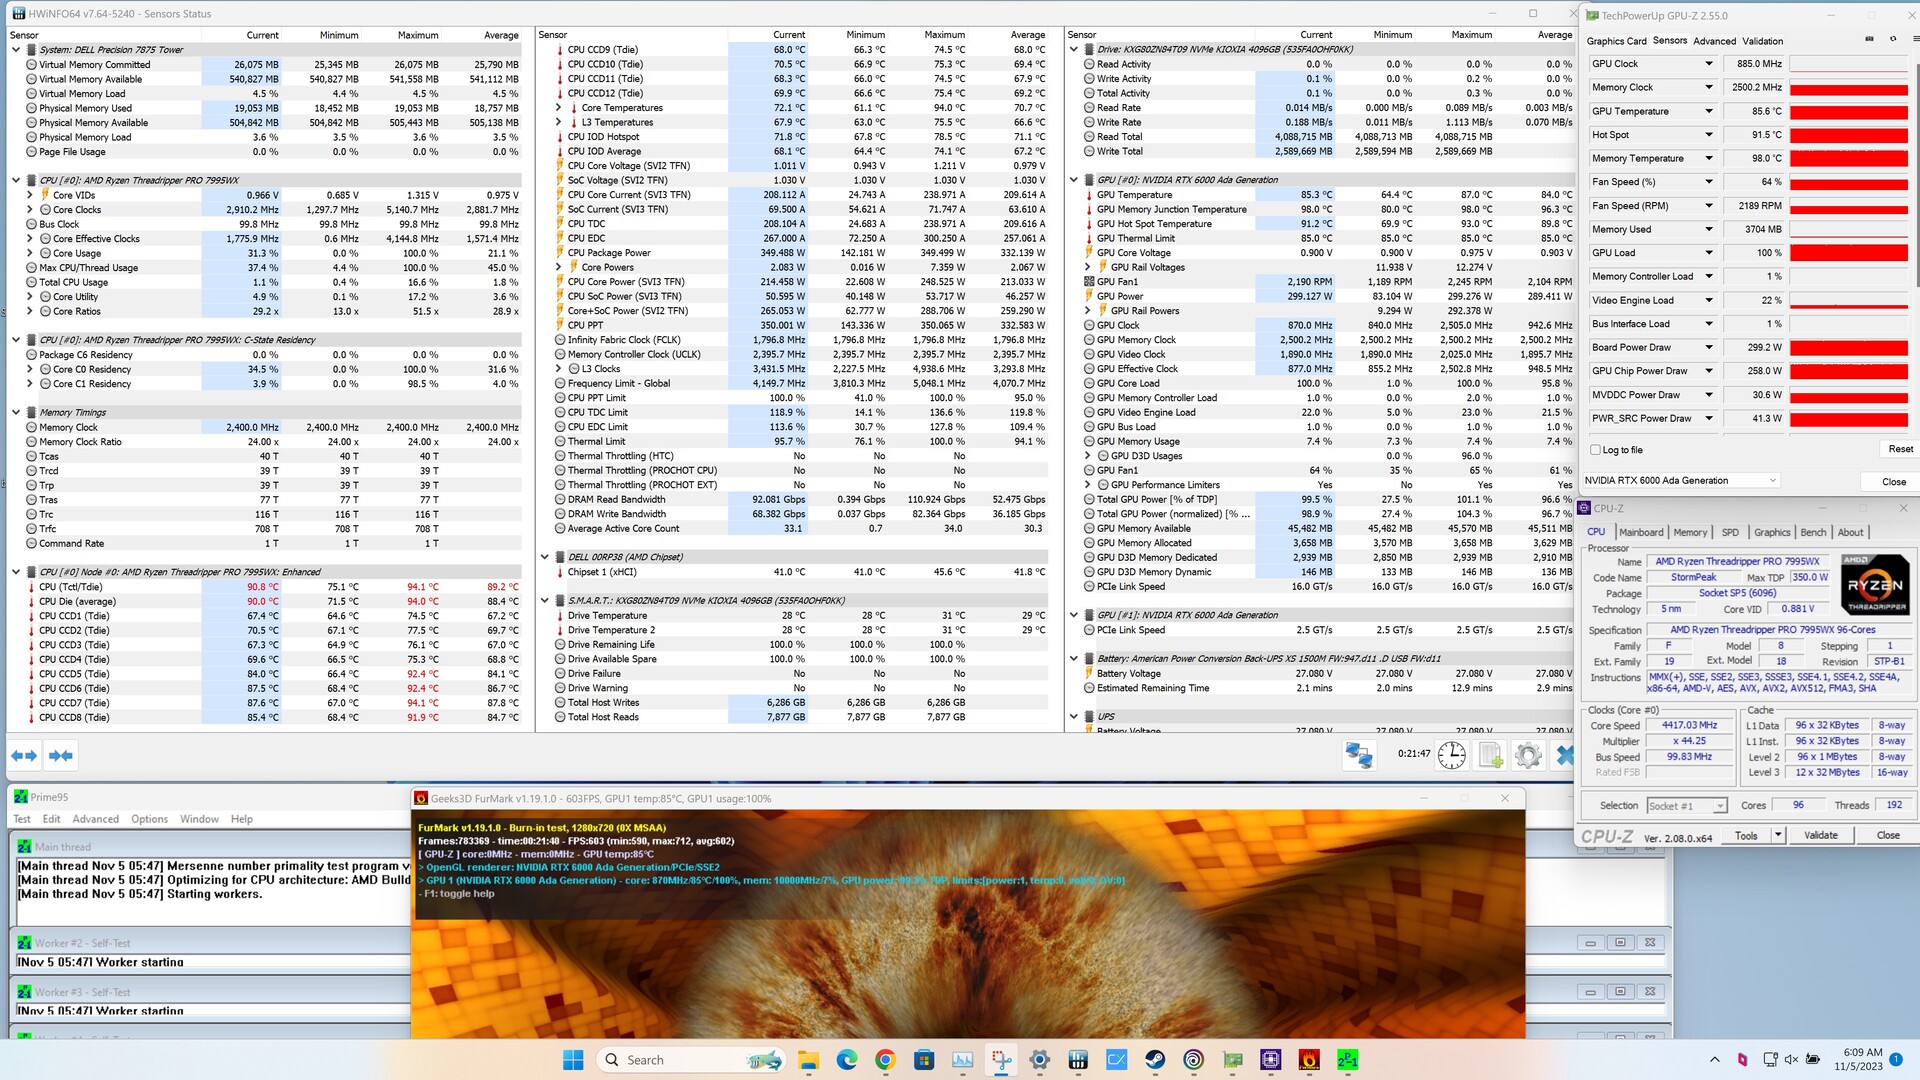
Emissions
Due to the test conditions, emission values are derived solely from HWiNFO results. The system underwent a stress test in three different scenarios. In the Prime95 stress test, the AMD Ryzen Threadripper Pro 7995WX demonstrated stable operation. Operating at 3.6 GHz, the processor consistently exceeded the base clock of 2.5 GHz. The temperature stabilized around 87 °C, reaching just under 92 °C at its peak. The Nvidia RTX 6000 Ada generation maintained maximum performance throughout the stress test, with no observed loss of performance at 300 watts. However, we recorded a hot spot value of 91 °C for the GPU, while the VRAM reached up to 98 °C. When both the CPU and GPU were loaded simultaneously, there were no significant differences. The average temperature of the AMD Ryzen Threadripper Pro 7995WX rose slightly to 89 °C.
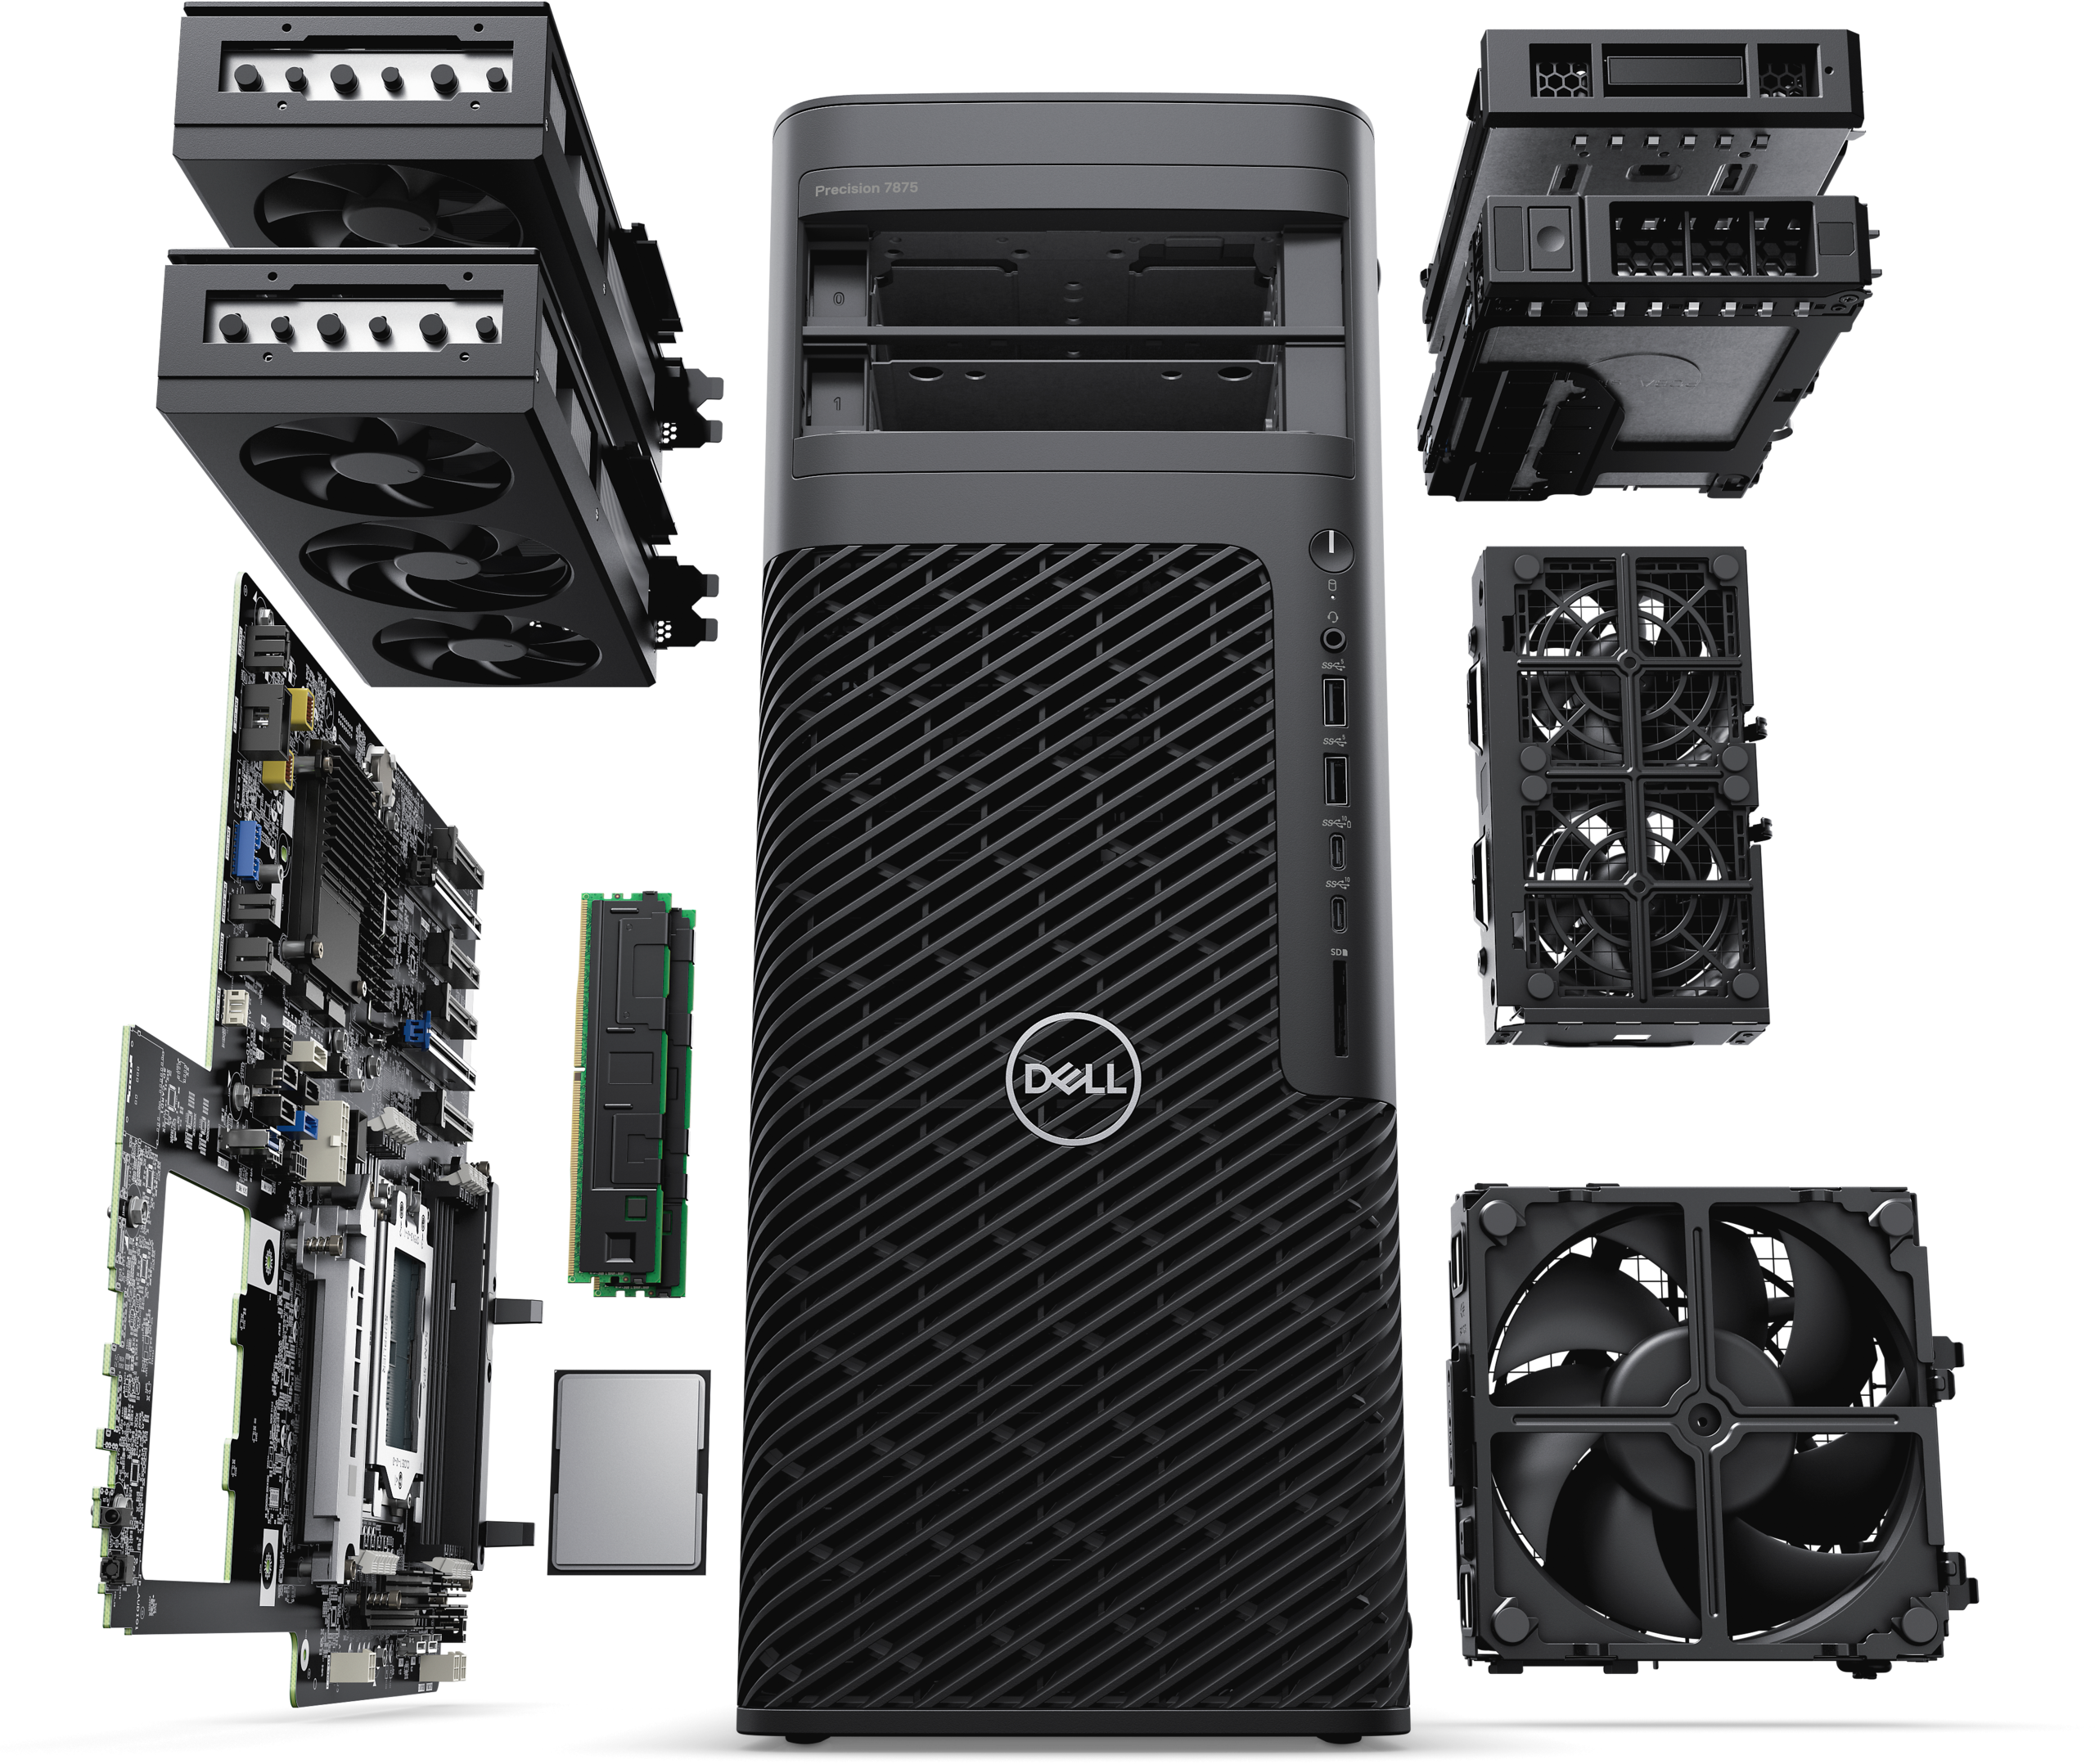
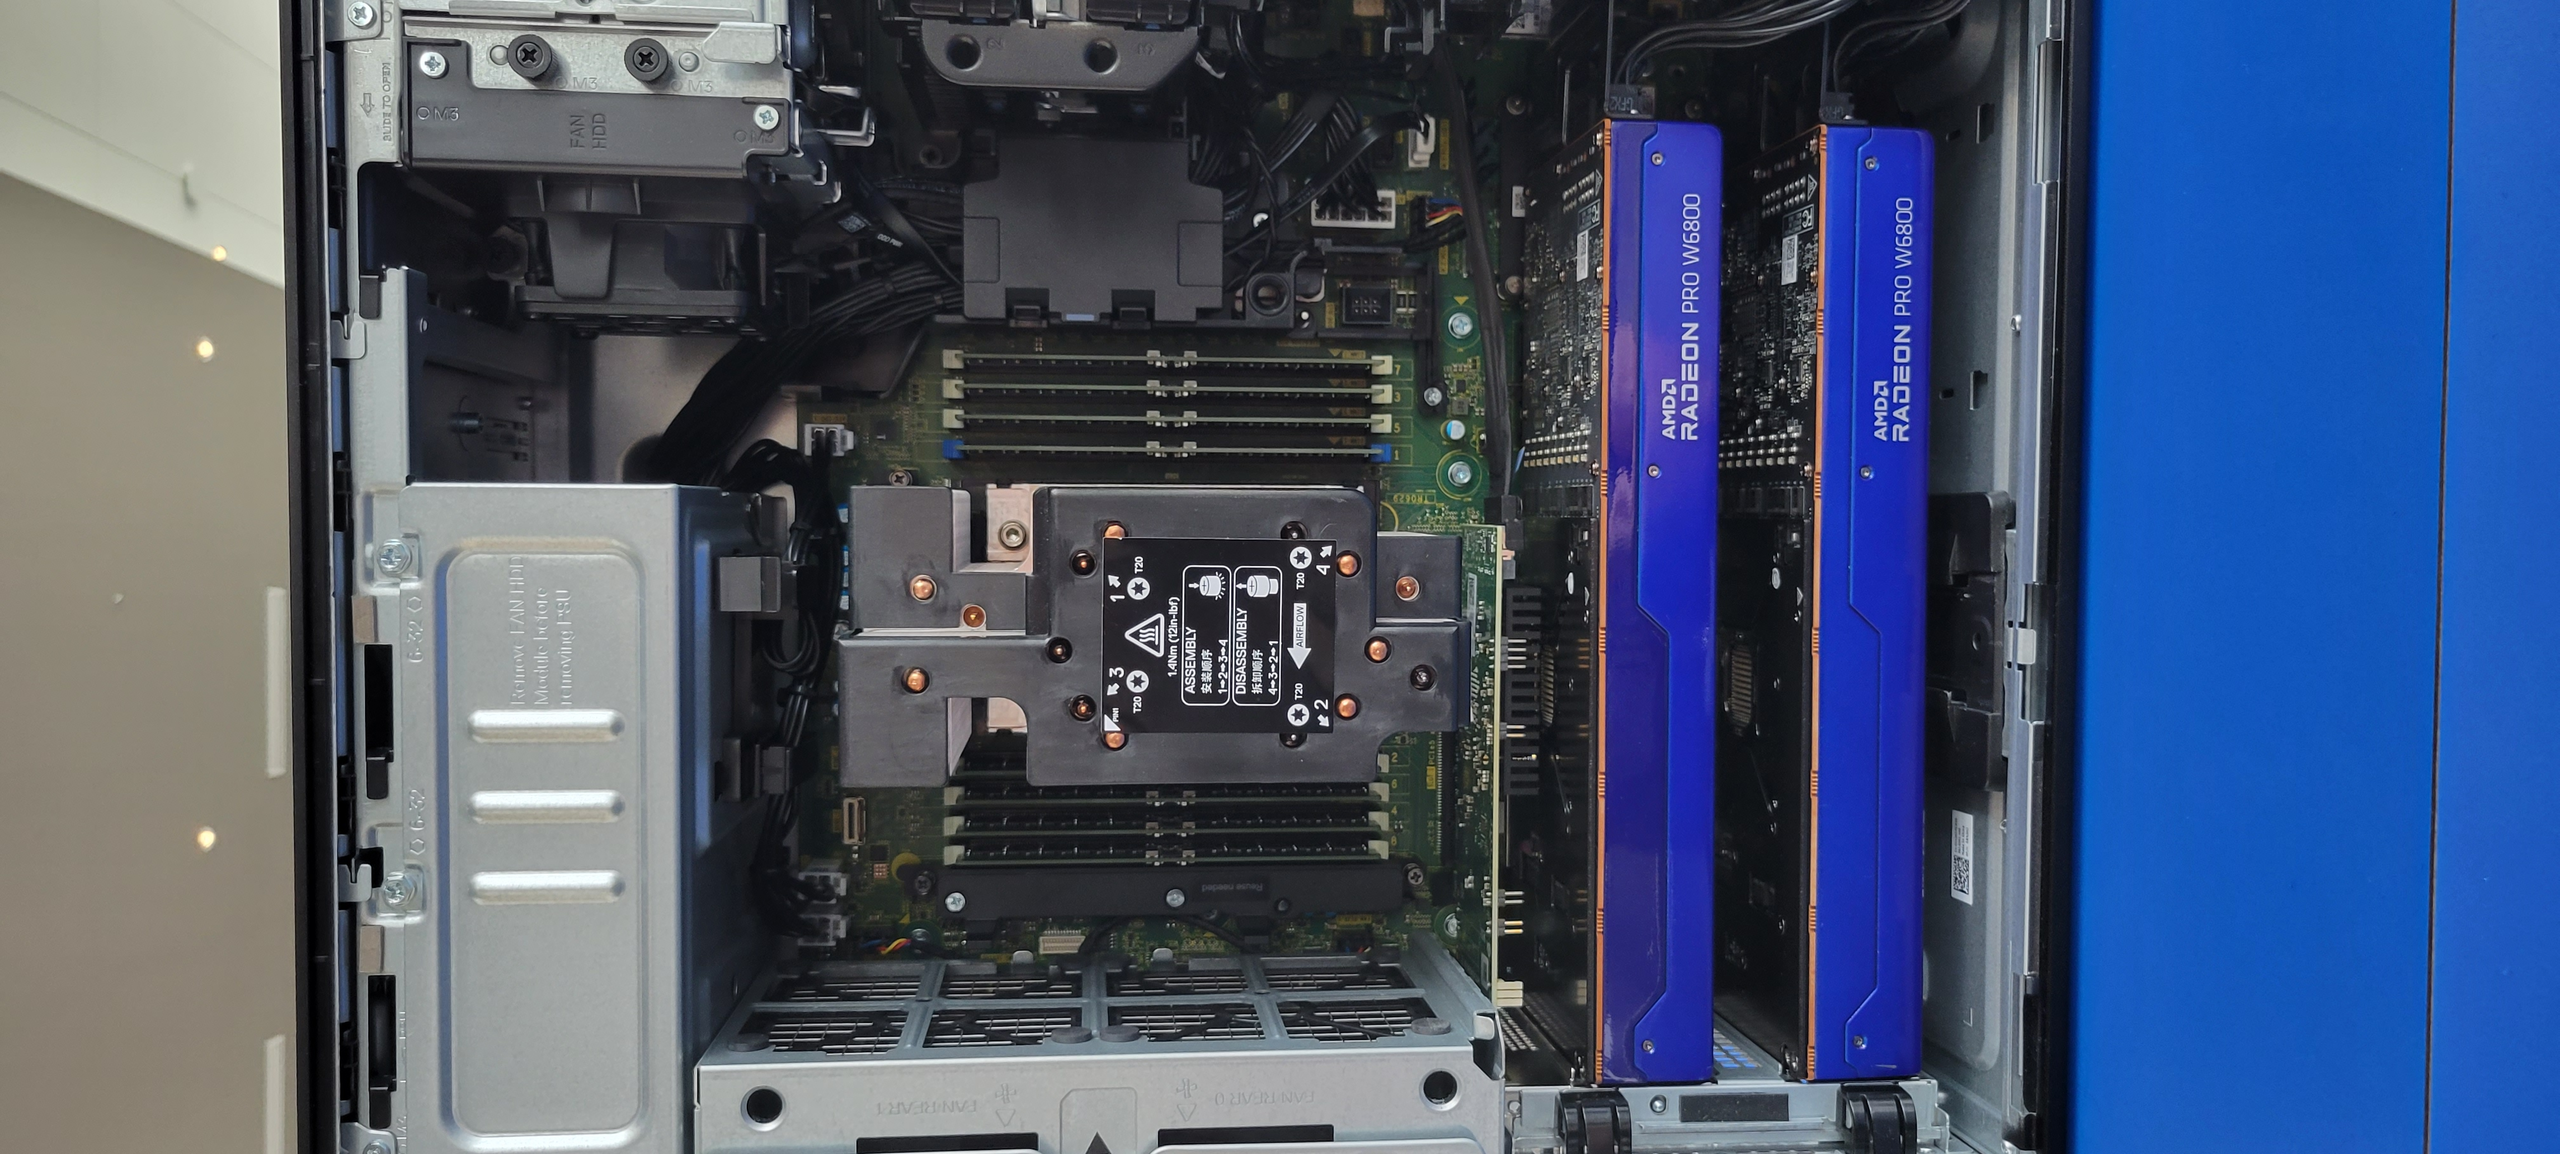
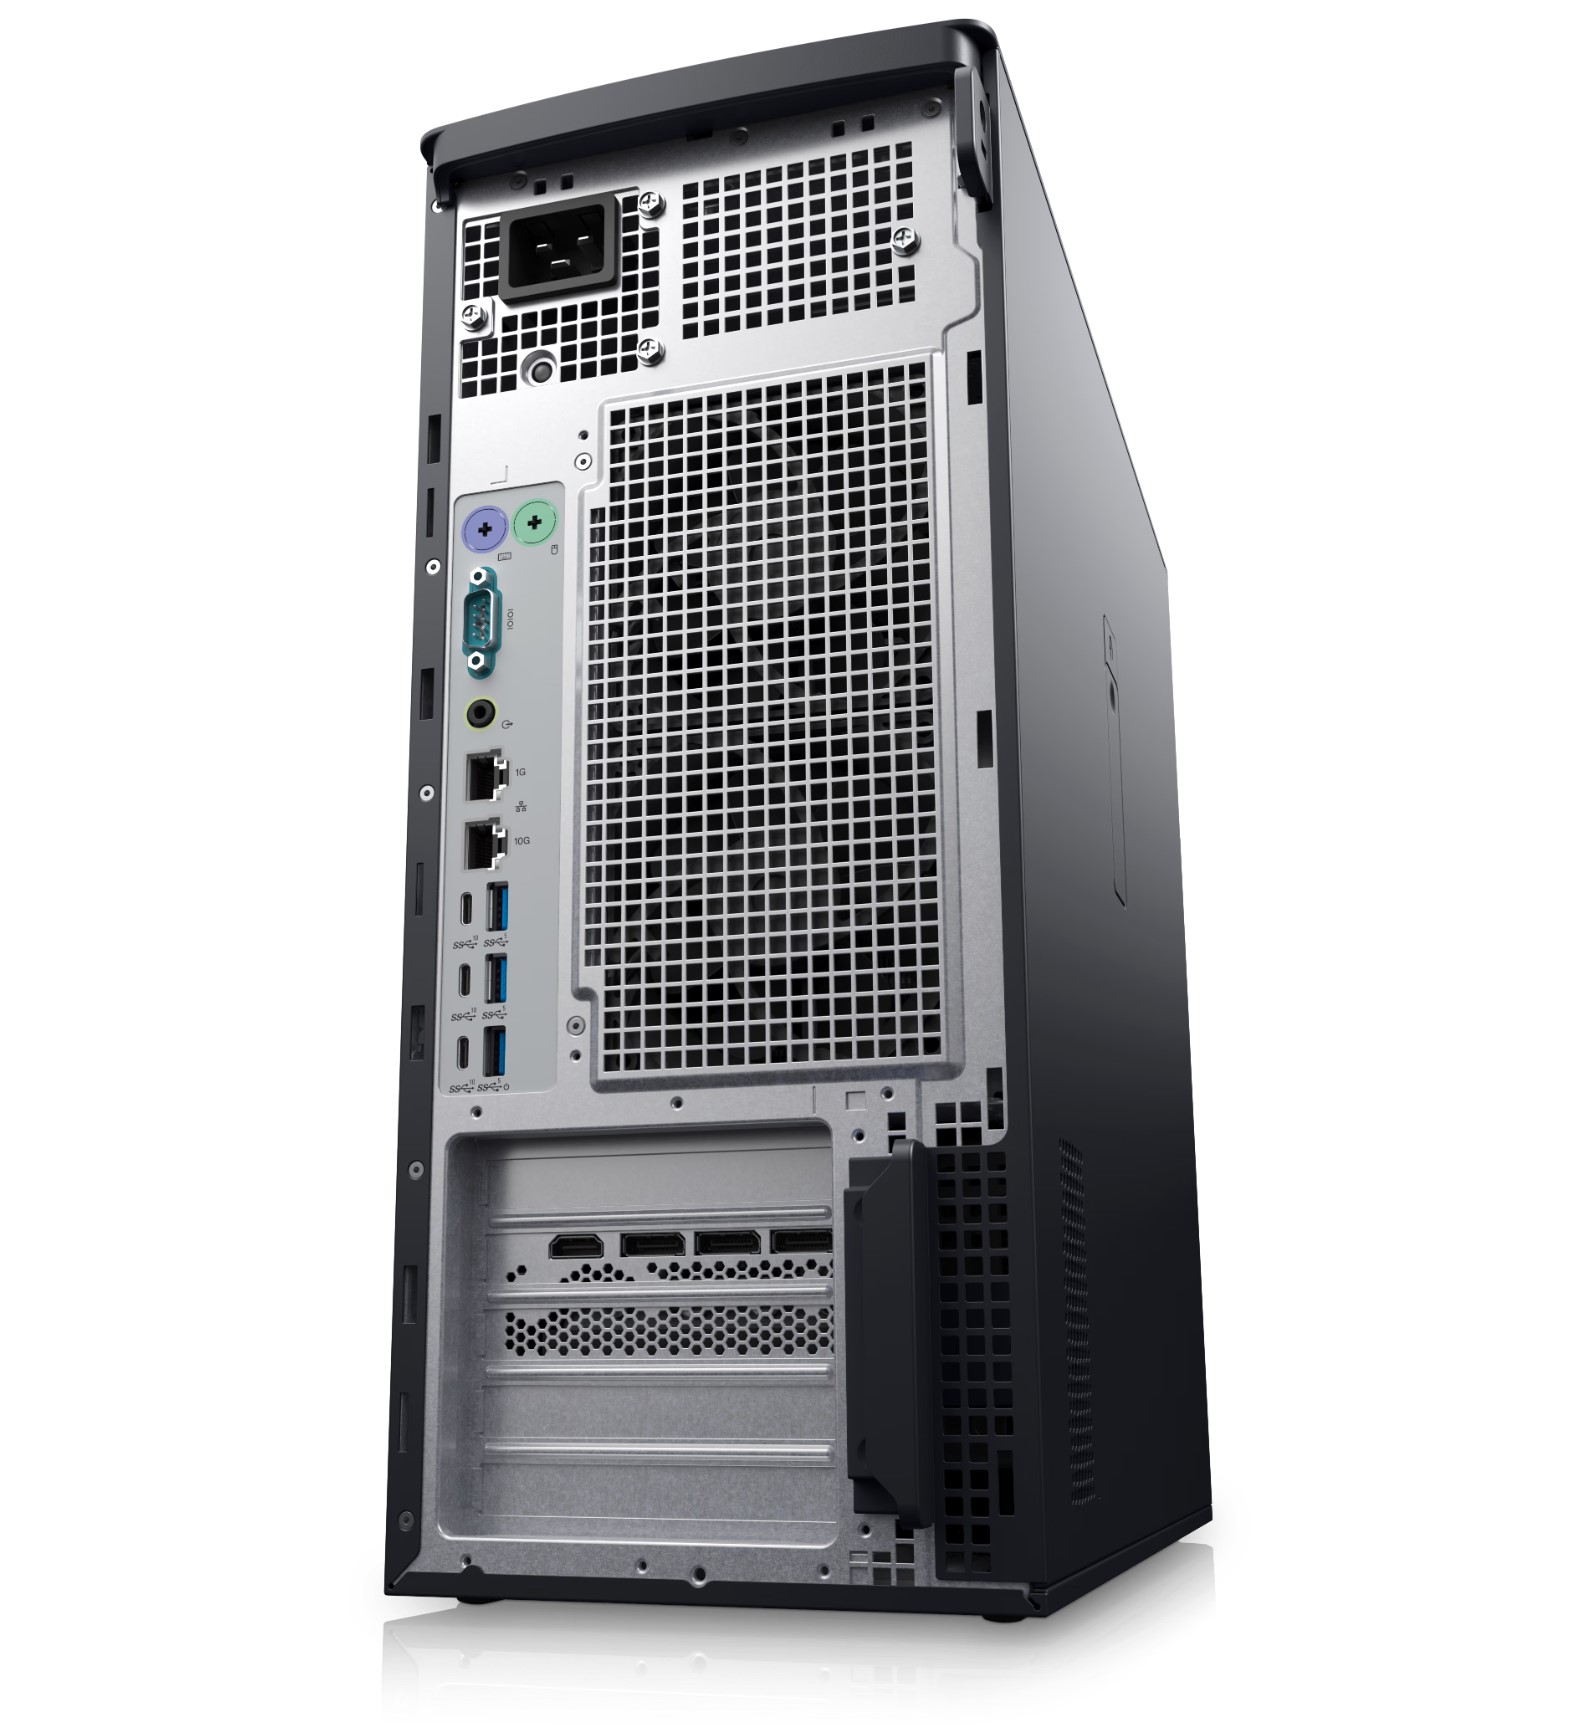
The cooling concept for the Dell Precision 7875 Tower Workstation adopts a chamber design. The upper area covers the processor and RAM, directing airflow directly over the components for cooling. The two graphics cards are situated in the lower area and receive fresh air from a front-mounted fan. It's worth noting that Nvidia has equipped the RTX 6000 Ada generation with a blower design, expelling waste heat directly from the housing. This concept has been utilized for consumer graphics cards at times as well.
Pros
Cons
Verdict - High-end workstation for the price of a mid-range car
The Dell Precision 7875 Tower Workstation integrates AMD's swiftest workstation processors, establishing new benchmarks in pure performance. Fueled by the Zen4 architecture, the AMD Ryzen Threadripper Pro 7995WX delivers substantial computing prowess and combines up to 96 cores under the heat spreader, a groundbreaking achievement. Consequently, the processor can concurrently handle up to 192 threads. Coupled with 512GB of RAM and two Nvidia RTX 6000 Ada generation graphics cards, this workstation can effectively tackle resource-intensive projects.
All of these components are housed within a relatively compact tower case equipped with a sophisticated cooling system. During testing, critical temperatures exceeding 100°C were not reached, affirming the effectiveness of the cooling concept and ensuring smooth operation even under full load.
Equipped with the AMD Ryzen Threadripper Pro 7995WX, the Dell Precision 7875 Tower Workstation boasts the fastest processor currently available for multi-core applications.
In tandem with the processor, the built-in graphics card is a crucial element of a workstation PC. The top model from Nvidia, the RTX 6000 Ada generation, provides ample power. In comparison to Nvidia's GeForce RTX 4090, the professional model, featuring the full version of the AD102, can deliver significantly higher performance, provided effective driver support is in place during various render tests.
While the company has not yet finalized the pricing details, Dell's in-house store allows users to configure the Dell Precision 7875 Tower Workstation according to their preferences. Entry-level models start at just ~ $3,000 USD. For those looking to push the boundaries, it's possible to assemble a system costing over $50,000 USD.
Price & Availability
The Dell Precision 7875 Tower Workstation, in the configuration tested here, is currently not available. However, the Dell Precision 7875 Tower Workstation with Threadripper models of the 5000 generation is available on the manufacturer's store page. Prices for the basic model start at just ~ $3,000 USD.
Transparency
The selection of devices to be reviewed is made by our editorial team. The test sample was provided to the author as a loan by the manufacturer or retailer for the purpose of this review. The lender had no influence on this review, nor did the manufacturer receive a copy of this review before publication. There was no obligation to publish this review. As an independent media company, Notebookcheck is not subjected to the authority of manufacturers, retailers or publishers.
This is how Notebookcheck is testing
Every year, Notebookcheck independently reviews hundreds of laptops and smartphones using standardized procedures to ensure that all results are comparable. We have continuously developed our test methods for around 20 years and set industry standards in the process. In our test labs, high-quality measuring equipment is utilized by experienced technicians and editors. These tests involve a multi-stage validation process. Our complex rating system is based on hundreds of well-founded measurements and benchmarks, which maintains objectivity. Further information on our test methods can be found here.

