Notebookcheck Logo

Review: AMD Ryzen Threadripper Pro 3995WX and Radeon Pro W6800 in the Lenovo ThinkStation P620 high-end workstation

64 (sixty-four!) cores. With the current ThinkStation P620, Lenovo offers a solid platform for compact high-end workstations. We took a closer look at the 13,000-Euro (~$15,292) device in our test; it consists of the AMD Ryzen Threadripper Pro 3995WX and the brand-new AMD Radeon Pro W6800.

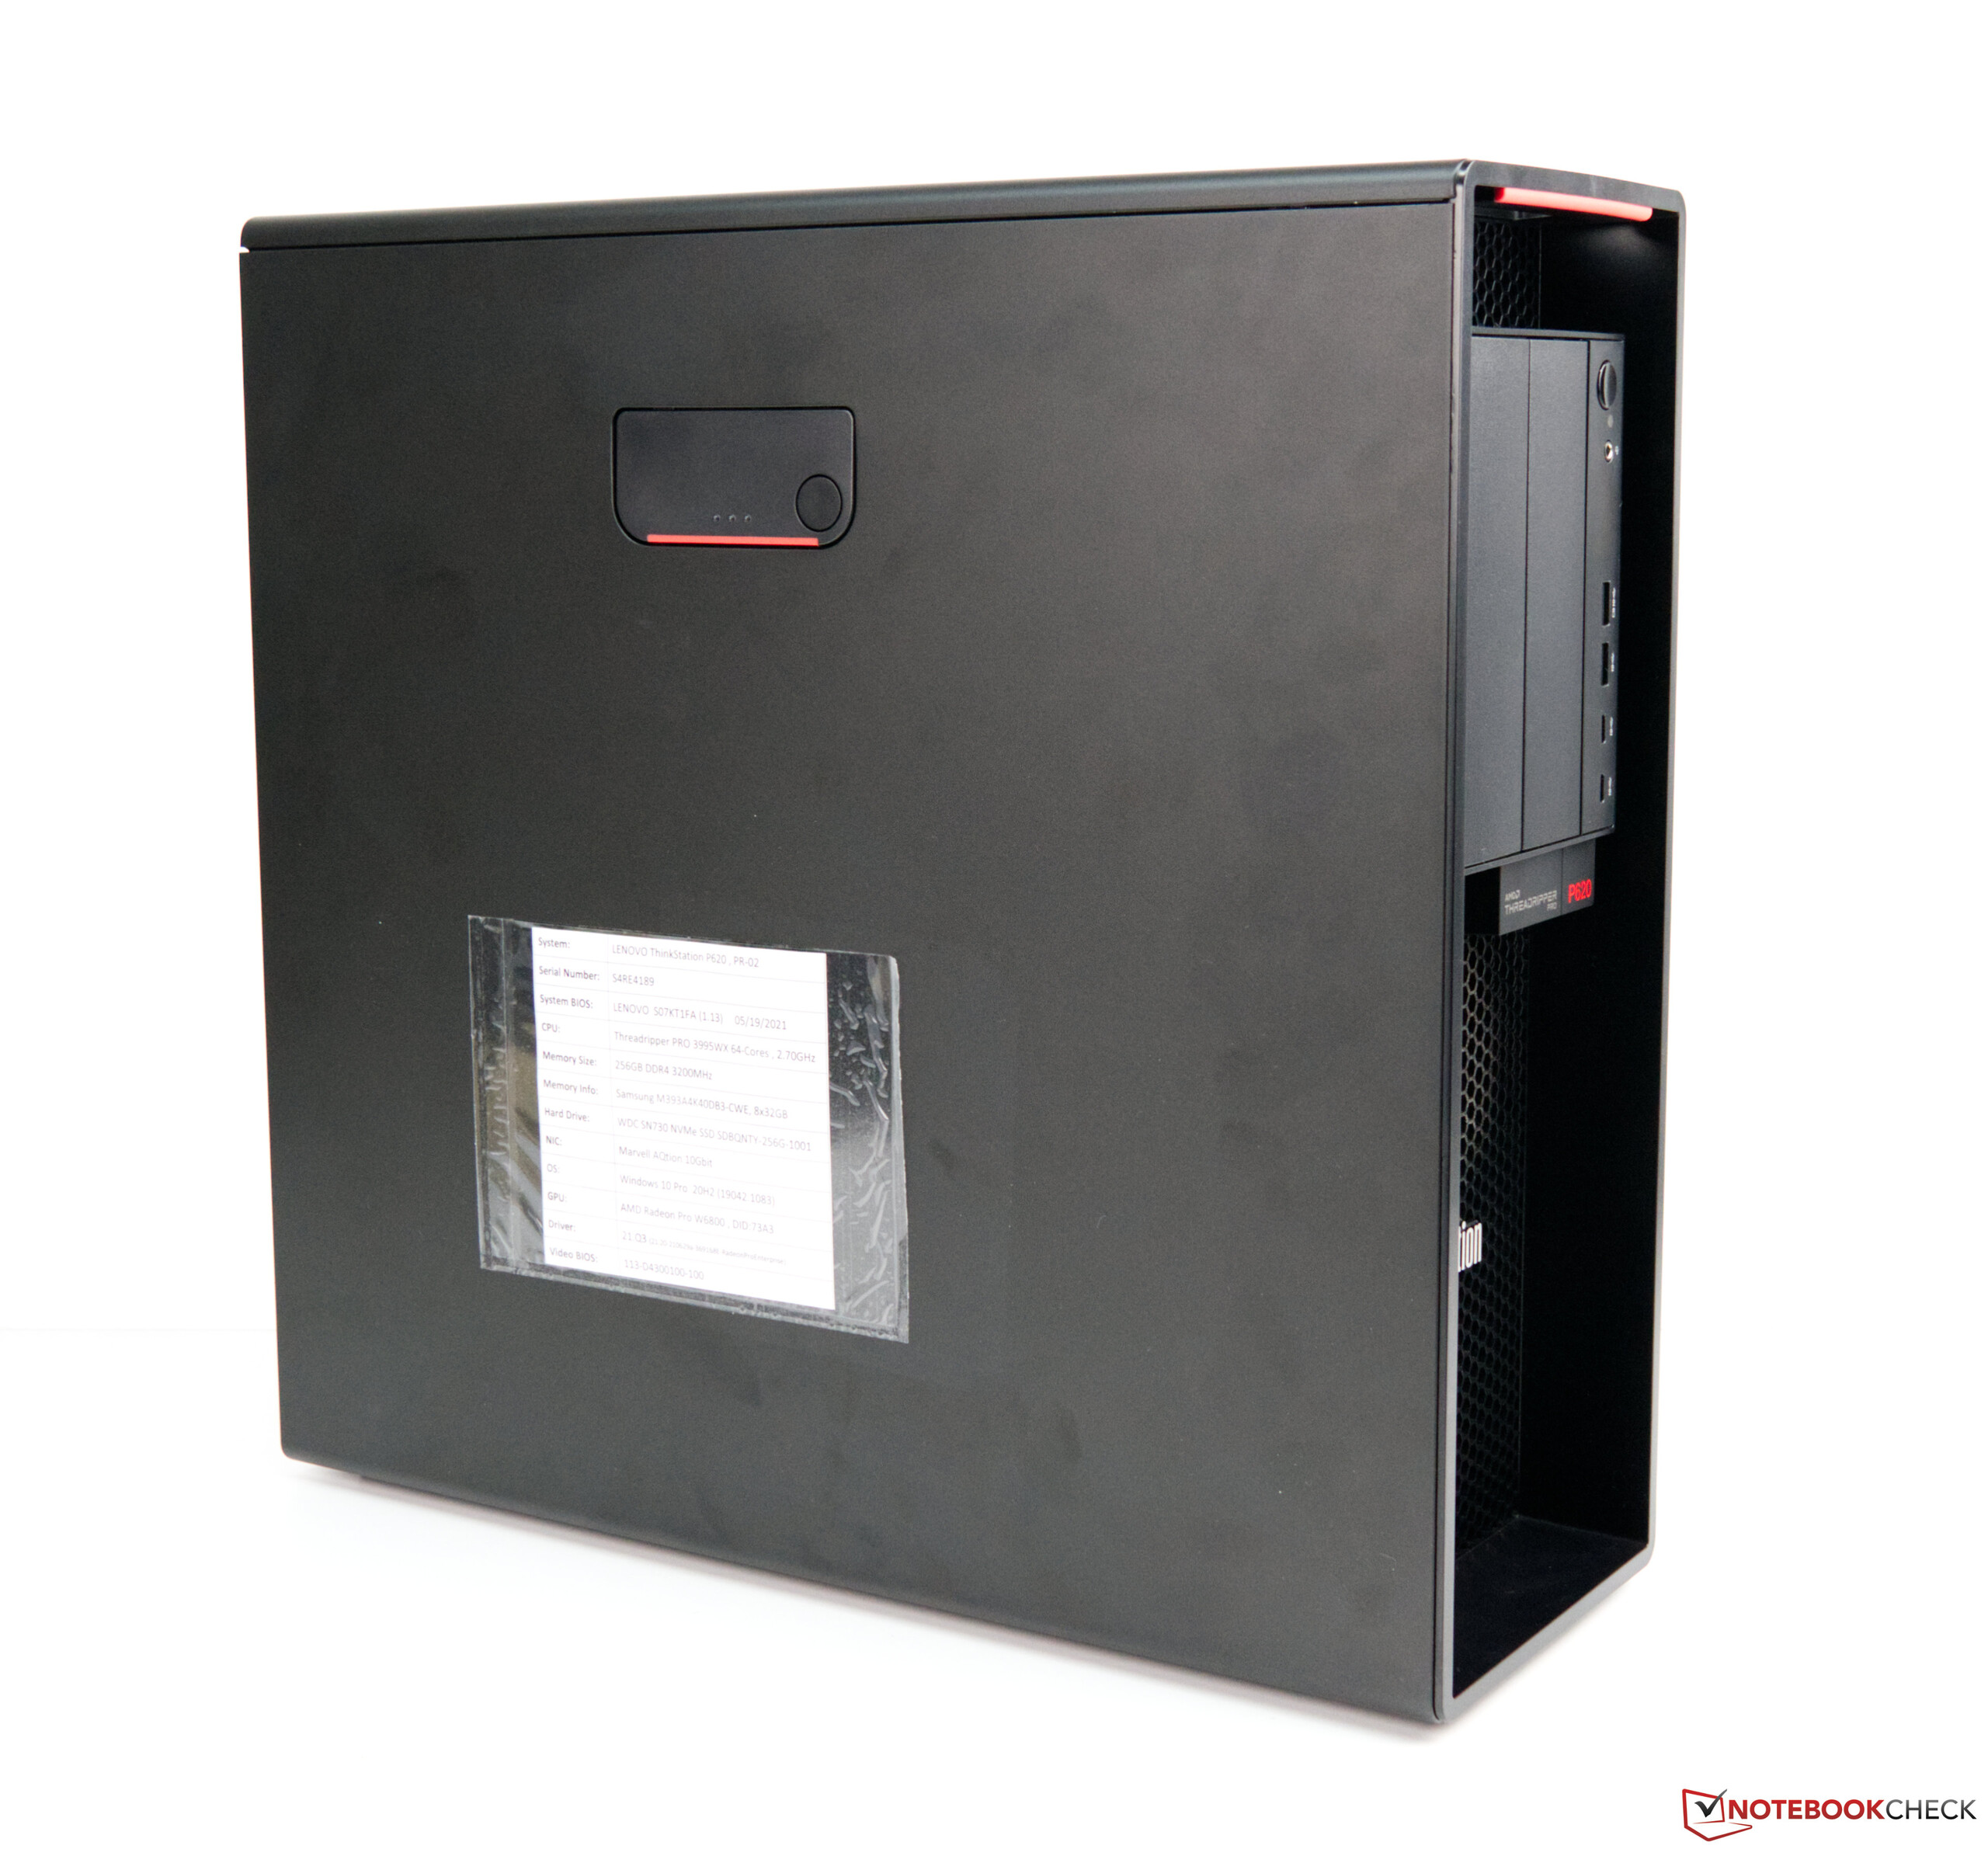
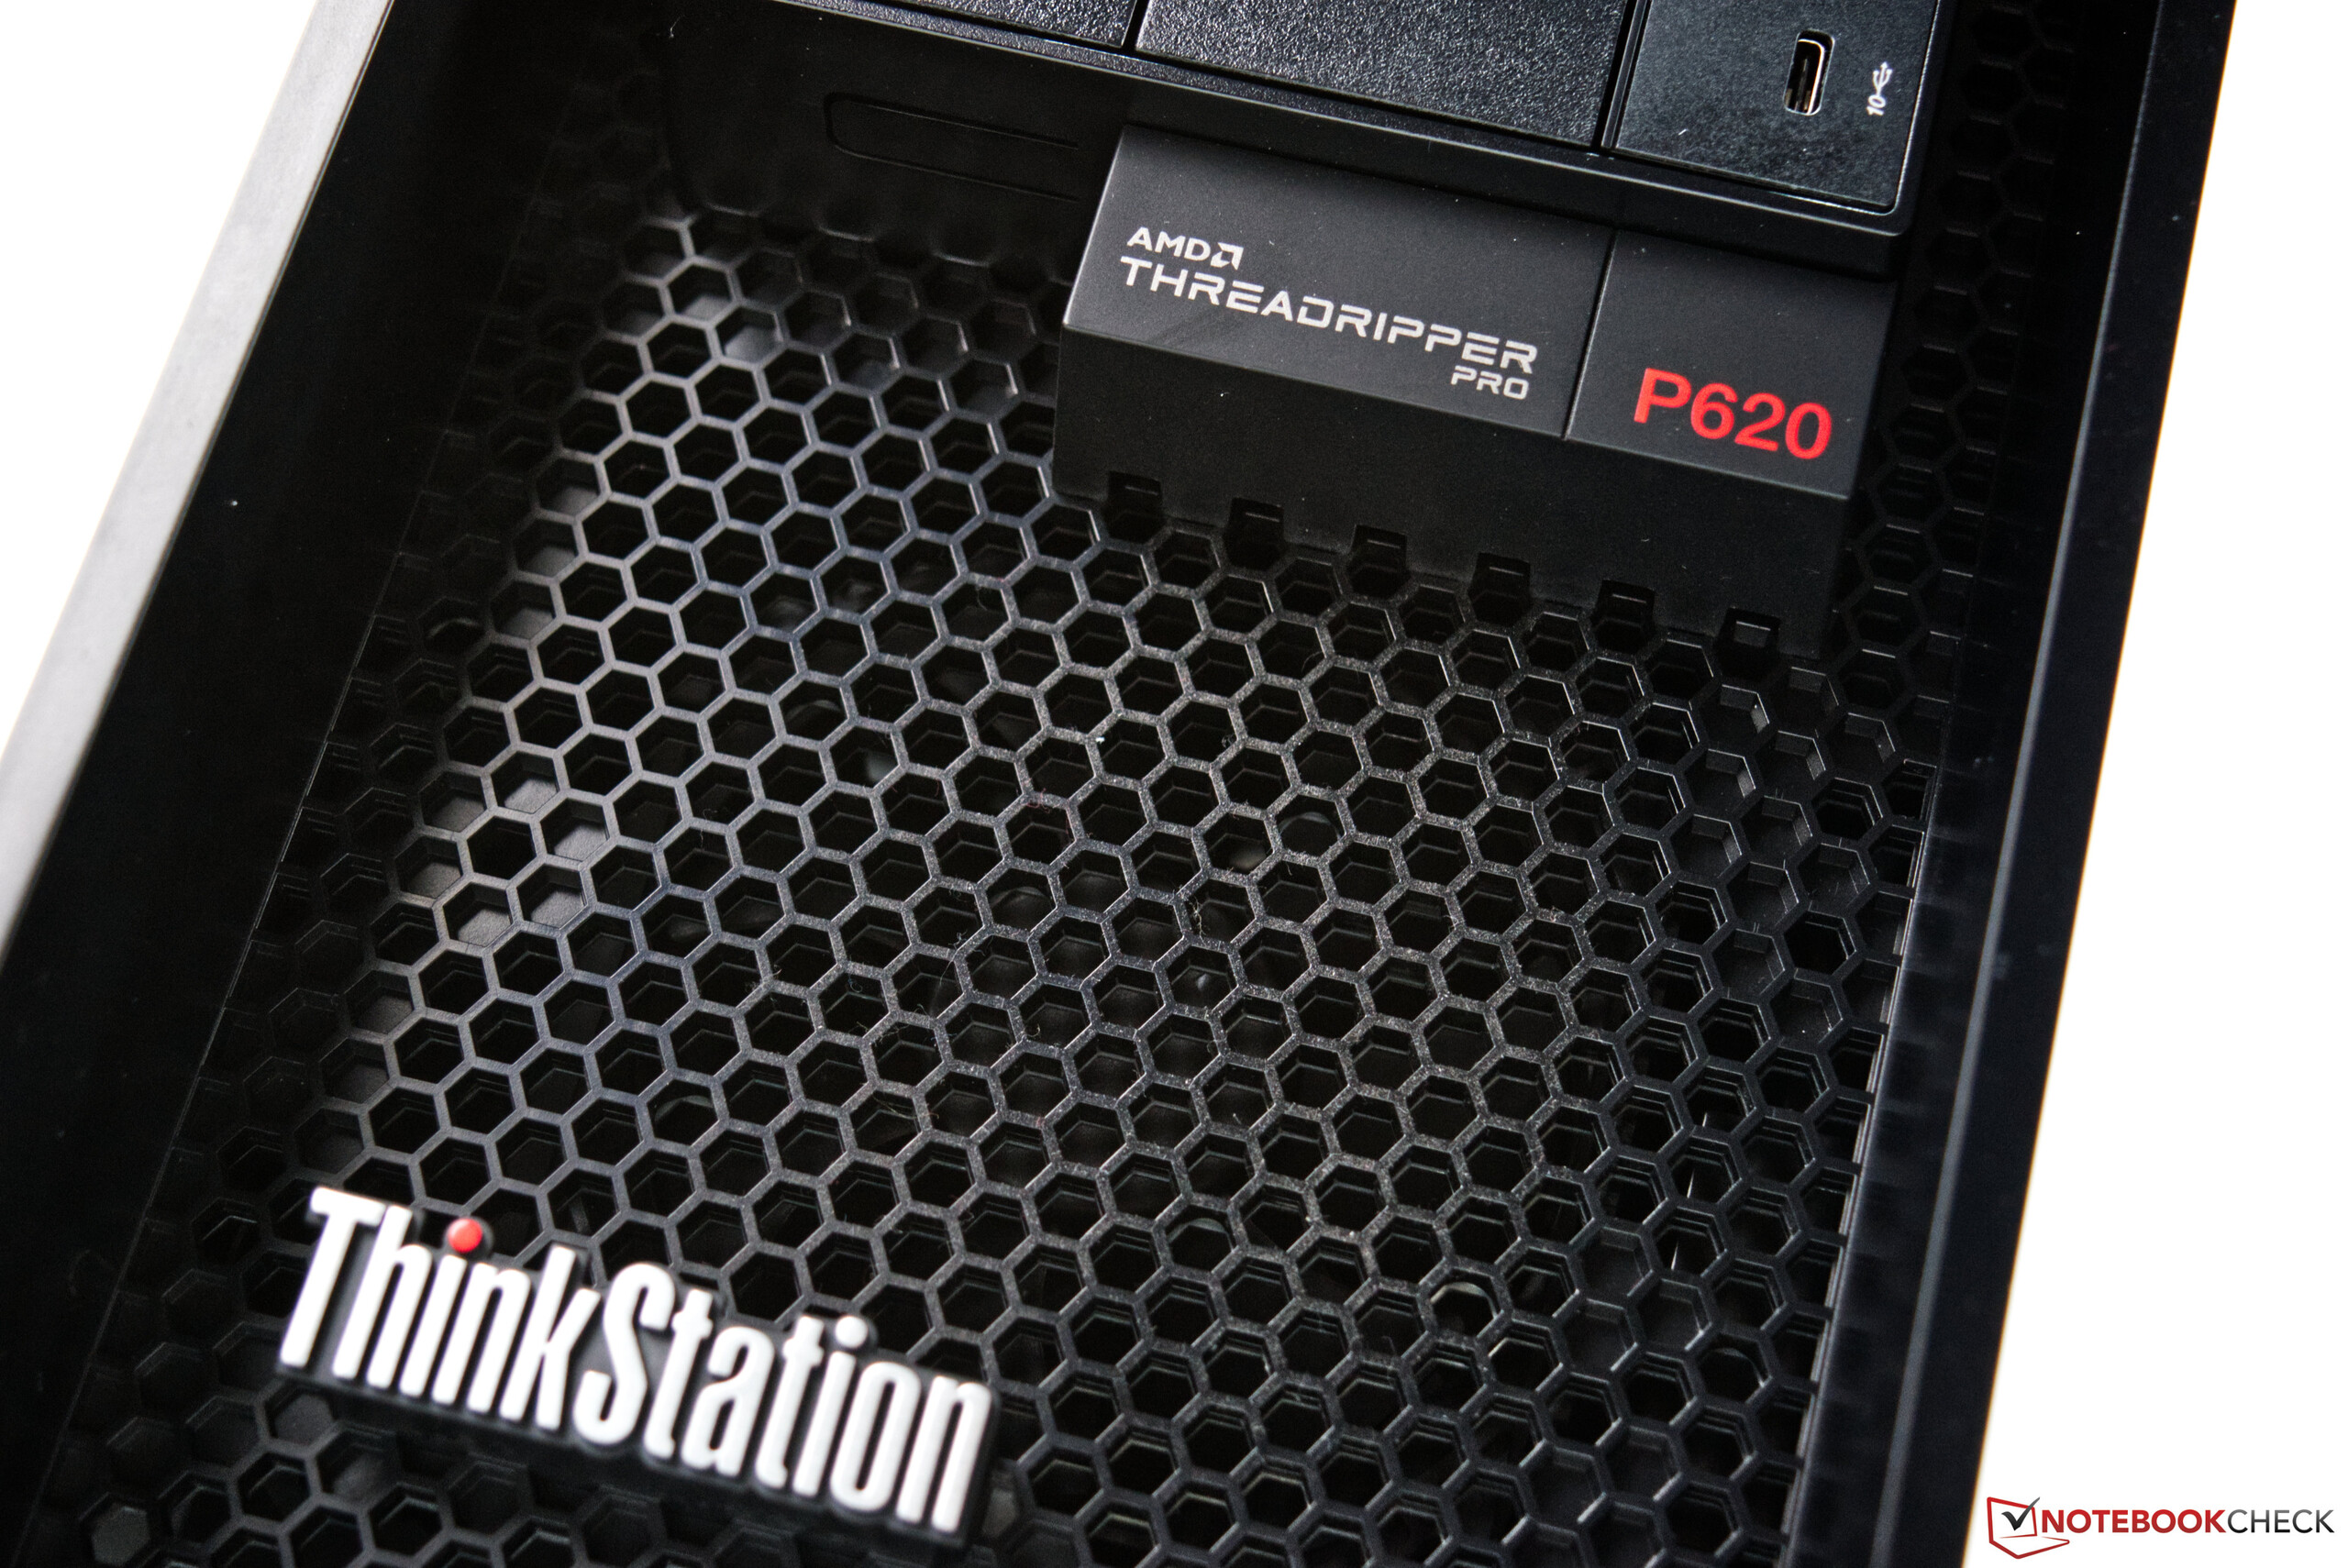
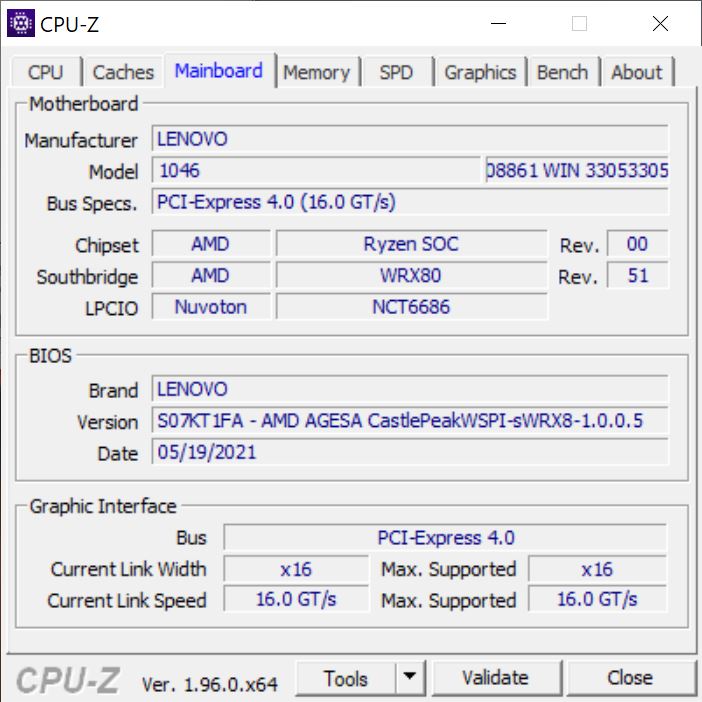
Lenovo has been in the workstation segment for a long time, and it offers a solid platform based on the latest hardware with the ThinkStation P620 series. But the manufacturer doesn't use standard components here. On the contrary, a custom-developed platform is used, which is tailored to the needs of a workstation. In our test sample, the well-designed and modular case is equipped with no less than the most powerful AMD processor at the moment and AMD's latest workstation graphics card.

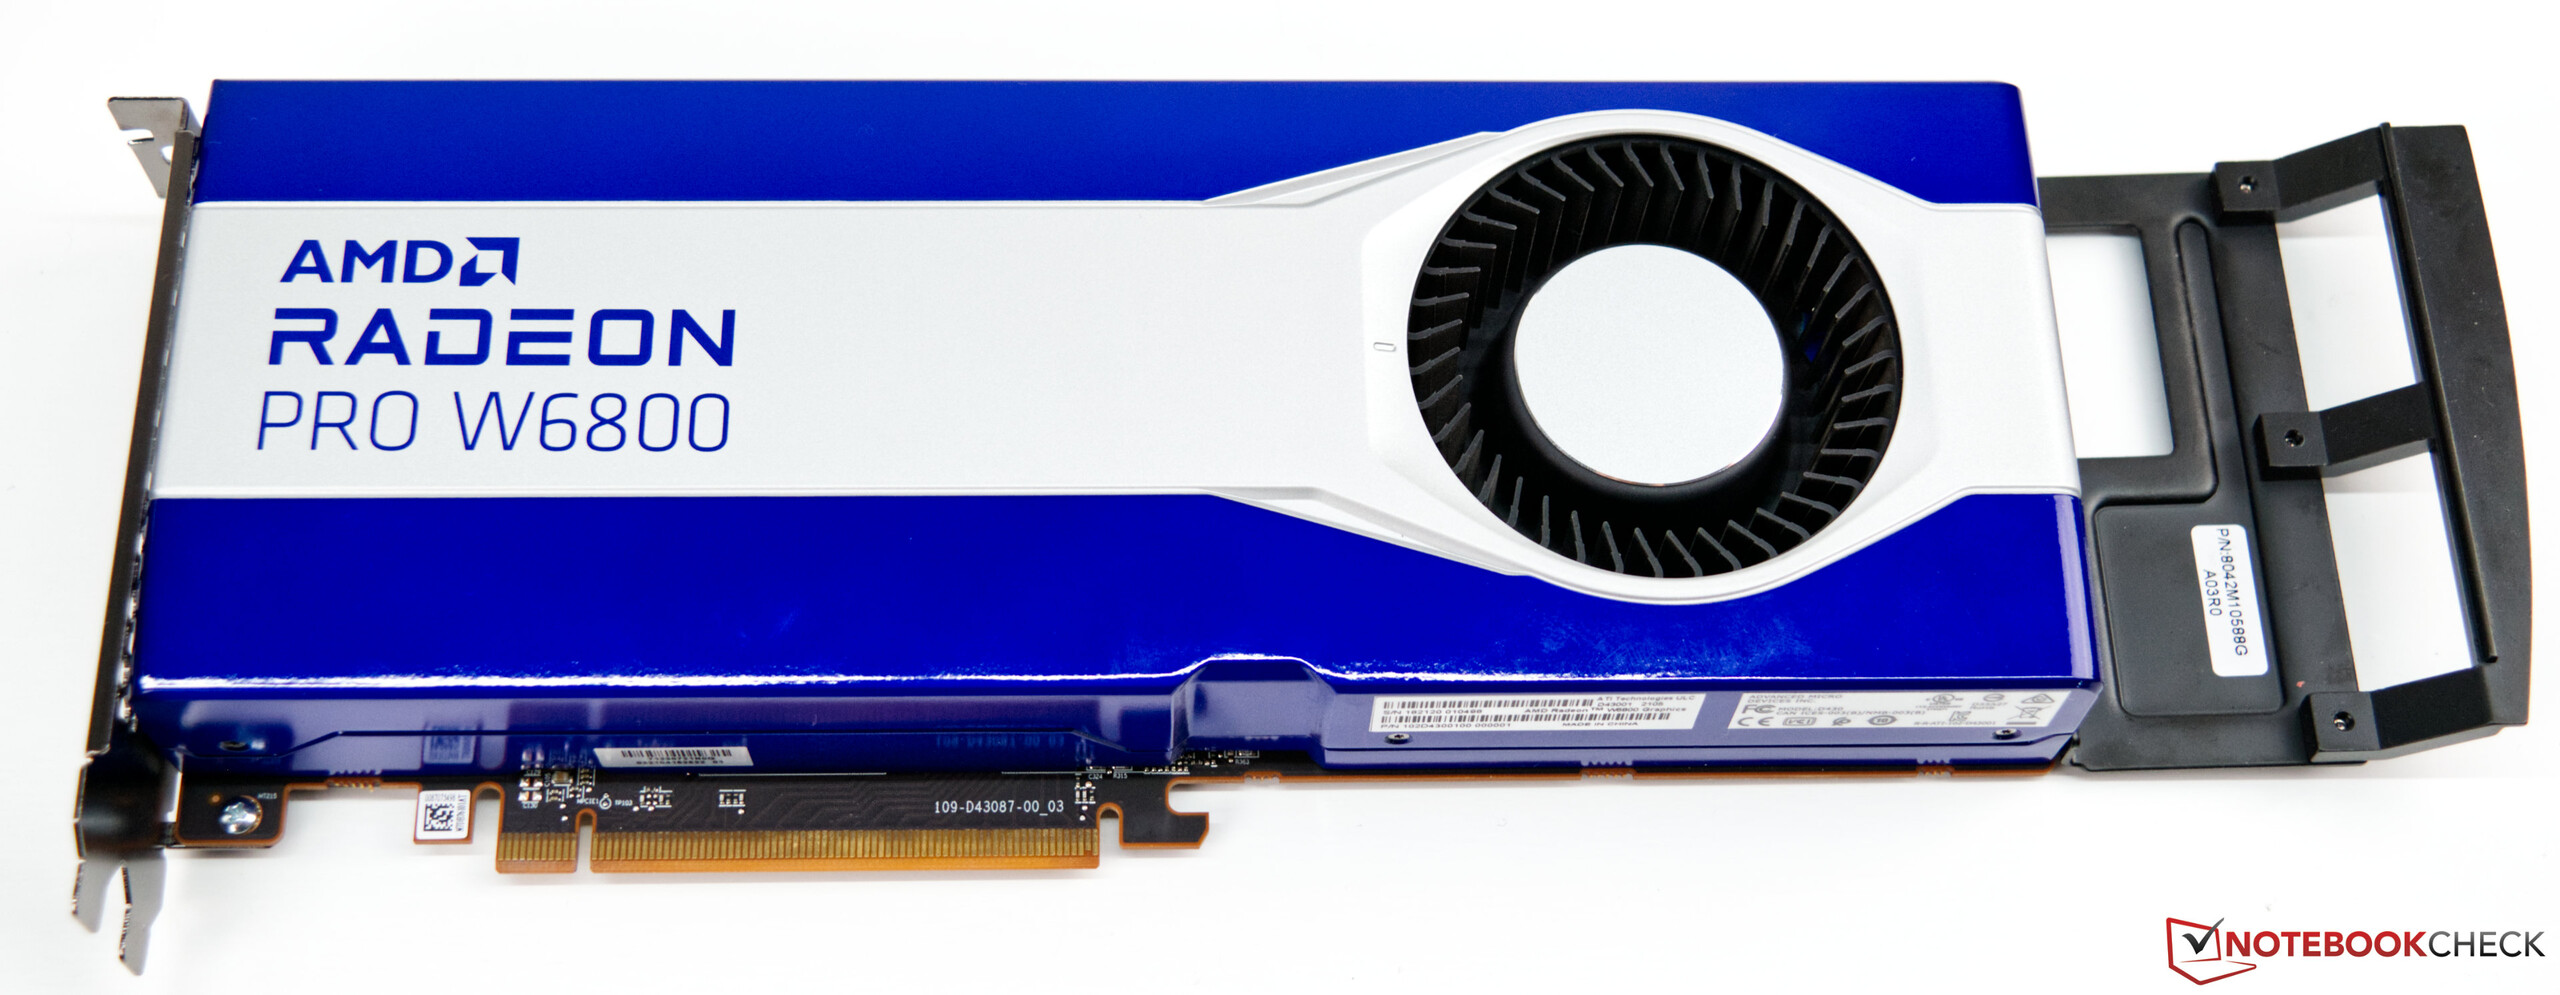
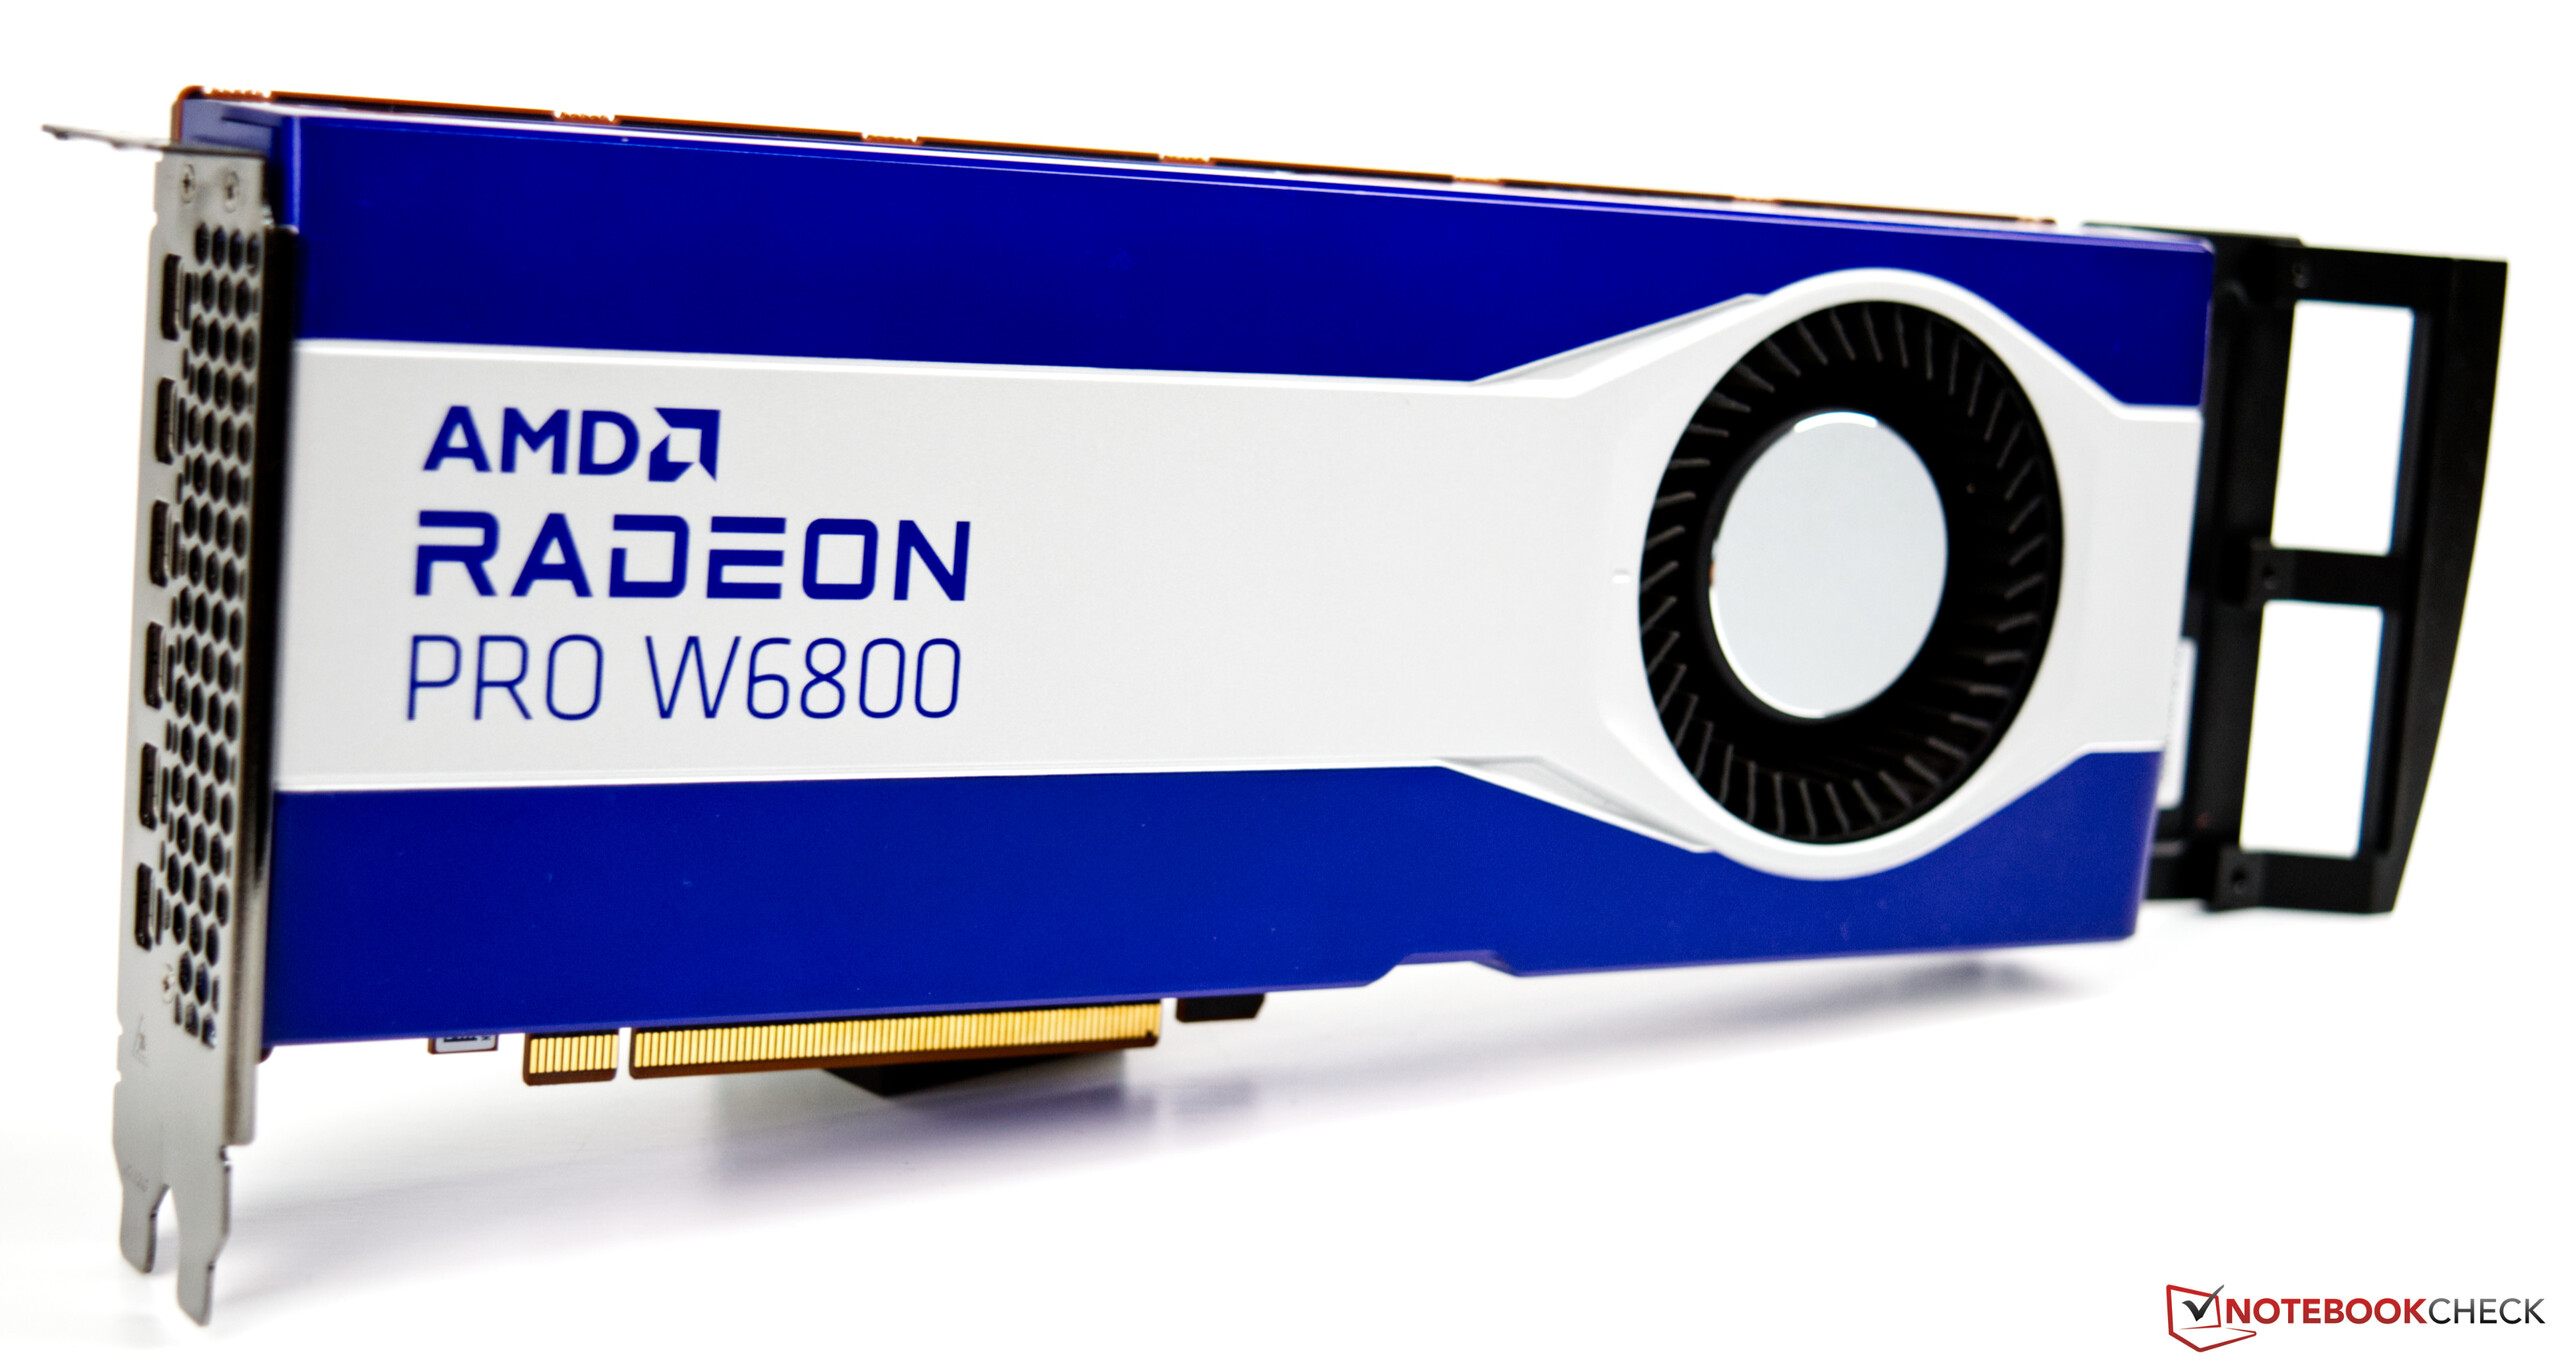
The AMD Ryzen Threadripper Pro 3995WX meets the AMD Radeon Pro W6800

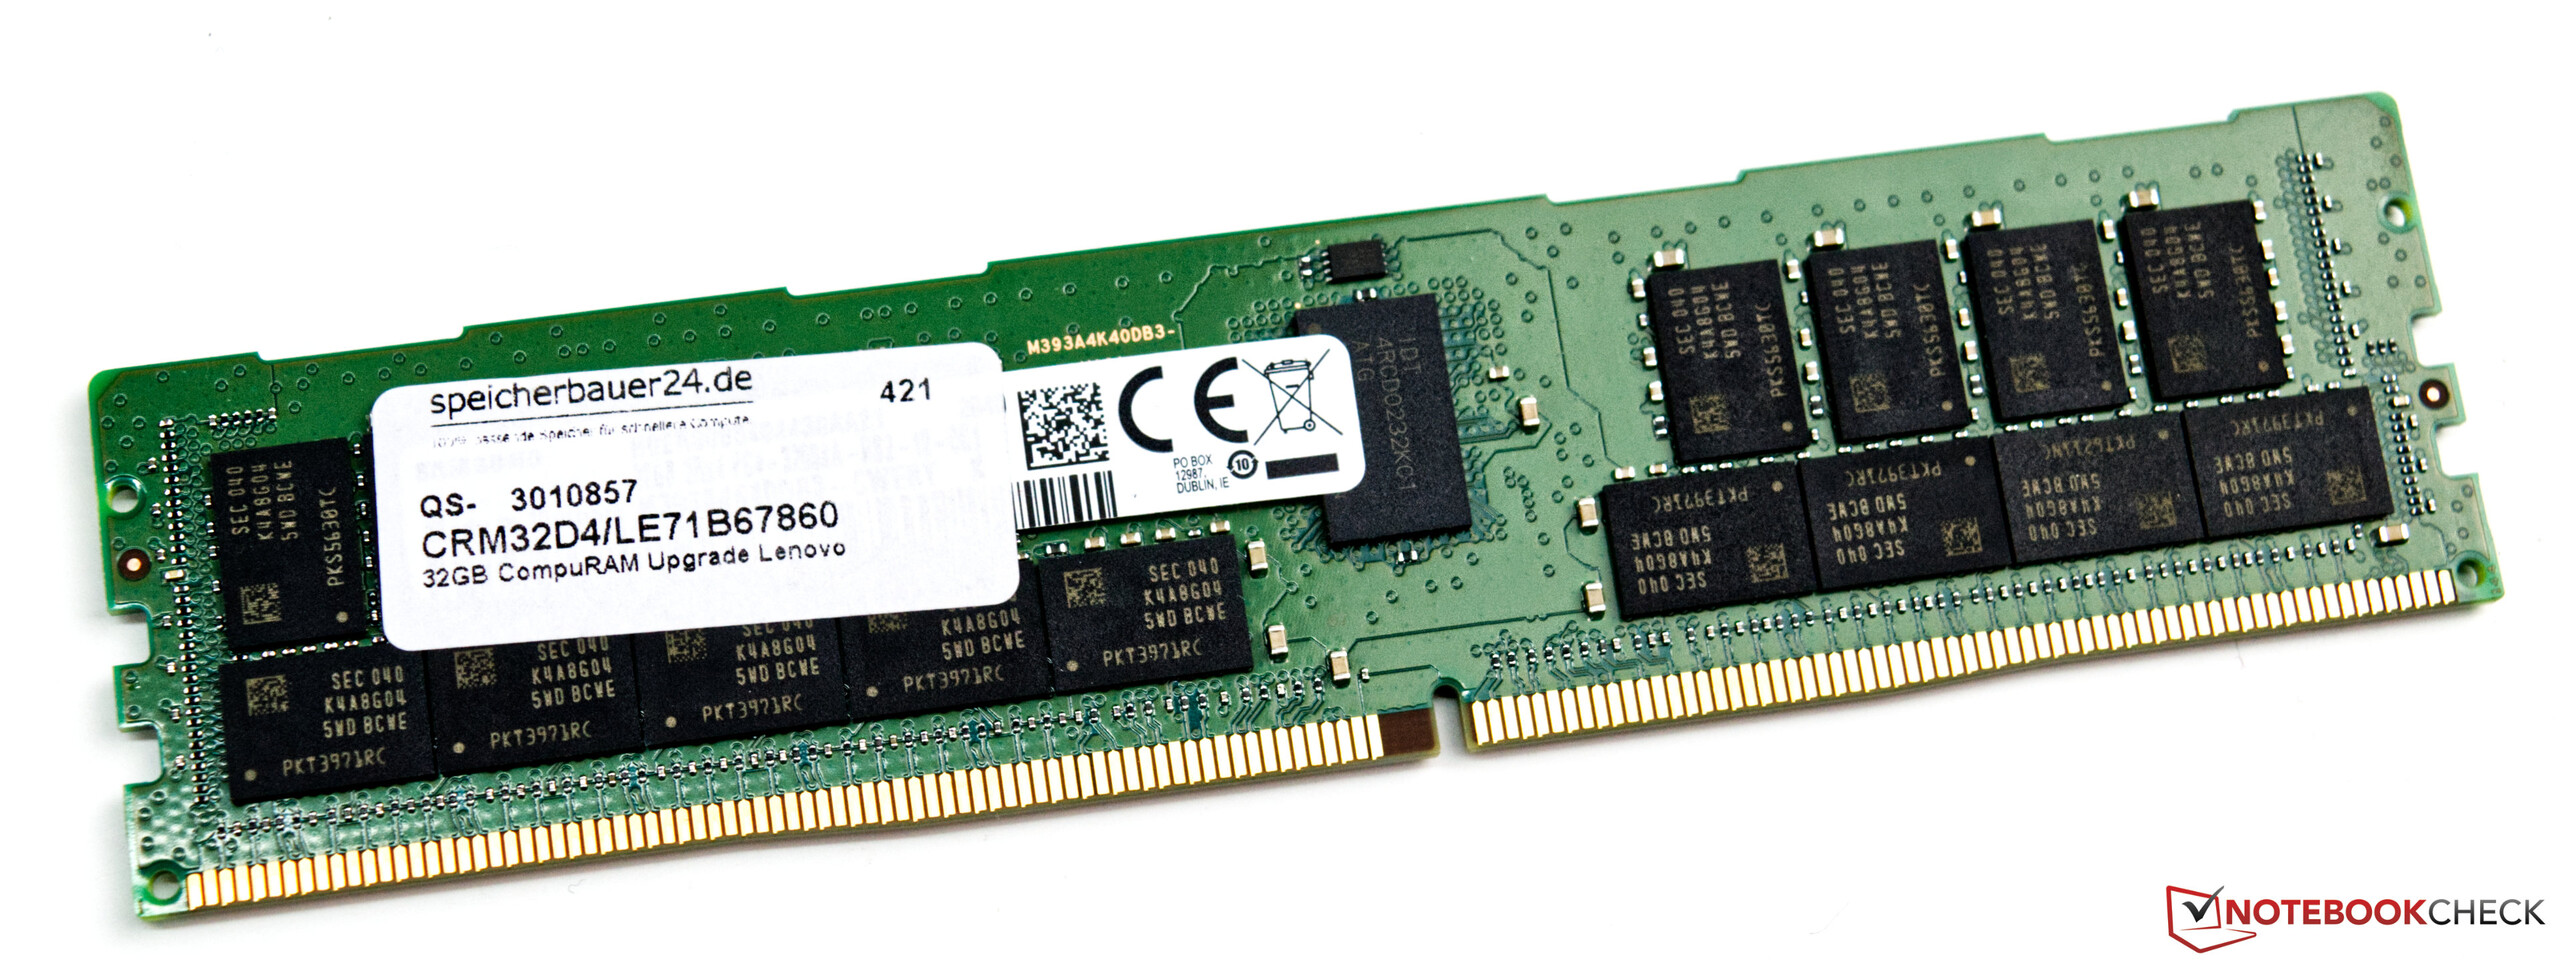
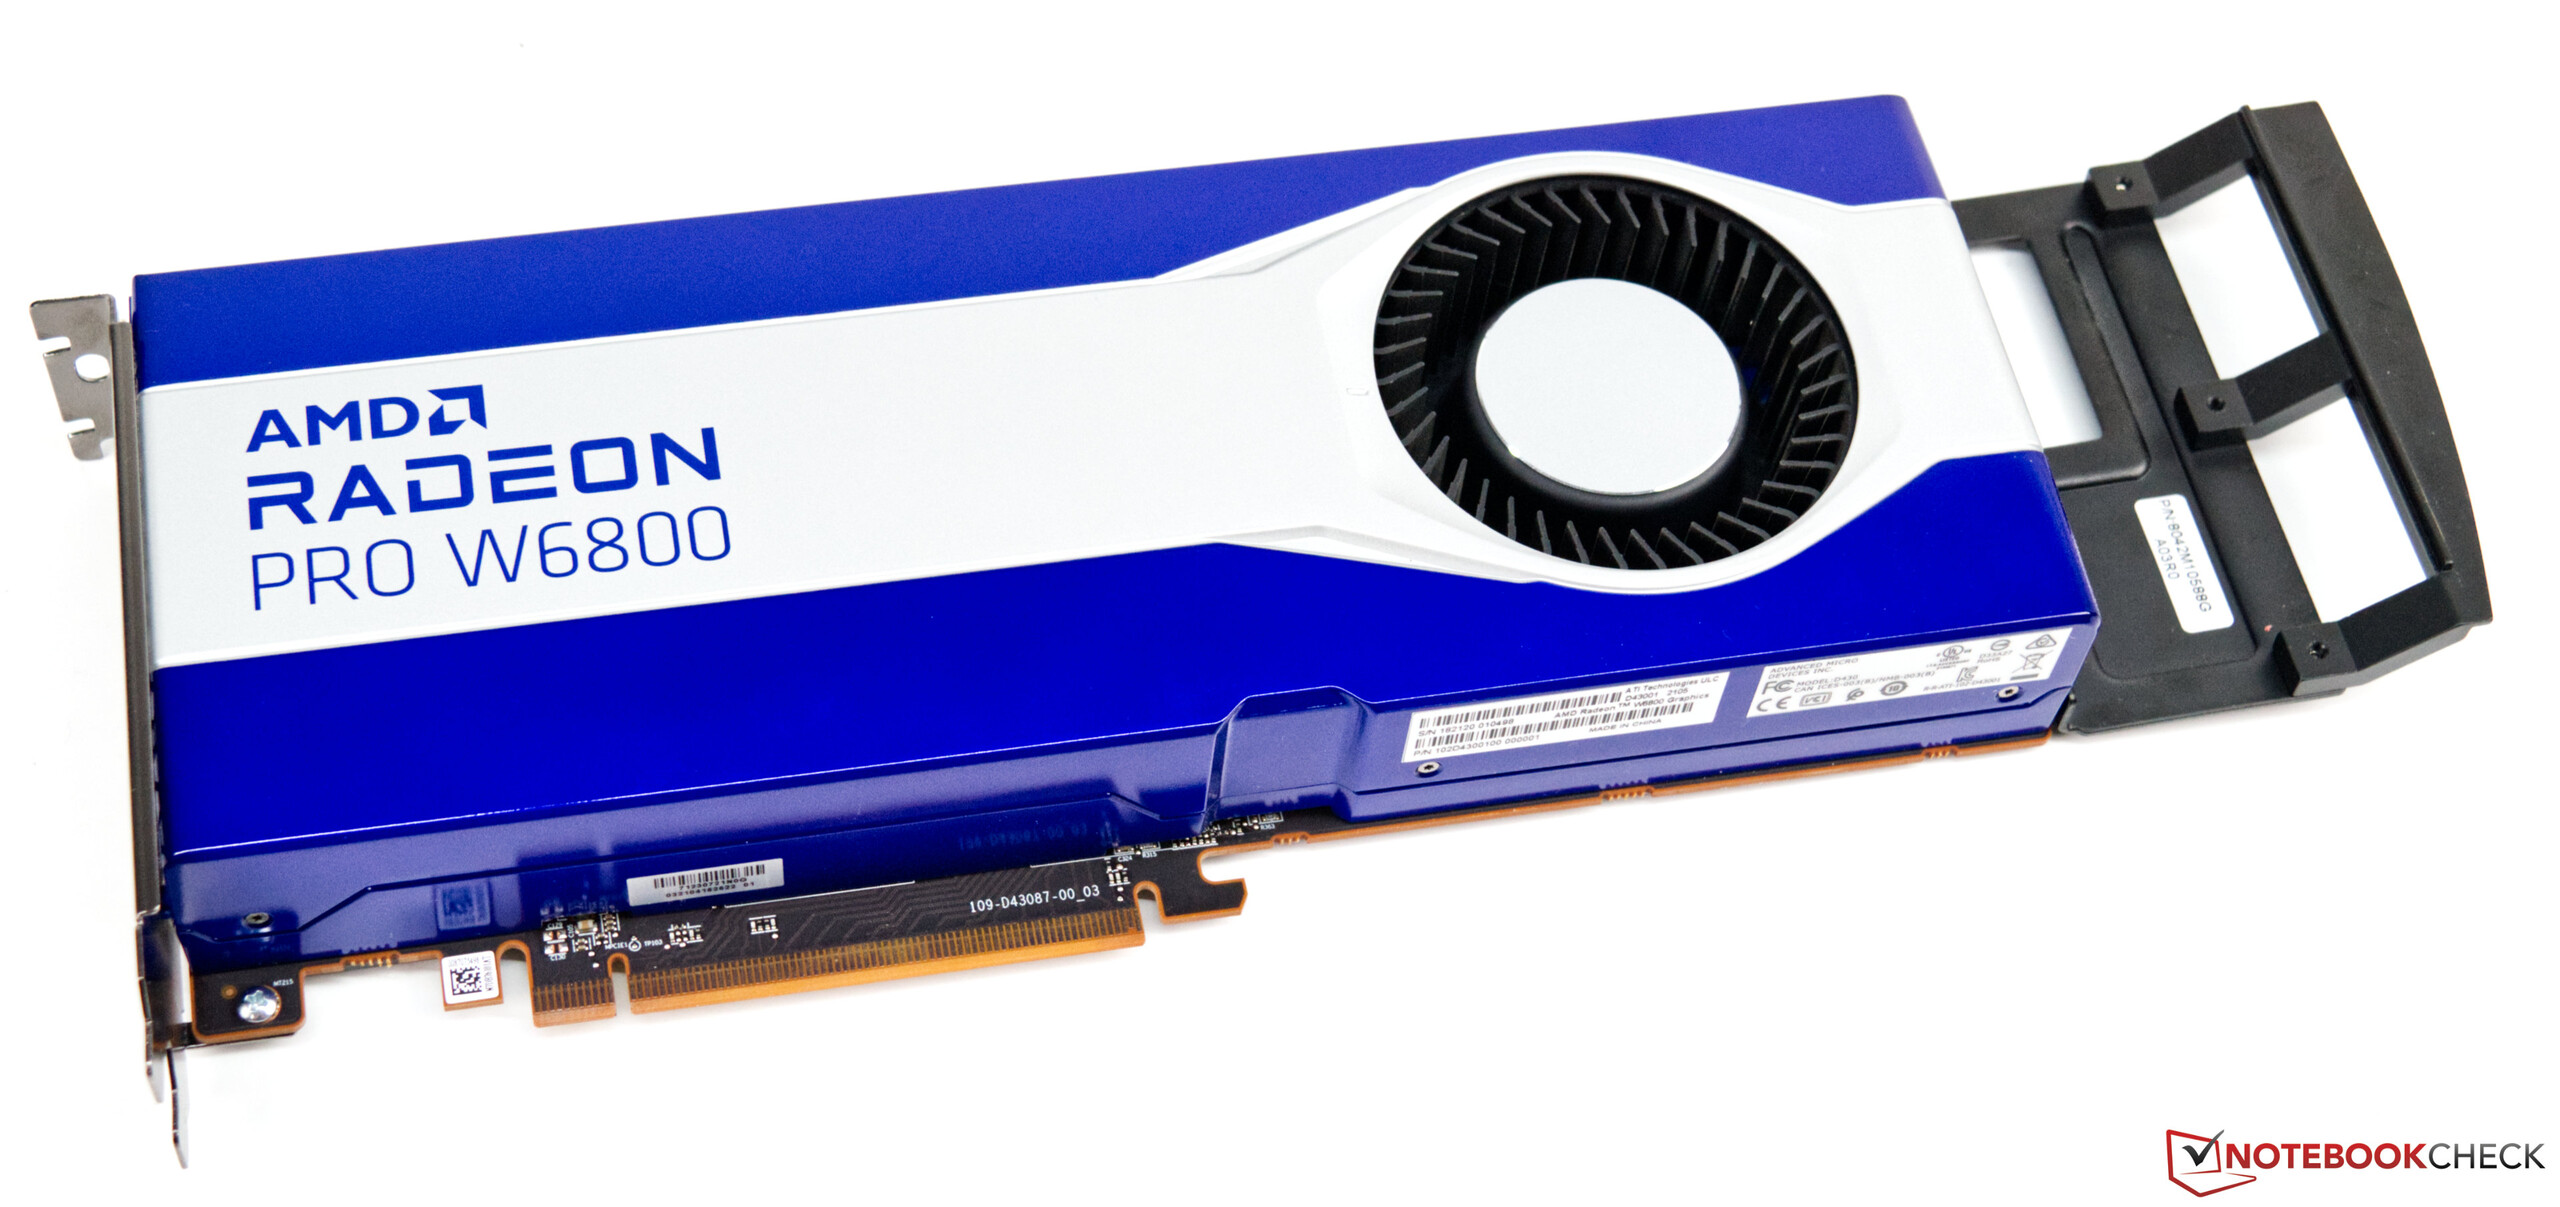
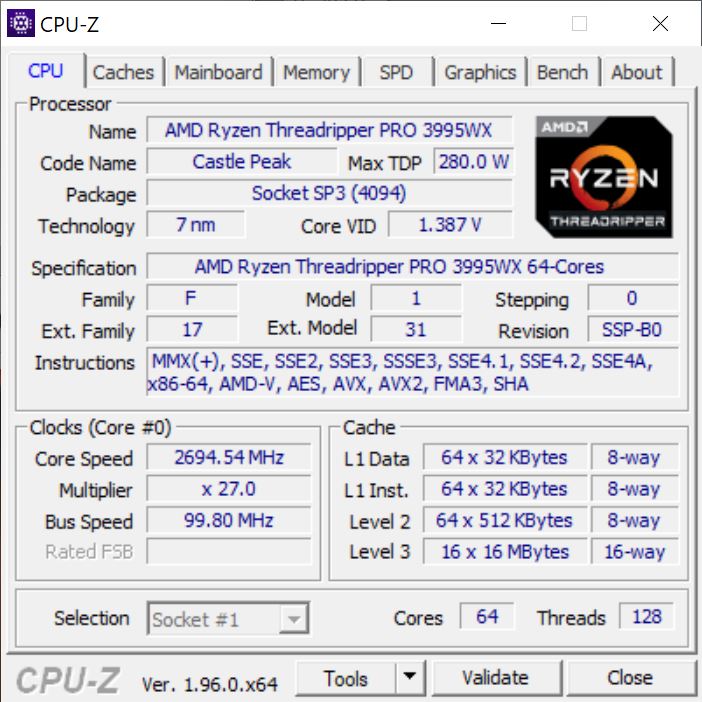
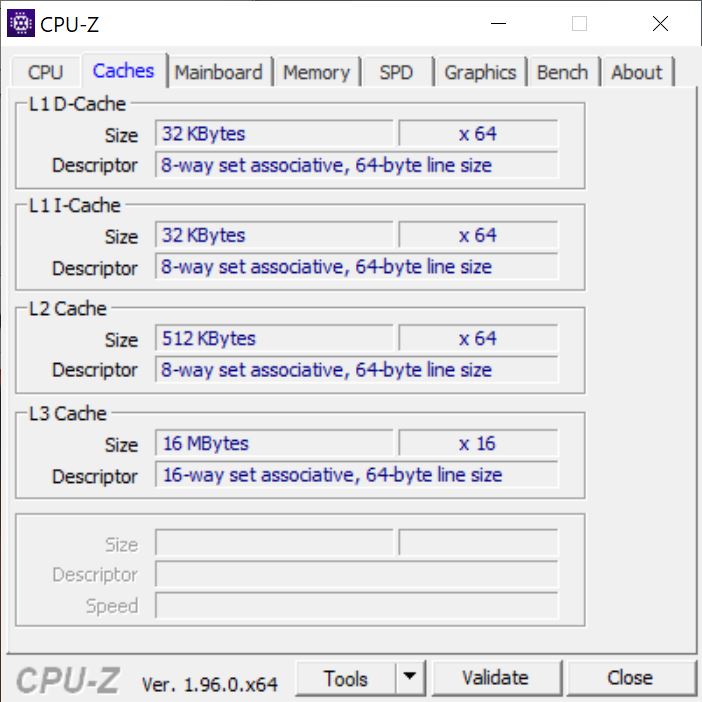
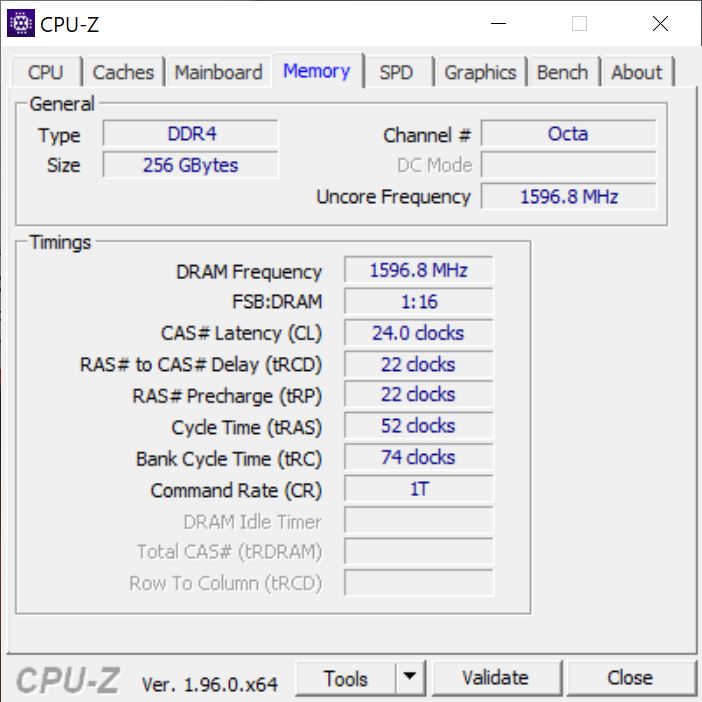
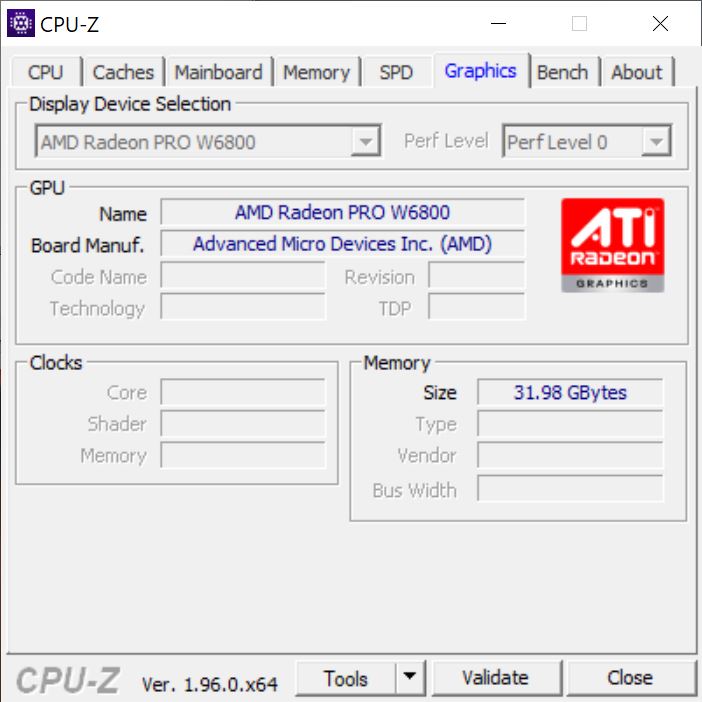
The AMD Ryzen Threadripper Pro 3995WX is a 64-core CPU with a total of 128 threads. The graphics card is the AMD Radeon Pro W6800, which succeeds the AMD Radeon Pro W5700 and is now based on RDNA2 like the current desktop gaming graphics cards. This means that the AMD Radeon Pro W6800 also offers hardware support for real-time ray tracing and can access 32 GB of VRAM. With a whopping 256 GB of DDR4 RAM, even very memory-intensive applications can be mastered without issues, because thanks to the AMD Ryzen Threadripper Pro 3995WX, there's octa-channel support, which leads to very good RAM data transfer rates. At 256 GB, the SSD installed in our test model of the P620 is very small in comparison. It would probably be better to choose the next larger model when selecting a configuration.

Speaking of the chosen configuration: You can customize the Lenovo ThinkStation P620 to your heart's content in Lenovo's online store. The manufacturer offers a variety of options here. However, users who want to buy the device in the version that we're reviewing will have to dig deep into their pockets. The base price (3,179 Euros (~$3,739)) is very far away from the Ultimate configuration: The system used in our review costs around 13,000 Euros (~$15,292).

Lenovo ThinkStation P620 (source: Lenovo)
Lenovo ThinkStation P620
Lenovo ThinkStation P620 - RAM
Lenovo ThinkStation P620 - SSD
Lenovo ThinkStation P620 - PSU
AMD Radeon Pro W6800

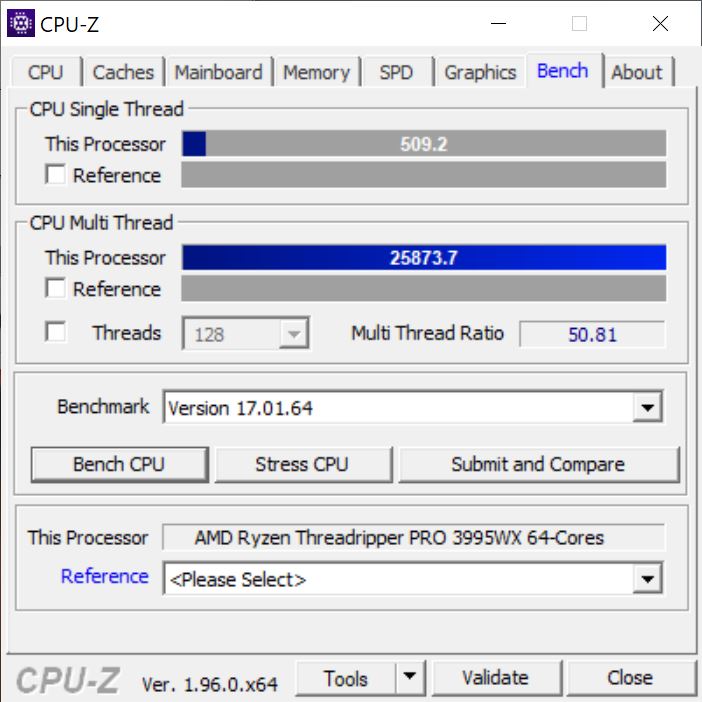
Processor benchmarks - The Threadripper Pro 3995WX is a multi-core monster

The AMD Ryzen Threadripper Pro 3995WX is a real processing monster considering the benchmark results of the multi-core tests. With its 64 cores and a total of 128 threads, the AMD Ryzen Threadripper Pro 3995WX is best suited for applications that use multiple computing cores. This also includes the virtualization of several computers on one system, among other things. With the generous 256 GB of DDR4 RAM, this doesn't pose a big challenge for the flagship. However, the AMD Ryzen Threadripper Pro 3995WX can't take advantage of the latest Zen3 architecture, since eight Matisse dies are installed under the huge heat spreader, which in turn are based on the Zen2 architecture. This also results in the relatively large deficit in the single-core tests compared to the Ryzen processors of the 5000 generation. At the same time, the 64-core CPU's base clock rate of 2.7 GHz is also somewhat more conservative. Nevertheless, our test sample can still compete with the Intel Core i9-10980XE.

For further comparisons and benchmarks, please refer to our CPU Benchmarks article.

CPU-Z
CPU-Z
CPU-Z
CPU-Z
CPU-Z
CPU-Z
Cinebench R20
CPU (Multi Core)
Lenovo ThinkStation P620, AMD Ryzen Threadripper PRO 3995WX
TR Pro 3995WX, 2700 MHz
23571 Points
AMD Ryzen 9 5950X, AMD Ryzen 9 5950X
R9 5950X, 3400 MHz
10482 Points -56%
AMD Threadripper 2970WX, AMD Radeon RX Vega 64, AMD Ryzen Threadripper 2970WX
TR 2970WX, 3000 MHz
10000 Points -58%
Asus X299 Prime Desktop, Intel Core i9-10980XE
i9-10980XE, 3000 MHz
8845 Points -62%
AMD Ryzen 9 5900X, AMD Ryzen 9 5900X
R9 5900X, 3700 MHz
8629 Points -63%
AMD Ryzen Threadripper 2950X (16 core, 32 threads) Review, AMD Ryzen Threadripper 2950X
TR 2950X, 3500 MHz
6950 Points -71%
AMD Radeon RX Vega 64, AMD Ryzen 9 3900X
R9 3900X, 3800 MHz
6910 Points -71%
Intel Core i9-11900K, Intel Core i9-11900K
i9-11900K, 3500 MHz
5997 Points -75%
CPU (Single Core)
Intel Core i9-11900K, Intel Core i9-11900K
i9-11900K, 3500 MHz
647 Points +33%
AMD Ryzen 9 5950X, AMD Ryzen 9 5950X
R9 5950X, 3400 MHz
641 Points +31%
AMD Ryzen 9 5900X, AMD Ryzen 9 5900X
R9 5900X, 3700 MHz
639 Points +31%
AMD Radeon RX Vega 64, AMD Ryzen 9 3900X
R9 3900X, 3800 MHz
514 Points +5%
Lenovo ThinkStation P620, AMD Ryzen Threadripper PRO 3995WX
TR Pro 3995WX, 2700 MHz
488 Points
Asus X299 Prime Desktop, Intel Core i9-10980XE
i9-10980XE, 3000 MHz
487 Points 0%
AMD Ryzen Threadripper 2950X (16 core, 32 threads) Review, AMD Ryzen Threadripper 2950X
TR 2950X, 3500 MHz
445 Points -9%
AMD Threadripper 2970WX, AMD Radeon RX Vega 64, AMD Ryzen Threadripper 2970WX
TR 2970WX, 3000 MHz
430 Points -12%
Cinebench R15
CPU Multi 64Bit
Lenovo ThinkStation P620, AMD Ryzen Threadripper PRO 3995WX
TR Pro 3995WX, 2700 MHz
9706 Points
AMD Ryzen 9 5950X, AMD Ryzen 9 5950X
R9 5950X, 3400 MHz
4492 Points -54%
AMD Threadripper 2970WX, AMD Radeon RX Vega 64, AMD Ryzen Threadripper 2970WX
TR 2970WX, 3000 MHz
4376 Points -55%
AMD Ryzen 9 5900X, AMD Ryzen 9 5900X
R9 5900X, 3700 MHz
3717 Points -62%
Asus X299 Prime Desktop, Intel Core i9-10980XE
i9-10980XE, 3000 MHz
3632 (3541.7min - 3632.07max) Points -63%
AMD Ryzen Threadripper 2950X (16 core, 32 threads) Review, AMD Ryzen Threadripper 2950X
TR 2950X, 3500 MHz
3110 Points -68%
AMD Radeon RX Vega 64, AMD Ryzen 9 3900X
R9 3900X, 3800 MHz
3049 Points -69%
Intel Core i9-11900K, Intel Core i9-11900K
i9-11900K, 3500 MHz
2436 Points -75%
CPU Single 64Bit
AMD Ryzen 9 5950X, AMD Ryzen 9 5950X
R9 5950X, 3400 MHz
272 Points +39%
AMD Ryzen 9 5900X, AMD Ryzen 9 5900X
R9 5900X, 3700 MHz
271 Points +39%
Intel Core i9-11900K, Intel Core i9-11900K
i9-11900K, 3500 MHz
262 Points +34%
AMD Radeon RX Vega 64, AMD Ryzen 9 3900X
R9 3900X, 3800 MHz
209 Points +7%
Asus X299 Prime Desktop, Intel Core i9-10980XE
i9-10980XE, 3000 MHz
208 Points +7%
Lenovo ThinkStation P620, AMD Ryzen Threadripper PRO 3995WX
TR Pro 3995WX, 2700 MHz
195 Points
AMD Ryzen Threadripper 2950X (16 core, 32 threads) Review, AMD Ryzen Threadripper 2950X
TR 2950X, 3500 MHz
176 Points -10%
AMD Threadripper 2970WX, AMD Radeon RX Vega 64, AMD Ryzen Threadripper 2970WX
TR 2970WX, 3000 MHz
173 Points -11%
Cinebench R11.5
CPU Multi 64Bit
Lenovo ThinkStation P620, AMD Ryzen Threadripper PRO 3995WX
TR Pro 3995WX, 2700 MHz
54.3 Points
AMD Ryzen 9 5950X, AMD Ryzen 9 5950X
R9 5950X, 3400 MHz
49.6 Points -9%
AMD Ryzen 9 5900X, AMD Ryzen 9 5900X
R9 5900X, 3700 MHz
41.78 Points -23%
Asus X299 Prime Desktop, Intel Core i9-10980XE
i9-10980XE, 3000 MHz
38.39 Points -29%
AMD Radeon RX Vega 64, AMD Ryzen 9 3900X
R9 3900X, 3800 MHz
33.44 Points -38%
AMD Ryzen Threadripper 2950X (16 core, 32 threads) Review, AMD Ryzen Threadripper 2950X
TR 2950X, 3500 MHz
27.07 Points -50%
Intel Core i9-11900K, Intel Core i9-11900K
i9-11900K, 3500 MHz
26.76 Points -51%
AMD Threadripper 2970WX, AMD Radeon RX Vega 64, AMD Ryzen Threadripper 2970WX
TR 2970WX, 3000 MHz
21.6 Points -60%
CPU Single 64Bit
AMD Ryzen 9 5900X, AMD Ryzen 9 5900X
R9 5900X, 3700 MHz
3.14 Points +48%
AMD Ryzen 9 5950X, AMD Ryzen 9 5950X
R9 5950X, 3400 MHz
3.14 Points +48%
Intel Core i9-11900K, Intel Core i9-11900K
i9-11900K, 3500 MHz
3.1 Points +46%
AMD Radeon RX Vega 64, AMD Ryzen 9 3900X
R9 3900X, 3800 MHz
2.36 Points +11%
Asus X299 Prime Desktop, Intel Core i9-10980XE
i9-10980XE, 3000 MHz
2.36 Points +11%
Lenovo ThinkStation P620, AMD Ryzen Threadripper PRO 3995WX
TR Pro 3995WX, 2700 MHz
2.12 Points
AMD Ryzen Threadripper 2950X (16 core, 32 threads) Review, AMD Ryzen Threadripper 2950X
TR 2950X, 3500 MHz
1.9 Points -10%
AMD Threadripper 2970WX, AMD Radeon RX Vega 64, AMD Ryzen Threadripper 2970WX
TR 2970WX, 3000 MHz
1.9 Points -10%
Cinebench R10
Rendering Multiple CPUs 64Bit
AMD Ryzen 9 5950X, AMD Ryzen 9 5950X
R9 5950X, 3400 MHz
104638 Points +22%
AMD Ryzen 9 5900X, AMD Ryzen 9 5900X
R9 5900X, 3700 MHz
99651 Points +16%
Lenovo ThinkStation P620, AMD Ryzen Threadripper PRO 3995WX
TR Pro 3995WX, 2700 MHz
85956 Points
Intel Core i9-11900K, Intel Core i9-11900K
i9-11900K, 3500 MHz
80613 Points -6%
AMD Ryzen Threadripper 2950X (16 core, 32 threads) Review, AMD Ryzen Threadripper 2950X
TR 2950X, 3500 MHz
76051 Points -12%
AMD Radeon RX Vega 64, AMD Ryzen 9 3900X
R9 3900X, 3800 MHz
76051 Points -12%
AMD Threadripper 2970WX, AMD Radeon RX Vega 64, AMD Ryzen Threadripper 2970WX
TR 2970WX, 3000 MHz
63266 Points -26%
Rendering Single CPUs 64Bit
Intel Core i9-11900K, Intel Core i9-11900K
i9-11900K, 3500 MHz
14149 Points +43%
AMD Ryzen 9 5950X, AMD Ryzen 9 5950X
R9 5950X, 3400 MHz
13279 Points +34%
AMD Ryzen 9 5900X, AMD Ryzen 9 5900X
R9 5900X, 3700 MHz
12739 Points +29%
AMD Radeon RX Vega 64, AMD Ryzen 9 3900X
R9 3900X, 3800 MHz
10352 Points +5%
Lenovo ThinkStation P620, AMD Ryzen Threadripper PRO 3995WX
TR Pro 3995WX, 2700 MHz
9892 Points
AMD Threadripper 2970WX, AMD Radeon RX Vega 64, AMD Ryzen Threadripper 2970WX
TR 2970WX, 3000 MHz
8763 Points -11%
AMD Ryzen Threadripper 2950X (16 core, 32 threads) Review, AMD Ryzen Threadripper 2950X
TR 2950X, 3500 MHz
8678 Points -12%
Blender - v2.79 BMW27 CPU
Intel Core i9-11900K, Intel Core i9-11900K
i9-11900K, 3500 MHz
190.3 Seconds * -298%
AMD Radeon RX Vega 64, AMD Ryzen 9 3900X
R9 3900X, 3800 MHz
162.3 Seconds * -240%
AMD Ryzen Threadripper 2950X (16 core, 32 threads) Review, AMD Ryzen Threadripper 2950X
TR 2950X, 3500 MHz
152.7 Seconds * -219%
AMD Ryzen 9 5900X, AMD Ryzen 9 5900X
R9 5900X, 3700 MHz
141 Seconds * -195%
Asus X299 Prime Desktop, Intel Core i9-10980XE
i9-10980XE, 3000 MHz
125 Seconds * -162%
AMD Ryzen 9 5950X, AMD Ryzen 9 5950X
R9 5950X, 3400 MHz
112.8 Seconds * -136%
AMD Threadripper 2970WX, AMD Radeon RX Vega 64, AMD Ryzen Threadripper 2970WX
TR 2970WX, 3000 MHz
110.7 Seconds * -132%
Lenovo ThinkStation P620, AMD Ryzen Threadripper PRO 3995WX
TR Pro 3995WX, 2700 MHz
47.8 Seconds *
wPrime 2.10
32m
Lenovo ThinkStation P620, AMD Ryzen Threadripper PRO 3995WX
TR Pro 3995WX, 2700 MHz
6.109 s *
AMD Ryzen Threadripper 2950X (16 core, 32 threads) Review, AMD Ryzen Threadripper 2950X
TR 2950X, 3500 MHz
4.186 s * +31%
AMD Threadripper 2970WX, AMD Radeon RX Vega 64, AMD Ryzen Threadripper 2970WX
TR 2970WX, 3000 MHz
4.156 s * +32%
Intel Core i9-11900K, Intel Core i9-11900K
i9-11900K, 3500 MHz
3.982 s * +35%
Asus X299 Prime Desktop, Intel Core i9-10980XE
i9-10980XE, 3000 MHz
2.81 s * +54%
AMD Radeon RX Vega 64, AMD Ryzen 9 3900X
R9 3900X, 3800 MHz
2.564 s * +58%
AMD Ryzen 9 5950X, AMD Ryzen 9 5950X
R9 5950X, 3400 MHz
2.538 s * +58%
1024m
Intel Core i9-11900K, Intel Core i9-11900K
i9-11900K, 3500 MHz
77.9 s * -207%
AMD Ryzen 9 5950X, AMD Ryzen 9 5950X
R9 5950X, 3400 MHz
64.9 s * -155%
AMD Radeon RX Vega 64, AMD Ryzen 9 3900X
R9 3900X, 3800 MHz
57.5 s * -126%
AMD Ryzen Threadripper 2950X (16 core, 32 threads) Review, AMD Ryzen Threadripper 2950X
TR 2950X, 3500 MHz
53.2 s * -109%
Asus X299 Prime Desktop, Intel Core i9-10980XE
i9-10980XE, 3000 MHz
47.4 s * -87%
AMD Threadripper 2970WX, AMD Radeon RX Vega 64, AMD Ryzen Threadripper 2970WX
TR 2970WX, 3000 MHz
38.49 s * -51%
Lenovo ThinkStation P620, AMD Ryzen Threadripper PRO 3995WX
TR Pro 3995WX, 2700 MHz
25.41 s *
X264 HD Benchmark 4.0
Pass 1
AMD Ryzen 9 5950X, AMD Ryzen 9 5950X
R9 5950X, 3400 MHz
338.5 (337min - 340max) fps +28%
AMD Ryzen 9 5900X, AMD Ryzen 9 5900X
R9 5900X, 3700 MHz
335 (325min - 337max) fps +27%
Intel Core i9-11900K, Intel Core i9-11900K
i9-11900K, 3500 MHz
309.5 (308min - 311max) fps +17%
AMD Radeon RX Vega 64, AMD Ryzen 9 3900X
R9 3900X, 3800 MHz
267.5 (266min - 268max) fps +1%
Lenovo ThinkStation P620, AMD Ryzen Threadripper PRO 3995WX
TR Pro 3995WX, 2700 MHz
264 (261min - 266max) fps
Asus X299 Prime Desktop, Intel Core i9-10980XE
i9-10980XE, 3000 MHz
215 (214min - 216max) fps -19%
AMD Ryzen Threadripper 2950X (16 core, 32 threads) Review, AMD Ryzen Threadripper 2950X
TR 2950X, 3500 MHz
202.3 (200.47min - 203.47max) fps -23%
AMD Threadripper 2970WX, AMD Radeon RX Vega 64, AMD Ryzen Threadripper 2970WX
TR 2970WX, 3000 MHz
202 (198min - 202max) fps -23%
Pass 2
AMD Ryzen 9 5950X, AMD Ryzen 9 5950X
R9 5950X, 3400 MHz
221 (220min - 221max) fps +15%
Lenovo ThinkStation P620, AMD Ryzen Threadripper PRO 3995WX
TR Pro 3995WX, 2700 MHz
192.5 (192min - 195max) fps
AMD Ryzen 9 5900X, AMD Ryzen 9 5900X
R9 5900X, 3700 MHz
191 (190min - 192max) fps -1%
Asus X299 Prime Desktop, Intel Core i9-10980XE
i9-10980XE, 3000 MHz
157.5 (155min - 159max) fps -18%
AMD Radeon RX Vega 64, AMD Ryzen 9 3900X
R9 3900X, 3800 MHz
147 (147min - 148max) fps -24%
AMD Ryzen Threadripper 2950X (16 core, 32 threads) Review, AMD Ryzen Threadripper 2950X
TR 2950X, 3500 MHz
144.9 (143.48min - 145.54max) fps -25%
Intel Core i9-11900K, Intel Core i9-11900K
i9-11900K, 3500 MHz
137 (137min - 137max) fps -29%
AMD Threadripper 2970WX, AMD Radeon RX Vega 64, AMD Ryzen Threadripper 2970WX
TR 2970WX, 3000 MHz
116.5 (115min - 117max) fps -39%
WinRAR - Result
AMD Ryzen 9 5900X, AMD Ryzen 9 5900X
R9 5900X, 3700 MHz
13361 KB/s +100%
AMD Ryzen 9 5950X, AMD Ryzen 9 5950X
R9 5950X, 3400 MHz
12503 KB/s +87%
Intel Core i9-11900K, Intel Core i9-11900K
i9-11900K, 3500 MHz
9030 KB/s +35%
AMD Radeon RX Vega 64, AMD Ryzen 9 3900X
R9 3900X, 3800 MHz
7529 KB/s +13%
Asus X299 Prime Desktop, Intel Core i9-10980XE
i9-10980XE, 3000 MHz
7172 KB/s +7%
Lenovo ThinkStation P620, AMD Ryzen Threadripper PRO 3995WX
TR Pro 3995WX, 2700 MHz
6689 KB/s
AMD Ryzen Threadripper 2950X (16 core, 32 threads) Review, AMD Ryzen Threadripper 2950X
TR 2950X, 3500 MHz
4548 KB/s -32%
AMD Threadripper 2970WX, AMD Radeon RX Vega 64, AMD Ryzen Threadripper 2970WX
TR 2970WX, 3000 MHz
4261 KB/s -36%
TrueCrypt
AES Mean 100MB
AMD Ryzen 9 5950X, AMD Ryzen 9 5950X
R9 5950X, 3400 MHz
26.9 GB/s +3%
Lenovo ThinkStation P620, AMD Ryzen Threadripper PRO 3995WX
TR Pro 3995WX, 2700 MHz
26 GB/s
AMD Ryzen 9 5900X, AMD Ryzen 9 5900X
R9 5900X, 3700 MHz
21.2 GB/s -18%
AMD Ryzen Threadripper 2950X (16 core, 32 threads) Review, AMD Ryzen Threadripper 2950X
TR 2950X, 3500 MHz
19.5 GB/s -25%
Asus X299 Prime Desktop, Intel Core i9-10980XE
i9-10980XE, 3000 MHz
18.2 GB/s -30%
Intel Core i9-11900K, Intel Core i9-11900K
i9-11900K, 3500 MHz
13 GB/s -50%
AMD Threadripper 2970WX, AMD Radeon RX Vega 64, AMD Ryzen Threadripper 2970WX
TR 2970WX, 3000 MHz
12.2 GB/s -53%
AMD Radeon RX Vega 64, AMD Ryzen 9 3900X
R9 3900X, 3800 MHz
10.9 GB/s -58%
Twofish Mean 100MB
Lenovo ThinkStation P620, AMD Ryzen Threadripper PRO 3995WX
TR Pro 3995WX, 2700 MHz
4.8 GB/s
AMD Ryzen 9 5950X, AMD Ryzen 9 5950X
R9 5950X, 3400 MHz
3.7 GB/s -23%
Asus X299 Prime Desktop, Intel Core i9-10980XE
i9-10980XE, 3000 MHz
3.2 GB/s -33%
AMD Threadripper 2970WX, AMD Radeon RX Vega 64, AMD Ryzen Threadripper 2970WX
TR 2970WX, 3000 MHz
3 GB/s -37%
AMD Ryzen Threadripper 2950X (16 core, 32 threads) Review, AMD Ryzen Threadripper 2950X
TR 2950X, 3500 MHz
2.9 GB/s -40%
AMD Radeon RX Vega 64, AMD Ryzen 9 3900X
R9 3900X, 3800 MHz
2.9 GB/s -40%
AMD Ryzen 9 5900X, AMD Ryzen 9 5900X
R9 5900X, 3700 MHz
2.9 GB/s -40%
Intel Core i9-11900K, Intel Core i9-11900K
i9-11900K, 3500 MHz
1.9 GB/s -60%
Serpent Mean 100MB
Lenovo ThinkStation P620, AMD Ryzen Threadripper PRO 3995WX
TR Pro 3995WX, 2700 MHz
2.9 GB/s
AMD Ryzen 9 5950X, AMD Ryzen 9 5950X
R9 5950X, 3400 MHz
2.4 GB/s -17%
AMD Threadripper 2970WX, AMD Radeon RX Vega 64, AMD Ryzen Threadripper 2970WX
TR 2970WX, 3000 MHz
1.9 GB/s -34%
Asus X299 Prime Desktop, Intel Core i9-10980XE
i9-10980XE, 3000 MHz
1.9 GB/s -34%
AMD Ryzen Threadripper 2950X (16 core, 32 threads) Review, AMD Ryzen Threadripper 2950X
TR 2950X, 3500 MHz
1.8 GB/s -38%
AMD Ryzen 9 5900X, AMD Ryzen 9 5900X
R9 5900X, 3700 MHz
1.8 GB/s -38%
AMD Radeon RX Vega 64, AMD Ryzen 9 3900X
R9 3900X, 3800 MHz
1.7 GB/s -41%
Intel Core i9-11900K, Intel Core i9-11900K
i9-11900K, 3500 MHz
1.2 GB/s -59%
Geekbench 5.5
Multi-Core
AMD Ryzen 9 5950X, AMD Ryzen 9 5950X
R9 5950X, 3400 MHz
16891 Points +14%
Lenovo ThinkStation P620, AMD Ryzen Threadripper PRO 3995WX
TR Pro 3995WX, 2700 MHz
14881 Points
AMD Ryzen 9 5900X, AMD Ryzen 9 5900X
R9 5900X, 3700 MHz
12990 Points -13%
AMD Ryzen Threadripper 2950X (16 core, 32 threads) Review, AMD Ryzen Threadripper 2950X
TR 2950X, 3500 MHz
12160 Points -18%
Intel Core i9-11900K, Intel Core i9-11900K
i9-11900K, 3500 MHz
11035 Points -26%
AMD Threadripper 2970WX, AMD Radeon RX Vega 64, AMD Ryzen Threadripper 2970WX
TR 2970WX, 3000 MHz
10501 Points -29%
AMD Radeon RX Vega 64, AMD Ryzen 9 3900X
R9 3900X, 3800 MHz
10498 Points -29%
Single-Core
Intel Core i9-11900K, Intel Core i9-11900K
i9-11900K, 3500 MHz
1885 Points +10%
Lenovo ThinkStation P620, AMD Ryzen Threadripper PRO 3995WX
TR Pro 3995WX, 2700 MHz
1720 Points
AMD Ryzen 9 5950X, AMD Ryzen 9 5950X
R9 5950X, 3400 MHz
1682 Points -2%
AMD Ryzen 9 5900X, AMD Ryzen 9 5900X
R9 5900X, 3700 MHz
1669 Points -3%
AMD Radeon RX Vega 64, AMD Ryzen 9 3900X
R9 3900X, 3800 MHz
1250 Points -27%
AMD Ryzen Threadripper 2950X (16 core, 32 threads) Review, AMD Ryzen Threadripper 2950X
TR 2950X, 3500 MHz
1100 Points -36%
AMD Threadripper 2970WX, AMD Radeon RX Vega 64, AMD Ryzen Threadripper 2970WX
TR 2970WX, 3000 MHz
1095 Points -36%
Geekbench 5.0
5.0 Multi-Core
Lenovo ThinkStation P620, AMD Ryzen Threadripper PRO 3995WX
TR Pro 3995WX, 2700 MHz
31711 Points
AMD Ryzen 9 5950X, AMD Ryzen 9 5950X
R9 5950X, 3400 MHz
16570 Points -48%
Asus X299 Prime Desktop, Intel Core i9-10980XE
i9-10980XE, 3000 MHz
15598 Points -51%
AMD Ryzen 9 5900X, AMD Ryzen 9 5900X
R9 5900X, 3700 MHz
12974 Points -59%
AMD Radeon RX Vega 64, AMD Ryzen 9 3900X
R9 3900X, 3800 MHz
11135 Points -65%
Intel Core i9-11900K, Intel Core i9-11900K
i9-11900K, 3500 MHz
11008 Points -65%
5.0 Single-Core
Intel Core i9-11900K, Intel Core i9-11900K
i9-11900K, 3500 MHz
1863 Points +47%
AMD Ryzen 9 5950X, AMD Ryzen 9 5950X
R9 5950X, 3400 MHz
1683 Points +33%
AMD Ryzen 9 5900X, AMD Ryzen 9 5900X
R9 5900X, 3700 MHz
1667 Points +32%
Asus X299 Prime Desktop, Intel Core i9-10980XE
i9-10980XE, 3000 MHz
1271 Points 0%
Lenovo ThinkStation P620, AMD Ryzen Threadripper PRO 3995WX
TR Pro 3995WX, 2700 MHz
1266 Points
AMD Radeon RX Vega 64, AMD Ryzen 9 3900X
R9 3900X, 3800 MHz
1247 Points -2%
Geekbench 4.4
64 Bit Multi-Core Score
Lenovo ThinkStation P620, AMD Ryzen Threadripper PRO 3995WX
TR Pro 3995WX, 2700 MHz
80545 Points
AMD Ryzen 9 5950X, AMD Ryzen 9 5950X
R9 5950X, 3400 MHz
63233 Points -21%
AMD Ryzen 9 5900X, AMD Ryzen 9 5900X
R9 5900X, 3700 MHz
51794 Points -36%
Asus X299 Prime Desktop, Intel Core i9-10980XE
i9-10980XE, 3000 MHz
50801 Points -37%
AMD Radeon RX Vega 64, AMD Ryzen 9 3900X
R9 3900X, 3800 MHz
43978 Points -45%
Intel Core i9-11900K, Intel Core i9-11900K
i9-11900K, 3500 MHz
42329 Points -47%
AMD Ryzen Threadripper 2950X (16 core, 32 threads) Review, AMD Ryzen Threadripper 2950X
TR 2950X, 3500 MHz
36198 Points -55%
AMD Threadripper 2970WX, AMD Radeon RX Vega 64, AMD Ryzen Threadripper 2970WX
TR 2970WX, 3000 MHz
32029 Points -60%
64 Bit Single-Core Score
Intel Core i9-11900K, Intel Core i9-11900K
i9-11900K, 3500 MHz
7976 Points +43%
AMD Ryzen 9 5900X, AMD Ryzen 9 5900X
R9 5900X, 3700 MHz
7297 Points +31%
AMD Ryzen 9 5950X, AMD Ryzen 9 5950X
R9 5950X, 3400 MHz
7216 Points +30%
AMD Radeon RX Vega 64, AMD Ryzen 9 3900X
R9 3900X, 3800 MHz
5880 Points +6%
Asus X299 Prime Desktop, Intel Core i9-10980XE
i9-10980XE, 3000 MHz
5820 Points +5%
Lenovo ThinkStation P620, AMD Ryzen Threadripper PRO 3995WX
TR Pro 3995WX, 2700 MHz
5567 Points
AMD Ryzen Threadripper 2950X (16 core, 32 threads) Review, AMD Ryzen Threadripper 2950X
TR 2950X, 3500 MHz
4903 Points -12%
AMD Threadripper 2970WX, AMD Radeon RX Vega 64, AMD Ryzen Threadripper 2970WX
TR 2970WX, 3000 MHz
4463 Points -20%
3DMark 11 - 1280x720 Performance Physics
AMD Ryzen 9 5950X, AMD Ryzen 9 5950X
R9 5950X, 3400 MHz
25367 Points +45%
AMD Ryzen 9 5900X, AMD Ryzen 9 5900X
R9 5900X, 3700 MHz
23423 Points +34%
Intel Core i9-11900K, Intel Core i9-11900K
i9-11900K, 3500 MHz
21175 Points +21%
Asus X299 Prime Desktop, Intel Core i9-10980XE
i9-10980XE, 3000 MHz
20452 Points +17%
AMD Radeon RX Vega 64, AMD Ryzen 9 3900X
R9 3900X, 3800 MHz
18270 Points +4%
Lenovo ThinkStation P620, AMD Ryzen Threadripper PRO 3995WX
TR Pro 3995WX, 2700 MHz
17518 Points
AMD Ryzen Threadripper 2950X (16 core, 32 threads) Review, AMD Ryzen Threadripper 2950X
TR 2950X, 3500 MHz
17222 Points -2%
AMD Threadripper 2970WX, AMD Radeon RX Vega 64, AMD Ryzen Threadripper 2970WX
TR 2970WX, 3000 MHz
12297 Points -30%
7-Zip 18.03
7z b 4
Lenovo ThinkStation P620, AMD Ryzen Threadripper PRO 3995WX
TR Pro 3995WX, 2700 MHz
140172 MIPS
AMD Ryzen 9 5950X, AMD Ryzen 9 5950X
R9 5950X, 3400 MHz
127792 MIPS -9%
AMD Ryzen 9 5900X, AMD Ryzen 9 5900X
R9 5900X, 3700 MHz
95123 MIPS -32%
Asus X299 Prime Desktop, Intel Core i9-10980XE
i9-10980XE, 3000 MHz
93092 MIPS -34%
AMD Radeon RX Vega 64, AMD Ryzen 9 3900X
R9 3900X, 3800 MHz
82119 MIPS -41%
Intel Core i9-11900K, Intel Core i9-11900K
i9-11900K, 3500 MHz
62746 MIPS -55%
7z b 4 -mmt1
AMD Ryzen 9 5950X, AMD Ryzen 9 5950X
R9 5950X, 3400 MHz
6974 MIPS +39%
AMD Ryzen 9 5900X, AMD Ryzen 9 5900X
R9 5900X, 3700 MHz
6785 MIPS +35%
Intel Core i9-11900K, Intel Core i9-11900K
i9-11900K, 3500 MHz
6652 MIPS +32%
AMD Radeon RX Vega 64, AMD Ryzen 9 3900X
R9 3900X, 3800 MHz
5533 MIPS +10%
Asus X299 Prime Desktop, Intel Core i9-10980XE
i9-10980XE, 3000 MHz
5333 MIPS +6%
Lenovo ThinkStation P620, AMD Ryzen Threadripper PRO 3995WX
TR Pro 3995WX, 2700 MHz
5021 MIPS
HWBOT x265 Benchmark v2.2 - 4k Preset
Lenovo ThinkStation P620, AMD Ryzen Threadripper PRO 3995WX
TR Pro 3995WX, 2700 MHz
46.6 fps
AMD Ryzen 9 5950X, AMD Ryzen 9 5950X
R9 5950X, 3400 MHz
31.8 fps -32%
Asus X299 Prime Desktop, Intel Core i9-10980XE
i9-10980XE, 3000 MHz
27.8 fps -40%
AMD Ryzen 9 5900X, AMD Ryzen 9 5900X
R9 5900X, 3700 MHz
25.5 fps -45%
AMD Radeon RX Vega 64, AMD Ryzen 9 3900X
R9 3900X, 3800 MHz
20.9 fps -55%
Intel Core i9-11900K, Intel Core i9-11900K
i9-11900K, 3500 MHz
19.8 fps -58%
AMD Threadripper 2970WX, AMD Radeon RX Vega 64, AMD Ryzen Threadripper 2970WX
TR 2970WX, 3000 MHz
18 fps -61%
AMD Ryzen Threadripper 2950X (16 core, 32 threads) Review, AMD Ryzen Threadripper 2950X
TR 2950X, 3500 MHz
17.5 fps -62%
R Benchmark 2.5 - Overall mean
Lenovo ThinkStation P620, AMD Ryzen Threadripper PRO 3995WX
TR Pro 3995WX, 2700 MHz
0.561 sec *
AMD Radeon RX Vega 64, AMD Ryzen 9 3900X
R9 3900X, 3800 MHz
0.542 sec * +3%
Intel Core i9-11900K, Intel Core i9-11900K
i9-11900K, 3500 MHz
0.4733 sec * +16%
AMD Ryzen 9 5950X, AMD Ryzen 9 5950X
R9 5950X, 3400 MHz
0.4556 sec * +19%
AMD Ryzen 9 5900X, AMD Ryzen 9 5900X
R9 5900X, 3700 MHz
0.4513 sec * +20%
LibreOffice - 20 Documents To PDF
Intel Core i9-11900K, Intel Core i9-11900K
i9-11900K, 3500 MHz
72.5 s * -14%
Lenovo ThinkStation P620, AMD Ryzen Threadripper PRO 3995WX
TR Pro 3995WX, 2700 MHz
63.5 s *
AMD Radeon RX Vega 64, AMD Ryzen 9 3900X
R9 3900X, 3800 MHz
56.5 s * +11%
AMD Ryzen 9 5900X, AMD Ryzen 9 5900X
R9 5900X, 3700 MHz
47.65 s * +25%
AMD Ryzen 9 5950X, AMD Ryzen 9 5950X
R9 5950X, 3400 MHz
45.97 s * +28%
WebXPRT 3 - Overall
AMD Ryzen 9 5950X, AMD Ryzen 9 5950X
R9 5950X, 3400 MHz
291 Points +27%
AMD Ryzen 9 5900X, AMD Ryzen 9 5900X
R9 5900X, 3700 MHz
284 Points +24%
Asus X299 Prime Desktop, Intel Core i9-10980XE
i9-10980XE, 3000 MHz
239 Points +4%
Lenovo ThinkStation P620, AMD Ryzen Threadripper PRO 3995WX
TR Pro 3995WX, 2700 MHz
229 Points
Intel Core i9-11900K, Intel Core i9-11900K
i9-11900K, 3500 MHz
217 Points -5%
Mozilla Kraken 1.1 - Total
Asus X299 Prime Desktop, Intel Core i9-10980XE
i9-10980XE, 3000 MHz
954 ms * -25%
Lenovo ThinkStation P620, AMD Ryzen Threadripper PRO 3995WX
TR Pro 3995WX, 2700 MHz
762 ms *
AMD Ryzen 9 5900X, AMD Ryzen 9 5900X
R9 5900X, 3700 MHz
566 ms * +26%
AMD Ryzen 9 5950X, AMD Ryzen 9 5950X
R9 5950X, 3400 MHz
558 ms * +27%
Intel Core i9-11900K, Intel Core i9-11900K
i9-11900K, 3500 MHz
544 ms * +29%
3DMark
3840x2160 Fire Strike Ultra Physics
AMD Ryzen 9 5950X, AMD Ryzen 9 5950X
R9 5950X, 3400 MHz
39353 Points +54%
AMD Ryzen 9 5900X, AMD Ryzen 9 5900X
R9 5900X, 3700 MHz
36154 Points +42%
AMD Radeon RX Vega 64, AMD Ryzen 9 3900X
R9 3900X, 3800 MHz
28865 Points +13%
Intel Core i9-11900K, Intel Core i9-11900K
i9-11900K, 3500 MHz
27685 Points +9%
AMD Ryzen Threadripper 2950X (16 core, 32 threads) Review, AMD Ryzen Threadripper 2950X
TR 2950X, 3500 MHz
27220 Points +7%
Lenovo ThinkStation P620, AMD Ryzen Threadripper PRO 3995WX
TR Pro 3995WX, 2700 MHz
25515 Points
AMD Threadripper 2970WX, AMD Radeon RX Vega 64, AMD Ryzen Threadripper 2970WX
TR 2970WX, 3000 MHz
23094 Points -9%
1920x1080 Fire Strike Physics
AMD Ryzen 9 5950X, AMD Ryzen 9 5950X
R9 5950X, 3400 MHz
39600 Points +57%
AMD Ryzen 9 5900X, AMD Ryzen 9 5900X
R9 5900X, 3700 MHz
35451 Points +41%
Intel Core i9-11900K, Intel Core i9-11900K
i9-11900K, 3500 MHz
28927 Points +15%
AMD Radeon RX Vega 64, AMD Ryzen 9 3900X
R9 3900X, 3800 MHz
28747 Points +14%
Asus X299 Prime Desktop, Intel Core i9-10980XE
i9-10980XE, 3000 MHz
28606 Points +14%
AMD Ryzen Threadripper 2950X (16 core, 32 threads) Review, AMD Ryzen Threadripper 2950X
TR 2950X, 3500 MHz
27107 Points +8%
Lenovo ThinkStation P620, AMD Ryzen Threadripper PRO 3995WX
TR Pro 3995WX, 2700 MHz
25166 Points
AMD Threadripper 2970WX, AMD Radeon RX Vega 64, AMD Ryzen Threadripper 2970WX
TR 2970WX, 3000 MHz
21457 Points -15%
2560x1440 Time Spy CPU
AMD Ryzen 9 5950X, AMD Ryzen 9 5950X
R9 5950X, 3400 MHz
13650 Points +25%
Intel Core i9-11900K, Intel Core i9-11900K
i9-11900K, 3500 MHz
13433 Points +23%
AMD Ryzen 9 5900X, AMD Ryzen 9 5900X
R9 5900X, 3700 MHz
12633 Points +15%
Asus X299 Prime Desktop, Intel Core i9-10980XE
i9-10980XE, 3000 MHz
12436 Points +14%
AMD Radeon RX Vega 64, AMD Ryzen 9 3900X
R9 3900X, 3800 MHz
11880 Points +9%
Lenovo ThinkStation P620, AMD Ryzen Threadripper PRO 3995WX
TR Pro 3995WX, 2700 MHz
10946 Points
AMD Ryzen Threadripper 2950X (16 core, 32 threads) Review, AMD Ryzen Threadripper 2950X
TR 2950X, 3500 MHz
9886 Points -10%
AMD Threadripper 2970WX, AMD Radeon RX Vega 64, AMD Ryzen Threadripper 2970WX
TR 2970WX, 3000 MHz
7663 Points -30%

* ... smaller is better

The Lenovo ThinkStation P620 in the Cinebench R15 Multi loop

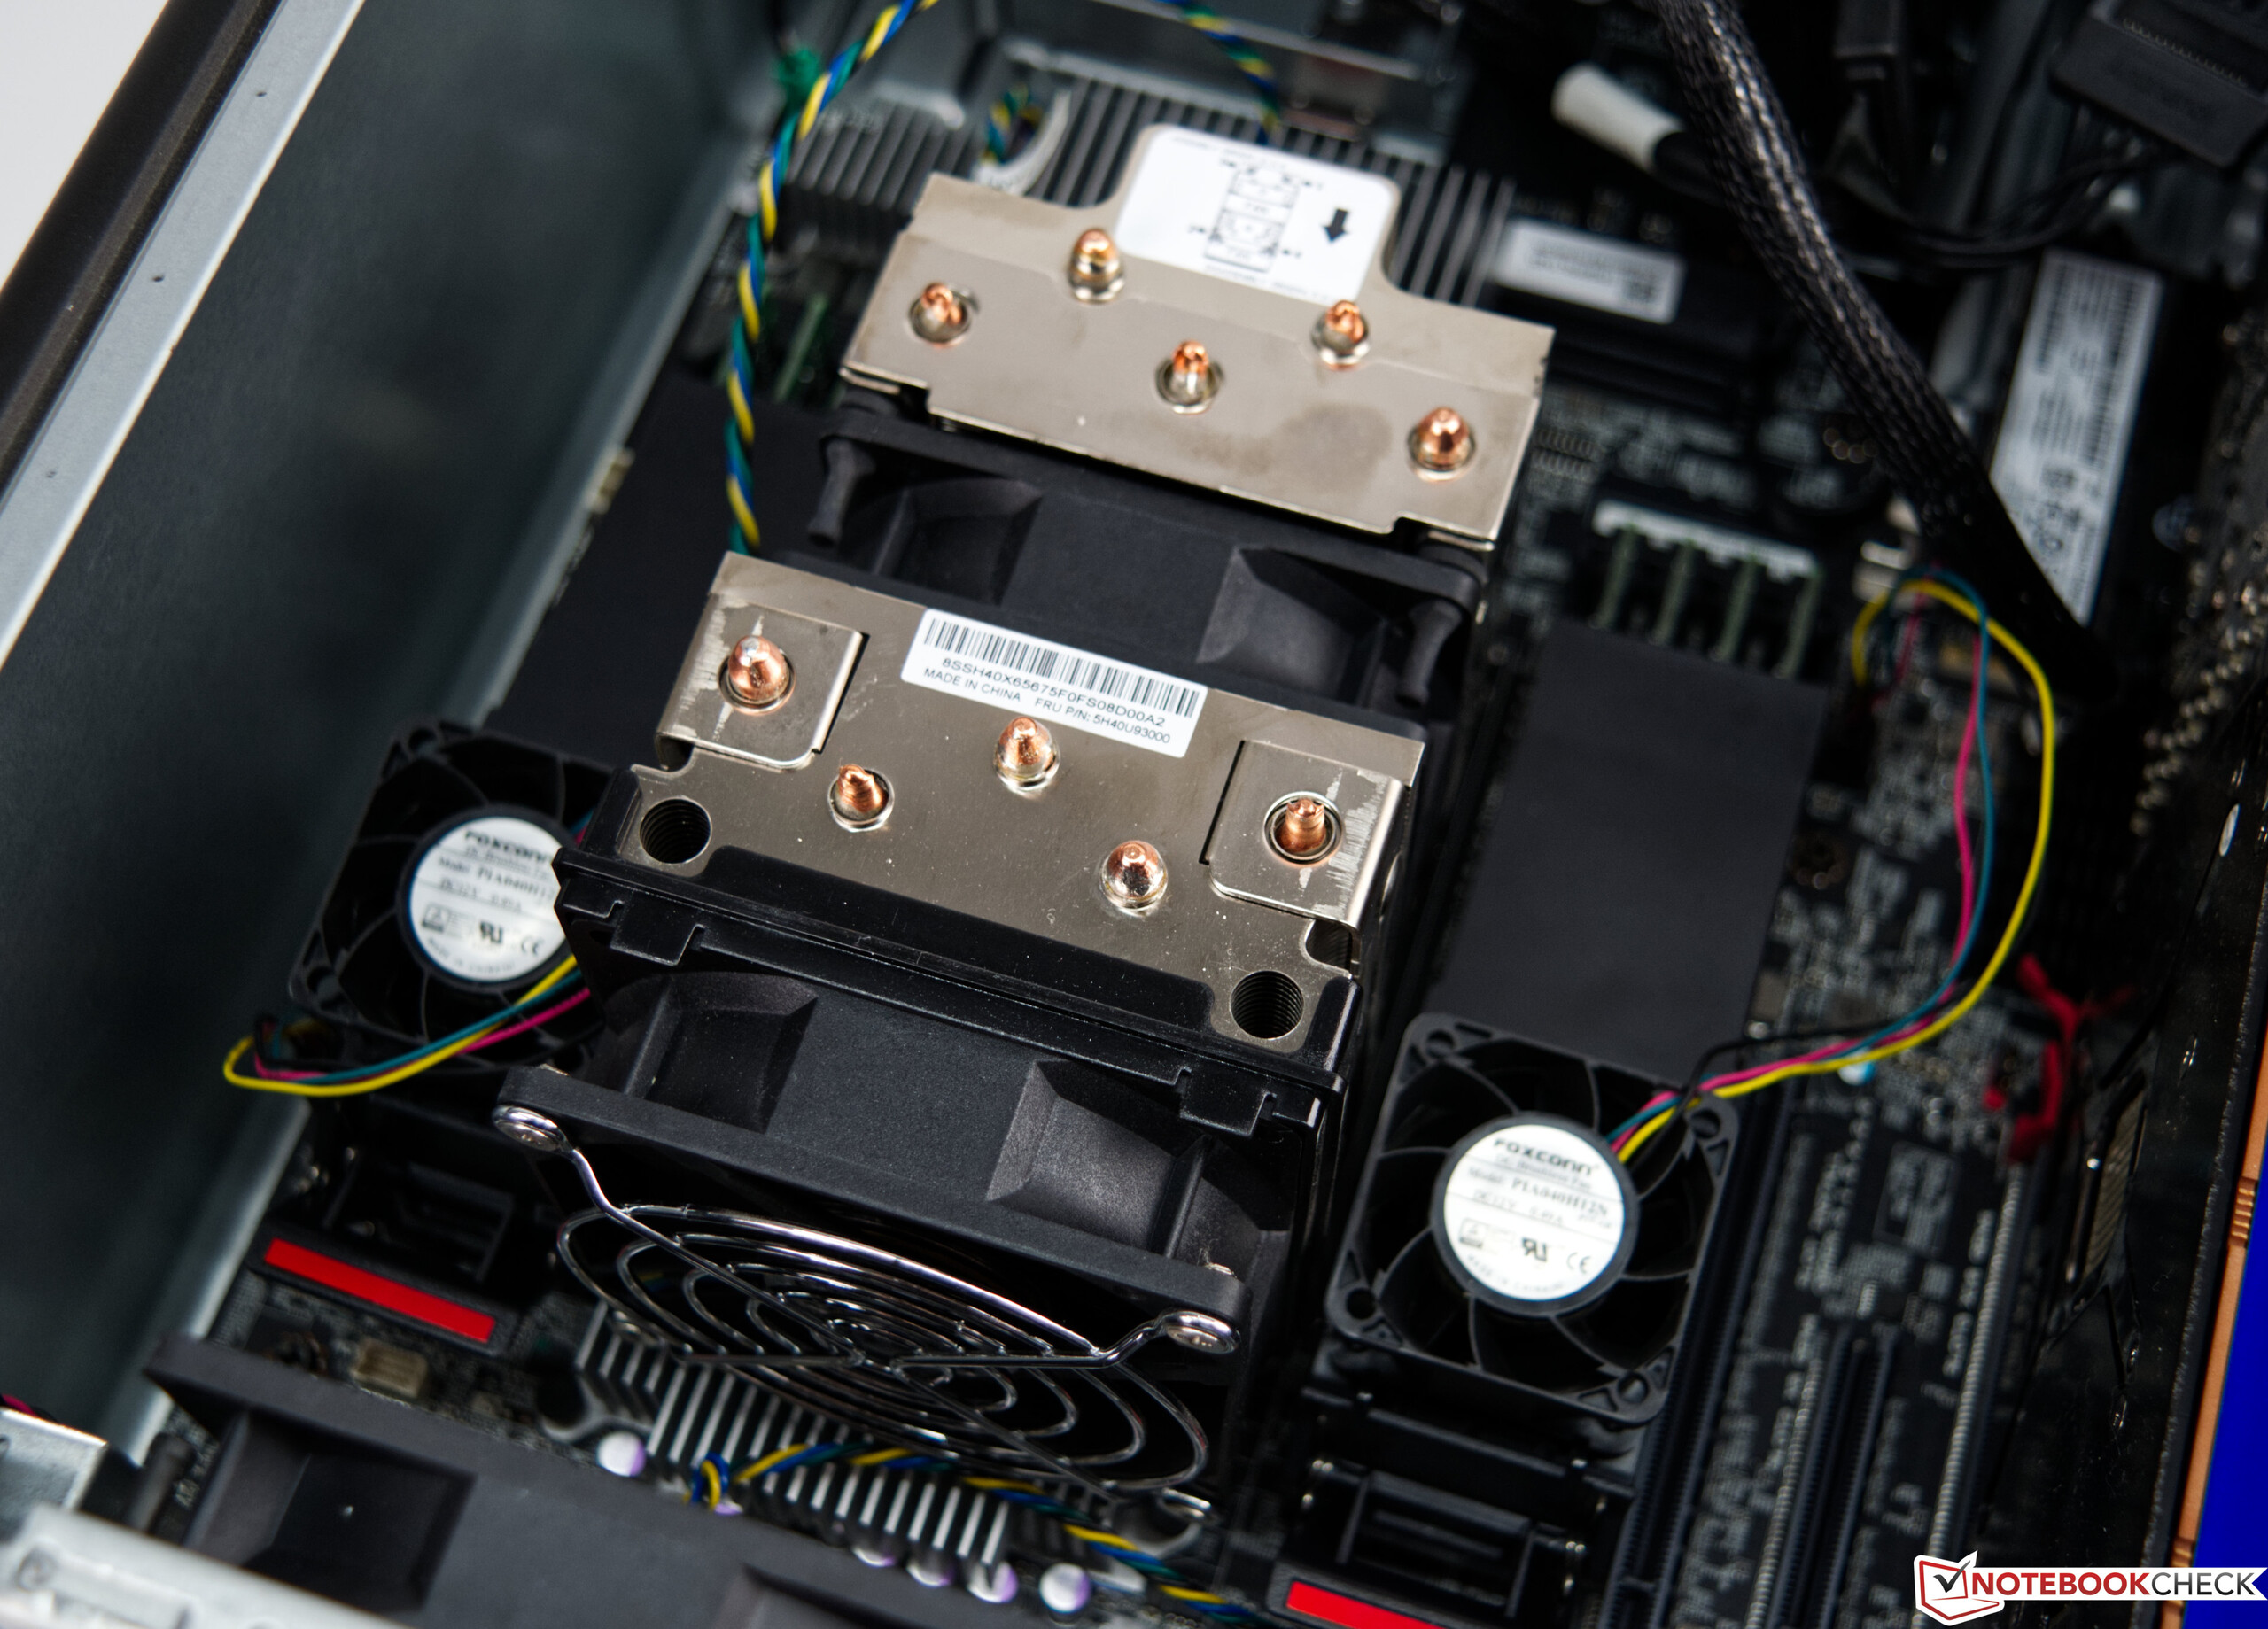
Lenovo uses a tower cooler with two fans, which provides sufficient cooling for the AMD Ryzen Threadripper Pro 3995WX. The workstation masters the Cinebench R15 multi-loop load test without problems, and it achieves a solid average score of 9,747 points. We weren't able to detect a significant drop in performance compared to the first runs.

010002000300040005000600070008000900010000Tooltip
Lenovo ThinkStation P620 AMD Ryzen Threadripper PRO 3995WX, AMD Ryzen Threadripper PRO 3995WX: Ø9747 (9622.32-10101.01)
AMD Threadripper 2970WX, AMD Radeon RX Vega 64 AMD Ryzen Threadripper 2970WX, AMD Ryzen Threadripper 2970WX: Ø4284 (4252.15-4316.86)

Application and rendering performance

In our test configuration, the Lenovo ThinkStation P620 achieves relatively good rates in our application benchmarks. The AMD Radeon Pro W6800 can show what it's capable of in the rendering tests that we carried out, such as SPECviewperf 2020. In many individual disciplines, it's even significantly faster than an Nvidia Titan RTX, which can be compared with a Quadro RTX 6000. Nonetheless, you have to keep the different drivers in mind here, because the Quadro as well as the Radeon Pro models have special drivers that offer additional options and are optimized for high performance and stability in professional applications.

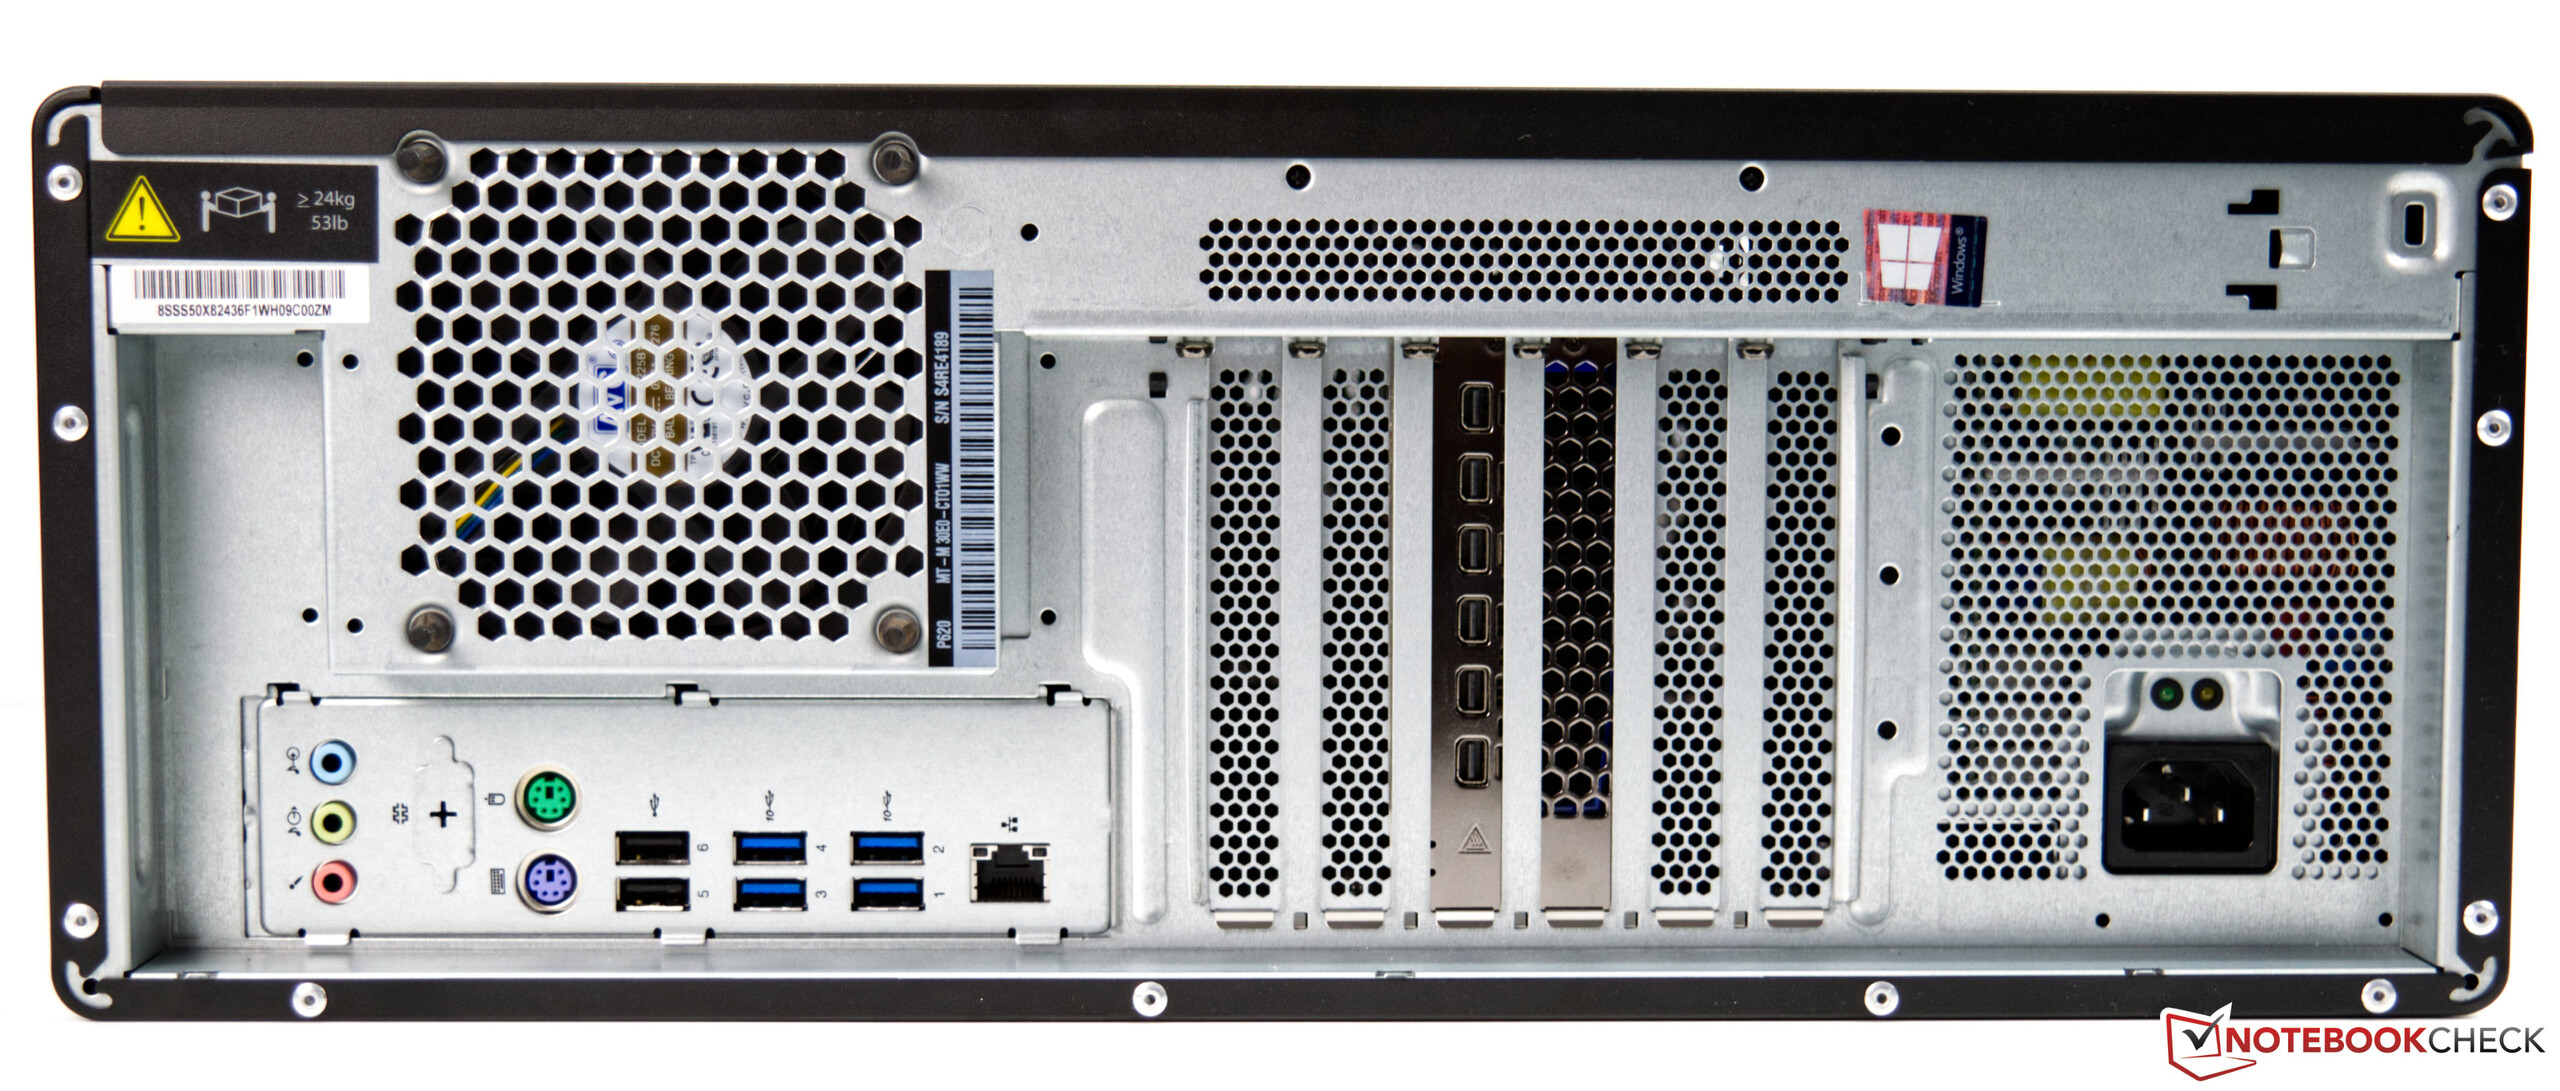
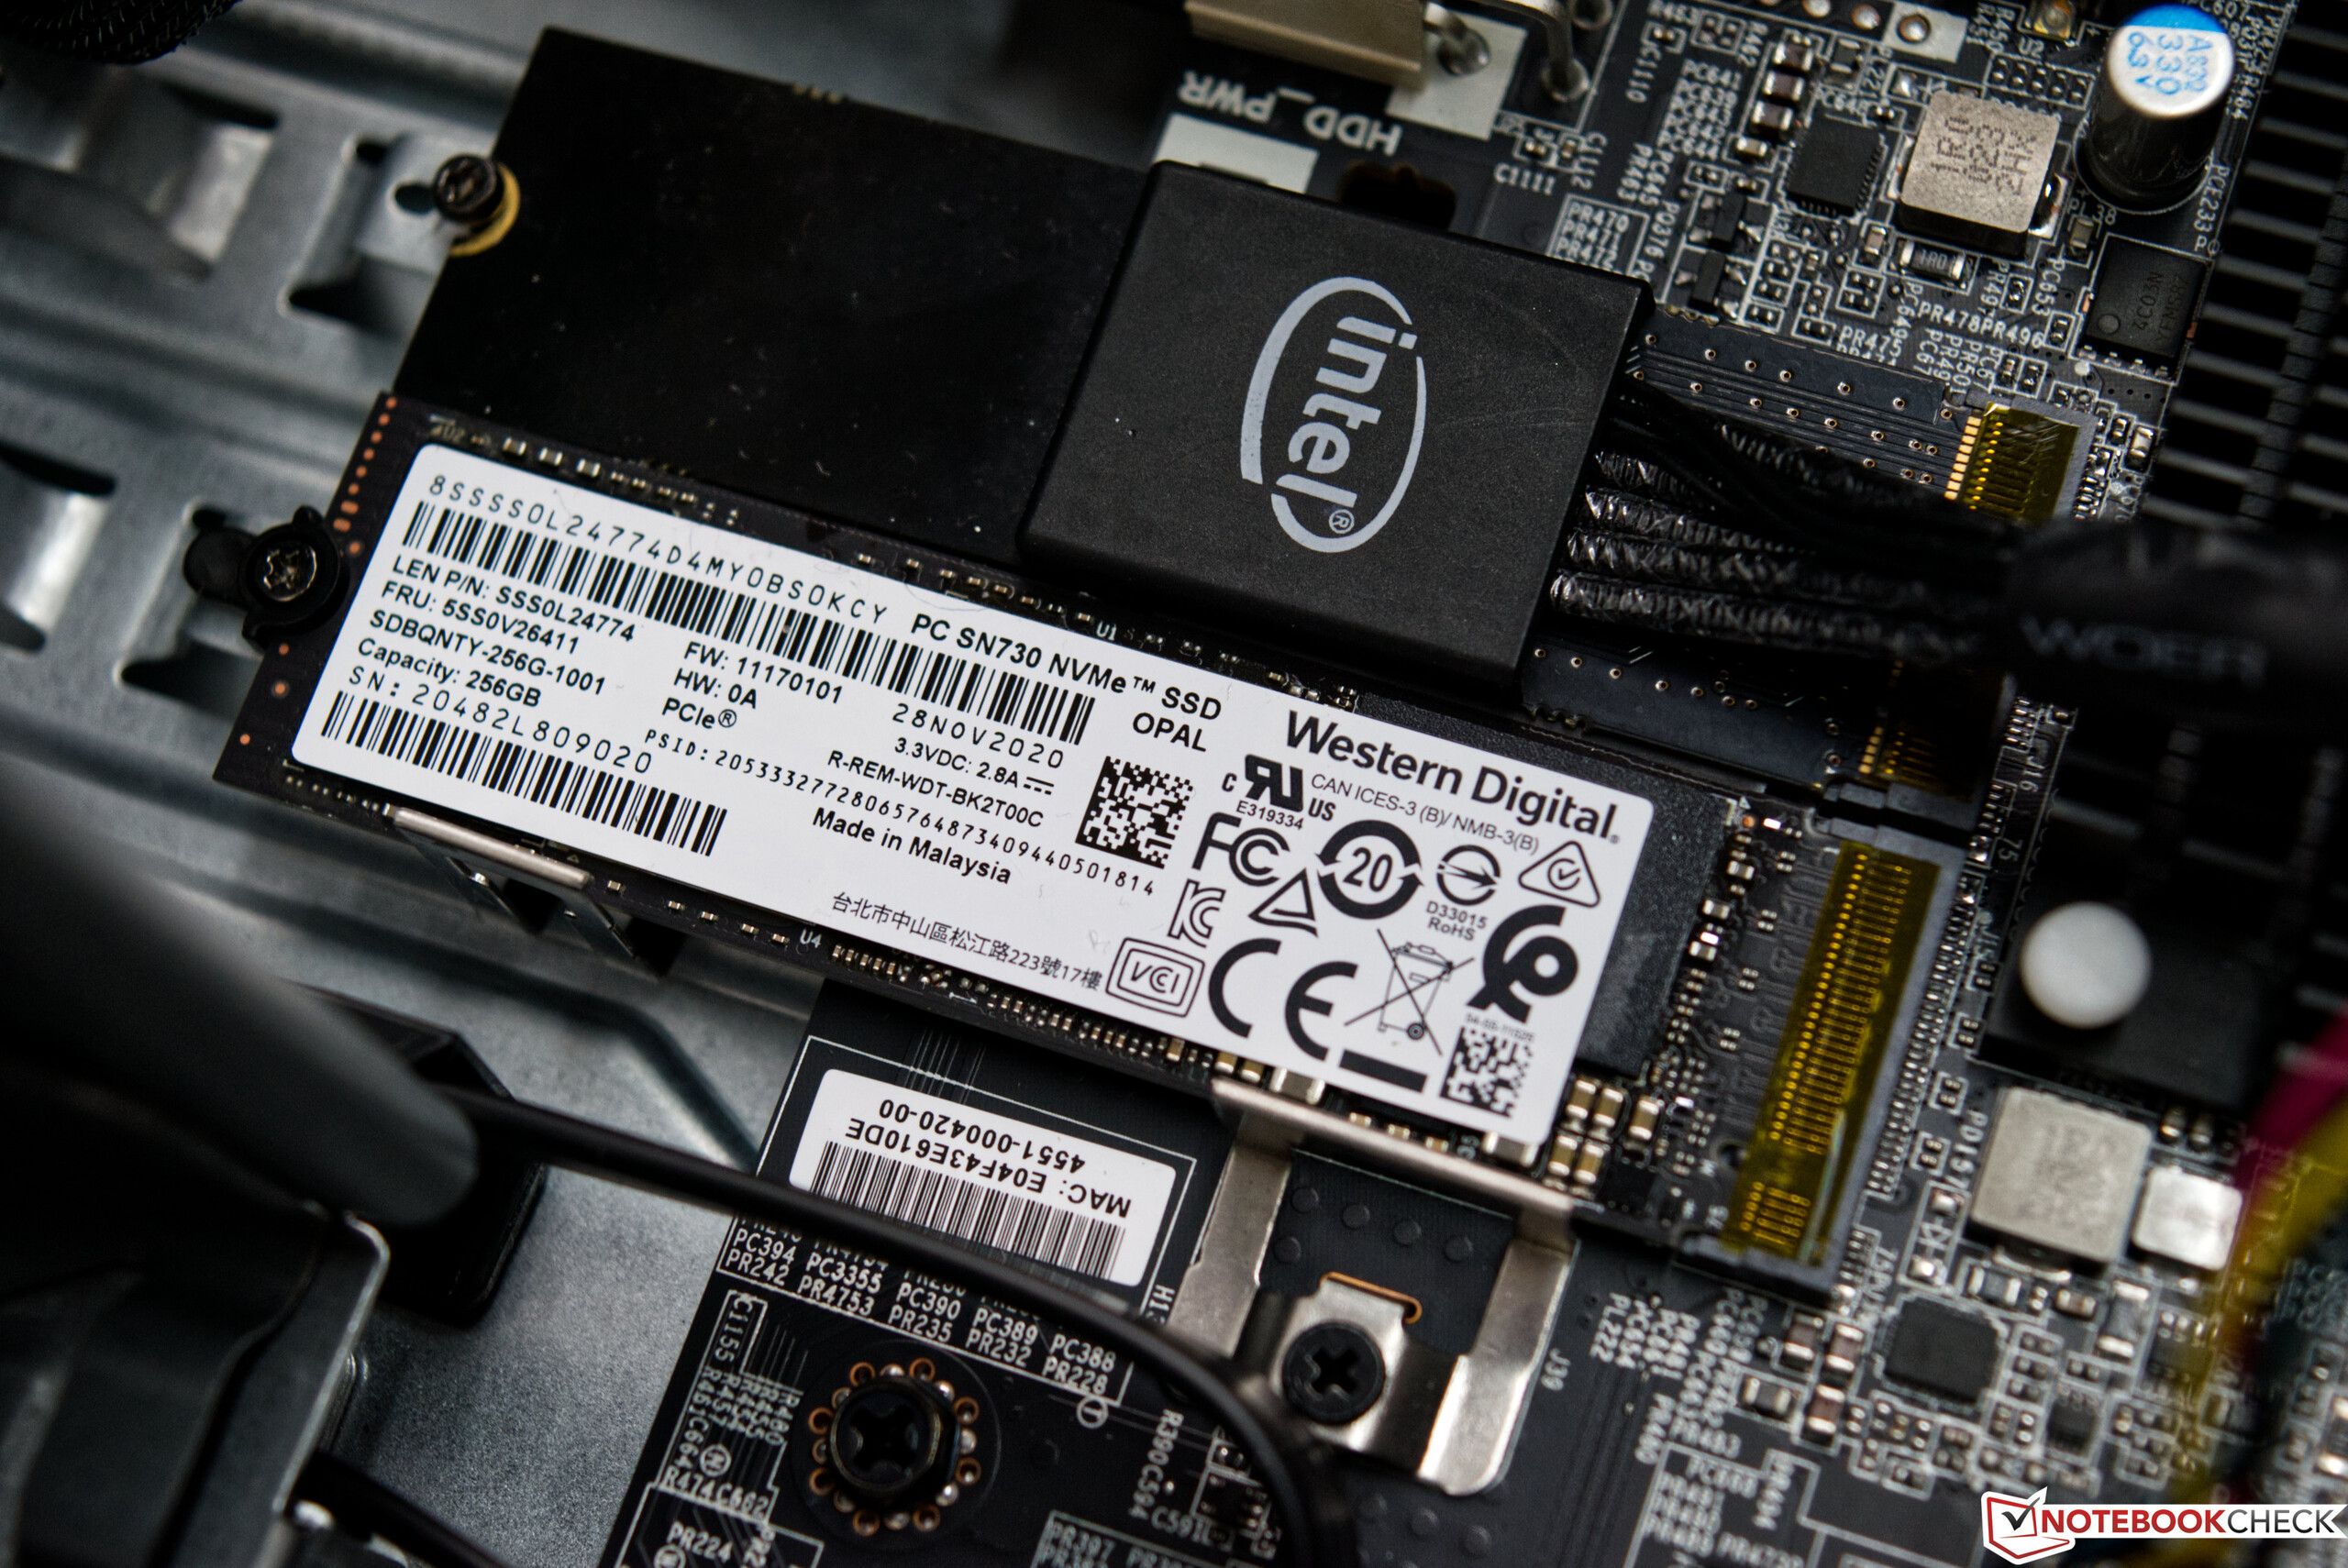
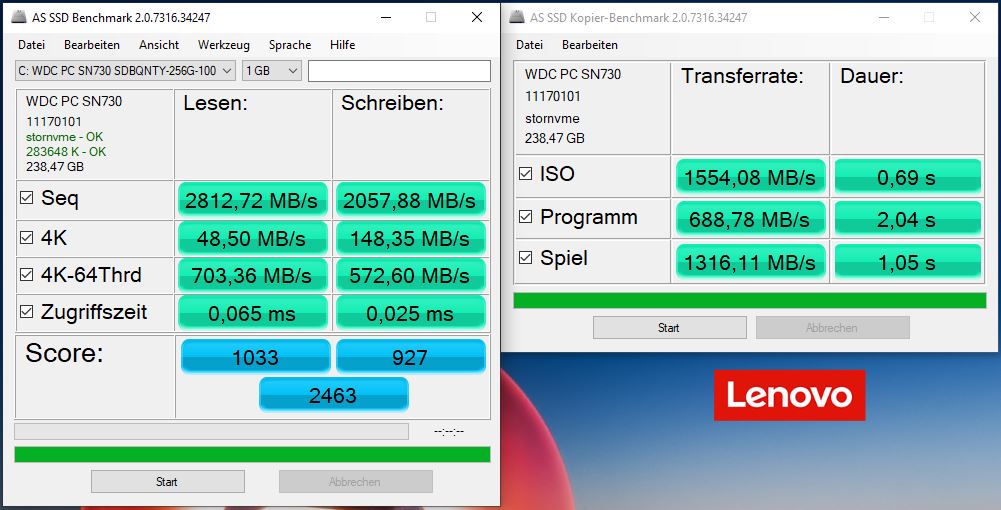
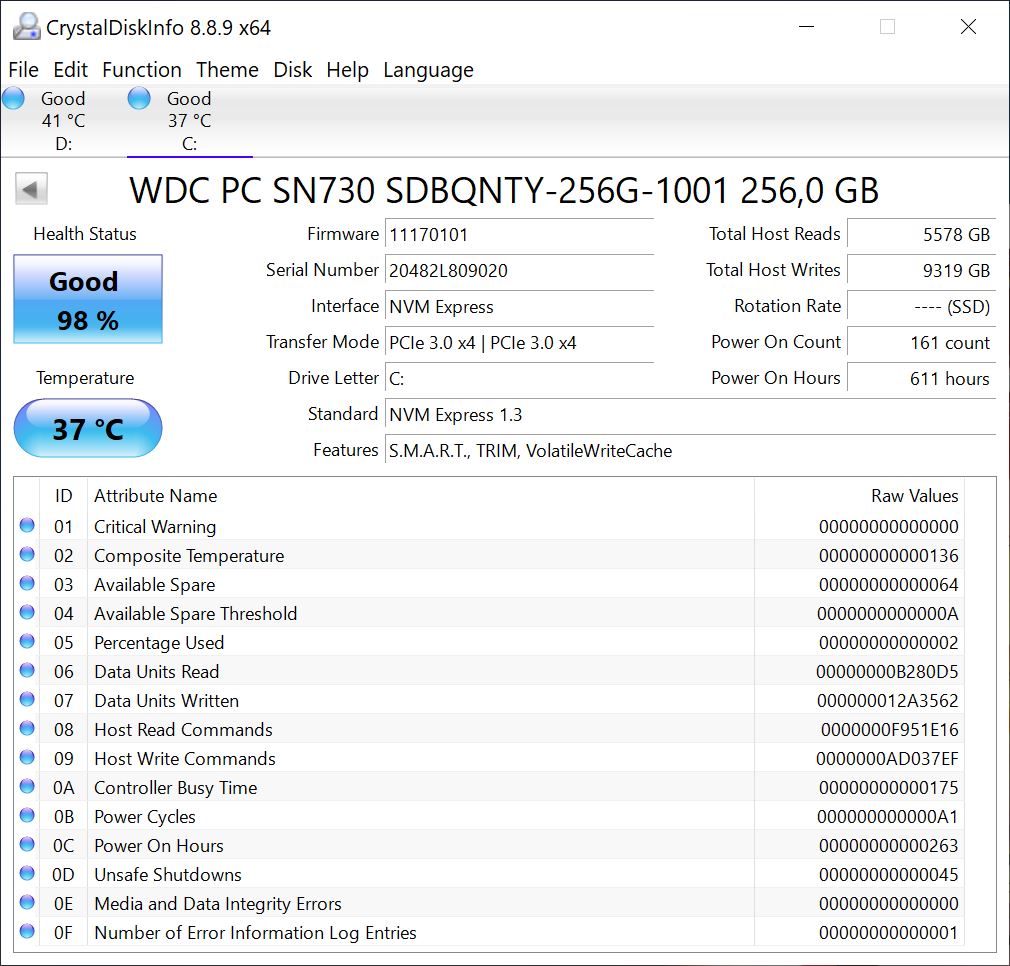
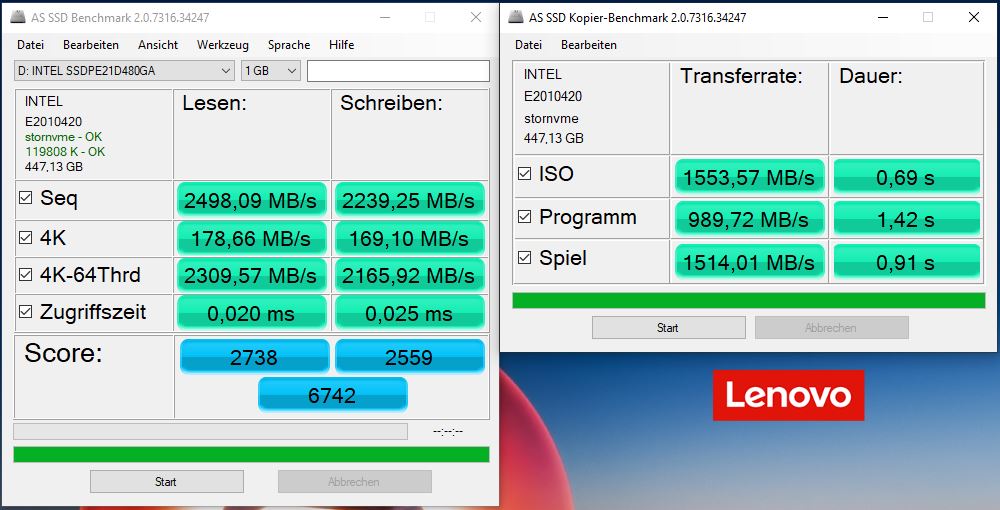
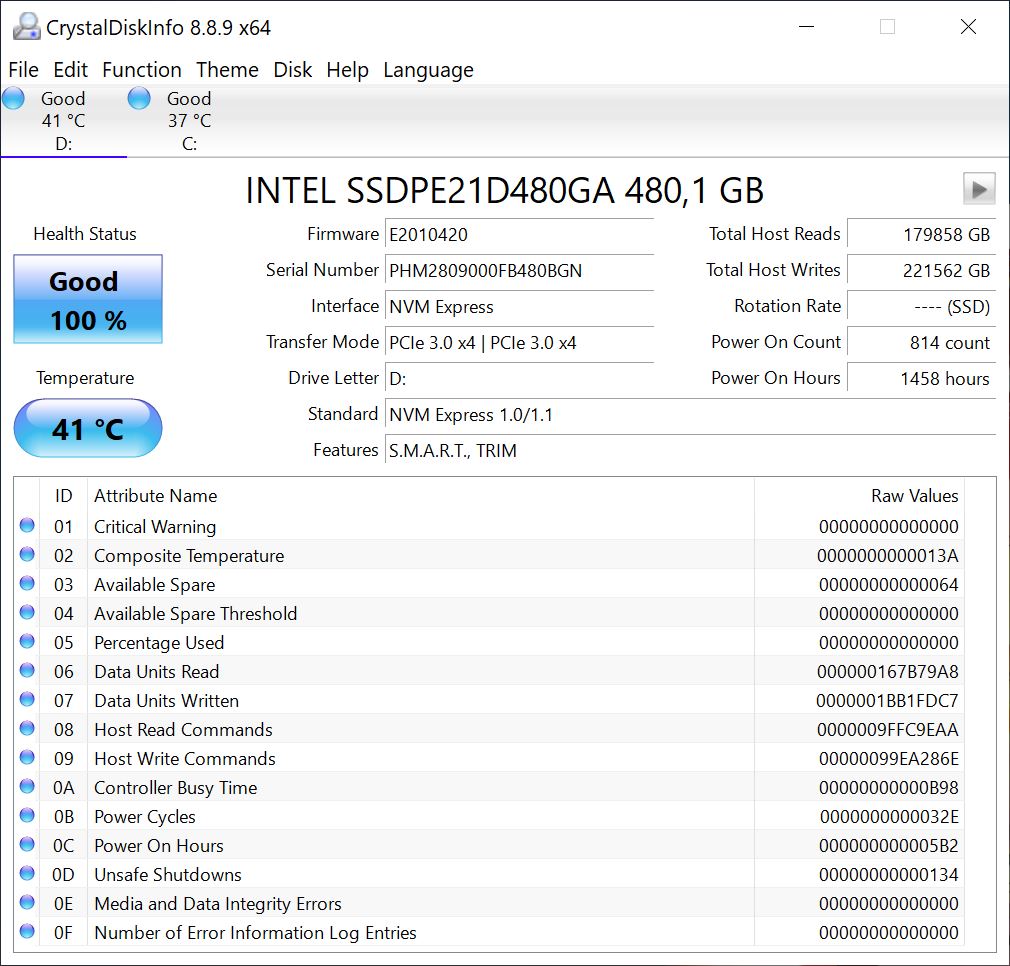
Our test configuration's built-in storage offers a capacity of 256 GB, and it delivers very fast transfer rates thanks to the NVMe protocol. Due to the very limited storage space, we added our Intel Optane 905P to the system for this review. It also delivered very good rates in the test as you can see in the pictures. A total of two M.2 SSDs can be installed on the motherboard. The latter offers additional SATA ports for other storage devices. At the same time, an additional SAS controller can also be installed to build a fail-safe storage drive array (e.g. RAID 5).

AS SSD (WD SN730)
AS SSD (WD SN730)
CDI (WD SN730)
CDI (WD SN730)
AS SSD (Intel Optane 905P)
CDI (Intel Optane 905P)
SPECviewperf 2020
3840x2160 Solidworks (solidworks-05)
Lenovo ThinkStation P620, AMD Ryzen Threadripper PRO 3995WX
AMD Radeon Pro W6800
265 fps
AMD Ryzen 9 5950X, AMD Ryzen 9 5950X
NVIDIA Titan RTX
154 fps -42%
AMD Ryzen 9 5900X, AMD Ryzen 9 5900X
NVIDIA Titan RTX
153 fps -42%
Intel Core i9-11900K, Intel Core i9-11900K
NVIDIA Titan RTX
153 fps -42%
3840x2160 Siemens NX (snx-04)
Lenovo ThinkStation P620, AMD Ryzen Threadripper PRO 3995WX
AMD Radeon Pro W6800
434 fps
AMD Ryzen 9 5950X, AMD Ryzen 9 5950X
NVIDIA Titan RTX
363 fps -16%
AMD Ryzen 9 5900X, AMD Ryzen 9 5900X
NVIDIA Titan RTX
347 fps -20%
Intel Core i9-11900K, Intel Core i9-11900K
NVIDIA Titan RTX
337 fps -22%
3840x2160 Medical (medical-03)
Lenovo ThinkStation P620, AMD Ryzen Threadripper PRO 3995WX
AMD Radeon Pro W6800
52 fps
Intel Core i9-11900K, Intel Core i9-11900K
NVIDIA Titan RTX
16.5 fps -68%
AMD Ryzen 9 5900X, AMD Ryzen 9 5900X
NVIDIA Titan RTX
16.42 fps -68%
AMD Ryzen 9 5950X, AMD Ryzen 9 5950X
NVIDIA Titan RTX
16.33 fps -69%
3840x2160 Maya (maya-06)
Lenovo ThinkStation P620, AMD Ryzen Threadripper PRO 3995WX
AMD Radeon Pro W6800
345 fps
AMD Ryzen 9 5950X, AMD Ryzen 9 5950X
NVIDIA Titan RTX
262 fps -24%
AMD Ryzen 9 5900X, AMD Ryzen 9 5900X
NVIDIA Titan RTX
257 fps -26%
Intel Core i9-11900K, Intel Core i9-11900K
NVIDIA Titan RTX
247 fps -28%
3840x2160 Energy (energy-03)
Lenovo ThinkStation P620, AMD Ryzen Threadripper PRO 3995WX
AMD Radeon Pro W6800
87.7 fps
AMD Ryzen 9 5900X, AMD Ryzen 9 5900X
NVIDIA Titan RTX
58.2 fps -34%
AMD Ryzen 9 5950X, AMD Ryzen 9 5950X
NVIDIA Titan RTX
57.9 fps -34%
Intel Core i9-11900K, Intel Core i9-11900K
NVIDIA Titan RTX
39.1 fps -55%
3840x2160 Creo (creo-03)
Intel Core i9-11900K, Intel Core i9-11900K
NVIDIA Titan RTX
126 fps +44%
AMD Ryzen 9 5900X, AMD Ryzen 9 5900X
NVIDIA Titan RTX
113 fps +29%
AMD Ryzen 9 5950X, AMD Ryzen 9 5950X
NVIDIA Titan RTX
109 fps +24%
Lenovo ThinkStation P620, AMD Ryzen Threadripper PRO 3995WX
AMD Radeon Pro W6800
87.8 fps
3840x2160 CATIA (catia-06)
Intel Core i9-11900K, Intel Core i9-11900K
NVIDIA Titan RTX
78.6 fps +3%
AMD Ryzen 9 5900X, AMD Ryzen 9 5900X
NVIDIA Titan RTX
78.2 fps +3%
AMD Ryzen 9 5950X, AMD Ryzen 9 5950X
NVIDIA Titan RTX
77.2 fps +1%
Lenovo ThinkStation P620, AMD Ryzen Threadripper PRO 3995WX
AMD Radeon Pro W6800
76.2 fps
3840x2160 3ds Max (3dsmax-07)
Lenovo ThinkStation P620, AMD Ryzen Threadripper PRO 3995WX
AMD Radeon Pro W6800
162 fps
AMD Ryzen 9 5950X, AMD Ryzen 9 5950X
NVIDIA Titan RTX
114 fps -30%
Intel Core i9-11900K, Intel Core i9-11900K
NVIDIA Titan RTX
114 fps -30%
AMD Ryzen 9 5900X, AMD Ryzen 9 5900X
NVIDIA Titan RTX
108 fps -33%
SPECviewperf 13
Solidworks (sw-04)
Intel Core i9-11900K, Intel Core i9-11900K
NVIDIA Titan RTX
198 fps +14%
AMD Ryzen 9 5900X, AMD Ryzen 9 5900X
NVIDIA Titan RTX
196.4 fps +14%
AMD Ryzen 9 5950X, AMD Ryzen 9 5950X
NVIDIA Titan RTX
174.6 fps +1%
Lenovo ThinkStation P620, AMD Ryzen Threadripper PRO 3995WX
AMD Radeon Pro W6800
173 fps
AMD Radeon RX Vega 64, AMD Ryzen 9 3900X
AMD Radeon RX Vega 64
102.2 fps -41%
AMD Threadripper 2970WX, AMD Radeon RX Vega 64, AMD Ryzen Threadripper 2970WX
AMD Radeon RX Vega 64
92.8 fps -46%
Siemens NX (snx-03)
AMD Ryzen 9 5900X, AMD Ryzen 9 5900X
NVIDIA Titan RTX
493.4 fps +13%
AMD Ryzen 9 5950X, AMD Ryzen 9 5950X
NVIDIA Titan RTX
478.5 fps +9%
Intel Core i9-11900K, Intel Core i9-11900K
NVIDIA Titan RTX
450 fps +3%
Lenovo ThinkStation P620, AMD Ryzen Threadripper PRO 3995WX
AMD Radeon Pro W6800
437 fps
AMD Threadripper 2970WX, AMD Radeon RX Vega 64, AMD Ryzen Threadripper 2970WX
AMD Radeon RX Vega 64
41.72 fps -90%
AMD Radeon RX Vega 64, AMD Ryzen 9 3900X
AMD Radeon RX Vega 64
38.37 fps -91%
Showcase (showcase-02)
Lenovo ThinkStation P620, AMD Ryzen Threadripper PRO 3995WX
AMD Radeon Pro W6800
216 fps
Intel Core i9-11900K, Intel Core i9-11900K
NVIDIA Titan RTX
194 fps -10%
AMD Ryzen 9 5950X, AMD Ryzen 9 5950X
NVIDIA Titan RTX
191.1 fps -12%
AMD Ryzen 9 5900X, AMD Ryzen 9 5900X
NVIDIA Titan RTX
190.5 fps -12%
AMD Radeon RX Vega 64, AMD Ryzen 9 3900X
AMD Radeon RX Vega 64
110.4 fps -49%
AMD Threadripper 2970WX, AMD Radeon RX Vega 64, AMD Ryzen Threadripper 2970WX
AMD Radeon RX Vega 64
108.2 fps -50%
Medical (medical-02)
Lenovo ThinkStation P620, AMD Ryzen Threadripper PRO 3995WX
AMD Radeon Pro W6800
116 fps
AMD Ryzen 9 5900X, AMD Ryzen 9 5900X
NVIDIA Titan RTX
90.8 fps -22%
AMD Ryzen 9 5950X, AMD Ryzen 9 5950X
NVIDIA Titan RTX
90.6 fps -22%
Intel Core i9-11900K, Intel Core i9-11900K
NVIDIA Titan RTX
90 fps -22%
AMD Radeon RX Vega 64, AMD Ryzen 9 3900X
AMD Radeon RX Vega 64
73.8 fps -36%
AMD Threadripper 2970WX, AMD Radeon RX Vega 64, AMD Ryzen Threadripper 2970WX
AMD Radeon RX Vega 64
30.86 fps -73%
Maya (maya-05)
AMD Ryzen 9 5950X, AMD Ryzen 9 5950X
NVIDIA Titan RTX
460.3 fps +17%
AMD Ryzen 9 5900X, AMD Ryzen 9 5900X
NVIDIA Titan RTX
458 fps +16%
Intel Core i9-11900K, Intel Core i9-11900K
NVIDIA Titan RTX
454 fps +15%
Lenovo ThinkStation P620, AMD Ryzen Threadripper PRO 3995WX
AMD Radeon Pro W6800
395 fps
AMD Radeon RX Vega 64, AMD Ryzen 9 3900X
AMD Radeon RX Vega 64
210.7 fps -47%
AMD Threadripper 2970WX, AMD Radeon RX Vega 64, AMD Ryzen Threadripper 2970WX
AMD Radeon RX Vega 64
195.6 fps -50%
Energy (energy-02)
Lenovo ThinkStation P620, AMD Ryzen Threadripper PRO 3995WX
AMD Radeon Pro W6800
87.8 fps
Intel Core i9-11900K, Intel Core i9-11900K
NVIDIA Titan RTX
53.7 fps -39%
AMD Ryzen 9 5900X, AMD Ryzen 9 5900X
NVIDIA Titan RTX
52 fps -41%
AMD Ryzen 9 5950X, AMD Ryzen 9 5950X
NVIDIA Titan RTX
52 fps -41%
AMD Radeon RX Vega 64, AMD Ryzen 9 3900X
AMD Radeon RX Vega 64
23.76 fps -73%
AMD Threadripper 2970WX, AMD Radeon RX Vega 64, AMD Ryzen Threadripper 2970WX
AMD Radeon RX Vega 64
22.98 fps -74%
Catia (catia-05)
AMD Ryzen 9 5950X, AMD Ryzen 9 5950X
NVIDIA Titan RTX
430 fps +11%
Intel Core i9-11900K, Intel Core i9-11900K
NVIDIA Titan RTX
415 fps +7%
Lenovo ThinkStation P620, AMD Ryzen Threadripper PRO 3995WX
AMD Radeon Pro W6800
389 fps
AMD Ryzen 9 5900X, AMD Ryzen 9 5900X
NVIDIA Titan RTX
374.8 fps -4%
AMD Radeon RX Vega 64, AMD Ryzen 9 3900X
AMD Radeon RX Vega 64
240.6 fps -38%
AMD Threadripper 2970WX, AMD Radeon RX Vega 64, AMD Ryzen Threadripper 2970WX
AMD Radeon RX Vega 64
225.1 fps -42%
3ds Max (3dsmax-06)
Lenovo ThinkStation P620, AMD Ryzen Threadripper PRO 3995WX
AMD Radeon Pro W6800
318 fps
AMD Ryzen 9 5900X, AMD Ryzen 9 5900X
NVIDIA Titan RTX
291.3 fps -8%
AMD Ryzen 9 5950X, AMD Ryzen 9 5950X
NVIDIA Titan RTX
290.5 fps -9%
Intel Core i9-11900K, Intel Core i9-11900K
NVIDIA Titan RTX
287 fps -10%
AMD Radeon RX Vega 64, AMD Ryzen 9 3900X
AMD Radeon RX Vega 64
158.3 fps -50%
AMD Threadripper 2970WX, AMD Radeon RX Vega 64, AMD Ryzen Threadripper 2970WX
AMD Radeon RX Vega 64
140.8 fps -56%
SPECviewperf 12
1900x1060 Solidworks (sw-03)
AMD Ryzen 9 5950X, AMD Ryzen 9 5950X
NVIDIA Titan RTX
196.8 fps +6%
Lenovo ThinkStation P620, AMD Ryzen Threadripper PRO 3995WX
AMD Radeon Pro W6800
185 fps
Intel Core i9-11900K, Intel Core i9-11900K
NVIDIA Titan RTX
182 fps -2%
AMD Ryzen 9 5900X, AMD Ryzen 9 5900X
NVIDIA Titan RTX
174.9 fps -5%
AMD Radeon RX Vega 64, AMD Ryzen 9 3900X
AMD Radeon RX Vega 64
80.9 fps -56%
AMD Threadripper 2970WX, AMD Radeon RX Vega 64, AMD Ryzen Threadripper 2970WX
AMD Radeon RX Vega 64
72.4 fps -61%
1900x1060 Siemens NX (snx-02)
AMD Ryzen 9 5900X, AMD Ryzen 9 5900X
NVIDIA Titan RTX
273.2 fps +12%
AMD Ryzen 9 5950X, AMD Ryzen 9 5950X
NVIDIA Titan RTX
264.7 fps +9%
Intel Core i9-11900K, Intel Core i9-11900K
NVIDIA Titan RTX
245 fps +1%
Lenovo ThinkStation P620, AMD Ryzen Threadripper PRO 3995WX
AMD Radeon Pro W6800
243 fps
AMD Threadripper 2970WX, AMD Radeon RX Vega 64, AMD Ryzen Threadripper 2970WX
AMD Radeon RX Vega 64
23.16 fps -90%
AMD Radeon RX Vega 64, AMD Ryzen 9 3900X
AMD Radeon RX Vega 64
21.32 fps -91%
1900x1060 Showcase (showcase-01)
Lenovo ThinkStation P620, AMD Ryzen Threadripper PRO 3995WX
AMD Radeon Pro W6800
215 fps
Intel Core i9-11900K, Intel Core i9-11900K
NVIDIA Titan RTX
203 fps -6%
AMD Ryzen 9 5900X, AMD Ryzen 9 5900X
NVIDIA Titan RTX
191.1 fps -11%
AMD Ryzen 9 5950X, AMD Ryzen 9 5950X
NVIDIA Titan RTX
190.8 fps -11%
AMD Threadripper 2970WX, AMD Radeon RX Vega 64, AMD Ryzen Threadripper 2970WX
AMD Radeon RX Vega 64
110.8 fps -48%
AMD Radeon RX Vega 64, AMD Ryzen 9 3900X
AMD Radeon RX Vega 64
110.3 fps -49%
1900x1060 Medical (medical-01)
Lenovo ThinkStation P620, AMD Ryzen Threadripper PRO 3995WX
AMD Radeon Pro W6800
165 fps
AMD Ryzen 9 5900X, AMD Ryzen 9 5900X
NVIDIA Titan RTX
90.7 fps -45%
AMD Ryzen 9 5950X, AMD Ryzen 9 5950X
NVIDIA Titan RTX
87.8 fps -47%
Intel Core i9-11900K, Intel Core i9-11900K
NVIDIA Titan RTX
87.8 fps -47%
AMD Radeon RX Vega 64, AMD Ryzen 9 3900X
AMD Radeon RX Vega 64
50.2 fps -70%
AMD Threadripper 2970WX, AMD Radeon RX Vega 64, AMD Ryzen Threadripper 2970WX
AMD Radeon RX Vega 64
45.66 fps -72%
1900x1060 Maya (maya-04)
Intel Core i9-11900K, Intel Core i9-11900K
NVIDIA Titan RTX
199 fps +27%
AMD Ryzen 9 5950X, AMD Ryzen 9 5950X
NVIDIA Titan RTX
189.7 fps +21%
AMD Ryzen 9 5900X, AMD Ryzen 9 5900X
NVIDIA Titan RTX
188.3 fps +20%
Lenovo ThinkStation P620, AMD Ryzen Threadripper PRO 3995WX
AMD Radeon Pro W6800
157 fps
AMD Radeon RX Vega 64, AMD Ryzen 9 3900X
AMD Radeon RX Vega 64
104.6 fps -33%
AMD Threadripper 2970WX, AMD Radeon RX Vega 64, AMD Ryzen Threadripper 2970WX
AMD Radeon RX Vega 64
74.5 fps -53%
1900x1060 Energy (energy-01)
Lenovo ThinkStation P620, AMD Ryzen Threadripper PRO 3995WX
AMD Radeon Pro W6800
37.8 fps
AMD Ryzen 9 5900X, AMD Ryzen 9 5900X
NVIDIA Titan RTX
28.31 fps -25%
Intel Core i9-11900K, Intel Core i9-11900K
NVIDIA Titan RTX
28.2 fps -25%
AMD Ryzen 9 5950X, AMD Ryzen 9 5950X
NVIDIA Titan RTX
27.88 fps -26%
AMD Radeon RX Vega 64, AMD Ryzen 9 3900X
AMD Radeon RX Vega 64
12.74 fps -66%
AMD Threadripper 2970WX, AMD Radeon RX Vega 64, AMD Ryzen Threadripper 2970WX
AMD Radeon RX Vega 64
12.13 fps -68%
1900x1060 Creo (creo-01)
AMD Ryzen 9 5900X, AMD Ryzen 9 5900X
NVIDIA Titan RTX
173 fps +71%
Intel Core i9-11900K, Intel Core i9-11900K
NVIDIA Titan RTX
173 fps +71%
AMD Ryzen 9 5950X, AMD Ryzen 9 5950X
NVIDIA Titan RTX
141.9 fps +40%
Lenovo ThinkStation P620, AMD Ryzen Threadripper PRO 3995WX
AMD Radeon Pro W6800
101 fps
AMD Radeon RX Vega 64, AMD Ryzen 9 3900X
AMD Radeon RX Vega 64
58 fps -43%
AMD Threadripper 2970WX, AMD Radeon RX Vega 64, AMD Ryzen Threadripper 2970WX
AMD Radeon RX Vega 64
52.1 fps -48%
1900x1060 Catia (catia-04)
Intel Core i9-11900K, Intel Core i9-11900K
NVIDIA Titan RTX
269 fps +8%
AMD Ryzen 9 5900X, AMD Ryzen 9 5900X
NVIDIA Titan RTX
262.7 fps +6%
Lenovo ThinkStation P620, AMD Ryzen Threadripper PRO 3995WX
AMD Radeon Pro W6800
248 fps
AMD Ryzen 9 5950X, AMD Ryzen 9 5950X
NVIDIA Titan RTX
237.7 fps -4%
AMD Radeon RX Vega 64, AMD Ryzen 9 3900X
AMD Radeon RX Vega 64
162.2 fps -35%
AMD Threadripper 2970WX, AMD Radeon RX Vega 64, AMD Ryzen Threadripper 2970WX
AMD Radeon RX Vega 64
150.6 fps -39%
1900x1060 3ds Max (3dsmax-05)
Lenovo ThinkStation P620, AMD Ryzen Threadripper PRO 3995WX
AMD Radeon Pro W6800
311 fps
AMD Ryzen 9 5900X, AMD Ryzen 9 5900X
NVIDIA Titan RTX
292.6 fps -6%
AMD Ryzen 9 5950X, AMD Ryzen 9 5950X
NVIDIA Titan RTX
291.3 fps -6%
Intel Core i9-11900K, Intel Core i9-11900K
NVIDIA Titan RTX
289 fps -7%
AMD Radeon RX Vega 64, AMD Ryzen 9 3900X
AMD Radeon RX Vega 64
158.9 fps -49%
AMD Threadripper 2970WX, AMD Radeon RX Vega 64, AMD Ryzen Threadripper 2970WX
AMD Radeon RX Vega 64
144.5 fps -54%
LuxMark v2.0 64Bit
Room GPUs-only
Lenovo ThinkStation P620, AMD Ryzen Threadripper PRO 3995WX
AMD Radeon Pro W6800
4483 Samples/s
Sala GPUs-only
Lenovo ThinkStation P620, AMD Ryzen Threadripper PRO 3995WX
AMD Radeon Pro W6800
3260 Samples/s
ComputeMark v2.1
1024x600 Normal, QJuliaRayTrace
Lenovo ThinkStation P620, AMD Ryzen Threadripper PRO 3995WX
AMD Radeon Pro W6800
9695 Points
1024x600 Normal, Mandel Scalar
Lenovo ThinkStation P620, AMD Ryzen Threadripper PRO 3995WX
AMD Radeon Pro W6800
8733 Points
1024x600 Normal, Mandel Vector
Lenovo ThinkStation P620, AMD Ryzen Threadripper PRO 3995WX
AMD Radeon Pro W6800
7356 Points
1024x600 Normal, Fluid 2DTexArr
Lenovo ThinkStation P620, AMD Ryzen Threadripper PRO 3995WX
AMD Radeon Pro W6800
3283 Points
1024x600 Normal, Fluid 3DTex
Lenovo ThinkStation P620, AMD Ryzen Threadripper PRO 3995WX
AMD Radeon Pro W6800
4867 Points
1024x600 Normal, Score
Lenovo ThinkStation P620, AMD Ryzen Threadripper PRO 3995WX
AMD Radeon Pro W6800
33935 Points
PCMark 10
Score
AMD Ryzen 9 5950X, AMD Ryzen 9 5950X
NVIDIA Titan RTX
8778 Points +27%
AMD Ryzen 9 5900X, AMD Ryzen 9 5900X
NVIDIA Titan RTX
8480 Points +23%
Intel Core i9-11900K, Intel Core i9-11900K
NVIDIA Titan RTX
7745 Points +12%
AMD Ryzen Threadripper 2950X (16 core, 32 threads) Review, AMD Ryzen Threadripper 2950X
AMD Radeon RX Vega 64
7451 Points +8%
AMD Radeon RX Vega 64, AMD Ryzen 9 3900X
AMD Radeon RX Vega 64
7298 Points +6%
Lenovo ThinkStation P620, AMD Ryzen Threadripper PRO 3995WX
AMD Radeon Pro W6800
6893 Points
Asus X299 Prime Desktop, Intel Core i9-10980XE
NVIDIA GeForce GTX 1080 Ti (Desktop)
6809 Points -1%
AMD Threadripper 2970WX, AMD Radeon RX Vega 64, AMD Ryzen Threadripper 2970WX
AMD Radeon RX Vega 64
5481 Points -20%
Digital Content Creation
AMD Ryzen 9 5950X, AMD Ryzen 9 5950X
NVIDIA Titan RTX
14607 Points +23%
AMD Ryzen 9 5900X, AMD Ryzen 9 5900X
NVIDIA Titan RTX
13801 Points +16%
Lenovo ThinkStation P620, AMD Ryzen Threadripper PRO 3995WX
AMD Radeon Pro W6800
11919 Points
Intel Core i9-11900K, Intel Core i9-11900K
NVIDIA Titan RTX
11863 Points 0%
AMD Radeon RX Vega 64, AMD Ryzen 9 3900X
AMD Radeon RX Vega 64
10181 Points -15%
AMD Ryzen Threadripper 2950X (16 core, 32 threads) Review, AMD Ryzen Threadripper 2950X
AMD Radeon RX Vega 64
8266 Points -31%
AMD Threadripper 2970WX, AMD Radeon RX Vega 64, AMD Ryzen Threadripper 2970WX
AMD Radeon RX Vega 64
7871 Points -34%
Productivity
AMD Ryzen 9 5950X, AMD Ryzen 9 5950X
NVIDIA Titan RTX
11163 Points +45%
AMD Ryzen 9 5900X, AMD Ryzen 9 5900X
NVIDIA Titan RTX
10079 Points +31%
Intel Core i9-11900K, Intel Core i9-11900K
NVIDIA Titan RTX
10039 Points +31%
AMD Radeon RX Vega 64, AMD Ryzen 9 3900X
AMD Radeon RX Vega 64
9420 Points +23%
AMD Ryzen Threadripper 2950X (16 core, 32 threads) Review, AMD Ryzen Threadripper 2950X
AMD Radeon RX Vega 64
7703 Points 0%
Lenovo ThinkStation P620, AMD Ryzen Threadripper PRO 3995WX
AMD Radeon Pro W6800
7681 Points
AMD Threadripper 2970WX, AMD Radeon RX Vega 64, AMD Ryzen Threadripper 2970WX
AMD Radeon RX Vega 64
7120 Points -7%
Essentials
AMD Ryzen 9 5950X, AMD Ryzen 9 5950X
NVIDIA Titan RTX
11255 Points +16%
AMD Radeon RX Vega 64, AMD Ryzen 9 3900X
AMD Radeon RX Vega 64
10998 Points +13%
AMD Ryzen 9 5900X, AMD Ryzen 9 5900X
NVIDIA Titan RTX
10964 Points +13%
Intel Core i9-11900K, Intel Core i9-11900K
NVIDIA Titan RTX
10585 Points +9%
Lenovo ThinkStation P620, AMD Ryzen Threadripper PRO 3995WX
AMD Radeon Pro W6800
9711 Points
AMD Ryzen Threadripper 2950X (16 core, 32 threads) Review, AMD Ryzen Threadripper 2950X
AMD Radeon RX Vega 64
8203 Points -16%
AMD Threadripper 2970WX, AMD Radeon RX Vega 64, AMD Ryzen Threadripper 2970WX
AMD Radeon RX Vega 64
7976 Points -18%

3D performance

Although the AMD Radeon Pro W6800 is strictly a high-end workstation graphics card, we chose a few games to evaluate the GPU's performance in comparison with the latest gaming graphics cards. With its built-in 32 GB of VRAM, the AMD Radeon Pro W6800 is actually perfectly suited for 4K gaming. This is also possible with this graphics card, given that the AMD Radeon Pro W6800 achieved smooth frame rates in all the games that we tested. Nevertheless, it's impossible to ignore the deficit when directly comparing it with gaming graphics cards. The AMD Radeon Pro W6800 usually ranks between the Nvidia GeForce RTX 3070 and the AMD Radeon RX 6800 XT. Performance varies from game to game depending on the drivers, and it's sometimes even significantly worse. For this reason, we'd like to point out once again that this is not a gaming graphics card, and that consequently, the resulting performance doesn't reflect what this graphics card was designed for. Please refer to our GPU Benchmarks article for further comparisons and benchmarks.

3DMark
Fire Strike Extreme Graphics
AMD Radeon RX 6800 XT
Radeon RX 6800 XT, R9 5950X, Intel Optane 905P 480GB 2.5
25015 Points +27%
Nvidia GeForce RTX 3090 Founders Edition
NVIDIA GeForce RTX 3090, R9 5900X, Corsair MP600
22075 Points +12%
MSI GeForce RTX 3080 Gaming X Trio
NVIDIA GeForce RTX 3080, R9 5900X, Intel Optane 905P 480GB 2.5
20007 Points +1%
Lenovo ThinkStation P620
Radeon Pro W6800, TR Pro 3995WX, WDC PC SN720 SDAPNTW-256G
19729 Points
AMD Radeon RX 6700 XT
Radeon RX 6700 XT, R9 5900X, Corsair MP600
17009 Points -14%
MSI GeForce RTX 3070 Ventus 3X
NVIDIA GeForce RTX 3070, R9 5900X, Intel Optane 905P 480GB 2.5
15722 Points -20%
Average NVIDIA GeForce RTX 2070 Super (Desktop)
  (11382 - 12044, n=7)
11850 Points -40%
Average NVIDIA GeForce RTX 2070 (Desktop)
  (9979 - 11423, n=5)
10987 Points -44%
Average NVIDIA GeForce RTX 2060 Super (Desktop)
  (10182 - 10726, n=6)
10498 Points -47%
1920x1080 Fire Strike Graphics
AMD Radeon RX 6800 XT
Radeon RX 6800 XT, R9 5950X, Intel Optane 905P 480GB 2.5
49735 Points +78%
Nvidia GeForce RTX 3090 Founders Edition
NVIDIA GeForce RTX 3090, R9 5900X, Corsair MP600
41298 Points +48%
MSI GeForce RTX 3080 Gaming X Trio
NVIDIA GeForce RTX 3080, R9 5900X, Intel Optane 905P 480GB 2.5
37604 Points +35%
AMD Radeon RX 6700 XT
Radeon RX 6700 XT, R9 5900X, Corsair MP600
35136 Points +26%
MSI GeForce RTX 3070 Ventus 3X
NVIDIA GeForce RTX 3070, R9 5900X, Intel Optane 905P 480GB 2.5
31020 Points +11%
Lenovo ThinkStation P620
Radeon Pro W6800, TR Pro 3995WX, WDC PC SN720 SDAPNTW-256G
27937 Points
Average NVIDIA GeForce RTX 2070 Super (Desktop)
  (22819 - 25799, n=8)
24645 Points -12%
Average NVIDIA GeForce RTX 2070 (Desktop)
  (16770 - 24242, n=6)
21999 Points -21%
Average NVIDIA GeForce RTX 2060 Super (Desktop)
  (20522 - 22764, n=7)
21970 Points -21%
2560x1440 Time Spy Graphics
Nvidia GeForce RTX 3090 Founders Edition
NVIDIA GeForce RTX 3090, R9 5900X, Corsair MP600
18685 Points +54%
MSI GeForce RTX 3080 Gaming X Trio
NVIDIA GeForce RTX 3080, R9 5900X, Intel Optane 905P 480GB 2.5
17604 Points +45%
AMD Radeon RX 6800 XT
Radeon RX 6800 XT, R9 5950X, Intel Optane 905P 480GB 2.5
17603 Points +45%
MSI GeForce RTX 3070 Ventus 3X
NVIDIA GeForce RTX 3070, R9 5900X, Intel Optane 905P 480GB 2.5
13111 Points +8%
Lenovo ThinkStation P620
Radeon Pro W6800, TR Pro 3995WX, WDC PC SN720 SDAPNTW-256G
12136 Points
AMD Radeon RX 6700 XT
Radeon RX 6700 XT, R9 5900X, Corsair MP600
11473 Points -5%
Average NVIDIA GeForce RTX 2070 Super (Desktop)
  (9564 - 10094, n=8)
9846 Points -19%
Average NVIDIA GeForce RTX 2070 (Desktop)
  (7445 - 9656, n=6)
8952 Points -26%
Average NVIDIA GeForce RTX 2060 Super (Desktop)
  (8396 - 8795, n=7)
8631 Points -29%
3DMark 11
1280x720 Performance GPU
Nvidia GeForce RTX 3090 Founders Edition
NVIDIA GeForce RTX 3090, R9 5900X, Corsair MP600
55144 Points +24%
AMD Radeon RX 6800 XT
Radeon RX 6800 XT, R9 5950X, Intel Optane 905P 480GB 2.5
52046 Points +17%
MSI GeForce RTX 3080 Gaming X Trio
NVIDIA GeForce RTX 3080, R9 5900X, Intel Optane 905P 480GB 2.5
50087 Points +13%
Lenovo ThinkStation P620
Radeon Pro W6800, TR Pro 3995WX, WDC PC SN720 SDAPNTW-256G
44404 Points
AMD Radeon RX 6700 XT
Radeon RX 6700 XT, R9 5900X, Corsair MP600
43888 Points -1%
MSI GeForce RTX 3070 Ventus 3X
NVIDIA GeForce RTX 3070, R9 5900X, Intel Optane 905P 480GB 2.5
43005 Points -3%
Average NVIDIA GeForce RTX 2070 Super (Desktop)
  (33257 - 37235, n=7)
34830 Points -22%
Average NVIDIA GeForce RTX 2070 (Desktop)
  (22174 - 32373, n=7)
29866 Points -33%
Average NVIDIA GeForce RTX 2060 Super (Desktop)
  (29148 - 30099, n=6)
29642 Points -33%
1280x720 Performance
Nvidia GeForce RTX 3090 Founders Edition
NVIDIA GeForce RTX 3090, R9 5900X, Corsair MP600
38620 Points +28%
AMD Radeon RX 6800 XT
Radeon RX 6800 XT, R9 5950X, Intel Optane 905P 480GB 2.5
38057 Points +26%
MSI GeForce RTX 3080 Gaming X Trio
NVIDIA GeForce RTX 3080, R9 5900X, Intel Optane 905P 480GB 2.5
35399 Points +17%
AMD Radeon RX 6700 XT
Radeon RX 6700 XT, R9 5900X, Corsair MP600
34078 Points +13%
MSI GeForce RTX 3070 Ventus 3X
NVIDIA GeForce RTX 3070, R9 5900X, Intel Optane 905P 480GB 2.5
33248 Points +10%
Lenovo ThinkStation P620
Radeon Pro W6800, TR Pro 3995WX, WDC PC SN720 SDAPNTW-256G
30190 Points
Average NVIDIA GeForce RTX 2070 Super (Desktop)
  (24879 - 35274, n=7)
28582 Points -5%
Average NVIDIA GeForce RTX 2060 Super (Desktop)
  (22211 - 30486, n=6)
26110 Points -14%
Average NVIDIA GeForce RTX 2070 (Desktop)
  (15341 - 27206, n=7)
23703 Points -21%
Unigine Superposition
1280x720 720p Low
Average NVIDIA GeForce RTX 2070 Super (Desktop)
  (26742 - 45424, n=3)
38495 Points +71%
AMD Radeon RX 6800 XT
Radeon RX 6800 XT, R9 5950X, Intel Optane 905P 480GB 2.5
36452 Points +62%
Average NVIDIA GeForce RTX 2060 Super (Desktop)
  (26634 - 40961, n=3)
35859 Points +59%
AMD Radeon RX 6700 XT
Radeon RX 6700 XT, R9 5900X, Corsair MP600
34713 Points +54%
Nvidia GeForce RTX 3090 Founders Edition
NVIDIA GeForce RTX 3090, R9 5900X, Corsair MP600
34649 Points +54%
MSI GeForce RTX 3070 Ventus 3X
NVIDIA GeForce RTX 3070, R9 5900X, Intel Optane 905P 480GB 2.5
34602 Points +54%
MSI GeForce RTX 3080 Gaming X Trio
NVIDIA GeForce RTX 3080, R9 5900X, Intel Optane 905P 480GB 2.5
32183 Points +43%
Lenovo ThinkStation P620
Radeon Pro W6800, TR Pro 3995WX, WDC PC SN720 SDAPNTW-256G
22537 Points
1920x1080 1080p High
Nvidia GeForce RTX 3090 Founders Edition
NVIDIA GeForce RTX 3090, R9 5900X, Corsair MP600
23853 Points +23%
AMD Radeon RX 6800 XT
Radeon RX 6800 XT, R9 5950X, Intel Optane 905P 480GB 2.5
22265 Points +14%
MSI GeForce RTX 3080 Gaming X Trio
NVIDIA GeForce RTX 3080, R9 5900X, Intel Optane 905P 480GB 2.5
21912 Points +13%
Lenovo ThinkStation P620
Radeon Pro W6800, TR Pro 3995WX, WDC PC SN720 SDAPNTW-256G
19450 Points
MSI GeForce RTX 3070 Ventus 3X
NVIDIA GeForce RTX 3070, R9 5900X, Intel Optane 905P 480GB 2.5
17244 Points -11%
AMD Radeon RX 6700 XT
Radeon RX 6700 XT, R9 5900X, Corsair MP600
15832 Points -19%
Average NVIDIA GeForce RTX 2070 Super (Desktop)
  (13655 - 13832, n=3)
13765 Points -29%
Average NVIDIA GeForce RTX 2060 Super (Desktop)
  (11421 - 11785, n=3)
11649 Points -40%
1920x1080 1080p Extreme
Nvidia GeForce RTX 3090 Founders Edition
NVIDIA GeForce RTX 3090, R9 5900X, Corsair MP600
11806 Points +39%
MSI GeForce RTX 3080 Gaming X Trio
NVIDIA GeForce RTX 3080, R9 5900X, Intel Optane 905P 480GB 2.5
10822 Points +28%
AMD Radeon RX 6800 XT
Radeon RX 6800 XT, R9 5950X, Intel Optane 905P 480GB 2.5
10046 Points +18%
Lenovo ThinkStation P620
Radeon Pro W6800, TR Pro 3995WX, WDC PC SN720 SDAPNTW-256G
8478 Points
MSI GeForce RTX 3070 Ventus 3X
NVIDIA GeForce RTX 3070, R9 5900X, Intel Optane 905P 480GB 2.5
8365 Points -1%
AMD Radeon RX 6700 XT
Radeon RX 6700 XT, R9 5900X, Corsair MP600
6804 Points -20%
Average NVIDIA GeForce RTX 2070 Super (Desktop)
  (6161 - 6178, n=3)
6169 Points -27%
Average NVIDIA GeForce RTX 2060 Super (Desktop)
  (5049 - 5143, n=3)
5105 Points -40%
3840x2160 4k Optimized
Nvidia GeForce RTX 3090 Founders Edition
NVIDIA GeForce RTX 3090, R9 5900X, Corsair MP600
15794 Points +30%
MSI GeForce RTX 3080 Gaming X Trio
NVIDIA GeForce RTX 3080, R9 5900X, Intel Optane 905P 480GB 2.5
14243 Points +17%
AMD Radeon RX 6800 XT
Radeon RX 6800 XT, R9 5950X, Intel Optane 905P 480GB 2.5
13471 Points +11%
Lenovo ThinkStation P620
Radeon Pro W6800, TR Pro 3995WX, WDC PC SN720 SDAPNTW-256G
12133 Points
MSI GeForce RTX 3070 Ventus 3X
NVIDIA GeForce RTX 3070, R9 5900X, Intel Optane 905P 480GB 2.5
10673 Points -12%
AMD Radeon RX 6700 XT
Radeon RX 6700 XT, R9 5900X, Corsair MP600
9106 Points -25%
Average NVIDIA GeForce RTX 2070 Super (Desktop)
  (8096 - 8111, n=3)
8101 Points -33%
Average NVIDIA GeForce RTX 2060 Super (Desktop)
  (6747 - 6863, n=3)
6811 Points -44%
7680x4320 8k Optimized
Nvidia GeForce RTX 3090 Founders Edition
NVIDIA GeForce RTX 3090, R9 5900X, Corsair MP600
7002 Points +45%
MSI GeForce RTX 3080 Gaming X Trio
NVIDIA GeForce RTX 3080, R9 5900X, Intel Optane 905P 480GB 2.5
6346 Points +31%
AMD Radeon RX 6800 XT
Radeon RX 6800 XT, R9 5950X, Intel Optane 905P 480GB 2.5
5256 Points +9%
Lenovo ThinkStation P620
Radeon Pro W6800, TR Pro 3995WX, WDC PC SN720 SDAPNTW-256G
4838 Points
MSI GeForce RTX 3070 Ventus 3X
NVIDIA GeForce RTX 3070, R9 5900X, Intel Optane 905P 480GB 2.5
4639 Points -4%
AMD Radeon RX 6700 XT
Radeon RX 6700 XT, R9 5900X, Corsair MP600
3586 Points -26%
Average NVIDIA GeForce RTX 2070 Super (Desktop)
  (3419 - 3435, n=3)
3429 Points -29%
Average NVIDIA GeForce RTX 2060 Super (Desktop)
  (2873 - 2914, n=3)
2900 Points -40%
Metro Exodus - 3840x2160 Ultra Quality AF:16x
Nvidia GeForce RTX 3090 Founders Edition
NVIDIA GeForce RTX 3090, R9 5900X, Corsair MP600
70.6 (41.43min - 118.98max) fps +29%
MSI GeForce RTX 3080 Gaming X Trio
NVIDIA GeForce RTX 3080, R9 5900X, Intel Optane 905P 480GB 2.5
65.9 (38.48min - 122.03max) fps +20%
AMD Radeon RX 6800 XT
Radeon RX 6800 XT, R9 5950X, Intel Optane 905P 480GB 2.5
56.3 (40.14min - 64.28max) fps +3%
Lenovo ThinkStation P620
Radeon Pro W6800, TR Pro 3995WX, WDC PC SN720 SDAPNTW-256G
54.7 (36.07min - 72.76max) fps
MSI GeForce RTX 3070 Ventus 3X
NVIDIA GeForce RTX 3070, R9 5900X, Intel Optane 905P 480GB 2.5
48.6 (29.82min - 99.64max) fps -11%
AMD Radeon RX 6700 XT
Radeon RX 6700 XT, R9 5900X, Corsair MP600
42.3 (27.78min - 56.35max) fps -23%
Average NVIDIA GeForce RTX 2070 Super (Desktop)
  (35 - 38.1, n=5)
36.8 fps -33%
Average NVIDIA GeForce RTX 2070 (Desktop)
  (30.5 - 32.7, n=3)
31.7 fps -42%
Average NVIDIA GeForce RTX 2060 Super (Desktop)
  (29.7 - 32.2, n=4)
30.9 fps -44%
Far Cry New Dawn - 3840x2160 Ultra Preset
Nvidia GeForce RTX 3090 Founders Edition
NVIDIA GeForce RTX 3090, R9 5900X, Corsair MP600
97 (75min - 124max) fps +76%
AMD Radeon RX 6800 XT
Radeon RX 6800 XT, R9 5950X, Intel Optane 905P 480GB 2.5
94 (75min - 129max) fps +71%
MSI GeForce RTX 3080 Gaming X Trio
NVIDIA GeForce RTX 3080, R9 5900X, Intel Optane 905P 480GB 2.5
88 (71min - 110max) fps +60%
MSI GeForce RTX 3070 Ventus 3X
NVIDIA GeForce RTX 3070, R9 5900X, Intel Optane 905P 480GB 2.5
72 (61min - 86max) fps +31%
AMD Radeon RX 6700 XT
Radeon RX 6700 XT, R9 5900X, Corsair MP600
70 (57min - 91max) fps +27%
Average NVIDIA GeForce RTX 2070 Super (Desktop)
  (55 - 58, n=5)
56.8 fps +3%
Lenovo ThinkStation P620
Radeon Pro W6800, TR Pro 3995WX, WDC PC SN720 SDAPNTW-256G
55 (42min - 77max) fps
Average NVIDIA GeForce RTX 2070 (Desktop)
  (49 - 53, n=3)
51 fps -7%
Average NVIDIA GeForce RTX 2060 Super (Desktop)
  (48 - 50, n=4)
49 fps -11%
Far Cry 5 - 3840x2160 Ultra Preset AA:T
Nvidia GeForce RTX 3090 Founders Edition
NVIDIA GeForce RTX 3090, R9 5900X, Corsair MP600
105 (94min - 121max) fps +75%
AMD Radeon RX 6800 XT
Radeon RX 6800 XT, R9 5950X, Intel Optane 905P 480GB 2.5
95 (72min - 124max) fps +58%
MSI GeForce RTX 3080 Gaming X Trio
NVIDIA GeForce RTX 3080, R9 5900X, Intel Optane 905P 480GB 2.5
93 (78min - 109max) fps +55%
MSI GeForce RTX 3070 Ventus 3X
NVIDIA GeForce RTX 3070, R9 5900X, Intel Optane 905P 480GB 2.5
70 (63min - 84max) fps +17%
AMD Radeon RX 6700 XT
Radeon RX 6700 XT, R9 5900X, Corsair MP600
70 (59min - 91max) fps +17%
Lenovo ThinkStation P620
Radeon Pro W6800, TR Pro 3995WX, WDC PC SN720 SDAPNTW-256G
60 (49min - 75max) fps
Average NVIDIA GeForce RTX 2070 Super (Desktop)
  (53 - 56, n=5)
54.4 fps -9%
Average NVIDIA GeForce RTX 2070 (Desktop)
  (46 - 51, n=4)
48.5 fps -19%
Average NVIDIA GeForce RTX 2060 Super (Desktop)
  (45 - 47, n=4)
46 fps -23%
X-Plane 11.11 - 3840x2160 high (fps_test=3)
MSI GeForce RTX 3080 Gaming X Trio
NVIDIA GeForce RTX 3080, R9 5900X, Intel Optane 905P 480GB 2.5
104.8 fps +132%
Average NVIDIA GeForce RTX 2060 Super (Desktop)
  (67 - 131.9, n=4)
101.7 fps +125%
Average NVIDIA GeForce RTX 2070 Super (Desktop)
  (67 - 131.8, n=5)
97.1 fps +115%
Nvidia GeForce RTX 3090 Founders Edition
NVIDIA GeForce RTX 3090, R9 5900X, Corsair MP600
92.8 fps +106%
MSI GeForce RTX 3070 Ventus 3X
NVIDIA GeForce RTX 3070, R9 5900X, Intel Optane 905P 480GB 2.5
84.3 fps +87%
Average NVIDIA GeForce RTX 2070 (Desktop)
 
82.2 fps +82%
AMD Radeon RX 6700 XT
Radeon RX 6700 XT, R9 5900X, Corsair MP600
45.5 fps +1%
Lenovo ThinkStation P620
Radeon Pro W6800, TR Pro 3995WX, WDC PC SN720 SDAPNTW-256G
45.1 fps
AMD Radeon RX 6800 XT
Radeon RX 6800 XT, R9 5950X, Intel Optane 905P 480GB 2.5
40.1 fps -11%
Final Fantasy XV Benchmark - 3840x2160 High Quality
Nvidia GeForce RTX 3090 Founders Edition
NVIDIA GeForce RTX 3090, R9 5900X, Corsair MP600
81.5 fps +34%
MSI GeForce RTX 3080 Gaming X Trio
NVIDIA GeForce RTX 3080, R9 5900X, Intel Optane 905P 480GB 2.5
66 fps +9%
AMD Radeon RX 6800 XT
Radeon RX 6800 XT, R9 5950X, Intel Optane 905P 480GB 2.5
65.2 fps +7%
Lenovo ThinkStation P620
Radeon Pro W6800, TR Pro 3995WX, WDC PC SN720 SDAPNTW-256G
60.8 fps
MSI GeForce RTX 3070 Ventus 3X
NVIDIA GeForce RTX 3070, R9 5900X, Intel Optane 905P 480GB 2.5
57.6 fps -5%
AMD Radeon RX 6700 XT
Radeon RX 6700 XT, R9 5900X, Corsair MP600
47.7 fps -22%
Average NVIDIA GeForce RTX 2070 Super (Desktop)
  (40.6 - 44.9, n=5)
42.6 fps -30%
Average NVIDIA GeForce RTX 2070 (Desktop)
  (37.1 - 39.3, n=4)
38.2 fps -37%
Average NVIDIA GeForce RTX 2060 Super (Desktop)
  (34.9 - 38, n=4)
36.5 fps -40%
Dota 2 Reborn - 3840x2160 ultra (3/3) best looking
Nvidia GeForce RTX 3090 Founders Edition
NVIDIA GeForce RTX 3090, R9 5900X, Corsair MP600
138.6 (69.8min) fps +47%
Average NVIDIA GeForce RTX 2070 Super (Desktop)
  (106.7 - 146.3, n=5)
129.3 fps +38%
MSI GeForce RTX 3070 Ventus 3X
NVIDIA GeForce RTX 3070, R9 5900X, Intel Optane 905P 480GB 2.5
128.5 (102.9min) fps +37%
AMD Radeon RX 6800 XT
Radeon RX 6800 XT, R9 5950X, Intel Optane 905P 480GB 2.5
122.2 (105.8min) fps +30%
Average NVIDIA GeForce RTX 2060 Super (Desktop)
  (105.1 - 126.9, n=4)
118.5 fps +26%
Average NVIDIA GeForce RTX 2070 (Desktop)
 
116.1 fps +24%
AMD Radeon RX 6700 XT
Radeon RX 6700 XT, R9 5900X, Corsair MP600
105.8 (89.8min) fps +13%
MSI GeForce RTX 3080 Gaming X Trio
NVIDIA GeForce RTX 3080, R9 5900X, Intel Optane 905P 480GB 2.5
98 (79.1min) fps +4%
Lenovo ThinkStation P620
Radeon Pro W6800, TR Pro 3995WX, WDC PC SN720 SDAPNTW-256G
94 (67.5min) fps
The Witcher 3 - 3840x2160 High Graphics & Postprocessing (Nvidia HairWorks Off)
Nvidia GeForce RTX 3090 Founders Edition
NVIDIA GeForce RTX 3090, R9 5900X, Corsair MP600
148 fps +49%
MSI GeForce RTX 3080 Gaming X Trio
NVIDIA GeForce RTX 3080, R9 5900X, Intel Optane 905P 480GB 2.5
114 (106min - 122max) fps +15%
AMD Radeon RX 6800 XT
Radeon RX 6800 XT, R9 5950X, Intel Optane 905P 480GB 2.5
110 (97min - 117max) fps +11%
Lenovo ThinkStation P620
Radeon Pro W6800, TR Pro 3995WX, WDC PC SN720 SDAPNTW-256G
99.1 (58min, 70.3P0.1, 79.5P1 - 233max) fps
MSI GeForce RTX 3070 Ventus 3X
NVIDIA GeForce RTX 3070, R9 5900X, Intel Optane 905P 480GB 2.5
90.9 (84min - 101max) fps -8%
Average NVIDIA GeForce RTX 2070 Super (Desktop)
  (65.5 - 71, n=5)
68 fps -31%
AMD Radeon RX 6700 XT
Radeon RX 6700 XT, R9 5900X, Corsair MP600
63 fps -36%
Average NVIDIA GeForce RTX 2070 (Desktop)
  (55.9 - 67, n=4)
62.3 fps -37%
Average NVIDIA GeForce RTX 2060 Super (Desktop)
  (57 - 61, n=4)
58.8 fps -41%
F1 2020 - 3840x2160 Ultra High Preset AA:T AF:16x
Nvidia GeForce RTX 3090 Founders Edition
NVIDIA GeForce RTX 3090, R9 5900X, Corsair MP600
135 (116min - 157max) fps +24%
AMD Radeon RX 6800 XT
Radeon RX 6800 XT, R9 5950X, Intel Optane 905P 480GB 2.5
128 (106min - 152max) fps +17%
MSI GeForce RTX 3080 Gaming X Trio
NVIDIA GeForce RTX 3080, R9 5900X, Intel Optane 905P 480GB 2.5
114 (100min - 136max) fps +5%
Lenovo ThinkStation P620
Radeon Pro W6800, TR Pro 3995WX, WDC PC SN720 SDAPNTW-256G
109 (87min - 131max) fps
MSI GeForce RTX 3070 Ventus 3X
NVIDIA GeForce RTX 3070, R9 5900X, Intel Optane 905P 480GB 2.5
88.7 (76min - 101max) fps -19%
AMD Radeon RX 6700 XT
Radeon RX 6700 XT, R9 5900X, Corsair MP600
83 fps -24%
Average NVIDIA GeForce RTX 2070 Super (Desktop)
  (67.6 - 71.4, n=3)
69.2 fps -37%
Average NVIDIA GeForce RTX 2070 (Desktop)
 
61 fps -44%
Average NVIDIA GeForce RTX 2060 Super (Desktop)
  (55.2 - 57.4, n=4)
56.3 fps -48%
GTA V - 3840x2160 High/On (Advanced Graphics Off) AA:FX AF:8x
Nvidia GeForce RTX 3090 Founders Edition
NVIDIA GeForce RTX 3090, R9 5900X, Corsair MP600
151 (6.66min, 33.3P1 - 81.5max) fps +21%
MSI GeForce RTX 3080 Gaming X Trio
NVIDIA GeForce RTX 3080, R9 5900X, Intel Optane 905P 480GB 2.5
150 (12.6min, 100P1 - 343max) fps +20%
AMD Radeon RX 6800 XT
Radeon RX 6800 XT, R9 5950X, Intel Optane 905P 480GB 2.5
134 (15.5min, 55.6P1 - 252max) fps +7%
Lenovo ThinkStation P620
Radeon Pro W6800, TR Pro 3995WX, WDC PC SN720 SDAPNTW-256G
125 (6.9min, 90.9P1 - 181max) fps
MSI GeForce RTX 3070 Ventus 3X
NVIDIA GeForce RTX 3070, R9 5900X, Intel Optane 905P 480GB 2.5
117 (9.24min, 76.9P1 - 263max) fps -6%
AMD Radeon RX 6700 XT
Radeon RX 6700 XT, R9 5900X, Corsair MP600
96.5 (5.12min, 71.4P1 - 220max) fps -23%
Average NVIDIA GeForce RTX 2070 Super (Desktop)
  (90.1 - 102, n=4)
94.4 fps -24%
Average NVIDIA GeForce RTX 2070 (Desktop)
  (79.9 - 111.9, n=3)
92.6 fps -26%
Average NVIDIA GeForce RTX 2060 Super (Desktop)
  (82.5 - 89, n=4)
84.4 fps -32%
Strange Brigade - 3840x2160 ultra AA:ultra AF:16
Nvidia GeForce RTX 3090 Founders Edition
NVIDIA GeForce RTX 3090, R9 5900X, Corsair MP600
150 (99min, 124P1 - 238max) fps +19%
MSI GeForce RTX 3080 Gaming X Trio
NVIDIA GeForce RTX 3080, R9 5900X, Intel Optane 905P 480GB 2.5
134 (59.3min, 111P1 - 180max) fps +6%
AMD Radeon RX 6800 XT
Radeon RX 6800 XT, R9 5950X, Intel Optane 905P 480GB 2.5
133 (45.6min, 48.7P1 - 316max) fps +6%
Lenovo ThinkStation P620
Radeon Pro W6800, TR Pro 3995WX, WDC PC SN720 SDAPNTW-256G
126 (91.9min, 104P1 - 184max) fps
MSI GeForce RTX 3070 Ventus 3X
NVIDIA GeForce RTX 3070, R9 5900X, Intel Optane 905P 480GB 2.5
96.8 (66.9min, 82.6P1 - 127max) fps -23%
AMD Radeon RX 6700 XT
Radeon RX 6700 XT, R9 5900X, Corsair MP600
91 (73.6min, 77.5P1 - 121max) fps -28%
Average NVIDIA GeForce RTX 2070 Super (Desktop)
  (55.5 - 75, n=2)
65.3 fps -48%
Average NVIDIA GeForce RTX 2060 Super (Desktop)
  (60.6 - 64.7, n=3)
63.3 fps -50%
low med. high ultraQHD4K
GTA V (2015) 181 169 152 89.7 88.1 125
The Witcher 3 (2015) 354 236 199 157 99.1
Dota 2 Reborn (2015) 143.6 119.3 99 85.7 94
Final Fantasy XV Benchmark (2018) 178 174 137 106 60.8
X-Plane 11.11 (2018) 62.2 52 45.4 45.1
Far Cry 5 (2018) 73 70 65 62 64 60
Strange Brigade (2018) 357 282 277 268 212 126
Far Cry New Dawn (2019) 66 61 59 55 55 55
Metro Exodus (2019) 124 121 186 172 171 54.7
F1 2020 (2020) 300 283 225 179 109

Emissions

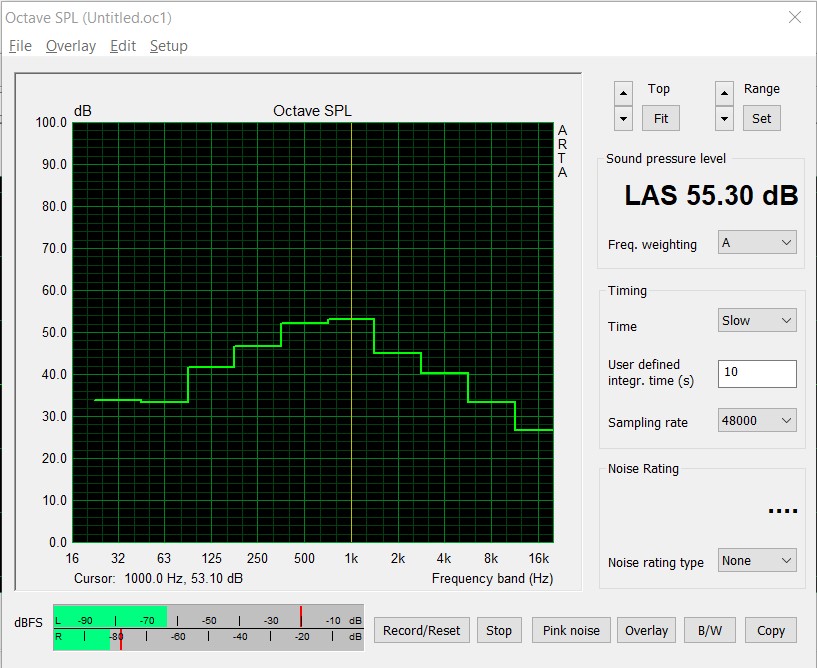
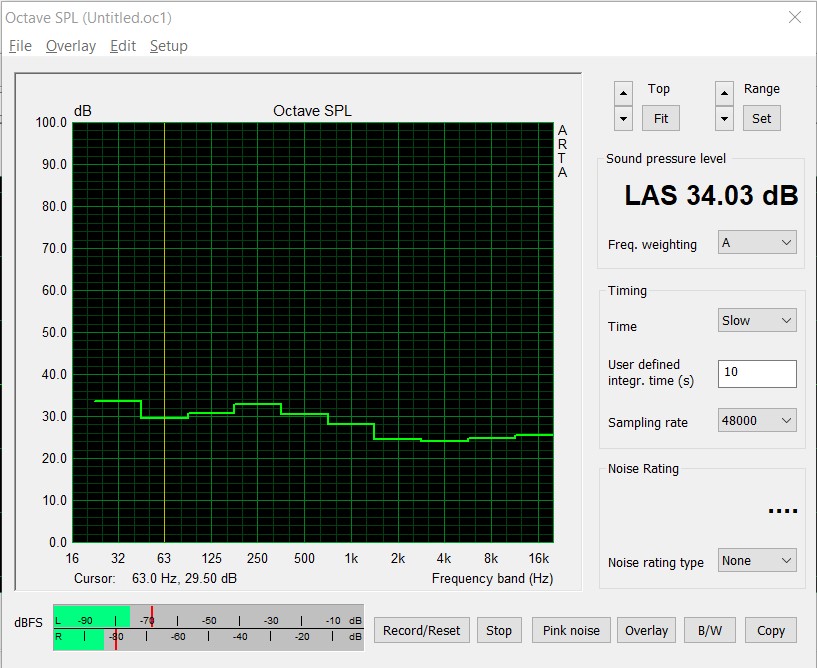
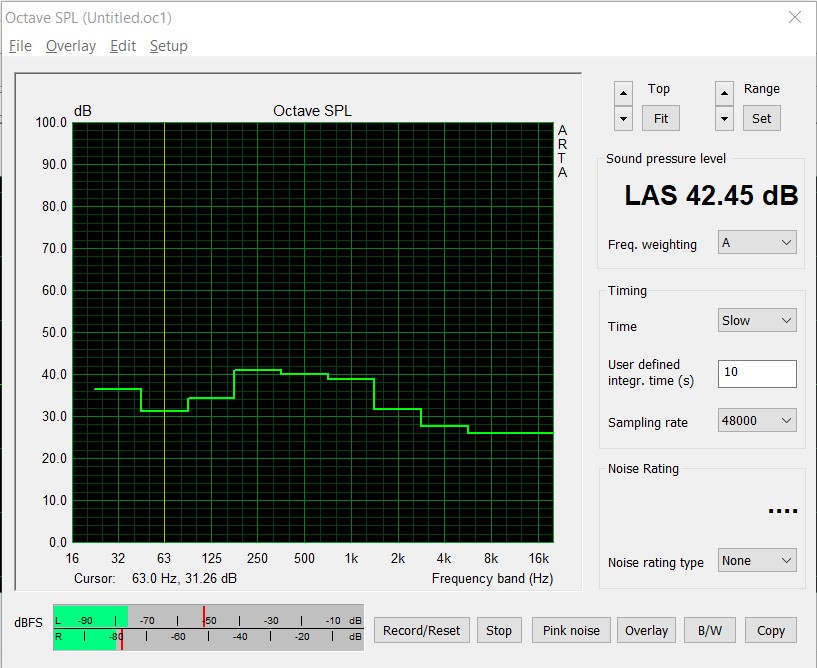
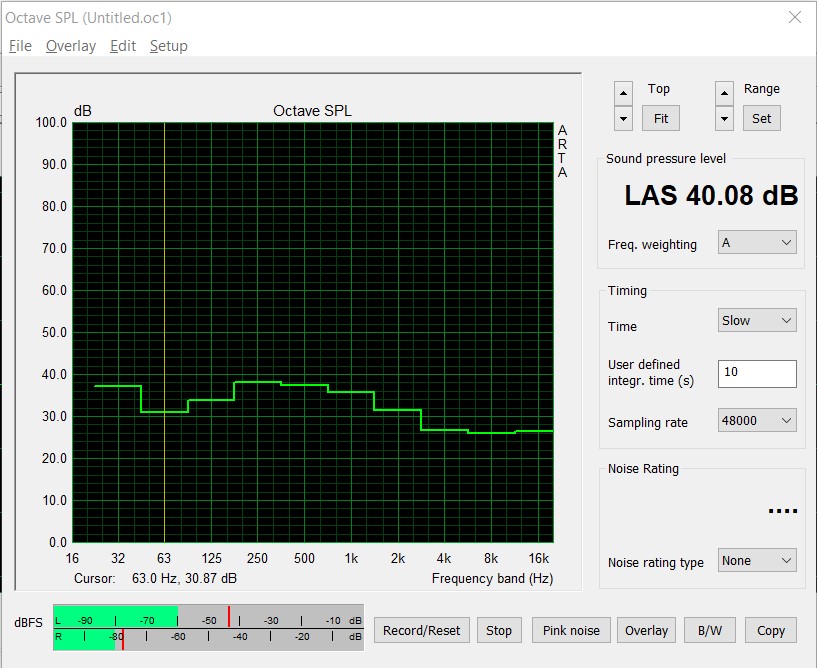
The Lenovo ThinkStation P620 is surprisingly quiet

You shouldn't expect top rates in terms of emissions due to the built-in components. Nevertheless, the system surprises with a pleasant operating noise in normal use, which is audible but not annoying by far. Only under full load does the Lenovo ThinkStation P620 draw attention to itself due to its accelerating fans. With a maximum of 42.4 dB(A), however, the system is still much quieter than some gaming laptops or mobile workstations. Even though this direct comparison is somewhat flawed, the system's volume appears to be a bit better from a subjective standpoint. Right after turning it on, the system makes it clear that it can get much louder. Fortunately, the fan control reduces the speed after a while, since you wouldn't want to have 55 dB(A) under your desk at all times.

System noise (system start)
System noise (idle usage)
System noise (Prime95 and FurMark)
System noise (The Witcher 3)

The Threadripper Pro 3995WX keeps a cool head

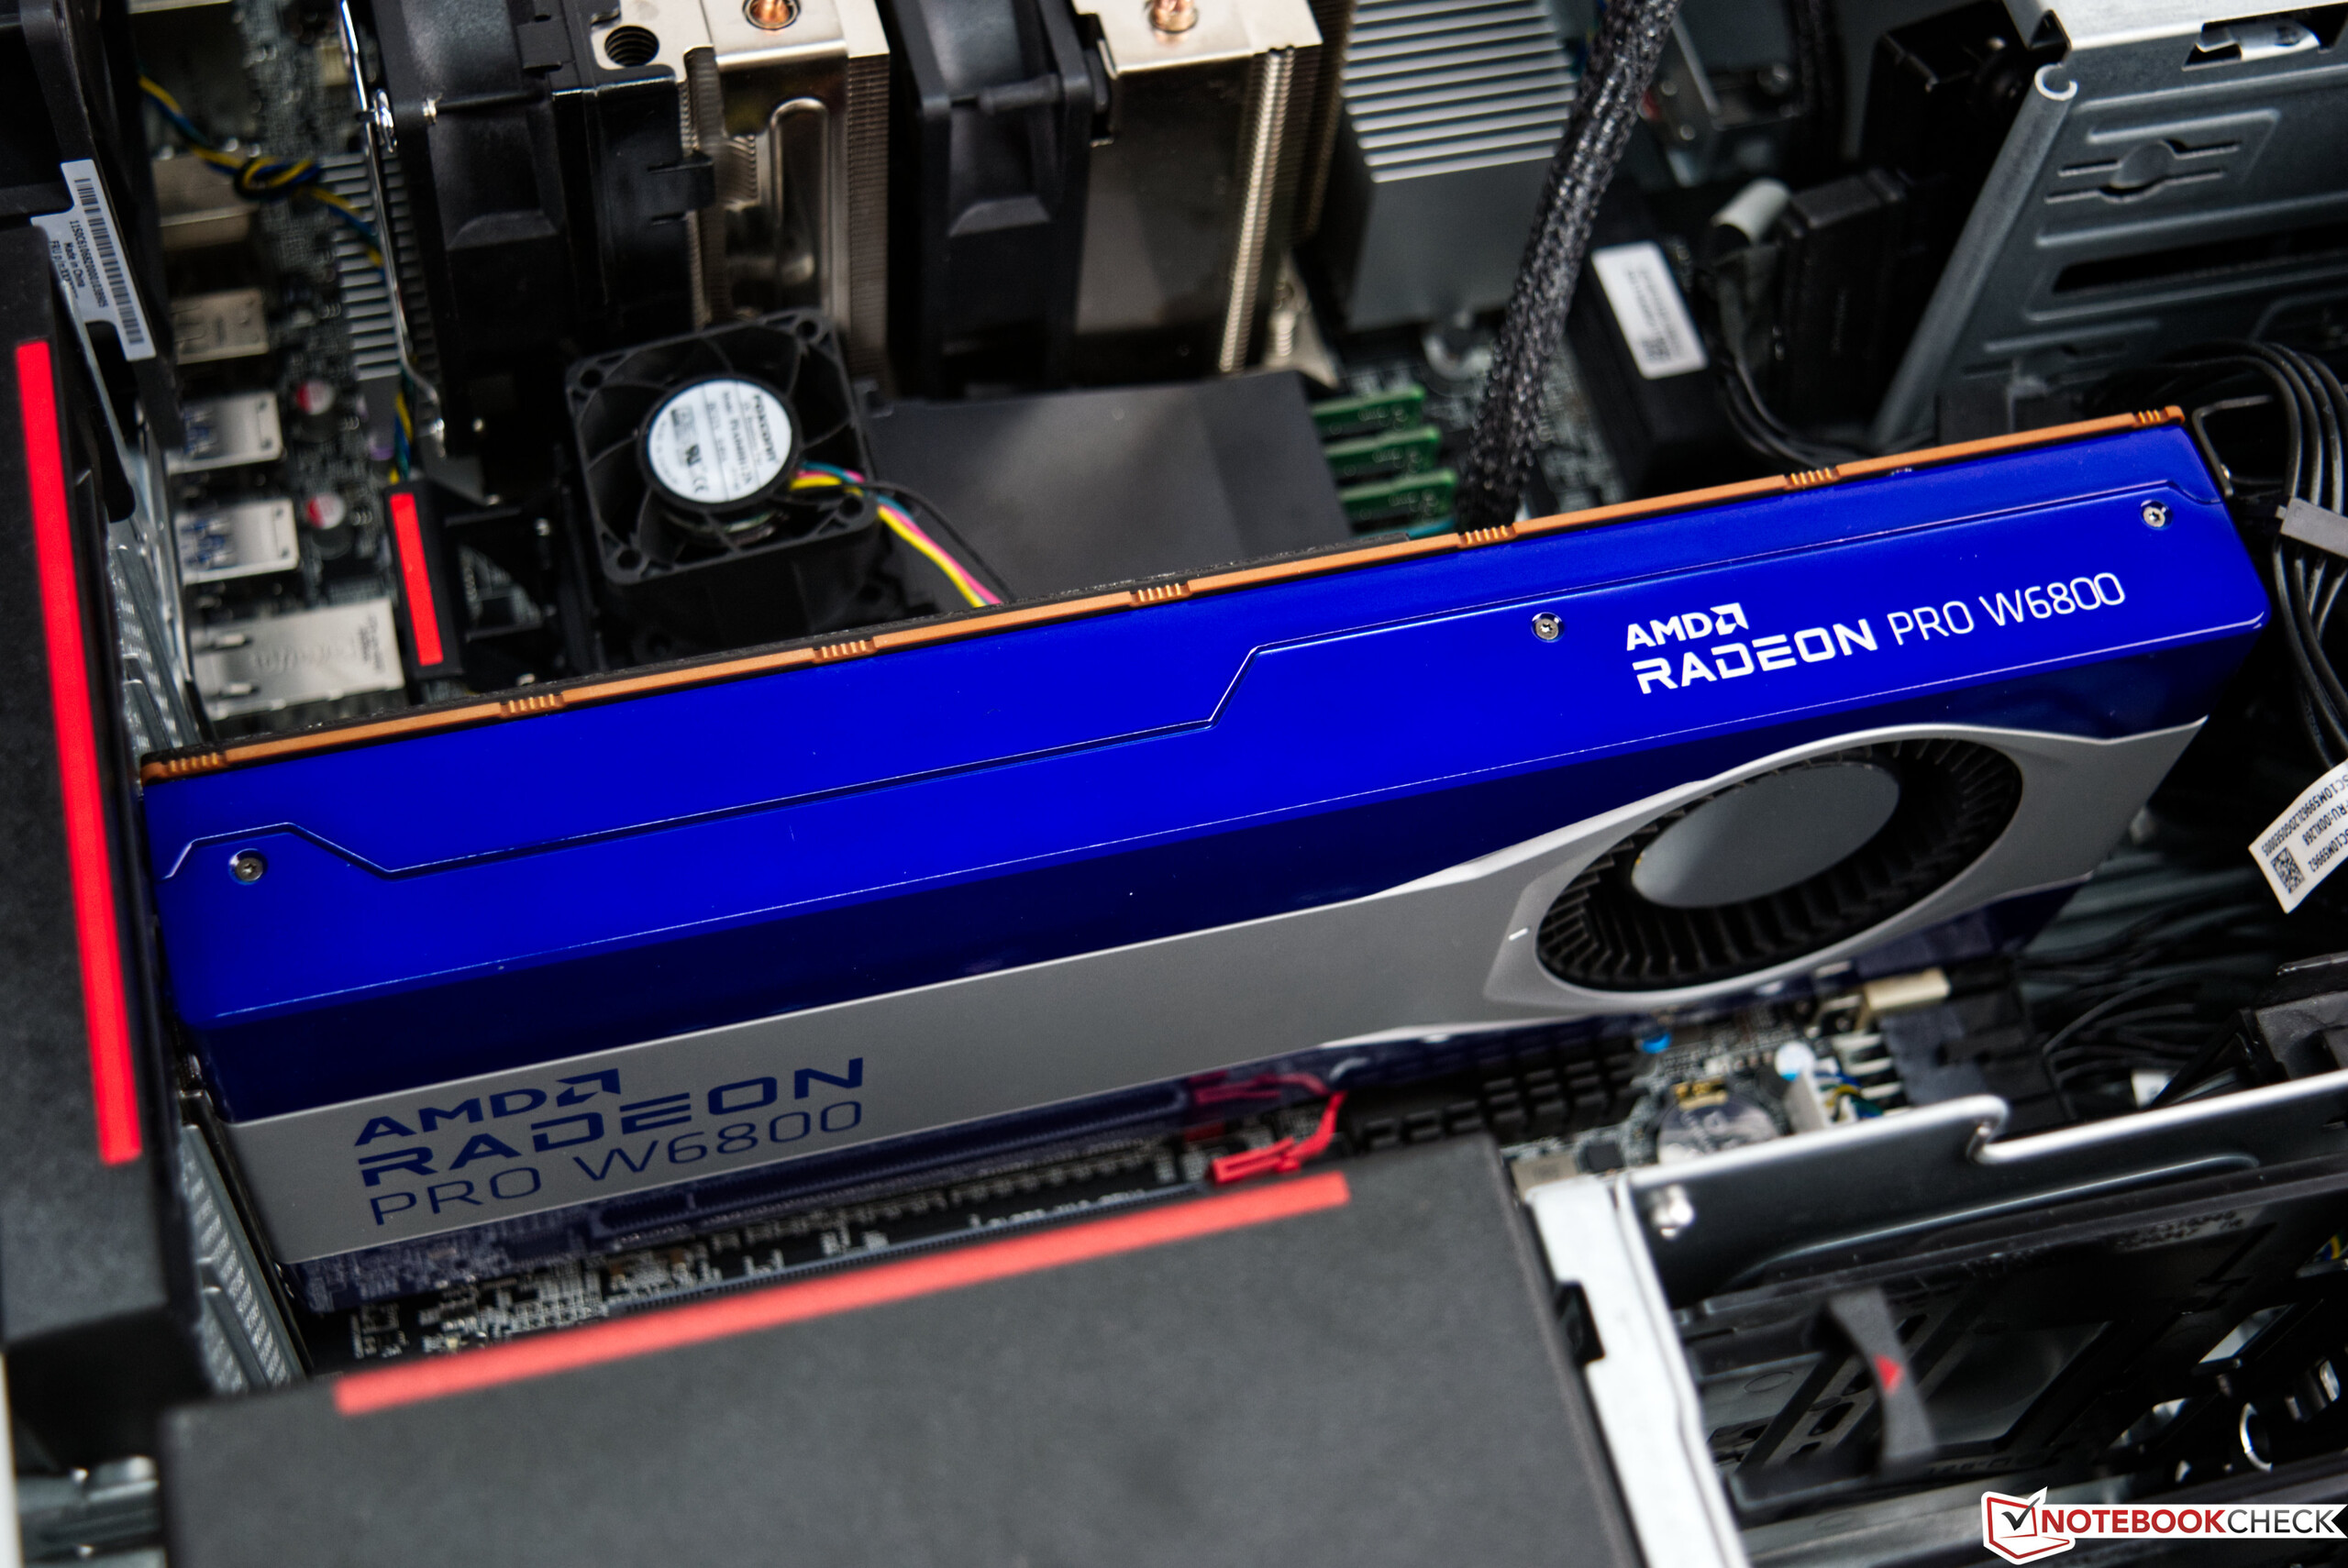
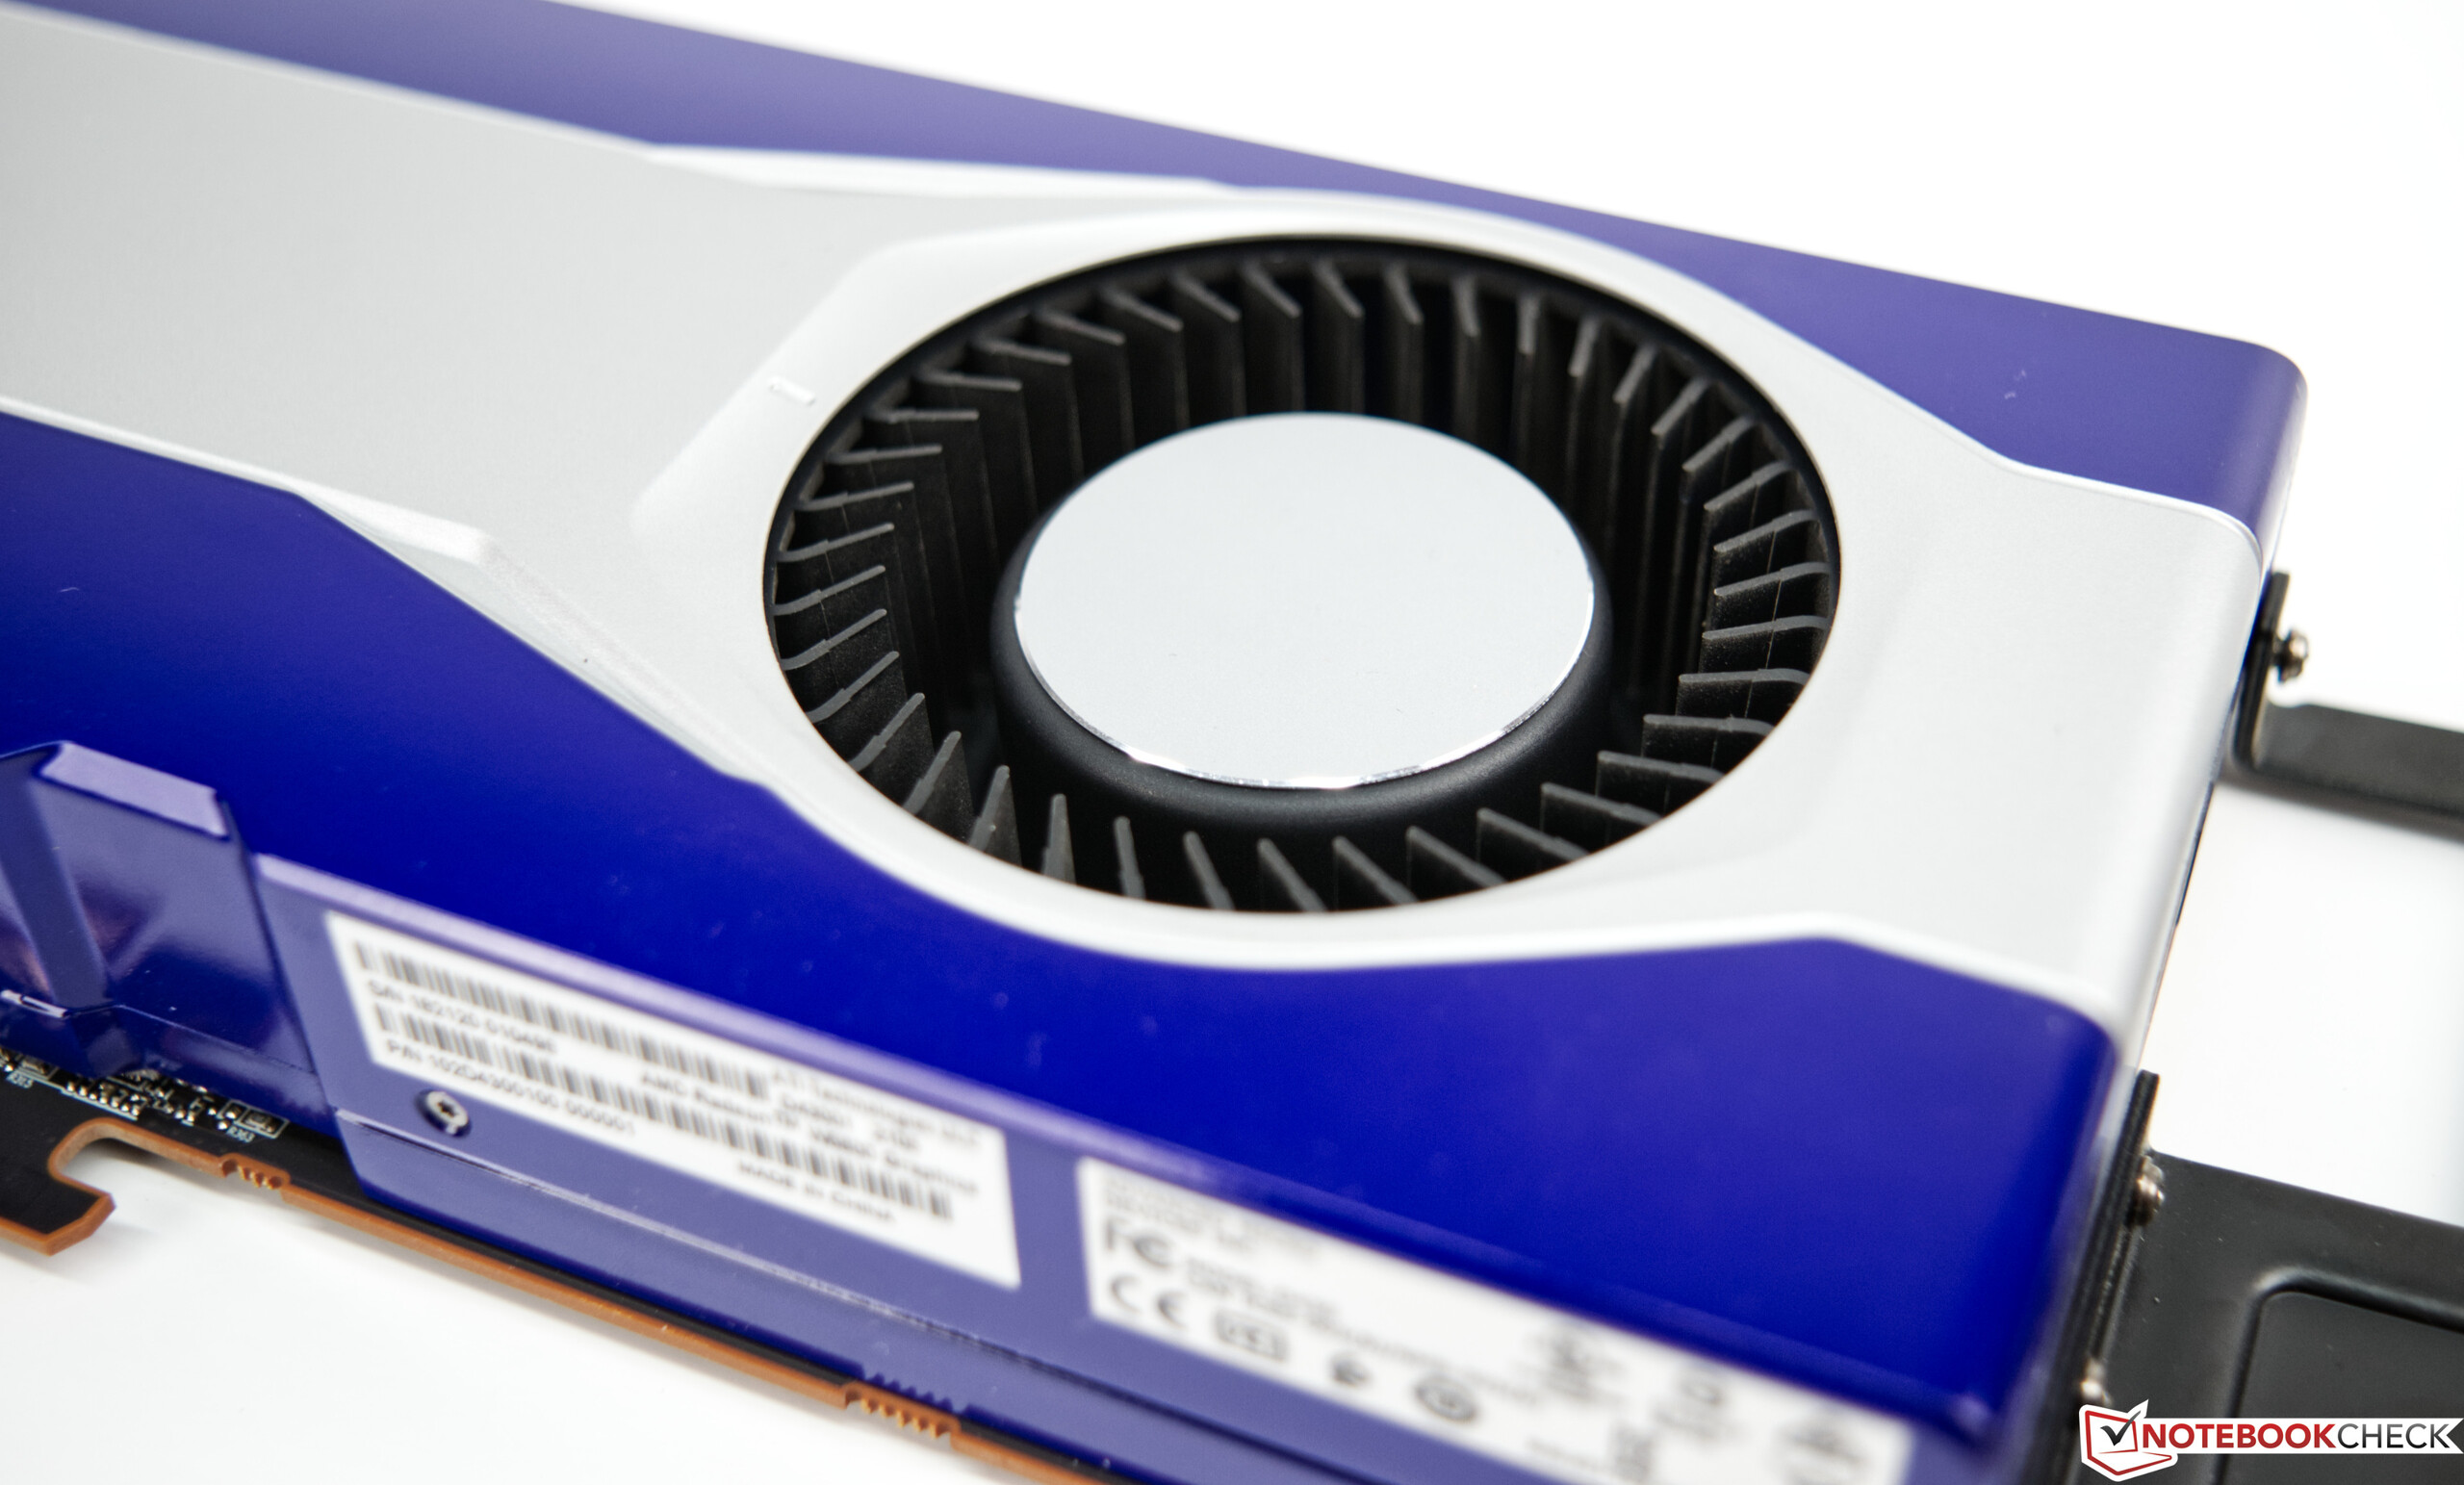
The AMD Radeon Pro W6800 gets even slightly warmer than the CPU (86 °C (~187 °F)) under extreme load. GPU-Z indicates a maximum of 99 °C (~210 °F) as the hot spot temperature. The Radeon Pro W6800's radial fan rotates at just under 2,000 rpm, which corresponds to about 40%. You can also adjust the speed manually in the Radeon driver settings, though. But it becomes loud quite quickly then, which is primarily due to the single radial fan. This design's advantage is the direct removal of the graphics card's waste heat out of the case.

Stress test with Prime95 and FurMark
Stress test Prime95
Stress test Prime95
Stress test FurMark
Stress test FurMark

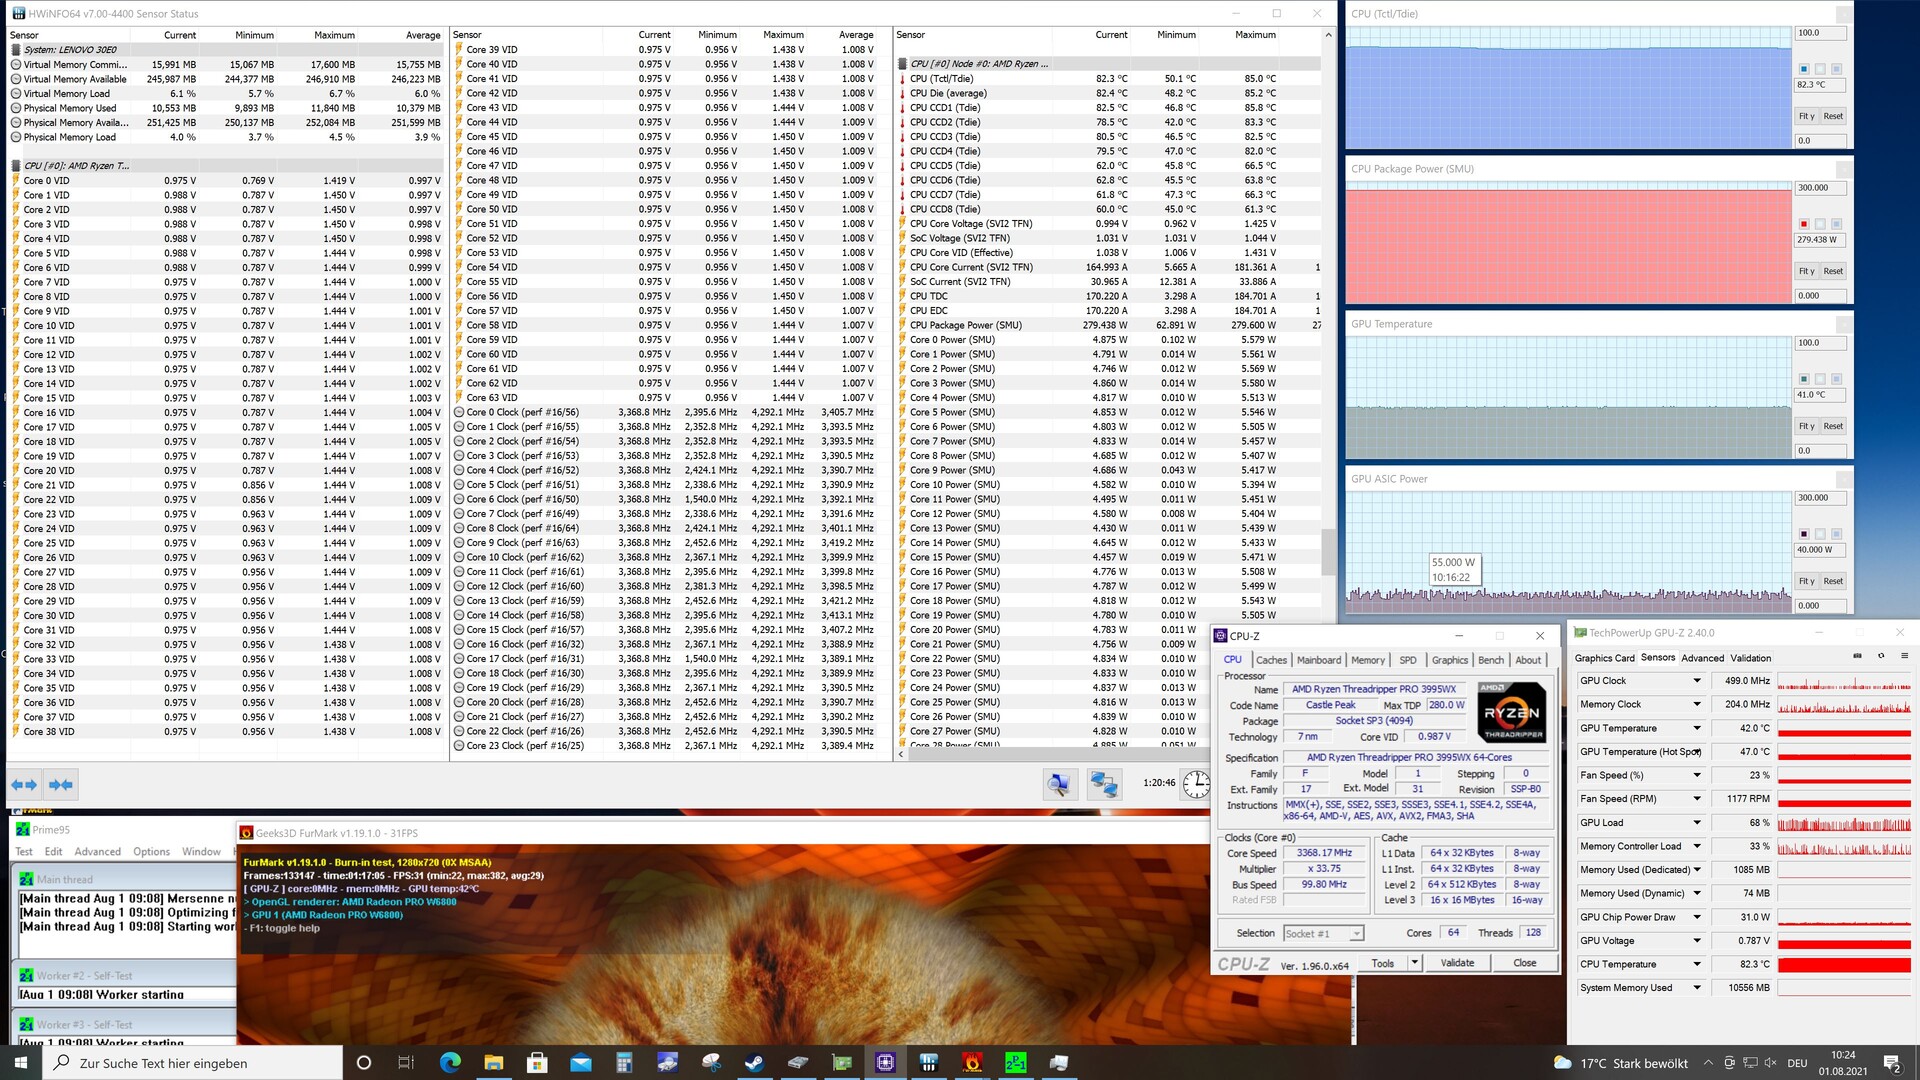
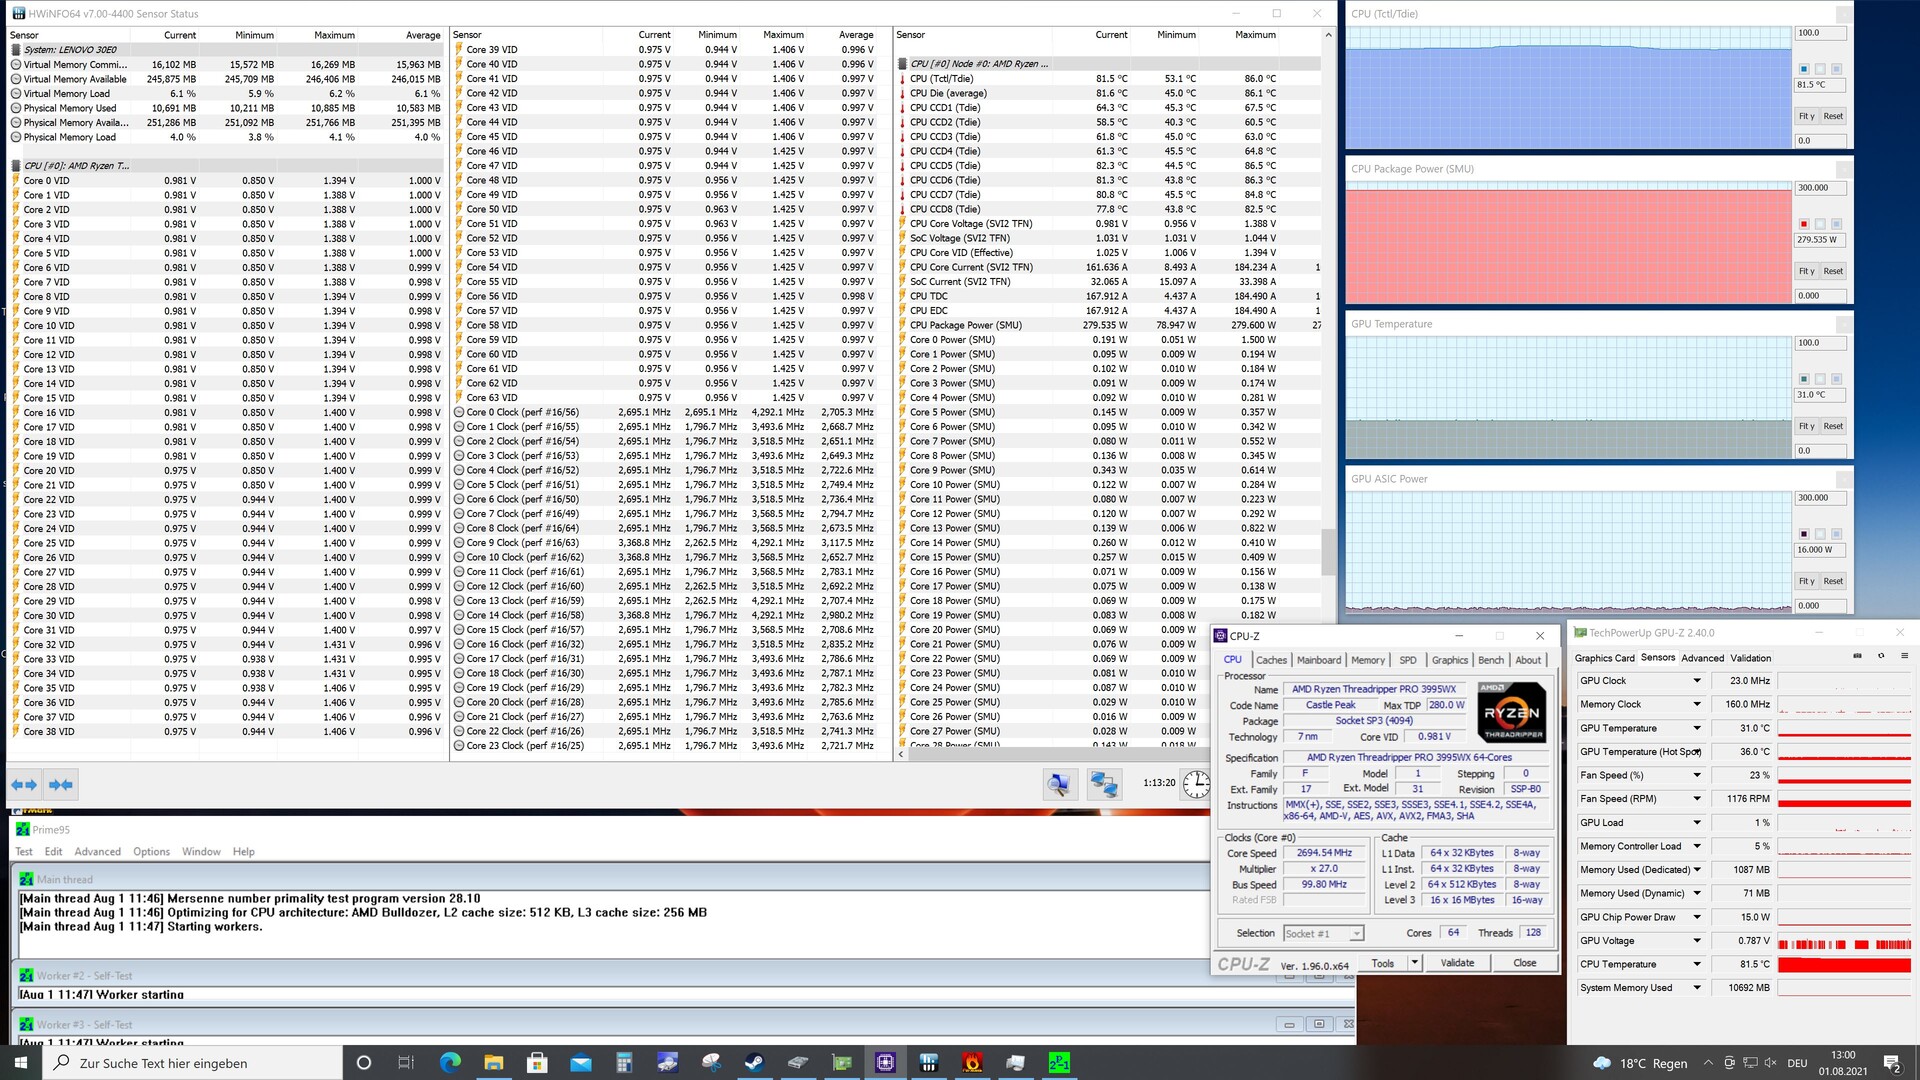
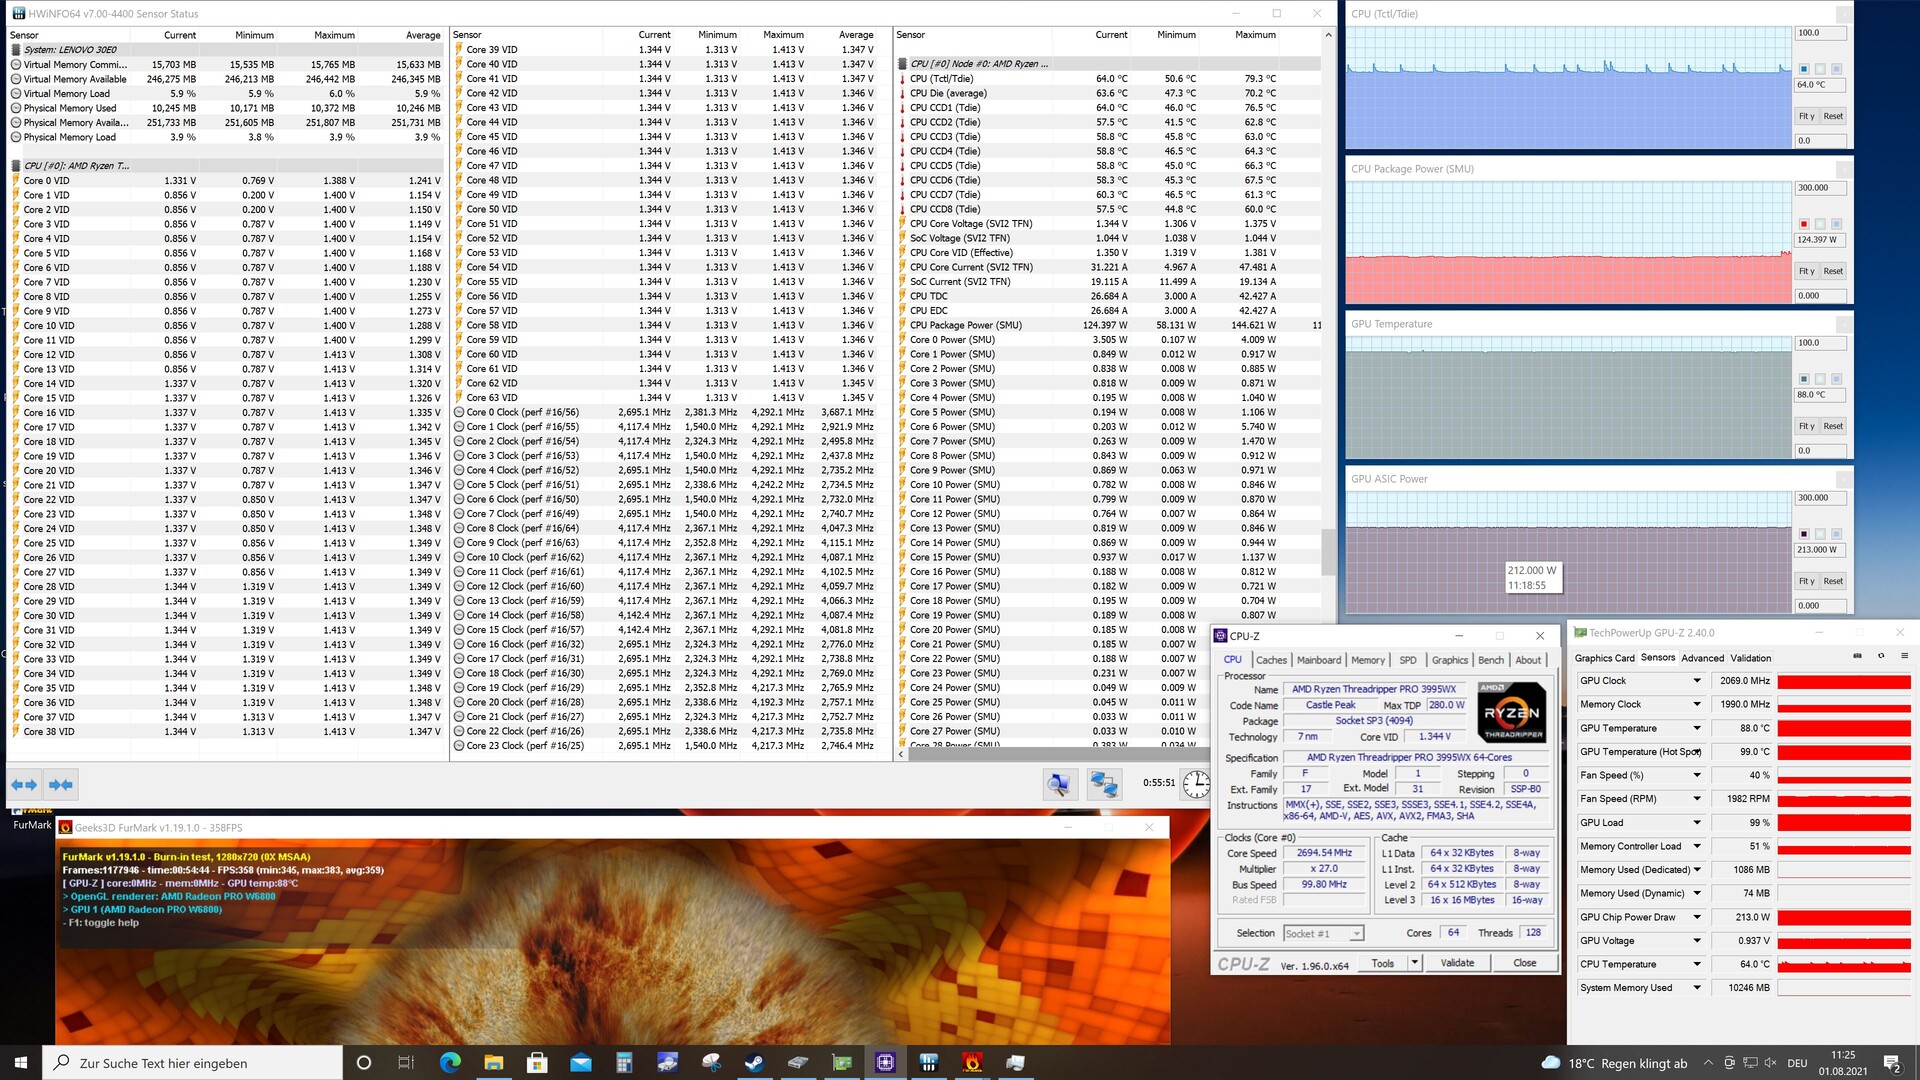
High load also lets energy consumption skyrocket

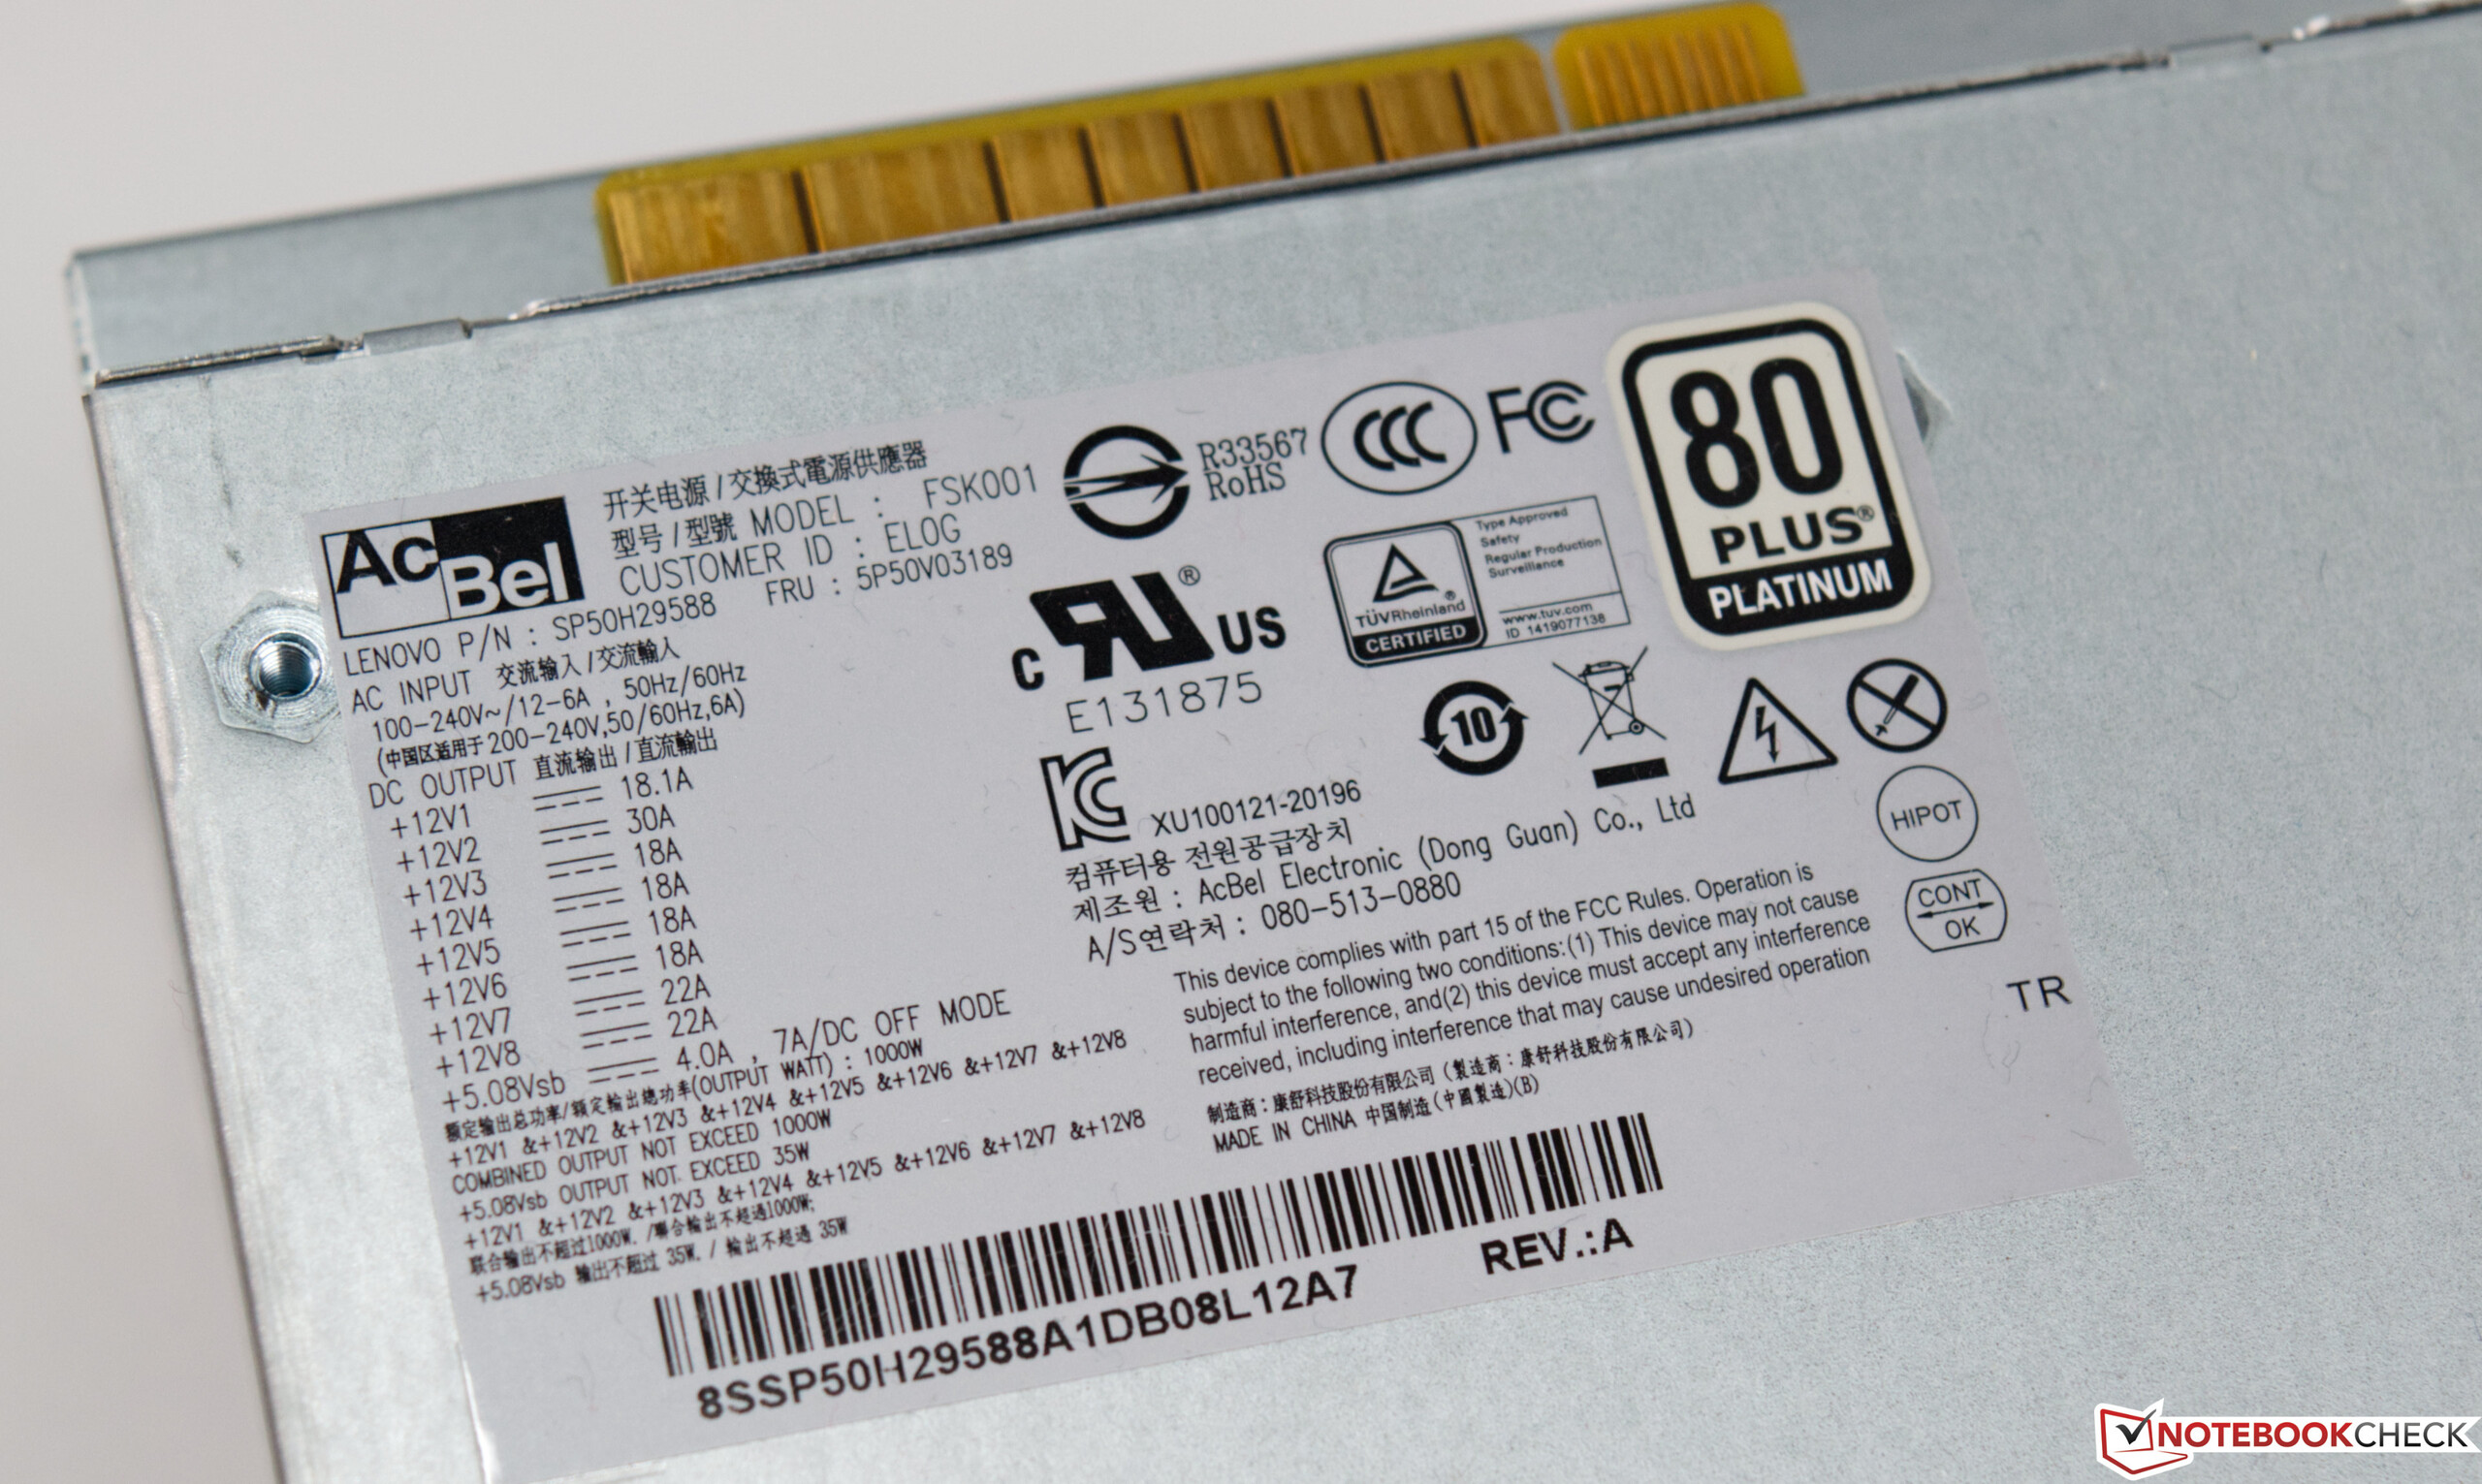
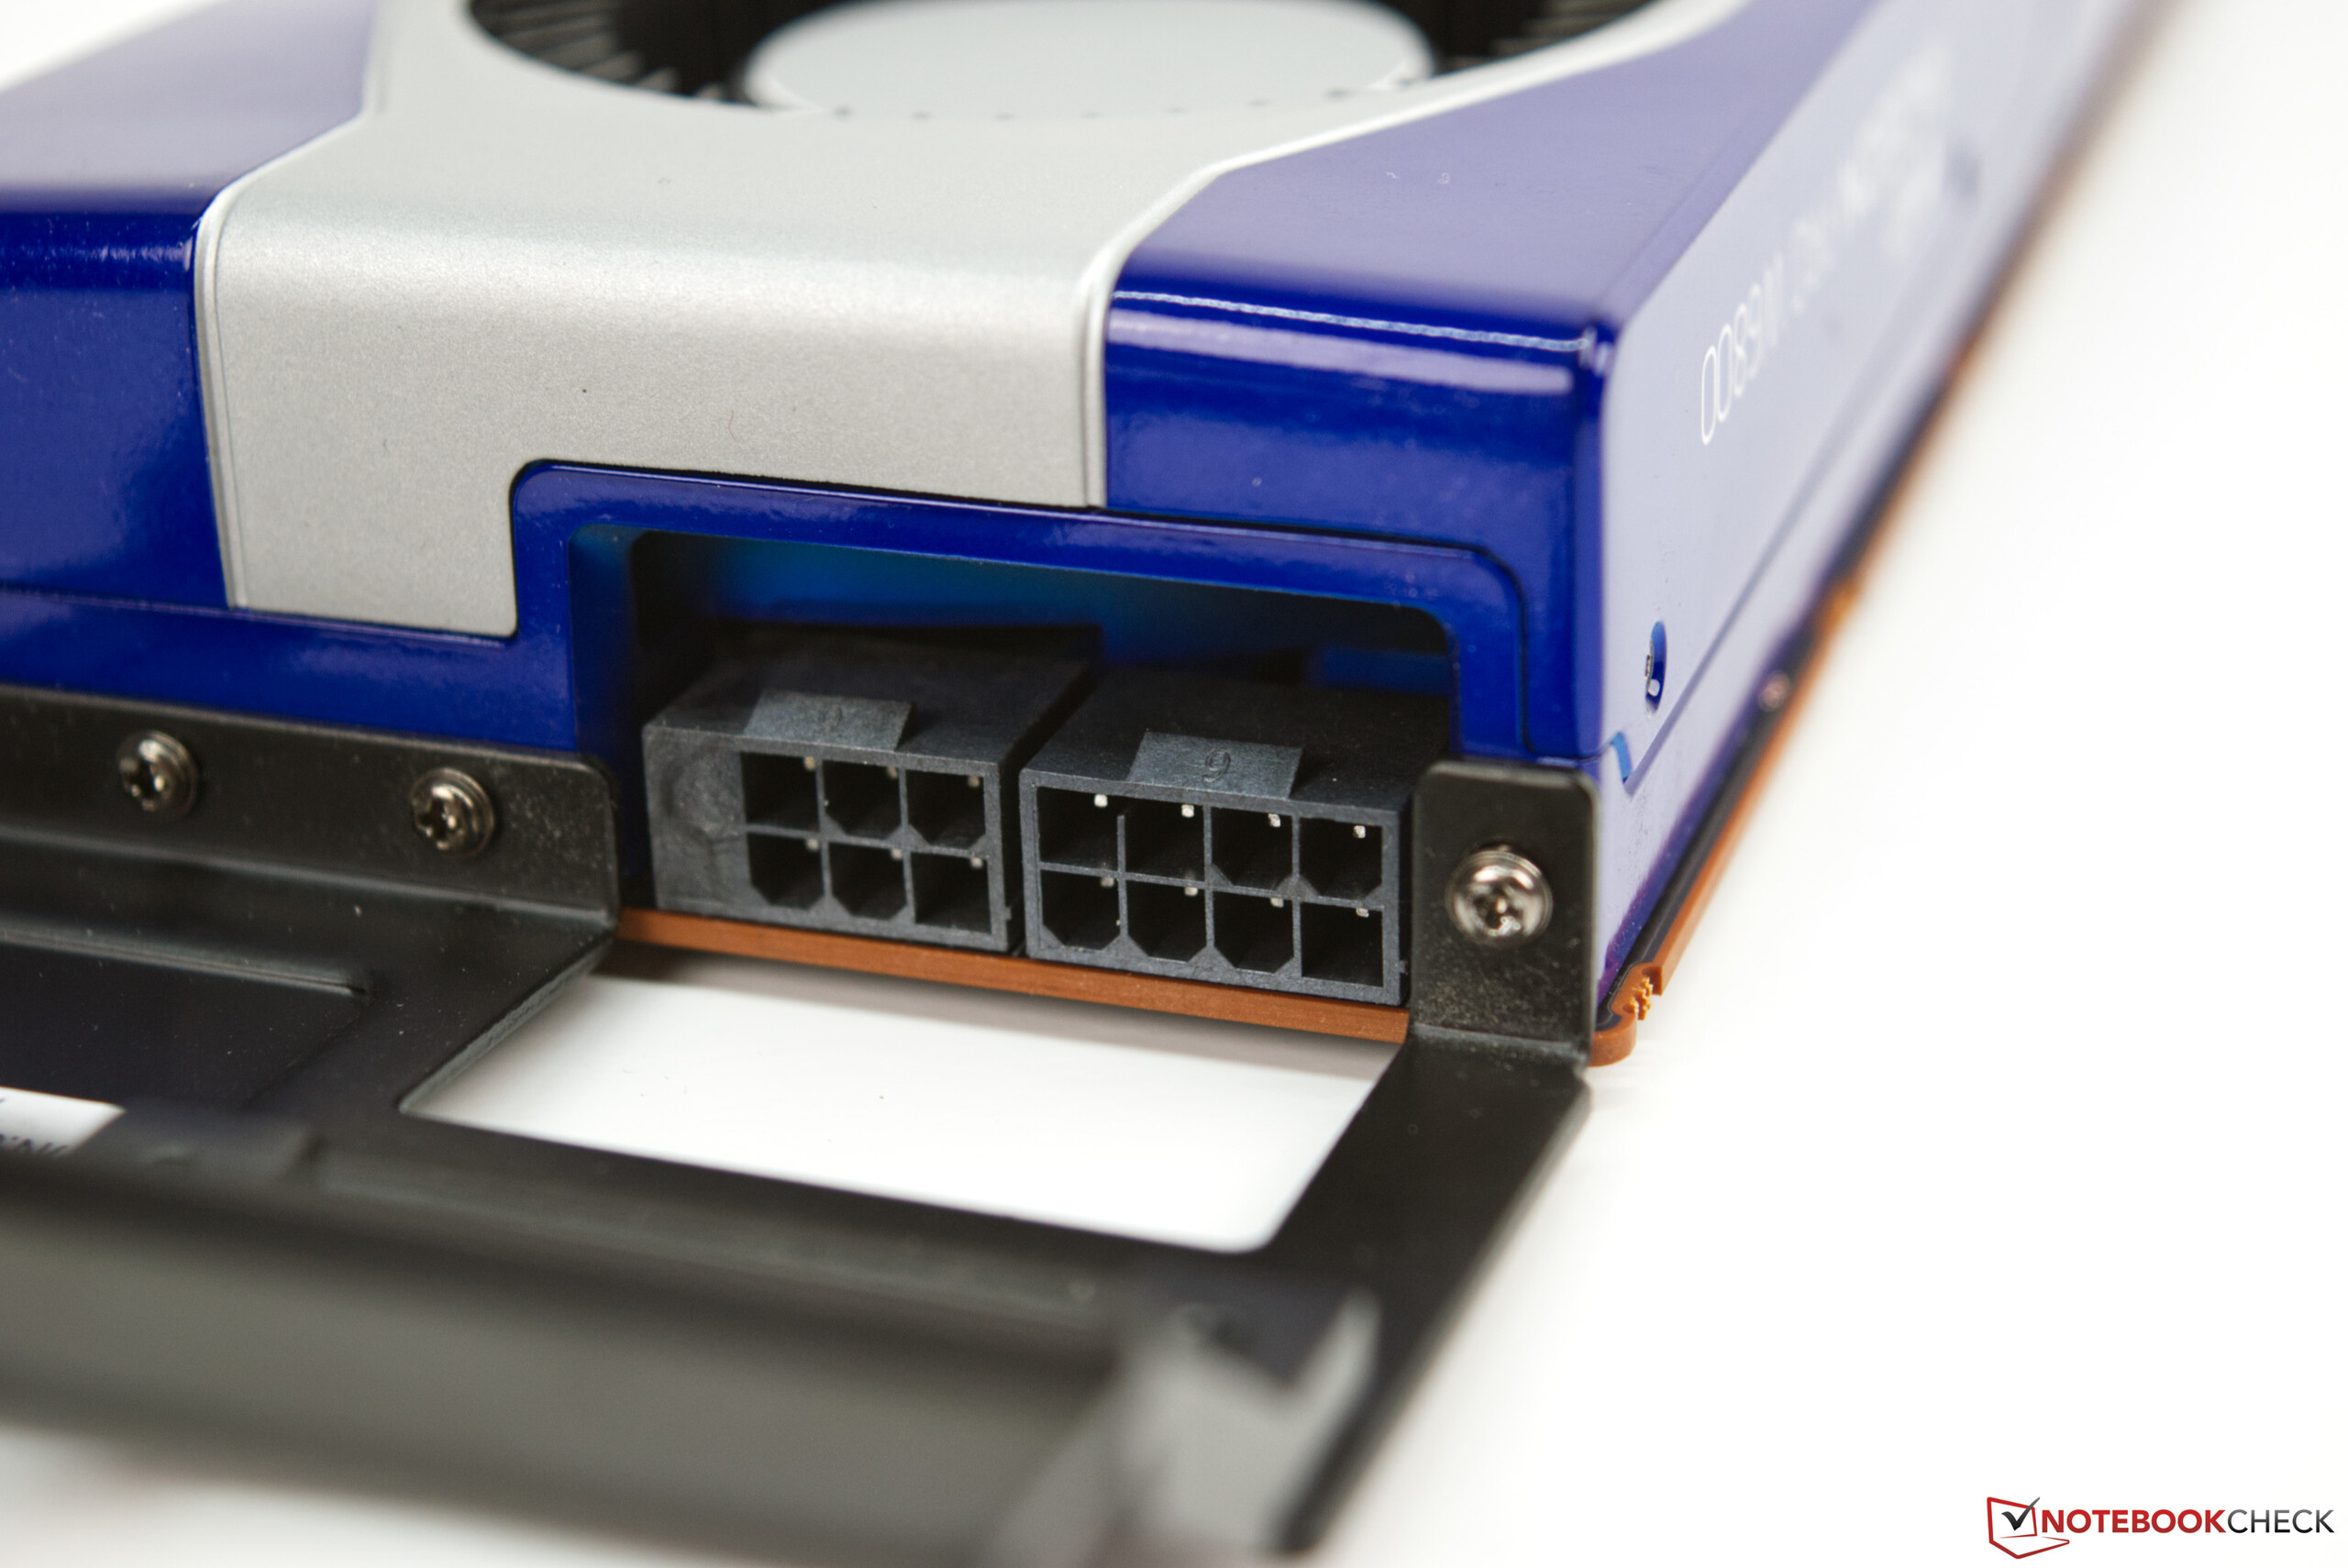
The ThinkStation P620's energy consumption is quite high in comparison due to its powerful hardware. Nevertheless, the power consumption is put into perspective when you consider the system's expected performance. The AMD Ryzen Threadripper Pro 3995WX is specified with a power consumption of up to 280 watts, which it effectively consumes under load. At 86 °C (~187 °F), it's also very warm under load, but it can still hold the base clock of 2.7 GHz stable. We note the highest energy consumption in the stress test with 420 watts. At the same time, though, the AMD Radeon Pro W6800 also requires up to 250 watts under load. This quickly explains why Lenovo equips the system with a 1,000-watt power adapter.

Energy consumption of the Lenovo ThinkStation P620

0306090120150180210240270300330360390420450480510Tooltip
Lenovo ThinkStation P620; 1280x720 Prime95 28.10 and Furmark 1.25: Ø445 (107-493)
Lenovo ThinkStation P620; Prime95 V2810 Stress (external Monitor): Ø420 (399-432)
Lenovo ThinkStation P620; 1280x720 FurMark 1.19 GPU Stress Test (external Monitor): Ø447 (422-512)
Lenovo ThinkStation P620; 1920x1080 The Witcher 3 ultra (external Monitor): Ø344 (304-405)
Power Consumption
1920x1080 The Witcher 3 ultra (external Monitor)
AMD Threadripper 2970WX, AMD Radeon RX Vega 64
RX Vega 64, TR 2970WX
441 (382min - 475max) Watt * -28%
AMD Ryzen 9 5950X
NVIDIA Titan RTX, R9 5950X, Intel Optane 905P 480GB 2.5 (Idle: 78 W)
440.5 (420min - 466max) Watt * -28%
AMD Ryzen 9 5900X
NVIDIA Titan RTX, R9 5900X, Intel Optane 905P 480GB 2.5 (Idle: 78.1 W)
439.6 (419min - 497max) Watt * -28%
AMD Ryzen Threadripper 2950X (16 core, 32 threads) Review
RX Vega 64, TR 2950X
411 Watt * -19%
AMD Radeon RX Vega 64
RX Vega 64, R9 3900X, Corsair MP600 (Idle: 81.56 W)
392.1 (329min - 466max) Watt * -14%
Intel Core i9-11900K
NVIDIA Titan RTX, i9-11900K, Intel Optane 905P 480GB 2.5 (Idle: 57.3 W)
387 (380min - 410max) Watt * -13%
Lenovo ThinkStation P620
Radeon Pro W6800, TR Pro 3995WX, WDC PC SN720 SDAPNTW-256G
344 (304min, 307P1 - 405max) Watt *
Prime95 V2810 Stress (external Monitor)
Lenovo ThinkStation P620
Radeon Pro W6800, TR Pro 3995WX, WDC PC SN720 SDAPNTW-256G
420 (399min, 401P1 - 432max) Watt *
AMD Threadripper 2970WX, AMD Radeon RX Vega 64
RX Vega 64, TR 2970WX
373 (326min - 411max) Watt * +11%
Intel Core i9-11900K
NVIDIA Titan RTX, i9-11900K, Intel Optane 905P 480GB 2.5 (Idle: 57.3 W)
302.2 (263min - 353max) Watt * +28%
AMD Ryzen Threadripper 2950X (16 core, 32 threads) Review
RX Vega 64, TR 2950X
270 Watt * +36%
AMD Ryzen 9 5950X
NVIDIA Titan RTX, R9 5950X, Intel Optane 905P 480GB 2.5 (Idle: 78 W)
252.3 (227min - 259max) Watt * +40%
AMD Ryzen 9 5900X
NVIDIA Titan RTX, R9 5900X, Intel Optane 905P 480GB 2.5 (Idle: 78.1 W)
235.6 (211min - 284max) Watt * +44%
AMD Radeon RX Vega 64
RX Vega 64, R9 3900X, Corsair MP600 (Idle: 81.56 W)
210.6 (195min - 256max) Watt * +50%
Cinebench R15 Multi (external Monitor)
AMD Threadripper 2970WX, AMD Radeon RX Vega 64
RX Vega 64, TR 2970WX
378 (375min - 380max) Watt * -19%
Lenovo ThinkStation P620
Radeon Pro W6800, TR Pro 3995WX, WDC PC SN720 SDAPNTW-256G
318 (117min, 126P1 - 412max) Watt *
AMD Ryzen Threadripper 2950X (16 core, 32 threads) Review
RX Vega 64, TR 2950X
263 Watt * +17%
Intel Core i9-11900K
NVIDIA Titan RTX, i9-11900K, Intel Optane 905P 480GB 2.5 (Idle: 57.3 W)
259.3 (256min - 281max) Watt * +18%
AMD Ryzen 9 5900X
NVIDIA Titan RTX, R9 5900X, Intel Optane 905P 480GB 2.5 (Idle: 78.1 W)
235.8 (204min - 238max) Watt * +26%
AMD Radeon RX Vega 64
RX Vega 64, R9 3900X, Corsair MP600 (Idle: 81.56 W)
229.2 (228min - 230max) Watt * +28%
AMD Ryzen 9 5950X
NVIDIA Titan RTX, R9 5950X, Intel Optane 905P 480GB 2.5 (Idle: 78 W)
226.1 (160min - 249max) Watt * +29%
Temperatures - CPU Temperature Prime95
Intel Core i9-11900K
NVIDIA Titan RTX, i9-11900K, Intel Optane 905P 480GB 2.5
91 °C +6%
Lenovo ThinkStation P620
Radeon Pro W6800, TR Pro 3995WX, WDC PC SN720 SDAPNTW-256G
86 °C
AMD Ryzen 9 5900X
NVIDIA Titan RTX, R9 5900X, Intel Optane 905P 480GB 2.5
79.3 °C -8%
AMD Ryzen 9 5950X
NVIDIA Titan RTX, R9 5950X, Intel Optane 905P 480GB 2.5
69.5 °C -19%
AMD Ryzen Threadripper 2950X (16 core, 32 threads) Review
RX Vega 64, TR 2950X
64 °C -26%
AMD Threadripper 2970WX, AMD Radeon RX Vega 64
RX Vega 64, TR 2970WX
59.4 °C -31%

* ... smaller is better

Pros

+ extreme multi-core performance thanks to 64 cores
+ very good 3D performance in professional use
+ 256 GB of RAM
+ 32 GB of VRAM and support for up to 6 displays
+ sturdy and well thought-out case
+ 1,000-watt power supply

Cons

- software not always supports all CPU cores
- high price

Verdict - High-End workstation at a high-end price

Lenovo ThinkStation P620 in review, provided by AMD Germany

The Lenovo ThinkStation P620 is a modern workstation without many bells and whistles. Lenovo installs the hardware in a quite compact and well thought-out case here, which is based on a modular construction. Particular emphasis is placed on air circulation, so that the built-in components can always deliver their full performance, even under load.

The AMD Ryzen Threadripper Pro 3995WX installed in our test system is a top choice, as it's the fastest AMD Threadripper CPU to date. The processor combines a whopping 64 cores and even provides up to 128 threads thanks to SMT. This makes the CPU ideal for extremely optimized multithread applications that significantly exceed normal requirements. In our case, the processor has 256 GB RAM at its disposal, which isn't exactly modest even for a workstation. Such magnitudes are otherwise only found in servers. Many scenarios, such as virtual machines, can be implemented with this configuration. Users who still need a RAM drive can also grab a bit of the generous RAM without the system falling to its knees.

With the AMD Ryzen Threadripper Pro 3995WX, the Lenovo ThinkStation P620 offers the fastest CPU for multi-core optimized applications to date.

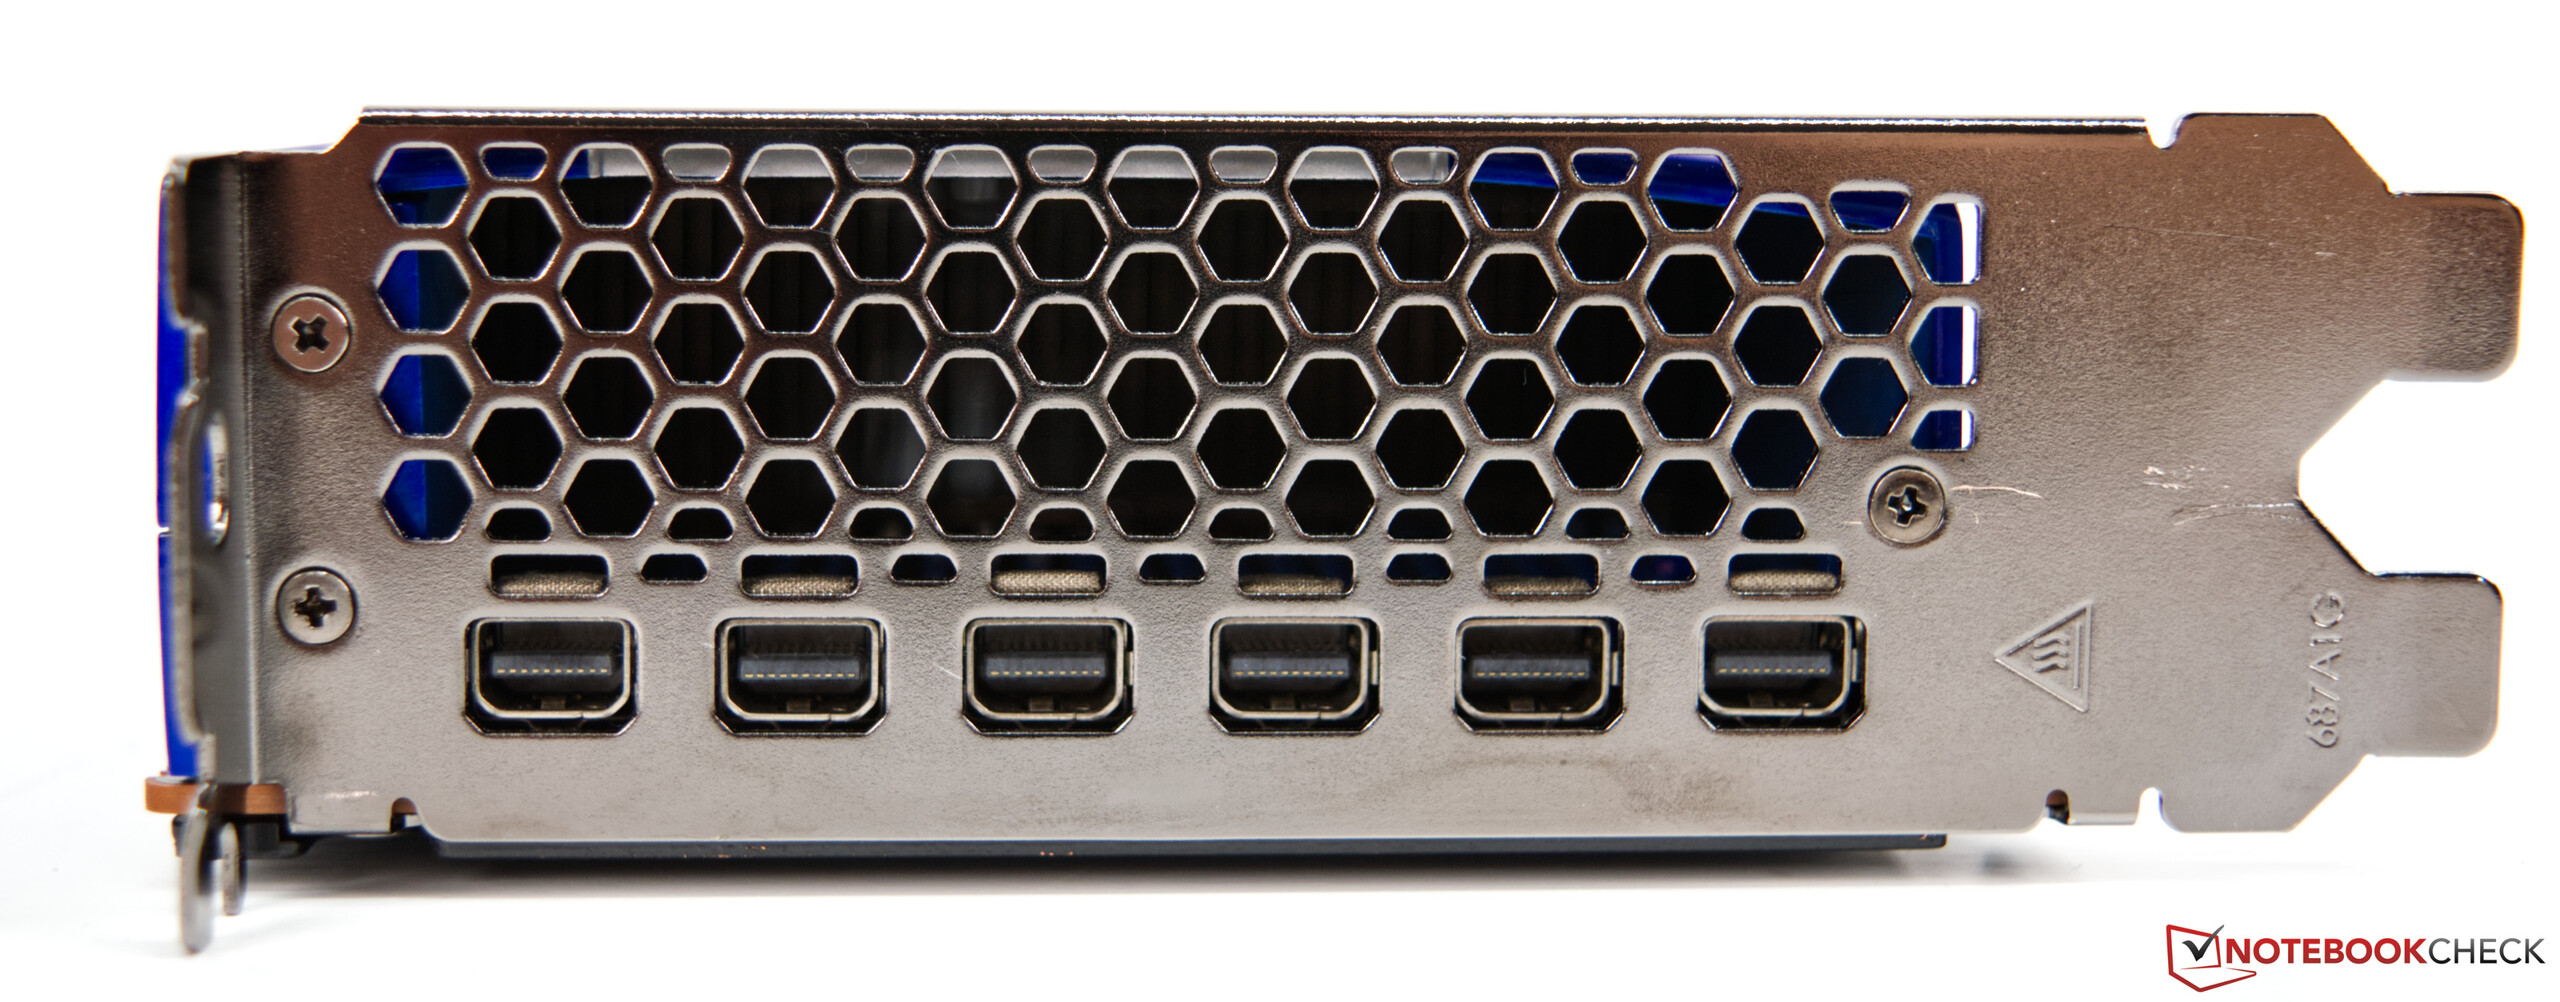
But the built-in graphics card is also essential for a workstation. In our case, the Lenovo ThinkStation P620 houses the brand-new AMD Radeon Pro W6800 with 32 GB of GDDR6 VRAM. This GPU is based on the latest RDNA2 architecture, with which we're already familiar from the 6000-series gaming graphics cards. Real-time ray tracing is now supported natively. This means that the corresponding workloads can be processed much faster than before now. With up to six displays, the virtual workspace can be expanded nearly limitlessly. Alternatively, the AMD Radeon Pro W6800 also supports two simultaneous native 8K panels.

Lenovo offers a wide range of workstation PCs. In addition, the manufacturer provides a variety of configuration options to customize the PC to the user's needs. At a good 13,000 Euros (~$15,293), our review sample is certainly no bargain. The CPU alone currently costs at least $5,000 on Amazon, for example. If you really want to max everything out, you'll easily end up with a workstation PC costing over 30,000 Euros (~$35,288).

Read all 2 comments / answer
static version load dynamic
Loading comments
Comment on this article
Please share our article, every link counts!
> Expert Reviews and News on Laptops, Smartphones and Tech Innovations > Reviews > Review: AMD Ryzen Threadripper Pro 3995WX and Radeon Pro W6800 in the Lenovo ThinkStation P620 high-end workstation
Sebastian Bade, 2021-08- 8 (Update: 2021-08- 8)